TRANE TECHNOLOGIES PLC
10-Ks and 10-Qs
|
|
|
|
|
|
|
|
|
|
|
|
|
|
|
|
|
|
|
|
|
|
|
|
|
|
|
|
|
|
|
|
|
|
|
|
|
|
|
|
|
|
|
|
|
|
|
|
|
|
|
|
|
|
|
|
|
|
|
UNITED STATES SECURITIES AND EXCHANGE COMMISSION
Washington, D.C. 20549
FORM 10-K
(Mark One)
|
X
|
ANNUAL REPORT PURSUANT TO SECTION 13 OR 15(d) OF THE SECURITIES EXCHANGE ACT OF 1934
|
For the fiscal year ended
December 31, 2015
or
|
—
|
TRANSITION REPORT PURSUANT TO SECTION 13 OR 15(d) OF THE SECURITIES EXCHANGE ACT OF 1934
|
For the transition period from
to
Commission File No. 001-34400
INGERSOLL-RAND PUBLIC LIMITED COMPANY
(Exact name of registrant as specified in its charter)
|
Ireland
|
|
98-0626632
|
|
(State or other jurisdiction of incorporation or organization)
|
|
(I.R.S. Employer
Identification No.)
|
170/175 Lakeview Dr.
Airside Business Park
Swords, Co. Dublin
Ireland
(Address of principal executive offices)
Registrant’s telephone number, including area code: +(353) (0) 18707400
Securities registered pursuant to Section 12(b) of the Act:
|
Title of each class
|
|
Name of each exchange on which registered
|
|
Ordinary Shares,
|
|
New York Stock Exchange
|
|
Par Value $1.00 per Share
|
|
|
Securities registered pursuant to Section 12(g) of the Act: None
Indicate by check mark if the registrant is a well-known seasoned issuer, as defined in Rule 405 of the Securities Act. YES
X
NO
Indicate by check mark if the registrant is not required to file reports pursuant to Section 13 or Section 15(d) of the Act. YES
NO
X
Indicate by check mark whether the registrant (1) has filed all reports required to be filed by Section 13 or 15(d) of the Securities Exchange Act of 1934 during the preceding 12 months (or for such shorter period that the registrant was required to file such reports), and (2) has been subject to such filing requirements for the past 90 days. YES
X
NO
Indicate by check mark whether the registrant has submitted electronically and posted on its corporate Web site, if any, every Interactive Data File required to be submitted and posted pursuant to Rule 405 of Regulation S-T (§232.405 of this chapter) during the preceding 12 months (or for such shorter period that the registrant was required to submit and post such files). YES
X
NO
Indicate by check mark if disclosure of delinquent filers pursuant to Item 405 of Regulation S-K (§229.405 of this chapter) is not contained herein, and will not be contained, to the best of registrant’s knowledge, in definitive proxy or information statements incorporated by reference in Part III of this Form 10-K or any amendment to this Form 10-K. [ X ]
Indicate by check mark whether the registrant is a large accelerated filer, an accelerated filer, a non-accelerated filer, or a smaller reporting company. See the definitions of “large accelerated filer,” “accelerated filer” and “smaller reporting company” in Rule 12b-2 of the Exchange Act.:
|
Large accelerated filer
X
|
Accelerated filer
|
|
Non-accelerated filer
|
Smaller reporting company
|
|
(Do not check if a smaller reporting company)
|
|
Indicate by check mark whether the registrant is a shell company (as defined in Rule 12b-2 of the Act). YES
NO
X
The aggregate market value of ordinary shares held by nonaffiliates on
June 30, 2015
was approximately $
17.7 billion
based on the closing price of such stock on the New York Stock Exchange.
The number of ordinary shares outstanding as of
February 1, 2016
was
256,847,948
.
DOCUMENTS INCORPORATED BY REFERENCE
Portions of the registrant’s proxy statement to be filed within 120 days of the close of the registrant’s fiscal year in connection with the registrant’s Annual General Meeting of Shareholders to be held
June 2, 2016
are incorporated by reference into Part II and Part III of this Form 10-K.
INGERSOLL-RAND PLC
Form 10-K
For the Fiscal Year Ended
December 31, 2015
TABLE OF CONTENTS
|
|
|
|
Page
|
|
Part I
|
Item 1.
|
||
|
Item 1A.
|
|||
|
Item 1B.
|
|||
|
Item 2.
|
|||
|
Item 3.
|
|||
|
Item 4.
|
|||
|
Part II
|
Item 5.
|
||
|
Item 6.
|
|||
|
Item 7.
|
|||
|
Item 7A.
|
|||
|
Item 8.
|
|||
|
Item 9.
|
|||
|
Item 9A.
|
|||
|
Item 9B.
|
|||
|
Part III
|
Item 10.
|
||
|
Item 11.
|
|||
|
Item 12.
|
|||
|
Item 13.
|
|||
|
Item 14.
|
|||
|
Part IV
|
Item 15.
|
||
CAUTIONARY STATEMENT FOR FORWARD LOOKING STATEMENTS
Certain statements in this report, other than purely historical information, are “forward-looking statements” within the meaning of the Private Securities Litigation Reform Act of 1995, Section 27A of the Securities Act of 1933 and Section 21E of the Securities Exchange Act of 1934. These forward-looking statements generally are identified by the words “believe,” “project,” “expect,” “anticipate,” “estimate,” “forecast,” “outlook,” “intend,” “strategy,” “plan,” “may,” “should,” “will,” “would,” “will be,” “will continue,” “will likely result,” or the negative thereof or variations thereon or similar terminology generally intended to identify forward-looking statements.
Forward-looking statements may relate to such matters as projections of revenue, margins, expenses, tax provisions, earnings, cash flows, benefit obligations, share or debt repurchases or other financial items; any statements of the plans, strategies and objectives of management for future operations, including those relating to any statements concerning expected development, performance or market share relating to our products and services; any statements regarding future economic conditions or our performance; any statements regarding pending investigations, claims or disputes; any statements of expectation or belief; and any statements of assumptions underlying any of the foregoing. These statements are based on currently available information and our current assumptions, expectations and projections about future events. While we believe that our assumptions, expectations and projections are reasonable in view of the currently available information, you are cautioned not to place undue reliance on our forward-looking statements. You are advised to review any further disclosures we make on related subjects in materials we file with or furnish to the SEC. Forward-looking statements speak only as of the date they are made and are not guarantees of future performance. They are subject to future events, risks and uncertainties - many of which are beyond our control - as well as potentially inaccurate assumptions, that could cause actual results to differ materially from our expectations and projections. We do not undertake to update any forward-looking statements.
Factors that might affect our forward-looking statements include, among other things:
|
•
|
overall economic, political and business conditions in the markets in which we operate;
|
|
•
|
the demand for our products and services;
|
|
•
|
competitive factors in the industries in which we compete;
|
|
•
|
changes in tax requirements (including tax rate changes, new tax laws and revised tax law interpretations);
|
|
•
|
the outcome of any litigation, governmental investigations or proceedings;
|
|
•
|
the outcome of any income tax audits or settlements;
|
|
•
|
interest rate fluctuations and other changes in borrowing costs;
|
|
•
|
other capital market conditions, including availability of funding sources;
|
|
•
|
currency exchange rate fluctuations, exchange controls and currency devaluations;
|
|
•
|
availability of and fluctuations in the prices of key commodities and the impact of higher energy prices;
|
|
•
|
impairment of our goodwill, indefinite-lived intangible assets and/or our long-lived assets;
|
|
•
|
climate change, changes in weather patterns and seasonal fluctuations;
|
|
•
|
the impact of potential information technology or data security breaches;
|
|
•
|
the strategic acquisition of businesses, product lines and joint ventures; and
|
|
•
|
the possible effects on us of future legislation in the U.S. that may limit or eliminate potential U.S. tax benefits resulting from our incorporation in a non-U.S. jurisdiction, such as Ireland.
|
Some of the significant risks and uncertainties that could cause actual results to differ materially from our expectations and projections are described more fully in Item 1A “Risk Factors.” You should read that information in conjunction with “Management's Discussion and Analysis of Financial Condition and Results of Operations” in Item 7 of this report and our Consolidated Financial Statements and related notes in Item 8 of this report. We note such information for investors as permitted by the Private Securities Litigation Reform Act of 1995.
2
Item 1.
BUSINESS
Overview
Ingersoll-Rand plc (Plc or Parent Company), a public limited company incorporated in Ireland in 2009, and its consolidated subsidiaries (collectively, we, our, the Company) is a diversified, global company that provides products, services and solutions to enhance the quality and comfort of air in homes and buildings, transport and protect food and perishables, and increase industrial productivity and efficiency. Our business segments consist of Climate and Industrial, both with strong brands and leading positions within their respective markets. We generate revenue and cash primarily through the design, manufacture, sale and service of a diverse portfolio of industrial and commercial products that include well-recognized, premium brand names such as Ingersoll-Rand
®
, Trane
®
, Thermo King
®
, American Standard
®
, ARO
®
, and Club Car
®
.
To achieve our mission of being a world leader in creating comfortable and efficient environments, we continue to focus on increasing our recurring revenue stream from parts, service, used equipment and rentals; and to continuously improve the efficiencies and capabilities of the products and services of our businesses. We also continue to focus on operational excellence strategies as a central theme to improving our earnings and cash flows.
Business Segments
Our business segments provide products, services and solutions used to increase the efficiency and productivity of both industrial and commercial operations and homes, as well as improve the health and comfort of people around the world.
Our business segments are as follows:
Climate
Our Climate segment globally delivers energy-efficient products and innovative energy services. It includes Trane
®
and American Standard
®
Heating & Air Conditioning which provide heating, ventilation and air conditioning (HVAC) systems, and commercial and residential building services, parts, support and controls; energy services and building automation through Trane Building Advantage and Nexia; and Thermo King
®
transport temperature control solutions. This segment had
2015
net revenues of $
10.2 billion
.
Industrial
Our Industrial segment delivers products and services that enhance energy efficiency, productivity and operations. It includes compressed air and gas systems and services, power tools, material handling systems, ARO
®
fluid management equipment, as well as Club Car
®
golf, utility and rough terrain vehicles. This segment had
2015
net revenues of $
3.1 billion
.
Segment Revenue and profit information and additional financial data and commentary on recent financial results for operating segments are provided in the Results of Operations section in Part II, Item7. “Management's Discussion and Analysis of Financial Condition and Results of Operations” and in Note 19 to the Consolidated Financial Statements in Part II, Item 8. “Financial Statements and Supplementary Data” of this Annual Report on Form 10-K.
3
Products and Services
Our principal products and services by business segment include the following:
|
Climate
|
||
|
Aftermarket and OEM parts and supplies
|
|
Hybrid and non-diesel transport refrigeration solutions
|
|
Air conditioners
|
Indoor air quality
|
|
|
Air exchangers
|
Industrial refrigeration
|
|
|
Air handlers
|
Installation contracting
|
|
|
Airside and terminal devices
|
Large commercial unitary
|
|
|
Auxiliary power units
|
Light commercial unitary
|
|
|
Building management systems
|
Motor replacements
|
|
|
Bus and rail HVAC systems
|
Package heating and cooling systems
|
|
|
Chillers
|
Performance contracting
|
|
|
Coils and condensers
|
Rail refrigeration systems
|
|
|
Container refrigeration systems and gensets
|
|
Refrigerant reclamation
|
|
Control systems
|
|
Repair and maintenance services
|
|
Cryogenic refrigeration systems
|
|
Rental services
|
|
Diesel-powered refrigeration systems
|
Self-powered truck refrigeration systems
|
|
|
Ductless systems
|
|
Service agreements
|
|
Energy management services
|
|
Temporary heating and cooling systems
|
|
Facility management services
|
|
Thermostats/controls
|
|
Furnaces
|
|
Trailer refrigeration systems
|
|
Geothermal systems
|
|
Transport heater products
|
|
Heat pumps
|
|
Unitary systems (light and large)
|
|
Home automation
|
|
Vehicle-powered truck refrigeration systems
|
|
Humidifiers
|
Water source heat pumps
|
|
|
Industrial
|
||
|
Compressors (centrifugal, reciprocating, and rotary)
|
Fluid power components
|
|
|
Air treatment and air separation systems
|
Installation contracting
|
|
|
Aftermarket controls, parts, accessories and consumables
|
Power tools (air, cordless and electric)
|
|
|
Airends
|
Precision fastening systems
|
|
|
Blowers
|
Pumps (diaphragm and piston)
|
|
|
Dryers
|
Rental services
|
|
|
Engine starting systems
|
Rough terrain (AWD) vehicles
|
|
|
Ergonomic material handling systems
|
Service agreements
|
|
|
Filters
|
Service break/fix
|
|
|
Fluid handling systems
|
Utility and low-speed vehicles
|
|
|
Golf vehicles
|
Visage® mobile golf information systems
|
|
|
Hoists (air, electric and manual)
|
Winches (air, electric and hydraulic)
|
|
These products are sold primarily under our name and under other names including American Standard, ARO, Club Car, Nexia, Thermo King and Trane.
Recent Acquisitions and Divestitures
Acquisitions
On January 1, 2015, we completed the acquisition of the assets of Cameron International Corporation’s Centrifugal Compression ("Engineered Centrifugal Compression") business for approximately $
850 million
. The acquired business manufactures centrifugal compression equipment and provides aftermarket parts and services for global industrial applications, air separation, gas transmission and process gas. The acquisition was financed through a combination of cash on hand and debt. The results of the Engineered Centrifugal Compression business have been included in our consolidated financial statements since the date of the acquisition and are reported within our Industrial segment.
4
On March 4, 2015, we acquired 100% of the outstanding stock of FRIGOBLOCK for approximately €
100 million
(approximately $113 million). The acquired business manufactures and designs transport refrigeration units for trucks and trailers, which it sells primarily in Western Europe. FRIGOBLOCK’s financial results are included in our consolidated financial statements as of the date of acquisition and reported within the our Climate segment.
Discontinued Operations
On December 1, 2013, we completed the separation of its commercial and residential security businesses by distributing the related ordinary shares of Allegion, on a pro rata basis, to our shareholders of record as of November 22, 2013. After the Distribution Date, Allegion became an independent publicly traded company. The results of the commercial and residential security businesses prior to the spin-off are presented as a discontinued operation on the Consolidated Statement of Comprehensive Income and Consolidated Statement of Cash Flows for all periods presented.
Competitive Conditions
Our products and services are sold in highly competitive markets throughout the world. Due to the diversity of these products and services and the variety of markets served, we encounter a wide variety of competitors that vary by product line and services. They include well-established regional or specialized competitors, as well as larger U.S. and non-U.S. corporations or divisions of larger companies.
The principal methods of competition in these markets relate to price, quality, delivery, service and support, technology and innovation. We believe that we are one of the leading manufacturers in the world of HVAC systems and services, air compression systems, transport temperature control products, power tools, and golf and utility vehicles.
Distribution
Our products are distributed by a number of methods, which we believe are appropriate to the type of product. U.S. sales are made through branch sales offices, distributors and dealers across the country. Non-U.S. sales are made through numerous subsidiary sales and service companies with a supporting chain of distributors throughout the world.
Customers
We have no customer that accounted for more than 10% of our consolidated net revenues in
2015
,
2014
or
2013
. No material part of our business is dependent upon a single customer or a small group of customers; therefore, the loss of any one customer would not have a material adverse effect on our results of operations or cash flows.
Raw Materials
We manufacture many of the components included in our products, which requires us to employ a wide variety of commodities. Principal commodities, such as steel, copper and aluminum, are purchased from a large number of independent sources around the world. In the past, variability in prices for some commodities, particularly steel and non-ferrous metals, have caused pricing pressures in some of our businesses. We have historically been able to adjust pricing with customers to maintain our margins; however, we may not always be able to offset these cost changes with price changes.
We believe that available sources of supply will generally be sufficient for the foreseeable future. There have been no commodity shortages which have had a material adverse effect on our businesses. However, significant changes in certain material costs may have an adverse impact on our costs and operating margins. To mitigate this potential impact, we enter into long-term supply contracts in order to manage our exposure to potential supply disruptions.
Working Capital
We manufacture products that must be readily available to meet our customers’ rapid delivery requirements. Therefore, we maintain an adequate level of working capital to support our business needs and our customers’ requirements. Such working capital requirements are not, however, in the opinion of management, materially different from those experienced by our major competitors. We believe our sales and payment terms are competitive in and appropriate for the markets in which we compete.
Seasonality
Demand for certain of our products and services is influenced by weather conditions. For instance, Trane's sales have historically tended to be seasonally higher in the second and third quarters of the year because this represents summer in the U.S. and other northern hemisphere markets, which is the peak season for sales of air conditioning systems and services. Therefore, results of any quarterly period may not be indicative of expected results for a full year and unexpected cool trends or unseasonably warm trends during the summer season could negatively or positively affect certain segments of our business and impact overall results of operations.
5
Research and Development
We engage in research and development activities in an effort to introduce new products, enhance existing product effectiveness, improve ease of use and reliability as well as expand the various applications for which our products may be appropriate. In addition, we continually evaluate developing technologies in areas that we believe will enhance our business for possible investment or acquisition. We anticipate that we will continue to make significant expenditures for research and development activities as we look to maintain and improve our competitive position.
Patents and Licenses
We own numerous patents and patent applications, and are licensed under others. Although in aggregate we consider our patents and licenses to be valuable to our operations, we do not believe that our business is materially dependent on a single patent or license or any group of them. In our opinion, engineering, production skills and experience are more responsible for our market position than our patents and/or licenses.
Operations by Geographic Area
Approximately
38%
of our net revenues in
2015
were derived outside the U.S. and we sold products in more than 100 countries. Therefore, the attendant risks of manufacturing or selling in a particular country, such as currency devaluation, nationalization and establishment of common markets, may have an adverse impact on our non-U.S. operations. For a discussion of risks associated with our non-U.S. operations, see “Risk Factors – Our global operations subject us to economic risks,” and “Risk Factors – Currency exchange rate fluctuations and other related risks may adversely affect our results,” in Item 1A and “Quantitative and Qualitative Disclosure about Market Risk” in Item 7A. Additional geographic data is provided in Note 19 to the Consolidated Financial Statements.
Backlog
Our approximate backlog of orders, believed to be firm, at
December 31
, was as follows:
|
In millions
|
2015
|
2014
|
||||||
|
Climate
|
$
|
1,517.3
|
|
$
|
1,499.3
|
|
||
|
Industrial
|
574.0
|
|
489.6
|
|
||||
|
Total
|
$
|
2,091.3
|
|
$
|
1,988.9
|
|
||
These backlog figures are based on orders received. While the major portion of our products are built in advance of order and either shipped or assembled from stock, orders for specialized machinery or specific customer application are submitted with extensive lead times and are often subject to revision and deferral, and to a lesser extent cancellation or termination. We expect to ship substantially all the
December 31, 2015
backlog during
2016
.
Environmental Matters
We continue to be dedicated to an environmental program to reduce the utilization and generation of hazardous materials during the manufacturing process and to remediate identified environmental concerns. As to the latter, we are currently engaged in site investigations and remediation activities to address environmental cleanup from past operations at current and former manufacturing facilities.
We are sometimes a party to environmental lawsuits and claims and have received notices of potential violations of environmental laws and regulations from the Environmental Protection Agency and similar state authorities. We have also been identified as a potentially responsible party (PRP) for cleanup costs associated with off-site waste disposal at federal Superfund and state remediation sites. For all such sites, there are other PRPs and, in most instances, our involvement is minimal.
In estimating our liability, we have assumed that we will not bear the entire cost of remediation of any site to the exclusion of other PRPs who may be jointly and severally liable. The ability of other PRPs to participate has been taken into account, based on our understanding of the parties’ financial condition and probable contributions on a per site basis. Additional lawsuits and claims involving environmental matters are likely to arise from time to time in the future.
For a further discussion of our potential environmental liabilities, see Note 18 to the Consolidated Financial Statements.
6
Asbestos Related Matters
Certain of our wholly-owned subsidiaries are named as defendants in asbestos-related lawsuits in state and federal courts. In virtually all of the suits, a large number of other companies have also been named as defendants. The vast majority of those claims allege injury caused by exposure to asbestos contained in certain historical products, primarily pumps, boilers and railroad brake shoes. None of our existing or previously-owned businesses were a producer or manufacturer of asbestos.
See also the discussion under Part I, Item 3, "Legal Proceedings," and Part II, Item 7, "Management’s Discussion and Analysis of Financial Condition and Results of Operations," "Contingent Liabilities," as well as further detail in Note 18 to the Consolidated Financial Statements.
Employees
As of
December 31, 2015
, we employed approximately
45,000
people throughout the world.
Available Information
We file annual, quarterly, and current reports, proxy statements, and other documents with the SEC under the Securities Exchange Act of 1934.
This Annual Report on Form 10-K, as well as our quarterly reports on Form 10-Q, current reports on Form 8-K and any amendments to all of the foregoing reports, are made available free of charge on our Internet website (http://www.ingersollrand.com) as soon as reasonably practicable after such reports are electronically filed with or furnished to the SEC. The Board of Directors of the Company has also adopted and posted in the Investor Relations section of the Company’s website our Corporate Governance Guidelines and charters for each of the Board’s standing committees. The contents of the Company’s website are not incorporated by reference in this report.
7
Executive Officers of the Registrant
The following is a list of executive officers of the Company as of
February 12, 2016
.
|
Name and Age
|
|
Date of
Service as
an Executive
Officer
|
Principal Occupation and
Other Information for Past Five Years
|
|
|
Michael W. Lamach (52)
|
|
2/16/2004
|
Chairman of the Board (since June 2010) and Chief Executive Officer (since February 2010); President and Chief Operating Officer (2009-2010); Senior Vice President and President, Trane Commercial Systems (2008-2009); Senior Vice President and President, Security Technologies (2004-2008)
|
|
|
Susan K. Carter (57)
|
10/2/2013
|
|
Senior Vice President and Chief Financial Officer (since October 2013); Executive Vice President and Chief Financial Officer, KBR Inc. (a global engineering, construction and services business), (2009-2013); Executive Vice President and Chief Financial Officer, Lennox International Inc. (a heating, air conditioning and refrigeration company), (2004 to 2009)
|
|
|
Marcia J. Avedon (54)
|
2/7/2007
|
Senior Vice President, Human Resources, Communications and Corporate Affairs (since June 2013); Senior Vice President, Human Resources and Communications (2007 - 2013)
|
||
|
Paul A. Camuti (54)
|
8/1/2011
|
Senior Vice President, Innovation and Chief Technology Officer (since August 2011); President, Smart Grid Applications, Siemens Energy, Inc. (an energy technology subsidiary of Siemens Corporation) (2010 -2011); President, Research Division, Siemens Corporation (a diversified global technology company) (2009 - 2010); President and Chief Executive Officer, Siemens Corporate Research, Inc. (the research subsidiary of Siemens Corporation) (2005 - 2009)
|
||
|
|
||||
|
Maria C. Green (63)
|
11/2/2015
|
Senior Vice President and General Counsel (since November 2015); Senior Vice President, General Counsel and Secretary, Illinois Tool Works Inc. (a global manufacturer of a diversified range of industrial products and equipment), (2012-2015); Vice President, General Counsel & Secretary, Illinois Tool Works Inc. (2011-2012)
|
||
|
Gary S. Michel (53)
|
8/1/2011
|
Senior Vice President and President, Residential HVAC (since December 2013); Senior Vice President and President, Residential Solutions (2011-2013); President and Chief Executive Officer, Club Car (2007 - 2011)
|
||
|
Didier Teirlinck (59)
|
6/4/2008
|
Executive Vice President, Climate Segment (since December 2013); Senior Vice President and President, Climate Solutions (2009-2013); President, Climate Control Technologies (2008-2009); President, Climate Control Europe (2005-2008)
|
||
|
Keith A. Sultana (46)
|
10/12/2015
|
Senior Vice President, Global Operations and Integrated Supply Chain (since October 2015); Vice President, Global Procurement (January 2015 to October 2015); Vice President, Global Integrated Supply Chain (GISC) for Climate Solutions (2010 to 2014)
|
||
|
Robert G. Zafari (57)
|
7/1/2010
|
Executive Vice President, Industrial Segment (since December 2013); Senior Vice President and President, Industrial Technologies (2010-2013); President, TCS and Climate Solutions EMEIA (2009-2010); President, Security Technologies ESA (2007-2008)
|
||
|
Christopher J. Kuehn (43)
|
6/1/2015
|
Vice President and Controller (since June 2015); Vice President and Corporate Controller
,
Whirlpool Corporation (a global manufacturer and marketer of major home appliances), (2012-2015); Vice President, Global CFO Thermal Equipment and Services Segment, SPX Corporation (a global supplier of infrastructure equipment platforms in heating, ventilation and air conditioning (HVAC), (2008-2012)
|
||
No family relationship exists between any of the above-listed executive officers of the Company. All officers are elected to hold office for one year or until their successors are elected and qualified.
8
Item 1A
.
RISK FACTORS
Our business, financial condition, results of operations, and cash flows are subject to a number of risks that could cause the actual results and conditions to differ materially from those projected in forward-looking statements contained in this Annual Report on Form 10-K. The risks set forth below are those we consider most significant. We face other risks, however, that we do not currently perceive to be material but could cause actual results and conditions to differ materially from our expectations. You should evaluate all risks before you invest in our securities. If any of the risks actually occur, our business, financial condition, results of operations or cash flows could be adversely impacted. In that case, the trading price of our ordinary shares could decline, and you may lose all or part of your investment.
Our global operations subject us to economic risks.
Our global operations are dependent upon products manufactured, purchased and sold in the U.S. and internationally, including Europe, China, Brazil, Venezuela, Africa, India, Argentina, Mexico and Russia. These activities are subject to risks that are inherent in operating globally, including:
|
•
|
changes in local laws and regulations or imposition of currency restrictions and other restraints;
|
|
•
|
limitation of ownership rights, including expropriation of assets by a local government, and limitation on the ability to repatriate earnings;
|
|
•
|
sovereign debt crises and currency instability in developed and developing countries;
|
|
•
|
imposition of burdensome tariffs and quotas;
|
|
•
|
difficulty in staffing and managing global operations;
|
|
•
|
difficulty of enforcing agreements, collecting receivables and protecting assets through non-U.S. legal systems;
|
|
•
|
national and international conflict, including war, civil disturbances and terrorist acts; and
|
|
•
|
economic downturns, slowing economic growth and social and political instability.
|
These risks could increase our cost of doing business internationally, increase our counterparty risk, disrupt our operations, disrupt the ability of suppliers and customers to fulfill their obligations, limit our ability to sell products in certain markets and have a material adverse impact on our results of operations, financial condition, and cash flows.
We face significant competition in the markets that we serve and our growth is dependent, in part, on the development, commercialization and acceptance of new products and services.
The markets that we serve are highly competitive. We compete worldwide with a number of other manufacturers and distributors that produce and sell similar products. There has been consolidation and new entrants within our industries and there may be future consolidation and new entrants which could result in increased competition and significantly alter the dynamics of the competitive landscape in which we operate. Due to our global footprint we are competing worldwide with large companies and with smaller, local operators who may have customer, regulatory or economic advantages in the geographies in which they are located.
In addition, we must develop and commercialize new products and services in a rapidly changing technological and business environment in order to remain competitive in our current and future markets and in order to continue to grow our business. The development and commercialization of new products and services require a significant investment of resources and an anticipation of the impact of new technologies and the ability to compete with others who may have superior resources. We cannot provide any assurance that any new product or service will be successfully commercialized in a timely manner, if ever, or, if commercialized, will result in returns greater than our investment. Investment in a product or service could divert our attention and resources from other projects that become more commercially viable in the market. We also cannot provide any assurance that any new product or service will be accepted by our current and future markets. Failure to develop new products and services that are accepted by these markets could have a material adverse impact on our competitive position, results of operations, financial condition, and cash flows.
The capital and credit markets are important to our business.
Instability in U.S. and global capital and credit markets, including market disruptions, limited liquidity and interest rate volatility, or reductions in the credit ratings assigned to us by independent rating agencies could reduce our access to capital markets or increase the cost of funding our short and long term credit requirements. In particular, if we are unable to access capital and credit markets on terms that are acceptable to us, we may not be able to make certain investments or fully execute our business plans and strategies.
Our suppliers and customers are also dependent upon the capital and credit markets. Limitations on the ability of customers, suppliers or financial counterparties to access credit could lead to insolvencies of key suppliers and customers, limit or prevent customers from obtaining credit to finance purchases of our products and services and cause delays in the delivery of key products from suppliers.
9
Currency exchange rate fluctuations and other related risks may adversely affect our results.
We are exposed to a variety of market risks, including the effects of changes in currency exchange rates. See Part II Item 7A, "Quantitative and Qualitative Disclosure About Market Risk."
We have operations throughout the world that manufacture and sell products in various international markets. As a result, we are exposed to movements in exchange rates of various currencies against the U.S. dollar as well as against other currencies throughout the world.
Many of our non-U.S. operations have a functional currency other than the U.S. dollar, and their results are translated into U.S. dollars for reporting purposes. Therefore, our reported results will be higher or lower depending on the weakening or strengthening of the U.S. dollar against the respective foreign currency.
We use derivative instruments to hedge those material exposures that cannot be naturally offset. The instruments utilized are viewed as risk management tools, involve little complexity and are not used for trading or speculative purposes. To minimize the risk of counter party non-performance, derivative instrument agreements are made only through major financial institutions with significant experience in such derivative instruments.
We also face risks arising from the imposition of exchange controls and currency devaluations. Exchange controls may limit our ability to convert foreign currencies into U.S. dollars or to remit dividends and other payments by our foreign subsidiaries or businesses located in or conducted within a country imposing controls. Currency devaluations result in a diminished value of funds denominated in the currency of the country instituting the devaluation.
Material adverse legal judgments, fines, penalties or settlements could adversely affect our results of operations or financial condition.
We are currently and may in the future become involved in legal proceedings and disputes incidental to the operation of our business or the business operations of previously-owned entities. Our business may be adversely affected by the outcome of these proceedings and other contingencies (including, without limitation, product liability and asbestos-related matters) that cannot be predicted with certainty. Moreover, any insurance or indemnification rights that we may have may be insufficient or unavailable to protect us against the total aggregate amount of losses sustained as a result of such proceedings and contingencies. As required by generally accepted accounting principles in the United States, we establish reserves based on our assessment of contingencies. Subsequent developments in legal proceedings and other events could affect our assessment and estimates of the loss contingency recorded as a reserve and we may be required to make additional material payments, which could have a material adverse impact on our liquidity, results of operations, financial condition, and cash flows.
Our reputation, ability to do business and results of operations could be impaired by improper conduct by any of our employees, agents or business partners.
We are subject to regulation under a wide variety of U.S. federal and state and non-U.S. laws, regulations and policies, including laws related to anti-corruption, export and import compliance, anti-trust and money laundering, due to our global operations. We cannot provide assurance our internal controls will always protect us from the improper conduct of our employees, agents and business partners. Any violations of law or improper conduct could damage our reputation and, depending on the circumstances, subject us to, among other things, civil and criminal penalties, material fines, equitable remedies (including profit disgorgement and injunctions on future conduct), securities litigation and a general loss of investor confidence, any one of which could have a material adverse impact on our business prospects, financial condition, results of operations, cash flows, and the market value of our stock.
We may be subject to risks relating to our information technology systems.
We rely extensively on information technology systems, some of which are supported by third party vendors, to manage and operate our business. We are also investing in new information technology systems that are designed to continue improving our operations. If these systems cease to function properly, if these systems experience security breaches or disruptions or if these systems do not provide the anticipated benefits, our ability to manage our operations could be impaired, which could have a material adverse impact on our results of operations, financial condition, and cash flows.
Security breaches or disruptions of our technology systems, infrastructure or products could negatively impact our business and financial results.
Our information technology systems and infrastructure and technology embedded in certain of our control products may be subject to cyber attacks and unauthorized security intrusions. It is possible for such vulnerabilities to remain undetected for an extended period. In addition, hardware, software or applications we develop or obtain from third parties may contain defects in design or manufacture or other problems that could unexpectedly result in security breaches or disruptions. The methods used to obtain unauthorized access, disable or degrade service, or sabotage systems are constantly changing and evolving. Despite having instituted security policies and business continuity plans, and implementing and regularly reviewing and updating processes and procedures
10
to protect against unauthorized access, the ever-evolving threats mean we must continually evaluate and adapt our systems and processes, and there is no guarantee that they will be adequate to safeguard against all data security breaches or misuses of data. Our systems, networks and certain of our control products may be vulnerable to system damage, malicious attacks from hackers, employee errors or misconduct, viruses, power and utility outages, and other catastrophic events that could cause significant harm to our business by negatively impacting our business operations, compromising the security of our proprietary information or the personally identifiable data relating to our customers, employees and business partners and exposing us to litigation that could adversely affect our reputation. Such events could have a material adverse impact on our results of operations, financial condition and cash flows. Our insurance coverage may not be adequate to cover all the costs related to a cybersecurity attack or disruptions resulting from such attacks.
Commodity shortages and price increases and higher energy prices could adversely affect our financial results.
We rely on suppliers to secure commodities, particularly steel and non-ferrous metals, required for the manufacture of our products. A disruption in deliveries from our suppliers or decreased availability of commodities could have an adverse effect on our ability to meet our commitments to customers or increase our operating costs. We believe that available sources of supply will generally be sufficient for our needs for the foreseeable future. Nonetheless, the unavailability of some commodities could have a material adverse impact on our results of operations and cash flows.
Volatility in the prices of these commodities or the impact of inflationary increases could increase the costs of our products and services. We may not be able to pass on these costs to our customers and this could have a material adverse impact on our results of operations and cash flows. Conversely, in the event there is deflation, we may experience pressure from its customers to reduce prices. There can be no assurance that we would be able to reduce its costs (through negotiations with suppliers or other measures) to offset any such price concessions which could adversely impact results of operations and cash flows. We do not currently use financial derivatives to hedge against this volatility. While we use fixed price contracts to mitigate this exposure, we expect any future hedging activity to seek to minimize near-term volatility of the commodity prices which would not protect us from long-term commodity price increases.
Additionally, we are exposed to large fluctuations in the price of petroleum-based fuel due to the instability of current market prices. Higher energy costs increase our operating costs and the cost of shipping our products, and supplying services, to customers around the world. Consequently, sharp price increases, the imposition of taxes or an interruption of supply, could cause us to lose the ability to effectively manage the risk of rising fuel prices and may have a material adverse impact on our results of operations and cash flows.
We may be required to recognize impairment charges for our goodwill and other indefinite-lived intangible assets.
At
December 31, 2015
, the net carrying value of our goodwill and other indefinite-lived intangible assets totaled $
5.7 billion
and $
2.7 billion
, respectively. In accordance with generally accepted accounting principles, we periodically assess these assets to determine if they are impaired. Significant negative industry or economic trends, disruptions to our business, unexpected significant changes or planned changes in use of the assets, divestitures and sustained market capitalization declines may result in recognition of impairments to goodwill or other indefinite-lived assets. Any charges relating to such impairments could have a material adverse impact on our results of operations in the periods recognized.
Changes in weather patterns and seasonal fluctuations may adversely affect certain segments of our business and impact overall results of operations.
Demand for certain segments of our products and services is influenced by weather conditions. For instance, Trane's sales have historically tended to be seasonally higher in the second and third quarters of the year because, in the U.S. and other northern hemisphere markets, summer is the peak season for sales of air conditioning systems and services. Therefore, results of any quarterly period may not be indicative of expected results for a full year and unexpected cool trends or unseasonably warm trends during the summer season could negatively or positively affect certain segments of our business and impact overall results of operations.
11
Global climate change and related regulations could negatively affect our business.
Refrigerants are essential to many of our products and there is a growing awareness and concern regarding global warming potential of such materials. As such, national, regional and international regulations and policies are being considered to curtail their use. As we begin to see regulations impeding the use of the current class of widely used refrigerants we are planning for, and managing transitions to, sustainable solutions. We have committed to increase energy efficiency and reduce our climate impact with operational and product-related climate targets, including among other initiatives: (i) 50 percent reduction in the greenhouse gas emissions of our products for customers by 2020 and lower global warming potential alternatives across our portfolio by 2030; (ii) $500 million investment in product-related research and development from 2015-2020 to fund the long-term reduction of greenhouse gas emissions; and (iii) 35 percent reduction in the greenhouse gas footprint of our office buildings, manufacturing facilities and fleet by 2020. While we are committed to pursuing these sustainable solutions, there can be no assurance that our commitments will be successful, that our products will be accepted by the market or that economic returns will match the investment that we are making in new product development.
Concerns regarding global climate change may result in more international, regional and/or federal requirements to reduce or mitigate global warming and these regulations could mandate even more restrictive standards than the voluntary commitments that we have made or require such changes on a more accelerated timeframe. There continues to be a lack of consistent climate legislation, which creates economic and regulatory uncertainty. Such regulatory uncertainty extends to future incentives for energy efficient buildings and vehicles and costs of compliance, which may impact the demand for our products, obsolescence of our products and our results of operations.
In addition, to the extent climate change influences weather patterns, such changes could also disrupt our operations by causing business interruptions or by impacting the availability and cost of materials needed for manufacturing and could increase insurance and other operating costs. These factors may impact our decisions to construct new facilities or maintain existing facilities in areas most prone to physical climate risks.
Weakness in the commercial and residential construction markets may adversely impact our results of operations and cash flow.
Our commercial and residential HVAC businesses, which collectively represent 61% of our net revenues, provide products and services to a wide range of markets, including significant sales to the commercial and residential construction markets. Weakness in either or both of these construction markets may negatively impact the demand for our products and services. Decrease in the demand for our products and services could have a material adverse impact on our results of operations and cash flow.
12
Our business strategy includes acquiring companies, entering into joint ventures and making investments that complement our existing businesses. We may not identify acquisition or joint venture candidates at the same rate as the past. Acquisitions, joint ventures and investments that we identify could be unsuccessful or consume significant resources, which could adversely affect our operating results.
We continue to analyze and evaluate the acquisition of strategic businesses and product lines, joint ventures and investments with the potential to strengthen our industry position, enhance our existing set of product and services offerings or grow revenues, earnings and cash flow. There can be no assurance that we will identify or successfully complete transactions with suitable candidates in the future, that we will consummate these transactions at rates similar to the past or that completed transactions will be successful. Acquisitions, joint ventures and investments may involve significant cash expenditures, debt incurrence, operating losses and expenses that could have a material adverse effect on our business, financial condition, results of operations and cash flows. Such transactions involve numerous other risks, including:
|
•
|
diversion of management time and attention from daily operations;
|
|
•
|
difficulties integrating acquired businesses, technologies and personnel into our business;
|
|
•
|
difficulties in obtaining and verifying the financial statements and other business information of acquired businesses;
|
|
•
|
inability to obtain required regulatory approvals and/or required financing on favorable terms;
|
|
•
|
potential loss of key employees, key contractual relationships or key customers of either acquired businesses or our business;
|
|
•
|
assumption of the liabilities and exposure to unforeseen liabilities of acquired businesses;
|
|
•
|
dilution of interests of holders of our common shares through the issuance of equity securities or equity-linked securities; and
|
|
•
|
in the case of joint ventures and other investments, interests that diverge from those of our partners without the ability to direct the management and operations of the joint venture or investment in the manner we believe most appropriate.
|
It may be difficult for us to complete transactions quickly and to integrate acquired operations efficiently into our business operations. Any acquisitions, joint ventures or investments may ultimately harm our business, financial condition, results of operations and cash flows, as such transactions may not be successful and may ultimately result in impairment charges.
Our operations are subject to regulatory risks.
Our U.S. and non-U.S. operations are subject to a number of laws and regulations, including among others, laws related to the environment and health and safety. We have made, and will be required to continue to make, significant expenditures to comply with these laws and regulations. Any violations of applicable laws and regulations could lead to significant penalties, fines or other sanctions. Changes in current laws and regulations could require us to increase our compliance expenditures, cause us to significantly alter or discontinue offering existing products and services or cause us to develop new products and services. Altering current products and services or developing new products and services to comply with changes in the applicable laws and regulations could require significant research and development investments, increase the cost of providing the products and services and adversely affect the demand for our products and services. The U.S. federal government and various states and municipalities have enacted or may enact legislation intended to deny government contracts to U.S. companies that reincorporate outside of the U.S. or have reincorporated outside of the U.S or may take other actions negatively impacting such companies. If we are unable to effectively respond to changes to applicable laws and regulations, interpretations of applicable laws and regulations, or comply with existing and future laws and regulations, our competitive position, results of operations, financial condition and cash flows could be materially adversely impacted.
Risks Relating to our Past Spin-off Transaction
In December 2013, we completed the spin-off of our former commercial and residential security businesses to our shareholders (the spin-off) pursuant to which each shareholder as of the record date for the spin-off received one ordinary share of Allegion, plc (Allegion) for every three Ingersoll-Rand plc ordinary shares. Allegion is now an independent public company. This spin-off exposed us and our shareholders to the risks described below. In addition, we cannot be assured that all of the anticipated benefits of the spin-off and subsequent to the spin-off will be realized.
If the distribution or certain internal transactions undertaken in anticipation of the spin-off are determined to be taxable for U.S. federal income tax purposes, we, our shareholders as of the time of the distribution that are subject to U.S. federal income tax and/or Allegion could incur significant U.S. federal income tax liabilities.
We received a ruling from the U.S. Internal Revenue Service (the “IRS”) substantially to the effect that, among other things, the distribution of Allegion plc’s ordinary shares, together with certain related transactions, will qualify for tax-free treatment under
13
Sections 355 and 368(a) of the U.S. Internal Revenue Code of 1986, as amended (the “Code”), with the result that we and our shareholders will not recognize any taxable income, gain or loss for U.S. federal income tax purposes as a result of the spin-off, except to the extent of cash received in lieu of fractional shares (the “IRS Ruling”). The IRS Ruling also provides that specified internal transactions undertaken in anticipation of the distribution will qualify for favorable treatment under the Code. In addition, we received opinions from the law firm of Simpson Thacher & Bartlett LLP substantially to the effect that specified requirements, including certain requirements that the IRS will not rule on, necessary to obtain tax-free treatment have been satisfied, such that the distribution for U.S. federal income tax purposes and certain other matters relating to the distribution, including certain internal transactions undertaken in anticipation of the distribution, will receive tax-free treatment under Section 355 of the Code. The IRS Ruling and the opinions relied on certain facts and assumptions and certain representations and undertakings from us and Allegion regarding the past and future conduct of our respective businesses and other matters.
Notwithstanding the IRS Ruling and the opinions, the IRS could determine on audit that the distribution or the internal transactions should be treated as taxable transactions if it determines that any of these facts, assumptions, representations or undertakings is not correct or has been violated, or that the distribution or the internal transactions should be taxable for other reasons, including as a result of significant changes in shares or asset ownership after the distribution. A legal opinion represents the tax adviser’s best legal judgment and is not binding on the IRS or the courts, and the IRS or the courts may not agree with the opinion. In addition, the opinion is based on current law and cannot be relied upon if current law changes with retroactive effect. If the distribution, and/or internal transactions, ultimately is determined to be taxable, we or Allegion could incur significant U.S. federal income tax liabilities, which could cause a material adverse impact on our business, financial condition, results of operations and cash flows in future reporting periods.
Furthermore, if, notwithstanding receipt of the IRS Ruling and opinions, the spin-off were determined to be a taxable transaction, each shareholder subject to U.S. federal income tax who received shares of Allegion in the spin-off would generally be treated as receiving a taxable distribution of property in an amount equal to the fair market value of the Allegion shares received. That distribution would be taxable as a dividend to the extent of our then-current and accumulated earnings and profits. Any amount that exceeded our earnings and profits would be treated first as a non-taxable return of capital to the extent of the applicable shareholder's tax basis in our ordinary shares with any remaining amount being taxed as a capital gain.
Under the terms of the Tax Matters Agreement between us and Allegion executed in connection with the spin-off, in the event the distribution or the internal transactions were determined to be taxable as a result of actions taken after the distribution by us or Allegion, the party responsible for such failure would be responsible for all taxes imposed on us or Allegion as a result thereof. If such failure is not the result of actions taken after the distribution by us or Allegion, then Allegion would be responsible for any taxes imposed on us or Allegion as a result of such determination. Such tax amounts could be significant. If Allegion were to default in its obligation to us to pay such taxes, we could be legally liable under applicable tax law for such liabilities and required to make additional tax payments. Accordingly, under certain circumstances, we may be obligated to pay amounts in excess of our agreed-upon share of tax liabilities. To the extent we are responsible for any liability under the Tax Matters Agreement, there could be a material adverse impact on our business, financial condition, results of operations and cash flows in future reporting periods.
If the distribution is determined to be taxable for Irish tax purposes, significant Irish tax liabilities may arise.
We received an opinion of the Irish Revenue regarding the Irish tax consequences of the distribution to the effect that certain reliefs and exemptions for corporate reorganizations apply. In addition to obtaining the opinion from Irish Revenue, we also received opinions from the law firm of Arthur Cox confirming the applicability of the relevant exemptions and reliefs to the distribution as well as received opinions from other external advisers that certain internal transactions will not trigger Irish tax costs as well. These opinions relied on certain facts and assumptions and certain representations and undertakings from us and Allegion regarding the past and future conduct of our respective businesses and other matters. Notwithstanding the opinions, Irish Revenue could determine on audit that the distribution or the internal transactions do not qualify for the relevant exemptions or reliefs if it determines that any of these facts, assumptions, representations or undertakings is not correct or has been violated. A legal opinion represents the tax adviser’s best legal judgment and is not binding on Irish Revenue or the courts and Irish Revenue or the courts may not agree with the legal opinion. In addition, the legal opinion is based on current law and cannot be relied upon if current law changes with retroactive effect. If the distribution ultimately is determined not to fall within certain exemptions or reliefs, the distribution could result in certain of our shareholders having an Irish tax liability as a result of the distribution, or we or Allegion could incur Irish tax liabilities. To the extent we are responsible for any such liability under the Tax Matters Agreement, there could be a material adverse impact on our business, financial condition, results of operations and cash flows in future reporting periods.
Risks Relating to Our Past Reorganizations
We effected a corporate reorganization in December 2001 to become a Bermuda company (the Bermuda Reorganization) and a subsequent corporate reorganization in July 2009 to become an Irish public limited company. These reorganizations exposed us and our shareholders to the risks described below. In addition, we cannot be assured that all of the anticipated benefits of the reorganizations will be realized.
14
Changes in tax or other laws, regulations or treaties, changes in our status under U.S. or non-U.S. laws or adverse determinations by taxing or other governmental authorities could increase our tax burden or otherwise affect our financial condition or operating results, as well as subject our shareholders to additional taxes.
The realization of any tax benefit related to our reorganizations could be impacted by changes in tax or other laws, treaties or regulations or the interpretation or enforcement thereof by the U.S. or non-U.S. tax or other governmental authorities. From time to time, proposals have been made and/or legislation has been introduced to change the tax laws, regulations or interpretations thereof of various jurisdictions or limit tax treaty benefits that if enacted or implemented could materially increase our tax burden and/or effective tax rate and could have a material adverse impact on our financial condition and results of operations. For instance, certain U.S. legislative proposals would broaden the circumstances under which we would be considered a U.S. resident for U.S. tax purposes, which would significantly diminish the realization of any tax benefit related to our reorganizations. There are other U.S. legislative proposals that could modify or eliminate the tax deductibility of various currently deductible payments, which could materially and adversely affect our effective tax rate and cash tax position. In addition, other U.S. legislative proposals could have a material adverse impact on us by overriding certain tax treaties and limiting the treaty benefits on certain payments by our U.S. subsidiaries to our non-U.S. affiliates, which could increase our tax liability. Moreover, the Organization for Economic Co-operation and Development has released proposals to create an agreed set of international rules for fighting base erosion and profit shifting, such that tax laws in countries in which we do business could change on a prospective or retroactive basis, and any such changes could adversely impact us. We cannot predict the outcome of any of these potential changes in any jurisdiction.
While we monitor proposals and other developments that would materially impact our tax burden and/or effective tax rate and investigate our options, we could still be subject to increased taxation on a going forward basis no matter what action we undertake if certain legislative proposals or regulatory changes are enacted, certain tax treaties are amended and/or our interpretation of applicable tax or other laws is challenged and determined to be incorrect. In particular, any changes and/or differing interpretations of applicable tax law that have the effect of disregarding the Ireland Reorganization, limiting our ability to take advantage of tax treaties between jurisdictions, modifying or eliminating the deductibility of various currently deductible payments, or increasing the tax burden of operating or being resident in a particular country, could subject us to increased taxation.
While our U.S. operations are subject to U.S. tax, we believe that a significant portion of our non-U.S. operations are generally not subject to U.S. tax other than withholding taxes. The IRS or a court, however, may not concur with our conclusions including our determination that we, and a significant number of our foreign subsidiaries, are not controlled foreign corporations (CFC) within the meaning of the U.S. tax laws. A contrary determination, which could also arise through significant future acquisitions of our stock by U.S. persons, could also potentially cause U.S. holders (direct, indirect or constructive owners) of 10% or more of our stock (or the voting stock of our non-U.S. subsidiaries) to include in their gross income their pro rata share of certain of our and our non-U.S. subsidiary income for the period during which we (and our non-U.S. subsidiaries) were a CFC. In addition, gain (or a portion of such gain) realized on CFC shares sold by such shareholders may be treated as ordinary income depending on certain facts. Treatment of us or any of our non-U.S. subsidiaries as a CFC could have a material adverse impact on our results of operations, financial condition, and cash flows.
The inability to realize any anticipated tax benefits related to our reorganizations could have a material adverse impact on our results of operations, financial condition, and cash flows.
Irish law differs from the laws in effect in the United States and may afford less protection to holders of our securities.
The United States currently does not have a treaty with Ireland providing for the reciprocal recognition and enforcement of judgments in civil and commercial matters. As such, there is some uncertainty as to whether the courts of Ireland would recognize or enforce judgments of U.S. courts obtained against us or our directors or officers based on U.S. federal or state civil liability laws, including the civil liability provisions of the U.S. federal or state securities laws, or hear actions against us or those persons based on those laws.
As an Irish company, we are governed by the Irish Companies Act, which differs in some material respects from laws generally applicable to U.S. corporations and shareholders, including, among others, differences relating to interested director and officer transactions and shareholder lawsuits. Likewise, the duties of directors and officers of an Irish company generally are owed to the company only. Shareholders of Irish companies generally do not have a personal right of action against directors or officers of the company and may exercise such rights of action on behalf of the company only in limited circumstances. Accordingly, holders of our securities may have more difficulty protecting their interests than would holders of securities of a corporation incorporated in a jurisdiction of the United States.
In addition, Irish law allows shareholders to authorize share capital which then can be issued by a board of directors without shareholder approval. Also, subject to specified exceptions, Irish law grants statutory pre-emptive rights to existing shareholders to subscribe for new issuances of shares for cash, but allows shareholders to authorize the waiver of the statutory pre-emptive rights with respect to any particular allotment of shares. Under Irish law, we must have authority from our shareholders to issue any shares, including shares that are part of the company’s authorized but unissued share capital. In addition, unless otherwise authorized by its shareholders, when an Irish company issues shares for cash to new shareholders, it is required first to offer those
15
shares on the same or more favorable terms to existing shareholders on a pro-rata basis. If we are unable to obtain these authorizations from our shareholders, or are otherwise limited by the terms of our authorizations, our ability to issue shares or otherwise raise capital could be adversely affected.
Dividends received by our shareholders may be subject to Irish dividend withholding tax.
In certain circumstances, we are required to deduct Irish dividend withholding tax (currently at the rate of 20%) from dividends paid to our shareholders. In the majority of cases, shareholders resident in the United States will not be subject to Irish withholding tax, and shareholders resident in a number of other countries will not be subject to Irish withholding tax provided that they complete certain Irish dividend withholding tax forms. However, some shareholders may be subject to withholding tax, which could have an adverse impact on the price of our shares.
Dividends received by our shareholders could be subject to Irish income tax.
Dividends paid in respect of our shares will generally not be subject to Irish income tax where the beneficial owner of these dividends is exempt from dividend withholding tax, unless the beneficial owner of the dividend has some connection with Ireland other than his or her shareholding in IR-Ireland.
Our shareholders who receive their dividends subject to Irish dividend withholding tax will generally have no further liability to Irish income tax on the dividends unless the beneficial owner of the dividend has some connection with Ireland other than his or her shareholding in Ingersoll Rand plc.
Item 1B.
UNRESOLVED STAFF COMMENTS
None.
Item 2.
PROPERTIES
As of
December 31, 2015
, we owned or leased a total of approximately
14 million
square feet of space worldwide. Manufacturing and assembly operations are conducted in
51
plants across the world. We also maintain various warehouses, offices and repair centers throughout the world. The majority of our plant facilities are owned by us with the remainder under long-term lease arrangements. We believe that our plants have been well maintained, are generally in good condition and are suitable for the conduct of our business.
16
The locations by segment of our principal plant facilities at
December 31, 2015
were as follows:
|
Climate
|
||||
|
Americas
|
Europe
|
Asia Pacific and India
|
||
|
Curitiba, Brazil
|
Kolin, Czech Republic
|
Zhong Shan, China
|
||
|
Monterrey, Mexico
|
Charmes, France
|
Taicang, China
|
||
|
Arecibo, Puerto Rico
|
Golbey, France
|
Bangkok, Thailand
|
||
|
Fort Smith, Arkansas *
|
Galway, Ireland
|
Penang, Malaysia
|
||
|
Pueblo, Colorado
|
Barcelona, Spain
|
|||
|
Lynn Haven, Florida
|
Essen, Germany
|
|||
|
Macon, Georgia
|
||||
|
Vidalia, Georgia
|
||||
|
Rushville, Indiana
|
||||
|
Lexington, Kentucky
|
||||
|
St. Paul, Minnesota
|
||||
|
Hastings, Nebraska
|
||||
|
Trenton, New Jersey
|
||||
|
Columbia, South Carolina
|
||||
|
Clarksville, Tennessee
|
||||
|
Tyler, Texas
|
||||
|
Waco, Texas
|
||||
|
La Crosse, Wisconsin
|
||||
|
Charlotte, North Carolina
|
||||
|
* The Fort Smith, Arkansas location has two plants.
|
||||
|
Industrial
|
||||
|
Americas
|
Europe
|
Asia Pacific and India
|
||
|
Dorval, Canada
|
Unicov, Czech Republic
|
Changzhou, China
|
||
|
Augusta, Georgia
|
Sin le Noble, France
|
Guilin, China
|
||
|
Campbellsville, Kentucky
|
Wasquehal, France
|
Nanjing, China
|
||
|
Mocksville, North Carolina
|
Oberhausen, Germany
|
Wujiang, China
|
||
|
Southern Pines, North Carolina
|
Fogliano Redipuglia, Italy
|
Naroda, India
|
||
|
West Chester, Pennsylvania
|
Vignate, Italy
|
Sahibabad, India
|
||
|
Kent, Washington
|
Logatec, Slovenia
|
|||
|
Buffalo, New York
|
||||
Item 3.
LEGAL PROCEEDINGS
In the normal course of business, we are involved in a variety of lawsuits, claims and legal proceedings, including commercial and contract disputes, employment matters, product liability claims, asbestos-related claims, environmental liabilities, intellectual property disputes, and tax-related matters. In our opinion, pending legal matters are not expected to have a material adverse impact on our results of operations, financial condition, liquidity or cash flows.
Tax Related Matters
As previously discussed in our third quarter Form 10-Q for the quarterly period ended September 30, 2015, we entered into an agreement with the IRS in July 2015 to resolve disputes related to withholding and income taxes for years 2002 through 2011. The IRS had previously disagreed with our tax treatment of intercompany debt and distributions and asserted we owed income and withholding tax relating to the 2002-2006 period totaling $774 million, not including interest and penalties. We also provided a substantial amount of information to the IRS in connection with its audit of the 2007-2011 tax periods. We expected the IRS to propose similar adjustments to these periods, although it was not known how the IRS would apply its position to the different
17
facts presented in these years or whether the IRS would take a similar position to intercompany debt instruments not outstanding in prior years.
The resolution reached in July 2015 covered intercompany debt and related issues for the entire period from 2002 through 2011 and includes all aspects of the dispute with the U.S. Tax Court, the Appeals Division and the Examination Division of the IRS. The resolution was subsequently reported to the Congressional Joint Committee on Taxation (JCT), as required, for its review. The JCT concluded its review without objection in December 2015 and the settlement was finalized with the IRS in December 2015.
Pursuant to the agreement with the IRS, we agreed to pay withholding tax and interest of $412 million in respect to the 2002-2006 years. We owed no additional tax with respect to intercompany debt and related matters for the years 2007-2011. No penalties were applied to any of the tax years 2002 through 2011. The resolution resulted in a net cash outflow of approximately $
364 million
, consisting of $230 million in tax and $134 million of interest, net of a tax benefit of $48 million.
For a further discussion of tax matters, see Note 15 to the Consolidated Financial Statements.
Asbestos-Related Matters
Certain of our wholly-owned subsidiaries are named as defendants in asbestos-related lawsuits in state and federal courts. In virtually all of the suits, a large number of other companies have also been named as defendants. The vast majority of those claims allege injury caused by exposure to asbestos contained in certain historical products, primarily pumps, boilers and railroad brake shoes. None of our existing or previously-owned businesses were a producer or manufacturer of asbestos.
See also the discussion under Part II, Item 7, "Management’s Discussion and Analysis of Financial Condition and Results of Operations," "Contingent Liabilities," and also Note 18 to the Consolidated Financial Statements.
18
Item 4.
MINE SAFETY DISCLOSURES
Not applicable.
Item 5.
MARKET FOR REGISTRANT’S COMMON EQUITY, RELATED STOCKHOLDER MATTERS AND
ISSUER PURCHASES OF EQUITY SECURITIES
Information regarding the principal market for our ordinary shares and related shareholder matters is as follows:
Our ordinary shares are traded on the New York Stock Exchange under the symbol IR. As of
February 1, 2016
, the approximate number of record holders of ordinary shares was
3,660
.
The high and low sales price per share and the dividend declared per share for the following periods were as follows:
|
Ordinary shares
|
||||||||||||
|
2015
|
High
|
Low
|
Dividend
|
|||||||||
|
First quarter
|
$
|
69.01
|
|
$
|
60.15
|
|
$
|
0.29
|
|
|||
|
Second quarter
|
70.93
|
|
65.47
|
|
0.29
|
|
||||||
|
Third quarter
|
69.28
|
|
49.80
|
|
0.29
|
|
||||||
|
Fourth quarter
|
60.43
|
|
49.74
|
|
0.29
|
|
||||||
|
2014
|
High
|
Low
|
Dividend
|
|||||||||
|
First quarter
|
$
|
62.88
|
|
$
|
55.70
|
|
$
|
0.25
|
|
|||
|
Second quarter
|
63.99
|
|
54.39
|
|
0.25
|
|
||||||
|
Third quarter
|
64.50
|
|
56.36
|
|
0.25
|
|
||||||
|
Fourth quarter
|
64.59
|
|
53.57
|
|
0.25
|
|
||||||
Future dividends on our ordinary shares, if any, will be at the discretion of our Board of Directors and will depend on, among other things, our results of operations, cash requirements and surplus, financial condition, contractual restrictions and other factors that the Board of Directors may deem relevant, as well as our ability to pay dividends in compliance with the Irish Companies Act 2014. Under the Irish Companies Act 2014, dividends and distributions may only be made from distributable reserves. Distributable reserves, broadly, means the accumulated realized profits (so far as not previously distributed or capitalized) less its accumulated, realized losses (so far as not previously written off in a reduction or reorganization of its share capital) of Ingersoll-Rand plc. In addition, no distribution or dividend may be made unless the net assets of Ingersoll-Rand plc are equal to, or in excess of, the aggregate of Ingersoll-Rand plc’s called up share capital plus undistributable reserves and the distribution does not reduce Ingersoll-Rand plc's net assets below such aggregate.
Information regarding equity compensation plans required to be disclosed pursuant to this Item is incorporated by reference from our definitive proxy statement for the Annual General Meeting of Shareholders.
19
Issuer Purchases of Equity Securities
The following table provides information with respect to purchases by us of our ordinary shares during the quarter ended
December 31, 2015
:
|
Period
|
Total number of shares purchased (000's) (a) (b)
|
Average price paid per share (a) (b)
|
Total number of shares purchased as part of program (000's) (a)
|
Approximate dollar value of shares still available to be purchased under the program ($000's) (a)
|
||||||||||
|
October 1 - October 31
|
331.1
|
|
$
|
50.93
|
|
327.3
|
|
$
|
666,639
|
|
||||
|
November 1 - November 30
|
—
|
|
—
|
|
—
|
|
$
|
666,639
|
|
|||||
|
December 1 - December 31
|
2.9
|
|
58.01
|
|
—
|
|
$
|
666,639
|
|
|||||
|
Total
|
334.0
|
|
$
|
50.99
|
|
327.3
|
|
|||||||
(a) In February 2014, our Board of Directors authorized the repurchase of up to
$1.5 billion
of our ordinary shares under a share repurchase program, which began in April 2014. Based on market conditions, share repurchases will be made from time to time in the open market and in privately negotiated transactions at the discretion of management. The repurchase program does not have a prescribed expiration date.
(b) We may also reacquire shares outside of the repurchase program from time to time in connection with the surrender of shares to cover taxes on vesting of share based awards. We reacquired 3,843 shares in October and 2,869 shares in December in transactions outside the repurchase programs.
20
Performance Graph
The following graph compares the cumulative total shareholder return on our ordinary shares with the cumulative total return on (i) the Standard & Poor’s 500 Stock Index and (ii) the Standard & Poor’s 500 Industrial Index for the five years ended
December 31, 2015
. The graph assumes an investment of $100 in our ordinary shares, the Standard & Poor’s 500 Stock Index and the Standard & Poor’s 500 Industrial Index on December 31, 2010 and assumes the reinvestment of dividends.
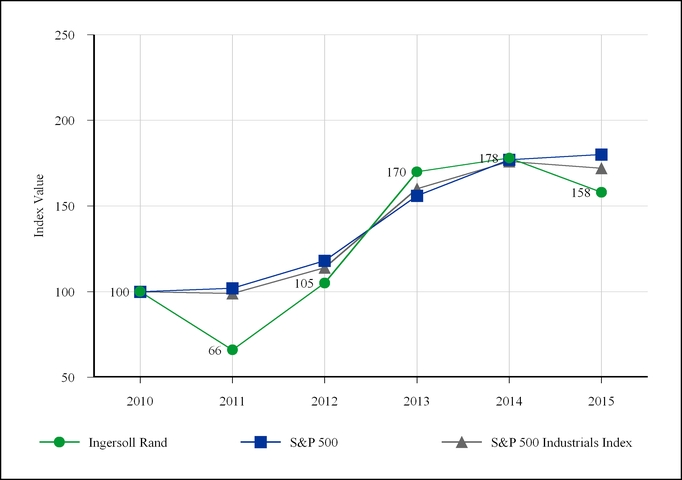
|
Company/Index
|
2010
|
2011
|
2012
|
2013
|
2014
|
2015
|
|
Ingersoll Rand
|
100
|
66
|
105
|
170
|
178
|
158
|
|
S&P 500
|
100
|
102
|
118
|
156
|
177
|
180
|
|
S&P 500 Industrials Index
|
100
|
99
|
114
|
160
|
176
|
172
|
21
Item 6.
SELECTED FINANCIAL DATA
In millions, except per share amounts:
|
At and for the years ended December 31,
|
2015
|
2014
|
2013
|
2012
|
2011
|
|||||||||||||||
|
Net revenues
|
$
|
13,300.7
|
|
$
|
12,891.4
|
|
$
|
12,350.5
|
|
$
|
11,988.3
|
|
$
|
12,760.8
|
|
|||||
|
Net earnings (loss) attributable to Ingersoll-Rand plc ordinary shareholders:
|
||||||||||||||||||||
|
Continuing operations
|
688.9
|
|
897.0
|
|
620.1
|
|
772.4
|
|
123.4
|
|
||||||||||
|
Discontinued operations
|
(24.3
|
)
|
34.7
|
|
(1.3
|
)
|
246.2
|
|
219.8
|
|
||||||||||
|
Total assets
|
16,738.8
|
|
17,298.5
|
|
17,658.1
|
|
18,482.1
|
|
18,819.6
|
|
||||||||||
|
Total debt
|
4,239.0
|
|
4,224.4
|
|
3,521.2
|
|
3,229.4
|
|
3,637.6
|
|
||||||||||
|
Total Ingersoll-Rand plc shareholders’ equity
|
5,816.7
|
|
5,987.4
|
|
7,068.9
|
|
7,147.8
|
|
6,924.3
|
|
||||||||||
|
Earnings (loss) per share attributable to Ingersoll-Rand plc ordinary shareholders:
|
||||||||||||||||||||
|
Basic:
|
||||||||||||||||||||
|
Continuing operations
|
$
|
2.60
|
|
$
|
3.32
|
|
$
|
2.11
|
|
$
|
2.54
|
|
$
|
0.38
|
|
|||||
|
Discontinued operations
|
(0.09
|
)
|
0.12
|
|
—
|
|
0.81
|
|
0.68
|
|
||||||||||
|
Diluted:
|
||||||||||||||||||||
|
Continuing operations
|
$
|
2.57
|
|
$
|
3.27
|
|
$
|
2.08
|
|
$
|
2.49
|
|
$
|
0.36
|
|
|||||
|
Discontinued operations
|
(0.09
|
)
|
0.13
|
|
(0.01
|
)
|
0.79
|
|
0.65
|
|
||||||||||
|
Dividends declared per ordinary share
|
$
|
1.16
|
|
$
|
1.00
|
|
$
|
0.63
|
|
$
|
0.69
|
|
$
|
0.59
|
|
|||||
|
1.
|
2011 amounts represent the operating results of the Hussmann Business and Branches through their respective divestiture and transaction dates of September 30, 2011 and November 30, 2011, including an after-tax loss on sale and impairment charges of $
546 million
.
|
|
2.
|
2011 Dividends declared per ordinary share includes a dividend of $
0.16
per ordinary share, declared in December 2011, and payable on March 30, 2012 to shareholders of record on March 12, 2012.
|
|
3.
|
2012 Dividends declared per ordinary share includes a dividend of $0.21 per ordinary share, declared in December 2012, and payable on March 28, 2013 to shareholders of record on March 12, 2013.
|
22
Item 7.
MANAGEMENT’S DISCUSSION AND ANALYSIS OF FINANCIAL CONDITION AND RESULTS OF OPERATIONS
The following Management’s Discussion and Analysis of Financial Condition and Results of Operations contains forward-looking statements that involve risks and uncertainties. Our actual results may differ materially from the results discussed in the forward-looking statements. Factors that might cause a difference include, but are not limited to, those discussed under Item 1A. Risk Factors in this Annual Report on Form 10-K. The following section is qualified in its entirety by the more detailed information, including our financial statements and the notes thereto, which appears elsewhere in this Annual Report.
Overview
Organization
We are a diversified, global company that provides products, services and solutions to enhance the quality and comfort of air in homes and buildings, transport and protect food and perishables and increase industrial productivity and efficiency. Our business segments consist of Climate and Industrial, both with strong brands and leading positions within their respective markets. We generate revenue and cash primarily through the design, manufacture, sale and service of a diverse portfolio of industrial and commercial products that include well-recognized, premium brand names such as Ingersoll-Rand
®
, Trane
®
, Thermo King
®
, American Standard
®
, ARO
®
,
and Club Car
®
.
To achieve our mission of being a world leader in creating comfortable, sustainable and efficient environments, we continue to focus on increasing our recurring revenue stream from parts, service, used equipment and rentals; and to continuously improve the efficiencies and capabilities of the products and services of our high-potential businesses. Additional emphasis is placed on expanding market coverage in terms of geography or by taking advantage of a particular vertical market or opportunity. We also continue to focus on operational excellence strategies as a central theme to improving our earnings and cash flows.
Trends and Economic Events
We are a global corporation with worldwide operations. As a global business, our operations are affected by worldwide, regional and industry-specific economic factors, as well as political factors, wherever we operate or do business. Our geographic and industry diversity, and the breadth of our product and services portfolios, have helped mitigate the impact of any one industry or the economy of any single country on our consolidated operating results.
Given the broad range of products manufactured and geographic markets served, management uses a variety of factors to predict the outlook for the Company. We monitor key competitors and customers in order to gauge relative performance and the outlook for the future. We regularly perform detailed evaluations of the different market segments we are serving to proactively detect trends and to adapt our strategies accordingly. In addition, we believe our order rates are indicative of future revenue and thus a key measure of anticipated performance. In those industry segments where we are a capital equipment provider, revenues depend on the capital expenditure budgets and spending patterns of our customers, who may delay or accelerate purchases in reaction to changes in their businesses and in the economy.
Current economic conditions remain challenging across each of the segments in which we participate. Residential and Commercial new construction has seen moderate growth in the United States which is positively impacting the results of our Heating, Ventilation and Air Conditioning (HVAC) businesses. Non-residential new construction continues to grow slowly in Europe and Asia. In addition, HVAC equipment replacement and aftermarket continue to experience steady growth. However, we have seen slower worldwide industrial equipment and aftermarket activity and economic pressure in Asia and Latin America. As economic conditions stabilize, we expect moderate growth in worldwide construction markets and flat to slow growth in industrial markets, along with benefits from continued productivity programs.
Despite the current market environment, we believe we have a solid foundation of global brands and leading market shares in all of our major product lines. Our growing geographic and industry diversity coupled with our large installed product base provides growth opportunities within our service, parts and replacement revenue streams. In addition, we are investing substantial resources to innovate and develop new products and services which we expect will drive our future growth.
Significant Events in the Year
IRS Exam Results
As previously discussed in our third quarter Form 10-Q for the quarterly period ended September 30, 2015, we entered into an agreement with the IRS in July 2015 to resolve disputes related to withholding and income taxes for years 2002 through 2011. The IRS had previously disagreed with our tax treatment of intercompany debt and distributions and asserted we owed income and withholding tax relating to the 2002-2006 period totaling $774 million, not including interest and penalties. We also provided a substantial amount of information to the IRS in connection with its audit of the 2007-2011 tax periods. We expected the IRS to propose similar adjustments to these periods, although it was not known how the IRS would apply its position to the different
23
facts presented in these years or whether the IRS would take a similar position to intercompany debt instruments not outstanding in prior years.
The resolution reached in July 2015 covered intercompany debt and related issues for the entire period from 2002 through 2011 and includes all aspects of the dispute with the U.S. Tax Court, the Appeals Division and the Examination Division of the IRS. The resolution was subsequently reported to the Congressional Joint Committee on Taxation (JCT), as required, for its review. The JCT concluded its review without objection in December 2015 and the settlement was finalized with the IRS in December 2015.
Pursuant to the agreement with the IRS, we agreed to pay withholding tax and interest of $412 million in respect to the 2002-2006 years. We owed no additional tax with respect to intercompany debt and related matters for the years 2007-2011. No penalties were applied to any of the tax years 2002 through 2011. The resolution resulted in a net cash outflow of approximately $
364 million
, consisting of $230 million in tax and $134 million of interest, net of a tax benefit of $48 million.
Announcement to Sell Hussmann Minority Interest
On December 21, 2015, we announced we will sell our remaining equity interest in Hussmann Parent, Inc. (“Hussmann”) as part of a transaction in which Panasonic Corporation will acquire 100 percent of Hussmann's shares. We expect to receive net proceeds of approximately $
425 million
. The transaction is anticipated to close in the first half of 2016 subject to customary approvals and closing conditions and has no impact on the results of our operations in 2015.
Acquisitions
On January 1, 2015, we completed the acquisition of the assets of Cameron International Corporation’s Centrifugal Compression business for approximately $
850 million
. The acquired business manufactures centrifugal compression equipment and provides aftermarket parts and services for global industrial applications, air separation, gas transmission and process gas. The acquisition was financed through a combination of cash on hand and debt. The results of the Engineered Centrifugal Compression business have been included in our consolidated financial statements since the date of the acquisition and are reported within our Industrial segment.
On March 4, 2015, we acquired 100% of the outstanding stock of FRIGOBLOCK for approximately €
100 million
(approximately $113 million). The acquired business manufactures and designs transport refrigeration units for trucks and trailers, which it sells primarily in Western Europe. The results of the FRIGOBLOCK business have been included in our consolidated financial statements since the date of the acquisition and are reported within our Climate segment.
2016 Dividend Increase and Share Repurchase Program
In February 2016, we announced an increase in our quarterly share dividend of 10% from $0.29 to $0.32 per share beginning with our March 2016 payment.
In February 2014, our Board of Directors authorized the repurchase of up to $1.5 billion of our ordinary shares under a share repurchase program that began in April 2014. Share repurchases are made from time to time at the discretion of management subject to market conditions, regulatory requirements and other considerations.
During the year ended December 31, 2015, we repurchased and settled
4.4 million
shares for $
250.1 million
. As of December 31, 2015, we had approximately $667 million remaining on the authorized plan. Since January 1, 2016, we repurchased and settled 4.9 million shares for $250.0 million. We have approximately $417 million remaining on the authorized plan.
Venezuela Currency Devaluation
We have one subsidiary with operations in Venezuela. Due to the historical designation of Venezuela as a highly inflationary economy, the U.S. dollar is the functional currency for this subsidiary. From February 2013 to March 2015, we utilized the official exchange rate obtained through the National Center of Foreign Trade (CENCOEX) of
6.3
bolivars to the U.S. dollar to translate the Venezuela subsidiary financial statements.
In January 2014, the Venezuelan government significantly expanded the use of the Supplementary Foreign Currency Administration System (SICAD) I exchange market and created a third exchange market called SICAD II. In January 2015, the Venezuelan government clarified the priority imports for the CENCOEX exchange and our products were not listed as a priority. In February 2015, the Venezuelan government announced a new exchange market called the Marginal Currency System (SIMADI), which replaced the SICAD II exchange and allows for trading based on supply and demand. These markets have exchange rates significantly less favorable than the CENCOEX rate.
In light of the developments described above and the continued deterioration in the economic conditions of Venezuela in connection with our preparation of the first quarter 2015 financial statements, we utilized the SIMADI rate of
192.95
bolivars to U.S. dollar to translate the financial position of our Venezuelan subsidiary as of March 31, 2015. As a result, we recorded a pre-tax charge of $
42.6 million
(within Other income/(expense), net) during the first quarter of 2015 to remeasure the net monetary assets at March
24
31, 2015. Our remaining net assets denominated in Venezuelan bolivar are nominal and continue be measured in U.S. dollars using the SIMADI rate through
December 31, 2015
.
25
Results of Operations
Our Climate segment globally delivers energy-efficient products and innovative energy services. It includes Trane
®
and American Standard
®
Heating & Air Conditioning which provide heating, ventilation and air conditioning (HVAC) systems, and commercial and residential building services, parts, support and controls; energy services and building automation through Trane Building Advantage and Nexia; and Thermo King
®
transport temperature control solutions.
Our Industrial segment delivers products and services that enhance energy efficiency, productivity and operations. It includes compressed air and gas systems and services, power tools, material handling systems, ARO
®
fluid management equipment, as well as Club Car
®
golf, utility and rough terrain vehicles.
Segment operating income is the measure of profit and loss that our chief operating decision maker uses to evaluate the financial performance of the business and as the basis for performance reviews, compensation and resource allocation. For these reasons, we believe that Segment operating income represents the most relevant measure of segment profit and loss. We may exclude certain charges or gains from Operating income to arrive at a Segment operating income that is a more meaningful measure of profit and loss upon which to base our operating decisions. We define Segment operating margin as Segment operating income as a percentage of Net revenues.
Year Ended December 31, 2015 Compared to the Year Ended December 31, 2014
|
Dollar amounts in millions
|
2015
|
2014
|
Period Change
|
2015
% of Revenues
|
2014
% of Revenues
|
|||||||||||
|
Net revenues
|
$
|
13,300.7
|
|
$
|
12,891.4
|
|
$
|
409.3
|
|
|||||||
|
Cost of goods sold
|
(9,301.6
|
)
|
(8,982.8
|
)
|
(318.8
|
)
|
69.9%
|
69.8%
|
||||||||
|
Selling and administrative expenses
|
(2,541.1
|
)
|
(2,503.9
|
)
|
(37.2
|
)
|
19.1%
|
19.4%
|
||||||||
|
Operating income
|
1,458.0
|
|
1,404.7
|
|
53.3
|
|
11.0%
|
10.9%
|
||||||||
|
Interest expense
|
(223.0
|
)
|
(225.3
|
)
|
2.3
|
|
||||||||||
|
Other income/(expense), net
|
12.9
|
|
30.0
|
|
(17.1
|
)
|
|
|
||||||||
|
Earnings before income taxes
|
1,247.9
|
|
1,209.4
|
|
38.5
|
|
||||||||||
|
Provision for income taxes
|
(540.8
|
)
|
(293.7
|
)
|
(247.1
|
)
|
|
|
||||||||
|
Earnings from continuing operations
|
707.1
|
|
915.7
|
|
(208.6
|
)
|
||||||||||
|
Gain (loss) from discontinued operations, net of tax
|
(24.3
|
)
|
34.7
|
|
(59.0
|
)
|
|
|
||||||||
|
Net earnings
|
$
|
682.8
|
|
$
|
950.4
|
|
$
|
(267.6
|
)
|
|||||||
Net Revenues
Net revenues for the year ended December 31, 2015 increased by
3.2%
, or
$409.3 million
, compared with the same period of 2014. The components of the period change are as follows:
|
Volume/product mix
|
4.5
|
%
|
|
Acquisitions
|
2.4
|
%
|
|
Pricing
|
0.2
|
%
|
|
Currency translation
|
(3.9
|
)%
|
|
Total
|
3.2
|
%
|
The increase in revenues was primarily driven by higher volumes in our Climate segment and favorable contributions from acquisitions across both business segments. These items were partially offset by unfavorable currency impacts, primarily from the Euro.
Our Revenues by segment are as follows:
|
Dollar amounts in millions
|
2015
|
2014
|
% change
|
||||||
|
Climate
|
$
|
10,224.3
|
|
$
|
9,879.7
|
|
3.5%
|
||
|
Industrial
|
3,076.4
|
|
3,011.7
|
|
2.1%
|
||||
|
Total
|
$
|
13,300.7
|
|
$
|
12,891.4
|
|
|
||
26
Climate
Net revenues for the year ended December 31, 2015 increased by
3.5%
or $
344.6 million
, compared with the same period of 2014 The components of the period change are as follows:
|
Volume/product mix
|
6.4
|
%
|
|
Acquisitions
|
0.4
|
%
|
|
Pricing
|
0.1
|
%
|
|
Currency translation
|
(3.4
|
)%
|
|
Total
|
3.5
|
%
|
The primary driver of the revenue increase related to higher volumes in each of our businesses. Commercial HVAC revenues increased from improvements in equipment, parts, services and solutions. In addition, Residential HVAC revenues increased through moderate market growth. Revenues in our Thermo King refrigeration transport business improved through organic growth in North America and Europe. Revenue improvements in the Climate segment were partially offset by the negative impact of foreign currency exchange rates.
Industrial
Net revenues for the year ended December 31, 2015 increased by
2.1%
or $
64.7 million
, compared with the same period of 2014. The components of the period change are as follows:
|
Volume/product mix
|
(1.6
|
)%
|
|
Acquisitions
|
8.9
|
%
|
|
Pricing
|
0.4
|
%
|
|
Currency translation
|
(5.6
|
)%
|
|
Total
|
2.1
|
%
|
The primary driver of the revenue increase related to acquisition of the Engineered Centrifugal Compression business during the year. In addition, Club Car revenues increased from gains in golf cars, utility vehicles and aftermarket sales. However, overall organic revenues decreased due to weak Industrial markets. Segment results were also negatively impacted by foreign currency exchange rate movements.
Operating Income/Margin
Operating margin improved to
11.0%
for the year ended December 31, 2015, compared to
10.9%
for the same period of 2014. The increase was primarily due to productivity benefits in excess of other inflation (0.9%), pricing improvements in excess of material inflation (0.3%) and favorable product mix and volume (0.3%), partially offset by increased investment and restructuring spending (0.5%), unfavorable currency impacts (0.5%), primarily from the Euro, and the inclusion of the Engineered Centrifugal Compression business and related step-up amortization (0.4%).
Our Operating income and Operating margin by segment are as follows:
|
Dollar amounts in millions
|
2015 Operating Income (Expense)
|
2014 Operating Income (Expense)
|
Period Change
|
2015 Operating Margin
|
2014 Operating Margin
|
||||||||||||
|
Climate
|
$
|
1,302.5
|
|
$
|
1,195.6
|
|
$
|
106.9
|
|
12.7
|
%
|
12.1
|
%
|
||||
|
Industrial
|
372.4
|
|
443.0
|
|
(70.6
|
)
|
12.1
|
%
|
14.7
|
%
|
|||||||
|
Unallocated corporate expenses
|
(216.9
|
)
|
(233.9
|
)
|
17.0
|
|
N/A
|
|
N/A
|
|
|||||||
|
Total
|
$
|
1,458.0
|
|
$
|
1,404.7
|
|
$
|
53.3
|
|
11.0
|
%
|
10.9
|
%
|
||||
Climate
Operating margin improved to
12.7%
for the year ended December 31, 2015, compared to
12.1%
for the same period of 2014. The improvement was primarily due to favorable product mix and volume (0.7%) and productivity benefits in excess of other inflation (0.5%), partially offset by increased investment spending (0.3%) and unfavorable currency impacts (0.3%), primarily from the Euro.
Industrial
Operating margin decreased to
12.1%
for the year ended December 31, 2015 compared to
14.7%
for the same period of 2014. The decrease was primarily due to the inclusion of the Engineered Centrifugal Compression business and related step-up amortization (1.9%), unfavorable volume/product mix (1.4%), increased investment and restructuring spending (0.9%) and
27
unfavorable currency impacts (0.8%), partially offset by productivity benefits in excess of other inflation (1.8%) and pricing improvements in excess of material inflation (0.6%).
Unallocated Corporate Expenses
Unallocated corporate expense for the year ended December 31, 2015 decreased by
7.3%
or $
17.0 million
, compared with the same period of 2014 due to lower professional expenses.
Interest Expense
Interest expense for the year ended December 31, 2015 increased by $
2.3 million
compared with the same period of 2014, primarily as a result of higher average debt balances during 2015, partially offset by a lower weighted-average interest rate during the period.
Other income/(expense), net
The components of Other income/(expense), net, for the year ended December 31 are as follows:
|
In millions
|
2015
|
2014
|
Period Change
|
|||||||||
|
Interest income
|
$
|
10.6
|
|
$
|
13.2
|
|
$
|
(2.6
|
)
|
|||
|
Exchange loss
|
(36.2
|
)
|
(0.1
|
)
|
(36.1
|
)
|
||||||
|
Income from equity investment
|
12.6
|
|
7.8
|
|
4.8
|
|
||||||
|
Other activity, net
|
25.9
|
|
9.1
|
|
16.8
|
|
||||||
|
Other income/(expense), net
|
$
|
12.9
|
|
$
|
30.0
|
|
$
|
(17.1
|
)
|
|||
We recognized a loss on foreign currency exchange of $36.2 million for the year ended December 31, 2015. This loss is comprised of a $42.6 million pre-tax charge recorded in the first quarter related to the remeasurement of net monetary assets denominated in Venezuelan bolivar, partially offset by foreign currency transaction gains.
We recognized income from our equity investment in Hussmann, a refrigeration display case business, of $12.6 million and $7.8 million for the years ended December 31, 2015 and 2014, respectively. Our ownership interest was 36.7% and 37.2% at December 31, 2015 and 2014, respectively.
Other activity primarily consists of income realized from insurance settlements on asbestos-related matters. In addition, other activity for the year ended December 31, 2014 includes a $6.0 million gain on the sale of an investment.
Provision for Income Taxes
The 2015 effective tax rate was 43.3% which is higher than the U.S. Statutory rate of 35% primarily due to the $227 million charge taken to settle the IRS matters described within the Significant Events in the Year section in Management's Discussion and Analysis, which increased our effective tax rate by 18.1%. This effect was partially offset by a $65 million benefit from the settlement of an audit in a major tax jurisdiction, less a tax charge of $52 million from a change in permanent reinvestment assertions on earnings from certain of our subsidiaries in non-U.S. jurisdictions. Revenues from non-U.S. jurisdictions account for approximately 38% of our total revenues, such that a material portion of our pretax income is earned and taxed outside the U.S. at rates ranging from 0% to 38%. When comparing the results of multiple reporting periods, among other factors, the mix of earnings between U.S. and foreign jurisdictions can cause variability on our overall effective tax rate.
The 2014 effective tax rate was 24.3%. The 2014 effective tax rate is lower than the U.S. Statutory rate of 35% primarily due to earnings in non-U.S. jurisdictions, which in aggregate have a lower effective rate partially offset by U.S. State and Local income taxes and U.S. tax on non-U.S. earnings.
Discontinued Operations
The components of discontinued operations for the years ended December 31 are as follows:
|
In millions
|
2015
|
2014
|
Period Change
|
|||||||||
|
Net revenues
|
$
|
—
|
|
$
|
—
|
|
$
|
—
|
|
|||
|
Pre-tax earnings (loss) from operations
|
(23.2
|
)
|
41.2
|
|
(64.4
|
)
|
||||||
|
Tax expense
|
(1.1
|
)
|
(6.5
|
)
|
5.4
|
|
||||||
|
Discontinued operations, net of tax
|
$
|
(24.3
|
)
|
$
|
34.7
|
|
$
|
(59.0
|
)
|
|||
28
Discontinued operations by business for the years ended December 31 are as follows:
|
In millions
|
2015
|
2014
|
Period Change
|
|||||||||
|
Allegion spin-off, net of tax
|
$
|
(4.5
|
)
|
$
|
15.0
|
|
$
|
(19.5
|
)
|
|||
|
Other discontinued operations, net of tax
|
(19.8
|
)
|
19.7
|
|
(39.5
|
)
|
||||||
|
Discontinued operations, net of tax
|
$
|
(24.3
|
)
|
$
|
34.7
|
|
$
|
(59.0
|
)
|
|||
Allegion Spin-Off
On December 1, 2013, (the Distribution Date) we completed the spin-off of our commercial and residential security businesses, now under the name of Allegion, plc (Allegion), to our shareholders (the spin-off). Allegion is now an independently traded public company. After-tax earnings from Allegion for the year ended December 31, 2014 primarily represent adjustments for certain tax matters.
Other Discontinued Operations
Other discontinued operations, net of tax for the years ended December 31, 2015 and 2014 are mainly related to postretirement benefits, product liability, worker's compensation, tax, and legal costs (mostly asbestos-related) from previously sold businesses.
Year Ended December 31, 2014 Compared to the Year Ended December 31, 2013
|
Dollar amounts in millions
|
2014
|
2013
|
Period Change
|
2014
% of Revenues
|
2013
% of Revenues
|
|||||||||||
|
Net revenues
|
$
|
12,891.4
|
|
$
|
12,350.5
|
|
$
|
540.9
|
|
|||||||
|
Cost of goods sold
|
(8,982.8
|
)
|
(8,722.3
|
)
|
(260.5
|
)
|
69.8%
|
70.6%
|
||||||||
|
Selling and administrative expenses
|
(2,503.9
|
)
|
(2,523.2
|
)
|
19.3
|
|
19.4%
|
20.4%
|
||||||||
|
Operating income
|
1,404.7
|
|
1,105.0
|
|
299.7
|
|
10.9%
|
8.9%
|
||||||||
|
Interest expense
|
(225.3
|
)
|
(278.8
|
)
|
53.5
|
|
||||||||||
|
Other income/(expense), net
|
30.0
|
|
3.4
|
|
26.6
|
|
|
|
||||||||
|
Earnings before income taxes
|
1,209.4
|
|
829.6
|
|
379.8
|
|
||||||||||
|
Provision for income taxes
|
(293.7
|
)
|
(189.0
|
)
|
(104.7
|
)
|
|
|
||||||||
|
Earnings from continuing operations
|
915.7
|
|
640.6
|
|
275.1
|
|
||||||||||
|
Gain (loss) from discontinued operations, net of tax
|
34.7
|
|
13.3
|
|
21.4
|
|
|
|
||||||||
|
Net earnings
|
$
|
950.4
|
|
$
|
653.9
|
|
$
|
296.5
|
|
|||||||
Net Revenues
Net revenues for the year ended December 31, 2014 increased by
4.4%
, or
$540.9 million
, compared with the same period of 2013, which primarily resulted from the following:
|
Volume/product mix
|
4.6
|
%
|
|
Pricing
|
0.5
|
%
|
|
Currency translation
|
(0.7
|
)%
|
|
Total
|
4.4
|
%
|
The increase in revenues was primarily driven by volume improvements within the Climate and Industrial segments.
Our Revenues by segment are as follows:
|
Dollar amounts in millions
|
2014
|
2013
|
% change
|
|||||||
|
Climate
|
$
|
9,879.7
|
|
$
|
9,414.0
|
|
4.9%
|
|||
|
Industrial
|
3,011.7
|
|
2,936.5
|
|
2.6%
|
|||||
|
Total
|
$
|
12,891.4
|
|
$
|
12,350.5
|
|
|
|||
29
Climate
Net revenues for the year ended December 31, 2014 increased by
4.9%
or $
465.7 million
, compared with the same period of 2013, which primarily resulted from the following:
|
Volume/product mix
|
5.0
|
%
|
|
Pricing
|
0.6
|
%
|
|
Currency translation
|
(0.7
|
)%
|
|
Total
|
4.9
|
%
|
Commercial HVAC net revenues increased due to improvements in equipment, parts, services and solutions markets. Residential HVAC net revenues increased due to increased volume in all major product categories. Thermo King refrigerated transport revenues increases in North America were partially offset by declines overseas.
Industrial
Net revenues for the year ended December 31, 2014 increased by
2.6%
, or $
75.2 million
, compared with the same period of 2013, which primarily resulted from the following.
|
Volume/product mix
|
3.2
|
%
|
|
Pricing
|
0.3
|
%
|
|
Currency translation
|
(0.9
|
)%
|
|
Total
|
2.6
|
%
|
Air compressors and industrial product net revenues increased with pricing gains in Americas. Club Car net revenues increased with growth in both golf car and utility vehicle sales.
Operating Income/Margin
Operating margin improved to
10.9%
for the year ended
December 31, 2014
, compared to
8.9%
for the same period of 2013. The increase was primarily due to productivity benefits in excess of other inflation (1.1%), favorable product mix and volume (0.6%), improved pricing net of material inflation (0.2%) and decreased restructuring spending (0.6%), partially offset by increased investment (0.5%).
Our Operating income and Operating margin by segment are as follows:
|
Dollar amounts in millions
|
2014 Operating Income (Expense)
|
2013 Operating Income (Expense)
|
Period Change
|
2014 Operating Margin
|
2013 Operating Margin
|
||||||||||||
|
Climate
|
$
|
1,195.6
|
|
$
|
936.0
|
|
$
|
259.6
|
|
12.1
|
%
|
9.9
|
%
|
||||
|
Industrial
|
443.0
|
|
450.3
|
|
(7.3
|
)
|
14.7
|
%
|
15.3
|
%
|
|||||||
|
Unallocated corporate expenses
|
(233.9
|
)
|
(281.3
|
)
|
$
|
47.4
|
|
N/A
|
|
N/A
|
|
||||||
|
Total
|
$
|
1,404.7
|
|
$
|
1,105.0
|
|
$
|
299.7
|
|
10.9
|
%
|
8.9
|
%
|
||||
Climate
Segment operating margin improved to
12.1%
for the year ended December 31, 2014, compared to
9.9%
for the same period of 2013. The improvement was primarily driven by productivity benefits in excess of other inflation (1.2%), favorable volume/product mix (0.6%), pricing improvements in excess of material inflation (0.2%) and decreased restructuring spending (0.4%); partially offset by increased investment spending (0.2%).
Industrial
Segment operating margin decreased to
14.7%
for the year ended December 31, 2014 compared to
15.3%
for the same period of 2013. The decrease was due to increased investment spending (1.2%), partially offset by lower restructuring spending (0.4%) and favorable volume/product mix (0.2%).
Unallocated Corporate Expenses
Unallocated corporate expense for the year ended December 31, 2014 decreased by 16.9% or $47.4 million, compared with the same period of 2013 due to lower professional expenses.
Interest Expense
Interest expense for the year ended December 31, 2014 decreased by $
53.5 million
compared with the same period of 2013, primarily as a result of lower redemption premium expense from early debt retirements ($10.2 million in 2014 compared to $45.6 million in 2013) and lower interest rates on refinanced debt.
30
Other income/(expense), net
The components of Other income/(expense), net, for the year ended December 31 are as follows:
|
In millions
|
2014
|
2013
|
Period Change
|
|||||||||
|
Interest income
|
$
|
13.2
|
|
$
|
12.8
|
|
$
|
0.4
|
|
|||
|
Exchange loss
|
(0.1
|
)
|
(14.0
|
)
|
13.9
|
|
||||||
|
Income (loss) from equity investment
|
7.8
|
|
(2.6
|
)
|
10.4
|
|
||||||
|
Other activity, net
|
9.1
|
|
7.2
|
|
1.9
|
|
||||||
|
Other income/(expense), net
|
$
|
30.0
|
|
$
|
3.4
|
|
$
|
26.6
|
|
|||
We recognized income from our equity investment in Hussmann, a refrigeration display case business, of $
7.8 million
and a loss of $
2.6 million
for the years ended December 31, 2014 and
2013
, respectively. Our ownership interest was 37.2% at both December 31, 2014 and
2013
.
Other activity primarily consists of income realized from insurance settlements on asbestos-related matters. In addition, other activity for the year ended December 31, 2014 includes a $
6.0 million
gain on the sale of an investment.
Provision for Income Taxes
The 2014 effective tax rate was 24.3%. The 2014 effective tax rate is lower than the U.S. Statutory rate of 35% primarily due to earnings in non-U.S. jurisdictions, which in aggregate have a lower effective rate partially offset by U.S. State and Local income taxes and U.S. tax on non-U.S. earnings.
The 2013 effective tax rate was 22.8%. The 2013 effective tax rate is lower than the U.S. Statutory rate of 35% primarily due to earnings in non-U.S. jurisdictions, which in aggregate, have a lower effective rate and a $36 million net reduction in our liability for unrecognized tax benefits primarily due to the settlement of an audit in a major tax jurisdiction, partially offset by a tax charge of $51 million as a result of a change in assertion in certain subsidiary earnings that the company has previously determined to be permanently reinvested and approximately $74 million of Allegion spin-off tax charges, primarily related to a net increase in our valuation allowances on certain deferred tax assets.
Discontinued Operations
The components of discontinued operations for the years ended December 31 are as follows:
|
In millions
|
2014
|
2013
|
Period Change
|
|||||||||
|
Net revenues
|
$
|
—
|
|
$
|
1,889.9
|
|
$
|
(1,889.9
|
)
|
|||
|
Pre-tax earnings from operations
|
41.2
|
|
84.7
|
|
(43.5
|
)
|
||||||
|
Tax expense
|
(6.5
|
)
|
(71.4
|
)
|
64.9
|
|
||||||
|
Discontinued operations, net of tax
|
$
|
34.7
|
|
$
|
13.3
|
|
$
|
21.4
|
|
|||
Discontinued operations by business for the years ended December 31 are as follows:
|
In millions
|
2014
|
2013
|
Period Change
|
|||||||||
|
Allegion spin-off, net of tax
|
$
|
15.0
|
|
$
|
12.4
|
|
$
|
2.6
|
|
|||
|
Other discontinued operations, net of tax
|
19.7
|
|
0.9
|
|
18.8
|
|
||||||
|
Discontinued operations, net of tax
|
$
|
34.7
|
|
$
|
13.3
|
|
$
|
21.4
|
|
|||
Allegion Spin-Off
On December 1, 2013, (the Distribution Date) we completed the spin-off of our commercial and residential security businesses, now under the name of Allegion, plc (Allegion), to our shareholders (the spin-off). Allegion is now an independently traded public company. After-tax earnings from Allegion for the year ended December 31, 2014 primarily represent adjustments for certain tax matters. After-tax earnings from Allegion for the year ended December 31, 2013 includes spin costs of
$128.0 million
. Also, the 2013 results include non-cash goodwill charges and tax of
$111.4 million
and
$148.2 million
, respectively.
Other Discontinued Operations
Other discontinued operations, net of tax for the years ended December 31, 2014 and 2013 are mainly related to postretirement benefits, product liability, worker's compensation, and legal costs (mostly asbestos-related) from previously sold businesses and tax effects of post-closing purchase price adjustments.
31
Liquidity and Capital Resources
We assess our liquidity in terms of our ability to generate cash to fund our operating, investing and financing activities. In doing so, we review and analyze our current cash on hand, the number of days our sales are outstanding, inventory turns, capital expenditure commitments and income tax payments. Our cash requirements primarily consist of the following:
|
•
|
Funding of working capital
|
|
•
|
Funding of capital expenditures
|
|
•
|
Debt service requirements
|
Our primary sources of liquidity include cash balances on hand, cash flows from operations, proceeds from debt offerings, commercial paper, and borrowing availability under our existing credit facilities. We earn a significant amount of our operating income in jurisdictions where it is deemed to be permanently reinvested. Our most prominent jurisdiction of operation is the U.S. We currently do not intend nor foresee a need to repatriate funds to the U.S., and no provision for U.S. income taxes has been made with respect to such earnings. We expect existing cash and cash equivalents available to the U.S., the cash generated by our U.S. operations, our committed credit lines as well as our expected ability to access the capital and debt markets will be sufficient to fund our U.S. operating and capital needs for at least the next twelve months and thereafter for the foreseeable future. In addition, we expect existing non-U.S. cash and cash equivalents and the cash generated by our non-U.S. operations will be sufficient to fund our non-U.S. operating and capital needs for at least the next twelve months and thereafter for the foreseeable future. Should we require more capital in the U.S. than is generated by our U.S. operations, and we determine that repatriation of non-U.S. cash is necessary, such amounts would be subject to U.S. federal income taxes.
In February 2016, we announced an increase in our quarterly share dividend from $0.29 to $0.32 per share beginning with our March 2016 payment. In February 2014, our Board of Directors authorized the repurchase of up to
$1.5 billion
of our ordinary shares under a new share repurchase program upon completion of the previous share repurchase program. The new share repurchase program began in April of 2014. During the year ended December 31, 2015, we repurchased
4.4 million
shares for $
250.1 million
. As of December 31, 2015, we had approximately $667 million remaining on the authorized plan. Since January 1, 2016, we repurchased and settled 4.9 million shares for $250.0 million. We have approximately $417 million remaining on the authorized plan. We expect our available cash flow, committed credit lines and access to the capital markets will be sufficient to fund the increased dividend and share repurchases.
On January 1, 2015 we completed the acquisition of the assets of the Cameron International Corporation's Engineered Centrifugal Compression business for $850 million, and on March 4, 2015 we completed the acquisition of FRIGOBLOCK for €
100 million
(approximately $113 million). These acquisitions were funded through a combination of cash from operations and debt.
Liquidity
The following table contains several key measures of our financial condition and liquidity at the periods ended December 31:
|
In millions
|
2015
|
2014
|
2013
|
|||||||||
|
Cash and cash equivalents
|
$
|
736.8
|
|
$
|
1,705.2
|
|
$
|
1,937.2
|
|
|||
|
Short-term borrowings and current maturities of long-term debt
|
504.2
|
|
482.7
|
|
367.7
|
|
||||||
|
Long-term debt
|
3,734.8
|
|
3,741.7
|
|
3,153.5
|
|
||||||
|
Total debt
|
4,239.0
|
|
4,224.4
|
|
3,521.2
|
|
||||||
|
Total Ingersoll-Rand plc shareholders’ equity
|
5,816.7
|
|
5,987.4
|
|
7,068.9
|
|
||||||
|
Total equity
|
5,879.2
|
|
6,045.4
|
|
7,131.3
|
|
||||||
|
Debt-to-total capital ratio
|
41.9
|
%
|
41.1
|
%
|
33.1
|
%
|
||||||
32
The primary components of our short-term and long-term obligations are as follows:
Commercial Paper Program
We use borrowings under the commercial paper program for general corporate purposes. The maximum aggregate amount of unsecured commercial paper notes available to be issued, on a private placement basis, under the commercial paper program is $
2 billion
as of
December 31, 2015
. Under the commercial paper program, we may issue notes from time to time through Ingersoll-Rand Global Holding Company Limited or Ingersoll-Rand Luxembourg Finance S.A. Each of Ingersoll-Rand plc, Ingersoll-Rand International Holding Limited, Ingersoll-Rand Lux International Holding Company S.à.r.l., Ingersoll-Rand Global Holding Company Limited and Ingersoll-Rand Company provided irrevocable and unconditional guarantees for the notes issued under the commercial paper program. We had $
143.0 million
and $
100.0 million
of commercial paper outstanding at
December 31, 2015
and
December 31, 2014
, respectively.
Debentures with Put Feature
At
December 31, 2015
and
December 31, 2014
, we had outstanding
$343.0 million
of fixed rate debentures which only require early repayment at the option of the holder. These debentures contain a put feature that the holders may exercise on each anniversary of the issuance date. If exercised, we are obligated to repay in whole or in part, at the holder’s option, the outstanding principal amount (plus accrued and unpaid interest) of the debentures held by the holder. If these options are not exercised, the final maturity dates would range between
2027
and
2028
.
Holders of these debentures had the option to exercise the put feature on $
37.2 million
of the outstanding debentures in February 2015, subject to the notice requirement. No material exercises were made. Holders of the remaining $
305.8 million
in outstanding debentures had the option to exercise the put feature, subject to the notice requirement, in November 2015. No material exercises were made.
Senior Notes due 2020, 2024, and 2044
In October 2014, we issued $
1.1 billion
principal amount of Senior Notes in three tranches through a newly-created wholly-owned subsidiary, Ingersoll-Rand Luxembourg Finance S.A. The tranches consist of $
300 million
of
2.625%
Senior Notes due in 2020, $
500 million
of
3.55%
Senior Notes due 2024, and $
300 million
of
4.65%
Senior Notes due in 2044. The notes are fully and unconditionally guaranteed by each of Ingersoll-Rand plc, Ingersoll-Rand International Holding Limited, Ingersoll-Rand Lux International Holding Company S.à.r.l., Ingersoll-Rand Global Holding Company Limited and Ingersoll-Rand Company. Interest on the notes is paid twice a year in arrears. We have the option to redeem the notes in whole or in part at any time, prior to their stated maturity date at redemption prices set forth in the indenture agreement. The notes are subject to certain customary covenants, however, none of these covenants are considered restrictive to our operations.
The proceeds from the notes were primarily used to fund the October 2014 redemption of the $
200 million
of
5.50%
Notes due 2015 and $
300 million
4.75%
Senior Notes due 2015, as well as fund the acquisition of the Engineered Centrifugal Compression business. Related to the redemption, the Company recognized $
10.2 million
of premium expense in Interest expense in 2014.
Senior Notes due 2019, 2023, and 2043
In June 2013, we issued $
1.55 billion
principal amount of Senior Notes in three tranches through our wholly-owned subsidiary, Ingersoll-Rand Global Holding Company Limited pursuant to Rule 144A of the Securities Act. The tranches consist of $
350 million
of
2.875%
Senior Notes due in 2019, $
700 million
of
4.250%
Senior Notes due in 2023, and $
500 million
of
5.750%
Senior Notes due in 2043. The notes are fully and unconditionally guaranteed by each of Ingersoll-Rand plc, Ingersoll-Rand International Holding Limited, Ingersoll-Rand Lux International Holding Company S.à.r.l. and Ingersoll-Rand Luxembourg Finance S.A. Later in 2013, the notes were modified to include Ingersoll-Rand Company. Interest on the notes is paid twice a year in arrears. We have the option to redeem the notes in whole or in part at any time, prior to their stated maturity date at redemption prices set forth in the indenture agreement. The notes are subject to certain customary covenants, however, none of these covenants are considered restrictive to our operations.
The proceeds from these notes were primarily used to fund the July 2013 redemption of $
600 million
of
6.0%
Senior Notes due 2013 and $
655 million
of
9.5%
Senior Notes due 2014 and to fund expenses related to the spin-off of the commercial and residential security businesses. The July 2013 redemption resulted in $
45.6 million
of premium expense, which was recorded in 2013 in Interest expense.
Other Credit Facilities
On March 20, 2014, we entered into an unsecured 5-year, $
1.0 billion
revolving credit facility through our wholly-owned subsidiary, Ingersoll-Rand Global Holding Company Limited. The credit facility matures in March 2019 and replaced the prior credit facility of $1 billion which was due to expire in 2015. We also have a 5-year, $
1.0 billion
revolving credit facility through Ingersoll-Rand Global Holding Company Limited that matures in March 2017. During the fourth quarter of 2014, both credit agreements were amended to include Ingersoll-Rand Lux International Holding Company S.à.r.l. as an additional borrower.
33
Ingersoll-Rand plc, Ingersoll-Rand International Holding Limited, Ingersoll-Rand Lux International Holding Company S.à.r.l., Ingersoll-Rand Global Holding Company Limited, Ingersoll-Rand Company and Ingersoll-Rand Luxembourg Finance S.A. have each provided irrevocable and unconditional guarantees for these credit facilities. The total committed revolving credit facilities of $
2.0 billion
are unused and provide support for our commercial paper program, as well as other general corporate purposes.We also have various non-U.S. lines of credit that provide aggregate borrowing capacity of $
948.8 million
, of which $
698.7 million
was unused at
December 31, 2015
. These lines provide support for bank guarantees, letters of credit and other general corporate purposes.
For additional information regarding the terms of our short-term and long-term obligations and their related guarantees, see Notes 7 and 20 to the Consolidated Financial Statements.
Pension Plans
Our investment objective in managing defined benefit plan assets is to ensure that all present and future benefit obligations are met as they come due. We seek to achieve this goal while trying to mitigate volatility in plan funded status, contribution and expense by better matching the characteristics of the plan assets to that of the plan liabilities. We use a dynamic approach to asset allocation whereby a plan's allocation to fixed income assets increases as the plan's funded status improves. We monitor plan funded status and asset allocation regularly in addition to investment manager performance.
We monitor the impact of market conditions on our defined benefit plans on a regular basis. None of our defined benefit pension plans have experienced a significant impact on their liquidity due to the volatility in the markets. For further details on pension plan activity, see Note 10 to the Consolidated Financial Statements.
Cash Flows
The following table reflects the major categories of cash flows for the years ended December 31, respectively. For additional details, please see the Consolidated Statements of Cash Flows in the Consolidated Financial Statements.
|
In millions
|
2015
|
2014
|
2013
|
|||||||||
|
Operating cash flow provided by continuing operations
|
$
|
886.2
|
|
$
|
991.7
|
|
$
|
798.8
|
|
|||
|
Investing cash flow used in continuing operations
|
(1,192.9
|
)
|
(197.0
|
)
|
(213.2
|
)
|
||||||
|
Financing cash flow provided by (used in) continuing operations
|
(490.3
|
)
|
(859.5
|
)
|
354.1
|
|
||||||
Operating Activities
Net cash provided by operating activities from continuing operations was $
886.2 million
for the year ended
December 31, 2015
compared with $
991.7 million
in
2014
. The change in operating activities is primarily related to the net cash outflow for the IRS settlement previously mentioned of approximately $
364 million
, along with the change in net working capital.
Net cash provided by operating activities from continuing operations was $
991.7 million
for the year ended
December 31, 2014
compared with $
798.8 million
in
2013
. Operating cash flows for 2014 reflect improved earnings from continuing operations partially offset by rising working capital in 2014.
Investing Activities
Net cash used in investing activities from continuing operations was $
1,192.9 million
for the year ended
December 31, 2015
compared with $
197.0 million
in
2014
. The change in investing activities is primarily attributable to the previously mentioned acquisition of the Engineered Centrifugal Compression business in January 2015 for approximately $850 million and the acquisition of FRIGOBLOCK in March 2015 for approximately €100 million (approximately $113 million).
Net cash used in investing activities from continuing operations was $
197.0 million
for the year ended
December 31, 2014
compared with $
213.2 million
in
2013
. The change in investing activities is primarily attributable to $30.3 million cash dividend received from equity investments during the year ended December 31, 2014.
Financing Activities
Net cash used in financing activities from continuing operations during the year ended
December 31, 2015
was $
490.3 million
, compared with $
859.5 million
in
2014
. The change in financing activities is primarily driven by the Company repurchasing 23.0 million shares for approximately $1.4 billion during the year ended December 31, 2014 as compared to the Company repurchasing 4.4 million shares for approximately $250.1 million during the year ended
December 31, 2015
.
Net cash used in financing activities from continuing operations during the year ended
December 31, 2014
was $
859.5 million
, compared with net cash provided by financing activities from continuing operations of $
354.1 million
in
2013
. The change in financing activities is primarily related to a transfer of $1,274.2 million from Allegion in connection with the spin-off in 2013.
34
Announced Sale of Hussmann Minority Interest
On December 21, 2015, we announced we will sell our remaining equity interest in Hussmann Parent, Inc. (“Hussmann”) as part of a transaction in which Panasonic Corporation will acquire 100 percent of Hussmann's shares. We expect to receive net proceeds of approximately $
425 million
. The transaction is anticipated to close in the first half of 2016 subject to customary approvals and closing conditions and has no impact on the results of our operations in 2015.
Capital Resources
Based on historical performance and current expectations, we believe our cash and cash equivalents balance, the cash generated from our operations, our committed credit lines and our expected ability to access capital markets will satisfy our working capital needs, capital expenditures, dividends, share repurchase programs, upcoming debt maturities, and other liquidity requirements associated with our operations for the foreseeable future.
Capital expenditures were $
249.6 million
, $
233.5 million
and $
242.2 million
for
2015
,
2014
and
2013
, respectively. Our investments continue to improve manufacturing productivity, reduce costs and provide environmental enhancements and advanced technologies for existing facilities. The capital expenditure program for
2016
is estimated to be approximately $244 million, including amounts approved in prior periods. Many of these projects are subject to review and cancellation at our option without incurring substantial charges.
For financial market risk impacting the Company, see Item 7A. "Quantitative and Qualitative Disclosure About Market Risk."
Capitalization
In addition to cash on hand and operating cash flow, we maintain significant credit availability under our Commercial Paper Program. Our ability to borrow at a cost-effective rate under the Commercial Paper Program is contingent upon maintaining an investment-grade credit rating. As of
December 31, 2015
, our credit ratings were as follows:
|
|
Short-term
|
Long-term
|
||
|
Moody’s
|
P-2
|
Baa2
|
||
|
Standard and Poor’s
|
A-2
|
BBB
|
||
The credit ratings set forth above are not a recommendation to buy, sell or hold securities and may be subject to revision or withdrawal by the assigning rating organization. Each rating should be evaluated independently of any other rating.
Our public debt does not contain financial covenants and our revolving credit lines have a debt-to-total capital covenant of 65%. As of
December 31, 2015
, our debt-to-total capital ratio was significantly beneath this limit.
35
Contractual Obligations
The following table summarizes our contractual cash obligations by required payment periods:
|
In millions
|
Less than
1 year
|
1 - 3
years
|
3 - 5
years
|
More than
5 years
|
Total
|
|||||||||||||||
|
Short-term debt
|
$
|
153.4
|
|
|
$
|
—
|
|
$
|
—
|
|
$
|
—
|
|
$
|
153.4
|
|
||||
|
Long-term debt
|
350.8
|
|
*
|
765.3
|
|
664.7
|
|
2,304.8
|
|
$
|
4,085.6
|
|
||||||||
|
Interest payments on long-term debt
|
209.3
|
|
**
|
393.9
|
|
283.0
|
|
1,325.4
|
|
2,211.6
|
|
|||||||||
|
Purchase obligations
|
799.9
|
|
|
18.1
|
|
—
|
|
—
|
|
818.0
|
|
|||||||||
|
Operating leases
|
118.3
|
|
|
159.6
|
|
84.8
|
|
42.8
|
|
405.5
|
|
|||||||||
|
Total contractual cash obligations
|
$
|
1,631.7
|
|
|
$
|
1,336.9
|
|
$
|
1,032.5
|
|
$
|
3,673.0
|
|
$
|
7,674.1
|
|
||||
* Includes $343.0 million of debt redeemable at the option of the holder. The scheduled maturities of these bonds range between 2027 and 2028. See Note 7 to the Consolidated Financial Statements for additional information.
** Includes nominal amount related to interest of short-term debt.
Future expected obligations under our pension and postretirement benefit plans, income taxes, environmental, asbestos-related, and product liability matters have not been included in the contractual cash obligations table above.
Pensions
At
December 31, 2015
, we had net obligations of $
751.8 million
, which consist of noncurrent pension assets of $
2.7 million
and current and non-current pension benefit liabilities of $
754.5 million
. It is our objective to contribute to the pension plans to ensure adequate funds are available in the plans to make benefit payments to plan participants and beneficiaries when required. We currently project that we will contribute approximately $
59.2 million
to our plans worldwide in
2016
. The timing and amounts of future contributions are dependent upon the funding status of the plan, which is expected to vary as a result of changes in interest rates, returns on underlying assets, and other factors. Therefore, pension contributions have been excluded from the preceding table. See Note 10 to the Consolidated Financial Statements for additional information.
Postretirement Benefits Other than Pensions
At
December 31, 2015
, we had postretirement benefit obligations of $
624.1 million
. We fund postretirement benefit costs principally on a pay-as-you-go basis as medical costs are incurred by covered retiree populations. Benefit payments, which are net of expected plan participant contributions and Medicare Part D subsidy, are expected to be approximately $
56.3 million
in
2016
. Because benefit payments are not required to be funded in advance, and the timing and amounts of future payments for are dependent on the cost of benefits for retirees covered by the plan, they have been excluded from the preceding table. See Note 10 to the Consolidated Financial Statements for additional information.
Income Taxes
At
December 31, 2015
, we have total unrecognized tax benefits for uncertain tax positions of $
174.9 million
and $
55.5 million
of related accrued interest and penalties, net of tax. The liability has been excluded from the preceding table as we are unable to reasonably estimate the amount and period in which these liabilities might be paid. See Note 15 to the Consolidated Financial Statements for additional information regarding matters relating to income taxes, including unrecognized tax benefits.
Contingent Liabilities
We are involved in various litigations, claims and administrative proceedings, including those related to environmental, asbestos-related, and product liability matters. We believe that these liabilities are subject to the uncertainties inherent in estimating future costs for contingent liabilities, and will likely be resolved over an extended period of time. Because the timing and amounts of potential future cash flows are uncertain, they have been excluded from the preceding table. See Note 18 to the Consolidated Financial Statements for additional information.
See Note 7 and Note 18 to the Consolidated Financial Statements for additional information on matters affecting our liquidity.
Critical Accounting Policies
Management’s Discussion and Analysis of Financial Condition and Results of Operations are based upon our Consolidated Financial Statements, which have been prepared in accordance with accounting principles generally accepted in the United States (GAAP). The preparation of financial statements in conformity with those accounting principles requires management to use judgment in making estimates and assumptions based on the relevant information available at the end of each period. These estimates and assumptions have a significant effect on reported amounts of assets and liabilities, revenue and expenses as well as the disclosure of contingent assets and liabilities because they result primarily from the need to make estimates and assumptions on matters that are inherently uncertain. Actual results may differ from estimates. If updated information or actual amounts are different from previous estimates, the revisions are included in our results for the period in which they become known.
36
The following is a summary of certain accounting estimates and assumptions made by management that we consider critical.
|
•
|
Allowance for doubtful accounts – We maintain an allowance for doubtful accounts receivable which represents our best estimate of probable loss inherent in our accounts receivable portfolio. This estimate is based upon our two step policy that results in the total recorded allowance for doubtful accounts. The first step is to record a portfolio reserve based on the aging of the outstanding accounts receivable portfolio and our historical experience with our end markets, customer base and products. The second step is to create a specific reserve for significant accounts as to which the customer's ability to satisfy their financial obligation to us is in doubt due to circumstances such as bankruptcy, deteriorating operating results or financial position. In these circumstances, management uses its judgment to record an allowance based on the best estimate of probable loss, factoring in such considerations as the market value of collateral, if applicable. Actual results could differ from those estimates. These estimates and assumptions are reviewed periodically, and the effects of changes, if any, are reflected in the statement of operations in the period that they are determined.
|
|
•
|
Goodwill and indefinite-lived intangible assets – We have significant goodwill and indefinite-lived intangible assets on our balance sheet related to acquisitions. Our goodwill and other indefinite-lived intangible assets are tested and reviewed annually during the fourth quarter for impairment or when there is a significant change in events or circumstances that indicate that the fair value of an asset is more likely than not less than the carrying amount of the asset.
|
Recoverability of goodwill is measured at the reporting unit level and begins with a qualitative assessment to determine if it is more likely than not that the fair value of each reporting unit is less than its carrying amount as a basis for determining whether it is necessary to perform the two-step goodwill impairment test included in U.S. GAAP. For those reporting units where it is required, the first step compares the carrying amount of the reporting unit to its estimated fair value. If the estimated fair value of a reporting unit exceeds its carrying amount, goodwill of the reporting unit is not impaired and the second step of the impairment test is not necessary. To the extent that the carrying value of the reporting unit exceeds its estimated fair value, a second step is performed, wherein the reporting unit's carrying value of goodwill is compared to the implied fair value of goodwill. To the extent that the carrying value exceeds the implied fair value, impairment exists and must be recognized.
As quoted market prices are not available for our reporting units, the calculation of their estimated fair value in step one is determined using three valuation techniques: a discounted cash flow model (an income approach), a market-adjusted multiple of earnings and revenues (a market approach), and a similar transactions method (also a market approach). The discounted cash flow approach relies on our estimates of future cash flows and explicitly addresses factors such as timing, growth and margins, with due consideration given to forecasting risk. The earnings and revenue multiple approach reflects the market's expectations for future growth and risk, with adjustments to account for differences between the guideline publicly traded companies and the subject reporting units. The similar transactions method considers prices paid in transactions that have recently occurred in our industry or in related industries. These methods are weighted 50%, 40% and 10%, respectively.
In step 2, the implied fair value of goodwill is determined in the same manner as the amount of goodwill recognized in a business combination. The estimated fair value of the reporting unit is allocated to all of the assets and liabilities of the reporting unit (including any unrecognized intangible assets) as if the reporting unit had been acquired in a business combination and the fair value of the reporting unit, as determined in the first step of the goodwill impairment test, was the price paid to acquire that reporting unit.
Recoverability of other intangible assets with indefinite useful lives is first assessed using a qualitative assessment to determine whether it is more likely than not that an indefinite-lived intangible asset is impaired. This assessment is used as a basis for determining whether it is necessary to calculate the fair value of an indefinite-lived intangible asset. For those indefinite-lived assets where it is required, a fair value is determined on a relief from royalty methodology (income approach) which is based on the implied royalty paid, at an appropriate discount rate, to license the use of an asset rather than owning the asset. The present value of the after-tax cost savings (i.e. royalty relief) indicates the estimated fair value of the asset. Any excess of the carrying value over the estimated fair value is recognized as an impairment loss equal to that excess.
The determination of the estimated fair value and the implied fair value of goodwill and other indefinite-lived intangible assets requires us to make assumptions about estimated cash flows, including profit margins, long-term forecasts, discount rates and terminal growth rates. We developed these assumptions based on the market and geographic risks unique to each reporting unit.
37
For our annual impairment testing performed during the fourth quarter of 2015, we calculated the fair value for each of the reporting units and indefinite-lived intangibles. Based on the results of these calculations, we determined that the fair value of the reporting units and indefinite-lived intangible assets exceeded their respective carrying values. The estimates of fair value are based on the best information available as of the date of the assessment, which primarily incorporates management assumptions about expected future cash flows.
Goodwill -
Under the income approach, we assumed a forecasted cash flow period of five years with discount rates ranging from 11.0% to 14.0% and terminal growth rates ranging from 3.0% to 3.5%. Under the guideline company method, we used an adjusted multiple ranging from 7.0 to 11.0 of projected earnings before interest, taxes, depreciation and amortization (EBITDA) based on the market information of comparable companies. Additionally, we compared the estimated aggregate fair value of our reporting units to our overall market capitalization.
For all reporting units, the excess of the estimated fair value over carrying value (expressed as a percentage of carrying value) was a minimum of 37%. A significant increase in the discount rate, decrease in the long-term growth rate, or substantial reductions in our end markets and volume assumptions could have a negative impact on the estimated fair value of these reporting units.
Other Indefinite-lived intangible assets
- In testing our other indefinite-lived intangible assets for impairment, we assumed forecasted revenues for a period of five years with discount rates ranging from 10.8% to 12.5%, terminal growth rate of 3.0%, and royalty rates ranging from 1.0% to 4.5%. For all tradenames, the excess of the estimated fair value over carrying value (expressed as a percentage of carrying value) was a minimum of 24%, with the exception of one tradename with a carrying value of approximately $28 million as December 31, 2015, which had an excess of the estimated fair value over carrying value (expressed as a percentage of carrying value) of approximately 7%.
A significant increase in the discount rate, decrease in the long-term growth rate, decrease in the royalty rate or substantial reductions in our end markets and volume assumptions could have a negative impact on the estimated fair values of any of our tradenames.
|
•
|
Long-lived assets and finite-lived intangibles – Long-lived assets and finite-lived intangibles are reviewed for impairment whenever events or changes in business circumstances indicate that the carrying amount of an asset may not be fully recoverable. Assets are grouped with other assets and liabilities at the lowest level for which identifiable cash flows can be generated. Impairment in the carrying value of an asset would be recognized whenever anticipated future undiscounted cash flows from an asset are less than its carrying value. The impairment is measured as the amount by which the carrying value exceeds the fair value of the asset as determined by an estimate of discounted cash flows. We believe that our use of estimates and assumptions are reasonable and comply with generally accepted accounting principles. Changes in business conditions could potentially require future adjustments to these valuations.
|
|
•
|
Loss contingencies – Liabilities are recorded for various contingencies arising in the normal course of business, including litigation and administrative proceedings, environmental and asbestos matters and product liability, product warranty, worker’s compensation and other claims. We have recorded reserves in the financial statements related to these matters, which are developed using input derived from actuarial estimates and historical and anticipated experience data depending on the nature of the reserve, and in certain instances with consultation of legal counsel, internal and external consultants and engineers. Subject to the uncertainties inherent in estimating future costs for these types of liabilities, we believe our estimated reserves are reasonable and do not believe the final determination of the liabilities with respect to these matters would have a material effect on our financial condition, results of operations, liquidity or cash flows for any year.
|
|
•
|
Asbestos matters – Certain of our wholly-owned subsidiaries are named as defendants in asbestos-related lawsuits in state and federal courts. We record a liability for our actual and anticipated future claims as well as an asset for anticipated insurance settlements. Asbestos related defense costs are excluded from the asbestos claims liability and are recorded separately as services are incurred. None of our existing or previously-owned businesses were a producer or manufacturer of asbestos. We record certain income and expenses associated with our asbestos liabilities and corresponding insurance recoveries within discontinued operations, net of tax, as they relate to previously divested businesses, except for amounts associated with Trane U.S. Inc.’s asbestos liabilities and corresponding insurance recoveries which are recorded within continuing operations. Refer to Note 18 to the Consolidated Financial Statements for further details of asbestos-related matters.
|
|
•
|
Revenue recognition – Revenue is recognized and earned when all of the following criteria are satisfied: (a) persuasive evidence of a sales arrangement exists; (b) the price is fixed or determinable; (c) collectability is reasonably assured; and (d) delivery has occurred or service has been rendered. Delivery generally occurs when the title and the risks and rewards of ownership have substantially transferred to the customer. Both the persuasive evidence of a sales arrangement and fixed or determinable price criteria are deemed to be satisfied upon receipt of an executed and legally binding sales agreement or contract that clearly defines the terms and conditions of the transaction including the respective obligations of the parties. If
|
38
the defined terms and conditions allow variability in all or a component of the price, revenue is not recognized until such time that the price becomes fixed or determinable. At the point of sale, we validate that existence of an enforceable claim that requires payment within a reasonable amount of time and assess the collectability of that claim. If collectability is not deemed to be reasonably assured, then revenue recognition is deferred until such time that collectability becomes probable or cash is received. Delivery is not considered to have occurred until the customer has taken title and assumed the risks and rewards of ownership. Service and installation revenue are recognized when earned. In some instances, customer acceptance provisions are included in sales arrangements to give the buyer the ability to ensure the delivered product or service meets the criteria established in the order. In these instances, revenue recognition is deferred until the acceptance terms specified in the arrangement are fulfilled through customer acceptance or a demonstration that established criteria have been satisfied. If uncertainty exists about customer acceptance, revenue is not recognized until acceptance has occurred.
We offer various sales incentive programs to our customers, dealers, and distributors. Sales incentive programs do not preclude revenue recognition, but do require an accrual for the Company's best estimate of expected activity. Examples of the sales incentives that are accrued for as a contra receivable and sales deduction at the point of sale include, but are not limited to, discounts (i.e. net 30 type), coupons, and rebates where the customer does not have to provide any additional requirements to receive the discount. Sales returns and customer disputes involving a question of quantity or price are also accounted for as a reduction in revenue and a contra receivable. At
December 31, 2015
and 2014, we had a customer claim accrual (contra receivable) of
$4.0 million
and
$4.7 million
, respectively. All other incentives or incentive programs where the customer is required to reach a certain sales level, remain a customer for a certain period of time, provide a rebate form or is subject to additional requirements are accounted for as a reduction of revenue and establishment of a liability. At
December 31, 2015
and 2014, we had a sales incentive accrual of
$83.2 million
and
$73.4 million
, respectively. Each of these accruals represents the best estimate we expect to pay related to previously sold units. These estimates are reviewed regularly for accuracy. If updated information or actual amounts are different from previous estimates, the revisions are included in our results for the period in which they become known. Historically, the aggregate differences, if any, between our estimates and actual amounts in any year have not had a material impact on the Consolidated Financial Statements.
We enter into maintenance and extended warranty contracts with customers. Revenue related to these services is recognized on a straight-line basis over the life of the contract, unless sufficient historical evidence indicates that the cost of providing these services is incurred on an other than straight-line basis. In these circumstances, revenue is recognized over the contract period in proportion to the costs expected to be incurred in performing the service.
We, primarily through our Climate segment, provides equipment (e.g. HVAC, controls), integrated solutions, and installation designed to customer specifications through construction-type contracts. The term of these types of contracts is typically less than one year, but can be as long as three years. Revenues related to these contracts are recognized using the percentage-of-completion method in accordance with GAAP. This measure of progress toward completion, utilized to recognize sales and profits, is based on the proportion of actual cost incurred to date as compared to the total estimate of contract costs at completion. The timing of revenue recognition often differs from the invoicing schedule to the customer, with revenue recognition in advance of customer invoicing recorded to unbilled accounts receivable and invoicing in advance of revenue recognition recorded to deferred revenue. At
December 31, 2015
, all recorded receivables (billed and unbilled) are due within one year. We re-evaluates our contract estimates periodically and reflects changes in estimates in the current period using the cumulative catch-up method. These periodic reviews have not historically resulted in significant adjustments. If estimated contract costs are in excess of contract revenues, then the excess costs are accrued.
We enter into sales arrangements that contain multiple elements, such as equipment, installation and service revenue. For multiple element arrangements, each element is evaluated to determine the separate units of accounting. The total arrangement consideration is then allocated to the separate units of accounting based on their relative selling price at the inception of the arrangement. The relative selling price is determined using vendor specific objective evidence (VSOE) of selling price, if it exists; otherwise, third-party evidence (TPE) of selling price is used. If neither VSOE nor TPE of selling price exists for a deliverable, a best estimate of the selling price is developed for that deliverable. We primarily utilizes VSOE to determine its relative selling price. We recognize revenue for delivered elements when the delivered item has stand-alone value to the customer, the basic revenue recognition criteria have been met, and only customary refund or return rights related to the delivered elements exist.
|
•
|
Income taxes – Deferred tax assets and liabilities are determined based on temporary differences between financial reporting and tax bases of assets and liabilities, applying enacted tax rates expected to be in effect for the year in which the differences are expected to reverse. We recognize future tax benefits, such as net operating losses and non-U.S. tax credits, to the extent that realizing these benefits is considered in our judgment to be more likely than not. We regularly review the recoverability of our deferred tax assets considering our historic profitability, projected future taxable income, timing of the reversals of existing temporary differences and the feasibility of our tax planning strategies. Where appropriate, we record a valuation allowance with respect to a future tax benefit.
|
39
The provision for income taxes involves a significant amount of management judgment regarding interpretation of relevant facts and laws in the jurisdictions in which we operate. Future changes in applicable laws, projected levels of taxable income, and tax planning could change the effective tax rate and tax balances recorded by us. In addition, tax authorities periodically review income tax returns filed by us and can raise issues regarding our filing positions, timing and amount of income or deductions, and the allocation of income among the jurisdictions in which we operate. A significant period of time may elapse between the filing of an income tax return and the ultimate resolution of an issue raised by a revenue authority with respect to that return. We believe that we have adequately provided for any reasonably foreseeable resolution of these matters. We will adjust our estimate if significant events so dictate. To the extent that the ultimate results differ from our original or adjusted estimates, the effect will be recorded in the provision for income taxes in the period that the matter is finally resolved.
|
•
|
Employee benefit plans – We provide a range of benefits to eligible employees and retirees, including pensions, postretirement and postemployment benefits. Determining the cost associated with such benefits is dependent on various actuarial assumptions including discount rates, expected return on plan assets, compensation increases, employee mortality, turnover rates and healthcare cost trend rates. Actuarial valuations are performed to determine expense in accordance with GAAP. Actual results may differ from the actuarial assumptions and are generally accumulated and amortized into earnings over future periods. We review our actuarial assumptions at each measurement date and make modifications to the assumptions based on current rates and trends, if appropriate. The discount rate, the rate of compensation increase and the expected long-term rates of return on plan assets are determined as of each measurement date.
|
At December 31, 2015, we refined the methodology used to calculate service and interest costs for both pension and other postretirement benefits. This refinement will result in the recognition of different costs in future periods as compared to the historical approach. Historically, we estimated service and interest costs utilizing a weighted-average discount rate calculated from spot rates selected along hypothetical yield curves based on corporate bonds rated AA quality. Beginning with the measurement of the December 31, 2015 benefit obligations, we refined the measurement approach to utilize multiple specific spot rates, along the same hypothetical yield curve, that correlate with the timing of the relevant projected cash flows. Our intent with this refinement is to provide a more precise measurement of service and interest costs. The change did not have an impact on the measurement of the December 31, 2015 benefit obligations. However, we estimate the impact on 2016 net periodic pension and postretirement benefit costs to be a reduction of $22.0 million and $5.8 million, respectively. We concluded that this refinement is a change in accounting estimate.
The rate of compensation increase is dependent on expected future compensation levels. The expected long-term rate of return on plan assets reflects the average rate of returns expected on the funds invested or to be invested to provide for the benefits included in the projected benefit obligation. The expected long-term rate of return on plan assets is based on what is achievable given the plan’s investment policy, the types of assets held and the target asset allocation. The expected long-term rate of return is determined as of each measurement date. We believe that the assumptions utilized in recording our obligations under our plans are reasonable based on input from our actuaries, outside investment advisors and information as to assumptions used by plan sponsors.
Changes in any of the assumptions can have an impact on the net periodic pension cost or postretirement benefit cost. Estimated sensitivities to the expected 2016 net periodic pension cost of a 0.25% rate decline in the two basic assumptions are as follows: the decline in the discount rate would increase expense by approximately $7.9 million and the decline in the estimated return on assets would increase expense by approximately $6.7 million. A 0.25% rate decrease in the discount rate for postretirement benefits would decrease expected 2016 net periodic postretirement benefit cost by $1.0 million and a 1.0% increase in the healthcare cost trend rate would increase the service and interest cost by approximately $0.8 million.
Recent Accounting Pronouncements
See Note 2 to the Consolidated Financial Statements for a discussion of recent accounting pronouncements.
Item 7A.
QUANTITATIVE AND QUALITATIVE DISCLOSURE ABOUT MARKET RISK
We are exposed to fluctuations in currency exchange rates, interest rates and commodity prices which could impact our results of operations and financial condition.
Foreign Currency Exposures
We have operations throughout the world that manufacture and sell products in various international markets. As a result, we are exposed to movements in exchange rates of various currencies against the U.S. dollar as well as against other currencies throughout the world.
Many of our non-U.S. operations have a functional currency other than the U.S. dollar, and their results are translated into U.S. dollars for reporting purposes. Therefore, our reported results will be higher or lower depending on the weakening or strengthening
40
of the U.S. dollar against the respective foreign currency. Our largest concentration of revenues from non-U.S. operations as of December 31, 2015 are in Euros and Chinese Yuan. A hypothetical 10% unfavorable change in the average exchange rate used to translate Net revenues as of December 31, 2015 from either Euros or Chinese Yuan-based operations into U.S. dollars would not have a material impact on our financial statements.
We use derivative instruments to hedge those material exposures that cannot be naturally offset. The instruments utilized are viewed as risk management tools, involve little complexity and are not used for trading or speculative purposes. To minimize the risk of counter party non-performance, derivative instrument agreements are made only through major financial institutions with significant experience in such derivative instruments.
We evaluate our exposure to changes in currency exchange rates on our foreign currency derivatives using a sensitivity analysis. The sensitivity analysis is a measurement of the potential loss in fair value based on a percentage change in exchange rates. Based on the firmly committed currency derivative instruments in place at
December 31, 2015
, a hypothetical change in fair value of those derivative instruments assuming a 10% adverse change in exchange rates would result in an unrealized loss of approximately $
64.5 million
, as compared with $
44.2 million
at
December 31, 2014
. These amounts, when realized, would be offset by changes in the fair value of the underlying transactions.
Commodity Price Exposures
We are exposed to volatility in the prices of commodities used in some of our products and we use fixed price contracts to manage this exposure. We do not have committed commodity derivative instruments in place at
December 31, 2015
.
Interest Rate Exposure
Our debt portfolio mainly consists of fixed-rate instruments, and therefore any fluctuation in market interest rates is not expected to have a material effect on our results of operations.
41
Item 8.
FINANCIAL STATEMENTS AND SUPPLEMENTARY DATA
|
(a)
|
The following Consolidated Financial Statements and Financial Statement Schedules and the report thereon of PricewaterhouseCoopers LLP dated
February 12, 2016
, are presented following Item 15 of this Annual Report on Form 10-K.
|
Consolidated Financial Statements:
Report of independent registered public accounting firm
Consolidated Statements of comprehensive income for the years ended
December 31, 2015
,
2014
and
2013
Consolidated balance sheets at
December 31, 2015
and
2014
For the years ended
December 31, 2015
,
2014
and
2013
:
Consolidated statements of equity
Consolidated statements of cash flows
Notes to Consolidated Financial Statements
Financial Statement Schedule:
Schedule II – Valuation and Qualifying Accounts for the years ended
December 31, 2015
,
2014
and
2013
:
|
(b)
|
The unaudited selected quarterly financial data for the two years ended
December 31,
is as follows:
|
|
2015
|
||||||||||||||||
|
In millions, except per share amounts
|
First
Quarter
|
Second
Quarter
|
Third
Quarter
|
Fourth
Quarter
|
||||||||||||
|
Net revenues
|
$
|
2,887.8
|
|
$
|
3,600.2
|
|
$
|
3,486.9
|
|
$
|
3,325.8
|
|
||||
|
Cost of goods sold
|
(2,086.7
|
)
|
(2,494.5
|
)
|
(2,379.4
|
)
|
(2,341.0
|
)
|
||||||||
|
Operating income
|
171.1
|
|
452.2
|
|
475.4
|
|
359.3
|
|
||||||||
|
Net earnings
|
55.4
|
|
82.9
|
|
306.0
|
|
238.5
|
|
||||||||
|
Net earnings attributable to Ingersoll-Rand plc
|
51.3
|
|
78.9
|
|
300.9
|
|
233.5
|
|
||||||||
|
Earnings per share attributable to Ingersoll-Rand plc ordinary shareholders:
|
||||||||||||||||
|
Basic
|
$
|
0.19
|
|
$
|
0.29
|
|
$
|
1.13
|
|
$
|
0.90
|
|
||||
|
Diluted
|
$
|
0.19
|
|
$
|
0.29
|
|
$
|
1.12
|
|
$
|
0.88
|
|
||||
|
2014
|
||||||||||||||||
|
First
Quarter
|
Second
Quarter
|
Third
Quarter
|
Fourth
Quarter
|
|||||||||||||
|
Net revenues
|
$
|
2,722.9
|
|
$
|
3,542.9
|
|
$
|
3,385.0
|
|
$
|
3,240.5
|
|
||||
|
Cost of goods sold
|
(1,954.8
|
)
|
(2,439.9
|
)
|
(2,327.0
|
)
|
(2,261.1
|
)
|
||||||||
|
Operating income
|
155.0
|
|
463.3
|
|
440.0
|
|
346.3
|
|
||||||||
|
Net earnings
|
83.6
|
|
310.6
|
|
296.2
|
|
260.2
|
|
||||||||
|
Net earnings attributable to Ingersoll-Rand plc
|
79.0
|
|
306.0
|
|
291.3
|
|
255.5
|
|
||||||||
|
Earnings per share attributable to Ingersoll-Rand plc ordinary shareholders:
|
||||||||||||||||
|
Basic
|
$
|
0.28
|
|
$
|
1.13
|
|
$
|
1.09
|
|
$
|
0.96
|
|
||||
|
Diluted
|
$
|
0.28
|
|
$
|
1.12
|
|
$
|
1.07
|
|
$
|
0.95
|
|
||||
42
Item 9.
CHANGES IN AND DISAGREEMENTS WITH ACCOUNTANTS ON ACCOUNTING AND FINANCIAL
DISCLOSURE
None.
Item 9A.
CONTROLS AND PROCEDURES
|
(a)
|
Evaluation of Disclosure Controls and Procedures
|
The Company's management, including its Chief Executive Officer and Chief Financial Officer, have conducted an evaluation of the effectiveness of the Company's disclosure controls and procedures (as such term is defined in Rules 13a-15(e) and 15d-15(e) under the Securities Exchange Act of 1934, as amended (the Exchange Act)), as of the end of the period covered by this Annual Report on Form 10-K. Based on that evaluation, the Chief Executive Officer and Chief Financial Officer concluded as of
December 31, 2015
, that the Company's disclosure controls and procedures were effective in ensuring that information required to be disclosed by the Company in reports that it files or submits under the Exchange Act has been recorded, processed, summarized and reported, within the time periods specified in the Commission's rules and forms, and that such information has been accumulated and communicated to the Company's management including its Chief Executive Officer and Chief Financial Officer, as appropriate, to allow timely decisions regarding required disclosure.
|
(b)
|
Management's Report on Internal Control Over Financial Reporting
|
The Company's management is responsible for establishing and maintaining adequate internal control over financial reporting as such term is defined under Exchange Act Rules 13a-15(f) and 15d-15(f). Internal control over financial reporting is a process designed by, or under the supervision of, the Chief Executive Officer and Chief Financial Officer and effected by the Company's Board of Directors to provide reasonable assurance regarding the reliability of financial reporting and the preparation of financial statements for external purposes in accordance with generally accepted accounting principles.
Because of its inherent limitations, internal control over financial reporting may not prevent or detect misstatements. Also, projections of any evaluation of effectiveness to future periods are subject to the risk that controls may become inadequate because of changes in conditions, or that the degree of compliance with the policies and procedures may deteriorate.
Management has assessed the effectiveness of internal control over financial reporting as of
December 31, 2015
. In making its assessment, management has utilized the criteria set forth by the Committee of Sponsoring Organizations (COSO) of the Treadway Commission in Internal Control - Integrated Framework (2013). Management concluded that based on its assessment, the Company's internal control over financial reporting was effective as of
December 31, 2015
.
The effectiveness of the Company's internal control over financial reporting as of
December 31, 2015
has been audited by PricewaterhouseCoopers LLP, an independent registered public accounting firm, as stated in their report which appears herein.
|
(c)
|
Changes in Internal Control Over Financial Reporting
|
There were no changes in internal control over financial reporting (as defined by Rules 13a-15(f) and 15d-15(f) under the Exchange Act) that occurred during the quarter ended
December 31, 2015
that have materially affected, or are reasonably likely to materially affect, the Company's internal control over financial reporting.
Item 9B.
OTHER INFORMATION
None.
43
Item 10.
DIRECTORS, EXECUTIVE OFFICERS AND CORPORATE GOVERNANCE
The information regarding our executive officers is included in Part I under the caption “Executive Officers of Registrant.”
The other information required by this item is incorporated herein by reference to the information contained under the headings “Item 1. Election of Directors”, “Section 16(a) Beneficial Ownership Reporting Compliance” and “Corporate Governance” in our definitive proxy statement for the
2016
annual general meeting of shareholders (“
2016
Proxy Statement”).
Item 11.
EXECUTIVE COMPENSATION
The other information required by this item is incorporated herein by reference to the information contained under the headings “Compensation Discussion and Analysis”, “Executive Compensation” and “Compensation Committee Report” in our
2016
Proxy Statement.
Item 12.
SECURITY OWNERSHIP OF CERTAIN BENEFICIAL OWNERS AND MANAGEMENT AND RELATED
STOCKHOLDER MATTERS
The other information required by this item is incorporated herein by reference to the information contained under the headings “Security Ownership of Certain Beneficial Owners and Management” and “Equity Compensation Plan Information” of our
2016
Proxy Statement.
Item 13.
CERTAIN RELATIONSHIPS AND RELATED TRANSACTIONS, AND DIRECTOR INDEPENDENCE
The other information required by this item is incorporated herein by reference to the information contained under the headings “Corporate Governance” and “Certain Relationships and Related Person Transactions” of our
2016
Proxy Statement.
Item 14.
PRINCIPAL ACCOUNTANT FEES AND SERVICES
The information required by this item is incorporated herein by reference to the information contained under the caption “Fees of the Independent Auditors” in our
2016
Proxy Statement.
44
Item 15.
EXHIBITS AND FINANCIAL STATEMENT SCHEDULES
|
(a) 1. and 2.
|
Financial statements and financial statement schedule
See Item 8.
|
|
3.
|
Exhibits
|
|
The exhibits listed on the accompanying index to exhibits are filed as part of this Annual Report on Form 10-K.
|
|
45
INGERSOLL-RAND PLC
INDEX TO EXHIBITS
(Item 15(a))
Description
Pursuant to the rules and regulations of the Securities and Exchange Commission (“SEC”), Ingersoll-Rand plc (the “Company”) has filed certain agreements as exhibits to this Annual Report on Form 10-K. These agreements may contain representations and warranties by the parties. These representations and warranties have been made solely for the benefit of the other party or parties to such agreements and (i) may have been qualified by disclosures made to such other party or parties, (ii) were made only as of the date of such agreements or such other date(s) as may be specified in such agreements and are subject to more recent developments, which may not be fully reflected in our public disclosure, (iii) may reflect the allocation of risk among the parties to such agreements and (iv) may apply materiality standards different from what may be viewed as material to investors. Accordingly, these representations and warranties may not describe our actual state of affairs at the date hereof and should not be relied upon.
On July 1, 2009, Ingersoll-Rand Company Limited, a Bermuda company, completed a reorganization to change the jurisdiction of incorporation of the parent company from Bermuda to Ireland. As a result, Ingersoll-Rand plc replaced Ingersoll-Rand Company Limited as the ultimate parent company effective July 1, 2009. All references related to the Company prior to July 1, 2009 relate to Ingersoll-Rand Company Limited.
(a) Exhibits
|
Exhibit No.
|
Description
|
|
Method of Filing
|
||
|
2.1
|
Asset and Stock Purchase Agreement, dated as of July 29, 2007, among Ingersoll-Rand Company Limited, on behalf of itself and certain of its subsidiaries, and Doosan Infracore Co., Ltd. and Doosan Engine Co., Ltd., on behalf of themselves and certain of their subsidiaries.
|
|
Incorporated by reference to Exhibit 2.1 to the Company’s Form 8-K (File No. 001-16831) filed with the SEC on July 31, 2007.
|
||
|
2.2
|
Separation and Distribution Agreement, dated as of July 16, 2007, by and between Trane Inc. (formerly American Standard Companies Inc.) and WABCO Holdings Inc.
|
|
Incorporated by reference to Exhibit 2.1 to Trane Inc.’s Form 8-K (File No. 001-11415) filed with the SEC on July 20, 2007.
|
||
|
2.3
|
Separation and Distribution Agreement between Ingersoll-Rand plc and Allegion plc, dated November 29, 2013.
|
|
Incorporated by reference to Exhibit 3.1 to the Company’s Form 8-K (File No. 001-34400) filed with the SEC on December 2, 2013.
|
||
|
3.1
|
Memorandum of Association of Ingersoll-Rand plc.
|
|
Incorporated by reference to Exhibit 3.1 to the Company’s Form 8-K (File No. 001-34400) filed with the SEC on July 1, 2009.
|
||
|
3.2
|
Articles of Association of Ingersoll-Rand plc, as amended and restated on June 6,2013.
|
|
Incorporated by reference to Exhibit 3.1 to the Company’s Form 8-K (File No. 001-34400) filed with the SEC on June 10, 2013.
|
||
|
3.3
|
Certificate of Incorporation of Ingersoll-Rand plc.
|
|
Incorporated by reference to Exhibit 3.3 to the Company’s Form 8-K (File No. 001-34400) filed with the SEC on July 1, 2009.
|
||
46
|
Exhibit No.
|
Description
|
|
Method of Filing
|
||
|
The Company and its subsidiaries are parties to several long-term debt instruments under which, in each case, the total amount of securities authorized does not exceed 10% of the total assets of the Company and its subsidiaries on a consolidated basis.
|
|
Pursuant to paragraph 4 (iii)(A) of Item 601 (b) of Regulation S-K, the Company agrees to furnish a copy of such instruments to the Securities and Exchange Commission upon request.
|
|||
|
4.1
|
Indenture, dated as of August 12, 2008, among the Company, Ingersoll-Rand Global Holding Company Limited and Wells Fargo Bank, N.A., as Trustee (replacing the Indenture originally filed as Exhibit 4.1 to the Company’s Form 10-Q (File No. 001-16831) for the period ended September 30, 2008 as filed with the SEC on November 7, 2008).
|
|
Incorporated by reference to Exhibit 4.4 to the Company’s Form 10-K for the fiscal year ended 2008 (File No. 001-16831) filed with the SEC on March 2, 2009.
|
||
|
4.2
|
First Supplemental Indenture, dated as of August 15, 2008, among the Company, Ingersoll-Rand Global Holding Company Limited and Wells Fargo Bank, N.A., as trustee, to that certain Indenture, dated as of August 12, 2008, among the Company, Ingersoll-Rand Global Holding Company Limited and Wells Fargo Bank, N.A., as trustee.
|
|
Incorporated by reference to Exhibit 1.1 to the Company’s Form 8-K (File No. 001-16831) filed with the SEC on August 18, 2008.
|
||
|
4.3
|
Second Supplemental Indenture, dated as of April 3, 2009, among the Company, Ingersoll-Rand Global Holding Company Limited and Wells Fargo Bank, N.A., as trustee, to that certain Indenture, dated as of August 12, 2008, among the Company, Ingersoll-Rand Global Holding Company Limited and Wells Fargo Bank, N.A., as trustee.
|
|
Incorporated by reference to Exhibit 4.1 to the Company’s Form 8-K (File No. 001-16831) filed with the SEC on April 6, 2009.
|
||
|
4.4
|
Third Supplemental Indenture, dated as of April 6, 2009, among the Company, Ingersoll-Rand Global Holding Company Limited and Wells Fargo Bank, N.A., as trustee, to that certain Indenture, dated as of August 12, 2008, among the Company, Ingersoll-Rand Global Holding Company Limited and Wells Fargo Bank, N.A., as trustee.
|
|
Incorporated by reference to Exhibit 4.2 to the Company’s Form 8-K (File No. 001-16831) filed with the SEC on April 6, 2009.
|
||
47
|
Exhibit No.
|
Description
|
|
Method of Filing
|
||
|
4.5
|
Fourth Supplemental Indenture, dated as of June 29, 2009, among Ingersoll-Rand Global Holding Company Limited, a Bermuda exempted company, Ingersoll-Rand Company Limited, a Bermuda exempted company, Ingersoll-Rand International Holding Limited, a Bermuda exempted company, Ingersoll-Rand plc, an Irish public limited company, and Wells Fargo Bank, N.A., as Trustee, to the Indenture dated as of August 12, 2008.
|
|
Incorporated by reference to Exhibit 4.1 to the Company’s Form 8-K (File No. 001-34400) filed with the SEC on July 1, 2009.
|
||
|
4.6
|
Fifth Supplemental Indenture dated as of November 20, 2013, among Ingersoll-Rand Global Holding Company Limited, a Bermuda company, Ingersoll-Rand International Holding Limited, a Bermuda company, Ingersoll-Rand Company, a New Jersey corporation, and Wells Fargo Bank, N.A., as Trustee, to the Indenture dated as of August 12, 2008.
|
Incorporated by reference to Exhibit 4.2 to the Company's Form 8-K (File No. 001-34400) filed with the SEC on November 26, 2013.
|
|||
|
4.7
|
Sixth Supplemental Indenture, dated as of October 28, 2014, by and among Ingersoll-Rand Global Holding Company Limited, as issuer, Ingersoll-Rand Company, as co-obligor, Ingersoll-Rand plc, Ingersoll-Rand International Holding Limited, Ingersoll-Rand Luxembourg Finance S.A., as guarantors, and Wells Fargo Bank, N.A., as Trustee, to an Indenture, dated as of August 12, 2008.
|
Incorporated by reference to Exhibit 4.6 to the Company's Form 8-K (File No. 001-34400) filed with the SEC on November 26, 2013.
|
|||
|
4.8
|
Seventh Supplemental Indenture, dated as of December 18, 2015, by and among Ingersoll-Rand Global Holding Company Limited, as issuer, Ingersoll-Rand Company, Ingersoll-Rand plc, Ingersoll-Rand International Holding Limited, Ingersoll-Rand Luxembourg Finance S.A., and Ingersoll-Rand Lux International Holding Company S.à.r.l. as guarantors, Wells Fargo Bank, N.A., as Trustee, to an Indenture, dated as of August 12, 2008.
|
Filed herewith.
|
|||
|
4.9
|
Fifth Supplemental Indenture, dated as of June 29, 2009, among Ingersoll-Rand Company, a New Jersey corporation, Ingersoll-Rand plc, an Irish public limited company, Ingersoll-Rand International Holding Limited, a Bermuda exempted company, and The Bank of New York Mellon, as Trustee, to the Indenture dated as of August 1, 1986.
|
|
Incorporated by reference to Exhibit 4.3 to the Company’s Form 8-K (File No. 001-34400) filed with the SEC on July 1, 2009.
|
||
48
|
Exhibit No.
|
Description
|
|
Method of Filing
|
||
|
4.10
|
Sixth Supplemental Indenture, dated as of October 28, 2014, by and among Ingersoll-Rand Company, as issuer, Ingersoll-Rand plc, Ingersoll-Rand International Holding Limited, Ingersoll-Rand Company Limited, Ingersoll-Rand Luxembourg Finance S.A., as guarantors, and The Bank of New York Mellon, as Trustee, to an Indenture, dated as of August 1, 1986.
|
Incorporated by reference to Exhibit 4.7 to the Company's Form 8-K (File No. 001-34400) filed with the SEC on November 26, 2013.
|
|||
|
4.11
|
Indenture, dated as of May 24. 2005, among Ingersoll-Rand Company Limited, Ingersoll-Rand Company and Wells Fargo Bank, N.A., as trustee.
|
|
Incorporated by reference to Exhibit 10.2 to the Company’s 8-K (File No. 001-16831) filed with the SEC on May 27, 2005.
|
||
|
4.12
|
First Supplemental Indenture, dated as of June 29, 2009, among Ingersoll-Rand Company Limited, a Bermuda exempted company, Ingersoll-Rand Company, a New Jersey corporation, Ingersoll-Rand International Holding Limited, a Bermuda exempted company, Ingersoll-Rand plc, an Irish public limited company, and Wells Fargo Bank, N.A., as Trustee, to the Indenture dated as of May 24, 2005.
|
|
Incorporated by reference to Exhibit 4.2 to the Company’s Form 8-K (File No. 001-34400) filed with the SEC on July 1, 2009.
|
||
|
4.13
|
Second Supplemental Indenture, dated as of November 20, 2013, among Ingersoll-Rand International Holding Limited, a Bermuda company, Ingersoll-Rand Company, a New Jersey corporation, and Wells Fargo Bank, N.A., as Trustee, to the Indenture dated as of May 24, 2005.
|
|
Incorporated by reference to Exhibit 4.3 to the Company's Form 8-K (File No. 001-34400) filed with the SEC on November 26, 2013.
|
||
|
4.14
|
Indenture, dated as of April 1, 2005, among the American Standard Inc., Trane Inc. (formerly American Standard Companies Inc.), American Standard International Inc. and The Bank of New York Trust Company, N.A., as trustee.
|
|
Incorporated by reference to Exhibit 4.1 to Trane, Inc.’s 8-K (File No. 001-11415) filed with the SEC on April 1, 2005.
|
||
|
4.15
|
Indenture, dated as of June 20, 2013, by and among Ingersoll-Rand Global Holding Company Limited, as issuer, Ingersoll-Rand plc, Ingersoll-Rand Company Limited and Ingersoll-Rand International Holding Limited, as guarantors and The Bank of New York Mellon, as Trustee.
|
Incorporated by reference to Exhibit 4.1 to the Company's Form 8-K (File No. 001-34400) filed with the SEC on June 26, 2013.
|
|||
49
|
Exhibit No.
|
Description
|
|
Method of Filing
|
||
|
4.16
|
First Supplemental Indenture, dated as of June 20, 2013, by and among Ingersoll-Rand Global Holding Company Limited, as issuer, Ingersoll-Rand plc, Ingersoll-Rand Company Limited and Ingersoll-Rand International Holding Limited, as guarantors and The Bank of New York Mellon, as Trustee, relating to the 2.875% Senior Notes due 2019.
|
Incorporated by reference to Exhibit 4.2 to the Company's Form 8-K (File No. 001-34400) filed with the SEC on June 26, 2013.
|
|||
|
4.17
|
Second Supplemental Indenture, dated as of June 20, 2013, by and among Ingersoll-Rand Global Holding Company Limited, as issuer, Ingersoll-Rand plc, Ingersoll-Rand Company Limited and Ingersoll-Rand International Holding Limited, as guarantors and The Bank of New York Mellon, as Trustee, relating to the 4.250% Senior Notes due 2023.
|
Incorporated by reference to Exhibit 4.3 to the Company's Form 8-K (File No. 001-34400) filed with the SEC on June 26, 2013.
|
|||
|
4.18
|
Third Supplemental Indenture, dated as of June 20, 2013, by and among Ingersoll-Rand Global Holding Company Limited, as issuer, Ingersoll-Rand plc, Ingersoll-Rand Company Limited and Ingersoll-Rand International Holding Limited, as guarantors and The Bank of New York Mellon, as Trustee, relating to the 5.750% Senior Notes due 2043.
|
Incorporated by reference to Exhibit 4.4 to the Company's Form 8-K (File No. 001-34400) filed with the SEC on June 26, 2013.
|
|||
|
4.19
|
Fourth Supplemental Indenture, dated as of November 20, 2013, among Ingersoll-Rand Global Holding Company Limited, a Bermuda company, Ingersoll-Rand Company Limited, a Bermuda company, Ingersoll-Rand International Holding Limited, a Bermuda company, Ingersoll-Rand plc, an Irish public limited company, Ingersoll-Rand Company, a New Jersey corporation, and The Bank of New York Mellon, as Trustee, to the Indenture dated as of June 20, 2013.
|
Incorporated by reference to Exhibit 4.1 to the Company's Form 8-K (File No. 001-34400) filed with the SEC on November 26, 2013.
|
|||
|
4.20
|
Fifth Supplemental Indenture, dated as of October 28, 2014, by and among Ingersoll-Rand Global Holding Company Limited, as issuer, Ingersoll-Rand Company, as co-obligor, Ingersoll-Rand plc, Ingersoll-Rand Company Limited, Ingersoll-Rand International Holding Limited, Ingersoll-Rand Luxembourg Finance S.A., as guarantors, and The Bank of New York Mellon, as Trustee, to an Indenture, dated as of June 20, 2013.
|
Incorporated by reference to Exhibit 4.5 to the Company’s Form 8-K (File No. 001-34400) filed with the SEC on October 29, 2014.
|
|||
50
|
Exhibit No.
|
Description
|
|
Method of Filing
|
||
|
4.21
|
Sixth Supplemental Indenture, dated as of December 18, 2015, by and among Ingersoll-Rand Global Holding Company Limited, as issuer, Ingersoll-Rand Company, as co-obligor, Ingersoll-Rand plc, Ingersoll-Rand International Holding Limited, Ingersoll-Rand Luxembourg Finance S.A., and Ingersoll-Rand Lux International Holding Company S.à.r.l. as guarantors, and The Bank of New York Mellon, as Trustee, to an Indenture, dated as of June 20, 2013.
|
Filed herewith.
|
|||
|
4.22
|
Form of Registration Rights Agreement, dated as of June 20, 2013, by and among Ingersoll-Rand Global Holding Company Limited, Ingersoll-Rand plc, Ingersoll-Rand Company Limited, Ingersoll-Rand International Holding Limited and the Representatives of the Initial Purchasers named therein.
|
Incorporated by reference to Exhibit 4.5 to the Company's Form 8-K (File No. 001-34400) filed with the SEC on June 26, 2013.
|
|||
|
4.23
|
Indenture, dated as of October 28, 2014, by and among Ingersoll-Rand Luxembourg Finance S.A., as issuer, and Ingersoll-Rand plc, Ingersoll-Rand Company Limited, Ingersoll-Rand International Holding Limited, Ingersoll-Rand Company and Ingersoll-Rand Global Holding Company Limited, as guarantors, and The Bank of New York Mellon, as Trustee.
|
Incorporated by reference to Exhibit 4.1 to the Company’s Form 8-K (File No. 001-34400) filed with the SEC on October 29, 2014.
|
|||
|
4.24
|
First Supplemental Indenture, dated as of October 28, 2014, by and among Ingersoll-Rand Luxembourg Finance S.A., as issuer, and Ingersoll-Rand plc, Ingersoll-Rand Company Limited, Ingersoll-Rand International Holding Limited, Ingersoll-Rand Company and Ingersoll-Rand Global Holding Company Limited, as guarantors, and The Bank of New York Mellon, as Trustee, relating to the 2.625% Senior Notes due 2020.
|
Incorporated by reference to Exhibit 4.2 to the Company’s Form 8-K (File No. 001-34400) filed with the SEC on October 29, 2014.
|
|||
|
4.25
|
Second Supplemental Indenture, dated as of October 28, 2014, by and among Ingersoll-Rand Luxembourg Finance S.A., as issuer, and Ingersoll-Rand plc, Ingersoll-Rand Company Limited, Ingersoll-Rand International Holding Limited, Ingersoll-Rand Company and Ingersoll-Rand Global Holding Company Limited, as guarantors, and The Bank of New York Mellon, as Trustee, relating to the 3.550% Senior Notes due 2024.
|
Incorporated by reference to Exhibit 4.3 to the Company’s Form 8-K (File No. 001-34400) filed with the SEC on October 29, 2014.
|
|||
51
|
Exhibit No.
|
Description
|
|
Method of Filing
|
||
|
4.26
|
Third Supplemental Indenture, dated as of October 28, 2014, by and among Ingersoll-Rand Luxembourg Finance S.A., as issuer, and Ingersoll-Rand plc, Ingersoll-Rand Company Limited, Ingersoll-Rand International Holding Limited, Ingersoll-Rand Company and Ingersoll-Rand Global Holding Company Limited, as guarantors, and The Bank of New York Mellon, as Trustee, relating to the 4.650% Senior Notes due 2044.
|
Incorporated by reference to Exhibit 4.3 to the Company’s Form 8-K (File No. 001-34400) filed with the SEC on October 29, 2014.
|
|||
|
4.27
|
Fourth Supplemental Indenture, dated as of December 18, 2015, by and among Ingersoll-Rand Luxembourg Finance S.A., as issuer, and Ingersoll-Rand plc, Ingersoll-Rand International Holding Limited, Ingersoll-Rand Company, Ingersoll-Rand Global Holding Company Limited, and Ingersoll-Rand Lux International Holding Company S.à.r.l. as guarantors, and The Bank of New York Mellon, as Trustee.
|
Filed herewith.
|
|||
|
4.28
|
Form of Ordinary Share Certificate of Ingersoll-Rand plc.
|
|
Incorporated by reference to Exhibit 4.6 to the Company’s Form S-3 (File No. 333-161334) filed with the SEC on August 13, 2009.
|
||
|
10.1
|
Form of IR Stock Option Grant Agreement (February 2015).
|
|
Incorporated by reference to Exhibit 10.1 to the Company’s Form 10-K for the fiscal year ended 2014 (File No. 001-34400) filed with the SEC on February 13, 2015.
|
||
|
10.2
|
Form of IR Restricted Stock Unit Grant Agreement (February 2015).
|
|
Incorporated by reference to Exhibit 10.2 to the Company’s Form 10-K for the fiscal year ended 2014 (File No. 001-34400) filed with the SEC on February 13, 2015.
|
||
|
10.3
|
Form of IR Performance Stock Unit Grant Agreement (February 2015).
|
|
Incorporated by reference to Exhibit 10.3 to the Company’s Form 10-K for the fiscal year ended 2014 (File No. 001-34400) filed with the SEC on February 13, 2015.
|
||
52
|
Exhibit No.
|
Description
|
|
Method of Filing
|
||
|
10.4
|
Credit Agreement dated March 15, 2012 among Ingersoll-Rand Global Holding Company Limited, Ingersoll-Rand plc, Ingersoll-Rand Company Limited, Ingersoll-Rand International Holding Limited, JPMorgan Chase Bank, N.A., as Administrative Agent, Citibank, N.A., as Syndication Agent, Bank of America, N.A., BNP Paribas, Deutsche Bank Securities Inc., Goldman Sachs Bank USA, Morgan Stanley MUFG Loan Partners, LLC, and Mizuho Corporate Bank, Ltd., as Documentation Agents, and J.P. Morgan Securities LLC and Citigroup Global Markets Inc., as joint lead arrangers and joint bookrunners; and certain other lending institutions from time to time parties thereto.
|
|
Incorporated by reference to Exhibit 10.1 to the Company’s Form 8-K (File No. 001-34400) filed with the SEC on March 21, 2012.
|
||
|
10.5
|
Supplement No. 1, dated as of November 20, 2013, between Ingersoll-Rand Company, a New Jersey Corporation, and JPMorgan Chase Bank, N.A., as Administrative Agent, to the Credit Agreement dated as of March 15, 2012.
|
Incorporated by reference to Exhibit 10.1 to the Company's Form 8-K (File No. 001-34400) filed with the SEC on November 26, 2013.
|
|||
|
10.6
|
Supplemental Guarantee dated as of December 18, 2015 made by Ingersoll-Rand Lux International Holding Company S.à.r.l. in favor of JPMorgan Chase Bank, N.A., as Administrative Agent for the Banks that are parties to the Credit Agreement dated as of March 15, 2012.
|
Filed herewith.
|
|||
|
10.7
|
Credit Agreement dated March 20, 2014 among Ingersoll-Rand Global Holding Company Limited, Ingersoll-Rand plc, Ingersoll-Rand Company Limited, Ingersoll-Rand International Holding Limited, Ingersoll-Rand Company, JPMorgan Chase Bank, N.A., as Administrative Agent, Citibank, N.A., as Syndication Agent, Bank of America, N.A., BNP Paribas, Deutsche Bank Securities Inc., Goldman Sachs Bank USA, Mizuho Bank, Ltd., and The Bank of Tokyo-Mitsubishi UFJ, Ltd. as Documentation Agents, and J.P. Morgan Securities LLC and Citigroup Global Markets Inc., as joint lead arrangers and joint bookrunners, and certain lending institutions from time to time parties thereto.
|
Incorporated by reference to Exhibit 10.1 to the Company’s Form 8-K (File No. 001-34400) filed with the SEC on March 26, 2014.
|
|||
53
|
Exhibit No.
|
Description
|
|
Method of Filing
|
||
|
10.8
|
Supplemental Guarantee dated as of December 18, 2015 made by Ingersoll-Rand Lux International Holding Company S.à.r.l. in favor of JPMorgan Chase Bank, N.A., as Administrative Agent for the Banks that are parties to the Credit Agreement dated as of March 20, 2014.
|
Filed herewith.
|
|||
|
10.9
|
Deed Poll Indemnity of Ingersoll-Rand plc, an Irish public limited company, as to the directors, secretary and officers and senior executives of Ingersoll-Rand plc and the directors and officers of Ingersoll-Rand plc’s subsidiaries.
|
|
Incorporated by reference to Exhibit 10.5 to the Company’s Form 8-K (File No. 001-34400) filed with the SEC on July 1, 2009.
|
||
|
10.10
|
Tax Sharing Agreement, dated as of July 16, 2007, by and among American Standard Companies Inc. and certain of its subsidiaries and WABCO Holdings Inc. and certain of its subsidiaries.
|
|
Incorporated by reference to Exhibit 10.1 to Trane Inc.’s Form 8-K (File No. 001-11415) filed with the SEC on July 20, 2007.
|
||
|
10.11
|
Tax Matters Agreement between Ingersoll-Rand plc and Allegion plc, dated November 30, 2013.
|
Incorporated by reference to Exhibit 10.2 to the Company's Form 8-K (File No. 001-34400) filed with the SEC on December 2, 2013.
|
|||
|
10.12
|
Ingersoll-Rand plc Incentive Stock Plan of 2013.
|
Incorporated by reference to Exhibit 4.5 to the Company's Form S-8 (File No. 333-189446) filed with the SEC on June 19, 2013.
|
|||
|
10.13
|
Ingersoll-Rand plc Incentive Stock Plan of 2007 (amended and restated as of December 1, 2010).
|
|
Incorporated by reference to Exhibit 10.18 to the Company’s Form 10-K for the fiscal year ended 2010 (File No. 001-34400) filed with the SEC on February 22, 2011.
|
||
|
10.14
|
Ingersoll-Rand plc Incentive Stock Plan of 1998 (amended and restated as of July 1, 2009).
|
|
Incorporated by reference to Exhibit 10.8 to the Company’s Form 8-K (File No. 001-34400) filed with the SEC on July 1, 2009.
|
||
|
10.15
|
Ingersoll-Rand Company Incentive Stock Plan of 1995 (amended and restated effective July 1, 2009).
|
|
Incorporated by reference to Exhibit 10.7 to the Company’s Form 8-K (File No. 001-34400) filed with the SEC on July 1, 2009.
|
||
|
10.16
|
IR Executive Deferred Compensation Plan (as amended and restated effective July 1, 2009).
|
|
Incorporated by reference to Exhibit 10.9 to the Company’s Form 8-K (File No. 001-34400) filed with the SEC on July 1, 2009.
|
||
|
10.17
|
IR Executive Deferred Compensation Plan II (as amended and restated effective July 1, 2009).
|
|
Incorporated by reference to Exhibit 10.10 to the Company’s Form 8-K (File No. 001-34400) filed with the SEC on July 1, 2009.
|
||
54
|
Exhibit No.
|
Description
|
|
Method of Filing
|
||
|
10.18
|
First Amendment to IR Executive Deferred Compensation Plan II (dated December 22, 2009).
|
Incorporated by reference to Exhibit 10.19 to the Company’s Form 10-K for the fiscal year ended 2011 (File No. 001-34400) filed with the SEC on February 21, 2012.
|
|||
|
10.19
|
Second Amendment to IR Executive Deferred Compensation Plan II (dated December 23, 2010).
|
Incorporated by reference to Exhibit 10.20 to the Company’s Form 10-K for the fiscal year ended 2011 (File No. 001-16831) filed with the SEC on February 21, 2012.
|
|||
|
10.20
|
IR-plc Director Deferred Compensation and Stock Award Plan (as amended and restated effective July 1, 2009).
|
|
Incorporated by reference to Exhibit 10.11 to the Company’s Form 8-K (File No. 001-34400) filed with the SEC on July 1, 2009.
|
||
|
10.21
|
IR-plc Director Deferred Compensation and Stock Award Plan II (as amended and restated effective July 1, 2009).
|
|
Incorporated by reference to Exhibit 10.12 to the Company’s Form 8-K (File No. 001-34400) filed with the SEC on July 1, 2009.
|
||
|
10.22
|
Ingersoll-Rand Company Supplemental Employee Savings Plan (amended and restated effective October 1, 2012).
|
|
Incorporated by reference to exhibit 10.23 to the Company's Form 10-K for the fiscal year ended 2012 (File No. 001-34400) filed with the SEC on February 14, 2013.
|
||
|
10.23
|
Ingersoll-Rand Company Supplemental Employee Savings Plan II (effective January 1, 2005 and amended and restated through October 1, 2012).
|
|
Incorporated by reference to exhibit 10.24 to the Company's Form 10-K for the fiscal year ended 2012 (File No. 001-34400) filed with the SEC on February 14, 2013.
|
||
|
10.24
|
Trane Inc. 2002 Omnibus Incentive Plan (restated to include all amendments through July 1, 2009).
|
Incorporated by reference to Exhibit 10.17 to the Company’s Form 8-K (File No. 001-34400) filed with the SEC on July 1, 2009.
|
|||
|
10.25
|
Trane Inc. Deferred Compensation Plan (as amended and restated as of July 1, 2009, except where otherwise stated).
|
Incorporated by reference to Exhibit 10.19 to the Company’s Form 8-K (File No. 001-34400) filed with the SEC on July 1, 2009.
|
|||
|
10.26
|
Ingersoll-Rand Company Supplemental Pension Plan (Amended and Restated Effective January 1, 2005).
|
Incorporated by reference to Exhibit 10.28 to the Company’s Form 10-K for the fiscal year ended 2008 (File No. 001-16831) filed with the SEC on March 2, 2009.
|
|||
|
10.27
|
First Amendment to the Ingersoll-Rand Company Supplemental Pension Plan, dated as of July 1, 2009.
|
Incorporated by reference to Exhibit 10.21 to the Company’s Form 8-K (File No. 001-34400) filed with the SEC on July 1, 2009.
|
|||
|
10.28
|
Ingersoll-Rand Company Supplemental Pension Plan II (Effective January 1, 2005 and Amended and Restated effective October 1, 2012).
|
Incorporated by reference to exhibit 10.31 to the Company's Form 10-K for the fiscal year ended 2012 (File No. 001-34400) filed with the SEC on February 14, 2013.
|
|||
55
|
Exhibit No.
|
Description
|
|
Method of Filing
|
||
|
10.29
|
Ingersoll-Rand Company Elected Officers Supplemental Plan II (Effective January 1, 2005 and Amended and Restated effective October 1, 2012).
|
Incorporated by reference to exhibit 10.32 to the Company's Form 10-K for the fiscal year ended 2012 (File No. 001-34400) filed with the SEC on February 14, 2013.
|
|||
|
10.30
|
Senior Executive Performance Plan.
|
Incorporated by reference to Exhibit 10.39 to the Company's Form 10-K for the fiscal year ended 2011 (File No. 001-34400) filed with the SEC on February 21, 2012.
|
|||
|
10.31
|
Description of Annual Incentive Matrix Program.
|
Incorporated by reference to Exhibit 10.40 to the Company's Form 10-K for the fiscal year ended 2011 (File No. 001-34400) filed with the SEC on February 21, 2012.
|
|||
|
10.32
|
Form of Tier 1 Change in Control Agreement (Officers before May 19, 2009).
|
Incorporated by reference to Exhibit 99.1 to the Company's Form 8-K (File No. 001-16831) filed with the SEC on December 4, 2006.
|
|||
|
10.33
|
Form of Tier 2 Change in Control Agreement (Officers before May 19, 2009).
|
Incorporated by reference to Exhibit 99.2 to the Company’s Form 8-K (File No. 001-16831) filed with the SEC on December 4, 2006.
|
|||
|
10.34
|
Form of Tier 1 Change in Control Agreement (New Officers on or after May 19, 2009).
|
|
Incorporated by reference to Exhibit 10.32 to the Company’s Form 10-Q for the period ended June 30, 2009 (File No. 001-34400) filed with the SEC on August 6, 2009.
|
||
|
10.35
|
Form of Tier 2 Change in Control Agreement (New Officers on or after May 19, 2009).
|
Incorporated by reference to Exhibit 10.33 to the Company’s Form 10-Q for the period ended June 30, 2009 (File No. 001-34400) filed with the SEC on August 6, 2009.
|
|||
|
10.36
|
Amended and Restated Major Restructuring Severance Plan (as amended and restated effective December 31, 2014).
|
Incorporated by reference to Exhibit 10.35 to the Company’s Form 10-K for the fiscal year ended 2014 (File No. 001-34400) filed with the SEC on February 13, 2015.
|
|||
|
10.37
|
Didier Teirlinck Offer Letter, dated June 5, 2008.
|
Incorporated by reference to Exhibit 10.4 to the Company’s Form 8-K (File No. 001-16831) filed with the SEC on June 10, 2008.
|
|||
|
10.38
|
Addendum to Didier Teirlinck Offer Letter, dated July 17, 2008.
|
Incorporated by reference to Exhibit 10.13 to the Company’s Form 10-Q for the period ended June 30, 2008 (File No. 001-16831) filed with the SEC on August 8, 2008.
|
|||
56
|
Exhibit No.
|
Description
|
|
Method of Filing
|
||
|
10.39
|
Addendum to Didier Teirlinck Offer Letter, dated December 9, 2013.
|
Incorporated by reference to exhibit 10.48 to the Company's Form 10-K for the fiscal year ended 2013 (File No. 001-34400) filed with the SEC on February 14, 2014
|
|||
|
10.40
|
Michael W. Lamach Letter, dated December 24, 2003.
|
Incorporated by reference to Exhibit 10.23 to the Company’s Form 10-K for the fiscal year ended 2003 (File No. 001-16831) filed with the SEC on February 27, 2004.
|
|||
|
10.41
|
Michael W. Lamach Letter, dated June 4, 2008.
|
Incorporated by reference to Exhibit 10.2 to the Company’s Form 8-K (File No. 001-16831) filed with the SEC on June 10, 2008.
|
|||
|
10.42
|
Michael W. Lamach Letter, dated February 4, 2009.
|
Incorporated by reference to Exhibit 10.43 to the Company’s Form 10-K for the fiscal year ended 2008 (File No. 001-16831) filed with the SEC on March 2, 2009.
|
|||
|
10.43
|
Michael W. Lamach Letter, dated February 3, 2010.
|
Incorporated by reference to Exhibit 10.1 to the Company’s Form 8-K (File No. 001-34400) filed with the SEC on February 5, 2010.
|
|||
|
10.44
|
Michael W. Lamach Letter, dated December 23, 2012.
|
Incorporated by reference to exhibit 10.48 to the Company's Form 10-K for the fiscal year ended 2012 (File No. 001-34400) filed with the SEC on February 14, 2013.
|
|||
|
10.45
|
Robert Zafari Letter and Addendum, dated August 25, 2010.
|
Incorporated by reference to Exhibit 10.1 to the Company’s Form 10-Q for the period ended September 30, 2010 (File No. 001-34400) filed with the SEC on November 1, 2010.
|
|||
|
10.46
|
Addendum to Robert Zafari Offer Letter, dated December 9, 2013.
|
Incorporated by reference to exhibit 10.55 to the Company's Form 10-K for the fiscal year ended 2013 (File No. 001-34400) filed with the SEC on February 14, 2014.
|
|||
|
10.47
|
Employment Agreement with Marcia J. Avedon, Senior Vice President, dated January 8, 2007.
|
Incorporated by reference to Exhibit 10.45 to the Company's Form 10-K for the fiscal year ended December 31, 2006 (File No. 001-16831) filed with the SEC on March 1, 2007.
|
|||
|
10.48
|
Marcia J. Avedon Letter, dated December 20, 2012.
|
Incorporated by reference to exhibit 10.53 to the Company's Form 10-K for the fiscal year ended 2012 (File No. 001-34400) filed with the SEC on February 14, 2013.
|
|||
57
|
Exhibit No.
|
Description
|
|
Method of Filing
|
||
|
10.49
|
Susan K. Carter Employment Agreement, dated as of August 19, 2013.
|
Incorporated by reference to Exhibit 10.1 to the Company's Form 8-K (File No. 001-34400) filed with the SEC on October 2, 2013.
|
|||
|
10.50
|
Employee Matters Agreement between Ingersoll-Rand plc and Allegion plc, dated November 30, 2013.
|
Incorporated by reference to Exhibit 10.1 to the Company's Form 8-K (File No. 001-34400) filed with the SEC on December 2, 2013.
|
|||
|
12
|
Computations of Ratios of Earnings to Fixed Charges.
|
|
Filed herewith.
|
||
|
21
|
List of Subsidiaries of Ingersoll-Rand plc.
|
|
Filed herewith.
|
||
|
23.1
|
Consent of Independent Registered Public Accounting Firm.
|
|
Filed herewith.
|
||
|
31.1
|
Certification of Chief Executive Officer Pursuant to Rule 13a-14(a) or Rule 15d-14(a), as Adopted Pursuant to Section 302 of the Sarbanes-Oxley Act of 2002.
|
|
Filed herewith.
|
||
|
31.2
|
Certification of Chief Financial Officer Pursuant to Rule 13a-14(a) or Rule 15d-14(a), as Adopted Pursuant to Section 302 of the Sarbanes-Oxley Act of 2002.
|
|
Filed herewith.
|
||
|
32
|
Certifications of Chief Executive Officer and Chief Financial Officer Pursuant to Rule 13a-14(b) or Rule 15d-14(b) and 18 U.S.C. Section 1350, as Adopted Pursuant to Section 906 of the Sarbanes-Oxley Act of 2002.
|
|
Furnished herewith.
|
||
|
101
|
The following materials from the Company’s Annual Report on Form 10-K for the year ended December 31, 2015, formatted in XBRL (Extensible Business Reporting Language): (i) the Consolidated Statements of Comprehensive Income, (ii) the Consolidated Balance Sheets, (iii) the Consolidated Statements of Equity, (iv) the Consolidated Statements of Cash Flows, and (v) Notes to Consolidated Financial Statements.
|
|
Furnished herewith.
|
||
58
SIGNATURES
Pursuant to the requirements of Section 13 or 15(d) of the Securities Exchange Act of 1934, the registrant has duly caused this report to be signed on its behalf by the undersigned, thereunto duly authorized.
INGERSOLL-RAND PLC
(Registrant)
|
By:
|
|
/s/ Michael W. Lamach
|
|
|
Michael W. Lamach
|
|
|
|
Chief Executive Officer
|
|
|
Date:
|
|
February 12, 2016
|
59
Pursuant to the requirement of the Securities Exchange Act of 1934, this report has been signed by the following persons on behalf of the registrant and in the capacities and on the dates indicated.
|
Signature
|
|
Title
|
|
Date
|
|
/s/ Michael W. Lamach
|
|
Chairman of the Board and Chief Executive Officer (Principal Executive Officer)
|
|
February 12, 2016
|
|
(Michael W. Lamach)
|
||||
|
/s/ Susan K. Carter
|
|
Senior Vice President and Chief Financial Officer (Principal Financial Officer)
|
|
February 12, 2016
|
|
(Susan K. Carter)
|
||||
|
/s/ Christopher J. Kuehn
|
|
Vice President and Controller (Principal Accounting Officer)
|
|
February 12, 2016
|
|
(Christopher J. Kuehn)
|
||||
|
/s/ Ann C. Berzin
|
|
Director
|
|
February 12, 2016
|
|
(Ann C. Berzin)
|
||||
|
/s/ John Bruton
|
|
Director
|
|
February 12, 2016
|
|
(John Bruton)
|
||||
|
/s/ Elaine L. Chao
|
|
Director
|
|
February 12, 2016
|
|
(Elaine L. Chao)
|
||||
|
/s/ Jared L. Cohon
|
|
Director
|
|
February 12, 2016
|
|
(Jared L. Cohon)
|
||||
|
/s/ Gary D. Forsee
|
|
Director
|
|
February 12, 2016
|
|
(Gary D. Forsee)
|
||||
|
/s/ Constance J. Horner
|
|
Director
|
|
February 12, 2016
|
|
(Constance J. Horner)
|
||||
|
/s/ Linda P. Hudson
|
|
Director
|
February 12, 2016
|
|
|
(Linda P. Hudson)
|
||||
|
/s/ Myles P. Lee
|
|
Director
|
|
February 12, 2016
|
|
(Myles P. Lee)
|
||||
|
/s/ John P. Surma
|
Director
|
February 12, 2016
|
||
|
(John P. Surma)
|
||||
|
/s/ Richard J. Swift
|
|
Director
|
|
February 12, 2016
|
|
(Richard J. Swift)
|
||||
|
/s/ Tony L. White
|
|
Director
|
|
February 12, 2016
|
|
(Tony L. White)
|
||||
60
INGERSOLL-RAND PLC
Index to Consolidated Financial Statements
F-1
Report of Independent Registered Public Accounting Firm
To the Shareholders and Board of Directors of Ingersoll-Rand plc:
In our opinion, the Consolidated Financial Statements listed in the accompanying index present fairly, in all material respects, the financial position of Ingersoll-Rand plc and its subsidiaries (the “Company”) at December 31, 2015 and 2014, and the results of their operations and their cash flows for each of the three years in the period ended December 31, 2015 in conformity with accounting principles generally accepted in the United States of America. In addition, in our opinion, the financial statement schedule listed in the accompanying index
presents fairly, in all material respects, the information set forth therein when read in conjunction with the related consolidated financial statements. Also in our opinion, the Company maintained, in all material respects, effective internal control over financial reporting as of December 31, 2015, based on criteria established in
Internal Control - Integrated Framework (2013)
issued by the Committee of Sponsoring Organizations of the Treadway Commission (COSO). The Company's management is responsible for these financial statements and financial statement schedule, for maintaining effective internal control over financial reporting and for its assessment of the effectiveness of internal control over financial reporting, included in the accompanying “Management’s Report on Internal Control over Financial Reporting.” Our responsibility is to express opinions on these financial statements, on the financial statement schedule, and on the Company's internal control over financial reporting based on our integrated audits. We conducted our audits in accordance with the standards of the Public Company Accounting Oversight Board (United States). Those standards require that we plan and perform the audits to obtain reasonable assurance about whether the financial statements are free of material misstatement and whether effective internal control over financial reporting was maintained in all material respects. Our audits of the financial statements included examining, on a test basis, evidence supporting the amounts and disclosures in the financial statements, assessing the accounting principles used and significant estimates made by management, and evaluating the overall financial statement presentation. Our audit of internal control over financial reporting included obtaining an understanding of internal control over financial reporting, assessing the risk that a material weakness exists, and testing and evaluating the design and operating effectiveness of internal control based on the assessed risk. Our audits also included performing such other procedures as we considered necessary in the circumstances. We believe that our audits provide a reasonable basis for our opinions.
As discussed in Note 2 to the consolidated financial statements, the Company has changed the classification and presentation of deferred income taxes in 2015 due to the adoption of Accounting Standards Update 2015-17
Balance Sheet Classification of Deferred Taxes
.
A company’s internal control over financial reporting is a process designed to provide reasonable assurance regarding the reliability of financial reporting and the preparation of financial statements for external purposes in accordance with generally accepted accounting principles. A company’s internal control over financial reporting includes those policies and procedures that (i) pertain to the maintenance of records that, in reasonable detail, accurately and fairly reflect the transactions and dispositions of the assets of the company; (ii) provide reasonable assurance that transactions are recorded as necessary to permit preparation of financial statements in accordance with generally accepted accounting principles, and that receipts and expenditures of the company are being made only in accordance with authorizations of management and directors of the company; and (iii) provide reasonable assurance regarding prevention or timely detection of unauthorized acquisition, use, or disposition of the company’s assets that could have a material effect on the financial statements.
Because of its inherent limitations, internal control over financial reporting may not prevent or detect misstatements. Also, projections of any evaluation of effectiveness to future periods are subject to the risk that controls may become inadequate because of changes in conditions, or that the degree of compliance with the policies or procedures may deteriorate.
/s/ PricewaterhouseCoopers LLP
Charlotte, North Carolina
February 12, 2016
F-2
|
Ingersoll-Rand plc
Consolidated Statements of Comprehensive Income
In millions, except per share amounts
|
||||||||||||
|
For the years ended December 31,
|
2015
|
2014
|
2013
|
|||||||||
|
Net revenues
|
$
|
13,300.7
|
|
$
|
12,891.4
|
|
$
|
12,350.5
|
|
|||
|
Cost of goods sold
|
(9,301.6
|
)
|
(8,982.8
|
)
|
(8,722.3
|
)
|
||||||
|
Selling and administrative expenses
|
(2,541.1
|
)
|
(2,503.9
|
)
|
(2,523.2
|
)
|
||||||
|
Operating income
|
1,458.0
|
|
1,404.7
|
|
1,105.0
|
|
||||||
|
Interest expense
|
(223.0
|
)
|
(225.3
|
)
|
(278.8
|
)
|
||||||
|
Other income/(expense), net
|
12.9
|
|
30.0
|
|
3.4
|
|
||||||
|
Earnings before income taxes
|
1,247.9
|
|
1,209.4
|
|
829.6
|
|
||||||
|
Provision for income taxes
|
(540.8
|
)
|
(293.7
|
)
|
(189.0
|
)
|
||||||
|
Earnings from continuing operations
|
707.1
|
|
915.7
|
|
640.6
|
|
||||||
|
Gain (loss) from discontinued operations, net of tax
|
(24.3
|
)
|
34.7
|
|
13.3
|
|
||||||
|
Net earnings
|
682.8
|
|
950.4
|
|
653.9
|
|
||||||
|
Less: Net earnings attributable to noncontrolling interests
|
(18.2
|
)
|
(18.7
|
)
|
(35.1
|
)
|
||||||
|
Net earnings attributable to Ingersoll-Rand plc
|
$
|
664.6
|
|
$
|
931.7
|
|
$
|
618.8
|
|
|||
|
Amounts attributable to Ingersoll-Rand plc ordinary shareholders:
|
||||||||||||
|
Continuing operations
|
$
|
688.9
|
|
$
|
897.0
|
|
$
|
620.1
|
|
|||
|
Discontinued operations
|
(24.3
|
)
|
34.7
|
|
(1.3
|
)
|
||||||
|
Net earnings
|
$
|
664.6
|
|
$
|
931.7
|
|
$
|
618.8
|
|
|||
|
Earnings (loss) per share attributable to Ingersoll-Rand plc ordinary shareholders:
|
||||||||||||
|
Basic:
|
||||||||||||
|
Continuing operations
|
$
|
2.60
|
|
$
|
3.32
|
|
$
|
2.11
|
|
|||
|
Discontinued operations
|
(0.09
|
)
|
0.12
|
|
—
|
|
||||||
|
Net earnings
|
$
|
2.51
|
|
$
|
3.44
|
|
$
|
2.11
|
|
|||
|
Diluted:
|
|
|
||||||||||
|
Continuing operations
|
$
|
2.57
|
|
$
|
3.27
|
|
$
|
2.08
|
|
|||
|
Discontinued operations
|
(0.09
|
)
|
0.13
|
|
(0.01
|
)
|
||||||
|
Net earnings
|
$
|
2.48
|
|
$
|
3.40
|
|
$
|
2.07
|
|
|||
F-3
|
Ingersoll-Rand plc
Consolidated Statements of Comprehensive Income (continued)
In millions, except per share amounts
|
||||||||||||
|
For the years ended December 31,
|
2015
|
2014
|
2013
|
|||||||||
|
Net earnings
|
$
|
682.8
|
|
$
|
950.4
|
|
$
|
653.9
|
|
|||
|
Other comprehensive income (loss):
|
||||||||||||
|
Currency translation
|
(447.6
|
)
|
(450.2
|
)
|
15.0
|
|
||||||
|
Cash flow hedges
|
||||||||||||
|
Unrealized net gains (losses) arising during period
|
1.2
|
|
(3.1
|
)
|
7.8
|
|
||||||
|
Net losses reclassified into earnings
|
2.6
|
|
5.7
|
|
12.1
|
|
||||||
|
Tax (expense) benefit
|
(1.8
|
)
|
0.1
|
|
(0.2
|
)
|
||||||
|
Total cash flow hedges, net of tax
|
2.0
|
|
2.7
|
|
19.7
|
|
||||||
|
Pension and OPEB adjustments:
|
||||||||||||
|
Prior service costs for the period
|
(6.8
|
)
|
(9.2
|
)
|
(1.2
|
)
|
||||||
|
Net actuarial gains (losses) for the period
|
1.8
|
|
(220.9
|
)
|
358.9
|
|
||||||
|
Amortization reclassified into earnings
|
55.1
|
|
31.6
|
|
63.9
|
|
||||||
|
Settlements/curtailments reclassified to earnings
|
0.7
|
|
7.1
|
|
0.7
|
|
||||||
|
Currency translation and other
|
15.9
|
|
16.1
|
|
(5.4
|
)
|
||||||
|
Tax (expense) benefit
|
(32.0
|
)
|
73.0
|
|
(153.6
|
)
|
||||||
|
Total pension and OPEB adjustments, net of tax
|
34.7
|
|
(102.3
|
)
|
263.3
|
|
||||||
|
Other comprehensive income (loss), net of tax
|
(410.9
|
)
|
(549.8
|
)
|
298.0
|
|
||||||
|
Comprehensive income, net of tax
|
$
|
271.9
|
|
$
|
400.6
|
|
$
|
951.9
|
|
|||
|
Less: Comprehensive income attributable to noncontrolling interests
|
(13.9
|
)
|
(16.5
|
)
|
(38.4
|
)
|
||||||
|
Comprehensive income attributable to Ingersoll-Rand plc
|
$
|
258.0
|
|
$
|
384.1
|
|
$
|
913.5
|
|
|||
See accompanying notes to Consolidated Financial Statements.
F-4
Ingersoll-Rand plc
In millions, except share amounts
|
December 31,
|
2015
|
2014
|
||||||
|
ASSETS
|
||||||||
|
Current assets:
|
||||||||
|
Cash and cash equivalents
|
$
|
736.8
|
|
$
|
1,705.2
|
|
||
|
Accounts and notes receivable, net
|
2,150.6
|
|
2,119.0
|
|
||||
|
Inventories
|
1,410.7
|
|
1,358.9
|
|
||||
|
Deferred taxes and current tax receivable
|
58.6
|
|
299.8
|
|
||||
|
Other current assets
|
252.7
|
|
225.0
|
|
||||
|
Total current assets
|
4,609.4
|
|
5,707.9
|
|
||||
|
Property, plant and equipment, net
|
1,575.1
|
|
1,477.0
|
|
||||
|
Goodwill
|
5,730.2
|
|
5,389.8
|
|
||||
|
Intangible assets, net
|
3,926.1
|
|
3,783.9
|
|
||||
|
Other noncurrent assets
|
898.0
|
|
939.9
|
|
||||
|
Total assets
|
$
|
16,738.8
|
|
$
|
17,298.5
|
|
||
|
LIABILITIES AND EQUITY
|
||||||||
|
Current liabilities:
|
||||||||
|
Accounts payable
|
$
|
1,249.3
|
|
$
|
1,290.0
|
|
||
|
Accrued compensation and benefits
|
437.4
|
|
471.5
|
|
||||
|
Accrued expenses and other current liabilities
|
1,457.5
|
|
1,421.9
|
|
||||
|
Short-term borrowings and current maturities of long-term debt
|
504.2
|
|
482.7
|
|
||||
|
Total current liabilities
|
3,648.4
|
|
3,666.1
|
|
||||
|
Long-term debt
|
3,734.8
|
|
3,741.7
|
|
||||
|
Postemployment and other benefit liabilities
|
1,409.9
|
|
1,438.0
|
|
||||
|
Deferred and noncurrent income taxes
|
896.1
|
|
1,174.3
|
|
||||
|
Other noncurrent liabilities
|
1,170.4
|
|
1,233.0
|
|
||||
|
Total liabilities
|
10,859.6
|
|
11,253.1
|
|
||||
|
Equity:
|
||||||||
|
Ingersoll-Rand plc shareholders’ equity
|
||||||||
|
Ordinary shares, $1 par value (269,029,003 and 266,271,978 shares issued at December 31, 2015 and 2014, respectively)
|
269.0
|
|
266.3
|
|
||||
|
Ordinary shares held in treasury, at cost (
7,777,486
and 3,372,657 shares at December 31, 2015 and 2014, respectively)
|
(452.6
|
)
|
(202.5
|
)
|
||||
|
Capital in excess of par value
|
223.3
|
|
97.1
|
|
||||
|
Retained earnings
|
6,897.9
|
|
6,540.8
|
|
||||
|
Accumulated other comprehensive loss
|
(1,120.9
|
)
|
(714.3
|
)
|
||||
|
Total Ingersoll-Rand plc shareholders’ equity
|
5,816.7
|
|
5,987.4
|
|
||||
|
Noncontrolling interest
|
62.5
|
|
58.0
|
|
||||
|
Total equity
|
5,879.2
|
|
6,045.4
|
|
||||
|
Total liabilities and equity
|
$
|
16,738.8
|
|
$
|
17,298.5
|
|
||
See accompanying notes to Consolidated Financial Statements.
F-5
Ingersoll-Rand plc
Consolidated Statements of Equity
|
Ingersoll-Rand plc shareholders’ equity
|
|||||||||||||||||||||||||||||||
|
In millions, except per share amounts
|
Total
equity
|
Ordinary shares
|
Ordinary shares held in treasury, at cost
|
Capital in
excess of
par value
|
Retained
earnings
|
Accumulated other
comprehensive
income (loss)
|
Noncontrolling Interest
|
||||||||||||||||||||||||
|
Amount
|
Shares
|
||||||||||||||||||||||||||||||
|
Balance at December 31, 2012
|
$
|
7,229.3
|
|
$
|
295.6
|
|
295.6
|
|
$
|
(0.8
|
)
|
$
|
1,015.3
|
|
$
|
6,358.7
|
|
$
|
(521.0
|
)
|
$
|
81.5
|
|
||||||||
|
Net earnings
|
653.9
|
|
—
|
|
—
|
|
—
|
|
—
|
|
618.8
|
|
—
|
|
35.1
|
|
|||||||||||||||
|
Other comprehensive income
|
298.0
|
|
—
|
|
—
|
|
—
|
|
—
|
|
—
|
|
294.7
|
|
3.3
|
|
|||||||||||||||
|
Shares issued under incentive stock plans
|
272.5
|
|
7.9
|
|
7.9
|
|
—
|
|
264.6
|
|
—
|
|
—
|
|
—
|
|
|||||||||||||||
|
Repurchase of ordinary shares
|
(1,213.2
|
)
|
(20.8
|
)
|
(20.8
|
)
|
—
|
|
(1,192.4
|
)
|
—
|
|
—
|
|
—
|
|
|||||||||||||||
|
Share-based compensation
|
71.8
|
|
—
|
|
—
|
|
—
|
|
71.8
|
|
—
|
|
—
|
|
—
|
|
|||||||||||||||
|
Dividends declared to noncontrolling interest
|
(17.6
|
)
|
—
|
|
—
|
|
—
|
|
—
|
|
—
|
|
—
|
|
(17.6
|
)
|
|||||||||||||||
|
Cash dividends, declared ($0.63 per share)
|
(183.4
|
)
|
—
|
|
—
|
|
—
|
|
—
|
|
(183.4
|
)
|
—
|
|
—
|
|
|||||||||||||||
|
Distribution of Allegion
|
18.5
|
|
—
|
|
—
|
|
—
|
|
—
|
|
0.5
|
|
59.1
|
|
(41.1
|
)
|
|||||||||||||||
|
Other
|
1.5
|
|
—
|
|
—
|
|
—
|
|
(0.1
|
)
|
(0.1
|
)
|
0.5
|
|
1.2
|
|
|||||||||||||||
|
Balance at December 31, 2013
|
$
|
7,131.3
|
|
$
|
282.7
|
|
282.7
|
|
$
|
(0.8
|
)
|
$
|
159.2
|
|
$
|
6,794.5
|
|
$
|
(166.7
|
)
|
$
|
62.4
|
|
||||||||
|
Net earnings
|
950.4
|
|
—
|
|
—
|
|
—
|
|
—
|
|
931.7
|
|
—
|
|
18.7
|
|
|||||||||||||||
|
Other comprehensive loss
|
(549.8
|
)
|
—
|
|
—
|
|
—
|
|
—
|
|
—
|
|
(547.6
|
)
|
(2.2
|
)
|
|||||||||||||||
|
Shares issued under incentive stock plans
|
113.1
|
|
3.2
|
|
3.2
|
|
—
|
|
109.9
|
|
—
|
|
—
|
|
—
|
|
|||||||||||||||
|
Repurchase of ordinary shares
|
(1,374.9
|
)
|
(19.6
|
)
|
(19.6
|
)
|
(202.0
|
)
|
(235.5
|
)
|
(917.8
|
)
|
—
|
|
—
|
|
|||||||||||||||
|
Share-based compensation
|
63.8
|
|
—
|
|
—
|
|
—
|
|
63.8
|
|
—
|
|
—
|
|
—
|
|
|||||||||||||||
|
Dividends declared to noncontrolling interest
|
(20.9
|
)
|
—
|
|
—
|
|
—
|
|
—
|
|
—
|
|
—
|
|
(20.9
|
)
|
|||||||||||||||
|
Cash dividends declared ($1.00 per share)
|
(267.6
|
)
|
—
|
|
—
|
|
—
|
|
—
|
|
(267.6
|
)
|
—
|
|
—
|
|
|||||||||||||||
|
Other
|
—
|
|
—
|
|
—
|
|
0.3
|
|
(0.3
|
)
|
—
|
|
—
|
|
—
|
|
|||||||||||||||
|
Balance at December 31, 2014
|
$
|
6,045.4
|
|
$
|
266.3
|
|
266.3
|
|
$
|
(202.5
|
)
|
$
|
97.1
|
|
$
|
6,540.8
|
|
$
|
(714.3
|
)
|
$
|
58.0
|
|
||||||||
|
Net earnings
|
682.8
|
|
—
|
|
—
|
|
—
|
|
—
|
|
664.6
|
|
—
|
|
18.2
|
|
|||||||||||||||
|
Other comprehensive loss
|
(410.9
|
)
|
—
|
|
—
|
|
—
|
|
—
|
|
—
|
|
(406.6
|
)
|
(4.3
|
)
|
|||||||||||||||
|
Shares issued under incentive stock plans
|
65.9
|
|
2.7
|
|
2.7
|
|
—
|
|
63.2
|
|
—
|
|
—
|
|
—
|
|
|||||||||||||||
|
Repurchase of ordinary shares
|
(250.1
|
)
|
—
|
|
—
|
|
(250.1
|
)
|
—
|
|
—
|
|
—
|
|
—
|
|
|||||||||||||||
|
Share-based compensation
|
61.8
|
|
—
|
|
—
|
|
—
|
|
63.0
|
|
(1.2
|
)
|
—
|
|
—
|
|
|||||||||||||||
|
Dividends declared to noncontrolling interest
|
(9.4
|
)
|
—
|
|
—
|
|
—
|
|
—
|
|
—
|
|
—
|
|
(9.4
|
)
|
|||||||||||||||
|
Cash dividends declared ($1.16 per share)
|
(305.6
|
)
|
—
|
|
—
|
|
—
|
|
—
|
|
(305.6
|
)
|
—
|
|
—
|
|
|||||||||||||||
|
Other
|
(0.7
|
)
|
—
|
|
—
|
|
—
|
|
—
|
|
(0.7
|
)
|
—
|
|
—
|
|
|||||||||||||||
|
Balance at December 31, 2015
|
$
|
5,879.2
|
|
$
|
269.0
|
|
269.0
|
|
$
|
(452.6
|
)
|
$
|
223.3
|
|
$
|
6,897.9
|
|
$
|
(1,120.9
|
)
|
$
|
62.5
|
|
||||||||
See accompanying notes to Consolidated Financial Statements.
F-6
Ingersoll-Rand plc
In millions
|
For the years ended December 31,
|
2015
|
2014
|
2013
|
|||||||||
|
Cash flows from operating activities:
|
||||||||||||
|
Net earnings
|
$
|
682.8
|
|
$
|
950.4
|
|
$
|
653.9
|
|
|||
|
(Income) loss from discontinued operations, net of tax
|
24.3
|
|
(34.7
|
)
|
(13.3
|
)
|
||||||
|
Adjustments for non-cash transactions:
|
||||||||||||
|
Depreciation and amortization
|
364.1
|
|
332.4
|
|
333.7
|
|
||||||
|
Other items
|
157.7
|
|
(35.1
|
)
|
226.1
|
|
||||||
|
Changes in other assets and liabilities
|
||||||||||||
|
Accounts and notes receivable
|
(79.8
|
)
|
(119.9
|
)
|
(214.3
|
)
|
||||||
|
Inventories
|
(6.3
|
)
|
(230.0
|
)
|
(39.4
|
)
|
||||||
|
Other current and noncurrent assets
|
248.8
|
|
83.0
|
|
68.3
|
|
||||||
|
Accounts payable
|
(41.0
|
)
|
157.2
|
|
141.0
|
|
||||||
|
Other current and noncurrent liabilities
|
(464.4
|
)
|
(111.6
|
)
|
(357.2
|
)
|
||||||
|
Net cash provided by continuing operating activities
|
886.2
|
|
991.7
|
|
798.8
|
|
||||||
|
Net cash (used in) provided by discontinued operating activities
|
(35.1
|
)
|
(18.5
|
)
|
292.7
|
|
||||||
|
Net cash provided by operating activities
|
851.1
|
|
973.2
|
|
1,091.5
|
|
||||||
|
Cash flows from investing activities:
|
||||||||||||
|
Capital expenditures
|
(249.6
|
)
|
(233.5
|
)
|
(242.2
|
)
|
||||||
|
Acquisition of businesses, net of cash acquired and liabilities assumed
|
(961.8
|
)
|
(10.2
|
)
|
—
|
|
||||||
|
Proceeds from sale of property, plant and equipment
|
18.5
|
|
14.4
|
|
24.3
|
|
||||||
|
Proceeds from business dispositions, net of cash sold
|
—
|
|
2.0
|
|
4.7
|
|
||||||
|
Dividends received from equity investments
|
—
|
|
30.3
|
|
—
|
|
||||||
|
Net cash used in continuing investing activities
|
(1,192.9
|
)
|
(197.0
|
)
|
(213.2
|
)
|
||||||
|
Net cash used in discontinued investing activities
|
—
|
|
—
|
|
(2.2
|
)
|
||||||
|
Net cash used in investing activities
|
(1,192.9
|
)
|
|
(197.0
|
)
|
(215.4
|
)
|
|||||
|
Cash flows from financing activities:
|
||||||||||||
|
Short-term borrowings, net
|
30.3
|
|
99.6
|
|
8.9
|
|
||||||
|
Proceeds from long-term debt
|
—
|
|
1,108.6
|
|
1,547.8
|
|
||||||
|
Payments of long-term debt
|
(23.9
|
)
|
(508.0
|
)
|
(1,265.0
|
)
|
||||||
|
Net proceeds from debt
|
6.4
|
|
700.2
|
|
291.7
|
|
||||||
|
Debt issuance costs
|
—
|
|
(12.3
|
)
|
(13.2
|
)
|
||||||
|
Dividends paid to ordinary shareholders
|
(303.3
|
)
|
(264.7
|
)
|
(245.5
|
)
|
||||||
|
Dividends paid to noncontrolling interests
|
(9.3
|
)
|
(20.9
|
)
|
(12.4
|
)
|
||||||
|
Proceeds from shares issued under incentive plans
|
61.3
|
|
113.1
|
|
272.5
|
|
||||||
|
Repurchase of ordinary shares
|
(250.1
|
)
|
(1,374.9
|
)
|
(1,213.2
|
)
|
||||||
|
Transfer from Allegion
|
—
|
|
—
|
|
1,274.2
|
|
||||||
|
Other financing activities, net
|
4.7
|
|
—
|
|
—
|
|
||||||
|
Net cash (used in) provided by continuing financing activities
|
(490.3
|
)
|
(859.5
|
)
|
354.1
|
|
||||||
|
Net cash used in discontinued financing activities
|
—
|
|
—
|
|
(7.5
|
)
|
||||||
|
Net cash (used in) provided by financing activities
|
(490.3
|
)
|
(859.5
|
)
|
346.6
|
|
||||||
|
Effect of exchange rate changes on cash and cash equivalents
|
(136.3
|
)
|
|
(148.7
|
)
|
6.1
|
|
|||||
|
Net increase (decrease) in cash and cash equivalents
|
(968.4
|
)
|
(232.0
|
)
|
1,228.8
|
|
||||||
|
Cash and cash equivalents – beginning of period
|
1,705.2
|
|
1,937.2
|
|
708.4
|
|
||||||
|
Cash and cash equivalents – end of period
|
$
|
736.8
|
|
$
|
1,705.2
|
|
$
|
1,937.2
|
|
|||
|
Cash paid during the year for:
|
||||||||||||
|
Interest
|
$
|
172.4
|
|
$
|
193.5
|
|
$
|
238.3
|
|
|||
|
Income taxes, net of refunds
|
$
|
408.6
|
|
$
|
159.8
|
|
$
|
162.3
|
|
|||
See accompanying notes to Consolidated Financial Statements.
F-7
NOTES TO CONSOLIDATED FINANCIAL STATEMENTS
Ingersoll-Rand plc (Plc or Parent Company), a public limited company incorporated in Ireland in 2009, and its consolidated subsidiaries (collectively, we, our, the Company) is a diversified, global company that provides products, services and solutions to enhance the quality and comfort of air in homes and buildings, transport and protect food and perishables, and increase industrial productivity and efficiency. Our business segments consist of Climate and Industrial, both with strong brands and leading positions within their respective markets. We generate revenue and cash primarily through the design, manufacture, sale and service of a diverse portfolio of industrial and commercial products that include well-recognized, premium brand names such as Ingersoll-Rand
®
, Trane
®
, Thermo King
®
, American Standard
®
, ARO
®
, and Club Car
®
.
A summary of significant accounting policies used in the preparation of the accompanying Consolidated Financial Statements follows:
Basis of Presentation:
The accompanying Consolidated Financial Statements reflect the consolidated operations of the Company and have been prepared in accordance with U.S. Generally Accepted Accounting Principles (GAAP) as defined by the Financial Accounting Standards Board (FASB) within the FASB Accounting Standards Codification (ASC). In the opinion of management, the accompanying consolidated financial statements contain all adjustments, which include normal recurring adjustments, necessary to present fairly the consolidated results for the periods presented. Intercompany accounts and transactions have been eliminated. The assets, liabilities, results of operations and cash flows of all discontinued operations have been separately reported as discontinued operations for all periods presented.
The Consolidated Financial Statements include all majority-owned subsidiaries of the Company. A noncontrolling interest in a subsidiary is considered an ownership interest in a majority-owned subsidiary that is not attributable to the parent. The Company includes Noncontrolling interest as a component of Total equity in the Consolidated Balance Sheet and the Net earnings attributable to noncontrolling interests are presented as an adjustment from Net earnings used to arrive at Net earnings attributable to Ingersoll-Rand plc in the Consolidated Statement of Comprehensive Income. Partially-owned equity affiliates represent
20
-
50
% ownership interests in investments where the Company demonstrates significant influence, but does not have a controlling financial interest. Partially-owned equity affiliates are accounted for under the equity method.
Use of Estimates:
The preparation of financial statements in conformity with GAAP requires management to make estimates and assumptions that affect the reported amounts of assets and liabilities and the disclosures of contingent assets and liabilities at the date of the financial statements as well as the reported amounts of revenues and expenses during the reporting period. Estimates are based on several factors including the facts and circumstances available at the time the estimates are made, historical experience, risk of loss, general economic conditions and trends, and the assessment of the probable future outcome. Actual results could differ from those estimates. Estimates and assumptions are reviewed periodically, and the effects of changes, if any, are reflected in the statement of operations in the period that they are determined.
Currency Translation:
Assets and liabilities of non-U.S. subsidiaries, where the functional currency is not the U.S. dollar, have been translated at year-end exchange rates, and income and expense accounts have been translated using average exchange rates throughout the year. Adjustments resulting from the process of translating an entity’s financial statements into the U.S. dollar have been recorded in the Equity section of the Consolidated Balance Sheet within Accumulated other comprehensive income (loss). Transactions that are denominated in a currency other than an entity’s functional currency are subject to changes in exchange rates with the resulting gains and losses recorded within Net earnings.
Cash and Cash Equivalents:
Cash and cash equivalents include cash on hand, demand deposits and all highly liquid investments with original maturities at the time of purchase of three months or less. The Company maintains amounts on deposit at various financial institutions, which may at times exceed federally insured limits. However, management periodically evaluates the credit-worthiness of those institutions and has not experienced any losses on such deposits.
Inventories:
Depending on the business, U.S. inventories are stated at the lower of cost or market using the last-in, first-out (LIFO) method or the lower of cost or market using the first-in, first-out (FIFO) method. Non-U.S. inventories are primarily stated at the lower of cost or market using the FIFO method. At
December 31, 2015
and
2014
, approximately
51%
and
52%
, respectively, of all inventory utilized the LIFO method.
Allowance for Doubtful Accounts
: The Company maintains an allowance for doubtful accounts receivable which represents the best estimate of probable loss inherent in the Company's accounts receivable portfolio. This estimate is based upon a two-step policy that results in the total recorded allowance for doubtful accounts. The first step is to record a portfolio reserve based on the aging of the outstanding accounts receivable portfolio and the Company's historical experience with the Company's end markets, customer base and products. The second step is to create a specific reserve for significant accounts as to which the customer's
F-8
ability to satisfy their financial obligation to the Company is in doubt due to circumstances such as bankruptcy, deteriorating operating results or financial position. In these circumstances, management uses its judgment to record an allowance based on the best estimate of probable loss, factoring in such considerations as the market value of collateral, if applicable. Actual results could differ from those estimates. These estimates and assumptions are reviewed periodically, and the effects of changes, if any, are reflected in the Consolidated Statement of Comprehensive Income in the period that they are determined. The Company reserved $
28.3 million
and $
34.1 million
for doubtful accounts as of
December 31, 2015
and
2014
, respectively.
Property, Plant and Equipment:
Property, plant and equipment are stated at cost, less accumulated depreciation. Assets placed in service are recorded at cost and depreciated using the straight-line method over the estimated useful life of the asset except for leasehold improvements, which are depreciated over the shorter of their economic useful life or their lease term. The range of useful lives used to depreciate property, plant and equipment is as follows:
|
Buildings
|
10
|
to
|
50
|
years
|
|
Machinery and equipment
|
2
|
to
|
12
|
years
|
|
Software
|
2
|
to
|
7
|
years
|
Major expenditures for replacements and significant improvements that increase asset values and extend useful lives are also capitalized. Capitalized costs are amortized over their estimated useful lives using the straight-line method. Repairs and maintenance expenditures that do not extend the useful life of the asset are charged to expense as incurred. The carrying amounts of assets that are sold or retired and the related accumulated depreciation are removed from the accounts in the year of disposal, and any resulting gain or loss is reflected within current earnings.
Per ASC 360, "Property, Plant, and Equipment," (ASC 360) the Company assesses the recoverability of the carrying value of its property, plant and equipment whenever events or changes in circumstances indicate that the carrying amount of the asset may not be recoverable. Recoverability is measured by a comparison of the carrying amount of an asset to the future net undiscounted cash flows expected to be generated by the asset. If the undiscounted cash flows are less than the carrying amount of the asset, an impairment loss is recognized for the amount by which the carrying value of the asset exceeds the fair value of the assets.
Goodwill and Intangible Assets:
The Company records as goodwill the excess of the purchase price over the fair value of the net assets acquired. In accordance with ASC 350, "Intangibles-Goodwill and Other," (ASC 350) goodwill and other indefinite-lived intangible assets are tested and reviewed annually for impairment during the fourth quarter or whenever there is a significant change in events or circumstances that indicate that the fair value of the asset is more likely than not less than the carrying amount of the asset.
Recoverability of goodwill is measured at the reporting unit level and begins with a qualitative assessment to determine, if it is more likely than not that the fair value of each reporting unit is less than its carrying amount as a basis for determining whether it is necessary to perform the two-step goodwill impairment test under ASC 350. For those reporting units where it is required, the first step compares the carrying amount of the reporting unit to its estimated fair value. If the estimated fair value of a reporting unit exceeds its carrying amount, goodwill of the reporting unit is not impaired and the second step of the impairment test is not necessary. To the extent that the carrying value of the reporting unit exceeds its estimated fair value, a second step is performed, wherein the reporting unit's carrying value of goodwill is compared to the implied fair value of goodwill. To the extent that the carrying value exceeds the implied fair value, impairment exists and must be recognized.
Intangible assets such as patents, customer-related intangible assets and other intangible assets with finite useful lives are amortized on a straight-line basis over their estimated economic lives. The weighted-average useful lives approximate the following:
|
Customer relationships
|
20
|
years
|
|
Completed technology/patents
|
10
|
years
|
|
Other
|
20
|
years
|
The Company assesses the recoverability of the carrying value of its intangible assets with finite useful lives whenever events or changes in circumstances indicate that the carrying amount of the asset may not be recoverable. Recoverability is measured by a comparison of the carrying amount of an asset to the future net undiscounted cash flows expected to be generated by the asset. If the undiscounted cash flows are less than the carrying amount of the asset, an impairment loss is recognized for the amount by which the carrying value of the asset exceeds the fair value of the assets.
Income Taxes:
Deferred tax assets and liabilities are determined based on temporary differences between financial reporting and tax bases of assets and liabilities, applying enacted tax rates expected to be in effect for the year in which the differences are expected to reverse. The Company recognizes future tax benefits, such as net operating losses and non-U.S. tax credits, to the extent that realizing these benefits is considered in its judgment to be more likely than not. The Company regularly reviews the recoverability of its deferred tax assets considering its historic profitability, projected future taxable income, timing of the reversals
F-9
of existing temporary differences and the feasibility of its tax planning strategies. Where appropriate, the Company records a valuation allowance with respect to a future tax benefit.
Product Warranties:
Standard product warranty accruals are recorded at the time of sale and are estimated based upon product warranty terms and historical experience. The Company assesses the adequacy of its liabilities and will make adjustments as necessary based on known or anticipated warranty claims, or as new information becomes available.
The Company's extended warranty liability represents the deferred revenue associated with its extended warranty contracts and is amortized into Revenue on a straight-line basis over the life of the contract, unless another method is more representative of the costs incurred. The Company assesses the adequacy of its liability by evaluating the expected costs under its existing contracts to ensure these expected costs do not exceed the extended warranty liability.
Treasury Stock:
The Company, through one of its consolidated subsidiaries, has repurchased its common shares from time to time as authorized by the Board of Directors. These repurchases are at the discretion of management subject to market conditions, regulatory requirements and other considerations. Amounts are recorded at cost and included within the Equity section of the Consolidated Balance Sheet.
Revenue Recognition:
Revenue is recognized and earned when all of the following criteria are satisfied: (a) persuasive evidence of a sales arrangement exists; (b) the price is fixed or determinable; (c) collectability is reasonably assured; and (d) delivery has occurred or service has been rendered. Delivery generally occurs when the title and the risks and rewards of ownership have substantially transferred to the customer. Both the persuasive evidence of a sales arrangement and fixed or determinable price criteria are deemed to be satisfied upon receipt of an executed and legally binding sales agreement or contract that clearly defines the terms and conditions of the transaction including the respective obligations of the parties. If the defined terms and conditions allow variability in all or a component of the price, revenue is not recognized until such time that the price becomes fixed or determinable. At the point of sale, the Company validates that existence of an enforceable claim that requires payment within a reasonable amount of time and assesses the collectability of that claim. If collectability is not deemed to be reasonably assured, then revenue recognition is deferred until such time that collectability becomes probable or cash is received. Delivery is not considered to have occurred until the customer has taken title and assumed the risks and rewards of ownership. Service and installation revenue are recognized when earned. In some instances, customer acceptance provisions are included in sales arrangements to give the buyer the ability to ensure the delivered product or service meets the criteria established in the order. In these instances, revenue recognition is deferred until the acceptance terms specified in the arrangement are fulfilled through customer acceptance or a demonstration that established criteria have been satisfied. If uncertainty exists about customer acceptance, revenue is not recognized until acceptance has occurred.
The Company offers various sales incentive programs to customers, dealers, and distributors. Sales incentive programs do not preclude revenue recognition, but do require an accrual for the Company's best estimate of expected activity. Examples of the sales incentives that are accrued for as a contra receivable and sales deduction at the point of sale include, but are not limited to, discounts (i.e. net 30 type), coupons, and rebates where the customer does not have to provide any additional requirements to receive the discount. Sales returns and customer disputes involving a question of quantity or price are also accounted for as a reduction in revenue and a contra receivable. At
December 31, 2015
and
2014
, the Company had a customer claim accrual (contra receivable) of
$4.0 million
and
$4.7 million
, respectively. All other incentives or incentive programs where the customer is required to reach a certain sales level, remain a customer for a certain period of time, provide a rebate form or is subject to additional requirements are accounted for as a reduction of revenue and establishment of a liability. At
December 31, 2015
and
2014
, the Company had a sales incentive accrual of
$83.2 million
and
$73.4 million
, respectively. Each of these accruals represents the best estimate the Company expects to pay related to previously sold units. These estimates are reviewed regularly for appropriateness. If updated information or actual amounts are different from previous estimates, the revisions are included in the results for the period in which they become known. Historically, the aggregate differences, if any, between the Company's estimates and actual amounts in any year have not had a material impact on the Consolidated Financial Statements.
The Company enters into maintenance and extended warranty contracts with customers. Revenue related to these services is recognized on a straight-line basis over the life of the contract, unless sufficient historical evidence indicates that the cost of providing these services is incurred on an other than straight-line basis. In these circumstances, revenue is recognized over the contract period in proportion to the costs expected to be incurred in performing the service.
The Company, primarily through its Climate segment, enters into construction-type contracts to design, deliver and build integrated HVAC solutions to meet customer specifications. The term of these types of contracts is typically less than one year, but can be as long as three years. Revenues related to these contracts are recognized using the percentage-of-completion method in accordance with GAAP. This measure of progress toward completion, utilized to recognize sales and profits, is based on the proportion of actual cost incurred to date as compared to the total estimate of contract costs at completion. The timing of revenue recognition often differs from the invoicing schedule to the customer, with revenue recognition in advance of customer invoicing recorded to unbilled accounts receivable and invoicing in advance of revenue recognition recorded to deferred revenue. At
December 31, 2015
, all recorded receivables (billed and unbilled) are due within one year. The Company re-evaluates its contract estimates
F-10
periodically and reflects changes in estimates in the current period using the cumulative catch-up method. These periodic reviews have not historically resulted in significant adjustments. If estimated contract costs are in excess of contract revenues, then the excess costs are accrued.
The Company enters into sales arrangements that contain multiple elements, such as equipment, installation and service revenue. For multiple element arrangements, each element is evaluated to determine the separate units of accounting. The total arrangement consideration is then allocated to the separate units of accounting based on their relative selling price at the inception of the arrangement. The relative selling price is determined using vendor specific objective evidence (VSOE) of selling price, if it exists; otherwise, third-party evidence (TPE) of selling price is used. If neither VSOE nor TPE of selling price exists for a deliverable, a best estimate of the selling price is developed for that deliverable. The Company primarily utilizes VSOE to determine its relative selling price. The Company recognizes revenue for delivered elements when the delivered item has stand-alone value to the customer, the basic revenue recognition criteria have been met, and only customary refund or return rights related to the delivered elements exist.
Environmental Costs:
The Company is subject to laws and regulations relating to protecting the environment. Environmental expenditures relating to current operations are expensed or capitalized as appropriate. Expenditures relating to existing conditions caused by past operations, which do not contribute to current or future revenues, are expensed. Liabilities for remediation costs are recorded when they are probable and can be reasonably estimated, generally no later than the completion of feasibility studies or the Company’s commitment to a plan of action. The assessment of this liability, which is calculated based on existing technology, does not reflect any offset for possible recoveries from insurance companies, and is not discounted.
Asbestos Matters
: Certain of our wholly-owned subsidiaries are named as defendants in asbestos-related lawsuits in state and federal courts. We record a liability for our actual and anticipated future claims as well as an asset for anticipated insurance settlements. Asbestos related defense costs are excluded from the asbestos claims liability and are recorded separately as services are incurred. None of our existing or previously-owned businesses were a producer or manufacturer of asbestos. We record certain income and expenses associated with our asbestos liabilities and corresponding insurance recoveries within discontinued operations, net of tax, as they relate to previously divested businesses, except for amounts associated with Trane U.S. Inc.’s asbestos liabilities and corresponding insurance recoveries which are recorded within continuing operations.
Research and Development Costs:
The Company conducts research and development activities for the purpose of developing and improving new products and services. These expenditures are expensed when incurred. For the years ended
December 31, 2015
,
2014
and
2013
, these expenditures amounted to approximately
$205.9 million
,
$212.3 million
and
$218.2 million
, respectively.
Software Costs:
The Company capitalizes certain qualified internal-use software costs during the application development stage and subsequently amortizes those costs over the software's useful life, which ranges from
2
to
7
years. The Company capitalizes costs, including interest, incurred to develop or acquire internal-use software. These costs are capitalized subsequent to the preliminary project stage once specific criteria are met. Costs incurred in the preliminary project planning stage are expensed. Other costs, such as maintenance and training, are also expensed as incurred. Capitalized costs are amortized over their estimated useful lives using the straight-line method.
Employee Benefit Plans
: The Company provides a range of benefits, including pensions, postretirement and postemployment benefits to eligible current and former employees. Determining the cost associated with such benefits is dependent on various actuarial assumptions, including discount rates, expected return on plan assets, compensation increases, employee mortality, turnover rates, and healthcare cost trend rates. Actuaries perform the required calculations to determine expense in accordance with GAAP. Actual results may differ from the actuarial assumptions and are generally accumulated into Accumulated other comprehensive income (loss) and amortized into Net earnings over future periods. The Company reviews its actuarial assumptions at each measurement date and makes modifications to the assumptions based on current rates and trends, if appropriate.
Loss Contingencies:
Liabilities are recorded for various contingencies arising in the normal course of business, including litigation and administrative proceedings, environmental matters, product liability, product warranty, worker’s compensation and other claims. The Company has recorded reserves in the financial statements related to these matters, which are developed using input derived from actuarial estimates and historical and anticipated experience data depending on the nature of the reserve, and in certain instances with consultation of legal counsel, internal and external consultants and engineers. Subject to the uncertainties inherent in estimating future costs for these types of liabilities, the Company believes its estimated reserves are reasonable and does not believe the final determination of the liabilities with respect to these matters would have a material effect on the financial condition, results of operations, liquidity or cash flows of the Company for any year.
Derivative Instruments:
The Company periodically enters into cash flow and other derivative transactions to specifically hedge exposure to various risks related to interest rates and currency rates. The Company recognizes all derivatives on the Consolidated Balance Sheet at their fair value as either assets or liabilities. For cash flow designated hedges, the effective portion of the changes in fair value of the derivative contract are recorded in Accumulated other comprehensive income (loss), net of taxes, and are
F-11
recognized in Net earnings at the time earnings are affected by the hedged transaction. For other derivative transactions, the changes in the fair value of the derivative contract are immediately recognized in Net earnings.
Recent Accounting Pronouncements
Recently Adopted Accounting Pronouncements
In November 2015, the FASB issued ASU 2015-17, "Balance Sheet Classification of Deferred Taxes" (ASU 2015-17). ASU 2015-17 requires that deferred income tax liabilities and assets be classified as noncurrent in a classified statement of financial position. The guidance is effective for annual periods beginning after December 15, 2016 and interim periods within those annual periods, with early adoption permitted. The amendments may be applied either prospectively to all deferred tax liabilities and assets or retrospectively to all periods presented. The Company elected to early adopt this standard prospectively to all deferred tax assets and liabilities beginning with the December 31, 2015 amounts presented. Prior periods presented were not retrospectively adjusted for this change.
In April 2014, the FASB issued Accounting Standards Update (ASU) 2014-08, “Presentation of Financial Statements and Property, Plant, and Equipment - Reporting Discontinued Operations and Disclosures of Disposals of Components of an Entity” (ASU 2014-08). ASU 2014-08 provides new guidance related to the definition of a discontinued operation and requires new disclosures of both discontinued operations and certain other disposals that do not meet the definition of a discontinued operation. This guidance is effective for annual periods beginning on or after December 15, 2014 and interim periods within those years. The Company will apply this guidance, as applicable, to future disposals of components or classifications as held for sale.
Recently Issued Accounting Pronouncements
In September 2015, the FASB issued ASU No. 2015-16, "Business Combinations (Topic 805): Simplifying the Accounting for Measurement Period Adjustments" (ASU 2015-16) which eliminates the requirement for an acquirer in a business combination to account for measurement period adjustments retrospectively. As a result, adjustments to provisional amounts that are identified during the measurement period are recognized in the reporting period in which the adjustment amounts are determined. ASU 2015-16 is effective for fiscal years beginning after December 15, 2015, including interim periods within those fiscal years, with early adoption permitted. The Company does not expect that the adoption of this guidance will have a material effect on its financial statements.
In May 2014, the FASB issued ASU 2014-09, “Revenue from Contracts with Customers” (ASU 2014-09). ASU 2014-09 provides new guidance related to how an entity should recognize revenue to depict the transfer of promised goods or services to customers in an amount that reflects the consideration to which the entity expects to be entitled in exchange for those goods or services. In August 2015, the FASB issued ASU 2015-14, “Deferral of the Effective Date," which defers the effective date to fiscal years, and interim periods within those years, beginning after December 15, 2017, with early application permitted only as of annual reporting periods beginning after December 15, 2016, including interim reporting periods within that reporting period. The amendments can be adopted either retrospectively to each prior reporting period presented or as a cumulative-effect adjustment as of the date of adoption. The Company is currently determining its implementation approach and assessing the impact on the financial statements.
In July 2015, the FASB issued ASU 2015-11, “Simplifying the Measurement of Inventory" (ASU 2015-11). ASU 2015-11 requires inventory that is recorded using the first in, first out method to be measured at the lower of cost or net realizable value. The guidance is effective for annual periods beginning after December 15, 2016 and interim periods within those annual periods. The amendments are to be applied prospectively with earlier application permitted as of the beginning of an interim or annual reporting period. The adoption of the new guidance is not expected to have a material impact on the Company’s financial statements.
In April 2015, the FASB issued ASU 2015-05, “Customer’s Accounting for Fees Paid in a Cloud Computing Arrangement,” (ASU 2015-05) which provides guidance about whether a cloud computing arrangement includes a software license and how to account for the license under each scenario. The guidance is effective for annual periods beginning after December 15, 2015 and interim periods within those annual periods. A reporting entity may apply the guidance prospectively to all arrangements entered into or materially modified after the effective date, or retrospectively to all prior periods presented in the financial statements. Early adoption is permitted. The adoption of the new guidance is not expected to have a material impact on the Company’s financial statements.
In April 2015, the FASB issued ASU 2015-03, “Simplifying the Presentation of Debt Issuance Costs,” (ASU 2015-03) which amends the current presentation of debt issuance costs in the financial statements. ASU 2015-03 requires that debt issuance costs related to a recognized debt liability be presented in the balance sheet as a direct deduction from the carrying amount of that debt liability, consistent with debt discounts, instead of as an asset. The amendments are to be applied retrospectively and are effective for public business entities for fiscal years, and for interim periods within those fiscal years, beginning after December 15, 2015, but early adoption is permitted. Debt issuance costs, net of accumulated amortization, totaled approximately $
24 million
and $
28
F-12
million
as of December 31, 2015 and December 31, 2014, respectively, and are presented within Other noncurrent assets on the Company’s financial statements.
At December 31, the major classes of inventory were as follows:
|
In millions
|
2015
|
2014
|
||||||
|
Raw materials
|
$
|
514.9
|
|
$
|
487.9
|
|
||
|
Work-in-process
|
131.0
|
|
118.2
|
|
||||
|
Finished goods
|
825.7
|
|
823.1
|
|
||||
|
1,471.6
|
|
1,429.2
|
|
|||||
|
LIFO reserve
|
(60.9
|
)
|
(70.3
|
)
|
||||
|
Total
|
$
|
1,410.7
|
|
$
|
1,358.9
|
|
||
The Company performs periodic assessments to determine the existence of obsolete, slow-moving and non-saleable inventories and records necessary provisions to reduce such inventories to net realizable value. Reserve balances, primarily related to obsolete and slow-moving inventories, were $
100.4 million
and $
85.1 million
at December 31, 2015 and December 31, 2014, respectively.
At December 31, the major classes of property, plant and equipment were as follows:
|
In millions
|
2015
|
2014
|
||||||
|
Land
|
$
|
61.7
|
|
$
|
62.9
|
|
||
|
Buildings
|
699.1
|
|
674.8
|
|
||||
|
Machinery and equipment
|
1,749.6
|
|
1,647.8
|
|
||||
|
Software
|
723.4
|
|
618.7
|
|
||||
|
3,233.8
|
|
3,004.2
|
|
|||||
|
Accumulated depreciation
|
(1,658.7
|
)
|
(1,527.2
|
)
|
||||
|
Total
|
$
|
1,575.1
|
|
$
|
1,477.0
|
|
||
Depreciation expense for the years ended
December 31, 2015
,
2014
and
2013
was
$209.5 million
,
$199.9 million
and
$199.5 million
, which include amounts for software amortization of
$41.9 million
,
$40.1 million
and
$44.3 million
, respectively.
The Company records as goodwill the excess of the purchase price over the fair value of the net assets acquired. Once the final valuation has been performed for each acquisition, adjustments may be recorded. Goodwill is tested and reviewed annually for impairment during the fourth quarter or whenever there is a significant change in events or circumstances that indicate that the fair value of the asset may be less than the carrying amount of the asset.
F-13
The changes in the carrying amount of Goodwill are as follows:
|
In millions
|
Climate
|
Industrial
|
Total
|
|||||||||
|
December 31, 2013 (gross)
|
$
|
7,663.6
|
|
$
|
373.0
|
|
$
|
8,036.6
|
|
|||
|
Acquisitions and adjustments
(1)
|
13.8
|
|
2.7
|
|
16.5
|
|
||||||
|
Currency translation
|
(158.5
|
)
|
(8.8
|
)
|
(167.3
|
)
|
||||||
|
December 31, 2014 (gross)
|
7,518.9
|
|
366.9
|
|
7,885.8
|
|
||||||
|
Acquisitions and adjustments
(2)
|
79.1
|
|
432.8
|
|
511.9
|
|
||||||
|
Currency translation
|
(149.4
|
)
|
(22.1
|
)
|
(171.5
|
)
|
||||||
|
December 31, 2015 (gross)
|
7,448.6
|
|
777.6
|
|
8,226.2
|
|
||||||
|
Accumulated impairment
(3)
|
(2,496.0
|
)
|
—
|
|
(2,496.0
|
)
|
||||||
|
Goodwill (net)
|
$
|
4,952.6
|
|
$
|
777.6
|
|
$
|
5,730.2
|
|
|||
(1)
Increase is primarily related to a $
15.0 million
acquisition in March of 2014 within the Climate segment and a $
3.0 million
acquisition in August of 2014 within the Industrial segment.
(2)
The increase in Climate segment goodwill is primarily related to the acquisition of FRIGOBLOCK in March 2015; the increase in Industrial segment goodwill is primarily related to the acquisition of the Engineered Centrifugal Compression business in January 2015. See Note 16 for further discussion of these acquisitions.
(3)
Accumulated impairment relates to a charge of $
2,496.0 million
recorded in the fourth quarter of 2008 as a result of the Company's annual impairment testing.
Indefinite-lived intangible assets are tested and reviewed annually for impairment during the fourth quarter or whenever there is a significant change in events or circumstances that indicate that the fair value of the asset may be less than the carrying amount of the asset. All other intangible assets with finite useful lives are being amortized on a straight-line basis over their estimated useful lives.
The following table sets forth the gross amount and related accumulated amortization of the Company’s intangible assets at December 31:
|
2015
|
2014
|
|||||||||||||||||||||||
|
In millions
|
Gross carrying amount
|
Accumulated amortization
|
Net carrying amount
|
Gross carrying amount
|
Accumulated amortization
|
Net carrying amount
|
||||||||||||||||||
|
Completed technologies/patents
|
$
|
214.9
|
|
$
|
(168.7
|
)
|
$
|
46.2
|
|
$
|
172.2
|
|
$
|
(146.8
|
)
|
$
|
25.4
|
|
||||||
|
Customer relationships
|
2,019.8
|
|
(811.5
|
)
|
1,208.3
|
|
1,850.6
|
|
(699.8
|
)
|
1,150.8
|
|
||||||||||||
|
Other
|
63.5
|
|
(45.7
|
)
|
17.8
|
|
55.9
|
|
(50.2
|
)
|
5.7
|
|
||||||||||||
|
Total finite-lived intangible assets
|
$
|
2,298.2
|
|
$
|
(1,025.9
|
)
|
$
|
1,272.3
|
|
$
|
2,078.7
|
|
$
|
(896.8
|
)
|
$
|
1,181.9
|
|
||||||
|
Trademarks (indefinite-lived)
|
2,653.8
|
|
—
|
|
2,653.8
|
|
2,602.0
|
|
—
|
|
2,602.0
|
|
||||||||||||
|
Total
|
$
|
4,952.0
|
|
$
|
(1,025.9
|
)
|
$
|
3,926.1
|
|
$
|
4,680.7
|
|
$
|
(896.8
|
)
|
$
|
3,783.9
|
|
||||||
Intangible asset amortization expense for
2015
,
2014
and
2013
was
$150.2 million
,
$128.3 million
and
$128.9 million
, respectively. Future estimated amortization expense on existing intangible assets in each of the next five years amounts to approximately
$113 million
for 2016,
$111 million
for 2017,
$109 million
for 2018,
$108 million
for 2019, and
$107 million
for 2020.
At December 31, short-term borrowings and current maturities of long-term debt consisted of the following:
|
In millions
|
2015
|
2014
|
||||||
|
Debentures with put feature
|
$
|
343.0
|
|
$
|
343.0
|
|
||
|
Commercial Paper
|
143.0
|
|
100.0
|
|
||||
|
Other current maturities of long-term debt
|
7.8
|
|
23.6
|
|
||||
|
Short-term borrowings
|
10.4
|
|
16.1
|
|
||||
|
Total
|
$
|
504.2
|
|
$
|
482.7
|
|
||
F-14
The weighted-average interest rate for total short-term borrowings and current maturities of long-term debt at
December 31, 2015
and
2014
was
4.8%
and
5.2%
, respectively.
At December 31, long-term debt excluding current maturities consisted of:
|
In millions
|
2015
|
2014
|
||||||
|
6.875% Senior notes due 2018
|
$
|
749.7
|
|
$
|
749.6
|
|
||
|
2.875% Senior notes due 2019
|
349.7
|
|
349.6
|
|
||||
|
2.625% Senior notes due 2020
|
299.9
|
|
299.8
|
|
||||
|
9.000% Debentures due 2021
|
125.0
|
|
125.0
|
|
||||
|
4.250% Senior notes due 2023
|
699.0
|
|
698.9
|
|
||||
|
7.200% Debentures due 2016-2025
|
67.5
|
|
75.0
|
|
||||
|
3.550% Senior notes due 2024
|
497.4
|
|
497.2
|
|
||||
|
6.48% Debentures due 2025
|
149.7
|
|
149.7
|
|
||||
|
5.750% Senior notes due 2043
|
498.0
|
|
498.0
|
|
||||
|
4.650% Senior notes due 2044
|
298.3
|
|
298.2
|
|
||||
|
Other loans and notes, at end-of-year average interest rates of 2.58% in 2015 and
1.08% in 2014, maturing in various amounts to 2020
|
0.6
|
|
0.7
|
|
||||
|
Total
|
$
|
3,734.8
|
|
$
|
3,741.7
|
|
||
The carrying value of the Company's short-term borrowings is a reasonable estimate of fair value due to the short-term nature of the instruments. The fair value of the Company's debt instruments at
December 31, 2015
and
December 31, 2014
was
$4,494.3 million
and $
4,661.4 million
, respectively. The Company measures the fair value of its long-term debt instruments based upon observable market prices quoted on public exchanges for similar assets. These fair value inputs are considered Level 2 within the fair value hierarchy discussed in Note 10.
Scheduled maturities of long-term debt as of
December 31, 2015
are as follows:
|
In millions
|
|
||
|
2016
|
$
|
350.8
|
|
|
2017
|
7.8
|
|
|
|
2018
|
757.5
|
|
|
|
2019
|
357.3
|
|
|
|
2020
|
307.4
|
|
|
|
Thereafter
|
2,304.8
|
|
|
|
Total
|
$
|
4,085.6
|
|
Commercial Paper Program
The Company uses borrowings under the commercial paper program for general corporate purposes. The maximum aggregate amount of unsecured commercial paper notes available to be issued, on a private placement basis, under the commercial paper program is $
2 billion
as of
December 31, 2015
. Under the commercial paper program, the Company may issue notes from time to time through Ingersoll-Rand Global Holding Company Limited or Ingersoll-Rand Luxembourg Finance S.A. Each of Ingersoll-Rand plc, Ingersoll-Rand International Holding Limited, Ingersoll-Rand Lux International Holding Company S.à.r.l., Ingersoll-Rand Global Holding Company Limited and Ingersoll-Rand Company provided irrevocable and unconditional guarantees for the notes issued under the commercial paper program. The Company had $
143.0 million
and $
100.0 million
of commercial paper outstanding at
December 31, 2015
and
December 31, 2014
, respectively.
Debentures with Put Feature
At
December 31, 2015
and
December 31, 2014
, the Company had outstanding
$343.0 million
of fixed rate debentures which only require early repayment at the option of the holder. These debentures contain a put feature that the holders may exercise on each anniversary of the issuance date. If exercised, the Company is obligated to repay in whole or in part, at the holder’s option, the outstanding principal amount (plus accrued and unpaid interest) of the debentures held by the holder. If these options are not exercised, the final maturity dates would range between
2027
and
2028
.
Holders of these debentures had the option to exercise the put feature on $
37.2 million
of the outstanding debentures in February 2015, subject to the notice requirement. No material exercises were made. Holders of the remaining $
305.8 million
in outstanding
F-15
debentures had the option to exercise the put feature, subject to the notice requirement, in November 2015. No material exercises were made.
Senior Notes due 2020, 2024, and 2044
In October 2014, the Company issued $
1.1 billion
principal amount of Senior Notes in three tranches through a newly-created wholly-owned subsidiary, Ingersoll-Rand Luxembourg Finance S.A. The tranches consist of $
300 million
of
2.625%
Senior Notes due in 2020, $
500 million
of
3.55%
Senior Notes due 2024, and $
300 million
of
4.65%
Senior Notes due in 2044. The notes are fully and unconditionally guaranteed by each of Ingersoll-Rand plc, Ingersoll-Rand International Holding Limited, Ingersoll-Rand Lux International Holding Company S.à.r.l., Ingersoll-Rand Global Holding Company Limited and Ingersoll-Rand Company. Interest on the notes is paid twice a year in arrears. The Company has the option to redeem the notes in whole or in part at any time, prior to their stated maturity date at redemption prices set forth in the indenture agreement. The notes are subject to certain customary covenants, however, none of these covenants are considered restrictive to the Company’s operations.
The proceeds from the notes were primarily used to fund the October 2014 redemption of the $
200 million
of
5.50%
Notes due 2015 and $
300 million
4.75%
Senior Notes due 2015, as well as fund the acquisition of the Engineered Centrifugal Compression business. Related to the redemption, the Company recognized $
10.2 million
of premium expense in Interest expense in 2014.
Senior Notes due 2019, 2023, and 2043
In June 2013, the Company issued $
1.55 billion
principal amount of Senior Notes in three tranches through the Company's wholly-owned subsidiary, Ingersoll-Rand Global Holding Company Limited pursuant to Rule 144A of the Securities Act. The tranches consist of $
350 million
of
2.875%
Senior Notes due in 2019, $
700 million
of
4.250%
Senior Notes due in 2023, and $
500 million
of
5.750%
Senior Notes due in 2043. The notes are fully and unconditionally guaranteed by each of Ingersoll-Rand plc, Ingersoll-Rand International Holding Limited, Ingersoll-Rand Lux International Holding Company S.à.r.l. and Ingersoll-Rand Luxembourg Finance S.A. Later in 2013, the notes were modified to include Ingersoll-Rand Company. Interest on the notes is paid twice a year in arrears. The Company has the option to redeem the notes in whole or in part at any time, prior to their stated maturity date at redemption prices set forth in the indenture agreement. The notes are subject to certain customary covenants, however, none of these covenants are considered restrictive to the Company’s operations.
The proceeds from these notes were primarily used to fund the July 2013 redemption of $
600 million
of
6.000%
Senior Notes due 2013 and $
655 million
of
9.500%
Senior Notes due 2014 and to fund expenses related to the spin-off of the commercial and residential security businesses. The July 2013 redemption resulted in $
45.6 million
of premium expense, which was recorded in 2013 in Interest expense.
In connection with the issuance of each series of notes, Ingersoll-Rand Global Holding Company Limited, the guarantors and the initial purchasers of the notes entered into a Registration Rights Agreement. Each Registration Rights Agreement required Ingersoll-Rand Global Holding Company Limited and the Guarantors to use their commercially reasonable efforts to execute an effective exchange offer registration statement with the SEC no later than 365 days after the closing date of the notes offering and to complete an exchange offer within 30 business days of such effective date. The Company filed its exchange offer in April 2014, and in June 2014, completed the exchange of the notes for registered notes having terms identical in all material respects to the private notes, except that the registered notes do not contain terms with respect to transfer restrictions, registration rights or additional interest for failure to observe certain obligations in the applicable registration rights agreement.
Other Credit Facilities
On March 20, 2014, the Company entered into an unsecured 5-year, $
1.0 billion
revolving credit facility through the Company's wholly-owned subsidiary, Ingersoll-Rand Global Holding Company Limited. The credit facility matures in March 2019 and replaced the prior credit facility of $
1.0 billion
which was due to expire in 2015. The Company also has a 5-year, $
1.0 billion
revolving credit facility through Ingersoll-Rand Global Holding Company Limited that matures in March 2017. During the fourth quarter of 2014, both credit agreements were amended to include Ingersoll-Rand Lux International Holding Company S.à.r.l. as an additional borrower.
Ingersoll-Rand plc, Ingersoll-Rand International Holding Limited, Ingersoll-Rand Lux International Holding Company S.à.r.l., Ingersoll-Rand Global Holding Company Limited, Ingersoll-Rand Company and Ingersoll-Rand Luxembourg Finance S.A. have each provided irrevocable and unconditional guarantees for these credit facilities. The total committed revolving credit facilities of $
2.0 billion
are unused and provide support for the Company's commercial paper program, as well as other general corporate purposes.
The Company also has various non-U.S. lines of credit that provide aggregate borrowing capacity of $
948.8 million
, of which $
698.7 million
was unused at
December 31, 2015
. These lines provide support for bank guarantees, letters of credit and other general corporate purposes.
F-16
Guarantees
Along with Ingersoll-Rand plc, certain of the Company's 100% directly or indirectly owned subsidiaries have fully and unconditionally guaranteed, on a joint and several basis, public debt issued by other 100% directly or indirectly owned subsidiaries. Refer to Note 20 for the Company's current guarantor structure.
In the normal course of business, the Company uses various financial instruments, including derivative instruments, to manage the risks associated with interest rate and currency rate exposures. These financial instruments are not used for trading or speculative purposes.
On the date a derivative contract is entered into, the Company designates the derivative instrument as a cash flow hedge of a forecasted transaction or as an undesignated derivative. The Company formally documents its hedge relationships, including identification of the derivative instruments and the hedged items, as well as its risk management objectives and strategies for undertaking the hedge transaction. This process includes linking derivative instruments that are designated as hedges to specific assets, liabilities or forecasted transactions.
The Company assesses at inception and at least quarterly thereafter, whether the derivatives used in cash flow hedging transactions are highly effective in offsetting the changes in the cash flows of the hedged item. To the extent the derivative is deemed to be a highly effective hedge, the fair market value changes of the instrument are recorded to Accumulated other comprehensive income (AOCI). Any ineffective portion of a derivative instrument’s change in fair value is recorded in Net earnings in the period of change. If the hedging relationship ceases to be highly effective, or it becomes probable that a forecasted transaction is no longer expected to occur, the hedging relationship will be undesignated and any future gains and losses on the derivative instrument will be recorded in Net earnings.
The fair market value of derivative instruments is determined through market-based valuations and may not be representative of the actual gains or losses that will be recorded when these instruments mature due to future fluctuations in the markets in which they are traded.
Currency Hedging Instruments
The notional amount of the Company’s currency derivatives was $
1,094.9 million
and $
776.7 million
at
December 31, 2015
and
2014
, respectively. At
December 31, 2015
and
2014
, a gain of $
0.5 million
and a loss of $
1.9 million
, net of tax, respectively, was included in AOCI related to the fair value of the Company’s currency derivatives designated as accounting hedges. The amount expected to be reclassified into Net earnings over the next twelve months is a gain of $
0.5 million
. The actual amounts that will be reclassified to Net earnings may vary from this amount as a result of changes in market conditions. Gains and losses associated with the Company’s currency derivatives not designated as hedges are recorded in Net earnings as changes in fair value occur. At
December 31, 2015
, the maximum term of the Company’s currency derivatives was approximately
12
months.
Other Derivative Instruments
The Company has utilized forward-starting interest rate swaps and interest rate locks to manage interest rate exposure in periods prior to the anticipated issuance of fixed-rate debt. These instruments have been designated as cash flow hedges and have a notional amount of $
1,250.0 million
at
December 31, 2015
and
2014
. Consequently, when the contracts were settled upon the issuance of the underlying debt, any realized gains or losses in the fair values of the instruments were initially deferred into Accumulated other comprehensive income. These deferred gains or losses are subsequently recognized into Interest expense over the term of the related notes. The net unrecognized gain in AOCI was $
5.5 million
and $
4.9 million
at
December 31, 2015
and
2014
. The deferred gain at
December 31, 2015
will be amortized over the term of notes with maturities ranging from 2018 to 2044. The amount expected to be amortized over the next twelve months is a net loss of $
0.5 million
. There were no forward-starting interest rate swaps or interest rate lock contracts outstanding at
December 31, 2015
or
2014
.
F-17
The fair values of derivative instruments included within the Consolidated Balance Sheet as of
December 31
were as follows:
|
|
Asset derivatives
|
Liability derivatives
|
||||||||||||||
|
In millions
|
2015
|
2014
|
2015
|
2014
|
||||||||||||
|
Derivatives designated as hedges:
|
||||||||||||||||
|
Currency derivatives
|
$
|
0.6
|
|
$
|
0.3
|
|
$
|
0.2
|
|
$
|
3.2
|
|
||||
|
Derivatives not designated as hedges:
|
||||||||||||||||
|
Currency derivatives
|
4.4
|
|
1.3
|
|
12.4
|
|
10.1
|
|
||||||||
|
Total derivatives
|
$
|
5.0
|
|
$
|
1.6
|
|
$
|
12.6
|
|
$
|
13.3
|
|
||||
Asset and liability derivatives included in the table above are recorded within Other current assets and Accrued expenses and other current liabilities, respectively.
The amounts associated with derivatives designated as hedges affecting Net earnings and AOCI for the years ended
December 31
were as follows:
|
|
Amount of gain (loss)
recognized in AOCI
|
Location of gain (loss) reclassified from AOCI and recognized into Net earnings
|
Amount of gain (loss) reclassified from AOCI and recognized into Net earnings
|
|||||||||||||||||||||||
|
In millions
|
2015
|
2014
|
2013
|
2015
|
2014
|
2013
|
||||||||||||||||||||
|
Currency derivatives - continuing
|
$
|
1.2
|
|
$
|
(3.0
|
)
|
$
|
(9.8
|
)
|
Cost of goods sold
|
$
|
(2.1
|
)
|
$
|
(3.4
|
)
|
$
|
(10.8
|
)
|
|||||||
|
Currency derivatives - discontinued
|
—
|
|
—
|
|
2.0
|
|
Discontinued operations
|
—
|
|
—
|
|
1.1
|
|
|||||||||||||
|
Interest rate swaps & locks
|
—
|
|
(0.1
|
)
|
10.5
|
|
Interest expense
|
(0.5
|
)
|
(2.3
|
)
|
(2.4
|
)
|
|||||||||||||
|
Total
|
$
|
1.2
|
|
$
|
(3.1
|
)
|
$
|
2.7
|
|
|
$
|
(2.6
|
)
|
$
|
(5.7
|
)
|
$
|
(12.1
|
)
|
|||||||
The amounts associated with derivatives not designated as hedges affecting Net earnings for the years ended
December 31
were as follows:
|
In millions
|
Location of gain (loss) recognized in Net earnings
|
Amount of gain (loss) recognized in Net earnings
|
||||||||||||
|
2015
|
2014
|
2013
|
||||||||||||
|
Currency derivatives
|
Other income/(expense), net
|
$
|
0.1
|
|
$
|
(31.5
|
)
|
$
|
(42.2
|
)
|
||||
|
Total
|
|
$
|
0.1
|
|
$
|
(31.5
|
)
|
|
$
|
(42.2
|
)
|
|||
The gains and losses associated with the Company’s undesignated currency derivatives are materially offset in Net earnings by changes in the fair value of the underlying transactions.
Concentration of Credit Risk
The counterparties to the Company’s forward contracts consist of a number of investment grade major international financial institutions. The Company could be exposed to losses in the event of nonperformance by the counterparties. However, the credit ratings and the concentration of risk in these financial institutions are monitored on a continuous basis and present no significant credit risk to the Company.
ASC 820, "Fair Value Measurement," (ASC 820) defines fair value as the price that would be received to sell an asset or paid to transfer a liability in an orderly transaction between market participants at the measurement date. ASC 820 also establishes a three-level fair value hierarchy that prioritizes information used in developing assumptions when pricing an asset or liability as follows:
|
•
|
Level 1:
Observable inputs such as quoted prices in active markets;
|
|
•
|
Level 2:
Inputs, other than quoted prices in active markets, that are observable either directly or indirectly; and
|
|
•
|
Level 3:
Unobservable inputs where there is little or no market data, which requires the reporting entity to develop its own assumptions.
|
ASC 820 requires the use of observable market data, when available, in making fair value measurements. When inputs used to measure fair value fall within different levels of the hierarchy, the level within which the fair value measurement is categorized is based on the lowest level input that is significant to the fair value measurement.
The following table presents the Company’s fair value hierarchy for those assets and liabilities measured at fair value on a recurring basis as of December 31, 2015:
F-18
|
In Millions
|
Fair Value
|
Fair value measurements
|
|||||||||||||
|
Level 1
|
Level 2
|
Level 3
|
|||||||||||||
|
Assets:
|
|||||||||||||||
|
Derivative instruments
|
$
|
5.0
|
|
$
|
—
|
|
$
|
5.0
|
|
$
|
—
|
|
|||
|
Liabilities:
|
|||||||||||||||
|
Derivative instruments
|
$
|
12.6
|
|
$
|
—
|
|
$
|
12.6
|
|
$
|
—
|
|
|||
The following table presents the Company’s fair value hierarchy for those assets and liabilities measured at fair value on a recurring basis as of December 31, 2014:
|
In Millions
|
Fair Value
|
Fair value measurements
|
|||||||||||||
|
Level 1
|
Level 2
|
Level 3
|
|||||||||||||
|
Assets:
|
|||||||||||||||
|
Derivative instruments
|
$
|
1.6
|
|
$
|
—
|
|
$
|
1.6
|
|
$
|
—
|
|
|||
|
Liabilities:
|
|||||||||||||||
|
Derivative instruments
|
$
|
13.3
|
|
$
|
—
|
|
$
|
13.3
|
|
$
|
—
|
|
|||
The Company determines the fair value of its financial assets and liabilities using the following methodologies:
|
•
|
Derivative instruments - These instruments include forward foreign currency contracts and instruments related to non-functional currency balance sheet exposures. The fair value of the derivative instruments are determined based on a pricing model that uses spot rates and forward prices from actively quoted currency markets that are readily accessible and observable.
|
The carrying values of cash and cash equivalents, accounts receivable, and accounts payable are a reasonable estimate of their fair value due to the short-term nature of these instruments. These methodologies used by the Company to determine the fair value of its financial assets and liabilities at December 31, 2015 are the same as those used at December 31, 2014. There have been no transfers between levels of the fair value hierarchy. See Note 7 for a discussion of the fair value measurement of the Company's debt instruments and Note 10 for a discussion of the fair value measurement of the Company's pension assets and liabilities.
The Company sponsors several U.S. defined benefit and defined contribution plans covering substantially all of the Company's U.S. employees. Additionally, the Company has many non-U.S. defined benefit and defined contribution plans covering eligible non-U.S. employees. Postretirement benefits, other than pensions, provide healthcare benefits, and in some instances, life insurance benefits for certain eligible employees.
Pension Plans
The noncontributory defined benefit pension plans covering eligible non-collectively bargained U.S. employees provide benefits on a final average pay formula while plans for most collectively bargained U.S. employees provide benefits on a flat dollar benefit formula or a percentage of pay formula. The non-U.S. pension plans generally provide benefits based on earnings and years of service. The Company also maintains additional other supplemental plans for officers and other key or highly compensated employees.
F-19
The following table details information regarding the Company’s pension plans at December 31:
|
In millions
|
2015
|
2014
|
||||||
|
Change in benefit obligations:
|
||||||||
|
Benefit obligation at beginning of year
|
$
|
3,719.6
|
|
$
|
3,333.2
|
|
||
|
Service cost
|
75.2
|
|
68.7
|
|
||||
|
Interest cost
|
129.5
|
|
147.2
|
|
||||
|
Employee contributions
|
1.0
|
|
1.2
|
|
||||
|
Amendments
|
6.8
|
|
9.2
|
|
||||
|
Actuarial (gains) losses
|
(153.4
|
)
|
448.3
|
|
||||
|
Benefits paid
|
(191.8
|
)
|
(215.3
|
)
|
||||
|
Currency translation
|
(50.0
|
)
|
(57.8
|
)
|
||||
|
Curtailments and settlements
|
(3.5
|
)
|
(4.1
|
)
|
||||
|
Other, including expenses paid
|
(9.6
|
)
|
(11.0
|
)
|
||||
|
Benefit obligation at end of year
|
$
|
3,523.8
|
|
$
|
3,719.6
|
|
||
|
Change in plan assets:
|
||||||||
|
Fair value at beginning of year
|
$
|
3,018.6
|
|
$
|
2,779.2
|
|
||
|
Actual return on assets
|
(43.0
|
)
|
395.2
|
|
||||
|
Company contributions
|
35.6
|
|
116.5
|
|
||||
|
Employee contributions
|
1.0
|
|
1.2
|
|
||||
|
Benefits paid
|
(191.8
|
)
|
(215.3
|
)
|
||||
|
Currency translation
|
(33.8
|
)
|
(43.1
|
)
|
||||
|
Settlements
|
(3.5
|
)
|
(4.1
|
)
|
||||
|
Other, including expenses paid
|
(11.1
|
)
|
(11.0
|
)
|
||||
|
Fair value of assets end of year
|
$
|
2,772.0
|
|
$
|
3,018.6
|
|
||
|
Net unfunded liability
|
$
|
(751.8
|
)
|
$
|
(701.0
|
)
|
||
|
Amounts included in the balance sheet:
|
||||||||
|
Other noncurrent assets
|
$
|
2.7
|
|
$
|
11.5
|
|
||
|
Accrued compensation and benefits
|
(11.0
|
)
|
(11.3
|
)
|
||||
|
Postemployment and other benefit liabilities
|
(743.5
|
)
|
(701.2
|
)
|
||||
|
Net amount recognized
|
$
|
(751.8
|
)
|
$
|
(701.0
|
)
|
||
It is the Company’s objective to contribute to the pension plans to ensure adequate funds, and no less than required by law, are available in the plans to make benefit payments to plan participants and beneficiaries when required. However, certain plans are not or cannot be funded due to either legal, accounting, or tax requirements in certain jurisdictions. As of
December 31, 2015
, approximately
six
percent of the Company's projected benefit obligation relates to plans that cannot be funded.
F-20
The pretax amounts recognized in Accumulated other comprehensive income (loss) are as follows:
|
In millions
|
Prior service cost
|
Net actuarial losses
|
Total
|
|||||||||
|
December 31, 2014
|
$
|
(22.3
|
)
|
$
|
(999.4
|
)
|
$
|
(1,021.7
|
)
|
|||
|
Current year changes recorded to Accumulated other comprehensive income (loss)
|
(6.8
|
)
|
(47.9
|
)
|
(54.7
|
)
|
||||||
|
Amortization reclassified to earnings
|
3.2
|
|
60.7
|
|
63.9
|
|
||||||
|
Settlements/curtailments reclassified to earnings
|
—
|
|
0.7
|
|
0.7
|
|
||||||
|
Currency translation and other
|
0.1
|
|
15.4
|
|
15.5
|
|
||||||
|
December 31, 2015
|
$
|
(25.8
|
)
|
$
|
(970.5
|
)
|
$
|
(996.3
|
)
|
|||
Weighted-average assumptions used to determine the benefit obligation at December 31 are as follows:
|
2015
|
2014
|
|||||
|
Discount rate:
|
||||||
|
U.S. plans
|
4.17
|
%
|
3.75
|
%
|
||
|
Non-U.S. plans
|
3.27
|
%
|
3.25
|
%
|
||
|
Rate of compensation increase:
|
||||||
|
U.S. plans
|
4.00
|
%
|
4.00
|
%
|
||
|
Non-U.S. plans
|
4.00
|
%
|
4.00
|
%
|
||
The accumulated benefit obligation for all defined benefit pension plans was $
3,391.8 million
and $
3,568.5 million
at
December 31, 2015
and
2014
, respectively. The projected benefit obligation, accumulated benefit obligation, and fair value of plan assets for pension plans with accumulated benefit obligations more than plan assets were $
3,052.2 million
, $
2,941.7 million
and $
2,312.7 million
, respectively, as of
December 31, 2015
, and $
3,244.3 million
, $
3,115.2 million
and $
2,536.2 million
, respectively, as of
December 31, 2014
.
Pension benefit payments are expected to be paid as follows:
|
In millions
|
|
||
|
2016
|
$
|
204.0
|
|
|
2017
|
206.0
|
|
|
|
2018
|
213.2
|
|
|
|
2019
|
213.1
|
|
|
|
2020
|
223.5
|
|
|
|
2021 — 2025
|
1,176.3
|
|
|
F-21
The components of the Company’s net periodic pension benefit costs for the years ended December 31 include the following:
|
In millions
|
2015
|
2014
|
2013
|
|||||||||
|
Service cost
|
$
|
75.2
|
|
$
|
68.7
|
|
$
|
88.5
|
|
|||
|
Interest cost
|
129.5
|
|
147.2
|
|
156.9
|
|
||||||
|
Expected return on plan assets
|
(158.3
|
)
|
(156.1
|
)
|
(166.3
|
)
|
||||||
|
Net amortization of:
|
||||||||||||
|
Prior service costs
|
3.2
|
|
4.4
|
|
4.7
|
|
||||||
|
Plan net actuarial losses
|
60.7
|
|
36.1
|
|
63.0
|
|
||||||
|
Net periodic pension benefit cost
|
110.3
|
|
100.3
|
|
146.8
|
|
||||||
|
Net curtailment and settlement (gains) losses
|
0.7
|
|
7.1
|
|
0.7
|
|
||||||
|
Net periodic pension benefit cost after net curtailment and settlement (gains) losses
|
$
|
111.0
|
|
$
|
107.4
|
|
$
|
147.5
|
|
|||
|
Amounts recorded in continuing operations
|
$
|
100.7
|
|
$
|
100.2
|
|
$
|
119.2
|
|
|||
|
Amounts recorded in discontinued operations
|
10.3
|
|
7.2
|
|
28.3
|
|
||||||
|
Total
|
$
|
111.0
|
|
$
|
107.4
|
|
$
|
147.5
|
|
|||
The curtailment and settlement losses in 2014 are associated with lump sum distributions under supplemental benefit plans for officers and other key employees.
Net periodic pension benefit cost for
2016
is projected to be approximately $
107.7 million
. The amounts expected to be recognized in net periodic pension benefit cost during the year ended
2016
for prior service cost and plan net actuarial losses are $
4.7 million
and $
60.9 million
, respectively.
At
December 31, 2015
, the Company refined the methodology used to calculate service and interest costs for pension benefits. This refinement will result in the recognition of different costs in future periods as compared to the historical approach. Historically, the Company estimated service and interest costs utilizing a weighted-average discount rate calculated from spot rates selected along hypothetical yield curves based on corporate bonds rated AA quality. Beginning with the measurement of the
December 31, 2015
benefit obligations, the Company has refined the measurement approach to utilize multiple specific spot rates, along the same hypothetical yield curve, that correlate with the timing of the relevant projected cash flows. The Company’s intent with this refinement is to provide a more precise measurement of service and interest costs. The change did not have an impact on the measurement of the
December 31, 2015
benefit obligations. However, the Company estimates the impact on
2016
net periodic pension benefit cost to be a reduction of $
22.0 million
. The Company has concluded that this refinement is a change in accounting estimate.
Weighted-average assumptions used to determine net periodic pension cost for the years ended December 31 are as follows:
|
2015
|
2014
|
2013
|
|||||||
|
Discount rate:
|
|||||||||
|
U.S. plans
|
|||||||||
|
For the period January 1 to November 30 *
|
3.75
|
%
|
4.75
|
%
|
3.75
|
%
|
|||
|
For the period December 1 to December 31
|
3.75
|
%
|
4.75
|
%
|
4.50
|
%
|
|||
|
Non-U.S. plans
|
3.25
|
%
|
4.25
|
%
|
4.25
|
%
|
|||
|
Rate of compensation increase:
|
|||||||||
|
U.S. plans
|
4.00
|
%
|
4.00
|
%
|
4.00
|
%
|
|||
|
Non-U.S. plans
|
4.00
|
%
|
4.25
|
%
|
4.00
|
%
|
|||
|
Expected return on plan assets:
|
|||||||||
|
U.S. plans
|
5.75
|
%
|
6.00
|
%
|
5.25
|
%
|
|||
|
Non-U.S. plans
|
4.25
|
%
|
5.00
|
%
|
5.00
|
%
|
|||
* The Allegion spin-off required the measurement of plan assets and benefit obligations.
The expected long-term rate of return on plan assets reflects the average rate of returns expected on the funds invested or to be invested to provide for the benefits included in the projected benefit obligation. The expected long-term rate of return on plan assets is based on what is achievable given the plan’s investment policy, the types of assets held and target asset allocations. The expected long-term rate of return is determined as of the measurement date. The Company reviews each plan and its historical returns and target asset allocations to determine the appropriate expected long-term rate of return on plan assets to be used.
F-22
The Company's objective in managing its defined benefit plan assets is to ensure that all present and future benefit obligations are met as they come due. It seeks to achieve this goal while trying to mitigate volatility in plan funded status, contribution, and expense by better matching the characteristics of the plan assets to that of the plan liabilities. The Company utilizes a dynamic approach to asset allocation whereby a plan's allocation to fixed income assets increases as the plan's funded status improves. The Company monitors plan funded status and asset allocation regularly in addition to investment manager performance.
F-23
The fair values of the Company’s pension plan assets at
December 31, 2015
by asset category are as follows:
|
|
Fair value measurements
|
Total
fair value
|
||||||||||||||
|
In millions
|
Level 1
|
Level 2
|
Level 3
|
|||||||||||||
|
Cash and cash equivalents
|
$
|
17.6
|
|
$
|
19.7
|
|
$
|
—
|
|
$
|
37.3
|
|
||||
|
Equity investments:
|
||||||||||||||||
|
Registered mutual funds – equity specialty
(a)
|
69.0
|
|
—
|
|
—
|
|
69.0
|
|
||||||||
|
Commingled funds – equity specialty
(a)
|
—
|
|
637.8
|
|
—
|
|
637.8
|
|
||||||||
|
69.0
|
|
637.8
|
|
—
|
|
706.8
|
|
|||||||||
|
Fixed income investments:
|
||||||||||||||||
|
U.S. government and agency obligations
|
—
|
|
478.4
|
|
—
|
|
478.4
|
|
||||||||
|
Corporate and non-U.S. bonds
(b)
|
—
|
|
1,168.0
|
|
—
|
|
1,168.0
|
|
||||||||
|
Asset-backed and mortgage-backed securities
|
—
|
|
20.3
|
|
—
|
|
20.3
|
|
||||||||
|
Registered mutual funds – fixed income specialty
(c)
|
30.7
|
|
108.7
|
|
—
|
|
139.4
|
|
||||||||
|
Commingled funds – fixed income specialty
(c)
|
—
|
|
111.6
|
|
—
|
|
111.6
|
|
||||||||
|
Other fixed income
(d)
|
—
|
|
—
|
|
24.6
|
|
24.6
|
|
||||||||
|
30.7
|
|
1,887.0
|
|
24.6
|
|
1,942.3
|
|
|||||||||
|
Real estate
(e)
|
—
|
|
—
|
|
10.8
|
|
10.8
|
|
||||||||
|
Other
(f)
|
—
|
|
—
|
|
61.2
|
|
61.2
|
|
||||||||
|
Total assets at fair value
|
$
|
117.3
|
|
$
|
2,544.5
|
|
$
|
96.6
|
|
$
|
2,758.4
|
|
||||
|
Receivables and payables, net
|
13.6
|
|
||||||||||||||
|
Net assets available for benefits
|
|
|
|
$
|
2,772.0
|
|
||||||||||
|
|
Fair value measurements
|
Total
fair value
|
||||||||||||||
|
In millions
|
Level 1
|
Level 2
|
Level 3
|
|||||||||||||
|
Cash and cash equivalents
|
$
|
1.3
|
|
$
|
27.3
|
|
$
|
—
|
|
$
|
28.6
|
|
||||
|
Equity investments:
|
||||||||||||||||
|
Registered mutual funds – equity specialty
(a)
|
6.3
|
|
—
|
|
—
|
|
6.3
|
|
||||||||
|
Commingled funds – equity specialty
(a)
|
—
|
|
834.0
|
|
—
|
|
834.0
|
|
||||||||
|
6.3
|
|
834.0
|
|
—
|
|
840.3
|
|
|||||||||
|
Fixed income investments:
|
||||||||||||||||
|
U.S. government and agency obligations
|
—
|
|
784.9
|
|
—
|
|
784.9
|
|
||||||||
|
Corporate and non-U.S. bonds
(b)
|
—
|
|
823.9
|
|
—
|
|
823.9
|
|
||||||||
|
Asset-backed and mortgage-backed securities
|
—
|
|
45.3
|
|
—
|
|
45.3
|
|
||||||||
|
Registered mutual funds – fixed income specialty
(c)
|
33.0
|
|
—
|
|
—
|
|
33.0
|
|
||||||||
|
Commingled funds – fixed income specialty
(c)
|
—
|
|
354.3
|
|
—
|
|
354.3
|
|
||||||||
|
Other fixed income
(d)
|
—
|
|
—
|
|
23.4
|
|
23.4
|
|
||||||||
|
33.0
|
|
2,008.4
|
|
23.4
|
|
2,064.8
|
|
|||||||||
|
Real estate
(e)
|
—
|
|
—
|
|
16.4
|
|
16.4
|
|
||||||||
|
Other
(f)
|
—
|
|
—
|
|
62.8
|
|
62.8
|
|
||||||||
|
Total assets at fair value
|
$
|
40.6
|
|
$
|
2,869.7
|
|
$
|
102.6
|
|
$
|
3,012.9
|
|
||||
|
Receivables and payables, net
(g)
|
5.7
|
|
||||||||||||||
|
Net assets available for benefits
|
|
|
|
$
|
3,018.6
|
|
||||||||||
|
(a)
|
This class includes commingled funds managed by investment mangers that focus on equity investments.
|
|
(b)
|
This class represents U.S. treasuries and state and municipal bonds.
|
|
(c)
|
This class comprises commingled funds that focus on fixed income securities.
|
|
(d)
|
This class includes group annuity and guaranteed interest contracts.
|
|
(e)
|
This class includes private equity fund that invest in real estate.
|
|
(f)
|
This investment comprises the Company's non-significant, non-US pension plan assets. It mostly includes insurance contracts.
|
F-24
Cash equivalents are valued using a market approach with inputs including quoted market prices for either identical or similar instruments. Fixed income securities are valued through a market approach with inputs including, but not limited to, benchmark yields, reported trades, broker quotes and issuer spreads. Commingled funds are valued at their daily net asset value (NAV) per share or the equivalent. NAV per share or the equivalent is used for fair value purposes as a practical expedient. NAVs are calculated by the investment manager or sponsor of the fund. Private real estate fund values are reported by the fund manager and are based on valuation or appraisal of the underlying investments. See Note 9 for additional information related to the fair value hierarchy defined by ASC 820, Fair Value Measurement. There have been no significant transfers between levels of the fair value hierarchy.
The Company made required and discretionary contributions to its pension plans of $
35.6 million
in
2015
, $
116.5 million
in
2014
, and $
109.7 million
in
2013
. The Company currently projects that it will contribute approximately $
59.2 million
to its plans worldwide in
2016
. The Company’s policy allows it to fund an amount, which could be in excess of or less than the pension cost expensed, subject to the limitations imposed by current tax regulations. The Company anticipates funding the plans in
2016
in accordance with contributions required by funding regulations or the laws of each jurisdiction.
Most of the Company’s U.S. employees are covered by defined contribution plans. Employer contributions are determined based on criteria specific to the individual plans and amounted to approximately
$98.1 million
,
$88.7 million
, and
$89.0 million
in
2015
,
2014
and
2013
, respectively. The Company’s contributions relating to non-U.S. defined contribution plans and other non-U.S. benefit plans were
$30.5 million
,
$32.1 million
and $
33.8 million
in
2015
,
2014
and
2013
, respectively.
Multiemployer Pension Plans
The Company also participates in a number of multiemployer defined benefit pension plans related to collectively bargained U.S. employees of Trane. The Company's contributions, and the administration of the fixed retirement payments, are determined by the terms of the related collective-bargaining agreements. These multiemployer plans pose different risks to the Company than single-employer plans, including:
|
1.
|
The Company's contributions to multiemployer plans may be used to provide benefits to all participating employees of the program, including employees of other employers.
|
|
2.
|
In the event that another participating employer ceases contributions to a plan, the Company may be responsible for any unfunded obligations along with the remaining participating employers.
|
|
3.
|
If the Company chooses to withdraw from any of the multiemployer plans, the Company may be required to pay a withdrawal liability, based on the underfunded status of the plan.
|
As of
December 31, 2015
, the Company does not participate in any plans that are individually significant, nor is the Company an individually significant participant to any of these plans. Total contributions to multiemployer plans for the years ended December 31 were as follows:
|
In millions
|
2015
|
2014
|
2013
|
|||||||||
|
Total contributions
|
$
|
6.7
|
|
$
|
6.3
|
|
$
|
5.4
|
|
|||
Contributions to these plans may increase in the event that any of these plans are underfunded.
Postretirement Benefits Other Than Pensions
The Company sponsors several postretirement plans that provide for healthcare benefits, and in some instances, life insurance benefits that cover certain eligible employees. These plans are unfunded and have no plan assets, but are instead funded by the Company on a pay-as-you-go basis in the form of direct benefit payments. Generally, postretirement health benefits are contributory with contributions adjusted annually. Life insurance plans for retirees are primarily noncontributory.
F-25
The following table details changes in the Company’s postretirement plan benefit obligations for the years ended December 31:
|
In millions
|
2015
|
2014
|
||||||
|
Benefit obligation at beginning of year
|
$
|
700.7
|
|
$
|
713.3
|
|
||
|
Service cost
|
4.4
|
|
5.1
|
|
||||
|
Interest cost
|
22.6
|
|
28.1
|
|
||||
|
Plan participants’ contributions
|
10.3
|
|
11.4
|
|
||||
|
Actuarial (gains) losses
|
(49.7
|
)
|
11.7
|
|
||||
|
Benefits paid, net of Medicare Part D subsidy *
|
(60.2
|
)
|
(67.8
|
)
|
||||
|
Other
|
(4.0
|
)
|
(1.1
|
)
|
||||
|
Benefit obligations at end of year
|
$
|
624.1
|
|
$
|
700.7
|
|
||
* Amounts are net of Medicare Part D subsidy of
$2.7 million
and
$0.1 million
in
2015
and
2014
, respectively
The benefit plan obligations are reflected in the Consolidated Balance Sheets as follows:
|
In millions
|
December 31, 2015
|
December 31, 2014
|
||||||
|
Accrued compensation and benefits
|
$
|
(56.1
|
)
|
$
|
(58.5
|
)
|
||
|
Postemployment and other benefit liabilities
|
(568.0
|
)
|
(642.2
|
)
|
||||
|
Total
|
$
|
(624.1
|
)
|
$
|
(700.7
|
)
|
||
The pre-tax amounts recognized in Accumulated other comprehensive income (loss) were as follows:
|
In millions
|
Prior service gains
|
Net actuarial losses
|
Total
|
|||||||||
|
Balance at December 31, 2014
|
$
|
30.5
|
|
$
|
(73.8
|
)
|
$
|
(43.3
|
)
|
|||
|
Gain (loss) in current period
|
—
|
|
49.7
|
|
49.7
|
|
||||||
|
Amortization reclassified to earnings
|
(8.9
|
)
|
0.1
|
|
(8.8
|
)
|
||||||
|
Currency translation and other
|
—
|
|
0.4
|
|
0.4
|
|
||||||
|
Balance at December 31, 2015
|
$
|
21.6
|
|
$
|
(23.6
|
)
|
$
|
(2.0
|
)
|
|||
The components of net periodic postretirement benefit (income) cost for the years ended December 31 were as follows:
|
In millions
|
2015
|
2014
|
2013
|
|||||||||
|
Service cost
|
$
|
4.4
|
|
$
|
5.1
|
|
$
|
6.6
|
|
|||
|
Interest cost
|
22.6
|
|
28.1
|
|
26.0
|
|
||||||
|
Net amortization of:
|
||||||||||||
|
Prior service gains
|
(8.9
|
)
|
(8.9
|
)
|
(10.3
|
)
|
||||||
|
Net actuarial losses
|
0.1
|
|
—
|
|
6.5
|
|
||||||
|
Net periodic postretirement benefit cost
|
$
|
18.2
|
|
$
|
24.3
|
|
$
|
28.8
|
|
|||
|
Amounts recorded in continuing operations
|
$
|
11.0
|
|
$
|
16.2
|
|
$
|
19.8
|
|
|||
|
Amounts recorded in discontinued operations
|
7.2
|
|
8.1
|
|
9.0
|
|
||||||
|
Total
|
$
|
18.2
|
|
$
|
24.3
|
|
$
|
28.8
|
|
|||
Postretirement cost for
2016
is projected to be $
12.9 million
. The amount expected to be recognized in net periodic postretirement benefits cost in
2016
for prior service gains is $
8.9 million
.
At
December 31, 2015
, the Company refined the methodology used to calculate service and interest costs for other postretirement benefits. This refinement will result in the recognition of different costs in future periods as compared to the historical approach. Historically, the Company estimated service and interest costs utilizing a weighted-average discount rate calculated from spot rates selected along hypothetical yield curves based on corporate bonds rated AA quality. Beginning with the measurement of the
December 31, 2015
benefit obligations, the Company has refined the measurement approach to utilize multiple specific spot rates, along the same hypothetical yield curve, that correlate with the timing of the relevant projected cash flows. The Company’s intent with this refinement is to provide a more precise measurement of service and interest costs. The change did not have an impact on the measurement of the
December 31, 2015
benefit obligations. However, the Company estimates the impact on
2016
net
F-26
periodic postretirement benefit cost to be a reduction of $
5.8 million
. The Company has concluded that this refinement is a change in accounting estimate.
Weighted-average assumptions used to determine net periodic benefit cost for the years ended December 31 are as follows:
|
2015
|
2014
|
2013
|
|||||||
|
Discount rate:
|
|||||||||
|
Benefit obligations at December 31
|
3.88
|
%
|
3.50
|
%
|
4.25
|
%
|
|||
|
Net periodic benefit cost
|
|||||||||
|
For the period January 1 to November 30 *
|
3.50
|
%
|
4.25
|
%
|
3.25
|
%
|
|||
|
For the period November 30 to December 31
|
3.50
|
%
|
4.25
|
%
|
4.00
|
%
|
|||
|
Assumed health-care cost trend rates at December 31:
|
|||||||||
|
Current year medical inflation
|
7.25
|
%
|
7.25
|
%
|
7.65
|
%
|
|||
|
Ultimate inflation rate
|
5.00
|
%
|
5.00
|
%
|
5.00
|
%
|
|||
|
Year that the rate reaches the ultimate trend rate
|
2023
|
|
2021
|
|
2021
|
|
|||
* The Allegion spin-off required the measurement of plan benefit obligations.
A 1% change in the assumed medical trend rate would have the following effects as of and for the year ended
December 31, 2015
:
|
In millions
|
1%
Increase
|
1%
Decrease
|
||||||
|
Effect on total of service and interest cost components of current year benefit cost
|
$
|
0.8
|
|
$
|
(0.7
|
)
|
||
|
Effect on benefit obligation at year-end
|
24.2
|
|
(21.0
|
)
|
||||
Benefit payments for postretirement benefits, which are net of expected plan participant contributions and Medicare Part D subsidy, are expected to be paid as follows:
|
In millions
|
|
||
|
2016
|
$
|
56.3
|
|
|
2017
|
55.8
|
|
|
|
2018
|
54.5
|
|
|
|
2019
|
52.1
|
|
|
|
2020
|
49.9
|
|
|
|
2021 — 2025
|
212.0
|
|
|
The authorized share capital of IR-Ireland is
1,185,040,000
shares, consisting of (1)
1,175,000,000
ordinary shares, par value $
1.00
per share, (2)
40,000
ordinary shares, par value EUR
1.00
and (3)
10,000,000
preference shares, par value $
0.001
per share. There were no Euro-denominated ordinary shares or preference shares outstanding at
December 31, 2015
or
2014
.
The changes in ordinary shares and treasury shares for the year ended
December 31, 2015
are as follows:
|
In millions
|
Ordinary shares issued
|
Ordinary shares held in treasury
|
|||
|
December 31, 2014
|
266.3
|
|
3.4
|
|
|
|
Shares issued under incentive plans
|
2.7
|
|
—
|
|
|
|
Repurchase of ordinary shares
|
—
|
|
4.4
|
|
|
|
December 31, 2015
|
269.0
|
|
7.8
|
|
|
In February 2014, our Board of Directors authorized the repurchase of up to $
1.5 billion
of our ordinary shares under a share repurchase program that began in April 2014. Share repurchases are made from time to time at the discretion of management subject to market conditions, regulatory requirements and other considerations.
During
2015
, the Company repurchased
4.4 million
shares for $
250.1 million
. Shares repurchased prior to October 2014 were canceled upon repurchase and accounted for as a reduction of Ordinary shares and Capital in excess of par value, or Retained earnings to the extent Capital in excess of par value was exhausted. Beginning in October 2014, repurchased shares were held in
F-27
treasury and recognized at cost. Ordinary shares held in treasury are presented separately on the balance sheet as a reduction to Equity.
Other Comprehensive Income (Loss)
The changes in Accumulated other comprehensive income (loss) are as follows:
|
In millions
|
Cash flow hedges
|
Pension and OPEB Items
|
Foreign Currency Items
|
Total
|
||||||||||||
|
December 31, 2013
|
$
|
0.4
|
|
$
|
(562.8
|
)
|
$
|
395.7
|
|
$
|
(166.7
|
)
|
||||
|
Other comprehensive income (loss) attributable to Ingersoll-Rand plc
|
2.7
|
|
(102.3
|
)
|
(448.0
|
)
|
(547.6
|
)
|
||||||||
|
December 31, 2014
|
$
|
3.1
|
|
$
|
(665.1
|
)
|
$
|
(52.3
|
)
|
$
|
(714.3
|
)
|
||||
|
Other comprehensive income (loss) attributable to Ingersoll-Rand plc
|
2.0
|
|
34.7
|
|
(443.3
|
)
|
(406.6
|
)
|
||||||||
|
December 31, 2015
|
$
|
5.1
|
|
$
|
(630.4
|
)
|
$
|
(495.6
|
)
|
$
|
(1,120.9
|
)
|
||||
The amounts of Other comprehensive income (loss) attributable to noncontrolling interests for 2015, 2014 and 2013 were ($
4.3 million
), ($
2.2 million
) and $
3.3 million
, respectively, related to currency translation.
The Company accounts for stock-based compensation plans in accordance with ASC 718, "Compensation - Stock Compensation" (ASC 718), which requires a fair-value based method for measuring the value of stock-based compensation. Fair value is measured once at the date of grant and is not adjusted for subsequent changes. The Company’s share-based compensation plans include programs for stock options, restricted stock units (RSUs), performance share units (PSUs), and deferred compensation.
In connection with the spin-off of the commercial and residential security businesses, the provisions of the Company's existing compensation plans required adjustments to the number and terms of outstanding employee stock options, stock appreciation rights (SARs), RSUs and PSUs to preserve the intrinsic value of the awards immediately before and after the spin-off. The outstanding awards will continue to vest over the original vesting period, which is generally three years from the grant date.
The stock awards held as of December 1, 2013 were adjusted as follows:
|
•
|
Stock options and SARs
: Holders of Ingersoll Rand vested stock option and SARs awards received one stock option of Allegion for every three Ingersoll Rand vested and exercisable stock options held. The exercise price for each award was also adjusted to preserve the overall intrinsic value of the awards. Unvested stock options held at the time of the spin-off were converted into stock options of the holder’s employer following the spin-off, with the number of underlying shares and the exercise price adjusted accordingly to preserve the overall intrinsic value of the awards.
|
|
•
|
Restricted stock units
: Ingersoll Rand restricted stock units were converted into restricted stock units of the holder’s employer following the spin-off with adjustments to the number of underlying shares as appropriate to preserve the intrinsic value of such awards immediately prior to the spin-off.
|
|
•
|
Performance share units
: Participants with active and outstanding performance share units had the number of units held adjusted for the change in Ingersoll Rand stock price before and after the spin-off. A corresponding adjustment was made to the calculation of earnings per share and total shareholder return to appropriately reflect the spin-off.
|
Under the Company's incentive stock plan, the total number of ordinary shares authorized by the shareholders is
20.0 million
, of which
13.1 million
remains available as of
December 31, 2015
for future incentive awards.
F-28
Compensation Expense
Share-based compensation expense related to continuing operations is included in Selling and administrative expenses. The following table summarizes the expenses recognized:
|
In millions
|
2015
|
2014
|
2013
|
|||||||||
|
Stock options
|
$
|
16.3
|
|
$
|
16.4
|
|
$
|
23.0
|
|
|||
|
RSUs
|
24.7
|
|
24.6
|
|
29.9
|
|
||||||
|
PSUs
|
20.5
|
|
24.2
|
|
20.2
|
|
||||||
|
Deferred compensation
|
1.7
|
|
1.9
|
|
1.9
|
|
||||||
|
Other
|
(0.5
|
)
|
0.6
|
|
2.9
|
|
||||||
|
Pre-tax expense
|
62.7
|
|
67.7
|
|
77.9
|
|
||||||
|
Tax benefit
|
24.0
|
|
25.9
|
|
29.8
|
|
||||||
|
After-tax expense
|
$
|
38.7
|
|
$
|
41.8
|
|
$
|
48.1
|
|
|||
|
Amounts recorded in continuing operations
|
$
|
38.7
|
|
$
|
41.8
|
|
$
|
43.4
|
|
|||
|
Amounts recorded in discontinued operations
|
—
|
|
—
|
|
4.7
|
|
||||||
|
Total
|
$
|
38.7
|
|
$
|
41.8
|
|
$
|
48.1
|
|
|||
Stock Options / RSUs
Eligible participants may receive (i) stock options, (ii) RSUs or (iii) a combination of both stock options and RSUs. The fair value of each of the Company’s stock option and RSU awards is expensed on a straight-line basis over the required service period, which is generally the
3
-year vesting period. However, for stock options and RSUs granted to retirement eligible employees, the Company recognizes expense for the fair value at the grant date.
The weighted average fair value of the stock options granted for the year ended
December 31, 2015
and
2014
was estimated to be $
13.98
per share and $
14.29
per share, respectively, using the Black-Scholes option-pricing model. The following assumptions were used:
|
2015
|
2014
|
|||||
|
Dividend yield
|
1.73
|
%
|
1.67
|
%
|
||
|
Volatility
|
28.56
|
%
|
31.43
|
%
|
||
|
Risk-free rate of return
|
1.24
|
%
|
1.46
|
%
|
||
|
Expected life in years
|
4.9
|
|
4.9
|
|
||
A description of the significant assumptions used to estimate the fair value of the stock option awards is as follows:
|
•
|
Volatility - The expected volatility is based on a weighted average of the Company’s implied volatility and the most recent historical volatility of the Company’s stock commensurate with the expected life.
|
|
•
|
Risk-free rate of return -The Company applies a yield curve of continuous risk-free rates based upon the published US Treasury spot rates on the grant date.
|
|
•
|
Expected life - The expected life of the Company’s stock option awards represents the weighted-average of the actual period since the grant date for all exercised or cancelled options and an expected period for all outstanding options.
|
|
•
|
Dividend yield - The Company determines the dividend yield based upon the expected quarterly dividend payments as of the grant date and the current fair market value of the Company’s stock.
|
|
•
|
Forfeiture Rate - The Company analyzes historical data of forfeited options to develop a reasonable expectation of the number of options to forfeit prior to vesting per year. This expected forfeiture rate is applied to the Company’s ongoing compensation expense; however, all expense is adjusted to reflect actual vestings and forfeitures.
|
F-29
For stock options granted prior to the spin-off, the weighted-average exercise prices in the table below reflect the historical exercise prices. Changes in options outstanding under the plans for the years
2015
,
2014
and
2013
are as follows:
|
Shares
subject
to option
|
Weighted-
average
exercise price
|
Aggregate
intrinsic
value (millions)
|
Weighted-
average
remaining life (years)
|
||||||||||
|
December 31, 2012
|
14,090,962
|
|
$
|
36.47
|
|
||||||||
|
Granted
|
1,341,602
|
|
52.71
|
|
|||||||||
|
Exercised
|
(6,994,024
|
)
|
35.33
|
|
|||||||||
|
Cancelled
|
(110,496
|
)
|
44.57
|
|
|
|
|||||||
|
Impact of Spin-off
|
371,984
|
|
****
|
|
|||||||||
|
December 31, 2013
|
8,700,028
|
|
31.87
|
|
|||||||||
|
Granted
|
1,160,057
|
|
59.82
|
|
|||||||||
|
Exercised
|
(2,253,094
|
)
|
31.04
|
|
|||||||||
|
Cancelled
|
(104,378
|
)
|
47.85
|
|
|
|
|||||||
|
December 31, 2014
|
7,502,613
|
|
36.21
|
|
|||||||||
|
Granted
|
1,457,523
|
|
66.25
|
|
|||||||||
|
Exercised
|
(1,968,725
|
)
|
31.33
|
|
|||||||||
|
Cancelled
|
(155,382
|
)
|
61.03
|
|
|
|
|||||||
|
Outstanding December 31, 2015
|
6,836,029
|
|
$
|
43.46
|
|
$
|
100.4
|
|
5.9
|
||||
|
Exercisable December 31, 2015
|
4,361,652
|
|
$
|
33.85
|
|
$
|
95.0
|
|
4.5
|
||||
The following table summarizes information concerning currently outstanding and exercisable options as adjusted for the spin-off as discussed above:
|
|
Options outstanding
|
Options exercisable
|
||||||||||||||||||||||||
|
Range of
exercise price
|
Number
outstanding at
December 31,
2015
|
Weighted-
average
remaining
life (years)
|
Weighted-
average
exercise
price
|
Number
outstanding at
December 31,
2015
|
Weighted-
average
remaining
life (years)
|
Weighted-
average
exercise
price
|
||||||||||||||||||||
|
$
|
10.01
|
|
—
|
$
|
20.00
|
|
345,085
|
|
2.3
|
$
|
13.97
|
|
345,085
|
|
2.3
|
$
|
13.97
|
|
||||||||
|
20.01
|
|
—
|
30.00
|
|
962,251
|
|
3.6
|
25.86
|
|
962,251
|
|
3.6
|
25.86
|
|
||||||||||||
|
30.01
|
|
—
|
40.00
|
|
2,078,727
|
|
4.1
|
34.24
|
|
2,078,727
|
|
4.1
|
34.24
|
|
||||||||||||
|
40.01
|
|
—
|
50.00
|
|
1,054,346
|
|
6.5
|
41.92
|
|
648,129
|
|
6.3
|
41.88
|
|
||||||||||||
|
50.01
|
|
—
|
60.00
|
|
1,147,510
|
|
8.2
|
59.55
|
|
325,890
|
|
7.9
|
59.82
|
|
||||||||||||
|
60.01
|
|
—
|
70.00
|
|
1,248,110
|
|
9.0
|
67.06
|
|
1,570
|
|
2.7
|
67.06
|
|
||||||||||||
|
$
|
10.74
|
|
—
|
$
|
68.70
|
|
6,836,029
|
|
5.9
|
$
|
43.46
|
|
4,361,652
|
|
4.5
|
$
|
33.85
|
|
||||||||
At
December 31, 2015
, there was
$14.7 million
of total unrecognized compensation cost from stock option arrangements granted under the plan, which is primarily related to unvested shares of non-retirement eligible employees. The aggregate intrinsic value of options exercised during the year ended
December 31, 2015
and
2014
was
$67.9 million
and
$67.4 million
, respectively. Generally, stock options expire ten years from their date of grant.
F-30
For restricted stock units awarded prior to the spin-off, grant price information in the table below reflects historical market prices. The following table summarizes RSU activity for the years
2015
,
2014
and
2013
:
|
RSUs
|
Weighted-
average grant
date fair value
|
||||||
|
Outstanding and unvested at December 31, 2012
|
1,284,692
|
|
$
|
39.81
|
|
||
|
Granted
|
685,441
|
|
53.78
|
|
|||
|
Vested
|
(669,079
|
)
|
38.44
|
|
|||
|
Cancelled
|
(63,954
|
)
|
43.98
|
|
|||
|
Impact of Spin-off
|
103,882
|
|
****
|
|
|||
|
Outstanding and unvested at December 31, 2013
|
1,340,982
|
|
$
|
38.49
|
|
||
|
Granted
|
378,873
|
|
59.79
|
|
|||
|
Vested
|
(630,185
|
)
|
35.73
|
|
|||
|
Cancelled
|
(41,921
|
)
|
45.14
|
|
|||
|
Outstanding and unvested at December 31, 2014
|
1,047,749
|
|
$
|
47.60
|
|
||
|
Granted
|
429,828
|
|
66.42
|
|
|||
|
Vested
|
(510,600
|
)
|
43.32
|
|
|||
|
Cancelled
|
(44,366
|
)
|
59.98
|
|
|||
|
Outstanding and unvested at December 31, 2015
|
922,611
|
|
$
|
58.14
|
|
||
At
December 31, 2015
, there was $
20.4 million
of total unrecognized compensation cost from RSU arrangements granted under the plan, which is related to unvested shares of non-retirement eligible employees.
Performance Shares
The Company has a Performance Share Program (PSP) for key employees. The program provides awards in the form of PSUs based on performance against pre-established objectives. The annual target award level is expressed as a number of the Company's ordinary shares. All PSUs are settled in the form of ordinary shares.
Beginning with the 2012 grant year, PSU awards are earned based
50%
upon a performance condition, measured at each reporting period by relative EPS growth to the industrial group of companies in the S&P 500 Index and the fair market value of the Company's stock on the date of grant, and
50%
upon a market condition, measured by the Company's relative total shareholder return (TSR) as compared to the TSR of the industrial group of companies in the S&P 500 Index over the
3
-year performance period. The fair value of the market condition is estimated using a Monte Carlo Simulation approach in a risk-neutral framework based upon historical volatility, risk-free rates and correlation matrix. Awards granted prior to 2012 were earned based upon the Company's relative earnings-per-share (EPS) growth as compared to the industrial group of companies in the S&P 500 Index over the
3
-year performance period.
F-31
The grant price information for performance share units awarded prior to the spin-off reflects historical market prices which were not adjusted to reflect the spin-off. The following table summarizes PSU activity for the maximum number of shares that may be issued for the years
2015
,
2014
and
2013
:
|
PSUs
|
Weighted-average grant date fair value
|
||||||
|
Outstanding and unvested at December 31, 2012
|
1,859,636
|
|
$
|
40.30
|
|
||
|
Granted
|
580,910
|
|
61.24
|
|
|||
|
Vested
|
(718,040
|
)
|
34.94
|
|
|||
|
Forfeited
|
(150,636
|
)
|
51.43
|
|
|||
|
Impact of spin-off
|
380,780
|
|
****
|
|
|||
|
Outstanding and unvested at December 31, 2013
|
1,952,650
|
|
$
|
39.20
|
|
||
|
Granted
|
473,988
|
|
66.22
|
|
|||
|
Vested
|
(604,649
|
)
|
27.84
|
|
|||
|
Forfeited
|
(36,991
|
)
|
44.33
|
|
|||
|
Outstanding and unvested at December 31, 2014
|
1,784,998
|
|
$
|
50.12
|
|
||
|
Granted
|
456,592
|
|
79.09
|
|
|||
|
Vested
|
(723,250
|
)
|
41.03
|
|
|||
|
Forfeited
|
(70,108
|
)
|
62.76
|
|
|||
|
Outstanding and unvested at December 31, 2015
|
1,448,232
|
|
$
|
63.18
|
|
||
At
December 31, 2015
, there was $
18.5 million
of total unrecognized compensation cost from the PSP based on current performance, which is related to unvested shares. This compensation will be recognized over the required service period, which is generally the three-year vesting period.
Deferred Compensation
The Company allows key employees to defer a portion of their eligible compensation into a number of investment choices, including its ordinary share equivalents. Any amounts invested in ordinary share equivalents will be settled in ordinary shares of the Company at the time of distribution.
Other Plans
The Company has not granted SARs since 2006 and does not anticipate additional grants in the future. As of
December 31, 2015
, there were
7,450
SARs outstanding, all of which are vested and expire
10
years from the date of grant. All unexercised shares will expire in 2016. All SARs exercised are settled with the Company’s ordinary shares.
The Company incurs costs associated with restructuring initiatives intended to result in improved operating performance, profitability and working capital levels. Actions associated with these initiatives include workforce reduction, improving manufacturing productivity, realignment of management structures, and rationalizing certain assets. The following table details restructuring charges recorded during the years ended
December 31
were as follows:
|
In millions
|
2015
|
2014
|
2013
|
|||||||||
|
Climate
|
$
|
11.9
|
|
$
|
5.2
|
|
$
|
47.5
|
|
|||
|
Industrial
|
15.6
|
|
4.0
|
|
14.5
|
|
||||||
|
Corporate and Other
|
6.6
|
|
3.3
|
|
20.3
|
|
||||||
|
Total
|
$
|
34.1
|
|
$
|
12.5
|
|
$
|
82.3
|
|
|||
|
Cost of goods sold
|
$
|
12.5
|
|
$
|
2.7
|
|
$
|
15.2
|
|
|||
|
Selling and administrative expenses
|
21.6
|
|
9.8
|
|
67.1
|
|
||||||
|
Total
|
$
|
34.1
|
|
$
|
12.5
|
|
$
|
82.3
|
|
|||
F-32
The changes in the restructuring reserve were as follows:
|
In millions
|
Climate
|
Industrial
|
Corporate
and Other
|
Total
|
||||||||||||
|
December 31, 2013
|
$
|
18.0
|
|
$
|
9.5
|
|
$
|
5.0
|
|
$
|
32.5
|
|
||||
|
Additions, net of reversals
|
5.2
|
|
4.0
|
|
3.3
|
|
12.5
|
|
||||||||
|
Cash paid
|
(20.3
|
)
|
(12.6
|
)
|
(7.7
|
)
|
(40.6
|
)
|
||||||||
|
December 31, 2014
|
2.9
|
|
0.9
|
|
0.6
|
|
4.4
|
|
||||||||
|
Additions, net of reversals
(1)
|
7.4
|
|
13.1
|
|
0.5
|
|
21.0
|
|
||||||||
|
Cash paid
|
(6.6
|
)
|
(12.1
|
)
|
(0.9
|
)
|
(19.6
|
)
|
||||||||
|
December 31, 2015
|
$
|
3.7
|
|
$
|
1.9
|
|
$
|
0.2
|
|
$
|
5.8
|
|
||||
(1)
Excludes the costs of asset rationalization.
Ongoing restructuring actions include workforce reductions as well as the closure and consolidation of manufacturing facilities in an effort to improve the Company's cost structure. As of
December 31, 2015
, the Company had
$5.8 million
accrued for costs associated with its ongoing restructuring actions, of which a majority is expected to be paid within one year.
In addition to the 2015 restructuring charges described above, the Company incurred $
0.2 million
of non-qualified restructuring charges, which represent costs that are directly attributable to restructuring activities, but do not fall into the severance, exit or disposal category. These non-qualified restructuring charges were incurred to improve the Company's cost structure.
Transactions that are denominated in a currency other than an entity's functional currency are subject to changes in exchange rates with the resulting gains and losses recorded within current earnings. The Company includes these gains and losses related to receivables and payables as well as the impacts of other operating transactions as a component of Operating income (loss).
The components of Other income/(expense), net for the years ended
December 31, 2015
,
2014
and
2013
are as follows:
|
In millions
|
2015
|
2014
|
2013
|
|||||||||
|
Interest income
|
$
|
10.6
|
|
$
|
13.2
|
|
$
|
12.8
|
|
|||
|
Exchange loss
|
(36.2
|
)
|
(0.1
|
)
|
(14.0
|
)
|
||||||
|
Income (loss) from equity investment
|
12.6
|
|
7.8
|
|
(2.6
|
)
|
||||||
|
Other activity, net
|
25.9
|
|
9.1
|
|
7.2
|
|
||||||
|
Other income/(expense), net
|
$
|
12.9
|
|
$
|
30.0
|
|
$
|
3.4
|
|
|||
The Company recognized a loss on foreign currency exchange of $
36.2 million
, for the year ended December 31, 2015. This loss is comprised of a
$42.6 million
pre-tax charge recorded in the first quarter related to the remeasurement of net monetary assets denominated in Venezuelan bolivar, partially offset by foreign currency transaction gain.
Other activity primarily consists of income realized from insurance settlements on asbestos-related matters. In addition, other activity for the year ended December 31, 2014 includes a $
6.0 million
gain on the sale of an investment.
Hussmann Minority Interest
During 2011, the Company completed the sale of a controlling interest of its Hussmann refrigerated display case business (“Hussmann”) to a newly-formed affiliate (“Hussmann Parent”) of private equity firm Clayton Dubilier & Rice, LLC (“CD&R”). Per the terms of the agreement, CD&R’s ownership interest in Hussmann at the acquisition date was 60% with the remaining 40% being retained by the Company. As a result, the Company accounts for its interest in Hussmann using the equity method of accounting. At December 31, 2014, the Company’s ownership interest was
37.2
%, which decreased to
36.7
% at December, 31 2015, a result of additional shares issued to CD&R as part of a quarterly dividend requirement.
On December 21, 2015, the Company announced it will sell its remaining equity interest in Hussmann as part of a transaction in which Panasonic Corporation will acquire 100 percent of Hussmann's shares. The Company expects to receive net proceeds of approximately $
425 million
. The transaction is anticipated to close in the first half of 2016 subject to customary approvals and closing conditions and has no impact on the results of our operations in 2015.
Venezuela Currency Devaluation
The Company has one subsidiary with operations in Venezuela. Due to the historical designation of Venezuela as a highly inflationary economy, the U.S. dollar is the functional currency for this subsidiary. From February 2013 to March 2015, the
F-33
Company utilized the official exchange rate obtained through the National Center of Foreign Trade (CENCOEX) of
6.3
bolivars to the U.S. dollar to translate the Venezuela subsidiary financial statements.
In January 2014, the Venezuelan government significantly expanded the use of the Supplementary Foreign Currency Administration System (SICAD) I exchange market and created a third exchange market called SICAD II. In January 2015, the Venezuelan government clarified the priority imports for the CENCOEX exchange and the Company’s products were not listed as a priority. In February 2015, the Venezuelan government announced a new exchange market called the Marginal Currency System (SIMADI), which replaced the SICAD II exchange and allows for trading based on supply and demand. These markets have exchange rates significantly less favorable than the CENCOEX rate.
In light of the developments described above and the continued deterioration in the economic conditions of Venezuela in connection with the Company’s preparation of the first quarter 2015 financial statements, the Company utilized the SIMADI rate of
192.95
bolivars to U.S. dollar to translate the financial position of the Company's Venezuelan subsidiary as of March 31, 2015. As a result the Company recorded a pre-tax charge of $
42.6 million
(within Other income/(expense), net) during the first quarter to remeasure the net monetary assets at March 31, 2015. The Company's remaining net assets denominated in Venezuelan bolivar are nominal and continue be measured in U.S. dollars using the SIMADI rate through
December 31, 2015
.
Current and deferred provision for income taxes
Earnings before income taxes for the years ended December 31 were taxed within the following jurisdictions:
|
In millions
|
2015
|
2014
|
2013
|
|||||||||
|
United States
|
$
|
451.6
|
|
$
|
276.5
|
|
$
|
(147.4
|
)
|
|||
|
Non-U.S.
|
796.3
|
|
932.9
|
|
977.0
|
|
||||||
|
Total
|
$
|
1,247.9
|
|
$
|
1,209.4
|
|
$
|
829.6
|
|
|||
The components of the Provision for income taxes for the years ended December 31 were as follows:
|
In millions
|
2015
|
2014
|
2013
|
|||||||||
|
Current tax expense (benefit):
|
||||||||||||
|
United States
|
$
|
300.1
|
|
$
|
168.4
|
|
$
|
2.1
|
|
|||
|
Non-U.S.
|
132.9
|
|
148.7
|
|
157.5
|
|
||||||
|
Total:
|
433.0
|
|
317.1
|
|
159.6
|
|
||||||
|
Deferred tax expense (benefit):
|
||||||||||||
|
United States
|
69.0
|
|
(21.4
|
)
|
19.2
|
|
||||||
|
Non-U.S.
|
38.8
|
|
(2.0
|
)
|
10.2
|
|
||||||
|
Total:
|
107.8
|
|
(23.4
|
)
|
29.4
|
|
||||||
|
Total tax expense (benefit):
|
||||||||||||
|
United States
|
369.1
|
|
147.0
|
|
21.3
|
|
||||||
|
Non-U.S.
|
171.7
|
|
146.7
|
|
167.7
|
|
||||||
|
Total
|
$
|
540.8
|
|
$
|
293.7
|
|
$
|
189.0
|
|
|||
F-34
The Provision for income taxes differs from the amount of income taxes determined by applying the applicable U.S. statutory income tax rate to pretax income, as a result of the following differences:
|
|
Percent of pretax income
|
||||||||
|
2015
|
2014
|
2013
|
|||||||
|
Statutory U.S. rate
|
35.0
|
%
|
35.0
|
%
|
35.0
|
%
|
|||
|
Increase (decrease) in rates resulting from:
|
|||||||||
|
Non-U.S. tax rate differential
|
(17.2
|
)
|
(14.8
|
)
|
(26.8
|
)
|
|||
|
Tax on U.S. subsidiaries on non-U.S. earnings
|
1.3
|
|
1.7
|
|
2.0
|
|
|||
|
State and local income taxes
(1)
|
1.5
|
|
1.6
|
|
6.3
|
|
|||
|
Valuation allowances
(2)
|
1.7
|
|
(1.0
|
)
|
2.5
|
|
|||
|
Change in permanent reinvestment assertion
(3)
|
3.9
|
|
0.9
|
|
6.2
|
|
|||
|
Reserves for uncertain tax positions
|
14.1
|
|
0.3
|
|
(2.9
|
)
|
|||
|
Provision to return and other true-up adjustments
|
0.7
|
|
0.1
|
|
(0.7
|
)
|
|||
|
Other adjustments
|
2.3
|
|
0.5
|
|
1.2
|
|
|||
|
Effective tax rate
|
43.3
|
%
|
24.3
|
%
|
22.8
|
%
|
|||
|
(1)
|
Net of changes in state valuation allowances
|
|
(2)
|
Primarily federal and non-U.S., excludes state valuation allowances
|
|
(3)
|
Net of foreign tax credits
|
Tax incentives, in the form of tax holidays, have been granted to the Company in certain jurisdictions to encourage industrial development. The expiration of these tax holidays varies by country. The tax holidays are conditional on the Company meeting certain employment and investment thresholds. The most significant tax holidays relate to the Company’s qualifying locations in China, Puerto Rico and Belgium. The benefit for the tax holidays for the years ended
December 31, 2015
,
2014
and 2013 was $
22.6 million
, $
24.7 million
and $
25.3 million
, respectively.
IRS Exam Results
As previously discussed in the Company’s third quarter Form 10-Q for the quarterly period ended September 30, 2015, the Company entered into an agreement with the IRS in July 2015 to resolve disputes related to withholding and income taxes for years 2002 through 2011. The IRS had previously disagreed with the Company’s tax treatment of intercompany debt and distributions and asserted the Company owed income and withholding tax relating to the 2002-2006 period totaling $774 million, not including interest and penalties. The Company also provided a substantial amount of information to the IRS in connection with its audit of the 2007-2011 tax periods. The Company expected the IRS to propose similar adjustments to these periods, although it was not known how the IRS would apply its position to the different facts presented in these years or whether the IRS would take a similar position to intercompany debt instruments not outstanding in prior years.
The resolution reached in July 2015 covered intercompany debt and related issues for the entire period from 2002 through 2011 and includes all aspects of the dispute with the U.S. Tax Court, the Appeals Division and the Examination Division of the IRS. The resolution was subsequently reported to the Congressional Joint Committee on Taxation (JCT), as required, for its review. The JCT concluded its review without objection in December 2015 and the settlement was finalized with the IRS in December 2015.
Pursuant to the agreement with the IRS, the Company agreed to pay withholding tax and interest of $412 million in respect to the 2002-2006 years. The Company owed no additional tax with respect to intercompany debt and related matters for the years 2007-2011. No penalties were applied to any of the tax years 2002 through 2011. The resolution resulted in a net cash outflow of approximately $
364 million
, consisting of $230 million in tax and $134 million of interest, net of a tax benefit of $48 million.
F-35
Deferred tax assets and liabilities
A summary of the deferred tax accounts at December 31 are as follows:
|
In millions
|
2015
|
2014
|
||||||
|
Deferred tax assets:
|
||||||||
|
Inventory and accounts receivable
|
$
|
17.4
|
|
$
|
19.2
|
|
||
|
Fixed assets and intangibles
|
17.5
|
|
8.6
|
|
||||
|
Postemployment and other benefit liabilities
|
672.6
|
|
702.5
|
|
||||
|
Product liability
|
169.5
|
|
191.0
|
|
||||
|
Other reserves and accruals
|
190.9
|
|
190.5
|
|
||||
|
Net operating losses and credit carryforwards
|
562.7
|
|
505.9
|
|
||||
|
Other
|
65.0
|
|
77.3
|
|
||||
|
Gross deferred tax assets
|
1,695.6
|
|
1,695.0
|
|
||||
|
Less: deferred tax valuation allowances
|
(213.1
|
)
|
(210.7
|
)
|
||||
|
Deferred tax assets net of valuation allowances
|
$
|
1,482.5
|
|
$
|
1,484.3
|
|
||
|
Deferred tax liabilities:
|
||||||||
|
Inventory and accounts receivable
|
$
|
(43.3
|
)
|
$
|
(42.8
|
)
|
||
|
Fixed assets and intangibles
|
(1,993.7
|
)
|
(1,999.6
|
)
|
||||
|
Postemployment and other benefit liabilities
|
(6.8
|
)
|
(3.3
|
)
|
||||
|
Other reserves and accruals
|
(2.5
|
)
|
(14.1
|
)
|
||||
|
Other
|
(53.5
|
)
|
(20.3
|
)
|
||||
|
Gross deferred tax liabilities
|
(2,099.8
|
)
|
(2,080.1
|
)
|
||||
|
Net deferred tax assets (liabilities)
|
$
|
(617.3
|
)
|
$
|
(595.8
|
)
|
||
At
December 31, 2015
, no deferred taxes have been provided for any portion of the approximately $
10.6 billion
of undistributed earnings of the Company’s subsidiaries, since these earnings have been, and under current plans will continue to be, permanently reinvested in these subsidiaries. Due to the number of legal entities and jurisdictions involved, the complexity of the legal entity structure of the Company, the complexity of the tax laws in the relevant jurisdictions, including, but not limited to the rules pertaining to the utilization of foreign tax credits in the United States and the impact of projections of income for future years to any calculations, the Company believes it is not practicable to estimate, within any reasonable range, the amount of additional taxes which may be payable upon distribution of these earnings.
In 2015, the Company changed its permanent reinvestment assertion on prior and current year’s earnings on certain of its subsidiaries. The Company recorded the tax effects of this change in the fourth quarter of 2015, which resulted in a tax charge of $
52 million
.
In 2013, in order to facilitate the repayment of an intercompany obligation between two of its subsidiaries, the Company changed its permanent reinvestment assertion as it relates to approximately $740 million of earnings primarily related to subsidiaries in Hong Kong, Australia and Canada. The Company recorded the tax effects of this change in the fourth quarter of 2013, which resulted in a charge of approximately $51 million.
At
December 31, 2015
, the Company had the following operating loss and tax credit carryforwards available to offset taxable income in prior and future years:
|
In millions
|
Amount
|
Expiration
Period
|
||||
|
U.S. Federal net operating loss carryforwards
|
$
|
678.1
|
|
2022-2034
|
||
|
U.S. Federal credit carryforwards
|
28.6
|
|
2024-Unlimited
|
|||
|
U.S. State net operating loss carryforwards
|
3,051.6
|
|
2016-2035
|
|||
|
U.S. State credit carryforwards
|
36.2
|
|
2016-Unlimited
|
|||
|
Non-U.S. net operating loss carryforwards
|
748.2
|
|
2016-Unlimited
|
|||
|
Non-U.S. credit carryforwards
|
3.4
|
|
Unlimited
|
|||
F-36
The amount of net operating loss carryforwards for which a benefit would be recorded in additional paid in capital when realized is $
38.2 million
.
The U.S. state net operating loss carryforwards were incurred in various jurisdictions. The non-U.S. net operating loss carryforwards were incurred in various jurisdictions, predominantly in Belgium, Brazil, India, Luxembourg, Spain, and the United Kingdom.
Activity associated with the Company’s valuation allowance is as follows:
|
In millions
|
2015
|
2014
|
2013
|
|||||||||
|
Beginning balance
|
$
|
210.7
|
|
$
|
218.5
|
|
$
|
156.2
|
|
|||
|
Increase to valuation allowance
|
40.7
|
|
35.2
|
|
89.3
|
|
||||||
|
Decrease to valuation allowance
|
(34.0
|
)
|
(38.8
|
)
|
(26.3
|
)
|
||||||
|
Accumulated other comprehensive income (loss)
|
(4.3
|
)
|
(4.2
|
)
|
(0.7
|
)
|
||||||
|
Ending balance
|
$
|
213.1
|
|
$
|
210.7
|
|
$
|
218.5
|
|
|||
During 2013, the Company recorded to continuing operations a tax charge of approximately $74.3 million as result of increases to its deferred tax asset valuation allowance for non-U.S. and U.S. state and local net operating losses and other net deferred tax assets.
Unrecognized tax benefits
The Company has total unrecognized tax benefits of $
174.9 million
and $
343.8 million
as of
December 31, 2015
, and
December 31, 2014
, respectively. The amount of unrecognized tax benefits that, if recognized, would affect the continuing operations effective tax rate are $
87.1 million
as of
December 31, 2015
. A reconciliation of the beginning and ending amount of unrecognized tax benefits is as follows:
|
In millions
|
2015
|
2014
|
2013
|
|||||||||
|
Beginning balance
|
$
|
343.8
|
|
$
|
363.3
|
|
$
|
497.5
|
|
|||
|
Additions based on tax positions related to the current year
|
8.7
|
|
6.7
|
|
19.9
|
|
||||||
|
Additions based on tax positions related to prior years
|
186.5
|
|
49.8
|
|
152.9
|
|
||||||
|
Reductions based on tax positions related to prior years
|
(102.2
|
)
|
(52.4
|
)
|
(215.3
|
)
|
||||||
|
Reductions related to settlements with tax authorities
|
(251.0
|
)
|
(8.0
|
)
|
(84.7
|
)
|
||||||
|
Reductions related to lapses of statute of limitations
|
(3.7
|
)
|
(7.1
|
)
|
(8.4
|
)
|
||||||
|
Translation (gain) loss
|
(7.2
|
)
|
(8.5
|
)
|
1.4
|
|
||||||
|
Ending balance
|
$
|
174.9
|
|
$
|
343.8
|
|
$
|
363.3
|
|
|||
The Company records interest and penalties associated with the uncertain tax positions within its Provision for income taxes. The Company had reserves associated with interest and penalties, net of tax, of $
55.5 million
and $
69.7 million
at
December 31, 2015
and
December 31, 2014
, respectively. For the year ended
December 31, 2015
and
December 31, 2014
, the Company recognized $
77.8 million
and $
2.5 million
, respectively, in interest and penalties net of tax in continuing operations related to these uncertain tax positions.
During 2015, the Company recorded a tax charge of approximately $
227 million
to continuing operations related to the increase in the liability for unrecognized tax benefits as a result of the proposed IRS settlement. Pursuant to the agreement with the IRS, the Company reduced its liability for unrecognized tax benefits for all related amounts at December 31, 2015. In addition, the Company recorded a tax benefit of approximately $
65 million
within continuing operations as a result of the settlement of an audit in a major tax jurisdiction.
In connection with the Company’s spin-off of Allegion, the Company and Allegion entered into a tax sharing agreement for the allocation of taxes. Of the total unrecognized tax benefit of
$174.9 million
at December 31, 2015, Allegion has agreed to indemnify Ingersoll Rand for
$9.0 million
, which is reflected in an other long-term receivable account. Additionally, included in an other current asset account is an indemnity receivable from Allegion in the amount of
$42.6 million
related to a filing for competent authority relief in connection with an unrecognized tax benefit included in the table above. The
$42.6 million
is exclusive of interest and penalties in the amount of
$6.5 million
. The Company also has an indemnity payable to Allegion in the amount of
$5.8 million
of tax and interest primarily related to competent authority relief filings.
F-37
During 2013, the Company recorded to continuing operations a net tax benefit of $36.0 million related to its liability for unrecognized tax benefits primarily driven by a tax benefit of $75.0 million as a result of the settlement of an audit in a major tax jurisdiction, partially offset by an increase in our liability for unrecognized tax benefits in non-U.S. tax jurisdictions.
The total amount of unrecognized tax benefits relating to the Company's tax positions is subject to change based on future events including, but not limited to, the settlements of ongoing audits and/or the expiration of applicable statutes of limitations. Although the outcomes and timing of such events are highly uncertain, it is reasonably possible that the balance of gross unrecognized tax benefits, excluding interest and penalties, could potentially be reduced by up to approximately $
64.3 million
during the next
12
months.
The provision for income taxes involves a significant amount of management judgment regarding interpretation of relevant facts and laws in the jurisdictions in which the Company operates. Future changes in applicable laws, projected levels of taxable income and tax planning could change the effective tax rate and tax balances recorded by the Company. In addition, tax authorities periodically review income tax returns filed by the Company and can raise issues regarding its filing positions, timing and amount of income or deductions, and the allocation of income among the jurisdictions in which the Company operates. A significant period of time may elapse between the filing of an income tax return and the ultimate resolution of an issue raised by a revenue authority with respect to that return. In the normal course of business the Company is subject to examination by taxing authorities throughout the world, including such major jurisdictions as Brazil, Canada, China, France, Germany, Ireland, Italy, Mexico, Switzerland, the Netherlands and the United States. In general, the examination of the Company’s material tax returns is complete for the years prior to 2003, with certain matters being resolved through appeals and litigation.
Acquisitions
Engineered Centrifugal Compression Business
On January 1, 2015, the Company completed the acquisition of the assets of Cameron International Corporation’s Centrifugal Compression ("Engineered Centrifugal Compression") business for approximately $
850 million
. The acquired business manufactures centrifugal compression equipment and provides aftermarket parts and services for global industrial applications, air separation, gas transmission and process gas. The acquisition was financed through a combination of cash on hand and debt.
The results of the Engineered Centrifugal Compression business have been included in the Company's consolidated financial statements since the date of the acquisition and are reported within the Company's Industrial segment. The aggregate value, net of cash acquired, was allocated to tangible and identifiable intangible assets acquired and liabilities assumed based on their estimated fair values at the acquisition date. During the fourth quarter of 2015, the Company finalized its fair market estimates of assets acquired and liabilities assumed.
The following table summarizes the fair values of the identifiable assets acquired and liabilities assumed as of January 1, 2015:
|
In millions
|
January 1,
2015 |
|||
|
Cash
|
$
|
10.2
|
|
|
|
Accounts receivable
|
37.7
|
|
||
|
Inventories
|
97.1
|
|
||
|
Property, plant and equipment
|
63.6
|
|
||
|
Intangible assets
|
272.2
|
|
||
|
Other assets
|
45.2
|
|
||
|
Accounts payable, accrued expenses and other liabilities
|
(119.7
|
)
|
||
|
Net identifiable assets acquired
|
406.3
|
|
||
|
Goodwill
|
431.0
|
|
||
|
Net assets acquired
|
$
|
837.3
|
|
|
F-38
The Company recorded intangible assets based on their estimate fair value, which consisted of the following:
|
In millions
|
Useful Life
|
January 1,
2015 |
||
|
Customer relationships
|
14 years
|
$
|
179.4
|
|
|
Trademarks
|
Indefinite
|
40.2
|
|
|
|
Completed technologies/patents
|
10 years
|
36.6
|
|
|
|
Other
|
2 - 5 years
|
16.0
|
|
|
|
Total
|
$
|
272.2
|
|
|
The excess of the purchase price over the estimated fair values of identifiable assets acquired was recorded as goodwill, and was equal to $
431.0 million
. This goodwill is mainly attributable to benefits the Company expects to realize by integrating Engineered Centrifugal Compression’s products with the Company's existing offerings and service network, by streamlining engineering and new product development efforts, and through other financial synergies.
FRIGOBLOCK
On March 4, 2015, the Company acquired 100% of the outstanding stock of FRIGOBLOCK for approximately €
100 million
(approximately $
113 million
). The acquired business manufactures and designs transport refrigeration units for trucks and trailers, which it sells primarily in Western Europe.
FRIGOBLOCK’s financial results are included in the Company's consolidated financial statements as of the date of acquisition and reported within the Company's Climate segment. The aggregate value, net of cash acquired, was allocated to tangible and identifiable intangible assets acquired and liabilities assumed based on their estimated fair values at the acquisition date. The excess of the purchase price over the estimated fair values of identifiable assets acquired, equal to $
64.3 million
, was recognized as goodwill. Intangible assets were identified and recorded at their estimated fair value of $
43.9 million
, and primarily consisted of customer relationships, completed technologies/patents and an indefinite-lived trademark. During the fourth quarter of 2015, the Company finalized its fair market estimates of assets acquired and liabilities assumed.
Divestitures
The components of discontinued operations for the years ended December 31 are as follows:
|
In millions
|
2015
|
2014
|
2013
|
|||||||||
|
Net revenues
|
$
|
—
|
|
$
|
—
|
|
$
|
1,889.9
|
|
|||
|
Pre-tax earnings (loss) from operations
|
$
|
(23.2
|
)
|
$
|
41.2
|
|
$
|
84.7
|
|
|||
|
Tax expense
|
(1.1
|
)
|
(6.5
|
)
|
(71.4
|
)
|
||||||
|
Discontinued operations, net of tax
|
$
|
(24.3
|
)
|
$
|
34.7
|
|
$
|
13.3
|
|
|||
Discontinued operations by business for the years ended December 31 are as follows:
|
In millions
|
2015
|
2014
|
2013
|
|||||||||
|
Allegion, net of tax
|
$
|
(4.5
|
)
|
$
|
15.0
|
|
$
|
12.4
|
|
|||
|
Other discontinued operations, net of tax
|
(19.8
|
)
|
19.7
|
|
0.9
|
|
||||||
|
Discontinued operations, net of tax
|
$
|
(24.3
|
)
|
$
|
34.7
|
|
$
|
13.3
|
|
|||
Allegion Spin-Off
On December 1, 2013, the Company completed the previously announced separation of its commercial and residential security businesses by distributing the related ordinary shares of Allegion, on a pro rata basis, to the Company's shareholders of record as of November 22, 2013. Allegion is now an independently traded publicly company. The results of the commercial and residential security businesses prior to the spin-off are presented as a discontinued operation on the Consolidated Statement of Comprehensive Income and Consolidated Statement of Cash Flows for all periods presented.
After-tax earnings from Allegion for the years ended December 31, 2015 and 2014 primarily represent adjustments for certain tax matters. After-tax earnings from Allegion for the year ended December 31, 2013 includes spin costs of
$128.0 million
. Also, the 2013 results include non-cash goodwill charges and tax of
$111.4 million
and
$148.2 million
, respectively. See below for further discussion of the impairment.
F-39
During the third quarter of 2013, prior to the spin-off, the Company recorded a non-cash, pre-tax goodwill impairment charge of
$111.4 million
(
$106.2 million
after-tax) related to Europe, Middle East, India and Africa (EMEIA) reporting unit of Allegion. This charge is reflected within Discontinued operations, net of tax, for the year ended December 31, 2013.
Other Discontinued Operations
Other discontinued operations, net of tax for the years ended December 31, 2015 and 2014 are mainly related to postretirement benefits, product liability, worker's compensation, tax, and legal costs (mostly asbestos-related) from previously sold businesses.
Basic EPS is calculated by dividing Net earnings attributable to Ingersoll-Rand plc by the weighted-average number of ordinary shares outstanding for the applicable period. Diluted EPS is calculated after adjusting the denominator of the basic EPS calculation for the effect of all potentially dilutive ordinary shares, which in the Company’s case, includes shares issuable under share-based compensation plans. The following table summarizes the weighted-average number of ordinary shares outstanding for basic and diluted earnings per share calculations:
|
In millions
|
2015
|
2014
|
2013
|
||||||
|
Weighted-average number of basic shares outstanding
|
265.1
|
|
270.5
|
|
294.1
|
|
|||
|
Shares issuable under incentive stock plans
|
2.7
|
|
3.8
|
|
4.2
|
|
|||
|
Weighted-average number of diluted shares outstanding
|
267.8
|
|
274.3
|
|
298.3
|
|
|||
|
Anti-dilutive shares
|
2.1
|
|
1.1
|
|
19.1
|
|
|||
The Company is involved in various litigations, claims and administrative proceedings, including those related to environmental, asbestos, and product liability matters. Amounts recorded for identified contingent liabilities are estimates, which are reviewed periodically and adjusted to reflect additional information when it becomes available. Subject to the uncertainties inherent in estimating future costs for contingent liabilities, except as expressly set forth in this note, management believes that any liability which may result from these legal matters would not have a material adverse effect on the financial condition, results of operations, liquidity or cash flows of the Company.
Environmental Matters
The Company continues to be dedicated to an environmental program to reduce the utilization and generation of hazardous materials during the manufacturing process and to remediate identified environmental concerns. As to the latter, the Company is currently engaged in site investigations and remediation activities to address environmental cleanup from past operations at current and former manufacturing facilities.
The Company is sometimes a party to environmental lawsuits and claims and has received notices of potential violations of environmental laws and regulations from the Environmental Protection Agency and similar state authorities. It has also been identified as a potentially responsible party (PRP) for cleanup costs associated with off-site waste disposal at federal Superfund and state remediation sites. For all such sites, there are other PRPs and, in most instances, the Company’s involvement is minimal.
In estimating its liability, the Company has assumed it will not bear the entire cost of remediation of any site to the exclusion of other PRPs who may be jointly and severally liable. The ability of other PRPs to participate has been taken into account, based on the Company's understanding of the parties’ financial condition and probable contributions on a per site basis. Additional lawsuits and claims involving environmental matters are likely to arise from time to time in the future.
As of
December 31, 2015
and
2014
, the Company has recorded reserves for environmental matters of $
43.8 million
and $
45.2 million
, respectively. Of these amounts $
35.5 million
and $
36.3 million
, respectively, relate to remediation of sites previously disposed by the Company.
Asbestos-Related Matters
Certain wholly-owned subsidiaries of the Company are named as defendants in asbestos-related lawsuits in state and federal courts. In virtually all of the suits, a large number of other companies have also been named as defendants. The vast majority of those claims have been filed against either Ingersoll-Rand Company (IR-New Jersey) or Trane U.S. Inc. (Trane) and generally allege injury caused by exposure to asbestos contained in certain historical products sold by IR-New Jersey or Trane, primarily pumps, boilers and railroad brake shoes. None of our existing or previously-owned businesses were a producer or manufacturer of asbestos.
The Company engages an outside expert to assist in calculating an estimate of the Company’s total liability for pending and unasserted future asbestos-related claims and annually performs a detailed analysis with the assistance of an outside expert to
F-40
update its estimated asbestos-related assets and liabilities. The methodology used to project the Company’s total liability for pending and unasserted potential future asbestos-related claims relied upon and included the following factors, among others:
|
•
|
the outside expert’s interpretation of a widely accepted forecast of the population likely to have been occupationally exposed to asbestos;
|
|
•
|
epidemiological studies estimating the number of people likely to develop asbestos-related diseases such as mesothelioma and lung cancer;
|
|
•
|
the Company’s historical experience with the filing of non-malignancy claims and claims alleging other types of malignant diseases filed against the Company relative to the number of lung cancer claims filed against the Company;
|
|
•
|
the outside expert’s analysis of the number of people likely to file an asbestos-related personal injury claim against the Company based on such epidemiological and historical data and the Company’s most recent three-year claims history;
|
|
•
|
an analysis of the Company’s pending cases, by type of disease claimed and by year filed;
|
|
•
|
an analysis of the Company’s most recent three-year history to determine the average settlement and resolution value of claims, by type of disease claimed;
|
|
•
|
an adjustment for inflation in the future average settlement value of claims, at a
2.5%
annual inflation rate, adjusted downward to
1.5%
to take account of the declining value of claims resulting from the aging of the claimant population; and
|
|
•
|
an analysis of the period over which the Company has and is likely to resolve asbestos-related claims against it in the future.
|
At
December 31, 2015
, over
80 percent
of the open claims against the Company are non-malignancy or unspecified disease claims, many of which have been placed on inactive or deferral dockets and the vast majority of which have little or no settlement value against the Company, particularly in light of recent changes in the legal and judicial treatment of such claims.
The Company’s liability for asbestos-related matters and the asset for probable asbestos-related insurance recoveries are included in the following balance sheet accounts:
|
In millions
|
December 31,
2015 |
December 31,
2014 |
|||||
|
Accrued expenses and other current liabilities
|
$
|
65.7
|
|
$
|
67.6
|
|
|
|
Other noncurrent liabilities
|
648.0
|
|
709.0
|
|
|||
|
Total asbestos-related liabilities
|
$
|
713.7
|
|
$
|
776.6
|
|
|
|
Other current assets
|
$
|
51.3
|
|
$
|
57.2
|
|
|
|
Other noncurrent assets
|
264.3
|
|
278.5
|
|
|||
|
Total asset for probable asbestos-related insurance recoveries
|
$
|
315.6
|
|
$
|
335.7
|
|
|
The Company's asbestos insurance receivable related to IR-New Jersey and Trane was $
166.4 million
and $
149.2 million
at
December 31, 2015
, and $
176.8 million
and $
158.9 million
at
December 31, 2014
, respectively.
The (costs) income associated with the settlement and defense of asbestos-related claims after insurance recoveries, for the years ended December 31, were as follows:
|
In millions
|
2015
|
2014
|
2013
|
|||||||||
|
Continuing operations
|
$
|
21.0
|
|
$
|
1.7
|
|
$
|
(0.4
|
)
|
|||
|
Discontinued operations
|
(8.8
|
)
|
63.2
|
|
(55.8
|
)
|
||||||
|
Total
|
$
|
12.2
|
|
$
|
64.9
|
|
$
|
(56.2
|
)
|
|||
Income and expense associated with IR-New Jersey's asbestos liabilities and corresponding insurance recoveries are recorded within discontinued operations, as they relate to previously divested businesses, primarily Ingersoll-Dresser Pump, which was sold in 2000. Income and expenses associated with Trane’s asbestos liabilities and corresponding insurance recoveries are recorded within continuing operations. During the second quarter of 2015, the Company reached a settlement with insurance carriers related to Trane asbestos matters.
The receivable attributable to Trane for probable insurance recoveries as of
December 31, 2015
is entirely supported by settlement agreements between Trane and the respective insurance carriers. Most of these settlement agreements constitute “coverage-in-place” arrangements, in which the insurer signatories agree to reimburse Trane for specified portions of its costs for asbestos bodily injury claims and Trane agrees to certain claims-handling protocols and grants to the insurer signatories certain releases and indemnifications.
F-41
In 2012 and 2013, IR-New Jersey filed actions in the Superior Court of New Jersey, Middlesex County, seeking a declaratory judgment and other relief regarding the Company's rights to defense and indemnity for asbestos claims. The defendants are several dozen solvent insurance companies, including companies that had been paying a portion of IR-New Jersey's asbestos claim defense and indemnity costs. The action involves certain of IR-New Jersey's unexhausted insurance policies applicable to the asbestos claims that are not subject to any settlement agreement. The responding defendants generally challenged the Company's right to recovery, and raised various coverage defenses.
The Company continually monitors the status of pending litigation that could impact the allocation of asbestos claims against the Company's various insurance policies. The Company has concluded that its IR-New Jersey insurance receivable is probable of recovery because of the following factors:
|
•
|
IR-New Jersey has reached favorable settlements regarding asbestos coverage claims for the majority of its recorded asbestos-related insurance receivable;
|
|
•
|
a review of other companies in circumstances comparable to IR-New Jersey, including Trane, and the success of other companies in recovering under their insurance policies, including Trane's favorable settlement discussed above;
|
|
•
|
the Company's confidence in its right to recovery under the terms of its policies and pursuant to applicable law; and
|
|
•
|
the Company's history of receiving payments under the IR-New Jersey insurance program, including under policies that had been the subject of prior litigation.
|
The amounts recorded by the Company for asbestos-related liabilities and insurance-related assets are based on currently available information. The Company’s actual liabilities or insurance recoveries could be significantly higher or lower than those recorded if assumptions used in the calculations vary significantly from actual results. Key variables in these assumptions include the number and type of new claims to be filed each year, the average cost of resolution of each such new claim, the resolution of coverage issues with insurance carriers, and the solvency risk with respect to the Company’s insurance carriers. Furthermore, predictions with respect to these variables are subject to greater uncertainty as the projection period lengthens. Other factors that may affect the Company’s liability include uncertainties surrounding the litigation process from jurisdiction to jurisdiction and from case to case, reforms that may be made by state and federal courts, and the passage of state or federal tort reform legislation.
The aggregate amount of the stated limits in insurance policies available to the Company for asbestos-related claims acquired over many years and from many different carriers, is substantial. However, limitations in that coverage, primarily due to the considerations described above, are expected to result in the projected total liability to claimants substantially exceeding the probable insurance recovery.
Warranty Liability
Standard product warranty accruals are recorded at the time of sale and are estimated based upon product warranty terms and historical experience. The Company assesses the adequacy of its liabilities and will make adjustments as necessary based on known or anticipated warranty claims, or as new information becomes available.
The changes in the standard product warranty liability for the year ended
December 31,
were as follows:
|
In millions
|
2015
|
2014
|
|||||
|
Balance at beginning of period
|
$
|
253.6
|
|
$
|
246.9
|
|
|
|
Reductions for payments
|
(128.8
|
)
|
(146.6
|
)
|
|||
|
Accruals for warranties issued during the current period
|
127.8
|
|
168.0
|
|
|||
|
Accruals for warranties assumed from acquisitions during the current period
|
9.7
|
|
—
|
|
|||
|
Changes to accruals related to preexisting warranties
|
4.5
|
|
(9.8
|
)
|
|||
|
Translation
|
(4.8
|
)
|
(4.9
|
)
|
|||
|
Balance at end of period
|
$
|
262.0
|
|
$
|
253.6
|
|
|
Standard product warranty liabilities are classified as Accrued expenses and other current liabilities, or Other noncurrent liabilities based on their expected term. The Company's total current standard product warranty reserve at
December 31, 2015
and
December 31, 2014
was $
152.6 million
and $
147.8 million
, respectively.
The Company's extended warranty liability represents the deferred revenue associated with its extended warranty contracts and is amortized into Revenue on a straight-line basis over the life of the contract, unless another method is more representative of the costs incurred. The Company assesses the adequacy of its liability by evaluating the expected costs under its existing contracts to ensure these expected costs do not exceed the extended warranty liability.
F-42
The changes in the extended warranty liability for the year ended
December 31,
were as follows:
|
In millions
|
2015
|
2014
|
|||||
|
Balance at beginning of period
|
$
|
330.1
|
|
$
|
357.9
|
|
|
|
Amortization of deferred revenue for the period
|
(107.7
|
)
|
(104.8
|
)
|
|||
|
Additions for extended warranties issued during the period
|
89.7
|
|
81.5
|
|
|||
|
Changes to accruals related to preexisting warranties
|
2.3
|
|
(2.6
|
)
|
|||
|
Translation
|
(2.8
|
)
|
(1.9
|
)
|
|||
|
Balance at end of period
|
$
|
311.6
|
|
$
|
330.1
|
|
|
The extended warranty liability is presented within Accrued expenses and other current liabilities or Other noncurrent liabilities based on the timing of when the deferred revenue is expected to be amortized into Revenue. The Company's total current extended warranty liability at
December 31, 2015
and
December 31, 2014
was $
97.5 million
and $
97.2 million
, respectively. For the years ended
December 31, 2015
and
2014
, the Company incurred costs of $
63.4 million
and $
63.5 million
, respectively, related to extended warranties.
Other Commitments and Contingencies
Certain office and warehouse facilities, transportation vehicles and data processing equipment are leased by the Company. Total rental expense was $
166.7 million
in
2015
, $
171.6 million
in
2014
and $
165.0 million
in
2013
. Minimum lease payments required under non-cancelable operating leases with terms in excess of one year for the next five years are as follows: $
118.3 million
in 2016, $
92.8 million
in 2017, $
66.8 million
in 2018, $
48.7 million
in 2019, and $
36.1 million
in 2020.
Trane has commitments and performance guarantees, including energy savings guarantees, totaling $
423.1 million
extending from 2016-2036. These guarantees are provided under long-term service and maintenance contracts related to its air conditioning equipment and system controls. Through
2015
, the Company has experienced no significant losses under such arrangements and considers the probability of any significant future losses to be remote.
Refer to Note 15 for a discussion of income tax-related contingencies.
The accounting policies of the operating segments are the same as those described in the summary of significant accounting policies except that the operating segments’ results are prepared on a management basis that is consistent with the manner in which the Company prepares financial information for internal review and decision making. The Company largely evaluates performance based on Segment operating income and Segment operating margins. Intercompany sales between segments are considered immaterial.
The Company's Climate segment globally delivers energy-efficient products and innovative energy services. It includes Trane
®
and American Standard
®
Heating & Air Conditioning which provide heating, ventilation and air conditioning (HVAC) systems, and commercial and residential building services, parts, support and controls; energy services and building automation through Trane Building Advantage and Nexia; and Thermo King
®
transport temperature control solutions.
The Company's Industrial segment delivers products and services that enhance energy efficiency, productivity and operations. It includes compressed air and gas systems and services, power tools, material handling systems, ARO
®
fluid management equipment, as well as Club Car
®
golf, utility and rough terrain vehicles.
Segment operating income is the measure of profit and loss that the Company's chief operating decision maker uses to evaluate the financial performance of the business and as the basis for performance reviews, compensation and resource allocation. For these reasons, the Company believes that Segment operating income represents the most relevant measure of segment profit and loss. The Company may exclude certain charges or gains from Operating income to arrive at a Segment operating income that is a more meaningful measure of profit and loss upon which to base its operating decisions.
F-43
A summary of operations by reportable segments for the years ended December 31 were as follows:
|
Dollar amounts in millions
|
2015
|
2014
|
2013
|
|||||||||
|
Climate
|
||||||||||||
|
Net revenues
|
$
|
10,224.3
|
|
$
|
9,879.7
|
|
$
|
9,414.0
|
|
|||
|
Segment operating income
|
1,302.5
|
|
1,195.6
|
|
936.0
|
|
||||||
|
Segment operating income as a percentage of revenues
|
12.7
|
%
|
12.1
|
%
|
9.9
|
%
|
||||||
|
Depreciation and amortization
|
246.3
|
|
247.1
|
|
252.8
|
|
||||||
|
Capital expenditures
|
83.9
|
|
107.8
|
|
129.4
|
|
||||||
|
Industrial
|
||||||||||||
|
Net revenues
|
3,076.4
|
|
3,011.7
|
|
2,936.5
|
|
||||||
|
Segment operating income
|
372.4
|
|
443.0
|
|
450.3
|
|
||||||
|
Segment operating income as a percentage of revenues
|
12.1
|
%
|
14.7
|
%
|
15.3
|
%
|
||||||
|
Depreciation and amortization
|
67.5
|
|
44.2
|
|
43.9
|
|
||||||
|
Capital expenditures
|
51.8
|
|
33.1
|
|
44.0
|
|
||||||
|
Total net revenues
|
$
|
13,300.7
|
|
$
|
12,891.4
|
|
$
|
12,350.5
|
|
|||
|
Reconciliation to Operating Income
|
||||||||||||
|
Segment operating income from reportable segments
|
1,674.9
|
|
1,638.6
|
|
1,386.3
|
|
||||||
|
Unallocated corporate expense
|
(216.9
|
)
|
(233.9
|
)
|
(281.3
|
)
|
||||||
|
Total operating income
|
$
|
1,458.0
|
|
$
|
1,404.7
|
|
$
|
1,105.0
|
|
|||
|
Total operating income as a percentage of revenues
|
11.0
|
%
|
10.9
|
%
|
8.9
|
%
|
||||||
|
Depreciation and Amortization
|
||||||||||||
|
Depreciation and amortization from reportable segments
|
313.8
|
|
291.3
|
|
296.7
|
|
||||||
|
Unallocated depreciation and amortization
|
50.3
|
|
41.1
|
|
37.0
|
|
||||||
|
Total depreciation and amortization
|
$
|
364.1
|
|
|
$
|
332.4
|
|
|
$
|
333.7
|
|
|
|
Capital Expenditures
|
||||||||||||
|
Capital expenditures from reportable segments
|
135.7
|
|
140.9
|
|
173.4
|
|
||||||
|
Corporate capital expenditures
|
113.9
|
|
92.6
|
|
68.8
|
|
||||||
|
Total capital expenditures
|
$
|
249.6
|
|
$
|
233.5
|
|
$
|
242.2
|
|
|||
A summary of Net revenues by destination and by major product/solution for the years ended December 31 were as follows:
|
In millions
|
2015
|
2014
|
2013
|
|||||||||
|
United States
|
$
|
8,291.2
|
|
$
|
7,693.0
|
|
$
|
7,298.0
|
|
|||
|
Non-U.S.
|
5,009.5
|
|
5,198.4
|
|
5,052.5
|
|
||||||
|
Total
|
$
|
13,300.7
|
|
$
|
12,891.4
|
|
$
|
12,350.5
|
|
|||
|
In millions
|
2015
|
2014
|
2013
|
|||||||||
|
Commercial HVAC
|
$
|
6,233.8
|
|
$
|
6,049.8
|
|
$
|
5,874.7
|
|
|||
|
Transport Refrigeration
|
2,147.8
|
|
2,089.2
|
|
1,895.0
|
|
||||||
|
Residential HVAC
|
1,842.6
|
|
1,740.7
|
|
1,644.3
|
|
||||||
|
Compression Technologies and Services
|
1,932.5
|
|
1,812.3
|
|
1,762.0
|
|
||||||
|
Other Industrial
|
1,144.0
|
|
1,199.4
|
|
1,174.5
|
|
||||||
|
Total
|
$
|
13,300.7
|
|
$
|
12,891.4
|
|
$
|
12,350.5
|
|
|||
In fiscal years 2015, 2014 and 2013, no customer exceeded 10% of consolidated net sales.
F-44
At December 31, summary of long-lived assets by geographic area were as follows:
|
In millions
|
2015
|
|
2014
|
|||||
|
United States
|
$
|
2,196.1
|
|
$
|
2,121.2
|
|
||
|
Non-U.S.
|
651.3
|
|
537.7
|
|
||||
|
Total
|
$
|
2,847.4
|
|
$
|
2,658.9
|
|
||
F-45
Ingersoll-Rand plc (Plc or Parent Company) and certain of its 100% directly or indirectly owned subsidiaries provide guarantees of public debt issued by other 100% directly or indirectly owned subsidiaries. The following condensed consolidating financial information is provided so that separate financial statements of these subsidiary issuer and guarantors are not required to be filed with the U.S. Securities and Exchange Commission.
The following table shows the Company’s guarantor relationships as of December 31, 2015:
|
Parent, issuer or guarantors
|
Notes issued
|
Notes guaranteed
|
|
Ingersoll-Rand plc (Plc)
|
None
|
All registered notes and debentures
|
|
Ingersoll-Rand International Holding Limited (International Holding)
|
None
|
All registered notes and debentures
|
|
Ingersoll-Rand Lux International Holding Company S.a.r.l. (Lux International)
|
None
|
All notes issued by Global Holding and Lux Finance
(1)
|
|
Ingersoll-Rand Global Holding Company Limited (Global Holding)
|
6.875% Senior notes due 2018
(2)
2.875% Senior notes due 2019
(2)
4.250% Senior notes due 2023
(2)
5.750% Senior notes due 2043
(2)
|
All notes issued by Lux Finance
|
|
Ingersoll-Rand Company (New Jersey)
|
9.000% Debentures due 2021
7.200% Debentures due 2016-2025
6.48% Debentures due 2025
Puttable debentures due 2027-2028
|
All notes issued by Global and Lux Finance
|
|
Ingersoll-Rand Luxembourg Finance S.A. (Lux Finance)
|
2.625% Notes due 2020
3.55% Notes due 2024
4.650% Notes due 2044
|
All notes and debentures issued by Global and New Jersey
|
(1) In the fourth quarter of 2015, Lux International was added as a guarantor of notes previously issued by Global Holding and Lux Finance
(2) In 2013, New Jersey was added as a co-obligor of notes previously issued by Global Holding
Each subsidiary debt issuer and guarantor is owned 100% directly or indirectly by the Parent Company. Each guarantee is full and unconditional, and provided on a joint and several basis. There are no significant restrictions of the Parent Company, or any guarantor, to obtain funds from its subsidiaries, such as provisions in debt agreements that prohibit dividend payments, loans or advances to the parent by a subsidiary.
Basis of presentation
The following Condensed Consolidating Financial Statements present the financial position, results of operations and cash flows of each issuer or guarantor on a legal entity basis. The financial information for all periods has been presented based on the Company’s legal entity ownerships and guarantees outstanding at December 31, 2015. Assets and liabilities are attributed to each issuer and guarantor generally based on legal entity ownership. Investments in subsidiaries of the Parent Company, subsidiary guarantors and issuers represent the proportionate share of their subsidiaries’ net assets. Certain adjustments are needed to consolidate the Parent Company and its subsidiaries, including the elimination of investments in subsidiaries and related activity that occurs between entities in different columns. These adjustments are presented in the Consolidating Adjustments column. This basis of presentation is intended to comply with the specific reporting requirements for subsidiary issuers and guarantors, and is not intended to present the Company’s financial position or results of operations or cash flows for any other purpose.
Revisions of prior year financial information to reflect changes in guarantor subsidiaries
During the fourth quarter of 2015, Ingersoll-Rand Company Limited, formerly a guarantor, was merged into its wholly-owned subsidiary, International Holding. Also during the fourth quarter of 2015, ownership of Global Holding was transferred from International Holding to Lux International in a non-cash exchange that increased an existing intercompany loan to $
20.1 billion
at December 31, 2015. Lux International was subsequently added as a guarantor of all notes issued by Global Holding and Lux Finance. The Condensed Consolidated Financial Statements were revised to present the financial statements as of and for the years ended December 31, 2013 and 2014 of the issuer and guarantor subsidiaries based on their composition at December 31, 2015. These transactions had no impact on the composition of the Company’s consolidated group and had no effect on the Consolidated Financial Statements.
F-46
Revisions of prior year financial information to correct the presentation of intercompany activity
Also in the fourth quarter of 2015, the Condensed Consolidated Financial Statements of the guarantor and issuer subsidiaries for prior periods were revised to correct the presentation of certain intercompany activity on the Condensed Consolidating Statements of Comprehensive Income, Condensed Consolidating Balance Sheet, and Condensed Consolidating Statements of Cash Flows. The tables below show the effect of these corrections on each of the revised statements. The Company assessed the materiality of these revisions on previously issued financial statements and concluded that the revisions were not material to the Consolidated Financial Statements taken as a whole.
Revisions to Condensed Consolidating Statement of Comprehensive Income for the year ended December 31, 2014:
|
in millions
|
Plc
|
International
Holding |
Lux
International |
Global
Holding |
New Jersey
|
Lux
Finance |
Other
Subsidiaries
|
Consolidating
Adjustments |
Consolidated
|
||||||||||||||||||
|
Net revenues
|
$
|
—
|
|
$
|
—
|
|
$
|
—
|
|
$
|
—
|
|
$
|
272.7
|
|
$
|
—
|
|
$
|
115.1
|
|
$
|
(387.8
|
)
|
$
|
—
|
|
|
Cost of goods sold
|
—
|
|
—
|
|
—
|
|
—
|
|
(272.7
|
)
|
—
|
|
(115.1
|
)
|
387.8
|
|
—
|
|
|||||||||
|
Selling and administrative expenses
|
(8.8
|
)
|
—
|
|
—
|
|
—
|
|
113.6
|
|
—
|
|
(104.8
|
)
|
—
|
|
—
|
|
|||||||||
|
Operating income (loss)
|
(8.8
|
)
|
—
|
|
—
|
|
—
|
|
113.6
|
|
—
|
|
(104.8
|
)
|
—
|
|
—
|
|
|||||||||
|
Equity earnings (loss) in subsidiaries, net of tax
|
—
|
|
(360.8
|
)
|
—
|
|
119.4
|
|
386.4
|
|
(21.0
|
)
|
(1,271.2
|
)
|
1,147.2
|
|
—
|
|
|||||||||
|
Other income/(expense), net
|
8.8
|
|
—
|
|
—
|
|
—
|
|
(113.6
|
)
|
—
|
|
104.8
|
|
—
|
|
—
|
|
|||||||||
|
Net earnings
|
—
|
|
(360.8
|
)
|
—
|
|
119.4
|
|
386.4
|
|
(21.0
|
)
|
(1,271.2
|
)
|
1,147.2
|
|
—
|
|
|||||||||
|
Other comprehensive income
|
—
|
|
(549.5
|
)
|
—
|
|
(261.5
|
)
|
(225.0
|
)
|
—
|
|
(30.1
|
)
|
1,066.1
|
|
—
|
|
|||||||||
|
Comprehensive income attributable to Ingersoll-Rand plc
|
$
|
—
|
|
$
|
(910.3
|
)
|
$
|
—
|
|
$
|
(142.1
|
)
|
$
|
161.4
|
|
$
|
(21.0
|
)
|
$
|
(1,301.3
|
)
|
$
|
2,213.3
|
|
$
|
—
|
|
Revisions to Condensed Consolidating Balance Sheet as of December 31, 2014:
|
in millions
|
Plc
|
International
Holding
|
Lux
International
|
Global
Holding
|
New Jersey
|
Lux
Finance
|
Other
Subsidiaries |
Consolidating
Adjustments |
Consolidated
|
||||||||||||||||||
|
Intercompany receivables
|
$
|
—
|
|
$
|
(309.5
|
)
|
$
|
—
|
|
$
|
(8.0
|
)
|
$
|
888.2
|
|
$
|
(50.7
|
)
|
$
|
(6,768.3
|
)
|
$
|
6,248.3
|
|
$
|
—
|
|
|
Investments in consolidated subsidiaries
|
—
|
|
2,276.9
|
|
—
|
|
(3,623.8
|
)
|
1,596.9
|
|
(214.7
|
)
|
(8,645.5
|
)
|
8,610.2
|
|
—
|
|
|||||||||
|
Intercompany notes receivable
|
—
|
|
—
|
|
—
|
|
—
|
|
—
|
|
—
|
|
5,471.6
|
|
(5,471.6
|
)
|
—
|
|
|||||||||
|
Total assets
|
$
|
—
|
|
$
|
1,967.4
|
|
$
|
—
|
|
$
|
(3,631.8
|
)
|
$
|
2,485.1
|
|
$
|
(265.4
|
)
|
$
|
(9,942.2
|
)
|
$
|
9,386.9
|
|
$
|
—
|
|
|
Intercompany payables
|
$
|
—
|
|
$
|
—
|
|
$
|
—
|
|
$
|
(436.8
|
)
|
$
|
(4,143.1
|
)
|
$
|
—
|
|
$
|
(1,669.1
|
)
|
$
|
6,249.0
|
|
$
|
—
|
|
|
Intercompany notes payable
|
—
|
|
—
|
|
—
|
|
429.0
|
|
5,042.6
|
|
—
|
|
—
|
|
(5,471.6
|
)
|
—
|
|
|||||||||
|
Equity
|
—
|
|
1,967.4
|
|
—
|
|
(3,624.0
|
)
|
1,585.6
|
|
(265.4
|
)
|
(8,273.1
|
)
|
8,609.5
|
|
—
|
|
|||||||||
|
Total liabilities and equity
|
$
|
—
|
|
$
|
1,967.4
|
|
$
|
—
|
|
$
|
(3,631.8
|
)
|
$
|
2,485.1
|
|
$
|
(265.4
|
)
|
$
|
(9,942.2
|
)
|
$
|
9,386.9
|
|
$
|
—
|
|
Revisions to Condensed Consolidating Statement of Cash Flows for the year ended December 31, 2014:
|
in millions
|
Plc
|
International
Holding |
Lux
International |
Global
Holding |
New Jersey
|
Lux
Finance |
Other
Subsidiaries |
Consolidating
Adjustments |
Consolidated
|
||||||||||||||||||
|
Cash flows from operating activities
|
$
|
(126.0
|
)
|
$
|
(14.1
|
)
|
$
|
—
|
|
$
|
3.1
|
|
$
|
(17.8
|
)
|
$
|
8.0
|
|
$
|
(849.2
|
)
|
$
|
996.0
|
|
$
|
—
|
|
|
Intercompany investing activities, net
|
(454.8
|
)
|
1,150.6
|
|
—
|
|
206.6
|
|
830.5
|
|
—
|
|
235.5
|
|
(1,968.4
|
)
|
—
|
|
|||||||||
|
Net cash flow provided by (used in) investing activities
|
(454.8
|
)
|
1,150.6
|
|
—
|
|
206.6
|
|
830.5
|
|
—
|
|
235.5
|
|
(1,968.4
|
)
|
—
|
|
|||||||||
|
Dividends paid to ordinary shareholders
|
—
|
|
—
|
|
—
|
|
—
|
|
734.1
|
|
—
|
|
318.2
|
|
(1,052.3
|
)
|
—
|
|
|||||||||
|
Intercompany financing activities, net
|
580.8
|
|
(1,136.5
|
)
|
—
|
|
(209.7
|
)
|
(1,512.7
|
)
|
(8.0
|
)
|
261.4
|
|
2,024.7
|
|
—
|
|
|||||||||
|
Net cash flow provided by (used in) financing activities
|
580.8
|
|
(1,136.5
|
)
|
—
|
|
(209.7
|
)
|
(778.6
|
)
|
(8.0
|
)
|
579.6
|
|
972.4
|
|
—
|
|
|||||||||
|
Net increase (decrease) in cash
|
$
|
—
|
|
$
|
—
|
|
$
|
—
|
|
$
|
—
|
|
$
|
34.1
|
|
$
|
—
|
|
$
|
(34.1
|
)
|
$
|
—
|
|
$
|
—
|
|
F-47
Revisions to Condensed Consolidating Statement of Comprehensive Income for the year ended December 31, 2013:
|
in millions
|
Plc
|
International
Holding |
Lux
International |
Global
Holding |
New Jersey
|
Lux
Finance |
Other
Subsidiaries |
Consolidating
Adjustments |
Consolidated
|
||||||||||||||||||
|
Net revenues
|
$
|
—
|
|
$
|
—
|
|
$
|
—
|
|
$
|
—
|
|
$
|
261.9
|
|
$
|
—
|
|
$
|
131.7
|
|
$
|
(393.6
|
)
|
$
|
—
|
|
|
Cost of goods sold
|
—
|
|
—
|
|
—
|
|
—
|
|
(279.7
|
)
|
—
|
|
(113.9
|
)
|
393.6
|
|
—
|
|
|||||||||
|
Selling and administrative expenses
|
(6.3
|
)
|
—
|
|
—
|
|
—
|
|
139.0
|
|
—
|
|
(133.3
|
)
|
0.6
|
|
—
|
|
|||||||||
|
Operating income (loss)
|
(6.3
|
)
|
—
|
|
—
|
|
—
|
|
121.2
|
|
—
|
|
(115.5
|
)
|
0.6
|
|
—
|
|
|||||||||
|
Equity earnings (loss) in subsidiaries, net of tax
|
—
|
|
(146.1
|
)
|
—
|
|
(805.9
|
)
|
235.0
|
|
107.9
|
|
(743.9
|
)
|
1,353.0
|
|
—
|
|
|||||||||
|
Other income/(expense), net
|
6.3
|
|
—
|
|
—
|
|
—
|
|
(135.3
|
)
|
—
|
|
129.0
|
|
—
|
|
—
|
|
|||||||||
|
Net earnings
|
—
|
|
(146.1
|
)
|
—
|
|
(805.9
|
)
|
220.9
|
|
107.9
|
|
(730.4
|
)
|
1,353.6
|
|
—
|
|
|||||||||
|
Other comprehensive income
|
—
|
|
293.4
|
|
—
|
|
133.1
|
|
(232.4
|
)
|
—
|
|
330.6
|
|
(524.7
|
)
|
—
|
|
|||||||||
|
Comprehensive income attributable to Ingersoll-Rand plc
|
$
|
—
|
|
$
|
147.3
|
|
$
|
—
|
|
$
|
(672.8
|
)
|
$
|
(11.5
|
)
|
$
|
107.9
|
|
$
|
(399.8
|
)
|
$
|
828.9
|
|
$
|
—
|
|
Revisions to Condensed Consolidating Statement of Cash Flows for the year ended December 31, 2013:
|
in millions
|
Plc
|
International
Holding |
Lux
International |
Global
Holding |
New Jersey
|
Lux
Finance |
Other
Subsidiaries |
Consolidating
Adjustments |
Consolidated
|
||||||||||||||||||
|
Cash flows from operating activities
|
$
|
(33.8
|
)
|
$
|
(37.2
|
)
|
$
|
—
|
|
$
|
(17.7
|
)
|
$
|
650.6
|
|
$
|
—
|
|
$
|
(6,238.2
|
)
|
$
|
5,676.3
|
|
$
|
—
|
|
|
Intercompany investing activities, net
|
—
|
|
1,313.3
|
|
—
|
|
777.2
|
|
(221.9
|
)
|
—
|
|
1,273.2
|
|
(3,141.8
|
)
|
—
|
|
|||||||||
|
Net cash flow provided by (used in) investing activities
|
—
|
|
1,313.3
|
|
—
|
|
777.2
|
|
(221.9
|
)
|
—
|
|
1,273.2
|
|
(3,141.8
|
)
|
—
|
|
|||||||||
|
Dividends paid to ordinary shareholders
|
—
|
|
685.5
|
|
—
|
|
1,274.2
|
|
—
|
|
—
|
|
1.2
|
|
(1,960.9
|
)
|
—
|
|
|||||||||
|
Intercompany financing activities, net
|
33.8
|
|
(1,961.6
|
)
|
—
|
|
(2,033.7
|
)
|
(462.8
|
)
|
—
|
|
4,997.9
|
|
(573.6
|
)
|
—
|
|
|||||||||
|
Net cash flow provided by (used in) financing activities
|
33.8
|
|
(1,276.1
|
)
|
—
|
|
(759.5
|
)
|
(462.8
|
)
|
—
|
|
4,999.1
|
|
(2,534.5
|
)
|
—
|
|
|||||||||
|
Net increase (decrease) in cash
|
—
|
|
—
|
|
—
|
|
—
|
|
(34.1
|
)
|
—
|
|
34.1
|
|
—
|
|
—
|
|
|||||||||
F-48
For the year ended December 31, 2015
|
In millions
|
Plc
|
International
Holding |
Lux International
|
Global
Holding |
New
Jersey |
Lux
Finance |
Other
Subsidiaries |
Consolidating
Adjustments |
Consolidated |
||||||||||||||||||||||||||
|
Net revenues
|
$
|
—
|
|
$
|
—
|
|
$
|
—
|
|
$
|
—
|
|
$
|
1,427.9
|
|
$
|
—
|
|
$
|
12,259.0
|
|
$
|
(386.2
|
)
|
$
|
13,300.7
|
|
||||||||
|
Cost of goods sold
|
—
|
|
—
|
|
—
|
|
—
|
|
(1,031.7
|
)
|
—
|
|
(8,656.1
|
)
|
386.2
|
|
(9,301.6
|
)
|
|||||||||||||||||
|
Selling and administrative expenses
|
(18.9
|
)
|
—
|
|
(0.1
|
)
|
(0.1
|
)
|
(303.5
|
)
|
(0.6
|
)
|
(2,217.8
|
)
|
(0.1
|
)
|
(2,541.1
|
)
|
|||||||||||||||||
|
Operating income (loss)
|
(18.9
|
)
|
—
|
|
(0.1
|
)
|
(0.1
|
)
|
92.7
|
|
(0.6
|
)
|
1,385.1
|
|
(0.1
|
)
|
1,458.0
|
|
|||||||||||||||||
|
Equity earnings (loss) in subsidiaries, net of tax
|
706.8
|
|
651.5
|
|
621.9
|
|
275.9
|
|
997.5
|
|
75.8
|
|
—
|
|
(3,329.4
|
)
|
—
|
|
|||||||||||||||||
|
Interest expense
|
—
|
|
—
|
|
—
|
|
(127.6
|
)
|
(48.3
|
)
|
(42.8
|
)
|
(4.3
|
)
|
—
|
|
(223.0
|
)
|
|||||||||||||||||
|
Intercompany interest and fees
|
(26.7
|
)
|
(6.4
|
)
|
(21.4
|
)
|
(28.6
|
)
|
(270.6
|
)
|
(2.4
|
)
|
357.2
|
|
(1.1
|
)
|
—
|
|
|||||||||||||||||
|
Other income/(expense), net
|
1.4
|
|
—
|
|
0.1
|
|
—
|
|
(9.1
|
)
|
—
|
|
21.0
|
|
(0.5
|
)
|
12.9
|
|
|||||||||||||||||
|
Earnings (loss) before income taxes
|
662.6
|
|
645.1
|
|
600.5
|
|
119.6
|
|
762.2
|
|
30.0
|
|
1,759.0
|
|
(3,331.1
|
)
|
1,247.9
|
|
|||||||||||||||||
|
Benefit (provision) for income taxes
|
2.0
|
|
—
|
|
(9.1
|
)
|
58.0
|
|
(125.5
|
)
|
—
|
|
(466.2
|
)
|
—
|
|
(540.8
|
)
|
|||||||||||||||||
|
Earnings (loss) from continuing operations
|
664.6
|
|
645.1
|
|
591.4
|
|
177.6
|
|
636.7
|
|
30.0
|
|
1,292.8
|
|
(3,331.1
|
)
|
707.1
|
|
|||||||||||||||||
|
Gain (loss) from discontinued operations, net of tax
|
—
|
|
—
|
|
—
|
|
—
|
|
(31.4
|
)
|
—
|
|
7.1
|
|
—
|
|
(24.3
|
)
|
|||||||||||||||||
|
Net earnings (loss)
|
664.6
|
|
645.1
|
|
591.4
|
|
177.6
|
|
605.3
|
|
30.0
|
|
1,299.9
|
|
(3,331.1
|
)
|
682.8
|
|
|||||||||||||||||
|
Less net earnings attributable to noncontrolling interests
|
—
|
|
—
|
|
—
|
|
—
|
|
—
|
|
—
|
|
(18.2
|
)
|
—
|
|
(18.2
|
)
|
|||||||||||||||||
|
Net earnings attributable to Ingersoll-Rand plc
|
$
|
664.6
|
|
$
|
645.1
|
|
$
|
591.4
|
|
$
|
177.6
|
|
$
|
605.3
|
|
$
|
30.0
|
|
$
|
1,281.7
|
|
$
|
(3,331.1
|
)
|
$
|
664.6
|
|
||||||||
|
|
|
|
|
|
|
|
|
|
|||||||||||||||||||||||||||
|
Other comprehensive loss, net of tax
|
(406.6
|
)
|
(406.0
|
)
|
(402.4
|
)
|
(83.6
|
)
|
(84.1
|
)
|
—
|
|
(393.9
|
)
|
1,370.0
|
|
(406.6
|
)
|
|||||||||||||||||
|
Comprehensive income attributable to Ingersoll-Rand plc
|
$
|
258.0
|
|
$
|
239.1
|
|
$
|
189.0
|
|
$
|
94.0
|
|
$
|
521.2
|
|
$
|
30.0
|
|
$
|
887.8
|
|
$
|
(1,961.1
|
)
|
$
|
258.0
|
|
||||||||
F-49
Condensed Consolidating Statement of Comprehensive Income
For the year ended December 31, 2014
|
In millions
|
Plc
|
International
Holding
|
Lux International
|
Global
Holding
|
New
Jersey |
Lux
Finance
|
Other
Subsidiaries |
Consolidating
Adjustments |
Consolidated |
||||||||||||||||||||||||||
|
Net revenues
|
$
|
—
|
|
$
|
—
|
|
$
|
—
|
|
$
|
—
|
|
$
|
1,257.3
|
|
$
|
—
|
|
$
|
12,021.9
|
|
$
|
(387.8
|
)
|
$
|
12,891.4
|
|
||||||||
|
Cost of goods sold
|
—
|
|
—
|
|
—
|
|
—
|
|
(891.8
|
)
|
—
|
|
(8,478.8
|
)
|
387.8
|
|
(8,982.8
|
)
|
|||||||||||||||||
|
Selling and administrative expenses
|
(34.9
|
)
|
—
|
|
(0.1
|
)
|
(0.6
|
)
|
(308.8
|
)
|
—
|
|
(2,159.5
|
)
|
—
|
|
(2,503.9
|
)
|
|||||||||||||||||
|
Operating income (loss)
|
(34.9
|
)
|
—
|
|
(0.1
|
)
|
(0.6
|
)
|
56.7
|
|
—
|
|
1,383.6
|
|
—
|
|
1,404.7
|
|
|||||||||||||||||
|
Equity earnings (loss) in subsidiaries, net of tax
|
985.9
|
|
566.5
|
|
565.5
|
|
488.6
|
|
858.4
|
|
29.7
|
|
—
|
|
(3,494.6
|
)
|
—
|
|
|||||||||||||||||
|
Interest expense
|
—
|
|
(21.6
|
)
|
—
|
|
(127.9
|
)
|
(48.9
|
)
|
(7.1
|
)
|
(19.8
|
)
|
—
|
|
(225.3
|
)
|
|||||||||||||||||
|
Intercompany interest and fees
|
(18.2
|
)
|
(10.0
|
)
|
(17.8
|
)
|
(2.5
|
)
|
(208.4
|
)
|
(0.6
|
)
|
257.5
|
|
—
|
|
—
|
|
|||||||||||||||||
|
Other income/(expense), net
|
0.9
|
|
3.3
|
|
—
|
|
—
|
|
2.9
|
|
—
|
|
22.9
|
|
—
|
|
30.0
|
|
|||||||||||||||||
|
Earnings (loss) before income taxes
|
933.7
|
|
538.2
|
|
547.6
|
|
357.6
|
|
660.7
|
|
22.0
|
|
1,644.2
|
|
(3,494.6
|
)
|
1,209.4
|
|
|||||||||||||||||
|
Benefit (provision) for income taxes
|
0.2
|
|
—
|
|
—
|
|
44.6
|
|
58.5
|
|
—
|
|
(397.0
|
)
|
—
|
|
(293.7
|
)
|
|||||||||||||||||
|
Earnings (loss) from continuing operations
|
933.9
|
|
538.2
|
|
547.6
|
|
402.2
|
|
719.2
|
|
22.0
|
|
1,247.2
|
|
(3,494.6
|
)
|
915.7
|
|
|||||||||||||||||
|
Gain (loss) from discontinued operations, net of tax
|
(2.2
|
)
|
—
|
|
—
|
|
—
|
|
37.2
|
|
—
|
|
(0.3
|
)
|
—
|
|
34.7
|
|
|||||||||||||||||
|
Net earnings (loss)
|
931.7
|
|
538.2
|
|
547.6
|
|
402.2
|
|
756.4
|
|
22.0
|
|
1,246.9
|
|
(3,494.6
|
)
|
950.4
|
|
|||||||||||||||||
|
Less net earnings attributable to noncontrolling interests
|
—
|
|
—
|
|
—
|
|
—
|
|
—
|
|
—
|
|
(18.7
|
)
|
—
|
|
(18.7
|
)
|
|||||||||||||||||
|
Net earnings attributable to Ingersoll-Rand plc
|
$
|
931.7
|
|
$
|
538.2
|
|
$
|
547.6
|
|
$
|
402.2
|
|
$
|
756.4
|
|
$
|
22.0
|
|
$
|
1,228.2
|
|
$
|
(3,494.6
|
)
|
$
|
931.7
|
|
||||||||
|
Other comprehensive loss, net of tax
|
(547.6
|
)
|
(547.6
|
)
|
(558.1
|
)
|
(260.9
|
)
|
(261.4
|
)
|
(0.1
|
)
|
(545.7
|
)
|
2,173.8
|
|
(547.6
|
)
|
|||||||||||||||||
|
Comprehensive income (loss) attributable to Ingersoll-Rand plc
|
$
|
384.1
|
|
$
|
(9.4
|
)
|
$
|
(10.5
|
)
|
$
|
141.3
|
|
$
|
495.0
|
|
$
|
21.9
|
|
$
|
682.5
|
|
$
|
(1,320.8
|
)
|
$
|
384.1
|
|
||||||||
F-50
Condensed Consolidating Statement of Comprehensive Income
For the year ended December 31, 2013
|
In millions
|
Plc
|
International
Holding |
Lux International
|
Global
Holding |
New
Jersey |
Lux
Finance |
Other
Subsidiaries |
Consolidating
Adjustments |
Consolidated |
||||||||||||||||||||||||||
|
Net revenues
|
$
|
—
|
|
$
|
—
|
|
$
|
—
|
|
$
|
—
|
|
$
|
1,184.0
|
|
$
|
—
|
|
$
|
11,560.1
|
|
$
|
(393.6
|
)
|
$
|
12,350.5
|
|
||||||||
|
Cost of goods sold
|
0.7
|
|
—
|
|
—
|
|
—
|
|
(844.6
|
)
|
—
|
|
(8,272.0
|
)
|
393.6
|
|
(8,722.3
|
)
|
|||||||||||||||||
|
Selling and administrative expenses
|
(66.3
|
)
|
(0.1
|
)
|
—
|
|
(1.1
|
)
|
(216.9
|
)
|
—
|
|
(2,239.4
|
)
|
0.6
|
|
(2,523.2
|
)
|
|||||||||||||||||
|
Operating income (loss)
|
(65.6
|
)
|
(0.1
|
)
|
—
|
|
(1.1
|
)
|
122.5
|
|
—
|
|
1,048.7
|
|
0.6
|
|
1,105.0
|
|
|||||||||||||||||
|
Equity earnings (loss) in subsidiaries, net of tax
|
696.7
|
|
644.9
|
|
716.4
|
|
202.1
|
|
387.4
|
|
107.9
|
|
—
|
|
(2,755.4
|
)
|
—
|
|
|||||||||||||||||
|
Interest expense
|
—
|
|
(15.8
|
)
|
—
|
|
(196.4
|
)
|
(49.6
|
)
|
—
|
|
(17.0
|
)
|
—
|
|
(278.8
|
)
|
|||||||||||||||||
|
Intercompany interest and fees
|
(14.1
|
)
|
(34.3
|
)
|
—
|
|
(34.0
|
)
|
8.5
|
|
—
|
|
69.4
|
|
4.5
|
|
—
|
|
|||||||||||||||||
|
Other income/(expense), net
|
1.8
|
|
1.5
|
|
—
|
|
0.6
|
|
(0.1
|
)
|
—
|
|
(0.4
|
)
|
—
|
|
3.4
|
|
|||||||||||||||||
|
Earnings (loss) before income taxes
|
618.8
|
|
596.2
|
|
716.4
|
|
(28.8
|
)
|
468.7
|
|
107.9
|
|
1,100.7
|
|
(2,750.3
|
)
|
829.6
|
|
|||||||||||||||||
|
Benefit (provision) for income taxes
|
(0.3
|
)
|
—
|
|
—
|
|
—
|
|
(1.3
|
)
|
—
|
|
(187.4
|
)
|
—
|
|
(189.0
|
)
|
|||||||||||||||||
|
Earnings (loss) from continuing operations
|
618.5
|
|
596.2
|
|
716.4
|
|
(28.8
|
)
|
467.4
|
|
107.9
|
|
913.3
|
|
(2,750.3
|
)
|
640.6
|
|
|||||||||||||||||
|
Gain (loss) from discontinued operations, net of tax
|
0.3
|
|
—
|
|
—
|
|
—
|
|
(172.4
|
)
|
—
|
|
185.4
|
|
—
|
|
13.3
|
|
|||||||||||||||||
|
Net earnings (loss)
|
618.8
|
|
596.2
|
|
716.4
|
|
(28.8
|
)
|
295.0
|
|
107.9
|
|
1,098.7
|
|
(2,750.3
|
)
|
653.9
|
|
|||||||||||||||||
|
Less net (earnings) loss attributable to noncontrolling interests
|
—
|
|
—
|
|
—
|
|
—
|
|
—
|
|
—
|
|
(35.1
|
)
|
—
|
|
(35.1
|
)
|
|||||||||||||||||
|
Net earnings attributable to Ingersoll-Rand plc
|
$
|
618.8
|
|
$
|
596.2
|
|
$
|
716.4
|
|
$
|
(28.8
|
)
|
$
|
295.0
|
|
$
|
107.9
|
|
$
|
1,063.6
|
|
$
|
(2,750.3
|
)
|
$
|
618.8
|
|
||||||||
|
|
|
|
|
|
|
|
|
|
|||||||||||||||||||||||||||
|
Other comprehensive income, net of tax
|
294.7
|
|
294.6
|
|
316.5
|
|
144.8
|
|
166.2
|
|
—
|
|
273.2
|
|
(1,195.3
|
)
|
294.7
|
|
|||||||||||||||||
|
Comprehensive income attributable to Ingersoll-Rand plc
|
$
|
913.5
|
|
$
|
890.8
|
|
$
|
1,032.9
|
|
$
|
116.0
|
|
$
|
461.2
|
|
$
|
107.9
|
|
$
|
1,336.8
|
|
$
|
(3,945.6
|
)
|
$
|
913.5
|
|
||||||||
F-51
Condensed Consolidating Balance Sheet
December 31, 2015
|
In millions
|
Plc
|
International
Holding |
Lux International
|
Global
Holding |
New
Jersey |
Lux
Finance |
Other
Subsidiaries |
Consolidating
Adjustments |
Consolidated |
||||||||||||||||||||||||||
|
ASSETS
|
|||||||||||||||||||||||||||||||||||
|
Current assets:
|
|||||||||||||||||||||||||||||||||||
|
Cash and cash equivalents
|
$
|
—
|
|
$
|
—
|
|
$
|
—
|
|
$
|
11.4
|
|
$
|
—
|
|
$
|
0.1
|
|
$
|
725.3
|
|
$
|
—
|
|
$
|
736.8
|
|
||||||||
|
Accounts and notes receivable, net
|
—
|
|
—
|
|
—
|
|
—
|
|
160.7
|
|
—
|
|
1,989.9
|
|
—
|
|
2,150.6
|
|
|||||||||||||||||
|
Inventories
|
—
|
|
—
|
|
—
|
|
—
|
|
192.0
|
|
—
|
|
1,218.7
|
|
—
|
|
1,410.7
|
|
|||||||||||||||||
|
Other current assets
|
0.1
|
|
—
|
|
—
|
|
6.4
|
|
83.3
|
|
—
|
|
237.5
|
|
(16.0
|
)
|
311.3
|
|
|||||||||||||||||
|
Intercompany receivables
|
136.8
|
|
20,103.6
|
|
3.3
|
|
102.2
|
|
1,413.9
|
|
—
|
|
15,933.5
|
|
(37,693.3
|
)
|
—
|
|
|||||||||||||||||
|
Total current assets
|
136.9
|
|
20,103.6
|
|
3.3
|
|
120.0
|
|
1,849.9
|
|
0.1
|
|
20,104.9
|
|
(37,709.3
|
)
|
4,609.4
|
|
|||||||||||||||||
|
Property, plant and equipment, net
|
—
|
|
—
|
|
—
|
|
—
|
|
463.0
|
|
—
|
|
1,112.1
|
|
—
|
|
1,575.1
|
|
|||||||||||||||||
|
Goodwill and other intangible assets, net
|
—
|
|
—
|
|
—
|
|
—
|
|
412.9
|
|
—
|
|
9,243.4
|
|
—
|
|
9,656.3
|
|
|||||||||||||||||
|
Other assets, net
|
0.2
|
|
—
|
|
—
|
|
295.8
|
|
734.0
|
|
8.6
|
|
568.4
|
|
(709.0
|
)
|
898.0
|
|
|||||||||||||||||
|
Investments in consolidated subsidiaries
|
10,139.0
|
|
123.5
|
|
13,511.6
|
|
5,985.6
|
|
13,766.2
|
|
1,708.7
|
|
—
|
|
(45,234.6
|
)
|
—
|
|
|||||||||||||||||
|
Intercompany notes receivable
|
—
|
|
—
|
|
—
|
|
—
|
|
—
|
|
—
|
|
2,876.6
|
|
(2,876.6
|
)
|
—
|
|
|||||||||||||||||
|
Total assets
|
$
|
10,276.1
|
|
$
|
20,227.1
|
|
$
|
13,514.9
|
|
$
|
6,401.4
|
|
$
|
17,226.0
|
|
$
|
1,717.4
|
|
$
|
33,905.4
|
|
$
|
(86,529.5
|
)
|
$
|
16,738.8
|
|
||||||||
|
LIABILITIES AND EQUITY
|
|
|
|
|
|
|
|
|
|
||||||||||||||||||||||||||
|
Current liabilities:
|
|||||||||||||||||||||||||||||||||||
|
Accounts payable and accrued expenses
|
$
|
7.1
|
|
$
|
—
|
|
$
|
0.1
|
|
$
|
30.7
|
|
$
|
599.2
|
|
$
|
6.3
|
|
$
|
2,516.7
|
|
$
|
(15.9
|
)
|
$
|
3,144.2
|
|
||||||||
|
Short-term borrowings and current maturities of long-term debt
|
—
|
|
—
|
|
—
|
|
—
|
|
350.4
|
|
143.0
|
|
10.8
|
|
—
|
|
504.2
|
|
|||||||||||||||||
|
Intercompany payables
|
4,452.3
|
|
753.1
|
|
23,528.9
|
|
1,997.8
|
|
5,858.2
|
|
745.5
|
|
357.6
|
|
(37,693.4
|
)
|
—
|
|
|||||||||||||||||
|
Total current liabilities
|
4,459.4
|
|
753.1
|
|
23,529.0
|
|
2,028.5
|
|
6,807.8
|
|
894.8
|
|
2,885.1
|
|
(37,709.3
|
)
|
3,648.4
|
|
|||||||||||||||||
|
Long-term debt
|
—
|
|
—
|
|
—
|
|
2,296.4
|
|
342.2
|
|
1,095.5
|
|
0.7
|
|
—
|
|
3,734.8
|
|
|||||||||||||||||
|
Other noncurrent liabilities
|
—
|
|
3.8
|
|
—
|
|
8.3
|
|
1,367.9
|
|
—
|
|
2,805.3
|
|
(708.9
|
)
|
3,476.4
|
|
|||||||||||||||||
|
Intercompany notes payable
|
—
|
|
—
|
|
—
|
|
429.0
|
|
2,447.7
|
|
—
|
|
—
|
|
(2,876.7
|
)
|
—
|
|
|||||||||||||||||
|
Total liabilities
|
4,459.4
|
|
756.9
|
|
23,529.0
|
|
4,762.2
|
|
10,965.6
|
|
1,990.3
|
|
5,691.1
|
|
(41,294.9
|
)
|
10,859.6
|
|
|||||||||||||||||
|
Equity:
|
|||||||||||||||||||||||||||||||||||
|
Total equity
|
5,816.7
|
|
19,470.2
|
|
(10,014.1
|
)
|
1,639.2
|
|
6,260.4
|
|
(272.9
|
)
|
28,214.3
|
|
(45,234.6
|
)
|
5,879.2
|
|
|||||||||||||||||
|
Total liabilities and equity
|
$
|
10,276.1
|
|
$
|
20,227.1
|
|
$
|
13,514.9
|
|
$
|
6,401.4
|
|
$
|
17,226.0
|
|
$
|
1,717.4
|
|
$
|
33,905.4
|
|
$
|
(86,529.5
|
)
|
$
|
16,738.8
|
|
||||||||
F-52
Condensed Consolidating Balance Sheet
December 31, 2014
|
In millions
|
Plc
|
International
Holding |
Lux International
|
Global
Holding |
New
Jersey |
Lux
Finance |
Other
Subsidiaries |
Consolidating
Adjustments |
Consolidated |
||||||||||||||||||||||||||
|
ASSETS
|
|||||||||||||||||||||||||||||||||||
|
Current assets:
|
|||||||||||||||||||||||||||||||||||
|
Cash and cash equivalents
|
$
|
—
|
|
$
|
—
|
|
$
|
1.1
|
|
$
|
—
|
|
$
|
425.4
|
|
$
|
—
|
|
$
|
1,278.7
|
|
$
|
—
|
|
$
|
1,705.2
|
|
||||||||
|
Accounts and notes receivable, net
|
—
|
|
—
|
|
—
|
|
—
|
|
147.0
|
|
—
|
|
1,972.0
|
|
—
|
|
2,119.0
|
|
|||||||||||||||||
|
Inventories
|
—
|
|
—
|
|
—
|
|
—
|
|
106.1
|
|
—
|
|
1,252.8
|
|
—
|
|
1,358.9
|
|
|||||||||||||||||
|
Other current assets
|
0.1
|
|
—
|
|
—
|
|
31.0
|
|
126.9
|
|
—
|
|
366.7
|
|
0.1
|
|
524.8
|
|
|||||||||||||||||
|
Intercompany receivable
|
48.6
|
|
8,226.9
|
|
28.8
|
|
298.0
|
|
5,676.4
|
|
—
|
|
15,035.5
|
|
(29,314.2
|
)
|
—
|
|
|||||||||||||||||
|
Total current assets
|
48.7
|
|
8,226.9
|
|
29.9
|
|
329.0
|
|
6,481.8
|
|
—
|
|
19,905.7
|
|
(29,314.1
|
)
|
5,707.9
|
|
|||||||||||||||||
|
Property, plant and equipment, net
|
—
|
|
—
|
|
—
|
|
—
|
|
324.7
|
|
—
|
|
1,152.3
|
|
—
|
|
1,477.0
|
|
|||||||||||||||||
|
Goodwill and other intangible assets, net
|
—
|
|
—
|
|
—
|
|
—
|
|
66.6
|
|
—
|
|
9,107.1
|
|
—
|
|
9,173.7
|
|
|||||||||||||||||
|
Other assets, net
|
0.2
|
|
—
|
|
—
|
|
176.7
|
|
731.7
|
|
9.6
|
|
595.4
|
|
(573.7
|
)
|
939.9
|
|
|||||||||||||||||
|
Investments in consolidated subsidiaries
|
9,738.8
|
|
2,951.4
|
|
14,837.5
|
|
5,709.2
|
|
16,625.3
|
|
1,485.2
|
|
—
|
|
(51,347.4
|
)
|
—
|
|
|||||||||||||||||
|
Intercompany notes receivable
|
—
|
|
—
|
|
—
|
|
—
|
|
—
|
|
—
|
|
5,471.6
|
|
(5,471.6
|
)
|
—
|
|
|||||||||||||||||
|
Total assets
|
$
|
9,787.7
|
|
$
|
11,178.3
|
|
$
|
14,867.4
|
|
$
|
6,214.9
|
|
$
|
24,230.1
|
|
$
|
1,494.8
|
|
$
|
36,232.1
|
|
$
|
(86,706.8
|
)
|
$
|
17,298.5
|
|
||||||||
|
LIABILITIES AND EQUITY
|
|
|
|
|
|
|
|
|
|
||||||||||||||||||||||||||
|
Current liabilities:
|
|||||||||||||||||||||||||||||||||||
|
Accounts payable and accrued expenses
|
$
|
7.9
|
|
$
|
—
|
|
$
|
0.4
|
|
$
|
26.6
|
|
$
|
495.8
|
|
$
|
8.1
|
|
$
|
2,644.6
|
|
$
|
—
|
|
$
|
3,183.4
|
|
||||||||
|
Short-term borrowings and current maturities of long-term debt
|
—
|
|
—
|
|
—
|
|
—
|
|
350.5
|
|
100.0
|
|
32.2
|
|
—
|
|
482.7
|
|
|||||||||||||||||
|
Intercompany payable
|
3,792.4
|
|
1,715.6
|
|
12,318.7
|
|
4.5
|
|
10,636.7
|
|
514.1
|
|
331.7
|
|
(29,313.7
|
)
|
—
|
|
|||||||||||||||||
|
Total current liabilities
|
3,800.3
|
|
1,715.6
|
|
12,319.1
|
|
31.1
|
|
11,483.0
|
|
622.2
|
|
3,008.5
|
|
(29,313.7
|
)
|
3,666.1
|
|
|||||||||||||||||
|
Long-term debt
|
—
|
|
—
|
|
—
|
|
2,296.1
|
|
349.6
|
|
1,095.2
|
|
0.8
|
|
—
|
|
3,741.7
|
|
|||||||||||||||||
|
Other noncurrent liabilities
|
—
|
|
3.8
|
|
—
|
|
2.6
|
|
1,471.6
|
|
—
|
|
2,941.0
|
|
(573.7
|
)
|
3,845.3
|
|
|||||||||||||||||
|
Intercompany notes payable
|
—
|
|
—
|
|
—
|
|
429.0
|
|
5,042.6
|
|
—
|
|
—
|
|
(5,471.6
|
)
|
—
|
|
|||||||||||||||||
|
Total liabilities
|
3,800.3
|
|
1,719.4
|
|
12,319.1
|
|
2,758.8
|
|
18,346.8
|
|
1,717.4
|
|
5,950.3
|
|
(35,359.0
|
)
|
11,253.1
|
|
|||||||||||||||||
|
Equity:
|
|||||||||||||||||||||||||||||||||||
|
Total equity
|
5,987.4
|
|
9,458.9
|
|
2,548.3
|
|
3,456.1
|
|
5,883.3
|
|
(222.6
|
)
|
30,281.8
|
|
(51,347.8
|
)
|
6,045.4
|
|
|||||||||||||||||
|
Total liabilities and equity
|
$
|
9,787.7
|
|
$
|
11,178.3
|
|
$
|
14,867.4
|
|
$
|
6,214.9
|
|
$
|
24,230.1
|
|
$
|
1,494.8
|
|
$
|
36,232.1
|
|
$
|
(86,706.8
|
)
|
$
|
17,298.5
|
|
||||||||
F-53
Condensed Consolidating Statement of Cash Flows
For the year ended
December 31, 2015
|
In millions
|
Plc
|
International
Holding |
Lux International
|
Global
Holding |
New
Jersey |
Lux
Finance |
Other
Subsidiaries |
Consolidating
Adjustments |
Consolidated |
||||||||||||||||||||||||||
|
CASH FLOWS FROM OPERATING ACTIVITIES:
|
|||||||||||||||||||||||||||||||||||
|
Net cash provided by (used in) continuing operating activities
|
$
|
(60.2
|
)
|
$
|
—
|
|
$
|
(33.6
|
)
|
$
|
(122.9
|
)
|
$
|
(294.3
|
)
|
$
|
(45.8
|
)
|
$
|
1,443.2
|
|
$
|
(0.2
|
)
|
$
|
886.2
|
|
||||||||
|
Net cash provided by (used in) discontinued operating activities
|
—
|
|
—
|
|
—
|
|
—
|
|
(30.6
|
)
|
—
|
|
(4.5
|
)
|
—
|
|
(35.1
|
)
|
|||||||||||||||||
|
Net cash provided by (used in) operating activities
|
(60.2
|
)
|
—
|
|
(33.6
|
)
|
(122.9
|
)
|
(324.9
|
)
|
(45.8
|
)
|
1,438.7
|
|
(0.2
|
)
|
851.1
|
|
|||||||||||||||||
|
CASH FLOWS FROM INVESTING ACTIVITIES:
|
|||||||||||||||||||||||||||||||||||
|
Capital expenditures
|
—
|
|
—
|
|
—
|
|
—
|
|
(122.9
|
)
|
—
|
|
(126.7
|
)
|
—
|
|
(249.6
|
)
|
|||||||||||||||||
|
Acquisition of businesses, net of cash acquired
|
—
|
|
—
|
|
—
|
|
—
|
|
(443.5
|
)
|
—
|
|
(518.3
|
)
|
—
|
|
(961.8
|
)
|
|||||||||||||||||
|
Proceeds from sale of property, plant and equipment
|
—
|
|
—
|
|
—
|
|
—
|
|
3.0
|
|
—
|
|
15.5
|
|
—
|
|
18.5
|
|
|||||||||||||||||
|
Intercompany investing activities, net
|
—
|
|
—
|
|
1,963.3
|
|
339.0
|
|
125.4
|
|
(228.0
|
)
|
(1,015.0
|
)
|
(1,184.7
|
)
|
—
|
|
|||||||||||||||||
|
Net cash provided by (used in) investing activities
|
|
—
|
|
1,963.3
|
|
339.0
|
|
(438.0
|
)
|
(228.0
|
)
|
(1,644.5
|
)
|
(1,184.7
|
)
|
(1,192.9
|
)
|
||||||||||||||||||
|
CASH FLOWS FROM FINANCING ACTIVITIES:
|
|||||||||||||||||||||||||||||||||||
|
Net proceeds (repayments) in debt
|
—
|
|
—
|
|
—
|
|
(0.1
|
)
|
(7.6
|
)
|
43.0
|
|
(28.9
|
)
|
—
|
|
6.4
|
|
|||||||||||||||||
|
Dividends paid to ordinary shareholders
|
(303.3
|
)
|
—
|
|
—
|
|
—
|
|
—
|
|
—
|
|
—
|
|
—
|
|
(303.3
|
)
|
|||||||||||||||||
|
Dividends paid to noncontrolling interests
|
—
|
|
—
|
|
—
|
|
—
|
|
—
|
|
—
|
|
(9.3
|
)
|
—
|
|
(9.3
|
)
|
|||||||||||||||||
|
Proceeds from shares issued under incentive plans
|
61.3
|
|
—
|
|
—
|
|
—
|
|
—
|
|
—
|
|
—
|
|
—
|
|
61.3
|
|
|||||||||||||||||
|
Repurchase of ordinary shares
|
(250.1
|
)
|
—
|
|
—
|
|
—
|
|
—
|
|
—
|
|
—
|
|
—
|
|
(250.1
|
)
|
|||||||||||||||||
|
Other financing activities, net
|
4.7
|
|
—
|
|
—
|
|
—
|
|
—
|
|
—
|
|
—
|
|
—
|
|
4.7
|
|
|||||||||||||||||
|
Intercompany financing activities, net
|
547.6
|
|
|
(1,930.8
|
)
|
(204.6
|
)
|
345.1
|
|
230.9
|
|
(173.1
|
)
|
1,184.9
|
|
—
|
|
||||||||||||||||||
|
Net cash provided by (used in) financing activities
|
60.2
|
|
—
|
|
(1,930.8
|
)
|
(204.7
|
)
|
337.5
|
|
273.9
|
|
(211.3
|
)
|
1,184.9
|
|
(490.3
|
)
|
|||||||||||||||||
|
Effect of exchange rate changes on cash and cash equivalents
|
—
|
|
—
|
|
—
|
|
—
|
|
—
|
|
—
|
|
(136.3
|
)
|
—
|
|
(136.3
|
)
|
|||||||||||||||||
|
Net increase (decrease) in cash and cash equivalents
|
—
|
|
—
|
|
(1.1
|
)
|
11.4
|
|
(425.4
|
)
|
0.1
|
|
(553.4
|
)
|
—
|
|
(968.4
|
)
|
|||||||||||||||||
|
Cash and cash equivalents - beginning of period
|
—
|
|
—
|
|
1.1
|
|
—
|
|
425.4
|
|
—
|
|
1,278.7
|
|
—
|
|
1,705.2
|
|
|||||||||||||||||
|
Cash and cash equivalents - end of period
|
$
|
—
|
|
$
|
—
|
|
$
|
—
|
|
$
|
11.4
|
|
$
|
—
|
|
$
|
0.1
|
|
$
|
725.3
|
|
$
|
—
|
|
$
|
736.8
|
|
||||||||
F-54
Condensed Consolidating Statement of Cash Flows
For the year ended December 31, 2014
|
In millions
|
Plc
|
International
Holding |
Lux International
|
Global
Holding |
New
Jersey |
Lux
Finance |
Other
Subsidiaries |
Consolidating
Adjustments |
Consolidated |
||||||||||||||||||||||||||
|
CASH FLOWS FROM OPERATING ACTIVITIES:
|
|||||||||||||||||||||||||||||||||||
|
Net cash provided by (used in) continuing operating activities
|
$
|
(160.0
|
)
|
$
|
(32.4
|
)
|
$
|
(70.9
|
)
|
$
|
(125.4
|
)
|
$
|
155.6
|
|
$
|
0.9
|
|
$
|
1,210.2
|
|
$
|
13.7
|
|
$
|
991.7
|
|
||||||||
|
Net cash provided by (used in) discontinued operating activities
|
(2.2
|
)
|
—
|
|
—
|
|
—
|
|
(2.4
|
)
|
—
|
|
(13.9
|
)
|
—
|
|
(18.5
|
)
|
|||||||||||||||||
|
Net cash provided by (used in) operating activities
|
(162.2
|
)
|
(32.4
|
)
|
(70.9
|
)
|
(125.4
|
)
|
153.2
|
|
0.9
|
|
1,196.3
|
|
13.7
|
|
973.2
|
|
|||||||||||||||||
|
CASH FLOWS FROM INVESTING ACTIVITIES:
|
|||||||||||||||||||||||||||||||||||
|
Capital expenditures
|
—
|
|
—
|
|
—
|
|
—
|
|
(87.7
|
)
|
—
|
|
(145.8
|
)
|
—
|
|
(233.5
|
)
|
|||||||||||||||||
|
Acquisition of businesses, net of cash acquired
|
—
|
|
—
|
|
—
|
|
—
|
|
—
|
|
—
|
|
(10.2
|
)
|
—
|
|
(10.2
|
)
|
|||||||||||||||||
|
Proceeds from sale of property, plant and equipment
|
—
|
|
—
|
|
—
|
|
—
|
|
1.3
|
|
—
|
|
13.1
|
|
—
|
|
14.4
|
|
|||||||||||||||||
|
Proceeds from business dispositions, net of cash sold
|
—
|
|
—
|
|
—
|
|
—
|
|
2.0
|
|
—
|
|
—
|
|
—
|
|
2.0
|
|
|||||||||||||||||
|
Dividends received from equity investments
|
—
|
|
—
|
|
—
|
|
—
|
|
—
|
|
—
|
|
30.3
|
|
—
|
|
30.3
|
|
|||||||||||||||||
|
Intercompany investing activities, net
|
(454.8
|
)
|
1,150.6
|
|
5.2
|
|
206.6
|
|
830.5
|
|
—
|
|
235.5
|
|
(1,973.6
|
)
|
—
|
|
|||||||||||||||||
|
Net cash provided by (used in) investing activities
|
(454.8
|
)
|
1,150.6
|
|
5.2
|
|
206.6
|
|
746.1
|
|
—
|
|
122.9
|
|
(1,973.6
|
)
|
(197.0
|
)
|
|||||||||||||||||
|
CASH FLOWS FROM FINANCING ACTIVITIES:
|
|||||||||||||||||||||||||||||||||||
|
Net proceeds (repayments) in debt
|
—
|
|
(300.0
|
)
|
—
|
|
—
|
|
(7.6
|
)
|
1,195.1
|
|
(187.3
|
)
|
—
|
|
700.2
|
|
|||||||||||||||||
|
Debt issuance costs
|
—
|
|
—
|
|
—
|
|
(2.5
|
)
|
—
|
|
(9.8
|
)
|
—
|
|
—
|
|
(12.3
|
)
|
|||||||||||||||||
|
Dividends paid to ordinary shareholders
|
(264.7
|
)
|
—
|
|
—
|
|
—
|
|
—
|
|
—
|
|
—
|
|
—
|
|
(264.7
|
)
|
|||||||||||||||||
|
Dividends paid to noncontrolling interests
|
—
|
|
—
|
|
—
|
|
—
|
|
—
|
|
—
|
|
(20.9
|
)
|
—
|
|
(20.9
|
)
|
|||||||||||||||||
|
Proceeds from shares issued under incentive plans
|
113.1
|
|
—
|
|
—
|
|
—
|
|
—
|
|
—
|
|
—
|
|
—
|
|
113.1
|
|
|||||||||||||||||
|
Repurchase of ordinary shares
|
(1,374.9
|
)
|
—
|
|
—
|
|
—
|
|
—
|
|
—
|
|
—
|
|
—
|
|
(1,374.9
|
)
|
|||||||||||||||||
|
Intercompany financing activities, net
|
2,143.5
|
|
(818.2
|
)
|
66.8
|
|
(1,054.0
|
)
|
(491.8
|
)
|
(1,186.2
|
)
|
(620.0
|
)
|
1,959.9
|
|
—
|
|
|||||||||||||||||
|
Net cash provided by (used in) financing activities
|
617.0
|
|
(1,118.2
|
)
|
66.8
|
|
(1,056.5
|
)
|
(499.4
|
)
|
(0.9
|
)
|
(828.2
|
)
|
1,959.9
|
|
(859.5
|
)
|
|||||||||||||||||
|
Effect of exchange rate changes on cash and cash equivalents
|
—
|
|
—
|
|
—
|
|
—
|
|
—
|
|
—
|
|
(148.7
|
)
|
—
|
|
(148.7
|
)
|
|||||||||||||||||
|
Net increase (decrease) in cash and cash equivalents
|
—
|
|
—
|
|
1.1
|
|
(975.3
|
)
|
399.9
|
|
—
|
|
342.3
|
|
—
|
|
(232.0
|
)
|
|||||||||||||||||
|
Cash and cash equivalents - beginning of period
|
—
|
|
—
|
|
—
|
|
975.3
|
|
25.5
|
|
—
|
|
936.4
|
|
—
|
|
1,937.2
|
|
|||||||||||||||||
|
Cash and cash equivalents - end of period
|
$
|
—
|
|
$
|
—
|
|
$
|
1.1
|
|
$
|
—
|
|
$
|
425.4
|
|
$
|
—
|
|
$
|
1,278.7
|
|
$
|
—
|
|
$
|
1,705.2
|
|
||||||||
F-55
Condensed Consolidating Statement of Cash Flows
For the year ended December 31, 2013
|
In millions
|
Plc
|
International
Holding |
Lux International
|
Global
Holding |
New
Jersey |
Lux
Finance |
Other
Subsidiaries |
Consolidating
Adjustments |
Consolidated |
||||||||||||||||||||||||||
|
CASH FLOWS FROM OPERATING ACTIVITIES:
|
|||||||||||||||||||||||||||||||||||
|
Net cash provided by (used in) continuing operating activities
|
$
|
(97.0
|
)
|
$
|
(51.4
|
)
|
$
|
—
|
|
$
|
(214.4
|
)
|
$
|
480.1
|
|
$
|
—
|
|
$
|
(1,754.7
|
)
|
$
|
2,436.2
|
|
$
|
798.8
|
|
||||||||
|
Net cash provided by (used in) discontinued operating activities
|
—
|
|
—
|
|
—
|
|
—
|
|
(112.2
|
)
|
—
|
|
404.9
|
|
—
|
|
292.7
|
|
|||||||||||||||||
|
Net cash provided by (used in) operating activities
|
(97.0
|
)
|
(51.4
|
)
|
—
|
|
(214.4
|
)
|
367.9
|
|
—
|
|
(1,349.8
|
)
|
2,436.2
|
|
1,091.5
|
|
|||||||||||||||||
|
CASH FLOWS FROM INVESTING ACTIVITIES:
|
|||||||||||||||||||||||||||||||||||
|
Capital expenditures
|
—
|
|
—
|
|
—
|
|
—
|
|
(80.1
|
)
|
—
|
|
(162.1
|
)
|
—
|
|
(242.2
|
)
|
|||||||||||||||||
|
Proceeds from sale of property, plant and equipment
|
—
|
|
—
|
|
—
|
|
—
|
|
1.9
|
|
—
|
|
22.4
|
|
—
|
|
24.3
|
|
|||||||||||||||||
|
Proceeds from business disposition, net of cash sold
|
—
|
|
—
|
|
—
|
|
|
|
—
|
|
4.7
|
|
—
|
|
4.7
|
|
|||||||||||||||||||
|
Intercompany investing activities, net
|
—
|
|
1,313.3
|
|
—
|
|
777.2
|
|
(221.9
|
)
|
|
1,273.2
|
|
(3,141.8
|
)
|
—
|
|
||||||||||||||||||
|
Net cash provided by (used in) continuing investing activities
|
—
|
|
1,313.3
|
|
—
|
|
777.2
|
|
(300.1
|
)
|
—
|
|
1,138.2
|
|
(3,141.8
|
)
|
(213.2
|
)
|
|||||||||||||||||
|
Net cash provided by (used in) discontinued investing activities
|
—
|
|
—
|
|
—
|
|
—
|
|
—
|
|
—
|
|
(2.2
|
)
|
—
|
|
(2.2
|
)
|
|||||||||||||||||
|
Net cash provided by (used in) investing activities
|
—
|
|
1,313.3
|
|
—
|
|
777.2
|
|
(300.1
|
)
|
—
|
|
1,136.0
|
|
(3,141.8
|
)
|
(215.4
|
)
|
|||||||||||||||||
|
CASH FLOWS FROM FINANCING ACTIVITIES:
|
|||||||||||||||||||||||||||||||||||
|
Net proceeds (repayments) in debt
|
—
|
|
—
|
|
—
|
|
291.2
|
|
(6.7
|
)
|
—
|
|
7.2
|
|
—
|
|
291.7
|
|
|||||||||||||||||
|
Debt issuance costs
|
—
|
|
—
|
|
—
|
|
(13.2
|
)
|
—
|
|
—
|
|
—
|
|
—
|
|
(13.2
|
)
|
|||||||||||||||||
|
Dividends paid to ordinary shareholders
|
(245.5
|
)
|
—
|
|
—
|
|
—
|
|
—
|
|
—
|
|
—
|
|
—
|
|
(245.5
|
)
|
|||||||||||||||||
|
Dividends paid to noncontrolling interests
|
—
|
|
—
|
|
—
|
|
—
|
|
—
|
|
—
|
|
(12.4
|
)
|
—
|
|
(12.4
|
)
|
|||||||||||||||||
|
Proceeds from shares issued under incentive plans
|
272.5
|
|
—
|
|
—
|
|
—
|
|
—
|
|
—
|
|
—
|
|
—
|
|
272.5
|
|
|||||||||||||||||
|
Repurchase of ordinary shares
|
(1,213.2
|
)
|
—
|
|
—
|
|
—
|
|
—
|
|
—
|
|
—
|
|
—
|
|
(1,213.2
|
)
|
|||||||||||||||||
|
Transfer from Allegion
|
1,274.2
|
|
—
|
|
—
|
|
—
|
|
—
|
|
—
|
|
—
|
|
—
|
|
1,274.2
|
|
|||||||||||||||||
|
Intercompany financing activities, net
|
9.0
|
|
(1,261.9
|
)
|
—
|
|
72.6
|
|
(94.7
|
)
|
—
|
|
574.3
|
|
700.7
|
|
—
|
|
|||||||||||||||||
|
Net cash provided by (used in) continuing financing activities
|
97.0
|
|
(1,261.9
|
)
|
—
|
|
350.6
|
|
(101.4
|
)
|
—
|
|
569.1
|
|
700.7
|
|
354.1
|
|
|||||||||||||||||
|
Net cash provided by (used in) discontinued financing activities
|
—
|
|
—
|
|
—
|
|
—
|
|
—
|
|
—
|
|
(12.4
|
)
|
4.9
|
|
(7.5
|
)
|
|||||||||||||||||
|
Net cash provided by (used in) financing activities
|
97.0
|
|
(1,261.9
|
)
|
—
|
|
350.6
|
|
(101.4
|
)
|
—
|
|
556.7
|
|
705.6
|
|
346.6
|
|
|||||||||||||||||
|
Effect of exchange rate changes on cash and cash equivalents
|
—
|
|
—
|
|
—
|
|
—
|
|
—
|
|
—
|
|
6.1
|
|
—
|
|
6.1
|
|
|||||||||||||||||
|
Net increase (decrease) in cash and cash equivalents
|
—
|
|
—
|
|
—
|
|
913.4
|
|
(33.6
|
)
|
—
|
|
349.0
|
|
—
|
|
1,228.8
|
|
|||||||||||||||||
|
Cash and cash equivalents - beginning of period
|
—
|
|
—
|
|
—
|
|
61.9
|
|
59.1
|
|
—
|
|
587.4
|
|
—
|
|
708.4
|
|
|||||||||||||||||
|
Cash and cash equivalents - end of period
|
$
|
—
|
|
$
|
—
|
|
$
|
—
|
|
$
|
975.3
|
|
$
|
25.5
|
|
$
|
—
|
|
$
|
936.4
|
|
$
|
—
|
|
$
|
1,937.2
|
|
||||||||
F-56
SCHEDULE II
INGERSOLL-RAND PLC
VALUATION AND QUALIFYING ACCOUNTS
FOR THE YEARS ENDED
December 31, 2015
,
2014
AND
2013
(Amounts in millions)
|
Allowances for Doubtful Accounts:
|
|||
|
Balance December 31, 2012
|
$
|
24.8
|
|
|
Additions charged to costs and expenses
|
20.8
|
|
|
|
Deductions*
|
(9.7
|
)
|
|
|
Business acquisitions and divestitures, net
|
(7.2
|
)
|
|
|
Currency translation
|
(0.5
|
)
|
|
|
Other
|
7.2
|
|
|
|
Balance December 31, 2013
|
35.4
|
|
|
|
Additions charged to costs and expenses
|
7.4
|
|
|
|
Deductions*
|
(7.5
|
)
|
|
|
Business acquisitions and divestitures, net
|
0.1
|
|
|
|
Currency translation
|
(1.3
|
)
|
|
|
Balance December 31, 2014
|
34.1
|
|
|
|
Additions charged to costs and expenses
|
1.4
|
|
|
|
Deductions*
|
(5.3
|
)
|
|
|
Business acquisitions and divestitures, net
|
0.3
|
|
|
|
Currency translation
|
(2.2
|
)
|
|
|
Balance December 31, 2015
|
$
|
28.3
|
|
|
(*)
|
“Deductions” include accounts and advances written off, less recoveries.
|
F-57
TABLE OF CONTENTS
Part IItem 1. BusinessItem 1A. Risk FactorsItem 1B. Unresolved Staff CommentsItem 2. PropertiesItem 3. Legal ProceedingsItem 4. Mine Safety DisclosuresPart IIItem 5. Market For Registrant S Common Equity, Related Stockholder Matters andItem 6. Selected Financial DataItem 7. Management S Discussion and Analysis Of Financial Condition and Results Of OperationsItem 7A. Quantitative and Qualitative Disclosure About Market RiskItem 8. Financial Statements and Supplementary DataItem 9. Changes in and Disagreements with Accountants on Accounting and FinancialItem 9A. Controls and ProceduresItem 9B. Other InformationPart IIIItem 10. Directors, Executive Officers and Corporate GovernanceItem 11. Executive CompensationItem 12. Security Ownership Of Certain Beneficial Owners and Management and RelatedItem 13. Certain Relationships and Related Transactions, and Director IndependenceItem 14. Principal Accountant Fees and ServicesPart IVItem 15. Exhibits and Financial Statement SchedulesNote 1. Description Of CompanyNote 2. Summary Of Significant Accounting PoliciesNote 3. InventoriesNote 4. Property, Plant and EquipmentNote 5. GoodwillNote 6. Intangible AssetsNote 7. Debt and Credit FacilitiesNote 8. Financial InstrumentsNote 9. Fair Value MeasurementsNote 10. Pensions and Postretirement Benefits Other Than PensionsNote 11. EquityNote 12. Share-based CompensationNote 13. Restructuring ActivitiesNote 14. Other Income/(expense), NetNote 15. Income TaxesNote 16. Acquisitions and DivestituresNote 17. Earnings Per Share (eps)Note 18. Commitments and ContingenciesNote 19. Business Segment InformationNote 20. Guarantor Financial Information