20-F
UNITED STATES SECURITIES AND EXCHANGE COMMISSION
WASHINGTON, D.C. 20549
Form 20-F
(Mark One)
|
¨
|
REGISTRATION STATEMENT PURSUANT TO SECTION 12(b) OR 12(g) OF THE SECURITIES EXCHANGE ACT OF 1934
|
OR
|
þ
|
ANNUAL REPORT PURSUANT TO SECTION 13 OR 15(d) OF THE SECURITIES EXCHANGE ACT OF 1934
|
For the fiscal year ended December 31, 2015
OR
|
¨
|
TRANSITION REPORT PURSUANT TO SECTION 13 OR 15(d) OF THE SECURITIES EXCHANGE ACT OF 1934
|
|
|
For the transition period from
to
|
OR
|
¨
|
SHELL COMPANY REPORT PURSUANT TO SECTION 13 OR 15(d) OF THE SECURITIES EXCHANGE ACT OF 1934
|
|
|
Date of event requiring this shell company report
|
Commission file number: 1-10888
TOTAL S.A.
(Exact Name of Registrant as Specified in Its Charter)
Republic of France
(Jurisdiction of Incorporation or Organization)
2, place Jean Millier
La
Défense 6
92400 Courbevoie
France
(Address of Principal Executive Offices)
Patrick de La Chevardière
Chief Financial Officer
TOTAL S.A.
2, place Jean
Millier
La Défense 6
92400 Courbevoie
France
Tel: +33 (0)1 47 44 45 46
Fax: +33 (0)1 47 44 49 44
(Name, Telephone, Email and/or Facsimile Number and Address of Company Contact Person)
Securities registered or to be registered pursuant to Section 12(b) of the Act.
|
|
|
|
|
Title of each class
|
|
Name of each exchange on which registered
|
|
Shares
|
|
New York Stock Exchange*
|
|
American Depositary Shares
|
|
New York Stock Exchange
|
|
*
|
Not for trading, but only in connection with the registration of American Depositary Shares, pursuant to the requirements of the Securities and Exchange Commission.
|
Securities registered or to be registered pursuant to Section 12(g) of the Act.
None
Securities for which there is a
reporting obligation pursuant to Section 15(d) of the Act.
None
Indicate the number of outstanding shares of each of the issuer’s classes of capital or common stock as of the close of the period covered by the annual report.
2,440,057,883 Shares, par value
€
2.50
each, as of December 31, 2015
Indicate by check mark if the registrant is a well-known seasoned issuer, as defined in Rule 405 of the Securities
Act. Yes
þ
No
¨
If
this report is an annual or transition report, indicate by check mark if the registrant is not required to file reports pursuant to Section 13 or 15(d) of the Securities Exchange Act of 1934. Yes
¨
No
þ
Indicate by check mark whether the registrant
(1) has filed all reports required to be filed by Section 13 or 15(d) of the Securities Exchange Act of 1934 during the preceding 12 months (or for such shorter period that the registrant was required to file such reports), and
(2) has been subject to such filing requirements for the past 90 days. Yes
þ
No
¨
Indicate by check mark whether the registrant has submitted electronically and posted on its corporate website, if any, every Interactive Data File required to be
submitted and posted pursuant to Rule 405 of Regulation S-T (§ 232.405 of this chapter) during the preceding 12 months (or for such shorter period that the registrant was required to submit and post such files).**
Yes
¨
No
¨
|
**
|
This requirement is not currently applicable to the registrant.
|
Indicate by check mark whether the registrant is a large accelerated filer, an accelerated filer, or a non-accelerated filer. See definition of “accelerated
filer and large accelerated filer” in Rule 12b-2 of the Exchange Act. (Check one):
|
|
|
|
|
|
|
Large accelerated filer
þ
|
|
Accelerated
filer
¨
|
|
Non-accelerated filer
¨
|
Indicate by check mark which basis of accounting the registrant has used to prepare the financial statements included in this
filing:
|
|
|
|
|
|
|
U.S.
GAAP
¨
|
|
International Financial Reporting Standards as issued by the International
Accounting Standards Board
þ
|
|
Other
¨
|
If “Other” has been checked in response to the previous question, indicate by check mark which financial statement item
the registrant has elected to
follow. Item17
¨
Item 18
¨
If this is an annual report, indicate by check mark whether the registrant is a shell company (as defined in Rule 12b-2 of the Exchange Act). Yes
¨
No
þ
TABLE OF CONTENTS
|
|
|
|
|
|
|
|
|
|
|
Page
|
|
|
|
|
|
CERTAIN TERMS
|
|
|
i
|
|
|
|
|
|
ABBREVIATIONS
|
|
|
ii
|
|
|
|
|
|
CONVERSION TABLE
|
|
|
ii
|
|
|
|
|
|
CAUTIONARY STATEMENT CONCERNING FORWARD-LOOKING STATEMENTS
|
|
|
iii
|
|
|
|
|
|
|
Item 1.
|
|
Identity of Directors, Senior Management and Advisers
|
|
|
1
|
|
|
|
|
|
|
Item 2.
|
|
Offer Statistics and Expected Timetable
|
|
|
1
|
|
|
|
|
|
|
Item 3.
|
|
Key Information
|
|
|
1
|
|
|
|
|
|
|
|
|
Selected Financial Data
|
|
|
1
|
|
|
|
|
|
|
|
|
Exchange Rate Information
|
|
|
2
|
|
|
|
|
|
|
|
|
Risk Factors
|
|
|
2
|
|
|
|
|
|
|
Item 4.
|
|
Information on the Company
|
|
|
9
|
|
|
|
|
|
|
|
|
History and Development
|
|
|
9
|
|
|
|
|
|
|
|
|
Business Overview
|
|
|
10
|
|
|
|
|
|
|
|
|
Other Matters
|
|
|
44
|
|
|
|
|
|
|
Item 4A.
|
|
Unresolved Staff Comments
|
|
|
73
|
|
|
|
|
|
|
Item 5.
|
|
Operating and Financial Review and Prospects
|
|
|
73
|
|
|
|
|
|
|
Item 6.
|
|
Directors, Senior Management and Employees
|
|
|
84
|
|
|
|
|
|
|
|
|
Directors and Senior Management
|
|
|
84
|
|
|
|
|
|
|
|
|
Compensation
|
|
|
93
|
|
|
|
|
|
|
|
|
Corporate Governance
|
|
|
111
|
|
|
|
|
|
|
|
|
Employees and Share Ownership
|
|
|
124
|
|
|
|
|
|
|
Item 7.
|
|
Major Shareholders and Related Party Transactions
|
|
|
128
|
|
|
|
|
|
|
Item 8.
|
|
Financial Information
|
|
|
131
|
|
|
|
|
|
|
Item 9.
|
|
The Offer and Listing
|
|
|
134
|
|
|
|
|
|
|
Item 10.
|
|
Additional Information
|
|
|
135
|
|
|
|
|
|
|
Item 11.
|
|
Quantitative and Qualitative Disclosures About Market Risk
|
|
|
147
|
|
|
|
|
|
|
Item 12.
|
|
Description of Securities Other than Equity Securities
|
|
|
148
|
|
|
|
|
|
|
Item 13.
|
|
Defaults, Dividend Arrearages and Delinquencies
|
|
|
149
|
|
|
|
|
|
|
Item 14.
|
|
Material Modifications to the Rights of Security Holders and Use of Proceeds
|
|
|
149
|
|
|
|
|
|
|
Item 15.
|
|
Controls and Procedures
|
|
|
149
|
|
|
|
|
|
|
Item 16A.
|
|
Audit Committee Financial Expert
|
|
|
155
|
|
|
|
|
|
|
Item 16B.
|
|
Code of Ethics
|
|
|
155
|
|
|
|
|
|
|
Item 16C.
|
|
Principal Accountant Fees and Services
|
|
|
155
|
|
|
|
|
|
|
Item 16D.
|
|
Exemptions from the Listing Standards for Audit Committees
|
|
|
156
|
|
|
|
|
|
|
Item 16E.
|
|
Purchases of Equity Securities by the Issuer and Affiliated Purchasers
|
|
|
156
|
|
|
|
|
|
|
Item 16F.
|
|
Change in Registrant’s Certifying Accountant
|
|
|
156
|
|
|
|
|
|
|
Item 16G.
|
|
Corporate Governance
|
|
|
157
|
|
|
|
|
|
|
Item 16H.
|
|
Mine Safety Disclosure
|
|
|
159
|
|
|
|
|
|
|
Item 17.
|
|
Financial Statements
|
|
|
159
|
|
|
|
|
|
|
Item 18.
|
|
Financial Statements
|
|
|
159
|
|
|
|
|
|
|
Item 19.
|
|
Exhibits
|
|
|
160
|
|
Basis of presentation
Financial information included in this Annual Report is presented according to International Financial Reporting Standards (IFRS) as issued by the International Accounting Standards Board (IASB) and IFRS as adopted
by the European Union (EU) as of December 31, 2015.
Statements regarding competitive position
Unless otherwise indicated, statements made in “Item 4. Information on the Company” referring to TOTAL’s competitive position are based on the
Company’s estimates, and in some cases rely on a range of sources, including investment analysts’ reports, independent market studies and TOTAL’s internal assessments of market share based on publicly available information about the
financial results and performance of market participants.
Additional information
This Annual Report on Form 20-F reports information primarily regarding TOTAL’s business, operations and financial information relating to the fiscal year
ended December 31, 2015. For more recent updates regarding TOTAL, you may inspect any reports, statements or other information TOTAL files with the United States Securities and Exchange Commission (“SEC”). All of TOTAL’s SEC
filings made after December 31, 2001, are available to the public at the SEC website at http://www.sec.gov and from certain commercial document retrieval services. See also “Item 10 — 8. Documents on Display”.
No material on the TOTAL website forms any part of this Annual Report on Form 20-F. References in this document to documents on the TOTAL website are
included as an aid to their location and are not incorporated by reference into this document.
Certain terms
Unless the context indicates otherwise, the following terms have the meanings shown below:
|
“acreage”
|
The area, expressed in acres, over which TOTAL has interests in exploration or production.
|
|
“ADRs”
|
American Depositary Receipts evidencing ADSs.
|
|
“ADSs”
|
American Depositary Shares representing the shares of TOTAL S.A.
|
|
“association”/“consortium”/“joint venture”
|
Terms used to generally describe a project in which two or more entities participate. For the principles and methods of consolidation applicable to different types of joint arrangements according to IFRS,
refer to Note 1 to the Consolidated Financial Statements.
|
|
“barrels”
|
Barrels of crude oil, condensates, NGL or bitumen.
|
|
“condensates”
|
Condensates are a mixture of hydrocarbons that exist in a gaseous phase at original reservoir temperature and pressure, but that, when produced, exist in a liquid phase at surface temperature and
pressure. Condensates are sometimes referred to as C5+.
|
|
“crude oil”
|
Crude oil is a mixture of compounds (mainly pentanes and heavier hydrocarbons) that exists in a liquid phase at original reservoir temperature and pressure and remains liquid at atmospheric pressure and
ambient temperature. “Crude oil” or “oil” are sometimes used as generic terms to designate crude oil plus condensates plus NGL.
|
|
“Depositary”
|
JP Morgan Chase Bank, N.A.
|
|
“Depositary Agreement”
|
The depositary agreement pursuant to which ADSs are issued, a copy of which is attached as Exhibit (a) to the registration statement on Form F-6
(Reg. No. 333-199737)
filed with the SEC on October 31, 2014.
|
|
“ERMI”
|
The ERMI (European Refining Margin Indicator) is a Group indicator intended to represent the refining margin after variable costs for a theoretical complex refinery located around Rotterdam in Northern
Europe that processes a mix of crude oil and other inputs commonly supplied to this region to produce and market the main refined products at prevailing prices in the region.
|
|
“Group”
|
TOTAL S.A. and its subsidiaries and affiliates. The terms TOTAL and Group are used interchangeably.
|
|
“hydrocracker”
|
A refinery unit which uses a catalyst and extraordinarily high pressure, in the presence of surplus hydrogen, to shorten molecules.
|
|
“liquids”
|
Liquids consist of crude oil, bitumen, condensates and NGL.
|
|
“LNG”
|
Liquefied natural gas.
|
|
“LPG”
|
Liquefied petroleum gas is a mixture of hydrocarbons, the principal components of which are propane and butane, in a gaseous state at atmospheric pressure, but which is liquefied under moderate pressure
and ambient temperature. LPG is included in NGL.
|
|
“NGL”
|
Natural gas liquids (NGL) are a mixture of light hydrocarbons that exist in the gaseous phase at atmospheric pressure and are recovered as liquids in gas processing plants; NGL include very light
hydrocarbons (ethane, propane and butane).
|
|
|
|
|
|
2015 Form 20-F TOTAL S.A.
|
|
i
|
|
“oil and gas”
|
Generic term which includes all hydrocarbons (
e.g
., crude oil, condensates, NGL, bitumen and natural gas).
|
|
“project”
|
As used in this report, “project” may encompass different meanings, such as properties, agreements, investments, developments, phases, activities or components, each of which may also informally
be described as a “project”. Such use is for convenience only and is not intended as a precise description of the term “project” as it relates to any specific governmental law or regulation.
|
|
“proved reserves”
|
Proved oil and gas reserves are those quantities of oil and gas, which, by analysis of geoscience and engineering data, can be estimated with reasonable certainty to be economically producible from a
given date forward, from known reservoirs, and under existing economic conditions, operating methods, and government regulations, prior to the time at which contracts providing the right to operate expire, unless evidence indicates that renewal is
reasonably certain, regardless of whether deterministic or probabilistic methods are used for the estimation. The full definition of “proved reserves” that we are required to follow in presenting such information in our financial results
and elsewhere in reports we file with the SEC is found in Rule 4-10 of Regulation S-X under the U.S. Securities Act of 1933, as amended (including as amended by the SEC “Modernization of Oil and Gas Reporting” Release
No. 33-8995 of December 31, 2008) (“Rule 4-10”).
|
|
“proved developed reserves”
|
Proved developed oil and gas reserves are proved reserves that can be expected to be recovered (i) through existing wells with existing equipment and operating methods or in which the cost of the
required equipment is relatively minor compared to the cost of a new well; and (ii) through installed extraction equipment and infrastructure operational at the time of the reserves estimate if the extraction is by means not involving a well.
The full definition of “developed reserves” that we are required to follow in presenting such information in our financial results and elsewhere in reports we file with the SEC is found in Rule 4-10.
|
|
“proved undeveloped reserves”
|
Proved undeveloped oil and gas reserves are proved reserves that are expected to be recovered from new wells on undrilled acreage, or from existing wells where a relatively major expenditure is required
for recompletion. The full definition of “undeveloped reserves” that we are required to follow in presenting such information in our financial results and elsewhere in reports we file with the SEC is found in Rule 4-10.
|
|
“steam cracker”
|
A petrochemical plant that turns naphtha and light hydrocarbons into ethylene, propylene, and other chemical raw materials.
|
|
“TOTAL”
|
TOTAL S.A. and its subsidiaries and affiliates. We use such term interchangeably with the term Group. When we refer to the parent holding company alone, we use the term TOTAL S.A. or the Company.
|
|
“trains”
|
Facilities for converting, liquefying, storing and off-loading natural gas.
|
|
“turnarounds”
|
Temporary shutdowns of facilities for maintenance, overhaul and upgrading.
|
Abbreviations
|
|
|
|
|
|
|
|
|
|
|
|
|
|
|
|
|
b
|
|
= barrel
|
|
boe
|
|
= barrel of oil equivalent
|
|
cf
|
|
= cubic feet
|
|
GWh
|
|
= gigawatt-hour
|
|
t
|
|
= metric ton
|
|
m
3
|
|
= cubic meter
|
|
Btu
|
|
= British thermal unit
|
|
TWh
|
|
= terawatt-hour
|
|
/d
|
|
= per day
|
|
/y
|
|
= per year
|
|
k
|
|
= thousand
|
|
Wp
|
|
= watt peak
|
|
M
|
|
= million
|
|
B
|
|
= billion
|
|
W
|
|
= watt
|
|
|
|
|
Conversion table
|
|
|
|
|
|
|
1 acre
|
|
= 0.405 hectares
|
|
|
|
1 b
|
|
= 42 U.S. gallons
|
|
|
|
1 boe
|
|
= 1 b of crude oil
|
|
= 5,390 cf of gas in 2015
(a)
(5,400 cf in 2014 and 5,403 cf in 2013)
|
|
1 b/d of crude oil
|
|
= approximately 50 t/y of crude oil
|
|
|
|
1
Bcm/y
|
|
= approximately 0.1 Bcf/d
|
|
|
|
1 m
3
|
|
= 35.3147 cf
|
|
|
|
1 kilometer
|
|
= approximately 0.62 miles
|
|
|
|
1 ton
|
|
= 1 t
|
|
= 1,000 kilograms (approximately 2,205 pounds)
|
|
1 ton of oil
|
|
= 1 t of oil
|
|
= approximately 7.5 b of oil (assuming a specific gravity of 37° API)
|
|
1 Mt of LNG
|
|
= approximately 48 Mcf of gas
|
|
|
|
1 Mt/y LNG
|
|
= approximately 131 Mcf/d
|
|
|
|
(a)
|
Natural gas is converted to barrels of oil equivalent using a ratio of cubic feet of natural gas per one barrel. This ratio is based on the actual average
equivalent energy content of TOTAL’s natural gas reserves during the applicable periods, and is subject to change. The tabular conversion rate is applicable to TOTAL’s natural gas reserves on a group-wide basis.
|
|
|
|
|
|
ii
|
|
TOTAL S.A. Form 20-F 2015
|
Cautionary statement concerning forward-looking statements
TOTAL has made certain forward-looking statements in this document and in the documents referred to in, or incorporated by reference into, this Annual Report. Such
statements are subject to risks and uncertainties. These statements are based on the beliefs and assumptions of the management of TOTAL and on the information currently available to such management. Forward-looking statements include information
concerning forecasts, projections, anticipated synergies, and other information concerning possible or assumed future results of TOTAL, and may be preceded by, followed by, or otherwise include the words “believes”, “expects”,
“anticipates”, “intends”, “plans”, “targets”, “estimates” or similar expressions.
Forward-looking
statements are not assurances of results or values. They involve risks, uncertainties and assumptions. TOTAL’s future results and share value may differ materially from those expressed in these forward-looking statements. Many of the factors
that will determine these results and values are beyond TOTAL’s ability to control or predict. Except for its ongoing obligations to disclose material information as required by applicable securities laws, TOTAL does not have any intention or
obligation to update forward-looking statements after the distribution of this document, even if new information, future events or other circumstances have made them incorrect or misleading.
You should understand that various factors, certain of which are discussed elsewhere in this document and in the documents referred to in, or incorporated by reference into, this document, could affect the future
results of TOTAL and could cause results to differ materially from those expressed in such forward-looking statements, including:
|
|
•
|
|
material adverse changes in general economic conditions or in the markets served by TOTAL, including changes in the prices of oil, natural gas, refined products,
petrochemical products and other chemicals;
|
|
|
•
|
|
changes in currency exchange rates and currency devaluations;
|
|
|
•
|
|
the success and the economic efficiency of oil and natural gas exploration, development and production programs, including, without limitation, those that are
not controlled and/or operated by TOTAL;
|
|
|
•
|
|
uncertainties about estimates of changes in proven and potential reserves and the capabilities of production facilities;
|
|
|
•
|
|
uncertainties about the ability to control unit costs in exploration, production, refining and marketing (including refining margins) and chemicals;
|
|
|
•
|
|
changes in the current capital expenditure plans of TOTAL;
|
|
|
•
|
|
the ability of TOTAL to realize anticipated cost savings, synergies and operating efficiencies;
|
|
|
•
|
|
the financial resources of competitors;
|
|
|
•
|
|
changes in laws and regulations, including tax and environmental laws and industrial safety regulations;
|
|
|
•
|
|
the quality of future opportunities that may be presented to or pursued by TOTAL;
|
|
|
•
|
|
the ability to generate cash flow or obtain financing to fund growth and the cost of such financing and liquidity conditions in the capital markets generally;
|
|
|
•
|
|
the ability to obtain governmental or regulatory approvals;
|
|
|
•
|
|
the ability to respond to challenges in international markets, including political or economic conditions (including national and international armed conflict)
and trade and regulatory matters (including actual or proposed sanctions on companies that conduct business in certain countries);
|
|
|
•
|
|
the ability to complete and integrate appropriate acquisitions, strategic alliances and joint ventures;
|
|
|
•
|
|
changes in the political environment that adversely affect exploration, production licenses and contractual rights or impose minimum drilling obligations, price
controls, nationalization or expropriation, and regulation of refining and marketing, chemicals and power generating activities;
|
|
|
•
|
|
the possibility that other unpredictable events such as labor disputes or industrial accidents will adversely affect the business of TOTAL; and
|
|
|
•
|
|
the risk that TOTAL will inadequately hedge the price of crude oil or finished products.
|
For additional factors, you should read the information set forth under “Item 3 — C. Risk Factors”, “Item 4 — E. Other
Matters”, “Item 5. Operating and Financial Review and Prospects” and “Item 11. Quantitative and Qualitative Disclosures About Market Risk”.
|
|
|
|
|
2015 Form 20-F TOTAL S.A.
|
|
iii
|
Items 1 - 3
ITEM 1. IDENTITY OF DIRECTORS, SENIOR MANAGEMENT AND ADVISERS
Not applicable.
ITEM 2.
OFFER STATISTICS AND EXPECTED TIMETABLE
Not applicable.
ITEM 3. KEY INFORMATION
A. SELECTED FINANCIAL DATA
The following table presents selected consolidated financial data for TOTAL on the basis of IFRS as issued by the IASB and IFRS as adopted by the EU for the years ended December 31, 2015, 2014, 2013, 2012 and
2011. Effective January 1, 2014, TOTAL changed the presentation currency of the Group’s Consolidated Financial Statements from the Euro to the US Dollar. Comparative 2013, 2012 and 2011 information in the table below has been restated.
Following the retrospective application of the accounting interpretation IFRIC 21 effective January 1, 2014, the information for 2013 and 2012 has been restated; however, the impact on such restated results is not significant. Ernst &
Young Audit and KPMG S.A., independent registered public accounting firms and the Company’s auditors, audited the historical consolidated financial statements of TOTAL for these periods from which the financial data presented below for such
periods are derived, except for the application of IFRIC 21 and the change of presentation currency for the year 2011. All such data should be read in conjunction with the Consolidated Financial Statements and the Notes thereto included elsewhere
herein.
SELECTED CONSOLIDATED FINANCIAL DATA
|
|
|
|
|
|
|
|
|
|
|
|
|
|
|
|
|
|
|
|
|
|
|
(M$, except share and per share
data)
(a)
|
|
2015
|
|
|
2014
|
|
|
2013
|
|
|
2012
|
|
|
2011
|
|
|
INCOME STATEMENT DATA
|
|
|
|
|
|
|
|
|
|
|
|
|
|
|
|
|
|
|
|
|
|
Revenues from sales
|
|
|
143,421
|
|
|
|
212,018
|
|
|
|
227,969
|
|
|
|
234,216
|
|
|
|
231,830
|
|
|
Net income, Group share
|
|
|
5,087
|
|
|
|
4,244
|
|
|
|
11,228
|
|
|
|
13,648
|
|
|
|
17,400
|
|
|
Earnings per share
|
|
|
2.17
|
|
|
|
1.87
|
|
|
|
4.96
|
|
|
|
6.05
|
|
|
|
7.74
|
|
|
Fully diluted earnings per share
|
|
|
2.16
|
|
|
|
1.86
|
|
|
|
4.94
|
|
|
|
6.02
|
|
|
|
7.71
|
|
|
CASH FLOW STATEMENT DATA
|
|
|
|
|
|
|
|
|
|
|
|
|
|
|
|
|
|
|
|
|
|
Cash flow from operating activities
|
|
|
19,946
|
|
|
|
25,608
|
|
|
|
28,513
|
|
|
|
28,858
|
|
|
|
27,193
|
|
|
Total expenditures
|
|
|
28,033
|
|
|
|
30,509
|
|
|
|
34,431
|
|
|
|
29,475
|
|
|
|
34,161
|
|
|
BALANCE SHEET DATA
|
|
|
|
|
|
|
|
|
|
|
|
|
|
|
|
|
|
|
|
|
|
Total assets
|
|
|
224,484
|
|
|
|
229,798
|
|
|
|
239,223
|
|
|
|
225,886
|
|
|
|
211,793
|
|
|
Non-current financial debt
|
|
|
44,464
|
|
|
|
45,481
|
|
|
|
34,574
|
|
|
|
29,392
|
|
|
|
29,186
|
|
|
Non-controlling interests
|
|
|
2,915
|
|
|
|
3,201
|
|
|
|
3,138
|
|
|
|
1,689
|
|
|
|
1,749
|
|
|
Shareholders’ equity — Group share
|
|
|
92,494
|
|
|
|
90,330
|
|
|
|
100,241
|
|
|
|
93,969
|
|
|
|
86,667
|
|
|
Common shares
|
|
|
7,670
|
|
|
|
7,518
|
|
|
|
7,493
|
|
|
|
7,454
|
|
|
|
7,447
|
|
|
DIVIDENDS
|
|
|
|
|
|
|
|
|
|
|
|
|
|
|
|
|
|
|
|
|
|
Dividend per share (euros)
|
|
|
€
2.44
|
(b)
|
|
|
€
2.44
|
|
|
|
€
2.38
|
|
|
|
€
2.34
|
|
|
|
€
2.28
|
|
|
Dividend per share (dollars)
|
|
|
$2.67
|
(b)(c)
|
|
|
$2.93
|
|
|
|
$3.24
|
|
|
|
$3.05
|
|
|
|
$2.97
|
|
|
COMMON SHARES
(d)
|
|
|
|
|
|
|
|
|
|
|
|
|
|
|
|
|
|
|
|
|
|
Average number outstanding of common shares
€
2.50 par value (shares undiluted)
|
|
|
2,295,037,940
|
|
|
|
2,272,859,512
|
|
|
|
2,264,349,795
|
|
|
|
2,255,801,563
|
|
|
|
2,247,479,529
|
|
|
Average number outstanding of common shares
€
2.50 par value (shares diluted)
|
|
|
2,304,435,542
|
|
|
|
2,281,004,151
|
|
|
|
2,271,543,658
|
|
|
|
2,266,635,745
|
|
|
|
2,256,951,403
|
|
|
(a)
|
Following the retrospective application of the accounting interpretation IFRIC 21 effective January 1, 2014, the information for 2013 has been restated;
however, the impact on such restated results is not significant (for further information concerning this restatement, see the introduction to the Notes to the Consolidated Financial Statements included elsewhere herein).
|
|
(b)
|
Subject to approval by the shareholders’ meeting on May 24, 2016.
|
|
(c)
|
Estimated dividend in dollars includes the first quarterly interim ADR dividend of $0.69 paid in October 2015 and the second quarterly interim ADR dividend of
$0.66 paid in January 2016, as well as the third quarterly interim ADR dividend of $0.66 payable in April 2016 and the proposed final interim ADR dividend of $0.66 payable in July 2016, both converted at a rate of $1.09/
€
.
|
|
(d)
|
The number of common shares shown has been used to calculate per share amounts.
|
|
|
|
|
|
2015 Form 20-F TOTAL S.A.
|
|
1
|
Item 3
B. EXCHANGE RATE INFORMATION
For information regarding the effects of currency fluctuations on TOTAL’s results, see “Item 5.
Operating and Financial Review and Prospects”.
Most currency amounts in this Annual Report on Form 20-F are expressed in U.S. dollars
(“dollars” or “$”) or in euros (“euros” or “
€
”). For the convenience of the reader, this Annual
Report on Form 20-F presents certain translations into dollars of certain euro amounts ($1.30/
€
1.00).
The following table sets out the average dollar/euro exchange rates expressed in dollars per
€
1.00 for the years indicated, based on an average of the daily European Central Bank (“ECB”) reference exchange rate.
(1)
Such rates are used by TOTAL in preparation of its Consolidated Statement of Income and Consolidated Statement of Cash Flow in its Consolidated Financial Statements. No
representation is made that the euro could have been converted into dollars at the rates shown or at any other rates for such periods or at such dates.
DOLLAR/EURO EXCHANGE RATES
|
|
|
|
|
|
|
Year
|
|
Average Rate
|
|
|
2011
|
|
|
1.3920
|
|
|
2012
|
|
|
1.2848
|
|
|
2013
|
|
|
1.3281
|
|
|
2014
|
|
|
1.3285
|
|
|
2015
|
|
|
1.1095
|
|
The table below shows the high and low dollar/euro exchange rates for the four months ended December 31, 2015,
and for the first months of 2016, based on the daily ECB reference exchange rates published during the relevant month expressed in dollars per
€
1.00.
DOLLAR/EURO EXCHANGE RATES
|
|
|
|
|
|
|
|
|
|
|
Period
|
|
High
|
|
|
Low
|
|
|
September 2015
|
|
|
1.1419
|
|
|
|
1.1138
|
|
|
October 2015
|
|
|
1.1439
|
|
|
|
1.0930
|
|
|
November 2015
|
|
|
1.1032
|
|
|
|
1.0579
|
|
|
December 2015
|
|
|
1.0990
|
|
|
|
1.0600
|
|
|
January 2016
|
|
|
1.0920
|
|
|
|
1.0742
|
|
|
February 2016
|
|
|
1.1347
|
|
|
|
1.0884
|
|
|
March 2016
(a)
|
|
|
1.1119
|
|
|
|
1.0856
|
|
|
(a)
|
Through March 14, 2016.
|
The ECB
reference exchange rate on March 14, 2016 for the dollar against the euro was
$1.1119/
€
.
C. RISK FACTORS
The Group conducts its activities in an ever-changing environment and is exposed to risks that, if they were to
occur, could have a material adverse effect on its business, financial condition, assets and liabilities, results or outlook.
The Group employs a
continuous process of identifying and analyzing risks in order to determine those that could prevent it from achieving its objectives. This section presents the significant risks to which the Group believes it is exposed as of the date of this
report. However, as of that date, the Group may not be aware of other risks that could, or other risks may not have been considered by the Group as being likely to, have a significant adverse impact on the Group, its business, financial condition,
assets and liabilities, results or outlook. For additional information on these conditions, along with TOTAL’s approaches to managing certain of these risks, refer to “Item 4 — E. Other Matters”, “Item 5. Operating and
Financial Review and Prospects”, “Item 11. Quantitative and Qualitative Disclosures About Market Risk” and “Item 15 — Controls and Procedures”.
The financial performance of TOTAL is sensitive to a number of market-related factors, the most significant being crude oil and natural gas prices, refining margins and exchange rates.
Generally, a decline in crude oil prices has a negative effect on the Group’s results due to a decrease in
revenues from oil production. Conversely, a rise in crude oil prices increases revenues.
The year 2015 was marked by the continuing sharp fall in oil
prices that started in the second half of 2014. For the year 2016, according to the scenarios retained, the Group estimates that a decrease of $10 per barrel in the price of Brent Crude would decrease annual adjusted net operating income by
approximately $2 billion and cash flow from operations by approximately $2 billion. Conversely, an increase of $10 per barrel in the price of Brent Crude would increase annual adjusted net operating income by approximately $2 billion and cash flow
from operations by approximately $2 billion.
The impact of changes in crude oil prices on downstream operations depends upon the speed at which the
prices of finished products adjust to reflect these changes. The Group estimates that a decrease in its European Refining Margin Indicator (ERMI) of $10 per ton would decrease annual adjusted net operating income by approximately $0.5 billion and
cash flow from operations by approximately $0.6 billion. Conversely, an increase in its ERMI of $10 per ton would increase annual adjusted net operating income by approximately $0.5 billion and cash flow from operations by approximately $0.6
billion.
|
(1)
|
For the period 2011-2015, the averages of the ECB reference exchange rates expressed in dollars per
€
1.00 on the last business day of each month during the relevant year are as follows: 2011 — 1.40; 2012 —1.29;
2013 —1.33; 2014 — 1.32; and 2015 — 1.10.
|
|
|
|
|
|
2
|
|
TOTAL S.A. Form 20-F 2015
|
Item 3 - C. Risk Factors
All of the Group’s activities are, for various reasons and to varying degrees, sensitive to fluctuations in the
dollar/euro exchange rate. The Group estimates that an increase of $0.10 per euro (weakening of the dollar versus the euro) would decrease adjusted net operating income by approximately $0.15 billion and cash flow
from operations by approximately $0.1 billion. Conversely, a decrease of $0.10 per euro (strengthening of the dollar versus the euro) would increase adjusted net operating income by approximately
$0.15 billion and cash flow from operations by approximately $0.1 billion.
|
|
|
|
|
|
|
|
|
|
|
|
|
|
|
|
|
|
|
Market impact environment 2016
(a)
|
|
Scenario
retained
|
|
|
Change
|
|
|
Estimated impact on adjusted
net operating income
|
|
|
Estimated impact on cash
flow from operations
|
|
|
Brent
|
|
|
50 $/b
|
|
|
|
-10 $/b
|
|
|
|
-2 B$
|
|
|
|
-2 B$
|
|
|
European refining margin indicator
(ERMI)
|
|
|
35 $/t
|
|
|
|
-10 $/t
|
|
|
|
-0.5 B$
|
|
|
|
-0.6 B$
|
|
|
$/
€
|
|
|
1.0
$/
€
|
|
|
|
+0.1 $ per
€
|
|
|
|
-0.15 B$
|
|
|
|
-0.1 B$
|
|
|
(a)
|
Sensitivities revised once per year upon publication of the previous year’s fourth quarter results. Indicated sensitivities are approximate and based
upon TOTAL’s current view of its 2016 portfolio. Results may differ significantly from the estimates implied by the application of these sensitivities. 85% of the impact of the
$/
€
sensitivity on net adjusted operating income is attributable to the Refining & Chemicals segment.
|
In addition to the adverse effect on the Group’s revenues, margins and profitability, a prolonged period
of low oil and natural gas prices could lead the Group to review its projects and the evaluation of its assets and oil and natural gas reserves.
Prices for oil and natural gas may fluctuate widely due to many factors over which TOTAL has no control. These factors include:
|
•
|
|
variations in global and regional supply of and demand for energy;
|
|
•
|
|
global and regional economic and political developments in resource-producing regions, particularly in the Middle East, Africa and South America;
|
|
•
|
|
the ability of the Organization of the Petroleum Exporting Countries (OPEC) and other producing nations to influence global production levels and prices;
|
|
•
|
|
prices of unconventional energies as well as evolving approaches for developing oil sands and shale oil, which may affect the Group’s realized prices,
notably under its long-term gas sales contracts and asset valuations, particularly in North America;
|
|
•
|
|
cost and availability of new technology;
|
|
•
|
|
governmental regulations and actions;
|
|
•
|
|
global economic and financial market conditions;
|
|
•
|
|
war or other conflicts;
|
|
•
|
|
changes in demographics, including population growth rates and consumer preferences; and
|
|
•
|
|
adverse weather conditions that can disrupt supplies or interrupt operations of the Group’s facilities.
|
Low oil and natural gas prices over prolonged periods may reduce the economic viability of projects planned or in development, impact the Group’s asset sale
program and reduce liquidity, thereby decreasing the Group’s ability to finance capital expenditures and/or causing it to cancel or postpone investment projects.
If TOTAL is unable to follow through with investment projects, the Group’s opportunities for future revenue and profitability growth would be reduced, which could materially impact the Group’s financial
condition.
Prolonged periods of low oil and natural gas prices may reduce the Group’s reported reserves and/or result in impairment that could have
a significant effect on the Group’s results in the period in which it occurs.
Conversely, in a high oil and gas price environment, the Group can
experience significant increases in cost and government take, and,
under some production-sharing contracts, the Group’s production rights could be reduced. Higher prices can also reduce demand for the Group’s products.
The Group’s earnings from its Refining & Chemicals and Marketing & Services segments are primarily dependent upon the supply and demand for
refined products and the associated margins on refined product sales, with the impact of changes in oil and gas prices on earnings on these segments being dependent upon the speed at which the prices of refined products adjust to reflect movements
in oil and gas prices. In 2015, the negative effects of the decline of oil prices on the Group’s results were partially offset by the results of Refining & Chemicals, which were supported by high refining margins. In 2016, there can be
no assurance that the refining margins will remain at such a high level.
The activities of Trading & Shipping (oil, gas and power trading and
shipping activities) are particularly sensitive to market risk and more specifically to price risk as a consequence of the volatility of oil and gas prices, to liquidity risk (inability to buy or sell cargoes at market prices) and to counterparty
risk (when a counterparty does not fulfill its contractual obligations). The Group uses various energy derivative instruments to adjust its exposure to price fluctuations of crude oil, refined products, natural gas, power and freight-rates. Although
TOTAL believes it has established appropriate risk management procedures, large market fluctuations may adversely affect the activities and operating results of the Group.
Since the second half of 2014, oil prices have declined very significantly. For more detailed information on the impact of the sharp decline in oil prices on the Group’s 2015 results, financial condition
(including impairments, significant reductions to capital expenditures and operating costs, and divestments completed under the Group’s asset sale program) and outlook, refer to “Item 5. Operating and Financial Review and
Prospects”.
Certain financial risks are detailed in Note 31 to the Consolidated Financial Statements.
TOTAL is exposed to risks related to the safety and security of its operations.
The Group’s activities involve a wide range of operational risks, such as explosions, fires, accidents, equipment failures, leakage of toxic products, emissions or discharges into the air, water or soil, that
can potentially cause death or injury, or impact natural resources and ecosystems.
|
|
|
|
|
2015 Form 20-F TOTAL S.A.
|
|
3
|
Item 3 - C. Risk Factors
The industrial event that could have the most significant impact is a major industrial accident (
e.g.
, blow
out, explosion, fire, leakage of highly toxic products resulting in the death or injury of one or several people and/or accidental pollution on a large-scale or at an environmentally sensitive site).
Acts of terrorism against the Group’s plants and sites, pipelines, and transportation and computer systems could also disrupt its business activities and could
cause harm to people, the environment and property.
Certain activities of the Group face specific additional risks. TOTAL’s Upstream segment faces,
notably, risks related to the physical characteristics of oil and gas fields, particularly during exploration operations that can cause blow outs, explosions and fires and harm the environment as well as lead to a disruption of the Group’s
operations or reduce its production. In addition to the risks of explosions and fires, the activities of the Refining & Chemicals and Marketing & Services business segments entail risks related to the overall life cycle of the
products manufactured, as well as the materials used. With regard to transportation, the likelihood of an operational accident depends not only on the hazardous nature of the products transported, but also on the volumes involved and the sensitivity
of the regions through which they are transported (quality of infrastructure, population density, environmental considerations).
TOTAL’s workforce
and the public are exposed to risks inherent to the Group’s operations (loss of life, injuries, property damage, environmental damage) that could result in regulatory action and legal liability against the Group’s entities and senior
management as well as damage to the Group’s reputation. Like most industrial groups, TOTAL is affected by reports of occupational illnesses, particularly those caused by past exposure of Group employees to asbestos.
To manage the operational risks to which it is exposed, the Group maintains worldwide third-party liability insurance coverage for all its subsidiaries. TOTAL also
has insurance to protect against the risk of damage to Group property and/or business interruption at its main refining and petrochemical sites. TOTAL’s insurance and risk management policies are described in “Item 4 — E. Other
Matters — 3. Insurance and risk management”. However, the Group is not insured against all potential risks. In certain cases, such as a major environmental disaster, TOTAL’s liability may exceed the maximum coverage provided by
its third-party liability insurance. The Group cannot guarantee that it will not suffer any uninsured loss and there can be no guarantee, particularly in the event of a major environmental disaster or industrial accident, that such loss would not
have a material adverse effect on the Group.
Crisis management systems are necessary to effectively respond to emergencies, avoid potential
disruptions to TOTAL’s business and operations and minimize impacts on third parties and the environment.
TOTAL has crisis management plans
in place to deal with emergencies (refer to “Item 15 — Controls and Procedures”). However, these plans cannot exclude the risk that the Group’s business and operations may be severely disrupted in a crisis situation or ensure the
absence of impacts on third parties or the environment. TOTAL has also implemented business continuity plans to continue or resume operations following a shutdown or incident. An inability to restore or replace critical capacity in a timely manner
could prolong the impact of any disruption and could have a material adverse effect on the Group’s business and operations.
TOTAL is subject to increasingly stringent environmental, health and safety laws and regulations in numerous
countries and may incur material related compliance costs.
The Group’s activities are subject to numerous laws and regulations pertaining
to health, safety and the environment. In most countries where the Group operates, particularly in Europe and the United States, sites and products are subject to increasingly strict laws governing the protection of the environment (
e.g.
,
water, air, soil, noise, protection of nature, waste management, impact assessments), health (
e.g.
, occupational safety, chemical product risk), and the safety of personnel and residents (
e.g.
, major risk facilities).
Product quality and consumer protection are also subject to regulations. The Group’s entities ensure that their products meet applicable specifications and
abide by all applicable consumer protection laws. Failure to do so could lead to personal injury, environmental harm and loss of customers, which could negatively impact the Group’s operating results, financial position and reputation.
TOTAL incurs, and will continue to incur, substantial expenditures to comply with increasingly complex laws and regulations aimed at protecting health,
safety and the environment. Such expenditures could have a material adverse effect on the Group’s operating results and financial position.
As a
further result of, notably, the introduction of new laws and regulations, the Group could also be compelled to curtail, modify or cease certain operations or implement temporary shutdowns of facilities, which could diminish the Group’s
productivity and have a material adverse impact on its operating results.
Moreover, most of the Group’s activities will eventually, at site
closure, require decommissioning followed by environmental remediation after operations are discontinued, due to compliance with applicable regulations. Costs related to such activities may materially exceed the Group’s provisions and adversely
impact its operating results. With regard to the permanent shutdown of an activity, the Group’s environmental contingencies and asset retirement obligations are addressed in the “Asset retirement obligations” and “Provisions for
environmental contingencies” sections of the Group’s Consolidated Balance Sheet (refer to Note 19 to the Consolidated Financial Statements). Future expenditures related to asset retirement obligations are accounted for in accordance
with the accounting principles described in Note 1Q to the Consolidated Financial Statements.
Laws and regulations related to climate change
may adversely affect the Group’s business.
Growing public concern in a number of countries over greenhouse gas (GHG) emissions and climate
change, as well as a multiplication of stricter regulations in this area, could adversely affect the Group’s businesses, increase its operating costs and reduce its profitability.
The scientific community has established a link between climate change and increasing GHG emissions. The worldwide goal to limit global warming has led to the need to gradually reduce fossil fuel use notably
through the diversification of the energy mix. The share of natural gas, the least GHG-emitting fossil energy source, represented nearly 50% of TOTAL’s production in 2015, compared to approximately 35% in 2005. The Group has ceased its coal
production activities and is developing its renewable energy production activities in solar and biomass. Regulations designed to gradually limit fossil fuel use may, depending on the
|
|
|
|
|
4
|
|
TOTAL S.A. Form 20-F 2015
|
Item 3 - C. Risk Factors
GHG emission limits and time horizons set, negatively and significantly affect the development of the most emitting
projects, as well as the economic value of some of the Group’s assets.
In Europe, the regulations concerning the market for CO
2
emission allowances, the EU Emissions Trading System (EU-ETS), entered a third phase on January 1, 2013. This phase marks the end of the overall free allocation of emission
allowances: certain emissions, such as those related to electricity production, no longer benefit from free allowances, while for others free allowances have been significantly reduced. Free allocations are now established based on the emission
level of the top-performing plants (
i.e.,
the least GHG-emitting) within the same sector (“top 10 benchmark”). Lower-performing plants must purchase, at market price, the necessary allowances to cover their emissions over these free
allocations. The plants also need to indirectly bear the cost of allowances for all electricity consumed (including electricity generated internally at the facilities).
The European Commission’s decision to apply a “cross-sectoral correction factor” (CSCF) has reduced the total amount of free allocations for all sectors combined by an average of 11.6% over phase 3
(2013-2020). However, the revision in 2014 of the list of “sectors exposed to carbon leakage” confirmed that the refining sector in Europe is an exposed sector, which may continue to benefit from free allowances that partially cover its
deficits.
In this context, the Group estimates that approximately 30% of its emissions subject to the EU-ETS will not be covered by
free allowances during the 2013-2020 period. The financial risk related to the foreseeable purchase of CO
2
emission allowances on the market should remain low for the Group
during this period. At year-end 2015, the price of the EU allowances stood at approximately
€
8/t CO
2
and may reach approximately
€
20/t
(1)
CO
2
for 2020 due to the combined effects of backloading
(2)
, having removed 900 Mt from phase 3 allowance auctions, and the establishment of a “market stability reserve” at the end of this phase.
The physical effects of climate change may adversely affect the Group’s business.
TOTAL’s businesses operate in varied locales where the potential physical impacts of climate change, including changes in weather patterns, are highly uncertain and may adversely impact the results of the
Group’s operations.
Climate change potentially has multiple effects that could harm the Group’s operations. The increasing scarcity of water
resources may negatively affect the Group’s operations in some regions of the world, high sea levels may harm certain coastal activities, and the multiplication of extreme weather events may damage offshore and onshore facilities. These climate
risk factors are continually assessed in TOTAL’s management and risk management plans.
The Group believes that it is impossible to guarantee that
the contingencies or liabilities related to the matters mentioned above will not have a material adverse impact in the future on its business, assets and liabilities, consolidated financial situation, cash flow or income.
Disruption to or breaches of TOTAL’s critical IT services or information security systems could adversely affect the Group’s operations.
The Group’s activities depend heavily on the reliability and security of its information technology (IT) systems. If the integrity of its
IT
systems were compromised due to, for example, technical failure, cyber attack, computer intrusions and viruses, power or network outages or natural disasters, the Group’s activities and
assets could sustain serious damage, material intellectual property could be divulged and, in some cases, personal injury, environmental harm and regulatory violations could occur, potentially having a material adverse effect on the Group’s
financial condition, including its results.
The Group’s production growth and profitability depend on the delivery of its major development
projects.
Growth of production and profitability of the Group rely heavily on the successful execution of its major development projects that
are increasingly complex and capital-intensive. These major projects are subject to a number of challenges, including, in particular, those related to:
|
•
|
|
negotiations with partners, governments, suppliers, customers and others;
|
|
•
|
|
obtaining project financing;
|
|
•
|
|
controlling operating costs;
|
|
•
|
|
earning an adequate return in a low oil price environment;
|
|
•
|
|
adhering to projects schedules; and
|
|
•
|
|
the timely issuance or renewal of permits and licenses by government agencies.
|
Poor delivery of any major project that underpins production or production growth could adversely affect the Group’s financial performance.
The Group’s long-term profitability depends on cost-effective discovery, acquisition and development of economically viable new reserves; if the Group is unsuccessful, its operating results and financial
condition would be materially and adversely affected.
A large portion of the Group’s revenues and operating results are derived from the
sale of oil and gas that the Group extracts from underground reserves developed as part of its exploration and production activities. The development of oil and gas fields, the construction of facilities and the drilling of production or injection
wells is capital intensive and requires advanced technology. Due to constantly changing market conditions and environmental challenges, cost projections can be uncertain. For the Upstream segment to continue to be profitable, the Group needs to
replace its reserves with new proved reserves that can be developed and produced in an economically viable manner.
In addition, TOTAL’s ability to
discover or acquire and develop new reserves successfully is uncertain and can be negatively affected by a number of factors, including:
|
•
|
|
the geological nature of oil and gas fields, notably unexpected drilling conditions including pressure or unexpected heterogeneities in geological formations;
|
|
•
|
|
the risk of dry holes or failure to find expected commercial quantities of hydrocarbons;
|
|
•
|
|
the inability of service companies to deliver on contracted services on time and on budget;
|
|
•
|
|
the inability of the Group’s partners to execute or finance projects in which the Group holds an interest;
|
|
•
|
|
equipment failures, fires, blow-outs or accidents;
|
|
•
|
|
the Group’s inability to develop or implement new technologies that enable access to previously inaccessible fields;
|
|
(2)
|
Backloading: authorization given to the European Commission to intervene at its own
discretion in the CO
2
allowance auction calendar.
|
|
|
|
|
|
2015 Form 20-F TOTAL S.A.
|
|
5
|
Item 3 - C. Risk Factors
|
•
|
|
the Group’s inability to anticipate market changes in a timely manner;
|
|
•
|
|
adverse weather conditions;
|
|
•
|
|
compliance with both anticipated and unanticipated governmental requirements, including U.S. and EU regulations that may give a competitive advantage to
companies not subject to such regulations;
|
|
•
|
|
shortages or delays in the availability or delivery of appropriate equipment;
|
|
•
|
|
competition from oil and gas companies for the acquisition and development of assets and licenses;
|
|
•
|
|
increased taxes and royalties, including retroactive claims; and
|
|
•
|
|
disputes related to property titles.
|
These
factors could lead to cost overruns and could impair the Group’s ability to complete a development project or make production economical. Some of these factors may also affect the Group’s projects and facilities further down the oil and
gas chain.
If TOTAL fails to develop new reserves cost-effectively in sufficient quantities to replace the Group’s reserves currently being
developed, produced and marketed, the Group’s financial condition, including its results, would be materially and adversely affected.
The
Group’s oil and gas reserves data are estimates only and subsequent downward adjustments are possible. If actual production from such reserves proves to be lower than current estimates indicate, the Group’s operating results and financial
condition would be negatively impacted.
The Group’s proved reserves figures are estimates prepared in accordance with SEC rules. Proved
reserves are those reserves which, by analysis of geoscience and engineering data, can be estimated with reasonable certainty to be economically recoverable — from a given date forward, from known reservoirs and under existing economic
conditions, operating methods and government regulations — prior to the time at which contracts providing the right to operate expire, unless evidence indicates that renewal is reasonably certain, regardless of whether deterministic or
probabilistic methods are used for the estimation. Reserves are estimated by teams of qualified, experienced and trained geoscientists, petroleum engineers and project engineers, who rigorously review and analyze in detail all available geoscience
and engineering data (
e.g.
, seismic data, electrical logs, cores, fluids, pressures, flow rates, facilities parameters). This process involves making subjective judgments, including with respect to the estimate of hydrocarbons initially in
place, initial production rates and recovery efficiency, based on available geological, technical and economic data. Consequently, estimates of reserves are not exact measurements and are subject to revision.
A variety of factors that are beyond the Group’s control could cause such estimates to be adjusted downward in the future, or cause the Group’s actual
production to be lower than its currently reported proved reserves indicate. These main such factors include:
|
•
|
|
a decline in the price of oil or gas, making reserves no longer economically viable to exploit and therefore not classifiable as proved;
|
|
•
|
|
an increase in the price of oil or gas, which may reduce the reserves to which the Group is entitled under production sharing and risked service contracts and
other contractual terms;
|
|
•
|
|
changes in tax rules and other government regulations that make reserves no longer economically viable to exploit; and
|
|
•
|
|
the actual production performance of the Group’s deposits.
|
The Group’s reserves estimates may therefore require substantial downward revisions should its subjective judgments prove not to have been conservative enough based on the available geoscience and engineering
data, or the Group’s assumptions regarding factors or variables that are beyond its control prove to be incorrect over time. Any downward adjustment would indicate lower future production amounts, which could adversely affect the Group’s
financial condition, including its results.
Many of the Group’s projects are conducted by equity affiliates or are operated by third parties.
For these projects, the Group’s degree of control, as well as its ability to identify and manage risks, may be reduced.
A significant
number of the Group’s projects is conducted by equity affiliates. In cases where the Group’s company is not the operator, such company may have limited influence over, and control of, the behavior, performance and costs of the partnership,
its ability to manage risks may be limited and it may, nevertheless, be prosecuted by regulators or claimants in the event of an incident.
For
additional information concerning equity affiliates, refer to Note 12 (“Equity affiliates: investments and loans”) to the Consolidated Financial Statements.
Additionally, the partners of the Group may not be able to meet their financial or other obligations to the projects, which may threaten the viability of a given project. These partners may also not have the
financial capacity to fully indemnify the Group in the event of an incident.
Contracts signed by the Group’s entities may provide for
indemnification obligations either by TOTAL in favor of the contractor or third parties or by the contractor or third parties in favor of TOTAL if, for example, an event occurs leading to death, personal injury or property or environmental damage.
With respect to joint ventures, contractual terms generally provide that the operator, whether an entity of the Group or a third party, assumes full
liability for damages caused by its gross negligence or willful misconduct.
In the absence of the operator’s gross negligence or willful
misconduct, other liabilities are generally borne by the joint venture and the cost thereof is assumed by the partners of the joint venture in proportion to their respective ownership interests.
With respect to third-party providers of goods and services, the amount and nature of the liability assumed by the third party depends on the context and may be
limited by contract. With respect to their customers, the Group’s entities ensure that their products meet applicable specifications and abide by all applicable consumer protection laws. Failure to do so could lead to personal injury,
environmental harm and loss of customers, which could negatively impact the Group’s financial condition and reputation.
|
|
|
|
|
6
|
|
TOTAL S.A. Form 20-F 2015
|
Item 3 - C. Risk Factors
TOTAL has significant production and reserves located in politically, economically and socially unstable areas,
where the likelihood of material disruption of the Group’s operations is relatively high.
A significant portion of TOTAL’s oil and gas
production and reserves is located in countries outside of the Organisation for Economic Co-operation and Development (OECD). In recent years, a number of these countries have experienced varying degrees of one or more of the following: economic
instability, political volatility, civil war, violent conflict, social unrest, actions of terrorist groups and the application of international economic sanctions. Any of these conditions alone or in combination could disrupt the Group’s
operations in any of these regions, causing substantial declines in production or revisions to reserves estimates. In Africa, which represented 29% of the Group’s 2015 combined liquids and gas production, certain of the countries in which the
Group has production have recently suffered from some of these conditions, including Nigeria, which is one of the main contributing countries to the Group’s production of hydrocarbons, and Libya. The Middle East, which represented 21% of the
Group’s 2015 combined liquids and gas production, has in recent years suffered increased political volatility in connection with violent conflict and social unrest, including Syria, where European Union (EU) and U.S. economic sanctions have
prohibited TOTAL from producing oil and gas since 2011. In Yemen, the deterioration of security conditions in the vicinity of Balhaf have lead the company Yemen LNG, in which the Group holds a stake of 39.62%, to stop its commercial production and
export of LNG and to declare
force majeure
to its various stakeholders. In South America, which represented 6% of the Group’s 2015, combined liquids and gas production, certain of the countries in which TOTAL has production have recently
suffered from some of the above-mentioned conditions, including Argentina and Venezuela. In Russia, where, as of December 31, 2015, the Group held 19% of its proved reserves, members of the international community have, since July 2014, adopted
economic sanctions against certain Russian persons and entities, including various entities operating in the financial, energy and defense sectors, in response to the situation in Ukraine (for additional information, refer to the risk factor on
economic sanctions, below).
Furthermore, in addition to current production, TOTAL is also exploring for and developing new reserves in other regions of
the world that are historically characterized by political, social and economic instability, such as the Caspian Sea region where TOTAL has large projects currently underway.
The occurrence and magnitude of incidents related to economic, social and political instability are unpredictable. It is possible that they could have a material adverse impact on the Group’s production and
operations in the future and/or cause certain investors to reduce their holdings of TOTAL’s securities.
TOTAL, like other major international
energy companies, has a geographically diverse portfolio of reserves and operational sites, which allows it to conduct its business and financial affairs so as to reduce its exposure to political and economic risks. However, there can be no
assurance that such events will not have a material adverse impact on the Group.
Intervention by host country authorities can adversely effect the
Group’s activities and its operating results.
TOTAL has significant exploration and production activities, and in some cases refining,
marketing or chemicals operations, in countries whose governmental and regulatory framework is subject to unexpected change and where the enforcement of contractual rights is uncertain. The legal framework of TOTAL’s exploration
and production activities, established through concessions, licenses, permits and contracts granted by or entered into with a government entity, a state-owned company or, sometimes, private
owners, is subject to risks of renegotiation that, in certain cases, can reduce or challenge the protections offered by the initial legal framework.
In
addition, the Group’s exploration and production activities in such countries are often undertaken in conjunction with state-owned entities, for example as part of a joint venture where the state has a significant degree of control. In recent
years, in various regions globally, TOTAL has observed governments and state-owned enterprises impose more stringent conditions on companies pursuing exploration and production activities in their respective countries, increasing the costs and
uncertainties of the Group’s business operations, which is a trend TOTAL expects to continue.
Potential increasing intervention by governments in
such countries can take a wide variety of forms, including:
|
•
|
|
the award or denial of exploration and production interests;
|
|
•
|
|
the imposition of specific drilling obligations;
|
|
•
|
|
price and/or production quota controls and export limits;
|
|
•
|
|
nationalization or expropriation of assets;
|
|
•
|
|
unilateral cancellation or modification of license or contract rights;
|
|
•
|
|
increases in taxes and royalties, including retroactive claims;
|
|
•
|
|
the renegotiation of contracts;
|
|
•
|
|
the imposition of increased local content requirements;
|
|
•
|
|
currency exchange restrictions or currency devaluation.
|
Imposition of any of these factors by a host government where TOTAL has substantial operations, including exploration, could cause the Group to incur material costs or cause the Group’s production or value of
the Group’s assets to decrease, which could potentially have a material adverse effect on its results.
For example, the Nigerian government has
been contemplating new legislation to govern the petroleum industry which, if passed into law, could have an impact on the existing and future activities of the Group in that country through increased taxes and/or operating costs and could adversely
affect financial returns from projects in that country.
The Group operates in a highly competitive environment. Its competitiveness could be
adversely impacted if the Group’s level of innovation lagged behind its competitors.
TOTAL’s main competitors are comprised of
national and international oil companies. The evolution of the energy sector has opened the door to new competitors and increased market price volatility.
TOTAL is subject to competition in the acquisition of assets and licenses for the exploration and production of oil and natural gas as well as for the sale of
manufactured products based on crude and refined oil. In the gas sector, major producers increasingly compete in the downstream value chain with established distribution companies, including those that belong to the Group. Increased competitive
pressure could have a significant negative effect on the prices, margins and market shares of the Group’s companies.
The pursuit of unconventional
gas development, particularly in the United States, has contributed to falling market prices and a marked difference between spot and long-term contract prices. The competitiveness of long-term contracts indexed to oil prices could be affected if
this discrepancy persists and if it should prove difficult to invoke price revision clauses.
|
|
|
|
|
2015 Form 20-F TOTAL S.A.
|
|
7
|
Item 3 - C. Risk Factors
The Group’s activities are carried out in a constantly changing environment with new products and technologies
continuously emerging. The Group may not be able to anticipate these changes, identify and integrate technological developments in order to maintain its competitiveness, maintain a high level of performance and operational excellence, and best meet
the needs and demands of its customers. The Group’s innovation policy requires significant investment, notably in R&D, of which the expected impact cannot be guaranteed.
Ethical misconduct or breaches of applicable laws by employees of the Group could expose TOTAL to criminal and civil penalties and be damaging to TOTAL’s reputation and shareholder value.
The Group’s Code of Conduct, which applies to all of its employees, defines TOTAL’s commitment to business integrity and compliance
with all applicable legal requirements and high ethical standards. This commitment is supported by a “zero tolerance” principle. Ethical misconduct or non-compliance with applicable laws and regulations by TOTAL or any third party acting
on its behalf could expose TOTAL and/or its employees to criminal and civil penalties and could be damaging to TOTAL’s reputation and shareholder value.
In addition, such misconduct or non-compliance may lead the competent authorities to impose other measures, such as the appointment of an independent monitor in charge of assessing the Group’s compliance and
internal control procedures and, if need be, recommending improvements. For an overview of the settlements between TOTAL, the SEC and the Department of Justice (DoJ) providing for the appointment of an independent monitor, refer to “Item 4
— E. Other Matters — 4.3.7.1. Preventing corruption” and “Item 8 — 4. Legal or arbitration proceedings — Iran”.
With respect to competition laws, which apply to the Group’s companies in the vast majority of countries in which it does business, non-compliance may result in substantial fines and expose the Group and its
employees to criminal sanctions and civil suits.
Generally, entities of the Group could potentially be subject to administrative, judicial or
arbitration proceedings that could have a material adverse impact on the Group or its financial situation.
TOTAL has activities in certain
countries targeted by economic sanctions. If the Group’s activities are not conducted in accordance with applicable laws and regulations, TOTAL could be sanctioned or otherwise penalized.
Various members of the international community have targeted certain countries, including Iran, Syria and Russia, with economic sanctions and other restrictive
measures. U.S. and European restrictions relevant to the Group and certain disclosure concerning the Group’s limited activities or presence in certain targeted countries are outlined below and in “Item 4 — E. Other Matters
— 5. Information concerning certain limited activities in Iran and Syria”, respectively.
TOTAL continues to closely monitor the possible
impacts of international economic sanctions regimes on its activities. The Group does not believe that its activities in targeted countries are in violation of applicable international economic sanctions administered by the United States, the
European Union (“EU”) and other members of the international community. However, the Group cannot assure that current or future regulations or developments related to economic sanctions will not have a negative impact on its business or
reputation. A violation by the
Group of applicable laws or regulations could result in criminal, civil and/or material financial penalties.
|
-
|
|
Restrictions against Iran
|
With respect
to Iran, the United States has adopted a number of measures since 1996 that provide for the possible imposition of sanctions against non-U.S. companies engaged in certain activities in and with Iran. Pursuant to the Iran Sanctions Act
(“ISA”), which has been amended and expanded on several occasions since 1996, including by the Comprehensive Iran Sanctions, Accountability and Divestment Act of 2010 (“CISADA”), the President of the United States is authorized
to initiate an investigation into the activities of non-U.S. companies in Iran’s energy sector and to impose sanctions against persons found, amongst other activities, to have knowingly made investments of $20 million or more in Iran’s
petroleum sector in any 12-month period. In May 1998, the U.S. government waived the application of ISA sanctions for TOTAL’s past investments in the South Pars gas field. This waiver, which has not been modified since it was granted, does not
address any of TOTAL’s other activities in Iran. Excluding the investments made as part of the development of South Pars, TOTAL made investments in Iran in excess of $20 million in each of the years between 1996 and 2007.These investments
are not sanctionable by the U.S. authorities pursuant to a determination made by the U.S. Department of State on September 30, 2010, under the “Special Rule” provision of ISA that allows it to avoid making a determination of
sanctionability with respect to any party that provides certain assurances. The U.S. Department of State further indicated that, so long as TOTAL acts in accordance with its commitments, it will not be regarded as a company of concern for its past
Iran-related activities. Since 2008, TOTAL’s position in Iran essentially has consisted of being reimbursed for its past investments as part of buyback contracts signed between 1995 and 1999 with respect to permits on which the Group is no
longer the operator. Since 2011, TOTAL has had no production in Iran. Furthermore, since the applicability of the “Special Rule” to TOTAL was announced by the U.S. State Department, the United States imposed a number of additional
restrictive measures targeting activities in Iran. TOTAL does not conduct activities that it believes would be sanctionable under these measures.
Many
U.S. states have adopted legislation with respect to Iran requiring, in certain conditions, state pension funds to divest themselves of securities in any company with active business operations in Iran and state contracts not to be awarded to such
companies. State regulators have adopted similar initiatives relating to investments by insurance companies. If TOTAL’s presence in Iran were determined to fall within the prohibited scope of these laws, and TOTAL were not to qualify for any
available exemptions, certain U.S. institutions holding interests in TOTAL may be required to sell their interests. If significant, sales of securities resulting from such laws and/or regulatory initiatives could have an adverse effect on the prices
of TOTAL’s securities.
The EU has also adopted sanctions regimes with regard to Iran, including a set of restrictive measures adopted in July and
October 2010 that prohibited, among other things, the supply of key equipment and technology in the refining, liquefied natural gas (LNG), and oil and gas exploration and production sectors in Iran, as well as technical assistance, training and
financial assistance in connection with such items. Extension of loans or credit to, acquisition of shares in, entry into joint ventures with or other participation in enterprises in Iran (or Iranian-owned enterprises outside of Iran) engaged in any
of the targeted sectors also is prohibited. Moreover, with respect to restrictions on transfers of funds and on financial services, any transfer of at least
€
400,000
|
|
|
|
|
8
|
|
TOTAL S.A. Form 20-F 2015
|
Items 3 - 4
or equivalent to or from an Iranian individual or entity shall require a prior authorization of the competent
authorities of the EU Member States. TOTAL conducts its activities in compliance with these EU measures. On January 23, 2012, the Council of the EU prohibited the purchase, import and transport of Iranian oil and petroleum and petrochemical
products by European persons and by entities constituted under the laws of an EU Member State. Prior to that date, TOTAL had ceased these activities.
On
July 14, 2015, the EU, the P5+1 countries (China, France, Russia, the United Kingdom, the United States and Germany) and Iran reached an agreement called the Joint Comprehensive Plan of Action (the “JCPOA”) regarding limits on
Iran’s nuclear activities and relief under certain U.S., EU and UN sanctions regarding Iran. On January 16, 2016, in recognition of the International Atomic Energy Agency (“IAEA”) having verified that Iran has met its initial
nuclear compliance commitments under the JCPOA, EU and UN and secondary U.S. (
i.e.
, those covering non-U.S. persons) economic and financial sanctions were suspended, but they could be re-imposed if there is a dispute over Iran’s
compliance with its nuclear commitments. TOTAL is closely monitoring developments in this regard.
|
-
|
|
Restrictions against Syria
|
With respect
to Syria, the EU adopted measures in May 2011 that prohibit the supply of certain equipment to this country, as well as certain financial and asset transactions with respect to a list of named individuals and entities. These measures apply to
European persons and to entities constituted under the laws of an EU Member State. In September 2011, the EU adopted further measures, including, notably, a prohibition on the purchase, import or transportation from Syria of crude oil and petroleum
products. Since early September 2011, the Group ceased to purchase hydrocarbons from Syria. On December 1, 2011, the EU extended sanctions against, among others, three state-owned Syrian oil firms, including General Petroleum Corporation,
TOTAL’s co-contracting partner in the production sharing agreement signed in 1988 (Deir Ez Zor licence) and the Tabiyeh contract. The United States also has various measures regarding Syria. Since early December 2011, the Group has ceased its
activities that contributed to oil and gas production in Syria.
|
-
|
|
Restrictions against Russia
|
Since July
2014, members of the international community have adopted economic sanctions against certain Russian persons and entities, including various entities operating in the financial, energy and defense sectors, in response to the situation in Ukraine.
Among other things, the United States has adopted economic sanctions targeting OAO Novatek
(1)
(“Novatek”), as well as entities in which Novatek (individually or with other similarly targeted persons or entities collectively) owns an interest of at least 50%,
including OAO Yamal LNG
(2)
(“Yamal LNG”). These sanctions prohibit U.S. persons from transacting in, providing financing for or otherwise dealing in debt issued by
these entities after July 16, 2014 of greater than 90 days maturity. Consequently, the use of the U.S. dollar for such financing, including for Yamal LNG, is effectively prohibited.
As a result, the financing plan for the Yamal LNG project is being reviewed, and the project’s partners are engaged in efforts to develop a financing plan in compliance with the applicable regulations.
The economic sanctions initially adopted by the European Union in 2014 and subsequently extended do not materially affect TOTAL’s activities in
Russia. TOTAL has been formally authorized to continue all its activities in Russia (in the Kharyaga field as operator, and in the Termokarstovoye field and Yamal project in which the Group holds interests) by the French government, which is the
competent authority for granting authorization under the EU sanctions regime.
TOTAL’s activities in Russia are also not materially affected by
restrictive measures adopted by the United States in August 2015 imposing export controls and restrictions relating to the export of certain goods, services, and technologies destined for projects located in Russia in the field of oil exploration.
With respect to the exploration project in the Bazhenov play (tight oil) in western Siberia, which has been suspended since 2014, TOTAL signed in July
2015 an agreement to transfer the exploration licenses it held in this play to OAO Lukoil. This agreement also sets out the conditions under which TOTAL and OAO Lukoil could potentially resume their joint activities in Russia. In January 2016, TOTAL
signed an agreement to sell 50% of its interest in the Kharyaga field and transfer the operatorship to Zarubezhneft. After the sale, which is expected to be completed in 2016, TOTAL’s interest in the Kharyaga field will be 20%.
TOTAL continues to closely monitor the different international economic sanctions with respect to its activities in Russia.
As of December 31, 2015, the Group held 19% of its proved reserves in Russia.
ITEM 4. INFORMATION ON
THE COMPANY
A. HISTORY AND DEVELOPMENT
TOTAL S.A., a French
société anonyme
(limited company) incorporated on
March 28, 1924 is, together with its subsidiaries and affiliates, the world’s fourth largest publicly-traded integrated oil and gas company
(3)
.
With operations in more than 130 countries, TOTAL is engaged in every sector of the oil industry, including upstream (hydrocarbon exploration, development and
production) and downstream (refining, petrochemicals, specialty chemicals, trading and shipping
of crude oil and petroleum products and marketing). TOTAL also operates in the renewable energies and power generation sectors.
TOTAL began its Upstream operations in the Middle East in 1924. Since then, the Company has grown and expanded its operations worldwide. In early 1999, the Company acquired control of PetroFina S.A. and in early
2000 it acquired control of Elf Aquitaine. Since the repeal in 2002 of the decree of December 13, 1993 that established a golden share of Elf Aquitaine held by the
|
(1)
|
A Russian company listed on stock exchanges in Moscow and London and in which the Group held an interest of 18.9% as of December 31, 2015.
|
|
(2
)
|
A company jointly owned by Novatek (60%), Total E&P Yamal (20%), and CNODC (20%), a subsidiary of China National Petroleum Corporation. Novatek’s
investment in the company OAO Yamal LNG is to be reduced to 50.1% following an agreement signed in September 2015 for the entry of the Silk Road Fund (9.9%). This agreement is expected to be approved by the authorities in 2016.
|
|
(3
)
|
Based on market capitalization (in dollars) as of December 31, 2015.
|
|
|
|
|
|
2015 Form 20-F TOTAL S.A.
|
|
9
|
Item 4 - A. History and Development
French government, there are no longer any agreements or regulatory provisions governing shareholding relationships
between TOTAL and the French government. Information on TOTAL S.A.’s shareholding structure is presented in “Item 7 — 1. Major shareholders”, below. For information concerning the Group’s principal capital expenditures
and divestitures, see “Item 4 — E. Other Matters — 1. Investments”, “Item 5 — Results 2013-2015” and “Item 5 — Liquidity and Capital Resources”.
The Company’s corporate name is TOTAL S.A. Its registered office is 2, place Jean Millier, La Défense 6,
92400 Courbevoie, France. Its telephone number is +33 (0)1 47 44 45 46 and its Internet address is total.com. TOTAL S.A. is registered in France at the Nanterre Trade Register under the registration number 542 051 180. The
length of the life of the Company is 99 years from March 22, 2000, unless it is dissolved or extended prior to such date.
B. BUSINESS OVERVIEW
The Group’s goal is to be a global energy company. TOTAL is a leading international oil and gas company, and is
active in new energy sources, such as solar energy and biomass. To achieve this goal, TOTAL leverages its integrated business model, which enables it to capture synergies between the different business segments of the Group. TOTAL stands out due to
its operational excellence, its technological expertise and its capacity to manage complex projects. The Group’s strategy is based on four main priorities:
|
•
|
|
driving profitable, sustainable growth in Exploration & Production’s hydrocarbon activities;
|
|
•
|
|
developing competitive, top-tier refining and petrochemical complexes;
|
|
•
|
|
responding to its customer needs by delivering innovative solutions and services that go beyond the supply of petroleum products; and
|
|
•
|
|
consolidating its leadership in solar energy and continuing to develop biomass in order to offer the most appropriate energy solutions.
|
This strategy incorporates the challenges of climate change using the International Energy Agency 2°C scenario (450 ppm) as a
point
of reference. TOTAL’s challenge is to contribute to satisfying the demand for energy of the world’s growing population, while providing concrete solutions to limit the effects of
climate change. To do so, the Group focuses its actions around several key points, including the development of gas and renewable energies.
At the core
of TOTAL’s strategy is a strong belief that energy is vital, drives progress and must be made available to everyone. Energy is a precious resource that must be used wisely. The Group is helping to produce the energy that people around the
planet need to live and thrive, while ensuring that its operations deliver economic, societal and environmental benefits. TOTAL is meeting this challenge with and for its employees, its stakeholders and local communities.
Beyond safety, the values of respect, responsibility and exemplary conduct underpin TOTAL’s Code of Conduct and accompany priority business principles in the
realms of safety/security/health/the environment, integrity (preventing corruption, fraud and anti-competitive practices) and human rights. It is through strict adherence to these values and principles that TOTAL will be able to build strong and
sustainable growth for the Group and its stakeholders and fulfill its motto: committed to better energy.
|
1.
|
G
EOGRAPHIC
BREAKDOWN
OF
ACTIVITIES
|
TOTAL’s worldwide operations in 2014 were conducted through three business segments: Upstream,
Refining & Chemicals and Marketing & Services. The table below gives information on the
geographic breakdown of TOTAL’s activities and is taken from Note 5 to the Consolidated Financial Statements included elsewhere herein.
|
|
|
|
|
|
|
|
|
|
|
|
|
|
|
|
|
|
|
|
|
|
|
|
|
|
|
(M$)
|
|
France
|
|
|
Rest of
Europe
|
|
|
North
America
|
|
|
Africa
|
|
|
Rest of
world
|
|
|
Total
|
|
|
2015
|
|
|
|
|
|
|
|
|
|
|
|
|
|
|
|
|
|
|
|
|
|
|
|
|
|
Non-Group sales
|
|
|
36,536
|
|
|
|
79,463
|
|
|
|
14,857
|
|
|
|
17,612
|
|
|
|
16,889
|
|
|
|
165,357
|
|
|
Property, plant and equipment, intangible assets, net
|
|
|
4,123
|
|
|
|
22,354
|
|
|
|
17,169
|
|
|
|
43,536
|
|
|
|
36,885
|
|
|
|
124,067
|
|
|
Capital expenditures
|
|
|
980
|
|
|
|
4,783
|
|
|
|
3,493
|
|
|
|
9,154
|
|
|
|
9,623
|
|
|
|
28,033
|
|
|
2014
|
|
|
|
|
|
|
|
|
|
|
|
|
|
|
|
|
|
|
|
|
|
|
|
|
|
Non-Group sales
|
|
|
51,471
|
|
|
|
114,747
|
|
|
|
23,766
|
|
|
|
23,281
|
|
|
|
22,857
|
|
|
|
236,122
|
|
|
Property, plant and equipment, intangible assets, net
|
|
|
4,350
|
|
|
|
25,137
|
|
|
|
16,064
|
|
|
|
41,405
|
|
|
|
34,602
|
|
|
|
121,558
|
|
|
Capital expenditures
|
|
|
1,266
|
|
|
|
5,880
|
|
|
|
3,658
|
|
|
|
9,798
|
|
|
|
9,907
|
|
|
|
30,509
|
|
|
2013
|
|
|
|
|
|
|
|
|
|
|
|
|
|
|
|
|
|
|
|
|
|
|
|
|
|
Non-Group sales
|
|
|
57,650
|
|
|
|
128,661
|
|
|
|
22,332
|
|
|
|
23,146
|
|
|
|
19,936
|
|
|
|
251,725
|
|
|
Property, plant and equipment, intangible assets, net
|
|
|
6,251
|
|
|
|
26,840
|
|
|
|
19,588
|
|
|
|
37,847
|
|
|
|
32,349
|
|
|
|
122,875
|
|
|
Capital expenditures
|
|
|
1,772
|
|
|
|
6,289
|
|
|
|
4,157
|
|
|
|
10,705
|
|
|
|
11,508
|
|
|
|
34,431
|
|
TOTAL’s Upstream segment includes the activities of
Exploration & Production and Gas. The Group has exploration and production activities in more than 50 countries and produces oil or gas in approximately 30 countries. Gas conducts activities downstream from production related to
natural gas, liquefied natural gas (LNG) and liquefied petroleum gas (LPG), as well as power generation and trading, and other activities.
|
|
|
|
|
10
|
|
TOTAL S.A. Form 20-F 2015
|
Item 4 - B.2. Upstream Segment
|
2.1.
|
Exploration & Production
|
Exploration & Production’s mission is to
discover and develop oil and gas fields in order to meet growing energy demand. Safety is a core value for that mission.
In an environment marked by the
significant drop in hydrocarbon prices, Exploration & Production’s strategy is based on:
|
•
|
|
developing its operational excellence (reduction of operating costs and development costs and operational efficiency improvement) by drawing on its technological
expertise and on innovation;
|
|
•
|
|
maintaining a leading position in the Group’s technical areas of excellence, such as deep offshore and LNG;
|
|
•
|
|
renewing reserves through exploration and access to already discovered but undeveloped resources.
|
This strategy aims at developing an oil and gas production model that is resilient
(
i.e.
, which can withstand a long period of low hydrocarbon
prices), profitable and sustainable.
Additionally, Exploration & Production thrives to minimize the environmental impact of its activities.
In 2015, the Group’s production grew 9.4% compared to 2014. Exploration & Production is exiting a heavy investments phase, which peaked in
2013, and which is expected to lead to a production increase of 5% per year over the period of 2014-2019. The main growth levers include, on the one hand, the start-up of 20 major projects between 2015 and 2019 and, on the other hand, the
improvement of the operational efficiency of the facilities. In 2015, nine projects were started up. After 2020, TOTAL’s objective for organic production growth of 1 to 2% is in line with worldwide growth in demand for hydrocarbons.
|
2.1.1.
|
Exploration and development
|
TOTAL evaluates exploration
opportunities based on a variety of geological, technical, political, economic (including taxes and license terms) environmental and societal factors.
The exploration strategy deployed since 2015 aims to prioritize drilling that creates value and resources. The Group expects more balanced exploration investments:
|
•
|
|
50% for core and emerging basins, where the presence of hydrocarbons is already proven;
|
|
•
|
|
25% for near-field exploration around operated assets; and
|
|
•
|
|
25% for high-potential frontier basins.
|
In
April 2015, a new organization for the Group’s exploration activities, adapted to the new strategy, was implemented with a new senior exploration management team. The organizational changes are focused notably on strengthening regional basin
mastery and technical excellence.
In 2015, exploration expenditure from all Exploration & Production subsidiaries stood at $1.9 billion
(excluding exploration bonuses), which were made mainly in the United States, Iraq, Norway, Brazil, Papua New Guinea, Nigeria and the United Kingdom, compared to $2.6 billion in 2014 and $2.9 billion in 2013. The 2016 exploration budget is
$1.5 billion.
Organic investments
(1)
from all
Exploration & Production subsidiaries stood at $20.5 billion in 2015, compared to $23 billion in 2014 and $24 billion in 2013, and were mainly made in Angola, Nigeria, the Republic of the Congo, Norway, Canada, Australia, the
United Kingdom, Russia, Kazakhstan, Indonesia, the United States and Argentina.
The definitions used for proved, proved developed
and proved undeveloped oil and gas reserves are in accordance with the United States Securities & Exchange Commission (SEC) Rule 4-10 of Regulation S-X as amended by the SEC Modernization of Oil and Gas Reporting release issued on
December 31, 2008. Proved reserves are estimated using geological and engineering data to determine with reasonable certainty whether the crude oil or natural gas in known reservoirs is recoverable under existing regulatory, economic and
operating conditions.
TOTAL’s oil and gas reserves are consolidated annually, taking into account, among other factors, levels of production, field
reassessments, additional reserves from discoveries and acquisitions, disposal of reserves and other economic factors.
Unless otherwise indicated, any
reference to TOTAL’s proved reserves, proved developed reserves, proved undeveloped reserves and production reflects the Group’s entire share of such reserves or such production. TOTAL’s worldwide proved reserves include the proved
reserves of its consolidated subsidiaries as well as its proportionate share of the proved reserves of equity affiliates. The reserves estimation process involves making subjective judgments. Consequently, estimates of reserves are not exact
measurements and are subject to revision under well-established control procedures.
The reserves booking process requires, among other things:
|
•
|
|
internal peer review of technical evaluations to ensure that the SEC definitions and guidance are followed; and
|
|
•
|
|
that management makes significant funding commitments towards the development of the reserves prior to booking.
|
For further information concerning the reserves and their evaluation process, see sections 1 and 2 of “Supplemental Oil and Gas Information (Unaudited)”.
|
–
|
|
Proved reserves for 2015, 2014 and 2013
|
In accordance with the amended Rule 4-10 of Regulation S-X, proved reserves at December 31 are calculated using a 12-month average price determined as the unweighted arithmetic average of the
first-day-of-the-month price for each month of the relevant year unless prices are defined by contractual arrangements, excluding escalations based upon future conditions. The reference prices for 2015, 2014 and 2013 were, respectively, $54.17/b,
$101.27/b and $108.02/b for Brent crude.
As of December 31, 2015, TOTAL’s combined proved reserves of oil and gas were 11,580 Mboe (53% of
which were proved developed reserves). Liquids (crude oil, condensates, natural gas liquids and bitumen) represented approximately 48% of these reserves and natural gas the remaining 52%. These reserves were located in Europe (mainly in Norway and
the United Kingdom), Africa (mainly in Angola, Gabon, Nigeria and the Republic of the Congo), the Americas (mainly in Canada, Argentina, the United States and Venezuela), the Middle East (mainly in Qatar, the United Arab Emirates and Yemen), and
Asia-Pacific (mainly in Australia), and in Kazakhstan and Russia.
Discoveries of new fields and extensions of existing fields brought an additional
2,762 Mboe to the Upstream segment’s proved reserves during the 3-year period ended December 31, 2015 (before deducting production and sales of reserves in place and adding any acquisitions of reserves in place during this period). The net
level of reserve revisions during this 3-year period is
|
|
|
|
|
2015 Form 20-F TOTAL S.A.
|
|
11
|
|
(1)
|
For Exploration & Production, organic investments include exploration investments, net development investments and net financial investments.
|
Item 4 - B.2. Upstream Segment
+244 Mboe, which was due to the overall positive revisions in field behaviors, a scope change in two projects in
2013, the impairment of two assets in Libya in 2015 due to the degradation of the security situation and to the positive impact of the decrease in hydrocarbon prices in 2015 that led to a reserves increase on fields with production sharing or
service contracts and on Canadian bitumen fields (royalty effect), which was partially offset by the reserves decrease resulting from the suspension or cancellation due to economic reasons of capital expenditures associated with, or from shorter
producing life of, certain producing fields.
As of December 31, 2014, TOTAL’s combined proved reserves of oil and gas were 11,523 Mboe (50% of
which were proved developed reserves) compared to 11,526 Mboe (49% of which were proved developed reserves) as of December 31, 2013. Liquids (crude oil, condensates, natural gas liquids and bitumen) at year-end 2014 represented approximately
46% of these reserves and natural gas the remaining 54% and, at year-end 2013, approximately 47% of these reserves and natural gas the remaining 53%.
|
–
|
|
Sensitivity to oil and gas prices
|
Changes in the price used as a reference for the proved reserves estimation result in non-proportionate inverse changes in proved reserves associated with
production sharing and risked service contracts (which together represent approximately 20% of TOTAL’s reserves as of December 31, 2015). Under such contracts, TOTAL is entitled to a portion of the production, the sale of which is meant to
cover expenses incurred by the Group. As oil prices decrease, more barrels are necessary to cover the same amount of expenses. Moreover, the number of barrels recoverable under these contracts may vary according to criteria such as cumulative
production, the rate of return on investment or the income-cumulative expenses ratio. This increase is partly offset by a reduction of the duration over which fields can be produced economically. However, the decrease in reserves due to this
reduction is generally less than the increase in reserves under production sharing or risked service contracts due to such lower prices. As a result, lower prices usually lead to an increase in TOTAL’s reserves. In Canada, a decrease in the
reference price per barrel used as a reference for estimating proved reserves leads to a decrease in the volume of royalties and, therefore, an increase of the proved reserves, and vice versa.
Lastly, for any type of contract, a significant decrease in the reference price of petroleum products that negatively impacts projects profitability may lead to a reduction of proved reserves.
The average daily production of liquids and
natural gas was 2,347 kboe/d in 2015 compared to 2,146 kboe/d in 2014 and 2,299 kboe/d in 2013. Liquids represented approximately 53% and natural gas approximately 47% of TOTAL’s overall production in 2015.
The tables on the following pages set forth TOTAL’s annual and average daily production of liquids and natural gas by geographic area and for each of the last
three fiscal years.
Consistent with industry practice, TOTAL often holds a percentage interest in its fields rather than a 100% interest, with the
balance being held by joint venture partners (which may include other international oil companies, state-owned oil companies or government entities). The Group’s entities may frequently act as operator (the party responsible for technical
production) on acreage in which it holds an interest. Refer to the table
“Presentation of production activities by region” on the following pages for a presentation of the Group’s producing assets.
As in 2014 and 2013, substantially all of the liquids production from TOTAL’s Upstream segment in 2015 was marketed by the Trading & Shipping division
of TOTAL’s Refining & Chemicals segment (refer to the table “Trading’s crude oil sales and supply and petroleum products sales” in “— 3.2.1. Trading & Shipping”, below).
|
2.1.4.
|
Delivery commitments
|
The majority of TOTAL’s natural
gas production is sold under long-term contracts. However, its North American production, and part of its production from the United Kingdom, the Netherlands and Norway, is sold on the spot market. The long-term contracts under which TOTAL sells its
natural gas usually provide for a price related to, among other factors, average crude oil and other petroleum product prices, as well as, in some cases, a cost-of-living index. Though the price of natural gas tends to fluctuate in line with crude
oil prices, a slight delay may occur before changes in crude oil prices are reflected in long-term natural gas prices.
Some of TOTAL’s long-term
contracts, notably in Bolivia, Indonesia, Nigeria, Norway, Thailand and Qatar, specify the delivery of quantities of natural gas that may or may not be fixed and determinable. Such delivery commitments vary substantially, both in duration and scope,
from contract to contract throughout the world. For example, in some cases, contracts require delivery of natural gas on an as-needed basis, and, in other cases, contracts call for the delivery of varied amounts of natural gas over different periods
of time. Nevertheless, TOTAL estimates the fixed and determinable quantity of gas to be delivered over the period 2016-2018 to be 3,591 Bcf. The Group expects to satisfy most of these obligations through the production of its proved reserves of
natural gas, with, if needed, additional sourcing from spot market purchases (refer to sections 1 and 2 of “Supplemental Oil and Gas Information (Unaudited)”).
|
2.1.5.
|
Contractual framework of activities
|
Licenses, permits and
contracts governing the Group’s ownership of oil and gas interests have terms that vary from country to country and are generally granted by or entered into with a government entity or a state-owned company and are sometimes entered into with
private owners. These agreements usually take the form of concessions or production sharing contracts.
In the framework of oil concession agreements,
the oil company owns the assets and the facilities and is entitled to the entire production. In exchange, the operating risks, costs and investments are the oil company’s responsibility and it agrees to remit to the relevant host country,
usually the owner of the subsoil resources, a production-based royalty, income tax, and possibly other taxes that may apply under local tax legislation.
The production sharing contract (“PSC”) involves a more complex legal framework than the concession agreement: it defines the terms and conditions of
production sharing and sets the rules governing the cooperation between the company or consortium in possession of the license and the host country, which is generally represented by a state-owned company. The latter can thus be involved in
operating decisions, cost accounting and production allocation. The consortium agrees to undertake and finance all exploration, development and production activities at its own risk. In exchange, it is entitled to a portion of the production, known
as “cost oil”, the sale of which is intended to cover its incurred expenses (capital and operating costs). The balance of production,
|
|
|
|
|
12
|
|
TOTAL S.A. Form 20-F 2015
|
Item 4 - B.2. Upstream Segment
known as “profit oil”, is then shared in varying proportions, between the company or consortium, on the one
hand, and the host country or state-owned company, on the other hand.
Today, concession agreements and PSCs can coexist, sometimes in the same country
or even on the same block. Even though there are other contractual models, TOTAL’s license portfolio is comprised mainly of concession agreements.
On most licenses, the partners and authorities of the host country, often assisted by international accounting firms, perform joint venture and PSC cost audits and
ensure the observance of contractual obligations.
In some countries, TOTAL has also signed contracts called “risked service contracts”, which
are similar to PSCs. However, the profit oil is replaced by a defined cash monetary remuneration, agreed by contract, which depends notably on field performance parameters such as the amount of barrels produced.
Oil and gas exploration and production activities are subject to authorization granted by public authorities
(licenses), which are granted for specific and limited periods of time and include an obligation to relinquish a large portion, or the entire portion in case of failure, of the area covered by the license at the end of the exploration period.
TOTAL pays taxes on income generated from its oil and gas production and sales activities under its concessions, PSCs and risked service contracts, as
provided for by local regulations. In addition, depending on the country, TOTAL’s production and sales activities may be subject to a number of other taxes, fees and withholdings, including special petroleum taxes and fees. The taxes imposed on
oil and gas production and sales activities are generally substantially higher than those imposed on other industrial or commercial businesses.
|
|
|
|
|
2015 Form 20-F TOTAL S.A.
|
|
13
|
Item 4 - B.2. Upstream Segment
|
2.1.6.
|
Production by region
|
The following table sets forth the
Group’s annual liquids and natural gas production by region.
|
|
|
|
|
|
|
|
|
|
|
|
|
|
|
|
|
|
|
|
|
|
|
|
|
|
|
|
|
|
|
|
|
|
|
|
|
|
|
|
|
2015
|
|
|
2014
|
|
|
2013
|
|
|
|
|
Liquids
Mb
|
|
|
Natural
gas
Bcf
(b)
|
|
|
Total
Mboe
|
|
|
Liquids
Mb
|
|
|
Natural
gas
Bcf
(b)
|
|
|
Total
Mboe
|
|
|
Liquids
Mb
|
|
|
Natural
gas
Bcf
(b)
|
|
|
Total
Mboe
|
|
|
Africa
|
|
|
198
|
|
|
|
247
|
|
|
|
247
|
|
|
|
191
|
|
|
|
253
|
|
|
|
240
|
|
|
|
194
|
|
|
|
255
|
|
|
|
245
|
|
|
Algeria
|
|
|
3
|
|
|
|
35
|
|
|
|
9
|
|
|
|
2
|
|
|
|
29
|
|
|
|
7
|
|
|
|
2
|
|
|
|
30
|
|
|
|
8
|
|
|
Angola
|
|
|
86
|
|
|
|
18
|
|
|
|
90
|
|
|
|
70
|
|
|
|
20
|
|
|
|
73
|
|
|
|
64
|
|
|
|
23
|
|
|
|
68
|
|
|
Gabon
|
|
|
20
|
|
|
|
5
|
|
|
|
22
|
|
|
|
20
|
|
|
|
5
|
|
|
|
21
|
|
|
|
20
|
|
|
|
6
|
|
|
|
22
|
|
|
Libya
|
|
|
5
|
|
|
|
—
|
|
|
|
5
|
|
|
|
10
|
|
|
|
—
|
|
|
|
10
|
|
|
|
18
|
|
|
|
—
|
|
|
|
18
|
|
|
Nigeria
|
|
|
54
|
|
|
|
178
|
|
|
|
89
|
|
|
|
57
|
|
|
|
187
|
|
|
|
94
|
|
|
|
58
|
|
|
|
187
|
|
|
|
95
|
|
|
The Congo, Republic of
|
|
|
30
|
|
|
|
11
|
|
|
|
32
|
|
|
|
32
|
|
|
|
13
|
|
|
|
35
|
|
|
|
32
|
|
|
|
10
|
|
|
|
34
|
|
|
North America
|
|
|
18
|
|
|
|
112
|
|
|
|
38
|
|
|
|
14
|
|
|
|
104
|
|
|
|
33
|
|
|
|
10
|
|
|
|
93
|
|
|
|
27
|
|
|
Canada
(a)
|
|
|
5
|
|
|
|
—
|
|
|
|
5
|
|
|
|
4
|
|
|
|
—
|
|
|
|
4
|
|
|
|
5
|
|
|
|
—
|
|
|
|
5
|
|
|
United States
|
|
|
13
|
|
|
|
112
|
|
|
|
33
|
|
|
|
10
|
|
|
|
104
|
|
|
|
28
|
|
|
|
5
|
|
|
|
93
|
|
|
|
22
|
|
|
South America
|
|
|
17
|
|
|
|
215
|
|
|
|
55
|
|
|
|
18
|
|
|
|
219
|
|
|
|
57
|
|
|
|
20
|
|
|
|
229
|
|
|
|
61
|
|
|
Argentina
|
|
|
3
|
|
|
|
129
|
|
|
|
26
|
|
|
|
3
|
|
|
|
134
|
|
|
|
27
|
|
|
|
5
|
|
|
|
134
|
|
|
|
28
|
|
|
Bolivia
|
|
|
1
|
|
|
|
49
|
|
|
|
10
|
|
|
|
1
|
|
|
|
51
|
|
|
|
11
|
|
|
|
1
|
|
|
|
47
|
|
|
|
10
|
|
|
Trinidad & Tobago
|
|
|
—
|
|
|
|
—
|
|
|
|
—
|
|
|
|
—
|
|
|
|
—
|
|
|
|
—
|
|
|
|
1
|
|
|
|
19
|
|
|
|
4
|
|
|
Venezuela
|
|
|
13
|
|
|
|
37
|
|
|
|
19
|
|
|
|
14
|
|
|
|
34
|
|
|
|
19
|
|
|
|
13
|
|
|
|
29
|
|
|
|
18
|
|
|
Asia-Pacific
|
|
|
12
|
|
|
|
471
|
|
|
|
94
|
|
|
|
11
|
|
|
|
430
|
|
|
|
87
|
|
|
|
11
|
|
|
|
427
|
|
|
|
86
|
|
|
Australia
|
|
|
—
|
|
|
|
10
|
|
|
|
1
|
|
|
|
—
|
|
|
|
8
|
|
|
|
1
|
|
|
|
—
|
|
|
|
9
|
|
|
|
1
|
|
|
Brunei
|
|
|
1
|
|
|
|
23
|
|
|
|
5
|
|
|
|
1
|
|
|
|
24
|
|
|
|
5
|
|
|
|
1
|
|
|
|
22
|
|
|
|
5
|
|
|
China
|
|
|
—
|
|
|
|
22
|
|
|
|
4
|
|
|
|
—
|
|
|
|
23
|
|
|
|
4
|
|
|
|
—
|
|
|
|
17
|
|
|
|
3
|
|
|
Indonesia
|
|
|
8
|
|
|
|
247
|
|
|
|
54
|
|
|
|
7
|
|
|
|
217
|
|
|
|
47
|
|
|
|
6
|
|
|
|
221
|
|
|
|
48
|
|
|
Myanmar
|
|
|
—
|
|
|
|
56
|
|
|
|
7
|
|
|
|
—
|
|
|
|
49
|
|
|
|
6
|
|
|
|
—
|
|
|
|
47
|
|
|
|
6
|
|
|
Thailand
|
|
|
3
|
|
|
|
113
|
|
|
|
23
|
|
|
|
4
|
|
|
|
108
|
|
|
|
22
|
|
|
|
4
|
|
|
|
112
|
|
|
|
23
|
|
|
CIS
|
|
|
20
|
|
|
|
457
|
|
|
|
106
|
|
|
|
13
|
|
|
|
414
|
|
|
|
91
|
|
|
|
12
|
|
|
|
382
|
|
|
|
83
|
|
|
Azerbaijan
|
|
|
—
|
|
|
|
—
|
|
|
|
—
|
|
|
|
1
|
|
|
|
22
|
|
|
|
5
|
|
|
|
2
|
|
|
|
30
|
|
|
|
7
|
|
|
Russia
|
|
|
20
|
|
|
|
457
|
|
|
|
106
|
|
|
|
12
|
|
|
|
393
|
|
|
|
86
|
|
|
|
10
|
|
|
|
352
|
|
|
|
76
|
|
|
Europe
|
|
|
60
|
|
|
|
424
|
|
|
|
137
|
|
|
|
60
|
|
|
|
397
|
|
|
|
133
|
|
|
|
61
|
|
|
|
449
|
|
|
|
143
|
|
|
France
|
|
|
—
|
|
|
|
—
|
|
|
|
—
|
|
|
|
—
|
|
|
|
3
|
|
|
|
1
|
|
|
|
—
|
|
|
|
16
|
|
|
|
3
|
|
|
Norway
|
|
|
47
|
|
|
|
224
|
|
|
|
88
|
|
|
|
49
|
|
|
|
210
|
|
|
|
88
|
|
|
|
50
|
|
|
|
210
|
|
|
|
89
|
|
|
The Netherlands
|
|
|
—
|
|
|
|
58
|
|
|
|
10
|
|
|
|
—
|
|
|
|
62
|
|
|
|
11
|
|
|
|
—
|
|
|
|
71
|
|
|
|
13
|
|
|
United Kingdom
|
|
|
13
|
|
|
|
142
|
|
|
|
39
|
|
|
|
11
|
|
|
|
122
|
|
|
|
32
|
|
|
|
11
|
|
|
|
152
|
|
|
|
38
|
|
|
Middle East
|
|
|
128
|
|
|
|
283
|
|
|
|
179
|
|
|
|
70
|
|
|
|
396
|
|
|
|
143
|
|
|
|
118
|
|
|
|
422
|
|
|
|
196
|
|
|
United Arab Emirates
|
|
|
100
|
|
|
|
24
|
|
|
|
105
|
|
|
|
42
|
|
|
|
22
|
|
|
|
46
|
|
|
|
90
|
|
|
|
26
|
|
|
|
95
|
|
|
Iraq
|
|
|
7
|
|
|
|
—
|
|
|
|
7
|
|
|
|
4
|
|
|
|
—
|
|
|
|
4
|
|
|
|
3
|
|
|
|
—
|
|
|
|
3
|
|
|
Oman
|
|
|
8
|
|
|
|
21
|
|
|
|
12
|
|
|
|
9
|
|
|
|
22
|
|
|
|
13
|
|
|
|
9
|
|
|
|
24
|
|
|
|
14
|
|
|
Qatar
|
|
|
12
|
|
|
|
209
|
|
|
|
49
|
|
|
|
12
|
|
|
|
203
|
|
|
|
48
|
|
|
|
13
|
|
|
|
204
|
|
|
|
50
|
|
|
Yemen
|
|
|
1
|
|
|
|
29
|
|
|
|
6
|
|
|
|
3
|
|
|
|
148
|
|
|
|
31
|
|
|
|
4
|
|
|
|
168
|
|
|
|
35
|
|
|
Total production
|
|
|
453
|
|
|
|
2,209
|
|
|
|
856
|
|
|
|
377
|
|
|
|
2,213
|
|
|
|
783
|
|
|
|
426
|
|
|
|
2,257
|
|
|
|
839
|
|
|
Including share of equity affiliates
|
|
|
81
|
|
|
|
667
|
|
|
|
204
|
|
|
|
73
|
|
|
|
726
|
|
|
|
208
|
|
|
|
119
|
|
|
|
714
|
|
|
|
251
|
|
|
Angola
|
|
|
—
|
|
|
|
—
|
|
|
|
—
|
|
|
|
—
|
|
|
|
4
|
|
|
|
1
|
|
|
|
—
|
|
|
|
6
|
|
|
|
1
|
|
|
Venezuela
|
|
|
14
|
|
|
|
3
|
|
|
|
14
|
|
|
|
14
|
|
|
|
2
|
|
|
|
14
|
|
|
|
13
|
|
|
|
3
|
|
|
|
14
|
|
|
United Arab Emirates
|
|
|
39
|
|
|
|
18
|
|
|
|
43
|
|
|
|
40
|
|
|
|
19
|
|
|
|
43
|
|
|
|
88
|
|
|
|
22
|
|
|
|
92
|
|
|
Oman
|
|
|
8
|
|
|
|
21
|
|
|
|
12
|
|
|
|
8
|
|
|
|
22
|
|
|
|
12
|
|
|
|
8
|
|
|
|
24
|
|
|
|
13
|
|
|
Qatar
|
|
|
3
|
|
|
|
140
|
|
|
|
28
|
|
|
|
3
|
|
|
|
139
|
|
|
|
28
|
|
|
|
3
|
|
|
|
141
|
|
|
|
28
|
|
|
Yemen
|
|
|
—
|
|
|
|
29
|
|
|
|
5
|
|
|
|
—
|
|
|
|
147
|
|
|
|
27
|
|
|
|
—
|
|
|
|
167
|
|
|
|
31
|
|
|
Russia
|
|
|
17
|
|
|
|
456
|
|
|
|
102
|
|
|
|
9
|
|
|
|
392
|
|
|
|
83
|
|
|
|
7
|
|
|
|
351
|
|
|
|
72
|
|
|
(a)
|
The Group’s production in Canada consists of bitumen only. All of the Group’s bitumen production is in Canada.
|
|
(b)
|
Including fuel gas (159 Bcf in 2015, 155 Bcf in 2014, 151 Bcf in 2013).
|
|
|
|
|
|
14
|
|
TOTAL S.A. Form 20-F 2015
|
Item 4 - B.2. Upstream Segment
The following table sets forth the Group’s average daily liquids and natural gas production by region.
|
|
|
|
|
|
|
|
|
|
|
|
|
|
|
|
|
|
|
|
|
|
|
|
|
|
|
|
|
|
|
|
|
|
|
|
|
|
|
|
|
2015
|
|
|
2014
|
|
|
2013
|
|
|
|
|
Liquids
kb/d
|
|
|
Natural
gas
Mcf/d
(b)
|
|
|
Total
kboe/d
|
|
|
Liquids
kb/d
|
|
|
Natural
gas
Mcf/d
(b)
|
|
|
Total
kboe/d
|
|
|
Liquids
kb/d
|
|
|
Natural
gas
Mcf/d
(b)
|
|
|
Total
kboe/d
|
|
|
Africa
|
|
|
542
|
|
|
|
677
|
|
|
|
678
|
|
|
|
522
|
|
|
|
693
|
|
|
|
657
|
|
|
|
531
|
|
|
|
699
|
|
|
|
670
|
|
|
Algeria
|
|
|
7
|
|
|
|
96
|
|
|
|
25
|
|
|
|
5
|
|
|
|
79
|
|
|
|
20
|
|
|
|
5
|
|
|
|
82
|
|
|
|
21
|
|
|
Angola
|
|
|
238
|
|
|
|
49
|
|
|
|
248
|
|
|
|
191
|
|
|
|
54
|
|
|
|
200
|
|
|
|
175
|
|
|
|
62
|
|
|
|
186
|
|
|
Gabon
|
|
|
55
|
|
|
|
15
|
|
|
|
59
|
|
|
|
55
|
|
|
|
14
|
|
|
|
58
|
|
|
|
55
|
|
|
|
16
|
|
|
|
59
|
|
|
Libya
|
|
|
14
|
|
|
|
—
|
|
|
|
14
|
|
|
|
27
|
|
|
|
—
|
|
|
|
27
|
|
|
|
50
|
|
|
|
—
|
|
|
|
50
|
|
|
Nigeria
|
|
|
147
|
|
|
|
487
|
|
|
|
245
|
|
|
|
156
|
|
|
|
511
|
|
|
|
257
|
|
|
|
158
|
|
|
|
511
|
|
|
|
261
|
|
|
The Congo, Republic of
|
|
|
81
|
|
|
|
30
|
|
|
|
87
|
|
|
|
88
|
|
|
|
35
|
|
|
|
95
|
|
|
|
88
|
|
|
|
28
|
|
|
|
93
|
|
|
North America
|
|
|
48
|
|
|
|
308
|
|
|
|
103
|
|
|
|
39
|
|
|
|
285
|
|
|
|
90
|
|
|
|
28
|
|
|
|
256
|
|
|
|
73
|
|
|
Canada
(a)
|
|
|
14
|
|
|
|
—
|
|
|
|
14
|
|
|
|
12
|
|
|
|
—
|
|
|
|
12
|
|
|
|
13
|
|
|
|
—
|
|
|
|
13
|
|
|
United States
|
|
|
34
|
|
|
|
308
|
|
|
|
89
|
|
|
|
27
|
|
|
|
285
|
|
|
|
78
|
|
|
|
15
|
|
|
|
256
|
|
|
|
60
|
|
|
South America
|
|
|
47
|
|
|
|
588
|
|
|
|
152
|
|
|
|
50
|
|
|
|
599
|
|
|
|
157
|
|
|
|
54
|
|
|
|
627
|
|
|
|
166
|
|
|
Argentina
|
|
|
8
|
|
|
|
354
|
|
|
|
72
|
|
|
|
9
|
|
|
|
367
|
|
|
|
75
|
|
|
|
13
|
|
|
|
366
|
|
|
|
78
|
|
|
Bolivia
|
|
|
3
|
|
|
|
133
|
|
|
|
28
|
|
|
|
4
|
|
|
|
139
|
|
|
|
30
|
|
|
|
4
|
|
|
|
129
|
|
|
|
28
|
|
|
Trinidad & Tobago
|
|
|
—
|
|
|
|
—
|
|
|
|
—
|
|
|
|
—
|
|
|
|
—
|
|
|
|
—
|
|
|
|
2
|
|
|
|
52
|
|
|
|
12
|
|
|
Venezuela
|
|
|
36
|
|
|
|
101
|
|
|
|
52
|
|
|
|
37
|
|
|
|
93
|
|
|
|
52
|
|
|
|
35
|
|
|
|
80
|
|
|
|
48
|
|
|
Asia-Pacific
|
|
|
34
|
|
|
|
1,290
|
|
|
|
258
|
|
|
|
30
|
|
|
|
1,178
|
|
|
|
238
|
|
|
|
30
|
|
|
|
1,170
|
|
|
|
235
|
|
|
Australia
|
|
|
—
|
|
|
|
28
|
|
|
|
4
|
|
|
|
—
|
|
|
|
23
|
|
|
|
4
|
|
|
|
—
|
|
|
|
25
|
|
|
|
4
|
|
|
Brunei
|
|
|
3
|
|
|
|
62
|
|
|
|
15
|
|
|
|
2
|
|
|
|
66
|
|
|
|
15
|
|
|
|
2
|
|
|
|
59
|
|
|
|
13
|
|
|
China
|
|
|
—
|
|
|
|
59
|
|
|
|
11
|
|
|
|
—
|
|
|
|
63
|
|
|
|
12
|
|
|
|
—
|
|
|
|
46
|
|
|
|
8
|
|
|
Indonesia
|
|
|
22
|
|
|
|
676
|
|
|
|
147
|
|
|
|
18
|
|
|
|
594
|
|
|
|
130
|
|
|
|
17
|
|
|
|
605
|
|
|
|
131
|
|
|
Myanmar
|
|
|
—
|
|
|
|
153
|
|
|
|
19
|
|
|
|
—
|
|
|
|
135
|
|
|
|
17
|
|
|
|
—
|
|
|
|
129
|
|
|
|
16
|
|
|
Thailand
|
|
|
9
|
|
|
|
312
|
|
|
|
62
|
|
|
|
10
|
|
|
|
297
|
|
|
|
60
|
|
|
|
11
|
|
|
|
306
|
|
|
|
63
|
|
|
CIS
|
|
|
54
|
|
|
|
1,252
|
|
|
|
290
|
|
|
|
36
|
|
|
|
1,135
|
|
|
|
249
|
|
|
|
32
|
|
|
|
1,046
|
|
|
|
227
|
|
|
Azerbaijan
|
|
|
—
|
|
|
|
—
|
|
|
|
—
|
|
|
|
3
|
|
|
|
59
|
|
|
|
14
|
|
|
|
5
|
|
|
|
82
|
|
|
|
20
|
|
|
Russia
|
|
|
54
|
|
|
|
1,252
|
|
|
|
290
|
|
|
|
33
|
|
|
|
1,076
|
|
|
|
235
|
|
|
|
27
|
|
|
|
964
|
|
|
|
207
|
|
|
Europe
|
|
|
161
|
|
|
|
1,161
|
|
|
|
374
|
|
|
|
165
|
|
|
|
1,089
|
|
|
|
364
|
|
|
|
168
|
|
|
|
1,231
|
|
|
|
392
|
|
|
France
|
|
|
—
|
|
|
|
—
|
|
|
|
—
|
|
|
|
—
|
|
|
|
9
|
|
|
|
2
|
|
|
|
1
|
|
|
|
45
|
|
|
|
9
|
|
|
Norway
|
|
|
125
|
|
|
|
614
|
|
|
|
239
|
|
|
|
135
|
|
|
|
576
|
|
|
|
242
|
|
|
|
136
|
|
|
|
575
|
|
|
|
243
|
|
|
The Netherlands
|
|
|
1
|
|
|
|
158
|
|
|
|
28
|
|
|
|
1
|
|
|
|
171
|
|
|
|
31
|
|
|
|
1
|
|
|
|
195
|
|
|
|
35
|
|
|
United Kingdom
|
|
|
35
|
|
|
|
389
|
|
|
|
107
|
|
|
|
29
|
|
|
|
333
|
|
|
|
89
|
|
|
|
30
|
|
|
|
416
|
|
|
|
105
|
|
|
Middle East
|
|
|
351
|
|
|
|
778
|
|
|
|
492
|
|
|
|
192
|
|
|
|
1,084
|
|
|
|
391
|
|
|
|
324
|
|
|
|
1,155
|
|
|
|
536
|
|
|
United Arab Emirates
|
|
|
274
|
|
|
|
66
|
|
|
|
287
|
|
|
|
115
|
|
|
|
61
|
|
|
|
127
|
|
|
|
247
|
|
|
|
71
|
|
|
|
260
|
|
|
Iraq
|
|
|
18
|
|
|
|
1
|
|
|
|
18
|
|
|
|
12
|
|
|
|
1
|
|
|
|
12
|
|
|
|
7
|
|
|
|
1
|
|
|
|
7
|
|
|
Oman
|
|
|
25
|
|
|
|
58
|
|
|
|
36
|
|
|
|
24
|
|
|
|
61
|
|
|
|
36
|
|
|
|
24
|
|
|
|
66
|
|
|
|
37
|
|
|
Qatar
|
|
|
32
|
|
|
|
573
|
|
|
|
134
|
|
|
|
32
|
|
|
|
555
|
|
|
|
132
|
|
|
|
36
|
|
|
|
558
|
|
|
|
137
|
|
|
Yemen
|
|
|
2
|
|
|
|
80
|
|
|
|
17
|
|
|
|
9
|
|
|
|
406
|
|
|
|
84
|
|
|
|
10
|
|
|
|
459
|
|
|
|
95
|
|
|
Total production
|
|
|
1,237
|
|
|
|
6,054
|
|
|
|
2,347
|
|
|
|
1,034
|
|
|
|
6,063
|
|
|
|
2,146
|
|
|
|
1,167
|
|
|
|
6,184
|
|
|
|
2,299
|
|
|
Including share of equity affiliates
|
|
|
219
|
|
|
|
1,828
|
|
|
|
559
|
|
|
|
200
|
|
|
|
1,988
|
|
|
|
571
|
|
|
|
325
|
|
|
|
1,955
|
|
|
|
687
|
|
|
Angola
|
|
|
—
|
|
|
|
—
|
|
|
|
—
|
|
|
|
—
|
|
|
|
10
|
|
|
|
2
|
|
|
|
—
|
|
|
|
16
|
|
|
|
3
|
|
|
Venezuela
|
|
|
36
|
|
|
|
7
|
|
|
|
37
|
|
|
|
37
|
|
|
|
6
|
|
|
|
38
|
|
|
|
35
|
|
|
|
7
|
|
|
|
37
|
|
|
United Arab Emirates
|
|
|
107
|
|
|
|
50
|
|
|
|
116
|
|
|
|
109
|
|
|
|
51
|
|
|
|
118
|
|
|
|
240
|
|
|
|
61
|
|
|
|
253
|
|
|
Oman
|
|
|
24
|
|
|
|
58
|
|
|
|
34
|
|
|
|
23
|
|
|
|
61
|
|
|
|
34
|
|
|
|
23
|
|
|
|
66
|
|
|
|
35
|
|
|
Qatar
|
|
|
7
|
|
|
|
383
|
|
|
|
77
|
|
|
|
7
|
|
|
|
381
|
|
|
|
77
|
|
|
|
8
|
|
|
|
385
|
|
|
|
78
|
|
|
Yemen
|
|
|
—
|
|
|
|
80
|
|
|
|
15
|
|
|
|
—
|
|
|
|
404
|
|
|
|
75
|
|
|
|
—
|
|
|
|
458
|
|
|
|
84
|
|
|
Russia
|
|
|
45
|
|
|
|
1,250
|
|
|
|
280
|
|
|
|
24
|
|
|
|
1,075
|
|
|
|
227
|
|
|
|
19
|
|
|
|
962
|
|
|
|
197
|
|
|
(a)
|
The Group’s production in Canada consists of bitumen only. All of the Group’s bitumen production is in Canada.
|
|
(b)
|
Including fuel gas (435 Mcf/d in 2015, 426 Mcf/d in 2014, 415 Mcf/d in 2013).
|
|
|
|
|
|
2015 Form 20-F TOTAL S.A.
|
|
15
|
Item 4 - B.2. Upstream Segment
|
2.1.7.
|
Presentation of production activities by region
|
The table
below sets forth, by country, TOTAL’s producing assets, the year in which TOTAL’s activities commenced, the Group’s interest in each asset and whether TOTAL is operator of the asset.
TOTAL’s producing assets as of December 31,
2015
(a)
|
|
|
|
|
|
|
Africa
|
|
|
|
|
|
Algeria
1952
|
|
|
|
Non-operated:
Tin Fouyé Tabankort (35.00%)
|
|
Angola
1953
|
|
|
|
Operated:
Girassol, Jasmim, Rosa, Dalia, Pazflor, CLOV (Block 17) (40.00%)
|
|
|
|
Non-operated:
Cabinda Block 0 (10.00%), Kuito, BBLT, Tombua-Landana (Block 14) (20.00%)
(b)
, Lianzi (Block 14K) (10.00%)
(b)
, Angola LNG (13.60%)
|
|
Gabon
1928
|
|
|
|
Operated:
Anguille (100.00%), Anguille Nord Est (100.00%), Anguille Sud-Est (100.00%), Atora (40.00%), Avocette (57.50%), Baliste (50.00%), Barbier (100.00%), Baudroie Marine (50.00%),
Baudroie Nord Marine (50.00%), Coucal (57.50%), Girelle (100.00%), Gonelle (100.00%), Grand Anguille Marine (100.00%), Grondin (100.00%), Hylia Marine (75.00%), Lopez Nord (100.00%), Mandaros (100.00%), M’Boukou (57.50%), M’Boumba
(100.00%), Mérou Sardine Sud (50.00%), Port Gentil Océan (100.00%), Tchengue (100.00%), Torpille (100.00%), Torpille Nord Est (100.00%)
|
|
|
|
|
|
Non-operated:
Rabi Kounga (47.50%)
|
|
Libya
1959
|
|
|
|
Non-operated:
zones 15, 16 & 32 (75.00%)
(c)
|
|
Nigeria
1962
|
|
|
|
Operated:
OML 58 (40.00%), OML 99 Amenam-Kpono (30.40%), OML 100 (40.00%), OML 102 (40.00%), OML 130 (24.00%)
|
|
|
|
Non-operated:
OML 102-Ekanga (40.00%), Shell Petroleum Development Company (SPDC 10.00%), OML 118—Bonga (12.50%), OML 138
(20.00%)
|
|
The Congo, Republic of
1968
|
|
|
|
Operated:
Kombi-Likalala-Libondo (65.00%), Moho Bilondo (including Moho phase 1b) (53.50%), Nkossa (53.50%), Nsoko (53.50%), Sendji (55.25%), Tchendo (65.00%),
Tchibeli-Litanzi-Loussima (65.00%), Tchibouela (65.00%), Yanga (55.25%)
|
|
|
|
Non-operated:
Lianzi (26.75%), Loango (42.50%), Zatchi (29.75%)
|
|
|
|
|
|
North America
|
|
|
|
|
|
Canada
|
|
|
|
Non-operated:
Surmont (50.00%)
|
|
1999
|
|
|
|
|
|
United States
1957
|
|
|
|
Non-operated:
Several assets in the Barnett Shale area (25.00%)
(d)
,
Several assets in the Utica Shale area (25.00%)
(d)
, Chinook (33.33%) Tahiti (17.00%)
|
|
|
|
|
|
South America
|
|
|
|
|
|
Argentina
1978
|
|
|
|
Operated:
Aguada Pichana (27.27%), Aguada San Roque (24.71%), Aries (37.50%), Cañadon Alfa Complex (37.50%), Carina (37.50%), Hidra (37.50%), Kaus (37.50%)
|
|
|
|
Non-operated:
Rincón de Aranda (45.00%) Sierra Chata (2.51%)
|
|
Bolivia
1995
|
|
|
|
Non-operated:
San Alberto (15.00%), San Antonio (15.00%), Itaú (41.00%)
|
|
Venezuela
1980
|
|
|
|
Non-operated:
PetroCedeño (30.32%), Yucal Placer (69.50%)
|
|
|
|
|
|
Asia-Pacific
|
|
|
|
|
|
Australia
2005
|
|
|
|
Non-operated:
Various fields in UJV GLNG (27.50%)
(e)
|
|
Brunei
1986
|
|
|
|
Operated:
Maharaja Lela Jamalulalam (37.50%)
|
|
China
2006
|
|
|
|
Non-operated:
South Sulige (49.00%)
|
|
Indonesia
1968
|
|
|
|
Operated:
Bekapai (50.00%), Handil (50.00%), Peciko (50.00%), Sisi-Nubi (47.90%), South Mahakam (50.00%), Tambora (50.00%), Tunu (50.00%),
|
|
|
|
|
Non-operated:
Badak (1.05%), Nilam-gas and condensates (9.29%), Nilam-oil (10.58%), Ruby-gas and condensates (15.00%)
|
|
Myanmar
1992
|
|
|
|
Operated:
Yadana (31.24%)
|
|
Thailand
1990
|
|
|
|
Non-operated:
Bongkot (33.33%)
|
|
|
|
|
|
16
|
|
TOTAL S.A. Form 20-F 2015
|
|
(a)
|
The Group’s interest in the local entity is approximately 100% in all cases except for Total Gabon (58.28%), TOTAL E&P Congo (85%) and certain
entities in Abu Dhabi and Oman (see notes b through k below).
|
|
(b)
|
Stake in the company Angola Block 14 BV (TOTAL 50.01%).
|
|
(c)
|
TOTAL’s stake in the foreign consortium.
|
|
(d)
|
TOTAL’s interest in the joint venture with Chesapeake.
|
|
(e)
|
TOTAL’s interest in the unincorporated joint venture.
|
Item 4 - B.2. Upstream Segment
|
|
|
|
|
|
|
|
|
|
|
Commonwealth of Independent States
|
|
|
|
|
|
Kazakhstan
1992
|
|
|
|
Non-operated:
Kashagan (16.81%)
|
|
Russia
1991
|
|
|
|
Operated:
Kharyaga (40.00%)
|
|
|
|
|
Non-operated:
Termokastovoye (49.00%)
(f)
, Several fields through the
participation in Novatek (18.90%)
|
|
|
|
|
|
Europe
|
|
|
|
|
|
Norway
1965
|
|
|
|
Operated:
Atla (40.00%) Skirne (40.00%)
|
|
|
|
|
Non-operated:
Åsgard (7.68%), Ekofisk (39.90%), Ekofisk South (39.90%), Eldfisk (39.90%), Embla (39.90%), Gimle (4.90%), Gungne (10.00%),
Heimdal (16.76%), Huldra (24.33%), Islay (5.51%)
(g)
, Kristin (6.00%), Kvitebjørn (5.00%), Mikkel (7.65%), Oseberg (14.70%), Oseberg East (14.70%), Oseberg South
(14.70%), Sleipner East (10.00%), Sleipner West (9.41%), Snøhvit (18.40%), Stjerne (14.70%), Tor (48.20%), Troll I (3.69%), Troll II (3.69%), Tune (10.00%), Tyrihans (23.15%), Visund (7.70%), Visund South (7.70%), Visund North
(7.70%)
|
|
The Netherlands 1964
|
|
|
|
Operated:
F6a (gas) (55.66%), F6a (oil) (65.68%), F15a Jurassic (38.20%), F15a/F15d Triassic (32.47%), F15d (32.47%), J3a (30.00%), K1a (40.10%), K1b/K2a (60.00%), K2c (60.00%), K3b
(56.16%), K3d (56.16%), K4a (50.00%), K4b/K5a (36.31%), K5b (50.00%), K6/L7 (56.16%), L1a (60.00%), L1d (60.00%), L1e (55.66%), L1f (55.66%), L4a (55.66%), L4d (55.66%)
|
|
|
|
|
Non-operated:
E16a (16.92%), E17a/E17b (14.10%), J3b/J6 (25.00%), K9ab-A (22.46%), Q16a (6.49%)
|
|
United Kingdom 1962
|
|
|
|
Operated:
Alwyn North (100.00%), Dunbar (100.00%), Ellon (100.00%), Forvie North (100.00%), Grant (100.00%), Jura (100.00%), Nuggets (100.00%), Elgin-Franklin (46.17%), West Franklin
(46.17%), Glenelg (58.73%), Islay (94.49%)
(g)
|
|
|
|
|
Non-operated:
Bruce (43.25%), Markham unitized field (7.35%), Keith (25.00%)
|
|
|
|
|
|
Middle East
|
|
|
|
|
|
U.A.E.
1939
|
|
|
|
Operated:
Abu Dhabi-Abu Al Bukhoosh (75.00%)
|
|
|
|
|
Non-operated:
ADCO (10.00%), Abu Dhabi offshore (13.33%)
(h)
, GASCO
(15.00%), ADGAS (5.00%)
|
|
Iraq
1920
|
|
|
|
Non-operated:
Halfaya (22.5%)
(i)
|
|
Oman
1937
|
|
|
|
Non-operated:
Various fields onshore (Block 6) (4.00%)
(j)
,
Mukhaizna field (Block 53) (2.00%)
(k)
|
|
Qatar
1936
|
|
|
|
Operated:
Al Khalij (40.00%)
|
|
|
|
|
Non-operated:
North Field-Bloc NF Dolphin (24.50%), North Field-Qatargas 1 Downstream (10.00%), North Field-Qatargas 1 Upstream (20.00%), North
Field-Qatargas 2 Train 5 (16.70%)
|
|
Yemen
1987
|
|
|
|
Operated:
Kharir/Atuf (Block 10) (28.57%)
|
|
|
|
|
Non-operated:
Various fields onshore (Block 5) (15.00%)
|
|
(f)
|
TOTAL’s interest in the joint venture with Novatek.
|
|
(g)
|
The field of Islay extends partially in Norway. TOTAL E&P UK holds a 94.49% stake and TOTAL E&P Norge 5.51%.
|
|
(h)
|
Via Abu Dhabi Marine Areas Limited (equity affiliate), TOTAL holds a 13.33% stake in the Abu Dhabi Marine Areas (ADMA) concession operated by ADMA-OPCO.
|
|
(i)
|
TOTAL’s interest in the joint venture
|
|
(j)
|
TOTAL’s indirect interest (4.00%) in the concession, via its 10% interest in Private Oil Holdings Oman Ltd. TOTAL also has a direct interest (5.54%) in
the Oman LNG facility (trains 1 and 2), and an indirect participation (2.04%) through OLNG in Qalhat LNG (train 3).
|
|
(k)
|
TOTAL’s direct interest in Block 53.
|
|
2.1.8.
|
Main activities by geographic area
|
The information presented
below describes the Group’s main exploration and production activities by geographic area, without detailing all of the assets held by TOTAL. The mentioned capacities are expressed in 100%.
Africa
In 2015, TOTAL’s production
in Africa was 678 kboe/d, representing 29% of the Group’s overall production, compared to 657 kboe/d in 2014 and 670 kboe/d in 2013. The two main producing countries in Africa in 2015 were Angola and Nigeria.
In
Algeria
, TOTAL’s production was 25 kboe/d during 2015, compared to 20 kboe/d in 2014 and 21 kboe/d in 2013. All of the
Group’s production in Algeria comes from the Tin Fouyé Tabankort (TFT) field (35%). TOTAL also has a 37.75% stake in the Timimoun gas development project.
The development of the Timimoun field continued in 2015 with engineering activities, the start of plant construction and drilling preparation.
In
Angola
, where TOTAL is the leading oil operator in the
country
(1)
, the Group’s production was 248 kboe/d in 2015 compared to 200 kboe/d in 2014 and 186 kboe/d in 2013. This production comes from Blocks 17, 14 and 0.
|
•
|
|
Deep offshore Block 17 (40%, operator) is TOTAL’s main asset in Angola. It is composed of four major producing hubs: Girassol, Dalia, Pazflor and CLOV. The
latest greenfield project, CLOV, started production in June 2014 and, since September 2014, its production plateau of 160 kboe/d
|
|
|
|
|
|
2015 Form 20-F TOTAL S.A.
|
|
17
|
Item 4 - B.2. Upstream Segment
|
|
|
has been maintained. In July 2015, Dalia Phase1A, a new development in the Dalia field, started production.
|
|
•
|
|
On the ultra-deep offshore Block 32 (30%, operator), the Kaombo project was launched in April 2014 to develop the discoveries in the southeast part of the block
via two FPSOs (floating production storage and offloading facilities) with a capacity of 115 kb/d each. The drilling campaign of 59 wells began in October 2015 and production start-up is planned for 2017. The exploration and delineation of the
center and north parts of the block (outside Kaombo) is ongoing.
|
|
•
|
|
On Block 14 (20%)
(1)
, production comes from the Tombua-Landana and Kuito fields as
well as the BBLT project, comprising the Benguela, Belize, Lobito and Tomboco fields.
|
|
•
|
|
Block 14K (36.75%) is the offshore unitization zone between Angola (Block 14) and the Republic of the Congo (Haute Mer license). The Lianzi field, which was
connected to the existing BBLT platform (Block 14), started production at the end of October 2015. The project is expected to reach a production plateau of 40 kb/d. TOTAL’s interest in the unitized zone is held 10% through Angola Block 14 BV
and 26.75% through Total E&P Congo.
|
|
•
|
|
On Block 0 (10%), the development of Mafumeira Sul was approved by the partners and authorities in 2012. This project constitutes the second development phase of
the Mafumeira field and is expected to start production by the end of 2016.
|
|
•
|
|
In April 2014, TOTAL sold its entire stake in Block 15/06 (15%).
|
In the Bas-Congo basin, TOTAL is the operator of exploration Block 17/06 (30%). The Group relinquished Block 33 (58.67%, operator) in November 2014.
In the Kwanza basin, deep offshore, TOTAL is also operator of Blocks 25 (35%), 40 (40%) and 39 (7.5% following the finalization of the sale of half of its stake in March 2015). TOTAL is also developing its LNG
activities through the Angola LNG project (13.6%), which includes a gas liquefaction plant near Soyo supplied by gas associated with production from Blocks 0, 14, 15, 17 and 18. LNG production started in June 2013, but various technical incidents
required the extended shutdown of the plant. LNG production is expected to resume in 2016.
In
Gabon
, the Group’s
production in 2015 was 59 kboe/d compared to 58 kboe/d in 2014 and 59 kboe/d in 2013. The Group’s exploration and production activities in Gabon were primarily carried out by Total Gabon
(2)
.
|
•
|
|
On the Anguille field (100%, operator), production of phase 3 of the redevelopment project (production capacity estimated at 20 kboe/d) from the AGM Nord
platform started in 2013 and 18 wells are operational today.
|
|
•
|
|
On the Torpille field (100%, operator), the data acquired during the 3D seismic survey performed in 2014 is now being processed.
|
|
•
|
|
On the deep-offshore Diaba license (42.5%, operator), an exploration well (Diaman-1B), drilled in 2013, showed an accumulation of gas and condensates. Additional
seismic data acquired at the end of 2014 on the western part of the license is being processed and is expected to generate a full inventory of the license’s prospectivity.
|
|
•
|
|
On the Nzeimbou (20%) license, the Igongo-1X well (which revealed a multilayer accumulation of oil and gas) was
|
|
|
|
commissioned by connecting to the facilities of the Echira field in June 2015.
|
In
Libya
, where the security context remains unstable, the Group’s production was 14 kb/d in 2015 compared to 27 kb/d in 2014 and 50 kb/d in 2013. This production comes from blocks located on offshore
areas 15, 16 and 32 (Al Jurf, 75%
(3)
), which have not been affected by the security issues. Since the fourth quarter of 2014, production as well as exploration activities
have been stopped on Mabruk — onshore areas 70 and 87 (75%
(3)
) — and on El Sharara — onshore areas 129, 130 (30%
(3)
), and 130 and 131 (24%
(3)
). In this environment of uncertainty, an impairment on the onshore assets
was booked in the 2015 Consolidated Financial Statements.
In
Morocco
, the 3D seismic processing and interpretation studies acquired in 2013 in
the south of the block continued in the scope of the reconnaissance authorization of Anzarane offshore, which covers an ocean region of 100,000 km² and was allocated in December 2011 to TOTAL by the ONHYM (National Office of Hydrocarbons and
Mines). The results of geological studies having not been encouraging, the reconnaissance authorization, which had been extended until December 2015, was not transformed into an exploration license.
In
Nigeria
, the Group’s production, primarily offshore, was 245 kboe/d in 2015, compared to 257 kboe/d in 2014 and 261 kboe/d in 2013. This
decrease is explained mainly by the sale of interests in certain licenses of the Shell Petroleum Development Company (SPDC) joint venture as well as by an upsurge of oil bunkering activities since 2013. This has negatively affected onshore
production and has had an impact on the integrity of the SPDC joint venture facilities as well as on the local environment.
TOTAL operates 5 of the 31
oil mining leases (OML) in which it has interests and also holds interests in 4 oil prospecting licenses (OPL).
Regarding the principal variations in
TOTAL’s permits since 2013:
|
•
|
|
TOTAL was granted approval by the authorities in 2013 to increase its stake in OPL 285 from 26.67% to 60% and it drilled the Ekpeyi-1 exploration well in 2015;
|
|
•
|
|
in 2013, TOTAL was granted approval by the authorities for the renewal of OMLs 99, 100 and 102 for a period of 20 years;
|
|
•
|
|
on OML 138 (20%), the production of the offshore field Usan reached 130 kboe/d in 2013. In 2014, two exploration wells, Ukot South-2B and Ukot South-3, and an
exploration well in 2015, Ukot South-4, led to three oil discoveries. The sale process, launched in November 2012, could not be closed. This asset is no longer accounted under “assets classified as held for sale” (refer to Note 4D to the
Consolidated Financial Statements). TOTAL has ceased to be the operator of OML 138 since February 2014;
|
|
•
|
|
TOTAL sold its 10% interest in OMLs 18 and 29 (in 2015) and OML 24 (in 2014), operated via the SPDC joint venture. In addition, the sale process is underway for
OML 25.
|
TOTAL continues to develop its operated assets, in particular:
|
•
|
|
OML 58 (40%, operator, onshore): in the scope of its joint venture with the Nigerian National Petroleum Corporation (NNPC), TOTAL has finalized the increase of
gas production capacity from 370 Mcf/d to 550 Mcf/d;
|
|
(1)
|
Stake held by the company Angola Block 14 BV (TOTAL 50.01%).
|
|
(2)
|
Total Gabon is a company under Gabonese law listed on Euronext Paris. TOTAL holds
58.28%, the Republic of Gabon holds 25% and the public float is 16.72%.
|
|
(3)
|
TOTAL’s stake in the foreign consortium.
|
|
|
|
|
|
18
|
|
TOTAL S.A. Form 20-F 2015
|
Item 4 - B.2. Upstream Segment
|
•
|
|
OML 102 (40%, operator): in December 2014, TOTAL stopped routine flaring on the Ofon field (Ofon phase 2 project). The gas associated with the production of oil
is now compressed and evacuated to shore and monetized via the Nigeria LNG plant;
|
|
•
|
|
OML 130 (24%, operator): the development of the Egina field (200 kboe/d capacity) launched in 2013 is underway. The drilling campaign for 44 wells started at the
end of 2014.
|
|
•
|
|
OML 99 (40%, operator): additional studies are underway for the development of the Ikike field.
|
TOTAL is also developing LNG activities with a 15% stake in the Nigeria LNG Ltd company, which owns a liquefaction plant with a 22 Mt/year total capacity.
Assessments are underway for the installation of an additional capacity of approximately 8.5 Mt/year. In an effort to focus its activities, TOTAL is currently re-evaluating its participation in the Brass LNG project, in which it holds a 20.48%
interest.
The Group’s non-operated production in Nigeria comes mostly from the SPDC joint venture in which TOTAL holds a 10% stake. TOTAL also
holds an interest in deep offshore OML 118 (12.5%). On this lease in 2015, the Bonga field contributed 19 kboe/d to the Group’s production. A unitization agreement for the Bonga South West/Aparo discovery (10%) was submitted to the
authorities in 2015.
In
Uganda
, a growth area for the Group and where TOTAL has been present in the upstream since 2012, the Group has a 33.33%
stake in the EA-1, EA-1A and EA-2 licenses and 28.33% in the EA-3 license located in the region of Lake Albert. TOTAL is the operator of licenses EA-1 and EA-1A and partner on the other licenses.
|
•
|
|
On the EA-1 license, a drilling campaign, production tests and 3D seismic acquisition survey were carried out between 2012 and mid-2014. As of the end of 2014,
five development plans had been submitted to the authorities. In 2015, discussions for the obtaining of production licenses were continued, and development optimization studies were conducted in order to start the project phase.
|
|
•
|
|
The EA-1A license expired in 2013 at the end of a drilling campaign that resulted in one discovery (Lyec). With the exception of the area relating to this
discovery, the license was relinquished to the authorities.
|
|
•
|
|
On the EA-2 license, the drilling campaign and production tests started in 2012 were completed in 2014. Two development plans were submitted to the authorities
in 2013. In 2015, discussions continued for the obtaining of production licenses.
|
|
•
|
|
The development plan for Kingfisher field, located on the EA-3 production license, was approved by the authorities in 2013 and the work to develop the field
continues.
|
|
•
|
|
In 2015, discussions were continued with the authorities of Uganda in order to assess the best option for the layout for the crude oil export pipeline to the
Indian Ocean.
|
In
the Republic of the Congo
, the Group’s production was 87 kboe/d in 2015 compared to 95 kboe/d in
2014 and 93 kboe/d in 2013. In December 2013, Qatar Petroleum International Upstream (QPI) purchased a 15% stake in the capital of Total E&P Congo, via a share capital increase of the subsidiary.
|
•
|
|
On the offshore field Moho Bilondo (53.5%, operator), phase 1b project (estimated capacity: 40 kboe/d) started production
|
|
|
|
in December 2015. Production of the Moho Nord project (estimated capacity: 100 kboe/d) is expected to start by the first half of 2017.
|
|
•
|
|
Block 14K (36.75%) corresponds to the offshore unitization area between the Republic of the Congo (Haute Mer license) and Angola (Block 14 located in
Angola). The production of the Lianzi field started at the end of October 2015. TOTAL’s interests in the unitization area are held 26.75% by Total E&P Congo and 10% by Angola Block 14 BV.
|
|
•
|
|
Since 2013, as part of the renewal of licenses, the stake held by the Group has been 42.5% on the Loango license and 29.75% on the Zatchi license.
|
|
•
|
|
Total E&P Congo is operator of Djéno (63%) the sole oil terminal in the country.
|
Rest of Africa
TOTAL also holds interests in
exploration licenses in South Africa, Côte d’Ivoire, Egypt, Kenya, Madagascar, Mauritania, Mozambique and the Democratic Republic of the Congo, and is negotiating with the authorities with the view to resume exploration activities in the
Republic of South Sudan.
North America
In 2015, TOTAL’s production in North America was 103 kboe/d, representing 4% of the Group’s total production, compared to 90 kboe/d in 2014 and 73 kboe/d in 2013.
In
Canada
, the Group’s production was 14 kboe/d in 2015 compared to 12 kboe/d in 2014 and 13 kboe/d in 2013. This production comes
entirely from TOTAL’s 50% stake in the Surmont project developed by SAGD
(1)
. Phase 2 of the project was commissioned in September 2015 and at the end of the ramp-up in
2017, the project is expected to have a total capacity of approximately 150 kb/d (75 kb/d in Group share).
Construction of the second oil sands project
in which TOTAL has a stake, the Fort Hills mining project, has progressed on time and within budget. At a more than 50% completion rate as at the end of 2015, production from Fort Hills is expected to start toward the end of 2017. As a result of a
full comparative analysis of its global asset portfolio in the context of lower oil prices, the Group decided in 2015 to reduce its exposure to Canadian oil sands. In November 2015,TOTAL sold 10% of its 39.2% stake in the Fort Hills project to the
operator, reducing its interest to 29.2%. Following this divestment, an impairment on the part of the asset sold was booked in the 2015 Consolidated Financial Statements.
On the Joslyn (38.25%, operator) and Northern Lights (50% operator) oil sands licenses, the projects were suspended and works have been strictly limited to legal and contractual obligations, and maintaining safety.
The Group booked an impairment of $2.2 billion on its oil sands assets in its 2014 Consolidated Financial Statements.
In the
United States
, the Group’s production was 89 kboe/d in 2015 compared to 78 kboe/d in 2014 and 60 kboe/d in 2013.
|
•
|
|
In the Gulf of Mexico, TOTAL holds interests in the deep offshore fields Tahiti (17%) and Chinook (33.33%).
|
In 2015, the TOTAL (40%) – Cobalt (60%, operator) alliance, formed in 2009 for exploration in the Gulf of Mexico, carried out further
drilling to evaluate the size of the North Platte discovery.
|
•
|
|
TOTAL is also present in shale gas production in the United States through its 25% stake in two joint ventures operated by Chesapeake in the Barnett (Texas) and
Utica (Ohio) basins.
|
|
(1
)
|
Steam Assisted Gravity Drainage, production by injection of recycled water vapor.
|
|
|
|
|
|
2015 Form 20-F TOTAL S.A.
|
|
19
|
Item 4 - B.2. Upstream Segment
|
|
|
Drilling activity in these basins was greatly reduced in 2015 due to the decrease in the price of gas and related liquids. In Barnett, four wells were drilled in 2015 compared to 40 in 2014
and approximately 60 in 2013. In Utica, the number of drilling rigs employed has been reduced from nine to one in 2015 and TOTAL participated in eight wells with Chesapeake. In 2014, approximately 170 wells were drilled by the joint venture and over
200 were drilled in 2013.
|
Following successive decreases in gas prices in the United States, impairments on shale gas
assets were booked in the 2013, 2014 and 2015 Consolidated Financial Statements.
The R&D stage oil shale projects (in situ and ex situ production
technology) in which the Group holds a stake (through American Shale Oil LLC, 55.7%, and the 50/50 joint venture with the company Red Leaf Resources) including the development of the Red Leaf pilot, have been deferred.
South America
In 2015, TOTAL’s
production in South America was 152 kboe/d, representing 7% of the Group’s total production, compared to 157 kboe/d in 2014 and 166 kboe/d in 2013. The two main producing countries in South America in 2015 were Argentina and Venezuela.
In
Argentina
, TOTAL operated approximately
30%
(1)
of the country’s gas production in 2015. The Group’s production was 72 kboe/d in 2015 compared to 75 kboe/d in 2014 and 78 kboe/d in 2013. From
2012, the Argentinean government concluded gas price agreements with various producers under which the government guarantees the price of gas for quantities above a fixed production level in exchange for compliance with defined production targets
and applicable penalties (
i
.e., “deliver or pay”). In 2013, TOTAL signed an agreement of this type for a period of five years with retroactive effect from December 1, 2012.
|
•
|
|
In Tierra del Fuego, the Group operates the Carina and Aries offshore fields (37.5%). A drilling campaign for two additional wells off the existing platform was
completed in 2015. The Vega Pleyade field (37.5%, operator), where development work was launched in 2013 (with a production capacity of 350 Mcf/d), started production in February 2016.
|
|
•
|
|
In the Neuquén basin, two pilot projects were launched following positive initial results of the drilling campaign on its mining licenses in order to
assess its gas and shale oil potential: one on the Aguada Pichana Block (27.3%, operator) where production started mid-2015, and the other on the Rincón la Ceniza Block (42.5%, operator).
|
In
Bolivia
, the Group’s production, mainly gas, was 28 kboe/d in 2015 compared to 30 kboe/d in 2014 and 28 kboe/d in 2013. TOTAL is active on seven
licenses: three production licenses at San Alberto (15%), San Antonio (15%) and Block XX Tarija Oeste (41%); two licenses in development phase, Aquio and Ipati (60%, operator); and two exploration phase licenses, Rio Hondo (50%) and Azero
(50%, operator of the exploration phase).
|
•
|
|
Following the discovery of the Incahuasi gas field, located in the Ipati Block, TOTAL was granted approval by the authorities to launch the first development
phase of the project, including the connection of three wells already drilled in a 6.5 Mm³/d capacity processing plant. The project is expected to start production mid-2016. In mid-2014, TOTAL reduced its stake in Aquio and Ipati from 80% to
60%.
|
|
•
|
|
In 2013, TOTAL acquired a 50% stake in the Azero exploration license located in the Andean foothills, which extends over an area of 7,800 km². The
exploration period began in June 2014.
|
In
Brazil
, a growth area for the Group, TOTAL acquired in 2013 a 20% stake in the Libra
field, located in the Santos basin. The field is located in the ultra-deep offshore (2,000 m) approximately 170 km off the coast of Rio de Janeiro and covers an area of 1,550 km². In 2014, a 50 kb/d capacity boat was reserved for long
duration production testing. In 2015, the drilling of two wells was completed and one of two others started in the northwest and center of the field.
The Group also holds stakes in 18 exploration licenses, following the 2015 acquisition of a 50% stake in Blocks P-M 1269, 1271, 1351 and 1353 in the Pelotas basin.
In
Venezuela
, where TOTAL has been active since 1980, the Group’s production was 52 kboe/d in 2015 as in 2014 and compared to 48 kboe/d
in 2013. TOTAL has stakes in PetroCedeño (30.3%) and Yucal Placer (69.5%) as well as the offshore exploration Block 4 of Plataforma Deltana (49%).
Development of the extra heavy oil field of PetroCedeño continues in the southern area as in the main area (47 production wells were drilled in 2015 compared to 86 in 2014 and 43 in 2013), as well as the
debottlenecking project for the water separation and treatment facilities.
In the Yucal Placer field, following the signature of an amendment to the gas
sale contract, a new development phase was launched in 2012. In April 2014, the field’s production increased following the commissioning of new clusters and the debottlenecking of the existing gas processing train (production capacity of150
Mcf/d in 2015).
Rest of South America
TOTAL also holds interests in exploration licenses in Aruba, Colombia, French Guiana and Uruguay.
Asia-Pacific
In 2015, TOTAL’s production in Asia-Pacific was 258 kboe/d, representing
11% of the Group’s overall production, compared to 238 kboe/d in 2014 and 235 kboe/d in 2013. The two main producing countries in Asia-Pacific in 2015 were Indonesia and Thailand.
In
Australia
, where TOTAL has had mining rights since 2005, the Group’s production was 4 kboe/d in 2015, 2014 and 2013.
|
•
|
|
The Ichthys project (30%) involves the development of a gas and condensate field located in the Browse Basin. This development will include a floating
platform designed for the production (CPF, Central Processing Facility), processing and exploration of gas, an FPSO (with condensate processing capacity of 100 kb/d) to stabilize and export the condensate, an 889 km gas pipeline and an onshore
liquefaction plant (with 8.9 Mt/y LNG and1.6 Mt/y LPG capacities) at Darwin. The LNG has already been sold mainly to Asian buyers under long-term contracts. Production is expected to start in 2017.
|
|
•
|
|
Gladstone LNG (GLNG) (27.5%) is an integrated gas production, transportation and liquefaction project of 7.2 Mt/y based on the development of coal seam gas
from the Fairview, Roma, Scotia and Arcadia fields. The development of a first upstream phase was completed with the start of
|
|
(1
)
|
Source: Department of Federal Planning, Public Investment and Services, Energy Secretariat.
|
|
|
|
|
|
20
|
|
TOTAL S.A. Form 20-F 2015
|
Item 4 - B.2. Upstream Segment
|
|
|
production of Fairview 3 and 4 and Roma 2. Train 1 (3.6 Mt/y capacity) started production in September 2015 and the first LNG cargo left GLNG for South Korea in October 2015. The
development of the liquefaction plant continues with the construction of train 2, which is expected to start production in 2016. An asset impairment of approximately $1.4 billion was booked in TOTAL’s 2015 Consolidated Financial Statements.
|
|
•
|
|
The WA-492 and WA-493 licenses, located in the Carnarvon basin, were awarded to TOTAL (100%, operator) in 2013. A 2D seismic regional campaign began in January
2015.
|
|
•
|
|
In 2012, TOTAL signed an agreement to enter into three shale gas exploration licenses located in the South Georgina basin in the center of the country. In 2013,
a 2D seismic survey was acquired on three licenses and a drilling campaign began in 2014 with two wells. Technical studies are ongoing.
|
In
Brunei
, TOTAL operates the offshore Maharaja Lela Jamalulalam gas and condensate field located on Block B (37.5%). The Group’s production was
15 kboe/d in 2015 as in 2014 and compared to 13 kboe/d in 2013. The gas is delivered to the Brunei LNG liquefaction plant.
A study regarding the
additional development of the southern part of the gas field (Maharaja Lela South) was completed in 2013. The project was launched in early 2014 with the signature of most of the contracts and the 20-year extension on the existing license. Onshore,
a first debottlenecking phase for the production processing plant was completed in 2015, increasing production by 20%. Offshore, the installation of a third platform was completed at the end of 2015 and the drilling campaign started in February
2016. The first wells are expected to be put into production in 2016.
Studies are currently being conducted to reassess the potential of the deep
offshore exploration Block CA1 (where TOTAL is operator), which includes the Jagus East discovery. Following the decision of two partners to sell their interest in the block, TOTAL decided to exercise its preemptive right, bringing its stake from
54% to 86.9%. A well was drilled in November 2015, and has confirmed the connection of the Jagus East field with the Gumusut-Kakap reservoirs in Malaysia. Discussions of the terms of the unitization are underway between the two countries and an
agreement should be reached in 2016
.
In
China
, TOTAL has been active since 2006 on the South Sulige Block, located in the Ordos Basin in
the Inner Mongolia province. The Group’s production was 11 kboe/d in 2015 compared to 12 kboe/d in 2014 and 8 kboe/d in 2013. Following appraisal work by TOTAL, China National Petroleum Corporation (CNPC) and TOTAL agreed to a development
plan under which CNPC is the operator and TOTAL holds a 49% stake. This development plan was approved by the authorities in 2014. The drilling of development wells is ongoing.
In 2013, TOTAL signed a joint study agreement with Sinopec for potential shale gas on the Xuancheng license (4,000 km²) near Nanjing. A 2D seismic survey was performed in 2014 and the drilling of an
exploration well was completed in 2015.
In
Indonesia
, the Group’s production was 147 kboe/d in 2015 compared to 130 kboe/d in 2014 and 131
kboe/d in 2013.
TOTAL’s operations in Indonesia are primarily concentrated on the Mahakam license (50%, operator), which in particular includes the
Peciko and Tunu gas fields. TOTAL also has a stake in the Sisi-Nubi gas field (47.9%, operator). The Mahakam license expires in December 2017. The Indonesian government has decided to
allocate 100% of the participating interest to Pertamina (operator) from January 1, 2018 onwards, while giving Pertamina the possibility to farm-out a maximum interest of 30% to TOTAL and its
current partner, INPEX. The Group delivers most of its natural gas production to the Bontang LNG plant. These volumes of gas represented approximately 80% of the Botang plant’s supply in 2015. To this gas production was added the operated
production of oil and condensates from the Handil and Bekapai fields.
|
•
|
|
On the Mahakam license, the works aimed at maintaining production on the Tunu, Peciko, South Mahakam, Sisi-Nubi and Bekapai fields are ongoing.
|
|
•
|
|
On the Sebuku (15%) license, production startup of the Ruby gas field took place in 2013, with a production capacity of approximately 100 Mcf/d. Production
is routed via pipeline for processing and separation at the Senipah terminal (operated by TOTAL).
|
|
•
|
|
TOTAL also holds stakes in two exploration blocks: Mentawai (80%, operator) and Telen (100%).
|
|
•
|
|
In addition, the Group holds stakes in blocks with no activity: Sadang (30%), Sageri (50%), Arafura Sea (24.5%), Amborip VI (24.5%), South Mandar (49.3%), South
West Bird’s Head (90%, operator) and South East Mahakam (50%, operator).
|
|
•
|
|
Early in 2015, the Group sold its stake in the two coal bed methane (CBM) blocks located in the East Kalimantan province, Kutai II (18.4%) and Kutai Timur
(50%).
|
In
Myanmar
, the Group’s production was 19 kboe/d en 2015 compared to 17 kboe/d in 2014 and 16 kboe/d in 2013.
The Yadana field (31.2%, operator), located on the offshore Blocks M5 and M6, primarily produces gas for delivery to PTT (Thai state-owned company) for
use in Thai power plants. The Yadana field also supplies the domestic market via two pipelines built and operated by MOGE, a Myanmar state-owned company. The LCP-Badamyar project, which includes the installation of the Badamyar field compression and
development platform connected to the Yadana facilities, was launched in September 2014.
In 2014, the Group was awarded the deep offshore Block YWB
(100%, operator) during the offshore round launched by the local authorities. The PSC was signed in February 2015.
In October 2015, the Group sold its
stake in the offshore Block M11 (47.06%) and entered in exploration license A6 (40%) in the deep offshore area west of Myanmar. A first well was drilled in December 2015 on which a natural gas discovery has been made and is currently under
evaluation.
In
Papua New Guinea
, where TOTAL has been active since 2012, the Group acquired in March 2014 a stake in Block PRL-15 (40.1%). TOTAL
became the operator in August 2015. The State of Papua New Guinea retains the right to enter the license (when the final investment decision is made) at a maximum level of 22.5%. In this case, TOTAL’s stake would be reduced to 31.1%.
Block PRL-15 includes the two discoveries Elk and Antelope, growth areas for the Group. A delineation program of these discoveries is underway. The
results of the first wells drilled have confirmed the level of resources in the Elk and Antelope fields. TOTAL has also started development studies in the Elk and Antelope fields, including on the construction of an onshore gas liquefaction plant.
In July 2015, the location of the various production sites was announced to the authorities.
In
Thailand
, the Group’s production was 62
kboe/d in 2015 compared to 60 kboe/d in 2014 and 63 kboe/d in 2013. This comes from the offshore gas and condensate field of Bongkot (33.33%). PTT (Thai state-owned company) purchases all of the natural gas and
|
|
|
|
|
2015 Form 20-F TOTAL S.A.
|
|
21
|
Item 4 - B.2. Upstream Segment
condensate production. New investments are underway for maintaining the plateau and responding to gas demand.
Rest of Asia
TOTAL also holds interests
in exploration licenses in Malaysia and the Philippines.
Commonwealth of Independent States (CIS)
In 2015, TOTAL’s production in the CIS was 290 kboe/d, representing 12% of the Group’s total production, compared to 249 kboe/d in 2014 and
227 kboe/d in 2013. The main producing country in the CIS in 2015 was Russia.
In
Kazakhstan
, TOTAL holds a stake in the North Caspian
license (16.81%), which covers the Kashagan field.
The production of the first phase of the Kashagan project (300 kb/d), started in September 2013,
was halted in October 2013 due to leaks detected in the gas export pipeline. The two gas and oil export pipelines are being replaced by the operator. The works progress according to plan and production is expected to resume in December 2016.
TOTAL is the operator of the Nurmunaï North and South onshore exploration licenses (51.1%, after the sale of 23.9% of interests in February 2015)
located in the southwest of the country. The drilling of two exploration wells (the first on the Nurmunai North license and the second on the Nurmunaï South license) was performed between February and October 2015. The results are being
analyzed.
In
Russia
, where, as of December 31, 2015, the Group holds 19% of its proved reserves, the Group’s production was
290 kboe/d in 2015 compared to 235 kboe/d in 2014 and 207 kboe/d in 2013. This production comes from the Kharyaga and Termokarstovoye fields and TOTAL’s stake in OAO Novatek (18.9% as of December 31, 2015). In 2015, Russia
became the leading contributor to the Group’s production.
In 2014, international economic sanctions associated with the situation in Ukraine were
adopted by the United States, the European Union and other countries. TOTAL complies with sanctions applicable to its activities. For further information, refer to “Item 3 —C. Risk Factors”, above.
On the Kharyaga (40%, operator) project, the works relating to the development plan of phases 3 and 4 are ongoing though they slowed in 2015 after a dispute with
the main contractor, which was settled at the end of 2015. In addition, in January 2016, TOTAL signed an agreement for the sale of a 20% interest and the transfer of operatorship of the field. This sale is expected to take effect in the second
quarter of 2016, subject to the approval of the authorities.
In addition to its shareholding in Novatek, TOTAL currently participates via a direct stake
in two projects with Novatek:
|
•
|
|
Termokarstovoye (an onshore gas and condensates field, located in the Yamalo-Nenets region): the development and production license of Termokarstovoye field is
held by ZAO Terneftegas, a joint venture between Novatek (51%) and TOTAL (49%). This field, which started production in May 2015, reached its capacity of 65 kboe/d in September 2015; and
|
|
•
|
|
Yamal LNG: in December 2013 the company OAO Yamal LNG
(1)
launched the project, aimed
at developing the onshore
|
|
|
|
field of South Tambey (gas and condensates) located on the Yamal peninsula and at building a three-train gas liquefaction plant with total LNG capacity of 16.5 Mt/y. The financing plan for the
Yamal LNG project is being reviewed, and the project’s partners are engaged in efforts to develop a financing plan in compliance with the applicable regulations. In 2015, the project advanced satisfactorily according to schedule.
|
The exploration project on the Bazhenov field (shale oil) in the Kanthy Mansiysk region has been suspended since 2014. In 2015, TOTAL
transferred all of its rights in the awarded licenses to a subsidiary of the partner of the project.
For further information on international economic
sanctions, refer to “Item 3 — C. Risk Factors”, above.
Rest of CIS
TOTAL also holds interests in exploration licenses in Azerbaijan and Tajikistan.
Europe
In 2015, TOTAL’s production in Europe was 374 kboe/d, representing 16% of the
Group’s total production, compared to 364 kboe/d in 2014 and 392 kboe/d in 2013. The two main producing countries in Europe in 2015 were Norway and the United Kingdom.
In
Denmark
, TOTAL (80%, operator) acquired in 2010 two shale gas exploration licenses in order to assess their potential. On the 1/10 (Nordjylland) license, a vertical exploration well without hydraulic
fracturing drilled in 2015 revealed the presence of gas, but the quantities were not sufficient to consider economically viable production. The Group is moving forward with restoration works on the drilling site, which will be rehabilitated in
compliance with environmental obligations as required by Danish law. The 2/10 (Nordsjaelland) license was relinquished in July 2015 due to lower than expected estimated potential for the Group.
In
France
, the Group’s production ended with the sale in October 2014 of the Lacq concessions to Geopetrol. Production in 2014 was 2 kboe/d
compared to 9 kboe/d in 2013. The Montélimar exclusive research license granted to TOTAL in 2010 for evaluating the shale gas potential of this area was repealed by the government in 2011. In January 2016, further to the appeal filed in 2011,
the administrative court canceled the revocation of the license deciding the Group had fulfilled its obligations.
In
Italy
, TOTAL holds a stake
in two exploration licenses and in the Tempa Rossa field (50%, operator), discovered in 1989 and located on the Gorgoglione concession (Basilicate region). Development of the Tempa Rossa project is underway.
In
Norway
, TOTAL has equity stakes in 97 production licenses on the Norwegian maritime continental shelf, 31 of which it operates. The Group’s
production in 2015 was 239 kboe/d compared to 242 kboe/d in 2014 and 243 kboe/d in 2013.
|
•
|
|
In the Greater Ekofisk area, the Group holds a 39.9% stake in the Ekofisk and Eldfisk fields. Production at Ekofisk South started in 2013 and at Eldfisk II in
January 2015 (capacity of 70 kboe/d each).
|
|
•
|
|
In the Sleipner area, development of the Gina Krog field located in the north of Sleipner and approved in 2013 is underway. The Group’s stake, currently 30%
(after the sale of
|
|
(1)
|
The OAO Yamal LNG company is owned by Novatek (60%), Total E&P Yamal (20%), and CNODC (20%), a subsidiary of China National Petroleum Corporation.
Novatek’s investment in the company OAO Yamal LNG is to be reduced to 50.1% following an agreement signed in September 2015 for the entry of the Silk Road Fund (9.9%). This agreement is expected to be approved by the authorities in 2016.
|
|
|
|
|
|
22
|
|
TOTAL S.A. Form 20-F 2015
|
Item 4 - B.2. Upstream Segment
|
|
|
8% in 2014), is expected to be reduced to 15% after the finalization of the sale of 15% announced in October 2015.
|
|
•
|
|
In the Greater Hild area, the Martin Linge field (51%, operator, estimated capacity 80 kboe/d) is currently being developed.
|
|
•
|
|
In the Haltenbanken region, the first sub-marine compression train in the world was commissioned on the Åsgard project (7.7%) in September 2015.
|
|
•
|
|
In the Barents Sea, the Group holds an 18.4% stake in the gas liquefaction plant of Snøhvit (capacity of 4.2 Mt/y). This plant is supplied with gas from
the Snøhvit, Albatross and Askeladd fields.
|
In
the Netherlands
, TOTAL currently holds interests in 24 offshore
production licenses, including 20 that it operates, and 2 offshore exploration licenses, E17c (16.92%) and K1c (30%). In 2015, the Group’s production was 28 kboe/d compared to 31 kboe/d in 2014 and 35 kboe/d in 2013.
In the
United Kingdom
, the Group’s production was 107 kboe/d in 2015 compared to 89 kboe/d in 2014 and 105 kboe/d in 2013. Approximately 90% of this
production comes from operated fields in two main areas: the Alwyn area in the northern North Sea, and the Elgin/Frankin area in the Central Graben.
|
•
|
|
In the Alwyn area (100%), production from the Alwyn and Dunbar fields represents 20% and 25% of production, respectively. The rest of the production comes from
satellites:
|
|
|
1)
|
linked to Alwyn by subsea tieback: the Forvie gas and condensates field joined by the Jura and Islay fields and the Nuggets gas field network, which started to produce in cyclic
mode at the end of 2015;
|
|
|
2)
|
linked to Dunbar: the Ellon (oil and gas) and the Grant (gas and condensates) fields.
|
The natural decline of the Alwyn field’s production was partially compensated by the start-up of new reservoir compartments. A system for improving recovery, the concentric gas lift, was installed in three
Alwyn wells in 2014.
On the Dunbar field (100%), a new development phase (Dunbar phase IV) is underway, which includes three well work-overs and the
drilling of six new wells. Drilling on the first well, D14, started in April 2015.
|
•
|
|
In Central Graben, TOTAL holds stakes in the Elgin, Franklin and West Franklin fields (46.2%, operator). A redevelopment project involving the drilling of five
new infill wells on Elgin and Franklin started in July 2013. The first well is currently being drilled. In addition, the West Franklin Phase II development project continued with the start-up of production of two new wells in 2015.
|
|
•
|
|
A third area, West of Shetland, is currently under development. This includes the fields of Laggan, Tormore, Edradour and Glenlivet (operator with 60%, following
the sale of 20% of its interests carried out in 2015) and the P967 license, including the discovery of gas at Tobermory (30%, operator). Production of the Laggan and Tormore fields started in February 2016. Production of the Edradour and Glenlivet
fields is expected to start in 2017 and 2018, respectively, with an expected total capacity of 90 kboe/d.
|
An impairment on gas assets
in the United Kingdom was booked in the 2015 Consolidated Financial Statements.
In 2014, TOTAL acquired a 40% stake in two onshore shale gas exploration
and production licenses (PEDL 139 and 140) located in the Gainsborough Trough basin of the East Midlands, and signed
an agreement enabling the Group to acquire a 50% stake in the PEDL 209 license located in the same area. A 3D seismic survey was performed on the PEDL 139 and 140 licenses. In August 2015, an
agreement was signed for the sale of interests held by TOTAL E&P UK in transport pipelines (FUKA and SIRGE) and the St. Fergus terminal. The transfer is expected to take effect in the first half of 2016.
Rest of Europe
TOTAL also holds interests in
exploration licenses in Bulgaria and Cyprus.
Middle East
In 2015, TOTAL’s production in the Middle East was 492 kboe/d, representing 21% of the Group’s total production, compared to 391 kboe/d in 2014 and 536 kboe/d in 2013. The two main producing
countries in the Middle East in 2015 were the United Arab Emirates and Qatar.
In the
United Arab Emirates
, the Group’s production was
287 kboe/d in 2015 compared to 127 kboe/d in 2014 and 260 kboe/d in 2013. The Group holds, since January 1, 2015, a 10% stake in the Abu Dhabi Company for Onshore Petroleum Operations Ltd. (ADCO) concession for a period of 40 years,
which follows a previous onshore concession. This concession covers the 15 main onshore fields of Abu Dhabi and represents more than half of the Emirate’s production.
TOTAL holds a 75% stake (operator) in the Abu Al Bukhoosh field and a 13.3% stake in Abu Dhabi Marine Operating Company (ADMA-OPCO), which operates two fields offshore Abu Dhabi. TOTAL also holds a 15% stake in Abu
Dhabi Gas Industries (GASCO), which produces NGL and condensates from the associated gas produced by ADCO. In addition, TOTAL holds 5% of the Abu Dhabi Gas Liquefaction Company (ADGAS), which processes the associated gas produced by ADMA-OPCO in
order to produce LNG, NGL and condensates, and 5% of National Gas Shipping Company (NGSCO), which owns eight LNG tankers and exports the LNG produced by ADGAS.
The Group holds a 24.5% stake in Dolphin Energy Ltd. in partnership with Mubadala, a company owned by the government of Abu Dhabi, in order to market gas produced in Qatar primarily to the United Arab Emirates.
The Group also owns 33.33% of Ruwais Fertilizer Industries (FERTIL), which produces urea. The FERTIL 2 project commenced operations in 2013, enabling
FERTIL to increase its production capacity to 2 Mt/y.
In
Iraq
, the Group’s production in 2015 was 18 kboe/d compared to 12 kboe/d in 2014
and 7 kboe/d in 2013.
On the Halfaya field in Missan province, following the completion of a negotiation in October 2014, TOTAL’s stake increased
from 18.75% to 22.5% in the consortium that was awarded the development and production contract. Production of phase 1 of the project started in 2012 and phase 2 started in 2014, enabling production to reach 200 kb/d in the second half of 2014. In
2015, amid low barrel prices, the commencement of EPCC contracts (engineering, procurement, construction and commissioning) of phase 3 of the project (to increase production to 400 kb/d) was postponed.
In Iraqi Kurdistan, TOTAL holds stakes in several exploration blocks.
|
(1
)
|
TOTAL holds an indirect 4% stake in Petroleum Development Oman LLC, operator of Block 6, via its 10% stake in Private Oil Holdings Oman Ltd.
|
|
(2
)
|
TOTAL has an indirect stake via Oman LNG’s stake in Qalhat LNG.
|
|
|
|
|
|
2015 Form 20-F TOTAL S.A.
|
|
23
|
Item 4 - B.2. Upstream Segment
In
Oman
, the Group’s production in 2015 was 36 kboe/d, stable compared to 2014 and
2013. TOTAL participates in the production of oil principally in Block 6 (4%)
(1)
, but also in Block
53 (2%). The Group also produces LNG through its investments in the Oman LNG (5.54%)/Qalhat LNG
(2.04%)
(2)
liquefaction complex, with an overall capacity of 10.5 Mt/y. The ultra-deep
offshore Block 41 license, obtained in 2013, was relinquished in February 2015 following disappointing results.
In
Qatar
, the Group’s
production was 134 kboe/d in 2015 compared to 132 kboe/d in 2014 and 137 kboe/d in 2013.
The Group operates the Al Khalij field (40% operator) and
participates in the production, processing and exporting of gas from the North Field due to investments in the Qatargas 1 and Qatargas 2 LNG plants and in Dolphin Energy.
|
•
|
|
Qatargas 2 (16.7%): the production capacity of train 5 of Qatargas 2 stood at 8 Mt/y. TOTAL offtakes part of the LNG produced under the 2006 contracts that
provide for the purchase of 5.2 Mt/y of LNG by the Group. In addition, the Group holds a stake in the Qatargas 1 liquefaction plant (10%) as well as a stake in the corresponding upstream Block NFB (20%).
|
|
•
|
|
Dolphin Energy (24.5%): the production contract for the Dolphin gas project, signed in 2001 with Qatar Petroleum, provides for the sale of 2 Bcf/d of gas from
the North Field for a 25-year period. The gas is processed in the Dolphin plant in Ras Laffan and exported to the United Arab Emirates through a 360 km gas pipeline.
|
In
Syria
, TOTAL has a 100% stake in the Deir Ez Zor license, which is operated by the joint venture company
DEZPC in which TOTAL and the state-owned company SPC each have a 50% share. Additionally, TOTAL is holder of the Tabiyeh contract which came into effect in 2009. The Group has had no production in the country since December 2011, when TOTAL
suspended its hydrocarbon production activities in Syria in compliance with the EU’s regulations regarding this country. For further information regarding international economic sanctions, refer to “Item 3 —C. Risk
Factors”, above.
In
Yemen
, the Group’s production was 17 kboe/d in 2015 compared to 84 kboe/d in 2014 and 95 kboe/d in 2013.
Due to the further deterioration in the security situation in the vicinity of its Balhaf site, the company Yemen LNG, in which the Group holds a 39.62%
stake, decided to stop its commercial LNG production and export activities. The plant is in a preservation mode. As a consequence of this situation, Yemen LNG declared Force Majeure to its various stakeholders in early April 2015.
The PSA of Block 10 (Masila Basin, East Shabwa permit, 28.57%, operator) expired in late December 2015, and the license was returned to the Yemeni authorities.
TOTAL is a partner in Block 5 (Marib basin, Jannah license, 15%) and holds various stakes in four onshore exploration licenses.
|
|
|
|
|
24
|
|
TOTAL S.A. Form 20-F 2015
|
Item 4 - B.2. Upstream Segment
|
2.1.9.
|
Oil and gas acreage
|
|
|
|
|
|
|
|
|
|
|
|
|
|
As of December 31,
(in thousands of acres at year-end)
|
|
2015
|
|
|
|
|
Undeveloped
acreage
(a)
|
|
|
Developed
acreage
|
|
|
Europe
|
|
Gross
|
|
|
9,585
|
|
|
|
703
|
|
|
|
|
Net
|
|
|
4,518
|
|
|
|
149
|
|
|
Africa
|
|
Gross
|
|
|
93,306
|
|
|
|
1,313
|
|
|
|
|
Net
|
|
|
53,154
|
|
|
|
346
|
|
|
Americas
|
|
Gross
|
|
|
23,881
|
|
|
|
984
|
|
|
|
|
Net
|
|
|
9,186
|
|
|
|
304
|
|
|
Middle East
|
|
Gross
|
|
|
28,032
|
|
|
|
2,189
|
|
|
|
|
Net
|
|
|
3,241
|
|
|
|
227
|
|
|
Asia — CIS (excl. Russia)
|
|
Gross
|
|
|
52,596
|
|
|
|
734
|
|
|
|
|
Net
|
|
|
28,349
|
|
|
|
260
|
|
|
Russia
|
|
Gross
|
|
|
3,659
|
|
|
|
520
|
|
|
|
|
Net
|
|
|
729
|
|
|
|
96
|
|
|
Total
|
|
Gross
|
|
|
211,059
|
|
|
|
6,443
|
|
|
|
|
Net
(b)
|
|
|
99,177
|
|
|
|
1,382
|
|
|
(a)
|
Undeveloped acreage includes leases and concessions.
|
|
(b)
|
Net acreage equals the sum of the Group’s equity stakes in gross acreage.
|
|
2.1.10.
|
Number of productive wells
|
|
|
|
|
|
|
|
|
|
|
|
|
|
As of December 31,
(wells at year-end)
|
|
2015
|
|
|
|
|
Gross
productive
wells
|
|
|
Net
productive
wells
(a)
|
|
|
Europe
|
|
Oil
|
|
|
386
|
|
|
|
105
|
|
|
|
|
Gas
|
|
|
283
|
|
|
|
88
|
|
|
Africa
|
|
Oil
|
|
|
2,532
|
|
|
|
624
|
|
|
|
|
Gas
|
|
|
177
|
|
|
|
49
|
|
|
Americas
|
|
Oil
|
|
|
1,092
|
|
|
|
349
|
|
|
|
|
Gas
|
|
|
3,903
|
|
|
|
795
|
|
|
Middle East
|
|
Oil
|
|
|
7,625
|
|
|
|
510
|
|
|
|
|
Gas
|
|
|
80
|
|
|
|
16
|
|
|
Asia — CIS (excl. Russia)
|
|
Oil
|
|
|
140
|
|
|
|
57
|
|
|
|
|
Gas
|
|
|
2,369
|
|
|
|
815
|
|
|
Russia
|
|
Oil
|
|
|
207
|
|
|
|
42
|
|
|
|
|
Gas
|
|
|
516
|
|
|
|
80
|
|
|
Total
|
|
Oil
|
|
|
11,982
|
|
|
|
1,687
|
|
|
|
|
Gas
|
|
|
7,328
|
|
|
|
1,843
|
|
|
(a)
|
Net wells equal the sum of the Group’s equity stakes in gross wells.
|
|
|
|
|
|
2015 Form 20-F TOTAL S.A.
|
|
25
|
Item 4 - B.2. Upstream Segment
|
2.1.11.
|
Number of net productive and dry wells drilled
|
|
|
|
|
|
|
|
|
|
|
|
|
|
|
|
|
|
|
|
|
|
|
|
|
|
|
|
|
|
|
|
|
|
|
|
|
|
|
|
|
|
As of December 31,
(wells at year-end)
|
|
2015
|
|
|
2014
|
|
|
2013
|
|
|
|
|
Net
productive
wells
drilled
(a)(b)
|
|
|
Net
dry
wells
drilled
(a)(c)
|
|
|
Net
total
wells
drilled
(a)(c)
|
|
|
Net
productive
wells
drilled
(a)(b)
|
|
|
Net
dry
wells
drilled
(a)(c)
|
|
|
Net
total
wells
drilled
(a)(c)
|
|
|
Net
productive
wells
drilled
(a)(b)
|
|
|
Net
dry
wells
drilled
(a)(c)
|
|
|
Net
total
wells
drilled
(a)(c)
|
|
|
Exploratory
|
|
Europe
|
|
|
1.0
|
|
|
|
3.6
|
|
|
|
4.6
|
|
|
|
1.4
|
|
|
|
0.2
|
|
|
|
1.6
|
|
|
|
1.5
|
|
|
|
0.2
|
|
|
|
1.7
|
|
|
|
|
Africa
|
|
|
0.2
|
|
|
|
2.1
|
|
|
|
2.3
|
|
|
|
2.0
|
|
|
|
3.3
|
|
|
|
5.3
|
|
|
|
1.5
|
|
|
|
5.1
|
|
|
|
6.6
|
|
|
|
|
Americas
|
|
|
1.4
|
|
|
|
0.6
|
|
|
|
2.0
|
|
|
|
2.1
|
|
|
|
0.3
|
|
|
|
2.4
|
|
|
|
2.9
|
|
|
|
1.4
|
|
|
|
4.3
|
|
|
|
|
Middle East
|
|
|
0.3
|
|
|
|
0.5
|
|
|
|
0.8
|
|
|
|
0.3
|
|
|
|
0.3
|
|
|
|
0.6
|
|
|
|
0.6
|
|
|
|
0.7
|
|
|
|
1.3
|
|
|
|
|
Asia — CIS (excl. Russia)
|
|
|
2.0
|
|
|
|
1.9
|
|
|
|
3.9
|
|
|
|
1.2
|
|
|
|
1.1
|
|
|
|
2.3
|
|
|
|
1.6
|
|
|
|
4.3
|
|
|
|
5.9
|
|
|
|
|
Russia
|
|
|
—
|
|
|
|
—
|
|
|
|
—
|
|
|
|
—
|
|
|
|
0.3
|
|
|
|
0.3
|
|
|
|
—
|
|
|
|
—
|
|
|
|
—
|
|
|
|
|
Total
|
|
|
4.9
|
|
|
|
8.7
|
|
|
|
13.6
|
|
|
|
7.0
|
|
|
|
5.5
|
|
|
|
12.5
|
|
|
|
8.1
|
|
|
|
11.7
|
|
|
|
19.8
|
|
|
Development
|
|
Europe
|
|
|
14.0
|
|
|
|
0.4
|
|
|
|
14.4
|
|
|
|
8.8
|
|
|
|
—
|
|
|
|
8.8
|
|
|
|
6.9
|
|
|
|
0.3
|
|
|
|
7.2
|
|
|
|
|
Africa
|
|
|
21.4
|
|
|
|
—
|
|
|
|
21.4
|
|
|
|
24.6
|
|
|
|
1.0
|
|
|
|
25.6
|
|
|
|
19.7
|
|
|
|
0.4
|
|
|
|
20.1
|
|
|
|
|
Americas
|
|
|
60.6
|
|
|
|
0.1
|
|
|
|
60.7
|
|
|
|
128.1
|
|
|
|
0.2
|
|
|
|
128.3
|
|
|
|
98.0
|
|
|
|
—
|
|
|
|
98.0
|
|
|
|
|
Middle East
|
|
|
36.6
|
|
|
|
0.6
|
|
|
|
37.2
|
|
|
|
36.1
|
|
|
|
0.2
|
|
|
|
36.3
|
|
|
|
42.7
|
|
|
|
0.3
|
|
|
|
43.0
|
|
|
|
|
Asia — CIS (excl. Russia)
|
|
|
88.6
|
|
|
|
—
|
|
|
|
88.6
|
|
|
|
106.2
|
|
|
|
0.5
|
|
|
|
106.7
|
|
|
|
184.2
|
|
|
|
—
|
|
|
|
184.2
|
|
|
|
|
Russia
|
|
|
22.9
|
|
|
|
—
|
|
|
|
22.9
|
|
|
|
28.8
|
|
|
|
0.8
|
|
|
|
29.6
|
|
|
|
13.8
|
|
|
|
—
|
|
|
|
13.8
|
|
|
|
|
Total
|
|
|
244.1
|
|
|
|
1.1
|
|
|
|
245.2
|
|
|
|
332.6
|
|
|
|
2.7
|
|
|
|
335.3
|
|
|
|
365.3
|
|
|
|
1.0
|
|
|
|
366.3
|
|
|
Total
|
|
|
|
|
249.0
|
|
|
|
9.8
|
|
|
|
258.8
|
|
|
|
339.6
|
|
|
|
8.2
|
|
|
|
347.8
|
|
|
|
373.4
|
|
|
|
12.7
|
|
|
|
386.1
|
|
|
(a)
|
Net wells equal the sum of the Company’s fractional interests in gross wells.
|
|
(b)
|
Includes certain exploratory wells that where abandoned, but which would have been capable of producing oil in sufficient quantities to justify completion.
|
|
(c)
|
For information: service wells and stratigraphic wells drilled within oil sands operations in Canada are not reported in this table ( 34.8 wells in 2015, 90.0
wells in 2014 and 86.2 wells in 2013).
|
For information on the accounting impacts in 2015 concerning dry wells drilled, refer to
Note 4D of the Consolidated Financial Statements.
|
2.1.12.
|
Wells in the process of being drilled (including wells temporarily suspended)
|
|
|
|
|
|
|
|
|
|
|
|
|
|
As of December 31,
(wells at
year-end)
|
|
2015
|
|
|
|
|
|
|
Gross
|
|
|
Net
(a)
|
|
|
Exploratory
|
|
Europe
|
|
|
5
|
|
|
|
1.6
|
|
|
|
|
Africa
|
|
|
25
|
|
|
|
7.3
|
|
|
|
|
Americas
|
|
|
14
|
|
|
|
4.6
|
|
|
|
|
Middle East
|
|
|
8
|
|
|
|
2.5
|
|
|
|
|
Asia — CIS (excl. Russia)
|
|
|
11
|
|
|
|
3.4
|
|
|
|
|
Russia
|
|
|
—
|
|
|
|
—
|
|
|
|
|
Total
|
|
|
63
|
|
|
|
19.4
|
|
|
Other wells
(b)
|
|
Europe
|
|
|
38
|
|
|
|
13.6
|
|
|
|
|
Africa
|
|
|
56
|
|
|
|
14.9
|
|
|
|
|
Americas
|
|
|
63
|
|
|
|
22.4
|
|
|
|
|
Middle East
|
|
|
158
|
|
|
|
20.5
|
|
|
|
|
Asia — CIS (excl. Russia)
|
|
|
642
|
|
|
|
191.7
|
|
|
|
|
Russia
|
|
|
113
|
|
|
|
17.4
|
|
|
|
|
Total
|
|
|
1,070
|
|
|
|
280.5
|
|
|
Total
|
|
|
|
|
1,133
|
|
|
|
299.9
|
|
|
(a)
|
Net wells equal the sum of the Group’s equity stakes in gross wells. Includes wells for which surface facilities permitting production have not yet been
constructed. Such wells are also reported in the table “Number of net productive and dry wells drilled”, above, for the year in which they were drilled.
|
|
(b)
|
Other wells are developments wells, service wells, stratigraphic wells and extension wells
|
|
|
|
|
|
26
|
|
TOTAL S.A. Form 20-F 2015
|
Item 4 - B.2. Upstream Segment
|
2.1.13.
|
Interests in pipelines
|
The table below
sets forth interests of the Group’s entities
(1)
in the main oil and gas pipelines as of December 31, 2015.
|
|
|
|
|
|
|
|
|
|
|
|
|
|
|
|
|
|
|
|
|
|
|
Pipeline(s)
|
|
Origin
|
|
Destination
|
|
% interest
|
|
|
Operator
|
|
|
Liquids
|
|
|
Gas
|
|
|
EUROPE
|
|
|
|
|
|
|
|
|
|
|
|
|
|
|
|
|
|
|
|
|
|
Norway
|
|
|
|
|
|
|
|
|
|
|
|
|
|
|
|
|
|
|
|
|
|
Frostpipe (inhibited)
|
|
Lille-Frigg, Froy
|
|
Oseberg
|
|
|
36.25
|
|
|
|
|
|
|
|
x
|
|
|
|
|
|
|
Heimdal to Brae Condensate Line
|
|
Heimdal
|
|
Brae
|
|
|
16.76
|
|
|
|
|
|
|
|
x
|
|
|
|
|
|
|
Kvitebjorn pipeline
|
|
Kvitebjorn
|
|
Mongstad
|
|
|
5.00
|
|
|
|
|
|
|
|
x
|
|
|
|
|
|
|
Norpipe Oil
|
|
Ekofisk Treatment center
|
|
Teeside (UK)
|
|
|
34.93
|
|
|
|
|
|
|
|
x
|
|
|
|
|
|
|
Oseberg Transport System
|
|
Oseberg, Brage and Veslefrikk
|
|
Sture
|
|
|
12.98
|
|
|
|
|
|
|
|
x
|
|
|
|
|
|
|
Sleipner East Condensate Pipe
|
|
Sleipner East
|
|
Karsto
|
|
|
10.00
|
|
|
|
|
|
|
|
x
|
|
|
|
|
|
|
Troll Oil Pipeline I and II
|
|
Troll B and C
|
|
Vestprosess (Mongstad refinery)
|
|
|
3.71
|
|
|
|
|
|
|
|
x
|
|
|
|
|
|
|
Vestprosess
|
|
Kollsnes (Area E)
|
|
Vestprosess (Mongstad refinery)
|
|
|
5.00
|
|
|
|
|
|
|
|
x
|
|
|
|
|
|
|
Polarled
|
|
Asta Hansteen/Linnorm
|
|
Nyhamna
|
|
|
5.11
|
|
|
|
|
|
|
|
|
|
|
|
x
|
|
|
The Netherlands
|
|
|
|
|
|
|
|
|
|
|
|
|
|
|
|
|
|
|
|
|
|
Nogat pipeline
|
|
F3-FB
|
|
Den Helder
|
|
|
5.00
|
|
|
|
|
|
|
|
|
|
|
|
x
|
|
|
WGT K13-Den Helder
|
|
K13A
|
|
Den Helder
|
|
|
4.66
|
|
|
|
|
|
|
|
|
|
|
|
x
|
|
|
WGT K13-Extension
|
|
Markham
|
|
K13 (via K4/K5)
|
|
|
23.00
|
|
|
|
|
|
|
|
|
|
|
|
x
|
|
|
United Kingdom
|
|
|
|
|
|
|
|
|
|
|
|
|
|
|
|
|
|
|
|
|
|
Alwyn Liquid Export Line
|
|
Alwyn North
|
|
Cormorant
|
|
|
100.00
|
|
|
|
x
|
|
|
|
x
|
|
|
|
|
|
|
Bruce Liquid Export Line
|
|
Bruce
|
|
Forties (Unity)
|
|
|
43.25
|
|
|
|
|
|
|
|
x
|
|
|
|
|
|
|
Central Graben Liquid Export Line (LEP)
|
|
Elgin-Franklin
|
|
ETAP
|
|
|
15.89
|
|
|
|
|
|
|
|
x
|
|
|
|
|
|
|
Frigg System : UK line
|
|
Alwyn North, Bruce and others
|
|
St.Fergus (Scotland)
|
|
|
100.00
|
|
|
|
x
|
|
|
|
|
|
|
|
x
|
|
|
Ninian Pipeline System
|
|
Ninian
|
|
Sullom Voe
|
|
|
16.00
|
|
|
|
|
|
|
|
x
|
|
|
|
|
|
|
Shearwater Elgin Area Line (SEAL)
|
|
Elgin-Franklin, Shearwater
|
|
Bacton
|
|
|
25.73
|
|
|
|
|
|
|
|
|
|
|
|
x
|
|
|
SEAL to Interconnector Link (SILK)
|
|
Bacton
|
|
Interconnector
|
|
|
54.66
|
|
|
|
x
|
|
|
|
|
|
|
|
x
|
|
|
AFRICA
|
|
|
|
|
|
|
|
|
|
|
|
|
|
|
|
|
|
|
|
|
|
Gabon
|
|
|
|
|
|
|
|
|
|
|
|
|
|
|
|
|
|
|
|
|
|
Mandji Pipes
|
|
Mandji fields
|
|
Cap Lopez Terminal
|
|
|
100.00
|
(a)
|
|
|
x
|
|
|
|
x
|
|
|
|
|
|
|
Rabi Pipes
|
|
Rabi fields
|
|
Cap Lopez Terminal
|
|
|
100.00
|
(a)
|
|
|
x
|
|
|
|
x
|
|
|
|
|
|
|
AMERICAS
|
|
|
|
|
|
|
|
|
|
|
|
|
|
|
|
|
|
|
|
|
|
Argentina
|
|
|
|
|
|
|
|
|
|
|
|
|
|
|
|
|
|
|
|
|
|
TGN
|
|
Network (Northern Argentina)
|
|
|
|
|
15.38
|
|
|
|
|
|
|
|
|
|
|
|
x
|
|
|
TGM
|
|
TGN
|
|
Uruguyana (Brazil)
|
|
|
32.68
|
|
|
|
|
|
|
|
|
|
|
|
x
|
|
|
Brazil
|
|
|
|
|
|
|
|
|
|
|
|
|
|
|
|
|
|
|
|
|
|
TBG
|
|
Bolivia-Brazil border
|
|
Porto Alegre via São Paulo
|
|
|
9.67
|
|
|
|
|
|
|
|
|
|
|
|
x
|
|
|
TSB
|
|
Argentina-Brazil border (TGM)
|
|
Uruguyana (Brazil)
|
|
|
25.00
|
|
|
|
|
|
|
|
|
|
|
|
x
|
|
|
|
Porto Alegre
|
|
Canoas
|
|
|
|
|
|
|
|
|
|
|
|
ASIA-PACIFIC
|
|
|
|
|
|
|
|
|
|
|
|
|
|
|
|
|
|
|
|
|
|
Australia
|
|
|
|
|
|
|
|
|
|
|
|
|
|
|
|
|
|
|
|
|
|
GLNG
|
|
Fairview, Roma, Scotia, Arcadia
|
|
GLNG (Curtis Island)
|
|
|
27.50
|
|
|
|
|
|
|
|
|
|
|
|
x
|
|
|
Myanmar
|
|
|
|
|
|
|
|
|
|
|
|
|
|
|
|
|
|
|
|
|
|
Yadana
|
|
Yadana field
|
|
Ban-I Tong (Thai border)
|
|
|
31.24
|
|
|
|
x
|
|
|
|
|
|
|
|
x
|
|
|
REST OF WORLD
|
|
|
|
|
|
|
|
|
|
|
|
|
|
|
|
|
|
|
|
|
|
BTC
|
|
Baku (Azerbaijan)
|
|
Ceyhan (Turkey, Mediterranean)
|
|
|
5.00
|
|
|
|
|
|
|
|
x
|
|
|
|
|
|
|
Dolphin
|
|
North Field (Qatar)
|
|
Tahweelah-Fujairah-Al Ain (United Arab Emirates)
|
|
|
24.50
|
|
|
|
|
|
|
|
|
|
|
|
x
|
|
|
(a)
|
Interest of Total Gabon. The Group has a financial interest of 58.28% in Total Gabon.
|
|
(1)
|
Excluding equity affiliates, except for the Yadana and Dolphin pipelines.
|
|
|
|
|
|
2015 Form 20-F TOTAL S.A.
|
|
27
|
Item 4 - B.2. Upstream Segment
The activities of Gas, formerly known as Gas & Power, have a primary objective of contributing to the growth
of the Group by ensuring sales outlets for TOTAL’s current and future natural gas production.
Beyond the production and liquefaction of natural gas
(refer to “—2.1. Exploration & Production”, above), TOTAL actively markets natural gas, which is sold either by pipeline or in the form of liquefied natural gas (LNG) and develops a downstream portfolio for its trading and
shipping activities, as well as regasification terminals.
In order to enhance the value of the Group’s gas resources, the activities of Gas also
include the trading and marketing of natural gas, LNG, liquefied petroleum gas (LPG) and electricity as well as shipping of LNG and LPG. The Group also has stakes in infrastructure companies (including regasification terminals, natural gas
transportation and storage, and power plants) necessary to implement its strategy.
|
2.2.1.
|
Purchases, sales and shipping of liquefied natural gas (LNG)
|
A pioneer in the LNG industry, TOTAL is today one of the world’s leading players
(1)
in the sector and has sound and diversified
positions both in the upstream and downstream portions of the LNG chain. LNG development is a key element of the Group’s strategy, strengthening its positions in most major production zones and markets.
Through its stakes in liquefaction plants located in Qatar, the United Arab Emirates, Oman, Nigeria, Norway, Yemen, Angola and Australia and its gas supply
agreement with the Bontang LNG plant in Indonesia, the Group markets LNG in all global markets. In 2015, the share of LNG production sold by TOTAL has decreased to 10.2 Mt, compared to 12.2 Mt in 2014 and 12.3 Mt in 2013. This reduction is connected
to the
force majeure
declared in April 2015 for the Yemen LNG joint venture due to the deterioration of security conditions. The growth of LNG production sold by TOTAL over the coming years is expected to be ensured by the Group’s
liquefaction projects under construction in Australia and Russia and by projects being studied, including a new project in Papua New Guinea and the expansion of the Nigeria LNG plant.
|
–
|
|
Long-term Group LNG purchases and sales
|
TOTAL acquires long-term LNG volumes mainly from liquefaction projects in which the Group holds an interest, including Qatargas 2 (Qatar), Yemen LNG (Yemen), Nigeria LNG (Nigeria) and Snøhvit (Norway). These
volumes support the expansion of the Group’s worldwide LNG portfolio.
Since 2009, a growing portion of the long-term volume purchased by the Group
that was initially intended for delivery to North American and European markets has been diverted to more buoyant Asian markets.
New LNG sources are expected to support the growth of the Group’s LNG portfolio, including Ichthys LNG (Australia), Yamal LNG
(2)
(Russia), trains 3 and 5 of Sabine Pass LNG (United States) and Cameron LNG (United States).
TOTAL has entered into several significant long-term agreements throughout the world for the sale of LNG from the Group’s global LNG portfolio, notably in China, Indonesia, Japan, Singapore, South Korea and
Spain.
As part of its LNG
transport activities, TOTAL uses two long-term chartered LNG tankers: since 2006, the
Arctic Lady
, with a capacity of 145,000 m³; and since 2011, the
Meridian Spirit
, with a capacity of 165,000 m³, primarily for the transport
of volumes from Snøhvit in Norway.
TOTAL continues to develop its fleet. The Group also signed a long-term charter agreement in 2013 with SK
Shipping and Marubeni for two 180,000 m³ LNG tankers. The vessels will serve to fulfill the purchase obligations of Total Gas & Power Limited, including commitments relating to the Ichthys and Sabine Pass projects. They will be among
the largest LNG tankers to navigate the Panama Canal after the canal’s expansion and are expected to be delivered in 2017.
In 2015, TOTAL continued its strategy downstream
from natural gas and LNG production by developing its trading, marketing and logistics activities. The aim of this strategy is to optimize access for the Group’s current and future production to markets supplied based on long-term contracts and
to markets open to international competition (with short-term contracts and spot sales). The Group also has operations in electricity trading and the marketing of LPG and petcoke, and is disengaging from coal trading activities.
The trading teams, which are located in London, Houston, Geneva and Singapore, conduct their business, in particular, through the Group’s wholly-owned
subsidiaries Total Gas & Power Limited, Total Gas & Power North America and Total Gas & Power Asia.
TOTAL is
pursuing gas and electricity trading operations in Europe and North America in order to sell the Group’s production, to supply its marketing subsidiaries and to support other entities of the Group.
In
Europe
, TOTAL traded 849 Bcf (24.0 Bcm) of natural gas in 2015, compared to 911 Bcf (25.8 Bcm) in 2014 and 1,194 Bcf (33.8 Bcm) in 2013. TOTAL
also traded 41.1 TWh of electricity in 2015, compared to 44.8 TWh in 2014 and 53.0 TWh in 2013, mainly from external resources.
In
North
America
, TOTAL traded 441 Bcf (12.5 Bcm) of natural gas in 2015 from its own production or from external resources, compared to 593 Bcf (16.8 Bcm) in 2014 and 938 Bcf (26.6 Bcm) in 2013.
TOTAL operates LNG trading
activities through both spot sales and long-term contracts such as those described in “— 2.2.1. Purchases, sales and shipping of liquefied natural gas (LNG)”, above. Significant sales and purchase agreements (SPAs) have permitted
appreciable development of the Group’s activities in LNG trading, especially in the more buoyant markets in Asia (China, South Korea, India and Japan). The spot and fixed-term LNG portfolio allows TOTAL to supply gas to its main customers
worldwide, while retaining a sufficient degree of flexibility to react to market opportunities.
|
|
|
|
|
28
|
|
TOTAL S.A. Form 20-F 2015
|
|
(1)
|
Company data, based on upstream and downstream LNG portfolios in 2015.
|
|
(2)
|
OAO Yamal LNG, which is developing the Yamal LNG project, is held by OAO Novatek
(60%), Total E&P Yamal (20%) and CNODC (20%), a subsidiary of of China National Petroleum Corporation. Novatek’s investment in the company OAO Yamal LNG is to be reduced to 50.1% following an agreement signed in September 2015 for the
entry of the Silk Road Fund (9.9%). This agreement is expected to be approved by the authorities in 2016. For information on international economic sanctions against Russia, refer “Item 3 — C. Risk Factors”, above.
|
Item 4 - B.2. Upstream Segment
In 2015, TOTAL purchased 64 contractual cargoes from Qatar, Yemen, Nigeria and Norway and 20 spot cargoes, compared
to, respectively, 88 and 7 in 2014 and 89 and 9 in 2013. The interruption of deliveries from Yemen LNG led to increased LNG trading activity on the spot market in 2015.
In 2015, TOTAL traded nearly
5.8 Mt of LPG (propane and butane) worldwide, compared to 5.5 Mt in 2014 and 5.6 Mt in 2013. Nearly 20% of these quantities come from fields or refineries operated by the Group. This trading activity was conducted by means of 7 time-chartered
vessels. In 2015, 292 voyages were necessary for transporting the negotiated quantities, including 196 journeys carried out by TOTAL’s time-chartered vessels and 96 journeys by spot-chartered vessels.
TOTAL has been trading
petcoke produced since 2011 by the Port Arthur refinery in the
United States
. Nearly 1.1 Mt of petcoke were sold on the international market in 2015, compared to 1.3 Mt in 2014 and 1.2 Mt in 2013.
In 2014, TOTAL began trading petcoke from the Jubail refinery in
Saudi Arabia
. In 2015, nearly 720 kt were sold, compared to 100 kt in 2014.
Petcoke has been sold to cement plants and electricity producers mainly in India, as well as in Turkey, Mexico, Brazil and other Latin American countries.
To consolidate its position throughout the value
chain and to leverage the synergies from the Group’s other activities, TOTAL has been developing the business of marketing natural gas and electricity to end users.
In
the United Kingdom
, TOTAL markets gas and electricity to the industrial and commercial segments through its subsidiary Total Gas & Power Ltd. In 2015, the volumes of gas sold was 140 Bcf (4.0
Bcm), compared to 135 Bcf (3.8 Bcm) in 2014 and 142 Bcf (4.0 Bcm) in 2013. Electricity sales were 6.0 TWh in 2015, compared to 5.3 TWh in 2014 and 4.7 TWh in 2013.
In
France
, TOTAL operates in the natural gas market through its marketing subsidiary Total Energie Gaz, the sales of which were 84 Bcf (2.4 Bcm) in 2015, compared to 95 Bcf (2.7 Bcm) in 2014 and 141 Bcf
(4.0 Bcm) in 2013. This decrease in volumes is explained by the strategic repositioning of the subsidiary on the small and medium companies market.
In
Germany
, Total Energie Gas GmbH, a marketing subsidiary of TOTAL, marketed 31 Bcf (0.9 Bcm) of gas in 2015 to industrial and commercial customers, compared to 24 Bcf (0.7 Bcm) in 2014 and 14 Bcf (0.4 Bcm) in 2013.
In 2015, the volumes of gas delivered to the industrial and commercial segments were 2 Bcf (0.1 Bcm) in
Belgium
(Total Gas & Power Belgium) and 7
Bcf (0.2 Bcm) in
the Netherlands
(Total Gas & Power Nederland B.V.), an increase with respect to 2014. These two subsidiaries started marketing gas in 2013.
In 2015, the natural gas marketing subsidiaries in France, Germany, Belgium and the Netherlands extended their activities to the marketing of electricity to industrial and commercial consumers.
In
Spain
, TOTAL markets natural gas to the industrial and commercial segments through Cepsa Gas
Comercializadora, in which it holds a 35% stake. In 2015, the volume of gas sold was 105 Bcf (3.0 Bcm), compared to 94 Bcf (2.7 Bcm) in 2014 and 101 Bcf (2.9 Bcm) in 2013.
In
Argentina
, the subsidiary Total Gas Marketing Cono Sur oversees the marketing of gas on behalf of Total Austral, the Group’s production subsidiary in Argentina.
The Group also holds stakes in the marketing companies that are associated with the LNG regasification terminals located at Altamira in
Mexico
and Hazira in
India
.
Downstream from its natural gas and LNG
production activities, TOTAL holds stakes in natural gas transport networks, natural gas storage facilities and LNG regasification terminals.
|
–
|
|
Transportation and storage of natural gas
|
The Group holds stakes in several natural gas transportation companies located in
Brazil
and
Argentina
. These companies are facing a difficult operational and financial environment in Argentina.
In
France
, Géosud (TOTAL, 56.1%) is a joint venture that holds 50% of Géométhane. Located in Manosque,
Géométhane owns and operates several natural gas storage caverns operating since 1983. Starting in April 2015, the shareholders of Géosud jointly developed a proposed sale covering 98% of the company’s shares. The closing
of this sale took place in the first quarter of 2016.
TOTAL has
entered into agreements to obtain long-term access to LNG regasifcation capacity on three continents that represent the largest consumers of natural gas: North America (United States and Mexico), Europe (France and the United Kingdom) and Asia
(India). This diversified market presence allows the Group to access new liquefaction projects by becoming a long-term buyer of a portion of the LNG produced, thereby strengthening TOTAL’s LNG supply portfolio.
In
France
, TOTAL holds a 27.5% stake in the company Fosmax and has, through its subsidiary Total Gas & Power Limited., a regasifcation capacity of
78 Bcf/y (2.25 Bcm/y). The terminal received 46 vessels in 2015, compared to 46 in 2014 and 53 in 2013.
In 2011, TOTAL acquired a 9.99% stake in
Dunkerque LNG in order to develop an LNG receiving terminal with a capacity of 459 Bcf/y (13 Bcm/y). Trade agreements have also been signed that allow TOTAL to reserve up to 2 Bcm/y of regasifcation capacity over a 20-year term. The project is
underway and commissioning of the terminal is scheduled for 2016.
In the
United Kingdom
, through its equity interest in the Qatargas 2 project,
TOTAL holds an 8.35% stake in the South Hook LNG receiving terminal with a total capacity of 742 Bcf/y (21 Bcm/y) and an equivalent access right to the regasifcation capacity. The terminal received 84 cargoes in 2015, compared to 68 in 2014 and
52 in 2013.
In
Mexico
, TOTAL has reserved 25% of the regasifcation capacity of the Altamira receiving terminal,
i.e.
, 59 Bcf/y (1.7
Bcm/y), through its 25% stake in Gas del Litoral.
|
|
|
|
|
2015 Form 20-F TOTAL S.A.
|
|
29
|
Item 4 - B.3. Refining & Chemicals Segment
In the
United States
, TOTAL has reserved a regasification capacity of approximately 353 Bcf/y (10 Bcm/y) in
the Sabine Pass terminal (Louisiana) for a 20-year period until 2029. In 2012, TOTAL and Sabine Pass Liquefaction (SPL) signed agreements allowing SPL to gradually obtain access to TOTAL’s reserved capacity. Access to 38 Bcf/y commenced in
2012, growing to 195 Bcf/y from the start-up of train 3 and plateauing at substantially all of TOTAL’s capacity from the start-up of train 5. In return, SPL will pay TOTAL a fee linked to the capacity assigned.
In
India
, TOTAL holds a 26% stake in the Hazira receiving terminal, the regasification capacity of which was increased to 244 Bcf/y (6.9 Bcm/y) in 2013.
This terminal, located in the Gujarat state, is a merchant terminal with operations that cover both LNG regasification and gas marketing. Due to the Indian market’s strong prospects for growth, a potential expansion project is under study to
increase the terminal’s capacity to 343 Bcf/y (9.7 Bcm/y).
|
2.2.5.
|
Electricity generation
|
In a context of increasing global
demand for electricity, TOTAL has developed expertise in the power generation sector, especially through cogeneration and combined-cycle power plant projects.
In
Abu Dhabi
, the Taweelah A1 gas-fired power plant, which is owned by Gulf Total Tractebel Power Company (TOTAL, 20%),
combines electricity generation and water desalination. The plant, in operation since 2003, currently has a net power generation capacity of 1,600 MW and a water desalination capacity of 385,000
m³ per day. The plant’s production is sold to Abu Dhabi Water and Electricity Company (ADWEC) as part of a long-term agreement.
In
Nigeria
, TOTAL holds a stake in the Afam VI gas-fired combined cycle power plant through its 10% interest in the Shell Petroleum Development Company (SPDC) joint venture. This plant is part of the government’s plan to develop power
generation and increase the share of natural gas production for domestic use.
In
Thailand
, TOTAL holds 28% of Eastern Power and Electric Company
Ltd which operates the Bang Bo gas-fired combined cycle power plant with a capacity of 350 MW, commissioned in 2003. Production is sold to the Electricity Generating Authority of Thailand (EGAT) under a long-term contract.
|
2.2.6.
|
Coal production and marketing
|
Following the completion of
the sale, in August 2015, of its subsidiary Total Coal South Africa, the Group ceased its coal production activities. In addition, the Group has announced the termination of its coal marketing activities in
2016.
|
3.
|
R
EFINING
& C
HEMICALS
SEGMENT
|
Refining & Chemicals is a large industrial segment
that encompasses refining, petrochemicals and specialty chemicals operations. It also includes the activities of Trading & Shipping.
|
3.1.
|
Refining & Chemicals
|
Refining & Chemicals includes the Group’s
refining, petrochemicals and specialty chemicals businesses.
|
•
|
|
the petrochemicals business includes base petrochemicals (olefins and aromatics) and polymer derivatives (polyethylene, polypropylene, polystyrene and
hydrocarbon resins); and
|
|
•
|
|
the specialty chemicals business includes elastomer processing and electroplating chemistry.
|
The volume of its Refining & Chemicals activities places TOTAL among the top ten integrated chemical producers in the world
(1)
.
Against the backdrop of rising worldwide demand for oil and petrochemicals
driven by non-OECD countries and the entry of new capacities into the market, the strategy of Refining & Chemicals, in addition to the priority given to safety and environmental protection, involves:
|
•
|
|
adapting production capacity to changes in demand in Europe by concentrating investments on large integrated platforms. The Group therefore plans to lower its
capacity by 20% in Europe by the end of 2016 in comparison with 2011;
|
|
•
|
|
consolidating industrial means of production and searching for opportunities for growth in the United States; and
|
|
•
|
|
strengthening TOTAL’s positions in Asia and the Middle East, in particular to gain access to advantaged oil and gas feedstocks and to benefit from market
growth.
|
This strategy is underpinned by an effort to differentiate through the technology used and innovation found in its products
and processes.
|
3.1.1.
|
Refining & Petrochemicals
|
TOTAL’s refining
capacity was 2,247 kb/d as of December 31, 2015, compared to 2,187 kb/d at year-end 2014 and 2,042 kb/d
at year-end 2013. TOTAL has equity stakes in 20 refineries (including 9 operated by companies of the Group), located in Europe, the United States, Africa, the Middle East and Asia.
The Refining & Chemicals segment manages refining operations located in Europe (excluding TotalErg in Italy), the United States, the
Middle East and Asia, with a capacity of 2,168 kb/d at year-end 2015 (96% of the Group’s total capacity
(2)
).
The petrochemicals businesses are located mainly in Europe, the United States, Qatar, South Korea and Saudi Arabia. Most of these sites are either adjacent to or connected by pipelines to Group refineries. As a
result, TOTAL’s petrochemical operations are integrated within its refining operations, thereby maximizing synergies.
The year 2015 saw the launch
of plans to adapt the Lindsey refinery in the United Kingdom and the La Mède refinery in France, as well as the launch of a study to invest in the Donges refinery in France. As part of its European refining and petrochemicals capacity
reduction and modernization plan, TOTAL ended steam cracking on the Carling site in France in October 2015. At the same time, the Group began to develop new polymer and specialty resin activities on the site. Finally, TOTAL continued to develop its
major investment project launched in 2013 on the Antwerp platform in Belgium.
As part of the active management of its business portfolio, TOTAL
finalized the sales of its stake in the Schwedt refinery (Germany) in November 2015 and its majority interest in the capital of the company Geosel (France) in December 2015. TOTAL completed in December 2014 the sale of its subsidiary CCP Composites
(100%), which is active in the composite resins segment, and finalized in 2013 the divestment of its Fertilizers activity (Base Chemicals) in Europe.
|
(1
)
|
Based on publicly available information, production capacities at year-end 2014.
|
|
(2
)
|
Earnings related to the refining assets in Africa, the French West Indies (up to mid-2015) and the TotalErg joint venture are reported in the results of the
Marketing & Services segment.
|
|
|
|
|
|
30
|
|
TOTAL S.A. Form 20-F 2015
|
Item 4 - B.3. Refining & Chemicals Segment
|
–
|
|
Activities by geographic area
|
Europe
TOTAL is the largest refiner in Western Europe
(1)
.
Western Europe
accounts for 76% of the Group’s refining capacity,
i.e.
, 1,699 kb/d at year-end 2015, compared to 1,736 kb/d at year-end 2014 and at year-end 2013. The decrease observed in 2015 is attributable to the sale of the Group’s stake in the Schwedt refinery in Germany.
The Group operates eight refineries in Western Europe (one in Antwerp, Belgium, five in France in Donges, Feyzin, Gonfreville, Grandpuits and La Mède, one in
Immingham in the United Kingdom and one in Leuna, Germany) and owns stakes in the Zeeland refinery in the Netherlands and the Trecate refinery in Italy through its interest in TotalErg.
The Group’s main petrochemical sites in Europe are located in Belgium, in Antwerp (steam crackers, aromatics, polyethylene) and Feluy (polyolefins, polystyrene), and in France, in Carling (polyethylene,
polystyrene), Feyzin (steam cracker, aromatics), Gonfreville (steam crackers, aromatics, styrene, polyolefins, polystyrene) and Lavéra (steam cracker, aromatics, polypropylene). Europe accounts for 49% of the Group’s petrochemicals
capacity,
i.e.
, 10,394 kt at year-end 2015, compared to 10,909 kt at year-end 2014 and 10,899 kt at year-end 2013.
|
•
|
|
In
France
, the Group continues to adapt its refining capacity and to improve its operational efficiency against the backdrop of structural decline in the
demand for petroleum products in Europe.
|
In April 2015, TOTAL announced a significant modernization plan for its
refining facilities in France, including:
|
|
–
|
|
in La Mède, a
€
200 million investment
project to transform the site and, in particular, to create the first bio-refinery in France, while stopping the treatment of crude oil at the end of 2016. The industrial transformation of La Mède will allow TOTAL to respond to the growing
demand for biofuel in Europe. Other activities, such as a logistics and storage platform, a solar energy farm, a training center and an AdBlue production plant
(2)
, will also
be developed on the site;
|
|
|
–
|
|
in Donges, a
€
400 million investment project
for the construction of intermediate feedstock desulfurization units and hydrogen production units. The program, due to be commissioned in 2019, requires the rerouting of the railroad track that currently crosses the refinery. A three-party
memorandum of intent to fund this work between the state, local authorities and TOTAL was signed at the end of 2015.
|
In 2014, the Group completed its industrial plan, launched in 2009, to reconfigure the Gonfreville refinery in Normandy by starting up a new
diesel desulfurization unit. At the end of 2014, the Group launched a project to modernize the specialties production scheme of the Normandy complex, notably including a decrease in base oil production capacity as of October 2015.
In petrochemicals, the Group announced an investment plan in 2013 for the Carling platform in Lorraine, France, to adapt its capacity and restore
its competitiveness. As part of this project, steam cracking ended in October 2015. New hydrocarbon resin and compound polypropylene production
units are in the process of being built and are expected to be commissioned in 2016.
|
•
|
|
In
Germany
, TOTAL operates the Leuna refinery (100%). In November 2015, the Group completed the sale of its stake in the Schwedt refinery (16.7%).
|
In petrochemicals, in February 2015, the Group acquired a majority stake in Polyblend, a manufacturer of polyolefin
compounds that are mainly used in the automotive industry.
|
•
|
|
In
Belgium
, the Group launched a major project in 2013 to modernize its Antwerp platform. This project consists of two parts:
|
|
|
–
|
|
the construction of new conversion units, which are expected to be completed in 2016, in response to the shift in demand towards lighter oil products with a very
low sulfur content; and
|
|
|
–
|
|
the construction of a new unit to convert part of the combustible gases recovered from the refining process into raw materials for the petrochemical units.
|
As part of this modernization plan, two of the site’s oldest production units were shut down: a steam cracker
in 2013 and a polyethylene production line in 2014.
In Feluy, TOTAL built a unit that produces latest-generation gray expandable
polystyrene for the fast-growing insulation market; the unit began production in 2014.
|
•
|
|
In the
United Kingdom
, in February 2015, TOTAL launched a plan to adapt and secure the future of its Lindsey refinery. In addition to shutting down one of
the two crude distillation units and associated units, which will reduce its capacity by 5 Mt/y, the plan aims to improve the conversion block, adapt logistics operations and simplify the refinery’s organization.
|
In 2013, TOTAL shut down its 70 kt/y polystyrene production site at Stalybridge, while continuing its commercial
activity for polymers.
North America
The Group’s main sites in North America are located in Texas, in Port Arthur (refinery, steam cracker), Bayport (polyethylene) and La Porte (polypropylene), and in Louisiana, in Carville (styrene,
polystyrene).
Located on the same site in Port Arthur, TOTAL wholly owns a 174 kb/d capacity refinery as well as a 40% stake in a condensate
splitter and a steam cracker (BASF Total Petrochemicals, BTP). The Group is working to strengthen the synergies between these two plants.
The new
pipeline connecting the Port Arthur refinery to the Sun terminal in Nederland was commissioned in 2014, facilitating access to all domestic crudes, which are priced advantageously compared to the international market. Following investments to adapt
its furnaces and the construction of a tenth ethane furnace, which was commissioned in March 2014, BTP’s cracker can now produce more than 1 Mt/year of ethylene, including more than 85% from advantaged feedstock (ethane, propane, butane). BTP
thus benefits from favorable market conditions in the United States. In addition, in September 2015, TOTAL launched detailed FEED studies for the construction of a new ethane steam cracker with an ethylene production capacity of 1 Mt/year on the
Port Arthur site, in synergy with the refinery and BTP steam cracker. The investment decision is expected to be made in 2016.
|
(1)
|
Based on publicly available information, 2014 refining capacities.
|
|
(2)
|
Fuel additive intended for road transport and designed to lower nitrogen oxide (NOx) compound emissions.
|
|
|
|
|
|
2015 Form 20-F TOTAL S.A.
|
|
31
|
Item 4 - B.3. Refining & Chemicals Segment
Asia and the Middle East
TOTAL is continuing to expand in growth areas and is developing sites in countries with favorable access to raw materials.
In
Saudi Arabia
, TOTAL has a 37.5% stake in the company, SATORP (Saudi Aramco Total Refining and Petrochemical Company), which operates the Jubail refinery. This refinery, fully operational since mid-2014,
has a capacity of 400 kb/d and is situated close to Saudi Arabia’s heavy crude oil fields. The refinery’s configuration enables it to process these heavy crudes and sell fuels and other light products that meet strict specifications and
are mainly intended for export. The refinery is also integrated with petrochemical units: a 700 kt/y paraxylene unit, a 200 kt/y propylene unit, and a 140 kt/y benzene unit.
In
China
, TOTAL holds a 22.4% stake in WEPEC, a company that operates a refinery located in Dalian.
The Group
is also active through its 200 kt/y capacity polystyrene plant in Foshan in the Guangzhou region. In September 2014, TOTAL successfully began production on a new 200 kt/y polystyrene plant in Ningbo in the Shanghai region.
Finally, TOTAL is continuing to study a project in Inner Mongolia to produce polyolefins from coal. This project, with a capacity of approximately 800 kt/y of
olefins, would use the innovative methanol-to-olefins/olefins cracking process (MTO/OCP), which the Group confirmed in 2013 on a demonstration unit in Feluy, Belgium. The environmental impact assessment was submitted for approval to the Ministry of
the Environment in 2015.
In
South Korea
, TOTAL has a 50% stake in Hanwha Total Petrochemicals Co., Ltd. (HTC), which operates a petrochemical
complex in Daesan (condensate splitter, steam cracker, styrene, paraxylene, polyolefins). To keep up with growth in Asian markets, two major construction projects were completed in 2014, thereby doubling the site’s capacity compared to 2011. A
new aromatics unit (paraxlyne, benzene) supplied by a new condensate splitter, as well as a new EVA unit were successfully started up in 2014. The site’s paraxylene production capacity increased to 1.8 Mt/y as a result of these new units.
In
Qatar
, the Group holds interests
(1)
in two
ethane-based steam crackers (Qapco, Ras Laffan Olefin Cracker (RLOC)) and four polyethylene lines (Qapco, Qatofin), including the Qatofin linear low-density polyethylene plant in Messaied with a capacity of 550 kt/y and a 300 kt/y low-density
polyethylene line operated by Qapco, which started up in 2012.
TOTAL holds a 10% stake in the Ras Laffan condensate refinery, which has a capacity of
146 kb/d. The construction project to double the refinery’s capacity started in 2014 and is expected to be completed by the end of 2016.
In
Singapore
, the Group sold its 95 kt/y capacity polystyrene production site in November 2014.
|
–
|
|
Crude oil refining capacity
|
The table below sets forth TOTAL’s crude oil refining capacity
(a)
:
|
|
|
|
|
|
|
|
|
|
|
|
|
|
|
As of December 31(kb/d)
|
|
2015
|
|
|
2014
|
|
|
2013
|
|
|
Nine refineries operated by Group companies
|
|
|
|
|
|
|
|
|
|
|
|
|
|
Normandy – Gonfreville (100%)
|
|
|
247
|
|
|
|
247
|
|
|
|
247
|
|
|
Provence-La Mède (100%)
|
|
|
153
|
|
|
|
153
|
|
|
|
153
|
|
|
Donges (100%)
|
|
|
219
|
|
|
|
219
|
|
|
|
219
|
|
|
Feyzin (100%)
|
|
|
109
|
|
|
|
109
|
|
|
|
109
|
|
|
Grandpuits (100%)
|
|
|
101
|
|
|
|
101
|
|
|
|
101
|
|
|
Antwerp (100%)
|
|
|
338
|
|
|
|
338
|
|
|
|
338
|
|
|
Leuna (100%)
|
|
|
227
|
|
|
|
227
|
|
|
|
227
|
|
|
Lindsey – Immingham (100%)
|
|
|
207
|
|
|
|
207
|
|
|
|
207
|
|
|
Port-Arthur (100%) and BTP (40%)
(b)
|
|
|
198
|
|
|
|
169
|
|
|
|
169
|
|
|
Subtotal
|
|
|
1,799
|
|
|
|
1,770
|
|
|
|
1,770
|
|
|
Other refineries in which the Group has equity stakes
(c)
|
|
|
448
|
|
|
|
417
|
|
|
|
272
|
|
|
Total
|
|
|
2,247
|
|
|
|
2,187
|
|
|
|
2,042
|
|
|
(a)
|
Capacity data based on refinery process unit stream-day capacities under normal operating conditions, less the impact of shutdown for regular repair and
maintenance activities averaged over an extended period of time.
|
|
(b)
|
The condensate splitter held by the joint venture between TOTAL 40% and BASF 60% located in Port-Arthur refinery is taken into account at end 2015.
|
|
(c)
|
TOTAL’s share in the 11 refineries in which it has equity stakes as of December 31, 2015 ranging from 10% to 55% (one each in the Netherlands,
China, Korea, Qatar, Saudi Arabia, Italy and five in Africa). In addition to the sale of its participation in the Schwedt refinery in November 2015, TOTAL completed in May 2015 the sale of its 50% stake in Société Anonyme de la
Raffinerie des Antilles (SARA) in Martinique. Moreover, the condensate splitter of Daesan in Korea is taken into account at end 2015, for a capacity of 79 kb/d (in TOTAL share of 50%).
|
The table below sets forth by product category TOTAL’s net share
(a)
of refined quantities produced at the Group’s refineries:
|
|
|
|
|
|
|
|
|
|
|
|
|
|
|
(kb/d)
|
|
2015
|
|
|
2014
|
|
|
2013
|
|
|
Gasoline
|
|
|
346
|
|
|
|
344
|
|
|
|
340
|
|
|
Aviation fuel
(b)
|
|
|
172
|
|
|
|
148
|
|
|
|
146
|
|
|
Diesel and heating oils
|
|
|
812
|
|
|
|
787
|
|
|
|
739
|
|
|
Heavy fuels
|
|
|
129
|
|
|
|
134
|
|
|
|
133
|
|
|
Other products
|
|
|
387
|
|
|
|
329
|
|
|
|
322
|
|
|
Total
|
|
|
1,846
|
|
|
|
1,742
|
|
|
|
1,680
|
|
|
(a)
|
For refineries not 100% owned by TOTAL, the production shown is TOTAL’s equity share in the site’s overall production.
|
|
(b)
|
Avgas, jet fuel and kerosene.
|
|
(1)
|
TOTAL shareholdings: Qapco (20%); Qatofin (49%); RLOC (22.5%).
|
|
|
|
|
|
32
|
|
TOTAL S.A. Form 20-F 2015
|
Item 4 - B.3. Refining & Chemicals Segment
The tables below set forth the utilization rate of the Group’s refineries:
|
|
|
|
|
|
|
|
|
|
|
|
|
|
|
On crude and other feedstock
(a)(b)
|
|
2015
|
|
|
2014
|
|
|
2013
|
|
|
France
|
|
|
81
|
%
|
|
|
77
|
%
|
|
|
78
|
%
|
|
Rest of Europe
|
|
|
94
|
%
|
|
|
88
|
%
|
|
|
87
|
%
|
|
Americas
|
|
|
115
|
%
|
|
|
106
|
%
|
|
|
100
|
%
|
|
Asia and the Middle East
|
|
|
75
|
%
|
|
|
50
|
%
|
|
|
75
|
%
|
|
Africa
|
|
|
84
|
%
|
|
|
77
|
%
|
|
|
78
|
%
|
|
Average
|
|
|
89
|
%
|
|
|
81
|
%
|
|
|
84
|
%
|
|
(a)
|
Including equity share of refineries in which the Group has a stake.
|
|
(b)
|
Crude + crackers’ feedstock/distillation capacity at the beginning of the year (2014: SATORP refinery’s capacity considered as from January 1).
|
|
|
|
|
|
|
|
|
|
|
|
|
|
|
|
On crude
(a)(b)
|
|
2015
|
|
|
2014
|
|
|
2013
|
|
|
Average
|
|
|
86
|
%
|
|
|
77
|
%
|
|
|
80
|
%
|
|
(a)
|
Including equity share of refineries in which the Group has a stake.
|
|
(b)
|
Crude/distillation capacity at the beginning of the year (2014: SATORP refinery’s capacity considered as from January 1).
|
|
–
|
|
Petrochemicals: breakdown of TOTAL’s main production capacities
|
|
|
|
|
|
|
|
|
|
|
|
|
|
|
|
|
|
|
|
|
|
|
|
|
|
|
|
|
|
2015
|
|
|
2014
|
|
|
2013
|
|
|
As of December 31
(in thousands of
tons)
|
|
Europe
|
|
|
North
America
|
|
|
Asia and
Middle East
(a)
|
|
|
Worldwide
|
|
|
Worldwide
|
|
|
Worldwide
|
|
|
Olefins
(b)
|
|
|
4,384
|
|
|
|
1,525
|
|
|
|
1,525
|
|
|
|
7,433
|
|
|
|
7,791
|
|
|
|
7,654
|
|
|
Aromatics
(c)
|
|
|
2,903
|
|
|
|
1,512
|
|
|
|
2,368
|
|
|
|
6,783
|
|
|
|
6,773
|
|
|
|
5,635
|
|
|
Polyethylene
|
|
|
1,120
|
|
|
|
445
|
|
|
|
773
|
|
|
|
2,338
|
|
|
|
2,338
|
|
|
|
2,289
|
|
|
Polypropylene
|
|
|
1,350
|
|
|
|
1,200
|
|
|
|
400
|
|
|
|
2,950
|
|
|
|
2,950
|
|
|
|
2,895
|
|
|
Polystyrene
|
|
|
637
|
|
|
|
700
|
|
|
|
408
|
|
|
|
1,745
|
|
|
|
1,805
|
|
|
|
1,530
|
|
|
Other
(d)
|
|
|
—
|
|
|
|
—
|
|
|
|
63
|
|
|
|
63
|
|
|
|
63
|
|
|
|
63
|
|
|
Total
|
|
|
10,394
|
|
|
|
5,382
|
|
|
|
5,536
|
|
|
|
21,312
|
|
|
|
21,720
|
|
|
|
20,065
|
|
|
(a)
|
Including interests in Qatar, 50% of Hanwha Total Petrochemicals Co. Ltd. and 37.5% of SATORP in Saudi Arabia.
|
|
(b)
|
Ethylene + propylene + butadiene.
|
|
(c)
|
Including monomer styrene.
|
|
(d)
|
Mainly monoethylene glycol (MEG) and cyclohexane.
|
|
–
|
|
Development of new avenues for the production of fuels and polymers
|
In addition to optimizing existing processes, TOTAL is exploring new ways to monetize carbon resources, conventional or otherwise (natural gas, biomass, waste). A number of innovative projects are being examined
that entail defining access to the resource (nature, location, supply method, transport), the nature of the molecules and target markets (fuels, lubricants, petrochemicals, specialty chemicals) and the most appropriate, efficient and
environmentally-friendly conversion processes. With regards to biomass transformation, TOTAL is involved in the following projects:
TOTAL is actively
involved in the development of activities associated with the conversion of biomass to polymers. The main area of focus is the development of the production of new molecules such as polylactic acid (PLA) and the development of drop-in solutions, by
incorporating biomass into the Group’s existing units, for example hydrotreated vegetable oil (HVO) or other hydrotreated vegetable oil co-products in a naphtha cracker.
In Europe, TOTAL produces
biofuel, namely hydrotreated vegetable oils for incorporation into diesel, and ether produced from ethanol and isobutene (ETBE) for incorporation into gasoline.
In 2015, the Group incorporated:
|
•
|
|
in gasoline, 442 kt of ethanol
(1)
at its European refineries and several depots
(2)
; and
|
|
•
|
|
in diesel, 1,771 kt of FAME
(3)
or HVO
at its European refineries and several depots
(2)
.
|
In addition, as part of the La Mède refinery transformation program announced in April 2015, the Group will construct the first bio-refinery in France in
2017. The Group intends to produce almost 500 kt/y of biofuel on this site, mainly high-quality biodiesel (HVO) but also biojet and petrochemical bio-feedstocks. This will therefore allow the La Mède plant to respond to the growing biofuel
market.
TOTAL is a member of the BioTFuel consortium, the objective of which is to develop a chain for converting lignocellulose into fungible,
sulfur-free liquid products through gasification. The construction of a pilot demonstration unit on the Dunkirk site in France was launched in September 2014.
|
3.1.2.
|
Speciality Chemicals
|
The specialty chemicals businesses
include elastomer processing (Hutchinson) and electroplating chemistry (Atotech). They primarily serve the automotive, construction, electronics, aerospace and convenience goods markets, for which marketing strategy, innovation and customer service
are key drivers. TOTAL markets specialty products in more than 60 countries and intends to develop by combining organic growth and targeted acquisitions.
|
(1)
|
Including ethanol from ETBE (ethyl-tertio-butyl-ether) and biomethanol from
bio-MTBE (methyl-tertio-butyl-ether), expressed in ethanol equivalent and biomethanol. Reference for bio content of ETBE and bio-MTBE is the EU Renewable Energy Directive.
|
|
(2)
|
Zeeland refinery included (TOTAL’s share).
|
|
(3)
|
FAME: fatty-acid-methyl-ester.
|
|
|
|
|
|
2015 Form 20-F TOTAL S.A.
|
|
33
|
Item 4 - B.3. Refining & Chemicals Segment
This development is focused on high-growth markets and the marketing of innovative products with high added value
that meet the Group’s Sustainable Development approach.
In 2015, consolidated worldwide sales of specialty chemicals activities (excluding Bostik)
totaled
€
4.8 billion ($5.4 billion), a 9% increase compared to 2014 and up 16% compared to 2013.
In February 2015, TOTAL finalized the divestment of its wholly-owned subsidiary Bostik, specialized in adhesive chemicals. In 2014, Bostik had almost 4,900
employees over 48 production sites in the world and its sales were
€
1.5 billion ($2 billion).
Hutchinson designs and supplies innovative and tailor-made solutions to automotive and aircraft manufacturers and major industries (defense, rail, energy) so that they can offer their clients a greater level of
safety and comfort. The company, one of the industry’s global leaders
(1)
, mainly develops vibration and thermal insulation systems as well as fluid management and
sealing solutions that combine performance and energy efficiency.
Hutchinson has over 87 production sites and 30,500 employees across the world to cater
to its clients.
Hutchinson’s sales were
€
3.8 billion ($4.3 billion) in 2015, up 11% compared to 2014 and 17% compared to 2013. This growth was due to outperformance on the
world’s automotive markets, especially among German and Asian manufacturers. In 2015, Hutchinson also performed well on its other markets, particularly civil aeronautics.
In addition, Hutchinson is pursuing the differentiation of its business by investing in several R&D programs that focus on material innovations and solutions that incorporate mechatronic components.
Since 2014, all Hutchinson entities that previously operated under 26 different brand names have been marketed under a unique Hutchinson brand name for greater
consistency and visibility.
Atotech is one of the world’s leading companies in the electroplating sector
(1)
. It is active in the markets for electronics (printed
circuits, semiconductors) and general surface treatments (automotive, construction, furnishing).
Atotech has 17 production sites worldwide, including
seven in Asia, six in Europe, three in North America and one in South America.
The company’s sales totaled
€
1.0 billion ($1.1 billion) in 2015, up by 4% compared to 2014 and 11% compared to 2013.
In 2015, Atotech successfully pursued its strategy to differentiate its products by offering its customers a complete package in terms
of equipment, processes, facilities design and chemical products and by developing innovative technologies that have less of an impact on the environment. This strategy relies on global coverage
provided by its technical centers located near customers.
Atotech intends to pursue its development in Asia, which already represents approximately
two-thirds of its global sales.
To strengthen its position in the electronics market, Atotech is increasing and modernizing its production capacity in
Asia with two major projects in Malaysia and China (inaugurations planned in 2016 and 2018, respectively). By relocating production as close to its markets as possible, these two projects also adhere to its cost-cutting strategy. Furthermore, the
new Atotech Development Center in India is planning to start its operations by 2017 in order to provide for a faster, more sustainable and higher-quality development of products and processes and for a more cost-effective selection of raw materials.
Trading & Shipping focuses on serving the
Group’s needs by:
|
•
|
|
selling and marketing the Group’s crude oil production;
|
|
•
|
|
providing a supply of crude oil for the Group’s refineries;
|
|
•
|
|
importing and exporting the appropriate petroleum and refined products for the Group’s refineries to be able to adjust their production to the needs of
local markets;
|
|
•
|
|
chartering appropriate ships for these activities; and
|
|
•
|
|
undertaking trading on various derivatives markets.
|
With its acquired expertise, Trading & Shipping is able to extend its scope beyond the aforementioned activities.
Trading & Shipping conducts its activities worldwide through various wholly-owned subsidiaries
(2)
established on strategically
important oil markets in Europe, Asia and North America.
In 2015, Trading benefited from
oil price volatility and the contango
(3)
situation of certain oil indexes (the opposite of the backwardation situation observed in 2014) by better optimizing positions and
arbitrage. Significant storage capacities in different parts of the world, made available through leases, contributed to the strong performance of these activities. The Group’s facilities in Houston and Singapore also contributed to the growth
of results by expanding their respective activities.
TOTAL is one of the world’s largest traders of crude oil and petroleum products on the basis
of volumes traded. The table below presents Trading’s worldwide crude oil sales and supply sources and petroleum product sales for each of the past three years. Trading of physical volumes of crude oil and petroleum products amounted to 5.2
Mb/d in 2015, compared to 4.9 Mb/d in 2014 and to 4.5 Mb/d in 2013.
|
(1)
|
Publicly available information, based on consolidated sales in 2014.
|
|
(2)
|
These subsidiaries include TOTSA Total Oil Trading S.A., Atlantic Trading & Marketing Inc., Total Trading Asia Pte, Total Trading and Marketing
Canada L.P., Total European Trading S.A.S and Chartering & Shipping Services S.A.
|
|
(3)
|
Contango is the price structure in which the prompt price of an index is lower than
the future price. For example, the difference between the Brent ICE 1
st
line and the Brent ICE 12
th
line was -$6.58/b in 2015, compared with +$1.15/b in 2014. The reverse situation is referred to as backwardation.
|
|
|
|
|
|
34
|
|
TOTAL S.A. Form 20-F 2015
|
Item 4 - B.3. Refining & Chemicals Segment
|
–
|
Trading’s crude oil sales and supply and refined products sales
(a)
|
|
|
|
|
|
|
|
|
|
|
|
|
|
|
|
(kb/d)
|
|
2015
|
|
|
2014
|
|
|
2013
|
|
|
Group’s worldwide liquids production
|
|
|
1,237
|
|
|
|
1,034
|
|
|
|
1,167
|
|
|
Purchased from Exploration & Production
|
|
|
935
|
|
|
|
791
|
|
|
|
916
|
|
|
Purchased from external suppliers
|
|
|
2,336
|
|
|
|
2,227
|
|
|
|
1,994
|
|
|
Total of Trading’s crude supply
|
|
|
3,271
|
|
|
|
3,018
|
|
|
|
2,910
|
|
|
Sales to Refining & Chemicals and Marketing & Services
segments
|
|
|
1,668
|
|
|
|
1,520
|
|
|
|
1,556
|
|
|
Sales to external customers
|
|
|
1,603
|
|
|
|
1,498
|
|
|
|
1,354
|
|
|
Total of Trading’s crude sales
|
|
|
3,271
|
|
|
|
3,018
|
|
|
|
2,910
|
|
|
Petroleum product sales by Trading
|
|
|
1,961
|
|
|
|
1,854
|
|
|
|
1,628
|
|
|
(a)
|
Including condensates.
|
Trading operates extensively on physical and derivatives markets, both organized and over the counter. In connection
with its trading activities, TOTAL, like most other oil companies, uses derivative energy instruments (futures, forwards, swaps and options) with the aim of adjusting its exposure to fluctuations in the price of crude oil and petroleum products.
These transactions are entered into with various counterparties.
For additional information concerning derivatives transactions by Trading &
Shipping, see Notes 30 (Financial instruments related to commodity contracts) and 31 (Market risks) to the Consolidated Financial Statements.
All of
TOTAL’s Trading activities are subject to strict internal controls and trading limits.
The transportation of crude oil and petroleum
products necessary for the activities of the Group is coordinated by Shipping. These
requirements are fulfilled through balanced use of the spot and time-charter markets. The additional transport capacity can also be used to transport third-party cargo. Shipping maintains a
rigorous safety policy, mainly through a strict selection of chartered vessels.
In 2015, Shipping chartered approximately 2,900 voyages (relatively
constant compared to 2014 and 2013) to transport 126 Mt of crude oil and petroleum products, compared to 122 Mt in 2014 and 115 Mt in 2013. On December 31, 2015, the mid- and long-term chartered fleet amounted to 55 vessels (including
7 LPG vessels), compared to 48 in 2014 and 46 in 2013. None of these vessels are single-hulled and the average age of the fleet is approximately five years.
Like a certain number of other oil companies and ship owners, the Group uses freight rate derivative contracts to adjust Shipping’s exposure to freight rate fluctuations.
|
|
|
|
|
2015 Form 20-F TOTAL S.A.
|
|
35
|
Item 4 - B.4. Marketing & Services Segment
|
4.
|
M
ARKETING
& S
ERVICES
SEGMENT
|
The Marketing & Services segment includes
worldwide supply and marketing activities in the oil products and services field as well as the activity of New Energies.
|
4.1.
|
Marketing & Services
|
The Marketing & Services (M&S) business segment is dedicated to the development of
TOTAL’s oil products distribution activities and related services throughout the world. Present in more than 150 countries
(1)
, M&S conveys TOTAL’s brand image
to its customers, both private and professional. The brand’s renown, underpinned by large-scale advertising campaigns, substantial R&D spending and an ambitious digital transformation plan all contribute to building its highly visible,
innovative and assertive lineup of commercial solutions for its customers.
M&S pursues a proactive, primarily organic,
development strategy. M&S aims to consolidate its market share in its six key markets
(2)
in Western Europe, where it has reached critical mass and is one of the main
distributors of oil products
(3)
. M&S continues to develop its activities in high-growth areas, particularly in Africa where it is the leading distributor
(4)
. In 2015, organic investments to the order of $1.1 billion mainly involved the development of retail networks, in particular in Africa.
In 2014 and 2015, M&S disposed of assets to optimize its position in Europe (sales of the liquefied petroleum gas (LPG) marketing subsidiaries in France and
Hungary, the LPG/commercial sales activity in Switzerland, and its stakes in the Société Anonyme de la Raffinerie des Antilles and the Société Réunionnaise de Produits Pétroliers). In Turkey, M&S
initiated in 2015 the sale of its retail network. At the same time, M&S is making targeted acquisitions in high-growth countries, such as Pakistan, Vietnam, the Dominican Republic, South Africa, Tunisia and Egypt.
M&S’s three main areas of activity are:
|
•
|
|
Retail
, with a network of slightly more than 16,000 service stations. The Group is focusing on six key markets in Western Europe and continues to develop
in Africa, where it is already present in more than 40 countries. In addition to the sale of high-performance fuels and oil products, it is able to capture new customers and build customer loyalty by diversifying its
|
|
|
|
offer in its stores and service stations (
e.g.
, car wash, catering, car servicing) through partnerships with leading brands. The aim of these new offers is to transform service stations
into living places where motorists enjoy stopping by. In 2015, the network increased its sales by 6% compared to 2014.
|
|
•
|
|
The production and sales of
lubricants
, a highly profitable sector that accounts for almost one third of M&S’s results
(5)
, and in which TOTAL intends to pursue its growth dynamic. M&S has entered commercial and technological partnerships with numerous carmakers. In recent years, contracts
with partners and industrial manufacturers in Europe and Asia have completed its long-standing partnerships with French carmakers. Furthermore, M&S will become supplier of first fill oils for BMW’s gasoline engines in its European
production plants. With 41 blending plants, including the plant in Singapore commissioned in 2015, and its research investments, M&S is able to supply quality lubricants to its customers worldwide. In 2015, sales of lubricants increased by 3%
compared to 2014.
|
|
•
|
|
The distribution of products and services for
professional markets
. TOTAL is a partner of choice and a local supplier of products (mainly aviation fuel,
special fluids, LPG, bitumens, heavy fuels and marine bunkers) and helps its customers to manage all their energy needs with solutions such as the maintenance of oil facilities and the optimization of consumption.
|
M&S holds interests in five refineries in Africa and one in Europe through its 49% stake in TotalErg.
To meet its customers’ current and future needs, M&S has increased its efforts in R&D by 24% since 2013 to design and develop new product ranges, in particular for the engine technologies of the
future.
|
4.1.1.
|
Sales of petroleum products
|
The
following table presents M&S petroleum products sales
(6)
by geographic area:
|
|
|
|
|
|
|
|
|
|
|
|
|
|
|
(kb/d)
|
|
2015
|
|
|
2014
|
|
|
2013
|
|
|
Europe
|
|
|
1,092
|
|
|
|
1,100
|
|
|
|
1,139
|
|
|
France
|
|
|
541
|
|
|
|
547
|
|
|
|
575
|
|
|
Europe, excluding France
|
|
|
551
|
|
|
|
553
|
|
|
|
564
|
|
|
Africa
|
|
|
423
|
|
|
|
380
|
|
|
|
326
|
|
|
Middle East
|
|
|
85
|
|
|
|
77
|
|
|
|
54
|
|
|
Asia-Pacific
(a)
|
|
|
148
|
|
|
|
134
|
|
|
|
144
|
|
|
Americas
|
|
|
70
|
|
|
|
78
|
|
|
|
86
|
|
|
(a)
|
Including Indian Ocean islands.
|
For data on biofuels, refer to “— 3.1.1. Refining & Petrochemicals — Development of new avenues for the production of fuels and
polymers”, above.
|
(1)
|
Including via national distributors.
|
|
(2)
|
France, Germany, Belgium, Luxembourg, the Netherlands and Italy.
|
|
(3)
|
Publicly available information, based on quantities sold in 2014.
|
|
(4)
|
PFC Energy and Company data 2014.
|
|
(5)
|
Adjusted net operating income of M&S, excluding New Energies.
|
|
(6)
|
In addition to M&S’s petroleum product sales, the Group’s sales also include international Trading (1,538 kb/d in 2015, 1,385 kb/d in 2014 and
1,155 kb/d in 2013) and bulk refining sales (649 kb/d in 2015, 615 kb/d in 2014 and 617 kb/d in 2013).
|
|
|
|
|
|
36
|
|
TOTAL S.A. Form 20-F 2015
|
Item 4 - B.4. Marketing & Services Segment
The table below presents the geographical
distribution of the Group’s service stations:
|
|
|
|
|
|
|
|
|
|
|
|
|
|
|
As of December 31,
|
|
2015
|
|
|
2014
|
|
|
2013
|
|
|
Europe
(a)
|
|
|
8,391
|
|
|
|
8,557
|
|
|
|
8,875
|
|
|
of which France
(b)
|
|
|
3,667
|
|
|
|
3,727
|
|
|
|
3,813
|
|
|
of which TotalErg
|
|
|
2,608
|
|
|
|
2,749
|
|
|
|
3,017
|
|
|
Africa
|
|
|
4,058
|
|
|
|
3,991
|
|
|
|
3,726
|
|
|
Middle East
|
|
|
816
|
|
|
|
796
|
|
|
|
770
|
|
|
Asia-Pacific
(c)
|
|
|
1,531
|
|
|
|
1,033
|
|
|
|
1,011
|
|
|
Americas
|
|
|
464
|
|
|
|
452
|
|
|
|
438
|
|
|
AS24 network (dedicated to heavy duty vehicles)
|
|
|
763
|
|
|
|
740
|
|
|
|
731
|
|
|
Total
|
|
|
16,023
|
|
|
|
15,569
|
|
|
|
15,551
|
|
|
(a)
|
Excluding AS24 network.
|
|
(b)
|
TOTAL, Total Access, Elf and Elan-branded service stations.
|
|
(c)
|
Including Indian Ocean islands.
|
|
4.1.3.
|
Main activities by geographic area
|
In Western Europe, the
Group continues to optimize its marketing activities in its six main markets. It has a retail network of nearly 8,400 service stations
(1)
throughout France, Belgium, the
Netherlands, Luxembourg, Germany and Italy. TOTAL is regaining market shares in Western Europe by developing an innovative and diversified line of products and services.
|
•
|
|
In
France
, the dense retail network includes more than 1,530 TOTAL-branded service stations, 670 Total Access stations (service station concept combining
low prices and premium TOTAL-branded fuels and services) and more than 1,300 Elan service stations, which are mainly located in rural areas. Since its launch in 2011, Total Access has led to the Group regaining nearly 3%
(2)
market share. Developing the range of services in its service stations is one of M&S’s strategic priorities. In France, where new offers and services have been
developed for vehicle maintenance, catering and stores, the share of non-oil activities of the network’s income is increasing and already stands at 30%.
|
In addition, TOTAL promotes a large fuel and service offering to 112,000 customer vehicle fleets. Fuel sales to consumers (B2C) reach more than
one million customers.
TOTAL holds stakes in 28 depots in France, 7 of which are operated by Group companies.
|
•
|
|
In
Germany
, TOTAL is the country’s fourth largest operator
(3)
and
continues to expand its network. With about 1,180 service stations at year-end 2015, the Group has gained 1% in market share in two years.
|
|
•
|
|
In
Italy
, TOTAL holds a 49% stake in TotalErg, which is the country’s fourth largest operator with more than 2,600 service stations
(3)
.
|
To distribute its specialty products, the Group benefits
from an extensive network in Europe and relies on numerous industrial facilities to produce lubricants (mainly Rouen in France and Ertvelde in Belgium), special fluids (Oudalle in France) and bitumen (Brunsbüttel in Germany).
TOTAL is pursuing its development in high-growth segments throughout Europe, and in particular in lubricants and
specialty bitumens on the growing markets in Eastern Europe.
TOTAL is also a major player in the market for fuel-payment cards, with nearly
3.3 million cards issued. With the AS24 card, TOTAL has a dedicated offering for the heavy-duty vehicles segment in 27 European countries. Bolstered by a network of more than 760 service stations, AS24 is expected to continue to grow
primarily through expansion in the Mediterranean basin and Eastern Europe and through its toll payment card service, which covers nearly 20 countries.
|
–
|
Africa & the Middle East
|
TOTAL is the leading marketer of petroleum products in Africa and in certain countries in the Middle East, with a 16%
(4)
average market share in 2015, compared with 13% in 2013. In these regions, it is pursuing a strategy of profitable growth in all its operations.
As part of its dynamic asset management policy and after considering that it would be difficult to reach a sufficient market share in Turkey to achieve the expected
level of profitability, TOTAL initiated in 2015 the disposal of its network of 450 service stations.
On high-growth markets, the Group continues its
development strategy for its retail network, which grew from approximately 4,400 service stations in 2012, to almost 5,000 in 2015, spread across more than 40 countries. The Group operates major networks in South Africa, Nigeria, Egypt and Morocco.
In
Egypt
, TOTAL acquired the service station network and commercial sales activities of Shell and Chevron in 2013. The
incorporation of these entities enabled the Group to increase its size three-fold and to become the second private operator in Africa’s largest market, with a 14% network market share
(3)
.
Overall, M&S continues to gain market share in the countries where it
operates in Africa and the Middle East. On the one hand, M&S has acquired independent petroleum networks in certain countries or is expanding its specialty products portfolio, as illustrated by the acquisition of an LPG activity in Tunisia, and
on
|
(1)
|
Excluding AS24 network.
|
|
(4)
|
Market share in the countries where the Group operates, based on 2014 publicly available information on quantities sold.
|
|
|
|
|
|
2015 Form 20-F TOTAL S.A.
|
|
37
|
Item 4 - B.4. Marketing & Services Segment
the other hand, M&S is deploying a range of innovative products and services through partnerships in catering and
stores, as well as in digital solutions. The retail networks in some 20 countries now offer customers to use their smartphones for money transfer services and payments by smartphone are accepted in the service stations of approximately 10 countries.
To strengthen its local presence, M&S began a process of opening up the share capital of select subsidiaries to regional investors, particularly in
Morocco and Senegal in 2015. The opening up of the capital resulted in the listing of these two entities, respectively, on the Abidjan stock exchange in February and the Casablanca stock exchange in May.
TOTAL is pursuing a strategy for growth in specialty products markets in Africa and the Middle East. M&S, which relies in particular on lubricants blending
plants in Dubai and Egypt, started up a new plant of this type in Saudi Arabia in 2013.
Moreover, TOTAL acts as a leading partner for mining customers
in Africa by delivering complete supply chain and management solutions for fuels and lubricants.
Finally, TOTAL continued to develop its Awango by Total
solar solutions, expanding this line to 10 new countries in Africa and the Middle East in 2015 (for additional information, refer to
“— E.
Other
Matters —
4.3.4.5. Giving the most disadvantaged populations greater access to energy”, below.
At year-end 2015, TOTAL was present in
more than 20 countries in the Asia-Pacific region and continues to strengthen its position in the distribution of fuels and specialty products.
TOTAL
operates service station networks in China, Pakistan, the Philippines, Cambodia and Indonesia, and is a significant player in the Pacific islands. The Group network continued to expand, and reached nearly 1,400 service stations at year-end 2015, an
increase of nearly 550 compared to 2014.
|
•
|
|
In
Pakistan
, TOTAL, with its local partner PARCO, completed the acquisition of Chevron’s distribution network in 2015. This acquisition will expand
TOTAL’s network by 500 service stations and strengthen the Group’s distribution and logistics capacities in Pakistan.
|
|
•
|
|
In the
Philippines
, TOTAL is pursuing its development, with the goal of doubling its retail network market share.
|
|
•
|
|
In
China
, the Group was operating more than 200 service stations at year-end 2015 through two joint ventures with Sinochem and a wholly-owned subsidiary.
|
TOTAL’s share of the inland
lubricant
(1)
market reached 3.4% in 2015 in this region. One of the Group’s largest lubricant production plants started up in mid-2015 in
Singapore
in order to
support M&S’s ambitions for growth in the region. It boasts a capacity of 310 kt/year. In China, a third lubricant production plant with a capacity of 200 kt/year was inaugurated in Tainjin in 2013. TOTAL continues to strengthen its
presence on the specialties market in the region, in particular in
Vietnam
, where the Group became number two
(2)
on the LPG market in 2015 following an acquisition,
and in India, with the extension of its LPG distribution to 55 stations.
In the
Americas
, TOTAL is active
directly in more than 20 countries and indirectly (via distributors) in approximately 20 additional countries. TOTAL operates a large number of
industrial units in these countries including, in particular, the production of lubricants and the storage and bottling of LPG. In addition, the Group has opened new distribution subsidiaries in
Peru and the Dominican Republic, in 2013 and 2014, respectively.
In the
Caribbean
, the Group operates on several islands with more than 450
service stations at year-end 2015. In January 2016, TOTAL strengthened its position with the acquisition of a majority stake of 70% in the fuel marketing leader in the Dominican Republic, which operates a network of 130 service stations, commercial
sales and lubricants activities.
In
Latin America
, TOTAL continues to pursue its growth strategy for specialty products (primarily lubricants and
special fluids).
In the
United States
and
Canada
, TOTAL mainly markets specialty products, particularly lubricants, jet fuels and special
fluids. To strengthen its special fluids business, the Group is constructing a special fluids production plant near Houston, Texas, which is expected to be operational in 2016.
|
4.1.4.
|
Products and services developments
|
The Group develops
technologically advanced products, some of which are formulated for use in motor sports before being generally released on the market. In 2015, TOTAL continued its technical partnerships, in particular with Renault Sport F1 (Formula 1) and the
PSA Peugeot Citroën group (WRC, WTCC and Rallycross). These partnerships demonstrate TOTAL’s technical excellence in the formulation of fuels and lubricants under extreme conditions and subject to requirements to reduce fuel consumption.
At year-end 2014, TOTAL and Renault renewed their global partnership for the next five years in the areas of R&D, business relations with Renault after-sales networks and Formula 1.
In order to respond to developments in world markets and prepare tomorrow’s growth opportunities, TOTAL develops solutions in collaboration with its customers that optimize their energy bills such as the Total
Ecosolutions product and service label (refer to “— E. Other Matters — 4.2.3.4. Energy efficiency and ecoperformance”, below). These solutions integrate a diversified range of energy supplies (fuels, gas,
photovoltaics and wood pellets) as well as consumption auditing, monitoring and management services. In the realm of consumption management, TOTAL draws on the know-how of its Tenag joint venture in Germany (49% owned) and its 2014 acquisition BHC
Energy in France, both of which specialize in energy efficiency.
Looking beyond energy services, TOTAL also relies on digital innovations to develop new
offers for its customers, such as money transfers and payment by smartphone in Africa, or online domestic heating oil orders in France. Total’s mobile application “Total Services” has been deployed in 42 countries. For its
professional customers, M&S has launched Bitume Online in France, a platform that offers bitumens at fixed rates, and a portal for lubricant distributors deployed in 20 countries, among others. In addition to the offers designed by TOTAL,
M&S also supports innovative start-ups in order to encourage the development of new business models and to test the commercial and economic worth of innovative services.
In the longer term, TOTAL also supports the development of alternatives to traditional fuels:
|
•
|
|
Gas for transport
, a segment in which M&S intends to grow: TOTAL has approximately 400 stations that deliver compressed natural gas in Asia, Africa
and Europe. In 2015, TOTAL opened its first liquefied natural gas (LNG) station for
|
|
(1)
|
For non-maritime transportation and industrial applications.
|
|
|
|
|
|
38
|
|
TOTAL S.A. Form 20-F 2015
|
Item 4 - B.4. Marketing & Services Segment
|
|
|
heavy duty vehicles in the port of Antwerp (Kallo) in Belgium, and its European subsidiaries are keeping an active watch on the potential of LNG as a fuel.
|
|
•
|
|
Hydrogen
: through its Clean Energy Partnership (CEP) in Germany, TOTAL is contributing to the development of a network of hydrogen stations, with the
target of opening 50 stations by the end of 2016. In addition, with its partners Air Liquide, Daimler, Linde, OMV and Shell, TOTAL created in 2015 the “H2 Mobility Germany” joint venture, which aims to deploy some 400 hydrogen
stations in Germany, with more than 250,000 fuel cell vehicles forecasted by 2023.
|
|
•
|
|
Electro-mobility
: The development and demonstration of the distribution of electricity intended for electric vehicles continued in 2015 in TOTAL’s
European subsidiaries. TOTAL has approximately 20 prototype electric vehicle refueling stations in the Netherlands, Belgium, Luxembourg and Germany. A partnership with Sodetrel (EDF) resulted in the installation of 10 fast charging stations in
motorway service stations in France in 2015. Industrial partnership projects in France, Benelux and Germany are expected to allow for the installation of 110 additional fast charging stations in 2016.
|
The Group, in addition to its activities in hydrocarbons, is active in the development of renewable energies to build a diversified energy mix
while generating lower CO
2
emissions as a response to the challenge of climate change. To develop robust and profitable New Energies activities, the Group focuses on the
following two themes:
|
•
|
|
solar energy, a high-growth market in which the Group is positioned among the leaders through SunPower; and
|
|
•
|
|
the transformation of biomass through biotechnology, a second theme of development over a longer term, which aims to develop new biosourced product solutions for
transportation and chemicals.
|
TOTAL actively follows developments in other renewable energies. In this context, the Group owns a farm
of four wind turbines (10 MW near Dunkirk, France) and a stake in marine energy (9.99% in the company Scotrenewables Tidal Power, Scotland).
The
Group expects to dedicate to New Energies an annual investment budget of approximately $500 million for the coming years.
TOTAL is mainly present in the photovoltaic
sector based on crystalline silicon technology through SunPower, in which the Group acquired a majority stake in 2011. The Group is also pursuing R&D investments in this field through several industrial and academic partnerships.
The steady reduction in photovoltaic electricity costs is increasing solar competitiveness in an ever-growing number of markets, in solar farms and residential and
commercial applications.
TOTAL holds 57.48% of SunPower as of
December 31, 2015, an American company listed on NASDAQ and based in California. As an integrated player, SunPower operates over the entire solar power value chain. On the one hand, it designs, manufactures and supplies cells as well as the
highest-efficiency crystalline silicon-based solar panels on the market. On the other hand, SunPower is active in the design and construction of large turnkey power plants
and in the marketing of integrated solar solutions for decentralized electricity generation.
Upstream, SunPower manufactures all of its cells in Asia (Philippines, Malaysia) and has a total production capacity of 1,360 MW/y. Through its significant
R&D program, the company is constantly optimizing its production process to reduce costs while maintaining its technological leadership. The cells are assembled into modules, or solar panels, in plants located in Asia, the United States, Mexico,
Europe and South Africa. A 350 MW/y expansion in capacity was approved at the end of 2013 for a production start-up in 2016.
To expand its product
offering, SunPower launched at year-end 2015 a module to target the most competitive market sectors while continuing to hold a technical edge over its competitors.
Downstream, SunPower markets its panels worldwide for applications ranging from residential and commercial roof tiles to large solar power plants. As of December 31, 2015, SunPower holds a 40.7% stake in the
company 8point3 Energy Partners, initially set up with First Solar. 8point3 Energy Partners, the purpose of which is to acquire and operate solar projects and to redistribute financial flows to its shareholders in the form of a dividend, was listed
on NASDAQ in June 2015. Additionally, SunPower completed in 2015 the construction in the United States of the largest solar farm in the world, Solar Star (709 MWc), and the Quinto farm (135 MWc). SunPower continued to expand internationally
with the commissioning in Chile of the El Salvador plant (70 MWc) and the starting of construction in South Africa of the Prieska solar power plant (86 MWc).
SunPower is pursuing its development in residential and commercial markets, in particular in the United States, by increasing its service offerings for solar power production, management and financing. SunPower is
also developing its Smart Energy activity to permit its residential customers to optimize their power consumption. In 2015, SunPower signed several agreements with companies developing solutions in the field of consumption and storage management.
The Group holds a 20% stake in the
solar power plant Shams 1, commissioned in 2013 in Abu Dhabi. With 109 MW of parabolic concentrated solar power, Shams 1 is the largest thermal parabolic concentrated solar power plant in the Middle East.
In line with its CSR approach, the Group continues to install solar solutions through its decentralized rural electrification projects in several countries,
especially in South Africa via KES (Kwazulu Energy Services Company), in which TOTAL holds a 35% stake.
In order to strengthen its
technological leadership in the crystalline silicon value chain, and in addition to its cooperation with SunPower in the R&D field, New Energies partners with leading laboratories and international research institutes. This work consists of
developing and optimizing the photovoltaic solar power chain (from the silicon to the system passing through the wafers, cells and modules) reducing production costs and increasing the efficiency and reliability of the components. The Group is also
strengthening its expertise in solar resource evaluation and prediction.
Additionally, downstream, TOTAL is continuing its research efforts on new
generations of energy management, control and storage systems for residential applications in order to differentiate
|
|
|
|
|
2015 Form 20-F TOTAL S.A.
|
|
39
|
Item 4 - C. Property, Plant & Equipment
SunPower’s offer on the electric market and to lower the cost of energy consumed.
|
4.2.2.
|
Biotechnologies and the conversion of biomass
|
TOTAL is
exploring a number of opportunities for developing biomass depending on its nature, accessibility and sustainability. The objective is to sell high-performance molecules in targeted markets (
e.g.
, fuel, lubricants, special polymers,
chemicals). The Group is focused on the biochemical conversion process of this biomass.
As of December 31, 2015, TOTAL holds 31.52% of Amyris, Inc., an
American company listed on NASDAQ that was the Group’s first significant equity investment in biotechnologies. Amyris has a plant in Brazil (in production since 2013) that converts 30 million liters of sugarcane juice into molecules of interest
for perfumes and cosmetics as well as farnesene, a molecule of interest for a number of chemical or downstream oil markets, including specialty products and fuels (diesel or jet). Biosourced jet fuel produced
from farnesene received the certification required in 2014 to be sold worldwide to airlines, and proved its technical performance through its use on commercial flights, especially with Air France
and KLM. Large-scale deployment will take several years, given the cost reduction effort required to make the molecule competitive with fossil jet fuel. TOTAL and Amyris continue their collaboration agreement covering the setting up of a common
R&D team for bio-sourced molecules
(
1)
.
In addition, the Group participates in R&D collaborations with other partners to develop technologies complementary to those of Amyris: the
deconstruction of lignocellulose, synthetic biology and metabolism engineering, especially through partnerships with Joint BioEnergy Institute and Novogy (TOTAL 100%, United States), the University of Wageningen (Netherlands) and the Toulouse White
Biotechnology Consortium (France).
The Group is also studying the longer-term potential for developing a cost-effective phototrophic process for
producing biomolecules through microalgae bioengineering.
C. PROPERTY, PLANT & EQUIPMENT
The companies of the Group have freehold and leasehold interests in over 130 countries throughout the world, none of
which inidividually is material to TOTAL. Operations in properties, oil and gas fields or any other industrial, commercial or administrative facility, as well as the production capacities and utilization rates of these facilities, are described in
“— B. Business Overview”, above, for each business segment (Upstream, Refining & Chemicals and Marketing & Services).
A summary of the Group’s property, plant and equipment and their main related expenses (depreciation and
impairment) is included in Note 11 to the Consolidated Financial Statements.
Minimum royalties from finance lease agreements regarding properties,
service stations, vessels and other equipment are presented in Note 22 to the Consolidated Financial Statements.
Information about the objectives of the
Company’s environmental policy, in particular those related to the Group’s industrial sites or facilities, is presented in “— E. Other Matters — 4. Social and environmental matters”, below.
|
(1)
|
For information on the plan to convert the La Mède refinery to a bio-refinery, refer to “— 3.1.1. Refining &
Petrochemicals”, above.
|
|
|
|
|
|
40
|
|
TOTAL S.A. Form 20-F 2015
|
Item 4 - D. Organizational Structure
D. ORGANIZATIONAL STRUCTURE
|
–
|
Position of the Company within the Group
|
TOTAL S.A.
is the Group’s parent company.
The Group’s businesses are organized as indicated on the chart in “— Organization chart as of
December 31, 2015”, below. The Group’s business segments receive assistance from the corporate functional divisions grouped within TOTAL S.A.
A list of the major subsidiaries
directly or indirectly held by the Company included in TOTAL S.A.’s scope of consolidation is presented in Note 35 to the Consolidated Financial Statements.
As of December 31, 2015, there were 882 consolidated companies, of which 789 were fully consolidated and 93 were accounted for under the equity method. The principles of consolidation are described in Note 1.A to
the Consolidated Financial Statements.
The decision of TOTAL S.A.’s subsidiaries to declare dividends is made by their relevant shareholders’
meetings and is subject to the provisions of applicable local laws and regulations. As of December 31, 2015, there is no restriction under such provisions
that would materially restrict the distribution to TOTAL S.A. of the dividends declared by those subsidiaries.
During fiscal year 2015, TOTAL S.A. neither acquired any stakes in companies with registered offices in France representing more than one twentieth, one tenth, one fifth, one third or one half of the capital of
these companies, nor took control of any such companies.
|
–
|
Group interests in publicly-traded companies
|
TOTAL holds stakes in a limited number of companies that issue publicly-traded financial instruments in France or abroad. These companies are mainly the Group’s financing vehicles (Total Capital, Total Capital
Canada Ltd., Total Capital International) or the operational subsidiaries in its business segments, in particular in Africa, such as Total Gabon
(1)
.
TOTAL also holds a majority stake in SunPower (57.48% on December 31, 2015), an American company listed on NASDAQ, and minority interests in other companies,
including OAO Novatek (18.9% on December 31, 2015), a Russian company listed on the Moscow Interbank Currency Exchange and the London Stock Exchange.
|
|
|
|
|
2015 Form 20-F TOTAL S.A.
|
|
41
|
|
(1)
|
Total Gabon is a company under Gabonese law listed on Euronext Paris. TOTAL holds 58.28%, the Republic of Gabon holds 25% and the public float is 16.72%.
|
Item 4 - D. Organizational Structure
|
–
|
Organization chart as of December 31, 2015
|
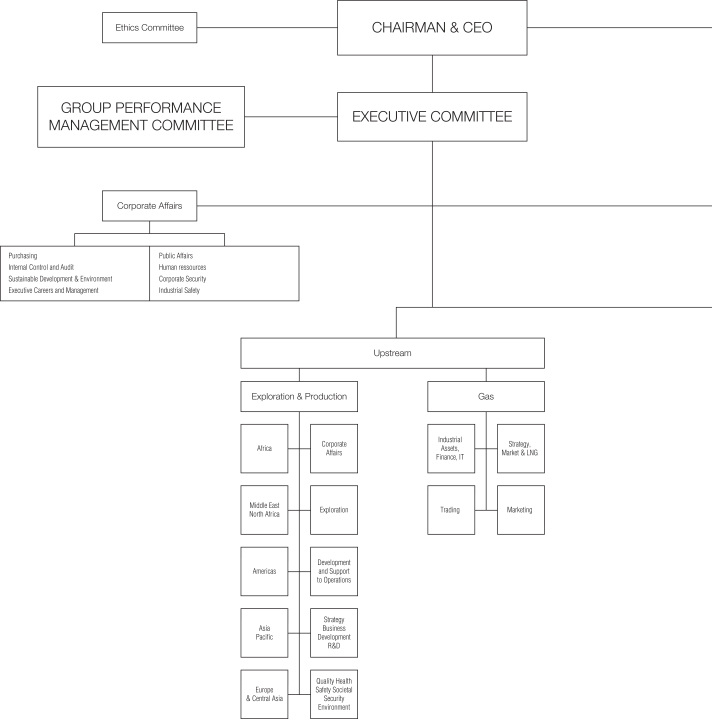
|
|
|
|
|
42
|
|
TOTAL S.A. Form 20-F 2015
|
Item 4 - D. Organizational Structure
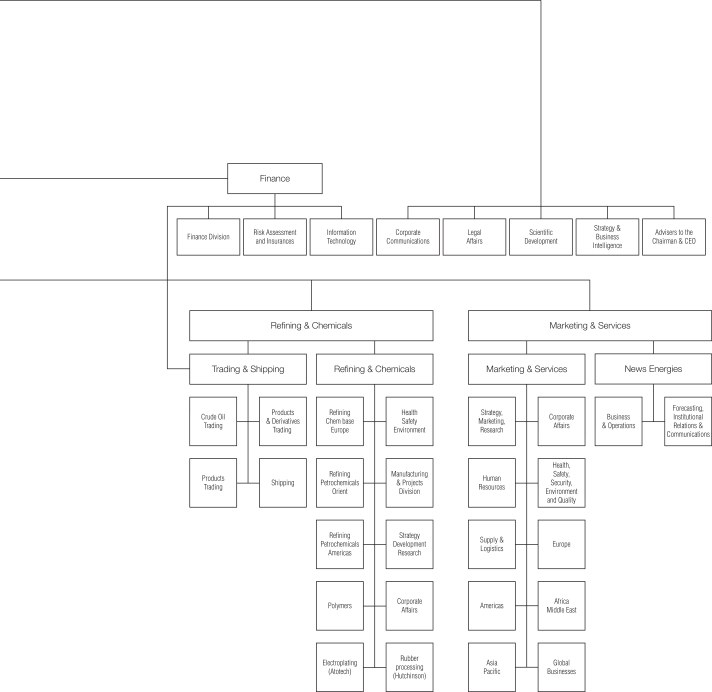
|
|
|
|
|
2015 Form 20-F TOTAL S.A.
|
|
43
|
Item 4 - E. Other Matters - 1. Investments
E. OTHER MATTERS
Various factors, including certain events or circumstances
discussed below, have affected or may affect TOTAL’s business and results.
|
1.1
|
Major investments over the 2013-2015 period
(1)
|
|
|
|
|
|
|
|
|
|
|
|
|
|
|
|
Gross investments
(a)
(M$)
|
|
2015
|
|
|
2014
|
|
|
2013
|
|
|
Upstream
|
|
|
24,270
|
|
|
|
26,520
|
|
|
|
29,750
|
|
|
Refining & Chemicals
|
|
|
1,843
|
|
|
|
2,022
|
|
|
|
2,708
|
|
|
Marketing & Services
|
|
|
1,841
|
|
|
|
1,818
|
|
|
|
1,814
|
|
|
Corporate
|
|
|
79
|
|
|
|
149
|
|
|
|
159
|
|
|
Total
|
|
|
28,033
|
|
|
|
30,509
|
|
|
|
34,431
|
|
|
|
|
|
|
|
|
|
|
|
|
|
|
|
|
Net investments
(b)
(M$)
|
|
2015
|
|
|
2014
|
|
|
2013
|
|
|
Upstream
|
|
|
21,055
|
|
|
|
20,756
|
|
|
|
21,866
|
|
|
Refining & Chemicals
|
|
|
(1,645
|
)
|
|
|
1,830
|
|
|
|
2,346
|
|
|
Marketing & Services
|
|
|
896
|
|
|
|
1,476
|
|
|
|
1,570
|
|
|
Corporate
|
|
|
54
|
|
|
|
78
|
|
|
|
97
|
|
|
Total
|
|
|
20,360
|
|
|
|
24,140
|
|
|
|
25,879
|
|
|
|
|
|
|
|
|
|
|
|
|
|
|
|
|
(M$)
|
|
2015
|
|
|
2014
|
|
|
2013
|
|
|
Acquisitions
|
|
|
3,441
|
|
|
|
2,539
|
|
|
|
4,473
|
|
|
Divestments
|
|
|
5,968
|
|
|
|
4,650
|
|
|
|
4,750
|
|
|
Other operations with non-controlling interests
|
|
|
89
|
|
|
|
179
|
|
|
|
2,153
|
|
|
|
|
|
|
|
|
|
|
|
|
|
|
|
|
Organic investments
(c)
(M$)
|
|
2015
|
|
|
2014
|
|
|
2013
|
|
|
Upstream
|
|
|
20,508
|
|
|
|
22,959
|
|
|
|
24,102
|
|
|
Refining & Chemicals
|
|
|
827
|
|
|
|
1,944
|
|
|
|
2,530
|
|
|
Marketing & Services
|
|
|
1,569
|
|
|
|
1,424
|
|
|
|
1,579
|
|
|
Corporate
|
|
|
72
|
|
|
|
104
|
|
|
|
97
|
|
|
Total
|
|
|
22,976
|
|
|
|
26,430
|
|
|
|
28,309
|
|
|
(a)
|
Including acquisitions and increases in non-current loans. The main acquisitions for the 2013-2015 period are detailed in Note 3 to the Consolidated Financial Statements.
|
|
(b)
|
Net investments = gross investments — divestments — repayment of non-current loans — other operations with non-controlling interests. The main divestments for
the 2013-2015 period are detailed in Note 3 to the Consolidated Financial Statements.
|
|
(c)
|
Organic investments = net investments, excluding acquisitions, divestments and other operations with non-controlling interests.
|
In 2015, the Group put in place a strong response to the falling Brent price, based in
particular on a reduction in organic investments. Including net investments in equity and
non-consolidated
affiliates, organic investments were $23.0 billion, in accordance with the $23-24 billion objective.
They were $26.4 billion in 2014 after reaching a peak of $28.3 billion in 2013, in line with the Group’s growth strategy. Major projects that will support a production growth of 5% per year on average until 2019
(2)
are launched, investments drop as they start and additional savings measures are implemented to accelerate this trend.
In the Upstream segment, most of the investments were geared toward the development of new hydrocarbon production facilities, the maintenance of existing facilities and exploration operations. Development
expenditure mainly pertained to the nine projects started in 2015 (Ofon 2, Eldfisk 2, West Franklin 2, Surmont, Termokarstovoye, GLNG, Dalia Phase 1a, Moho Phase 1b, Lianzi), the five projects that are expected to start in 2016 (Laggan-Tormore, Vega
Pleyade, Incahuasi, Angola LNG and Kashagan) and to other major projects under construction like Moho North in the Republic of the Congo, Ichthys in Australia, Egina in Nigeria and Yamal in Russia.
In the Refining & Chemicals segment, investments were made in facilities maintenance and safety, as well as in projects aimed at
improving the plants’ competitiveness. In 2015, the Group completed the Carling adaptation project, with the closure of the steamcracker in October and the modernization of the Antwerp
refinery. The segment also announced in France the transformation of the La Mède refinery into a bio-refinery and the modernization of the Donges refinery, and the 50% capacity reduction of the Lindsey oil refinery in the United Kingdom.
In the Marketing & Services segment, investments in 2015 mainly concerned the network (notably in Africa), logistics and specialty products
production and storage facilities, notably the new Singapore lubricant plant inaugurated in July.
While mobilizing its teams for
future startups in Upstream and for cost reduction programs, the Group is preparing for the future by expanding its acreage and acquiring stakes in new promising assets. Acquisitions were $3.4 billion, comprised principally of the ADCO license
extension in Abu Dabi, the renewal of licenses in Nigeria, the acquisition of an additional stake in OAO Novatek
(3)
and the carry on the Utica gas and condensate field in the
United States.
Gross investments (including acquisitions and changes in
non-current
loans) fell by 8% to $28.0
billion in 2015 compared to $30.5 billion in 2014.
|
(1)
|
Including acquisitions. The main acquisitions in fiscal years 2013-2015 are detailed in Note 3 to the Consolidated Financial Statements.
|
|
(3)
|
The Group held an 18.9% stake in OAO Novatek as of December 31, 2015.
|
|
|
|
|
|
44
|
|
TOTAL S.A. Form 20-F 2015
|
Item 4 - E. Other Matters - 2. R&D
The Group also continued its asset sale program with the finalization of sales totaling $6.0 billion in 2015,
comprised essentially of the sale of a 20% interest in Laggan-Tormore in the United-Kingdom, a 10% interest in the Fort Hills project in Canada, the Group’s stake in the Schwedt refinery in Germany, a majority share in Geosel in France and the
finalization in 2015 of the sales announced in 2014 (Bostik, participations in Nigerian onshore blocks, coal mines in South Africa and Totalgaz).
The
Group confirmed an asset sale target of $10 billion for
2015-17.
The sales of the FUKA pipeline system in the United-Kingdom, a 15% in the Gina Krog project in Norway and the marketing activities in Turkey
were announced in 2015.
Net investments were therefore $20.4 billion in 2015, compared to $24.1 billion in 2014, a decrease of 16%. This decrease was
essentially due to the decrease in organic investments.
|
1.2
|
Major planned investments
|
In response to the falling oil
prices, TOTAL announced an organic investments budget for 2016 of approximately $19 billion.
Investments in the Upstream segment are expected to be
approximately $16 billion and will mainly be allocated to major development projects, including Vega Pleyade, Incahuasi, Angola LNG and Kashagan that are expected to start in 2016 as well as Ichthys in Australia, Moho Nord in the Republic of the
Congo, Egina in Nigeria and Yamal in Russia that are expected to start from 2017. A little over $4 billion will also be allocated to assets already in production, in particular for maintenance capital expenditures and in-fill wells.
The Refining & Chemicals segment has an investment budget of approximately $1.5 billion, which is expected to be allocated to the refining, petrochemicals
and specialty chemicals businesses. The modernization of the Antwerp integrated platform, the transformation of the La Mède refinery in a bio-refinery and the adaptation of the Lindsey refinery are the three largest investments in the segment
in 2016. A significant portion of the segment’s budget will also be allocated to the maintenance and safety investments required for these types of industrial activities.
The Marketing & Services segment has an investment budget of approximately $1.5 billion, which is expected
to finance, in particular, the service station network, logistics, specialty products production and storage facilities, particularly lubricants, and the development of its activities in New Energies. Most of the Marketing & Services budget
will be allocated to growth areas (Africa, Middle East, Asia and Latin America).
After 2016, TOTAL expects investments to be in line with a
$17-19 billion
per year guideline and this level should allow the Group to grow 1-2% per year over the long-term, in line with oil and gas market growth.
TOTAL self-finances most of its investments from its excess cash from operations (refer to Consolidated Statement of Cash Flow for the Years Ended December 31,
2015, 2014 and 2013), which is mainly supplemented by accessing the bond market on a regular basis, when conditions on the financial markets are favorable (refer to Note 20 to the Consolidated Financial Statements). However, investments for joint
ventures between TOTAL and external partners are generally funded through specific project financing.
Active management of the asset portfolio, which is
fully integrated into the Group’s strategy, creates value and TOTAL has confirmed its 2015-17 asset sale program of $10 billion, including $4 billion announced in 2015. In addition, the Group makes targeted acquisitions, notably to acquire
resources discovered by other oil companies, with $2 billion planned in 2016.
As part of certain project financing arrangements, TOTAL S.A. has provided
guarantees. These guarantees (“Guarantees given on borrowings”) as well as other information on the Group’s off-balance sheet commitments and contractual obligations appear in Note 23 to the Consolidated Financial Statements. The
Group currently believes that neither these guarantees nor the other off-balance sheet commitments of TOTAL S.A. or of any other Group company have, or could reasonably have in the future, a material effect on the Group’s financial position,
income and expenses, liquidity, investments or financial resources.
|
2.
|
Research & Development
|
Certain R&D initiatives of the Group are set forth below. For additional information on the Group’s R&D,
see “Item 5 — Research and Development”.
In Exploration & Production, the project
portfolio was reviewed in 2015 according to what impact the projects have on reducing costs and improving production. More than half the R&D budget is given to improving exploration, seismic acquisition and imaging technologies, appraisal of
hydrocarbon reservoirs and simulation of field evolution during operations, especially for low permeability or carbonate reservoirs. Enhancing oil recovery from mature reservoirs remains an active area of research.
A new direction was taken to strengthen R&D activities in offshore at greater distances for multiphase production transport, which is fully in line with the
goals of Exploration & Production and supports major technology-intensive assets such as Libra in Brazil.
The
oxy-combustion CO
2
capture and storage project in the depleted Rousse reservoir in Lacq (France) is still in the monitoring phase, following the injection phase that ended in
2013. The Group now has a strong command of the methods used to characterize reservoirs and their mechanical properties for this type of injection. New projects will look into new capturing solutions.
A sustained effort to adapt mature technologies in order to reduce their costs has been implemented. In particular,
new produced water management technologies are now available for new developments. This subject is part of a larger program dedicated to sustainable development.
Finally, R&D programs prepare for the more distant future, whether for developing technologies, such as robotics or
high-performance
computing, or for researching new
exploration concepts.
Concerning the activities of Gas, the program to develop new technological LNG solutions is continuing.
|
2.2.
|
Refining & Chemicals
|
|
2.2.1.
|
Refining & Chemicals (excluding Specialty Chemicals)
|
The aim of R&D is to support the medium and long-term development of Refining & Chemicals. In doing so, it contributes to the technological differentiation of this business through the development,
implementation and promotion of effective R&D programs that pave the way for the industrialization of knowledge, processes and technologies.
In line
with Refining & Chemicals’ strategy, R&D places special emphasis on the following four major challenges: take advantage
|
|
|
|
|
2015 Form 20-F TOTAL S.A.
|
|
45
|
Item 4 - E. Other Matters - 2. R&D
of different types of feedstock, maximize asset value, continue developing innovative products, and develop
bio-sourced products. The medium-term strategy of the project portfolio and its deployment plan will facilitate Refining & Chemicals’ technological differentiation.
To take advantage of different types of feedstock, R&D activities related to the processing of more diversified crudes have increased significantly through a clearer insight into the effect that feedstocks have
on equipment and processes at the molecular level. R&D is launching ambitious new programs to develop various technologies for producing liquid fuels, monomers and intermediates from gas.
R&D is developing expertise and technologies with a view to maximizing asset value. Its efforts mainly involve programs focusing on the flexibility and availability of facilities. Advanced modeling of
feedstocks and processes helps the units overcome their processing-related constraints and operate while taking these constraints into account in real time. Research conducted on catalysts is helping to increase their resistance, improve catalytic
stability and extend the cycle time at a lower cost. Programs are being set up to maximize the value of heavy residues.
To address
concerns related to social and environmental acceptability in particular, R&D is focusing its efforts on reducing emissions to minimize facilities’ environmental footprint. In anticipation of long-term challenges and the value of CO
2
, R&D is pioneering technologies to reduce GHG emissions through carbon capture and recovery by conversion.
Product innovation is a key aspect of research on polymers. R&D draws on its knowledge of metallocenes and bimodality to develop different types of mass consumption polymers that have exceptional properties
that allow them to replace heavier materials and compete with technical polymers. Value-added niche polymers are also being developed, whether in the form of blends, compounds or composites. Efforts to diversify into “green” products are
focused mainly on bioproducts endorsed by the market: biomonomers, biointermediates and biopolymers. R&D is banking on polylactic acid for the market launch of new polymers that boast enhanced properties. In addition, the development of blends,
compounds and composites broadens the scope of application of polylactic acid-based polymers.
With regard to biofuels, R&D has directed its efforts
towards gasification and coprocessing to produce liquid fuels from biomass. R&D is also particularly mindful of issues related to blends and product quality raised by the use of biomolecules.
Efficient resource use and end-of-life management for plastics are topics of growing interest. R&D is therefore developing technologies that enable plastics to
be used more efficiently as feedstock.
|
2.2.2.
|
Specialty Chemicals
|
R&D is
strategically important for specialty chemical products. It is closely linked to the needs of the subsidiaries and industrial customers.
Material
innovation at Hutchinson is gaining pace for raising performance and increasing potential applications, with the development of advanced rubber or thermoplastic formulas, the development of new material formulations based on composite structures,
and the development of energy storage applications.
The aerospace and automotive industries face the same challenges, namely mass reduction, energy efficiency, and
diagnostic and control functionality. In 2015, Hutchinson improved its expertise in electronics and embedded systems. Hutchinson has also extended its network of partnerships across the American continent and Asia.
Atotech is a global leader in integrated production systems (chemicals, equipment, expertise and service) for industrial surface finishing and the manufacturing of
integrated circuits. Given the environmental challenges related to electroplating, nearly half of Atotech’s R&D projects are designed to develop ever cleaner technologies and favor conditions for the sustainable development of these
industries.
|
2.3.
|
Marketing & Services
|
|
2.3.1.
|
Marketing & Services
|
In
2015, the R&D of the Marketing & Services activities continued to roll out its new roadmap in line with its ambitions.
The roadmap features
two focal points: reducing the environmental footprint of products and improving the durability of its end users’ equipment. They include the following developments: energy savings for customers (fuels, lubricants, additives and bitumen),
competitive advantage and new solutions (lubricants, bitumen and special fluids), anticipation of changes in legislation (marine lubricants and aviation fuel), and incorporation of bio-sourced molecules (lubricants and racing fuels).
Considerable efforts are therefore being made to develop digital tools that can be used to provide a closer insight into how products work, model their behavior,
detect the performance of the different components available and ultimately determine targets for chemists and formulators.
In 2015, a project aimed at
pioneering new molecules for future changes to the Total Excellium fuel range was launched, with target areas including chemicals and methods & measurements. Extensive work was also aimed at developing new products and adapting products to
the range, mainly for Africa and the Middle East.
In the field of refinery additives, research continued into understanding and modeling the
crystallization kinetics of paraffin.
The Fuel Economy range of lubricants continues to expand with many new products designed to comply with the
specifications of manufacturers targeted by the Total Lubricants business line in all fields of application (automotive, marine and manufacturing). The key work areas are focusing on the design of breakthrough components used in formulations.
Furthermore, new marine lubricants for two-stroke engines are being developed to anticipate changes in fuel specifications (very low sulfur rate in coastal areas) and reduce emissions.
To meet the challenges of competitiveness, sustainable logistics and geographic development in the bitumen sector, researchers mainly concentrated on the prospect of transporting bitumen in solid form and
developing Styrelf formulas for the international market.
Cooperation with the Federal Aviation Administration (FAA) continued in the field of unleaded
Avgas.
A greater understanding of the molecular composition of fluids, their applicative properties and their method of manufacture paved the way for
new innovations, some of which in the field of renewable energy technologies.
|
|
|
|
|
46
|
|
TOTAL S.A. Form 20-F 2015
|
|
(1
)
|
American company listed on NASDAQ in which the Group holds a 57.48% interest as of December 31, 2015.
|
Item 4 - E. Other Matters - 3. Insurance and risk management
In terms of Formula One racing, closer ties with manufacturers were instrumental in raising engine performance. This
collaboration will help target future fuel developments more effectively.
In 2015, the Asia-Pacific Technical Center based in Bombay, India, continued
to ramp up its activities and strengthen its skills, mainly in lubricants (including textile lubricants and engine lubricants) and special fluids, including drilling fluids.
French and international skills have been increasingly enlisted in recent years, with a growing number of ties with academia, researchers seconded to universities, and international researchers recruited for the
Solaize Research Centre. Cooperation with academia and secondments contribute to core research used to provide scientific support for designing and developing breakthrough products, which is one of Marketing & Services’ objectives.
New Energies’
R&D effort is focused on the solar value chain from silicon to photovoltaic electricity management systems and on the development of biotechnological methods of converting biomass into products for the Group’s markets.
In the field of solar energy, R&D is striving to improve
SunPower’s
(1)
methods of producing cells and modules in order to drive down costs while enhancing their efficiency and reliability. It is also preparing future
generation photovoltaic cells within the framework of several strategic partnerships between TOTAL and renowned academic research institutes. In particular, TOTAL is the founding partner of the Ile de France Photovoltaic Institute, an ambitious
project set up in the Paris-Saclay campus.
Downstream in the solar value chain, R&D is monitoring the development of low-cost stationary storage
technologies. It is also preparing solutions for supplying solar power and associated services to residential markets, by developing software tools and algorithms for the intelligent management of domestic electricity production and consumption, but
also by integrating and testing
systems combining photovoltaics, storage, control of demand as well as pilots for assessing and improving systems and algorithms in contact with customers.
With regard to biotechnologies, the Group is developing methods for converting sugars into biofuels and molecules of interest for chemicals, as
well as processes for the deconstruction of lignocellulose into sugars. The Group has set up its own laboratories, including a competence center on fermentation and a laboratory focused on themes shared by New Energies and Marketing &
Services (bio-sourced specialties in particular), and a dedicated research team. This research team manages a network of partnerships with research laboratories and startups in the United States and in Europe. The Group mainly works with Amyris
(1)
, a company specializing in biotechnologies (refer to “— B.4.2.2. Biotechnologies and the conversion of biomass, above).
Environmental issues are important throughout
the Group and are taken into account in all R&D projects. R&D’s effort is to manage environmental risks more effectively, particularly with regard to:
|
•
|
|
water management, especially by reducing the use of water from natural environments and lowering emissions in compliance with local, national and international
regulations;
|
|
•
|
|
reduction of GHG emissions by improving energy efficiency and monitoring carbon capture and storage and the potential effects of CO
2
on the natural environment;
|
|
•
|
|
detection and reduction of discharges into the air and simulation of their dispersal;
|
|
•
|
|
prevention of soil contamination and regulatory compliance with regard to historical aspects and the remediation of sites; and
|
|
•
|
|
changes in the Group’s different products and management of their life cycle, in particular in compliance with the Registration, Evaluation, Authorisation
and Restriction of Chemicals regulation (REACH).
|
|
3.
|
Insurance and risk management
|
TOTAL has its own reinsurance company, Omnium
Reinsurance Company (ORC). ORC is integrated within the Group’s insurance management and is used as a centralized global operations tool for covering the Group companies’ insurable risks. It allows the Group’s worldwide insurance
program to be implemented in compliance with the specific requirements of local regulations applicable in the countries where the Group operates.
Some
countries may require the purchase of insurance from a local insurance company. If the local insurer accepts to cover the subsidiary of the Group in compliance with its worldwide insurance program, ORC negotiates a retrocession of the covered risks
from the local insurer. As a result, ORC enters into reinsurance contracts with the subsidiaries’ local insurance companies, which transfer most of the risk to ORC.
At the same time, ORC negotiates a reinsurance program at the Group level with oil industry mutual insurance companies and commercial reinsurance markets. ORC allows the Group to better manage price variations in
the insurance market by taking on a greater or lesser amount of risk corresponding to the price trends in the insurance market.
In 2015, the net amount of risk retained by ORC after reinsurance was, on the one hand, a maximum of $53 million per
onshore third-party liability insurance claim or $77 million per offshore third-party liability insurance claim and, on the other hand, $75 million per property damage and/or business interruption insurance claim. Accordingly, in the event of any
loss giving rise to an aggregate insurance claim, the effect on ORC would be limited to its maximum retention of $152 million per occurrence.
|
3.2.
|
Risk and insurance management policy
|
In this context, the
Group risk and insurance management policy is to work with the relevant internal department of each subsidiary to:
|
•
|
|
define scenarios of major disaster risks (estimated maximum loss);
|
|
•
|
|
assess the potential financial impact on the Group should a catastrophic event occur;
|
|
•
|
|
help implement measures to limit the probability that a catastrophic event occurs and the financial consequences if such event should occur; and
|
|
•
|
|
manage the level of financial risk from such events to be either covered internally by the Group or transferred to the insurance market.
|
|
|
|
|
|
2015 Form 20-F TOTAL S.A.
|
|
47
|
|
(1
)
|
American company listed on NASDAQ in which the Group holds a 31.52% interest as of December 31, 2015.
|
Item 4 - E. Other Matters - 4. Social, environmental and societal information
The Group has worldwide property insurance
and third-party liability coverage for all its subsidiaries. These programs are contracted with first-class insurers (or reinsurers and oil and gas industry mutual insurance companies through ORC).
The amounts insured depend on the financial risks defined in the disaster scenarios and the coverage terms offered by the market (available capacities and price
conditions).
More specifically for:
|
•
|
|
third-party liability: since the maximum financial risk cannot be evaluated by a systematic approach, the amounts insured are based on market conditions and oil
and gas industry practice. In 2015, the Group’s third-party liability insurance for any liability (including potential accidental environmental liabilities) was capped at $900 million (onshore) and $850 million (offshore). In addition, the
Group adopts, where appropriate, the necessary means to manage the compensation of victims in the event of an industrial accident for which it is liable; and
|
|
•
|
|
property damage and business interruption: the amounts insured vary by sector and by site and are based on the estimated cost and scenarios of reconstruction
under maximum loss situations and on insurance market conditions. The Group subscribed for business interruption coverage in 2015 for its main refining and petrochemical sites.
|
For example, for the Group’s highest risks (North Sea platforms and main refineries or petrochemical plants), in 2015 the insurance limit for the Group share
of the installations was approximately $1.75 billion for the Refining & Chemicals segment and approximately $2.15 billion for the Upstream segment.
Deductibles for property damage and third-party liability fluctuate between
€
0.1 and
€
10 million depending on the level of risk and
liability, and are borne by the relevant subsidiaries. For business interruption, coverage is triggered 60 days after the occurrence giving rise to the interruption. In addition, the main
refineries and petrochemical plants bear a combined retention for property damage and business interruption of $75 million per insurance claim.
Other
insurance contracts are bought by the Group in addition to property damage and third-party liability coverage, mainly in connection with car fleets, credit insurance and employee benefits. These risks are mostly underwritten by outside insurance
companies.
The above-described policy is given as an example of a situation as of a given date and cannot be considered as representative of future
conditions. The Group’s insurance policy may be changed at any time depending on the market conditions, specific circumstances and on the General Management’s assessment of the risks incurred and the adequacy of their coverage.
TOTAL believes that its insurance coverage is in line with industry practice and sufficient to cover normal risks in its operations. However, the Group is not
insured against all potential risks. In the event of a major environmental disaster, for example, TOTAL’s liability may exceed the maximum coverage provided by its third-party liability insurance. The loss TOTAL could suffer in the event of
such disaster would depend on all the facts and circumstances of the event and would be subject to a whole range of uncertainties, including legal uncertainty as to the scope of liability for consequential damages, which may include economic damage
not directly connected to the disaster. The Group cannot guarantee that it will not suffer any uninsured loss and there can be no guarantee, particularly in the case of a major environmental disaster or industrial accident, that such loss would not
have a material adverse effect on the Group.
|
4.
|
Social, environmental and societal information
|
TOTAL puts corporate social responsibility (CSR) at the heart of its activities and conducts its
operations according to the following principles of:
|
•
|
|
protecting the safety and security of people and its facilities;
|
|
•
|
|
limiting its environmental footprint;
|
|
•
|
|
ensuring that its Code of Conduct is applied in its sphere of operations;
|
|
•
|
|
incorporating the challenges of sustainable development in the exercise of its activities;
|
|
•
|
|
increasing its local integration by placing dialogue with its stakeholders at the heart of its policy and contributing to the economic and social development of
the regions where the Group has operations; and
|
|
•
|
|
promoting equal opportunities and fostering diversity and cultural mix among its personnel.
|
The Group’s CSR performance is measured by non-financial rating agencies. TOTAL has been included continuously in the FTSE4Good index (London Stock Exchange)
since 2001 and in the Dow Jones Sustainability World Index (DJSI World – New York Stock Exchange) since 2004. TOTAL was listed in the DJSI Europe from 2005 to 2014.
In terms of reporting, TOTAL refers to the IPIECA (global oil and gas industry association for environmental and social issues) guidance and to the Global Reporting Initiative (GRI). Detailed
information on these reporting guidelines is available on the
Group’s website (analystes-csr.total.com).
On September 25, 2015, the United Nations adopted the 17 Sustainable Development Goals (SDGs). These goals acknowledge the determining role corporations
play in economic development and growth and ask of them to show creativity and innovation in finding solutions to global sustainable development challenges. TOTAL is continuing its analysis on how to better report, as of 2016, on its contribution
toward achieving these SDGs. Detailed information on TOTAL’s implementation of these goals is provided in this section “– 4. Social, environmental and societal information”, particularly with regard to Goal 7 – affordable
and clean energy (see “– 4.3.4.5. Giving the most disadvantaged populations greater access to energy”, below) and Goal 13 – climate action (see “– 4.2.3. Climate change”, below).
The reporting scopes and method concerning the information in this section “– 4. Social, environmental and societal information” is presented in
“– 4.4. Reporting scopes and method”, below.
The data presented in this section are provided on a current-scope basis.
The quantitative information set out in
this section “– 4.1. Social information” and “Item 6 – D.1. Group employees” regarding the
|
(1)
|
Refer to “— 4.4.3.2. Terminology used in social reporting”,
below.
|
|
|
|
|
|
48
|
|
TOTAL S.A. Form 20-F 2015
|
Item 4 - E. Other Matters - 4. Social, environmental and societal information
Group’s employees worldwide covers all the entities that are fully consolidated in the
Group’s financial statements
(1)
. However, some of the data comes from the Group’s Worldwide Human Resources Survey (WHRS), which gathers approximately 100
indicators measuring important aspects of TOTAL’s Human Resources policy. The WHRS is performed on a sample of employees from
representative consolidated companies at the business segment and regional levels; when WHRS is mentioned in this document, reference is made to data related to this sample, which represents 91%
of the Group’s employees at 134 subsidiaries in 2015, stable compared to 2014 (91%) and 2013 (90%) despite a decrease in consolidated companies’ payrolls.
|
4.1.1.
|
Organization of work
|
The average work
week is determined by applicable local law. It is less than 40 hours in most subsidiaries located in Europe, Japan and Qatar. It is 40 hours in most Asian and African countries, and in North America. It is longer in Latin America (Argentina, Mexico,
Brazil) and a few Asian (India) and African (South Africa, Equatorial Guinea, Morocco) countries.
In addition, there are two
specific employment regimes within the Group, the “shift”
(1)
regime and the
“rotational”
(2)
regime. Most shift workers are employed in the Refining & Chemicals and Marketing & Services business segments, while the
rotational regime concerns the Upstream segment. New indicators were established in 2015 to monitor these regimes.
Depending on local law, there are
several programs that aim to create a better balance between work and private life and/or encourage equal career opportunities. In France, teleworking was introduced in 2012. As of December 31, 2015, there were 454 teleworkers in France (WHRS
scope), 27.1% of whom were men, compared to 346 in 2014.
|
|
|
|
|
|
|
|
|
|
|
|
|
|
|
|
|
WHRS 2015
|
|
|
WHRS 2014
|
|
|
WHRS 2013
|
|
|
% of companies offering the option of teleworking
|
|
|
17.2
|
%
|
|
|
16
|
%
|
|
|
22
|
%
|
|
% of employees involved in teleworking of those given the option
|
|
|
2.5
|
%
|
|
|
2.1
|
%
|
|
|
2.3
|
%
|
The sickness absenteeism rate is one of the indicators monitored in the WHRS:
|
|
|
|
|
|
|
|
|
|
|
|
|
|
|
|
|
WHRS 2015
|
|
|
WHRS 2014
|
|
|
WHRS 2013
|
|
|
Sickness absenteeism rate
|
|
|
2.1
|
%
|
|
|
2.3
|
%
|
|
|
2.5
|
%
|
|
4.1.2.
|
Dialogue with employees
|
The
Group’s employees and their representatives have a privileged position and role among the numerous stakeholders with which TOTAL has regular dialogue (refer also to “— 4.3.2. Dialogue and involvement with stakeholders”,
below). In countries where employee representation is not required by law (for example in Myanmar and Brunei), TOTAL strives to set up such representation. There are therefore employee representatives in the majority of Group companies, most of whom
are elected. The subjects covered by dialogue with employees vary from company to company, but some are shared throughout, such as health and safety, work time, compensation, training and equal opportunity.
Within the Group, organizational changes are made in consultation with the employee representatives, such as the creation of a new entity in
2014 (Total Global Services) dedicated to shared IT and telecommunications services, and, in 2015, the sale of Totalgaz to Antargaz or the industrial project for the Donges (Loire-Atlantique) and La Mède (Bouches-du-Rhône) refineries to
secure the future of operations at these industrial sites. This constructive social dialogue has led to various agreements, for example an agreement regarding commitments in the context of the disposal of Totalgaz and another on employee support
measures for the project relating to the future of La Mède (refer to
“— B.3.1.1. Refining & Petrochemicals”,
above). In 2015, 153 agreements were signed with employee representatives around the world, including 63
(3)
in France, covering in particular supplemental health insurance,
life insurance, teleworking and compensation systems.
|
|
|
|
|
|
|
|
|
|
|
|
|
|
|
|
|
WHRS 2015
|
|
|
WHRS 2014
|
|
|
WHRS 2013
|
|
|
Percentage of companies with employee representation
|
|
|
76.9
|
%
|
|
|
75.5
|
%
|
|
|
71.6
|
%
|
|
Percentage of employees covered by collective agreements
|
|
|
65.5
|
%
|
|
|
67.8
|
%
|
|
|
67.0
|
%
|
TOTAL maintains an ongoing dialogue with employees in Europe via negotiations with European trade union federations.
Several agreements have been signed, including, for example, the convention on labor relations and equal opportunities that aims to set up a common
social platform applicable to all the Group’s European entities.
A European committee (single representative body for the employees at the group
level) has been set up in order to inform employees and hold discussions on the Group’s strategy, its social, economic and financial situation, as well as questions of sustainable development, environmental and societal responsibility, and
safety on a European scale. It also examines any significant proposed organizational change concerning at least two companies in two European countries, to express its opinion, in addition to the procedures initiated before the national
representative bodies.
In addition, every other year, TOTAL carries out an internal survey (Total Survey) amongst its employees to gather their views
and expectations with regard to their work situation and perception of the company, locally and as a Group. The results of the survey conducted in 2015 among 65,000 employees at 508 entities in 115 countries demonstrated that employees have a
commitment rate of 75% and that 87% of them are proud to work for TOTAL.
In January 2015, TOTAL signed a global agreement with the worldwide trade union
federation, IndustriALL Global Union, which represents 50 million employees in 140 countries. Under this agreement, the Group made a commitment to maintain minimum Corporate Social Responsibility (CSR) standards and guarantees worldwide for
subsidiaries in which it has more than a 50% stake, in the areas of occupational health and safety, human rights in the workplace, enhancement of the dialogue with employees, life insurance, professional equality, social responsibility and
assistance with organizational changes. The Group also ensures that the principles of the agreement on health, safety and human rights are
|
(1)
|
For employees providing a continual activity with relays between alternating teams to maintain production (two or three 8-hour shifts), for example in plants
or refineries.
|
|
(2)
|
For employees working at a location (town or worksite) far from their place of residence with alternating periods of work and rest.
|
|
(3)
|
Some agreements cover several companies at once (for example, agreements in the Social and Economic Units or group of companies).
|
|
|
|
|
|
2015 Form 20-F TOTAL S.A.
|
|
49
|
Item 4 - E. Other Matters - 4. Social, environmental and societal information
disclosed to and promoted among its service providers and suppliers. The implementation of this agreement will be
monitored annually with representatives who are members of trade unions affiliated with the IndustriALL Global Union and appointed by this federation.
The Group has four
priorities in the field of training:
|
•
|
|
sharing TOTAL’s corporate values, particularly with respect to HSE and ethics;
|
|
•
|
|
increasing key skills in all business areas to maintain a high level of operating performance;
|
|
•
|
|
promoting employees’ integration and career development through Group induction and training on management and personal development; and
|
|
•
|
|
supporting the policy of diversity and mobility within the Group through language and inter-cultural training.
|
The Group’s efforts in the field of training were still significant in 2015 with 71% of employees having followed at least one training course during the year.
Within the scope of the WHRS, 289,000 days of training were followed onsite, compared to 380,000 days in 2014, for a total training budget of approximately
€
170 million, compared to
€
235 million in 2014. This decrease from 2014 to 2015 is due
to three main factors: firstly, the divestments of Totalgaz and Bostik in 2015 (which represented in 2014 12,000
training days for approximately
€
2 million) and the completion of specific
training sessions in certain subsidiaries of Exploration & Production combined with a decrease in activity (Yemen and Canada); secondly, the increase in at-distance training courses (26,000 days in 2015 compared to 19,000 in 2014), which
are gradually being combined with or are replacing on-site courses as part of the Group’s digitalization program; and lastly, the combined effect of optimizing the length of training courses and better selecting these to manage costs.
This shift towards e-learning programs within the Group accelerated in 2015 with the aim to improve the effectiveness of training and reaching the
largest number of people as quickly as possible. It has been accompanied by the launch of a digital awareness program in 2015 to support the Group’s goals in this area. As a result, 42,000 people received distance training courses in 2015,
compared to 30,000 in 2014.
In addition, Total University offers Group integration programs as well as courses aimed specifically at developing
leadership among managers and executive officers. Furthermore, Total University offers specific theme-based conferences, some of which are open to external audiences. These conferences cover strategic topics in the field of energy ranging from
technology to geopolitics and societal matters.
|
|
|
|
|
|
|
|
|
|
|
|
|
|
Average number of training days/year per
employee
(a)
(excluding “Companion” apprenticeships and e-learning)
|
|
WHRS 2015
|
|
|
WHRS 2014
|
|
|
WHRS 2013
|
|
|
Group average
|
|
|
3.3
|
|
|
|
4.2
|
|
|
|
4.0
|
|
|
By segment
(b)
|
|
|
|
|
|
|
|
|
|
|
|
|
|
Upstream
|
|
|
7.0
|
|
|
|
9.2
|
|
|
|
9.1
|
|
|
Exploration & Production
|
|
|
7.2
|
|
|
|
9.5
|
|
|
|
9.5
|
|
|
Gas
|
|
|
4.2
|
|
|
|
2.7
|
|
|
|
2.4
|
|
|
Refining & Chemicals
|
|
|
2.3
|
|
|
|
3.5
|
|
|
|
2.9
|
|
|
Refining & Chemicals
|
|
|
2.3
|
|
|
|
3.6
|
|
|
|
2.9
|
|
|
Trading & Shipping
|
|
|
1.4
|
|
|
|
2.0
|
|
|
|
1.8
|
|
|
Marketing & Services
|
|
|
2.8
|
|
|
|
2.2
|
|
|
|
2.7
|
|
|
Marketing & Services
|
|
|
2.4
|
|
|
|
2.9
|
|
|
|
3.4
|
|
|
New Energies
|
|
|
3.8
|
|
|
|
0.3
|
|
|
|
0.6
|
|
|
Corporate
|
|
|
2.6
|
|
|
|
3.0
|
|
|
|
3.3
|
|
|
By region
|
|
|
|
|
|
|
|
|
|
|
|
|
|
Africa
|
|
|
5.5
|
|
|
|
7.6
|
|
|
|
8.6
|
|
|
Asia-Pacific
|
|
|
4.9
|
|
|
|
4.6
|
|
|
|
4.1
|
|
|
Europe
|
|
|
2.7
|
|
|
|
3.5
|
|
|
|
3.2
|
|
|
Latin America
|
|
|
3.7
|
|
|
|
5.3
|
|
|
|
4.1
|
|
|
Middle East
|
|
|
2.9
|
|
|
|
6.9
|
|
|
|
9.4
|
|
|
North America
|
|
|
1.1
|
|
|
|
3.1
|
|
|
|
3.0
|
|
|
Oceania
|
|
|
0.7
|
|
|
|
0.1
|
|
|
|
2.3
|
|
|
French overseas departments and territories
|
|
|
3.2
|
|
|
|
1.6
|
|
|
|
2.2
|
|
|
Breakdown by type of training given
|
|
|
|
|
|
|
|
|
|
|
|
|
|
Technical
|
|
|
37
|
%
|
|
|
35
|
%
|
|
|
34
|
%
|
|
Health, Safety, Environment, Quality (HSEQ)
|
|
|
22
|
%
|
|
|
21
|
%
|
|
|
22
|
%
|
|
Language
|
|
|
11
|
%
|
|
|
14
|
%
|
|
|
16
|
%
|
|
Other (management, personal development, inter-cultural, etc.)
|
|
|
30
|
%
|
|
|
30
|
%
|
|
|
28
|
%
|
|
(a)
|
This number is calculated using the number of training hours, where 7.6 hours equals one day.
|
|
(b)
|
2014 and 2013 data was restated to allocate TOTAL S.A. data into the business segments to ensure consistency with the activities.
|
TOTAL is an
international Group in terms of both its operations and its team members. The diversity of its employees and management is crucial to the Group’s competitiveness, innovative capacity, attractiveness and acceptability.
For this reason, TOTAL develops its employees’ skills and careers while both prohibiting any discrimination related to origin, gender, sexual orientation or
identity, disability, age or affiliation with a political, labor or religious organization, and promoting proactive
behaviors that allow everyone to feel integrated into the Company. This policy is upheld by the Diversity Council, which is chaired by a member of the Group Performance Management Committee.
Each entity is responsible for defining its own areas of focus based on the legal context and its challenges and for creating a suitable work
environment in which it can fully benefit from all the skills and diverse approaches. Two areas are managed at the global level: gender diversity and internationalization, so as to offer all employees, regardless of their gender or nationality, the
same career opportunities.
|
|
|
|
|
50
|
|
TOTAL S.A. Form 20-F 2015
|
Item 4 - E. Other Matters - 4. Social, environmental and societal information
To this end, the Group’s target for 2020 is to have:
|
•
|
|
women represent 25% of senior executives (having represented approximately 5% in 2004 and 19% in 2015);
|
|
•
|
|
non-French nationals represent 40% of senior executives (having represented approximately 19% in 2004 and 28% in 2015);
|
|
•
|
|
women represent more than 20% of management committee members (head office and subsidiaries); and
|
|
•
|
|
local managers represent 50% to 75% of the subsidiaries’ management committee members.
|
In addition to the Group’s targets, each business segment also sets targets for its senior management.
|
-
|
4.1.4.1. Equal treatment for men and women
|
In 2010, TOTAL
signed the “Women’s Empowerment Principles – Equality Means Business” set out in the United Nations Global Compact, and its commitment to equal treatment of men and women is regularly embodied in agreements, such as the global
agreement signed in 2015 with IndustriALL (refer to “— 4.1.2. Dialogue with employees”, above). Specific measures are taken to correct discrepancies, such as salary equality (review and adjustment of compensation in 2013 and
again in 2015) and teleworking to improve employees’ work-life balance.
The Group also promotes gender diversity in its professions. In France,
TOTAL has partnered with
Elles bougent
since 2011 and served as honorary chairman in 2015: 70 female engineers regularly inform high-school girls about careers in science.
In line with the goal of increasing the number of women in positions of responsibility, the TWICE network (Total Women’s Initiative for Communication and Exchange) aims to promote career development for women
and train and educate men and women about gender diversity. Created in 2006, it is currently in place in France and around the world (19 local networks) and has over 3,400 members. As part of this network, a mentoring program is deployed
internationally, and has benefited nearly 500 women since 2010 and 182 mentee/mentor pairs in 2015.
TOTAL also participates in
the “BoardWomen Partners” program, which aims to increase the proportion of women on boards of directors in large European companies. At the end of 2015, women accounted for 36.4%
(1)
of TOTAL S.A.’s Board members, compared to 38.5% at year-end 2014 and 33% at year-end 2013. Given the appointment proposals presented to the next Shareholders’
Meeting (refer to “Item 6 — A.1.7. Appointment and renewal of directorships proposed to the Shareholders’ Meeting of May 24, 2016”, below), if the proposed resolutions are approved, the composition of the Board of Directors,
following the Meeting, will include six women,
i.e.
, a proportion of 54.54%
(1)
, above the level of 40% set out by law and in the AFEP-MEDEF Code. The Board of
Directors will continue its reflections on diversifying its composition in the coming years.
|
|
|
|
|
|
|
|
|
|
|
|
|
|
|
% of women
|
|
2015
|
|
|
2014
|
|
|
2013
|
|
|
Open-ended contract recruitment
|
|
|
34.9%
|
|
|
|
33.2%
|
|
|
|
35.9%
|
|
|
Managers (JL
³
10
(a)
) recruitment
|
|
|
30.6%
|
|
|
|
27.6%
|
|
|
|
29.2%
|
|
|
Employees
|
|
|
32%
|
|
|
|
31.1%
|
|
|
|
30.8%
|
|
|
Managers (JL
³
10
(a)
)
|
|
|
25.1%
|
|
|
|
24.5%
|
|
|
|
23.9%
|
|
|
Senior executives
|
|
|
18.6%
|
|
|
|
17.6%
|
|
|
|
17.0%
|
|
|
(a)
|
Job Level of the position according to the Hay method. JL10 corresponds to junior managers (cadre débutant).
|
|
-
|
4.1.4.2. Internationalization of management
|
With employees
representing over 150 nationalities, TOTAL enjoys broad cultural diversity and strives to reflect this at all levels of its activities. In 2015, 93.5% of employees hired by the Group and 76.3% of managers hired were non-French nationals.
Several measures have been put in place to internationalize management, including training courses to internationalize careers, increasing the number of foreign
postings for employees of all nationalities (nearly 4,600 employees of 102 nationalities are posted in 117 countries), and integration and personal development training organized by large regional hubs (Houston, Johannesburg, Singapore, etc.).
|
|
|
|
|
|
|
|
|
|
|
|
|
|
|
% of employees of non-French nationality
|
|
2015
|
|
|
2014
|
|
|
2013
|
|
|
Open-ended contracts
|
|
|
93.5%
|
|
|
|
90.5%
|
|
|
|
90.0%
|
|
|
Managers (JL
³
10) recruitment
(a)
|
|
|
76.3%
|
|
|
|
75.8%
|
|
|
|
73.1%
|
|
|
Employees
|
|
|
68.8%
|
|
|
|
67.8%
|
|
|
|
66.6%
|
|
|
Managers (JL
³
10)
(a)
|
|
|
60.9%
|
|
|
|
61.2%
|
|
|
|
60.9%
|
|
|
Senior executives
|
|
|
27.9%
|
|
|
|
27.2%
|
|
|
|
26.2%
|
|
|
(a)
|
Job level of the position according to the Hay method. JL10 corresponds to junior
managers (cadre débutant).
|
|
-
|
4.1.4.3. Measures promoting the employment and integration of people with disabilities
|
For over 20 years, TOTAL has formally set out its disability policy in France through successive agreements signed with employee
representatives to promote the employment of workers with disabilities. Three framework agreements signed for three years (2013-2015) with the French representative unions set out TOTAL’s policy with regard to integrating people with
disabilities into the work world. New agreements were signed for the 2016-2018 period. The average Group employment rate of people with disabilities in France (direct and indirect employment) was 4.74% in 2014 (compared to 4.27% in 2013)
(2)
.
TOTAL promotes the direct recruitment of disabled people and cooperation with
the sector for disabled workers, while at the same time taking various types of action:
|
•
|
|
internally: integration, professional training, support and job retention, communication, awareness sessions organized for managers and teams, human resources
managers, etc.; and
|
|
•
|
|
externally: information and advertising aimed at students, cooperation with recruitment agencies, attendance at specialized forums, etc.
|
|
-
|
4.1.4.4. Measures promoting non-discrimination
|
Large-scale
initiatives aimed at raising employees’ awareness of diversity are organized on a regular basis: in 2015, more than 180 of the Group’s sites celebrated the third World Diversity Day on the theme of “Diversity makes us
better”.
TOTAL is involved in a number of initiatives to promote diversity, including the professional integration of young people in France, for
example via the
la France s’engage
partnership with the French government (refer to “— 4.3.5.2. TOTAL S.A. philanthropy”, below).
In 2014, the Group also signed the LGBT (lesbian, gay, bisexual and transgender) Charter. This document, prepared by the
L’Autre
|
(1
)
|
Excluding the director representing employees, in accordance with the recommendations of the AFEP-MEDEF Code (point 6.4).
|
|
(2
)
|
The rate for 2015 was not available at the time of the publication of this report.
|
|
|
|
|
|
2015 Form 20-F TOTAL S.A.
|
|
51
|
Item 4 - E. Other Matters - 4. Social, environmental and societal information
Cercle
association, establishes a framework for combating discrimination related to sexual orientation or
identity in the workplace in France.
|
4.2.
|
Safety, health and environment information
|
In line with its
Code of Conduct, TOTAL has adopted a Safety Health Environment Quality Charter, updated in 2014, covering the areas of safety, security, health, the environment, quality and societal commitment, and on which the Group relies for the conduct of its
operations (available on total.com). This Charter represents the common framework of the Group’s management systems. Group directives define the minimum requirements expected in these areas and are designed to be implemented in the business
segments, which subsequently factor in the specific characteristics of their operations. Recommendations, guides and manuals, which are the primary documents used for implementing and managing the Group’s policies, are regularly distributed
within the different business segments. The Industrial Safety department and the Sustainable Development and Environment department, as well as the Security department, which report to Corporate Affairs, provide support to the segments and oversee
the implementation by the segments of policies that reflect the principles of the charter in a concrete, effective manner.
In accordance with oil and
gas industry best practices (set out in the IPIECA reporting guidance), the following safety, health and environment information relates to the activities, sites and industrial assets for which TOTAL S.A. or one of the companies it controls is the
operator (
i.e
., operates or has contractual responsibility for managing operations). An exception is made for information related to greenhouse gases, which is also expressed as a Group share of all assets in which TOTAL has a stake.
|
4.2.1.
|
Occupational health and safety
|
For
many years, the Group has been developing a normative framework related to occupational health and safety, security, societal commitment and the environment (H3SE). In this respect, directives have been drawn up for occupational health and safety.
These directives set out TOTAL’s requirements in these areas for personnel working on its sites. Since 2013, the three business segments have increased their efforts regarding the frameworks of the H3SE management systems in order to provide
greater overall consistency, while at the same time respecting the businesses’ specific characteristics.
Indicators are used to measure the main
results in these areas. Monthly reporting of occupational accidents is used to monitor performance at both the global and site levels.
|
|
|
|
|
|
|
|
|
|
|
|
|
|
|
Safety indicators
|
|
2015
|
|
|
2014
|
|
|
2013
|
|
|
TRIR
(a)
: number of recorded
injuries per million hours worked
|
|
|
1.17
|
|
|
|
1.30
|
|
|
|
1.55
|
|
|
- Employees of TOTAL
|
|
|
0.92
|
|
|
|
1.06
|
|
|
|
1.34
|
|
|
- Employees of external contractors
(b)
|
|
|
1.38
|
|
|
|
1.51
|
|
|
|
1.72
|
|
|
LTIR
(c)
: number of
lost time injuries per million hours worked
|
|
|
0.66
|
|
|
|
0.74
|
|
|
|
0.91
|
|
|
SIR
(d)
: average
number of days lost per lost time injury
|
|
|
30.11
|
|
|
|
29.74
|
|
|
|
32.04
|
|
|
Number of fatalities
|
|
|
9
|
|
|
|
9
|
|
|
|
15
|
|
|
(a)
|
TRIR: Total Recordable Injury Rate.
|
|
(b)
|
As defined in “— 4.4.4.1. Industrial Safety definitions and
indicators”, below.
|
|
(c)
|
LTIR: Lost Time Injury Rate.
|
|
(d)
|
SIR: Severity Injury Rate.
|
For more than 10 years, the TRIR and the LTIR have declined continuously. In 2015, the Group regrettably recorded
nine accidents that led to nine fatalities. A series of measures was adopted in 2015. These are intended, in particular, to strengthen safety monitoring of external contractor staff, who are the primary victims of fatal accidents. These measures
will be gradually rolled out throughout 2016.
The Group’s safety efforts are focused on preventing major accidents and accidental spills (refer to
“ — 4.2.2.3. Incident risk”, below, and “Item 15 — 4. Internal control and risk management procedures (Article L. 225-37 of the French Commercial Code)”, below), occupational accidents and transport
accidents. They cover both TOTAL employees and employees of external contractors. The external contractors’ safety results are monitored as closely as those for TOTAL employees. These efforts are coordinated by the Group’s Industrial
Safety Division and put into practice by the Group’s entities with the support of the HSE departments.
Safety is the subject of regular training
activities, in particular at management level (refer to “ — 4.2.2.1. General policy and environmental targets”, below), as well as of a policy that recognizes HSE performance, in particular by taking account of safety-related criteria
for the calculation of compensation (refer to “Item 6 — B.1. Employees’ compensation”, below).
Since 2010, the basic rules to
be scrupulously followed by all personnel, employees and contractors alike, in all of the Group’s businesses worldwide, have been set out in a safety document entitled “Safety at Work: TOTAL’s Twelve Golden Rules”. According to
the Group’s internal statistics, in more than 85% of severe incidents or near misses with high severity potential in the workplace, at least one of the golden rules had not been followed. The proper application of these golden rules, and more
generally of all occupational safety procedures, is verified through site visits and internal audits. The World Day for Safety at Work on April 28, 2015, was dedicated to the golden rules and provided an opportunity to assess how well they have
been disseminated and understood in the field five years after being introduced. Consequently, so that these rules are better assimilated by all of the Group’s employees as well as by those working for external contractors, and to ensure they
are implemented correctly, additional obligations and prohibitions were added to these golden rules. An e-learning program has been developed to train all personnel in the 12 golden rules and will be rolled out in 2016.
Moreover, the reporting of anomalies (770,000 in 2015) and near misses is strongly encouraged and monitored. The ability of each employee to identify anomalies or
dangerous situations is one of the measures of the personnel’s involvement and vigilance in accident prevention and reflects the safety culture within the Group. In late 2015, a “stop card” mechanism was implemented throughout the
Group. The stop card is the concrete expression of the authority given to any Group employee or employee of an external contractor to stop work in progress if he or she perceives there to be an uncontrolled risk, and guarantees that no sanctions
will be applied even if the assessment of the situation proves to be incorrect.
An investigation is generally launched in response to any type of
accident whatsoever. The method and scope of investigation depend on the actual or potential severity of the event. For example, a near miss with a high severity potential level is treated in the same way as a severe incident: its analysis is
considered to be a key driving force for progress and, depending on its relevance to the Group’s other entities, triggers a safety alert and even the dissemination of a feedback report.
|
|
|
|
|
52
|
|
TOTAL S.A. Form 20-F 2015
|
Item 4 - E. Other Matters - 4. Social, environmental and societal information
Traffic risk management is an important component of the Group’s safety policy. An extensive transporter
assessment program, launched in 2012 in Africa and the Middle East, revealed a 40% decrease in the number of serious accidents (roll-overs and collisions) between 2013 and 2015. This program, which includes assistance provided to transporters to
help them improve their professional skills, has enabled them to achieve, in particular, higher levels of profitability through the optimization of truck rotation. As a result, transporters have been able to modernize their fleets and ensure their
compliance with TOTAL’s safety requirements. Between 2012 and 2015, 98% of the transporters with contracts with Marketing & Services subsidiaries in Africa and the Middle East were inspected and 28% of the contracts were terminated due
to proven non-compliance. In 2015, 172 initial and 35 follow-up inspections were performed. Given these results, this program is to be extended to Marketing & Services’ Latin America and Asia-Pacific regions. Within the more general
framework of road vehicle handling, and given that driver behavior is a key safety consideration, TOTAL is pursuing its policy of training drivers and demanding that they adhere strictly to the Group’s rules. Building on the approach adopted
for assessing transporters, the Africa-Middle East region of Marketing & Services has, as of 2015, introduced a similar process to improve the selection and monitoring of external contractors that perform operations at its sites.
With regard to health, the Group has drawn up a policy to define TOTAL’s minimum requirements in terms of incident prevention and the protection of
health. In particular, based on the Industrial Hygiene and Health at the Workplace directive, the Group’s companies are expected to prepare and carry out a formal risk assessment (chemical, physical, biological, ergonomic or psychosocial),
create a risk management action plan and provide medical monitoring of staff in line with the risks to which they are exposed.
|
|
|
|
|
|
|
|
|
|
|
|
|
|
|
Health indicators
|
|
2015
|
|
|
2014
|
|
|
2013
|
|
|
Percentage of companies included in the WHRS offering employees regular medical
monitoring
|
|
|
99.3%
|
|
|
|
97%
|
|
|
|
95%
|
|
|
Number of occupational illnesses recorded in the year (in accordance with local regulations) per
million hours worked
|
|
|
0.63
|
|
|
|
0.81
|
|
|
|
0.68
|
|
In 2015, there was a 27.5% decrease in recorded illnesses compared to 2014 with respect to the main occupational illnesses
identified at TOTAL:
|
•
|
|
musculoskeletal disorders, the main cause of occupational illnesses, representing 63% of all recorded illnesses in 2015. Following the 65% increase between 2013
and 2014, the 20% decrease recorded in 2015 proves that specific action plans to control risk and improve working conditions must be maintained over the long-term;
|
|
•
|
|
illnesses related to asbestos exposure decreased by 16% compared to 2014, in line with the continuous decline over several years due to the absence of recent
exposure.
|
A Medical Advisory Committee meets regularly to discuss key health issues that may affect the Group’s employees. It
consists of external scientific experts and brings together TOTAL’s management team and the relevant members of the Group. This Committee provides scientific monitoring of health problems that
could impact the Group, thus enabling the best health protection strategies to be put in place when necessary.
In support of the Group’s health policy and to complement the periodic medical surveillance program currently in place and organized by the Group’s medical staff, an employee health observatory has also
been set up. This observatory aims at establishing health indicators for keeping track over the long term of any medical conditions that could affect employees using a population-based approach. This program can be used to quickly identify the
emergence of certain illnesses and, if applicable, suggest and oversee appropriate preventive measures. Approximately 13% of the Group’s employees worldwide, whatever their position, age or horizon, took part anonymously in this program,
thereby providing a representative sample of the Group’s different business segments and professions, including administrative as much as operational staff. Based on the results, actions were taken, particularly in the field of nutrition and
quality of sleep.
On a broader level, TOTAL is associated with promoting individual and collective health in the countries where it operates, including
flu vaccination campaigns and prevention and screening programs for certain diseases (AIDS, cancer, malaria, Ebola, etc.) for employees, their families and local communities. For several years, awareness campaigns have also been in place concerning,
for example, musculoskeletal disorder prevention and lifestyle risks (anti-smoking and anti-drinking campaigns).
|
4.2.2.
|
Environmental protection
|
|
-
|
4.2.2.1. General policy and environmental targets
|
The HSE departments and services within the Group’s entities seek to ensure that both applicable local regulations and internal minimum requirements are being met. The Group steering bodies, led by the
Sustainable Development and Environment department, have a threefold task:
|
•
|
|
monitoring TOTAL’s environmental performance, which is reviewed annually by the Executive Committee, for which multi-annual improvement targets are set;
|
|
•
|
|
handling, in conjunction with the business segments, the various environment-related subjects under their responsibility; and
|
|
•
|
|
promoting the internal standards to be applied by the Group’s business units as set out in the Safety Health Environment Quality Charter.
|
The Group’s environmental targets, which were redefined in part at the beginning of 2013 for the period up to 2017, were as
follows:
|
•
|
|
decrease flaring by 50% from 2005 to 2014 (excluding start-ups);
|
|
•
|
|
improve the energy efficiency of Group facilities by 1.5% on average per year from 2012 to 2017;
|
|
•
|
|
decrease greenhouse gas emissions (GHG) by 15% from 2008 to 2015;
|
|
•
|
|
obtain the “Total Ecosolutions” label for more than 50 products or services by 2015;
|
|
•
|
|
develop a Biodiversity Action Plan by 2015 for all Group industrial sites
(1)
located
in a IUCN
(2)
I to IV or Ramsar convention protected area;
|
|
•
|
|
decrease by 40% the volume of hydrocarbons discharged in the Group’s onshore and coastal wastewater from 2011 to 2017;
|
|
(1)
|
Excluding exploration wells, seismic survey areas and sites for the distribution and storage of products.
|
|
(2)
|
International Union for the Conservation of Nature.
|
|
|
|
|
|
2015 Form 20-F TOTAL S.A.
|
|
53
|
Item 4 - E. Other Matters - 4. Social, environmental and societal information
|
•
|
|
decrease Group SO
2
emissions by 20% between 2010 and 2017; and
|
|
•
|
|
obtain ISO 14001 certification for 100% of the production sites
(1)
by 2017.
|
At year-end 2015, TOTAL had reached, ahead of or on time, all of the environmental targets it had set for 2014
and 2015: reduction of GHG emissions and associated gas flaring; certification of its main operated sites; obtaining the “Total Ecosolutions” label for products and services; and development of a Biodiversity Action Plan for sensitive
sites. In addition, the Group is on track for reaching the above-mentioned environmental targets set for 2017 on improving its facilities’ energy efficiency, obtaining ISO14001 certification for its main production sites and reducing SO
2
emissions. The 2017 target for the reduction of hydrocarbons discharged into water may not be met until 2018.
In order to pursue its progressive approach, the Group defined in early 2016 a new set of coherent environmental targets aligned with the 2010-2020 period:
|
•
|
|
continue its efforts to reduce GHG emissions, particularly through:
|
|
|
1.
|
an 80% reduction of routine flaring
(2)
with the aim to eliminate it by 2030, and
|
|
|
2.
|
an average 1% improvement per year in the energy efficiency of the Group’s operated facilities;
|
|
•
|
|
decrease SO
2
air emissions by 50%; and
|
|
•
|
|
maintain hydrocarbon content of water discharges below 30 mg/l for offshore sites and below 15 mg/l for onshore and coastal sites.
|
In addition, the Group:
|
•
|
|
develops Biodiversity Action Plans for production sites located in protected areas
(3)
;
|
|
•
|
|
does not conduct oil and gas exploration or production operations at natural sites included on the UNESCO World Heritage List
(4)
or in oil fields under sea ice in polar areas; and
|
|
•
|
|
reclaims more than half of its waste and will continue its efforts in this area.
|
TOTAL is developing a policy to decrease the carbon intensity of the Group’s productions (oil, gas, renewable energies) so as to contribute to the evolution towards a lower carbon energy mix.
With regard more specifically to the certification objective, 100% of the 71 production sites emitting more than 10 kt/year of GHG have ISO 14001 certification
since 2013. Overall, at year-end 2015, 290 sites had ISO 14001 certification. In addition, 2 sites in the process of starting up are concerned by the Group’s policy and have been allowed two years to obtain certification. These are CLOV
(Angola), which started up in June 2015, and Laggan-Tormorre (United Kingdom), which started up in February 2016.
The environmental risks and impacts of
any planned investment, disposal or acquisition subject to Executive Committee approval are assessed and reviewed before the final decision is made (also refer to “Item 15 — 4. Internal control and risk management procedures (Article
L. 225-37 of the French Commercial Code)”).
TOTAL seeks to ensure that all employees share its environmental protection requirements.
Employees receive training in the required skills. TOTAL also raises employee awareness through internal communication campaigns (
e.g.
, in-house magazines, intranet,
posters) and provides annual information about the Group’s environmental performance.
H3SE
training courses are organized for managers and senior executives. In 2015, 48 training sessions were attended by 864 participations in 1,957 training days across 20 countries. Three HSE training courses are made available to the business
units: “HSE for Managers”, “HSE Implementation” and “HSE Leadership for Group Senior Executives”. The training session “HSE for Managers” is aimed at senior managers and operational or functional managers who
are currently or will in the future be responsible for one of the Group’s business units (four sessions were held in 2015 with 214 participants). “HSE Implementation” sessions are aimed at employees whose job is specifically to handle
one or more HSE or operational areas within a business unit (one session was held in 2015 with 17 participants). This offer, recently redesigned and presented to Oléum Dunkerque, completes an existing course for the same target
population provided by the Group’s business segments. In addition, the “HSE Leadership for Group Senior Executives” course focusing on management styles has been organized since 2012 (two sessions were held in 2015 with 29
participants). Since 2012, close to 260 senior executives have taken part in this program.
|
-
|
4.2.2.2. Environmental footprint
|
TOTAL implements an active
policy of monitoring, managing and reducing the environmental footprint of its operations. As part of this policy, emissions are identified and quantified by environment (water, air and soil) so that appropriate measures can be taken to better
control them.
Water, air
The Group’s operations generate emissions such as fumes at combustion plants, emissions into the atmosphere from the various conversion
processes and discharges into wastewater. In addition to complying with applicable legislation, the Group’s companies actively pursue a policy aimed at reducing emissions. Sites use various treatment systems that include organizational measures
(such as using predictive models to control peaks in SO
2
emissions based on weather forecast data and the improvement of combustion processes management) and technical measures
(such as setting up wastewater treatment plants, using low NOx burners and the biological treatment of processed water).
The Refining &
Chemicals segment has partnered with Ondeo Industrial Solutions (Suez group) for an ambitious European project launched in June 2013 called “E4Water” aimed at saving large quantities of drinking water and reducing discharges of effluents.
Seven pilot research projects are being conducted at the petrochemicals plant on the Normandy platform. A
€
1.2 million budget was
allocated to test three water treatment processes (wastewater from the site’s water treatment plant, cooling water and cooling blowdown). The pertinent technical knowledge identified by this research could be used to reduce the water footprint
of facilities.
To ensure the quality of its wastewater discharge, TOTAL has set, for all of its offshore exploration and production operations, a target
of complying with the hydrocarbon concentration requirements set out in the OSPAR standard (less than 30 mg/l), which is only mandatory in the North Sea. The Group has achieved this goal for the past six years based on yearly averages.
|
(1)
|
Defined as sites emitting more than 10 kt/year of GHG, with a 2-year tolerance for sites in the process of starting up or recently acquired.
|
|
(2
)
|
Operated routine flaring, in accordance with the World Bank’s Zero Routine Flaring initiative.
|
|
(3)
|
Sites located in a IUCN I to IV or Ramsar convention protected area.
|
|
(4
)
|
Natural sites included on the UNESCO World Heritage List of June 4, 2013.
|
|
|
|
|
|
54
|
|
TOTAL S.A. Form 20-F 2015
|
Item 4 - E. Other Matters - 4. Social, environmental and societal information
|
|
|
|
|
|
|
|
|
|
|
|
|
|
Chronic
emissions into the atmosphere
(excluding GHG) and discharged water quality
|
|
2015
|
|
|
2014
|
|
|
2013
|
|
|
SO
2
emissions
(kt)
|
|
|
59
|
|
|
|
65
|
|
|
|
75
|
|
|
NOx emissions (kt)
|
|
|
82
|
|
|
|
93
|
|
|
|
91
|
|
|
Hydrocarbons in discharged water (rivers, waterways and coasts) (t)
|
|
|
324
|
|
|
|
295
|
|
|
|
306
|
|
N.B.: Because
of the divestures made in the Specialty Chemicals activity over the past years, it has been decided that the chemical oxygen demand in discharged water will no longer be measured as of 2015.
The amount of hydrocarbons discharged in rivers, waterways and coasts increased in 2015. This increase, despite good performances in Gabon, is mainly due to the
increase in treated water volumes due to the aging of the field in Indonesia and a deterioration in the Republic of the Congo, which led to the decision to commission floaters on the Djeno site. This implementation, planned in 2016, should enable to
reduce the quantity of hydrocarbons discharged.
Below are the Group’s achievements at year-end 2015 based on the objectives for air and water set
at the beginning of 2013:
|
•
|
|
16% reduction in hydrocarbon discharges in water (rivers, waterways and coasts) since 2011, down from the -40% target set for 2017; this target may not be
reached until 2018;
|
|
•
|
|
40% reduction in SO
2
emissions compared to 2010, considerably above the -20% target set
for 2017.
|
Soil
The risks of
soil pollution related to TOTAL’s operations come mainly from accidental spills (refer to “— 4.2.2.3. “Incident risk”, below) and waste storage (see “Waste” below).
The Group’s approach to preventing and controlling these types of pollution is based on four cornerstones:
|
•
|
|
preventing leaks, by implementing industry best practices in engineering, operations and transport;
|
|
•
|
|
carrying out maintenance at appropriate intervals to minimize the risk of leaks;
|
|
•
|
|
overall monitoring of the environment to identify any soil and groundwater pollution; and
|
|
•
|
|
controlling pollution from previous activities by means of containment or reduction operations.
|
In addition, a Group directive published in 2014 defines the following minimum requirements:
|
•
|
|
systematic identification of each site’s environmental and health impacts related to possible soil and groundwater contamination;
|
|
•
|
|
assessment of soil and groundwater contamination based on various factors (extent of pollution inside or outside the site’s boundaries, nature and
concentrations of pollutants, presence of a vector that could allow the pollution to migrate, use of the land and groundwater in and around the site); and
|
|
•
|
|
management of health or environmental impacts identified based on the use of the site (current or future, if any) and the risk acceptability criteria recommended
by the World Health Organization (WHO) and the Group.
|
Lastly, decommissioned Group facilities (
i.e.
, chemical plants, service
stations, mud pits or lagoons resulting from hydrocarbon extraction operations, wasteland on the site of decommissioned refinery units, etc.) impact the landscape and may, despite all the precautions taken, be sources of chronic or accidental
pollution. TOTAL has a site remediation policy with the aim to, in agreement with the authorities, allow new operations to be set up once the future use of the land has been determined. These remediation operations are conducted by the Group’s
specialized entities. The
Group’s provisions for the protection of the environment and site remediation are detailed in Note 19 to the Consolidated Financial Statements.
Waste
The Group’s companies are focused on controlling
the waste produced at every stage in their operations. This commitment is based on the following four principles, listed in decreasing order of priority:
|
|
1.
|
reducing waste at source by designing products and processes that generate as little waste as possible, as well as minimizing the quantity of waste produced by the Group’s
operations;
|
|
|
2.
|
reusing products for a similar purpose in order to prevent them from becoming waste;
|
|
|
3.
|
recycling residual waste; and
|
|
|
4.
|
recovering energy, wherever possible, from non-recycled products.
|
A
Group directive revised in 2014 sets out the minimum requirements related to waste management. It is carried out in four basic stages: waste identification (technical and regulatory); waste storage (soil protection and discharge management); waste
traceability, from production through to disposal (
e.g.
, notes, logs, statements); and waste treatment, with technical and regulatory knowledge of the relevant processes, under the site’s responsibility.
TOTAL is especially committed to managing and treating waste classified as hazardous. Due to its nature, hazardous waste is mainly treated outside the Group by
specialized companies (202 kt in 2015 compared with 223 kt in 2014 and 232 kt in 2013).
|
|
|
|
|
|
|
|
|
|
|
|
|
|
|
Waste
treatment processes
|
|
2015
|
|
|
2014
|
|
|
2013
|
|
|
Recycling
|
|
|
42%
|
|
|
|
47%
|
|
|
|
37%
|
|
|
Waste-to-energy recovery
|
|
|
13%
|
|
|
|
9%
|
|
|
|
7%
|
|
|
Incineration
|
|
|
7%
|
|
|
|
8%
|
|
|
|
12%
|
|
|
Landfill
|
|
|
14%
|
|
|
|
20%
|
|
|
|
23%
|
|
Environmental nuisance
The
environmental nuisances resulting from TOTAL’s operations, which may be sound or odor nuisances or the result of vibrations or road, sea or river traffic, are monitored at the Group’s main industrial sites.
Monitoring systems can be put in place (sound level measurements at the site perimeter, networks of “noses” to determine the origin and intensity of
odors, etc.). In addition, most sites have a system for receiving and handling residents’ complaints, the aim of which is to gain a clearer insight into the different types of nuisances and minimize them (refer to
“— 4.3.3. Controlling the impact of the Group’s activities”, below).
The Group has management structures
and systems that present similar requirements and expectations across all the entities. TOTAL strives to minimize the potential impacts of its operations on people, the environment and property through a major risk management policy. This policy
draws on a shared approach that includes, on the one hand, risk identification and analysis, and on the other hand, the management of these risks.
This
structured approach applies to all of the Group’s operated businesses exposed to major risks. It first sets out an analysis of the risks related to these industrial operations based on incident scenarios for which the probability of occurrence
and the severity of the consequences are assessed.
|
|
|
|
|
2015 Form 20-F TOTAL S.A.
|
|
55
|
Item 4 - E. Other Matters - 4. Social, environmental and societal information
Based on these parameters, a prioritization matrix is used to determine whether further measures are needed in
addition to compliance with the Group’s standards and local regulations. These mainly include preventive measures but can also include mitigation measures.
In addition to its drilling and pipeline transport operations, the Group has 232 entities corresponding to:
|
•
|
|
Seveso industrial sites (upper and lower threshold) and their equivalents outside the EU; and
|
|
•
|
|
offshore and onshore operating activities in Exploration & Production.
|
The management of major risks also hinges on:
|
•
|
|
staff training and raising awareness (refer to “— 4.2.2.1. General policy and environmental targets”, above);
|
|
•
|
|
a coherent event reporting and indicators system;
|
|
•
|
|
systematic, structured event analysis, particularly to learn lessons in terms of design and operation; and
|
|
•
|
|
regularly tested contingency plans and measures.
|
In terms of monitoring indicators, the Group reports the number of Tier 1 events as defined by the API and the IOGP. Despite the increase observed in 2015 compared
to 2014, the number of losses of primary containment was lower than in 2013. Like others in the industry, TOTAL believes that process safety indicators cover a long cycle and progress is to be assessed over the long term. In addition to the 51
Tier 1 operational events indicated in the table below, the Group recorded two other Tier 1 events due to sabotage or theft in 2015.
|
|
|
|
|
|
|
|
|
|
|
|
|
|
|
Loss
of containment
|
|
2015
|
|
|
2014
|
|
|
2013
|
|
|
Loss of primary containment (Tier 1)
|
|
|
51
|
|
|
|
39
|
(a)
|
|
|
66
|
|
|
(a)
|
After reclassifying two events that occurred in 2014 in Marketing &
Services, the figure given for 2014 was revised to 39 events (compared to 37 initially).
|
In accordance with industry best
practices, TOTAL also monitors accidental liquid hydrocarbon spills of more than one barrel. Spills that exceed a certain severity threshold (whether in terms of volume spilled, toxicity of the product in question or sensitivity of the natural
environment affected) are reviewed on a monthly basis and annual statistics are sent to the Group Performance Management Committee. All accidental spills are followed by corrective actions aimed at returning the environment to its original state as
quickly as possible.
|
|
|
|
|
|
|
|
|
|
|
|
|
|
|
Accidental
hydrocarbon spills
(a)
|
|
2015
|
|
|
2014
|
|
|
2013
|
|
|
Number of hydrocarbon spills
|
|
|
128
|
|
|
|
129
|
|
|
|
169
|
|
|
Total volume of hydrocarbon spills (thousands of m³)
|
|
|
1.4
|
|
|
|
1.3
|
(b)
|
|
|
1.8
|
|
|
(a)
|
Accidental spills with an environmental impact and of more than one barrel. Soil on sites is deemed to form part of the natural environment unless sealed.
|
|
(b)
|
The 2014 volume was revised: the spill into the natural environment resulting from the leak in the Île-de-France pipeline is estimated at 500 m
3
. This event led to remediation operations that enabled nearly all spilled hydrocarbons to be recovered, along with the unspilled contents of the pipeline (i.e., a total of 5,000
m
3
as initially reported).
|
In addition, the Group has
set up a crisis management process with a dedicated organization (also refer to “Item 15 — 4.3.1. Monitoring of risk management systems”, below). As part of this process, TOTAL regularly trains in crisis management on the basis
of risk scenarios identified through analyses. Based on feedback from past events, in 2014 the Group restructured the crisis management center at the head office to enable the management of two simultaneous crises. In particular, the Group has
emergency plans and procedures in place in the event of a hydrocarbon leak
or spill. For accidental spills that reach the surface, anti-pollution plans are regularly reviewed and tested during exercises. These plans are specific to each company or site and are adapted
to their structure, activities and environment while complying with Group recommendations.
|
|
|
|
|
|
|
|
|
|
|
|
|
|
|
Oil
spill preparedness
|
|
2015
|
|
|
2014
|
|
|
2013
|
|
|
Number of sites whose risk analysis identified at least one scenario of major accidental
pollution to surface water
|
|
|
167
|
|
|
|
155
|
|
|
|
150
|
|
|
Proportion of those sites with an operational anti-pollution plan
|
|
|
98%
|
|
|
|
90%
|
|
|
|
87%
|
|
|
Proportion of those sites that have performed at least one anti-pollution exercise during the
year
|
|
|
98%
|
|
|
|
82%
|
|
|
|
82%
|
|
A plan to mobilize resources against pollution (PARAPOL) is available to the Group’s companies, which also have assistance
agreements with the main third-party bodies specializing in oil spill management (refer to “Item 15 — 4.3.1. Monitoring of risk management systems”, below).
In 2014, the last of the four capping systems resulting from the work carried out by the Subsea Well Response Project, a consortium of nine oil companies including TOTAL, was deployed. These systems are positioned
in various parts of the world (South Africa, Brazil, Singapore, Norway) to provide solutions that can be launched into action in the event of deep offshore drilling pollution incidents. In addition, TOTAL is building its own capping equipment as
part of its Subsea Emergency Response System project. A portion of this equipment was delivered to Angola in 2015 and another one will be delivered to Nigeria in 2016.
With regard to shipping, the Group has an internal policy setting out the rules for selecting vessels. These rules are based on the recommendations of the Oil Company International Marine Forum (OCIMF), an industry
association consisting of the main global oil companies that promotes best practices in oil shipping, and on its Ship Inspection Report (SIRE) Programme. TOTAL does not charter any single-hulled vessels for shipping hydrocarbons and the average age
of the fleet chartered on time by TOTAL’s Shipping division is approximately five years.
|
-
|
4.2.2.4. Sustainable use of resources
|
Water
To determine which facilities are most affected by the
availability of fresh water, TOTAL conducts identification procedures of water withdrawals and discharges across all of its sites.
|
|
|
|
|
|
|
|
|
|
|
|
|
|
|
Water-related
indicator
|
|
2015
|
|
|
2014
|
|
|
2013
|
|
|
Fresh water withdrawals excluding cooling water (million m³)
|
|
|
118
|
|
|
|
112
|
|
|
|
126
|
|
The increase in water withdrawals between 2014 and 2015 is due mainly to the increase in activity of certain refineries in
maintenance shutdown in 2014, the consolidation of Sobegi (France) within the operated scope of Exploration & Production and, to a lesser degree, the increase in New Energies’ solar business.
From 2012 to 2015, TOTAL used the World Resource Institute’s Global Water Tool, WRI Acqueduct and, since 2013, has been identifying the risk levels of its
sites with withdrawals of more than 500,000 m³/year located in areas of potential risk to the water resource. The Local Water Tool (LWT) developed by the Global Environmental Management Initiative (GEMI) is more suitable and is now used to
perform these water risk assessments and to guide the actions needed to reduce these risks in order to optimize the use of water resources at these sites.
|
|
|
|
|
56
|
|
TOTAL S.A. Form 20-F 2015
|
Item 4 - E. Other Matters - 4. Social, environmental and societal information
At year-end 2015, 10 of the Group’s sites (8 in Refining & Chemicals and 2 in Exploration &
Production) were assessed for their level of water risk. These assessments will be progressively extended to priority sites and accompanied by an action plan to reduce risk and optimize water resource use at these sites.
In Exploration & Production operations, reinjecting water extracted along with hydrocarbons (known as produced water) back into the original reservoir is
one of the methods used to maintain reservoir pressure. The technical specifications in force in the Group stipulate that this option be prioritized over other methods. The Group’s R&D programs make it possible to examine the best
techniques for treating this produced water so as to facilitate its reinjection or consider its recovery and otherwise discharge it into the natural environment while respecting natural and regulatory constraints.
Efforts to optimize water risk management tools are being made both internally, with the LWT (used as a multi-site notice board), and externally, via the IPIECA,
which is developing an e-learning module to extend and facilitate access to these tools.
Approximately 83% of the fresh water withdrawals were taken
from the Refining & Chemicals segment in 2015. At refineries and petrochemicals sites, water is mainly used to produce steam and for cooling units. Increasing recycling and replacing water cooling with air cooling, such as at the Normandy
(France) and Antwerp (Belgium) refineries, are TOTAL’s preferred approaches for reducing fresh water withdrawals.
Soil
TOTAL uses the ground surface that it needs to safely conduct its industrial operations and, to date, does not make extensive use of ground surfaces that could
substantially conflict with various natural ecosystems or agriculture.
For open-pit oil sands mining projects, TOTAL strives to ensure that
environmental issues are managed by the operator, in particular with regard to the remediation of affected soils.
Raw materials
Hydrocarbons, an energetic material, are the Group’s main raw material. Optimum use of hydrocarbons therefore lies in what is known as “energy
efficiency”, as described in “— 4.2.3.4. Energy efficiency and ecoperformance” below.
|
|
|
|
|
|
|
|
|
|
|
|
|
|
|
Raw material loss rate
|
|
2015
|
|
|
2014
|
|
|
2013
|
|
|
Hydrocarbon production business
|
|
|
2.5%
|
|
|
|
2.4%
|
|
|
|
2.5%
|
|
|
Refining business
|
|
|
0.5%
|
|
|
|
0.5%
|
|
|
|
0.5%
|
|
|
-
|
4.2.2.5. Protecting biodiversity and ecosystem services
|
Given their nature, the Group’s projects, and particularly Exploration & Production projects, may be located in sensitive natural environments. TOTAL’s operations can therefore have an impact on
ecosystems and their biodiversity.
TOTAL is aware of these challenges and takes biodiversity and ecosystem services into account in its guidelines and
operations:
|
•
|
|
in the Safety Health Environment Quality Charter, which specifies that TOTAL “
is committed to managing (…) its use of natural resources and its
impact on biodiversity
” and, therefore, supports ecosystem services; and
|
|
•
|
|
in the biodiversity approach, set within the Group’s environmental framework, which incorporates the following core principles for action:
|
|
|
1.
|
Deploy the “avoid – mitigate – compensate” hierarchy
: TOTAL applies this approach for the duration of its projects’ lifecycle to minimize the
impact of its activities on biodiversity.
|
|
|
2.
|
Take into account environmental sensitivity of ecosystems
: as part of the course of its business, TOTAL identifies and takes into account the diversity and sensitivity of
various environments in terms of biodiversity.
|
|
|
3.
|
Manage biodiversity
: TOTAL incorporates the biodiversity impact and risk management into its environmental management systems and refers to good practices within the
industry.
|
|
|
4.
|
Report
: TOTAL reports to its stakeholders on its biodiversity performance.
|
|
|
5.
|
Improve knowledge of biodiversity
: TOTAL participates in the improvement of knowledge of biodiversity and ecosystem services as well as managing the stakes involved,
through R&D initiatives taken with local and international partners, professional associations and the Total Foundation.
|
The Group
made a commitment not to engage in oil and gas exploration or extraction operations at natural sites included on the UNESCO World Heritage List of June 4, 2013; in addition, TOTAL currently does not conduct any exploration activities in oil
fields under the sea ice in polar areas. In the Democratic Republic of the Congo, TOTAL made the commitment to not carry out any exploration activity in the Virunga National Park, partly located in Block III of the Graben Albertine.
To develop its projects located in sensitive habitats, TOTAL developed, based on the sensitivity and impact analysis, a Biodiversity Action Plan for Group operated
sites located in the most sensitive protected areas corresponding to IUCN I to IV or Ramsar categories. Two biodiversity action plans were developed in 2015, in Gabon (Atora) and the Republic of the Congo (Djeno); other plans are expected to be
developed, such as in Uganda and Papua-New-Guinea.
The Group actively contributes to the development of best practices related to biodiversity and
ecosystem services management in the extractive industry through its partnerships with IPIECA, the Cross-Sector Biodiversity Initiative (which brings together the Equator Principles signatory banks and the mining and oil industries), the United
Nation Environment Programme’s World Conservation Monitoring (UNEP-WCMC) and other work groups on biodiversity bringing together stakeholders from the private sector (international NGOs, governments, universities, the World Bank, etc.). In
France, TOTAL continues its partnership with the
Fondation pour la Recherche sur la Biodiversité
(Foundation for biodiversity research) and the
Centre Vétérinaire de la Faune Sauvage et des Ecosystèmes des Pays
de la Loire
.
The Group’s
strategy incorporates the challenges of climate change using the International Energy Agency 2°C scenario (450 ppm) as a point of reference. TOTAL’s challenge is to contribute to satisfying the demand for energy of the world’s
growing population while providing concrete solutions to limit the effects of climate change.
To do so, the Group focuses its actions around the
following key points:
|
•
|
|
developing natural gas as the primary fossil energy source due to its lower carbon intensity;
|
|
•
|
|
selecting and developing hydrocarbon projects based on their economic merit order, which incorporates their resistance to low price scenarios;
|
|
•
|
|
developing the solar energy offer as the renewable energy of choice in the evolution of the energy mix, as well as the production of biofuels from biomass;
|
|
|
|
|
|
2015 Form 20-F TOTAL S.A.
|
|
57
|
Item 4 - E. Other Matters - 4. Social, environmental and societal information
|
•
|
|
improving the energy efficiency of the Group’s facilities, products and services, and maintaining efforts to reduce direct emissions of greenhouse gases
(GHG);
|
|
•
|
|
increasing access to more sustainable energy, for as many people as possible, particularly by means of an innovative solar energy solution; and
|
|
•
|
|
stimulating initiatives in the oil and gas sector and supporting the implementation of an international framework on climate.
|
To ensure that investment projects are as profitable as anticipated in the desirable event that the international community agrees to put a
cost on CO
2
emissions, investments have been valued since 2008 generally based on a cost of
€
25 per ton of CO
2
emitted. As of 2016, new investments projects presented to the Executive Committee are evaluated using a cost of
$30 to $40 per ton of CO
2
emitted depending on the price scenario retained. This cost bracket is consistent with the prices generally required to favor, on the one hand, gas
over coal for producing electricity and, on the other hand, R&D in new low-carbon technologies.
|
-
|
4.2.3.1. The role of gas
|
Natural gas
rose from 35% in 2005 to nearly 50% of TOTAL’s production in 2015 and is expected to contribute to approximately half of the Group’s production in the coming years.
The Group believes in the essential role of natural gas as one of the solutions to climate change issues. Indeed, replacing coal with natural
gas at power plants could help reduce worldwide CO
2
emissions by 5 Bt/y,
i.e.
, approximately 10% of worldwide emissions
(1)
. The reduction of GHG emissions linked to the use of gas requires limiting methane losses to less than 3% throughout the entire production value chain. Since methane’s
global warming potential is 25 times higher than CO
2
(2)
and given its short life span in the
atmosphere, a reduction in methane emissions is expected to play a significant role in the fight against climate change.
Due to the nature of its
activities, the Group’s methane losses are structurally less than 1%. The Group strengthened its commitment on this theme of methane losses in 2014 by becoming one of the first members of the partnership between governments and industry
companies regarding the improvement of tools to measure and control methane emissions set up by the Climate and Clean Air Coalition and promoted by the UN Environment Programme and the non-profit organization Environmental Defense Fund.
|
-
|
4.2.3.2. Project selection
|
Particular
care is taken when selecting and developing the Group’s oil projects, based on their economic merit incorporating their resistance to low price scenarios. This notably involves giving priority to low cost oil projects.
In Canada, in the context of the lower oil prices, the Group decided to limit its exposure to oil sands and reduced its interest in the Fort Hills project from
39.2% to 29.2% in November 2015. On the Joslyn (38.25%, operator) and Northern Lights (50% operator) oil sands licenses, the projects were suspended and works have been strictly limited to legal and contractual obligations, and maintaining safety.
In the United-States, R&D-stage oil shale projects (
in situ
and
ex-situ
production technology) in which the Group holds a stake
(through American Shale Oil LLC, 55.7%, and the 50/50 joint
venture with the company Red Leaf Resources), including the development of the Red Leaf pilot, have been deferred.
Beyond its oil projects, the Group has ceased its coal production activities following the sale in August 2015 of its subsidiary Total Coal South Africa and, in addition, has announced the termination of its coal
marketing activities by year-end 2016.
|
-
|
4.2.3.3. Developing renewable energies
|
For some 15 years, TOTAL has been committed to developing renewable energies. The Group’s activities in this area are set out in “— B.4.2. New
Energies”, above. The Group’s priority strategic development is solar energy through its interest in SunPower, 57.48% owned by the Group as of December 31, 2015).
In addition to solar energy, biomass is TOTAL’s second strategic development area in the field of renewable energies. In general, biomass represents approximately 10% of worldwide energy consumption and is
mostly used for heating or cooking purposes. Biomass is the only renewable alternative to fossil resources for the provision of liquid fuel for transport (biodiesel, bioethanol, biokerosene), lubricants and base molecules for chemicals (solvents or
polymers).
TOTAL invests in R&D to reduce direct GHG emissions into the atmosphere by other means. For example, through Total Energy Ventures (TEV),
its venture capital firm created in 2008, the Group supports the development of companies that offer innovative technologies or business models in such areas as renewable energies, energy efficiency, energy storage and sustainable mobility. For
instance, in 2015 TEV acquired a stake in Off-Grid Electric, a supplier of electricity produced by solar energy in African rural areas that have no or poor grid connection. At year-end 2015, TEV had made 24 investments.
|
-
|
4.2.3.4. Energy efficiency and ecoperformance
|
In its scope of activities, TOTAL has made reducing GHG emissions one of its priorities. The Group exceeded its objective of reducing GHG emissions from its operated activities by 15% from 2008 to 2015. The
reduction of GHG emissions entails reducing continuous flaring and improving energy efficiency.
|
|
|
|
|
|
|
|
|
|
|
|
|
|
|
GHG emissions and flaring
|
|
2015
|
|
|
2014
|
|
|
2013
|
|
|
Operated direct GHG emissions (Mt CO
2
equivalent) (100% of emissions from sites operated by the Group)
|
|
|
42
|
|
|
|
44
|
|
|
|
46
|
|
|
Daily volumes of gas
flared
(a)
(million m³ per day)
|
|
|
7.2
|
|
|
|
9.8
|
|
|
|
10.8
|
|
|
Group share of direct GHG emissions (Mt CO
2
equivalent)
|
|
|
50
|
|
|
|
54
|
|
|
|
51
|
|
|
(a)
|
Continuous, safety and operational flaring (including during the start-up of facilities phase).
|
Reducing continuous flaring
Since 2000,
TOTAL has made a commitment to stop continuous flaring of gas associated with crude production for its new projects. The Group’s objective to reduce continuous flaring by half between 2005 and 2014 has been achieved. The flaring objective was
redefined (refer to “ — 4.2.2.1. General policy and environmental targets”, above): the new objective is to reduce routine flaring
(3)
for the 2010-2020 period
by 80%, for this to be eliminated by 2030.
|
(2)
|
Source: fifth assessment report of the Intergovernmental Panel on Climate Change (IPCC).
|
|
(3)
|
Operated routine flaring, in accordance with the World Bank’s Zero Routine Flaring initiative.
|
|
|
|
|
|
58
|
|
TOTAL S.A. Form 20-F 2015
|
Item 4 - E. Other Matters - 4. Social, environmental and societal information
For over 10 years, as part of the Global Gas Flaring Reduction program, TOTAL has worked alongside the World Bank to
help producing countries and industrial players control continuous flaring of associated gas.
Flaring of associated gas declined sharply in 2015 (-27%
compare to 2014), in particular due the end of flaring related to the start-up (in 2014) of CLOV in Angola as well as operational improvements carried out in Nigeria at the Ofon offshore field, which ceased its continuous flaring. Excluding volumes
related to the start-up of facilities, the volumes of flared associated gas totaled 6.8 Mm³/d in 2015.
Improving the energy efficiency of the
Group’s facilities
One of the Group’s performance targets is to better control energy consumption. Internal documents (roadmaps and
guides) describe the challenges and set out methodologies and action plans. Since the beginning of 2013, a Group directive has defined the requirements to be met by year-end 2016 at operated sites that use more than 50,000 tons of oil equivalent per
year of primary energy (approximately 40 sites).
In early 2013, the Group set an objective to improve energy efficiency by 1.5% per year on average
between 2012 and 2017 within Exploration & Production, Refining and Petrochemicals. These activities represent over 95% of the Group’s net primary energy consumption. A Group Energy Efficiency Index (GEEI) was created in early 2013 to
assess the Group’s performance in this area. It consists of a combination of energy intensity ratios (ratio of net primary energy consumption to the level of activity) per business, reduced to base 100 and consolidated with a weighting by each
business’s net primary energy consumption. Its value was defined as 100 in 2012 and the goal is therefore to reach 92.5 by 2017. Within the scope of the alignment of the Group’s objectives for the 2010-2020 period, the objective for this
period is an average 1% improvement per year in the energy efficiency of the Group’s operated facilities.
|
|
|
|
|
|
|
|
|
|
|
|
|
|
|
Energy efficiency
|
|
2015
|
|
|
2014
|
|
|
2013
|
|
|
Net primary energy consumption (TWh)
|
|
|
153
|
|
|
|
153
|
|
|
|
157
|
|
|
Group Energy Efficiency Index (base 100 in 2012)
|
|
|
91.9
|
|
|
|
101.0
|
|
|
|
102.3
|
|
The Group’s very good energy efficiency performance in 2015 is the result of the end of start-up flaring of the CLOV field in
Angola, and the commissioning of the gas exportation project from the Ofon site in Nigeria to the Bonny natural gas liquefaction plant, as well as permanent efforts to improve the availability rate of the Group’s facilities.
The Group is implementing energy management systems based on ISO 50001. The Leuna refinery and Brunsbüttel bitumen plant (Germany) were certified, as well as
several Marketing & Services sites in France in 2015: the Solaize research center, the Saint-Martin d’Hères site, as well as 7 depots and 193 service stations. At Exploration & Production, Total ABK (Adu Dhabi) also
received this certification in early 2016.
Improving the environmental footprint of products and services
Approximately 85% of GHG related to the use of oil and gas are emitted during the customer usage phase, compared to 15% during the production phase. For this
reason, in addition to the measures taken by TOTAL at its industrial sites, the Group believes that improving the environmental footprint of its products is a key factor in the fight against climate change.
The Group has acquired energy service subsidiaries in France and Germany, working mainly for European customers, as
well as in Africa and the Middle East. These service companies use results obtained in-house to give industrial customers advice on improving their performance and energy efficiency.
In France, Energy Efficiency Certificates (
Certificats d’économies d’énergie
– CEE) are awarded by the authorities in recognition of energy-saving activities and, within this
framework, TOTAL has encouraged its customers to reduce their energy consumption. Action taken since 2011 has led to a reduction in its French clients’ energy consumption of 10 Twh/y and its German clients’ power bill of approximately
€
150 million.
Through the
“Total Ecosolutions” program, the Group is also developing innovative products and services that perform above market standards on the environmental front, in particular in terms of reducing energy use, GHG emissions and the impact on
human health. At year-end 2015, 81 products and services bore the “Total Ecosolutions” label, well above the target of 50 products and services. They relate to a variety of sectors, including mobility, agriculture, buildings,
packaging, infrastructure and industrial manufacturing. For example, Total Amyris biodiesel and biocomponent for aviation fuel are produced from renewable raw materials that allow a significant reduction in GHG emissions over their life cycle
(compared to the fossil equivalent). Some of the products result in reduced energy consumption, such as Total Excellium fuel, Total Quartz Fuel Economy lubricant, and the
Azalt
®
ECO
2
and
Styrelf
®
ECO
2
bitumen ranges.
The CO
2
eq emissions avoided throughout the life cycle by the use of
“Total Ecosolutions” products and services, compared to the use of benchmark products on the market and for an equivalent level of service, are measured annually based on sales volumes. This represented 1.7 Mt CO
2
eq in 2015.
|
-
|
4.2.3.5. Access to energy
|
The World
Bank estimate for the number of people without access to electricity has exceeded 1.3 billion. In 2011, TOTAL therefore launched a range of innovative solar energy solutions, accessible to the greatest number of people, led by its flagship project
Awango by Total
(refer to “ — 4.3.4.5. “Giving the most disadvantaged populations greater access to energy”, below).
|
-
|
4.2.3.6. Sector initiatives and international framework
|
In 2014, TOTAL decided to join the call of the UN Global Compact, which encourages companies to consider a CO
2
price internally and publicly
support the importance of such a price via regulation mechanisms suited to the local context. TOTAL also works alongside the World Bank as part of the Carbon Pricing Leadership Coalition. In particular, TOTAL advocates the emergence of a balanced,
progressive international agreement that prevents the distortion of competition between industries or regions of the world. Drawing attention to future constraints on GHG emissions is crucial to changing the energy mix. TOTAL therefore encourages
the setting of a worldwide price for each ton of carbon emitted, provided that great care is taken to protect “sectors exposed to carbon leakage” (as defined by the EU). To this end, six oil industry leaders, including that of the Group,
called for the setting up of carbon pricing mechanisms at the UN Framework Convention on Climate Change in June 2015.
According to
the IEA, the electricity-generating sector is the sector that must contribute most to the decrease of CO
2
emissions in the world by 2035 in order to remain within the 450 ppm of
CO
2
scenario (electricity generation contributes more than 65% to the emission reduction effort, compared to 11% for the industrial
|
|
|
|
|
2015 Form 20-F TOTAL S.A.
|
|
59
|
Item 4 - E. Other Matters - 4. Social, environmental and societal information
sector, 16% for transport and 4% for the construction sector). Substituting coal for gas in the
electricity-generating sector is currently the fastest and cheapest way to reduce worldwide CO
2
emissions. This solution is immediately available and offers the necessary
flexibility to electric networks, which supplements intermittent energies. As a result, TOTAL supports standards that impose emission ceilings on electricity generation. Such standards are being discussed in the United States and the United Kingdom.
In 2014, TOTAL was actively involved in launching and developing the Oil and Gas Climate Initiative (OGCI), a global industry partnership announced at
the UN Climate Summit in New York on September 23, 2014. The aim of this initiative, which at year-end 2015 included 10 major international energy players, is to share experiences, advance technological solutions and catalyze meaningful action
in order to assist the evolution of the energy mix in a manner compatible with climate change issues. In September 2015, the executives of the member companies published the first OGCI report, accompanied by a joint declaration of their support for
an ambitious climate agreement, during a debate on energy and climate issues with international experts.
TOTAL actively followed the deliberations of
the United Nations Framework Convention on Climate Change during the COP21 conference held in Paris, which, on December 12, 2015, resulted in the Paris Agreement, the first universal agreement on climate change.
TOTAL also actively participates in the debate on climate issues and has long-term partnerships with key stakeholders. For example, TOTAL funds research programs in
France conducted by the ADEME, Paris-Saclay and the Climate Economics Chair at Paris-Dauphine University, as well as the Massachusetts Institute of Technology (MIT) in the United States. TOTAL has also been an active member of the World Business
Council for Sustainable Development since 2014. Lastly, TOTAL offers training and makes presentations at several universities, thereby taking part in the debate.
|
4.3.
|
Societal information
|
|
4.3.1.
|
TOTAL’s societal approach
|
In
line with the values and principles set out in its Code of Conduct and Safety Health Environment and Quality Charter, TOTAL places its commitment to community development at the heart of its corporate responsibility in order to create shared value
with people living near its facilities, its customers and suppliers, and its employees. Dialogue with stakeholders, impact management and the creation of shared value are the pillars of the Group’s societal policy.
This approach, which is deployed in direct relation with operations, encompasses all actions taken by the Group to improve the way it is integrated in the countries
where it operates. In line with the strategic priorities defined by senior management, reporting tools are used to track and monitor overall societal performance. Eight indicators, which are based on the societal policy, cover the quality of
dialogue with stakeholders, the management of the impact of the Group’s activities, socioeconomic development projects and access to energy. Four topics have been identified as “Group Priorities”: education, employment, road safety,
and access to energy.
|
4.3.2.
|
Dialogue and involvement with stakeholders
|
Openness, dialogue and engagement are essential for developing long-term, constructive and transparent relations with stakeholders. For the past 20 years or so, changes in the regulatory framework have promoted
information, consultation and dialogue prior to high-impact decisions being made.
In addition to complying with regulations, TOTAL encourages dialogue
at every level of its organization. The foremost
requirement of the societal directive is that “
each asset must consult its stakeholders regularly to gain a clearer understanding of their expectations and concerns, measure their level
of satisfaction regarding the Group and identify avenues of improvement for its societal strategy
”.
|
-
|
4.3.2.1. Stakeholder consultation
|
In
Exploration & Production, dialogue is initiated within the framework of societal baseline studies carried out to identify at a very early stage, even before the start of operational activities, stakeholders that may potentially be affected
and to understand the human socioeconomic context of the area in question. The Community Liaison Officer (CLO) maintains a dialogue between the subsidiary and the local communities. CLOs, who are employees of TOTAL, are members of the local
community and therefore speak the local language and understand local customs; as such they often play a key role in facilitating the company’s integration into the local context. To formalize and organize relations with stakeholders,
agreements may also be signed and meetings held, such as public consultations.
In the Democratic Republic of the Congo, a Consultation Committee
composed of 10 members (5 women and 5 men) elected from among those living in the permit area was set up. The first Committee meeting was held in the presence of the Territory Administrator and representatives of the Ministry of Hydrocarbons.
In Azerbaijan, the consultation of local stakeholders (administration, nearby industrial players, the public, existing training centers, local NGOs,
etc.) continued in 2015 in preparation for the development of the deep offshore discovery in the Absheron Block, which includes the construction of an onshore terminal.
In addition to holding regulatory forums for dialogue, Refining & Chemicals has voluntarily set up structures for dialogue with local stakeholders (such as Community Advisory Panels in the United
States and special commissions for some European platforms). In 2015, Refining & Chemicals signed the Responsible Care
®
Global Charter for its worldwide operated
petrochemical activities, thereby reaffirming its commitment to the safe handling of chemicals. One of the principles of this Charter is to engage stakeholders in order to understand and respond to their concerns on improving operational and product
safety.
|
-
|
4.3.2.2. Implementation of the SRM+ tool
|
To put its societal approach on a professional footing, TOTAL has applied its internal Stakeholder Relationship Management (SRM+) methodology since 2006. The aim of this methodology is to identify and map the main
stakeholders, schedule meetings with them, understand their views and issues, and then define an action plan for building a long-term relationship. It makes it possible to establish a trust-based relationship and work with complete transparency.
These discussions allow the Group to identify expectations to which it can respond and consolidate the societal strategy of the subsidiaries and sites. Since 2006, SRM+ has been implemented in over 100 entities.
In 2015, in Exploration & Production, this was the case in Papua New Guinea, where the methodology was adapted to carry out due diligence in order to
better understand the societal practices of the former operator and to consult with those living around the site.
In Refining & Chemicals, the
methodology was implemented in France on the Donges platform in the Loire-Atlantique region.
In Marketing & Services, a specific module was set
up for small sites, allowing 11 subsidiaries of the Africa – Middle East division to begin a consultation process with stakeholders in 2015 at
|
|
|
|
|
60
|
|
TOTAL S.A. Form 20-F 2015
|
Item 4 - E. Other Matters - 4. Social, environmental and societal information
33 sites (service stations, depots and head offices). Four countries (Algeria, Lebanon, Democratic Republic of
the Congo and Mauritania) launched this initiative for the first time, while others are implementing it for new sites or have relaunched a consultation procedure after several years. A total of 39 countries have implemented SRM+ in this region.
In 2015, a new and more streamlined SRM+ guide and manual for managers and operational staff was drawn up to include new developments made since the
tool was first launched in 2007.
|
-
|
4.3.2.3. Respecting the rights of indigenous peoples
|
TOTAL is aware of the specificities of indigenous and tribal peoples (as referred to in International Labour Organization’s Convention No. 169) and has developed a charter of principles and guidelines
regarding indigenous and tribal peoples to be followed with communities that are in contact with its subsidiaries. This Charter encourages the use of experts in order to identify and understand these peoples’ expectations and specificities,
consult with them and contribute to their socioeconomic development.
Convinced that respect for the human rights of local populations is a cornerstone
of its industrial projects, TOTAL participated in the work of IPIECA (the global oil and gas industry association for environmental and social issues) to develop the guide entitled “
Indigenous peoples and the oil and gas industry: context,
issues and emerging good practices
”. The Group thus shared its experience with the Guarani people in Bolivia. Partnerships have been forged with institutions known to be experts in their field in order to enhance the societal team’s
professionalism in implementing projects and allow for benefits to be shared equitably and transparently. A number of socioeconomic development initiatives have been launched to support the fight against discrimination, especially gender
discrimination.
A chance archaeological discovery (bones, ceramic fragments, etc.) made by Total E&P Bolivia at the Incahuasi field during
construction work was managed in collaboration with the Bolivian authorities and the local Guarani communities. Social and environmental monitors from these communities provided oversight of the archaeological site. At the request of the Guarani
communities, TOTAL changed the architecture of its construction project and agreed to re-bury the remains in the same place where they were found and ensure communities retained access to this sacred place.
|
4.3.3.
|
Controlling the impact of the Group’s activities
|
To better control the impact of its operations, the Group has integrated its societal approach into its operational processes via the Group’s H3SE (industrial hygiene, safety, security, societal and
environment) management system, known as MAESTRO (Management And Expectations Standards Towards Robust Operations). Audits conducted with MAESTRO give rise to recommendations and strengthen efforts in order to better manage the societal impacts of
the Group’s operations.
|
-
|
4.3.3.1. Conducting impact assessments
|
An understanding of the socioeconomic context is gained through a baseline study, which is generally accompanied by a consultation phase involving local
stakeholders.
In Exploration & Production, impact assessments are carried out before any operation to avoid, reduce and compensate for negative
impacts. In 2015, a team of some 20 people in Papua New Guinea was recruited to prepare geotechnical studies and undertake societal and environmental assessments of the potential Papua LNG project sites. The technical team used the results of the
assessment to minimize the potential impacts on the local population.
In Uganda, the results of the societal and health baseline study were incorporated into an Environmental, Social and
Health Impact Assessment and specifications were submitted to the government for approval. A Preliminary Resettlement Action Plan was developed along with a risk identification methodology. Following the exploration phase, the subsidiary
commissioned a consultant (ASLO) and an international NGO (International Alert) to conduct an ex-post assessment of its societal performance with an analysis based on consultation of the local populations.
In addition, to assess the impact of its operations in host countries, the Group regularly works with CDA, an independent non-profit organization. In 2015, CDA
conducted an assessment in Argentina and a number of recommendations were made in a report to better integrate operations into the local socioeconomic fabric. CDA impact assessments systematically produce reports, which are available online on the
organization’s website.
Finally, the MOST (Management Operational Societal Tool) now offers a standard version that allows users to manage
stakeholder relations, site-related grievances and societal projects. Specific modules (access to land, compensation and employment) can be added to this common framework. Societal data is geo-referenced, with automatic display in a geographic
information system. MOST generates reports that serve as a basis for the analysis of societal performance. This tool is used as part of the professionalization of local teams. In 2015, this tool was used in 13 countries and will be implemented
more widely in 2016.
|
-
|
4.3.3.2. Handling grievances from local communities
|
A grievance mechanism is gradually being introduced at all the Group’s subsidiaries and sites. These systems are already in place at all Refining & Chemicals platforms.
In Exploration & Production, a guide on the handling of grievances, inspired by the UN Guiding Principles on Business & Human Rights, was drawn up
in 2013. In Denmark, for example, grievances received during the drilling of an exploration well were recorded in MOST and follow-up action was taken by the CLO. This grievance mechanism was also implemented in 2015 in Papua New Guinea and the
Democratic Republic of the Congo. The Group’s expertise contributed to the development by IPIECA of a Community Grievance Mechanism Toolbox that is now available on its website. In 2014, Marketing & Services published a brochure to
raise awareness of grievance management to allow the segment’s subsidiaries and operating sites to become familiar with this subject and introduce a dedicated system separate from the one used to handle commercial complaints. This mechanism was
incorporated into Marketing & Service’s societal framework.
|
-
|
4.3.3.3. Improving road safety
|
Road
safety is one of the Group’s priorities (also refer to “— 4.2.1. “Occupational health and safety”, above), particularly in terms of societal matters.
To mobilize the public and private sectors, TOTAL created in 2012 an independent organization known as Safe Way Right Way with a view to mobilize partners, raise funds, set up training and awareness initiatives and
improve regulations and their implementation.
TOTAL is a member of the Global Road Safety Partnership (GRSP). The aim of this public-private partnership
is to improve road safety and share expertise in this area. In this context, the Group has partnered with Toyota to help implement the “Safe to school – Safe to home” program developed by the GRSP in Zambia. TOTAL also co-financed the
African Road Safety 2015 conference organized by the GRSP in Lusaka, during which public
|
|
|
|
|
2015 Form 20-F TOTAL S.A.
|
|
61
|
Item 4 - E. Other Matters - 4. Social, environmental and societal information
authorities, international institutions and the private sector were able to discuss their policies regarding road
safety in Africa.
The “Safety Cube”, a box containing fun educational materials, supports road safety awareness campaigns in schools. Made
available by the subsidiaries in 37 countries in the Africa – Middle East region in partnership with education and transport ministries and local NGOs and through the active involvement of employees, this program has grown and supports such
initiatives as the opening of the Children’s Road Safety Education Center in Senegal. This program was also deployed in Asia, where 3,000 children have already been made aware of road safety issues in around 10 countries over the past two
years. In total, nearly 440,000 children were made aware of the dangers of the road.
A qualitative study was carried out in 2015 by the GRSP with four
subsidiaries (South Africa, Kenya, Morocco and Zambia) on the use of the Cube. The purpose of this study was to receive feedback on how the project is perceived by the schools in which the program was deployed. The large majority of teachers stated
they were satisfied and felt that the educational content was pertinent and effective. One suggested area for improvement is to integrate this project into a wider road safety strategy that includes action on schools surroundings and involves local
communities more.
In France, TOTAL has, since 1995, contributed to the
10 de Conduite Jeune
training operation for young drivers in cooperation
with the French national police, Groupama and Renault. Each year, this initiative raises awareness among more than 10,000 junior and secondary school students.
|
4.3.4.
|
Creating local value
|
TOTAL’s
goal is to act and be recognized both as a partner in the long-term economic and social development of the communities and regions in which the Group operates, and as a key player in access to energy. The Group has a special responsibility to the
communities living close to its facilities and endeavors to make its activities a source of value and opportunity for them.
TOTAL is building a global,
integrated local development approach (“In-Country Value”) that creates synergies among all the value-creating elements for host countries (infrastructures, support for local industries, employment, subcontracting, socioeconomic
development projects, education, access to energy, etc.) by promoting the Group’s industrial know-how. This approach is reflected in two key strategies: on the one hand, the Group’s commitment to local content and, on the other hand,
support for the implementation of socioeconomic programs, including in particular the implementation of access-to-energy programs.
|
-
|
4.3.4.1. Committing to local content
|
TOTAL is committed to: employing more local staff and subcontracting more work to local businesses wherever the operating constraints of its activities allow,
particularly through training and support programs intended for small and medium-sized enterprises (SME) and companies that shape the local economy; helping to diversify the economies of the regions in which it operates by supporting local
initiatives; and contributing to human development, mainly by focusing on education and strengthening local development skills and capacities.
To this
end, Exploration & Production is shifting from a local content approach (focused mainly on direct and indirect local employment) to an In-Country Value approach geared toward local value creation. It has also developed a roadmap centered on
four main areas: publishing future industrial and manpower needs; using a unique supplier database for each subsidiary; developing a
large-scale program for training technicians; and comprehensively studying local value creation. TOTAL participated in the development of the IPIECA “Local content strategy guide” and
helped update this document in 2015.
In Papua New Guinea, where TOTAL opened a subsidiary in 2014, the Elk-Antelope project team is working on a local
value creation strategy aimed at integrating local businesses and professionals from the facilities construction phase. To this end, TOTAL conducted a national industrial survey in 2015 that enabled it to identify avenues for developing the
country’s industrial fabric and the skills of its workforce.
Training and education are the key pillars of the In-Country Value approach. For
instance, in Marketing & Services in Africa and the Middle East, the “Young Dealers” program aims to help young service station employees gain promotion to management positions. Approximately 20% of the service stations in
Africa – Middle East are managed by young dealers. Another program launched in 2014, the “Young Graduate” program, is intended for young graduates from Africa or the Middle East with five years of higher education and less
than one year of professional experience. This career trajectory strengthens their skills and makes it easier to recruit young people with high potential. Currently, 140 “Young Graduates” are working in retail, operations or finance. More
than 40 of them have taken up a position outside their country of origin.
|
-
|
4.3.4.2. Boosting regional development and supporting industrial restructuring
|
TOTAL has set up a program to pre-qualify and certify French SMEs, in line with Group standards, in order to work with more local suppliers. In addition to the jobs
generated by its activities, the Group, as a responsible company, supports SMEs, mainly in France, through its Total Développement Régional (TDR) entity. The Group relies on TDR for the local implementation of agreements signed with
the French government and local public players in connection with its industrial conversion projects. These included, for example, the conversion of the ICD platform in Dunkirk and the future Carling Saint-Avold and La Mède platform projects.
This support is a major element in TOTAL’s commitment to its industrial and economic responsibilities and takes a number of different forms within
TDR. These include financial assistance for the setting up, development or takeover of SMEs in the form of loans, industrial conversion assistance alongside local development bodies, assistance in the development of export activities and
international trade, and help for innovative SMEs. These programs help create long-term jobs. Over the past three years (2013-2015), TDR has issued a total of
€
21.2 million in loans to 419 SME projects, thereby supporting nearly 8,000 jobs.
To maintain industrial
activities and jobs once refining operations at the Flanders facility end, two industrial projects are underway: construction of a dietary phosphate production plant by 2017 (Ecophos), and construction of a pilot biodiesel and biofuel production
plant in which the Group has a stake (BioTfueL). The activities maintained at the Flanders facility currently provide 260 positions and 130 subcontracting jobs.
In Carling, the steam cracker was permanently shut down in October 2015. To adapt the platform and ensure its future by restoring its competitiveness, TOTAL expects to invest
€
180 million by the end of 2016 to develop new activities in the growing hydrocarbon resins (Cray Valley) and polymers markets. TOTAL has
made a commitment to implement this industrial conversion without any lay-offs and to fulfill all of its contractual obligations with its clients and partner companies, particularly
|
|
|
|
|
62
|
|
TOTAL S.A. Form 20-F 2015
|
Item 4 - E. Other Matters - 4. Social, environmental and societal information
through a support fund. In addition, TOTAL commits to improving the industrial platform’s attractiveness by
developing a shared services offer, with the aim to help new economic stakeholders establish in the area. In this way, TOTAL confirms its responsibility towards the employment areas in which the Group operates as well as its commitment to maintain a
strong and sustainable industrial presence in the Lorraine region. A framework agreement signed in early 2015 between the Chairman of the Lorraine region and TOTAL aims to leverage the Group’s expertise and financial means to develop the
area’s industrial fabric.
In 2015, TOTAL announced its plan to adapt its operations in La Mède by stopping refining activities and investing
in converting the platform to renewable energies and high value-added products. This project will be completed without any lay-offs. TDR will be involved to help minimize the impact on subcontractors.
|
-
|
4.3.4.3. Acting as a partner for human, social and economic development
|
TOTAL’s contribution to the socioeconomic and human development of the countries in which the Group operates is reflected in its involvement in local development programs.
In 2015,
€
384 million ($426 million) was spent on
societal projects, compared to
€
459 million in 2014 and
€
357 million in 2013. Certain expenses are managed directly by host countries in application of contractual provisions, for example in Nigeria (Niger Delta Development Committee) or the Republic of the
Congo (
Provisions d’investissements diversifiés
). In 2015, 3,063 societal actions were reported. These programs support local populations and fall into three main categories: local economic development, human and social
development, and citizenship. Approximately 85% of expenditure for societal projects goes to countries outside the OECD.
Two cross-functional priorities
underlie these projects: partnerships and skills development. Built on constructive dialogue and the determination to forge long-term relationships of trust with stakeholders, partnerships with local institutions and organizations guarantee the
long-term success of projects. In all its actions, TOTAL ensures that it does not take the place of local authorities and teams up with NGOs that have solid field experience. In the same vein, TOTAL promotes actions that help strengthen the ability
of individuals and local bodies to organize their own development independently in order to ensure sustainability.
The Group’s expertise is based
on the continued professionalization of its societal teams through structuring projects, setting goals and monitoring performance indicators. At the Group’s head office, an individual is dedicated to relations with NGOs. In
Exploration & Production, more than 400 people are involved in societal matters, with over 360 involved on a full-time basis. In 2015, some 100 employees involved in societal projects from many of the Group’s entities attended a Group
Societal Seminar to share experiences, followed by a training session on human rights presented by the Danish Institute of Human Rights. Several in-house training modules have been created for all Group employees, including an e-learning launched in
2015 on the Group’s societal commitment.
|
-
|
4.3.4.4. Supporting education
|
Education is key to creating shared value by helping host countries develop the skills of their young people and training the future employees that industry will
need. TOTAL’s contributions to education are framed within existing local systems, adapted to local realities and always undertaken in the form of partnerships. In addition to support for primary and secondary education where needs have been
identified, the Group’s educational initiatives are
built around four core international programs: scholarships, partnerships with universities, teaching and research chairs, and professional training.
TOTAL promotes the internationalization of its management, the recruitment of local personnel and their access to positions of responsibility, particularly within
their original subsidiaries. To achieve this, the Group offers local, regional and international scholarships prior to recruitment. Each year, these scholarships enable several thousand young people to pursue their studies throughout the world and,
since 2004, over 1,000 students from the Group’s host countries have been able to prepare for qualifications (doctorates, MBAs, Master’s degrees, engineering schools, bachelor’s degrees and university institutes of technology) at the
best institutions, mainly in France or other European countries.
To help the companies recruit qualified local staff, TOTAL helps to strengthen the
African continent’s universities by making the Group’s technical and scientific expertise available to them. Twenty-nine framework agreements have been signed with leading institutes of higher education, such as the 2IE Institute in
Burkina Faso and the universities of Cape Town and Witwatersrand in South Africa. The university partnership program launched in Africa in 2010 has been extended to all of Europe, Asia and the Middle East and now includes 80 establishments that
maintain a regular dialogue with TOTAL. In addition, professional training programs adapted to the needs of each country are organized in cooperation with local actors and allow trainees to obtain diplomas and recognized professional qualifications.
Thus, the Group’s entities have introduced a large number of training schemes adapted to meet the specific local context, particularly in Africa.
TOTAL supports teaching and research chairs, and in particular research and innovation at 32 institutions, to address the needs of the business world.
These programs are complemented by “TOTAL associate teachers” (
TOTAL professeurs associés
). This original initiative is a non-profit
association run by current or retired employees of the Group who teach courses free of charge in schools and universities. Over 250 teachers give courses and lectures in
oil-related
fields. Since 2001, more
than 160,000 students throughout the world have benefited from this expertise.
Finally, to help provide access to education to as many people as
possible, TOTAL broke new ground in 2015 by contributing to the creation of a free massive open online course (MOOC) on the oil chain entitled “Oil & Gas: from Exploration to Distribution”, a
four-week
online course taken by more than 21,800 learners worldwide, half of whom were from the African continent.
|
-
|
4.3.4.5. Giving the most disadvantaged populations greater access to energy
|
For more than 10 years, several Group subsidiaries have been engaged in various one-off access-to-energy projects, usually in cooperation with neighboring communities and local authorities in host countries,
without always aiming to economic viability and sustainability objective. To improve its societal performance and structure its approach, TOTAL aims to develop models that are both profitable and sustainable. For this reason, in 2010 the Group
launched the “Total Access to Energy” program, a source of initiatives for identifying and testing solutions that facilitate access to energy for the poorest populations.
Awango by Total
, a new business model
The first large-scale achievement to come out of
this program,
Awango by Total
is a business response to a societal problem. This innovative, sustainable and reproducible business model
|
|
|
|
|
2015 Form 20-F TOTAL S.A.
|
|
63
|
Item 4 - E. Other Matters - 4. Social, environmental and societal information
offers a range of solar solutions for lighting and recharging small electrical appliances such as mobile phones.
Launched in 2011 in four pilot countries, this offer was sold in over 30 countries in 2015, including 6 where it is currently being launched. At the end
of 2015, 1.3 million lamps have been sold, improving the day-to-day lives of six million people and exceeding the target set in 2012 at the Rio+20 conference. The distribution networks used are both TOTAL’s traditional networks (service
stations) and “last mile” networks built with local partners to bring these solutions to isolated areas. Reseller networks are then set up and programs developed with the support of external partners to recruit and train “Young Solar
Resellers”.
This model is based on innovative partnerships with various stakeholders: development experts, NGOs, manufacturers, institutional
bodies and associations, microfinancing institutes, etc. In 2014, TOTAL and the IFC entered into a 3-year partnership to support the Lighting Global program. On the ground in Uganda,
Awango by Total
lamps have been sold since 2013 in the Lake
Albert region through partnerships with local villager associations and the Caritas Arua NGO.
In Haiti, a partnership with Entrepreneurs du Monde led to
the development of a social business (Palmis Eneji) through the use of microfinance mechanisms. A pilot project is also underway in the Philippines with Entrepreneurs du Monde to measure the societal impact of solar solutions on populations that use
them (
e.g.
, health, education, savings, revenue generated).
The Group’s goal is to further develop this program with a target of five
million lamps sold in Africa by 2020, benefiting 25 million people on a continent that is at the core of TOTAL’s global strategy.
In 2015,
Babyloan, a European leader in crowdfunding, and TOTAL teamed up to develop the first crowdfunding platform dedicated to access to energy. This partnership aims to accelerate access to energy and related financing solutions, particularly in Africa,
Asia and Latin America, where the need is greatest. This brings together Babyloan and TOTAL’s complementary expertise: in crowdfunding and microfinance for Babyloan, and in access to energy for TOTAL. This collaboration aims to support the
creation of local microbusinesses that will develop distribution networks towards isolated communities and better face of last mile distribution challenges.
Fighting fuel poverty and developing more inclusive mobility
The aim of the “fuel poverty and inclusive
mobility” project in France is to reduce heating costs (via thermal renovation) and enhance mobility for low-income households.
To respond to the issue of fuel poverty, the Group is working alongside the French government and other energy producers in the “Living
Better” program, which has allowed 150,000
low-income
households
(1)
to benefit from thermal renovation since its creation in
2011. In addition, the 90 energy efficiency ambassadors at PACT and FACE (agreement signed in 2014 with the French Ministry for the City, Youth and Sport) have helped to identify and support households affected by energy poverty in
30 departments in France (assistance with building renovation formalities, financing solutions, training in eco-friendly behaviors).
The Wimoov association provided mobility advice and solutions to 7,500 people
(1)
in 2015, 50% of whom found jobs or new
employment. As a result of TOTAL’s support, new mobility platforms were opened and developed. In 2015, the Inclusive Mobility Laboratory created by TOTAL and Wimoov welcomed five new members
– the Red Cross, FARE (French federation of road associations for education), Michelin, Keolis and Transdev – and worked on the global recognition of mobility advisors and innovative services available to vulnerable groups, including local
support via community services and tailored digital solutions that bring together transport operators and players in the social economy. The call for projects issued in partnership with the French Ministry for the City, Youth and Sport (Experimental
Youth Development Fund) has made it possible to fund and support, via the Agence Nationale des Solidarités Actives (national agency for active inclusion), 16 innovative youth initiatives throughout France until the end of 2016.
Finally, TOTAL launched a social business model involving service stations with reduced investment and operating costs for municipalities (two openings in 2015) to
facilitate access to fuel in rural areas in France.
|
4.3.5.
|
Partnerships and philanthropy
|
In
addition to the societal initiatives that are directly related to the Group’s industrial activities, TOTAL has also been committed for over 20 years to taking general-interest measures in the countries where it has operations. These actions are
essentially conducted by the Total Corporate Foundation and the Philanthropy Department of TOTAL S.A.
|
-
|
4.3.5.1. Total Corporate Foundation
|
For the period of 2013-2017, the Group has renewed its commitment to its Corporate Foundation, which has a 5-year budget of
€
50 million. The Foundation is active in four fields: health, solidarity, oceans and marine biodiversity, culture and heritage.
In the health field, the Group has been a partner of the Pasteur Institute since 2005. The aim of this partnership, renewed for 2015 to 2017, is to support projects
to combat childhood diseases as well as research programs and field actions in partnership with the Group’s subsidiaries, mainly in Africa and South-East Asia.
In the field of solidarity, the Foundation encourages Group employees to engage with the community through support for projects championed by non-profit organizations with which they volunteer on a personal basis.
In 2015, the Foundation supported 42 employee projects in 33 countries.
With regard to marine biodiversity, the Foundation funds research programs
undertaken to improve knowledge about marine species and ecosystems and challenges related to their protection and enhancement. For the 51 projects supported in 2015, the Foundation ensures the sharing of knowledge through awareness and education
campaigns. In particular, it backed the Lengguru scientific expedition in West Papua. Led by the Institute of Research for Development, the Indonesian Institute of Sciences and the Sorong Fisheries Academy, this project mobilized more than 70
European and Indonesian researchers.
In the culture and heritage field, the Total Foundation partly funded 12 exhibitions in 2015 that helped to
showcase the cultures of the countries in which the Group operates. In 2015, the Total Foundation and the Fondation du Patrimoine (heritage foundation) renewed their partnership for the fourth time for the 2015-2017
|
(1)
|
Source: Wimoov, an association that accompanies audiences from difficult situations (people with disabilities, people needing integration into the
professional world, the elderly, etc.) to give them more mobility.
|
|
|
|
|
|
64
|
|
TOTAL S.A. Form 20-F 2015
|
Item 4 - E. Other Matters - 4. Social, environmental and societal information
period. The partnership primarily focuses its activities on the rehabilitation of the country’s industrial,
craft, port and maritime heritage converted for sociocultural purposes and on work sites designed to further professional training and social integration. Since 2006, more than 155 projects, including 29 worksites for employment integration, spread
across France, have received nearly
€
21 million in funding from this partnership.
|
-
|
4.3.5.2. TOTAL S.A. philanthropy
|
In
the field of solidarity, the Philanthropy Department has forged a number of major institutional partnerships in France. Since 2009, it has worked with the French government and the ministry responsible for youth to promote the social, professional
and civic integration of young people through programs that have already benefited over 200,000 people. This partnership, with an overall budget of
€
60 million and the experimental youth development fund as its primary technical and financial tool, has enabled the financing of more than 260 projects since its creation. In 2014, the program was
renamed “
La France s’engage
”.
In the field of marine biodiversity, the Group has been a partner of the French Society of Sea
Rescuers (SNSM) since 2008. Through its funding and expertise, it plays a role in improving the safety of rescue operations and training volunteers. Thanks to its support, the Sea Rescuers have a center equipped with a state-of-the-art navigation
and vessel handling simulator. Each year, more than 300 rescuers have access to this training.
In the field of culture, convinced that access to culture
from a very young age is key to self-confidence and respect for others, the Group supports numerous initiatives designed to instruct young people in the worlds of art and culture. In total, nearly 75,000 children from metropolitan France and the
Overseas Departments have benefited from these projects.
|
4.3.6.
|
Contractors and suppliers
|
TOTAL’s activities generate hundreds of thousands of direct and indirect jobs worldwide. The Group’s purchases alone represented approximately $40 billion
worldwide in 2015. The average breakdown, at the Group level, of expenditure for purchases of goods (products, materials, etc.) is approximately 25% and of services (including consulting services, work with supply of materials, transport, etc.) is
approximately 75%, excluding crude oil materials. The number of hours worked by subcontractors is monitored for large projects. This involves a range of environmental, social and societal impact concerns addressed by TOTAL when dealing with its
suppliers via its principles, purchasing commitments and sustainable procurement initiatives.
TOTAL’s societal commitment is shared by the
Group’s employees, partners, customers and suppliers, in particular by employing more local staff and subcontracting more work to local businesses wherever the operating constraints of its activities allow. The Group’s societal directive
stipulates that purchasing processes must be adapted as required in cases where a societal action plan has been implemented.
TOTAL has created a map of
the CSR risks and opportunities in the Group’s main purchasing categories to identify key issues in three areas: ethics and human rights, environmental impact and the creation of value with local communities. Pilot projects were implemented in
certain purchasing categories to integrate the monitoring of CSR aspects into the purchasing process through concrete measures (
e.g.
, specific questionnaire focusing on the Fundamental Principles of Purchasing, drafting of suitable contract
clauses, good practices guide for purchases from the disabled and sheltered employment sectors). For example, for a multi-country “car wash” call for tenders, typical of Marketing & Services’
activities, the map encouraged the buyer/internal client team to take a “total cost of ownership” approach (calculated by adding to the initial purchase price costs incurred by the
client when using and disposing of the product: power and water consumption, end-of-life processing costs, etc.) and incorporate environmental criteria into the specifications and then into the contract. The map was updated in 2015 to reflect the
Group’s main purchasing categories and presented to the buyers, the Group Purchasing Committee and the Ethics Department.
|
-
|
4.3.6.1. Monitoring responsible practices among suppliers
|
In its Code of Conduct, TOTAL states that it works with its suppliers to ensure the protection of the interests of both parties on the basis of clear and fairly negotiated contractual conditions. This relationship
is founded on three key principles: dialogue, professionalism and adherence to commitments.
TOTAL expects its suppliers to:
|
•
|
|
adhere to principles equivalent to those in its own Code of Conduct, such as those set out in the Fundamental Principles of Purchasing directive; and
|
|
•
|
|
agree to be audited, be particularly attentive to the human rights-related aspects of their standards and procedures, in particular their employees’ working
conditions, and ensure that their own suppliers and contractors respect equivalent principles.
|
The Fundamental Principles of
Purchasing, launched in 2010 and formally set out in a Group directive in 2014, specify the commitments that TOTAL expects of its suppliers in the following areas: respect for human rights at work, health protection, assurance of safety and
security, preservation of the environment, prevention of corruption, conflicts of interest and fraud, respect for competition law, as well as the promotion of economic and social development. TOTAL’s suppliers must be made aware of the rules it
contains, which apply to all the Group’s companies, by including them, suitably transposed if necessary, into the agreements concluded with these suppliers. These principles are available for consultation by all suppliers in both French and
English on TOTAL’s website (under “Suppliers”).
Questionnaires focused on environmental and societal issues are used to gather more
in-depth information from suppliers about their approach to these subjects, either during pre-qualification or as part of an audit. Supplier relations are also considered from an environmental and societal perspective on occasion as part of ethical
assessments of Group subsidiaries and entities undertaken by GoodCorporation (refer to “ — 4.3.7.2. “Respect for human rights”, below) in all continents in which the Group is present.
In 2015, TOTAL signed an agreement with the worldwide trade union federation, IndustriALL Global Union, which marks a major step in TOTAL’s commitment as a
responsible employer (refer to “Item 6 — B.1. Employees’ compensation”, below). In addition, TOTAL is committed to disclosing and promoting the principles of this agreement to its service providers and suppliers.
Despite a difficult economic environment, certain one-off initiatives were launched. In October 2015, a suppliers day at Exploration & Production, which
brought together 300 people, including 200 representatives of approximately 100 suppliers, was focused around two main themes: HSE and economic performance. Also in October 2015, a suppliers day at Refining & Chemicals, which brought
together over 250 representatives from its main European suppliers, was held to present them with Refining & Chemicals’ strategy and safety, availability and cost-cutting goals.
|
|
|
|
|
2015 Form 20-F TOTAL S.A.
|
|
65
|
Item 4 - E. Other Matters - 4. Social, environmental and societal information
The deployment of the anti-corruption policy in purchasing continued in 2015 with the dispatching of specific
questionnaires to select service providers and, in some cases, external controls. An initiative was launched in 2014 in which service providers working on Group sites were asked to take a training module similar to the Group’s anti-corruption
e-learning module. CDs of this e-learning course were also distributed by several entities to their suppliers.
In addition,
pursuant to Rule 13p-1 of the Securities Exchange Act of 1934, as amended, which implemented certain provisions of the Dodd-Frank Wall Street Reform and Consumer Protection Act of 2010, TOTAL has submitted since 2014 to the SEC an annual document
relating to certain minerals (deemed “conflict minerals”
(1)
by this Rule) sourced from the Democratic Republic of the Congo or a neighboring country. The document
indicates whether TOTAL S.A. or one of its affiliates had, during the preceding calendar year, used any such minerals that were necessary to the functionality or production of a product manufactured or contracted to be manufactured by the Group. In
addition, the document states whether such minerals were sourced from the Democratic Republic of the Congo or a neighboring country. The main objective of the rule’s obligation to publish this information is to prevent the direct or indirect
funding of armed groups in central Africa. For more information, refer to TOTAL’s most recent publication available at: http://csr-analysts.total.com/ or http://www.sec.gov/.
|
-
|
4.3.6.2. Promoting sustainable procurement
|
An interdisciplinary working group dedicated to the issue of sustainable procurement and representing the various business segments as well as the Purchasing, Legal and Sustainable Development Departments is tasked
with strengthening TOTAL’s policy in this area based on initiatives developed by each segment.
The Group’s buyers take part in international
working groups on sustainable procurement. TOTAL is an active member of IPIECA’s Supply Chain Task Force. In 2015, TOTAL participated in the two special workshops on Operationalization of the UN Guiding Principles organized by the IPIECA, aimed
at both oil and gas companies and engineering, procurement, construction (EPC) contractors. TOTAL is also represented in the French delegation to the international group that is considering the forthcoming ISO 20400 standard on sustainable
procurement. The aim of this standard is to transpose the concept of social responsibility – as defined in ISO 26000 – to purchasing activities. Forty-one countries from every continent, as well as international organizations such as the
OECD, the UN and the International Labour Organization, are involved in drafting this standard.
Sustainable procurement targets are integrated into the
central buyers’ annual appraisals. Twelve sustainable procurement training
sessions have been held in France since 2013, with a total of 130 Group employees receiving training. Half of buyers responsible for a category at the head offices of the various business
segments took part in this training and have been able to apply the corresponding good practices to their categories. To accompany these training events, practical tools (country factsheets including local laws and regulations, internal feedback and
methodology sheets) were developed and used both before and after the learning phases.
As part of the new Corporate Purchasing training program, an
induction
e-learning
course entitled “Purchasing at TOTAL” has been made available to all buyers and is mandatory for all new buyers. This module covers, in particular, the Group’s ethical
commitments and the Fundamental Principles of Purchasing.
In France, the Group’s purchases from the disabled and protected employment sectors
enabled the achievement of an indirect employment rate of nearly 1% in 2015. TOTAL is a member of the Pas@Pas association and provides its buyers with an online directory that can be used to identify potential suppliers and service providers from
the disabled or protected employment sectors by geographical area and by category. A new training course on purchasing from the disabled and protected employment sectors was launched in 2015 and attended by nearly 100 people, including the
Group’s Chief Purchasing Officer. Courses in the regions of France where TOTAL operates (Pau, Lyon, Nantes and Le Havre) were held throughout the year. These sessions form part of TOTAL’s sustainable procurement approach and further
reflect its focus on regional development. In addition, in Belgium, Refining & Chemicals uses the services of companies that give priority to the employment of disabled individuals.
|
-
|
4.3.6.3. Acting as a responsible partner in relation with suppliers
|
TOTAL received the “Responsible supplier relationships” label in 2014 for its Holding and Marketing & Services activities in France. This label, awarded by the French authorities, recognizes
companies that maintain sustainable and balanced relationships with their suppliers. Eligibility for this label is reviewed every year and was confirmed in 2015.
The general terms and conditions of purchase were updated in 2014 to ensure a sharper focus on balanced contractual relations. This balance is monitored in particular by an interdisciplinary working group dedicated
to the issue of payment terms, set up in 2014. It involves the Purchasing and Finance departments at the French head offices of all the Group’s business segments and has the aim of monitoring payment terms, reporting and improving the
processing of invoices.
The breakdown of TOTAL S.A.’s accounts
payable as of December 31, 2015 and December 31, 2014, in application of the provisions of Article D. 144-4 of the French Commercial Code, is as follows:
|
|
|
|
|
|
|
|
|
|
|
|
|
|
|
|
|
|
|
|
|
|
|
|
|
|
|
(in M
€
)
|
|
2014
|
|
|
2015
|
|
|
|
Group
|
|
|
non-Group
|
|
|
Total
|
|
|
Group
|
|
|
non-Group
|
|
|
Total
|
|
|
Balance
|
|
|
286
|
|
|
|
1,101
|
|
|
|
1,387
|
|
|
|
307
|
|
|
|
930
|
|
|
|
1,237
|
|
|
Overdue as of Dec. 31
|
|
|
3
|
|
|
|
1
|
|
|
|
4
|
|
|
|
3
|
|
|
|
1
|
|
|
|
4
|
|
|
0 to 30 days
|
|
|
281
|
|
|
|
309
|
|
|
|
590
|
|
|
|
228
|
|
|
|
177
|
|
|
|
405
|
|
|
Over 30 days
|
|
|
0
|
|
|
|
302
|
|
|
|
302
|
|
|
|
0
|
|
|
|
348
|
|
|
|
348
|
|
|
Not yet received
|
|
|
2
|
|
|
|
489
|
|
|
|
491
|
|
|
|
76
|
|
|
|
404
|
|
|
|
480
|
|
|
(1)
|
Rule 13p-1 defines “conflict minerals” as follows (irrespective of their
geographical origin): columbite-tantalite (coltan), cassiterite, gold, wolframite and their derivatives, which are limited to tantalum, tin and tungsten.
|
|
|
|
|
|
66
|
|
TOTAL S.A. Form 20-F 2015
|
Item 4 - E. Other Matters - 4. Social, environmental and societal information
Regarding the support given to French SMEs, TOTAL is a member of the “Pacte PME” association and was
positively rated by its Monitoring Committee in 2015. One example is the support the Group gives to the international development of SMEs, including a number of its own suppliers, through TDR. More than 150 SMEs were thus able to take advantage of a
range of programs in 2015: temporary reception of a Volunteer for International Experience (VIE) to represent them in one of the Group’s subsidiaries, access to a network of contacts consisting of Group employees at overseas subsidiaries, and
the organization of joint operations in countries in which the Group is present in order to gain a better understanding of the local economic context (refer to “— 4.3.4.2. “Boosting regional development and supporting industrial
restructuring”, above). Finally, the identification of innovative SME suppliers takes place through the appointment of innovation correspondents within each Purchasing department of TOTAL’s business segments.
Together with GEP-AFTP, TOTAL was involved in the creation of OG2P (Oil and Gas Partnering Platform). This is an online
In-Country
Value partnering platform launched in October 2015. It allows SMEs in France and other European countries to build relationships with SMEs in producing countries.
To contribute toward the development of good practices in business relations, TOTAL launched an initiative to raise its employees’ awareness of mediation as an
alternative method for resolving disputes with suppliers. Each year since 2013, a training day to raise awareness of mediation has been organized, and in 2015 two events were held. Each session brings together employees of the Group, lawyers and
suppliers. This day enables employees to gain an understanding of mediation and its advantages, in particular in cementing long-term business relations, and includes practical exercises. A brochure designed to increase awareness of the mediation
process is also made available to all employees. In addition, an e-mail address is available on the Group website (under “Suppliers”). It can be used to contact the Group’s internal mediator, whose task is to facilitate relations
between the Group and its French and international suppliers. Finally, the general purchase terms and conditions also mention the possibility of recourse to mediation.
|
4.3.7.
|
Fair operating practices
|
|
-
|
4.3.7.1. Preventing corruption
|
The
oil industry must be particularly vigilant concerning the risk of corruption, especially given the scale of investments and the number of countries in which operations are conducted. Preventing corruption is therefore a major challenge for the Group
and all its employees.
TOTAL’s stance on the issue of corruption is based on clear principles set out in its Code of Conduct: “
The Group
adopts a ‘zero tolerance’ approach to corruption and adheres to the strictest integrity standards
”. This Code sets out the principles governing the actions and individual behavior of each person, both in their day-to-day decisions
and in their relations with the company’s stakeholders. In it, TOTAL also reiterates its support for the OECD Guidelines and the Tenth Principle of the United Nations Global Compact, which urges businesses to work against corruption in all its
forms.
The Group’s commitment has led to a number of actions, including:
|
•
|
|
the adoption by the Executive Committee in 2009 of a corruption prevention policy and the implementation of a dedicated compliance program; and
|
|
•
|
|
the establishment of a specific organization including, in particular, a Compliance and Social Responsibility Department, which is responsible for rolling out a
robust
anti-corruption
compliance program via a network of 370 Compliance Officers wherever TOTAL operates.
|
The corruption prevention program is based on the very highest standards including, in particular:
|
•
|
|
a framework of internal rules that allow employees, with the support of their Compliance Officer, to identify risk situations, conduct due diligence and
implement appropriate actions, particularly in the cases of: representatives dealing with public officials, purchasing/sales, gifts/invitations, donations/philanthropy, acquisitions, joint ventures, conflicts of interest and human resources;
|
|
•
|
|
activities designed to raise awareness among all employees: an initial e-learning course was rolled out in 2011 in 12 languages, followed by a more in-depth
e-learning module in December 2015. This module is accessible to all employees and mandatory for the target groups (approximately 30,000 employees);
|
|
•
|
|
more targeted training activities intended for the most highly exposed positions (particularly for implementation of new rules) and in-depth training for all
Compliance Officers;
|
|
•
|
|
the prohibition of “facilitation payments”;
|
|
•
|
|
regular reporting and incident feedback mechanisms, including an ethics alert system;
|
|
•
|
|
audits dedicated to compliance (six to eight per year) covering all the Group’s activities. These audits are followed up the next year to verify that the
recommendations have been implemented. In addition, missions carried out by the Group Audit Department include, depending on their purpose, controls to ensure compliance processes are being followed; and
|
|
•
|
|
the application of suitable sanctions.
|
In
2015, significant internal communications took place to emphasize once again the importance the Group attaches to these issues. For the UN’s International Anti-Corruption Day and International Human Rights Day (both observed annually in
December), TOTAL held its first Business Ethics Day, which focused on these two themes. This event was organized at Group level and relayed locally by the subsidiaries to remind employees how to react appropriately and to encourage dialogue.
Under the settlements reached in 2013 between TOTAL, the U.S. Securities and Exchange Commission and the U.S. Department of Justice, an independent
monitor was appointed for three years to conduct a review of anti-corruption compliance and related internal control procedures implemented by the Group and to recommend improvements, when necessary. The monitor assumed his position at the end of
2013 (refer “Item 15 — 4.3. Risk assessment and management”, below) and issued an initial report to the authorities in July 2014. As the monitor had to relinquish his duties for health reasons, a new monitor was appointed in early
2015 to continue the review. A second report was issued in October 2015, in which the monitor completed his recommendations and indicated that
“TOTAL has considerably improved its anti-corruption program by implementing the recommendations
outlined in the first report”
.
|
-
|
4.3.7.2. Respect for human rights
|
Activities of companies can affect the human rights of employees, partners and local communities in numerous ways. TOTAL’s proactive approach to human rights
reflects its ethical commitment and helps to establish and maintain successful relationships with all stakeholders, which is essential for the Group to operate effectively.
|
|
|
|
|
2015 Form 20-F TOTAL S.A.
|
|
67
|
Item 4 - E. Other Matters - 4. Social, environmental and societal information
TOTAL’s approach to respect for human rights is based on several pillars, described below.
Written commitments
The Group’s Code of Conduct was
revised in 2014 to reinforce TOTAL’s commitments in terms of respect for human rights. It sets out the Group’s adherence to international standards such as the UN Guiding Principles on Business and Human Rights and the Voluntary Principles
on Security and Human Rights (VPSHR). In the event of any discrepancy between legal provisions and the Code of Conduct, the highest standard of protection of human rights is applied.
Human rights are now one of the priority business principles, alongside integrity (preventing corruption and fraud and anti-competitive practices) and HSE standards (health, safety/security and environment). The
Group ensures that employees’ rights are protected and prohibits any form of discrimination against them, including due to sexual orientation or identity. It demands that they themselves respect human rights. TOTAL also expects its suppliers to
respect standards equivalent to its own and pay particular attention to their employees’ working conditions. In addition, while respecting the sovereignty of the host countries in which it operates, the Group reserves the right to express its
conviction on the importance of respecting human rights in matters concerning it. Finally, TOTAL respects the rights of local communities by identifying, preventing and limiting the impacts of its activities on their way of life and remediating
them.
Some of these principles are set out in the “To find out more” section of the Code of Conduct and are detailed in TOTAL’s Human
Rights Guide, as updated in December 2015 (available in English, French, Spanish and Chinese at total.com).
In 2013, the Group developed a strategic
human rights roadmap to better integrate respect for human rights into its various risk and impact management systems. This roadmap, approved by the Executive Committee, is implemented by various Group entities (in particular the Legal, Ethics,
Sustainable Development, Purchasing and Safety Departments). For example, a practical guide was published in 2015 to help the Group’s teams responsible for business acquisitions and disposals better incorporate human rights into the various due
diligence processes that apply.
A dedicated organization
The Ethics Committee and the “Ethics and Human Rights” unit within the Compliance and Social Responsibility Department advise employees, help operatives and monitor efforts to promote respect for human
rights. In particular, they run a human rights committee that coordinates the actions taken internally and externally by the various Group entities. The Ethics Committee is a central, independent structure that represents all of TOTAL’s
business segments. Its role is to listen and support. Both employees and people outside the Group can refer matters to it by email at ethics@total.com. The Committee maintains confidentiality with regard to referrals, which can only be lifted with
the agreement of the person in question. At the local level, mechanisms for handling grievances raised by local communities are also implemented by subsidiaries exposed to societal risks.
Awareness and training
To ensure its adopted principles are disseminated in-house, TOTAL raises employee
awareness via corporate communications channels such as the Ethics and Security intranet site and through events such as the Business Ethics Day (refer to “— 4.3.7.1. Preventing corruption”, above) at which a new version of the
Group’s Human Rights Guide was released. The Group has also produced several videos on three human rights topics that are key for TOTAL:
responsible security, prevention of societal impacts on local communities, and working conditions, both for its own employees and within its supply chain. The Group also offers some employees
special training tailored to the challenges faced in the field, such as the Responsible Leadership for a Sustainable Business program. Finally, actions are taken to raise awareness among the Group’s external stakeholders, such as training
related to the VPSHR for its security providers.
Assessments and reporting
Tools are used to regularly assess the subsidiaries’ human rights practices and the risks they may have to face. Their objective is to analyze the societal impacts of a project at the local level or to verify
that the subsidiaries’ practices are in line with the Group’s ethical standards. TOTAL commissions approximately 10 ethical assessments per year, with more than 120 subsidiaries evaluated since 2002. These assessments are undertaken by
GoodCorporation (GoodCorp), a qualified ethics expert. Certain assessments are also conducted in partnership with the Danish Institute for Human Rights, a Danish public non-profit organization. A reference catalog containing approximately 90
questions relating to human rights, labor law and rules on competition, is used on site, and numerous internal and external stakeholders are interviewed by GoodCorp over the course of several weeks. GoodCorp then issues a final report identifying
points requiring improvement and good practices. The entity is then given several months to correct any issues that have been identified. A follow-up report is issued by GoodCorp for the subsidiaries that were assessed. Other non-profit partner
organizations, such as the CDA Corporate Engagement Project, also contribute by evaluating the societal impact of the Group’s activities on nearby local communities, for example by surveying the populations in question. CDA’s reports are
published online on their website.
At end-2013, the Group also commissioned the British NGO International Alert to conduct an impact study focusing on
human rights in the Democratic Republic of the Congo. Even though the Group had not yet conducted any operations nor had any subsidiaries in the area in question at that time, more than 300 people – a quarter of whom were women – were
consulted by the NGO. The aim of this study was to enable the Group to better understand the country’s complex dynamics in order to limit any negative impact and maximize any positive impact the Group’s exploration activities may have on
this sensitive environment. The NGO’s report is available online. Action based on the NGO’s recommendations were carried out by Total E&P RDC before the start-up of the seismic campaign.
Participation in external initiatives
TOTAL is actively
involved in numerous initiatives and working groups on human rights that bring together various stakeholders, including Global Compact, Global Compact LEAD (initiative for sustainable leadership), Global Business Initiative on Human Rights, IPIECA
and non-profit organizations such as Shift.
|
-
|
4.3.7.3. Consumer health and safety
|
Many of the products that TOTAL markets pose potential risks; for example, if they are used incorrectly. The Group therefore aims to meet its current and future
obligations with regard to information and prevention in order to minimize the risks throughout its product’s life cycle. TOTAL’s health and products directive sets outs the minimum requirements for marketing the Group’s products
worldwide in order to reduce potential risks to consumer health and the environment.
TOTAL identifies and assesses the risks inherent to its products
and their use, and then informs customers and users of these risks
|
|
|
|
|
68
|
|
TOTAL S.A. Form 20-F 2015
|
Item 4 - E. Other Matters - 4. Social, environmental and societal information
and the applicable prevention and protection measures. The material safety data sheets (MSDS) that accompany all
products marketed by the Group (in at least one of the languages used in the country) and product labels are two key sources of information in this regard. All new products comply fully with the regulatory requirements in the countries and markets
for which they are intended.
|
4.4.
|
Reporting scopes and method
|
|
4.4.1.
|
Reporting guidance
|
The Group’s
reporting is based:
|
•
|
|
for social indicators, on a practical handbook titled “Corporate Social Reporting Protocol and Method”;
|
|
•
|
|
for Industrial Safety indicators, on the Corporate Guidance on Event and Statistical Reporting; and
|
|
•
|
|
for environmental indicators, on a Group reporting procedure, together with segment-specific instructions.
|
These documents are available to all TOTAL companies. The environmental and social reporting handbooks can be consulted at Corporate headquarters, in the relevant
departments.
In 2015, environmental
reporting covered all activities, sites and industrial assets in which TOTAL S.A., or one of its companies it controls, is the operator (
i.e.
, either operates or contractually manages the operations): 803 sites as of December 31, 2015.
Greenhouse gas (GHG) emissions “based on the Group’s equity interest” are the only data which are published for the “equity interest” scope. This scope, which is different from the “operated domain” mentioned
above, includes all the assets in which TOTAL has a financial interest with rights over all or part of the production (financial interest without operational responsibility nor rights on all or part of the production do not lead to the incorporation
of GHG emissions).
Safety reporting covers all TOTAL employees, employees of contractors working at Group-operated sites and employees of transport
companies under long-term contracts. Each site submits its safety reporting to the relevant business unit. The data is then consolidated at the business level and every month at the Group level. In 2015, the Group safety reporting scope covered
508 million hours worked, equivalent to approximately 283,000 people.
Reporting on occupational illnesses covers only the Group’s personnel
and illnesses reported according to the regulations applicable in the country of operation of each entity. Each site sends its reporting on occupational illnesses to the operational entity it reports to. Statistics are consolidated at business
segment level and reported to the Group once a year.
Social reporting is based on two resources – the Global Workforce Analysis and the Worldwide
Human Resources Survey.
The Global Workforce Analysis is conducted twice a year, on June 30 and December 31, in all fully consolidated
companies at least 50% owned and consolidated by the global integration method. The survey mainly covers worldwide workforces, hiring under permanent and fixed-term contracts (non-French equivalents of
contrats à durée
déterminée
or
indéterminée
) as well as employee turnover. This survey produces a breakdown of the workforce by gender, professional category (managers and other employees), age and nationality.
The Worldwide Human Resources Survey is an annual survey which comprises approximately 100 indicators in addition to those used in the Global Workforce Analysis.
The indicators are selected in cooperation with the business segments and cover major components of the Group Human Resources policy, such as mobility, career management, training, work conditions, employee
dialogue, Code of Conduct application, human rights, health, compensation, retirement benefits and insurance. The survey covers a representative sample of the consolidated scope. The data
published in this Registration Document are extracted from the most recent survey, carried out in December 2015 and January 2016; 134 companies in 54 countries, representing 91% of the consolidated Group workforce (87,341 employees) replied to the
survey. With regard to training only, this scope covers 90.5% of the Group’s consolidated workforce and 133 companies.
Both surveys are conducted
using a new information system implemented at TOTAL in 2015, which strengthens coherency controls and develops the internal control process by adding levels of validation.
|
-
|
4.4.2.1. Consolidation method
|
For
the scopes defined above, safety indicators and social data are fully consolidated. Environmental indicators consolidate 100% of the emissions of Group operated sites for the “operated” indicators. GHG emissions are also published on an
equity interest basis,
i.e.
, by consolidating the Group share of the emissions of all assets in which the Group has a financial interest or rights to production.
|
-
|
4.4.2.2. Changes in scope
|
For social
and environmental indicators, the indicators are calculated on the basis of the perimeter of the Group as of December 31, 2015. For safety indicators, acquisitions are taken into account as soon as possible and at the latest on January 1
of the following year, and divestments are taken into account at the end of the quarter preceding their effective date of implementation. Restatement of previous years published data, unless there is a specific statement, is now limited to changes
of methodology.
|
-
|
4.4.3.1. Indicator selection and relevance
|
The data published in the Registration Document are intended to inform stakeholders about TOTAL’s Corporate Social Responsibility performance for the year in question. The environmental indicators include
Group performance indicators in line with the IPIECA reporting guidance, updated in 2015. The indicators have been selected in order to monitor:
|
•
|
|
TOTAL’s commitments and policies, and their effects in the safety, environment, social, etc., domains;
|
|
•
|
|
performance relative to TOTAL’s main challenges and impacts; and
|
|
•
|
|
information required by legislative and regulatory obligations (Article L. 225-102-1 of the French Commercial Law).
|
|
-
|
4.4.3.2. Terminology used in social reporting
|
Outside of France, management staff refers to any employee whose job level is the equivalent of 300 or more Hay points. Permanent contracts correspond to
contrats à durée
indéterminée
(CDI) and fixed-term contracts to contrats
à durée détermi
née (CDD), according to the terminology used in the Group’s social reporting.
Managed scope
: all subsidiaries in which one or more Group companies own a stake of 50% or more,
i.e.
, 453 companies in 123 countries as of
December 31, 2015.
Consolidated scope
: all companies fully consolidated by the global integration method,
i.e.
, 314 companies having
employees in 102 countries as of December 31, 2015.
Employees present
: employees present are employees on the payroll of the
consolidated scope, less employees who are not present,
i.e.
, persons who are under suspended contract (sabbatical, business development leave, etc.), absent on long-term sick leave (more than six months), assigned to a company outside the
Group, etc.
|
|
|
|
|
2015 Form 20-F TOTAL S.A.
|
|
69
|
Item 4 - E. Other Matters - 4. Social, environmental and societal information
The methods may be
adjusted to reflect the diversity of TOTAL’s activities, recent integration of subsidiaries, lack of regulations or standardized international definitions, practical procedures for collecting data, or changes in methods.
|
-
|
4.4.3.4. Consolidation and internal controls
|
Environmental, social and industrial safety data are consolidated and checked by each business unit and business segment, and then at Group level. Data pertaining to certain specific indicators are calculated
directly by the business segments. These processes undergo regular internal audits.
|
4.4.4.
|
Details of certain indicators
|
|
-
|
4.4.4.1. Industrial Safety definitions and indicators
|
TRIR
(Total Recordable Injury Rate)
:
number of recorded injuries per million hours worked.
LTIR
(Lost Time Injury Rate)
:
number of lost time injuries per million hours worked.
SIR
(Severity Injury Rate)
:
average number of days lost per lost time injury.
Employees of
external contractors: any employee of a service provider working at a Group-operated site or assigned by a transport company under a long-term contract.
Tier 1
: indicator of the number of loss of primary containment as defined in standards API 754 (for downstream) and IOGP 456 (for upstream).
Near miss
: event which, under slightly different circumstances, could have resulted in a serious accident. The term “potential severity” is used
for near misses.
Incidents and near misses are assessed in terms of actual or potential severity based on a scale that consists of six levels. Events
with an actual or potential severity level of four or more are considered serious.
|
-
|
4.4.4.2. Environmental indicators
|
ISO sites
: sites covered by an ISO 14001 certificate that is valid, some certificates may cover several sites.
Fresh water
: water with salinity below 1.5 g/l.
Hydrocarbon spills
: spills with a volume greater than 1 barrel (159 liters) are counted. These are accidental spills of which at least part of the volume
spilled reaches the natural environment
(including non-waterproof ground). Spills resulting from sabotage or malicious acts are included. Spills which remain in a confined watertight containment system are excluded.
Waste
: the contaminated soil excavated and removed from active sites to be treated externally is counted as waste. However, drilling debris, mining cuttings
or soil polluted in inactive sites are not counted as waste.
GHG
: the six gases of the Kyoto protocol, which are CO
2
, CH
4
, N
2
O, HFCs, PFCs and SF6, with
their respective GWP (Global Warming Potential) as described in the 2007 GIEC report.
GHG based on the Group’s equity
interest
: GHG emissions of non-significant assets are excluded,
i.e.
, assets in which the Group’s equity interest is less than 10% and for which the Group share of emissions are less than 50 kt CO
2
eq/year. TOTAL relies on the information provided by its partners who operate its non-operated assets. In cases where this information is not available, estimates are made based on
past data, budget data or by pro rata with similar assets.
Material loss rate
: this rate corresponds to the net sum of materials extracted or
consumed which are neither auto-consumed energy nor sold to a client, divided by the sum of transformed material. This rate is only significant for hydrocarbon exploration, production and refinery activities.
Oil spill preparedness
:
|
•
|
|
an oil spill scenario is deemed “important” as soon as its consequences are on a small scale and with limited impacts on the environment (orders of
magnitude of several hundred meters of beaches impacted, and several tons of hydrocarbons);
|
|
•
|
|
an oil spill preparedness plan is deemed operational if it describes the alert mechanisms, if it is based on pollution scenarios that stem from risk analyses and
if it describes mitigation strategies that are adapted to each scenario, if it defines the technical and organizational means, internal and external, to be implemented and, lastly, if it mentions elements to be taken into account to implement a
follow-up of the environmental impacts of the pollution; and
|
|
•
|
|
oil spill preparedness exercise: only exercises conducted on the basis of one of the scenarios identified in the oil spill preparedness plan and which are played
out until the stage of equipment deployment are included for this indicator.
|
|
|
|
|
|
70
|
|
TOTAL S.A. Form 20-F 2015
|
Item 4 - E. Other Matters - 5. Iran and Syria
|
5.
|
Information concerning certain limited activities in Iran and Syria
|
Provided in this section is certain
information concerning TOTAL’s activities related to Iran that took place in 2015 that is required to be disclosed pursuant to Section 13(r) of the Securities Exchange Act of 1934, as amended (“U.S. Exchange Act”). In addition,
information for 2015 is provided concerning the various types of payments made by Group affiliates to the government of any country identified by the United States as a state sponsor of terrorism (currently, Iran, Syria and Sudan
(1)
) or any entity controlled by those governments. TOTAL believes that these activities are not sanctionable and has not been informed that it is at risk of possible imposition
of sanctions for activities previously disclosed. For more information on certain U.S. and EU restrictions relevant to TOTAL in these jurisdictions, see “Item 3 — C. Risk Factors”, above.
The Iran Threat Reduction and Syria Human Rights
Act of 2012 (“ITRA”) added Section 13(r) to the U.S. Exchange Act, which requires TOTAL to disclose whether it or any of its affiliates has engaged during the calendar year in certain Iran-related activities, including those targeted
under ISA, without regard to whether such activities are sanctionable under ISA, and any transaction or dealing with the Government of Iran that is not conducted pursuant to a specific authorization of the U.S. government. While neither TOTAL S.A.
nor any of its affiliates have engaged in any activity that would be required to be disclosed pursuant to subparagraphs (A), (B) or (C) of Section 13(r)(1), affiliates of the Company may be deemed to have engaged in certain
transactions or dealings with the government of Iran that would require disclosure pursuant to Section 13(r)(1)(D), as discussed below.
Upstream
The Group has no upstream activities in Iran and maintains a local office in Iran solely for non-operational functions. Some
payments are yet to be reimbursed to the Group with respect to past expenditures and remuneration under buyback contracts entered into between 1997 and 1999 with the National Iranian Oil Company (“NIOC”) for the development of the South
Pars 2&3 and Dorood fields. With respect to these contracts, development operations were completed in 2010 and the Group is no longer involved in the operation of these fields. In 2015, Total E&P Iran (100%), Elf Petroleum Iran (99.8%),
Total Sirri (100%) and Total South Pars (99.8%) collectively made payments of approximately IRR 4 billion (approximately $0.1 million
(2)
) to (i) the
Iranian administration for taxes and social security contributions concerning the personnel of the aforementioned local office and residual buyback contract-related obligations, and (ii) Iranian public entities for payments with respect to the
maintenance of the aforementioned local office (
e.g.
, utilities, telecommunications). TOTAL expects similar or slightly higher payments to be made by these affiliates in 2016. Neither revenues nor profits were recognized from the
aforementioned activities in 2015.
In the context of the then-anticipated suspension of part of the sanctions targeting Iran following the adoption of
the JCPOA on July 14, 2015, there were contacts in 2015 between representatives of certain wholly-owned affiliates of TOTAL S.A and representatives of the Iranian Government and NIOC within the framework of delegations organized by French
authorities or
during public international events. During the course of these contacts, such affiliates received in 2015 verbal information of a general nature concerning certain oil and gas fields and projects
in Iran and no information not permitted by applicable international economic sanctions was provided to Iranian authorities for the development of Iranian hydrocarbons. Neither TOTAL S.A. nor any of its affiliates recognized any revenue or profit
from this activity in 2015. Following the suspension of certain international economic sanctions against Iran on January 16, 2016 (refer to “Item 3 – C. Risk Factors”, above), TOTAL entered into a Memorandum of Understanding
(“MOU”) with NIOC and a framework agreement for the purchase of crude oil for French and European refineries, in particular. Pursuant to the MOU, NIOC will provide technical data on certain oil and gas projects so that TOTAL can assess
potential developments in Iran in compliance with the remaining applicable international economic sanctions.
Total E&P UK Limited (“TEP
UK”), a wholly-owned affiliate of TOTAL, holds a 43.25% interest in a joint venture at the Bruce field in the UK with BP Exploration Operating Company Limited (37.5%, operator), BHP Billiton Petroleum Great Britain Ltd (16%) and Marubeni
Oil & Gas (North Sea) Limited (3.75%). This joint venture is party to an agreement (the “Bruce Rhum Agreement”) governing certain transportation, processing and operation services provided to a joint venture at the Rhum field in
the UK that is co-owned by BP (50%, operator) and the Iranian Oil Company UK Ltd (“IOC”), a subsidiary of NIOC (50%) (together, the “Rhum Owners”). TEP UK owns and operates the Frigg UK Association pipeline and St Fergus Gas
Terminal and is party to an agreement governing provision of transportation and processing services to the Rhum Owners (the “Rhum FUKA Agreement”) (the Bruce Rhum Agreement and the Rhum FUKA Agreement being referred to collectively as the
“Rhum Agreements”). To TOTAL’s knowledge, provision of all services under the Rhum Agreements was initially suspended in November 2010, when the Rhum field stopped production following the adoption of EU sanctions, other than critical
safety-related services (
i.e.
, monitoring and marine inspection of the Rhum facilities), which were permitted by EU sanctions regulations. On October 22, 2013, the UK government notified IOC of its decision to apply a temporary
management scheme to IOC’s interest in the Rhum field within the meaning of UK Regulations 3 and 5 of the Hydrocarbons (Temporary Management Scheme) Regulations 2013 (the “Hydrocarbons Regulations”). Since that date all correspondence
in respect of IOC’s interest in the Rhum Agreements has been with the UK government in its capacity as temporary manager of IOC’s interests and TEP UK has had no contact with IOC in 2015 regarding the Rhum Agreements. On December 6,
2013, the UK government authorized TEP UK, among others, under Article 43a of EU Regulation 267/2012, as amended by 1263/2012 and under Regulation 9 of the Hydrocarbons Regulations, to carry out activities in relation to the operation and production
of the Rhum field. In addition, on September 4, 2013, the U.S. Treasury Department issued a license to BP authorizing BP and certain others to engage in various activities relating to the operation and production of the Rhum field. Following
receipt of all necessary authorizations, the Rhum field resumed production on October 26, 2014 with IOC’s interest in the Rhum field and the Rhum Agreements subject to the UK government’s temporary management pursuant to the
Hydrocarbons Regulations. Services have been provided by TEP UK under the Rhum Agreements since
|
|
|
|
|
2015 Form 20-F TOTAL S.A.
|
|
71
|
|
(1)
|
Since the independence of the Republic of South Sudan on July 9, 2011, TOTAL is no longer present in Sudan.
|
|
(2)
|
Unless otherwise indicated, all non-USD currencies presented in “—Information concerning certain limited activities in Iran and Syria” were
converted to USD using the prevailing exchange rates available on February 29, 2016.
|
Item 4 - E. Other Matters - 5. Iran and Syria
that date and TEP UK has received tariff income from BP and the UK government (in its capacity as temporary manager
of IOC’s interest in the Rhum field) in accordance with the terms of the Rhum Agreements. In 2015, these activities generated for TEP UK gross revenue of approximately £4.6 million (approximately $6.4 million) and net profit of
approximately £1.4 million (approximately $2.0 million). On August 27, 2015, TEP UK signed a sale and purchase agreement to divest its entire interest in the Frigg UK Association pipeline and St Fergus Gas Terminal to NSMP Operations
Limited (“NSMP”). Upon completion of the divestment, TEP UK’s interest in the Rhum FUKA Agreement will be novated to NSMP whereupon TEP UK’s only interest in the Rhum FUKA Agreement will be in relation to the settlement of
historical
force majeure
claims with the Rhum Owners relating to the period when the Rhum field was shut down. Subject to the foregoing, TEP UK intends to continue such activities so long as they continue to be permissible under UK and EU law
and not be in breach of remaining applicable international economic sanctions.
Downstream
The Group does not own or operate any refineries or chemicals plants in Iran and did not purchase Iranian hydrocarbons when prohibited by applicable EU and U.S.
economic and financial sanctions (refer to “Item 3 — C. Risk Factors”, above).
Hutchinson, a wholly-owned affiliate
of TOTAL, conducted, in conjunction with a delegation of international companies (Fédération des Industries des Equipements pour Véhicules), two visits in Iran in 2015 to discuss business opportunities in the Iranian car
industry sector with several companies, including some having direct or indirect ties to the government of Iran. Hutchinson recognized no revenue or profit from this activity in 2015 and expects to continue such discussions in the future.
Until December 2012, at which time it sold its entire interest, the Group held a 50% interest in the lubricants retail company Beh
Total (now named Beh Tam) along with Behran Oil (50%), a company controlled by entities with ties to the government of Iran. As part of the sale of the Group’s interest in Beh Tam, TOTAL S.A. agreed to license the trademark “Total” to
Beh Tam for an initial
3-year
period for the sale by Beh Tam of lubricants to domestic consumers in Iran. In 2014, Total E&P Iran (“TEPI”), a wholly-owned affiliate of TOTAL S.A., received,
on behalf of TOTAL S.A., royalty payments of approximately IRR 24 billion (nearly $1 million
(1)
) from Beh Tam for such license. These payments were based on Beh
Tam’s sales of lubricants during the previous calendar year. In 2015, royalty payments were suspended due to an adjustment procedure concerning these payments brought by the Iranian tax authorities against TEPI, which TEPI expects will be
settled in 2016. Therefore, TEPI expects royalty payments may resume in 2016. In addition, representatives of the Group and Beh Tam met several times in 2015 to discuss the local lubricants market and further discussions are expected to take place
in the future.
Total Liban, a Lebanese company wholly-owned by the Group, is a member of a consortium with five other companies for the purpose of
providing services for fueling facilities at Beirut International Airport (“BIA”) to the members of the consortium. The consortium members assume, on a rotating three-year term, ministerial and administrative responsibilities (including
supervision
of fuel services) in connection with the consortium. Until October 2015, Total Liban served in this capacity. During this period, another consortium member had a fuel supply contract with Iran
Air. Total Liban did not receive, directly or indirectly, any profit or remuneration in connection with the fuel sold to Iran Air by this other consortium member.
Total Marketing Middle East FZE (“TMME”), a wholly-owned affiliate of the Group, sold lubricants to Beh Tam in 2015. The sale in 2015 of approximately 299 t of lubricants and special fluids generated
gross revenue of approximately AED 2 million (approximately $0.5 million) and net profit of approximately AED 1.7 million (approximately $0.5 million). TMME expects to continue this activity in 2016.
Total Marketing France (“TMF”), a French company wholly-owned by Total Marketing Services (“TMS”), itself a French company wholly-owned by TOTAL
S.A. and six Group employees, provided in 2015 fuel payment cards to the Iranian embassy in France for use in the Group’s service stations. In 2015, these activities generated gross revenue of approximately
€
25,000 (approximately $27,200) and net profit of approximately
€
1,000 (approximately $1,100). TMF expects to continue this activity in 2016.
Total Belgium (“TB”), a
Belgian company wholly-owned by the Group, provided in 2015 fuel payment cards to the Iranian embassy in Brussels for use in the Group’s service stations. In 2015, these activities generated gross revenue of approximately
€
23,100 (approximately $25,100) and net profit of approximately
€
1,600 (approximately $1,700). TB expects to continue this activity in 2016.
Proxifuel, a Belgian company
wholly-owned by the Group, sold in 2015 heating oil to the Iranian embassy in Brussels. In 2015, these activities generated gross revenue of approximately
€
2,400 (approximately $2,600) and net profit of approximately
€
200 (approximately $220).
Proxifuel expects to continue this activity in 2016.
Caldeo, a French company wholly-owned by TMS, sold in 2015 domestic heating oil to the Iranian
embassy in France, which generated gross revenue of nearly
€
3,500 (approximately $3,800) and net profit of approximately
€
700 (approximately $760). Caldeo expects to continue this activity in 2016.
Total Namibia (PTY) Ltd (“TN”), a wholly-owned affiliate of Total South Africa (PTY) Ltd (of which the Group holds 50.1%), sold petroleum products and services during 2015 to Rössing Uranium Limited,
a company in which the Iranian Foreign Investment Co. holds an interest of 15.3%. In 2015, these activities generated gross revenue of approximately N$115 million (approximately $7.3 million) and net profit of nearly N$5 million (approximately
$0.3 million). TN expects to continue this activity in 2016.
Since early December 2011, TOTAL has ceased its
activities that contribute to oil and gas production in Syria and maintains a local office solely for non-operational functions. In 2015, TOTAL made payments of approximately SYP 37 million (approximately $0.2 million) to Syrian government
agencies in the form of taxes and contributions for public services rendered in relation to the maintenance of the aforementioned office and its personnel. In late 2014, the Group initiated a downsizing of its Damascus office and reduced its staff
to a few employees.
|
(1)
|
Based on an average daily exchange rate of $1 = IRR 0.000039 during 2014, as published by Bloomberg.
|
|
|
|
|
|
72
|
|
TOTAL S.A. Form 20-F 2015
|
Items 4A - 5
ITEM 4A. UNRESOLVED STAFF COMMENTS
None.
ITEM 5. OPERATING AND FINANCIAL REVIEW
AND PROSPECTS
This section is the Company’s analysis of its financial performance and of significant trends that may affect
its future performance. It should be read in conjunction with the Consolidated Financial Statements included elsewhere in this Annual Report. The Consolidated Financial Statements are prepared in accordance with IFRS as issued by the IASB and IFRS
as adopted by the EU.
This section contains forward-looking statements which are subject to risks and uncertainties. For a list of important
factors
that could cause actual results to differ materially from those expressed in the forward-looking statements, see “Cautionary Statement Concerning Forward-Looking Statements” on page
iii.
Effective January 1, 2014, TOTAL changed the presentation currency of the Group’s Consolidated Financial Statements from the Euro to
the US Dollar and applied IFRIC 21. Comparative 2013 information has been restated.
OVERVIEW
TOTAL’s results are affected by a variety of factors, including changes in crude oil and natural gas prices as
well as refining and marketing margins, which are all generally expressed in dollars, and changes in exchange rates, particularly the value of the euro compared to the dollar. Lower crude oil and natural gas prices generally have a negative effect
on the income of TOTAL, since its Upstream oil and gas business is negatively impacted by the resulting decrease in revenues realized from production. Higher crude oil and natural gas prices generally have a corresponding positive effect. The effect
of changes in crude oil prices on TOTAL’s Refining & Chemicals and Marketing & Services activities depends upon the speed at which the prices of refined petroleum products adjust to reflect such changes. TOTAL’s results
are also significantly affected by the costs of its activities, in particular those related to exploration and production, and by the outcome of its strategic decisions with respect to cost reduction efforts. In addition, TOTAL’s results are
affected by general economic and political conditions and changes in governmental laws and regulations, as well as by the impact of decisions by OPEC on production levels. For more information, see “Item 3 — C. Risk Factors” and
“Item 4 — E. Other Matters”.
The year 2015 was marked by the sharp decline of oil prices, in a context of global abundance
of supply. The Brent oil price averaged $52/b in 2015, almost 50% less than in 2014. In the downstream, the environment was favorable. Margins in refining, petrochemicals and retail were sustained by strong demand. The competitiveness of European
activities improved, notably due to the lower cost of raw materials and a favorable euro-dollar exchange rate.
In this context, TOTAL’s net income
(Group share) in 2015 increased by 20% to $5,087 million from $4,244 million in 2014, mainly due to a less negative impact on net income (Group share) in 2015 of special items, with the strong performance of the Group’s integrated model
and its cost reduction program being demonstrated despite the 47% drop in the average Brent price. For additional information, refer to “—Results 2013-2015”, below, and to Note 4D to the Consolidated Financial Statements.
Adjustments to net income (Group share), which include special items and the after-tax inventory valuation effect, had a negative impact of $5,431 million in 2015. Excluding these items, adjusted net income (Group share) declined by 18% to $10,518
million in 2015 compared to $12,837 million in 2014, primarily due to the impact of lower Brent prices on Upstream results, partially offset by a higher contribution from downstream activities.
Discipline on spending was reinforced in 2015. The cost reduction program allowed the Group to
save $1.5 billion, above the objective of $1.2 billion. Organic investments
(1)
were $23 billion, a decrease of close to 15% compared to 2014
.
In the Upstream segment, adjusted net operating income was $4.8 billion in
2015, a decrease of 55% compared to 2014 essentially due to lower oil and gas prices. Upstream production increased by a record 9.4%. Nine projects were started up globally: Ofon 2 in Nigeria, Eldfisk 2 in Norway, West Franklin 2 in the United
Kingdom, Termokarstovoye in Russia, Dalia Phase 1a in Angola, Surmont 2 in Canada, GLNG in Australia, Lianzi located in the unitized zone between Congo and Angola, and Moho phase 1b in Congo.
The Group was able to prepare its future with a reserve replacement rate of 107%. It continued its exploration program and made discoveries in Argentina, Myanmar
and Nigeria.
In the Refining & Chemicals segment, adjusted net operating income was $4.9 billion in 2015, almost twice the level of 2014.
Strong operational performance, with a utilization rate averaging 89% for the year, enabled the segment to fully benefit from high margins. The segment also benefited from the ramp-up of SATORP in Saudi Arabia. Modernization projects have been
launched, with the conversion of La Mède into a bio-refinery in France, the Lindsey restructuring in the UK and the Antwerp refinery modernization.
In the Marketing & Services segment, adjusted net operating income was $1.7 billion in 2015, an increase of 35% compared to 2014. This good performance was
due to the growth in sales and margins in a favorable environment and to the contribution of the SunPower affiliate with the finalization of the Quinto solar farm in the United States.
Divestments were $6 billion, essentially comprised of the finalization of the Bostik disposal, onshore blocks in Nigeria, Totalgaz, the Schwedt refinery, Geosel oil storage facilities, coal production activities in
South Africa and partial interests in Laggan-Tormore and Fort Hills.
Acquisitions were $3.4 billion, essentially comprised of the ADCO license extension
in the United Arab Emirates, the acquisition of an additional 0.7% interest in the capital of Novatek in Russia (increasing the Group’s interest to 18.9%), and the carry on the Utica field in the United States.
|
|
|
|
|
2015 Form 20-F TOTAL S.A.
|
|
73
|
|
(1)
|
Organic investments = net investments, excluding acquisitions, divestments and
other operations with non-controlling interests (refer to “Item 4 – E. Other Matters – 1. Investments”).
|
Item 5 - Critical Accounting Policies
The net-debt-to-equity ratio at year-end decreased to 28% as a result of a financial policy which is designed to
maintain a strong balance sheet through the cycle.
In the numerous countries where its projects are conducted, the Group also places an emphasis on
Corporate Social Responsibility (CSR) challenges and the development of local economies.
In 2015, the return on equity for the Group
was 11.5%. TOTAL resisted the drop in prices by leveraging the effectiveness of its integrated model and its strong operational performance. The Group will further pursue this strategy and all of the necessary actions will continue to be implemented
to reduce costs and maintain a solid balance sheet, demonstrating once again the Group’s capacity to adapt.
In 2016, the Group
will reduce its organic investments to around $19 billion, a reduction of more than 15% compared
to 2015. This marks a transition to a sustainable level of investments
of
$17-19 billion
from 2017 onwards. The cost reduction program
launched in 2014 will be reinforced, enabling Opex savings of $2.4 billion in 2016 and underpinning the objective of more than $3 billion in 2017. The asset sales program will continue in
line with the plan, with $4 billion expected in 2016, the same level as 2015.
In the Upstream, five major start ups are planned in 2016. The first of
these, Laggan-Tormore, took place on February 8. Production is expected to grow by 4% in 2016 compared to 2015, following more than 9% in 2015 compared to 2014, confirming the growth target of 5% per year on average between 2014 and 2019.
In the Downstream, the target to reduce European refining capacity by 20% will be achieved by end-2016, one year ahead of the initial plan announced in
2012. The cessation of traditional refining activities at La Mède in view of its conversion to a
bio-refinery,
the restructuring of the Lindsey refinery and the modernization of the Antwerp refinery
will be finalized before the end of the year, with the first benefits expected from 2017.
The strategy implemented by the Group in 2015 based on its
four priorities of Safety, Delivery, Costs and Cash, will continue in 2016, notably for the benefit of its shareholders.
CRITICAL ACCOUNTING POLICIES
A summary of the Group’s accounting policies is included in the Introduction and Note 1 to the Consolidated
Financial Statements. Management believes that the application of these policies on a consistent basis enables the Group to report useful and reliable information about the Group’s financial condition and results of operations.
The preparation of financial statements in accordance with IFRS requires the executive management to make estimates and assumptions that affect the reported amounts
of assets, liabilities and contingent liabilities at the date of preparation of the financial statements and reported income and expenses for the period. Management reviews these estimates and assumptions on an ongoing basis, by reference to past
experience and various other factors considered as reasonable which form the basis for assessing the carrying amount of assets and liabilities. Actual results may differ significantly from these estimates, if different assumptions or circumstances
apply.
Furthermore, where the accounting treatment of a specific transaction is not addressed by any accounting standard or interpretation, management
applies its judgment to define and apply accounting policies that provide information consistent with the general IFRS concepts: faithful representation, relevance and materiality.
The following summary provides further information about the critical accounting policies that involve significant elements of management judgment, and which could have a significant impact on the results of the
Group. It should be read in conjunction with Note 1 to the Consolidated Financial Statements.
The assessment of critical accounting policies below
is not meant to be an all-inclusive discussion of the uncertainties in financial results that can occur from the application of the full range of the Company’s accounting policies. Materially different financial results could occur in the
application of other accounting policies as well. Likewise, materially different results can occur upon the adoption of new accounting standards promulgated by the various rule-making bodies.
|
–
|
Successful efforts method of oil and gas accounting
|
The Group follows the successful efforts method of accounting for its oil and gas activities. The Group’s oil and gas reserves are estimated by the
Group’s petroleum engineers in accordance with industry standards and SEC regulations. Proved oil and gas reserves are those quantities of oil and gas, which, by analysis of geoscience and engineering data, can be estimated with reasonable
certainty to be economically producible from a given date forward, from known reservoirs, and under existing economic conditions, operating methods, and government regulations, prior to the time at which contracts providing the right to operate
expire, unless evidence indicates that renewal is reasonably certain, regardless of whether deterministic or probabilistic methods are used for the estimation. Estimated oil and gas reserves are based on available reservoir data and prices and costs
in the accounting period during which the estimate is made and are subject to future revision. The Group reassesses its oil and gas reserves at least once a year on all its properties.
Exploration leasehold acquisition costs are capitalized when acquired. During the exploration phase, management exercises judgment on the probability that prospects ultimately would partially or fully fail to find
proved oil and gas reserves. Based on this judgmental approach, a leasehold impairment charge may be recorded. This position is assessed and adjusted throughout the contractual period of the leasehold based in particular on the results of
exploratory activity and any impairment is adjusted prospectively.
When a discovery is made, exploratory drilling costs continue to be capitalized
pending determination of whether potentially economic oil and gas reserves have been discovered by the drilling effort. The length of time necessary for this determination depends on the specific technical or economic difficulties in assessing the
recoverability of the reserves. If a determination is made that the well did not encounter oil and gas in economically viable quantities, the well costs are expensed and are reported in exploration expense.
|
|
|
|
|
74
|
|
TOTAL S.A. Form 20-F 2015
|
Item 5 - Critical Accounting Policies
Exploratory drilling costs are temporarily capitalized pending determination of whether the well has found proved
reserves if both of the following conditions are met:
|
•
|
|
the well has found a sufficient quantity of reserves to justify, if appropriate, its completion as a producing well, assuming that the required capital
expenditure is made; and
|
|
•
|
|
satisfactory progress toward ultimate development of the reserves is being achieved, with the Company making sufficient progress assessing the reserves and the
economic and operating viability of the project.
|
The Company evaluates the progress made on the basis of regular project reviews which
take into account the following factors:
|
•
|
|
First, if additional exploratory drilling or other exploratory activities (such as seismic work or other significant studies) are either underway or firmly
planned, the Company deems there is satisfactory progress. For these purposes, exploratory activities are considered firmly planned only if they are included in the Company’s 3-year exploration plan/budget.
|
|
•
|
|
In cases where exploratory activity has been completed, the evaluation of satisfactory progress takes into account indicators such as the fact that costs for
development studies are incurred in the current period, or that governmental or other third-party authorizations are pending or that the availability of capacity on an existing transport or processing facility awaits confirmation.
|
The successful efforts method requires, among other things, that the capitalized costs for proved oil and gas properties (which
include the costs of drilling successful wells) be amortized on the basis of reserves that are produced in a period as a percentage of the total estimated proved reserves (unit-of-production method). The impact of changes in estimated proved
reserves is dealt with prospectively by amortizing the remaining book value of the asset over the expected future production. If proved reserve estimates are revised downward, earnings could be affected by higher depreciation expense or an immediate
write-down of the property’s book value. Conversely, if the oil and gas quantities were revised upwards, future per-barrel depreciation and depletion expense would be lower.
|
–
|
Valuation of long-lived assets
|
In addition to oil and
gas assets that could become impaired under the application of successful efforts accounting, other assets could become impaired and require write-down if circumstances warrant. Conditions that could cause an asset to become impaired include
lower-than-expected commodity sales prices, changes in the Group’s business plans or a significant adverse change in the local or national business climate. The amount of an impairment charge would be based on estimates of the higher of the
value in use or the fair value minus cost to sell compared with its book value. The value in use is based on the present value of expected future cash flow using assumptions commensurate with the risks involved in the asset group. The expected
future cash flow used for impairment reviews is based on judgmental assessments of future production volumes, prices and costs, considering information available at the date of review.
|
–
|
Asset retirement obligations and environmental remediation
|
When the Group has a present obligation (legal or constructive), upon application of International Accounting Standard (IAS) 37 and IAS 16, it records provisions for the future decommissioning of production
facilities at the end of their economic lives. Management makes judgments and estimates in recording these liabilities. Most of these removal obligations are many years in the future and the precise requirements that will have to be met when the
removal event actually occurs are uncertain. Asset removal technologies and costs are constantly changing, as well as political, environmental, safety and public expectations.
The Group also makes judgments and estimates in recording costs and establishing provisions for environmental
clean-up and remediation costs, which are based on current information on costs and expected plans for remediation. For environmental provisions, actual costs can differ from estimates because of changes in laws and regulations, public expectations,
discovery and analysis of site conditions and changes in clean-up technology.
|
–
|
Pensions and post-retirement benefits
|
Accounting for
pensions and other post-retirement benefits involves judgments about uncertain events, including estimated retirement dates, salary levels at retirement, mortality rates, determination of discount rates for measuring plan obligations, healthcare
cost-trend rates and rates of utilization of healthcare services by retirees. These assumptions are based on the environment in each country. The assumptions used are reviewed at the end of each year and may vary from year-to-year, based on the
evolution of the situation, which will affect future results of operations. Any differences between these assumptions and the actual outcome will also impact future results of operations.
The significant assumptions used to account for pensions and other post-retirement benefits are determined as follows.
Discount rates are determined by reference to the high quality rates of AA-rated corporate bonds of a duration equivalent to that of the plan obligations. Inflation
rates reflect market conditions observed on a country-by-country basis.
Salary increase assumptions (when relevant) are determined by each entity. They
reflect an estimate of the actual future salary levels of the individual employees involved, including future changes attributed to general price levels (consistent with inflation rate assumptions), productivity, seniority, promotion and other
factors.
Healthcare cost trend assumptions (when relevant) reflect an estimate of the actual future changes in the cost of the healthcare-related
benefits provided to the plan participants and are based on past and current healthcare cost trends including healthcare inflation, changes in healthcare utilization, and changes in health status of the participants.
Demographic assumptions such as mortality, disability and turnover reflect the best estimate of these future events for the individual employees involved, based
principally on available actuarial data.
The effect pensions had on results of operations, cash flow and liquidity is fully set out in Note 18 to
the Consolidated Financial Statements. Net employee benefit expense in 2015 amounted to $345 million and the Company’s contributions to pension plans were $311 million.
Differences between projected and actual costs and between the normative return and the actual return on plan assets routinely occur and are recognized in the statement of comprehensive income, with no possibility
to subsequently recycle them to the income statement.
The past service cost in respect of defined benefit plans is recorded immediately in the statement
of income, whether vested or unvested.
For defined contribution plans, expenses correspond to the contributions paid.
The computation of the
Group’s income tax expense requires the interpretation of complex tax laws and regulations in many taxing jurisdictions around the world, the determination of expected outcomes from pending litigation, and the assessment of audit findings that
are performed by numerous taxing authorities. Actual income tax expense may differ from management’s estimates.
|
|
|
|
|
2015 Form 20-F TOTAL S.A.
|
|
75
|
Item 5 - Results 2013-2015
RESULTS
2013-2015
|
|
|
|
|
|
|
|
|
|
|
|
|
|
As of and for the year ended
December 31, (M$, except per
share data)
|
|
2015
|
|
|
2014
|
|
|
2013
|
|
|
Non-Group sales
|
|
|
165,357
|
|
|
|
236,122
|
|
|
|
251,725
|
|
|
Net income (Group share)
|
|
|
5,087
|
|
|
|
4,244
|
|
|
|
11,228
|
|
|
Diluted earnings per share
|
|
|
2.16
|
|
|
|
1.86
|
|
|
|
4.94
|
|
|
–
|
Group results 2015 vs. 2014
|
Market conditions were less favorable in 2015, with the average Brent price having decreased by 47% to $52.4/b in 2015 compared to $99.0/b in
2014. In 2015, TOTAL’s average liquids price realization
(1)
decreased by 47% to $47.4/b from $89.4/b in 2014. TOTAL’s average natural gas price realization for the
Group’s consolidated subsidiaries decreased in 2015 by 28% to $4.75/Mbtu from $6.57/Mbtu in 2014. In the downstream, the Group’s European refining margin indicator (“ERMI”) more than doubled to $48.5/t in 2015 compared to $18.7/t
in 2014. In the fourth quarter of 2015, the ERMI was $38.1/t. Petrochemical margins in Europe increased in 2015 due to a strong demand for polymers and the decrease in raw material costs.
The Euro depreciated in 2015 compared to the US Dollar, with the euro-dollar exchange rate averaging
$1.11/
€
in 2015 compared to
$1.33/
€
in 2014.
In this context,
non-Group sales in 2015 were $165,357 million, a decrease of 30% compared to $236,122 million for 2014, due mainly to the decrease of oil and gas prices, with non-Group sales decreasing 28% for the Upstream segment, 33% for the
Refining & Chemicals segment and 27% for the Marketing & Services segment.
Net income (Group share) in 2015 increased by 20% to
$5,087 million from $4,244 million in 2014, mainly due to a less negative impact on net income (Group share) in 2015 of special items, with the strong performance of the Group’s integrated model and its cost reduction program being
demonstrated despite the 47% drop in the Brent price. Adjustments to net income (Group share), which include special items and the after-tax inventory valuation effect, had a negative impact on net income (Group share) of $5,431 million in
2015. This includes impairments on Fort Hills in Canada and Gladstone LNG in Australia as well as in Libya, an adjustment to depreciation on Usan in Nigeria following the cancellation of the sale process, the impairment of exploration projects that
will not be developed and a negative inventory effect. For a detailed overview of adjustment items for 2015, refer to Note 4D to the Consolidated Financial Statements. In 2014, adjustment items had a negative impact on net income (Group share)
of $8,593 million, including impairments of oil sands in Canada, unconventional gas notably in the United States, refining in Europe and certain other assets in the Upstream, and a negative inventory valuation effect, which was partially offset by a
gain on asset sales, including for the Group’s interests in Shah Deniz in Azerbaijan and GTT. Excluding these items, adjusted net income (Group share) declined by 18% to $10,518 million in 2015 compared to $12,837 million in 2014,
primarily due to the impact of lower Brent prices on Upstream results, partially offset by a higher contribution from downstream activities.
Income taxes in 2015 amounted to $1,653 million, a decrease of 81% compared to $8,614 million in 2014, as a
result of the decrease in taxable income and the Group’s lower tax rate.
TOTAL bought back in 2015 approximately 4.7 million of its own shares
(
i.e.
, approximately 0.19% of the share capital as of December 31, 2015) under the authorization granted by the shareholders at the meeting of May 29, 2015 (see “Item 10 — 1.6. Share buybacks”). The number
of fully-diluted shares at December 31, 2015, was 2,336 million compared to 2,285 million at December 31, 2014.
Fully-diluted
earnings per share, based on 2,304 million weighted-average shares, was $2.16 in 2015 compared to $1.86 in 2014, an increase of 16%.
Asset sales
were $5,968 million in 2015, comprised mainly of the sales of Bostik, interests in onshore blocks in Nigeria, Totalgaz, the Schwedt Refinery, the Geosel oil storage facility, coal mining assets in South Africa and partial interests in Laggan-Tormore
and Fort Hills. Asset sales were $4,650 million in 2014.
Acquisitions were $3,441 million in 2015, comprised mainly of the renewal of the ADCO license
in the United Arab Emirates, the acquisition of a further 0.7% in the capital of Novatek in Russia bringing the Group participation to 18.9%, and the carry on the Utica gas and condensate field in the United States. Acquisitions were $2,539 million
in 2014.
Net investments
(2)
were $20.4 billion in
2015 compared to $24.1 billion in 2014, a decrease of 16% mainly due to a lower level of capital expenditure.
See also “— Liquidity and
Capital Resources”, below.
|
–
|
Group results 2014 vs. 2013
|
The average Brent price
decreased by 9% to $99.0/b in 2014 compared to 2013. Brent dropped sharply in the second half, from about $110/b to less than $60/b by December 31, 2014. In 2014, TOTAL’s average liquids price realization decreased by 13% to $89.4/b from
$103.3/b in 2013. TOTAL’s average natural gas price realization for the Group’s consolidated subsidiaries decreased in 2014 by 8% to $6.57/Mbtu from $7.12/Mbtu in 2013. In the downstream, the ERMI was $18.7/t in 2014 compared to $17.9/t in
2013, an increase of 4%. The environment for petrochemicals also improved, notably in the United States.
The euro-dollar exchange rate averaged $1.33/
€
in 2014, unchanged from 2013, though the euro did start to decline against the dollar in the second half of 2014.
In this context, non-Group sales in 2014 were $236,122 million, a decrease of 6% compared to $251,725 million for 2013, with non-Group sales decreasing
11% for the Upstream segment, 7% for the Refining & Chemicals segment and 4% for the Marketing & Services segment.
Net income (Group
share) in 2014 decreased by 62% to $4,244 million from $11,228 million in 2013, mainly due to a more negative impact on net income (Group share) of special items. Adjustments to net income (Group share), which include special items and the after-tax
inventory valuation effect, had a negative impact on net income (Group share) of $8,593 million in 2014, including impairments of oil sands in Canada, unconventional gas notably in the United States, refining in Europe and certain other assets
in the Upstream, and a negative inventory effect, which were partially
|
(1)
|
Consolidated subsidiaries, excluding fixed margins.
|
|
(2)
|
Net investments = gross investments – divestments – repayment of non-current loans – other operations with non-controlling interests. The main
divestments for the 2013-2015 period are detailed in Note 3 to the Consolidated Financial Statements.
|
|
|
|
|
|
76
|
|
TOTAL S.A. Form 20-F 2015
|
Item 5 - Results 2013-2015
offset by a gain on asset sales, including for the Group’s interests in Shah Deniz in Azerbaijan and GTT. In
2013, adjustments items had a negative impact on net income (Group share) of $3,064 million, including a loss on the sale of the Voyageur upgrader project in Canada, the impairment of Upstream assets in the Barnett field in the United States and in
Syria, charges, write-offs related to the restructuring of downstream activities in France, and a negative inventory effect, which were partially offset by the gain on the sales of TIGF and Upstream assets in Italy. Excluding these items, adjusted
net income (Group share) declined by 10% to $12,837 million in 2014 compared to $14,292 million in 2013, primarily due to the impact of lower Brent prices on Upstream results, partially offset by a higher contribution from downstream
activities.
Income taxes in 2014 amounted to $8,614 million, a decrease of 42% compared to $14,767 million in 2013, as a result of the
decrease in taxable income and the Group’s lower tax rate.
TOTAL bought back in 2014 nearly 4.4 million of its own shares
(
i.e.
, approximately 0.18% of the share capital as of December 31, 2014) under the authorization granted by the shareholders at the meeting of May 16, 2014. The number of fully-diluted shares at December 31, 2014, was
2,285 million compared to 2,276 million at December 31, 2013.
Fully-diluted earnings per share, based on 2,281 million
weighted-average shares, was $1.86 in 2014 compared to $4.94 in 2013, a decrease of 62%.
Asset sales were $4,650 million in 2014, comprised essentially
of the sale of interests in Shah Deniz and the associated pipelines in Azerbaijan, Block 15/06 in Angola, GTT and the Cardinal midstream assets in the United States. Asset sales were $4,750 million in 2013.
Acquisitions were $2,539 million in 2014, comprised principally of the acquisition of an interest in the Elk and Antelope discoveries in Papua
New Guinea, the acquisition of an additional interest in Novatek
(1)
and the carry on the Utica gas and condensate field in the United States. In 2013, acquisitions were
$4,473 million.
Net investments were $24.1 billion in 2014 compared to $25.9 billion in 2013, a decrease of 7% reflecting a lower level
of capital expenditure and a lower level of acquisitions.
See also “— Liquidity and Capital Resources”, below.
|
–
|
Business segment reporting
|
The financial information
for each business segment is reported on the same basis as that used internally by the chief operating decision maker in assessing segment performance and the allocation of segment resources. Due to their particular nature or significance, certain
transactions qualified as “special items” are excluded from the business segment figures. In general, special items relate to transactions that are significant, infrequent or unusual. However, in certain instances, transactions such as
restructuring costs or asset disposals, which are not considered to be representative of the normal course of business, may also be qualified as special items although they may have occurred in prior years or are likely to recur in following years.
In accordance with IAS 2, the Group values inventories of petroleum products in the financial statements according to the First-In, First-Out (FIFO)
method and other inventories using the weighted-average cost method. Under the FIFO method, the cost of inventory is based on the historic cost of acquisition or manufacture rather than the current replacement cost. In volatile energy markets, this
can have a significant distorting effect on the reported income. Accordingly, the adjusted results of the Refining & Chemicals and Marketing & Services segments are presented according to the replacement cost method in order to
facilitate the comparability of the Group’s results with those of its competitors and to help illustrate the operating performance of these segments excluding the impact of oil price changes on the replacement of inventories. In the replacement
cost method, which
approximates the Last-In, First-Out (LIFO) method, the variation of inventory values in the statement of income is, depending on the nature of the inventory, determined using either the month-end
price differential between one period and another or the average prices of the period. The inventory valuation effect is the difference between the results under the FIFO and replacement cost methods.
The effect of changes in fair value presented as an adjustment item reflects, for trading inventories and storage contracts, differences between internal measures
of performance used by TOTAL’s management and the accounting for these transactions under IFRS, which requires that trading inventories be recorded at their fair value using period-end spot prices. In order to best reflect the management of
economic exposure through derivative transactions, internal indicators used to measure performance include valuations of trading inventories recorded at their fair value based on forward prices. Furthermore, TOTAL, in its trading activities, enters
into storage contracts, the future effects of which are recorded at fair value in the Group’s internal economic performance. IFRS, by requiring accounting for storage contracts on an accrual basis, precludes recognition of this fair value
effect.
The adjusted business segment results (adjusted operating income and adjusted net operating income) are defined as replacement cost results,
adjusted for special items, excluding the effect of changes in fair value. For further information on the adjustments affecting operating income on a segment-by-segment basis, and for a reconciliation of segment figures to figures reported in the
Company’s audited consolidated financial statements, see Note 4 to the Consolidated Financial Statements.
The Group
measures performance at the segment level on the basis of net operating income and adjusted net operating income. Net operating income comprises operating income of the relevant segment after deducting the amortization and the depreciation of
intangible assets other than leasehold rights, translation adjustments and gains or losses on the sale of assets, as well as all other income and expenses related to capital employed (dividends from non-consolidated companies, income from equity
affiliates and capitalized interest expenses) and after income taxes applicable to the above. The income and expenses not included in net operating income that are included in net income are interest expenses related to long-term liabilities net of
interest earned on cash and cash equivalents, after applicable income taxes (net cost of net debt and non-controlling interests). Adjusted net operating income excludes the effect of the adjustments (special items and the inventory valuation effect)
described above. For further discussion of the calculation of net operating income and the calculation of return on average capital employed (ROACE
(2)
), see Note 2 to
the Consolidated Financial Statements.
|
–
|
Upstream segment results
|
|
|
|
|
|
|
|
|
|
|
|
|
|
|
|
(M$)
|
|
2015
|
|
|
2014
|
|
|
2013
|
|
|
Non-Group sales
|
|
|
16,840
|
|
|
|
23,484
|
|
|
|
26,367
|
|
|
Operating income
(a)
|
|
|
(2,941
|
)
|
|
|
10,494
|
|
|
|
22,658
|
|
|
Equity in income (loss) of affiliates and other items
|
|
|
2,019
|
|
|
|
4,302
|
|
|
|
2,688
|
|
|
Tax on net operating income
|
|
|
(294
|
)
|
|
|
(8,799
|
)
|
|
|
(13,706
|
)
|
|
Net operating income
(a)
|
|
|
(1,216
|
)
|
|
|
5,997
|
|
|
|
11,640
|
|
|
Adjustments affecting net operating income
|
|
|
5,990
|
|
|
|
4,507
|
|
|
|
810
|
|
|
Adjusted net operating income
(b)
|
|
|
4,774
|
|
|
|
10,504
|
|
|
|
12,450
|
|
|
Investments
|
|
|
24,270
|
|
|
|
26,520
|
|
|
|
29,750
|
|
|
Divestments
|
|
|
3,215
|
|
|
|
5,764
|
|
|
|
5,786
|
|
|
|
|
|
|
|
ROACE
|
|
|
4.6%
|
|
|
|
10.7%
|
|
|
|
13.8%
|
|
|
(a)
|
For the definition of operating income and net operating income, see Note 2 to the Consolidated Financial Statements.
|
|
(b)
|
Adjusted for special items. See Notes 2 and 4 to the Consolidated Financial Statements.
|
|
(1)
|
The Group held an 18.24% stake in OAO Novatek as of December 31, 2014.
|
|
(2)
|
ROACE = adjusted net operating income divided by average capital employed.
|
|
|
|
|
|
2015 Form 20-F TOTAL S.A.
|
|
77
|
Item 5 - Results 2013-2015
2015 vs. 2014
For the full-year 2015, hydrocarbon production was 2,347 kboe/d, an increase of 9.4% compared to 2014, due to the following:
|
•
|
|
+6% for new project start ups and ramp ups, notably CLOV, West Franklin Phase 2, Eldfisk II and Termokarstovoye;
|
|
•
|
|
+6% due to portfolio changes, mainly the extension of the ADCO concession in the United Arab Emirates, partially offsetby asset sales in the North Sea, Nigeria
and Azerbaijan;
|
|
•
|
|
-4% due to shutdowns in Yemen and in Libya; and
|
|
•
|
|
+1% due to the price effect
(1)
and field performance, net of natural field decline.
|
Proved hydrocarbon reserves based on SEC rules (based on Brent at $54.17/b) were 11,580 Mboe at December 31,
2015, compared to 11,523 Mboe at December 31, 2014 (Brent at $101.3/b). Based on the 2015 average rate of production, the reserve life is more than 13 years. In 2015, the proved reserve replacement rate
(2)
was 107%, notably due to the extension of the ADCO concession.
See “Item
4 — B. Business Overview — 2.1.2. Reserves” for a discussion of proved reserves and section 1 of “Supplemental Oil and Gas Information (Unaudited)” contained elsewhere herein for additional information on proved reserves,
including tables showing changes in proved reserves by region.
The Upstream segment’s non-Group sales in 2015 were $16,840 million compared to
$23,484 million in 2014, a decrease of 28%.
Upstream net operating income in 2015 amounted to $(1,216) million (for 2014, $5,997 million)
from operating income of $(2,941) million (for 2014, $10,494 million). The difference between net operating income and operating income resulted primarily from income from equity affiliates and other items of $2,019 million (for 2014,
$4,302 million), partially offset by taxes on net operating income of $294 million (for 2014, tax charge of $8,799 million).
Adjusted net
operating income from the Upstream segment was $4,774 million for the full-year 2015, a decrease of 55% compared to $10,504 million for 2014, essentially due to the lower price of hydrocarbons, partially offset by an increase in production, a
decrease in operating costs, and a lower effective tax rate.
Adjusted net operating income for the Upstream segment excludes special items. The
exclusion of special items had a positive impact on the segment’s adjusted net operating income in 2015 of $5,990 million, comprised mainly of impairments on Fort Hills in Canada and Gladstone LNG in Australia as well as in Libya, an
adjustment to depreciation on Usan in Nigeria following the cancellation of the sale process and the impairment of exploration projects that will not be developed (for additional information, see Note 4D to the Consolidated Financial Statements). In
2014, the exclusion of special items had a positive impact on the segment’s adjusted net operating income of $4,507 million, comprised mainly of the impairment of the Group’s oil sands assets in Canada, its unconventional gas assets,
notably in the United States, and certain other assets in the Upstream segment.
The effective tax rate
(3)
for the Upstream segment in 2015 was 45.5% compared to 57.1% in 2014. The lower rate reflects mainly lower oil and gas prices.
Technical costs
(4)
for consolidated subsidiaries, calculated in accordance with ASC 932
(5)
, were $23.0/boe in 2015 compared to $28.3/boe in 2014. This reduction is essentially due to the
execution of the Group’s program to reduce operating costs (which decreased from $9.9/boe in 2014 to $7.4/boe in 2015) and lower depreciation (portfolio effect).
The Upstream segment’s total capital expenditures in 2015 decreased by 8% to $24,270 million from $26,520 million in 2014, reflecting essentially a lower level of expenditure on development projects.
Development expenditure mainly pertained to the nine projects started in 2015 (Ofon 2, Eldfisk 2, West Franklin 2, Surmont, Termokarstovoye, GLNG, Dalia Phase 1a, Moho Phase 1b, Lianzi), the five projects that are expected to start in 2016
(Laggan-Tormore, Vega Pleyade, Incahuasi, Angola LNG and Kashagan) and to other major projects under construction like Moho North in the Republic of the Congo, Ichthys in Australia, Egina in Nigeria and Yamal in Russia. Divestments by the Upstream
segment were $3,215 million in 2015, a decrease of 44% compared to $5,764 million in 2014.
In this context, the segment’s ROACE for the
full-year 2015 was 4.6% compared to 10.7% for the full-year 2014.
2014 vs. 2013
For the full-year 2014, hydrocarbon production was 2,146 kboe/d, a decrease of 7% compared to 2013, essentially as a result of:
|
•
|
|
-6% essentially for the expiration of the ADCO license in the United Arab Emirates in January 2014;
|
|
•
|
|
-2% essentially for natural decline and higher maintenance in 2014 notably in the first half, partially offset by production growth in the Utica in the United
States; and
|
|
•
|
|
+1% for production growth from start-ups, essentially CLOV in Angola.
|
Excluding ADCO, hydrocarbon production was virtually stable compared to 2013.
Proved reserves based on SEC rules were
11,523 Mboe at December 31, 2014 (Brent at $101.3/b) compared to 11,526 Mboe at December 31, 2013 (Brent at $108.2/b). Based on the 2014 average rate of production, the reserve life was more than 13 years. In 2014, the proved reserve
replacement rate was 100%.
The Upstream segment’s non-Group sales in 2014 were $23,484 million compared to $26,367 million in 2013, a
decrease of 11%.
Upstream net operating income in 2014 amounted to $5,997 million (for 2013, $11,640 million) from operating income of
$10,494 million (for 2013, $22,658 million). The difference between net operating income and operating income resulted primarily from taxes on net operating income of $8,799 million (for 2013, tax charge of $13,706 million),
partially offset by income from equity affiliates and other items of $4,302 million (for 2013, income of $2,688 million).
Adjusted net
operating income from the Upstream segment in 2014 was $10,504 million compared to $12,450 million in 2013, a decrease of 16%, which was due essentially to the decrease in the average realized price of hydrocarbons.
|
(1)
|
The “price effect” refers to the impact of changing hydrocarbon prices on entitlement volumes from production sharing and buyback contracts. For
example, as the price of oil or gas increases above certain pre-determined levels, TOTAL’s share of production normally decreases.
|
|
(2)
|
Change in reserves excluding production: (revisions + discoveries, extensions + acquisitions – divestments) / production for the period.
|
|
(3)
|
Defined as: (tax on adjusted net operating income) / (adjusted net operating income – income from equity affiliates – dividends received from
investments + tax on adjusted net operating income).
|
|
(4)
|
(Production costs + exploration expenses + depreciation, depletion and amortization
and valuation allowances)/production of the year.
|
|
(5)
|
Financial Accounting Standards Board (FASB) Accounting Standards Codification Topic 932, Extractive industries — Oil and Gas.
|
|
|
|
|
|
78
|
|
TOTAL S.A. Form 20-F 2015
|
Item 5 - Results 2013-2015
Adjusted net operating income for the Upstream segment excludes special items. The exclusion of special items had a
positive impact on the segment’s adjusted net operating income in 2014 of $4,507 million, comprised mainly of the impairment of the Group’s oil sands assets in Canada, its unconventional gas assets, notably in the United States, and
certain other assets in the Upstream segment. In 2013, the exclusion of special items had a positive impact on the segment’s adjusted net operating income of $810 million, comprised mainly of a loss on the sale of the Voyageur upgrader
project in Canada and the impairment of Upstream assets, principally in the Barnett field in the United States and in Syria, partially offset by the gain on the sales of TIGF and Upstream assets in Italy.
The effective tax rate for the Upstream segment in 2014 was 57.1% compared to 60.0% in 2013. The lower rate reflects mainly the benefit of tax allowances in the UK
in the second quarter 2014.
Technical costs for consolidated subsidiaries, calculated in accordance with ASC 932, were $28.3/boe in 2014 compared to
$26.1/boe in 2013, an increase due principally to the increase in depreciation of fixed assets and the increase in production costs, mainly maintenance costs.
The Upstream segment’s total capital expenditures in 2014 decreased by 11% to $26,520 million from $29,750 million in 2013, reflecting essentially a lower level of expenditure on development
projects. In 2014, in the Upstream segment, capital expenditure mainly pertained to major projects that drive the Group’s growth, such as GLNG and Ichthys in Australia, Surmont in Canada, the Ekofisk and Eldfisk areas in Norway, the
Laggan-Tormore projects in the United Kingdom, Moho North in the Republic of the Congo, CLOV in Angola, Ofon II and Egina in Nigeria and Yamal in Russia. Divestments by the Upstream segment were $5,764 million in 2014, a slight decrease
compared to $5,786 million in 2013.
In this context, the segment’s ROACE for the full-year 2014 was 10.7% compared to 13.8% for the full-year 2013.
|
–
|
Refining & Chemicals segment results
|
|
|
|
|
|
|
|
|
|
|
|
|
|
|
|
(M$)
|
|
2015
|
|
|
2014
|
|
|
2013
|
|
|
Non-Group sales
|
|
|
70,623
|
|
|
|
106,124
|
|
|
|
114,483
|
|
|
Operating income
(a)
|
|
|
4,544
|
|
|
|
(1,691
|
)
|
|
|
177
|
|
|
Equity in income (loss) of affiliates and other items
|
|
|
1,780
|
|
|
|
90
|
|
|
|
181
|
|
|
Tax on net operating income
|
|
|
(1,105
|
)
|
|
|
391
|
|
|
|
(612
|
)
|
|
Net operating income
(a)
|
|
|
5,219
|
|
|
|
(1,210
|
)
|
|
|
(254
|
)
|
|
Adjustments affecting net operating income
|
|
|
(330
|
)
|
|
|
3,699
|
|
|
|
2,111
|
|
|
Adjusted net operating income
(b)
|
|
|
4,889
|
|
|
|
2,489
|
|
|
|
1,857
|
|
|
Contribution of Specialty Chemicals
(c)
|
|
|
496
|
|
|
|
629
|
|
|
|
583
|
|
|
Investments
|
|
|
1,843
|
|
|
|
2,022
|
|
|
|
2,708
|
|
|
Divestments
|
|
|
3,488
|
|
|
|
192
|
|
|
|
365
|
|
|
|
|
|
|
|
ROACE
|
|
|
41.0%
|
|
|
|
15.0%
|
|
|
|
9.2%
|
|
|
(a)
|
For the definition of operating income and net operating income, see Note 2 to the Consolidated Financial Statements.
|
|
(b)
|
Adjusted for special items and the inventory valuation effect. See Notes 2 and 4 to the Consolidated Financial Statements.
|
|
(c)
|
Hutchinson and Atotech; Bostik until February 2015.
|
2015 vs. 2014
In 2015, the Refining & Chemicals segment benefited from a favorable environment, notably in Europe. The ERMI averaged $48.5/t in 2015 compared to $18.7/t
in 2014, mainly due to strong demand for gasoline. In the fourth quarter of 2015, the ERMI was $38.1/t. Refinery throughput in 2015 increased by 9% to 1,938 kb/d compared to 1,775 kb/d in 2014. Actions to improve the availability in Europe
resulted in a high utilization rate of 89%. The segment also benefited from the ramp-up of SATORP in Saudi Arabia. Petrochemical margins in Europe increased in 2015 due to strong demand for polymers and the decrease in raw material costs.
Non-Group sales for the segment in 2015 were $70,623 million compared to $106,124 million in 2014, a decrease of 33%.
The net operating income of the Refining & Chemicals segment in 2015 increased to $5,219 million (for 2014, $(1,210) million) from operating income of
$4,544 million (for 2014, $(1,691) million). The difference between net operating income and operating income resulted primarily from income from equity affiliates and other items of $1,780 million (for 2014, income of
$90 million), partially offset by taxes on net operating income of $1,105 million (for 2014, tax income of $391 million).
The segment’s
adjusted net operating income in 2015 was $4,889 million, twice the level of $2,489 million in 2014, due to strong industrial performance during a period of high margins and cost reduction programs.
Adjusted net operating income for the Refining & Chemicals segment excludes any after-tax inventory valuation effect and special items. The exclusion of
the inventory valuation effect had a positive impact on the segment’s adjusted net operating income in 2015 of $590 million compared to a positive impact of $2,114 million in 2014, for both periods essentially due to a reduction of
stock. The exclusion of special items had a negative impact on the segment’s adjusted net operating income in 2015 of $920 million, consisting essentially of gains on asset sales, compared to a positive impact of $1,585 million in 2014,
consisting essentially of impairments of European refining assets.
Investments by the Refining & Chemicals segment in 2015 were
$1,843 million compared to $2,022 million in 2014, a decrease of 9%. Divestments by the segment were $3,488 million in 2015 compared to $192 million in 2014.
In this context, the segment’s ROACE for the full year 2015 was 41.0% compared to 15.0% for the full year 2014.
2014 vs. 2013
The ERMI for the full-year 2014 was $18.7/t,
an increase of 4% compared to $17.9/t in 2013. Refinery throughput in 2014 increased slightly by 3% to 1,775 kb/d compared to 1,719 kb/d in 2013, essentially due to the start up of SATORP.
Non-Group sales for the segment in 2014 were $106,124 million compared to $114,483 million in 2013, a decrease of 7%.
The net operating income of the Refining & Chemicals segment in 2014 decreased to $(1,210) million (for 2013, $(254) million) from operating income of $(1,691) million (for 2013, $177 million).
The difference between net operating income and operating income resulted primarily from taxes on net operating income of $(391) million (for 2013, tax charge of $612 million) and income from equity affiliates and other items of
$90 million (for 2013, income of $181 million).
The segment’s adjusted net operating income in 2014 was $2,489 million, an increase
of 34% compared to 2013 while the refining margin increased by only 4% in 2014. The synergies and
|
|
|
|
|
2015 Form 20-F TOTAL S.A.
|
|
79
|
Item 5 - Results 2013-2015
efficiency plans supported the ability of the segment to adapt to the lower European margins in the first half and
subsequently to take advantage of a more favorable refining and chemicals environment in the second half of the year. The petrochemicals environment was more favorable in 2014, especially in the United States.
Adjusted net operating income for the Refining & Chemicals segment excludes any after-tax inventory valuation effect and special items. The exclusion of
the inventory valuation effect had a positive impact on the segment’s adjusted net operating income in 2014 of $2,114 million, essentially as a result of a reduction of stocks, and a positive impact of $656 million in 2013. The
exclusion of special items had a positive impact on the segment’s adjusted net operating income in 2014 of $1,585 million, consisting essentially of impairments of European refining assets, compared to a positive impact of
$1,455 million in 2013 , reflecting mainly charges and write-offs related to the restructuring of downstream activities in France.
Investments by
the Refining & Chemicals segment in 2014 were $2,022 million compared to $2,708 million in 2013, a decrease of 25%. Divestments by the segment were $192 million in 2014 compared to $365 million in 2013, a decrease of
47%.
In this context, the segment’s ROACE for the full year 2014 was 15.0% compared to 9.2% for the full year 2013. The segment attained its
profitability objective one year earlier than the schedule fixed in 2011.
|
–
|
Marketing & Services segment results
|
|
|
|
|
|
|
|
|
|
|
|
|
|
|
|
(M$)
|
|
2015
|
|
|
2014
|
|
|
2013
|
|
|
Non-Group sales
|
|
|
77,887
|
|
|
|
106,509
|
|
|
|
110,873
|
|
|
Operating income
(a)
|
|
|
1,758
|
|
|
|
1,158
|
|
|
|
2,014
|
|
|
Equity in income (loss) of affiliates and other items
|
|
|
297
|
|
|
|
(140
|
)
|
|
|
55
|
|
|
Tax on net operating income
|
|
|
(585
|
)
|
|
|
(344
|
)
|
|
|
(560
|
)
|
|
Net operating income
(a)
|
|
|
1,470
|
|
|
|
674
|
|
|
|
1,509
|
|
|
Adjustments affecting net operating income
|
|
|
229
|
|
|
|
580
|
|
|
|
45
|
|
|
Adjusted net operating income
(b)
|
|
|
1,699
|
|
|
|
1,254
|
|
|
|
1,554
|
|
|
Contribution of New Energies
|
|
|
108
|
|
|
|
10
|
|
|
|
—
|
|
|
Investments
|
|
|
1,841
|
|
|
|
1,818
|
|
|
|
1,814
|
|
|
Divestments
|
|
|
856
|
|
|
|
163
|
|
|
|
186
|
|
|
|
|
|
|
|
ROACE
|
|
|
19.7%
|
|
|
|
13.3%
|
|
|
|
16.1%
|
|
|
(a)
|
For the definition of operating income and net operating income, see Note 2 to the Consolidated Financial Statements.
|
|
(b)
|
Adjusted for special items and the inventory valuation effect. See Notes 2 and 4 to the Consolidated Financial Statements.
|
2015 vs. 2014
The Marketing & Services segment’s refined product sales
(1)
were 1,818 kb/d in 2015 compared to 1,769 kb/d in 2014, an
increase of 3%. In addition to strong growth in Africa, the sector benefited from its strategic repositioning in Europe and demand stimulated by lower prices. The segment’s non-Group sales in 2015 were $77,887 million, a decrease of 27%
compared to $106,509 million in 2014.
Net operating income for the Marketing & Services segment in 2015 was $1,470 million (for 2014,
$674 million) from operating income of $1,758 million (for 2014, $1,158 million). The difference between net operating income and operating income resulted primarily from taxes on net operating income of $585 million (for 2014,
tax charge of $344 million), partially offset by income from equity affiliates and other items of $297 million (for 2014, loss of $140 million).
Adjusted net operating income in 2015 for the segment was $1,699 million compared to $1,254 million in 2014, an
increase of 35% compared to 2014, benefiting from an increase in sales and margins in a favorable environment, and the contribution of SunPower.
Adjusted net operating income for the Marketing & Services segment excludes any after-tax inventory valuation effect and special items. The exclusion of
the inventory valuation effect had a positive impact on the segment’s adjusted net operating income in 2015 of $169 million compared to a positive impact of $384 million in 2014. The exclusion of special items had a positive impact on
the segment’s adjusted net operating income in 2015 of $60 million compared to a positive impact of $196 million in 2014.
Investments by the
Marketing & Services segment in 2015 were $1,841 million compared to $1,818 million in 2014. Divestments by the segment in 2015 were $856 million compared to $163 million in 2014.
In this context, the segment’s ROACE for the full year 2015 was 19.7% compared to 13.3% for the full year 2014.
2014 vs. 2013
The Marketing & Services
segment’s refined product sales were 1,769 kb/d in 2014 compared to 1,749 kb/d in 2013, an increase of 1% due to higher sales in growth areas and offset by lower sales in Europe, mainly due to mild winter weather conditions impacting
heating oil sales and low retail sales throughout the year. The segment’s non-Group sales in 2014 were $106,509 million, a decrease of 4% compared to $110,873 million in 2013.
Net operating income for the Marketing & Services segment in 2014 was $674 million (for 2013, $1,509 million) from operating income of $1,158 million (for 2013, $2,014 million). The
difference between net operating income and operating income resulted primarily from taxes on net operating income of $344 million (for 2013, tax charge of $560 million) and a loss from equity affiliates and other items of
$140 million (for 2013, income of $55 million).
Adjusted net operating income in 2014 for the segment was $1,254 million compared to
$1,554 million in 2013, a decrease of 19% mainly due to a negative accounting effect of $100 million on the valuation of hedging positions in the fourth quarter of 2014 and weather conditions in the first half in Europe and lower margins in
2014, notably in the European network.
Adjusted net operating income for the Marketing & Services segment excludes any after-tax inventory
valuation effect and special items. The exclusion of the inventory valuation effect had a positive impact on the segment’s adjusted net operating income in 2014 of $384 million compared to a positive impact of $63 million in 2013. The
exclusion of special items had a positive impact on the segment’s adjusted net operating income in 2014 of $196 million compared to a negative impact of $18 million in 2013.
Investments by the Marketing & Services segment in 2014 were $1,818 million compared to $1,814 million in 2013. Divestments by the segment in 2014 were $163 million compared to
$186 million in 2013, a decrease of 12%.
In this context, the segment’s ROACE for the full year 2014 was 13.3% compared to 16.1% for the full
year 2013.
|
(1)
|
The Marketing & Services segment’s refined product sales presented herein exclude trading and bulk refining sales, which are reported under the
Refining & Chemicals segment.
|
|
|
|
|
|
80
|
|
TOTAL S.A. Form 20-F 2015
|
Item 5 - Liquidity and Capital Resources
LIQUIDITY
AND CAPITAL RESOURCES
|
|
|
|
|
|
|
|
|
|
|
|
|
|
|
(M$)
|
|
2015
|
|
|
2014
|
|
|
2013
|
|
|
Cash flow from operating activities
|
|
|
19,946
|
|
|
|
25,608
|
|
|
|
28,513
|
|
|
Including (increase) decrease in working capital
|
|
|
1,683
|
|
|
|
4,480
|
|
|
|
2,525
|
|
|
Cash flow used in investing activities
|
|
|
(20,449
|
)
|
|
|
(24,319
|
)
|
|
|
(28,032
|
)
|
|
Total expenditures
|
|
|
(28,033
|
)
|
|
|
(30,509
|
)
|
|
|
(34,431
|
)
|
|
Total divestments
|
|
|
7,584
|
|
|
|
6,190
|
|
|
|
6,399
|
|
|
Cash flow from financing activities
|
|
|
1,060
|
|
|
|
5,909
|
|
|
|
(1,521
|
)
|
|
Net increase (decrease) in cash and cash equivalents
|
|
|
577
|
|
|
|
7,198
|
|
|
|
(1,040
|
)
|
|
Effect of exchange rates
|
|
|
(2,469
|
)
|
|
|
(2,217
|
)
|
|
|
831
|
|
|
Cash and cash equivalents at the beginning of the period
|
|
|
25,181
|
|
|
|
20,200
|
|
|
|
20,409
|
|
|
Cash and cash equivalents at the end of the period
|
|
|
23,269
|
|
|
|
25,181
|
|
|
|
20,200
|
|
TOTAL’s cash requirements for working capital, capital expenditures, acquisitions and dividend payments over the past three
years were financed primarily by a combination of funds generated from operations, borrowings and divestments of non-core assets. In the current environment, TOTAL expects its external debt to be principally financed from the international debt
capital markets. The Group continually monitors the balance between cash flow from operating activities and net expenditures. In the Company’s opinion, its working capital is sufficient for its present requirements.
The largest part of TOTAL’s
capital expenditures in 2015 was made up of additions to intangible assets and property, plant and equipment (approximately 90%), with the remainder attributable to equity-method affiliates and to acquisitions of subsidiaries. In the Upstream
segment, as described in more detail under “Supplemental Oil and Gas Information (Unaudited) — 1.1.6. Cost incurred”, capital expenditures in 2015 were principally development costs (approximately 80%, mainly for construction of new
production facilities), exploration expenditures (successful or unsuccessful, approximately 5%) and acquisitions of proved and unproved properties (approximately 13%). In the Refining & Chemicals segment, about 85% of capital expenditures
in 2015 were related to refining and petrochemical activities (essentially 60% for existing units including maintenance and major turnarounds and 40% for new construction), the balance being related to Specialty Chemicals. In the
Marketing & Services segment, capital expenditures were split between marketing/retail activities (approximately 70%) and New Energies (approximately 30%). For additional information on capital expenditures, please refer to the discussion
above in “— Overview” and “— Results 2013-2015”, above, and “Item 4 — E. Other Matters — 1. Investments”.
Cash flow from operating activities in 2015
was $19,946 million compared to $25,608 million in 2014 and $28,513 million in 2013. The $5,662 million decrease in cash flow from operating activities
from 2014 to 2015 was due mainly to a lower decrease in working capital requirements between the two periods ($1,683 million in 2015 compared to $4,480 million in 2014). The Group’s working
capital requirement was affected by the effect of changes in oil and oil product prices. As IFRS rules require TOTAL to account for inventories of petroleum products according to the FIFO method, a lower decrease in oil and oil product prices in
2015 compared to 2014 generates, all other factors remaining equal, a lower decrease in inventories, resulting in a lower decrease in working capital requirements. In 2015, the Group’s working capital requirement decreased by $1,683 million,
due in part to reductions in inventories and receivables partially offset by a decrease in payables. The Group’s working capital requirement decreased by $4,480 million in 2014 and by $2,525 million in 2013, in both cases mainly due
to reductions in inventory and receivables.
Cash flow used in investing activities in 2015 was $20,449 million compared to $24,319 million in 2014
and $28,032 million in 2013. The decrease from 2014 to 2015 was due to lower expenditures on the portfolio of Upstream projects, as various projects approach completion, and by the divestment of Bostik in the Refining & Chemicals
segment, partly offset by the extension of the ADCO concession in Abu Dhabi. The decrease from 2013 to 2014 was due to lower expenditures on the portfolio of Upstream projects as various projects approach completion. Total expenditures in 2015 were
$28,033 million compared to $30,509 million in 2014 and $34,431 million in 2013. During 2015, 87% of the expenditures were made by the Upstream segment (as compared to 87% in 2014 and 2013), 7% by the Refining & Chemicals segment
(compared to 7% in 2014 and 8% in 2013) and 6% by the Marketing & Services segment (as compared to 6% in 2014 and 5% in 2013). The main source of funding for these expenditures has been cash from operating activities and higher
issuance of non-current debt. For additional information on expenditures, please refer to the discussions above in “— Overview” and “— Results 2013-2015”.
Divestments, based on selling price and net of cash sold, in 2015 were $7,584 million compared to $6,190 million in 2014 and $6,399 million in 2013. In 2015, the Group’s principal divestments were
asset sales of $5,968 million, consisting mainly of sales of Bostik, interests in onshore blocks in Nigeria, Totalgaz, the Schwedt refinery, the Géosel oil storage facility, coal mining assets in South Africa, and partial interests in
Laggan-Tormore and Fort Hills. In 2014, the Group’s principal divestments were asset sales of $4,650 million, consisting mainly of sales in the Upstream segment in Azerbaijan, Angola and the United States. In 2013, the Group’s
principal divestments were asset sales of $4,750 million, consisting mainly of sales of assets in the Upstream segment in Canada, Italy and Trinidad & Tobago, and the sale of its subsidiary Transport et Infrastructures Gaz France
(TIGF).
Cash flow raised from financing activities in 2015 was $1,060 million compared to cash flow raised of $5,909 million in 2014 and cash flow
used of $1,521 million in 2013. The decrease in cash flow from financing activities in 2015 compared to 2014 was due primarily to lower issuance of non-current financial debt ($4,166 million in 2015 compared to $15,786 million in 2014) and
a decrease in current financial assets and liabilities ($(5,517) million in 2015 compared to $(351) million in 2014), partially offset by the issuance of perpetual subordinated notes for $5,616 million in 2015 and lower dividends paid ($(2,845)
million in 2015 compared to $(7,308) million in 2014).
|
|
|
|
|
2015 Form 20-F TOTAL S.A.
|
|
81
|
Item 5 - Guarantees and Other Off-Balance Sheet Arrangements
The Company’s
non-current financial debt at year-end 2015 was $44,464 million
(1)
compared to $45,481 million at year-end 2014 and $34,574 million at year-end 2013. For further
information on the Company’s level of borrowing and the type of financial instruments, including maturity profile of debt and currency and interest rate structure, see Note 20 to the Consolidated Financial Statements. For further
information on the Company’s treasury policies, including the use of instruments for hedging purposes and the currencies in which cash and cash equivalents are held, see “Item 11. Quantitative and Qualitative Disclosures About Market
Risk”.
On February 22, 2016, Standard & Poor’s downgraded TOTAL’s long term credit rating from AA- to A+ with a negative outlook. The
short term credit rating was also downgraded from A-1+ to A-1.
Cash and cash equivalents at year-end 2015 were $23,269 million compared to
$25,181 million at year-end 2014 and $20,200 million at year-end 2013.
Shareholders’ equity
at year-end 2015 was $95,409 million compared to $93,531 million at year-end 2014 and $103,379 million at year-end 2013. Changes in shareholders’ equity in 2015 were primarily due to the impacts of dividend payments, the issuance of
perpetual subordinated notes and the issuance of common shares. Changes in shareholders’ equity in
2014 were primarily due to the impacts of dividend payments, variations in foreign exchange and impairments (for information concerning the impairments, refer to “— Results
2013-2015”, above). Changes in shareholders’ equity in 2013 were primarily due to the addition of net income and other operations with non-controlling interests, partially offset by the payment of dividends.
In 2015, TOTAL bought back nearly 4.7 million of its own shares (
i.e.
, 0.19% of the share capital as of December 31, 2015) under the previous
authorization granted by the shareholders at the meeting of May 29, 2015 (see “Item 10 — 1.6. Share buybacks”). In 2014, TOTAL bought back nearly 4.4 million of its own shares (
i.e.
, 0.18% of the share capital as
of December 31, 2014) under the authorization granted by the shareholders at the meeting of May 16, 2014. In 2013, TOTAL bought back approximately 4.4 million of its own shares (
i.e.
, 0.19% of the share capital as of
December 31, 2013) under the authorization granted by the shareholders at the meeting of May 17, 2013.
As of
December 31, 2015, TOTAL’s net-debt-to-equity ratio
(2)
was 28.3% compared to 31.3% and 23.3% at year-ends 2014 and 2013, respectively. The decrease from 2014 to
2015 was mostly due to the issuance of perpetual subordinated notes.
As of December 31, 2015, TOTAL S.A. had $10,675 million of long-term
confirmed lines of credit, of which $10,675 million were unused.
GUARANTEES AND OTHER OFF-BALANCE SHEET ARRANGEMENTS
As part of certain project financing arrangements, TOTAL S.A. provided in 2008 guarantees in connection with the
financing of the Yemen LNG project for an amount of $551 million. These guarantees are presented under “Guarantees given against borrowings” in Note 23 to the Consolidated Financial Statements. “Guarantees given against
borrowings” also include the guarantees provided in 2010 by TOTAL S.A. in connection with the financing of the Jubail project (operated by SAUDI ARAMCO TOTAL Refining and Petrochemical Company (SATORP)) of up to $3,188 million,
proportional to TOTAL’s share in the project (37.5%). In addition, in 2015, TOTAL S.A. has confirmed and extended guarantees for TOTAL Refining SAUDI ARABIA SAS shareholders’ advances for an amount of $1,013 million. In 2013,
TOTAL S.A. provided guarantees in connection with the financing of the Ichthys LNG project. As of December 31, 2015, these guarantees, which are presented under “Guarantees given
against borrowings” in Note 23 to the Consolidated Financial Statements, amounted to $6,580 million.
These guarantees and other information on
the Company’s commitments and contingencies are presented in Note 23 to the Consolidated Financial Statements. The Group does not currently consider that these guarantees, or any other off-balance sheet arrangements of TOTAL S.A. nor any
other members of the Group, have or are reasonably likely to have, currently or in the future, a material effect on the Group’s financial condition, changes in financial condition, revenues or expenses, results of operation, liquidity, capital
expenditures or capital resources.
|
(1)
|
Excludes net current and non-current financial debt of $141 million as of December 31, 2015, $(56) million as of December 31, 2014 and $(179)
million as of December 31, 2013, related to assets classified in accordance with IFRS 5 “non-current assets held for sale and discontinued operations”.
|
|
(2)
|
Net-debt-to-equity ratio = net debt (i.e., the sum of current borrowings, other current financial liabilities and non-current financial debt, net of current
financial assets, net financial assets and liabilities related to assets classified in accordance with IFRS 5 as non-current assets held for sale, hedging instruments on non-current financial debt and cash and cash equivalents) divided by the sum of
shareholders’ equity and non-controlling interests after expected dividends payable.
|
|
|
|
|
|
82
|
|
TOTAL S.A. Form 20-F 2015
|
Item 5 - Contractual Obligations
CONTRACTUAL OBLIGATIONS
|
|
|
|
|
|
|
|
|
|
|
|
|
|
|
|
|
|
|
|
|
|
|
Payment due by period (M$)
|
|
Less
than
1 year
|
|
|
1-3
years
|
|
|
3-5
years
|
|
|
More
than
5 years
|
|
|
Total
|
|
|
Non-current debt obligations
(a)
|
|
|
—
|
|
|
|
8,981
|
|
|
|
10,467
|
|
|
|
23,502
|
|
|
|
42,950
|
|
|
Current portion of non-current debt
obligations
(b)
|
|
|
4,518
|
|
|
|
—
|
|
|
|
—
|
|
|
|
—
|
|
|
|
4,518
|
|
|
Finance lease obligations
(c)
|
|
|
41
|
|
|
|
41
|
|
|
|
40
|
|
|
|
214
|
|
|
|
336
|
|
|
Asset retirement obligations
(d)
|
|
|
707
|
|
|
|
1,322
|
|
|
|
795
|
|
|
|
10,490
|
|
|
|
13,314
|
|
|
Operating lease obligations
(c)
|
|
|
1,430
|
|
|
|
1,833
|
|
|
|
992
|
|
|
|
1,718
|
|
|
|
5,973
|
|
|
Purchase
obligations
(e)
|
|
|
14,728
|
|
|
|
11,275
|
|
|
|
13,337
|
|
|
|
84,628
|
|
|
|
123,968
|
|
|
Total
|
|
|
21,424
|
|
|
|
23,452
|
|
|
|
25,631
|
|
|
|
120,552
|
|
|
|
191,059
|
|
|
(a)
|
Non-current debt obligations are included in the items “Non-current financial debt” and “Hedging instruments of non-current financial
debt” of the Consolidated Balance Sheet. The figures in this table are net of the non-current portion of issue swaps and swaps hedging bonds, and exclude non-current finance lease obligations of $295 million and net current and non-current
financial debt of $141 million related to assets classified in accordance with IFRS 5 “non-current assets held for sale and discontinued operations”.
|
|
(b)
|
The current portion of non-current debt is included in the items “Current borrowings”, “Current financial assets” and “Other current
financial liabilities” of the balance sheet. The figures in this table are net of the current portion of issue swaps and swaps hedging bonds and exclude the current portion of finance lease obligations of $41 million.
|
|
(c)
|
Finance lease obligations and operating lease obligations: the Group leases real estate, retail stations, ships, and other equipment through non-cancelable
capital and operating leases. These amounts represent the future minimum lease payments on non-cancelable leases to which the Group is committed as of December 31, 2015, less the financial expense due on finance lease obligations for $55
million.
|
|
(d)
|
The discounted present value of Upstream asset retirement obligations, primarily asset removal costs at the completion date.
|
|
(e)
|
Purchase obligations are obligations under contractual agreements to purchase goods or services, including capital projects. These obligations are enforceable
and legally binding on TOTAL and specify all significant terms, including the amount and the timing of the payments. These obligations mainly include: hydrocarbon unconditional purchase contracts (except where an active, highly liquid market exists
and when the hydrocarbons are expected to be re-sold shortly after purchase), reservation of transport capacities in pipelines, unconditional exploration works and development works in the Upstream segment, and contracts for downstream capital
investment projects. This disclosure does not include contractual exploration obligations with host states where a monetary value is not attributed and purchases of booking capacities in pipelines where the Group has a participation superior to the
capacity used.
|
For additional information on the Group’s contractual obligations, see Note 23 to the Consolidated
Financial Statements. The Group has other obligations in connection with pension plans which are described in Note 18 to the Consolidated Financial Statements. As these obligations are not contractually fixed as to timing and amount, they have
not been included in this disclosure. Other
non-
current liabilities, detailed in Note 19 to the Consolidated Financial Statements, are liabilities related to risks that are probable and amounts that can be reasonably estimated. However,
no contractual agreements exist related to the settlement of such liabilities, and the timing of the settlement is not known.
RESEARCH AND DEVELOPMENT
In 2015, TOTAL invested $1,068 million in Research and Development (R&D), compared to $1,353 million in 2014 and
$1,260 million in 2013. There were 4,498 people dedicated to R&D activities in 2015 compared to 4,840 in 2014 and 4,684 in 2013. The decrease in R&D budget and staff between 2014 and 2015 was due to divestments during the year (notably
Bostik, which represented an R&D budget of $65 million in 2014). At a constant scope, the R&D budget has continuously increased since 2004.
R&D at TOTAL focuses on six major axes:
|
•
|
|
developing knowledge, tools and technological expertise to discover and profitably operate complex oil and gas resources at a reduced cost to help meet the
global demand for energy;
|
|
•
|
|
developing, industrializing and improving first-level competitive processes for the conversion of oil, gas and biomass resources to adapt to changes in resources
and markets, improve reliability and safety, achieve better energy efficiency, reduce the environmental footprint and maintain the Group’s economic margins in the long term;
|
|
•
|
|
developing and industrializing solar, biomass and carbon capture and storage technologies to help prepare for future energy needs in an economically competitive
manner;
|
|
•
|
|
developing practical, innovative and competitive materials and products that meet customers’ specific needs, contribute to the emergence of new features and
systems, enable current materials to be replaced by materials delivering higher
|
|
|
|
performance to users, and address the challenges of improved energy efficiency, lower environmental impact and toxicity, better management of their life cycle and waste recovery;
|
|
•
|
|
understanding and measuring the impacts of the Group’s operations and products on ecosystems (water, soil, air, biodiversity) and recovering waste to
improve environmental safety, as part of the regulation in place, and reduce their environmental footprint to endeavor to achieve sustainability in the Group’s operations; and
|
|
•
|
|
mastering and using innovative technologies such as biotechnologies, materials sciences, nanotechnologies, high-performance computing, information and
communication technologies or new analytical techniques.
|
These issues are globally incorporated into the project portfolio to develop
synergies. Different aspects may be looked at independently by different business segments.
The portfolio managed by Total Energy Ventures, in charge of
developping SMEs specialized in innovative energy technologies and cleantechs for the Group
,
has grown regularly since 2009. In addition, a loan facility was introduced for innovative SMEs that develop technologies of interest for the Group.
The Group intends to increase R&D in all of its segments through cross-functional themes and technologies. Constant attention is paid to R&D
synergies between business segments.
|
|
|
|
|
2015 Form 20-F TOTAL S.A.
|
|
83
|
Item 6 - A. Directors and Senior Management
The Group has 18 R&D sites worldwide and has forged approximately 1,000 partnerships with other industrial groups
and academic or highly specialized research institutes. TOTAL also has a permanently renewed network of scientific advisors worldwide that monitor and consult on matters of interest to the Group’s R&D activities. Long-term partnerships with
universities and academic laboratories considered to be of strategic importance in Europe, the United States, Japan and China, as well as innovative small businesses, are part of the Group’s approach.
Each business segment is developing an active intellectual property activity aimed at protecting its innovations,
allowing its activity to develop and promoting its technological assets among its partners. In 2015, more than 200 patent applications were issued by the Group.
For additional information on TOTAL’s R&D, refer to “Item 4 — E. Other Matters — 2. Research & Development”, above.
ITEM 6. DIRECTORS, SENIOR
MANAGEMENT AND EMPLOYEES
A. DIRECTORS AND SENIOR MANAGEMENT
|
1.
|
Composition of the Board of Directors
|
|
1.1.
|
Composition of the Board of Directors
|
The Company is
administered by a Board of Directors composed of 12 members. The members of the Board of Directors include a director representing employee shareholders and a director representing employees pursuant to French law.
Directors are appointed for a 3-year term (Article 11 of the Company’s bylaws) by the Shareholders’ Meeting, with the exception of the director
representing employees who is appointed by the Central Works Council.
The terms of office of the members of the Board are staggered to more evenly space
the renewal of appointments and to ensure the continuity of the work of the Board of Directors and its Committees, in accordance with the recommendations made in the AFEP-MEDEF Code, which the Company uses as a reference.
As of February 10, 2016, the Board of Directors had seven independent directors,
i.e.
, 70%
(1)
of the directors (refer to “— 1.4. Director independence”, below).
Mr. Patrick Pouyanné has served as Chairman of the Board of Directors since December 19, 2015, the date on which the functions of Chairman of the Board of Directors and Chief Executive Officer were
combined following the decision made by the Board of Directors at its meeting on December 16, 2015 (refer to “— C.1.1. Governance structure”, below). Since December 19, 2015, Mr. Pouyanné has therefore been
Chairman and Chief Executive Officer of TOTAL S.A.
At its meeting on December 16, 2015, the Board of Directors also appointed Ms. Patricia
Barbizet as Lead Independent Director for the duration of her term of office as director. Her duties took effect on December 19, 2015 and are described in “— C.1.2. Working procedures of the Board of Directors
”
,
below.
|
|
|
|
|
|
|
|
|
|
|
|
|
|
|
|
|
|
|
|
|
|
|
|
|
|
|
|
|
|
|
|
|
|
|
|
|
|
|
|
|
|
Participation in Board Committee
s
|
|
|
As of February 10, 2016
|
|
First
appointment
|
|
|
Expiry of
term of
office
|
|
|
Independence
|
|
|
Audit
Committee
|
|
|
Governance
and Ethics
Committee
|
|
|
Compensation
Committee
|
|
|
Strategic
Committee
|
|
|
Patrick Pouyanné
|
|
|
2015
|
|
|
|
2018
|
|
|
|
|
|
|
|
|
|
|
|
|
|
|
|
|
|
|
|
C
|
|
|
Thierry Desmarest, Honorary Chairman
|
|
|
1995
|
|
|
|
2016
|
|
|
|
|
|
|
|
|
|
|
|
*
|
|
|
|
|
|
|
|
*
|
|
|
Patrick Artus
|
|
|
2009
|
|
|
|
2018
|
|
|
|
*
|
|
|
|
*
|
|
|
|
|
|
|
|
|
|
|
|
*
|
|
|
Patricia Barbizet, Lead Independent Director
|
|
|
2008
|
|
|
|
2017
|
|
|
|
*
|
|
|
|
|
|
|
|
C
|
|
|
|
*
|
|
|
|
*
|
|
|
Marc Blanc, director representing employees
|
|
|
2014
|
|
|
|
2017
|
|
|
|
n/a
|
|
|
|
|
|
|
|
|
|
|
|
|
|
|
|
*
|
|
|
Gunnar Brock
|
|
|
2010
|
|
|
|
2016
|
|
|
|
*
|
|
|
|
|
|
|
|
*
|
|
|
|
*
|
|
|
|
*
|
|
|
Marie-Christine Coisne-Roquette
|
|
|
2011
|
|
|
|
2017
|
|
|
|
*
|
|
|
|
C
|
|
|
|
|
|
|
|
*
|
|
|
|
|
|
|
Paul Desmarais, Jr
|
|
|
2002
|
|
|
|
2017
|
|
|
|
|
|
|
|
|
|
|
|
|
|
|
|
|
|
|
|
|
|
|
Anne-Marie Idrac
|
|
|
2012
|
|
|
|
2018
|
|
|
|
*
|
|
|
|
|
|
|
|
*
|
|
|
|
|
|
|
|
|
|
|
Charles Keller, director representing employee shareholders
|
|
|
2013
|
|
|
|
2016
|
|
|
|
n/a
|
|
|
|
*
|
|
|
|
|
|
|
|
|
|
|
|
|
|
|
Barbara Kux
|
|
|
2011
|
|
|
|
2017
|
|
|
|
*
|
|
|
|
|
|
|
|
*
|
|
|
|
|
|
|
|
*
|
|
|
Gérard Lamarche
|
|
|
2012
|
|
|
|
2016
|
|
|
|
*
|
|
|
|
*
|
|
|
|
|
|
|
|
C
|
|
|
|
|
|
C: Committee chair
|
(1)
|
Excluding the director representing employee shareholders and the director representing employees, in accordance with recommendations of the AFEP-MEDEF Code
(point 9.2).
|
|
|
|
|
|
84
|
|
TOTAL S.A. Form 20-F 2015
|
Item 6 - A. Directors and Senior Management
The profiles, experience and expertise of the directors are detailed in the biographies
below:
Patrick Pouyanné
Chairman and Chief Executive Officer of TOTAL S.A.
Born on June 24, 1963 (French).
A graduate of École Polytechnique and a Chief Engineer of France’s Corps des Mines engineering school, Mr. Pouyanné held various
administrative positions in the Ministry of Industry and other cabinet positions (technical advisor to the Prime Minister in the fields of the Environment and Industry – Edouard Balladur – from 1993 to 1995, Cabinet Director for the
Minister for Information and Aerospace Technologies – François Fillon – from 1995 to 1996) between 1989 and 1996. In January 1997, he joined TOTAL’s Exploration & Production division, first as Chief Administrative
Officer in Angola, before becoming Group representative in Qatar and President of the Exploration and Production subsidiary in that country in 1999. In August 2002, he was appointed President, Finance, Economy and IT for Exploration &
Production. In January 2006, he became President, Strategy, Growth and Research in Exploration & Production and was appointed a member of the Group’s Management Committee in May 2006. In March 2011, Mr. Pouyanné was
appointed Vice President, Chemicals, and Vice President, Petrochemicals. In January 2012, he became President,
Refining & Chemicals and a member of the Group’s Executive Committee.
On
October 22, 2014, he was appointed Chief Executive Officer of TOTAL. On May 29, 2015, he was appointed by the Annual Shareholders’ Meeting as director of TOTAL S.A. for a 3-year term. At its meeting on December 16, 2015, the
Board of Directors of TOTAL appointed him as Chairman of the Board of Directors as of December 19, 2015 for the remainder of his term of office as director. Mr. Pouyanné therefore is now Chairman and Chief Executive Officer.
Main function: Chairman and Chief Executive Officer of TOTAL S.A.
Director of TOTAL S.A. since May 29, 2015 until 2018. Chairman of the Strategic Committee. Holds 55,489 TOTAL shares and 7,767.05 units of the TOTAL ACTIONNARIAT FRANCE collective investment fund.
Principal other directorships
Patrick Artus
Born on October 14, 1951 (French).
A graduate of École Polytechnique, École Nationale de la
Statistique et de l’Administration Économique (ENSAE) and Institut d’études politiques de Paris, Mr. Artus began his career at INSEE (the French National Institute for Statistics and Economic Studies) where his work
included economic forecasting and modeling. He then worked at the Economics Department of the OECD (1980), later becoming the Head of Research at the ENSAE from 1982 to 1985. He was scientific adviser at the research department of the Banque de
France, before joining the Natixis Group as the head of the research department, and has been a member of its Executive
Committee since May 2013. He is an associate professor at the University of Paris I, Sorbonne. He is also a member of the Cercle des Économistes.
Main function: Head of the research department and member of the Executive Committee of Natixis
Director of TOTAL S.A. since 2009. Last renewal: May 29, 2015 until 2018. Independent director. Member of the Audit Committee and the Strategic Committee. Holds 1,000 shares.
Principal other directorships
|
*
|
Company names marked with an asterisk are publicly listed companies.
|
|
|
Underlined companies are companies excluded from the group in which the director has his or her main duties.
|
|
|
|
|
|
2015 Form 20-F TOTAL S.A.
|
|
85
|
Item 6 - A. Directors and Senior Management
Patricia Barbizet
Born on April 17, 1955 (French).
Ms. Barbizet is the Chief Executive Officer of Artémis, the Pinault
family’s investment company, Chairwoman and Chief Executive Officer of Christie’s International and Vice Chairman of the Board of Directors of Kering S.A. She joined the Pinault group in 1989 as the Chief Financial Officer. In 1992, she
became the Chief Executive Officer of Artémis. In 2014, she was appointed Chief Executive Officer of Christie’s International. She was previously the Treasurer of Renault Véhicules Industriels and then Chief Financial Officer of
Renault Crédit International. Ms. Barbizet is also a member of the Board of Directors of TOTAL S.A. and PSA Peugeot Citroën. She was also a member of the Board of Directors of Bouygues from 2005 to 2012, and Chairwoman of the
investment committee of the Fonds Stratégique d’Investissement from 2008 to 2013. She is an ESCP Europe graduate (class of 1976).
Main
function: Chief Executive Officer of Artémis
Director of TOTAL S.A. since 2008. Last renewal: May 16, 2014 until 2017. Independent director.
Lead Independent Director, Chairwoman of the Governance and Ethics Committee, member of the Compensation Committee and Strategic Committee. Holds 1,000 shares.
Principal other directorships
|
•
|
|
Director of
PSA Peugeot Citroën
* until April 26, 2016
|
|
•
|
|
Director and Vice Chairperson of the Board of Directors of Kering S.A.*
|
|
•
|
|
Director of Groupe Fnac* (S.A.)
|
|
•
|
|
Director and Chief Executive Officer of Artémis (S.A.)
|
|
•
|
|
Chief Executive Officer (non-Director) of Financière Pinault (S.C.A.)
|
|
•
|
|
Member of the Supervisory Board of Financière Pinault (S.C.A.)
|
|
•
|
|
Permanent representative of Artémis, member of the Board of Directors of Agefi (S.A.)
|
|
•
|
|
Permanent representative of Artémis, member of the Board of Directors of Sebdo le Point (S.A.)
|
|
•
|
|
Member of the Management Board of Société Civile du Vignoble de Château Latour (
société civile
)
|
|
•
|
|
Director of Yves Saint Laurent (S.A.S.)
|
|
•
|
|
Chairwoman, CEO and Board member of Christie’s International Plc (England)
|
|
•
|
|
Administratore Delagato & administratore de Palazzo Grazzi (Italy)
|
Marc Blanc
Born on December 7, 1954 (French).
After joining the Group in 1980 as a refinery operator at the Grandpuits
Refinery, Mr. Blanc has, since 1983, exercised a number of trade union functions, in particular as Secretary of the European Elf Aquitaine Committee and then at TOTAL S.A. from 1991 to 2005. From 1995 to 1997, he worked as Secretary General of
the CFDT Seine et Marne trade union for the chemicals industry (Syndicat Chimie CFDT), and then, from 1997 to 2001, as Deputy Secretary General of the CFDT trade union for the power and chemicals industries in the Île de France region
(Syndicat Énergie Chimie, SECIF), where he became Secretary General in 2001 and continued in this role until 2005. Subsequently, from 2005 to 2012, Mr. Blanc acted as Federal Secretary of the CFDT chemical and power industry federation
(Fédération Chimie Énergie) where he was responsible first for industrial policy and then for sustainable development, corporate social responsibility, international affairs (excluding Europe), and the oil and chemicals sectors.
From 2009 to 2014, he was Director of the Chemicals and Power Industry Research and Training Institute (IDEFORCE
association) as well as Adviser to the Economic, Social and Environmental Council (Conseil Économique, Social et Environnemental, CESE) where he sits as a member of the Economic and
Finance section as well as of the Environment section. In particular, he is responsible for submitting a report on the societal challenges of biodiversity (
la biodiversité, relever le défi sociétal
), which was published
in 2011, and is the co-author with Alain Bougrain-Dubourg of a follow-up opinion entitled “Acting for Biodiversity” (
Agir pour la Biodiversité
) submitted in 2013. Mr. Blanc was also a member of the CESE’s temporary
Committee on the “annual report on the state of France” in October 2013.
Main function: Director of TOTAL S.A. representing employees
Director of TOTAL S.A. representing employees as of November 4, 2014 until 2017.
Member of the Strategic Committee. Holds 345 TOTAL shares and 848 units in the TOTAL ACTIONNARIAT FRANCE collective investment fund.
Principal other directorships
|
*
|
Company names marked with an asterisk are publicly listed companies.
|
|
|
Underlined companies are companies excluded from the group in which the director has his or her main duties.
|
|
|
|
|
|
86
|
|
TOTAL S.A. Form 20-F 2015
|
Item 6 - A. Directors and Senior Management
Gunnar Brock
Born on April 12, 1950 (Swedish).
A graduate of Stockholm School of Economics with an MBA in Economics and
Business Administration, Mr. Brock held various international positions at Tetra Pak. He served as Chief Executive Officer of Alfa Laval from 1992 to 1994 and as Chief Executive Officer of Tetra Pak from 1994 to 2000. After serving as Chief
Executive Officer of Thule International, he was appointed Chief Executive Officer of Atlas Copco AB from 2002 to 2009. He is currently Chairman of the Board of Stora Enso Oy. Mr. Brock is also a member of the Royal Swedish Academy of
Engineering Sciences and of the Board of Directors of the Stockholm School of Economics.
Main function: Chairman of the Board of Directors of Stora Enso
Oy*
Director of TOTAL S.A. since 2010. Last renewal: May 17, 2013 until 2016. Independent director. Member of the
Compensation Committee, the Governance and Ethics Committee and the Strategic Committee.
Holds 1,000 shares.
Principal other directorships
|
•
|
|
Chairman of the Board of Directors of Stora Enso Oy*
|
|
•
|
|
Member of the Board of
Investor AB
*
|
|
•
|
|
Member of the Board of
Syngenta AG
*
|
|
•
|
|
Chairman of the Board of
Mölnlycke Health Care Group
|
|
•
|
|
Chairman of the Board of
Rolling Optics
|
|
•
|
|
Member of the Board of
Stena AB
|
Marie-Christine Coisne-Roquette
Born on November 4, 1956 (French).
Ms. Coisne-Roquette has a Bachelor’s Degree in English. Lawyer by
training, with a French Masters’ Law and a Specialized Law Certificate from the New York bar, she started a career as an attorney in 1981 at the Paris and New York bars, as an associate of Cabinet Sonier & Associés in Paris. In
1984, she joined the Board of Sonepar as a director and gave up her law career in 1988 to work full time for the family group. As Chairwoman of the family holding company, Colam Entreprendre, and later of the Sonepar Supervisory Board, she
consolidated family ownership, reorganized the Group structures and reinforced the shareholders’ Group to sustain its long-term strategy. Chairwoman and CEO of Sonepar from early 2002 until end 2012, Ms. Coisne-Roquette handed over the
operational management of the Group to the Managing Director, and is now Chairwoman of the Board of Sonepar. She heads also Colam Entreprendre as its Chairwoman and CEO. Formerly a member of the Young Presidents’ Organization (YPO), she served
the MEDEF (France’s main employers’ association) as Executive Committee member from 2000 to 2013 and Chairwoman of the Tax Commission the last
eight years. She was member of the Economic, Social and Environmental Council from 2013 and 2015 and is currently a Director of TOTAL S.A.
Main function: Chairwoman of the Board of Directors of Sonepar
Director of TOTAL S.A. since 2011. Last renewal:
May 16, 2014 until 2017. Independent director. Chairwoman of the Audit Committee and member of the Compensation Committee. Holds 3,718 shares.
Principal other directorships
|
•
|
|
Chairwoman of the Board of Directors of Sonepar S.A.
|
|
•
|
|
Chairwoman and Chief Executive Officer of Colam Entreprendre
|
|
•
|
|
Permanent representative of Colam Entreprendre,
co-manager
of Sonedis (
société civile
)
|
|
•
|
|
Permanent representative of Colam Entreprendre, Director of Sovemarco Europe (S.A.)
|
|
•
|
|
Chief Executive Officer of Sonepack S.A.S.
|
|
•
|
|
Co-manager of
Développement Mobilier & Industriel (D.M.I.)
(
société civile
)
|
|
•
|
|
Manager of
Ker Coro
(
société civile immobilière
)
|
|
*
|
Company names marked with an asterisk are publicly listed companies.
|
|
|
Underlined companies are companies excluded from the group in which the director has his or her main duties.
|
|
|
|
|
|
2015 Form 20-F TOTAL S.A.
|
|
87
|
Item 6 - A. Directors and Senior Management
Paul Desmarais, Jr
Born on July 3, 1954 (Canadian).
A graduate of McGill University in Montreal and Institut européen
d’administration des affaires (INSEAD) in Fontainebleau, Mr. Desmarais was first appointed as Vice Chairman (1984), and then as Chairman and Chief Executive Officer (1986), Executive Vice Chairman of the Board (1989), Executive Chairman of
the Board (1990), Chairman of the Executive Committee (2006) and Executive Co-Chairman of the Board (2008) of Power Financial Corporation, a company he helped found. Since 1996, he has also served as Chairman of the Board and Co-Chief
Executive Officer of Power Corporation of Canada.
Main function: Chairman of the Board & Co-Chief Executive Officer of Power Corporation of
Canada*
Director of TOTAL S.A. since 2002. Last renewal: May 16, 2014 until 2017. Holds 2,000 ADRs (corresponding to 2,000 shares).
Principal other directorships
|
•
|
|
Chairman of the Board & Co-Chief Executive Officer of Power Corporation of Canada*
|
|
•
|
|
Executive Co-Chairman of the Board of Power Financial Corporation* (Canada)
|
|
•
|
|
Executive Chairman of the Board of Directors and Co-Chief Executive Officer of Pargesa Holding SA* (Switzerland)
|
|
•
|
|
Director and member of the Executive Committee of Great-West Lifeco Inc.* (Canada)
|
|
•
|
|
Director and member of the Executive Committee of Great-West Life Assurance Company (Canada)
|
|
•
|
|
Director and member of the Executive Committee of Great-West Life & Annuity Insurance Company (United States of America)
|
|
•
|
|
Director of Great-West Financial (Canada) Inc. (Canada)
|
|
•
|
|
Vice Chairman of the Board, Director and member of the Standing Committee of Groupe Bruxelles Lambert S.A.* (Belgium)
|
|
•
|
|
Director and member of the Executive Committee of Investors Group Inc. (Canada)
|
|
•
|
|
Director and member of the Executive Committee of London Insurance Group Inc. (Canada)
|
|
•
|
|
Director and member of the Executive Committee of London Life Insurance Company (Canada)
|
|
•
|
|
Director and member of the Executive Committee of Mackenzie Inc.
|
|
•
|
|
Director and Deputy Chairman of the Board of La Presse, ltée (Canada)
|
|
•
|
|
Director and Deputy Chairman of Gesca ltée (Canada)
|
|
•
|
|
Director of
LafargeHolcim Ltd
* (Switzerland)
|
|
•
|
|
Director and member of the Executive Committee of The Canada Life Assurance Company (Canada)
|
|
•
|
|
Director and member of the Executive Committee of The Canada Life Financial Corporation (Canada)
|
|
•
|
|
Director and member of the Executive Committee of IGM Financial Inc.* (Canada)
|
|
•
|
|
Director and Chairman of the Board of 171263 Canada Inc. (Canada)
|
|
•
|
|
Director of 152245 Canada Inc. (Canada)
|
|
•
|
|
Director of GWL&A Financial Inc. (United States of America)
|
|
•
|
|
Director of Great-West Financial (Nova Scotia) Co. (Canada)
|
|
•
|
|
Director of Great-West Life & Annuity Insurance Company of New York (United States of America)
|
|
•
|
|
Director of Power Communications Inc. (Canada)
|
|
•
|
|
Director and Chairman of the Board of Power Corporation International (Canada)
|
|
•
|
|
Director and member of the Executive Committee of Putnam Investments, LLC (United States of America)
|
|
•
|
|
Member of the Supervisory Board of Power Financial Europe B.V. (Netherlands)
|
|
•
|
|
Director and member of the Executive Committee of The Canada Life Insurance Company of Canada (Canada)
|
|
•
|
|
Director and Deputy Chairman of the Board of Groupe de Communications Square Victoria Inc. (Canada)
|
|
•
|
|
Member of the Supervisory Board of Parjointco N.V. (Netherlands)
|
|
•
|
|
Director of
SGS S.A.
* (Switzerland)
|
Thierry Desmarest
Born on December 18, 1945 (French).
A graduate of École Polytechnique and an Engineer of France’s
Corps des Mines engineering school, Mr. Desmarest served as Director of Mines and Geology in New Caledonia, then as technical advisor at the Offices of the Minister of Industry and the Minister of Economy. He joined TOTAL in 1981, where he held
various management positions, then served as President of Exploration & Production until 1995. He served as Chairman and Chief Executive Officer of TOTAL from May 1995 until February 2007, and then as Chairman of the Board of TOTAL until
May 21, 2010. He was then appointed Honorary Chairman of TOTAL where he remains a
director, and was Chairman of the TOTAL Foundation until January 2015. On October 22, 2014, he was again appointed as Chairman of the Board of Directors for a term of office that expired on
December 18, 2015.
Main function: Honorary Chairman of TOTAL S.A.*
Director of TOTAL S.A. since 1995. Last renewal: May 17, 2013 until 2016. Member of the Governance and Ethics Committee and the Strategic Committee. Holds 186,576 shares.
Principal other
directorships
|
•
|
|
Director of
Air Liquide
*
|
|
•
|
|
Director of
Renault S.A.
*
|
|
•
|
|
Director of
Renault S.A.S.
|
|
*
|
Company names marked with an asterisk are publicly listed companies.
|
|
|
Underlined companies are companies excluded from the group in which the director has his or her main duties.
|
|
|
|
|
|
88
|
|
TOTAL S.A. Form 20-F 2015
|
Item 6 - A. Directors and Senior Management
Anne-Marie Idrac
Born on July 27, 1951 (French).
A graduate of Institut d’Etudes Politiques de Paris and formerly a student
at École Nationale d’Administration (ENA -1974), Ms. Idrac began her career holding various positions as a senior civil servant at the Ministry of Infrastructure (Ministère de l’Équipement) in the fields of
environment, housing, urban planning and transportation. She served as Executive Director of the public institution in charge of the development of Cergy-Pontoise (Établissement public d’Aménagement de Cergy-Pontoise) from 1990 to
1993 and Director of land transport from 1993 to 1995. Ms. Idrac was State Secretary for Transport from May 1995 to June 1997, elected member of Parliament for Yvelines from 1997 to 2002, regional councilor for Île-de-France from 1998 to
2002 and State Secretary
for Foreign Trade from March 2008 to November 2010. She also served as Chairwoman and Chief Executive Officer of RATP from 2002 to 2006 and then as Chairwoman of SNCF from 2006 to 2008.
Main function: Chairwoman of the Supervisory Board of Toulouse-Blagnac Airport
Director of TOTAL S.A. since 2012. Last renewal: May 29, 2015 until 2018. Independent director. Member of the Governance and Ethics Committee. Holds 1,195 shares.
Principal other
directorships
|
•
|
|
Director of
Saint Gobain
*
|
|
•
|
|
Chairwoman of the Supervisory Board of Toulouse-Blagnac Airport
|
Charles Keller
Born on November 15, 1980 (French).
A graduate of École Polytechnique and École des Hautes Etudes
Commerciales (HEC), Mr. Keller joined the Group in 2005 at the refinery in Normandy as a performance auditor. In 2008, he was named Project Manager at the Grandpuits refinery to improve the site’s energy efficiency and oversee its
reliability plan. In 2010, he joined Exploration & Production and Yemen LNG as head of the Production Support department in charge of optimizing the plant. Since February 2014, he has been a reservoir engineer at the head office in La
Défense. While performing his duties in the refining sector, Mr. Keller sat on the Works Committees of the two refineries and contributed to the activities of the Central Works
Council of UES Aval, first as an elected member and then as a union representative. Mr. Keller has been an elected member, representing holders of fund units, of the Supervisory Board of the
TOTAL ACTIONNARIAT FRANCE collective investment fund since November 2012.
Main function: Engineer
Director of TOTAL S.A. representing employee shareholders since May 17, 2013 and until 2016. Member of the Audit Committee. Holds 754 TOTAL shares and 543
units of the TOTAL ACTIONNARIAT FRANCE collective investment fund.
Principal other
directorships
Barbara Kux
Born on February 26, 1954 (Swiss).
Holder of an MBA (with honors) from INSEAD in Fontainebleau, Ms. Kux
joined McKinsey & Company in 1984 as a Management Consultant, where she was responsible for strategic assignments for international groups. After serving as manager for development of emerging markets at ABB and then at Nestlé
between 1989 and 1999, she was appointed Executive Director of Ford in Europe from 1999 to 2003. In 2003, Ms. Kux became a member of the Executive Committee of the Philips group and, starting in 2005, was in charge of the supply chain and
sustainable development. From 2008 to 2013, she was a member of the Executive Board of Siemens AG, a global leader in high technology present in the energy and renewable energies sector. She has been responsible for sustainable development and the
supply chain of the group.
Since 2013, she has been a director of various world-class international companies and is also a member of the Advisory Board of INSEAD.
Main function: Independent director
Director of TOTAL S.A. since 2011. Last renewal: May 16, 2014 until 2017.
Independent director. Member of the Governance and Ethics Committee and the Strategic Committee. Holds 1,000 shares.
Principal other
directorships
|
•
|
|
Director of
Engie S.A
.*
|
|
•
|
|
Director of
Pargesa Holding S.A.
*
|
|
•
|
|
Member of the Supervisory Board of
Henkel
*
|
|
•
|
|
Member of the Board of Directors of
Firmenich S.A.
|
|
*
|
Company names marked with an asterisk are publicly listed companies.
|
|
|
Underlined companies are companies excluded from the group in which the director has his or her main duties.
|
|
|
|
|
|
2015 Form 20-F TOTAL S.A.
|
|
89
|
Item 6 - A. Directors and Senior Management
Gérard Lamarche
Born on July 15, 1961 (Belgian).
Mr. Lamarche graduated in economic science from Louvain-la-Neuve
University and is also a graduate of INSEAD business school (Advanced Management Program for Suez Group Executives). He also followed the Global Leadership Series training course at the Wharton International Forum in 1998-99. He started his career
in 1983 at Deloitte Haskins & Sells in Belgium, before becoming a consultant in mergers and acquisitions in the Netherlands in 1987. In 1988, Mr. Lamarche joined Société Générale de Belgique as an investment
manager and management controller between 1989 and 1991, then as a consultant in strategic operations from 1992 to 1995. He joined Compagnie Financière de Suez as a project manager for the Chairman and Secretary of the Executive Committee
(1995-1997), before taking part in the merger between Compagnie de Suez and Lyonnaise des Eaux, which became Suez Lyonnaise des Eaux (1997), and then being appointed as the acting Managing Director in charge of Planning, Management Control and
Accounts. In 2000, Mr. Lamarche pursued his career by branching into the industrial sector, joining NALCO (the American subsidiary of the Suez group
and the world leader in the treatment of industrial water) as the Director and Chief Executive Officer. In January 2003, he was appointed Chief Financial Officer of the Suez group. In April 2011,
Mr. Lamarche became a director on the Board of Directors of Groupe Bruxelles Lambert (GBL). He has been the Deputy Managing Director since January 2012. Mr. Lamarche is currently a director of LafargeHolcim Ltd (Switzerland), Legrand,
TOTAL S.A. and SGS S.A.
Main function: Deputy Managing Director of Groupe Bruxelles Lambert*
Director of TOTAL S.A. since 2012. Last renewal: May 17, 2013 until 2016. Independent director. Chairman of the Compensation Committee and member of the Audit Committee. Holds 2,836 shares.
Principal other directorships
|
•
|
|
Deputy Managing Director and Director of Groupe Bruxelles Lambert*
|
|
•
|
|
Director and Chairman of the Audit Committee of
Legrand
*
|
|
•
|
|
Director of
LafargeHolcim Ltd
* (Switzerland)
|
|
•
|
|
Director of
SGS S.A.
* (Switzerland)
|
|
1.2.
|
Expired directorships of TOTAL S.A. in 2015
|
Born on August 14, 1942
(French).
A graduate of École Polytechnique and an Engineer of France’s Corps des Mines engineering school, Mr. Collomb held a number
of positions within the Ministry of Industry and other cabinet positions from 1966 to 1975. In 1975, he joined the Lafarge group, where he served in various management positions. He served as Chairman and Chief Executive Officer of Lafarge from 1989
to 2003, then as Chairman of the Board of Directors from 2003 to 2007, and has been the Honorary Chairman since 2007.
Director of TOTAL S.A. since 2000.
Last renewal: May 11, 2012 until May 29, 2015. Member of the Governance and Ethics Committee until May 29, 2015.
Born on August 2, 1959 (French).
A Chief Engineer of France’s Corps des Mines engineering school and a graduate of École Normale Supérieure with a doctorate in
physical science, Ms. Lauvergeon held various positions in industry before becoming Deputy Chief of Staff in the Office of the President of the Republic in 1990. She joined Lazard Frères et Cie as Managing Partner in 1995. From 1997 to
1999, she was Executive Vice President and member of the Executive Committee of Alcatel, where she was responsible for industrial partnerships and international affairs. Ms. Lauvergeon was Chairwoman of the Management Board of the Areva Group
from July 2001 to June 2011 and Chairwoman and Chief Executive Officer of Areva NC (formerly Cogema) from June 1999 to June 2011. Since 2011, Ms. Lauvergeon has been Chairwomanand Chief Executive Officer of ALP and, since April 2014, Chairwoman
of the Board of Directors of SIGFOX.
Director of TOTAL S.A. since 2000. Last renewal: May 11, 2012 until May 29, 2015. Member of the Strategic
Committee until May 29, 2015.
Born on January 23, 1942
(French).
Honorary Inspector General of Finance, Mr. Pébereau held various positions in the Ministry of Economy and Finance before serving,
from 1982 to 1993, as Chief Executive Officer and then as Chairman and Chief Executive Officer of Crédit Commercial de France (CCF). He was Chairman and Chief Executive Officer of BNP and then of BNP Paribas from 1993 to 2003, Chairman of the
Board of Directors from 2003 to 2011, and is currently Honorary Chairman of BNP Paribas, Chairman of the BNP Paribas Foundation, and Chairman of the Centre des professions financières. He is also a member of the Académie des Sciences
Morales et Politiques, a member of the Policy Board of the Institut de l’Entreprise, Honorary Chairman of the Supervisory Board of the Institut Aspen and Chairman of the ARC Foundation.
Director of TOTAL S.A. since 2000. Last renewal: May 11, 2012 until May 29, 2015. Chairman of the Compensation Committee until May 29, 2015.
|
1.3
|
Absence of conflicts of interest or convictions
|
The Board of
Directors noted the absence of potential conflicts of interest between the directors’ duties with respect to the Company and their private interests. To the Company’s knowledge, there is no family relationship among the members of the
Board of Directors of TOTAL S.A., there is no arrangement or agreement with customers or suppliers under which a director was selected, and there is no service agreement that binds a director to TOTAL S.A. or to any of its subsidiaries and provides
for special benefits under the terms thereof.
The current members of the Board of Directors of the Company have informed the Company that they have not
been convicted, have not been associated with a bankruptcy, receivership or liquidation, and have not been incriminated or publicly sanctioned or disqualified, as stipulated in item 14.1 of Annex I of EC Regulation 809/2004 of April 29, 2004.
|
*
|
Company names marked with an asterisk are publicly listed companies.
|
|
|
Underlined companies are companies excluded from the group in which the director has his or her main duties.
|
|
|
|
|
|
90
|
|
TOTAL S.A. Form 20-F 2015
|
Item 6 - A. Directors and Senior Management
|
1.4.
|
Director independence
|
At its meeting on February 10,
2016, the Board of Directors, on the recommendation of the Governance and Ethics Committee, reviewed the independence of the Company’s directors as of December 31, 2015. At the Committee’s proposal, the Board considered that, pursuant
to the AFEP-MEDEF Code, a director is independent when “he or she has no relationship of any kind with the Company, its Group or its Management, that may compromise the exercise of his or her freedom of judgment”.
For each director, this assessment relies on the independence criteria set forth in the AFEP-MEDEF Code, revised in November 2015, as outlined below, as well as on
the analysis of the High Committee for Corporate Governance (
Haut Comité de Gouvernement d’Entreprise
) set out in the AFEP-MEDEF Code Application Guide, revised in December 2015:
|
•
|
|
not to be an employee or executive director of the Company, or an employee or director of its parent company or of a company consolidated by its parent company,
and not having been in such a position for the previous five years;
|
|
•
|
|
not to be an executive director of a company in which the Company holds a directorship, directly or indirectly, or in which an employee appointed as such or an
executive director of the Company (currently in office or having held such office for less than five years) is a director;
|
|
•
|
|
not to be a significant customer, supplier, investment banker or commercial banker of the Company or Group or for which the Company or the Group represents a
material part of their business (the assessment of the materiality or non-materiality of the relationship must be discussed by the Board and the criteria on which this assessment was based must be explained in the Registration Document);
|
|
•
|
|
not to be related by close family ties to a corporate executive director;
|
|
•
|
|
not have been a statutory auditor of the Company within the previous five years; and
|
|
•
|
|
not have been a director of the Company for more than 12 years (upon expiry of the term of office during which the 12-year limit was reached).
|
The AFEP-MEDEF Code expressly stipulates that the Board can decide that the implementation of certain defined criteria is not relevant
or induces an interpretation that is particular to the Company.
At its meeting on February 10, 2016, based on the proposals of the Governance and
Ethics Committee, the Board of Directors observed that Mr. Desmarest, a director since May 30, 1995 and Chairman of the Board of Directors between October 22, 2014 and December 18, 2015, was a former executive director within the
meaning of the Code and therefore could not be considered as independent.
With regard to the criterion of 12 years of service, the Board of Directors,
at its meeting on February 10, 2016 and based on the proposals of the Governance and Ethics Committee, observed that as of December 31, 2015, the more than 12 years of service of Mr. Desmarais, Jr disqualified him from being
considered as independent within the meaning of the AFEP-MEDEF Code.
In addition, the Board deemed that the level of activity between the Group’s companies and
Stena AB, of which Mr. Brock is a director, which accounted for less than 0.05% of Stena AB’s sales
(1)
and less than 0.05% of the Group’s purchases in 2015,
represented neither a material portion of this supplier’s overall activity nor a material portion of the Group’s purchases. The Board concluded that Mr. Brock could be considered as being independent.
The Board also deemed that the level of activity between the Group’s companies and Engie, of which Ms. Kux is a director, which
accounted for less than 0.05% of Engie’s sales
(2)
and less than 0.3% of the Group’s purchases in 2015, represented neither a material portion of this
supplier’s overall activity nor a material portion of the Group’s purchases. The Board concluded that Ms. Kux could be considered as being independent.
Accordingly, Mses. Barbizet, Coisne-Roquette, Idrac and Kux and Messrs. Artus, Brock and Lamarche were deemed to be independent directors.
The percentage of independent directors on the Board based on its composition as of December 31, 2015 was 70%
(3)
.
The rate of independence of the Board of Directors is higher than that
recommended by the AFEP-MEDEF Code, which specifies that at least one-half of Board members at widely held companies with no controlling shareholders must be independent.
|
1.5.
|
Diversity policy of the Board of Directors
|
The Board of
Directors places a great deal of importance on its composition and that of its Committees’ composition. In particular, it relies on the work of the Governance and Ethics Committee, which reviews annually and proposes, as circumstances may
require, desirable changes to the composition of the Board of Directors and Committees based on the Group’s strategy.
The Governance and Ethics
Committee conducts its work within the context of a formal procedure so as to ensure the complementarity of the directors’ competencies and the diversity of their profiles, maintain a rate of independence for the Board as a whole that is
relevant to the Company’s governance structure and shareholder base, strive for a balanced representation of men and women on the Board, and promote an appropriate representation of directors of different nationalities.
As part of an effort that began several years ago, the composition of the Board of Directors has changed significantly since 2010 to achieve a more balanced
representation of men and women and an openness to more international profiles.
As of February 10, 2016, the Board of
Directors had four women (36.4%
(4)
of the directors) and four members of foreign nationality
(36.4%
(5)
of the directors).
According to the
recommendations introduced in April 2010 in the AFEP-MEDEF Code regarding balanced representation of men and women on boards, the proportion of women on boards of directors should be at least 20% within three years of the 2010 Shareholders’
Meeting and should be at least 40% within six years of that same Shareholders’ Meeting
(6)
. These requirements were also stipulated in the French law of January 27,
2011 regarding
|
(1)
|
Based on the 2014 consolidated sales published by Stena AB.
|
|
(2)
|
Based on the 2014 consolidated sales published by GDF Suez.
|
|
(3)
|
Excluding the director representing employee shareholders and the director
representing employees, in accordance with the recommendations of the AFEP-MEDEF Code (point 9.2).
|
|
(4)
|
Excluding the director representing employees, in accordance with the recommendations of the AFEP-MEDEF Code (point 6.4).
|
|
(5)
|
Excluding the director representing employees.
|
|
(6)
|
According to the AFEP-MEDEF Code (point 6.4), directors representing employees are
not considered for the purposes of calculating this percentage.
|
|
|
|
|
|
2015 Form 20-F TOTAL S.A.
|
|
91
|
Item 6 - A. Directors and Senior Management
balanced representation of men and women on boards of directors and supervisory boards and equal
treatment of men and women. Pursuant to this law, the 20% target must be reached by the end of the 2014 Shareholders’ Meeting and the 40% target must be reached by the end of the 2017 Shareholders’ Meeting
(1)
.
Given the appointment proposals presented to the next
Shareholders’ Meeting (refer to “— 1.7. Appointment and renewal of directorships proposed to the Shareholders’ Meeting of May 24, 2016”, below), if the proposed resolutions are approved, the composition of the
Board of Directors, following the Meeting, will include six women,
i.e.
, a proportion of 54.54%
(2)
, above the level of 40% set out by law and in the AFEP-MEDEF Code.
The Board of Directors will continue its reflections on diversifying its composition in the coming years.
|
1.6.
|
Training of directors
|
Directors may ask to receive training
in the specifics of the Company, its businesses and its business sector, as well as any training that may help them perform their duties as directors.
The director representing employees also receives 20 hours of training per year, which covers in-house training at the Company and/or training in economics offered
by an outside company chosen by the director, after the Board Secretary has accepted the company and the training program.
Since 2013, the Board of
Directors has met once a year at a production or industrial site. In October 2015, the Board of Directors met in Abu Dhabi. On-site Board meetings contribute to the integration of new directors.
|
1.7.
|
Appointment and renewal of directorships proposed to the Shareholders’ Meeting of May 24, 2016
|
|
–
|
Renewal of the directorship of Mr. Gérard Lamarche
|
At its meeting of February 10, 2016, and further to a proposal by the Governance and Ethics Committee, the Board of Directors decided to propose to the Annual Shareholders’ Meeting of May 24, 2016
the renewal of the directorship of Mr. Gérard Lamarche for a 3-year term to expire at the end of the Annual Shareholders’ Meeting held to approve the 2018 financial statements. Messrs. Desmarest and Brock have not requested the
renewal of their directorships.
|
–
|
Proposal to appoint Ms. Maria Van der Hoeven and Mr. Jean Lemierre
|
At its meeting of March 15, 2016, and further to a proposal by the Governance and Ethics Committee, the Board of Directors decided to propose to this same Shareholders’ Meeting the appointment of
Ms. Maria Van der Hoeven and Mr. Jean Lemierre as directors for a 3-year term to expire at the end of the Shareholders’ Meeting held to approve the 2018 financial statements.
Ms. Van der Hoeven, former Executive Director of the International Energy Agency (IEA), will, in particular, bring to the Board her knowledge and her expertise in the energy sector.
Mr. Lemierre, Chairman of the Board of Directors of BNP Paribas, will bring to the Board his knowledge and his expertise in the financial sector at an
international level.
The Board considered that Ms. Van der Hoeven and Mr. Lemierre could be deemed as being independent, after having assessed
their independence based on the independence criteria set forth in the AFEP-MEDEF Code. Concerning “significant relationships” as a customer, supplier, investment banker or finance
banker, between a director whose appointment is proposed and the Company, the Board deemed that the level of activity between Group companies and BNP Paribas at which Mr. Lemierre is the Chairman of the Board, which is less than 0.1% of its net
banking income
(3)
and less than 5% of the Group’s overall assets, represents neither a significant portion of the overall activity of such bank nor a material portion of
the Group’s external financing.
|
–
|
Proposals to appoint the director representing employee shareholders
|
In addition, the term of office of Mr. Keller, the director representing employee shareholders, is due to expire at the end of the Annual Shareholders’ Meeting on May 24, 2016. Pursuant to the
provisions of Article 11 of the bylaws of TOTAL S.A., which specify the procedure for nominating candidates for the position of director representing employees of the Group who are shareholders of TOTAL S.A., a process to elect candidates for this
position was launched at the end of 2015. At the end of this process, three applications for the position of director representing employee shareholders were submitted to the shareholders for voting:
|
•
|
|
Mr. Charles Keller, nominated by the Supervisory Board of the TOTAL ACTIONNARIAT FRANCE collective investment fund, which, as of December 31, 2015,
held 84.4 million shares of the Company, and by the Supervisory Board of the TOTAL FRANCE CAPITAL + collective investment fund, which, as of December 31, 2015 held 4.8 million shares of the Company.
|
The biography of Mr. Keller is presented above.
|
•
|
|
Ms. Renata Perycz, nominated by the Supervisory Board of the TOTAL ACTIONNARIAT INTERNATIONAL CAPITALISATION collective investment fund, which, as of
December 31, 2015, held 23.7 million Company shares, and by the Supervisory Board of the TOTAL INTERNATIONAL CAPITAL collective investment fund, which, as of December 31, 2015 held 2.0 million shares of the Company.
|
Ms. Perycz, born on November 5, 1963 (Polish), is a graduate of the University of Warsaw, the Ecole des
Hautes Etudes Commerciales (HEC) and the SGH Warsaw School of Economics. Ms. Perycz entered the Group in 1993 as a logistics and sales manager for Total Polska. In 2000, she became a supplies and logistics manager before becoming head of the
subsidiary’s purchasing department in 2003. In 2007, she became Total Polska’s Human Resources and Purchasing director. Since 2013, Ms. Perycz has been the subsidiary’s Human Resources and Internal Communications director. She
has also been an elected member, representing unit-holders, of Supervisory Board of FCPE TOTAL ACTIONNARIAT INTERNATIONAL CAPITALISATION since 2012.
|
•
|
|
Mr. Werner Guyot, elected, after the counting of votes, by the employee shareholders having the right to vote on an individual basis (who, as of
December 31, 2015, together held 2.3 million shares of the Company).
|
Mr. Guyot, born on
September 10, 1955 (German nationality), holds a master’s degree in business administration (MBA). Mr. Guyot entered the Group in 1989 as Head of the Department Controlling, Budgeting, Back Office for the
|
(1
)
|
According to Article L. 225-27-1 of the French Commercial Code, directors representing employees are not taken into consideration for the application of these
provisions.
|
|
(2)
|
Excluding the director representing employees, in accordance with the recommendations of the AFEP-MEDEF Code (point 6.4).
|
|
(3)
|
2015 net banking income estimated based on BNP Paribas accounts as of
September 30, 2015.
|
|
|
|
|
|
92
|
|
TOTAL S.A. Form 20-F 2015
|
Item 6 - A. Directors and Senior Management
network in Düsseldorf. In 1994, he became Head of the Mülheim blending plant
(lubricants). From 1996 to 2000, he was Head of Controlling and Strategy Department of Total Deutschland, then in 2000, he became Head of Controlling, Business Support, Pricing for the network. From 2004 to 2006, he was in charge of implementing the
Template Europe project for Germany. In 2006, he joined Centralized Purchasing of Total Deutschland, then Finance in 2010 as Head of Management Information.
The candidate receiving the largest number of votes (and at least a majority of the votes) cast by the shareholders present and represented at the Annual Shareholders’ Meeting on May 24, 2016 will be
appointed as the director representing employee shareholders and will sit on the Board of Directors for the 3-year term set out in the bylaws.
After reviewing the applications, based on the proposal of the Governance and Ethics Committee, the Board of
Directors, at its meeting on March 15, 2016, decided to approve the resolution proposing the appointment of Ms. Renata Perycz, nominated by the Supervisory Boards of the TOTAL ACTIONNARIAT INTERNATIONAL CAPITALISATION and TOTAL
INTERNATIONAL CAPITAL collective investment funds, to promote the international representation within the Board, due to the presence of a director representing the French employees, pursuant to the law of June 14, 2013.
Following the Shareholders’ Meeting of May 24, 2016, if the proposed resolutions were approved, the Board of Directors would have 12
members (as before). The number of women on the Board would be six (
i.e.
, 54.54%
(1)
).
|
2.1.
|
The Executive Committee
|
The Executive Committee, under the responsibility of the Chairman and Chief Executive Officer, is the decision-making
body of the Group.
It implements the strategy formulated by the Board of Directors and authorizes related investments, subject to the approval of the
Board of Directors for investments exceeding 3% of the Group’s equity or notification of the Board for investments exceeding 1% of equity.
In 2015,
the Executive Committee met at least twice a month, except in August when it met once.
As of December 31, 2015, the members of TOTAL’s
Executive Committee were as follows:
|
•
|
|
Patrick Pouyanné, Chairman and Chief Executive Officer and President of the Executive Committee;
|
|
•
|
|
Philippe Boisseau, President, Marketing & Services and President New Energies;
|
|
•
|
|
Arnaud Breuillac, President, Exploration & Production;
|
|
•
|
|
Jean-Jacques Guilbaud, Chief Administrative Officer;
|
|
•
|
|
Patrick de La Chevardière, Chief Financial Officer; and
|
|
•
|
|
Philippe Sauquet, President, Refining & Chemicals.
|
|
2.2.
|
The Group Performance Management Committee
|
The mission of
the Group Performance Management Committee is to examine, analyze and monitor the safety, financial and operational results of the Group. It meets once a month.
In addition to the members of the Executive Committee, this Committee, chaired by the Chairman and Chief Executive
Officer, is made up of the head of the Group’s main business units, as well as a limited number of Senior Vice Presidents of functions at the Group and business segment levels:
|
•
|
|
for central corporate functions, the Senior Vice Presidents in charge of Corporate Communication, Human Resources, Legal, Safety and Strategy;
|
|
•
|
|
for Exploration & Production, the Senior Vice Presidents in charge of the Africa, Americas, Asia-Pacific, Europe and Central Asia, Middle East/North
Africa and Exploration business units, and any of the functional divisions designated by the Executive Committee;
|
|
•
|
|
for Gas, the President, Gas;
|
|
•
|
|
for Refining & Chemicals, the Senior Vice Presidents in charge of the Refining & Base Chemicals Europe, Refining & Petrochemicals
Orient, Refining & Petrochemicals Americas and Hutchinson business units, and any of the functional divisions designated by the Executive Committee;
|
|
•
|
|
for Trading & Shipping, the Senior Vice President, Trading & Shipping;
|
|
•
|
|
for Marketing & Services, the Senior Vice Presidents of the Europe, Africa-Middle East and Global Operations and Businesses business units, and any of
the functional divisions designated by the Executive Committee; and
|
|
•
|
|
for New Energies, the President, New Energies.
|
B. COMPENSATION
|
1.
|
Employees’ compensation
|
The Group’s human resources policy formalized at the end of 2014 applies to all companies in which TOTAL S.A.
holds the majority of voting rights. In terms of compensation, the aim of this policy is to ensure external competitiveness and internal fairness, reinforce the link to individual performance, increase employee share ownership and fulfill the
Group’s CSR commitments.
A large majority of employees benefit from laws that guarantee a minimum wage, and, whenever this is not the case, the
Group’s policy ensures that compensation is above the minimum wage observed locally. Regular benchmarking is used to assess compensation based on the external market and the entity’s
competitive environment. Each entity’s positioning relative to its reference market is approved by the human resources department of each business segment, which monitors evolutions in
payroll, turnover and consistency with the market.
Fair treatment is ensured within the Group through the widespread implementation of a job level
evaluation using a common method (the Hay method), which associates a salary range to each job level. Performance of the Group’s employees (attainment of set targets, skills assessment, overall evaluation of job performance) is evaluated during
an annual individual review and formalized in accordance with principles common to the entire Group.
|
(1)
|
Excluding the director representing employees, in accordance with the recommendations of the AFEP-MEDEF Code (point 6.4).
|
|
|
|
|
|
2015 Form 20-F TOTAL S.A.
|
|
93
|
Item 6 - B. Compensation
The compensation structure of the Group’s employees is based on the following components, depending on the
country:
|
•
|
|
A base salary
, which each year, in addition to a general salary-raise campaign, is subject to a merit-based salary-raise campaign intended to compensate
employees’ individual performance according to the targets set during the annual individual review, including at least one HSE (Health, Safety, Environment) target;
|
|
•
|
|
Individual variable compensation
, starting at a certain level of responsibility, which is intended to compensate individual performance (quantitative and
qualitative attainment of previously set targets) and the employee’s contribution to collective performance evaluated among others according to HSE targets set for each business segment, which represent up to 10% of the variable portion. In
2015, 87.3% of the Group’s entities (WHRS scope) included HSE criteria in the variable compensation.
|
Complementary collective variable compensation programs
are implemented in some countries, such as France via incentives and
profit-sharing that also incorporates HSE criteria. According to the agreement signed for 2015-2017 applicable to the oil and petrochemicals
(1)
(nearly 19,000 employees)
sector in France, the amount available for employee incentive is determined based on financial parameters (the Group’s return on equity and the evolution of the net adjusted income in comparison) and the attainment of safety targets (injury
rate and accidental deaths).
The Group also offers
employee benefit and pension programs
(health, death and pension) based on a single standard
of coverage at the Group level. These programs, which supplement those that may be provided by local regulations, allow each employee to: benefit, in case of illness, from coverage that is at least equal to the median amount for the national
industrial market; save or accumulate income substitution benefits for retirement; and arrange for the protection of family members in case of the employee’s death via insurance that provides for the payment of a benefit recommended to equal
two years’ gross salary. This program was made available to 91% of the workforce in 2015 (WHRS scope). These programs are reviewed on a regular basis and adjusted when necessary.
Employee shareholding
, one of the pillars of the Group’s policy, is extended via three main mechanisms: the grant of performance shares, share capital increases reserved for employees, and employee
savings. In this way, TOTAL wishes to encourage
employee shareholding, strengthen their sense of belonging to the Group and give them a stake in the Group’s performance by allowing them to benefit from their involvement.
Each year since 2005, TOTAL has granted performance shares to many of its employees (approximately 10,000). The definitive granting of these shares depends on the
fulfillment of performance conditions assessed at the end of a vesting period extended to three years in 2013 (refer to “— 5. Stock option and free share grants policy”, below). The last performance share plan approved by the Board of
Directors of TOTAL S.A. in July 2015 ensured a significant replenishment rate: 39% of plan beneficiaries had not received performance shares the previous year. More than 10,000 non-senior executive employees were concerned by this plan, namely 97%
of the beneficiaries.
The Group also regularly invites its employees to subscribe to capital increases reserved for employees. The
latest capital increase was completed in 2015. Like the previous operation in 2013, it included a classic offering and a leveraged offering. For the first time, this operation included a matching contribution for the first five shares subscribed
aimed at encouraging subscribers with modest saving capacity. Approximately 42,000 employees in 102 countries decided to participate in this capital increase, which resulted in the subscription of 10,108,918 shares at a price of
€
37.50. This operation was completed, based on the offering chosen and the employees’ location, via the Shareholder Group Savings Plan
(PEG-A), created in 1999 for this purpose, either through Company Savings Plans
(2)
or by subscribing directly for shares or for American Depositary Shares (ADSs).
Finally,
employee savings
are also developed via the “TOTAL Group Savings Plan” (PEGT) and the “Complementary Company Savings Plan”
(PEC), both open to employees of the Group’s French companies that have subscribed to the plans under the agreements signed in 2002 and 2004 and their amendments. These plans allow investments in a number of mutual funds, including the TOTAL
ACTIONNARIAT FRANCE fund that is mostly invested in TOTAL shares. Employees can make discretionary contributions to these funds, which the Group’s companies may supplement under certain conditions (
abondement
). The Group’s companies
made gross supplementary contributions (
abondement
) that totaled
€
68 million in 2015. A Collective Retirement Savings Plan
(PERCO) set up under the 2004 Group agreement on provisions for retirement savings is open to employees of the Group’s French companies covered by the French Collective Bargaining Agreement for the Petroleum Industry.
|
2.
|
Board members’ compensation
|
The conditions applicable to Board members’ compensation are defined by the Board of Directors on the proposal
of the Compensation Committee, subject to the overall maximum amount of directors’ fees authorized by the Shareholders’ Meeting of May 17, 2013 and set at
€
1.4 million per fiscal year.
In 2015, the overall amount of directors’ fees due to the members of
the Board of Directors was
€
1.21 million, noting that there were 12 directors as of December 31, 2015.
The directors’ fees for fiscal year 2015 are allocated according to a formula comprised of fixed compensation and variable
compensation based on fixed amounts per meeting, which makes it possible to take into account each director’s actual attendance at the meetings of the Board of Directors and its Committees,
subject to the conditions below:
|
•
|
|
a fixed annual amount of
€
20,000 is to be paid to
each director (calculated on a
pro rata
basis in case of a change during the year), apart from the Chairperson of the Audit Committee, who is to be paid
€
30,000 and the other Audit Committee members, who are to be paid
€
25,000;
|
|
•
|
|
an amount of
€
5,000 per director for each
Board of Directors’ meeting actually attended;
|
|
(1)
|
It includes the following Upstream, Refining & Chemicals and
Marketing & Services companies in France: TOTAL S.A., Elf Exploration Production, Total Exploration Production France, CDF Énergie, Total Marketing Services, Total Marketing France, Total Additifs et Carburants Spéciaux, Total
Lubrifiants, Total Fluides, Total Raffinage-Chimie, Total Petrochemicals France, Total Raffinage France and Total Global Services.
|
|
(2
)
|
TOTAL ACTIONNARIAT FRANCE, TOTAL FRANCE CAPITAL+, TOTAL ACTIONNARIAT INTERNATIONAL CAPITALISATION, TOTAL INTERNATIONAL CAPITAL.
|
|
|
|
|
|
94
|
|
TOTAL S.A. Form 20-F 2015
|
Item 6 - B. Compensation
|
•
|
|
an amount of
€
3,500 per director for each
Governance and Ethics Committee, Compensation Committee or Strategic Committee meeting actually attended;
|
|
•
|
|
an amount of
€
7,000 per director for each
Audit Committee meeting actually attended;
|
|
•
|
|
a premium of
€
2,000 for travel from a country
outside France to attend a Board of Directors’ or Committee meeting;
|
|
•
|
|
the Chief Executive Officer, or the Chairman and Chief Executive Officer if the positions are unified, does not receive directors’ fees for his work on the
Board and Committees of TOTAL S.A.; and
|
|
•
|
|
the total amount paid to each director is determined after taking into consideration the director’s actual presence at each Board of Directors’ or
Committee meeting and, if appropriate, after prorating the amount set for each director, such that the overall amount paid remains within the maximum limit set by the Shareholders’ Meeting.
|
Directors’ fees for a fiscal year are paid on the decision of the Board of Directors, following a proposal of the Governance and Ethics Committee, at the
beginning of the next fiscal year.
The director representing employee shareholders and the director representing employees receive directors’ fees
according to the same terms and conditions as any other director.
At its meeting of December 16, 2015, the Board of Directors maintained the rules
for allocating directors’ fees for fiscal year 2016; after deciding, however, to increase the annual fixed portion for the Chairperson of the Governance and Ethics Committee and the Chairperson of the Compensation Committee to
€
25,000 and set the additional annual fixed portion for the Lead Independent Director at
€
15,000.
The table
below presents the total compensation (including in-kind benefits) due and paid to each director and non-executive director (
mandataires sociaux
) during the previous two fiscal years (Article L. 225-102-1 of the French Commercial Code, 1
st
and 2
nd
paragraphs).
Messrs. Marc Blanc and Charles Keller participate in the internal defined contribution pension plan applicable to all
TOTAL S.A. employees, known as RECOSUP (
Régime collectif et obligatoire de retraite supplémentaire à cotisations définies
), covered by Article L. 242-1 of the French Social Security Code. The Company’s commitment
is limited to its share of the payment to the insurance company that manages the plan. For fiscal year 2015, this pension plan represented a booked expense to TOTAL S.A. in favor of Messrs. Marc Blanc and Charles Keller of
€
761 and
€
920, respectively.
Mr. Marc Blanc, who joined the Elf Aquitaine Group in 1980, also participates in a supplementary defined benefit pension plan, known as CREA, set up and
financed by the Company. This plan covers former employees of the Elf Aquitaine Group and was closed on December 31, 1994. It does not require a presence condition within the Group at the time of retirement. Commitments made by the Group in favor of
Mr. Marc Blanc under this plan represent, at December 31, 2015, a gross annual pension, payable to his spouse within a limit of 60% in case of death of the beneficiary, estimated at
€
4,848. The Group’s commitments under the CREA plan are outsourced to an insurance company for almost their entire amount, the remaining balance being evaluated on an annual basis and adjusted through a
provision in the accounts. The amount of these commitments of the Group at December 31, 2015 in favor of Mr. Marc Blanc is
€
129.4 thousand. This amount represents the gross value of the Group’s commitments to this beneficiary based on the gross annual
pension estimated as of December 31, 2015, as well as a statistical life expectancy of the beneficiary and his spouse.
Over the past two years, the directors currently in office have not received any compensation or in-kind benefits from companies controlled by TOTAL S.A.
Moreover, there is no service contract linking a director to TOTAL S.A. or any of its controlled companies that provide for benefits under such contract.
|
|
|
|
|
2015 Form 20-F TOTAL S.A.
|
|
95
|
Item 6 - B. Compensation
|
–
|
Table of directors’ fees and other compensation due and paid to executive and non-executive directors (AMF Table No. 3)
|
|
|
|
|
|
|
|
|
|
|
|
|
|
|
|
|
|
|
|
|
|
For fiscal year 2015
|
|
|
For fiscal year 2014
|
|
|
Gross
amount (
€
)
|
|
Amounts due
|
|
|
Amounts paid
|
|
|
Amounts due
|
|
|
Amounts paid
|
|
|
Patrick Pouyanné
(a)
|
|
|
|
|
|
|
|
|
|
|
|
|
|
|
|
|
|
Directors’ fees
|
|
|
none
|
|
|
|
none
|
|
|
|
n/a
|
|
|
|
n/a
|
|
|
Other compensation
|
|
|
(a
|
)
|
|
|
(a
|
)
|
|
|
(a
|
)
|
|
|
(a
|
)
|
|
Thierry Desmarest
(b)
|
|
|
|
|
|
|
|
|
|
|
|
|
|
|
|
|
|
Directors’ fees
|
|
|
82,500
|
|
|
|
101,500
|
|
|
|
101,500
|
|
|
|
89,500
|
|
|
Other compensation
|
|
|
none
|
|
|
|
none
|
|
|
|
none
|
|
|
|
none
|
|
|
Patrick Artus
|
|
|
|
|
|
|
|
|
|
|
|
|
|
|
|
|
|
Directors’ fees
|
|
|
88,000
|
|
|
|
101,500
|
|
|
|
101,500
|
|
|
|
79,500
|
|
|
Other compensation
|
|
|
none
|
|
|
|
none
|
|
|
|
none
|
|
|
|
none
|
|
|
Patricia Barbizet
(c)
|
|
|
|
|
|
|
|
|
|
|
|
|
|
|
|
|
|
Directors’ fees
|
|
|
130,644
|
|
|
|
136,000
|
|
|
|
136,000
|
|
|
|
134,500
|
|
|
Other compensation
|
|
|
none
|
|
|
|
none
|
|
|
|
none
|
|
|
|
none
|
|
|
Marc Blanc
(d)
|
|
|
|
|
|
|
|
|
|
|
|
|
|
|
|
|
|
Directors’ fees
(e)
|
|
|
72,000
|
|
|
|
8,178
|
|
|
|
8,178
|
|
|
|
—
|
|
|
Other compensation
|
|
|
75,104
|
|
|
|
75,104
|
|
|
|
72,940
|
|
|
|
72,940
|
|
|
Gunnar Brock
|
|
|
|
|
|
|
|
|
|
|
|
|
|
|
|
|
|
Directors’ fees
|
|
|
107,500
|
|
|
|
115,000
|
|
|
|
115,000
|
|
|
|
102,500
|
|
|
Other compensation
|
|
|
none
|
|
|
|
none
|
|
|
|
none
|
|
|
|
none
|
|
|
Marie-Christine Coisne-Roquette
(f)
|
|
|
|
|
|
|
|
|
|
|
|
|
|
|
|
|
|
Directors’ fees
|
|
|
122,679
|
|
|
|
126,000
|
|
|
|
126,000
|
|
|
|
129,500
|
|
|
Other compensation
|
|
|
none
|
|
|
|
none
|
|
|
|
none
|
|
|
|
none
|
|
|
Bertrand Collomb
(g)
|
|
|
|
|
|
|
|
|
|
|
|
|
|
|
|
|
|
Directors’ fees
|
|
|
28,109
|
|
|
|
81,000
|
|
|
|
81,000
|
|
|
|
67,500
|
|
|
Other compensation
|
|
|
none
|
|
|
|
none
|
|
|
|
none
|
|
|
|
none
|
|
|
Paul Desmarais, Jr
|
|
|
|
|
|
|
|
|
|
|
|
|
|
|
|
|
|
Directors’ fees
|
|
|
61,000
|
|
|
|
56,000
|
|
|
|
56,000
|
|
|
|
47,000
|
|
|
Other compensation
|
|
|
none
|
|
|
|
none
|
|
|
|
none
|
|
|
|
none
|
|
|
Anne-Marie Idrac
|
|
|
|
|
|
|
|
|
|
|
|
|
|
|
|
|
|
Directors’ fees
|
|
|
79,000
|
|
|
|
77,000
|
|
|
|
77,000
|
|
|
|
75,500
|
|
|
Other compensation
|
|
|
none
|
|
|
|
none
|
|
|
|
none
|
|
|
|
none
|
|
|
Charles Keller
(h)
|
|
|
|
|
|
|
|
|
|
|
|
|
|
|
|
|
|
Directors’ fees
(e)
|
|
|
126,000
|
|
|
|
93,083
|
|
|
|
93,083
|
|
|
|
36,000
|
|
|
Other compensation
|
|
|
91,947
|
|
|
|
91,947
|
|
|
|
74,244
|
|
|
|
74,244
|
|
|
Barbara Kux
|
|
|
|
|
|
|
|
|
|
|
|
|
|
|
|
|
|
Directors’ fees
|
|
|
102,500
|
|
|
|
104,000
|
|
|
|
104,000
|
|
|
|
79,000
|
|
|
Other compensation
|
|
|
none
|
|
|
|
none
|
|
|
|
none
|
|
|
|
none
|
|
|
Gérard Lamarche
|
|
|
|
|
|
|
|
|
|
|
|
|
|
|
|
|
|
Directors’ fees
|
|
|
147,000
|
|
|
|
156,000
|
|
|
|
156,000
|
|
|
|
143,500
|
|
|
Other compensation
|
|
|
none
|
|
|
|
none
|
|
|
|
none
|
|
|
|
none
|
|
|
Anne Lauvergeon
(g)
|
|
|
|
|
|
|
|
|
|
|
|
|
|
|
|
|
|
Directors’ fees
|
|
|
31,609
|
|
|
|
68,500
|
|
|
|
68,500
|
|
|
|
65,500
|
|
|
Other compensation
|
|
|
none
|
|
|
|
none
|
|
|
|
none
|
|
|
|
none
|
|
|
Claude Mandil
(i)
|
|
|
|
|
|
|
|
|
|
|
|
|
|
|
|
|
|
Directors’ fees
|
|
|
none
|
|
|
|
42,951
|
|
|
|
42,951
|
|
|
|
93,000
|
|
|
Other compensation
|
|
|
none
|
|
|
|
none
|
|
|
|
none
|
|
|
|
none
|
|
|
Michel Pébereau
(g)
|
|
|
|
|
|
|
|
|
|
|
|
|
|
|
|
|
|
Directors’ fees
|
|
|
31,609
|
|
|
|
74,000
|
|
|
|
74,000
|
|
|
|
77,500
|
|
|
Other compensation
|
|
|
none
|
|
|
|
none
|
|
|
|
none
|
|
|
|
none
|
|
|
Total
|
|
|
1,377,111
|
|
|
|
1,507,673
|
|
|
|
1,487,896
|
|
|
|
1,367,184
|
|
|
(a)
|
Chairman and Chief Executive Officer since December 19, 2015. Chief Executive Officer between October 22, 2014 and December 18, 2015. For more
information concerning compensation, refer to the summary compensation tables presented in
“— 2.4. Summary tables”, belo
w.
|
|
(b)
|
Chairman of the Board between October 22, 2014 and December 18, 2015. Mr. Desmarest did not receive any specific compensation as Chairman of
the Board until December 18, 2015. In relation to the previous duties that he performed within the Group until May 21, 2010, he receives a retirement pension from the pension plans set up by the Company (internal defined contribution
pension plan, known as RECOSUP, and supplementary defined benefit pension plan).
|
|
(c)
|
Chairwoman of the Audit Committee until December 18, 2015. Lead Independent Director and Chairwoman of the Governance and Ethics Committee since
December 19, 2015.
|
|
(d)
|
Director representing employees since November 4, 2014.
|
|
(e)
|
Messrs. Blanc and Keller chose for the entire term of their directorship to grant all their directors’ fees to their trade union membership
organizations.
|
|
(f)
|
Chairwoman of the Audit Committee as of December 19, 2015.
|
|
(g)
|
Director until May 29, 2015.
|
|
(h)
|
Director representing employee shareholders since May 17, 2013.
|
|
(i)
|
Director until May 16, 2014.
|
|
|
|
|
|
96
|
|
TOTAL S.A. Form 20-F 2015
|
Item 6 - B. Compensation
|
3.
|
Executive directors’ compensation
|
|
3.1.
|
General principles for determining the compensation of the executive directors
|
The compensation policy for the executive directors is approved and reviewed every year by the Board of Directors on the proposal of the Compensation Committee. It is determined in accordance with the principles
and rules approved by the Board of Directors at its meeting on February 9, 2012, which have not since been amended and are set out below.
Based on
a proposal by the Compensation Committee, the Board adopted the following principles for determining the compensation and other benefits of the executive directors:
|
•
|
|
Compensation and benefits for the executive directors are set by the Board of Directors after considering proposals from the Compensation Committee. Such
compensation must be reasonable and fair, in a context that values both teamwork and motivation within the Company. Compensation for the executive directors is related to market practice, work performed, results obtained and responsibilities held.
|
|
•
|
|
Compensation for the executive directors includes both a fixed portion and a variable portion. The fixed portion is reviewed at least every two years.
|
|
•
|
|
The amount of variable compensation is reviewed each year and may not exceed a stated percentage of fixed compensation. Variable compensation is determined based
on pre-defined quantitative and qualitative criteria that are periodically reviewed by the Board of Directors. Quantitative criteria are limited in number, objective, measurable and adapted to the Company’s strategy.
|
|
•
|
|
Variable compensation is designed to reward short-term performance and progress towards medium-term objectives. The compensation is determined in line with the
annual assessment of the performance of the executive directors and the Company’s medium-term strategy.
|
The Board
of Directors monitors the evolution of the fixed and variable portions of the compensation of the executive directors over several years and in light of the Company’s performance.
|
•
|
|
The Group does not have a specific pension plan for the executive directors. They are eligible for retirement benefits and pensions plans available to certain
employee categories in the Group under conditions determined by the Board.
|
|
•
|
|
Stock options and performance shares are designed to align the long-term interests of the executive directors with those of the shareholders. The allocation of
options and performance shares to the executive directors is examined in light of all forms of compensation for each person. The exercise price for stock options awarded is not discounted compared with the market price, at the time of the grant, for
the underlying share.
|
Stock options and performance shares are awarded at regular intervals to prevent any
opportunistic behavior.
The exercise of options and the definitive allocation of performance shares to which the executive directors are
entitled are subject to performance criteria that must be met over several years.
The Board puts in place restrictions on the transfer
of a portion of shares held upon the exercise of options and the definitive allocation of performance shares, applicable to the executive directors until the end of their term of office.
The executive directors may not be granted stock options or performance shares when they leave office.
|
•
|
|
After three years in office, the executive directors are required to hold at least the number of Company shares set by the Board.
|
|
•
|
|
The components of the compensation of the executive directors are made public after the Board of Directors’ meeting at which they are approved.
|
The executive directors do not take part in any discussions or deliberations of the corporate bodies regarding items
on the agenda of Board of Directors’ meetings related to the assessment of their performance or the determination of the components comprising their compensation.
|
3.2.
|
Compensation of the Chairman and Chief Executive Officer
|
The compensation structure for Mr. Pouyanné
(1)
consists of a fixed compensation, an annual variable compensation calculated on
the basis of predefined criteria and a long-term component in the form of the allocation of performance shares.
Performance shares are allocated as part
of plans that are not specific to the Chairman and Chief Executive Officer and which are structured over a 5-year term with a 3-year vesting period followed by a mandatory 2-year holding period. The final grant of shares is subject to a presence
condition and performance conditions which are assessed following the 3-year vesting period.
Mr. Pouyanné does not receive any multi-year or deferred variable compensation or any extraordinary
compensation. He does not receive directors’ fees as director of the Group’s companies.
In addition, the Company is committed to paying
Mr. Pouyanné a retirement benefit and a termination payment in case of forced
departure owing to a change of control or strategy. The Chief
Executive Officer is also entitled to the pension plans in place within the Group. In line with the principles of the AFEP-MEDEF Code, the benefit accruing from participation in the pension plans has been taken into consideration when determining
the compensation policy applicable to the Chairman and Chief Executive Officer. These commitments, which are subject to performance conditions, are described in “— 3.2.3. Commitments made by the Company to the Chairman and Chief Executive
Officer”, below.
In addition, Mr. Pouyanné has the use of a company car and benefits from the life insurance plans and the health care
plan that are described in more detail in “— 3.2.3. Commitments made by the Company to the Chairman and Chief Executive Officer”, below.
|
(1)
|
Chairman and Chief Executive Officer since December 19, 2015. Chief Executive Officer between October 22, 2014 and December 18, 2015.
|
|
|
|
|
|
2015 Form 20-F TOTAL S.A.
|
|
97
|
Item 6 - B. Compensation
|
3.2.1.
|
Compensation due to the Chairman and Chief Executive Officer for fiscal year 2015
|
The structure of the compensation due to Mr. Pouyanné for fiscal year 2015 is as follows:

|
–
|
|
Fixed and variable compensation
|
In accordance with the compensation policy defined by the Board of Directors at its meeting of February 11, 2015, and confirmed at its meeting of December 16, 2015, the Board of Directors determined at
its meeting of February 10, 2016, on the proposals of the Compensation Committee, the compensation due to Mr. Pouyanné in respect of his activities as Chief Executive Officer for the period of January 1, 2015 to
December 18, 2015 and his activities as Chairman and Chief Executive Officer from December 19 to December 31, 2015.
This consists of a
base salary (fixed portion) of
€
1,200,000 and a variable portion (paid in 2016) of
€
1,814,400, corresponding to 151.2% of his fixed compensation and calculated as follows.
At its meeting on February 10, 2016, the Board of Directors examined the extent to which the different performance criteria had been achieved (economic
parameters, HSE/CSR parameter and the parameter relating to the reduction in operating costs), as well as the Chairman and Chief Executive Officer’s personal contribution assessed on the basis of the three objective and operational target
criteria concerning the Group’s business segments as pre-determined by the Board of Directors (successful managerial transition, achievement of production and reserve targets, and successful strategic negotiations with producing countries).
|
•
|
|
Concerning the economic parameters, the Board of Directors noted that the Group’s performance, in comparison with its main competitors (in terms of earnings
per share and adjusted net income), improved in 2015 compared to 2014, but the return on equity (ROE) declined compared to 2014, which led the Board of Directors to set the part allocated for the different economic parameters at 88.2% of the fixed
compensation for fiscal year 2015 (against a maximum of 100%).
|
|
•
|
|
In terms of the HSE/CSR criterion, the Board of Directors noted that the objectives had been mostly achieved, which led to the portion in respect to this
criterion being set at 14% of the fixed compensation (against a maximum of 16%).
|
|
•
|
|
Concerning the parameter relating to the reduction in operating costs, the Board of Directors noted that the objective measured in terms of impact on the
Group’s operating result had been fully achieved, which led to the
|
|
|
|
portion in respect to this criterion being set at 16% of the fixed compensation (against a maximum of 16%).
|
|
•
|
|
Concerning the personal contribution, the Board of Directors considered that the objectives that had been set were fully achieved, particularly the targets
relating to successful managerial transition, increase of hydrocarbon production, and successful strategic negotiations with producing countries. The Chairman and Chief Executive Officer’s personal contribution was therefore set at 33% of the
fixed compensation (against a maximum of 33%).
|
In the light of the level of achievement of the targets and the attained performance,
the Board of Directors has set the variable portion of Mr. Pouyanné’s compensation in respect of fiscal year 2015 at 151.2% of his fixed compensation.
Annual variable compensation due for fiscal year 2015 (expressed as a percentage of the base salary)
|
|
|
|
|
|
|
|
|
|
|
|
|
|
|
|
|
|
|
|
|
Maximum
percentage
|
|
|
Percentage
allocated
|
|
|
Economic parameters:
|
|
|
|
|
|
|
100%
|
|
|
|
|
|
|
|
88.2%
|
|
|
– ROE
|
|
|
34%
|
|
|
|
|
|
|
|
23.8%
|
|
|
|
|
|
|
– Net earnings per share — comparative
|
|
|
33%
|
|
|
|
|
|
|
|
31.4%
|
|
|
|
|
|
|
– Adjusted net income — comparative
|
|
|
33%
|
|
|
|
|
|
|
|
33%
|
|
|
|
|
|
|
HSE/CSR parameter
|
|
|
|
|
|
|
16%
|
|
|
|
|
|
|
|
14%
|
|
|
Reduction in operating costs
|
|
|
|
|
|
|
16%
|
|
|
|
|
|
|
|
16%
|
|
|
Personal contribution
|
|
|
|
|
|
|
33%
|
|
|
|
|
|
|
|
33%
|
|
|
Total
|
|
|
|
|
|
|
165%
|
|
|
|
|
|
|
|
151.2%
|
|
In addition, Mr. Pouyanné had the use in 2015 of a company car and benefited from the life insurance plans and the
health care plan described in detail in “— 3.2.3. Commitments made by the Company to the Chairman and Chief Executive Officer”, below. These benefits were booked in the amount of
€
36,390 in the Consolidated Financial Statements at December 31, 2015.
Mr. Pouyanné did not benefit from any other forms of compensation due or granted for fiscal year 2015. No multi-year or deferred variable compensation or any extraordinary compensation was awarded for
fiscal year 2015.
|
–
|
|
Grant of performance shares
|
At
its meeting of July 28, 2015, the Board of Directors, on the proposal of the Compensation Committee and pursuant to the authorization of the Company’s Combined Shareholders’ Meeting of May 16, 2014 (sixteenth resolution), decided
to grant Mr. Pouyanné, who was at that time Chief Executive Officer of TOTAL S.A., 48,000 existing shares of the Company (corresponding to 0.002% of the share capital) subject to the conditions set out below. These shares were awarded as
part of a broader share grant plan approved by the Board of Directors on July 28, 2015 relating to 0.20% of the share capital for more than 10,000 beneficiaries.
The definitive award of the totality of the shares is subject to the beneficiary’s continued presence within the Group during the vesting period and to performance conditions, according to which 40% of the
awarded shares are subject to the Group’s return on equity (ROE) and return on average capital employed (ROACE) during the fiscal years 2015, 2016 and 2017 (internal criteria) and 60% are dependent on a performance condition that is based on
adjusted net income (ANI) (external criterion).
|
|
|
|
|
98
|
|
TOTAL S.A. Form 20-F 2015
|
Item 6 - B. Compensation
The number of performance shares definitively awarded to Mr. Pouyanné will therefore depend, with regard
to 20% of the awarded performance shares, on the average ROE, and, with regard to a further 20%, on the average ROACE. The ROE and ROACE values adopted for the assessment of attainment of the performance conditions shall be those published by the
Group in the first quarter of 2016, the first quarter of 2017 and the first quarter of 2018, based on the Group’s balance sheet and consolidated statement of income for fiscal years 2015, 2016 and 2017.
In the case of the ROE criterion, the acquisition rate will be zero if the average ROE is less than 6.5%, will vary on a straight-line basis from 0% to 50% if the
average ROE is greater than or equal to 6.5% and less than or equal to 9.5%, will vary on a straight-line basis from 50% to 100% if the average ROE is greater than or equal to 9.5% and less than or equal to 14.5%, and will be equal to 100% if the
average ROE is greater than 14.5%.
In the case of the ROACE criterion, the acquisition rate will be zero if the average ROACE is less than 6.5%, will
vary on a straight-line basis from 0% to 50% if the average ROACE is greater than or equal to 6.5% and less than or equal to 9%, will vary on a straight-line basis from 50% to 100% if the average ROACE is greater than or equal to 9% and less than or
equal to 13%, and will be equal to 100% if the average ROACE is greater than 13%.
The number of performance shares definitively
awarded to Mr. Pouyanné will also depend, for 60% of the awarded performance shares, on a performance condition defined in relation to changes in the Group’s published 3-yearly average ANI compared to that of a set of four other
international oil companies
(1)
during the three years of acquisition (2015, 2016 and 2017).
In the case of the ANI criterion, by comparison, the acquisition rate will be zero if the relative difference in this change is less than -12%, will be equal to 60% if the relative difference in this change is zero
and will be equal to 100% if the relative difference in this change is greater than 12%, with intermediate values between these anchor points being calculated on a straight-line basis.
In accordance with the provisions of the French Commercial Code, Mr. Pouyanné will be required, until the end of his functions, to
retain in the form of registered shares 50% of the gains on the acquired shares net of tax and national insurance contributions on the awarded shares. When Mr. Pouyanné holds a volume of shares
(2)
representing five times the fixed portion of his gross annual compensation, this percentage will be equal to 10%. If this condition is no longer fulfilled, the 50% holding
requirement stated above will again apply. Given this holding requirement, the availability of the performance shares is not dependent on the purchase of further shares in the Company.
In addition, the Board of Directors has noted that, pursuant to the Board of Directors’ rules of procedure applicable to all directors, the Chairman and Chief Executive Officer may not hedge the shares of the
Company or any related financial instruments and has taken note of Mr. Pouyanné’s commitment to abstain from any such hedging operations with regard to the awarded performance shares.
Subject to the specific provisions set out above, the award of performance shares to Mr. Pouyanné is subject to the same provisions as those that apply
to the other beneficiaries of the performance share plan approved by the Board at its meeting of
July 28, 2015. In particular, these provisions require that the shares that are definitively awarded following the 3-year vesting period shall, following confirmation of fulfillment of the
presence and performance conditions, be automatically recorded as pure registered shares on the date of the start of the 2-year holding period and will remain non-transferable and unavailable through to the end of the holding period.
|
3.2.2.
|
Compensation policy for the Chairman and Chief Executive Officer for fiscal year 2016
|
The Board of Directors defined the compensation elements for the Chairman and Chief Executive Officer for fiscal year 2016 during its meeting on December 16,
2015, as follows:
In the light of his
appointment as Chairman and Chief Executive Officer, the Board of Directors set Mr. Pouyanné’s base salary (fixed compensation) at
€
1,400,000 with effect from January 1, 2016.
The positioning of the Chairman and Chief Executive
Officer’s fixed compensation was set in relation to the responsibilities held and taking account of the compensation practices for executive directors of comparable companies (in particular, CAC 40 companies and issuers operating in the energy
sectors).
|
–
|
|
Annual variable portion
|
The
Board of Directors also decided to fix the maximum amount of the variable portion potentially payable to the Chairman and Chief Executive Officer in respect of fiscal year 2016 at 180% of his base salary. This ceiling was fixed in the light of the
levels adopted by a reference sample including companies operating in the energy sectors.
The formula used to calculate the variable portion of the
Chairman and Chief Executive Officer’s compensation for fiscal year 2016 involves parameters that refer to quantitative targets that reflect the Group’s performance as well as the Chairman and Chief Executive Officer’s personal
contribution that permits a qualitative assessment of his management.
The Board of Directors has defined the respective weightings of the various
criteria used to calculate the variable portion of the Chairman and Chief Executive Officer’s compensation for fiscal year 2016 as follows:
Annual variable compensation for fiscal year 2016 (expressed as a percentage of the base salary)
|
|
|
|
|
|
|
|
|
|
|
|
|
Maximum
percentage
|
|
|
Safety – comparative
|
|
|
|
|
|
|
20
|
%
|
|
ROE
|
|
|
|
|
|
|
30
|
%
|
|
Net-debt-to-equity ratio
|
|
|
|
|
|
|
40
|
%
|
|
ANI – comparative
|
|
|
|
|
|
|
50
|
%
|
|
Personal contribution:
|
|
|
|
|
|
|
40
|
%
|
|
– successful managerial transition
|
|
|
10
|
%
|
|
|
|
|
|
– achievement of production and reserve targets
|
|
|
10
|
%
|
|
|
|
|
|
– successful strategic negotiations with producing countries
|
|
|
10
|
%
|
|
|
|
|
|
– Corporate Social Responsibility (CSR) performance
|
|
|
10
|
%
|
|
|
|
|
|
Total
|
|
|
|
|
|
|
180
|
%
|
|
(1)
|
ExxonMobil, Royal Dutch Shell, BP and Chevron.
|
|
(2)
|
In the form of shares or holdings in mutual funds invested in shares of the Company.
|
|
|
|
|
|
2015 Form 20-F TOTAL S.A.
|
|
99
|
Item 6 - B. Compensation
The chosen parameters include:
|
•
|
|
changes in safety-related values, to account for a maximum of 20%, assessed in particular through the achievement of an annual TRIR target (Total Recordable
Injury Rate) and the number of accidental deaths per million hours worked, FIR (Fatality Incident Rate). Safety performance is more specifically assessed by comparison with the corresponding performance of the four large competitor oil companies
(1)
.
|
|
•
|
|
return on equity (ROE) as published by the Group on the basis of its balance sheet and consolidated statement of income, to account for a maximum amount equal to
30% of the base salary.
|
|
•
|
|
net-debt-to-equity ratio as published by the Group on the basis of its balance sheet and consolidated statement of income, to account for a maximum amount equal
to 40% of the base salary.
|
|
•
|
|
the change in the adjusted net income (ANI), to account for a maximum amount equal to 50% of the base salary, determined on the basis of the financial statements
published by the Group (in accordance with the accounting standards applicable at the time of the closure of the accounts for the fiscal years in question) and compared with the ANI values of peers
(1)
drawn up on the basis of estimates calculated by a group of leading financial analysts.
|
The expected levels of attainment of the quantitative targets for determining the variable portion of the Chairman and Chief Executive Officer’s compensation have been clearly defined but have not been made
public for reasons of confidentiality.
The Chairman and Chief Executive Officer’s personal contribution, which may represent a maximum of 40% of
the base salary, is evaluated based on the following criteria:
|
•
|
|
successful managerial transition, accounting for a maximum of 10%;
|
|
•
|
|
achievement of production and reserve targets, accounting for a maximum of 10%;
|
|
•
|
|
successful strategic negotiations with producing countries, accounting for a maximum of 10%; and
|
|
•
|
|
CSR performance, accounting for a maximum of 10%, measured in particular in the light of the achievement of targets relating to CO
2
emissions, energy efficiency, and the Group’s position in the rankings published by non-financial rating agencies.
|
|
3.2.3.
|
Commitments made by the Company to the Chairman and Chief Executive Officer (Article L. 225-102-1, paragraph 3, of the French Commercial Code)
|
The commitments made to the Chairman and Chief Executive Officer with regard to pension plans, retirement benefits and the
termination payment to be paid in the event of a forced departure owing to a change of control or strategy, as well as the life insurance and health care plans set out below, were approved by the Board of Directors on December 16, 2015. They
will be presented to the Annual Shareholders’ Meeting of May 24, 2016 in accordance with the provisions of Article L. 225-42-1 of the French Commercial Code.
It should be noted that Mr. Pouyanné was already entitled to all these provisions when he was an employee of the Company, except for the commitment to be granted a termination payment in
case of forced departure owing to a change of control or strategy. It should also be noted that Mr. Pouyanné joined the Group on January 1, 1997, and terminated the employment
contract that previously bound him to TOTAL S.A. by resignation when he was appointed Chief Executive Officer on October 22, 2014.
Pursuant to law, the Chairman and Chief Executive Officer is eligible for the basic French social security pension and for pension benefits under the
government-sponsored supplementary pension plans ARRCO (
Association pour le régime de retraite complémentaire des salariés
) and AGIRC (
Association générale des institutions de retraite des cadres
).
He also participates in the internal defined contribution pension plan applicable to all TOTAL S.A. employees, known as RECOSUP (
Régime
collectif et obligatoire de retraite supplémentaire à cotisations définies
), covered by Article L. 242-1 of the French Social Security Code. The Company’s commitment is limited to its share of the payment to the
insurance company that manages the plan. For fiscal year 2015, this pension plan represented a booked expense to the Company in favor of the Chairman and Chief Executive Officer of
€
2,282.
The Chairman and Chief Executive Officer also participates in a supplementary defined benefit pension
plan, covered by Article L. 137-11 of the French Social Security Code, set up and financed by the Company, which was approved by the Board of Directors at its meeting on March 13, 2001, for which management is outsourced to two insurance
companies and which is effective as of January 1, 2012. This plan is applicable to all employees of TOTAL S.A. whose annual compensation is greater than eight times the ceiling for calculating French social security contributions (
Plafond
annuel de la sécurité sociale
, PASS), set at
€
38,616 for 2016, and above which there is no conventional pension plan.
To be eligible for this supplementary pension plan, participants must have a length of service of at least five years and must still be employed at the
time of their retirement. However, in the event of a beneficiary leaving the Company at the Company’s initiative as of the age of 55 or in the event of invalidity, then the beneficiary’s rights will be maintained provided that the 5-year
length of service condition is met. The length of service acquired by Mr. Pouyanné as a result of his previous salaried duties within the Group exercised as of January 1, 1997 has been maintained for the benefit of this plan. The
compensation taken into account to calculate the supplementary pension is the retiree’s last 3-year average gross compensation (fixed and variable portions). The amount paid under this plan is equal to 1.8% of the compensation falling between 8
and 40 times the PASS and 1% for the portion of the compensation falling between 40 and 60 times this ceiling, multiplied by the number of years of service up to a maximum of 20 years, subject to the performance condition set out below applicable to
the Chairman and Chief Executive Officer.
The sum of the annual supplementary pension plan benefits and other pension plan benefits (other than those
constituted individually and on a voluntary basis) may not exceed 45% of the average gross compensation (fixed and variable portions) for the last three years. In the event that this percentage is exceeded, the supplementary pension is reduced
accordingly. The amount of the supplementary pension determined in this way is indexed to the ARRCO pension point.
|
(1)
|
ExxonMobil, Royal Dutch Shell, BP and Chevron.
|
|
|
|
|
|
100
|
|
TOTAL S.A. Form 20-F 2015
|
Item 6 - B. Compensation
The supplementary pension includes a clause whereby up to 60% of the amount will be paid to beneficiaries in the
event of death after retirement.
To ensure that the acquisition of additional pension rights under this defined benefit pension plan is subject to
performance conditions to be defined pursuant to the provisions of Article L. 225-42-1 of the French Commercial Code amended by law No. 2015-990 of August 6, 2015, the Board of Directors noted the existence of the Chief Executive
Officer’s pension rights under the abovementioned pension plan immediately before his appointment as Chairman, from the period from January 1, 1997 to December 18, 2015.
The conditional rights awarded for the period from January 1, 1997 to December 18, 2015 (inclusive)
(1)
acquired free of performance conditions correspond to a substitution rate equal to 34.14%
(2)
in
respect of the portion of the reference compensation contained between 8 and 40 times the PASS , and a substitution rate of 18.96%
(3)
in respect of the portion of the
reference compensation contained between 40 and 60 times the PASS.
The conditional rights awarded for the period from
December 19, 2015 to December 31, 2016 that are subject to the performance condition described below correspond to a maximum substitution rate equal to 1.86%
(4)
in
respect of the portion of the reference compensation contained between 8 and 40 times the PASS , and a substitution rate of 1.04%
(5)
in respect of the portion of the
reference compensation contained between 40 and 60 times the PASS.
Pursuant to the provisions of Article L. 225-42-1 of the French Commercial Code, the
Board of Directors decided that the acquisition of these conditional rights for the period from December 19, 2015 to December 31, 2016 is to be subject to a performance-related condition applicable to the beneficiary, which shall
be considered to be fulfilled if the variable portion of the Chairman and Chief Executive Officer’s compensation paid in 2017 in respect of fiscal year 2016 reaches 100% of the base salary due in respect of fiscal year 2016. Should the variable
portion not reach 100% of the base salary, the awarded rights will be calculated on a
prorata
basis.
The commitments made by TOTAL S.A. in favor
of the Chairman and Chief Executive Officer with regard to the supplementary defined benefit and similar pension plans therefore represent, at December 31, 2015, a gross annual pension estimated at
€
560,862, based on the length of service acquired as of December 31, 2015,
i.e.
, 18.61% of Mr. Pouyanné’s gross
annual compensation, consisting of the annual fixed portion for 2015 (
i.e.
,
€
1,200,000) and the variable portion paid in 2016
in respect of fiscal year 2015 (
i.e.
,
€
1,814,000).
The commitments of TOTAL S.A. related to these supplementary defined benefit and similar plans (including the retirement benefit) are outsourced to insurance companies for almost their entire amount, the remaining
balance being evaluated on an annual basis and adjusted through a provision in the accounts. The Group’s commitments amount, as of December 31, 2015, to
€
14.1 million for the Chairman and Chief Executive Officer (
€
26.5 million for the Chairman
and Chief Executive Officer, non-executive directors and the concerned former non-executive directors). These amounts
represent the gross value of the commitments of TOTAL S.A. to these beneficiaries based on the gross annual pensions estimated as of December 31, 2015 as well as a statistical life
expectancy of the beneficiaries.
The sum of all the pension plans in which Mr. Pouyanné participates would, as of December 31, 2015,
represent a gross annual retirement pension estimated at
€
647,407, based on the length of service acquired as of December 31, 2015,
i.e.
, 21.48% of Mr. Pouyanné’s gross annual compensation defined above (fixed annual portion for 2015 and variable portion paid in 2016 in respect of fiscal year 2015).
In line with the principles used to determine the compensation of the executive directors as set out in the AFEP-MEDEF Code which the Company uses as a reference, the Board of Directors has taken account of the
advantage conferred through participation in the pension plans when determining the Chairman and Chief Executive Officer’s compensation.
The Chairman and Chief Executive Officer is entitled to a retirement benefit equal to those available to eligible members of the Group under the French National
Collective Bargaining Agreement for the Petroleum Industry. This benefit amounts to 25% of the annual compensation (both fixed and variable portions) of the 12-month period preceding retirement.
Pursuant to the provisions of Article L. 225-42-1 of the French Commercial Code, receipt of this retirement benefit is contingent upon a performance-related
condition applicable to the beneficiary, which is deemed to be fulfilled if at least two of the following criteria are met:
|
•
|
|
the average ROE (return on equity) over the three years preceding the year in which the Chairman and Chief Executive Officer retires is at least 10%;
|
|
•
|
|
the average debt-to-equity ratio for the three years preceding the year in which the Chairman and Chief Executive Officer retires is less than or equal to 30%;
and
|
|
•
|
|
growth in TOTAL’s oil and gas production is greater than or equal to the average of the rates of growth of four oil companies
(6)
during the three years preceding the year in which the Chairman and Chief Executive Officer retires.
|
The retirement benefit cannot be combined with the termination payment described below.
The Chairman
and Chief Executive Officer is entitled to a benefit equal to two years’ gross compensation in the event of a forced departure owing to a change of control or strategy. The calculation is based on the gross compensation (both fixed and variable
portions) for the 12-month period preceding the date of termination or non-renewal of his term of office.
The termination payment will only be paid in
the event of forced departure owing to a change of control or strategy. It will not be due in cases of gross negligence or willful misconduct or if the Chairman and Chief Executive Officer leaves the Company of his own volition, accepts new
responsibilities within the Group, or may claim full retirement benefits within a short time period.
|
(1)
|
The
period that elapsed from January 1, 1997 to December 18, 2015 (inclusive) is equal to 18 years and 352 days in 2015 (out of 365).
|
|
(2)
|
1.8%*(18+352/365) = 1.8%* (18+0.9643) = 34.14%.
|
|
(3
)
|
1%*(18+352/365) = 1%*(18+0.9643) = 18.96%.
|
|
(4
)
|
1.8%*(1+ 13/365) = 1.8%*(1+ 0.0356) = 1.86%.
|
|
(5
)
|
1%*(1+ 13/365) = 1%*(1+ 0.0356) = 1.04%.
|
|
(6
)
|
ExxonMobil, Royal Dutch Shell, BP and Chevron.
|
|
|
|
|
|
2015 Form 20-F TOTAL S.A.
|
|
101
|
Item 6 - B. Compensation
Pursuant to the provisions of Article L. 225-42-1 of the French Commercial Code, receipt of this termination benefit
is contingent upon a performance-related condition applicable to the beneficiary, which is considered to be fulfilled if at least two of the criteria set out below are met:
|
•
|
|
the average ROE (return on equity) over the three years preceding the year in which the Chairman and Chief Executive Officer retires is at least 10%;
|
|
•
|
|
the average debt-to-equity ratio for the three years preceding the year in which the Chairman and Chief Executive Officer retires is less than or equal to 30%;
and
|
|
•
|
|
growth in TOTAL’s oil and gas production is greater than or equal to the average of the rates of growth of four oil companies
(1)
during the three years preceding the year in which the Chairman and Chief Executive Officer retires.
|
|
–
|
|
Life insurance and health care plans
|
The Chairman and Chief Executive Officer is covered by the life insurance plans described below, which are taken out from various life insurance companies.
|
•
|
|
An “incapacity, disability, life insurance” plan applicable to all employees, partially at the expense of the Company, that provides for two options in
the event of the death of a married employee: either the payment of a sum equal to five times the annual compensation, subject to a maximum of 16 times the PASS (and therefore corresponding to a maximum of
€
3,089,280 in 2016). This amount is increased if there is a dependent child or children; alternatively, the beneficiary may
|
|
|
|
receive three times the annual compensation, subject to a maximum of 16 times the PASS, complemented by a spouse’s pension and education allowance.
|
|
•
|
|
A second “disability and life insurance” plan, entirely at the expense of the Company, applicable to senior executives whose annual gross compensation
is greater than 16 times the PASS. This contract, which was signed on October 17, 2002, guarantees beneficiaries the payment, in the event of death, of an amount corresponding to two years of compensation, which is increased to three years in
the event of accidental death. In the event of accidental permanent disability, the beneficiary receives a payment proportional to the degree of disability. The payment made in the event of death is increased by 15% for each dependent child.
|
Any payment due under the terms of this contract is paid following deduction of any amount paid under the above-mentioned plan
applicable to all employees.
The Chairman and Chief Executive Officer also benefits from a health care plan available to all employees.
|
2.3.
|
Compensation of the former Chairman of the Board
|
For fiscal
year 2015, Mr. Desmarest did not receive any compensation in his role as Chairman of the Board for the period from January 1 to December 18, 2015, other than his directors’ fees. In relation to the previous duties that he
performed within the Group until May 21, 2010, Mr. Desmarest receives a retirement pension from the pension plans set up by the Company.
|
2.4.
|
Summary tables (AFEP-MEDEF Code/AMF position-recommendations No. 2009-16)
|
|
–
|
Summary of compensation for each executive director (AMF Table No. 2)
|
|
|
|
|
|
|
|
|
|
|
|
|
|
|
|
|
|
|
|
|
|
For fiscal year 2014
|
|
|
For fiscal year 2015
|
|
|
(
€
)
|
|
Amount due for
the fiscal
year
|
|
|
Amount paid
during the
fiscal year
(a)
|
|
|
Amount due for
the fiscal
year
|
|
|
Amount paid
during the
fiscal year
(a)
|
|
|
Patrick Pouyanné
Chairman and Chief Executive Officer
since December 19, 2015
(b)
|
|
|
|
|
|
|
|
|
|
|
|
|
|
|
|
|
|
Fixed compensation
(c)
|
|
|
233,425
|
|
|
|
233,425
|
|
|
|
1,200,000
|
|
|
|
1,200,000
|
|
|
Annual variable compensation
(c)
|
|
|
295,469
|
|
|
|
—
|
|
|
|
1,814,000
|
|
|
|
295,469
|
|
|
Multi-year variable compensation
|
|
|
—
|
|
|
|
—
|
|
|
|
—
|
|
|
|
—
|
|
|
Extraordinary compensation
|
|
|
—
|
|
|
|
—
|
|
|
|
—
|
|
|
|
—
|
|
|
Directors’ fees
|
|
|
—
|
|
|
|
—
|
|
|
|
—
|
|
|
|
—
|
|
|
In-kind
benefits
(d)
|
|
|
23,551
|
|
|
|
23,551
|
|
|
|
36,390
|
|
|
|
36,390
|
|
|
Total
|
|
|
552,445
|
|
|
|
256,976
|
|
|
|
3,050,790
|
|
|
|
1,531,859
|
|
|
Thierry Desmarest
Chairman of the Board
until December 18, 2015
|
|
|
|
|
|
|
|
|
|
|
|
|
|
|
|
|
|
Fixed compensation
|
|
|
—
|
|
|
|
—
|
|
|
|
—
|
|
|
|
—
|
|
|
Annual variable compensation
|
|
|
—
|
|
|
|
—
|
|
|
|
—
|
|
|
|
—
|
|
|
Multi-year variable compensation
|
|
|
—
|
|
|
|
—
|
|
|
|
—
|
|
|
|
—
|
|
|
Extraordinary compensation
|
|
|
—
|
|
|
|
—
|
|
|
|
—
|
|
|
|
—
|
|
|
Directors’ fees
(e)
|
|
|
101,500
|
|
|
|
—
|
|
|
|
82,500
|
|
|
|
101,500
|
|
|
In-kind benefits
|
|
|
—
|
|
|
|
—
|
|
|
|
—
|
|
|
|
—
|
|
|
Total
|
|
|
101,500
|
|
|
|
—
|
|
|
|
82,500
|
|
|
|
101,500
|
|
|
(a)
|
Variable portion paid for the prior fiscal year.
|
|
(b)
|
Chief Executive Officer between October 22, 2014 and December 18, 2015.
|
|
(c)
|
For information purposes, it should be noted that before his appointment as Chief Executive Officer on October 22, 2014, Mr. Pouyanné was
paid a fixed compensation of
€
483,288 and a variable portion defined according to the pre-determined general rules
applicable to the Group’s executive officers and amounting to
€
473,806 in respect of his salaried duties as President
of Refining & Chemicals for the period from January 1, 2014 to October 21, 2014. For further details of the parameters used to calculate the variable portion due for fiscal year 2015, refer to “— 3.2.1. Compensation due
to the Chairman and Chief Executive Officer for fiscal year 2015”, above.
|
|
(d)
|
Mr. Pouyanné has the use of a company car and benefits from life insurance and health care plans at the expense of the Company (refer to
“— 3.2.3. Commitments made by the Company to the Chairman and Chief Executive Officer”, above).
|
|
(e)
|
For information purposes, it should be noted that before his appointment as Chairman of the Board of Directors on October 22, 2014, Mr. Desmarest
was paid
€
89,500 in Directors’ fees in 2014, in respect of fiscal year 2013 in his capacity as Director of the Company
(refer to AMF Table No. 3 above).
|
|
(1)
|
ExxonMobil, Royal Dutch Shell, BP and Chevron.
|
|
|
|
|
|
102
|
|
TOTAL S.A. Form 20-F 2015
|
Item 6 - B. Compensation
|
–
|
Summary of compensation, stock options and performance shares awarded to each executive director (AMF Table No. 1)
|
|
|
|
|
|
|
|
|
|
|
|
(in
€
, except for numbers of
shares)
|
|
For fiscal year 2014
|
|
|
For fiscal year 2015
|
|
|
Patrick Pouyanné
Chairman and Chief Executive Officer
since December 19, 2015
(a)
|
|
|
|
|
|
|
|
|
|
Compensation due in respect of the fiscal year (detailed in AMF Table No. 2 above)
|
|
|
552,445
|
|
|
|
3,050,790
|
|
|
Valuation of multi-year variable compensation awarded during the fiscal year
|
|
|
—
|
|
|
|
—
|
|
|
Accounting valuation of the stock options awarded during the fiscal year
|
|
|
—
|
|
|
|
—
|
|
|
Accounting valuation of performance shares awarded during the fiscal
year
(b)
|
|
|
1,116,500
|
(c)
|
|
|
1,722,960
|
|
|
Number of performance shares awarded during the fiscal year
|
|
|
25,000
|
(c)
|
|
|
48,000
|
|
|
Total
|
|
|
1,668,945
|
|
|
|
4,773,750
|
|
|
Thierry Desmarest
Chairman of the Board
until December 18, 2015
|
|
|
|
|
|
|
|
|
|
Compensation due in respect of the fiscal year (detailed in AMF Table No. 2 above)
|
|
|
101,500
|
|
|
|
82,500
|
|
|
Valuation of multi-year variable compensation awarded during the fiscal year
|
|
|
—
|
|
|
|
—
|
|
|
Accounting valuation of the stock options awarded during the fiscal year
|
|
|
—
|
|
|
|
—
|
|
|
Accounting valuation of performance shares awarded during the fiscal
year
(b)
|
|
|
—
|
|
|
|
—
|
|
|
Number of performance shares awarded during the fiscal year
|
|
|
—
|
|
|
|
—
|
|
|
Total
|
|
|
101,500
|
|
|
|
82,500
|
|
|
Note:
|
The valuation of the options and performance shares awarded corresponds to a valuation performed in accordance with IFRS 2 (see Notes 1E and 25 to the Consolidated Financial
Statements) and not to any compensation actually received during the fiscal year. Entitlement to performance shares is subject to fulfillment of performance conditions assessed over a 3-year period.
|
|
(a)
|
Chief Executive Officer between October 22, 2014 and December 18, 2015.
|
|
(b)
|
For detailed information, refer to AMF Table No. 6 below. The valuation of performance shares awarded was calculated on the day they were awarded (see
Note 1E to the Consolidated Financial Statements).
|
|
(c)
|
Performance shares were granted prior to Mr. Pouyanné’s appointment as Chief Executive Officer and related to his previous salaried duties.
|
|
–
|
Stock options awarded in 2015 to each executive director by the issuer and by any Group company (AMF Table No. 4)
|
|
|
|
|
|
|
|
|
|
|
|
|
|
|
|
|
|
|
|
|
|
|
|
|
|
|
|
Executive directors
|
|
Plan date
and No.
|
|
|
Nature of options
(purchase or
subscription)
|
|
|
Valuation
of
options
(
€
)
(a)
|
|
|
Number of options
awarded during
fiscal year
|
|
|
Exercise
price
|
|
|
Exercise
period
|
|
|
Patrick Pouyanné,
Chairman and Chief Executive Officer
since December 19, 2015
(b)
|
|
|
—
|
|
|
|
—
|
|
|
|
—
|
|
|
|
—
|
|
|
|
—
|
|
|
|
—
|
|
|
Thierry Desmarest,
Chairman of the Board until
December 18, 2015
|
|
|
—
|
|
|
|
—
|
|
|
|
—
|
|
|
|
—
|
|
|
|
—
|
|
|
|
—
|
|
|
(a)
|
According to the method used for the Consolidated Financial Statements.
|
|
(b)
|
Chief Executive Officer between October 22, 2014 and December 18, 2015.
|
|
|
|
|
|
2015 Form 20-F TOTAL S.A.
|
|
103
|
Item 6 - B. Compensation
|
–
|
Performance shares awarded in 2015 to each executive director by the issuer and by any Group company (Extract from AMF Table No. 6)
|
|
|
|
|
|
|
|
|
|
|
|
|
|
|
|
|
|
|
|
|
|
|
|
|
|
|
|
Plan date
and No.
|
|
|
Number of
shares
awarded
during fiscal
year
|
|
|
Valuation of
shares (
€
)
(a)
|
|
|
Acquisition
date
|
|
|
Date of
transferability
|
|
|
Performance
conditions
|
|
Patrick Pouyanné
Chairman and Chief Executive Officer since December 19, 2015
(b)
|
|
|
2015 Plan
07/28/2015
|
|
|
|
48,000
|
|
|
|
1,722,960
|
|
|
|
07/29/2018
|
|
|
|
07/29/2020
|
|
|
The conditions are based:
– for 20% of the awarded performance shares, on the average ROE,
– for 20% of the awarded performance
shares, on the average ROACE.
The ROE and ROACE values adopted for the assessment of attainment of the performance conditions shall be those published by
the Group in the 1
st
quarter of 2016, the 1
st
quarter of 2017 and the 1
st
quarter of 2018, based on the Group’s balance sheet and consolidated statement of income for the fiscal years 2015, 2016 and 2017.
– for 60% of the awarded performance shares, on the change in the Group’s published 3-yearly average adjusted net income (ANI) compared to that of a set
of four other international oil companies during the three years of acquisition (2015, 2016 and 2017).
|
|
Thierry Desmarest
Chairman of the Board until December 18, 2015
|
|
|
—
|
|
|
|
—
|
|
|
|
—
|
|
|
|
—
|
|
|
|
—
|
|
|
—
|
|
(a)
|
The valuation of performance shares was calculated on the day they were awarded, according to the method used for the Consolidated Financial Statements.
|
|
(b)
|
Chief Executive Officer between October 22, 2014 and December 18, 2015.
|
|
|
|
|
|
|
|
|
|
|
|
Executive directors
|
|
Employment
contract
|
|
Supplementary pension plan
|
|
Payments or benefits due or
likely to be due upon
termination or change in duties
|
|
Benefits
related to
a
non-compete
agreement
|
|
Patrick Pouyanné,
Chairman and Chief Executive Officer
Start of term of office: December 19, 2015
End of current term of office: Shareholders’ Meeting held in 2018 to approve the financial statements for fiscal year
2017
|
|
NO
|
|
YES
Supplementary internal defined benefit pension plan
(a)
and internal defined contribution
pension plan, known as RECOSUP
|
|
YES
(a)
Termination payment and retirement benefit
|
|
NO
|
|
Thierry Desmarest,
Chairman of the Board until December 18, 2015
Start of term of office: October 22,
2014
|
|
NO
|
|
(b)
|
|
NO
|
|
NO
|
|
(a)
|
Payment subject to a performance condition in accordance with the decision of the Board of Directors on December 16, 2015. Details of these commitments
are set out in “— 3.2.3. Commitments made by the Company to the Chairman and Chief Executive Officer”, above. The retirement benefit cannot be combined with the termination payment.
|
|
(b)
|
Note that in relation to the previous duties that he performed within the Group
until May 21, 2010, the Chairman of the Board is paid a retirement pension from the pension plans set up by the Company (internal defined contribution pension plan, known as RECOSUP, and supplementary defined benefit pension plan).
|
|
|
|
|
|
104
|
|
TOTAL S.A. Form 20-F 2015
|
Item 6 - B. Compensation
|
4.
|
Executive officers’ compensation
|
In 2015, the aggregate amount paid directly or indirectly by the French and foreign Group
companies as compensation to the executive officers of TOTAL
(1)
in office as of December 31, 2015 (12 individuals) was
€
11.34 million (compared to
€
10.44 million in 2014 with a comparable scope), including
€
7.56 million paid to the members of the Executive Committee (6 individuals). Variable compensation accounted for 40.97% of the aggregate amount of
€
11.34 million paid to the executive officers.
The following individuals were executive officers of the Group as of December 31, 2015 (12
individuals compared to 29 at year-end 2014): Patrick Pouyanné
(2)
; Philippe Boisseau
(3)
;
Arnaud Breuillac
(3)
; Jean-Jacques Guilbaud
(3)
; Patrick de La Chevardière
(3)
; Philippe Sauquet
(3)
; Jacques-Emmanuel Saulnier; François Viaud; Maarten Scholten; Bernadette
Spinoy; Helle Kristoffersen; and Humbert de Wendel.
|
5.
|
Stock option and free share grants policy
|
In addition to its policy to develop employee shareholding, TOTAL S.A. is pursuing a policy to associate employees
and senior executives with the Group’s future results. This policy consists of awarding free performance shares each year. TOTAL S.A. may also award stock options, but no plan has been put in place since September 14, 2011.
Stock options and performance share grants put in place by TOTAL S.A. concern only TOTAL shares. No options for or grants of performance shares of any of the
Group’s listed subsidiaries are awarded by TOTAL S.A.
All grants are approved by the Board of Directors, based on the proposal of the Compensation
Committee. For each plan, the Compensation Committee recommends a list of beneficiaries, the conditions and the number of options or shares awarded to each beneficiary. The Board of Directors then gives final approval for this list and the grant
conditions.
|
•
|
|
Grants of performance shares under selective plans only become definitive at the end of a vesting period that has been extended to three years for shares granted
as from July 25, 2013, subject to fulfillment of presence and performance conditions. At the end of this vesting period, and provided that the conditions set are met, the performance shares are definitively awarded to the beneficiaries, who
must then hold them for at least two years (holding period). For beneficiaries employed by non-French subsidiaries on the grant date, the vesting period for performance shares may be increased to four years; in such cases, there is no mandatory
holding period. As of 2011, all performance shares granted to senior executives are subject to performance conditions.
|
|
•
|
|
Stock options have a term of eight years, with an exercise price set at the average of the closing TOTAL share prices on Euronext Paris during the
20 trading days prior to the grant date, without any discount. The exercise of the options is subject to a presence condition and performance conditions, based on the return on equity (ROE) of the Group, which vary depending on the plan and
beneficiary category. Since 2011, all options granted are subject to performance conditions. For options to be awarded pursuant to the authorization given by the Extraordinary Shareholders’ Meeting of May 17, 2013 (eleventh resolution),
performance conditions will be assessed over a minimum period of three consecutive fiscal years. For
|
|
|
|
earlier option plans, and subject to the applicable presence and performance conditions being met, options may be exercised only at the end of an initial 2-year vesting period and the shares
resulting from the exercise may only be disposed of at the end of a second 2-year holding period. Moreover, for the 2007 to 2011 option plans, the shares resulting from the exercise of options by beneficiaries employed by non-French subsidiaries on
the grant date may be disposed of or converted to bearer form at the end of the first 2-year vesting period.
|
Performance share and
stock option grants to the executive directors (
dirigeants mandataires sociaux
) in office at the time of the decision are subject to a presence condition within the Group and to specific performance conditions set by the Board of Directors,
on the proposal of the Compensation Committee.
The award of performance shares or stock options is used to extend the Group-wide policy of developing
employee shareholding, based on individual performance assessments at the time of each plan.
|
5.2.
|
Follow up of the grants to executive directors
|
No stock options have
been awarded since September 14, 2011. Until this date, the Company’s executive directors in office at the time of the decision were awarded stock options as part of broader share grant plans approved by the Board of Directors for certain
Group employees and senior executives. Options granted to the executive directors were governed by the same provisions that apply to other beneficiaries of grant plans.
For options awarded between 2007 and 2011, the Board of Directors has made the exercise of options awarded to the executive directors contingent upon a presence condition and performance conditions based on the
Group’s ROE and ROACE. The acquisition rate of performance-related options under the 2009, 2010 and 2011 plans was 100%. It had been 60% for the 2008 plan.
All the options awarded to Mr. Pouyanné outstanding at December 31, 2015 represented 0.003% of the potential share capital of the Company
(4)
at that date. Mr. Desmarest holds no TOTAL stock options as of December 31, 2015.
|
(1)
|
The Group’s executive officers (non-executive directors with the exception of the Chairman and Chief Executive Officer) include the members of the
Executive Committee, the five Senior Vice Presidents of the Group central functions who are members of the Group Performance Management Committee (Corporate Communication, Human Resources, Legal, Industrial Safety, Strategy and Business
Intelligence) and the Treasurer.
|
|
(2)
|
Chairman and Chief Executive Officer and Chairman of the Executive Committee.
|
|
(3)
|
Member of the Executive Committee.
|
|
(4)
|
Based on a potential capital of 2,449,375,723.
|
|
|
|
|
|
2015 Form 20-F TOTAL S.A.
|
|
105
|
Item 6 - B. Compensation
|
–
|
Stock options exercised in fiscal year 2015 by each executive director
(AMF Table No. 5)
|
|
|
|
|
|
|
|
|
|
|
|
|
|
|
|
|
|
Plan date and No.
|
|
|
Number of options
exercised during
fiscal year
|
|
|
Exercise
price
(
€
)
|
|
|
Patrick Pouyanné
Chairman and Chief Executive Officer since December 19, 2015
(a)
|
|
|
2008 Plan-09/09/2008
|
|
|
|
29,333
|
|
|
|
42.90
|
|
|
Thierry Desmarest
Chairman of the Board until December 18, 2015
|
|
|
—
|
|
|
|
—
|
|
|
|
—
|
|
|
(a)
|
Chief Executive Officer between October 22, 2014 and December 18, 2015.
|
|
5.2.2.
|
Grant of performance shares
|
Mr. Pouyanné has been awarded performance shares as part of the broader share grant plans approved by the Board of Directors for certain Group
employees. Subject to specific performance conditions, performance shares granted to him are governed by the same provisions that apply to other beneficiaries of grant plans.
|
–
|
Free shares awarded to each executive and non-executive director in fiscal year 2015 by the issuer and by any Group company
(AMF Table No. 6)
|
|
|
|
|
|
|
|
|
|
|
|
|
|
|
|
|
|
|
|
|
|
|
|
|
|
|
|
Plan date
and No.
|
|
|
Number of
shares
awarded
during
fiscal year
|
|
|
Valuation
of shares
(
€
)
(a)
|
|
|
Acquisition
date
|
|
|
Date of
transferability
|
|
|
Performance
conditions
|
|
Patrick Pouyanné
Chairman and Chief Executive Officer since December 19, 2015
(b)
|
|
|
2015 Plan
07/28/2015
|
|
|
|
48,000
|
|
|
|
1,722,960
|
|
|
|
07/29/2018
|
|
|
|
07/29/2020
—
|
|
|
The conditions are based:
– for 20% of the awarded performance shares, on the average ROE;
– for 20% of the awarded performance
shares, on the average ROACE.
The ROE and ROACE values adopted for the assessment of attainment of the performance conditions shall be those published by
the Group in the 1
st
quarter of 2016, the 1
st
quarter of 2017 and the 1
st
quarter of 2018, based on the Group’s balance sheet and consolidated statement of income for the fiscal years 2015, 2016 and 2017.
– for 60% of the awarded performance shares, on the change in the Group’s published
3-yearly
average adjusted net
income (ANI) compared to that of a set of four other international oil companies during the three years of acquisition (2015, 2016 and 2017).
|
|
Thierry Desmarest
Chairman of the Board since December 18, 2015
|
|
|
—
|
|
|
|
none
|
|
|
|
—
|
|
|
|
—
|
|
|
|
—
|
|
|
—
|
|
Marc Blanc
Director representing employees since November 4, 2014
|
|
|
—
|
|
|
|
none
|
|
|
|
—
|
|
|
|
—
|
|
|
|
—
|
|
|
—
|
|
Charles Keller
Director representing employee shareholders since May 17, 2013
|
|
|
—
|
|
|
|
none
|
|
|
|
—
|
|
|
|
—
|
|
|
|
—
|
|
|
—
|
|
Total
|
|
|
|
|
|
|
48,000
|
|
|
|
1,722,960
|
|
|
|
|
|
|
|
|
|
|
|
|
(a)
|
The valuation of performance shares was calculated on the day they were awarded, according to the method used for the Consolidated Financial Statements.
|
|
(b)
|
Chief Executive Officer between October 22, 2014 and December 18, 2015.
|
|
|
|
|
|
106
|
|
TOTAL S.A. Form 20-F 2015
|
Item 6 - B. Compensation
|
–
|
Free shares that have become available for each executive and non-executive director (AMF Table No. 7)
|
|
|
|
|
|
|
|
|
|
|
|
|
|
|
|
|
|
Plan date and No.
|
|
|
Number of shares that
have become available
during the
fiscal year
|
|
|
Vesting conditions
|
|
|
Patrick Pouyanné
Chairman and Chief Executive Officer since December 19, 2015
(a)
|
|
|
—
|
|
|
|
—
|
|
|
|
—
|
|
|
Thierry Desmarest
Chairman of the Board until December 18, 2015
|
|
|
—
|
|
|
|
—
|
|
|
|
—
|
|
|
Marc Blanc
Director representing employees since November 4, 2014
|
|
|
—
|
|
|
|
—
|
|
|
|
—
|
|
|
Charles Keller
Director representing employee shareholders since May 17, 2013
|
|
|
—
|
|
|
|
—
|
|
|
|
—
|
|
|
(a)
|
Chief Executive Officer between October 22, 2014 and December 18, 2015.
|
No stock options
have been awarded since September 14, 2011.
|
5.3.2.
|
Performance share plan
|
The
performance conditions of performance share grant plans decided in 2013, 2014 and 2015 are described in Note 25 to the Consolidated Financial Statements.
For the 2011 and 2012 plans, pursuant to performance conditions, the acquisition rate was 100%.
|
5.4.
|
Follow up of TOTAL stock option plans as of December 31, 2015
|
|
5.4.1.
|
Breakdown of TOTAL stock option grants by category of beneficiary
|
The breakdown of TOTAL stock options awarded by category of beneficiary (executive officers, other senior executives and other employees) for each of the plans in effect during 2015 is as follows:
|
|
|
|
|
|
|
|
|
|
|
|
|
|
|
|
|
|
|
|
|
|
|
|
|
Number of
beneficiaries
|
|
|
Number
of notified
options
|
|
|
Percentage
|
|
|
Average
number of
options per
beneficiary
|
|
|
2007 Plan: Subscription options
|
|
Executive officers
(a)
|
|
|
27
|
|
|
|
1,329,360
|
|
|
|
22.8%
|
|
|
|
49,236
|
|
|
Decision of the Board of Directors
of
July 17, 2007
Exercise price:
€
60.10;
discount: 0.0%
|
|
Other senior executives
Other employees
Total
|
|
|
298
2,401
2,726
|
|
|
|
2,162,270
2,335,600
5,827,230
|
|
|
|
37.1%
40.1%
100%
|
|
|
|
7,256
973
2,138
|
|
|
|
|
|
|
|
|
|
2008 Plan
(b)
: Subscription options
|
|
Executive officers
(a)
|
|
|
26
|
|
|
|
1,227,500
|
|
|
|
27.6%
|
|
|
|
47,212
|
|
|
Awarded on October 9, 2008, pursuant to the decision of the Board of Directors of September 9, 2008 Exercise price:
€
42.90; discount: 0.0%
|
|
Other senior executives
Other employees
Total
|
|
|
298
1,690
2,014
|
|
|
|
1,988,420
1,233,890
4,449,810
|
|
|
|
44.7%
27.7%
100%
|
|
|
|
6,673
730
2,209
|
|
|
|
|
|
|
|
|
|
2009 Plan
(b)
: Subscription options
|
|
Executive officers
(a)
|
|
|
26
|
|
|
|
1,201,500
|
|
|
|
27.4%
|
|
|
|
46,212
|
|
|
Decision of the Board of Directors of September 15, 2009
Exercise price:
€
39.90; discount: 0.0%
|
|
Other senior executives
Other employees
Total
|
|
|
284
1,742
2,052
|
|
|
|
1,825,540
1,360,460
4,387,500
|
|
|
|
41.6%
31.0%
100%
|
|
|
|
6,428
781
2,138
|
|
|
|
|
|
|
|
|
|
2010 Plan
(b)
: Subscription options
|
|
Executive officers
(a)
|
|
|
25
|
|
|
|
1,348,100
|
|
|
|
28.2%
|
|
|
|
53,924
|
|
|
Decision of the Board of Directors of September 14, 2010
Exercise price:
€
38.20; discount: 0.0%
|
|
Other senior executives
Other employees
Total
|
|
|
282
1,790
2,097
|
|
|
|
2,047,600
1,392,720
4,788,420
|
|
|
|
42.8%
29.0%
100%
|
|
|
|
7,261
778
2,283
|
|
|
|
|
|
|
|
|
|
2011 Plan
(b)
: Subscription options
|
|
Executive officers
(a)
|
|
|
29
|
|
|
|
846,600
|
|
|
|
55.7%
|
|
|
|
29,193
|
|
|
Decision of the Board of Directors of September 14, 2011
Exercise price:
€
33.00; discount:
0.0%
|
|
Other senior executives
Other employees
Total
|
|
|
177
—
206
|
|
|
|
672,240
—
1,518,840
|
|
|
|
44.3%
—
100%
|
|
|
|
3,798
—
7,373
|
|
|
(a)
|
Members of the Management Committee and the Treasurer, as defined on the date of the Board meeting granting the performance shares.
|
|
(b)
|
The acquisition rate of performance condition-related shares was 60% for the 2008 plan and 100% for the 2009, 2010 and 2011 plans.
|
For the 2007, 2008 and 2009 share subscription option plans, the Board of Directors decided that for each beneficiary of more than
25,000 options, one-third of the options awarded in excess of that number should be subject to a performance condition.
For the 2010 share subscription
option plan, a portion of the options granted to beneficiaries of more than 3,000 options are subject to a performance condition. For the 2011 share subscription option plan, all of the options are subject to a performance condition.
Since September 14, 2011, the Board of Directors has decided not to award any stock options.
|
|
|
|
|
2015 Form 20-F TOTAL S.A.
|
|
107
|
Item 6 - B. Compensation
|
5.4.2.
|
Breakdown of TOTAL stock option grants by category of beneficiary
|
|
–
|
Past awards of subscription or purchase options — Information on the subscription or purchase options
(AMF Table
No. 8)
|
|
|
|
|
|
|
|
|
|
|
|
|
|
|
|
|
|
|
|
|
|
|
|
|
|
|
|
|
|
2007 Plan
|
|
|
2008 Plan
|
|
|
2009 Plan
|
|
|
2010 Plan
|
|
|
2011 Plan
|
|
|
Total
|
|
|
Type of
options
|
|
Subscription
options
|
|
|
Subscription
options
|
|
|
Subscription
options
|
|
|
Subscription
options
|
|
|
Subscription
options
|
|
|
|
|
|
Date of the Shareholders’ Meeting
|
|
|
05/11/2007
|
|
|
|
05/11/2007
|
|
|
|
05/11/2007
|
|
|
|
05/21/2010
|
|
|
|
05/21/2010
|
|
|
|
|
|
|
Date of Board meeting/grant
date
(a)
|
|
|
07/17/2007
|
|
|
|
10/09/2008
|
|
|
|
09/15/2009
|
|
|
|
09/14/2010
|
|
|
|
09/14/2011
|
|
|
|
|
|
|
Total number of options awarded by the Board of Directors, including:
|
|
|
5,937,230
|
|
|
|
4,449,810
|
|
|
|
4,387,620
|
|
|
|
4,788,420
|
|
|
|
1,518,840
|
|
|
|
21,081,920
|
|
|
Executive and non-executive directors
(b)
|
|
|
134,160
|
|
|
|
30,000
|
|
|
|
30,000
|
|
|
|
40,000
|
|
|
|
30,400
|
|
|
|
264,560
|
|
|
— T. Desmarest
|
|
|
110,000
|
|
|
|
—
|
|
|
|
—
|
|
|
|
—
|
|
|
|
—
|
|
|
|
110,000
|
|
|
— P. Pouyanné
|
|
|
24,160
|
|
|
|
30,000
|
|
|
|
30,000
|
|
|
|
40,000
|
|
|
|
30,400
|
|
|
|
154,560
|
|
|
— M. Blanc
|
|
|
n/a
|
|
|
|
n/a
|
|
|
|
n/a
|
|
|
|
n/a
|
|
|
|
n/a
|
|
|
|
—
|
|
|
— C. Keller
|
|
|
n/a
|
|
|
|
n/a
|
|
|
|
n/a
|
|
|
|
n/a
|
|
|
|
n/a
|
|
|
|
—
|
|
|
Date as of which the options may be exercised:
|
|
|
07/18/2009
|
|
|
|
10/10/2010
|
|
|
|
09/16/2011
|
|
|
|
09/15/2012
|
|
|
|
09/15/2013
|
|
|
|
|
|
|
Expiry date
|
|
|
07/17/2015
|
|
|
|
10/09/2016
|
|
|
|
09/15/2017
|
|
|
|
09/14/2018
|
|
|
|
09/14/2019
|
|
|
|
|
|
|
Exercise price (
€
)
(c)
|
|
|
60.10
|
|
|
|
42.90
|
|
|
|
39.90
|
|
|
|
38.20
|
|
|
|
33.00
|
|
|
|
|
|
|
Cumulative number of options exercised as of December 31, 2015
|
|
|
—
|
|
|
|
1,770,436
|
|
|
|
1,644,317
|
|
|
|
1,373,977
|
|
|
|
792,131
|
|
|
|
5,580,861
|
|
|
Cumulative number of options canceled as of December 31, 2015
|
|
|
5,937,230
|
|
|
|
117,872
|
|
|
|
32,520
|
|
|
|
91,197
|
|
|
|
4,400
|
|
|
|
6,183,219
|
|
|
Number of options:
|
|
|
|
|
|
|
|
|
|
|
|
|
|
|
|
|
|
|
|
|
|
|
|
|
|
— Outstanding as of January 1, 2015
|
|
|
5,847,965
|
|
|
|
3,215,884
|
|
|
|
3,011,269
|
|
|
|
3,701,218
|
|
|
|
1,141,094
|
|
|
|
16,635,411
|
|
|
— Awarded in 2015
|
|
|
—
|
|
|
|
—
|
|
|
|
—
|
|
|
|
—
|
|
|
|
—
|
|
|
|
—
|
|
|
— Canceled in 2015
(d)
|
|
|
5,847,965
|
|
|
|
—
|
|
|
|
—
|
|
|
|
—
|
|
|
|
—
|
|
|
|
5,847,965
|
|
|
— Exercised in 2015
|
|
|
—
|
|
|
|
654,382
|
|
|
|
300,486
|
|
|
|
377,972
|
|
|
|
136,766
|
|
|
|
1,469,606
|
|
|
Outstanding as of December 31, 2015
|
|
|
—
|
|
|
|
2,561,502
|
|
|
|
2,710,783
|
|
|
|
3,323,246
|
|
|
|
722,309
|
|
|
|
9,317,840
|
|
|
(a)
|
The grant date is the date of the Board meeting awarding the options, except for the share subscription option plan of October 9, 2008, approved by the
Board on September 9, 2008.
|
|
(b)
|
List of executive and non-executive directors who had this status during fiscal year 2015.
|
|
(c)
|
The exercise price is the average closing price of TOTAL’s share on Euronext Paris during the 20 trading days prior to the grant date, without any
discount.
|
|
(d)
|
The 5,847,965 options canceled in 2015 were unexercised options that expired on July 17, 2015 due to the expiration of the 2007 subscription option plan.
|
In the event of the exercise of all share subscription options outstanding as of December 31, 2015, the
corresponding shares would represent 0.38%
(1)
of the Company’s potential share capital on that date.
|
5.4.3.
|
Stock options awarded to the ten employees (other than executive or non-executive directors) receiving the largest number of options/Stock options exercised
by the ten employees (other than executive or non-executive directors) exercising the largest number of options (AMF Table No. 9)
|
|
|
|
|
|
|
|
|
|
|
|
|
|
|
|
|
|
|
|
|
|
|
|
|
|
|
|
|
|
Total number
of options
awarded/
exercised
|
|
|
Average
weighted
exercise
price
(
€
)
|
|
|
2008 Plan
10/09/2008
(a)
|
|
|
2009 Plan
09/15/2009
|
|
|
2010 Plan
09/14/2010
|
|
|
2011 Plan
09/14/2011
|
|
|
Options awarded in fiscal year 2015 by TOTAL S.A. and its affiliates
(b)
to the 10 TOTAL S.A. employees (other than executive or non-executive directors) receiving the largest number of options (aggregate —not individual
information)
|
|
|
—
|
|
|
|
—
|
|
|
|
—
|
|
|
|
—
|
|
|
|
—
|
|
|
|
—
|
|
|
Options held on TOTAL S.A. and its affiliates
(b)
, and exercised in fiscal year 2015 by the 10 TOTAL S.A. employees (other than executive or non-executive directors at the date of the exercises) with the largest number of
options purchased or subscribed (aggregate —not individual information)
|
|
|
439,984
|
|
|
|
39.63
|
|
|
|
161,434
|
|
|
|
109,100
|
|
|
|
108,700
|
|
|
|
60,750
|
|
|
(a)
|
The grant date is the date of the Board meeting awarding the options, except for the share subscription option plan of October 9, 2008, approved by the
Board on September 9, 2008.
|
|
(b)
|
Pursuant to the conditions of Article L. 225-180 of the French Commercial Code.
|
|
(1)
|
Based on a potential capital of 2,449,375,723.
|
|
|
|
|
|
108
|
|
TOTAL S.A. Form 20-F 2015
|
Item 6 - B. Compensation
|
5.5.
|
Follow up of TOTAL free share grants as of December 31, 2015
|
|
5.5.1.
|
Breakdown of TOTAL performance share grants by category of beneficiary
|
The following table gives a breakdown of TOTAL performance share grants by category of beneficiary (executive officers, other senior executives and other employees):
|
|
|
|
|
|
|
|
|
|
|
|
|
|
|
|
|
|
|
|
|
|
|
|
|
Number of
beneficiaries
|
|
|
Number
of notified
shares
|
|
|
Percentage
|
|
|
Average
number of
shares per
beneficiary
|
|
|
2011 Plan
(a)
|
|
Executive officers
(b)
|
|
|
29
|
|
|
|
184,900
|
|
|
|
5.1
|
%
|
|
|
6,376
|
|
|
Decision of the Board of Directors of September 14, 2011
|
|
Other senior executives
|
|
|
274
|
|
|
|
624,000
|
|
|
|
17.1
|
%
|
|
|
2,277
|
|
|
|
|
Other employees
|
|
|
9,658
|
|
|
|
2,840,870
|
|
|
|
77.8
|
%
|
|
|
294
|
|
|
|
|
Total
|
|
|
9,961
|
|
|
|
3,649,770
|
|
|
|
100
|
%
|
|
|
366
|
|
|
2012 Plan
(a)
|
|
Executive officers
(b)
|
|
|
33
|
|
|
|
416,100
|
|
|
|
9.7
|
%
|
|
|
12,609
|
|
|
Decision of the Board of Directors of July 26, 2012
|
|
Other senior executives
|
|
|
274
|
|
|
|
873,000
|
|
|
|
20.3
|
%
|
|
|
3,186
|
|
|
|
|
Other employees
|
|
|
9,698
|
|
|
|
3,006,830
|
|
|
|
70.0
|
%
|
|
|
310
|
|
|
|
|
Total
|
|
|
10,005
|
|
|
|
4,295,930
|
|
|
|
100
|
%
|
|
|
429
|
|
|
2013 Plan
|
|
Executive officers
(b)
|
|
|
32
|
|
|
|
422,600
|
|
|
|
9.5
|
%
|
|
|
13,206
|
|
|
Decision of the Board of Directors of July 25, 2013
|
|
Other senior executives
|
|
|
277
|
|
|
|
934,500
|
|
|
|
20.9
|
%
|
|
|
3,374
|
|
|
|
|
Other employees
(c)
|
|
|
9,625
|
|
|
|
3,107,100
|
|
|
|
69.6
|
%
|
|
|
323
|
|
|
|
|
Total
|
|
|
9,934
|
|
|
|
4,464,200
|
|
|
|
100
|
%
|
|
|
449
|
|
|
2014 Plan
|
|
Executive officers
(b)
|
|
|
32
|
|
|
|
421,200
|
|
|
|
9.4
|
%
|
|
|
13,163
|
|
|
Decision of the Board of Directors of July 29, 2014
|
|
Other senior executives
|
|
|
281
|
|
|
|
975,300
|
|
|
|
21.7
|
%
|
|
|
3,471
|
|
|
|
|
Other employees
(c)
|
|
|
9,624
|
|
|
|
3,089,800
|
|
|
|
68.9
|
%
|
|
|
321
|
|
|
|
|
Total
|
|
|
9,937
|
|
|
|
4,486,300
|
|
|
|
100
|
%
|
|
|
451
|
|
|
2015 Plan
|
|
Executive officers
(d)
|
|
|
13
|
|
|
|
264,600
|
|
|
|
5.6
|
%
|
|
|
20,354
|
|
|
Decision of the Board of Directors of July 28, 2015
|
|
Other senior executives
|
|
|
290
|
|
|
|
1,132,750
|
|
|
|
23.8
|
%
|
|
|
3,906
|
|
|
|
|
Other employees
(c)
|
|
|
10,012
|
|
|
|
3,364,585
|
|
|
|
70.6
|
%
|
|
|
336
|
|
|
|
|
Total
|
|
|
10,315
|
|
|
|
4,761,935
|
|
|
|
100
|
%
|
|
|
462
|
|
|
(a)
|
For the 2011 and 2012 plans, the share acquisition rate deriving from the ROE
performance condition was 100%.
|
|
(b)
|
Members of the Management Committee and the Treasurer such as defined on the date of the Board meeting granting the performance shares.
|
|
(c)
|
Mr. Keller, who is an employee of TOTAL S.A. and TOTAL S.A. director
representing employee shareholders as of May 17, 2013, was awarded 400 performance shares under the 2013 plan, 400 performance shares under the 2014 plan and was not awarded any share under the 2015 plan. Mr. Blanc, who is an employee of
TOTAL S.A. and TOTAL S.A. director representing employees as of November 4, 2014, was not awarded any shares under the 2014 and 2015 plan.
|
|
(d)
|
Group executive officers as defined on the date of the Board meeting granting the
performance shares. The Group’s executive officers include the members of the Executive Committee, the five Senior Vice Presidents of the Group functions (Corporate Communications, Human Resources, Legal, Safety and Strategy) and the Treasurer.
|
These performance shares, which were previously bought back by the Company on the market, are definitively awarded at the end of a
2-year
vesting period. In the case of shares awarded as of July 25, 2013, the vesting period has been extended to three years. The definitive grant of all performance shares is subject to a continued
employment condition and a performance condition (refer to Note 25 to the Consolidated Financial Statements). In addition, the disposal of shares that have been definitively awarded cannot occur until the end of a
2-year
mandatory holding period.
|
|
|
|
|
2015 Form 20-F TOTAL S.A.
|
|
109
|
Item 6 - B. Compensation
|
5.5.2.
|
Breakdown of TOTAL performance share plans
|
|
–
|
Past award of TOTAL performance shares – Information on granted performance shares (AMF Table No. 10)
|
|
|
|
|
|
|
|
|
|
|
|
|
|
|
|
|
|
|
|
|
|
|
|
|
|
2011 Plan
|
|
|
2012 Plan
|
|
|
2013 Plan
|
|
|
2014 Plan
|
|
|
2015 Plan
|
|
|
Date of the Shareholders’ Meeting
|
|
|
05/13/2011
|
|
|
|
05/13/2011
|
|
|
|
05/13/2011
|
|
|
|
05/16/2014
|
|
|
|
16/05/2014
|
|
|
Date of Board meeting/grant date
|
|
|
09/14/2011
|
|
|
|
07/26/2012
|
|
|
|
07/25/2013
|
|
|
|
07/29/2014
|
|
|
|
28/07/2015
|
|
|
Closing price on grant date
|
|
|
€
32.690
|
|
|
|
€
36.120
|
|
|
|
€
40.005
|
|
|
|
€
52.220
|
|
|
|
€
43.215
|
|
|
Average repurchase price per share paid by the Company
|
|
|
€
39.580
|
|
|
|
€
38.810
|
|
|
|
€
40.560
|
|
|
|
€
48.320
|
|
|
|
€
45.150
|
|
|
Total number of performance shares awarded, including to:
|
|
|
3,649,770
|
|
|
|
4,295,930
|
|
|
|
4,464,200
|
|
|
|
4,486,300
|
|
|
|
4,761,935
|
|
|
Executive and non-executive directors
(a)
|
|
|
7,000
|
|
|
|
22,500
|
|
|
|
22,900
|
|
|
|
25,400
|
|
|
|
48,000
|
|
|
– T. Desmarest
|
|
|
—
|
|
|
|
—
|
|
|
|
—
|
|
|
|
—
|
|
|
|
—
|
|
|
– P. Pouyanné
|
|
|
7,000
|
(b)
|
|
|
22,500
|
(b)
|
|
|
22,500
|
(b)
|
|
|
25,000
|
(b)
|
|
|
48,000
|
|
|
– M. Blanc
|
|
|
n/a
|
|
|
|
n/a
|
|
|
|
n/a
|
|
|
|
—
|
|
|
|
—
|
|
|
– C. Keller
|
|
|
n/a
|
|
|
|
n/a
|
|
|
|
400
|
|
|
|
400
|
|
|
|
—
|
|
|
Start of the vesting period
|
|
|
09/14/2011
|
|
|
|
07/26/2012
|
|
|
|
07/25/2013
|
|
|
|
07/29/2014
|
|
|
|
28/07/2015
|
|
|
Definitive grant date, subject to the conditions set out (end of the vesting period)
|
|
|
09/15/2013
|
|
|
|
07/27/2014
|
|
|
|
07/26/2016
|
|
|
|
07/30/2017
|
|
|
|
29/07/2018
|
|
|
Disposal possible from (end of the mandatory holding period)
|
|
|
09/15/2015
|
|
|
|
07/27/2016
|
|
|
|
07/26/2018
|
|
|
|
07/30/2019
|
|
|
|
29/07/2020
|
|
|
Number of performance shares:
|
|
|
|
|
|
|
|
|
|
|
|
|
|
|
|
|
|
|
|
|
|
– Outstanding as of January 1, 2015
|
|
|
—
|
|
|
|
—
|
|
|
|
4,434,460
|
|
|
|
4,475,030
|
|
|
|
—
|
|
|
– Notified in 2015
|
|
|
—
|
|
|
|
—
|
|
|
|
—
|
|
|
|
—
|
|
|
|
4,761,935
|
|
|
– Canceled in 2015
|
|
|
—
|
|
|
|
—
|
|
|
|
(28,230
|
)
|
|
|
(22,630
|
)
|
|
|
(1,430
|
)
|
|
– Definitively granted in 2015
(c)
|
|
|
—
|
|
|
|
—
|
|
|
|
(55,400
|
)
|
|
|
(49,940
|
)
|
|
|
—
|
|
|
Outstanding as of December 31, 2015
|
|
|
—
|
|
|
|
—
|
|
|
|
4,350,830
|
|
|
|
4,402,460
|
|
|
|
4,760,505
|
|
|
(a)
|
List of executive and non-executive directors who had this status during the fiscal year 2015.
|
|
(b)
|
Shares granted in respect of his previous salaried duties.
|
|
(c)
|
Definitive grants brought forward following the death of the beneficiaries of
shares of the respective plan.
|
In case of a definitive grant of all the performance shares outstanding at
December 31, 2015, these shares would represent 0.55%
(1)
of the potential share capital of the Company on that date.
|
5.5.3.
|
Performance share grants to the ten employees (other than executive and non-executive directors) receiving the largest number of performance shares
|
|
|
|
|
|
|
|
|
|
|
|
|
|
|
|
|
|
|
|
|
|
Number of
performance
shares
notified/definitively
awarded
|
|
|
Date of the award
|
|
|
Definitive grant
date (end of the
vesting period)
|
|
|
Availability
date (end
of holding
period)
|
|
|
Performance share grants approved by the Board of Directors at its meeting on July 28, 2015
to the ten TOTAL S.A. employees (other than executive and non-executive directors on the date of this decision) receiving the largest number of performance
shares
(a)
|
|
|
207,300
|
|
|
|
07/28/2015
|
|
|
|
07/29/2018
|
|
|
|
07/29/2020
|
|
|
Performance shares definitively awarded in fiscal year 2015 to the ten TOTAL S.A. employees (who
were not executive and non-executive directors at the time of this decision) receiving the largest number of performance shares
|
|
|
—
|
|
|
|
—
|
|
|
|
—
|
|
|
|
—
|
|
|
(a)
|
These shares will be definitively awarded at the end of a 3-year vesting period, i.e., on July 29, 2018, subject to a performance condition being met
(refer to “— 5.3.2. Performance share plan”, above). Moreover, the disposal of shares that have been definitively awarded cannot occur until the end of a 2-year holding period, i.e., from July 29, 2020.
|
|
(1)
|
Based on a potential capital of 2,449,375,723.
|
|
|
|
|
|
110
|
|
TOTAL S.A. Form 20-F 2015
|
Item 6 - C. Board Practices and Corporate Governance
C. BOARD PRACTICES AND CORPORATE GOVERNANCE
|
1.
|
Practices of the Board of Directors
|
|
1.1.
|
Governance structure
|
|
–
|
Combination of the management positions
|
At its
meeting on December 16, 2015, the Board of Directors decided to reunify the positions of Chairman and Chief Executive Officer of TOTAL S.A. as of December 19, 2015. Since that date, Mr. Pouyanné has therefore held the position
of Chairman and Chief Executive Officer of TOTAL S.A.
Following the death of TOTAL’s former Chairman and Chief Executive
Officer, Mr. de Margerie, the Board of Directors had decided, at its meeting on October 22, 2014, to separate the functions of Chairman and Chief Executive Officer in order to ensure the greatest possible continuity in the transition of
the General Management. The Board of Directors had therefore appointed Mr. Pouyanné as Chief Executive Officer for a term of office expiring at the end of the Annual Shareholders’ Meeting called in 2017
(1)
to approve the 2016 financial statements, and Mr. Desmarest as Chairman of the Board of Directors for a term of office expiring on December 18, 2015, in accordance
with the age limits set out in the bylaws. It was announced that, on that date, the functions of Chairman and Chief Executive Officer of TOTAL S.A. would be combined.
The decision to reunify the positions of Chairman of the Board of Directors and Chief Executive Officer was made further to work done by the Governance and Ethics Committee and in the best interests of the Company.
The Board of Directors had deemed that a unified management form was most appropriate to the Group’s organization,
modus operandi
and business, and to the specificities of the oil and gas sector. In its decision, the Board in particular
noted the advantage for the Group of having a unified management in strategic negotiations with governments and the Group’s partners.
The Board
also wanted the Group’s governance structure to ensure a balanced distribution of powers. To this end, at its meeting on December 16, 2015, the Board amended the provisions of its rules of procedure to provide for the appointment of a Lead
Independent Director in case of the combination of the positions of Chairman of the Board of Directors and Chief Executive Officer. The Lead Independent Director’s duties, resources and rights are described in the rules of procedure of the
Board of Directors.
The balance of powers within the Company’s bodies is also ensured by the composition of the Board of Directors and that of its
four Committees, particularly given the high proportion of members who are independent directors. It is further ensured by the directors’ full involvement in the work of the Board and the Committees, and by their diverse profiles, competencies
and expertise (refer to “— A.1.1. Composition of the Board of Directors”, above).
In addition, the Board’s rules of procedure state
that investments and divestments considered by the Group exceeding 3% of equity must be approved by the Board, which is also informed of any significant events related to the Company’s operations, particularly investments and divestments in
amounts exceeding 1% of equity.
Finally, the Company’s bylaws also offer the necessary guarantees to ensure compliance with best governance
practices under a unified management form. In particular, they stipulate that a Board meeting may be convened by any means, including verbally, and at short notice depending on the urgency, by the Chairman, a Vice Chairman, or by a third of its
members, at any time and as often as required to ensure the best interests of the Company. The rules of procedure of the Board of Directors also state that each director must notify the Board of Directors of any existing or potential conflict of
interest with the Company or any Group company and must refrain from participating in the vote related to the corresponding resolution as well as in any discussion preceding such vote.
|
–
|
Lead Independent Director
|
At its meeting on
December 16, 2015, the Board of Directors appointed Ms. Barbizet as Lead Independent Director as of December 19, 2015. Pursuant to the provisions of the rules of procedure of the Board of Directors, she therefore chairs the Governance
and Ethics Committee.
The duties of the Lead Independent Director are described in detail in the rules of procedure of the Board of Directors, the full
version of which is provided below.
|
1.2.
|
Working procedures of the Board of Directors
|
The working
procedures of the Board of Directors are set out in its rules of procedure, which set forth the mission of the Board of Directors and the rules related to the organization of its work. The Board’s rules of procedure also specify the obligations
of each director, as well as the role and powers of the Chairman and the Chief Executive Officer.
Mr. Charles Paris de Bollardière has
served as Secretary of the Board of Directors since September 15, 2009, the date on which the Board of Directors decided to appoint him to this position.
As of November 4, 2014, date of the appointment of the director representing employees on the Board of Directors, a member of the Central Works Council attends Board meetings in an advisory capacity, pursuant
to Article L. 2323-65 of the French Labor Code.
The rules of procedure of the Board of Directors are reviewed on a regular basis to adapt them to
changes in governance rules and practices. In 2014, changes were made to include, in particular, new provisions relating to information of the Board of Directors in the event of new directorships being assumed by the directors or changes being made
to existing directorships, together with a reminder of the obligations of
|
(1)
|
The Board of Directors of December 16, 2015 decided to prorogate the term of this office to the end of the 2018 Annual Shareholders’ Meeting, date
of expiry of the term of office of Mr. Pouyanné as Director.
|
|
|
|
|
|
2015 Form 20-F TOTAL S.A.
|
|
111
|
Item 6 - C. Board Practices and Corporate Governance
confidentiality inherent to the work of the Board. In December 2015, changes were made
to provide for the appointment of a Lead Independent Director in the event of the combination of the management positions and to define his or her duties.
The latest unabridged version of the rules of procedure of the Board of Directors, approved by the Board of Directors at its meeting on December 16, 2015, is
provided below. It is also available on the Company’s website under “Our Group/Governance”.
The Board of Directors of TOTAL S.A.
(1)
approved the following Rules of Procedure.
|
|
1.
|
ROLE OF THE BOARD OF DIRECTORS
|
|
The Board of Directors is a collegial body that determines the
strategic direction of the Company and supervises the implementation of this vision. With the exception of the powers and authority expressly reserved for shareholders and within the limits of the Company’s legal purpose, the Board may address
any issue related to the Company’s operation and make any decision concerning the matters falling within its purview. Within this framework, the Board’s duties and responsibilities include, but are not limited to, the following:
|
|
•
|
|
appointing the executive directors
(2)
and supervising the handling of their
responsibilities;
|
|
|
|
•
|
|
defining the Company’s strategic orientation and, more generally, that of the Group;
|
|
|
|
•
|
|
approving investments or divestments being considered by the Group that exceed 3% of shareholders’ equity;
|
|
|
|
•
|
|
reviewing information on significant events related to the Company’s operations, in particular for investments and divestments involving amounts exceeding
1% of shareholders’ equity;
|
|
|
|
•
|
|
conducting any audits and investigations it deems appropriate. In particular, the Board, with the assistance of the Audit Committee, ensures that:
|
|
|
|
•
|
|
authority has been properly defined and that the various corporate bodies of the Company make proper use of their powers and responsibilities,
|
|
|
•
|
|
no individual is authorized to commit to pay or to make payments, on behalf of the Company, without proper supervision and control,
|
|
|
|
•
|
|
the internal control function operates properly and the statutory auditors are able to perform their mission satisfactorily, and
|
|
|
|
•
|
|
the Committees it has created duly perform their responsibilities;
|
|
|
|
•
|
|
ensuring the quality of the information provided to shareholders and financial markets through the financial statements that it approves as well as the annual
reports, or when major transactions are conducted;
|
|
|
|
•
|
|
convening and setting the agenda for Shareholders’ Meetings or meetings of bond holders; and
|
|
|
|
•
|
|
preparing on an annual basis the list of directors it deems to be independent according to generally accepted corporate governance criteria.
|
|
|
|
•
|
|
appointing a Lead Independent Director under the conditions set out in article 7, when the Chairman of the Board of Directors is also the Chief Executive Officer
pursuant to a decision by the Board of Directors.
|
|
2. OBLIGATIONS OF THE DIRECTORS OF TOTAL S.A.
Before accepting a directorship, all candidates receive a copy of TOTAL S.A.’s bylaws and these rules of procedure. They must
ensure that they have broad knowledge of the general and particular obligations related to their duty, especially the laws and regulations governing directorships in French limited liability companies (
sociétés anonymes
) whose
shares are listed in one or several regulated markets. They must also ensure that they are familiar with the guidelines set out in the Corporate Governance Code to which the Company refers.
Accepting a directorship creates an obligation to comply with applicable regulations relating in particular to the functioning of
the Board of Directors, and with the ethical rules of professional conduct for directors as described in the Corporate Governance Code to which the Company refers. It also creates an obligation to comply with these rules of procedure and to uphold
the Group’s values as described in its Code of Conduct.
When directors participate in and vote at meetings of the
Board of Directors, they are required to represent all of the Company’s shareholders and to act in the interest of the Company as a whole.
|
|
2.1.
|
INDEPENDENCE OF JUDGMENT
|
|
Directors undertake to maintain, in all circumstances, the
independence of their analysis, judgment, decision-making and actions as well as not to be unduly influenced, directly or indirectly, by other directors, particular groups of shareholders, creditors, suppliers or, more generally, any third party.
|
|
2.2.
|
OTHER DIRECTORSHIPS OR FUNCTIONS
|
|
Directors must keep the Board of Directors informed
of any position they hold on the management team, board of directors or supervisory board of any other company, whether French or foreign, listed or unlisted. This includes any positions as a non-voting member (
censeur
) of a board. To this
end, directors expressly undertake to promptly notify the Chairman of the Board of Directors, and the Lead Independent Director if one has been appointed, of any changes to the positions held, for any reason, whether appointment, resignation,
termination or non-renewal.
|
(1
)
|
TOTAL S.A. is referred to in these rules of procedure as the “Company” and collectively with all its direct and indirect subsidiaries as the
“Group”.
|
|
(2
)
|
The term “executive director” refers to the Chairman and Chief Executive Officer, if the Chairman of the Board of Directors is also responsible for
the management of the Company; the Chairman of the Board of Directors and the Chief Executive Officer, if the two roles are carried out separately; and, where applicable, any Deputy Chief Executive Officers or Chief Operating Officers, depending on
the organizational structure adopted by the Board of Directors.
|
|
|
|
|
|
112
|
|
TOTAL S.A. Form 20-F 2015
|
Item 6 - C. Board Practices and Corporate Governance
|
|
2.3.
|
PARTICIPATION IN THE BOARD’S WORK
|
Directors undertake to devote the amount of time required to duly consider the information they are given and otherwise prepare for meetings of the Board of Directors and of the Committees of the Board of Directors
on which they sit. They may request from the executive directors any additional information they deem necessary or useful to their duties. If they consider it necessary, they may request training on the Company’s specificities, businesses and
industry sector, and any other training that may be of use to the effective exercise of their duties as directors.
Unless unable, in which case the Chairman of the Board shall be provided advance notice, directors are to attend all meetings of the
Board of Directors, meetings of Committees of the Board of Directors on which they serve and Shareholders’ Meetings.
The Chairman of the Board ensures that directors receive all relevant information concerning the Company, including that of a
negative nature, particularly analyst reports, press releases and the most important media articles.
Directors and any
other person who attends all or part of any meeting of the Board of Directors or its Committees are under the strict obligation not to disclose any details of the proceedings.
All documents reviewed at meetings of the Board of Directors, as well as information conveyed prior to or during the meetings, are
strictly confidential.
With respect to all non-public information acquired during the exercise of their functions,
directors are bound by professional secrecy not to divulge such information to employees of the Group or to outside parties. This obligation goes beyond the mere duty of discretion provided for by law.
Directors must not use confidential information obtained prior to or during meetings for their own personal benefit or for the
benefit of anyone else, for whatever reason. They must take all necessary steps to ensure that the information remains confidential. Confidentiality and privacy are lifted when such information is made publicly available by the Company.
Directors must not
take advantage of their office or duties to gain, for themselves or a third party, any monetary or non-monetary benefit.
They must notify the Chairman of the Board of Directors and the Lead Independent Director, if one has been appointed, of any
existing or potential conflict of interest with the Company or any Group company, and they must refrain from participating in the vote relating to the corresponding resolution as well as in any discussion preceding such vote.
Directors must inform the Board of Directors of their participation in any transaction that directly involves the Company, or any
Group company, before such transaction is finalized.
Directors must not assume personal responsibilities in companies or
businesses having activities in competition with those of the Company or any Group company without first having informed the Board of Directors.
Directors undertake not to seek or accept from the Company, or from companies directly or indirectly connected to the Company, any advantages liable to be considered as being of a nature that may compromise their
independence.
Directors
undertake to clearly express their opposition if they deem a decision being considered by the Board of Directors is contrary to the Company’s corporate interest and they must endeavor to convince the Board of Directors of the pertinence of
their position.
|
|
2.7.
|
TRANSACTIONS IN THE COMPANY’S SECURITIES AND STOCK EXCHANGE RULES
|
While in office, directors are required to hold the minimum number of registered shares of the Company as set by the bylaws.
Generally speaking, directors must act with the highest degree of prudence and vigilance when completing any personal transaction involving the financial instruments of the Company, its subsidiaries or affiliates
that are listed or that issue listed financial instruments.
To that end, directors must comply with the following
requirements:
|
|
1.
|
Any shares or ADRs of TOTAL S.A. or its listed subsidiaries are to be held in registered form, either with the Company or its agent, or as administered registered shares with a
French broker (or North American broker for ADRs), whose contact details are communicated by the director to the Secretary of the Board of Directors.
|
|
|
|
2.
|
Directors shall refrain from directly or indirectly engaging in (or recommending engagement in) transactions involving the financial instruments (shares, ADRs or any other
securities related to such financial instruments) of the Company or its listed subsidiaries, or any listed financial instruments for which the director has insider information.
|
|
Insider information is specific information that has not yet been made public and that
directly or indirectly concerns one or more issuers of financial instruments or one or more financial instruments and which, if it were made public, could have a significant impact on the price of the financial instruments concerned or on the price
of financial instruments related to them.
|
|
3.
|
Any transaction in the Company’s financial instruments (shares, ADRs or related financial instruments) is strictly prohibited during the thirty calendar days preceding the
publication by the Company of its periodic results (quarterly, half-year or annual) as well as on the day of any such announcement.
|
|
|
|
4.
|
Moreover, directors shall comply, where applicable, with the provisions of Article L. 255-197-1 of the French Commercial Code, which stipulates that free shares may not be sold:
|
|
|
|
•
|
|
during the ten trading days preceding and the three trading days following the date on which the Consolidated Financial Statements or, failing that, the annual
financial statements, are made public; and
|
|
|
|
•
|
|
during the period from the date on which the Company’s corporate bodies become aware of information that, if it were made public, could have a significant
impact on the Company’s share price, until ten trading days after such information is made public.
|
|
|
|
|
|
|
2015 Form 20-F TOTAL S.A.
|
|
113
|
Item 6 - C. Board Practices and Corporate Governance
|
|
5.
|
Directors are prohibited from carrying out transactions on any financial instruments related to the Company’s share (Paris option market (MONEP), warrants, exchangeable
bonds, etc.) and from buying on margin or short selling such financial instruments.
|
|
|
6.
|
Directors are also prohibited from hedging the shares of the Company and any financial instruments related to them, and in particular:
|
|
|
•
|
|
Company shares that they hold; and, where applicable;
|
|
|
•
|
|
Company share subscription or purchase options;
|
|
|
•
|
|
rights to Company shares that may be awarded free of charge; and
|
|
|
•
|
|
Company shares obtained from the exercise of options or granted free of charge.
|
|
|
7.
|
Directors must make all necessary arrangements to declare, pursuant to the form and timeframe provided by applicable law, to the French securities regulator (
Autorité
des marchés financiers
), as well as to the Secretary of the Board of Directors, any transaction involving the Company’s securities conducted by themselves or by any other person to whom they are closely related.
|
|
3. FUNCTIONING OF THE BOARD OF DIRECTORS
The Board of Directors meets at least four times a year and whenever
circumstances require.
Prior to each Board meeting, the directors receive the agenda and, whenever possible, all other
materials necessary to consider for the session.
Directors may be represented by another director at a meeting of the
Board, provided that no director holds more than one proxy at any single meeting.
Whenever authorized by law, directors
are considered present for quorum and majority purposes who attend Board meetings through video conferencing or other audiovisual means that are compliant with the technical requirements set by applicable regulations.
The Board of Directors allocates annual directors’ fees within
the total amount authorized by the Annual Shareholders’ Meeting. Compensation includes a fixed portion and a variable portion that takes into account each directors’ actual participation in the work of the Board of Directors and its
Committees together with, if applicable, the duties of the Lead Independent Director.
The Chief Executive Officer or, if
the functions are combined, the Chairman and Chief Executive Officer, does not receive any director’s fees for his participation in the work of the Board and its Committees.
|
|
3.3.
|
SECRETARY OF THE BOARD OF DIRECTORS
|
|
The Board of Directors, based on the recommendation of its Chairman,
appoints a Secretary of the Board who assists the Chairman in organizing the Board’s activities, and particularly in preparing the annual work program and the schedule of Board meetings.
The Secretary drafts the minutes of Board meetings, which are then submitted to the Board for approval. The Secretary is authorized
to dispatch Board meeting minutes and to certify copies and excerpts of the minutes.
The Secretary is responsible for
all procedures pertaining to the functioning of the Board of Directors. These procedures are reviewed periodically by the Board.
All Board members may ask the Secretary for information or assistance.
|
|
3.4.
|
EVALUATION OF THE FUNCTIONING OF THE BOARD
|
|
The Board evaluates its functioning at regular intervals not exceeding
three years. The evaluation is carried out under the supervision of the Lead Independent Director, if one has been appointed, or under the supervision of the Governance and Ethics Committee, with the assistance of an outside consultant. The Board of
Directors also conducts an annual review of its practices.
4. ROLE AND AUTHORITY OF THE CHAIRMAN
The Chairman represents the Board of Directors and, except under exceptional circumstances, has sole authority to act and speak on
behalf of the Board of Directors.
The Chairman organizes and oversees the work of the Board of Directors and ensures
that the Company’s corporate bodies operate effectively and in compliance with good governance principles. The Chairman coordinates the work of the Board of Directors and its Committees. The Chairman establishes the agenda for each Board
meeting, including items suggested by the Chief Executive Officer.
The Chairman ensures that directors receive, in a
timely manner and in a clear and appropriate format, the information they need to effectively carry out their duties.
In
liaison with the Group’s general management, the Chairman is responsible for maintaining relations between the Board of Directors and the Company’s shareholders. The Chairman monitors the quality of information disclosed by the Company.
In close cooperation with the Group’s general management, the Chairman may represent the Company in high-level
discussions with government authorities and major partners, both at a national and international level.
The Chairman is
regularly informed by the Chief Executive Officer of significant events and situations relating to the Group, particularly with regard to strategy, organization, monthly financial reporting, major investment and divestment projects and key financial
transactions. The Chairman may ask the Chief Executive Officer or other senior executives of the Company, provided that the Chief Executive Officer is informed, to supply any information that may help the Board or its Committees to carry out their
duties.
The Chairman may meet with the statutory auditors in order to prepare the work of the Board of Directors and the
Audit Committee.
|
|
|
|
|
114
|
|
TOTAL S.A. Form 20-F 2015
|
Item 6 - C. Board Practices and Corporate Governance
Every year, the Chairman presents a report to the Annual Shareholders’ Meeting describing the preparation and
organization of the Board of Directors’ work, any limits set by the Board of Directors concerning the powers of the Chief Executive Officer, and the internal control procedures implemented by the Company. To this end, the Chairman obtains the
necessary information from the Chief Executive Officer.
5. AUTHORITY OF THE CHIEF EXECUTIVE OFFICER
The Chief Executive Officer is responsible for the Company’s overall management. He represents the Company in its relationships
with third parties and chairs the Executive Committee. The Chief Executive Officer is vested with the broadest powers to act on behalf of the Company in all circumstances, subject to the powers that are, by law, restricted to the Board of Directors
and to the Annual Shareholders’ Meeting, as well as to the Company’s corporate governance rules and in particular these rules of procedure of the Board of Directors.
The Chief Executive Officer is responsible for presenting the Group’s results and prospects to shareholders and the financial community on a regular basis.
At each meeting of the Board of Directors, the Chief Executive Officer presents an overview of significant Group events.
6. BOARD COMMITTEES
The Board of Directors approved the creation of:
|
|
•
|
|
a Governance and Ethics Committee;
|
|
|
|
•
|
|
a Compensation Committee; and
|
|
The roles and composition of each Committee are set forth in their
respective rules of procedure, which have been approved by the Board of Directors.
The Committees perform their duties
under the authority and for the benefit of the Board of Directors.
Each Committee reports on its activities to the Board
of Directors.
7. LEAD INDEPENDENT DIRECTOR
|
|
7.1.
|
APPOINTMENT OF THE LEAD INDEPENDENT DIRECTOR
|
|
When the functions of the Chairman of the Board and Chief Executive
Officer are combined, the Board of Directors appoints a Lead Independent Director, on the recommendation of the Governance and Ethics Committee, among the directors considered to be independent by the Board of Directors.
The appointed Lead Independent Director holds this position while in office as director, unless otherwise decided by the Board of
Directors, which may choose to terminate his duties at any time. If for any reason the director is no longer deemed to be independent, his or her position as Lead Independent Director will be terminated.
The Lead Independent Director, if one is appointed, chairs the Governance and Ethics Committee.
|
|
7.2.
|
DUTIES OF THE LEAD INDEPENDENT DIRECTOR
|
|
The Lead Independent Director’s duties include:
|
|
1.
|
Convening meetings of the Board of Directors – Meeting Agenda
|
|
The Lead Independent Director may request that the Chairman and Chief
Executive Officer call a meeting of the Board of Directors to discuss a given agenda.
He may request that the Chairman
and Chief Executive Officer include additional items on the agenda of any meeting of the Board of Directors.
|
|
2.
|
Participation in the work of the Committees
|
|
If not a member of the Compensation Committee, the Lead Independent
Director is invited to attend meetings and participates in the work of the Compensation Committee relating to the annual review of the executive directors’ performance and recommendations regarding their compensation.
|
|
3.
|
Acting as Chairperson of Board of Directors’ meetings
|
|
When the Chairman and Chief Executive Officer is unable to attend all
or part of a meeting of the Board of Directors, the Lead Independent Director chairs the meeting. In particular, he or she chairs those Board meetings the proceedings of which relate to the evaluation of the performance of the executive directors
and the determination of their compensation, which take place in their absence.
|
|
4.
|
Evaluation of the functioning of the Board of Directors
|
|
The Lead Independent Director manages the evaluation process relating
to the functioning of the Board of Directors and reports on this evaluation to the Board of Directors.
|
|
5.
|
Prevention of conflicts of interest
|
|
Within the Governance and Ethics Committee, the Lead Independent
Director organizes the performance of due diligence in order to identify and analyze potential conflicts of interest within the Board of Directors. He informs the Chairman and Chief Executive Officer of any conflicts of interest identified as a
result and reports to the Board of Directors on these activities.
Pursuant to the obligation to
declare conflicts of interest set out in article 2.5 of these Rules, any director affected by an existing or potential conflict of interest must inform the Chairman and Chief Executive Officer and the Lead Independent Director.
|
|
|
|
|
2015 Form 20-F TOTAL S.A.
|
|
115
|
Item 6 - C. Board Practices and Corporate Governance
|
|
6.
|
Monitoring of the satisfactory functioning of the Board and compliance with the Rules of Procedure
|
The Lead Independent Director ensures compliance with the rules of the Corporate Governance Code to which TOTAL S.A. refers and with the Rules of
Procedure of the Board of Directors. He or she may make any suggestions or recommendations that he deems appropriate to this end.
He or
she ensures that the directors are in a position to carry out their tasks under optimal conditions and that they have sufficient information to perform their duties.
With the agreement of the Governance and Ethics Committee, the Lead Independent Director may hold meetings of the directors who do not hold executive or salaried positions on the Board of Directors. He reports to
the Board of Directors on the conclusions of such meetings.
|
|
7.
|
Relationships with Shareholders
|
The Chairman and
Chief Executive Officer and the Lead Independent Director are the shareholders’ dedicated contacts on issues that fall within the remit of the Board.
When a shareholder approaches the Chairman and Chief Executive Officer in relation to such issues, they may seek the opinion of the Lead Independent Director before responding appropriately to the
shareholder’s request.
When the Lead Independent Director is approached by a shareholder in relation to such issues, he or she must
inform the Chairman and Chief Executive Officer, providing his or her opinion, so that the Chairman and Chief Executive Officer may respond appropriately to the request. The Chairman and Chief Executive Officer must inform the Lead Independent
Director of the response given.
|
|
7.3
|
RESOURCES, CONDITIONS OF OFFICE AND ACTIVITY REPORT
|
|
The Chairman and Chief Executive Officer must regularly update the
Lead Independent Director on the Company’s activities.
The Lead Independent Director has access to all of the
documents and information necessary for the performance of his or her duties.
The Lead Independent Director may consult
the Secretary of the Board and use the latter’s services in the performance of his or her duties.
Under the
conditions set out in article 3.2 of these Rules and those established by the Board of Directors, the Lead Independent Director may receive additional director’s fees for the duties entrusted to him or her.
The Lead Independent Director must report annually to the Board of Directors on the performance of his or her
duties. During Annual General Meetings, the Chairman and Chief Executive Officer may invite the Lead Independent Director to report on his or her activities.
|
1.3.
|
Activity of the Board of Directors
|
Directors are generally
given written notice during the week prior to Board meetings. Whenever possible, documents to be considered for decisions to be made at Board meetings are sent with the notice of meetings. The minutes of the previous meeting are expressly approved
at each following Board meeting.
The Board of Directors held 9 meetings in 2015. The attendance rate for all the directors was 94.9%. The Audit
Committee held 7 meetings, with an attendance rate of 92.8%; the Compensation Committee met 3 times, with 100% attendance; the Governance and Ethics Committee held 3 meetings, with 93.3% attendance; and the Strategic Committee met twice, with
91.6% attendance.
|
|
|
|
|
116
|
|
TOTAL S.A. Form 20-F 2015
|
Item 6 - C. Board Practices and Corporate Governance
A table summarizing individual attendance at the Board of Directors and Committee
meetings is provided below.
|
–
|
Directors’ attendance at Board and Committee meetings in 2015
|
|
|
|
|
|
|
|
|
|
|
|
|
|
|
|
|
|
|
|
|
|
|
|
|
|
|
|
|
|
|
|
|
|
|
|
|
|
|
|
|
|
|
|
|
|
Board of Directors
|
|
|
Audit Committee
|
|
|
Compensation
Committee
|
|
|
Governance and
Ethics Committee
|
|
|
Strategic Committee
|
|
|
Directors
|
|
Attendance
rate
|
|
|
Number of
meetings
|
|
|
Attendance
rate
|
|
|
Number of
meetings
|
|
|
Attendance
rate
|
|
|
Number of
meetings
|
|
|
Attendance
rate
|
|
|
Number of
meetings
|
|
|
Attendance
rate
|
|
|
Number of
meetings
|
|
|
Patrick Pouyanné
(a)
|
|
|
100
|
%
|
|
|
4/4
|
|
|
|
—
|
|
|
|
—
|
|
|
|
—
|
|
|
|
—
|
|
|
|
—
|
|
|
|
—
|
|
|
|
100
|
%
|
|
|
2/2
|
|
|
Thierry Desmarest
|
|
|
100
|
%
|
|
|
9/9
|
|
|
|
—
|
|
|
|
—
|
|
|
|
—
|
|
|
|
—
|
|
|
|
100
|
%
|
|
|
3/3
|
|
|
|
100
|
%
|
|
|
2/2
|
|
|
Patrick Artus
|
|
|
89
|
%
|
|
|
8/9
|
|
|
|
—
|
|
|
|
—
|
|
|
|
100
|
%
|
|
|
3/3
|
|
|
|
100
|
%
|
|
|
3/3
|
|
|
|
100
|
%
(c)
|
|
|
2/2
|
(c)
|
|
Patricia Barbizet
|
|
|
100
|
%
|
|
|
9/9
|
|
|
|
100
|
%
|
|
|
7/7
|
|
|
|
—
|
|
|
|
—
|
|
|
|
—
|
|
|
|
—
|
|
|
|
100
|
%
|
|
|
2/2
|
|
|
Marc Blanc
|
|
|
100
|
%
|
|
|
9/9
|
|
|
|
—
|
|
|
|
—
|
|
|
|
—
|
|
|
|
—
|
|
|
|
—
|
|
|
|
—
|
|
|
|
100
|
%
(c)
|
|
|
2/2
|
(c)
|
|
Gunnar Brock
|
|
|
100
|
%
|
|
|
9/9
|
|
|
|
—
|
|
|
|
—
|
|
|
|
100
|
%
|
|
|
3/3
|
|
|
|
100
|
%
|
|
|
3/3
|
|
|
|
50
|
%
|
|
|
1/2
|
|
|
Marie-Christine Coisne-Roquette
|
|
|
100
|
%
|
|
|
9/9
|
|
|
|
85.7
|
%
|
|
|
6/7
|
|
|
|
100
|
%
|
|
|
3/3
|
|
|
|
—
|
|
|
|
—
|
|
|
|
—
|
|
|
|
—
|
|
|
Bertrand Collomb
(b)
|
|
|
80
|
%
|
|
|
4/5
|
|
|
|
—
|
|
|
|
—
|
|
|
|
—
|
|
|
|
—
|
|
|
|
0
|
%
|
|
|
0/1
|
|
|
|
—
|
|
|
|
—
|
|
|
Paul Desmarais, Jr
|
|
|
78
|
%
|
|
|
7/9
|
|
|
|
—
|
|
|
|
—
|
|
|
|
—
|
|
|
|
—
|
|
|
|
—
|
|
|
|
—
|
|
|
|
—
|
|
|
|
—
|
|
|
Anne-Marie Idrac
|
|
|
100
|
%
|
|
|
9/9
|
|
|
|
—
|
|
|
|
—
|
|
|
|
—
|
|
|
|
—
|
|
|
|
100
|
%
|
|
|
2/2
|
|
|
|
100
|
%
(c)
|
|
|
2/2
|
(c)
|
|
Charles Keller
|
|
|
100
|
%
|
|
|
9/9
|
|
|
|
100
|
%
|
|
|
7/7
|
|
|
|
—
|
|
|
|
—
|
|
|
|
—
|
|
|
|
—
|
|
|
|
100
|
%
(c)
|
|
|
2/2
|
(c)
|
|
Barbara Kux
|
|
|
100
|
%
|
|
|
9/9
|
|
|
|
—
|
|
|
|
—
|
|
|
|
—
|
|
|
|
—
|
|
|
|
100
|
%
|
|
|
3/3
|
|
|
|
100
|
%
|
|
|
2/2
|
|
|
Gérard Lamarche
|
|
|
100
|
%
|
|
|
9/9
|
|
|
|
85.7
|
%
|
|
|
6/7
|
|
|
|
—
|
|
|
|
—
|
|
|
|
—
|
|
|
|
—
|
|
|
|
100
|
%
|
|
|
2/2
|
|
|
Anne Lauvergeon
(b)
|
|
|
80
|
%
|
|
|
4/5
|
|
|
|
—
|
|
|
|
—
|
|
|
|
—
|
|
|
|
—
|
|
|
|
—
|
|
|
|
—
|
|
|
|
100
|
%
|
|
|
1/1
|
|
|
Michel
Pébereau
(b)
|
|
|
80
|
%
|
|
|
4/5
|
|
|
|
—
|
|
|
|
—
|
|
|
|
100
|
%
|
|
|
1/1
|
|
|
|
—
|
|
|
|
—
|
|
|
|
—
|
|
|
|
—
|
|
|
Attendance rate
|
|
|
94.9
|
%
|
|
|
|
|
|
|
92.8
|
%
|
|
|
|
|
|
|
100
|
%
|
|
|
|
|
|
|
93.3
|
%
|
|
|
|
|
|
|
91.6
|
%
|
|
|
|
|
|
(a)
|
Chairman and Chief Executive Officer since December 19, 2015. Director since May 29, 2015.
|
|
(b)
|
Director until May 29, 2015.
|
|
(c)
|
Voluntary participation (director not a member of the Strategic Committee).
|
The Board meetings included, but were not limited to, a review of the following subjects:
January 27
|
•
|
|
information and decisions regarding the new concession project in Abu Dhabi.
|
February 11
|
•
|
|
2014 accounts (Consolidated Financial Statements, parent company accounts) after the Audit Committee’s report and work performed by the statutory auditors;
|
|
•
|
|
main financial communications, including industrial safety aspects;
|
|
•
|
|
debate on the Board of Directors’ practices based on a summary presented by the Governance and Ethics Committee of the evaluation carried out in the form of
a detailed questionnaire to which each director responded;
|
|
•
|
|
definition of the proposed strategic directions;
|
|
•
|
|
assessment of the directors’ independence and report on the absence of conflicts of interest;
|
|
•
|
|
proposal to renew directorships;
|
|
•
|
|
determination of the amount of directors’ fees due for fiscal year 2014;
|
|
•
|
|
the Chief Executive Officer’s compensation (in the absence of the Chief Executive Officer); and
|
|
•
|
|
review of the possibility of granting the Company’s performance shares and stock options.
|
March 25
|
•
|
|
summary of the Strategic Committee meeting of February 11, 2015;
|
|
•
|
|
presentation to the Board of the work of the Audit Committee at its meeting on March 23, 2015;
|
|
•
|
|
presentation to the Board of the Group’s R&D activities and the major issues it faces;
|
|
•
|
|
preparation of the Annual Shareholders’ Meeting: agenda, resolutions and reports;
|
|
•
|
|
review of various chapters of the Registration Document forming the Management Report within the meaning of the French Commercial Code (risk factors and social,
environmental and societal information); and
|
|
•
|
|
setting the schedule related to the payment of interim dividends and the balance of the dividend for 2016.
|
April 27
|
•
|
|
results for the first quarter of 2015 after the Audit Committee’s report and work performed by the statutory auditors;
|
|
•
|
|
payment of an interim dividend;
|
|
•
|
|
preparation of the Annual Shareholders’ Meeting: review of requests made by the Central Works Council to include a draft resolution on the Annual
Shareholders’ Meeting agenda; the Board of Directors’ position on this request;
|
|
•
|
|
information about the share capital increase reserved for employees and additional decisions; establishment of the Board of Directors’ additional report on
this operation; and
|
|
•
|
|
French Labor Code procedure relating to the company’s strategic directions: communication of the Central Works Council’s response to the Board of
Directors’ response given on December 16, 2014.
|
May 29 – pre-Shareholders’ Meeting
|
•
|
|
review of the draft responses to the written questions submitted by a shareholder; and
|
|
•
|
|
setting of the share issue price for the payment of the balance of the 2014 dividend in shares, subject to the adoption of the resolution by the Annual
Shareholders’ Meeting immediately following the Board meeting.
|
July 28
|
•
|
|
strategic perspectives of the Refining & Chemicals segment including safety and energy efficiency aspects and prevention of major environmental risks;
|
|
|
|
|
|
2015 Form 20-F TOTAL S.A.
|
|
117
|
Item 6 - C. Board Practices and Corporate Governance
|
•
|
|
results for the second quarter 2015 and the first half of 2015 after the Audit Committee’s report and work performed by the statutory auditors;
|
|
•
|
|
payment of a second interim dividend;
|
|
•
|
|
approval of the resources made available and training program for the director representing employees on recommendation of the Governance and Ethics Committee;
|
|
•
|
|
performance share grants on the recommendation of the Compensation Committee;
|
|
•
|
|
presentation of the Company’s equal opportunity and salary equality policy and comparative status of overall employment and training conditions for women
and men in the Company; and
|
|
•
|
|
information about the results of the votes on the resolutions at the Annual Shareholders’ Meeting held on May 29, 2015, the results of the option to
receive the payment of the remaining balance of the dividend for fiscal year 2014 in shares.
|
September 22
|
•
|
|
strategic perspectives of Exploration & Production activities with a presentation of safety indicators and environmental objectives;
|
|
•
|
|
mid-2015 financial communications: presentation of the outlook and objectives for the coming years;
|
|
•
|
|
the Company’s strategic directions;
|
|
•
|
|
comparison of the results of international oil companies; and
|
|
•
|
|
distribution of the first interim dividend for the 2015 fiscal year and setting of the new share issue price for the option to receive the interim dividend in
shares.
|
October 28 – meeting held in Abu Dhabi
|
•
|
|
summary of the Strategic Committee meeting of September 22, 2015;
|
|
•
|
|
strategic perspectives of Marketing & Services activities, including the operational safety, technological risk and environmental aspects, and strategic
perspectives of New Energies (solar and biotechnology) activities;
|
|
•
|
|
results for the third quarter of 2015 after the Audit Committee’s report and work performed by the statutory auditors;
|
|
•
|
|
payment of a third interim dividend;
|
|
•
|
|
information about the results of the option to receive the payment of the first interim dividend for fiscal year 2015 in shares.
|
December 16
|
•
|
|
decision to reunify the positions of Chairman and Chief Executive Officer and appointment of the Chairman following the Governance and Ethics Committee’s
report;
|
|
•
|
|
amendment of the Board of Directors’ Rules of Procedure to introduce the option of appointing a Lead Independent Director and define their duties;
|
|
•
|
|
appointment of a Lead Independent Director;
|
|
•
|
|
amendment of the Rules of Procedure of the Governance and Ethics Committee;
|
|
•
|
|
approval of the change in the composition of the Committees;
|
|
•
|
|
examination of the allocation of the directors’ fees in particular in light of the a appointment of a Lead Independent Director;
|
|
•
|
|
the Chairman and Chief Executive Officer’s compensation (in the absence of the Chief Executive Officer);
|
|
•
|
|
determination of the commitments made to the Chairman and Chief Executive Officer (supplementary pension plan, retirement benefits, severance pay and life
insurance plan) (in the absence of the Chief Executive Officer);
|
|
•
|
|
the Group’s 5-year plan: outlook of the Group and business segments and financial summary of the long-term plan;
|
|
•
|
|
Board of Directors’ response to the Central Works Council’s opinion on the strategic directions presented to the Board on September 22, 2015;
|
|
•
|
|
distribution of the second interim dividend for the 2015 fiscal year and setting of the new share issue price for the option to receive the interim dividend in
shares; and
|
|
•
|
|
information about the regulated agreements authorized during the fiscal year and the regulated agreements concluded and authorized during previous fiscal years
that have remained applicable during fiscal year 2015.
|
The Committee has four members. It is
chaired by Ms. Coisne-Roquette and its members also include Messrs. Artus, Keller and Lamarche. Ms. Coisne-Roquette was appointed “financial expert” of the Committee by the Board at its meeting of December 16, 2015.
The Committee members are all independent directors (refer to “— A.1.4. Director independence”, above), with the exception of
the director representing employee shareholders (Mr. Keller). The careers of all of the Committee members attest to their possession of acknowledged expertise in the financial and accounting or economic fields (refer to “— A.1.1.
Composition of the Board of Directors”, above).
The rules of procedure of the Audit Committee
define the Committee’s duties and working procedures. They were last amended in 2014 to permit the appointment of a director representing employee shareholders or employees. The unabridged version of the rules of procedure approved by the Board
of Directors on July 29, 2014 is available on the Company’s website under “Our Group/Corporate Governance”.
To allow the Board of
Directors of TOTAL S.A. to ensure that internal control is effective and that published information available to shareholders and financial markets is reliable, the duties of the Committee include:
|
•
|
|
recommending the appointment of statutory auditors and their compensation, ensuring their independence and monitoring their work;
|
|
•
|
|
establishing the rules for the use of statutory auditors for non-audit services and verifying their implementation;
|
|
•
|
|
supervising the audit by the statutory auditors of the Consolidated Financial Statements and the parent company financial statements;
|
|
•
|
|
examining the assumptions used to prepare the financial statements, assessing the validity of the methods used to handle significant transactions and examining
the parent company financial statements and annual, half-yearly, and quarterly Consolidated Financial Statements prior to their examination by the Board of Directors, after regularly monitoring the financial situation, cash position and commitments
included in the annual financial statements of the Company;
|
|
•
|
|
supervising the implementation of internal control and risk management procedures and their effective application, with the assistance of the internal audit
department;
|
|
•
|
|
supervising procedures for preparing financial information;
|
|
•
|
|
monitoring the implementation and activities of the disclosure committee, including reviewing the conclusions of this committee;
|
|
•
|
|
reviewing the annual work program of internal and external auditors;
|
|
|
|
|
|
118
|
|
TOTAL S.A. Form 20-F 2015
|
Item 6 - C. Board Practices and Corporate Governance
|
•
|
|
receiving information periodically on completed audits and examining annual internal audit reports and other reports (statutory auditors, annual report, etc.);
|
|
•
|
|
reviewing the choice of appropriate accounting policies and principles used to prepare the Consolidated Financial Statements and parent company financial
statements and ensuring the continuity of the principles;
|
|
•
|
|
reviewing the Group’s policy for the use of derivative instruments;
|
|
•
|
|
reviewing, if requested by the Board of Directors, major transactions contemplated by the Group;
|
|
•
|
|
reviewing significant litigation annually;
|
|
•
|
|
implementing and monitoring compliance with the Group’s Financial Code of Ethics;
|
|
•
|
|
proposing to the Board of Directors, for implementation, a procedure for complaints or concerns of employees, shareholders and others, related to accounting,
internal control or auditing matters, and monitoring the implementation of this procedure;
|
|
•
|
|
where applicable, reviewing significant transactions of the Group during which a conflict of interest may have occurred; and
|
|
•
|
|
reviewing the procedure for booking the Group’s proved reserves.
|
|
–
|
Organization of activities
|
The Committee meets at
least seven times each year: each quarter to review the statutory financial statements of TOTAL S.A. as parent company and the annual and quarterly Consolidated Financial Statements, and at least three other times a year to review matters not
directly related to the review of the quarterly financial statements.
At each committee meeting where the quarterly financial statements are reviewed,
the Group’s Chief Financial Officer presents the Consolidated Financial Statements and the statutory financial statements of TOTAL S.A. as parent company, as well as the Group’s financial position and, in particular, its liquidity, cash
flow and debt situation. A memo describing the Company’s risk exposure and off-balance sheet commitments is communicated to the Audit Committee. This review of the financial statements includes a presentation by the statutory auditors
underscoring the key points observed.
As part of monitoring the efficiency of the internal control and risk management systems, the Committee is
informed of the work program of the Corporate Internal Control and Audit Department and its organization, on which it may issue an opinion. The Committee also receives a summary of the internal audit reports, which is presented at each Committee
meeting where the quarterly financial statements are reviewed. The risk management processes implemented within the Group and updates to them are presented regularly to the Audit Committee.
The Committee may meet with the Chairman and Chief Executive Officer or, if the functions are separate, the Chairman of the Board of Directors, the Chief Executive Officer and, if applicable, any Deputy Chief
Executive Officer of the Company, and perform inspections and consult with managers of operating or non-operating departments, as may be useful in performing its duties. The Chairperson of the Committee gives prior notice of such meeting to the
Chairman and Chief Executive Officer or, if the functions are separate, both the Chairman of the Board of Directors and the Chief Executive Officer. The Committee is authorized to consult with those involved in preparing or auditing the financial
statements (Chief Financial Officer and principal Finance Department managers, Audit Department, Legal
Department) by asking the Company’s Chief Financial Officer to call them to a meeting.
The
Committee consults with the statutory auditors and, at least once a year, without any Company representative being present. If it is informed of a substantial irregularity, it recommends that the Board of Directors take all appropriate action.
|
–
|
Audit Committee activity
|
In 2015, the Audit Committee
held 7 meetings, with 92.8% attendance. Its work was focused on the following areas:
February 9
|
•
|
|
review of the accounts for the fourth quarter of 2014, the Group’s consolidated results and the statutory financial statements of TOTAL S.A. as parent
company for 2014. Presentation by the statutory auditors of a summary of their work performed in accordance with French and American professional audit standards, in particular on the Group’s positions in terms of valuing assets and assessing
country risk;
|
|
•
|
|
review of the Group’s financial position;
|
|
•
|
|
presentation of the preparation process and key validation stages of the Management Report forming chapter 3 of the Registration Document;
|
|
•
|
|
update on internal audit: presentation of the 2014 main accomplishments and key topics of the audit plan for 2015. Comments on the results of the assessment of
internal control on financial reporting conducted for fiscal year 2014 as part of the implementation of the Sarbanes-Oxley Act (SOX), along with a summary of the statutory auditors’ assessments of internal control related to financial reporting
as part of the SOX 404 process;
|
|
•
|
|
review of the draft of the Chairman’s report on internal control and risk management procedures; and
|
|
•
|
|
update on unvalued guarantees given by TOTAL S.A. in 2014.
|
March 23
|
•
|
|
presentation of certain parts of the Registration Document: risk factors and legal proceedings;
|
|
•
|
|
update on compliance procedures: 2014 results and implementation of programs;
|
|
•
|
|
environmental and societal reporting: analysis of environmental risks, key indicators and action plans. Presentation of the Group’s societal policy.
Presentation by the statutory auditors of their procedures and the conclusions of their review of these issues.
|
|
•
|
|
review of the hydrocarbon reserves evaluation process at year-end 2014; and
|
|
•
|
|
presentation of the Group’s insurance policy: coverage for 2015 against property damage, business interruption and civil liability. Update on the main
pending claims.
|
April 23
|
•
|
|
compliance: information about the new independent monitor appointed by the U.S. authorities (the monitor originally appointed having relinquished his assignment
for health reasons); presentation of the monitor’s work schedule;
|
|
•
|
|
review of the consolidated and statutory financial statements of TOTAL S.A. as parent company for the first quarter of 2015, with a presentation by the statutory
auditors of a summary of their work;
|
|
•
|
|
presentation of the Group’s financial position at the end of the quarter; and
|
|
•
|
|
update on the internal audits conducted in the first quarter of 2015.
|
|
|
|
|
|
2015 Form 20-F TOTAL S.A.
|
|
119
|
Item 6 - C. Board Practices and Corporate Governance
June 10
|
•
|
|
presentation of the topics covered by the Group Risk Committee in 2014, including “partner” risks for assets operated by third parties, tax risks,
major accident and pollution risks, and environmental risks;
|
|
•
|
|
approval of the new version of the Risk Management, Internal Control and Audit Charter;
|
|
•
|
|
presentation of the main potential risks for the growth of Exploration & Production;
|
|
•
|
|
presentation of the updated Trading & Shipping risk map;
|
|
•
|
|
presentation of the Group’s financial position: map of taxes paid worldwide, tax risk map; main inspections and tax-related legal proceedings; main changes
and anticipated risks; and
|
|
•
|
|
review of the Consolidation Department’s functions in terms of accounting standards and its organization within the Group; presentation of the main proposed
changes in standards in progress.
|
July 24
|
•
|
|
update on the statutory auditors panel (in the absence of the statutory auditors) in light of the European Regulation on statutory audit that will come into
effect on June 17, 2016 and the end of the terms of office of the current statutory auditors at the 2016 Annual Shareholders’ Meeting. After analysis, the Audit Committee will recommend that the Board propose to the Annual
Shareholders’ Meeting of May 24, 2016 that the terms of office of the statutory auditors be renewed for a period of six fiscal years;
|
|
•
|
|
review of the Consolidated Financial Statements for the second quarter and first half of 2015 and the statutory financial statements of TOTAL S.A.as parent
company. Presentation by the statutory auditors of a summary of their work;
|
|
•
|
|
presentation of the Group’s financial position at the end of the quarter; and
|
|
•
|
|
update on the internal audits conducted in the second quarter of 2015.
|
October 7
|
•
|
|
statutory auditors’ analysis of the main transverse risks that will be addressed as important points in their audit plan for the closing of the 2015
accounts;
|
|
•
|
|
review of significant litigation and status update on the main pending proceedings involving the Group;
|
|
•
|
|
presentation by the independent monitor of the aims of his mission and the actions taken since his appointment;
|
|
•
|
|
presentation on social commitments and managed assets: control and management; and
|
|
•
|
|
statutory auditors: update on fees followed by review of the rules for pre-approval of audit and non-audit services and approval, without changes, of the policy
implemented.
|
The members of the Committee then met with the statutory auditors without management being present.
October 26
|
•
|
|
review of the consolidated and the statutory financial statements of TOTAL S.A. as parent company for the third quarter of 2015 and the first nine months of
2015. Presentation by the statutory auditors of a summary of their work;
|
|
•
|
|
presentation of the Group’s financial position at the end of the quarter;
|
|
•
|
|
update on the internal audits conducted in the third quarter of 2015;
|
|
•
|
|
the Committee was informed that the relevant employees acted in compliance with the provisions of the Financial Code of Ethics; and
|
|
•
|
|
presentation of the supervision of the audit of the equity affiliates’ financial statements.
|
At each meeting related to the quarterly financial statements, the Committee reviewed the Group’s financial position in terms of liquidity, cash flow and debt,
as well as its significant risks and off-balance sheet commitments. The Audit Committee was periodically informed of the risk management processes implemented within the Group and the work carried out by the Corporate Internal Control and Audit
Department which was presented at each Committee meeting where the quarterly financial statements were reviewed.
The Audit Committee reviewed the
accounts within the time limits required by the AFEP-MEDEF Code, namely at least two days prior to their review by the Board of Directors.
The statutory
auditors attended all Audit Committee meetings held in 2015.
The Chief Financial Officer, the Vice President Accounting and the Vice President Corporate
Internal Control and Audit attended all Audit Committee meetings, and the Treasurer attended all meetings related to his area.
The Chairman of the
Committee reported to the Board of Directors on the Committee’s activities.
|
1.5.
|
Governance and Ethics Committee
|
The Governance and Ethics Committee has
five members. It is chaired by Ms. Barbizet, Lead Independent Director, and its members also include Mses. Kux and Idrac and Messrs. Brock and Desmarest. 80% of the Committee members are independent directors (refer to “—
A.1.4. Director independence”, above).
The rules of procedure of the Governance and Ethics Committee define the Committee’s duties and working procedures. The unabridged version of the rules of procedure approved by the Board of Directors on
December 16, 2015 is available on the Company’s website under “Our Group/Corporate Governance”.
The Governance and Ethics Committee is
focused on:
|
•
|
|
recommending to the Board of Directors the persons who are qualified to be appointed as directors, so as to guarantee the scope of coverage of the
Directors’ competencies and the diversity of their profiles;
|
|
•
|
|
recommending to the Board of Directors the persons who are qualified to be appointed as executive directors;
|
|
•
|
|
preparing the Company’s corporate governance rules and supervising their implementation; and
|
|
•
|
|
ensuring compliance with ethics rules and examining any questions related to ethics and conflicts of interest.
|
Its duties include:
|
•
|
|
presenting recommendations to the Board for its membership and the membership of its committees, and the qualification in terms of independence of each candidate
for directors’ positions on the Board of Directors;
|
|
•
|
|
proposing annually to the Board of Directors the list of directors who may be considered as “independent directors”;
|
|
•
|
|
examining, for the parts within its remit, reports to be sent by the Board of Directors or its Chairman to shareholders;
|
|
•
|
|
assisting the Board of Directors in the selection and evaluation of the executive directors and examining the
|
|
|
|
|
|
120
|
|
TOTAL S.A. Form 20-F 2015
|
Item 6 - C. Board Practices and Corporate Governance
|
|
|
preparation of their possible successors, including cases of unforeseeable absence;
|
|
•
|
|
recommending to the Board of Directors the persons who are qualified to be appointed as directors;
|
|
•
|
|
recommending to the Board of Directors the persons who are qualified to be appointed as members of a Committee of the Board of Directors;
|
|
•
|
|
proposing methods for the Board of Directors to evaluate its performance, and in particular preparing means of regular self-assessment of the practices of the
Board of Directors, and the possible assessment thereof by an external consultant;
|
|
•
|
|
proposing to the Board of Directors the terms and conditions for allocating directors’ fees and the conditions under which expenses incurred by the
directors are reimbursed;
|
|
•
|
|
developing and recommending to the Board of Directors the corporate governance principles applicable to the Company;
|
|
•
|
|
preparing recommendations requested at any time by the Board of Directors or the Management of the Company regarding appointments or governance;
|
|
•
|
|
examining the conformity of the Company’s governance practices with the recommendations of the Corporate Governance Code adopted by the Company;
|
|
•
|
|
supervising and monitoring implementation of the Company’s ethics and compliance program and, in this respect, ensuring that the necessary procedures for
updating the Group’s Code of Conduct are put in place and that this Code is disseminated and applied;
|
|
•
|
|
examining any questions related to ethics and conflicts of interest; and
|
|
•
|
|
examining changes in the duties of the Board of Directors.
|
|
–
|
Governance and Ethics Committee activity
|
In 2015, the
Governance and Ethics Committee held 3 meetings, with 93.3% attendance. Its work was focused on the following areas:
February 10
|
•
|
|
results of the formal self-assessment of the Board’s practices conducted in the form of a detailed questionnaire, prepared with the assistance of an
external consultant, to which the directors responded. The Committee stated that it was in favor of the proposed improvements, which will be submitted to the Board of Directors and notably concern the accentuating of the progress made to the time
allotted to the most important issues and substantive debates;
|
|
•
|
|
proposals to the Board of Directors regarding the assessment of the independence of the directors based on the independence criteria specified in the AFEP-MEDEF
Code and after reviewing the level of activity between certain directors and the Group’s suppliers;
|
|
•
|
|
proposals to the Board of Directors regarding the list of directors whose appointment will be voted on by the 2015 Annual Shareholders’ Meeting;
|
|
•
|
|
proposals regarding changes to the composition of the Committees, subject to approval of the resolutions voted on by the Annual Shareholders’ Meeting;
|
|
•
|
|
review of the terms and conditions for allocating directors’ fees to directors and Committee members. After noting the criteria used, the Committee proposed
setting the fees to be paid to directors for 2014 based on the number of Board and Committee meetings in which they participated at
€
1.34
million; and
|
|
•
|
|
review, for the parts within its remit, of the reports that must be sent to shareholders by the Board of Directors or its Chairman.
|
July 28
|
•
|
|
presentation by the Chairman of the Ethics Committee of a review of the ethics program for 2014 (information and training campaigns, changes in the matters and
cases reviewed, ethical assessments conducted within the Group’s entities, actions related to human rights) and presentation of the priorities for 2015;
|
|
•
|
|
discussion of changes to the composition of the Board of Directors; and
|
|
•
|
|
establishment of the conditions for the performance of the duties of the director representing employees on the Board of Directors: resources made available and
training program.
|
December 15
|
•
|
|
review of the General Management form and proposal to combine the positions of Chairman and Chief Executive Officer;
|
|
•
|
|
proposed appointment of the Chairman and Chief Executive Officer;
|
|
•
|
|
proposal to amend the Board of Directors’ Rules of Procedure to include provision for the appointment of a Lead Independent Director if the positions of
Chairman and Chief Executive Officer are combined, and setting out of his or her duties, proposal to amend the rules of procedures of the Governance and Ethics Committee;
|
|
•
|
|
proposal regarding the appointment of a Lead Independent Director;
|
|
•
|
|
proposals regarding changes in the composition of the committees; and
|
|
•
|
|
proposal regarding change in the directors’ fees to be allocated to the directors and the members of the Committees, in the event of the combination of the
positions of Chairman and Chief Executive Officer.
|
|
1.6.
|
Compensation Committee
|
The Compensation Committee is made up of
four members. It is chaired by Mr. Lamarche and its members also include Mses. Barbizet and Coisne-Roquette and Mr. Brock. 100% of the Committee members are independent directors (refer to “— A.1.4. Director
independence”, above).
The rules of procedure of the Compensation
Committee define the Committee’s duties and working procedures. The unabridged version of the rules of procedure approved by the Board of Directors on February 9, 2012 is available on the Company’s website under “Our
Group/Corporate Governance”.
The Committee is focused on:
|
•
|
|
examining the executive compensation policies implemented by the Group and the compensation of members of the Executive Committee;
|
|
•
|
|
evaluating the performance and recommending the compensation of each executive director; and
|
|
•
|
|
preparing reports which the Company must present in these areas.
|
Its duties include:
|
•
|
|
reviewing the main objectives proposed by the General Management of the Company regarding compensation of the Group’s executive directors, including stock
option plans, free share plans and equity-based plans, and advising on this subject;
|
|
|
|
|
|
2015 Form 20-F TOTAL S.A.
|
|
121
|
Item 6 - C. Board Practices and Corporate Governance
|
•
|
|
making recommendations and proposals to the Board of Directors concerning:
|
|
|
–
|
|
compensation, pension and life insurance plans, in-kind benefits and other compensation (including severance benefits) for the executive directors of the
Company; in particular, the Committee proposes compensation structures that take into account the Company’s strategy, objectives and earnings as well as market practices,
|
|
|
–
|
|
grants of stock options and free shares, particularly grants of registered shares to the executive directors;
|
|
•
|
|
reviewing the compensation of the members of the Executive Committee, including stock option plans, free share plans and equity-based plans, pension and
insurance plans and in-kind benefits;
|
|
•
|
|
preparing and presenting reports in accordance with its rules of procedure;
|
|
•
|
|
examining, for the parts within its remit, reports to be sent by the Board of Directors or its Chairman to shareholders; and
|
|
•
|
|
preparing recommendations requested at any time by the Chairman of the Board of Directors or the General Management of the Company regarding compensation.
|
|
–
|
Work of the Compensation Committee
|
In 2015, the
Compensation Committee held 3 meetings, with 100% attendance. Neither the Chairman nor the Chief Executive Officer may be present during the Committee’s deliberations regarding his own situation.
Its work was focused on the following areas:
February 10
|
•
|
|
determination of the variable portion of the compensation to be paid to the former Chairman and Chief Executive Officer for his performance in 2014;
|
|
•
|
|
proposed compensation for the Chief Executive Officer (fixed portion for 2015 and variable portion for his duties in 2014) and proposals regarding the variable
portion for 2015;
|
|
•
|
|
review of compliance with the restrictions on share transfers by the Chairman and by the Chief Executive Officer;
|
|
•
|
|
information regarding the compensation policy for the members of the Executive Committee;
|
|
•
|
|
review of the performance share and stock option grant policy for 2015; and
|
|
•
|
|
for the parts within its remit, provision of the information and reports that must be sent to shareholders by the Board of Directors or its Chairman.
|
July 28
|
•
|
|
appointment of the new Chairman of the Committee; and
|
|
•
|
|
proposals regarding the 2015 performance share plan: number of beneficiaries, length of the acquisition period (three years) and retention period (two years),
performance conditions for final grant; and
|
|
•
|
|
proposals regarding the grant of performance shares to the Chief Executive Officer.
|
December 15
|
•
|
|
proposals regarding the compensation of the Chairman and Chief Executive Officer; and
|
|
•
|
|
proposals regarding the commitments to be made to the Chairman and Chief Executive Officer.
|
The Strategic
Committee is made up of seven members. It is chaired by Mr. Pouyanné and its members also include Mses. Barbizet and Kux and Messrs. Artus, Blanc, Brock and Desmarest. 66.7%
(1)
of the Committee members are independent directors (refer to “— A.1.4. Director independence”, above).
The rules of procedure of the Strategic
Committee define the Committee’s duties and working procedures. The unabridged version of the rules of procedure approved by the Board of Directors on April 25, 2013 is available on the Company’s website under “Our
Group/Corporate Governance”.
To allow the Board of Directors of TOTAL S.A. to ensure the Group’s development, the Strategic Committee’s
duties include:
|
•
|
|
examining the Group’s overall strategy proposed by the Company’s Chief Executive Officer;
|
|
•
|
|
examining operations that are of particular strategic importance; and
|
|
•
|
|
reviewing competition and the resulting medium and long-term outlook for the Group.
|
|
–
|
Work of the Strategic Committee
|
In 2015, the
Strategic Committee held 2 meetings, with 91.6% attendance. Its work was focused on the following areas:
February 11
|
•
|
|
analysis of the status of the oil markets and the positions of market players, in the context of the drop in oil prices in the second half of 2014.
|
September 22
|
•
|
|
analysis of long-term demand on the oil and gas markets.
|
|
1.8.
|
Evaluation of the Board’s practices
|
Once a year, the
Board of Directors adds a discussion of its practices to its agenda. It also conducts a formal evaluation of its own practices at regular intervals of up to three years. This evaluation is carried out under the supervision of the Governance and
Ethics Committee with the help of an outside consultant. When a Lead Independent Director is appointed, he or she oversees this evaluation process and reports on it to the Board of Directors.
At its meeting on February 10, 2016, the Board of Directors discussed its practices on the basis of a formal self-evaluation carried out by an external consultant in the form of interviews with each director
based on a detailed questionnaire. The evaluation was carried out under the supervision of Ms. Barbizet, Lead Independent Director. The responses given by the directors were then presented to the Governance and Ethics Committee to be reviewed
and summarized. This summary was then discussed by the Board of Directors. This process made it possible to confirm the quality of each director’s contribution to the work of the Board and its Committees.
This formal evaluation showed a positive opinion of the practices of the Board of Directors and the Committees. In particular, it was noted that the suggestions for
improvement made by the directors in recent years had generally been taken into account. During the Board of Directors’ meetings, some of which were held at certain of the Group’s sites,
|
(1
)
|
Excluding the director representing employees.
|
|
|
|
|
|
122
|
|
TOTAL S.A. Form 20-F 2015
|
Item 6 - C. Board Practices and Corporate Governance
special attention was paid at the start of each meeting to the review of the main points to be examined by the Board
(financial statements, large-scale investment and divestment projects, etc.).
To further improve its performance, the Board retained the main
suggestions made by the directors in the 2016 self-assessment,
which notably concerned to continue its reflections on the monitoring of risks at the Board level and changes to the Board’s composition, as well as the holding of executive sessions in
application of the Board’s rules of procedures and the examination of creating a secured-access platform for Board documents.
|
2.
|
Statement regarding corporate governance
|
For many years, TOTAL has taken an active approach to
corporate governance and at its meeting on November 4, 2008, the Board of Directors confirmed its decision to refer to the AFEP-MEDEF Code of corporate governance for publicly-traded companies.
The AFEP-MEDEF Code is available on the Internet websites of the MEDEF and AFEP.
The AFEP-MEDEF Code was revised in June 2013 to introduce new changes regarding, in particular, a consultation procedure in which shareholders can express an opinion on the individual compensation of the executive
directors (say on pay), as well as the establishment of a High Committee for corporate governance, an independent structure in charge of monitoring implementation of the Code. It was also revised in November 2015 to introduce the principle of
consultation of the Annual Shareholders’ Meeting in case of the sale of at least one-half of the company’s assets and to bring the Code in line with new laws regarding supplementary pensions of executive directors.
Pursuant to Article L. 225-37 of the French Commercial Code, the following table sets forth the recommendations made in the AFEP-MEDEF Code that the Company has not
followed and the reasons for such decision.
|
|
|
|
|
Recommendations not followed
|
|
Explanations — Practice followed by TOTAL
|
|
The Board of Directors’ assessment (paragraph 10.4 of the Code)
It is recommended that non-executive directors meet periodically without the participation of
the executive or “in house” directors. The rules of procedure of the Board of Directors should provide for one meeting of this kind per year, during which the performance of the Chairman, the Chief Executive Officer and the Deputy Chief
Executive Officer(s) would be evaluated, and which would be an opportunity to reflect periodically on the future of the Company’s management.
|
|
At its meeting held each year in February, the Board of Directors evaluates the performance of the
executive directors and, where applicable, reflects as necessary on the future of the Company’s management. When these particular matters are reviewed, the Chairman and Chief Executive Officer and the members of the Executive Committee in
attendance (who are not directors) leave the Board meeting.
Since December 16, 2015,
the rules of procedure of the Board of Directors provide that, with the agreement of the Governance and Ethics Committee, the Lead Independent Director may hold meetings of the directors who do not hold executive or salaried positions on the Board
of Directors. He or she reports to the Board of Directors on the conclusions of such meetings.
In February 2016, the part of the meeting during which the Board discussed the evaluation of the performance of the Chairman and Chief Executive Officer and the determination of his compensation was chaired by the
Lead Independent Director. Thus, the Board of Directors’ practice constitutes a mechanism that has the same effect as the recommendation made in the AFEP-MEDEF Code.
|
|
Compensation Committee (point 18.1 of the Code)
It is recommended that one member of the Committee should be an employee
director.
|
|
Given that the Compensation Committee is made up exclusively of independent directors and that the Lead
Independent Director is a member of this Committee, the Board of Directors determined that it was appropriate that the director representing employees be a member of the Strategic Committee to allow him or her to be more involved in reviewing the
overall strategy of the Group and operations that are of particular strategic importance, and in reviewing competition and the resulting medium and long-term outlook for the Group.
|
|
Supplementary pension plan (point 23.2.6 of the
Code)
Supplementary pension schemes with defined benefits must be subject to
the condition that the beneficiary must be a director or employee of the Company when claiming his or her pension rights pursuant to the applicable rules.
|
|
It appeared justified not to deprive the concerned beneficiaries of the benefit of the pension commitments made by the Company in special cases of
the disability or departure of a beneficiary over 55 years of age at the initiative of the Group. In addition, it should be noted that the supplementary pension plan set up by the Company was declared to URSSAF in 2004, in accordance with
Articles L. 137-11 and R. 137-16 of the French Social Security Code.
|
|
|
|
|
|
2015 Form 20-F TOTAL S.A.
|
|
123
|
Item 6 - D. Employees and Share Ownership
D. EMPLOYEES AND SHARE OWNERSHIP
|
1.1.
|
Group employees as of December 31, 2015
|
As of
December 31, 2015, the Group had 96,019 employees belonging to 314 employing companies and subsidiaries located in 102 countries. The tables below present the breakdown of employees by the following categories: gender, nationality, business
segment, region and age bracket.
|
|
|
|
|
|
|
|
|
|
|
|
|
|
|
Group employees as of December 31,
|
|
2015
|
|
|
2014
|
|
|
2013
|
|
|
Total number of employees
|
|
|
96,019
|
|
|
|
100,307
|
|
|
|
98,799
|
|
|
Women
|
|
|
32.0%
|
|
|
|
31.1%
|
|
|
|
30.8%
|
|
|
Men
|
|
|
68.0%
|
|
|
|
68.9%
|
|
|
|
69.2%
|
|
|
French
|
|
|
31.2%
|
|
|
|
32.2%
|
|
|
|
33.4%
|
|
|
Other nationalities
|
|
|
68.8%
|
|
|
|
67.8%
|
|
|
|
66.6%
|
|
|
Breakdown by business segment
|
|
|
|
|
|
|
|
|
|
|
|
|
|
Upstream
|
|
|
|
|
|
|
|
|
|
|
|
|
|
Exploration & Production
|
|
|
17.1%
|
|
|
|
17.2%
|
|
|
|
17.1%
|
|
|
Gas
|
|
|
0.8%
|
|
|
|
1.1%
|
|
|
|
1.1%
|
|
|
Refining & Chemicals
|
|
|
|
|
|
|
|
|
|
|
|
|
|
Refining & Chemicals
|
|
|
49.6%
|
|
|
|
50.9%
|
|
|
|
51.5%
|
|
|
Trading & Shipping
|
|
|
0.6%
|
|
|
|
0.6%
|
|
|
|
0.6%
|
|
|
Marketing & Services
|
|
|
|
|
|
|
|
|
|
|
|
|
|
Marketing & Services
|
|
|
21.3%
|
|
|
|
21.2%
|
|
|
|
21.5%
|
|
|
New Energies
|
|
|
8.9%
|
|
|
|
7.4%
|
|
|
|
6.7%
|
|
|
Corporate
|
|
|
1.7%
|
|
|
|
1.6%
|
|
|
|
1.5%
|
|
|
Breakdown by region
|
|
|
|
|
|
|
|
|
|
|
|
|
|
France
|
|
|
31.5%
|
|
|
|
32.5%
|
|
|
|
33.6%
|
|
|
French overseas departments and territories
|
|
|
0.4%
|
|
|
|
0.3%
|
|
|
|
0.4%
|
|
|
Rest of Europe
|
|
|
24.5%
|
|
|
|
23.9%
|
|
|
|
23.4%
|
|
|
Africa
|
|
|
10.5%
|
|
|
|
10.2%
|
|
|
|
10.0%
|
|
|
North America
|
|
|
6.4%
|
|
|
|
6.6%
|
|
|
|
6.6%
|
|
|
Latin America
|
|
|
10.5%
|
|
|
|
9.7%
|
|
|
|
9.6%
|
|
|
Asia
|
|
|
14.8%
|
|
|
|
15.0%
|
|
|
|
14.6%
|
|
|
Middle East
|
|
|
1.3%
|
|
|
|
1.3%
|
|
|
|
1.3%
|
|
|
Oceania
|
|
|
0.1%
|
|
|
|
0.5%
|
|
|
|
0.5%
|
|
|
Breakdown by age bracket
|
|
|
|
|
|
|
|
|
|
|
|
|
|
< 25 years
|
|
|
6.6%
|
|
|
|
6.3%
|
|
|
|
6.5%
|
|
|
25 to 34 years
|
|
|
28.8%
|
|
|
|
29.0%
|
|
|
|
29.1%
|
|
|
35 to 44 years
|
|
|
29.1%
|
|
|
|
29.1%
|
|
|
|
28.8%
|
|
|
45 to 54 years
|
|
|
22.6%
|
|
|
|
22.7%
|
|
|
|
23.1%
|
|
|
> 55 years
|
|
|
12.9%
|
|
|
|
12.9%
|
|
|
|
12.5%
|
|
At year-end 2015, the country with the most employees after France was the United States, followed by Mexico, Poland and the
Philippines. The decrease in the number of employees in 2015 was, on the one hand, due to divestments made during the year (refer to Note 3 to the Consolidated Financial Statements) and, on the other hand, due to the recruitment reduction policy in
the Group’s oil-related sector to face the decrease in the price of hydrocarbons.
The breakdown by gender and nationality of
managers or equivalent positions (
³
300 Hay points
(1)
) is as follows:
|
|
|
|
|
|
|
|
|
|
|
|
|
|
Breakdown of managers
or equivalent as of December 31,
|
|
2015
|
|
|
2014
|
|
|
2013
|
|
|
Total number of managers
|
|
|
27,624
|
|
|
|
29,271
|
|
|
|
28,527
|
|
|
Women
|
|
|
25.1%
|
|
|
|
24.5%
|
|
|
|
23.9%
|
|
|
Men
|
|
|
74.9%
|
|
|
|
75.5%
|
|
|
|
76.1%
|
|
|
French
|
|
|
39.1%
|
|
|
|
38.8%
|
|
|
|
39.1%
|
|
|
Other nationalities
|
|
|
60.9%
|
|
|
|
61.2%
|
|
|
|
60.9%
|
|
|
(1)
|
The Hay method is a unique reference framework used to classify and assess jobs.
|
|
|
|
|
|
124
|
|
TOTAL S.A. Form 20-F 2015
|
Item 6 - D. Employees and Share Ownership
The table below presents the breakdown by business segment of the
Group employees present
(1)
.
|
|
|
|
|
|
|
|
|
|
|
Breakdown by business segment of the Group employees present as of December 31,
|
|
2015
|
|
|
2014
|
|
|
Upstream
|
|
|
|
|
|
|
|
|
|
Exploration & Production
|
|
|
15,366
|
|
|
|
16,157
|
|
|
Gas
|
|
|
915
|
|
|
|
1,111
|
|
|
Refining & Chemicals
|
|
|
|
|
|
|
|
|
|
Refining & Chemicals
|
|
|
46,661
|
|
|
|
49,967
|
|
|
Trading & Shipping
|
|
|
563
|
|
|
|
567
|
|
|
Marketing & Services
|
|
|
|
|
|
|
|
|
|
Marketing & Services
|
|
|
19,923
|
|
|
|
20,682
|
|
|
New Energies
|
|
|
8,475
|
|
|
|
7,425
|
|
|
Corporate
|
|
|
1,568
|
|
|
|
1,551
|
|
|
1.2.
|
Employees joining and leaving TOTAL
|
|
|
|
|
|
|
|
|
|
|
|
|
|
|
|
As of December 31,
|
|
2015
|
|
|
2014
|
|
|
2013
|
|
|
Total number hired on open-ended contracts
(a)
|
|
|
9,022
|
|
|
|
10,771
|
|
|
|
10,649
|
|
|
Women
|
|
|
34.9%
|
|
|
|
33.2%
|
|
|
|
35.9%
|
|
|
Men
|
|
|
65.1%
|
|
|
|
66.8%
|
|
|
|
64.1%
|
|
|
French
|
|
|
6.5%
|
|
|
|
9.5%
|
|
|
|
10.0%
|
|
|
Other nationalities
|
|
|
93.5%
|
|
|
|
90.5%
|
|
|
|
90.0%
|
|
|
(a)
|
Recruitments in China, which represent 9.2% of 2015 recruitments, are long-term contracts as defined by local law.
|
The number of employees hired under open-ended contracts in 2015 in the fully-consolidated companies decreased by 16.2% compared to 2014, due to the very
significant decrease in the price of oil since the second half of 2014. The regions or business segments in which the largest number of employees were hired were Latin America (37.8%), Asia (24.3%) and Europe (20%), on the one hand, and
Refining & Chemicals (53%), on the other hand.
In 2015, the fully-consolidated Group companies also hired 2,666 employees on fixed-term
contracts. Close to 600,000 job applications were received by the companies covered by the WHRS.
|
|
|
|
|
|
|
|
|
|
|
|
|
|
|
As of December 31,
|
|
2015
|
|
|
2014
|
|
|
2013
|
|
|
Total number of
departures
(a)
|
|
|
7,724
|
|
|
|
7,195
|
|
|
|
6,779
|
|
|
Deaths
|
|
|
128
|
|
|
|
108
|
|
|
|
106
|
|
|
Resignations
|
|
|
4,719
|
|
|
|
4,545
|
|
|
|
4,040
|
|
|
Dismissals/negotiated departures
|
|
|
2,754
|
|
|
|
2,413
|
|
|
|
2,495
|
|
|
Ruptures conventionnelles
(specific negotiated departure in France)
|
|
|
123
|
|
|
|
129
|
|
|
|
138
|
|
|
Total departures/total employees
|
|
|
8%
|
|
|
|
7.2%
|
|
|
|
6.9%
|
|
|
(a)
|
Excluding retirements, transfers, early retirements, voluntary departures and expiry of short-term contracts.
|
TOTAL believes that the relationship between its management and labor unions is, in general, satisfactory.
|
2.1.
|
Employee shareholding
|
Presented below is the total number of
TOTAL shares held directly or indirectly by the Group’s employees as of December 31, 2015:
|
|
|
|
|
|
|
TOTAL ACTIONNARIAT FRANCE
|
|
|
84,369,644
|
|
|
TOTAL ACTIONNARIAT INTERNATIONAL CAPITALISATION
|
|
|
23,711,988
|
|
|
TOTAL FRANCE CAPITAL+
|
|
|
4,758,223
|
|
|
TOTAL INTERNATIONAL CAPITAL
|
|
|
1,984,034
|
|
|
Shares subscribed by employees in the U.S.
|
|
|
736,109
|
|
|
Group Caisse Autonome (Belgium)
|
|
|
539,871
|
|
|
TOTAL shares from the exercise of the Company’s stock options and held as registered shares
within a Company Savings Plan
|
|
|
3,070,324
|
|
|
Total shares held by employees
|
|
|
119,170,193
|
|
As of December 31, 2015, the Group’s employees held, on the basis of the definition of employee
shareholding set forth in Article L. 225-102 of the French Commercial Code, 119,170,193 TOTAL shares, representing 4.88% of the Company’s share capital and 9.04% of the voting rights that could be exercised at a Shareholders’ Meeting on
that date.
The management of each of the FCPEs (Collective investment funds) mentioned above is controlled by a dedicated
Supervisory board,
two-thirds
of its members representing holders of fund units and one-third representing the Company. The Board is responsible for reviewing the Collective investment fund’s management
report and annual financial statements, as well as the
|
(1)
|
Employees present as defined in “Item 4
— E. Other Matters — 4.4.3.2.
Terminology used in social reporting”, above.
|
|
|
|
|
|
2015 Form 20-F TOTAL S.A.
|
|
125
|
Item 6 - D. Employees and Share Ownership
financial, administrative and accounting management of the fund, exercising voting rights attached to portfolio
securities, deciding contribution of securities in case of a public tender offer, deciding mergers, spin-offs or liquidations, and granting its approval prior to changes in the rules and procedures of the Collective investment fund in the conditions
provided for by the rules and procedures.
These rules and procedures also stipulate a simple majority vote for decisions, except for decisions requiring
a qualified majority vote of two-thirds plus one related to a change in a fund’s rules and procedures, its conversion or disposal.
For employees
holding shares outside of the employee collective investment funds mentioned in the table above, voting rights are exercised individually.
The
information regarding shares held by the administration and management bodies is set forth below.
|
2.2.
|
Shares held by the administration and management bodies
|
As of December 31, 2015, based on statements by the directors and the share register listing registered shares, all the members of the Board of Directors and all the Group’s executive officers
(1)
held less than 0.5% of the share capital:
|
•
|
|
members of the Board of Directors
(2)
: 256,930 shares and 9,158.05 units of the
collective investment fund invested in TOTAL shares;
|
|
•
|
|
Chairman and Chief Executive Officer: 55,489 shares and 7,767.05 units of the collective investment fund invested in TOTAL shares;
|
|
•
|
|
members of the Executive Committee: 362,688 shares and 32,967.54 units of the collective investment fund invested in TOTAL shares; and
|
|
•
|
|
executive officers: 459,197 shares and 101,740.04 units of the collective investment fund invested in TOTAL shares.
|
By decision of the Board of Directors:
|
•
|
|
executive directors are required to hold a number of shares of the Company equal in value to two years of the fixed portion of their annual compensation; and
|
|
•
|
|
members of the Executive Committee are required to hold a number of shares of the Company equal in value to two years of the fixed portion of their annual
compensation. These shares must be acquired within three years of their appointment to the Executive Committee.
|
The number of TOTAL
shares to be considered includes:
|
•
|
|
directly held shares, whether or not they are subject to transfer restrictions; and
|
|
•
|
|
units of the collective investment fund invested in TOTAL shares.
|
|
(1)
|
The Group’s executive officers include the members of the Executive Committee, the five Senior Vice Presidents of the Group’s central corporate
functions who are members of the Group Performance Management Committee (Corporate Communication, Human Resources, Legal, Industrial Safety, Strategy and Business Intelligence) and the Treasurer.
|
|
(2)
|
Including the Chairman and Chief Executive Officer, the director representing
employee shareholders and the director representing employees.
|
|
|
|
|
|
126
|
|
TOTAL S.A. Form 20-F 2015
|
Item 6 - D. Employees and Share Ownership
Summary of transactions in the Company’s securities (Article L. 621-18-2 of the
French Monetary and Financial Code)
The following table presents transactions, of which the Company has been informed, in the
Company’s shares or related financial instruments carried out in 2015 by the individuals referred to in paragraphs a), b)
(1)
and c) of Article L. 621-18-2 of the French
Monetary and Financial Code.
|
|
|
|
|
|
|
|
|
|
|
|
|
|
|
|
|
|
|
|
|
|
|
|
|
Year 2015
|
|
|
|
Acquisition
|
|
|
Subscription
|
|
|
Transfer
|
|
|
Exchange
|
|
|
Exercise of
stock
options
|
|
|
Patrick Pouyanné
(a)
|
|
TOTAL shares
|
|
|
577.00
|
|
|
|
688.00
|
|
|
|
29,333.00
|
|
|
|
—
|
|
|
|
29,333.00
|
|
|
|
|
Shares in collective investment plans (“FCPE”) and other related financial instruments
(b)
|
|
|
266.40
|
|
|
|
214.21
|
|
|
|
—
|
|
|
|
—
|
|
|
|
—
|
|
|
Philippe Boisseau
(a)
|
|
TOTAL shares
|
|
|
—
|
|
|
|
1,090.00
|
|
|
|
66,000.00
|
|
|
|
—
|
|
|
|
76,400.00
|
|
|
|
|
Shares in FCPE and other related financial instruments
(b)
|
|
|
666.93
|
|
|
|
7,027.48
|
|
|
|
7,748.43
|
|
|
|
—
|
|
|
|
—
|
|
|
Arnaud Breuillac
(a)
|
|
TOTAL shares
|
|
|
—
|
|
|
|
612.00
|
|
|
|
—
|
|
|
|
—
|
|
|
|
25,000.00
|
|
|
|
|
Shares in FCPE and other related financial instruments
(b)
|
|
|
274.03
|
|
|
|
3,489.68
|
|
|
|
—
|
|
|
|
—
|
|
|
|
—
|
|
|
Yves-Louis Darricarrère
(a)
|
|
TOTAL shares
|
|
|
—
|
|
|
|
—
|
|
|
|
—
|
|
|
|
—
|
|
|
|
—
|
|
|
|
Shares in FCPE and other related financial instruments
(b)
|
|
|
596.24
|
|
|
|
10,535.09
|
|
|
|
102.93
|
|
|
|
—
|
|
|
|
—
|
|
|
Patrick de La Chevardière
(a)
|
|
TOTAL shares
|
|
|
—
|
|
|
|
2,833.00
|
|
|
|
102,667.00
|
|
|
|
—
|
|
|
|
115,167.00
|
|
|
|
Shares in FCPE and other related financial instruments
(b)
|
|
|
389.13
|
|
|
|
8,683.15
|
|
|
|
8,085.51
|
|
|
|
—
|
|
|
|
—
|
|
|
Jean-Jacques Guilbaud
(a)
|
|
TOTAL shares
|
|
|
—
|
|
|
|
1,622.00
|
|
|
|
65,167.00
|
|
|
|
—
|
|
|
|
66,767.00
|
|
|
|
Shares in FCPE and other related financial instruments
(b)
|
|
|
181.18
|
|
|
|
1,179.21
|
|
|
|
1,183.04
|
|
|
|
—
|
|
|
|
—
|
|
|
Philippe Sauquet
(a)
|
|
TOTAL shares
|
|
|
—
|
|
|
|
155.00
|
|
|
|
12,500.00
|
|
|
|
—
|
|
|
|
12,500.00
|
|
|
|
|
Shares in FCPE and other related financial instruments
(b)
|
|
|
731.61
|
|
|
|
3,356.28
|
|
|
|
—
|
|
|
|
—
|
|
|
|
—
|
|
|
Marie-Christine Coisne-Roquette
(a)
|
|
TOTAL shares
|
|
|
—
|
|
|
|
—
|
|
|
|
—
|
|
|
|
—
|
|
|
|
—
|
|
|
|
Shares in FCPE and other related financial instruments
(b)
|
|
|
—
|
|
|
|
112.00
|
|
|
|
—
|
|
|
|
—
|
|
|
|
—
|
|
|
Charles Keller
(a)
|
|
TOTAL shares
|
|
|
29.87
|
|
|
|
450.00
|
|
|
|
—
|
|
|
|
—
|
|
|
|
—
|
|
|
|
|
Shares in FCPE and other related financial instruments
(b)
|
|
|
—
|
|
|
|
—
|
|
|
|
—
|
|
|
|
—
|
|
|
|
—
|
|
|
Gérard Lamarche
(a)
|
|
TOTAL shares
|
|
|
—
|
|
|
|
61.00
|
|
|
|
—
|
|
|
|
—
|
|
|
|
—
|
|
|
|
|
Shares in FCPE and other related financial instruments
(b)
|
|
|
—
|
|
|
|
—
|
|
|
|
—
|
|
|
|
—
|
|
|
|
—
|
|
|
(a)
|
Including related parties within the meaning of the provisions of Article R. 621-43-1 of the French Monetary and Financial Code.
|
|
(b)
|
Collective investment fund (FCPE) primarily invested in TOTAL shares.
|
|
(1)
|
The individuals referred to in paragraph b) of Article L. 621-18-2 of the French Monetary and Financial Code include the members of the Executive Committee.
|
|
|
|
|
|
2015 Form 20-F TOTAL S.A.
|
|
127
|
Item 7 - Major Shareholders and Related Party Transactions
ITEM 7. MAJOR SHAREHOLDERS AND RELATED PARTY TRANSACTIONS
|
1.1.
|
Changes in major shareholders’ holdings
|
TOTAL’s major shareholders
(1)
as of December 31, 2015, 2014 and 2013 were as follows:
|
|
|
|
|
|
|
|
|
|
|
|
|
|
|
|
|
|
|
|
|
|
|
|
|
|
|
|
|
|
|
|
|
2015
|
|
|
2014
|
|
|
2013
|
|
|
As of
December 31
|
|
% of
share
capital
|
|
|
% of
voting
rights
|
|
|
%
of
theoretical
voting
rights
(a)
|
|
|
% of
share
capital
|
|
|
% of
voting
rights
|
|
|
% of
share
capital
|
|
|
% of
voting
rights
|
|
|
BlackRock,
Inc.
(b)
|
|
|
5.5
|
|
|
|
5.0
|
|
|
|
4.6
|
|
|
|
6.2
|
|
|
|
5.4
|
|
|
|
NC
|
(c)
|
|
|
NC
|
(c)
|
|
Group
employees
(d)
|
|
|
4.9
|
|
|
|
9.0
|
|
|
|
8.3
|
|
|
|
4.6
|
|
|
|
8.8
|
|
|
|
4.7
|
|
|
|
8.6
|
|
|
GBL-LOVERAL Finance (ex CNP) in concert
|
|
|
3.3
|
|
|
|
3.3
|
|
|
|
3.1
|
|
|
|
3.9
|
|
|
|
3.9
|
|
|
|
4.8
|
|
|
|
4.8
|
|
|
of which Groupe Bruxelles Lambert
(e)
|
|
|
2.5
|
|
|
|
2.4
|
|
|
|
2.2
|
|
|
|
3.0
|
|
|
|
3.0
|
|
|
|
3.6
|
|
|
|
3.6
|
|
|
of which GBL-LOVERVAL Finance (ex CNP)
(e)
|
|
|
0.9
|
|
|
|
0.9
|
|
|
|
0.8
|
|
|
|
0.9
|
|
|
|
0.9
|
|
|
|
1.2
|
|
|
|
1.2
|
|
|
Treasury shares
|
|
|
4.7
|
|
|
|
—
|
|
|
|
8.0
|
|
|
|
4.6
|
|
|
|
—
|
|
|
|
4.6
|
|
|
|
—
|
|
|
of which TOTAL S.A.
|
|
|
0.6
|
|
|
|
—
|
|
|
|
0.5
|
|
|
|
0.4
|
|
|
|
—
|
|
|
|
0.4
|
|
|
|
—
|
|
|
of which Total Nucléaire
|
|
|
0.1
|
|
|
|
—
|
|
|
|
0.2
|
|
|
|
0.1
|
|
|
|
—
|
|
|
|
0.1
|
|
|
|
—
|
|
|
of which subsidiaries of Elf Aquitaine
(f)
|
|
|
4.0
|
|
|
|
—
|
|
|
|
7.4
|
|
|
|
4.1
|
|
|
|
—
|
|
|
|
4.1
|
|
|
|
—
|
|
|
Other shareholders
(g)
|
|
|
81.6
|
|
|
|
82.7
|
|
|
|
76.0
|
|
|
|
80.7
|
|
|
|
81.9
|
|
|
|
85.9
|
|
|
|
86.6
|
|
|
of which holders of
ADRs
(h)
|
|
|
7.2
|
|
|
|
7.2
|
|
|
|
6.6
|
|
|
|
8.5
|
|
|
|
8.4
|
|
|
|
9.3
|
|
|
|
9.2
|
|
|
(a)
|
Pursuant to Article 223-11 of the AMF General Regulation, the number of theoretical voting rights is calculated on the basis of all outstanding shares to
which voting rights are attached, including treasury shares that are deprived of voting rights.
|
|
(b)
|
Information sourced from the form Schedule 13G filed by BlackRock, Inc. (“BlackRock”) with the SEC on February 10, 2016, pursuant to which
BlackRock declared beneficial ownership of 135,167,376 Company shares as of December 31, 2015 (i.e., 5.5% of the Company’s share capital). BlackRock specified that it had dispositive power of these shares as well as 124,058,361 voting
rights (i.e., 5.0% of the Company’s share capital). Furthermore, BlackRock declared not having any shared voting or dispositive powers over these shares.
|
|
(d)
|
Based on the definition of employee shareholding pursuant to Article L. 225-102 of the French Commercial Code. The Amundi Group, the holding company for
Amundi Asset Management, which is the manager of the employee collective investment fund TOTAL ACTIONNARIAT FRANCE (see below), filed a Schedule 13G with the SEC on February 9, 2016, declaring beneficial ownership of 183,753,375 Company shares
as of December 31, 2015 (i.e., 7.5% of the Company’s share capital). The Amundi Group specified that it did not have sole voting or dispositive power over any of these shares and that it had shared voting power over 66,187,570 of these
shares (i.e., 2.7% of the Company’s share capital) and shared dispositive power over all of these shares. Moreover, the employee representatives serve on the Board of Directors of TOTAL S.A.
|
|
(e)
|
Groupe Bruxelles Lambert is a company controlled jointly by the Desmarais family and Frère-Bourgeois S.A., and for the latter mainly through its direct
and indirect interest in LOVERVAL Finance (ex Compagnie Nationale à Portefeuille). In addition, Groupe Bruxelles Lambert and LOVERVAL Finance have declared that they act in concert. Moreover, these companies have executive directors who serve
on the Board of Directors of TOTAL S.A. Furthermore, on February 16, 2016, GBL announced the sale of 0.7% of the share capital of TOTAL.
|
|
(f)
|
Fingestval, Financière Valorgest and Sogapar.
|
|
(g)
|
Of which 1.49% held by registered shareholders (non-Group) in 2015.
|
|
(h)
|
Including all American Depositary Shares represented by American Depositary Receipts listed on the New York Stock Exchange.
|
As of December 31, 2015, the holdings of the major shareholders were calculated based on
2,440,057,883 shares, representing 2,460,619,275 voting rights exercisable at Shareholders’ Meetings, or 2,674,918,301 theoretical voting rights
(2)
including:
|
•
|
|
13,636,490 voting rights attached to the 13,636,490 TOTAL shares held by TOTAL S.A. that are deprived of voting rights; and
|
|
•
|
|
200,662,536 voting rights attached to the 100,331,268 TOTAL shares held by TOTAL S.A. subsidiaries that cannot be exercised at Shareholders’ Meetings.
|
For prior years, the holdings of the major shareholders were calculated on the basis of 2,385,267,525 shares to which 2,406,809,364
voting rights exercisable at Shareholders’ Meetings were attached as of December 31, 2014, and 2 377,678,160 shares to which 2,391,533,246 voting rights exercisable at Shareholders’ Meetings were attached as of December 31, 2013.
|
1.2.
|
Holdings above the legal thresholds
|
In accordance with
Article L. 233-13 of the French Commercial Code, to TOTAL’s knowledge, two known shareholders hold 5% or more of TOTAL’s share capital or voting rights at year-end 2015.
As of December 31, 2015, the TOTAL ACTIONNARIAT FRANCE collective investment fund held 3.46% of the share capital representing 6.66% of the voting rights exercisable at Shareholders’ Meetings and 6.12% of
the theoretical voting rights.
As of December 31, 2015, BlackRock held 5.54% of the share capital representing 5.04% of the voting rights
exercisable at Shareholders’ Meetings and 4.64% of the theoretical voting rights.
|
(1)
|
Major shareholders are defined herein as shareholders whose interest (in the share capital or voting rights) exceeds 5%.
|
|
(2)
|
Pursuant to Article 223-11 of the AMF General Regulation, the number of theoretical
voting rights is calculated on the basis of all outstanding shares to which voting rights are attached, including treasury shares that are deprived of voting rights.
|
|
|
|
|
|
128
|
|
TOTAL S.A. Form 20-F 2015
|
Item 7 - Major Shareholders and Related Party Transactions
|
1.3.
|
Legal threshold notifications in 2015
|
In AMF notice
No. 215C0524 dated April 24, 2015, BlackRock, Inc. stated that, as of April 22, 2015, they had fallen below the 5% share capital threshold and that they held 119,087,683 TOTAL shares representing as many voting rights,
i.e.
, 4.99%
of the share capital and 4.95% of the theoretical voting rights (based on share capital of 2,385,555,871 shares representing 2,406,776,372 voting rights).
In AMF notice No. 215C0941 dated June 30, 2015, BlackRock, Inc. stated that, as of June 26, 2015, they had risen above the 5% share capital threshold
and that they held 119,829,183 TOTAL shares representing as many voting rights,
i.e.
, 5.0005% of the share capital and 4.56% of the theoretical voting rights (based on share capital of 2,396,322,481 shares representing 2,627,688,781 voting
rights).
In AMF notice No. 215C0971 dated July 3, 2015, BlackRock, Inc. stated that, as of June 29, 2015, they had fallen below the 5%
share capital threshold and that they held 119,757,351 TOTAL shares representing as many voting rights,
i.e.
, 4.99% of the share capital and 4.56% of the theoretical voting rights (based on share capital of 2,396,322,481 shares representing
2,627,688,781 voting rights).
In AMF notice No. 215C1371 dated October 5, 2015, BlackRock, Inc. stated that, as of September 30, 2015,
they had risen above the 5% share capital threshold and that they held 120,847,773 TOTAL shares representing as many voting rights,
i.e.
, 5.004% of the share capital and 4.57% of the theoretical voting rights (based on share capital of
2,415,073,561 shares representing 2,646,761,359 voting rights).
In AMF notice No. 215C1395 dated October 9, 2015, BlackRock, Inc. stated that,
as of October 5, 2015, they had fallen below the 5% share capital threshold and that they held 120,602,086 TOTAL shares representing as many voting rights,
i.e.
, 4.99% of the share capital and 4.56% of the theoretical voting rights
(based on share capital of 2,415,073,561 shares representing 2,646,761,359 voting rights).
In AMF notice No. 215C1413 dated October 13, 2015,
BlackRock, Inc. stated that, as of October 7, 2015, they had risen above the 5% share capital threshold and that they held 121,653,868 TOTAL shares representing as many voting rights,
i.e.
, 5.04% of the share capital and 4.60% of the
theoretical voting rights (based on share capital of 2,415,073,561 shares representing 2,646,761,359 voting rights).
|
1.4.
|
Threshold notifications
|
In addition to the legal obligation
to inform the Company and the French Financial Markets Authority within four trading days of the
date on which the number of shares (or securities similar to shares or voting rights pursuant to Article L. 233-9 of the French Commercial Code) held represents more than 5%, 10%, 15%, 20%, 25%,
30%, one-third, 50%, two-thirds, 90% or 95% of the share capital or theoretical voting rights (Article L. 233-7 of the French Commercial Code), any individual or legal entity who directly or indirectly comes to hold a percentage of the share
capital, voting rights or rights giving future access to the Company’s share capital that is equal to or greater than 1%, or a multiple of this percentage, is required to notify the Company, within 15 days of the date on which each of the above
thresholds is exceeded, by registered mail with return receipt requested, and indicate the number of shares held.
In case the shares above these
thresholds are not declared, any shares held in excess of the threshold that should have been declared will be deprived of voting rights at Shareholders’ Meetings if, at a Shareholders’ Meeting, the failure to make a declaration is
acknowledged and if one or more shareholders holding collectively at least 3% of the Company’s share capital or voting rights so request at that meeting.
Any individual or legal entity is also required to notify the Company in due form and within the time limits stated above when their direct or indirect holdings fall below each of the aforementioned thresholds.
Notifications must be sent to the Senior Vice President of Investor Relations in London.
|
1.5.
|
Temporary transfer of securities
|
Pursuant to legal
provisions, any legal entity or individual (with the exception of those described in paragraph IV-3 of Article L. 233-7 of the French Commercial Code) holding alone or in concert a number of shares representing more than 0.5% of the
Company’s voting rights pursuant to one or more temporary transfers or similar operations as described in Article L. 225-126 of the aforementioned Code is required to notify the Company and the French Financial Markets Authority of the number
of shares temporarily owned no later than the second business day preceding the Shareholders’ Meeting at midnight.
Notifications must be e-mailed
to the Company at the following address: holding.df-declarationdeparticipation@total.com.
If no notification is sent, any shares acquired under any of
the above temporary transfer operations will be deprived of voting rights at the relevant Shareholders’ Meeting and at any Shareholders’ Meeting that may be held until such shares are transferred again or returned.
|
1.6.
|
Shareholders’ agreements
|
TOTAL is not aware of any
agreements among its shareholders.
|
|
|
|
|
2015 Form 20-F TOTAL S.A.
|
|
129
|
Item 7 - Major Shareholders and Related Party Transactions
|
1.7.
|
Shareholding structure
|
Estimates below are as of
December 31, 2015, excluding treasury shares, based on the survey of identifiable holders of bearer shares conducted on that date.
The number of French individual TOTAL shareholders is estimated at approximately 450,000.
TOTAL shares held by the Company or its subsidiaries
|
|
|
|
|
|
|
As of December 31, 2015
|
|
|
|
|
Percentage of share capital held by TOTAL S.A.
|
|
|
0.56%
|
|
|
Number of shares held in portfolio
|
|
|
13,636,490
|
|
|
Book value of portfolio (at purchase price) (M
€
)
|
|
|
609
|
|
|
Market value of portfolio
(M
€
)
(a)
|
|
|
563
|
|
|
Percentage of capital held by companies
(b)
of the
Group
|
|
|
4.67%
|
|
|
Number of shares held in portfolio
|
|
|
113,967,758
|
|
|
Book value of portfolio (at purchase price) (M
€
)
|
|
|
3,635
|
|
|
Market value of portfolio (M
€
)
(a)
|
|
|
4,703
|
|
|
(a)
|
Based on a market price of
€
41.265 per share as of December 31, 2015.
|
|
(b)
|
TOTAL S.A., Total Nucléaire, Financière Valorgest, Sogapar and Fingestval.
|
See also “Item 10 — 1.6.2. Board’s report on share buybacks and sales”, below.
|
3.
|
Related party transactions
|
The Group’s main transactions with related parties (principally all the investments carried under the equity
method) and the balances receivable from and payable to them are shown in Note 24 to the Consolidated Financial Statements.
In the ordinary course of its business, TOTAL enters into transactions with various organizations with which certain
of its directors or executive officers may be associated, but no such transactions of a material or unusual nature have been entered into during the period commencing on January 1, 2013, and ending on March 16, 2016.
|
|
|
|
|
130
|
|
TOTAL S.A. Form 20-F 2015
|
Item 8 - Financial Information
ITEM 8. FINANCIAL INFORMATION
|
1.
|
Consolidated Statements and other supplemental information
|
See pages F-1 through F-96 for TOTAL’s
Consolidated Financial Statements and Notes thereto and pages S-1 through S-30 for other supplemental information.
|
2.1.1.
|
Dividend payment policy
|
The Company has paid dividends on its share capital in each year since 1946. Future dividends will depend on the
Company’s earnings, financial condition and other factors. The payment and amount of dividends are subject to the recommendation of the Board of Directors and resolution by the Company’s shareholders at the annual Shareholders’
Meeting.
On October 28, 2010, TOTAL S.A.’s Board of Directors adopted a policy based on quarterly dividend payments starting in fiscal year
2011.
|
2.1.2.
|
Fiscal years 2015 and 2016 dividends
|
TOTAL has paid the following quarterly interim dividends with respect to fiscal year 2015:
|
•
|
|
the first quarterly interim dividend for the fiscal year 2015 of
€
0.61 per share, decided by the Board of Directors on September 22, 2015, was paid in cash or in shares on October 21, 2015 (the ex-dividend date was September 28, 2015). The number of
shares issued in lieu of the cash dividend was based on the dividend amount divided by
€
35.63 per share, equal to 90% of the average
Euronext Paris opening price of the shares for the 20 trading days preceding the Board of Directors meeting, reduced by the amount of the first interim dividend; and
|
|
•
|
|
the second quarterly interim dividend for the fiscal year 2015 of
€
0.61 per share, decided by the Board of Directors on December 16, 2015, was paid in cash or in shares on January 14, 2016 (the ex-dividend date was December 21, 2015). The number of
shares issued in lieu of the cash dividend was based on the dividend amount divided by
€
39.77 per share, equal to 90% of the average
Euronext Paris opening price of the shares for the 20 trading days preceding the Board of Directors meeting, reduced by the amount of the second interim dividend.
|
The third quarterly interim dividend of
€
0.61 per share for fiscal year 2015, approved by the
Board of Directors on March 15, 2016, will be paid in cash or in shares on April 12, 2016 (the ex-dividend date will be March 21, 2016).
After closing the 2015 accounts, the Board of Directors decided on February 10, 2016, to propose to the Annual Shareholders’ Meeting on May 24, 2016
an annual dividend of
€
2.44 per share for fiscal year 2015. Taking into account the interim dividends for the first three quarters of
2015 decided by the Board of Directors, the remaining 2015 dividend is
€
0.61 per share, equal to the three 2015 interim dividends.
The Board of Directors also decided to propose to the shareholders the option of receiving the remaining 2015 dividend
payment in new shares benefiting from a discount of 10%
(1)
. Pending the approval at the Annual Shareholders’
Meeting, the
ex-dividend
date would be June 6, 2016, and the payment date for the cash dividend or the delivery of the new shares, depending on the election of the shareholder, would be set for
June 23, 2016.
Subject to the applicable legislative and regulatory provisions, and pending the approval by the Board of Directors and the
shareholders at the Shareholders’ Meeting for the accounts and the remaining dividend, the ex-date calendar for the interim quarterly dividends and the final dividend for fiscal year 2016 is expected to be as follows:
|
•
|
|
1
st
interim dividend: September 27, 2016;
|
|
•
|
|
2
nd
interim dividend: December 21, 2016;
|
|
•
|
|
3
rd
interim dividend: March 20, 2017; and
|
|
•
|
|
remaining dividend: June 5, 2017.
|
The
provisional ex-dividend dates above relate to the TOTAL shares traded on Euronext Paris.
Dividends in euros per share for the last five fiscal years are
presented below:
BNP Paribas Securities Services manages the
payment of the dividend, which is made through financial intermediaries using the Euroclear France direct payment system.
JP Morgan Chase Bank (4 New
York Plaza, New York, NY 10005-1401, USA) manages the payment of dividends to holders of American Depositary Receipts (ADRs).
Dividends paid to holders
of ADRs will be subject to a charge by the Depositary for any expenses incurred by the Depositary in the conversion of euros to dollars. See “Item 10 — 5. Taxation”, for a summary of certain U.S. federal and French tax
consequences to holders of shares and ADRs.
|
2.2.1.
|
Dividend payment of stock certificates
|
TOTAL issued stock certificates (
certificats représentatifs d’actions
, CRs) as part of the public exchange offer for Total
Petrochemicals & Refining SA/NV (formerly PetroFina) shares.
The CR is a stock certificate provided for by French rules, issued by Euroclear
France, intended to circulate exclusively outside of France, and which may not be held by French residents. The CR is freely convertible from a physical certificate into a security
|
(1
)
|
The issuance price of each new share will be equal to 90% of the average opening price of TOTAL S.A.’s shares on Euronext Paris over the 20 trading days
preceding the Annual Shareholders’ Meeting, reduced by the amount of the remaining dividend, and rounded up to the nearest euro centime.
|
|
(2
)
|
Pending approval at the May 24, 2016 Shareholders’ Meeting. Dividends are eligible for the 40% rebate applicable to individuals residing in France
for tax purposes, as stipulated in Article 158 of the French General Tax Code.
|
|
|
|
|
|
2015 Form 20-F TOTAL S.A.
|
|
131
|
Item 8 - Financial Information
registered on a custody account and vice-versa. However, in compliance with the Belgian law of December 14, 2005
on the dematerialization of securities in Belgium, CRs may only be delivered in the form of a dematerialized certificate as of January 1, 2008. In addition, ING Belgique is the bank handling the payment of all coupons detached from outstanding
CRs.
No fees are applicable to the payment of coupons detached from CRs, except for any income or withholding taxes; the
payment may be received on request at the following bank branches:
|
•
|
|
ING Belgique – Avenue Marnix 24, 1000 Brussels, Belgium
|
|
•
|
|
BNP Paribas Fortis – Avenue Marnix 24, 1000 Brussels, Belgium
|
|
•
|
|
KBC BANK N.V. – Avenue du Port 2, 1080 Brussels, Belgium
|
|
3.
|
Significant changes since the date of the Company’s Consolidated Financial Statements
|
For a description of other significant changes that have occurred since the date of the Company’s Consolidated
Financial Statements, see “Item 4 — B. Business Overview” and “Item 5.
Operating and Financial Review and Prospects”, which include descriptions of certain recent 2016 activities.
|
4.
|
Legal or arbitration proceedings
|
There are no governmental, legal or arbitration proceedings, including any proceeding of which the Company is aware
that are pending or threatened against the Company, that could have, or could have had during the last 12 months, a material impact on the Group’s financial situation or profitability.
Described below are the main administrative, legal and arbitration proceedings in which the Company and the other entities of the Group are involved.
In the Marketing & Services
segment, a civil proceeding was initiated in Italy, in 2013, against TOTAL S.A. and its subsidiary Total Aviazione Italia Srl before the competent Italian civil court. The plaintiff claims against TOTAL S.A., its subsidiary and other third parties,
damages that it estimates to be nearly
€
908 million. This proceeding follows practices that had been condemned by the Italian competition
authority in 2006. The parties have exchanged preliminary findings. The existence and the assessment of the alleged damages in this procedure involving multiple defendants remain contested.
|
–
|
Blue Rapid and the Russian Olympic Committee – Russian regions and Interneft
|
Blue Rapid, a Panamanian company, and the Russian Olympic Committee filed a claim for damages with the Paris Commercial Court against Elf Aquitaine, alleging a so-called non-completion by a former subsidiary of Elf
Aquitaine of a contract related to an exploration and production project in Russia negotiated in the early 1990s. Elf Aquitaine believed this claim to be unfounded and opposed it. On January 12, 2009, the Commercial Court of Paris rejected Blue
Rapid’s claim against Elf Aquitaine and found that the Russian Olympic Committee did not have standing in the matter. On June 30, 2011, the Court of Appeal of Paris dismissed as inadmissible the claim of Blue Rapid and the Russian Olympic
Committee against Elf Aquitaine, notably on the grounds of the contract having lapsed. The judgment of the Court of Appeals of Paris is now final and binding following two decisions issued on February 18, 2016 by the French Supreme Court to put
an end to this proceeding.
In connection with the same facts, and 15 years after the aforementioned exploration and production contract was rendered
null and void (“
caduc
”), a Russian company, which was held not to be the contracting party to the contract, and two regions of the Russian Federation that were not even parties to the contract, launched an arbitration procedure
against the aforementioned former subsidiary of Elf Aquitaine that was liquidated in 2005, claiming alleged damages of $22.4 billion. For the same reasons as those successfully adjudicated by Elf Aquitaine against Blue Rapid and the Russian Olympic
Committee, the Group considers this claim to be unfounded as a matter of law and fact.
The Group has lodged a criminal complaint to denounce the fraudulent claim of which the Group believes it is a victim
and, has taken and reserved its rights to take all actions and measures to defend its interests.
The Office of Enforcement of the U.S. Federal
Energy Regulatory Commission (FERC) has begun an investigation in connection with the natural gas trading activities of TOTAL Gas & Power North America, Inc, an American subsidiary of the Group. The investigation covers transactions made by
the Group’s subsidiary between June 2009 and June 2012 on the natural gas market. TOTAL Gas & Power North America, Inc received a Notice of Alleged Violations of the FERC on September 21, 2015
The Group’s subsidiary is cooperating in the investigation with the U.S. authorities, while contesting the claims brought against it.
On September 21, 2001, an
explosion occurred at the industrial site of Grande Paroisse (a former subsidiary of Atofina which became a subsidiary of Elf Aquitaine Fertilisants on December 31, 2004), in a stockpile of ammonium nitrate pellets. The explosion caused the
death of thirty-one people, including twenty-one workers at the site, injured many others and caused significant damage on the site and to property in the city of Toulouse.
Grande Paroisse donated the former site of the plant to the greater agglomeration of Toulouse. A
€
10 million endowment was also granted to the InNaBioSanté research foundation as part of the setting up of a cancer research
center at the site.
After many years, the investigating magistrate brought charges against Grande Paroisse and the former Plant Manager before the
Toulouse Criminal Court. TOTAL S.A. and the CEO at the time of the event were summoned to appear in Court pursuant to a request by a victims association.
On November 19, 2009, the Toulouse Criminal Court acquitted both the former Plant Manager and Grande Paroisse due to the lack of reliable evidence for the
explosion. The Court declared Grande Paroisse civilly liable for the damages caused by the explosion to the victims in its capacity as custodian and operator of the plant. The Court also ruled that the summonses were inadmissible.
On September 24, 2012, the Court of Appeal convicted the former Plant Manager and Grande Paroisse. The summonses were determined to be inadmissible.
On January 13, 2015, the French Supreme Court (
Cour de cassation
) fully quashed the decision of September 24, 2012. The French Supreme
Court ruled that the Court of Appeal impartiality
|
|
|
|
|
132
|
|
TOTAL S.A. Form 20-F 2015
|
Item 8 - Financial Information
was questionable and that the application of the law on which the conviction was partially based was improper. The
case has been referred back to the Court of Appeal of Paris for a new criminal trial that could be held in early 2017.
A compensation mechanism for
victims was set up immediately following the explosion.
€
2.3 billion was paid for the compensation of claims and related expenses amounts.
A
€
7.3 million reserve remains booked in the Group’s Consolidated Financial Statements as of December 31, 2015.
In 2003, the Securities and Exchange Commission
(SEC) followed by the Department of Justice (DoJ) issued a formal order directing an investigation against TOTAL, and others oil companies, for alleged violations of the Foreign Corrupt Practices Act (FCPA) and the Company’s accounting
obligations in connection with the pursuit of business in Iran in the 1990s.
In late May 2013, and after several years of discussions, TOTAL reached
settlements with the U.S. authorities (a Deferred Prosecution Agreement with the DoJ and a Cease and Desist Order with the SEC). These settlements, which put an end to these investigations, were concluded without admission of guilt and in exchange
for TOTAL respecting a number of obligations, including the payment of a fine and civil compensation for an aggregate amount of $398.2 million. By virtue of these settlements, TOTAL also accepted the appointment of a French independent
compliance monitor to review the Group’s compliance program and to recommend possible improvements. For more information, refer to “Item 4 – E. Other Matters – 4.3.7.1. Preventing corruption” and “Item 15 – 4.3.1.
Monitoring of risk management systems – Ethical misconduct and non–compliance risks”.
With respect to the same facts, TOTAL was placed
under formal investigation in France in 2012. In October 2014, the investigating magistrate decided to refer the case to trial.
As part of an investigation led by the Public
Prosecutor of the Potenza Court in 2007, Total Italia and certain Group employees were the subjects of an investigation related to alleged irregularities in connection with the purchase of lands and the award of calls for tenders in relation to the
preparation and development of an oil field located in the south of Italy.
In May 2012, the Judge of the preliminary hearing decided to send Total
Italia and several employees for trial before the criminal court of Potenza. The trial started in September 2012 and is still ongoing. The judgment of the Court of Potenza is expected during the second quarter of 2016.
Several countries have launched
investigations concerning possible violations of the UN resolutions relating to the Iraqi Oil-for-Food Program implemented as from 1996.
Pursuant to a
French criminal investigation, certain current or former Group employees were placed under formal criminal investigation for possible charges as aiding and abetting the misappropriation of corporate assets and/or as aiding and abetting the
corruption of foreign public agents. In 2010, TOTAL S.A. was indicted on bribery charges as well as aiding and abetting and concealing the influence peddling.
On July 8, 2013, TOTAL S.A. and the persons who were prosecuted were cleared of all charges by the Paris Criminal Court, which found that none of the offenses for which they had been prosecuted was established. The
Prosecutor’s office appealed the parts of the Criminal Court’s decision acquitting TOTAL S.A. for corruption of foreign public agents. On February 26, 2016, the Court of Appeal of Paris overturned the Criminal Court’s decision and
TOTAL S.A. was convicted and ordered to pay a fine of
€
750,000. The Company has decided to appeal this decision before, the French Supreme
Court (
Cour de cassation
).
|
|
|
|
|
2015 Form 20-F TOTAL S.A.
|
|
133
|
Item 9. The Offer and Listing
ITEM 9. THE OFFER AND LISTING
The principal trading markets for the Company’s shares
are the Euronext Paris exchange in France and the New York Stock Exchange (“NYSE”) in the United States. The shares are also listed on Euronext Brussels and the London Stock Exchange.
|
2.
|
Offer and listing details
|
|
2.1.
|
Trading on Euronext Paris
|
Official trading of listed securities on Euronext Paris, including the shares, is transacted through French
investment service providers that are members of Euronext Paris and takes place continuously on each business day in Paris from 9:00 a.m. to 5:30 p.m. (Paris time), with a fixing of the closing price at 5:35 p.m. Euronext Paris may
suspend or resume trading in a security listed on Euronext Paris if the quoted price of the security exceeds certain price limits defined by the regulations of Euronext Paris.
The markets of Euronext Paris settle and transfer ownership two trading days after a transaction (T+2). Highly liquid shares, including those of the Company, are eligible for deferred settlement (
Service de
Règlement Différé
— SRD). Payment and delivery for shares under the SRD occurs on the last trading day of each month. Use of the SRD service requires payment of a commission.
In France, the shares are included in the principal index published by Euronext Paris (the “CAC 40 Index”). The CAC 40 Index is derived daily by comparing
the total market capitalization of forty
stocks traded on Euronext Paris to the total market capitalization of the stocks that made up the CAC 40 Index on December 31, 1987. Adjustments are made to allow for expansion of the sample
due to new issues. The CAC 40 index indicates trends in the French stock market as a whole and is one of the most widely followed stock price indices in France. In the UK, the shares are listed in both the FTSE Eurotop 100 and FTSEurofirst 300
index. As a result of the creation of Euronext, the shares are included in Euronext 100, the index representing Euronext’s blue chip companies based on market capitalization. The shares are also included in the Dow Jones Stoxx Europe 50 and Dow
Jones Euro Stoxx 50, blue chip indices comprised of the fifty most highly capitalized and most actively traded equities throughout Europe and within the European Monetary Union, respectively. Since June 2000, the shares have been included in the Dow
Jones Global Titans 50 Index which consists of fifty global companies selected based on market capitalization, book value, assets, revenue and earnings.
The table below sets forth, for the periods
indicated, the reported high and low quoted prices in euros for the currently outstanding shares on Euronext Paris.
|
|
|
|
|
|
|
|
|
|
|
Price per share
(
€
)
|
|
High
|
|
|
Low
|
|
|
2011
|
|
|
44.550
|
|
|
|
29.400
|
|
|
2012
|
|
|
42.970
|
|
|
|
33.420
|
|
|
2013
|
|
|
45.670
|
|
|
|
35.175
|
|
|
2014
|
|
|
54.710
|
|
|
|
38.250
|
|
|
First Quarter
|
|
|
48.250
|
|
|
|
41.310
|
|
|
Second Quarter
|
|
|
54.710
|
|
|
|
47.310
|
|
|
Third Quarter
|
|
|
53.650
|
|
|
|
47.145
|
|
|
Fourth Quarter
|
|
|
52.090
|
|
|
|
48.470
|
|
|
2015
|
|
|
50.300
|
|
|
|
36.920
|
|
|
First Quarter
|
|
|
48.600
|
|
|
|
39.345
|
|
|
Second Quarter
|
|
|
50.300
|
|
|
|
43.285
|
|
|
Third Quarter
|
|
|
46.500
|
|
|
|
36.920
|
|
|
September
|
|
|
42.660
|
|
|
|
38.195
|
|
|
Fourth Quarter
|
|
|
47.400
|
|
|
|
40.255
|
|
|
October
|
|
|
46.440
|
|
|
|
40.255
|
|
|
November
|
|
|
47.295
|
|
|
|
43.660
|
|
|
December
|
|
|
47.400
|
|
|
|
40.440
|
|
|
2016 (through February 29)
|
|
|
41.395
|
|
|
|
35.210
|
|
|
January
|
|
|
41.350
|
|
|
|
36.155
|
|
|
February
|
|
|
41.395
|
|
|
|
35.210
|
|
|
|
|
|
|
134
|
|
TOTAL S.A. Form 20-F 2015
|
Items 9 - 10
|
2.2.
|
Trading on the New York Stock Exchange
|
ADSs evidenced by ADRs have been listed on the NYSE since October 25, 1991. JPMORGAN CHASE BANK, N.A. serves as
depositary with respect to the ADSs evidenced by ADRs traded on the NYSE. One ADS corresponds to one TOTAL share. The table
below sets forth, for the periods indicated, the reported high and low prices quoted in dollars for the currently outstanding ADSs evidenced by ADRs on the NYSE.
|
|
|
|
|
|
|
|
|
|
|
Price per ADR ($)
|
|
High
|
|
|
Low
|
|
|
2011
|
|
|
64.44
|
|
|
|
40.00
|
|
|
2012
|
|
|
57.06
|
|
|
|
41.75
|
|
|
2013
|
|
|
62.45
|
|
|
|
45.93
|
|
|
2014
|
|
|
74.220
|
|
|
|
48.433
|
|
|
First Quarter
|
|
|
66.297
|
|
|
|
56.030
|
|
|
Second Quarter
|
|
|
74.220
|
|
|
|
65.460
|
|
|
Third Quarter
|
|
|
73.090
|
|
|
|
62.530
|
|
|
Fourth Quarter
|
|
|
64.016
|
|
|
|
48.433
|
|
|
2015
|
|
|
54.790
|
|
|
|
40.930
|
|
|
First Quarter
|
|
|
55.860
|
|
|
|
46.610
|
|
|
Second Quarter
|
|
|
54.790
|
|
|
|
48.530
|
|
|
Third Quarter
|
|
|
50.870
|
|
|
|
40.930
|
|
|
September
|
|
|
48.410
|
|
|
|
42.736
|
|
|
Fourth Quarter
|
|
|
52.340
|
|
|
|
44.190
|
|
|
October
|
|
|
52.340
|
|
|
|
44.880
|
|
|
November
|
|
|
51.190
|
|
|
|
47.180
|
|
|
December
|
|
|
50.010
|
|
|
|
44.190
|
|
|
2016 (through February 29)
|
|
|
45.420
|
|
|
|
39.050
|
|
|
January
|
|
|
44.560
|
|
|
|
39.050
|
|
|
February
|
|
|
45.420
|
|
|
|
40.080
|
|
ITEM 10. ADDITIONAL INFORMATION
|
1.1.
|
Share capital as of December 31, 2015
|
€
6,100,144,707.50 consisting of 2,440,057,883 fully paid ordinary shares.
|
1.2.
|
Features of the shares
|
There is only one class of shares,
and the par value of each share is
€
2.50. A double voting right is granted under certain conditions
(refer to “— 2.4.1. Double voting rights”, below) to every shareholder. The shares are in bearer or registered form at the shareholder’s discretion. The shares are in
book-entry form and registered in an account.
|
|
|
|
|
2015 Form 20-F TOTAL S.A.
|
|
135
|
Item 10 - 1. Share capital
|
1.3.
|
Authorized share capital not issued as of December 31, 2015
|
Table compiled in accordance with Article L. 225-100 of the French Commercial Code summarizing the use of delegations of authority and powers granted to the Board of Directors with respect to capital increases as
of December 31, 2015:
|
|
|
|
|
|
|
|
|
|
|
|
|
|
|
Type
|
|
|
|
Cap on par value, or
number of shares or
expressed as % of share
capital
|
|
Use in 2015,
par value,
or number
of shares
|
|
Available
balance as
of 12/31/2015,
par value, or
number of
shares
|
|
Date of
delegation of
authority or
authorization
by the
Extraordinary
Shareholders’
Meeting
(ESM)
|
|
Expiry date
and term of
authorization
granted to
the Board of
Directors
|
|
Maximum cap for the issuance of securities granting immediate or future rights to share
capital
|
|
Debt securities representing rights to capital
|
|
€
10 B in securities
|
|
—
|
|
€
10 B
|
|
May 16, 2014 (10
th
, 11
th
and 13
th
resolutions)
|
|
July 16, 2016, 26 months
|
|
|
Nominal share capital
|
|
An overall cap of
€
2.5 B (
i.e.
, a maximum of 1,000 million shares issued
with a pre-emptive subscription right) from which can be deducted:
|
|
10.5 million shares
(a)
|
|
€
2.47 B (
i.e.
, 989.5 million shares)
|
|
May 16, 2014 (10
th
resolution)
|
|
July 16, 2016, 26 months
|
|
|
|
1/
a specific cap of 575 M
€
,
i.e.
, a maximum of 230 million shares
for issuances without pre-emptive subscription rights (with potential use of a greenshoe), including in compensation with securities contributed within the scope of a public exchange offer, provided that they meet the requirements of Article L.
225-148 of the French Commercial Code, from which can be deducted:
|
|
—
|
|
€
575 M
|
|
May 16, 2014 (11
th
and 12
th
resolutions)
|
|
July 16, 2016, 26 months
|
|
|
|
1/a
a sub-cap of 575 M
€
through in-kind
contributions when provisions of Article L. 225-148 of the French Commercial Code are not applicable
|
|
—
|
|
€
575 M
|
|
May 16, 2014 (13
th
resolution)
|
|
July 16, 2016, 26 months
|
|
|
|
2/
a specific cap of 1.5% of the share capital on the date of the
Board
(b)
decision for capital increases reserved for employees participating in a Company savings plan
|
|
10.5 million shares
(c)
|
|
26.1 million shares
|
|
May 16, 2014 (14
th
and 15
th
resolutions)
|
|
July 16, 2016, 26 months
|
|
Stock option grants
|
|
0.75% of share capital
(b)
on the date of the Board decision to grant
options
|
|
—
|
|
18.3 million shares
|
|
May 17, 2013 (11
th
resolution)
|
|
July 17, 2016, 38 months
|
|
Restricted shares awarded to Group Employees and to executive directors
|
|
0.8% of share capital
(b)
on the date of the Board decision to grant the
restricted shares
|
|
4.8 million shares
(d)
|
|
10.3 million shares
(d)
|
|
May 16, 2014 (16
th
resolution)
|
|
July 16, 2017, 38 months
|
|
(a)
|
The number of new shares authorized under the 10th resolution of the ESM held on May 16, 2014 cannot exceed 1,000 million shares. Pursuant to the
14th resolution of the ESM held on May 16, 2014, the Board of Directors decided on July 29, 2014 to proceed with a capital increase reserved for Group employees in 2015 (see note (c) below). As a result, the available
balance under this authorization was 989,520,590 new shares as of December 31, 2015.
|
|
(b)
|
Share capital as of December 31, 2015: 2,440,057,883 shares.
|
|
(c)
|
The number of new shares authorized under the 14
th
and 15
th
resolutions of the May 16, 2014 ESM may not exceed 1.5% of the share capital on the date when the Board of Directors decides to use the delegation. On July 29, 2014,
the Board of Directors decided to proceed with a capital increase in 2015. This led to the issue of 10,479,410 shares. As a result, the available balance under these authorizations was 26,121,458 new shares as of December 31, 2015.
|
|
(d)
|
The number of shares that may be awarded as restricted share grants under the 16th resolution of the May 16, 2014 ESM may not exceed 0.8% of the share
capital on the date when the restricted shares are awarded by the Board of Directors. The Board of Directors awarded 4,486,300 outstanding shares on July 29, 2014, awarded 20,882 new shares on April 27, 2015 as part of the decision to
grant a matching contribution for the capital increase reserved for employees in 2015, and awarded 4,761,935 outstanding shares on July 28, 2015. As a result, the number of shares that could still be awarded as of December 31, 2015 was
10,251,346 shares. In addition, the shares awarded under presence and performance conditions to the Company’s executive directors under the 16th resolution of the ESM held on May 16, 2014, cannot exceed 0.01% of the outstanding share
capital on the date of the decision of the Board of Directors to proceed with the grant. Given the 48,000 outstanding shares awarded under presence and performance conditions to the Chairman and Chief Executive Officer by the Board of Directors on
July 29, 2014, and the 48,000 outstanding shares awarded under performance conditions to the Chief Executive Officer by the Board of Directors on July 28, 2015, the number of outstanding shares that may still be awarded to the
Company’s executive directors is 148,005.
|
|
|
|
|
|
136
|
|
TOTAL S.A. Form 20-F 2015
|
Item 10 - 1. Share capital
|
1.3.1.
|
Authorization to cancel shares of the Company
|
Pursuant to the terms of the 19
th
resolution of the Shareholders’ Meeting held on May 11, 2012, the Board of Directors is
authorized to cancel shares up to a maximum of 10% of the share capital of the Company existing as of the date of the operation within a 24-month period. This authorization is effective until the Shareholders’ Meeting held to approve the
financial statements for the year ending December 31, 2016. The Board has not made use of this authorization since the 2012 Shareholders’ Meeting.
Based on 2,440,057,883 shares outstanding on December 31, 2015, the Company may, up until the conclusion of the Shareholders’ Meeting called to approve the financial statements for the fiscal year ending
on December 31, 2016, cancel a maximum of 244,005,788 shares before reaching the cancellation threshold of 10% of share capital canceled over a 24-month period.
|
1.4.
|
Potential share capital as of December 31, 2015
|
Securities granting rights to TOTAL shares through exercise are TOTAL share subscription options amounting to 9,317,840 as of December 31, 2015, divided into:
|
•
|
|
2,561,502 options awarded on October 9, 2008 under the plan decided by the Board of Directors on September 9, 2008;
|
|
•
|
|
2,710,783 options awarded on September 15, 2009 under the plan decided by the Board of Directors;
|
|
•
|
|
3,323,246 options awarded on September 14, 2010 under the plan decided by the Board of Directors; and
|
|
•
|
|
722,309 options awarded on September 14, 2011 under the plan decided by the Board of Directors.
|
The potential share capital (
i.e.
, the existing share capital plus rights and securities that could result in the issuance of new TOTAL shares through
exercise),
i.e.
, 2,449,375,723 shares, represents 100.38% of the share capital as of December 31, 2015, on the basis of 2,440,057,883 TOTAL shares constituting the share capital as of December 31, 2015, and 9,317,840 TOTAL shares
that could be issued upon the exercise of TOTAL options.
|
1.5.
|
Share capital history since January 1, 2013
|
|
|
|
|
|
For fiscal year 2013
|
|
|
|
April 25, 2013
|
|
Acknowledgement of the issuance of 10,802,215 new shares, par value
€
2.50 per
share, as part of the capital increase reserved for Group employees approved by the Board of Directors on September 18, 2012, raising the share capital by
€
27,005,537.50 from
€
5,914,832,865 to
€
5,941,838,402.50.
|
|
|
|
|
January 8, 2014
|
|
Acknowledgement of the issuance of 942,799 new shares, par value
€
2.50 per
share, through the exercise of stock options between January 1 and December 31, 2013, raising the share capital by
€
2,356,997.50 from
€
5,941,838,402.50 to
€
5,944,195,400.
|
|
|
|
|
For fiscal year 2014
|
|
|
|
|
|
|
July 1, 2014
|
|
Acknowledgement of the issuance of 666,575 new shares, par value
€
2.50 per
share, as part of the global free TOTAL share plan to Group employees decided by the Board of Directors on May 21, 2010, raising the share capital by
€
1,666,437.50 from
€
5,944,195,400 to
€
5,945,861,837.50.
|
|
|
|
|
January 12, 2015
|
|
Acknowledgement of the issuance of 6,922,790 new shares, par value
€
2.50 per
share, through the exercise of stock options between January 1 and December 31, 2014, raising the share capital by
€
17,306,975 from
€
5,945,861,837.50 to
€
5,963,168,812.50.
|
|
|
|
|
For fiscal year 2015
|
|
|
|
|
|
|
April 27, 2015
|
|
Acknowledgement of the issuance of 10,479,410 new shares, par value
€
2.50 per
share, as part of the capital increase reserved for Group employees approved by the Board of Directors on July 29, 2014, raising the share capital by
€
26,198,525 from
€
5,963,168,812.50 to
€
5,989,367,337.50.
|
|
|
|
|
July 1, 2015
|
|
Acknowledgement of the issuance of 18,609,466 new shares, par value
€
2.50 per
share and a share price of
€
42.02 (
i.e
., a par value of
€
2.50 value and issue premium of
€
39.52) for the payment of the 2014 fourth quarter dividend in
shares, raising the share capital by
€
46,523,665 from
€
5,989,367,337.50 to
€
6,035,891,002.50.
|
|
|
|
|
October 21, 2015
|
|
Acknowledgement of the issuance of 24,231,876 new shares, par value
€
2.50 per
share and a share price of
€
35.63 (
i.e
., a par value of
€
2.50 value and issue premium of
€
33.13) for the payment of the first quarterly interim dividend
for fiscal year 2015 in shares, raising the share capital by
€
60,579,690 from
€
6,035,891,002.50 to
€
6,096,470,692.50.
|
|
|
|
|
January 14, 2016
|
|
Acknowledgement of the issuance of 1,469,606 new shares, par value
€
2.50 per
share, through the exercise of stock options between January 1 and December 31, 2015, raising the share capital by
€
3,674,015 from
€
6,096,470,692.50 to
€
6,100,144,707.50.
|
|
|
|
|
|
|
Acknowledgement of the issuance of 13,945,709 new shares, par value
€
2.50 per
share and a share price of
€
39.77 (
i.e
., a par value of
€
2.50 value and issue premium of
€
37.27) for the payment of the second quarterly interim dividend
for fiscal year 2015 in shares, raising the share capital by
€
34,864,272.50 from
€
6,100,144,707.50 to
€
6,135,008,980.
|
|
|
|
|
|
2015 Form 20-F TOTAL S.A.
|
|
137
|
Item 10 - 1. Share capital
The Shareholders’ Meeting of
May 29, 2015, after acknowledging the report of the Board of Directors, authorized the Board of Directors, in accordance with the provisions of Article L. 225-209 of the French Commercial Code and of EC Regulation 2273/2003 of
December 22, 2003, to buy and sell the Company’s shares as part of a share buyback program. The maximum purchase price was set at
€
70 per share. The number of shares acquired may not exceed 10% of the share capital. This authorization was granted for a period of
18 months and replaced the previous authorization granted by the Shareholders’ Meeting of May 16, 2014.
A resolution will be submitted to the
Shareholders’ Meeting on May 24, 2016 to authorize trading in TOTAL shares under a share buyback program carried out in accordance with Article L. 225-209 of the French Commercial Code and European Regulation 2273/2003 of December 22,
2003. The specificities of this program are described in “— 1.6.3. 2015-2016 share buyback program”, below.
|
1.6.1.
|
Share buybacks and cancellations in 2015
|
In 2015, TOTAL S.A. bought back 4,711,935 of its own shares to cover commitments made in connection with performance share grant plans,
i.e.
, 0.20% of the share capital
(1)
.
Percentages of share capital bought back for the last five fiscal years are
presented below:
In addition, TOTAL S.A. did not
cancel any shares in 2015.
|
1.6.2.
|
Board’s report on share buybacks and sales
|
|
1.6.2.1.
|
Share buybacks during 2015
|
Under the authorization
granted by the Shareholders’ Meeting of May 29, 2015, 4,711,935 TOTAL shares, each with a par value of
€
2.50, were bought back
by TOTAL S.A. in 2015,
i.e.
, 0.20% of the share capital as of December 31, 2015. These buybacks were completed at an average price of
€
45.22 per share, for a total cost of approximately
€
213 million, excluding transaction fees. These buybacks are intended to cover the performance share grant plan approved by the Board of Directors on July 28, 2015.
|
1.6.2.2.
|
Shares held in the name of the Company and its subsidiaries as of December 31, 2015
|
As of December 31, 2015, the Company held 13,636,490 treasury shares, representing 0.56% of TOTAL’s share capital, including 13,603,525 shares held to cover the performance share grant plans and 32,965
shares to be awarded under new share purchase option plans or new restricted share grant plans. Pursuant to French law, the voting rights and dividend rights of these shares are suspended.
As of December 31, 2015, the Group’s subsidiaries held 100,331,268 treasury shares, representing 4.11% of TOTAL’s share capital. Pursuant to French law, the shares are entitled to a dividend but
deprived of voting rights
The total number of TOTAL shares held by the Group as of December 31, 2015 was 113,967,758, representing 4.67%
of TOTAL’s share capital.
For shares bought back to be allocated to Company or Group employees pursuant to the objectives referred to in Article 3
of EC Regulation 2273/2003 of December 22, 2003, note that, when such shares are held to cover share purchase option plans that have expired or performance share grants that have not been awarded at the end of the vesting period, they will be
allocated to new TOTAL share purchase option plans or restricted share grant plans that may be approved by the Board of Directors.
|
1.6.2.3.
|
Transfer of shares during fiscal year 2015
|
105,590
TOTAL shares were transferred in 2015 following the final award of TOTAL shares under the restricted share grant plans.
|
1.6.2.4
|
Cancellation of Company shares during fiscal years 2012, 2013, 2014 and 2015
|
TOTAL S.A. did not cancel any shares in 2012, 2013, 2014 and 2015.
The Shareholders’ Meeting of May 11,
2012 authorized the Board of Directors to reduce the share capital on one or more occasions by canceling shares held by the Company up to a maximum of 10% of the share capital over a 24-month period. As a result, based on 2,440,057,883 shares
outstanding on December 31, 2015, the Company may cancel a maximum of 244,005,788 shares before reaching the cancellation threshold of 10% of share capital canceled over a 24-month period.
|
1.6.2.5.
|
Reallocation for other approved purposes during fiscal year 2015
|
Shares purchased by the Company under the authorization granted by the Shareholders’ Meeting of May 29, 2015, or under previous authorizations, were not reallocated in 2015 to purposes other than those
initially specified at the time of purchase.
|
1.6.2.6.
|
Conditions for the buyback and use of derivative products
|
Between January 1, 2015 and February 29, 2016, the Company did not use any derivative products on the financial markets as part of the share buyback programs successively authorized by the
Shareholders’ Meetings of May 16, 2014 and May 29, 2015.
|
1.6.2.7.
|
Shares held in the name of the Company and its subsidiaries as of February 29, 2016
|
As of February 29, 2016, the Company held 13,636,210 shares, representing 0.56% of TOTAL’s share capital. Pursuant to French law, the voting rights and dividend rights of these shares are suspended.
After taking into account the shares held by Group subsidiaries, which are entitled to a dividend but deprived of voting rights, the total number of
TOTAL shares held by the Group as of February 29, 2016 was 113,967,478, representing 4.64% of TOTAL’s share capital, comprised of, on the one hand, 13,636,210 treasury shares, including 13,603,245 shares held to cover the performance share
grant plans and 32,965 shares to be awarded under new share purchase option plans or new restricted share grant plans and, on the other hand, 100,331,268 shares held by subsidiaries.
|
(1
)
|
Average share capital of year N = (share capital at December 31 N-1 + share capital at December 31 N)/2.
|
|
|
|
|
|
138
|
|
TOTAL S.A. Form 20-F 2015
|
Item 10 - 1. Share capital
Summary table of transactions completed by the Company involving its own shares from March 1, 2015 to
February 29, 2016
(1)
:
|
|
|
|
|
|
|
|
|
|
|
|
|
|
|
|
|
|
|
|
|
|
|
|
|
|
|
|
|
Cumulative gross movements
|
|
|
Open positions as of February 29, 2016
|
|
|
|
|
Purchases
|
|
|
Sales
|
|
|
Open purchase
positions
|
|
|
Open sales
positions
|
|
|
Number of shares
|
|
|
4,711,935
|
|
|
|
—
|
|
|
|
Bought calls
|
|
|
|
Purchases
|
|
|
|
Sold calls
|
|
|
|
Sales
|
|
|
Maximum average maturity
|
|
|
—
|
|
|
|
—
|
|
|
|
—
|
|
|
|
—
|
|
|
|
—
|
|
|
|
—
|
|
|
Average transaction price
(
€
)
|
|
|
45.22
|
|
|
|
—
|
|
|
|
—
|
|
|
|
—
|
|
|
|
—
|
|
|
|
—
|
|
|
Average exercise price
|
|
|
—
|
|
|
|
—
|
|
|
|
—
|
|
|
|
—
|
|
|
|
—
|
|
|
|
—
|
|
|
Amounts (
€
)
|
|
|
213,073,104
|
|
|
|
—
|
|
|
|
—
|
|
|
|
—
|
|
|
|
—
|
|
|
|
—
|
|
Moreover, following the final award of shares under the performance share grant plans, 3,310 TOTAL shares were transferred between
March 1, 2015 and February 29, 2016.
|
|
|
|
|
|
|
As of February 29, 2016
|
|
|
|
|
|
Percentage of share capital held by TOTAL S.A.
|
|
|
0.56%
|
|
|
Number of shares held in portfolio
(a)
|
|
|
13,636,210
|
|
|
Book value of portfolio (at purchase price) (M
€
)
|
|
|
609
|
|
|
Market value of the portfolio (M
€
)
(b)
|
|
|
564
|
|
|
Percentage of capital held by companies
(c)
of the Group
|
|
|
4.64%
|
|
|
Number of shares held in portfolio
|
|
|
113,967,478
|
|
|
Book value of portfolio (at purchase price) (M
€
)
|
|
|
3,635
|
|
|
Market value of the portfolio (M
€
)
(b)
|
|
|
4,715
|
|
|
(a)
|
TOTAL S.A. did not buy back any shares during the two trading days preceding February 29, 2016. As a result, TOTAL S.A. owns all the shares held in
portfolio as of that date.
|
|
(b)
|
Based on a closing price of
€
41.375 per share as of February 29, 2016.
|
|
(c)
|
TOTAL S.A., Total Nucléaire, Financière Valorgest, Sogapar and Fingestval.
|
|
1.6.3.
|
2015-2016 share buyback program
|
|
1.6.3.1.
|
Description of the share buyback program under Article 241-1 et seq. of the General Regulation of the French Financial Markets Authority
|
The objectives of the share buyback program are as follows:
|
•
|
|
reduce the Company’s capital through the cancellation of shares;
|
|
•
|
|
honor the Company’s obligations related to securities convertible or exchangeable into Company shares;
|
|
•
|
|
honor the Company’s obligations related to stock option programs or other share grants to the Company’s executive directors or to employees of the
Company or a Group subsidiary;
|
|
•
|
|
deliver shares (by exchange, payment or otherwise) in connection with external growth operations; and
|
|
•
|
|
stimulate the secondary market or the liquidity of the TOTAL share under a liquidity agreement.
|
Implementation
of this share buyback program, which is covered by Article L. 225-209 et seq. of the French Commercial Code, Article 241-1 et seq. of the General Regulation of the French Financial Markets Authority (Autorité des marchés financiers
— AMF), and the provisions of EC Regulation 2273/2003 of December 22, 2003, is subject to approval by the TOTAL S.A. Shareholders’ Meeting of May 24, 2016 through the 5
th
resolution that reads as follows:
“Upon presentation of the report by the
Board of Directors and information appearing in the description of the program prepared pursuant to Articles 241-1 and thereafter of the General Regulation (Règlement général) of the French Financial Markets Authority
(Autorité des marchés financiers, AMF), and voting under the conditions of quorum and majority required for Ordinary General Meetings, the shareholders hereby authorize the Board of Directors, with the possibility to sub-delegate such
authority under the terms provided for by French law, pursuant to the provisions of Article L. 225-209 of the French Commercial Code, of Council Regulation No. 2273/2003 dated December 22, 2003 and of the General Regulation of the AMF, to
buy or sell shares of the Company within the framework of a share buyback program.
The purchase, sale or transfer of such shares may be transacted by any means on regulated markets, multilateral
trading facilities or over the counter, including the purchase or sale by block-trades, in accordance with the regulations of the relevant market authorities. Such transactions may include the use of any financial derivative instrument traded on
regulated markets, multilateral trading facilities or over the counter, and implementing option strategies.
These transactions may be carried out at any
time, in accordance with the applicable rules and regulations, except during any public offering periods applying to the Company’s share capital.
The maximum purchase price is set at
€
70 per
share.
In the case of a capital increase by incorporation of reserves or share grants for no consideration and in the case of a stock-split or a
reverse-stock-split, this maximum price shall be adjusted by applying the ratio of the number of shares outstanding before the transaction to the number of shares outstanding after the transaction.
Pursuant to the provisions of Article L. 225-209 of the French Commercial Code, the maximum number of shares that may be bought back under this authorization may
not exceed 10% of the total number of shares outstanding as of the date on which this authorization is used. This limit of 10% is applicable to a capital of
|
(1)
|
In compliance with the applicable regulations as of February 29, 2016, the period indicated begins on the day after the date used as a reference for the
publication of information regarding the previous program published in the 2014 Form 20-F.
|
|
|
|
|
|
2015 Form 20-F TOTAL S.A.
|
|
139
|
Item 10 - 1. Share capital
the Company which may be adjusted from time to time as a result of transactions after the date of the present
Meeting. Purchases made by the Company may under no circumstances result in the Company holding more than 10% of the share capital, either directly or indirectly through indirect subsidiaries.
As of December 31, 2015, out of the 2,440,057,883 shares outstanding at this date, the Company held 13,636,490 shares directly and 100,331,268 shares indirectly through its subsidiaries, for a total of
113,967,758 shares. Under these circumstances, the maximum number of shares that the Company could buy back is 130,038,030 shares and the maximum amount that the Company may spend to acquire such shares is
€
9,101,662,100.
The purpose of this share
buyback program is to reduce the number of shares outstanding or to allow the Company to fulfill its engagements in connection with:
|
•
|
|
convertible or exchangeable securities that may give holders rights to receive shares of the Company upon conversion or exchange; or
|
|
•
|
|
share purchase option plans, employee shareholding plans, Company savings plans or other share allocation programs for management or employees of the Company or
Group companies.
|
The purpose of the buybacks may also be one of the market practices accepted by the AMF,
i.e.,
:
|
•
|
|
delivery of shares (by exchange, payment or otherwise) in cases of external growth transactions, mergers, spin-offs or contributions, not exceeding the limit set
forth in Article L. 225-209, 6th paragraph of the French Commercial Code in cases of mergers, spin-offs or contributions; or
|
|
•
|
|
support the secondary market or the liquidity of TOTAL shares by an investment services provider by means of a liquidity agreement compliant with the Code of
ethics recognized by the AMF.
|
This program may also be used by the Company to trade in its own shares, either on or off the market,
for any other purpose that is authorized or any permitted market practice, or any other purpose that may be authorized or any other market practice that may be permitted under the applicable law or regulation. In case of transactions other than the
above-mentioned intended purposes, the Company will inform its shareholders in a press release.
According to the intended purposes, the treasury shares
that are acquired by the Company through this program may, in particular, be:
|
•
|
|
cancelled, up to the maximum legal limit of 10% of the total number of shares outstanding on the date of the operation, per each 24-month period;
|
|
•
|
|
granted for no consideration to the employees of the Group and to the management of the Company or of other companies of the Group;
|
|
•
|
|
delivered to the holders of Company’s shares purchase options having exercised such options;
|
|
•
|
|
sold to employees, either directly or through the intermediary of Company savings funds;
|
|
•
|
|
delivered to the holders of securities that grant such rights to receive such shares, either through redemption, conversion, exchange, presentation of a warrant
or in any other manner; or
|
|
•
|
|
used in any other way consistent with the purposes stated in this resolution.
|
While they are bought back and held by the Company, such shares will be deprived of voting rights and dividend rights.
This authorization is granted for a period of eighteen months from the date of this Meeting. It renders ineffective
up to the unused portion, the previous authorization granted by the Ordinary Shareholders’ Meeting held on May 29, 2015.
The Board of
Directors is hereby granted full authority, with the right to delegate such authority, to undertake all actions authorized by this resolution.”
In
addition, the Annual Shareholders’ Meeting of May 11, 2012 authorized the Board of Directors to reduce the Company capital by canceling shares within a 10% limit of the share capital per
24-month
period. This authorization was granted for five years and will expire at the conclusion of the Shareholders’ Meeting called to approve the financial statements for fiscal year ending December 31, 2016. This authorization reads as follows:
“Upon presentation of the report of the Board of Directors and the auditors’ special report, and voting under the conditions of quorum and majority required for Extraordinary General Meetings, the shareholders hereby authorize the Board of
Directors, in accordance with Article L.225-209 and following of the French Commercial Code and Article L.225-213 of the same Code, to reduce the Company’s capital on one or more occasions by canceling shares, in the limits authorized by law.
The maximum number of Company shares that can be canceled due to this authorization is set at 10% of the shares comprising the Company capital, per
twenty-four month period, specifying that this limit applies to the number of shares that will be adjusted, if necessary, to take into account transactions affecting the share capital after this meeting.
The Shareholders’ Meeting grants all authority to the Board of Directors, with the option to sub-delegate within the conditions set forth by the law, to
perform the share capital reduction transactions at its sole option, decide on the number of shares to be canceled within a 10% limit per twenty-four month period, of the total number of shares comprising the existing share capital on the date of
the transaction, determine the terms and condition of the capital reduction and record the completion, allocate, if necessary, the difference between the purchase value of the shares to be canceled and their par value in a reserve or premium
account, then modify the Articles of Association and carry out any necessary formalities.
This authorization is granted for five years and expires at
the conclusion of the Shareholders’ Meeting called to approve the financial statements for fiscal year ending December 31, 2016.”
Maximum share capital to be
purchased and maximum funds allocated to the transaction
The maximum number of shares that may be purchased under the authorization proposed to the
Shareholders’ Meeting of May 24, 2016 may not exceed 10% of the total number of shares outstanding, with this limit applying to an amount of the Company’s share capital that will be adjusted, if necessary, to include transactions
affecting the share capital subsequent to this Meeting. Purchases made by the Company may under no circumstances result in the Company holding more than 10% of the share capital, either directly or indirectly through subsidiaries.
Before any share cancellation under the authorization given by the Shareholders’ Meeting of May 29, 2015, based on the number of shares outstanding as of
February 29, 2016 (2,454,012,342 shares), and given the 113,967,478 shares held by the Group as of February 29, 2016,
i.e.
, 4.64% of the share capital, the maximum
|
|
|
|
|
140
|
|
TOTAL S.A. Form 20-F 2015
|
Item 10 - 2. Memorandum and Articles of Association
number of shares that may be purchased would be 131,433,756, representing a theoretical maximum investment of
€
9,200,362,920 based on the maximum purchase price of
€
70.
Conditions for buybacks
Such shares may be bought back by any means on regulated markets, multilateral trading facilities or over the counter, including through the purchase or sale of blocks of shares, under the conditions authorized by
the relevant market authorities. These means include the use of any financial derivative instrument traded on a regulated market or over the counter and the implementation of option strategies, with the Company taking measures, however, to avoid
increasing the volatility of its stock. The portion of the program carried out through the purchase of blocks of shares will not be subject to quota allocation, up to the limit set by this
resolution. These shares may be bought back at any time in accordance with current regulations, except during public offerings for the Company’s shares.
Duration and schedule of the share buyback program
In accordance with the 5
th
resolution, which will be subject to approval by the Shareholders’ Meeting of May 24, 2016, the share
buyback program may be implemented over an 18-month period following the date of this Meeting, and therefore expires on November 23, 2017.
Transactions carried out under the previous program
Transactions carried out under the previous program are listed in the special report of the Board of Directors on share buybacks (refer to “— 1.7.2.
Board’s report on share buybacks and sales”, above).
|
2.
|
Memorandum and Articles of Association
|
|
2.1.
|
General information concerning the Company
|
|
•
|
|
The Company’s name is TOTAL S.A. Its telephone number is +33 (0)1 47 44 45 46 and its Internet address is total.com.
|
|
•
|
|
TOTAL S.A. is a French limited liability company (société anonyme) headquartered at 2, place Jean Millier, La Défense 6, 92400 Courbevoie,
France. It is registered in the French trade registry in Nanterre under No. 542 051 180 RCS. The Company’s term was extended for 99 years from March 22, 2000, to expire on March 22, 2099, unless dissolved prior to this date or
extended.
|
|
•
|
|
Fiscal year: from January 1 to December 31 of each year.
|
|
•
|
|
EC Registration Number: FR 59 542 051 180.
|
|
•
|
|
APE Code (NAF): 111Z until January 7, 2008; 7010Z since January 8, 2008.
|
|
•
|
|
The Company’s bylaws are on file with K.L. Associés, Notaries in Paris.
|
|
2.2.
|
Summary of the Company’s purpose
|
The direct and
indirect purpose of the Company is to search for and extract mining deposits in all countries, particularly hydrocarbons in all forms, and to perform industrial refining, processing and trading in said materials as well as their derivatives and
by-products, as well as all activities relating to production and distribution of all forms of energy, as well as the chemicals sector in all of its forms and to the rubber and health sectors. The complete details of the Company’s corporate
purpose are set forth in Article 3 of the bylaws.
|
2.3.
|
Provisions of the bylaws governing the administration and management bodies
|
|
2.3.1.
|
Election of directors and term of office
|
Directors are elected by the Shareholders’ Meeting for a 3-year term up to a maximum number of directors authorized by law (currently 18), subject to the legal provisions that allow the term to be extended
until the next Shareholders’ Meeting called to approve the financial statements for the previous fiscal year.
In addition, one director
representing the employee shareholders is also elected by the Shareholders’ Meeting for a 3-year term from a list of at least two candidates pre-selected by the employee shareholders under the conditions provided for by the laws,
regulations and bylaws in force. However, his or her term shall expire automatically once this Director is no longer an employee or a shareholder. The Board of Directors may meet and conduct
valid deliberations until the date his or her replacement is named.
Furthermore, a director representing the employees is
designated by the Company’s Central Works Council. Where the number of directors appointed by the Shareholders’ Meeting is greater than 12
(1)
, a second director
representing the employees is designated by the Company’s European Works Council. In accordance with applicable legal provisions, the director elected by the Central Works Council must have held an employment contract with the Company or one of
its direct or indirect subsidiaries, whose registered office is based in mainland France, for at least two years prior to appointment. The second director elected by the European Works Council must have held an employment contract with the Company
or one of its direct or indirect subsidiaries for at least two years prior to appointment. The term of office for a director representing the employees is three years. However, the term of office ends following the Shareholders’ Meeting called
to approve the financial statements for the last fiscal year and held in the year during which the said director’s term of office expires.
|
2.3.2.
|
Age limit of Directors
|
On the closing
date of each fiscal year, the number of individual directors over the age of 70 may not be greater than one-third of the directors in office. If this percentage is exceeded, the oldest Board member is automatically considered to have resigned. The
director permanent representative of a legal entity must be under 70 years old.
|
2.3.3.
|
Age limit of the Chairman of the Board and the Chief Executive Officer
|
The duties of the Chairman of the Board automatically cease on his or her
70
th
birthday at the latest.
To hold this office, the Chief Executive Officer
must be under the age of 67. When the age limit is reached during his or her duties, such duties automatically cease, and the Board of Directors elects a new Chief Executive Officer. However, his or her duties as Chief Executive Officer will
continue until the date of the Board of Directors’ meeting aimed at electing his or her successor. Subject to the age limit specified above, the Chief Executive Officer can always be re-elected.
|
(1
)
|
Neither the director representing employee shareholders, elected by the Shareholders’ Meeting, nor the director(s) representing employees are taken into
consideration when calculating the 12-member threshold, which is assessed on the date on which the employee director(s) is/are elected.
|
|
|
|
|
|
2015 Form 20-F TOTAL S.A.
|
|
141
|
Item 10 - 2. Memorandum and Articles of Association
The age limits specified above are stipulated in the Company’s bylaws and were approved by the
Shareholders’ Meeting held on May 16, 2014.
|
2.3.4.
|
Minimum interest in the Company held by directors
|
Each director (other than the director representing the employee shareholders or the director representing the employees) must own at least 1,000 shares of stock during his or her term of office. If, however, any
director ceases to own the required number of shares, they may adjust their position subject to the conditions set by law. The director representing employee shareholders must hold, during his or her term of office, either individually or through a
Company Savings Plan (
Fonds Commun de Placement d’Entreprise
, FCPE) governed by Article L. 214-165 of the French Monetary and Finance Code, at least one share or a number of units in said fund equivalent to at least one share. The
director representing the employees is not bound to be a shareholder.
|
2.3.5.
|
Majority rule for Board meetings
|
Decisions are adopted by a majority vote of the directors present or represented. In the event of a tie vote, the person chairing the meeting shall cast the
deciding vote.
|
2.3.6.
|
Rules of procedure of the Board and Committees of the Board of Directors
|
Refer to “Item 6 — C.1. Practices of the Board of Directors”, above.
|
2.3.7.
|
Form of Management
|
Management of the
Company is assumed either by the Chairman of the Board (who then holds the title of the Chairman and Chief Executive Officer), or by another person appointed by the Board of Directors with the title of Chief Executive Officer. It is the
responsibility of the Board of Directors to choose between these two forms of management under the majority rules described above.
At its meeting on
December 16, 2015, the Board of Directors decided to reunify, as of December 19, 2015, the functions of Chairman and Chief Executive Officer of TOTAL S.A. As of such date, Mr. Pouyanné was appointed Chairman and Chief Executive
Officer of TOTAL S.A. For further information on governance structure refer to “Item 6 — C.1.1. Governance structure”, above.
|
2.4.
|
Rights, privileges and restrictions attached to the shares
|
In addition to the right to vote, each share entitles the holder to a portion of the corporate assets, distributions of profits and liquidation dividend that is
proportional to the number of shares issued, subject to the laws and regulations in force and the bylaws.
With the exception of double voting rights, no
privilege is attached to a specific class of shares or to a specific class of shareholders.
|
2.4.1.
|
Double voting rights
|
Double voting rights, in relation to the portion of share capital they represent, are granted to all fully paid-up registered shares held continuously in the name of the same shareholder for at least two years
(1)
, and to additional registered shares allotted to a shareholder in connection with a capital increase by capitalization of reserves, profits or premiums on the basis of the
existing shares which entitle the shareholder to a double voting right.
|
2.4.2.
|
Limitation of voting rights
|
Article
18 of the Company’s bylaws provides that at Shareholders’ Meetings, no shareholder may cast, by himself or through his agent, on the basis of the single voting rights attached to the shares he holds directly or indirectly and the shares
for which he holds powers, more than 10% of the total number of voting rights attached to the Company’s shares. In the case of double voting rights, by himself or through his agent, this limit may be exceeded, taking only the resulting
additional voting rights into account, provided that the total voting rights that he exercises do not exceed 20% of the total voting rights associated with the shares in the Company.
Moreover, Article 18 of the bylaws also provides that the limitation on voting rights no longer applies, absent any decision of the Shareholders’ Meeting, if an individual or a legal entity acting solely or
together with one or more individuals or entities acquires at least two-thirds of the Company’s shares following a public tender offer for all the Company’s shares. In that case, the Board of Directors acknowledges that the limitation no
longer applies and carries out the necessary procedure to modify the Company’s bylaws accordingly.
Once acknowledged, the fact that the limitation
no longer applies is final and applies to all Shareholders’ Meetings following the public tender offer under which the acquisition of at least two-thirds of the overall number of shares of the Company was made possible, and not solely to the
first meeting following that public tender offer.
Since in such circumstances the limitation no longer applies, such limitation on voting rights cannot
prevent or delay any takeover of the Company, except in case of a public tender offer where the bidder does not acquire at least two-thirds of the Company’s shares.
Whenever it is
necessary to own several shares in order to exercise a right, a number of shares less than the number required does not give the owners any right with respect to the Company; in such case, the shareholders are responsible for aggregating the
required number of shares.
|
2.4.4.
|
Statutory allocation of profits
|
The
Company may distribute dividends under the conditions provided for by the French Commercial Code and the Company’s bylaws.
The net profit for the
period is equal to the net income minus general expenses and other personnel expenses, all amortization and depreciation of the assets, and all provisions for commercial and industrial contingencies.
From this profit, minus prior losses, if any, the following items are deducted in the order indicated:
|
|
1)
|
5% to constitute the legal reserve fund, until said fund reaches 10% of the share capital;
|
|
|
2)
|
the amounts set by the Shareholders’ Meeting to fund reserves for which it determines the allocation or use; and
|
|
|
3)
|
the amounts that the Shareholders’ Meeting decides to retain.
|
The remainder is paid to the shareholders as dividends.
The Board
of Directors may pay interim dividends.
|
(1)
|
This term is not interrupted and the right acquired is retained in case of a conversion of bearer to bearer pursuant to intestate or testamentary succession,
share of community property between spouses or donation to the spouse or relatives entitled to inherit (Article 18 § 6 of the bylaws).
|
|
|
|
|
|
142
|
|
TOTAL S.A. Form 20-F 2015
|
Item 10 - 2. Memorandum and Articles of Association
The Shareholders’ Meeting held to approve the financial statements for the fiscal year may decide to grant
shareholders an option, for all or part of the dividend or interim dividends, between payment of the dividend in cash or in shares.
The
Shareholders’ Meeting may decide at any time, but only based on a proposal by the Board of Directors, to make a full or partial distribution of the amounts in the reserve accounts, either in cash or in Company shares.
Dividends that have not been claimed at the end of a 5-year period are forfeited to the French State.
|
2.5.
|
Amending shareholders’ rights
|
Any amendment to the
bylaws must be approved or authorized by the Shareholders’ Meeting voting with the quorum and majority required by the laws and regulations governing Extraordinary Shareholders’ Meetings.
|
2.6.
|
Shareholders’ meetings
|
|
2.6.1.
|
Notice of meetings
|
Shareholders’ Meetings are
convened and conducted under the conditions provided for by law.
The Ordinary Shareholders’ Meeting is called to take any decisions that do not
modify the Company’s bylaws. It is held at least once a year within six months of the closing date of each fiscal year to approve the financial statements of that year. It may only deliberate, at its first meeting, if the shareholders present,
represented or participating by remote voting hold at least one fifth of the shares that confer voting rights. No quorum is required at its second meeting. Ordinary Shareholders’ Meeting decisions are made with the majority of votes of
shareholders present, represented or participating by remote voting.
Only the Extraordinary Shareholders’ Meeting is authorized to modify the
bylaws. It may not, however, increase shareholders’ commitments. It may only deliberate, at its first meeting, if the shareholders present, represented or participating by remote voting hold at least one quarter, and, at the second meeting, one
fifth, of the shares that confer voting rights. Decisions of Extraordinary Shareholders’ Meetings are made with a two-thirds majority of votes of shareholders present, represented or participating by remote voting.
One or several shareholders holding a certain percentage of the Company’s share capital (calculated using a decreasing scale based on the share capital) may
ask for items or resolution drafts to be added to the agenda of a Shareholders’ Meeting under the forms, terms and deadlines set forth by the French Commercial Code. Requests to add items or resolution drafts to the agenda must be sent no later
than 20 days after the publication of the notice of meeting that the Company must publish in the French official journal of legal notices (
Bulletin des Annonces Légales Obligatoires
, BALO). Any request to add an item to the agenda must
be justified. Any request to add a draft resolution must be accompanied by the draft resolution text and brief summary of the grounds for this request. Requests made by shareholders must be accompanied by a proof of their share ownership and their
ownership of the portion of capital as required by the regulations. Review of the item or draft resolution filed pursuant to regulatory conditions is subject to those making the request providing a new attestation justifying the shares being
recorded in a book-entry form in the same accounts on the second working date preceding the date of the meeting.
The Central Works Committee may also request the addition of draft resolutions to the meeting agendas under the
forms, terms and deadlines set by the French Labor Code. In particular, requests to add draft resolutions must be sent within 10 business days following the date the notice of meeting was published.
|
2.6.2.
|
Admission to meetings
|
Participation in any form in
Shareholders’ Meetings is subject to registration of participating shares, either in the registered account maintained by the Company (or its securities agent) or recorded in bearer form in a securities account maintained by a financial
intermediary. Proof of this registration is obtained under a certificate of participation (
attestation de participation
) delivered to the shareholder. Registration of the shares must be effective no later than midnight (Paris time) on the
second business day preceding the date of the Shareholders’ Meeting. If, after having received such a certificate, shares are sold or transferred prior to this record date, the certificate of participation will be canceled and the votes sent by
mail or proxies granted to the Company for such shares will be canceled accordingly. If shares are sold or transferred after this record date, the certificate of participation will remain valid and votes cast or proxies granted will be taken into
account.
|
2.7.
|
Identification of the holders of bearer shares
|
In accordance
with Article 9 of its bylaws, TOTAL S.A. is authorized, to the extent permitted under applicable law, to identify the holders of securities that grant immediate or future voting rights at the Company’s Shareholders’ Meetings.
|
2.8.
|
Thresholds to be declared according to the bylaws
|
Any
individual or entity who directly or indirectly acquires a percentage of the share capital, voting rights or rights giving future access to the share capital of the Company that is equal to or greater than 1%, or a multiple of this percentage, is
required to notify the Company within 15 days by registered mail with return receipt requested, and declare the number of securities held.
In case the
shares above these thresholds are not declared, as specified in the preceding paragraph, any shares held in excess of the threshold that should have been declared will be deprived of voting rights at Shareholders’ Meetings if, at a
Shareholders’ Meeting, the failure to make a declaration is acknowledged and if one or more shareholders holding collectively at least 3% of the Company’s share capital or voting rights so request at that meeting.
All individuals and entities are also required to notify the Company in due form and within the time limits stated above when their direct or indirect holdings fall
below each of the thresholds mentioned in the first paragraph.
|
2.9.
|
Changes in the share capital
|
The Company’s share
capital may be changed only under the conditions stipulated by the legal and regulatory provisions in force. No provision of the bylaws, charter, or internal regulations provide for more stringent conditions than the law governing changes in the
Company’s share capital.
The French Commercial Code stipulates that shareholders hold, in proportion to their number of shares, a pre-emptive
subscription right to shares issued for cash to increase the share capital. The Extraordinary Shareholders’ Meeting can decide, under the conditions provided for by law, to remove this pre-emptive subscription
right.
|
|
|
|
|
2015 Form 20-F TOTAL S.A.
|
|
143
|
Item 10 - 5. Taxation
There have been no material contracts (not entered into in
the ordinary course of business) entered into by members of the Group since March 15, 2014.
Under current French exchange control regulations, no
limits exist on the amount of payments that TOTAL may remit to residents of the United States. Laws and regulations concerning foreign exchange controls do require, however, that an accredited intermediary must handle all payments or transfer of
funds made by a French resident to a non-resident.
This section generally summarizes the material U.S. federal income tax and French tax consequences of owning and
disposing of shares and ADSs of TOTAL to U.S. Holders that hold their shares or ADSs as capital assets for tax purposes. A U.S. Holder is a beneficial owner of shares or ADSs that is (i) a citizen or resident of the United States for U.S.
federal income tax purposes, (ii) a domestic corporation or other domestic entity treated as a corporation for U.S. federal income tax purposes, (iii) an estate whose income is subject to U.S. federal income tax regardless of its source,
or (iv) a trust if a U.S. court can exercise primary supervision over the trust’s administration and one or more U.S. persons are authorized to control all substantial decisions of the trust.
This section does not address the Medicare tax on net investment income and does not apply to members of special classes of holders subject to special rules,
including:
|
•
|
|
traders in securities that elect to use a mark-to-market method of accounting for their securities holdings;
|
|
•
|
|
tax-exempt organizations;
|
|
•
|
|
life insurance companies;
|
|
•
|
|
U.S. Regulated Investment Companies (RICs), Real Estate Investment Trusts (REITs), and Real Estate Mortgage Investment Conduits (REMICs);
|
|
•
|
|
persons who are liable for the alternative minimum tax;
|
|
•
|
|
persons that actually or constructively own 10% or more of the share capital or voting rights in TOTAL;
|
|
•
|
|
persons that purchase or sell shares or ADSs as part of a wash sale for U.S. federal income tax purposes;
|
|
•
|
|
persons that hold the shares or ADSs as part of a straddle or a hedging or conversion transaction; or
|
|
•
|
|
persons whose functional currency is not the U.S. dollar.
|
If a partnership or other entity treated as a partnership for U.S. federal income tax purposes holds shares or ADSs, the tax treatment of a partner will generally depend upon the status of the partner and upon the
activities of the partnership. Partners of a partnership holding these shares or ADSs should consult their tax advisors as to the tax consequences of owning or disposing of shares or ADSs, as applicable.
Under French law, specific rules apply to trusts, in particular specific tax and filing requirements as well as modifications to wealth, estate and gift taxes as
they apply to trusts. Given the complex nature of these rules and the fact that their application varies depending on the status of the trust, the grantor, the beneficiary and the assets held in the trust, the following summary does not address the
tax treatment of ADSs or shares held in a trust. If ADSs or shares are held in trust, the grantor, trustee and beneficiary are urged to consult their own tax adviser regarding the specific tax consequences of acquiring, owning and disposing of ADSs
or shares.
In addition, the discussion below is limited to U.S. Holders that (i) are residents of the United States
for purposes of the Treaty (as defined below), (ii) do not maintain a permanent establishment or fixed base in France to which the shares or ADSs are attributable and through which the respective U.S. Holders carry on, or have carried on,
a business (or, if the holder is an individual, performs or has performed independent personal services), and (iii) are otherwise eligible for the benefits of the Treaty in respect of income and gain from the shares or ADSs (in particular,
under the “Limitation on Benefits” provision of the Treaty). In addition, this section is based in part upon the representations of the Depositary and the assumption that each obligation in the Deposit Agreement and any related agreement
will be performed in accordance with its terms.
This section is based on the Internal Revenue Code of 1986, as amended (“IRC”), its
legislative history, existing and proposed regulations, published rulings and court decisions, and with respect to the description of the material French tax consequences, the laws of the Republic of France and French tax regulations, all as
currently in effect, as well as on the Convention Between the United States and the Republic of France for the Avoidance of Double Taxation and the Prevention of Fiscal Evasion with respect to Taxes on Income and Capital dated August 31, 1994
as amended (the “Treaty”). These laws, regulations and the Treaty are subject to change, possibly on a retroactive basis.
This discussion
is intended only as a descriptive summary and does not purport to be a complete analysis or listing of all potential tax effects of the ownership or disposition of the shares and ADSs and is not intended to substitute competent professional advice.
Individual situations of holders of shares and ADSs may vary from the description made below. The following summary does not address the French tax treatment applicable to dividends paid in so-called “Non Cooperative Countries and
Territories” (“NCCT”) within the meaning of
Section 238-0 A
of the French Tax Code. It does not apply to dividends paid to persons established or domiciled in such a NCCT, or paid to a
bank account opened in a financial institution located in such a NCCT.
Holders are urged to consult their own tax advisors regarding the U.S.
federal, state and local, and French and other tax consequences of owning and disposing shares or ADSs of TOTAL in their respective circumstances. In particular, a holder is encouraged to confirm with its advisor whether the holder is a U.S. Holder
eligible for the benefits of the Treaty.
|
5.2.
|
Taxation of dividends
|
The term
“dividends” used in the following discussion means dividends within the meaning of the Treaty.
|
|
|
|
|
144
|
|
TOTAL S.A. Form 20-F 2015
|
Item 10 - 5. Taxation
Dividends paid to non-residents of France are in principle subject to a French withholding tax at a rate of 30%,
regardless of whether they are paid in cash, in shares or a mix of both.
However, under the Treaty, a U.S. Holder is generally entitled to a
reduced rate of French withholding tax of 15% with respect to dividends, provided that certain requirements are satisfied.
Administrative guidelines
(
Bulletin Officiel des Finances Publiques
, BOI-INT-DG-20-20-20-20-20120912) (the “Administrative Guidelines”) set forth the conditions under which the reduced French withholding tax at the rate of 15% may be available. The
immediate application of the reduced 15% rate is available to those U.S. Holders that may benefit from the so-called “simplified procedure” (within the meaning of the Administrative Guidelines).
Under the “simplified procedure”, U.S. Holders may claim the immediate application of withholding tax at the rate of 15% on the dividends to be
received by them, provided that:
|
|
(i)
|
they furnish to the U.S. financial institution managing their securities account a certificate of residence conforming with form No. 5000-FR. The immediate application of
the 15% withholding tax will be available only if the certificate of residence is sent to the U.S. financial institution managing their securities account no later than the dividend payment date. Furthermore, each financial institution managing the
U.S. Holders’ securities account must also send to the French paying agent the figure of the total amount of dividends to be received which are eligible to the reduced withholding tax rate before the dividend payment date; and
|
|
|
(ii)
|
the U.S. financial institution managing the U.S. Holder’s securities account provides to the French paying agent a list of the eligible U.S. Holders and other pieces of
information set forth in the Administrative Guidelines. Furthermore, the financial institution managing the U.S. Holders’ securities account should certify that the U.S. Holder is, to the best of its knowledge, a United States resident
within the meaning of the Treaty. These documents must be sent to the French paying agent within a time frame that will allow the French paying agent to file them no later than the end of the third month computed as from the end of the month of the
dividend payment date.
|
Where the U.S. Holder’s identity and tax residence are known by the French paying agent, the latter may
release such U.S. Holder from furnishing to (i) the financial institution managing its securities account, or (ii) as the case may be, the U.S. Internal Revenue Service (“IRS”), the abovementioned certificate of residence,
and apply the 15% withholding tax rate to dividends it pays to such U.S. Holder.
For a U.S. Holder that is not entitled to the
“simplified procedure” and whose identity and tax residence are not known by the paying agent at the time of the payment, the 30% French withholding tax will be levied at the time the dividends are paid. Such U.S. Holder, however, may
be entitled to a refund of the withholding tax in excess of the 15% rate under the “standard procedure”, as opposed to the “simplified procedure”, provided that the U.S. Holder furnishes to the French paying agent an
application for refund on forms No. 5000-FR and 5001-FR (or any other relevant form to be issued by the French tax authorities) certified by the U.S. financial institution managing the U.S. Holder’s securities account (or,
if not, by the competent U.S. tax authorities) before December 31 of the second year following the date of payment of the withholding tax at the 30% rate to the French tax authorities,
according to the requirements provided by the Administrative Guidelines.
Copies of
forms No. 5000-FR and 5001-FR (or any other relevant form to be issued by the French tax authorities) as well as the form of the certificate of residence and the U.S. financial institution certification, together with instructions,
are available from the IRS and the French tax authorities.
These forms, together with instructions, are to be provided by the Depositary to all
U.S. Holders of ADRs registered with the Depositary. The Depositary is to use reasonable efforts to follow the procedures established by the French tax authorities for U.S. Holders to benefit from the immediate application of the 15%
French withholding tax rate or, as the case may be, to recover the excess 15% French withholding tax initially withheld and deducted in respect of dividends distributed to them by TOTAL. To effect such benefit or recovery, the Depositary shall
advise such U.S. Holder to return the relevant forms to it, properly completed and executed. Upon receipt of the relevant forms properly completed and executed by such U.S. Holder, the Depositary shall cause them to be filed with the
appropriate French tax authorities, and upon receipt of any resulting remittance, the Depositary shall distribute to the U.S. Holder entitled thereto, as soon as practicable, the proceeds thereof in U.S. dollars.
The identity and address of the French paying agent are available from TOTAL.
In addition, subject to certain specific filing obligations, there is no withholding tax on dividend payments made by French companies to non-French collective investment funds formed under foreign law and
established in a Member State of the European Union or in another State or territory, such as the United States, that has entered with France into an administrative assistance agreement for the purpose of combating fraud and tax evasion, and which
fulfill the two following conditions:
|
•
|
|
the fund raises capital among a number of investors for the purpose of investing in accordance with a defined investment policy, in the interest of its
investors; and
|
|
•
|
|
the fund has characteristics similar to those of collective investment funds organized under French law (
i.e.,
among others, open-end mutual fund (OPCVM),
open-end real estate fund (OPCI) and closed-end investment companies (SICAF)).
|
Collective investment funds are urged to consult their
own tax advisors to confirm whether they are eligible to such provisions and under which conditions.
For U.S. federal
income tax purposes and subject to the passive foreign investment company rules discussed below, the gross amount of any dividend a U.S. Holder must include in gross income equals the amount paid by TOTAL (
i.e.,
the net distribution
received plus any tax withheld therefrom) to the extent of the current and accumulated earnings and profits of TOTAL (as determined for U.S. federal income tax purposes). Dividends paid to a non-corporate U.S. Holder that constitute
qualified dividend income will be taxable to the holder at the preferential rates applicable to long-term capital gains provided that the shares or ADSs are held for more than sixty days during the 121-day period beginning sixty days before the
ex-dividend date and the holder meets other holding period requirements. TOTAL believes that dividends paid by TOTAL with respect to its shares or ADSs will be qualified dividend income. The dividend will not be eligible for the dividends-received
deduction allowed to a U.S. corporation under IRC Section 243. The dividend is taxable to the U.S. Holder when
|
|
|
|
|
2015 Form 20-F TOTAL S.A.
|
|
145
|
Item 10 - 5. Taxation
the holder, in the case of shares, or the Depositary, in the case of ADSs, receives the dividend, actually or
constructively. Because TOTAL does not currently maintain calculations of earnings and profits for U.S. federal income tax purposes, a U.S. Holder of shares or ADSs of TOTAL should expect to generally treat distributions with respect to the shares
or ADSs as dividends
The amount of any dividend distribution includible in the income of a U.S. Holder equals the U.S. dollar value of the
euro payment made, determined at the spot euro/dollar exchange rate on the date the dividend distribution is includible in the U.S. Holder’s income, regardless of whether the payment is in fact converted into U.S. dollars. Any gain or
loss resulting from currency exchange fluctuations during the period from the date the dividend payment is includible in the U.S. Holder’s income to the date the payment is converted into U.S. dollars will generally be treated as
ordinary income or loss and, for foreign tax credit limitation purposes, from sources within the United States and will not be eligible for the special tax rate applicable to qualified dividend income.
The U.S. federal income tax rules governing
the availability and computation of foreign tax credits are complex. U.S. Holders should consult their own tax advisers concerning the implications of these rules in light of their particular circumstances.
Subject to certain conditions and limitations, French taxes withheld in accordance with the Treaty will generally be eligible for credit against the
U.S. Holder’s U.S. federal income tax liability. The limitation on foreign taxes eligible for credit is calculated separately with respect to specific classes of income. In addition, special rules apply in determining the foreign tax
credit limitation with respect to dividends that are subject to the preferential tax rates. To the extent a refund of the tax withheld is available to a U.S. Holder under French law or under the Treaty, the amount of tax withheld that is
refundable will not be eligible for credit against such an individual’s U.S. federal income tax liability.
For this purpose, dividends distributed
by TOTAL will constitute “passive income”, or, in the case of certain U.S. Holders, “general income”, which are treated separately from one another for purposes of computing the foreign tax credit allowable to the
U.S. Holder. Alternatively, a U.S. Holder may claim all foreign taxes paid as an itemized deduction in lieu of claiming a foreign tax credit.
If a U.S. Holder has the option to receive a distribution in shares (or ADSs) instead of cash, the distribution of shares (or ADSs) will be taxable as if the holder
had received an amount equal to the fair market value of the distributed shares (or ADSs), and such holder’s tax basis in the distributed shares (or ADSs) will be equal to such amount.
|
5.3.
|
Taxation of disposition of shares
|
In general, a
U.S. Holder will not be subject to French tax on any capital gain from the sale or exchange of the shares or ADSs or redemption of the underlying shares that the ADSs represent unless those shares or ADSs form part of a business property of a
permanent establishment or fixed base that the U.S. Holder has in France. Special rules may apply to individuals who are residents of more than one country.
A financial transaction tax applies, under certain conditions, to the acquisition of shares of publicly traded companies registered in France having a market capitalization over
€
1 billion on December 1
st
of the year preceding the
acquisition. A list of the companies within the scope of the financial transaction tax for 2016 is published in the French Guidelines
Bulletin Officiel des
Finances Publiques
, BOI-ANNX-000467-20151221. TOTAL is included in this list. The tax also applies to the acquisition of ADRs evidencing ADSs. The financial transaction tax is due at a
rate of 0.2% on the price paid to acquire the shares. The person or entity liable for the tax is generally the provider of investment services defined in Article L. 321-1 of the French Monetary and Financial Code (
prestataire de services
d’investissement
). Investment service providers providing equivalent services outside France are subject to the tax under the same terms and conditions. Taxable transactions are broadly construed but several exceptions may apply. In
general, non-income taxes, such as this financial transaction tax, paid by a U.S. Holder are not eligible for a foreign tax credit for U.S. federal income tax purposes. U.S. Holders should consult their own tax advisors as to the tax consequences
and creditability of such financial transaction tax.
For U.S. federal income tax purposes and subject to the passive foreign investment company
rules discussed below, a U.S. Holder generally will recognize capital gain or loss upon the sale or other disposition of shares or ADSs equal to the difference between the U.S. dollar value of the amount realized on the sale or disposition
and the holder’s tax basis, determined in U.S. dollars, in the shares or ADSs. The gain or loss generally will be U.S. source gain or loss and will be long-term capital gain or loss if the U.S. Holder’s holding period of the
shares or ADSs is more than one year at the time of the disposition. Long-term capital gain of a non-corporate U.S. Holder is generally taxed at preferential rates if specified minimum holding periods are met. The deductibility of capital
losses is subject to limitation.
|
5.4.
|
Passive foreign investment status
|
TOTAL believes that the
shares or ADSs are not treated as stock of a passive foreign investment company (“PFIC”) for U.S. federal income tax purposes, and TOTAL does not expect that it will be treated as a PFIC in the current or future taxable years. This
conclusion is a factual determination that is made annually and thus is subject to change. If TOTAL is treated as a PFIC, gain realized on the sale or other disposition of the shares or ADSs would in general not be treated as capital gain. Instead,
unless a U.S. Holder elects to be taxed annually on a mark-to-market basis with respect to the shares or ADSs, a U.S. Holder would be treated as if he or she had realized such gain and certain “excess distributions” ratably over the
holding period for the shares or ADSs and would be taxed at the highest tax rate in effect for each such year to which the gain was allocated, in addition to an interest charge in respect of the tax attributable to each such year. With certain
exceptions, a U.S. Holder’s shares or ADSs will be treated as stock in a PFIC if TOTAL were a PFIC at any time during such holder’s holding period in the shares or ADSs. Dividends paid will not be eligible for the preferential tax rates
applicable to qualified dividend income if TOTAL is treated as a PFIC with respect to a U.S. Holder either in the taxable year of the distribution or the preceding taxable year, but instead will be taxable at rates applicable to ordinary income.
|
5.5.
|
French estate and gift taxes
|
In general, a transfer of
shares or ADSs by gift or by reason of the death of a U.S. Holder that would otherwise be subject to French gift or inheritance tax, respectively, will not be subject to such French tax by reason of the Convention between the United States of
America and the French Republic for the Avoidance of Double Taxation and the Prevention of Fiscal Evasion with Respect to Taxes on Estates, Inheritances and Gifts, dated November 24, 1978, as amended, unless the donor or the transferor is
domiciled in France at the time of making the gift, or at the time of his death,
|
|
|
|
|
146
|
|
TOTAL S.A. Form 20-F 2015
|
Items 10 - 11
or if the shares or ADSs were used in, or held for use in, the conduct of a business through a permanent
establishment or a fixed base in France.
The French wealth tax does not apply to a
U.S. Holder (i) that is not an individual, or (ii) in the case of individuals who are eligible for the benefits of the Treaty and who own, alone or with related
persons, directly or indirectly, TOTAL shares which give right to less than 25% of TOTAL’s earnings.
|
5.7.
|
U.S. state and local taxes
|
In addition to U.S. federal
income tax, U.S. Holders of shares or ADSs may be subject to U.S. state and local taxes with respect to their shares or ADSs. U.S. Holders should consult their own tax advisors.
|
6.
|
Dividends and Paying Agents
|
Refer to “Item 8 — 2.2. Dividend payment”,
above.
The independent third-party report of DeGolyer and MacNaughton, a petroleum engineering consulting firm with address
at 5001 Spring Valley Road, Suite 800 East, Dallas, Texas 75244, is attached as Exhibit 15.3 to this Form 20-F. This report
provided TOTAL estimates of proved crude oil, condensate and natural gas reserves, as of December 31, 2015, of certain properties owned by OAO NOVATEK. As evidenced by Exhibit 15.2 to this
Form 20-F, DeGolyer and MacNaughton has consented to the inclusion of their report in this Form 20-F.
TOTAL files annual, periodic, and other reports and information with the Securities and Exchange Commission. You may
inspect any reports, statements or other information TOTAL files with the United States Securities and Exchange Commission (“SEC”) at the SEC’s public reference rooms by calling the SEC for more information at 1-800-SEC-0330. All of
TOTAL’s SEC filings made
after December 31, 2001, are available to the public at the SEC website at http://www.sec.gov and from certain commercial document retrieval services. You may also inspect any document the
Company files with the SEC at the offices of The New York Stock Exchange, 20 Broad Street, New York, New York 10005.
ITEM 11. QUANTITATIVE AND
QUALITATIVE DISCLOSURES ABOUT MARKET RISK
Please refer to Note 31 to the Consolidated Financial Statements included elsewhere herein for a qualitative and
quantitative discussion of the Group’s exposure to market risks. Please also refer to Notes 29 and 30 to the Consolidated Financial Statements included elsewhere herein for details of the different derivatives owned by the Group in these
markets.
As part of its financing and cash management activities, the Group uses derivative instruments to manage its exposure to changes in interest
rates and foreign exchange rates. These instruments are mainly interest rate and currency swaps. The Group may also occasionally use futures contracts and options. These operations and their accounting treatment are detailed in Note 1
paragraph M and Notes 20, 28 and 29 to the Consolidated Financial Statements included elsewhere herein.
The financial performance of TOTAL is sensitive to a number of factors, the most significant being oil and gas
prices, generally expressed in dollars, and exchange rates, in particular that of the dollar versus the euro. Generally, a rise in the price of crude oil has a positive effect on earnings as a result of an increase in revenues from oil and gas
production. Conversely, a decline in crude oil prices reduces revenues. The impact of changes in crude oil prices on the activities of the Refining & Chemicals and Marketing & Services segments depends upon the speed at which the
prices of finished products adjust to reflect these changes. All of the Group’s activities are, to various degrees, sensitive to fluctuations in the dollar/euro exchange rate.
|
|
|
|
|
2015 Form 20-F TOTAL S.A.
|
|
147
|
Items 12 - Description of Securities Other than Equity Securities
ITEM 12. DESCRIPTION OF SECURITIES OTHER THAN EQUITY SECURITIES
American Depositary Receipts fees and charges
JPMORGAN CHASE BANK, N.A., as depositary for the TOTAL S.A. ADR program, collects its fees for delivery and surrender of ADRs directly from investors depositing shares or surrendering ADRs for the purpose of
withdrawal or from intermediaries acting for them. The depositary collects fees for making distributions to investors by deducting those fees from the amounts distributed or by selling a portion of distributable property to pay the fees. The
depositary may generally refuse to provide fee-attracting services until its fees for those services are paid.
|
|
|
|
|
Investors must pay:
|
|
For:
|
|
$5.00 (or less) per 100 ADSs (or portion of 100 ADSs)
|
|
• Issuance of ADRs,
including issuances resulting from a distribution of shares or rights or other property, stocks splits or mergers
• Cancellation of ADRs for the purpose of withdrawal, including if the deposit
agreement terminates
|
|
A fee equivalent to the fee that would be payable if securities distributed to the investor had been shares and the shares had been deposited for
issuance of ADSs
|
|
• Distribution of securities distributed to holders of
deposited securities that are distributed by the depositary to ADS registered holders
|
|
Registration or transfer fees
|
|
• Transfer and registration of shares on the Company’s
share register to or from the name of the depositary or its agent when the investor deposits or withdraws shares
|
|
Expenses of the depositary
|
|
• Cable, telex and
facsimile transmissions (when expressly provided in the deposit agreement)
• Converting foreign currency to U.S. dollars
|
|
Taxes and other governmental charges the depositary or the custodian have to pay on any ADS or share underlying an ADS, for example, stock transfer
taxes, stamp duty or withholding taxes
|
|
• As necessary
|
|
Any charges incurred by the depositary or its agents for servicing the deposited securities
|
|
• As necessary
|
The depositary has agreed to provide the Company with payments concerning, among other things, expenses incurred by
the Company for the establishment and maintenance of the ADR program that include, but are not limited to, exchange listing fees, annual meeting expenses, standard out-of-pocket maintenance costs for the ADRs (
e.g
., the expenses of postage
and envelopes for mailing annual and interim financial reports, printing and distributing dividend checks, electronic filing of U.S. Federal tax information, mailing required tax forms, stationery, postage, facsimile, and telephone calls),
shareholder identification, investor relations activities or programs in North America, accounting fees (such as external audit fees incurred in connection with the
Sarbanes-Oxley Act, the preparation of the Company’s Form 20-F and paid to the FASB and the PCAOB), legal fees and other expenses incurred in connection with the preparation of
regulatory filings and other documentation related to ongoing SEC, NYSE and U.S. securities law compliance. In certain instances, the depositary has agreed to provide additional payments to the Company based on certain applicable performance
indicators related to the ADR facility.
During the calendar year preceding March 1, 2016, the Company received net payments from the depositaries
of approximately $6.6 million.
|
|
|
|
|
148
|
|
TOTAL S.A. Form 20-F 2015
|
Items 13 - 15
ITEM 13. DEFAULTS, DIVIDEND ARREARAGES AND DELINQUENCIES
None.
ITEM 14. MATERIAL
MODIFICATIONS TO THE RIGHTS OF
SECURITY HOLDERS AND USE OF PROCEEDS
None.
ITEM 15. CONTROLS AND PROCEDURES
|
1.
|
Disclosure controls and procedures
|
An evaluation was carried out under the supervision and with the participation of the Group’s management,
including the Chief Executive Officer and the Chief Financial Officer, of the effectiveness, as of the end of the period covered by this report, of the design and operation of the Group’s disclosure controls and procedures, which are defined as
those controls and procedures designed to ensure that information required to be disclosed in reports filed under the Securities Exchange Act of 1934, as amended, is recorded, summarized and reported within specified time periods. There are inherent
limitations to the effectiveness of any system of disclosure controls and procedures, including the possibility of human error and the circumvention or overriding of the controls and procedures. Accordingly, even effective
disclosure controls and procedures can provide only reasonable assurance of achieving their control objectives. Based on this evaluation, the Chief Executive Officer and the Chief Financial
Officer concluded that the design and operation of these disclosure controls and procedures were effective to provide reasonable assurance that information required to be disclosed in the reports that the Company files under the Exchange Act is
recorded, processed, summarized and reported, within the time periods specified in the applicable rules and forms, and that it is accumulated and communicated to management, including the Chief Executive Officer and the Chief Financial Officer, as
appropriate to allow timely decisions regarding required disclosure.
|
2.
|
Management’s annual report on internal control over financial reporting
|
The Group’s management is responsible for establishing and maintaining adequate internal control over financial
reporting. Because of its inherent limitations, internal control over financial reporting may not prevent or detect misstatements and even when determined to be effective, can only provide reasonable assurance with respect to financial statement
preparation and presentation. Also, the effectiveness of an internal control system may change over time.
The Group’s management, including the
Chief Executive Officer and the Chief Financial Officer, conducted an evaluation of the effectiveness of internal control over financial reporting using the
criteria set forth in
Internal Control — Integrated Framework (2013)
issued by the Committee of Sponsoring Organizations of the Treadway Commission (“COSO”). Based on
the results of this evaluation, the Group’s management concluded that its internal control over financial reporting was effective as of December 31, 2015.
The effectiveness of internal control over financial reporting as of December 31, 2015, was audited by KPMG S.A. and Ernst & Young Audit, independent registered public accounting firms, as stated in
their report on page F-2 of this Annual Report.
|
3.
|
Changes in internal control over financial reporting
|
There were no changes in the Group’s internal control over financial reporting that occurred during the period
covered by this
report that have materially affected, or that were reasonably likely to materially affect, the Group’s internal control over financial reporting.
|
4.
|
Internal control and risk management procedures (Article L. 225-37 of the French Commercial Code)
|
Information related to the internal control and risk management procedures implemented within the Group presented
hereafter are part of the Report of the Chairman of the Board of Directors prepared pursuant to Article L. 225-37 of the French Commercial Code.
The
information contained in the Report of the Chairman of the Board of Directors was prepared with the assistance of several of the Company’s corporate functional departments, including in particular the Legal, Finance and Group Internal Control
and Audit Departments. After the sections relevant to their respective duties were reviewed by the Governance and Ethics Committee, the Compensation Committee and the Audit Committee, the information was approved by the Board of Directors.
|
4.1.
|
Basic elements of internal control
|
The Group is structured
around three business segments (Upstream, Refining & Chemicals, Marketing & Services) to which
the Group’s operational entities report. Business segment management are responsible, within their area of responsibility, for ensuring that operations are carried out in accordance with the
strategic objectives defined by the Board of Directors and General Management. The functional departments of the Holding level help General Management define norms and standards, oversee their application and monitor activities. They also lend their
expertise to the operational divisions.
The functional departments of the Holding level include the Finance Division (to which the Group Risk Assessment
and Insurance Department and the Group Information Technology Department report), the Legal Affairs Department (including the Compliance and Social Responsibility Department) and Corporate Affairs (to which the following departments report:
Corporate Internal Control and Audit, Sustainable Development and Environment, Human Resources, Security, Industrial Safety and Purchasing).
|
|
|
|
|
2015 Form 20-F TOTAL S.A.
|
|
149
|
Items 15 - 4. Internal control and risk management procedures
The Group’s internal control and risk management systems are structured around this three-level organization
— Holding level, business segments, operational entities — where each level is directly involved and accountable in line with the degree of centralization decided by General Management.
General Management constantly strives to maintain an efficient internal control system across the Group, based on the framework of the Committee of Sponsoring
Organizations of the Treadway Commission (COSO). In this framework, internal control is a process intended to provide reasonable assurance that the objectives related to operations, reporting and compliance with applicable laws and regulations are
achieved. As for any internal control system, it cannot provide an absolute guarantee that all risks are completely controlled or eliminated. The COSO framework is considered equivalent to the reference framework of the French Financial Markets
Authority (
Autorité des marchés financiers
). The Group has also chosen to rely on this framework as part of its obligations under the Sarbanes-Oxley Act.
The Group’s internal control and risk management systems are therefore based on the five components of this framework: control environment, risk assessment, control activities, monitoring and information, and
communication.
The Group’s risk management system draws on the main international standards (COSO Enterprise Risk Management integrated framework,
ISO 31000:2009 — Risk management) as well as on French standards (Reference framework of the French Financial Markets Authority). The internal Risk Management, Internal Control and Audit Charter forms the common framework on which the Group
relies to ensure control of its activities.
The Group’s internal control and risk management systems cover the processes of the fully consolidated
entities and the most important equity affiliates.
Under these internal control principles, which are part of the corporate governance organization, the
Audit Committee is responsible for monitoring the efficiency of internal control and risk management systems, assisted by the Corporate Internal Control and Audit Department and the internal control teams from the business segments. These rules are
particularly designed to allow the Board of Directors to ensure that internal control is effective and that published information available to shareholders and financial markets is reliable.
Approximately 400 employees monitor the internal control systems within the Group. The assessment of the internal control and risk management system is mainly overseen by the Corporate Internal Control and Audit
Department, which employed 79 people in 2015 and carried out more than 180 internal audits.
The control environment is based
primarily on the Group’s Code of Conduct, which, in addition to safety, sets forth its core values (respect, responsibility and exemplary conduct) and business principles in terms of safety, security, health, protection of the environment,
integrity and respect for human rights. This Code of Conduct builds trust between TOTAL and both its employees and stakeholders.
The Group’s values and
business principles are set out in its Code of Conduct (revised in 2014), its Business Integrity Guide and its Human Rights Guide. These documents are distributed to all employees and are available on the intranet. They also set out the rules of
individual behavior expected of all employees in the countries where the Group has a presence. The Group has
pledged its adherence to recognized international standards related to human rights and, in particular, the core conventions of the International Labour Organization (ILO), the “voluntary
principles on security and human rights” and the United Nations guiding principles on business and human rights.
The Financial Code of Ethics,
which also refers to the Code of Conduct, sets forth specific rules for the Chairman and Chief Executive Officer, the Chief Financial Officer, the Senior Vice President Accounting and the financial and accounting officers of the principal Group
activities.
As a priority of General Management, the Group deploys ethics and compliance policies and programs, including in particular anti-fraud
programs and programs for the prevention of corruption and competition law infringement. These include training programs as well as compliance audits and ethical assessments (refer to “Item 4 — E. Other Matters — 4.3.7. Fair
operating practices”, above). The Group also relies on the Ethics Committee, whose role is to listen and provide assistance in these areas.
The
relationship between the Group and its service providers is also based on adherence to the principles set forth in the Code of Conduct and on the fundamental principles of purchasing attached to all contracts. Suppliers and service providers are
required to apply standards equivalent to those of the Group, particularly with respect to their employees, and to make every effort to encourage their own suppliers and subcontractors in turn to respect these principles (for further information
about relations between the Group and its suppliers, (refer to “Item 4 — E. Other Matters — 4.3.6. Contractors and suppliers”, above).
|
–
|
Structure, authority and responsibility
|
General
Management ensures that the organizational structure and reporting lines plan, execute, control and periodically assess the Group’s activities. General Management regularly reviews the relevance of the organizational structures so as to be able
to adapt them quickly to changes in the activities and in the environment in which they are carried out.
The Group has also defined central
responsibilities that cover the three lines of defense of internal control: (1) operational management, which is responsible for implementing internal control, (2) support functions (such as Finance, Legal, Human Resources, etc.), which
prescribe the internal control systems, verify their implementation and effectiveness and assist operational employees, and (3) internal auditors who, through their internal control reports, provide recommendations to improve the effectiveness
of the system.
In addition, an accountability system is defined and formalized at all levels of the organization, through organization notes,
organization charts, appointment notes, job descriptions and delegations of powers. Each business segment has established clear rules applicable to its specific scope by directly integrating the Group’s instructions.
|
–
|
Policies and procedures
|
TOTAL incorporates the
values, fundamental principles, strategic options and respective requirements of the businesses, at all levels of the organization, into a normative framework, supplemented by a set of practical recommendations and feedback. Like the Group’s
organization, this framework has a three-level structure: a Group level, with the REFLEX Group framework and the technical framework set out by the Corporate Technology Group, frameworks for each business segment; and a specific framework for each
significant operational entity.
|
|
|
|
|
150
|
|
TOTAL S.A. Form 20-F 2015
|
Items 15 - 4. Internal control and risk management procedures
A document known as the governance framework details the relationship between these frameworks and describes their
respective scope, the way in which the standards differ from one another (by adaptation, clarification or stricter requirements relative to higher level standards), exemption processes, if any, standards development processes and the monitoring
system put in place.
The main procedures regarding financial controls established at the corporate level cover acquisitions and sales, capital
expenditure, financing and cash management, budget control and financial reporting. Disclosure controls and procedures are in place (refer to “— 4.3.2. Internal control procedures related to the preparation and processing of accounting and
financial information”, below). At the operating levels, these procedures mainly pertain to directives, rules and recommendations regarding health, general safety, industrial safety, IT security, the environment and sustainable development, as
well as integrity and fraud and corruption prevention.
These documents, all of which are published on the intranet, are reviewed regularly and their
implementation is monitored.
At the business segment or operational entity levels, control activities are organized around the main operational
processes: exploration and reserves, procurement, capital expenditure, production, sales, oil and gas trading, inventories, human resources, financing and cash management, and account closing process.
|
–
|
Commitment to competence
|
The Group’s Human
Resources policy, revised in 2014, sets out rules and practices that reflect its commitment in terms of social responsibility and its expectations of employees, particularly in terms of competencies. Descriptions of jobs within the Group’s
various entities define the competencies and expertise required for employees to carry out their functions effectively.
In addition, the Human Resources
function shapes and regularly updates policies aimed at attracting new talents, including employee training, assessment and retention policies (annual appraisals, training programs, compensation policies and career management – refer to
“Item 6 — B.1. Employees’ compensation”, above).
The Board of Directors, with the
support of the Audit Committee, ensures that the internal control functions are operating properly. The Audit Committee ensures that General Management implements internal control and risk management procedures based on the risks identified, such
that the Group’s objectives are achieved.
The general managements of the business segments and operational entities are responsible for designing
and deploying specific components of this internal control and risk management system within their area of responsibility. A representation letter process regularly deployed at the various levels of the organization reinforces the effectiveness of
the internal control system, particularly over financial reporting.
The Internal Control Department has pursued a process aimed at strengthening the
assessment of the role and involvement of all employees in terms of internal control. Training initiatives tailored to the various stakeholders involved in the internal control process are regularly launched within the Group.
|
–
|
Control activities and assessment
|
The Group regularly
examines and assesses the design and effectiveness of the key operational, financial and information technology controls related to internal control over financial
reporting, pursuant to Section 404 of the Sarbanes-Oxley Act. In 2015, this assessment was performed with the assistance of the Group’s main entities and the Corporate Internal Control
and Audit Department. The system used covers:
|
•
|
|
the most significant entities, which assess the key operational controls of their significant processes and respond to a Group questionnaire for assessing the
internal control system;
|
|
•
|
|
other less significant entities, which respond only to the Group questionnaire for assessing the internal control system.
|
These two categories of entities account for approximately 80% and 10%, respectively, of the financial aggregates in the Group’s Consolidated Financial
Statements.
In addition, any activity, process or management system may be the subject of an internal audit conducted by Group Audit, in accordance with
the international internal audit framework and its code of ethics. The Corporate Internal Control and Audit Department also conducts joint audits with third-party auditors and provides assistance (advice, analysis, input regarding methodology). The
audit plan, which is based on an analysis of the risks and risk management systems, is submitted annually to the Executive Committee and the Audit Committee for approval. The statutory auditors also review the internal controls that they deem
necessary as part of their certification of the financial statements. In 2015, they reviewed the implementation of the Group’s internal control framework and the design and effectiveness of key internal controls at its main entities regarding
financial reporting. Based on their work, the statutory auditors declared that they had no comments on the information and statements presented in this present Report of the Chairman of the Board on internal control and risk management procedures.
The reports on the work performed by the Group Audit and statutory auditors are periodically summarized and presented to the Audit Committee and,
thereby, to the Board of Directors. The Senior Vice President, Corporate Internal Control and Audit attended all Audit Committee meetings held in 2015. The Audit Committee also interviews the statutory auditors at least once a year without any
Company representatives present.
If areas of improvement are identified by these internal audits and operational controls, then corrective action plans
are drawn up and shared with operational management who, along with the Corporate Internal Control and Audit Department, monitor them closely.
Based on
the internal reviews, General Management has reasonable assurance of the effectiveness of the Group’s internal control.
|
4.3.
|
Risk assessment and management
|
To implement its strategy,
General Management ensures that clear and precise objectives are defined at the various levels of the organization with regard to operations, reporting and compliance.
Operational objectives focus on the definition and efficient use of human, financial and technical resources. In particular, they are defined during the budgetary processes and in the long-term plan, and are
monitored regularly as part of the self-assessment process.
The monitoring of operational objectives (financial and non-financial) helps in
decision-making and monitoring performance of activities at each level of the organization.
TOTAL has set up an ongoing process to identify and analyze
risks that may preclude the achievement of its objectives. The Group takes into account risks at all levels of the organization and in all its
|
|
|
|
|
2015 Form 20-F TOTAL S.A.
|
|
151
|
Items 15 - 4. Internal control and risk management procedures
entities, and examines factors that influence the severity, probability of occurrence of risks or the loss of its
assets and the potential impact on operations, reporting (financial and non-financial) and compliance with applicable laws and regulations.
The Group
has developed a control framework in line with the risk assessments performed and implements initiatives necessary for addressing specific risks by enforcing Group-wide rules. These initiatives must reduce the probability of occurrence of risks and
their possible impact. They also cover the main processes outsourced via subcontracting agreements.
TOTAL also identifies changes that could have a
significant impact on its internal control system, particularly changes related to assets consolidated by the business segments. To this end, the Group relies on governance bodies adapted to its various activities and capable of making and
implementing decisions necessary for quickly responding to material changes that the Group must deal with.
The risk-mapping activities carried out by
the Group’s entities as part of a regular risk assessment process help identify and analyze key ongoing or foreseeable changes.
|
4.3.1.
|
Monitoring of risk management systems
|
The Executive Committee, with the assistance of the Group Risk Committee (GRC) created in 2011, is responsible for identifying and analyzing internal and external
risks that could impact TOTAL’s performance. The GRC’s main function is to identify risks that could prevent the Group from achieving its objectives and to ensure the existence and effectiveness of risk management systems adapted to the
Group’s needs.
The GRC relies on the work carried out by the business segments and functional departments, which concurrently establish their own
risk mapping. These maps are drawn up according to a methodological framework developed by the Group. The activities of the GRC, the major risks identified by the Group and the risk mappings of the business segments are regularly reported to the
Audit Committee
The Group’s business segments and entities are responsible for defining and implementing a risk management policy suited to their
specific activities. However, today the handling of certain transverse risks is more closely coordinated by the respective functional departments.
General Management exercises operational control over TOTAL’s activities through the Executive Committee’s approval of investments and commitments for
projects based on defined thresholds. These projects are subject to prior review by the Risk Committee (CORISK), whose conclusions are transmitted to the Executive Committee. As part of this review, the CORISK verifies the analysis of the various
project-related risks.
The Group implements appropriate control systems for the main risks identified.
Financial risks
The management and
conditions procedures for using financial instruments are governed by strict rules that are defined by the Group’s General Management, and which provide for centralization by the Treasury Department of liquidity, interest exchange rate
positions, management of financial instruments and access to capital markets.
The Group’s financing policy consists of incurring long-term debt
primarily at a floating rate, or at a fixed rate when warranted by interest rates. Debt is mainly incurred in U.S. dollars or euros according to the Group’s general corporate needs.
The Group’s cash balances, which mainly consist of euros and U.S. dollars, are managed to maintain liquidity
based on daily interest rates in the given currency. Maximum amounts are set for transactions exceeding one month, with placements not to exceed 12 months. TOTAL S.A. also has confirmed credit facilities granted by international banks. These credit
facilities, along with the Group’s net cash position, allow it to continually maintain a high level of liquidity in accordance with targets set by General Management.
In terms of counterparty risk in financial transactions, the Group adheres to a cautious policy, and only makes commitments with institutions featuring a high degree of financial soundness, as based on a
multi-criteria analysis. An overall credit limit is set for each authorized financial counterparty and allocated among the Group’s subsidiaries. In addition, to reduce market value risk on its commitments, the Treasury Department has entered
into margin call contracts with its significant counterparties.
The Group seeks to minimize its currency exposure, on the one hand by financing its
long-term assets in the functional currency of the entity to which they belong and, on the other hand, by systematically hedging the currency exposure generated by commercial activity. These risks are managed centrally by the Treasury Department,
which operates within a set of limits defined by General Management.
The policy for managing risks related to financing and cash management activities
as well as the Group’s currency exposure and interest rate risks is described in detail in Note 31 to the Consolidated Financial Statements.
Industrial and environmental risks and risks related to climate issues
The Group has
developed a Safety Health Environment Quality Charter that sets out the basic principles applicable to the protection of people, property and the environment. This Charter is implemented at several levels within the Group through its management
systems.
Along these lines, TOTAL develops safety, environment and quality management systems such as MAESTRO (internal HSE management system) and takes
a targeted approach to certifying its activities based on such standards as ISO 14001 and ISO 9001.
As part of its policy, the Group performs
regular assessments, following various procedures, of the risks and impacts of its activities in the areas of industrial safety (particularly process safety), the environment and the protection of workers and local residents:
|
•
|
|
prior to approving new projects, investments, acquisitions and assets disposal;
|
|
•
|
|
during operations (safety studies, environmental impact assessments, health impact studies); and
|
|
•
|
|
prior to releasing new substances on the market (toxicological and ecotoxicological studies and life cycle analyses).
|
These assessments incorporate the regulatory requirements of the countries where the Group’s activities are carried out and generally accepted professional
practices.
In countries where prior administrative authorization and supervision is required, projects are not undertaken without the authorization of
the relevant authorities based on the studies provided to the latter.
In particular, TOTAL has developed a common methodology for analyzing
technological risks that is being gradually applied to all activities carried out by the companies of the Group (refer to “Item 4 – E. Other Matters – 4.2.2.3. Incident risk”, above). TOTAL develops risk
|
|
|
|
|
152
|
|
TOTAL S.A. Form 20-F 2015
|
Items 15 - 4. Internal control and risk management procedures
management measures based on risk and impact assessments. These measures involve facility and structure design, the
reinforcement of safety devices and environmental remediation.
In addition to developing management systems as described above, the Group strives to
minimize industrial and environmental risks inherent in its operations by conducting thorough inspections and audits, training personnel and raising awareness among all those involved.
In addition, performance indicators (particularly in the areas of HSE) and risk monitoring have been put in place, objectives have been set and action plans have been implemented to achieve these objectives (refer
to “Item 4 – E. Other Matters – 4.2. Safety, health and environment information”, above).
Although the emphasis is on preventing
risks, TOTAL takes regular steps to prepare for crisis management based on identified risk scenarios. The Group has a crisis management process that relies on a permanent on-call system, regular drills, training courses in crisis management and a
set of tools. The organization set up in the event of a crisis is deployed at two closely-coordinated levels:
|
•
|
|
at the local level (country, site or entities), a crisis unit is responsible for ensuring operational management and implementing emergency plans; and
|
|
•
|
|
at the head office level, a crisis unit consisting of a multi-disciplinary team is tasked with assessing the situation and overseeing crisis management. This
central unit provides the necessary expertise and mobilizes additional resources to assist the local crisis unit when necessary.
|
In
addition, TOTAL has developed emergency plans and procedures to respond to an oil spill or leak. These plans and procedures are specific to each subsidiary and adapted to its organization, activities and environment, and are consistent with the
Group’s anti-pollution plan. They are reviewed regularly and tested through drills (refer to “Item 4 – E. Other Matters – 4.2.2.3. Incident risk”, above).
At the Group level, TOTAL has set up an organization structured around the Plan to Mobilize Resources Against Pollution (PARAPOL) alert scheme to facilitate crisis management and provide assistance regardless of
geographical restrictions by mobilizing both internal and external resources in the event of pollution of marine, coastal or inland waters. Its main objective is to facilitate access to internal and external experts and physical response resources
(FOST, Cedre, OSRL).
With regard to risks related to climate issues, TOTAL is committed to managing its energy consumption and
develops processes to improve its energy performance and that of its customers, in accordance with Article 9 of its Safety Health Environment Quality Charter. In its decision-making process, the risks and associated climate issues (flaring, GHG
emissions, CO
2
price sensitivity) are assessed prior to the presentation of the projects to the Executive Committee. Climate hazards are taken into consideration and addressed
either through environmental and safety assessments to ensure that the consequences, and, in particular, possible changes to surface water levels, do not affect the integrity of the facilities, or through procedures that take into account local
hazards in order to arrange for the protection of people and facilities.
Risks related to information systems
TOTAL’s IT Department has developed and distributed governance and security rules that describe the recommended infrastructure, organization and procedures in
order to maintain information systems that are appropriate to the organization’s
needs and to limit information security risks. These rules are implemented across the Group under the responsibility of the various business segments.
The Group has also developed control activities at various levels of the organization in areas where information systems cover all or part of the processes. A set
of Information Technology General Controls (ITGC) aim to guarantee that information systems function and are available as required, and that data integrity is guaranteed and changes controlled.
Information Technology Automated Controls (ITAC) aim to ensure the integrity of data generated or supported by business applications, particularly those that impact
financial flows.
The outsourcing of some components of the Group’s IT infrastructure to service providers poses specific risks and requires the
selection and development of additional controls of the completeness, accuracy and validity of the information supplied and received from such service providers. Accordingly, to ensure continuous improvement, the Group assesses whether suitable
controls are implemented by the service providers concerned and what controls are necessary within its own organization to maintain these risks at an acceptable level.
In addition, in light of growing risks in legal (document retention, personal data protection, copyrights, etc.) and security (loss of information, external and internal threats, fraud, etc.) areas, the Group has
stepped up its deployment, including within subsidiaries, of information protection, document retention and personal data protection policies (and, for the latter, in anticipation of complying with the future European regulation scheduled to be
adopted in 2016).
Ethical misconduct and non-compliance risks
The Group deploys an
anti-fraud and fraud prevention program and has implemented a range of procedures and programs that help to prevent, detect and limit different types of fraud. This effort is supported by the business principles and values of individual behavior
described in the Group’s Code of Conduct and in the codes, charters and other standards applied by the business segments.
The Group has also issued
a directive for handling incidents of fraud that has been widely distributed to employees, and has created an alert system that employees can use to report acts that may constitute fraud. In addition, a specific process is in place for reporting
accounting, internal control and auditing irregularities. This alert process, implemented at the request of the Audit Committee, is monitored by the Audit Committee and may be used by shareholders, employees and third parties.
In 2015, a large campaign on fraud risks to raise awareness of all Group employees has been launched. A guide “Prevention and fraud prevention the risks of
fraud”, which highlights the different actions conducted through the anti-fraud program was distributed. A mapping of fraud risks in the Group was finalized in December 2015, allowing defining priority actions for 2016.
The deployment of the anti-fraud and fraud prevention program relies on the network of fraud risks coordinators within the business segments and operational
entities.
|
|
–
|
|
Prevention of corruption risks
|
General
Management constantly reiterates the principle of zero tolerance with regard to corruption. Internal rules have been published since 2011 in this area. They cover various areas where particular risks of exposure to corruption may exist (business
partnerships, representatives, procurement and sales, donations,
|
|
|
|
|
2015 Form 20-F TOTAL S.A.
|
|
153
|
Items 15 - 4. Internal control and risk management procedures
acquisitions, joint ventures, human resources, gifts and invitations, etc.) in an effort to detect, assess and
address risks at a very early stage through an appropriate due diligence process.
To support this program, in December 2015 TOTAL launched a second
e-learning module in 11 languages open to all employees and mandatory for more than 30,000 of them.
In addition, 370 compliance officers were appointed
and trained within the business segments and operational entities. Their role is to ensure that the program is implemented at the local level.
Lastly,
under the settlements reached in 2013 between TOTAL, the Securities and Exchange Commission (SEC) and the Department of Justice (DoJ), an independent monitor was appointed. His role is to conduct a 3-year assessment of the anti-corruption compliance
and related internal control procedures implemented by the Group and to recommend improvements, where necessary. The monitor took up the position at the end of 2013 and issued an initial report to the authorities in July 2014. As the monitor was
forced by health reasons to abandon this role, a new monitor was appointed in early 2015 to continue the review. A second report was issued in October 2015 in which the monitor stated that “TOTAL has improved its corruption prevention program
considerably by implementing the recommendations made in the first report.”
|
|
–
|
|
Prevention of competition law infringement
|
A
Group policy aimed at ensuring compliance with, and preventing infringement of, competition law has been in place since 2014 and is a follow-up to the various measures previously implemented by the business segments. Its deployment is based, in
particular, on management and staff involvement, training courses that include an e-learning module and an organization responsible for implementing the program.
|
|
–
|
|
Prevention of insider trading and conflict of interests
|
The Group’s Ethics Committee implements a policy to prevent insider trading on the financial markets which is based, in particular, on the Group’s internal ethics rules. These rules are updated on a
regular basis and widely distributed to employees who are permanently or occasionally in possession of insider information. These ethical rules require, in particular, that permanent insiders refrain from carrying out any transactions, including
hedging transactions, in TOTAL shares or ADRs and in shares in collective investment plans (FCPE) invested primarily in TOTAL shares (as well as derivatives related to such shares) on the day on which the Company discloses its periodic results
publications (quarterly, interim and annual) as well as during the 30 calendar days preceding such date.
To prevent conflicts of interest, each of the
Group’s senior executives completes an annual statement declaring any conflicts of interest to which he or she may be subject. By completing this declaration, each senior executive also agrees to report to his or her supervisor any conflict of
interest that he or she has had or of which he or she is aware in performing his or her duties.
|
4.3.2.
|
Internal control procedures related to the preparation and processing of accounting and financial information
|
Accounting information
The
Group’s Accounting Department, which reports to the Group’s Chief Financial Officer, draws up the Group’s Consolidated Financial Statements according to IFRS standards based on the reporting packages prepared quarterly by the
consolidated entities, as well as the Statutory Financial Statements
of TOTAL S.A. as parent company and those of certain French entities. Each quarter, the Consolidated and Statutory Financial Statements of TOTAL S.A. are reviewed by the Audit Committee and the
Board of Directors.
The Consolidated Financial Statements are prepared based on the following principles:
|
•
|
|
homogeneity of the accounting framework and standards; to this end, the interpretation of accounting standards applicable to the Consolidated Financial
Statements is centralized by the Group’s Accounting Department, which also distributes these standards through formal procedures and an internal financial reporting manual. The department monitors the effective implementation of these standards
through periodic formal communication with managers of the business segments; and
|
|
•
|
|
a supervised account closing process based mainly on formalization of economic assumptions, judgments and estimates, treatment of complex accounting transactions
and on respect of established timetables announced through Group instructions disclosed to each entity.
|
Off-balance sheet commitments
which are valued according to the financial reporting manual are reported on a quarterly basis to the Audit Committee.
Internal control of accounting
information is mainly focused around the following areas:
|
•
|
|
a monthly financial report is formalized by Group and business segment control panels. This report and the Consolidated Financial Statements use the same
framework and standards. In addition, the quarterly closing schedule is the same for preparing the Consolidated Financial Statements and financial reporting;
|
|
•
|
|
a detailed analysis of differences as part of the quarterly reconciliation between the Consolidated Financial Statements and financial reporting is supervised by
the Accounting and Budget-Controlling Departments, which are part of the Finance Division;
|
|
•
|
|
a detailed analysis of differences between actual amounts and the yearly budget established on a monthly basis is realized at each level of the organization;
|
|
•
|
|
an annual reconciliation between the parent company financial statements and the financial statements based on IFRS standards is performed by entity;
|
|
•
|
|
periodic controls are designed to ensure the reliability of accounting information and mainly concern the processes for preparing aggregated financial items;
|
|
•
|
|
a regular process for the signature of representation letters at each level of the organization; and
|
|
•
|
|
the Disclosure Committee ensures the application of the procedures in place.
|
Because of the important contribution of the equity affiliates to the Group’s aggregated financial items, an annual review of the control on these companies’ financial statements is implemented based on a
detailed questionnaire completed by each entity. This system is integrated into the Group’s internal control framework.
Other
financial information
Proved oil and gas reserves are evaluated annually by the relevant entities. They are reviewed by the Reserves Committee,
approved by Exploration & Production’s senior management and then validated by the Group’s General Management. They are also presented to the Audit Committee each year.
|
|
|
|
|
154
|
|
TOTAL S.A. Form 20-F 2015
|
Items 16A - 16C
The internal control process related to estimating reserves is formalized in a special procedure described in detail
in “Item 4 — B. Business Overview — 2.1.2. Reserves“, above). The reserves evaluation and the related internal control processes are audited periodically.
The strategic outlook published by the Group is prepared, in particular, according to the long-term plans drawn up at
the business segment and Group levels, and on the work carried out at each relevant level of the organization. The Board of Directors reviews the strategic outlook each year.
ITEM 16A. AUDIT COMMITTEE
FINANCIAL EXPERT
Ms. Marie-Christine Coisne-Roquette is the Audit Committee financial expert. She is an independent member of the Board of
Directors in accordance with the NYSE listing standards applicable to TOTAL.
ITEM 16B. CODE OF ETHICS
At its meeting on October 30, 2012, the Board of Directors adopted a code of ethics that applies to its Chief Executive Officer, Chief Financial Officer, Chief
Accounting Officer and the financial and accounting officers for its principal activities. A copy of this code of ethics is included as an exhibit to this Annual Report.
ITEM 16C. PRINCIPAL ACCOUNTANT FEES AND SERVICES
|
1.
|
Fees for accountants’ services
|
During the fiscal years ended December 31, 2015 and
2014, fees for services provided by Ernst & Young Audit and KPMG were as follows:
|
|
|
|
|
|
|
|
|
|
|
|
|
|
|
|
|
|
|
|
|
Ernst & Young Audit
fiscal year
|
|
|
KPMG
fiscal year
|
|
|
(M$)
|
|
2015
|
|
|
2014
|
|
|
2015
|
|
|
2014
|
|
|
Audit Fees
|
|
|
22.0
|
|
|
|
24.7
|
|
|
|
16.0
|
|
|
|
20.8
|
|
|
Audit-Related Fees
(a)
|
|
|
1.1
|
|
|
|
1.1
|
|
|
|
4.8
|
|
|
|
6.8
|
|
|
Legal, Tax, Labor Law Fees
(b)
|
|
|
3.3
|
|
|
|
3.3
|
|
|
|
3.0
|
|
|
|
2.7
|
|
|
All Other
Fees
(c)
|
|
|
0.5
|
|
|
|
—
|
|
|
|
0.3
|
|
|
|
—
|
|
|
Total
|
|
|
26.9
|
|
|
|
29.1
|
|
|
|
24.1
|
|
|
|
30.3
|
|
|
(a)
|
Audit-related fees are generally fees billed for services that are closely related to the performance of the audit or review of financial statements. These
include due diligence services related to business combinations, attestation services not required by statute or regulation, agreed upon or expanded auditing procedures related to accounting or billing records required to respond to or comply with
financial, accounting or regulatory reporting matters, consultations concerning financial accounting and reporting standards, information system reviews, internal control reviews and assistance with internal control reporting requirements.
|
|
(b)
|
Tax fees are fees for services related to international and domestic tax compliance, including the preparation of tax returns and claims for refund, tax
planning and tax advice, including assistance with tax audits and tax appeals, and tax services regarding statutory, regulatory or administrative developments and expatriate tax assistance and compliance.
|
|
(c)
|
All other fees are principally for risk management advisory services.
|
|
2.
|
Audit Committee Pre-Approval Policy
|
The Audit Committee has adopted an Audit and Non-Audit Services Pre-Approval Policy that sets forth the procedures
and the conditions pursuant to which services proposed to be performed by the statutory auditors may be pre-approved and that are not prohibited by regulatory or other professional requirements. This policy provides for both pre-approval of certain
types of services through the use of an annual budget approved by the Audit Committee for these types of services and special
pre-
approval of services by the Audit Committee on a case-by-case basis. The Audit Committee reviews on an annual basis the services provided by the statutory auditors. During 2015, no audit-related
fees, tax fees or other non-audit fees were approved by the Audit Committee pursuant to the
de minimis
exception to the pre-approval requirement provided by paragraph (c)(7)(i)(C) of
Rule 2-01
of
Regulation S-X.
|
3.
|
Auditor’s term of office
|
French law provides that the statutory and alternate auditors are appointed for renewable 6-fiscal year terms. The
terms of office of the statutory auditors and of the alternate auditors will expire at the end of the Annual Shareholders’ Meeting called in 2016 to approve the financial statements for fiscal year 2015. At its meeting on
March 15, 2016 and further to a proposal by the Audit Committee, the Board of Directors decided to propose to the Annual Shareholders’ Meeting of May 24, 2016 the renewal of the
terms of office of the statutory auditors for a 6-fiscal year term.
|
|
|
|
|
2015 Form 20-F TOTAL S.A.
|
|
155
|
Items 16D - 16F
ITEM 16D. EXEMPTIONS FROM THE LISTING STANDARDS FOR AUDIT
COMMITTEES
TOTAL’s Audit Committee consists of four directors including three directors who meet the independence
requirements under Rule 10A-3 of the Securities Exchange Act of 1934, as amended, and one who is exempt under such requirements pursuant to the Rule 10A-3(b)(1)(iv)(C) exemption for non-executive officer employees. The Audit Committee member
exempt from the
independence requirements under this rule is Mr. Charles Keller, appointed as the director representing employee shareholders pursuant to Article L.225-23 of the French Commercial Code
(see “Item 6 — C.1.4. Audit Committee”). TOTAL’s reliance on such exemptions does not materially adversely affect the ability of the Audit Committee to act independently.
ITEM 16E. PURCHASES OF
EQUITY SECURITIES BY THE ISSUER AND AFFILIATED PURCHASERS
|
|
|
|
|
|
|
|
|
|
|
|
|
|
|
|
|
|
|
Period
|
|
Total Number Of
Shares
Purchased
|
|
|
Average Price
Paid Per
Share
(
€
)
|
|
|
Total Number Of
Shares Purchased,
As Part Of Publicly
Announced Plans Or
Programs
(a)
|
|
|
Maximum Number
Of Shares That May
Yet Be
Purchased
Under The Plans Or
Programs
(b)
|
|
|
January 2015
|
|
|
—
|
|
|
|
—
|
|
|
|
—
|
|
|
|
129,266,822
|
|
|
February 2015
|
|
|
—
|
|
|
|
—
|
|
|
|
—
|
|
|
|
129,291,634
|
|
|
March 2015
|
|
|
—
|
|
|
|
—
|
|
|
|
—
|
|
|
|
129,296,725
|
|
|
April 2015
|
|
|
—
|
|
|
|
—
|
|
|
|
—
|
|
|
|
130,363,410
|
|
|
May 2015
|
|
|
—
|
|
|
|
—
|
|
|
|
—
|
|
|
|
130,373,985
|
|
|
June 2015
|
|
|
—
|
|
|
|
—
|
|
|
|
—
|
|
|
|
130,377,746
|
|
|
July 2015
|
|
|
—
|
|
|
|
—
|
|
|
|
—
|
|
|
|
132,240,749
|
|
|
August 2015
|
|
|
4,711,935
|
|
|
|
45.22
|
|
|
|
4,711,935
|
|
|
|
127,537,278
|
|
|
September 2015
|
|
|
—
|
|
|
|
—
|
|
|
|
—
|
|
|
|
127,538,900
|
|
|
October 2015
|
|
|
—
|
|
|
|
—
|
|
|
|
—
|
|
|
|
129,967,333
|
|
|
November 2015
|
|
|
—
|
|
|
|
—
|
|
|
|
—
|
|
|
|
130,030,886
|
|
|
December 2015
|
|
|
—
|
|
|
|
—
|
|
|
|
—
|
|
|
|
130,038,030
|
|
|
January 2016
|
|
|
—
|
|
|
|
—
|
|
|
|
—
|
|
|
|
131,432,881
|
|
|
February 2016
|
|
|
—
|
|
|
|
—
|
|
|
|
—
|
|
|
|
131,433,756
|
|
|
(a)
|
The shareholders’ meeting of May 29, 2015, canceled and replaced the previous resolution from the shareholders’ meeting of May 16, 2014,
authorizing the Board of Directors to trade in the Company’s own shares on the market for a period of eighteen months within the framework of the stock purchase program. The maximum number of shares that may be purchased by virtue of this
authorization or under the previous authorization may not exceed 10% of the total number of shares constituting the share capital, this amount being periodically adjusted to take into account operations modifying the share capital after each
shareholders’ meeting. Under no circumstances may the total number of shares the Company holds, either directly or indirectly through its subsidiaries, exceed 10% of the share capital.
|
|
(b)
|
Based on 10% of the Company’s share capital, and after deducting the shares held by the Company for cancellation and the shares held by the Company to
cover the share purchase option plans for Company employees and restricted share grants for Company employees, as well as after deducting the shares held by the subsidiaries.
|
ITEM 16F. CHANGE IN REGISTRANT’S CERTIFYING ACCOUNTANT
Not applicable.
|
|
|
|
|
156
|
|
TOTAL S.A. Form 20-F 2015
|
Item 16G
ITEM 16G. CORPORATE GOVERNANCE
This section presents a summary of significant differences between French corporate governance practices and the
NYSE’s corporate governance standards, as required by section 303A.11 of the NYSE Listed Company Manual.
The following paragraphs provide a brief, general
summary of significant ways in which our corporate governance practices differ from those required by the listing standards of the New York Stock Exchange ( “NYSE”) for U.S. companies that have common stock listed on the NYSE. While
our management believes that our corporate governance practices are similar in many respects to those of U.S. domestic NYSE listed companies and provide investors with protections that are comparable in many respects to those established by the NYSE
Listed Company Manual, certain significant differences are described below.
The principal sources of corporate governance standards in France are the
French Commercial Code (Code de commerce), the French Financial and Monetary Code (Code monétaire et financier) and the regulations and recommendations provided by the French Financial Markets Authority (Autorité des marchés
financiers, AMF), as well as a number of general recommendations and guidelines on corporate governance, most notably the Corporate Governance Code for Listed Companies published in December 2008 (as amended in April 2010,June 2013 and
November 2015) by the principal French business confederations, the Association Française des Entreprises Privées (AFEP) and the Mouvement des Entreprises de France (MEDEF) (the “AFEP-MEDEF Code”).
The AFEP-MEDEF Code includes, among other things, recommendations relating to the role and operation of the board of directors (creation, composition and evaluation
of the board of directors and the audit, compensation and nominating committees) and the independence criteria for board members. Articles L. 820-1
et seq.
of the French Commercial Code prohibits statutory auditors from providing certain
non-audit services and defines certain criteria for the independence of statutory auditors. In France, the independence of statutory auditors is also monitored by an independent body, the High Council for Statutory Auditors (Haut Conseil du
commissariat aux comptes).
For an overview of certain of our corporate governance policies, see “Item 6 — C. Board Practices and
Corporate Governance”.
|
1.2.
|
Composition of Board of Directors; Independence
|
The NYSE
listing standards provide that the board of directors of a U.S.-listed company must consist of a majority of independent
directors and that the audit
committee, the nominating/corporate governance committee and the compensation committee must be composed entirely of independent directors. A director qualifies as independent only if the board affirmatively determines that the director has no
material relationship with the company, either directly or as a partner, shareholder or officer of an organization that has a relationship with the company. Furthermore, as discussed below, the listing standards require additional procedures in
regards to the independence of directors who sit on the compensation committee. In addition, the listing standards enumerate a number of relationships that preclude independence.
French law does not contain any independence requirement for the members of the board of directors of a French
company, except for the audit committee, as described below. The AFEP-MEDEF Code recommends, however, that (i) at least half of the members of the board of directors be independent in companies that have a dispersed ownership structure and no
controlling shareholder, and (ii) at least a third of the members of the board of directors be independent in companies that have a controlling shareholder. Members of the board representing employees and employee shareholders are not taken
into account in order to determine these percentages. The AFEP-MEDEF Code states that a director is independent when “he or she has no relationship of any kind whatsoever with the corporation, its group or the management of either that may
colour his or her judgment.” The AFEP-MEDEF Code also enumerates specific criteria for determining independence, which are on the whole consistent with the goals of the NYSE’s rules, including recent amendments, although the specific tests
under the two standards may vary on some points.
For an overview of the Board of Directors’ assessment of the independence of the Company’s
Directors, including a description of the Board’s independence criteria, refer to “Item 6 — A.1.4. Director independence”.
|
1.3.
|
Representation of women on corporate boards
|
French commercial law provides for legally binding quotas to boost the percentage of women on boards of directors of French-listed companies, requiring that women represent: (i) at least 20% following the
first ordinary shareholders’ meeting held after January 1, 2014, and (ii) at least 40% following the first ordinary shareholders’ meeting held after January 1, 2017. Members of the board representing the employees are not
taken into account in order to determine these percentages. When the board of directors consists of less than nine members, the difference between the number of directors of each gender when the 40% quota will apply should not be higher than two.
Any appointment of a director made in violation of these rules shall be declared null and void and the payment of the directors’ compensation shall be suspended until the board composition complies with the law’s requirements (the
management report shall also indicate the suspension of the directors’ compensation until the board composition complies with the law’s requirements). However, decisions of a board of directors that fail to comply with these quotas may not
be declared null and void. In addition, the AFEP-MEDEF Code recommends compliance with said 40% quota within a period of six years from the date of the 2010 annual ordinary shareholders’ meeting. As of February 10, 2016, the Company’s
Board had four female members (36.4%
(1)
of the Directors).
The NYSE listing standards
require that a U.S.-listed company have an audit committee, a nominating/corporate governance committee and a compensation committee. Each of these committees must consist solely of independent directors and must have a written charter that
addresses certain matters specified in the listing standards. Furthermore, the listing standards require
|
(1)
|
As per French law and the AFEP-MEDEF Code, the director representing employees shall be excluded for the computation of the gender percentage. As of
February 10, 2016, the gender percentage is 36.4%, because four Board seats are held by women out of a total of eleven seats (excluding the director representing the employees of TOTAL’s Board of Directors).
|
|
|
|
|
|
2015 Form 20-F TOTAL S.A.
|
|
157
|
Item 16G
that, in addition to the independence criteria referenced above under “Composition of Board of Directors;
Independence”, certain enumerated factors be taken into consideration when making a determination on the independence of directors on the compensation committee or when engaging advisors to the compensation committee.
With the exception of an audit committee, as described below, French law requires neither the establishment of board committees nor the adoption of written
charters.
The AFEP-MEDEF Code recommends, however, that the board of directors sets up, in addition to an audit committee, a nominating committee and a
compensation committee, indicating that the nominating and compensation committees may form only one committee. The AFEP-MEDEF Code also recommends that at least two-thirds of the audit committee members and a majority of the members of each of the
compensation committee and the nominating committee be independent directors, it being specified that the chairman of the compensation committee should be independent, and that none of these three committees should include any executive director.
TOTAL has established an Audit Committee, a Governance and Ethics Committee, a Compensation Committee and a Strategic Committee. As of
December 31, 2015, the composition of these committees was as follows:
|
•
|
|
The Audit Committee had four members. With the exception of the director representing the employee shareholders, Mr. Keller (see “— 1.4.2. Audit
committee”, below, and “Item 16D. Exemptions from the listing standards for audit committees”), all members of this committee have been deemed independent by the Board of Directors.
|
|
•
|
|
The Governance and Ethics Committee had five members. With the exception of Mr. Desmarest, all members of this committee have been deemed independent by the
Board of Directors.
|
|
•
|
|
The Compensation Committee had four members, all of whom have been deemed independent by the Board of Directors.
|
|
•
|
|
The Strategic Committee had seven members. With the exception of Messrs. Pouyanné, who chairs the committee, and Desmarest and the director
representing the employees (Mr. Blanc), all members of this committee have been deemed independent by the Board of Directors.
|
For a
description of the scope of each committee’s activity and the independence assessment of each member, see “Item 6 — C.1.Practices of the Board of Directors”.
The NYSE listing standards also require that the audit, nominating/corporate governance and compensation committees of a U.S.-listed company be vested with decision-making powers on certain matters. Under French
law, these committees are advisory in nature and have no decision-making authority. Board committees are responsible for examining matters within the scope of their charter and making recommendations on these matters to the board of directors. Under
French law, the board of directors has the final decision-making authority.
The NYSE listing
standards contain detailed requirements for the audit committees of U.S.-listed companies. Some, but not all, of these requirements also apply to non-U.S.-listed companies, such as TOTAL.
French law requires the board of directors of companies listed in France to establish an audit committee (Article L.
823-19 of the French Commercial Code), at least one member of which must be an independent director and must be competent in finance or accounting. The AFEP-MEDEF Code provides that at least two-thirds of the directors on the audit committee be
independent and that the audit committee should not include any executive director. Under NYSE rules, in the absence of an applicable exemption, audit committees are required to comply with in the independence requirements of Rule 10A-3 of the
Exchange Act. TOTAL’s Audit Committee consists of four directors including three directors who meet the independence requirements under Rule 10A-3, and one who is exempt under such requirements pursuant to the Rule 10A-3(b)(1)(iv)(C)
exemption for non-executive officer employees. The Audit Committee member exempt from the independence requirements under this rule is Mr. Keller, the director representing employee shareholders (see “Item 6 — C.1.4.
Audit Committee”).
Pursuant to French law and the AFEP-MEDEF Code, the audit committee is responsible for, among other things, reviewing the
financial statements and ensuring the relevance and consistency of accounting methods used in drawing up the consolidated and corporate accounts, examining the company’s risk exposure and material off-balance sheet commitments and the scope of
consolidation, monitoring the process for the preparation of financial information, monitoring the efficiency of internal control procedures and risk management systems, managing the process of selecting statutory auditors, expressing an opinion on
the amount of their fees and monitoring compliance with rules designed to ensure auditor independence, regularly interviewing statutory auditors without the executive management being present and calling upon outside experts if necessary.
Although the audit committee requirements under French law and recommendations under the AFEP-MEDEF Code are less detailed than those contained in the
NYSE listing standards, French law and the AFEP-MEDEF Code share the goal of establishing a system for overseeing the company’s accounting that is independent from management and that ensures auditor independence. As a result, they address
similar topics, and there is some overlap.
For the specific tasks performed by the Audit Committee of TOTAL that exceed those required by French law and
those recommended by the AFEP-MEDEF Code, see “Item 6 — C.1.4. Audit Committee”.
One structural difference between the legal status
of the audit committee of a U.S.-listed company and that of a French-listed company concerns the degree of the committee’s involvement in managing the relationship between the company and the auditor. French law requires French companies that
publish consolidated financial statements, such as TOTAL S.A., to have two co-auditors. While the NYSE listing standards require that the audit committee of a U.S.-listed company have direct responsibility for the appointment, compensation,
retention and oversight of the work of the auditor, French law provides that the election of the co-auditors is the sole responsibility of the shareholders duly convened at a shareholders’ meeting. In making their decision, the shareholders may
rely on proposals submitted to them by the board of directors, the decision of the latter being taken upon consultation with the audit committee. The shareholders elect the auditors for an audit period of six fiscal years. The auditors may only be
dismissed by a court and only on grounds of professional negligence or incapacity to perform their mission.
|
|
|
|
|
158
|
|
TOTAL S.A. Form 20-F 2015
|
Items 16G - 18
|
1.5.
|
Meetings of non-management directors
|
The NYSE listing
standards require that the non-management directors of a U.S.-listed company meet at regularly scheduled executive sessions without management. French law does not contain such a requirement. The AFEP-MEDEF Code recommends, however, that
non-executive directors meet periodically without the executive (or “in-house”) directors.
Since December 16, 2015, the rules of
procedure of the Board of Directors provide that, with the agreement of the Governance and Ethics Committee, the Lead Independent Director may hold meetings of the directors who do not hold executive or salaried positions on the Board of Directors.
He or she reports to the Board of Directors on the conclusions of such meetings.
In February 2016, the part of the meeting during which the Board
discussed the evaluation of the performance of the Chairman and Chief Executive Officer and the determination of his compensation was chaired by the Lead Independent Director.
Thus, the Board of Directors’ practice constitutes a mechanism that has the same effect as the recommendation made in the AFEP-MEDEF Code.
The NYSE listing standards require U.S.-listed
companies to adopt, and post on their websites, a set of corporate governance guidelines. The guidelines must address, among other things: director qualification standards, director responsibilities, director access to management and independent
advisers, director compensation, director orientation and continuing education, management succession and an annual performance evaluation of the board. In addition, the chief executive officer of a U.S.-listed company must certify to the NYSE
annually that he or she is not aware of any violations by the company of the NYSE’s corporate governance listing standards.
French law requires
neither the adoption of such guidelines nor the provision of such certification. The AFEP-MEDEF Code recommends, however, that the board of directors of a
French-
listed company performs an annual review of its operation and a formal evaluation at least once every three years, implemented under the leadership of the appointments or nominations committee or
an independent director, with help from an external consultant (which for TOTAL took place in early 2016). The AFEP-MEDEF Code also recommends that the board of directors review its composition, organization and operation and that shareholders be
informed of these evaluations each year in the annual report. In addition, Article L. 225-37 of the French Commercial Code provides that the chairman of the board of directors annually must describe in a report to the shareholders the composition of
the board and the balanced representation of men and women in the board, the preparation and organization of the board’s work, as well as the internal control and risk management procedures implemented by the company. The AFEP-MEDEF Code also
includes ethical rules concerning which directors are expected to comply.
|
1.7.
|
Code of business conduct and ethics
|
The NYSE listing
standards require each U.S.-listed company to adopt, and post on its website, a code of business conduct and ethics for its directors, officers and employees. There is no similar requirement under French law. However, under the SEC’s rules and
regulations, all companies required to submit periodic reports to the SEC, including TOTAL, must disclose in their annual reports whether they have adopted a code of ethics for their principal executive officer and senior financial officers. In
addition, they must file a copy of the code with the SEC, post the text of the code on their website or undertake to provide a copy upon request to any person without charge. There is significant, though not complete, overlap between the code of
ethics required by the NYSE listing standards and the code of ethics for senior financial officers required by the SEC’s rules. For a discussion of the code of ethics adopted by TOTAL, see “Item 6. C. Board Practices and Corporate
Governance”, “Item 15. 4. Internal control and risk management procedures (Article L. 225-37 of the French Commercial Code)” and “Item 16B. Code of Ethics”.
ITEM 16H. MINE SAFETY DISCLOSURE
Not applicable.
ITEM 17. FINANCIAL STATEMENTS
Not applicable.
ITEM 18. FINANCIAL
STATEMENTS
The following financial statements, together with the report of Ernst & Young Audit and KPMG S.A. thereon, are held as part of
this annual report.
|
|
|
|
|
|
|
|
|
Page
|
|
|
Report of Independent Registered Public Accounting Firms on the Consolidated Financial Statements
|
|
|
F-1
|
|
|
Report of Independent Registered Public Accounting Firms on the Internal Control over Financial
Reporting
|
|
|
F-2
|
|
|
Consolidated Statement of Income for the Years Ended December 31, 2015, 2014 and 2013
|
|
|
F-3
|
|
|
Consolidated Statement of Comprehensive Income for the Years Ended December 31, 2015, 2014 and
2013
|
|
|
F-4
|
|
|
Consolidated Balance Sheet at December 31, 2015, 2014 and 2013
|
|
|
F-5
|
|
|
Consolidated Statement of Cash Flow for the Years Ended December 31, 2015, 2014 and 2013
|
|
|
F-6
|
|
|
Consolidated Statement of Changes in Shareholders’ Equity for the Years Ended December
31, 2015, 2014 and 2013
|
|
|
F-7
|
|
|
Notes to the Consolidated Financial Statements
|
|
|
F-8
|
|
|
|
|
|
Supplemental Oil and Gas Information (Unaudited)
|
|
|
S-1
|
|
Schedules have been omitted since they are not required under the applicable instructions or the substance of the required
information is shown in the financial statements.
|
|
|
|
|
2015 Form 20-F TOTAL S.A.
|
|
159
|
Item 19
ITEM 19. EXHIBITS
The following
documents are filed as part of this annual report:
|
|
|
|
|
1
|
|
Bylaws (
statuts
) of TOTAL S.A. (as amended through January 14, 2016).
|
|
2
|
|
The total amount of long-term debt securities authorized under any instrument does not exceed 10% of the total assets of the Company and its subsidiaries on a consolidated basis. We hereby
agree to furnish to the SEC, upon its request, a copy of any instrument defining the rights of holders of long-term debt of the Company or of its subsidiaries for which consolidated or unconsolidated financial statements are required to be
filed.
|
|
7.1
|
|
Ratio of earnings to fixed charges.
|
|
7.2
|
|
Computation of earnings to fixed charges.
|
|
8
|
|
List of Subsidiaries (see Note 35 to the Consolidated Financial Statements included in this Annual Report).
|
|
11
|
|
Code of Ethics (incorporated by reference to the Company’s Annual Report on Form 20-F for the year ended December 31, 2014, filed on March 26, 2015, as amended on March 27,
2015).
|
|
12.1
|
|
Certification of Chief Executive Officer.
|
|
12.2
|
|
Certification of Chief Financial Officer.
|
|
13.1
|
|
Certification of Chief Executive Officer.
|
|
13.2
|
|
Certification of Chief Financial Officer.
|
|
15.1
|
|
Consent of ERNST & YOUNG AUDIT and of KPMG S.A.
|
|
15.2
|
|
Consent of DeGolyer and MacNaughton.
|
|
15.3
|
|
Third party report of DeGolyer and MacNaughton.
|
SIGNATURE
The registrant hereby certifies that it meets all of the requirements for filing on Form 20-F and that it has duly caused and authorized the undersigned to sign
this annual report on its behalf.
|
|
|
|
|
TOTAL S.A.
|
|
|
|
|
By:
|
|
/
S
/ P
ATRICK
P
OUYANNÉ
|
|
|
|
Name: Patrick Pouyanné
|
|
|
|
Title: Chairman and Chief Executive Officer
|
Date: March 16, 2016
|
|
|
|
|
160
|
|
TOTAL S.A. Form 20-F 2015
|
|
|
|
|
|
KPMG Audit
Tour EQHO
2 Avenue Gambetta
CS 60055
92066 Paris la Défense Cedex
France
|
|
ERNST & YOUNG Audit
1/2, place des
Saisons
92400 Courbevoie – Paris La Défense 1
France
|
TOTAL S.A.
Registered
office: 2, place Jean Millier – La Défense 6 – 92400 Courbevoie – France
REPORT OF
INDEPENDENT REGISTERED PUBLIC ACCOUNTING FIRMS ON THE CONSOLIDATED FINANCIAL STATEMENTS
Year ended December 31, 2015
The Board of Directors and Shareholders,
We have audited the
accompanying consolidated balance sheets of TOTAL S.A. and subsidiaries (“the Company”) as of December 31, 2015, 2014 and 2013, and the related consolidated statements of income, comprehensive income, cash flows and changes in
shareholders’ equity for each of the years in the three-year period ended December 31, 2015. These consolidated financial statements are the responsibility of the Company’s management. Our responsibility is to express an opinion on these
consolidated financial statements based on our audits.
We conducted our audits in accordance with the standards of the Public Company Accounting
Oversight Board (United States). Those standards require that we plan and perform the audit to obtain reasonable assurance about whether the financial statements are free of material misstatement. An audit includes examining, on a test basis,
evidence supporting the amounts and disclosures in the financial statements. An audit also includes assessing the accounting principles used and significant estimates made by management, as well as evaluating the overall financial statement
presentation. We believe that our audits provide a reasonable basis for our opinion.
In our opinion, the consolidated financial statements referred to
above present fairly, in all material respects, the consolidated financial position of the Company as of December 31, 2015, 2014 and 2013, and the consolidated results of its operations and its consolidated cash flows for each of the years in the
three-year period ended December 31, 2015, in conformity with International Financial Reporting Standards as adopted by the European Union and in conformity with International Financial Reporting Standards as issued by the International Accounting
Standards Board.
We also have audited, in accordance with the standards of the Public Company Accounting Oversight Board (United States), the
Company’s internal control over financial reporting as of December 31, 2015, based on criteria established in Internal Control – Integrated Framework (2013) issued by the Committee of Sponsoring Organizations of the Treadway Commission
(COSO), and our report dated March 15, 2016 expressed an unqualified opinion on the effectiveness of the Company’s internal control over financial reporting.
Paris La Défense, March 15, 2016
|
|
|
|
|
|
|
|
|
|
|
|
|
|
|
|
|
|
|
KPMG Audit
|
|
|
|
ERNST & YOUNG Audit
|
|
/s/ M
ICHEL
P
IETTE
|
|
|
|
/s/ V
ALéRIE
B
ESSON
|
|
|
|
/s/ Y
VON
S
ALAüN
|
|
|
|
/s/ L
AURENT
M
IANNAY
|
|
Michel Piette
|
|
|
|
Valérie Besson
|
|
|
|
Yvon Salaün
|
|
|
|
Laurent Miannay
|
|
Partner
|
|
|
|
Partner
|
|
|
|
Partner
|
|
|
|
Partner
|
|
|
|
|
|
2015 Form 20-F TOTAL S.A.
|
|
F-1
|
|
|
|
|
|
KPMG Audit
Tour EQHO
2 Avenue Gambetta
CS 60055
92066 Paris la Défense Cedex
France
|
|
ERNST & YOUNG Audit
1/2, place des
Saisons
92400 Courbevoie – Paris La Défense 1
France
|
TOTAL S.A.
Registered
office: 2, place Jean Millier – La Défense 6 – 92400 Courbevoie – France
REPORT OF
INDEPENDENT REGISTERED PUBLIC ACCOUNTING FIRMS ON THE INTERNAL CONTROL OVER FINANCIAL REPORTING
Year ended December 31, 2015
The Board of Directors and Shareholders,
We have audited TOTAL S.A.
and subsidiaries’ (“the Company”) internal control over financial reporting as of December 31, 2015, based on criteria established in
Internal Control – Integrated Framework (2013)
issued by the Committee of
Sponsoring Organizations of the Treadway Commission (COSO). The Company’s management is responsible for maintaining effective internal control over financial reporting and for its assessment of the effectiveness of internal control over
financial reporting, included in the accompanying Management’s Annual Report on Internal Control Over Financial Reporting. Our responsibility is to express an opinion on the Company’s internal control over financial reporting based on our
audit.
We conducted our audit in accordance with the standards of the Public Company Accounting Oversight Board (United States). Those standards require
that we plan and perform the audit to obtain reasonable assurance about whether effective internal control over financial reporting was maintained in all material respects. Our audit included obtaining an understanding of internal control over
financial reporting, assessing the risk that a material weakness exists, and testing and evaluating the design and operating effectiveness of internal control based on the assessed risk. Our audit also included performing such other procedures as we
considered necessary in the circumstances. We believe that our audit provides a reasonable basis for our opinion.
A company’s internal control over
financial reporting is a process designed to provide reasonable assurance regarding the reliability of financial reporting and the preparation of financial statements for external purposes in accordance with generally accepted accounting principles.
A company’s internal control over financial reporting includes those policies and procedures that (1) pertain to the maintenance of records that, in reasonable detail, accurately and fairly reflect the transactions and dispositions of the
assets of the company; (2) provide reasonable assurance that transactions are recorded as necessary to permit preparation of financial statements in accordance with generally accepted accounting principles, and that receipts and expenditures of
the company are being made only in accordance with authorizations of management and directors of the company; and (3) provide reasonable assurance regarding prevention or timely detection of unauthorized acquisition, use, or disposition of the
company’s assets that could have a material effect on the financial statements.
Because of its inherent limitations, internal control over
financial reporting may not prevent or detect misstatements. Also, projections of any evaluation of effectiveness to future periods are subject to the risk that controls may become inadequate because of changes in conditions, or that the degree of
compliance with the policies or procedures may deteriorate.
In our opinion, the Company maintained, in all material respects, effective internal control
over financial reporting as of December 31, 2015, based on criteria established in
Internal Control – Integrated Framework (2013)
issued by the Committee of Sponsoring Organizations of the Treadway Commission (COSO).
We also have audited, in accordance with the standards of the Public Company Accounting Oversight Board (United States), the consolidated balance sheets of the
Company as of December 31, 2015, 2014 and 2013, and the related consolidated statements of income, comprehensive income, cash flows and changes in shareholders’ equity for each of the years in the three-year period ended December 31, 2015, and
our report dated March 15, 2016 expressed an unqualified opinion on those consolidated financial statements.
Paris La Défense, March 15, 2016
|
|
|
|
|
|
|
|
|
|
|
|
|
|
|
|
|
|
|
KPMG Audit
|
|
|
|
ERNST & YOUNG Audit
|
|
/s/ M
ICHEL
P
IETTE
|
|
|
|
/s/ V
ALéRIE
B
ESSON
|
|
|
|
/s/ Y
VON
S
ALAüN
|
|
|
|
/s/ L
AURENT
M
IANNAY
|
|
Michel Piette
|
|
|
|
Valérie Besson
|
|
|
|
Yvon Salaün
|
|
|
|
Laurent Miannay
|
|
Partner
|
|
|
|
Partner
|
|
|
|
Partner
|
|
|
|
Partner
|
|
|
|
|
|
F-2
|
|
TOTAL S.A. Form 20-F 2015
|
Consolidated Financial Statements
Consolidated statement of income
TOTAL
|
|
|
|
|
|
|
|
|
|
|
|
|
|
|
|
|
|
|
For the year ended December 31,
(M$)
(a)
|
|
|
|
|
2015
|
|
|
2014
|
|
|
2013
|
|
|
Sales
|
|
|
(Notes 4 & 5
|
)
|
|
|
165,357
|
|
|
|
236,122
|
|
|
|
251,725
|
|
|
Excise taxes
|
|
|
|
|
|
|
(21,936
|
)
|
|
|
(24,104
|
)
|
|
|
(23,756
|
)
|
|
Revenues from sales
|
|
|
|
|
|
|
143,421
|
|
|
|
212,018
|
|
|
|
227,969
|
|
|
Purchases, net of inventory variation
|
|
|
(Note 6
|
)
|
|
|
(96,671
|
)
|
|
|
(152,975
|
)
|
|
|
(160,849
|
)
|
|
Other operating expenses
|
|
|
(Note 6
|
)
|
|
|
(24,345
|
)
|
|
|
(28,349
|
)
|
|
|
(28,764
|
)
|
|
Exploration costs
|
|
|
(Note 6
|
)
|
|
|
(1,991
|
)
|
|
|
(1,964
|
)
|
|
|
(2,169
|
)
|
|
Depreciation, depletion and impairment of tangible assets and mineral interests
|
|
|
|
|
|
|
(17,720
|
)
|
|
|
(19,656
|
)
|
|
|
(11,994
|
)
|
|
Other income
|
|
|
(Note 7
|
)
|
|
|
3,606
|
|
|
|
2,577
|
|
|
|
2,290
|
|
|
Other expense
|
|
|
(Note 7
|
)
|
|
|
(1,577
|
)
|
|
|
(954
|
)
|
|
|
(2,800
|
)
|
|
Financial interest on debt
|
|
|
|
|
|
|
(967
|
)
|
|
|
(748
|
)
|
|
|
(889
|
)
|
|
Financial income from marketable securities & cash equivalents
|
|
|
|
|
|
|
94
|
|
|
|
108
|
|
|
|
85
|
|
|
Cost of net debt
|
|
|
(Note 29
|
)
|
|
|
(873
|
)
|
|
|
(640
|
)
|
|
|
(804
|
)
|
|
Other financial income
|
|
|
(Note 8
|
)
|
|
|
882
|
|
|
|
821
|
|
|
|
696
|
|
|
Other financial expense
|
|
|
(Note 8
|
)
|
|
|
(654
|
)
|
|
|
(676
|
)
|
|
|
(702
|
)
|
|
Equity in net income (loss) of affiliates
|
|
|
(Note 12
|
)
|
|
|
2,361
|
|
|
|
2,662
|
|
|
|
3,415
|
|
|
Income taxes
|
|
|
(Note 9
|
)
|
|
|
(1,653
|
)
|
|
|
(8,614
|
)
|
|
|
(14,767
|
)
|
|
Consolidated net income
|
|
|
|
|
|
|
4,786
|
|
|
|
4,250
|
|
|
|
11,521
|
|
|
Group share
|
|
|
|
|
|
|
5,087
|
|
|
|
4,244
|
|
|
|
11,228
|
|
|
Non-controlling interests
|
|
|
|
|
|
|
(301
|
)
|
|
|
6
|
|
|
|
293
|
|
|
Earnings per share ($)
|
|
|
|
|
|
|
2.17
|
|
|
|
1.87
|
|
|
|
4.96
|
|
|
Fully-diluted earnings per share ($)
|
|
|
|
|
|
|
2.16
|
|
|
|
1.86
|
|
|
|
4.94
|
|
|
(a)
|
Except for per share amounts.
|
|
|
|
|
|
2015 Form 20-F TOTAL S.A.
|
|
F-3
|
Consolidated Financial Statements
Consolidated statement of comprehensive income
TOTAL
|
|
|
|
|
|
|
|
|
|
|
|
|
|
|
For the year ended December 31, (M$)
|
|
2015
|
|
|
2014
|
|
|
2013
|
|
|
Consolidated net income
|
|
|
4,786
|
|
|
|
4,250
|
|
|
|
11,521
|
|
|
Other comprehensive income
|
|
|
|
|
|
|
|
|
|
|
|
|
|
Actuarial gains and losses
|
|
|
557
|
|
|
|
(1,526
|
)
|
|
|
682
|
|
|
Tax effect
|
|
|
(278
|
)
|
|
|
580
|
|
|
|
(287
|
)
|
|
Currency translation adjustment generated by the parent company
|
|
|
(7,268
|
)
|
|
|
(9,039
|
)
|
|
|
3,129
|
|
|
Items not potentially reclassifiable to profit and loss
|
|
|
(6,989
|
)
|
|
|
(9,985
|
)
|
|
|
3,524
|
|
|
Currency translation adjustment
|
|
|
2,456
|
|
|
|
4,245
|
|
|
|
(1,925
|
)
|
|
Available for sale financial assets
|
|
|
9
|
|
|
|
(29
|
)
|
|
|
33
|
|
|
Cash flow hedge
|
|
|
(185
|
)
|
|
|
97
|
|
|
|
156
|
|
|
Share of other comprehensive income of equity affiliates, net amount
|
|
|
120
|
|
|
|
(1,538
|
)
|
|
|
(805
|
)
|
|
Other
|
|
|
1
|
|
|
|
3
|
|
|
|
(12
|
)
|
|
Tax effect
|
|
|
53
|
|
|
|
(18
|
)
|
|
|
(62
|
)
|
|
Items potentially reclassifiable to profit and loss
|
|
|
2,454
|
|
|
|
2,760
|
|
|
|
(2,615
|
)
|
|
Total other comprehensive income (net amount)
(Note 17)
|
|
|
(4,535
|
)
|
|
|
(7,225
|
)
|
|
|
909
|
|
|
Comprehensive income
|
|
|
251
|
|
|
|
(2,975
|
)
|
|
|
12,430
|
|
|
— Group share
|
|
|
633
|
|
|
|
(2,938
|
)
|
|
|
12,193
|
|
|
— Non-controlling interests
|
|
|
(382
|
)
|
|
|
(37
|
)
|
|
|
237
|
|
|
|
|
|
|
F-4
|
|
TOTAL S.A. Form 20-F 2015
|
Consolidated Financial Statements
Consolidated balance sheet
TOTAL
|
|
|
|
|
|
|
|
|
|
|
|
|
|
|
|
|
|
|
As of December 31, (M$)
|
|
|
|
|
2015
|
|
|
2014
|
|
|
2013
|
|
|
ASSETS
|
|
|
|
|
|
|
|
|
|
|
|
|
|
|
|
|
|
Non-current assets
|
|
|
|
|
|
|
|
|
|
|
|
|
|
|
|
|
|
Intangible assets, net
|
|
|
(Notes 5 & 10
|
)
|
|
|
14,549
|
|
|
|
14,682
|
|
|
|
18,395
|
|
|
Property, plant and equipment, net
|
|
|
(Notes 5 & 11
|
)
|
|
|
109,518
|
|
|
|
106,876
|
|
|
|
104,480
|
|
|
Equity affiliates: investments and loans
|
|
|
(Note 12
|
)
|
|
|
19,384
|
|
|
|
19,274
|
|
|
|
20,417
|
|
|
Other investments
|
|
|
(Note 13
|
)
|
|
|
1,241
|
|
|
|
1,399
|
|
|
|
1,666
|
|
|
Hedging instruments of non-current financial debt
|
|
|
(Note 20
|
)
|
|
|
1,219
|
|
|
|
1,319
|
|
|
|
1,418
|
|
|
Deferred income taxes
|
|
|
(Note 9
|
)
|
|
|
3,982
|
|
|
|
4,079
|
|
|
|
3,838
|
|
|
Other non-current assets
|
|
|
(Note 14
|
)
|
|
|
4,355
|
|
|
|
4,192
|
|
|
|
4,406
|
|
|
Total non-current assets
|
|
|
|
|
|
|
154,248
|
|
|
|
151,821
|
|
|
|
154,620
|
|
|
Current assets
|
|
|
|
|
|
|
|
|
|
|
|
|
|
|
|
|
|
Inventories, net
|
|
|
(Note 15
|
)
|
|
|
13,116
|
|
|
|
15,196
|
|
|
|
22,097
|
|
|
Accounts receivable, net
|
|
|
(Note 16
|
)
|
|
|
10,629
|
|
|
|
15,704
|
|
|
|
23,422
|
|
|
Other current assets
|
|
|
(Note 16
|
)
|
|
|
15,843
|
|
|
|
15,702
|
|
|
|
14,892
|
|
|
Current financial assets
|
|
|
(Note 20
|
)
|
|
|
6,190
|
|
|
|
1,293
|
|
|
|
739
|
|
|
Cash and cash equivalents
|
|
|
(Note 27
|
)
|
|
|
23,269
|
|
|
|
25,181
|
|
|
|
20,200
|
|
|
Assets classified as held for sale
|
|
|
(Note 34
|
)
|
|
|
1,189
|
|
|
|
4,901
|
|
|
|
3,253
|
|
|
Total current assets
|
|
|
|
|
|
|
70,236
|
|
|
|
77,977
|
|
|
|
84,603
|
|
|
Total assets
|
|
|
|
|
|
|
224,484
|
|
|
|
229,798
|
|
|
|
239,223
|
|
|
LIABILITIES & SHAREHOLDERS’ EQUITY
|
|
|
|
|
|
|
|
|
|
|
|
|
|
|
|
|
|
Shareholders’ equity
|
|
|
|
|
|
|
|
|
|
|
|
|
|
|
|
|
|
Common shares
|
|
|
|
|
|
|
7,670
|
|
|
|
7,518
|
|
|
|
7,493
|
|
|
Paid-in surplus and retained earnings
|
|
|
|
|
|
|
101,528
|
|
|
|
94,646
|
|
|
|
98,254
|
|
|
Currency translation adjustment
|
|
|
|
|
|
|
(12,119
|
)
|
|
|
(7,480
|
)
|
|
|
(1,203
|
)
|
|
Treasury shares
|
|
|
|
|
|
|
(4,585
|
)
|
|
|
(4,354
|
)
|
|
|
(4,303
|
)
|
|
Total shareholders’ equity — Group share
|
|
|
(Note 17
|
)
|
|
|
92,494
|
|
|
|
90,330
|
|
|
|
100,241
|
|
|
Non-controlling interests
|
|
|
|
|
|
|
2,915
|
|
|
|
3,201
|
|
|
|
3,138
|
|
|
Total shareholders’ equity
|
|
|
|
|
|
|
95,409
|
|
|
|
93,531
|
|
|
|
103,379
|
|
|
Non-current liabilities
|
|
|
|
|
|
|
|
|
|
|
|
|
|
|
|
|
|
Deferred income taxes
|
|
|
(Note 9
|
)
|
|
|
12,360
|
|
|
|
14,810
|
|
|
|
17,850
|
|
|
Employee benefits
|
|
|
(Note 18
|
)
|
|
|
3,774
|
|
|
|
4,758
|
|
|
|
4,235
|
|
|
Provisions and other non-current liabilities
|
|
|
(Note 19
|
)
|
|
|
17,502
|
|
|
|
17,545
|
|
|
|
17,517
|
|
|
Non-current financial debt
|
|
|
(Note 20
|
)
|
|
|
44,464
|
|
|
|
45,481
|
|
|
|
34,574
|
|
|
Total non-current liabilities
|
|
|
|
|
|
|
78,100
|
|
|
|
82,594
|
|
|
|
74,176
|
|
|
Current liabilities
|
|
|
|
|
|
|
|
|
|
|
|
|
|
|
|
|
|
Accounts payable
|
|
|
|
|
|
|
20,928
|
|
|
|
24,150
|
|
|
|
30,282
|
|
|
Other creditors and accrued liabilities
|
|
|
(Note 21
|
)
|
|
|
16,884
|
|
|
|
16,641
|
|
|
|
18,948
|
|
|
Current borrowings
|
|
|
(Note 20
|
)
|
|
|
12,488
|
|
|
|
10,942
|
|
|
|
11,193
|
|
|
Other current financial liabilities
|
|
|
(Note 20
|
)
|
|
|
171
|
|
|
|
180
|
|
|
|
381
|
|
|
Liabilities directly associated with the assets classified as held for sale
|
|
|
(Note 34
|
)
|
|
|
504
|
|
|
|
1,760
|
|
|
|
864
|
|
|
Total current liabilities
|
|
|
|
|
|
|
50,975
|
|
|
|
53,673
|
|
|
|
61,668
|
|
|
Total liabilities & shareholders’ equity
|
|
|
|
|
|
|
224,484
|
|
|
|
229,798
|
|
|
|
239,223
|
|
|
|
|
|
|
2015 Form 20-F TOTAL S.A.
|
|
F-5
|
Consolidated Financial Statements
Consolidated statement of cash flow
TOTAL
(Note 27)
|
|
|
|
|
|
|
|
|
|
|
|
|
|
|
For the year ended December 31, (M$)
|
|
2015
|
|
|
2014
|
|
|
2013
|
|
|
CASH FLOW FROM OPERATING ACTIVITIES
|
|
|
|
|
|
|
|
|
|
|
|
|
|
Consolidated net income
|
|
|
4,786
|
|
|
|
4,250
|
|
|
|
11,521
|
|
|
Depreciation, depletion, amortization and impairment
|
|
|
19,334
|
|
|
|
20,859
|
|
|
|
13,358
|
|
|
Non-current liabilities, valuation allowances, and deferred taxes
|
|
|
(2,563
|
)
|
|
|
(1,980
|
)
|
|
|
1,567
|
|
|
Impact of coverage of pension benefit plans
|
|
|
—
|
|
|
|
—
|
|
|
|
—
|
|
|
(Gains) losses on disposals of assets
|
|
|
(2,459
|
)
|
|
|
(1,979
|
)
|
|
|
(80
|
)
|
|
Undistributed affiliates’ equity earnings
|
|
|
(311
|
)
|
|
|
29
|
|
|
|
(775
|
)
|
|
(Increase) decrease in working capital
|
|
|
1,683
|
|
|
|
4,480
|
|
|
|
2,525
|
|
|
Other changes, net
|
|
|
(524
|
)
|
|
|
(51
|
)
|
|
|
397
|
|
|
Cash flow from operating activities
|
|
|
19,946
|
|
|
|
25,608
|
|
|
|
28,513
|
|
|
CASH FLOW USED IN INVESTING ACTIVITIES
|
|
|
|
|
|
|
|
|
|
|
|
|
|
Intangible assets and property, plant and equipment additions
|
|
|
(25,132
|
)
|
|
|
(26,320
|
)
|
|
|
(29,748
|
)
|
|
Acquisitions of subsidiaries, net of cash acquired
|
|
|
(128
|
)
|
|
|
(471
|
)
|
|
|
(21
|
)
|
|
Investments in equity affiliates and other securities
|
|
|
(513
|
)
|
|
|
(949
|
)
|
|
|
(1,756
|
)
|
|
Increase in non-current loans
|
|
|
(2,260
|
)
|
|
|
(2,769
|
)
|
|
|
(2,906
|
)
|
|
Total expenditures
|
|
|
(28,033
|
)
|
|
|
(30,509
|
)
|
|
|
(34,431
|
)
|
|
Proceeds from disposals of intangible assets and property, plant and equipment
|
|
|
2,623
|
|
|
|
3,442
|
|
|
|
1,766
|
|
|
Proceeds from disposals of subsidiaries, net of cash sold
|
|
|
2,508
|
|
|
|
136
|
|
|
|
2,654
|
|
|
Proceeds from disposals of non-current investments
|
|
|
837
|
|
|
|
1,072
|
|
|
|
330
|
|
|
Repayment of non-current loans
|
|
|
1,616
|
|
|
|
1,540
|
|
|
|
1,649
|
|
|
Total divestments
|
|
|
7,584
|
|
|
|
6,190
|
|
|
|
6,399
|
|
|
Cash flow used in investing activities
|
|
|
(20,449
|
)
|
|
|
(24,319
|
)
|
|
|
(28,032
|
)
|
|
CASH FLOW USED IN FINANCING ACTIVITIES
|
|
|
|
|
|
|
|
|
|
|
|
|
|
Issuance (repayment) of shares:
|
|
|
|
|
|
|
|
|
|
|
|
|
|
—Parent company shareholders
|
|
|
485
|
|
|
|
420
|
|
|
|
485
|
|
|
—Treasury shares
|
|
|
(237
|
)
|
|
|
(289
|
)
|
|
|
(238
|
)
|
|
Dividends paid:
|
|
|
|
|
|
|
|
|
|
|
|
|
|
—Parent company shareholders
|
|
|
(2,845
|
)
|
|
|
(7,308
|
)
|
|
|
(7,128
|
)
|
|
—Non-controlling interests
|
|
|
(100
|
)
|
|
|
(154
|
)
|
|
|
(156
|
)
|
|
Issuance of perpetual subordinated notes
|
|
|
5,616
|
|
|
|
—
|
|
|
|
—
|
|
|
Payments on perpetual subordinated notes
|
|
|
—
|
|
|
|
—
|
|
|
|
—
|
|
|
Other transactions with non-controlling interests
|
|
|
89
|
|
|
|
179
|
|
|
|
2,153
|
|
|
Net issuance (repayment) of non-current debt
|
|
|
4,166
|
|
|
|
15,786
|
|
|
|
11,102
|
|
|
Increase (decrease) in current borrowings
|
|
|
(597
|
)
|
|
|
(2,374
|
)
|
|
|
(9,037
|
)
|
|
Increase (decrease) in current financial assets and liabilities
|
|
|
(5,517
|
)
|
|
|
(351
|
)
|
|
|
1,298
|
|
|
Cash flow used in financing activities
|
|
|
1,060
|
|
|
|
5,909
|
|
|
|
(1,521
|
)
|
|
Net increase (decrease) in cash and cash equivalents
|
|
|
557
|
|
|
|
7,198
|
|
|
|
(1,040
|
)
|
|
Effect of exchange rates
|
|
|
(2,469
|
)
|
|
|
(2,217
|
)
|
|
|
831
|
|
|
Cash and cash equivalents at the beginning of the period
|
|
|
25,181
|
|
|
|
20,200
|
|
|
|
20,409
|
|
|
Cash and cash equivalents at the end of the period
|
|
|
23,269
|
|
|
|
25,181
|
|
|
|
20,200
|
|
|
|
|
|
|
F-6
|
|
TOTAL S.A. Form 20-F 2015
|
Consolidated Financial Statements
Consolidated statement of changes in shareholders’ equity
TOTAL
|
|
|
|
|
|
|
|
|
|
|
|
|
|
|
|
|
|
|
|
|
|
|
|
|
|
|
|
|
|
|
|
|
|
|
|
|
|
|
|
|
Common shares issued
|
|
|
Paid-in surplus
and retained
earnings
|
|
|
Currency
translation
adjustment
|
|
|
Treasury shares
|
|
|
Shareholders’
equity-Group
share
|
|
|
Non-controlling
interests
|
|
|
Total
shareholders’
equity
|
|
|
(M$)
|
|
Number
|
|
|
Amount
|
|
|
|
|
Number
|
|
|
Amount
|
|
|
|
|
|
As of January 1, 2013
|
|
|
2,365,933,146
|
|
|
|
7,454
|
|
|
|
92,485
|
|
|
|
(1,696
|
)
|
|
|
(108,391,639
|
)
|
|
|
(4,274
|
)
|
|
|
93,969
|
|
|
|
1,689
|
|
|
|
95,658
|
|
|
Net income 2013
|
|
|
—
|
|
|
|
—
|
|
|
|
11,228
|
|
|
|
—
|
|
|
|
—
|
|
|
|
—
|
|
|
|
11,228
|
|
|
|
293
|
|
|
|
11,521
|
|
|
Other comprehensive income
.
(Note 17)
|
|
|
—
|
|
|
|
—
|
|
|
|
473
|
|
|
|
492
|
|
|
|
—
|
|
|
|
—
|
|
|
|
965
|
|
|
|
(56
|
)
|
|
|
909
|
|
|
Comprehensive income
|
|
|
—
|
|
|
|
—
|
|
|
|
11,701
|
|
|
|
492
|
|
|
|
—
|
|
|
|
—
|
|
|
|
12,193
|
|
|
|
237
|
|
|
|
12,430
|
|
|
Dividend
|
|
|
—
|
|
|
|
—
|
|
|
|
(7,116
|
)
|
|
|
—
|
|
|
|
—
|
|
|
|
—
|
|
|
|
(7,116
|
)
|
|
|
(156
|
)
|
|
|
(7,272
|
)
|
|
Issuance of common shares
.
(Note 17)
|
|
|
11,745,014
|
|
|
|
39
|
|
|
|
446
|
|
|
|
—
|
|
|
|
—
|
|
|
|
—
|
|
|
|
485
|
|
|
|
—
|
|
|
|
485
|
|
|
Purchase of treasury shares
|
|
|
—
|
|
|
|
—
|
|
|
|
—
|
|
|
|
—
|
|
|
|
(4,414,200
|
)
|
|
|
(238
|
)
|
|
|
(238
|
)
|
|
|
—
|
|
|
|
(238
|
)
|
|
Sale of treasury shares
(a)
|
|
|
—
|
|
|
|
—
|
|
|
|
(209
|
)
|
|
|
—
|
|
|
|
3,591,391
|
|
|
|
209
|
|
|
|
—
|
|
|
|
—
|
|
|
|
—
|
|
|
Share-based payments
.
(Note 25)
|
|
|
—
|
|
|
|
—
|
|
|
|
189
|
|
|
|
—
|
|
|
|
—
|
|
|
|
—
|
|
|
|
189
|
|
|
|
—
|
|
|
|
189
|
|
|
Share cancellation
.
(Note 17)
|
|
|
—
|
|
|
|
—
|
|
|
|
—
|
|
|
|
—
|
|
|
|
—
|
|
|
|
—
|
|
|
|
—
|
|
|
|
—
|
|
|
|
—
|
|
|
Other operations with non-controlling interests
|
|
|
—
|
|
|
|
—
|
|
|
|
749
|
|
|
|
1
|
|
|
|
—
|
|
|
|
—
|
|
|
|
750
|
|
|
|
1,355
|
|
|
|
2,105
|
|
|
Other items
|
|
|
—
|
|
|
|
—
|
|
|
|
9
|
|
|
|
—
|
|
|
|
—
|
|
|
|
—
|
|
|
|
9
|
|
|
|
13
|
|
|
|
22
|
|
|
As of December 31, 2013
|
|
|
2,377,678,160
|
|
|
|
7,493
|
|
|
|
98,254
|
|
|
|
(1,203
|
)
|
|
|
(109,214,448
|
)
|
|
|
(4,303
|
)
|
|
|
100,241
|
|
|
|
3,138
|
|
|
|
103,379
|
|
|
Net income 2014
|
|
|
—
|
|
|
|
—
|
|
|
|
4,244
|
|
|
|
—
|
|
|
|
—
|
|
|
|
—
|
|
|
|
4,244
|
|
|
|
6
|
|
|
|
4,250
|
|
|
Other comprehensive income
.
(Note 17)
|
|
|
—
|
|
|
|
—
|
|
|
|
(907
|
)
|
|
|
(6,275
|
)
|
|
|
—
|
|
|
|
—
|
|
|
|
(7,182
|
)
|
|
|
(43
|
)
|
|
|
(7,225
|
)
|
|
Comprehensive income
|
|
|
—
|
|
|
|
—
|
|
|
|
3,337
|
|
|
|
(6,275
|
)
|
|
|
—
|
|
|
|
—
|
|
|
|
(2,938
|
)
|
|
|
(37
|
)
|
|
|
(2,975
|
)
|
|
Dividend
|
|
|
—
|
|
|
|
—
|
|
|
|
(7,378
|
)
|
|
|
—
|
|
|
|
—
|
|
|
|
—
|
|
|
|
(7,378
|
)
|
|
|
(154
|
)
|
|
|
(7,532
|
)
|
|
Issuance of common shares
.
(Note 17)
|
|
|
7,589,365
|
|
|
|
25
|
|
|
|
395
|
|
|
|
—
|
|
|
|
—
|
|
|
|
—
|
|
|
|
420
|
|
|
|
—
|
|
|
|
420
|
|
|
Purchase of treasury shares
|
|
|
—
|
|
|
|
—
|
|
|
|
—
|
|
|
|
—
|
|
|
|
(4,386,300
|
)
|
|
|
(283
|
)
|
|
|
(283
|
)
|
|
|
—
|
|
|
|
(283
|
)
|
|
Sale of treasury shares
(a)
|
|
|
—
|
|
|
|
—
|
|
|
|
(232
|
)
|
|
|
—
|
|
|
|
4,239,335
|
|
|
|
232
|
|
|
|
—
|
|
|
|
—
|
|
|
|
—
|
|
|
Share-based payments
.
(Note 25)
|
|
|
—
|
|
|
|
—
|
|
|
|
114
|
|
|
|
—
|
|
|
|
—
|
|
|
|
—
|
|
|
|
114
|
|
|
|
—
|
|
|
|
114
|
|
|
Share cancellation
.
(Note 17)
|
|
|
—
|
|
|
|
—
|
|
|
|
—
|
|
|
|
—
|
|
|
|
—
|
|
|
|
—
|
|
|
|
—
|
|
|
|
—
|
|
|
|
—
|
|
|
Other operations with non-controlling interests
|
|
|
—
|
|
|
|
—
|
|
|
|
148
|
|
|
|
(2
|
)
|
|
|
—
|
|
|
|
—
|
|
|
|
146
|
|
|
|
195
|
|
|
|
341
|
|
|
Other items
|
|
|
—
|
|
|
|
—
|
|
|
|
8
|
|
|
|
—
|
|
|
|
—
|
|
|
|
—
|
|
|
|
8
|
|
|
|
59
|
|
|
|
67
|
|
|
As of December 31, 2014
|
|
|
2,385,267,525
|
|
|
|
7,518
|
|
|
|
94,646
|
|
|
|
(7,480
|
)
|
|
|
(109,361,413
|
)
|
|
|
(4,354
|
)
|
|
|
90,330
|
|
|
|
3,201
|
|
|
|
93,531
|
|
|
Net income 2015
|
|
|
—
|
|
|
|
—
|
|
|
|
5,087
|
|
|
|
—
|
|
|
|
—
|
|
|
|
—
|
|
|
|
5,087
|
|
|
|
(301
|
)
|
|
|
4,786
|
|
|
Other comprehensive income
.
(Note 17)
|
|
|
—
|
|
|
|
—
|
|
|
|
185
|
|
|
|
(4,639
|
)
|
|
|
—
|
|
|
|
—
|
|
|
|
(4,454
|
)
|
|
|
(81
|
)
|
|
|
(4,535
|
)
|
|
Comprehensive income
|
|
|
—
|
|
|
|
—
|
|
|
|
5,272
|
|
|
|
(4,639
|
)
|
|
|
—
|
|
|
|
—
|
|
|
|
633
|
|
|
|
(382
|
)
|
|
|
251
|
|
|
Dividend
|
|
|
—
|
|
|
|
—
|
|
|
|
(6,303
|
)
|
|
|
—
|
|
|
|
—
|
|
|
|
—
|
|
|
|
(6,303
|
)
|
|
|
(100
|
)
|
|
|
(6,403
|
)
|
|
Issuance of common shares
.
(Note 17)
|
|
|
54,790,358
|
|
|
|
152
|
|
|
|
2,159
|
|
|
|
—
|
|
|
|
—
|
|
|
|
—
|
|
|
|
2,311
|
|
|
|
—
|
|
|
|
2,311
|
|
|
Purchase of treasury shares
|
|
|
—
|
|
|
|
—
|
|
|
|
—
|
|
|
|
—
|
|
|
|
(4,711,935
|
)
|
|
|
(237
|
)
|
|
|
(237
|
)
|
|
|
—
|
|
|
|
(237
|
)
|
|
Sale of treasury shares
(a)
|
|
|
—
|
|
|
|
—
|
|
|
|
(6
|
)
|
|
|
—
|
|
|
|
105,590
|
|
|
|
6
|
|
|
|
—
|
|
|
|
—
|
|
|
|
—
|
|
|
Share-based payments
.
(Note 25)
|
|
|
—
|
|
|
|
—
|
|
|
|
101
|
|
|
|
—
|
|
|
|
—
|
|
|
|
—
|
|
|
|
101
|
|
|
|
—
|
|
|
|
101
|
|
|
Share cancellation
.
(Note 17)
|
|
|
—
|
|
|
|
—
|
|
|
|
—
|
|
|
|
—
|
|
|
|
—
|
|
|
|
—
|
|
|
|
—
|
|
|
|
—
|
|
|
|
—
|
|
|
Issuance of perpetual subordinated notes
|
|
|
—
|
|
|
|
—
|
|
|
|
5,616
|
|
|
|
—
|
|
|
|
—
|
|
|
|
—
|
|
|
|
5,616
|
|
|
|
—
|
|
|
|
5,616
|
|
|
Payments on perpetual subordinated notes
|
|
|
—
|
|
|
|
—
|
|
|
|
(114
|
)
|
|
|
—
|
|
|
|
—
|
|
|
|
—
|
|
|
|
(114
|
)
|
|
|
—
|
|
|
|
(114
|
)
|
|
Other operations with non-controlling interests
|
|
|
—
|
|
|
|
—
|
|
|
|
23
|
|
|
|
—
|
|
|
|
—
|
|
|
|
—
|
|
|
|
23
|
|
|
|
64
|
|
|
|
87
|
|
|
Other items
|
|
|
—
|
|
|
|
—
|
|
|
|
134
|
|
|
|
—
|
|
|
|
—
|
|
|
|
—
|
|
|
|
134
|
|
|
|
132
|
|
|
|
266
|
|
|
As of December 31, 2015
|
|
|
2,440,057,883
|
|
|
|
7,670
|
|
|
|
101,528
|
|
|
|
(12,119
|
)
|
|
|
(113,967,758
|
)
|
|
|
(4,585
|
)
|
|
|
92,494
|
|
|
|
2,915
|
|
|
|
95,409
|
|
|
(a)
|
Treasury shares related to the restricted stock grants.
|
|
|
|
|
|
2015 Form 20-F TOTAL S.A.
|
|
F-7
|
Notes to the Consolidated Financial Statements
TOTAL
Notes to the Consolidated Financial Statements
On February 10, 2016, the Board of Directors established and authorized the publication of the Consolidated
Financial Statements of TOTAL S.A. for the year ended December 31, 2015, which will be submitted for approval to the shareholders’ meeting to be held on May 24, 2016.
Basis of preparation of the consolidated financial statements
The Consolidated Financial Statements of TOTAL
S.A. and its subsidiaries (the Group) are presented in U.S. dollars and have been prepared on the basis of IFRS (International Financial Reporting Standards) as adopted by the European Union and IFRS as issued by the IASB (International Accounting
Standard Board) as of December 31, 2015.
The accounting policies and principles applied in the Consolidated Financial Statements as of
December 31, 2015 were the same as those that were used as of December 31, 2014 except for standards, amendments and interpretations of IFRS which were mandatory for the periods beginning after January 1, 2015 (and not early adopted).
Their application did not have a significant impact on the financial statements as of December 31, 2015.
Major judgments and accounting
estimates
The preparation of financial statements in accordance with IFRS for the closing as of December 31, 2015 requires the executive
management to make estimates, judgments and assumptions considered reasonable, which affect the consolidated financial statements and their notes. Different estimates, assumptions and judgments could have significant impacts on the consolidated
financial statements and their notes and consequently the final achievements could also be different from the amounts included in the consolidated financial statements.
These estimates, assumptions and judgments are regularly reviewed if circumstances change or as a result of new information or changes in the Group’s experience; they could therefore be significantly changed
later.
The main estimates, judgments and assumptions can have a significant impact in the following cases:
|
|
•
|
|
Estimation of hydrocarbon reserves
|
The
estimation of oil and gas reserves is a key factor in the Successful Efforts method used by the Group to account for its oil and gas activities.
The
Group’s oil and gas reserves are estimated by the Group’s petroleum engineers in accordance with industry standards and SEC (U.S. Securities and Exchange Commission
)
regulations.
Proved oil and gas reserves are those quantities of oil and gas, which, by analysis of geosciences and engineering data, can be determined with reasonable certainty
to be recoverable (from a given date forward, from known reservoirs, and under existing economic conditions, operating methods, and government regulations), prior to the time at which contracts providing the rights to operate expire, unless evidence
indicates that renewal is reasonably certain, regardless of whether deterministic or probabilistic methods are used for the estimation.
Proved oil and
gas reserves are calculated using a 12-month average price determined as the unweighted arithmetic average of
the first-day-of-the-month price for each month of the relevant year unless prices are defined by contractual arrangements, excluding escalations based upon future conditions. The Group
reassesses its oil and gas reserves at least once a year on all its properties.
The Successful Efforts method of accounting is presented in Note 1
“Accounting principles” section H.
For mineral interests and property and equipment of exploration and production, see Notes 10 and 11.
As part of the
determination of the recoverable value of assets for impairment (IAS36), the estimates, assumptions and judgments mainly concern hydrocarbon prices scenarios, operating costs, production volumes and oil and gas proved reserves, refining margins and
product marketing conditions (mainly petroleum, petrochemical and chemical products as well as solar industry products). The estimates and assumptions used by the executive management are determined in specialized internal departments in light of
economic conditions and external expert analysis. The discount rate is reviewed annually.
The paragraph L of Note 1 “Accounting principles”
describes the method applied for the impairment of fixed assets.
For asset impairment, see section D of Note 4 “Information by business
segment”.
The benefit
obligations and plan assets can be subject to significant volatility due in part to changes in market values and actuarial assumptions. These assumptions vary between different pension plans and thus take into account local conditions. They are
determined following a formal process involving expertise and Group internal judgments, in financial and actuarial terms, and also in consultation with actuaries and independent experts.
The assumptions for each plan are reviewed annually and adjusted if necessary to reflect changes from the experience and actuarial advices.
The section R of Note 1 “Accounting principles” describes the methods applied for employee benefits accounting.
For employee benefits, see Note 18.
|
|
•
|
|
Asset retirement obligations
|
Asset
retirement obligations, which result from a legal or constructive obligation, are recognized based on a reasonable estimate in the period in which the obligation arises.
This estimate is based on information available in terms of costs and work program. It is regularly reviewed to take into account the changes in laws and regulations, the estimates of reserves and production, the
analysis of site conditions and technologies.
The discount rate is reviewed annually.
Section Q of Note 1 “Accounting policies” describes the methods used to account for asset retirement obligations.
For asset retirement obligations, see Note 19 “Provisions and other non-current liabilities”.
|
|
|
|
|
F-8
|
|
TOTAL S.A. Form 20-F 2015
|
Notes to the Consolidated Financial Statements
A tax liability is
recognized when a future payment, in application of a tax regulation, is considered probable and can be reasonably estimated. The exercise of judgment is required to assess the impact of new events on the amount of the liability.
Deferred tax assets are recognized in the accounts to the extent that their recovery is considered probable. The amount of these assets is determined based on
future taxable profits estimated inherently uncertain and subject to change over time. The exercise of judgment is required to assess the impact of new events on the value of these assets and including changes in estimates of future taxable profits
and the deadlines for their use.
In addition, these tax positions may depend on interpretations of tax laws and regulations in the countries where the
Group operates. These interpretations may have uncertain nature.
Depending on the circumstances, they are final only after negotiations or resolution of disputes with authorities that can last several years.
Section F of Note 1 “Accounting policies” describes the accounting methods for income taxes. For the income tax, see Note 9.
|
|
•
|
|
Transactions not addressed by any accounting standard or interpretation
|
Furthermore, when the accounting treatment of a specific transaction is not addressed by any accounting standard or interpretation, the management applies its judgment to define and apply accounting policies that
provide information consistent with the general IFRS concepts: faithful representation, relevance and materiality.
|
|
|
|
|
2015 Form 20-F TOTAL S.A.
|
|
F-9
|
Notes to the Consolidated Financial Statements – Note 1
1)
Accounting policies
Pursuant to the accrual basis of accounting followed by the Group, the financial statements reflect the effects of transactions and other events when they occur. Assets and liabilities such as property, plant and
equipment and intangible assets are usually measured at cost. Assets and liabilities are measured at fair value when required by the standards.
Accounting policies used by the Group are described below:
A)
Principles of consolidation
Entities that are directly controlled by the parent company or indirectly controlled by other consolidated entities are
fully consolidated.
Investments in joint ventures are consolidated under the equity method. The Group accounts for joint operations by recognizing its
share of assets, liabilities, income and expenses.
Investments in associates, in which the Group has significant influence, are accounted for by the
equity method. Significant influence is presumed when the Group holds, directly or indirectly (e.g. through subsidiaries), 20% or more of the voting rights. Companies in which ownership interest is less than 20%, but over which the Company is deemed
to exercise significant influence, are also accounted for by the equity method.
All internal balances, transactions and income are eliminated.
B) Business combinations
Business combinations
are accounted for using the acquisition method. This method requires the recognition of the acquired identifiable assets, assumed liabilities and any non-controlling interest in the companies acquired by the Group at their fair value.
The value of the purchase price is finalized up to a maximum of one year from the acquisition date.
The acquirer shall recognize goodwill at the acquisition date, being the excess of:
|
•
|
|
The consideration transferred, the amount of non-controlling interests and, in business combinations achieved in stages, the fair value at the acquisition date
of the investment previously held in the acquired company;
|
|
•
|
|
Over the fair value at the acquisition date of acquired identifiable assets and assumed liabilities.
|
If the consideration transferred is lower than the fair value of acquired identifiable assets and assumed liabilities, an additional analysis is performed on the
identification and valuation of the identifiable elements of the assets and liabilities. After having completed such additional analysis any residual negative goodwill is recorded as income.
In transactions with non-controlling interests, the difference between the price paid (received) and the book value of non-controlling interests acquired (sold) is recognized directly in equity.
C) Foreign currency translation
The presentation currency of
the Group’s Consolidated Financial Statements is the U.S. dollar. However the functional currency of the parent company is the euro. The resulting currency translation adjustments are presented on the line “currency translation adjustment
generated by the parent company” of the consolidated statement of comprehensive income, within “items not potentially reclassifiable to profit and loss”. In the balance sheet, they are recorded in “currency translation
adjustment”.
The financial statements of subsidiaries are prepared in the currency that most clearly reflects their business
environment. This is referred to as their functional currency.
|
(i)
|
Monetary transactions
|
Transactions denominated in
foreign currencies other than the functional currency of the entity are translated at the exchange rate on the transaction date. At each balance sheet date, monetary assets and liabilities are translated at the closing rate and the resulting
exchange differences are recognized in the statement of income.
|
(ii)
|
Translation of financial statements denominated in foreign currencies
|
Assets and liabilities of foreign entities are translated into dollars on the basis of the exchange rates at the end of the period. The income and cash flow statements are translated using the average exchange
rates for the period. Foreign exchange differences resulting from such translations are either recorded in shareholders’ equity under “Currency translation adjustments” (for the Group share) or under “Non-controlling
interests” (for the share of non-controlling interests) as deemed appropriate
.
D) Sales and revenues from sales
Sales figures include excise taxes collected by the Group within the course of its oil distribution operations. Excise taxes are deducted from sales in order to
obtain the “Revenues from sales” indicator.
Revenues from sales are recognized when the
significant risks and rewards of ownership have been passed to the buyer and when the amount is recoverable and can be reasonably measured.
Revenues
from sales of crude oil, natural gas and coal are recorded upon transfer of title, according to the terms of the sales contracts.
Revenues from the
production of crude oil and natural gas properties, in which the Group has an interest with other producers, are recognized based on actual volumes sold during the period. Any difference between volumes sold and entitlement volumes, based on the
Group net working interest, is recognized as “Crude oil and natural gas inventories” or “Other current assets” or “Other creditors and accrued liabilities”, as appropriate.
Quantities delivered that represent production royalties and taxes, when paid in cash, are included in oil and gas sales, except for the United States and Canada.
Certain transactions within the trading activities (contracts involving quantities that are purchased from third parties then resold to third parties)
are shown at their net value in sales.
Exchanges of crude oil and petroleum products within normal trading activities do not generate any income and
therefore these flows are shown at their net value in both the statement of income and the balance sheet.
Revenues from services are recognized when
the services have been rendered.
Revenues from gas transport are recognized when services are rendered. These revenues are based on the quantities
transported and measured according to procedures defined in each service contract.
Shipping revenues and expenses from time-charter activities are
recognized on a pro rata basis over a period that commences
|
|
|
|
|
F-10
|
|
TOTAL S.A. Form 20-F 2015
|
Note 1 – Notes to the Consolidated Financial Statements
upon the unloading of the previous voyage and terminates upon the unloading of the current voyage. Shipping revenue
recognition starts only when a charter has been agreed to by both the Group and the customer.
|
(iii)
|
Solar Farm Development Projects
|
SunPower develops and sells
solar farm projects. This activity generally contains a property component (land ownership or an interest in land rights). The revenue associated with the development of these projects is recognized when the project-entities and land rights are
irrevocably sold.
Revenues under contracts for construction of solar systems are recognized based on the progress of construction works, measured
according to the percentage of costs incurred relative to total forecast costs.
E) Share-based payments
The Group may grant employees stock options, create employee share purchase plans and offer its employees the opportunity to subscribe to reserved capital
increases. These employee benefits are recognized as expenses with a corresponding credit to shareholders’ equity.
The expense is equal to the fair
value of the instruments granted. The expense is recognized on a straight-line basis over the period in which the advantages are acquired.
The fair
value of the options is calculated using the Black-Scholes model at the grant date.
For restricted share plans, the fair value is calculated using the
market price at the grant date after deducting the expected distribution rate during the vesting period. The number of allocated equity instruments can be revised during the vesting period in cases of non compliance with performance conditions, with
the exception of those related to the market, or according to the rate of turnover of the beneficiaries.
The cost of employee-reserved capital increases
is immediately expensed. A discount reduces the expense in order to account for the non-transferability of the shares awarded to the employees over a period of five years.
F) Income taxes
Income taxes disclosed in the statement of income include the current tax expenses (or income)
and the deferred tax expenses (or income).
The expense (or income) of current tax is the estimated amount of the tax due for the taxable income of the
period.
The Group uses the method whereby deferred income taxes are recorded based on the temporary differences between the carrying amounts of assets
and liabilities recorded in the balance sheet and their tax bases, and on carry-forwards of unused tax losses and tax credits.
Deferred tax assets and
liabilities are measured using the tax rates that have been enacted or substantially enacted at the balance sheet date. The tax rates used depend on the timing of reversals of temporary differences, tax losses and other tax credits. The effect of a
change in tax rate is recognized either in the Consolidated Statement of Income or in shareholders’ equity depending on the item it relates to.
Deferred tax resulting from temporary differences between the carrying amounts of equity-method investments and their tax bases are recognized. The deferred tax
calculation is based on the expected future tax effect (dividend distribution rate or tax rate on capital gains).
G) Earnings per share
Earnings per share is calculated by dividing net income (Group share) by the weighted-average number of common shares outstanding during the period, excluding TOTAL shares held by TOTAL S.A. (Treasury shares) and
TOTAL shares held by the Group subsidiaries which are deducted from consolidated shareholders’ equity.
Diluted earnings per share is calculated by
dividing net income (Group share) by the fully-diluted weighted-average number of common shares outstanding during the period. Treasury shares held by the parent company, TOTAL S.A., and TOTAL shares held by the Group subsidiaries are deducted from
consolidated shareholders’ equity. These shares are not considered outstanding for purposes of this calculation which also takes into account the dilutive effect of stock options, share grants and capital increases with a subscription period
closing after the end of the fiscal year.
The weighted-average number of fully-diluted shares is calculated in accordance with the treasury stock method
provided for by IAS 33. The proceeds, which would be recovered in the event of an exercise of rights related to dilutive instruments, are presumed to be a share buyback at the average market price over the period. The number of shares thereby
obtained leads to a reduction in the total number of shares that would result from the exercise of rights.
In compliance with IAS 33, earnings per share
and diluted earnings per share are based on the net income after deduction of the remuneration due to the holders of deeply subordinated notes.
H)
Oil and gas exploration and producing properties
The Group applies IFRS 6 “Exploration for and Evaluation of Mineral Resources”. Oil and
gas exploration and production properties and assets are accounted for in accordance with the Successful Efforts method.
Geological and geophysical costs,
including seismic surveys for exploration purposes are expensed as incurred.
Mineral interests are capitalized as intangible assets when acquired. These
acquired interests are tested for impairment on a regular basis, property-by-property, based on the results of the exploratory activity and the management’s evaluation.
In the event of a discovery, the unproved mineral interests are transferred to proved mineral interests at their net book value as soon as proved reserves are booked.
Exploratory wells are tested for impairment on a well-by-well basis and accounted for as follows:
|
–
|
|
Costs of exploratory wells which result in proved reserves are capitalized and then depreciated using the unit-of-production method based on proved developed
reserves;
|
|
–
|
|
Costs of dry wells and wells that have not found proved reserves are charged to expense;
|
|
–
|
|
Costs of exploratory wells are temporarily capitalized until a determination is made as to whether the well has found proved reserves if both of the following
conditions are met:
|
|
|
•
|
|
The well has found a sufficient quantity of reserves to justify, if appropriate, its completion as a producing well, assuming that the required capital
expenditures are made;
|
|
|
•
|
|
The Group is making sufficient progress assessing the reserves and the economic and operating viability of the project. This progress is evaluated on the basis
of indicators such as whether additional exploratory works are under way or firmly planned (wells, seismic or
|
|
|
|
|
|
2015 Form 20-F TOTAL S.A.
|
|
F-11
|
Notes to the Consolidated Financial Statements – Note 1
|
|
|
significant studies), whether costs are being incurred for development studies and whether the Group is waiting for governmental or other third-party authorization of a proposed project, or
availability of capacity on an existing transport or processing facility.
|
Costs of exploratory wells not meeting these conditions are
charged to expense.
|
(ii)
|
Oil and Gas producing assets
|
Development costs incurred for
the drilling of development wells and for the construction of production facilities are capitalized, together with borrowing costs incurred during the period of construction and the present value of estimated future costs of asset retirement
obligations. The depletion rate is equal to the ratio of oil and gas production for the period to proved developed reserves (unit-of-production method).
With respect to phased development projects or projects subject to progressive well production start-up, the fixed assets’ depreciable amount, excluding
production or service wells, is adjusted to exclude the portion of development costs attributable to the undeveloped reserves of these projects.
With
respect to production sharing contracts, this computation is based on the portion of production and reserves assigned to the Group taking into account estimates based on the contractual clauses regarding the reimbursement of exploration, development
and production costs (cost oil/gas) as well as the sharing of hydrocarbon rights (profit oil/gas).
Hydrocarbon transportation and processing assets are
depreciated using the unit-of-production method based on throughput or by using the straight-line method whichever best reflects the duration of use of the economic life of the asset.
Proved mineral interests are depreciated using the unit-of-production method based on proved reserves.
I) Goodwill
and other intangible assets excluding mineral interests
Other intangible assets include goodwill, patents, trademarks, and lease rights.
Intangible assets are carried at cost, after deducting any accumulated depreciation and accumulated impairment losses.
Guidance for calculating goodwill is presented in Note 1 paragraph B to the Consolidated Financial Statements. Goodwill is not amortized but is tested for
impairment annually or as soon as there is any indication of impairment (see Note 1 paragraph L to the Consolidated Financial Statements).
In equity
affiliates, goodwill is included in the investment book value.
Other intangible assets (except goodwill) have a finite useful life and are amortized on
a straight-line basis over between three to twenty years depending on the useful life of the assets.
Research and development
Research costs are charged to expense as incurred.
Development
expenses are capitalized when the criteria of IAS38 are met.
Advertising costs are charged to expense as incurred.
J) Other property, plant and equipment
Other property, plant
and equipment are carried at cost, after deducting any accumulated depreciation and accumulated impairment losses. This cost includes borrowing costs directly
attributable to the acquisition or production of a qualifying asset incurred until assets are placed in service. Borrowing costs are capitalized as follows:
|
|
•
|
|
if the project benefits from a specific funding, the capitalization of borrowing costs is based on the borrowing rate;
|
|
|
•
|
|
if the project is financed by all the Group’s debt, the capitalization of borrowing costs is based on the weighted average borrowing cost for the period.
|
Routine maintenance and repairs are charged to expense as incurred. The costs of major turnarounds of refineries and large
petrochemical units are capitalized as incurred and depreciated over the period of time between two consecutive major turnarounds.
Other property, plant
and equipment are depreciated using the straight-line method over their useful lives, which are as follows:
|
|
|
|
|
• Furniture, office equipment, machinery and tools
|
|
3-12 years
|
|
• Transportation equipment
|
|
5-20 years
|
|
• Storage tanks and related equipment
|
|
10-15 years
|
|
• Specialized complex installations and pipelines
|
|
10-30 years
|
|
• Buildings
|
|
10-50 years
|
K) Leases
A finance lease
transfers substantially all the risks and rewards incidental to ownership from the lessor to the lessee. These contracts are capitalized as assets at fair value or, if lower, at the present value of the minimum lease payments according to the
contract. A corresponding financial debt is recognized as a financial liability. These assets are depreciated over the corresponding useful life used by the Group.
Leases that are not finance leases as defined above are recorded as operating leases.
Certain arrangements do not
take the legal form of a lease but convey the right to use an asset or a group of assets in return for fixed payments. Such arrangements are accounted for as leases and are analyzed to determine whether they should be classified as operating leases
or as finance leases.
L) Impairment of long-lived assets
The recoverable amounts of intangible assets and property, plant and equipment are tested for impairment as soon as any indication of impairment exists. This test is performed at least annually for goodwill.
The recoverable amount is the higher of the fair value (less costs to sell) or its value in use.
Assets are grouped into cash-generating units (or CGUs) and tested. A CGU is a homogeneous group of assets that generates cash inflows that are largely independent
of the cash inflows from other groups of assets.
The value in use of a CGU is determined by reference to the discounted expected future cash flows,
based upon the management’s expectation of future economic and operating conditions. When this value is less than the carrying amount of the CGU, an impairment loss is recorded. It is allocated first to goodwill with a corresponding amount in
“Other expenses”. These impairment losses are then allocated to property, plant and mineral interests with a corresponding amount in “Depreciation, depletion and impairment of tangible assets and mineral interests” and to other
intangible assets with a corresponding amount in “Other expenses”.
|
|
|
|
|
F-12
|
|
TOTAL S.A. Form 20-F 2015
|
Note 1 – Notes to the Consolidated Financial Statements
Impairment losses recognized in prior periods can be reversed up to the original carrying amount, had the impairment
loss not been recognized. Impairment losses recognized for goodwill cannot be reversed.
M) Financial assets and liabilities
Financial assets and liabilities are financial loans and receivables, investments in non-consolidated companies, publicly traded equity securities, derivatives
instruments and current and non-current financial liabilities.
The accounting treatment of these financial assets and liabilities is as follows:
|
(i)
|
Loans and receivables
|
Financial loans and receivables are
recognized at amortized cost. They are tested for impairment, by comparing the carrying amount of the assets to estimates of the discounted future recoverable cash flows. These tests are conducted as soon as there is any evidence that their fair
value is less than their carrying amount, and at least annually. Any impairment loss is recorded in the statement of income.
These assets are classified as financial
assets available for sale and therefore measured at their fair value. For listed securities, this fair value is equal to the market price. For unlisted securities, if the fair value is not reliably determinable, the securities are recorded at their
historical value. Changes in fair value are recorded in other comprehensive income. If there is any evidence of a significant or long-lasting impairment loss, a loss is recorded in the statement of income. This impairment is irreversible.
|
(iii)
|
Derivative instruments
|
The Group uses derivative instruments
to manage its exposure to risks of changes in interest rates, foreign exchange rates and commodity prices. Changes in fair value of derivative instruments are recognized in the statement of income or in other comprehensive income and are recognized
in the balance sheet in the accounts corresponding to their nature, according to the risk management strategy described in Note 31 to the Consolidated Financial Statements. The derivative instruments used by the Group are the following:
Financial
instruments used for cash management purposes are part of a hedging strategy of currency and interest rate risks within global limits set by the Group and are considered to be used for transactions (held for trading). Changes in fair value are
systematically recorded in the statement of income. The balance sheet value of those instruments is included in “Current financial assets” or “Other current financial liabilities”.
When
an external long-term financing is set up, specifically to finance subsidiaries, and when this financing involves currency and interest rate derivatives, these instruments are qualified as:
|
|
i.
|
Fair value hedge of the interest rate risk on the external debt and of the currency risk of the loans to subsidiaries. Changes in fair value of derivatives are recognized in the
statement of income as are changes in fair value of underlying financial debts and loans to subsidiaries.
|
The fair value
of those hedging instruments of long-term financing is included in assets under “Hedging instruments on non-current financial debt” or in liabilities
under “Non-current financial debt “for the non-current portion. The current portion (less than one year) is accounted for in “Current financial assets” or “Other current
financial liabilities”.
In case of the anticipated termination of derivative instruments accounted for as fair value hedges, the
amount paid or received is recognized in the statement of income and:
|
|
•
|
|
If this termination is due to an early cancellation of the hedged items, the adjustment previously recorded as revaluation of those hedged items is also
recognized in the statement of income;
|
|
|
•
|
|
If the hedged items remain in the balance sheet, the adjustment previously recorded as a revaluation of those hedged items is spread over the remaining life of
those items.
|
|
|
ii.
|
Cash flow hedge of the currency risk of the external debt. Changes in fair value are recorded in Other comprehensive Income for the effective portion of the hedging and in the
statement of income for the ineffective portion of the hedging. Amounts recorded in equity are transferred to the income statement when the hedged transaction affects profit or loss.
|
The fair value of those hedging instruments of long-term financing is included in assets under “Hedging instruments on non-current financial
debt” or in liabilities under “Non-current financial debt” for the non-current portion. The current portion (less than one year) is accounted for in “Current financial assets” or “Other current financial
liabilities”.
If the hedging instrument expires, is sold or terminated by anticipation, gains or losses previously recognized in
equity remain in equity. Amounts are recycled to the income statement only when the hedged transaction affects profit or loss.
|
–
|
|
Foreign subsidiaries’ equity hedge
|
Certain financial instruments hedge against risks related to the equity of foreign subsidiaries whose functional currency is not the euro (mainly the dollar). These instruments qualify as “net investment
hedges” and changes in fair value are recorded in other comprehensive income for the effective portion of the hedging and in the statement of income for the ineffective portion of the hedging. Gains or losses on hedging instruments previously
recorded in equity, are reclassified to the statement of income in the same period as the total or partial disposal of the foreign activity.
The fair
value of these instruments is recorded under “Current financial assets” or “Other current financial liabilities”.
|
–
|
|
Financial instruments related to commodity contracts, forward freight agreements
|
Financial instruments related to commodity contracts, including crude oil, petroleum products, gas, power and coal purchase/sales contracts within the trading
activities, together with the commodity contract derivative instruments such as energy contracts and forward freight agreements, are used to adjust the Group’s exposure to price fluctuations within global trading limits. According to the
industry practice, these instruments are considered as held for trading
.
Changes in fair value are recorded in the statement of income. The fair value of these instruments is recorded in “Other current assets” or “Other
creditors and accrued liabilities” depending on whether they are assets or liabilities.
|
|
|
|
|
2015 Form 20-F TOTAL S.A.
|
|
F-13
|
Notes to the Consolidated Financial Statements – Note 1
Detailed information about derivatives positions is disclosed in Notes 20, 28, 29, 30 and 31 to the Consolidated
Financial Statements.
|
(iv)
|
Current and non-current financial liabilities
|
Current and
non-current financial liabilities (excluding derivatives) are recognized at amortized cost, except those for which hedge accounting can be applied as described in the previous paragraph (iii) Derivative instruments.
|
(v)
|
Fair value of financial instruments
|
Fair values are
estimated for the majority of the Group’s financial instruments, with the exception of publicly traded equity securities and marketable securities for which the market price is used.
Estimations of fair value, which are based on principles such as discounting future cash flows to present value, must be weighted by the fact that the value of a financial instrument at a given time may be
influenced by the market environment (liquidity especially), and also the fact that subsequent changes in interest rates and exchange rates are not taken into account.
As a consequence, the use of different estimates, methodologies and assumptions could have a material effect on the estimated fair value amounts.
The methods used are as follows:
The market value
of swaps and of bonds that are hedged by those swaps has been determined on an individual basis by discounting future cash flows with the zero coupon interest rate curves existing at year-end.
|
–
|
|
Financial instruments related to commodity contracts
|
The valuation methodology is to mark-to-market all open positions for both physical and paper transactions. The valuations are determined on a daily basis using observable market data based on organized and over
the counter (OTC) markets. In particular cases when market data is not directly available, the valuations are derived from observable data such as arbitrages, freight or spreads and market corroboration. For valuation of risks which are the result
of a calculation, such as options for example, commonly known models are used to compute the fair value.
|
–
|
|
Other financial instruments
|
The
fair value of the interest rate swaps and of FRA’s (Forward Rate Agreements) are calculated by discounting future cash flows on the basis of zero coupon interest rate curves existing at year-end after adjustment for interest accrued but unpaid.
Forward exchange contracts and currency swaps are valued on the basis of a comparison of the negotiated forward rates with the rates in effect on the financial markets at year-end for similar maturities.
Exchange options are valued based on the Garman-Kohlhagen model including market quotations at year-end.
|
(vi)
|
Commitments to purchase shares held by non-controlling interests (put options written on minority interests)
|
Put options granted to non-controlling-interest shareholders are initially recognized as financial liabilities at the present value of the exercise price of the
options with a corresponding reduction in shareholders’ equity. The financial liability is subsequently measured at fair value at each balance sheet date in accordance with contractual clauses and any variation is recorded in the statement of
income (cost of debt).
N) Inventories
Inventories are measured in the Consolidated Financial Statements at the lower of historical cost or market value. Costs for petroleum and petrochemical products
are determined according to the FIFO (First-In, First-Out) method and other inventories are measured using the weighted-average cost method.
In addition
stocks held for trading are measured at fair value less costs of sale.
Refining & Chemicals
Petroleum product inventories are mainly comprised of crude oil and refined products. Refined products principally consist of gasoline, kerosene, diesel, fuel oil
and heating oil produced by the Group’s refineries. The turnover of petroleum products does not exceed more than two months on average.
Crude oil
costs include raw material and receiving costs. Refining costs principally include crude oil costs, production costs (energy, labor, depreciation of producing assets) and an allocation of production overheads (taxes, maintenance, insurance, etc.).
Costs of chemical product inventories consist of raw material costs, direct labor costs and an allocation of production overheads. Start-up costs,
general administrative costs and financing costs are excluded from the cost price of refined and chemicals products.
Marketing & Services
The costs of refined products include mainly crude oil costs, production costs (energy, labor, depreciation of producing assets) and an allocation
of production overheads (taxes, maintenance, insurance, etc.).
Start-up costs, general administrative costs and financing costs are excluded from the
cost price of refined products.
Product inventories purchased from entities external to the Group are valued at their purchase cost plus primary costs
of transport.
O) Treasury shares
Treasury shares
of the parent company held by its subsidiaries or itself are deducted from consolidated shareholders’ equity. Gains or losses on sales of treasury shares are excluded from the determination of net income and are recognized in shareholders’
equity.
P) Provisions and other non-current liabilities
A provision is recognized when the Group has a present obligation (legal or constructive) as a result of a past event for which it is probable that an outflow of resources will be required and when a reliable
estimate can be made regarding the amount of the obligation. The amount of the liability corresponds to the best possible estimate.
Provisions and
non-current liabilities are comprised of liabilities for which the amount and the timing are uncertain. They arise from environmental risks, legal and tax risks, litigation and other risks.
Q) Asset retirement obligations
Asset retirement obligations, which result from a legal or constructive
obligation, are recognized based on a reasonable estimate in the period in which the obligation arises.
The associated asset retirement costs are
capitalized as part of the carrying amount of the underlying asset and depreciated over the useful life of this asset.
|
|
|
|
|
F-14
|
|
TOTAL S.A. Form 20-F 2015
|
Note 1 – Notes to the Consolidated Financial Statements
An entity is required to measure changes in the liability for an asset retirement obligation due to the passage of
time (accretion) by applying a risk-free discount rate to the amount of the liability. Given the long term nature of expenditures related to our asset retirement obligations, the rate is determined by reference to the high quality rates for AA-rated
Corporate bonds on the USD area for a long-term horizon. The increase of the provision due to the passage of time is recognized as “Other financial expense”.
R) Employee benefits
In accordance with the laws and practices of each country, the Group participates in
employee benefit plans offering retirement, death and disability, healthcare and special termination benefits. These plans provide benefits based on various factors such as length of service, salaries, and contributions made to the governmental
bodies responsible for the payment of benefits.
These plans can be either defined contribution or defined benefit pension plans and may be entirely or
partially funded with investments made in various non-Group instruments such as mutual funds, insurance contracts, and other instruments.
For defined
contribution plans, expenses correspond to the contributions paid.
Defined benefit obligations are determined according to the Projected Unit Method.
Actuarial gains and losses may arise from differences between actuarial valuation and projected commitments (depending on new calculations or assumptions) and between projected and actual return of plan assets. Such gains and losses are recognized
in the statement of comprehensive income, with no possibility to subsequently recycle them to the income statement.
The past service cost is recorded
immediately in the statement of income, whether vested or unvested.
The net periodic pension cost is recognized under “Other operating
expenses”.
S) Consolidated Statement of Cash Flows
The Consolidated Statement of Cash Flows prepared in foreign currencies has been translated into dollars using the exchange rate on the transaction date or the average exchange rate for the period. Currency
translation differences arising from the translation of monetary assets and liabilities denominated in foreign currency into dollars using the closing exchange rates are shown in the Consolidated Statement of Cash Flows under “Effect of
exchange rates”. Therefore, the Consolidated Statement of Cash Flows will not agree with the figures derived from the Consolidated Balance Sheet.
Cash and cash equivalents
Cash and cash equivalents are
comprised of cash on hand and highly liquid short-term investments that are easily convertible into known amounts of cash and are subject to insignificant risks of changes in value.
Investments with maturity greater than three months and less than twelve months are shown under “Current financial assets”.
Changes in current financial assets and liabilities are included in the financing activities section of the Consolidated Statement of Cash Flows.
Non-current financial debt
Changes in non-current financial debt are presented as the net variation to reflect
significant changes mainly related to revolving credit agreements.
T) Carbon dioxide emission rights
In the absence of a current IFRS standard or interpretation on accounting for emission rights of carbon dioxide, the following principles are applied:
|
–
|
|
Emission rights are managed as a cost of production and as such are recognized in inventories:
|
|
|
•
|
|
Emission rights allocated for free are booked in inventories with a nil carrying amount,
|
|
|
•
|
|
Purchased emission rights are booked at acquisition cost,
|
|
|
•
|
|
Sales or annual restorations of emission rights consist of decreases in inventories recognized based on a weighted average cost,
|
|
|
•
|
|
If the carrying amount of inventories at closing date is higher than the market value, an impairment loss is recorded.
|
|
–
|
|
At each closing, a provision is recorded in order to materialize the obligation to surrender emission rights related to the emissions of the period. This
provision is calculated based on estimated emissions of the period, valued at weighted average cost of the inventories at the end of the period. It is reversed when the emission rights are surrendered.
|
|
–
|
|
If emission rights to be surrendered at the end of the compliance period are higher than emission rights recorded in inventories, the shortage is accounted for
as a liability at market value.
|
|
–
|
|
Forward transactions are recognized at their fair market value in the balance sheet. Changes in the fair value of such forward transactions are recognized in the
statement of income.
|
U) Energy savings certificates
In the absence of current IFRS standards or interpretations on accounting for energy savings certificates (ESC), the following principles are applied:
|
–
|
|
If the obligations linked to the sales of energy are greater than the number of ESC’s held then a liability is recorded. These liabilities are valued based
on the price of the last transactions,
|
|
–
|
|
In the event that the number of ESC’s held exceeds the obligation at the balance sheet date this is accounted for as inventory,
|
|
–
|
|
ESC inventories are valued at weighted average cost (acquisition cost for those ESC’s acquired or cost incurred for those ESC’s generated internally).
|
If the carrying value of the inventory of certificates at the balance sheet date is higher than the market value, an impairment loss
is recorded.
V) Non-current assets held for sale and discontinued operations
Pursuant to IFRS 5 “Non-current assets held for sale and discontinued operations”, assets and liabilities of affiliates that are held for sale are presented separately on the face of the balance sheet.
Depreciation of assets ceases from the date of classification in “Non-current assets held for sale”.
Net income from discontinued operations
is presented separately on the face of the statement of income. Therefore, the notes to the Consolidated Financial Statements related to the statement of income only refer to continuing operations.
|
|
|
|
|
2015 Form 20-F TOTAL S.A.
|
|
F-15
|
Notes to the Consolidated Financial Statements – Note 2
A discontinued operation is a component of the Group for which cash flows are independent. It represents a major line
of business or geographical area of operations which has been disposed of or is currently being held for sale.
W) New accounting texts not yet in
effect
The standards or interpretations published respectively by the International Accounting Standards Board (IASB) and the International
Financial Reporting Interpretations Committee (IFRIC) which were not yet in effect at December 31, 2015, are as follows:
|
•
|
|
Standards not yet adopted by the European Union at December 31, 2015
|
|
–
|
|
In May 2014, the IASB issued standard IFRS 15 that includes requirements for the recognition of revenue from contracts with customers. The standard is applicable
for annual periods starting on or after January 1, 2018. The impacts of the application of this standard are under analysis.
|
|
–
|
|
In July 2014, the IASB issued standard IFRS 9 “Financial Instruments” that includes requirements for the recognition and measurement of financial
instruments. This standard brings together three phases: classification and measurement, impairment of financial assets and hedge accounting excluding macro-hedging. The standard is applicable for annual periods starting on or after
January 1, 2018. The impacts of the application of this standard are under analysis.
|
|
–
|
|
In addition, in January 2016, the IASB issued standard IFRS 16, which sets out the principles for recognition of leases contracts. The standard is applicable for
annual periods starting on or after January 1, 2019. The impacts of the application of this standard are under analysis.
|
2)
Main indicators – information by business segment
Performance indicators excluding the adjustment items, such as adjusted operating income, adjusted net operating income, and adjusted net income are meant to facilitate the analysis of the financial performance and
the comparison of income between periods.
Adjustment items
The detail of these adjustment items is presented in Note 4 to the Consolidated Financial Statements.
Adjustment
items include:
Due to their unusual nature or
particular significance, certain transactions qualified as “special items” are excluded from the business segment figures. In general, special items relate to transactions that are significant, infrequent or unusual. However, in certain
instances, transactions such as restructuring costs or assets disposals, which are not considered to be representative of the normal course of business, may be qualified as special items although they may have occurred within prior years or are
likely to occur again within the coming years.
|
(ii)
|
The inventory valuation effect
|
The adjusted results
of the Refining & Chemicals and Marketing & Services segments are presented according to the replacement cost method. This method is used to assess the segments’ performance and facilitate the comparability of the
segments’ performance with those of its competitors.
In the replacement cost method, which approximates the LIFO (Last-In, First-Out) method, the variation of inventory
values in the statement of income is, depending on the nature of the inventory, determined using either the month-end prices differential between one period and another or the average prices of the period rather than the historical value. The
inventory valuation effect is the difference between the results according to the FIFO (First-In, First-Out) and the replacement cost.
|
(iii)
|
Effect of changes in fair value
|
The effect of
changes in fair value presented as adjustment items reflects for some transactions differences between internal measure of performance used by TOTAL’s management and the accounting for these transactions under IFRS.
IFRS requires that trading inventories be recorded at their fair value using period end spot prices. In order to best reflect the management of economic exposure
through derivative transactions, internal indicators used to measure performance include valuations of trading inventories based on forward prices.
Furthermore, TOTAL, in its trading activities, enters into storage contracts, which future effects are recorded at fair value in Group’s internal economic
performance. IFRS precludes recognition of this fair value effect.
Main indicators
|
(i)
|
Operating income (measure used to evaluate operating performance)
|
Revenue from sales after deducting cost of goods sold and inventory variations, other operating expenses, exploration expenses and depreciation, depletion, and impairment of tangible assets and mineral interests.
Operating income excludes the amortization of intangible assets other than mineral interests, currency translation adjustments and gains or losses on
the disposal of assets.
|
(ii)
|
Net operating income (measure used to evaluate the return on capital employed)
|
Operating income after taking into account the amortization of intangible assets other than mineral interests, currency translation adjustments, gains or losses on the disposal of assets, as well as all other
income and expenses related to capital employed (dividends from non-consolidated companies, equity in income of affiliates, capitalized interest expenses), and after income taxes applicable to the above.
The only income and expense not included in net operating income but included in net income are interest expenses related to net financial debt, after applicable
income taxes (net cost of net debt) and non-controlling interests.
Operating income, net operating
income, or net income excluding the effect of adjustment items described above.
|
(iv)
|
Fully-diluted adjusted earnings per share
|
Adjusted
net income divided by the fully-diluted weighted-average number of common shares.
Non-current assets and working
capital, at replacement cost, net of deferred income taxes and non-current liabilities.
|
(vi)
|
ROACE (Return on Average Capital Employed)
|
Ratio of
adjusted net operating income to average capital employed between the beginning and the end of the period.
|
|
|
|
|
F-16
|
|
TOTAL S.A. Form 20-F 2015
|
Notes 3 to 4 – Notes to the Consolidated Financial Statements
|
(vii)
|
ROE (Return on Equity)
|
Ratio of adjusted consolidated
net income to average adjusted shareholders’ equity (after distribution) between the beginning and the end of the period.
Non-current debt, including current portion,
current borrowings, other current financial liabilities less cash and cash equivalents and other current financial assets.
3)
Changes in the Group
structure, main acquisitions and divestments
In 2015, the main changes in the Group structure and main acquisitions and divestments were as
follows:
|
|
•
|
|
In January 2015, TOTAL was granted a 10% interest in the new ADCO concession in Abu Dhabi (United Arab Emirates) for a duration of 40 years, effective
January 1, 2015.
|
|
|
•
|
|
TOTAL completed in March 2015 the sale of its entire stake in onshore Oil Mining Lease (OML) 29 to Aiteo Eastern E&P, a Nigerian company, for an amount of
$569 million.
|
|
|
•
|
|
In August 2015, TOTAL finalized the sale of its 100% stake in Total Coal South Africa, its coal-producing affiliate in South Africa.
|
|
|
•
|
|
In September 2015, TOTAL sold 20% of its interests in the Laggan, Tormore, Edradour and Glenlivet fields, located in the West of Shetland area in the United
Kingdom, to SSE E&P UK Limited.
|
|
|
•
|
|
In November 2015, TOTAL finalized the sale to Suncor Energy of a 10% interest in the Fort Hills oil sands mining project, in Canada.
|
|
|
•
|
|
In February 2015, TOTAL sold its Bostik adhesives activity to Arkema.
|
|
|
•
|
|
In November 2015, TOTAL sold its 16.67% interest in the Schwedt refinery in northeastern Germany (Brandenburg) to Rosneft.
|
|
|
•
|
|
In December 2015, TOTAL sold an interest of 50% plus one share in Géosel Manosque to a 50-50 consortium composed of EDF Invest and Ardian.
|
|
|
•
|
|
In May 2015, TOTAL sold 100 % of Totalgaz, distributor of liquefied petroleum gas (LPG) in France to the U.S. company UGI Corporation, the parent company of
Antargaz.
|
Information relating to sales in progress is presented in accordance with IFRS 5 “Non-current assets held for sale and
discontinued operations” in Note 34.
4)
Business segment information
Financial information by business segment is reported in accordance with the internal reporting system and shows internal segment information that is used to manage and measure the performance of TOTAL and which is
reviewed by the main operational decision-making body of the Group, namely the Executive Committee.
The operational profit and assets are broken down by
business segment prior to the consolidation and inter-segment adjustments.
Sales prices between business segments approximate market prices.
The Group’s activities are divided into three business segments as follows:
|
•
|
|
an Upstream segment including, alongside the activities of the Exploration & Production of hydrocarbons, the activities of Gas;
|
|
•
|
|
a Refining & Chemicals segment constituting a major industrial hub comprising the activities of refining, petrochemicals and specialty chemicals.
This segment also includes the activities of oil Trading & Shipping; and marine shipping;
|
|
•
|
|
a Marketing & Services segment including the global activities of supply and marketing in the field of petroleum products as well as the activity
of New Energies.
|
In addition the Corporate segment includes holdings operating and financial activities.
|
|
|
|
|
2015 Form 20-F TOTAL S.A.
|
|
F-17
|
Notes to the Consolidated Financial Statements – Note 4
A) Information by business segment
|
|
|
|
|
|
|
|
|
|
|
|
|
|
|
|
|
|
|
|
|
|
|
|
|
|
|
For the year ended December 31, 2015
(M$)
|
|
Upstream
|
|
|
Refining &
Chemicals
|
|
|
Marketing
& Services
|
|
|
Corporate
|
|
|
Intercompany
|
|
|
Total
|
|
|
Non-Group sales
|
|
|
16,840
|
|
|
|
70,623
|
|
|
|
77,887
|
|
|
|
7
|
|
|
|
—
|
|
|
|
165,357
|
|
|
Intersegment sales
|
|
|
17,927
|
|
|
|
26,794
|
|
|
|
911
|
|
|
|
218
|
|
|
|
(45,850
|
)
|
|
|
—
|
|
|
Excise taxes
|
|
|
—
|
|
|
|
(4,107
|
)
|
|
|
(17,829
|
)
|
|
|
—
|
|
|
|
—
|
|
|
|
(21,936
|
)
|
|
Revenues from sales
|
|
|
34,767
|
|
|
|
93,310
|
|
|
|
60,969
|
|
|
|
225
|
|
|
|
(45,850
|
)
|
|
|
143,421
|
|
|
Operating expenses
|
|
|
(21,851
|
)
|
|
|
(87,674
|
)
|
|
|
(58,467
|
)
|
|
|
(865
|
)
|
|
|
45,850
|
|
|
|
(123,007
|
)
|
|
Depreciation, depletion and impairment of tangible assets and mineral interests
|
|
|
(15,857
|
)
|
|
|
(1,092
|
)
|
|
|
(744
|
)
|
|
|
(27
|
)
|
|
|
—
|
|
|
|
(17,720
|
)
|
|
Operating income
|
|
|
(2,941
|
)
|
|
|
4,544
|
|
|
|
1,758
|
|
|
|
(667
|
)
|
|
|
—
|
|
|
|
2,694
|
|
|
Equity in net income (loss) of affiliates and other items
|
|
|
2,019
|
|
|
|
1,780
|
|
|
|
297
|
|
|
|
522
|
|
|
|
—
|
|
|
|
4,618
|
|
|
Tax on net operating income
|
|
|
(294
|
)
|
|
|
(1,105
|
)
|
|
|
(585
|
)
|
|
|
171
|
|
|
|
—
|
|
|
|
(1,813
|
)
|
|
Net operating income
|
|
|
(1,216
|
)
|
|
|
5,219
|
|
|
|
1,470
|
|
|
|
26
|
|
|
|
—
|
|
|
|
5,499
|
|
|
Net cost of net debt
|
|
|
|
|
|
|
|
|
|
|
|
|
|
|
|
|
|
|
|
|
|
|
(713
|
)
|
|
Non-controlling interests
|
|
|
|
|
|
|
|
|
|
|
|
|
|
|
|
|
|
|
|
|
|
|
301
|
|
|
Net income
|
|
|
|
|
|
|
|
|
|
|
|
|
|
|
|
|
|
|
|
|
|
|
5,087
|
|
|
|
|
|
|
|
|
|
|
|
|
|
|
|
|
|
|
|
|
|
|
|
|
|
|
|
|
For the year ended December 31, 2015
(adjustments)
(a)
(M$)
|
|
Upstream
|
|
|
Refining &
Chemicals
|
|
|
Marketing
& Services
|
|
|
Corporate
|
|
|
Intercompany
|
|
|
Total
|
|
|
Non-Group sales
|
|
|
(519
|
)
|
|
|
—
|
|
|
|
—
|
|
|
|
—
|
|
|
|
—
|
|
|
|
(519
|
)
|
|
Intersegment sales
|
|
|
—
|
|
|
|
—
|
|
|
|
—
|
|
|
|
—
|
|
|
|
—
|
|
|
|
—
|
|
|
Excise taxes
|
|
|
—
|
|
|
|
—
|
|
|
|
—
|
|
|
|
—
|
|
|
|
—
|
|
|
|
—
|
|
|
Revenues from sales
|
|
|
(519
|
)
|
|
|
—
|
|
|
|
—
|
|
|
|
—
|
|
|
|
—
|
|
|
|
(519
|
)
|
|
Operating expenses
|
|
|
(564
|
)
|
|
|
(1,035
|
)
|
|
|
(316
|
)
|
|
|
—
|
|
|
|
—
|
|
|
|
(1,915
|
)
|
|
Depreciation, depletion and impairment of tangible assets and mineral interests
|
|
|
(6,783
|
)
|
|
|
(70
|
)
|
|
|
(24
|
)
|
|
|
—
|
|
|
|
—
|
|
|
|
(6,877
|
)
|
|
Operating income
(b)
|
|
|
(7,866
|
)
|
|
|
(1,105
|
)
|
|
|
(340
|
)
|
|
|
—
|
|
|
|
—
|
|
|
|
(9,311
|
)
|
|
Equity in net income (loss) of affiliates and other items
|
|
|
(264
|
)
|
|
|
1,172
|
|
|
|
24
|
|
|
|
(19
|
)
|
|
|
—
|
|
|
|
913
|
|
|
Tax on net operating income
|
|
|
2,140
|
|
|
|
263
|
|
|
|
87
|
|
|
|
7
|
|
|
|
—
|
|
|
|
2,497
|
|
|
Net operating income
(b)
|
|
|
(5,990
|
)
|
|
|
330
|
|
|
|
(229
|
)
|
|
|
(12
|
)
|
|
|
—
|
|
|
|
(5,901
|
)
|
|
Net cost of net debt
|
|
|
|
|
|
|
|
|
|
|
|
|
|
|
|
|
|
|
|
(11
|
)
|
|
Non-controlling interests
|
|
|
|
|
|
|
|
|
|
|
|
|
|
|
|
|
|
|
|
481
|
|
|
Net income
|
|
|
|
|
|
|
|
|
|
|
|
|
|
|
|
|
|
|
|
(5,431
|
)
|
|
|
|
|
|
|
|
|
|
|
|
|
|
|
|
|
|
|
|
|
(a)
Adjustments
include special items, inventory valuation effect and the effect of changes in fair value.
|
|
|
|
|
|
|
|
|
|
|
(b)
Of which inventory valuation
effect
|
|
|
|
|
|
|
|
|
|
|
|
|
|
|
|
|
|
|
|
|
|
|
|
|
|
On operating income
|
|
|
—
|
|
|
|
(859
|
)
|
|
|
(254
|
)
|
|
|
—
|
|
|
|
|
|
|
|
|
|
|
On net operating income
|
|
|
—
|
|
|
|
(590
|
)
|
|
|
(169
|
)
|
|
|
—
|
|
|
|
|
|
|
|
|
|
|
|
|
|
|
F-18
|
|
TOTAL S.A. Form 20-F 2015
|
Note 4 – Notes to the Consolidated Financial Statements
|
|
|
|
|
|
|
|
|
|
|
|
|
|
|
|
|
|
|
|
|
|
|
|
|
|
|
For the year ended December 31, 2015
(adjusted) (M$)
(a)
|
|
Upstream
|
|
|
Refining &
Chemicals
|
|
|
Marketing
& Services
|
|
|
Corporate
|
|
|
Intercompany
|
|
|
Total
|
|
|
Non-Group sales
|
|
|
17,359
|
|
|
|
70,623
|
|
|
|
77,887
|
|
|
|
7
|
|
|
|
—
|
|
|
|
165,876
|
|
|
Intersegment sales
|
|
|
17,927
|
|
|
|
26,794
|
|
|
|
911
|
|
|
|
218
|
|
|
|
(45,850
|
)
|
|
|
—
|
|
|
Excise taxes
|
|
|
—
|
|
|
|
(4,107
|
)
|
|
|
(17,829
|
)
|
|
|
—
|
|
|
|
—
|
|
|
|
(21,936
|
)
|
|
Revenues from sales
|
|
|
35,286
|
|
|
|
93,310
|
|
|
|
60,969
|
|
|
|
225
|
|
|
|
(45,850
|
)
|
|
|
143,940
|
|
|
Operating expenses
|
|
|
(21,287
|
)
|
|
|
(86,639
|
)
|
|
|
(58,151
|
)
|
|
|
(865
|
)
|
|
|
45,850
|
|
|
|
(121,092
|
)
|
|
Depreciation, depletion and impairment of tangible assets and mineral interests
|
|
|
(9,074
|
)
|
|
|
(1,022
|
)
|
|
|
(720
|
)
|
|
|
(27
|
)
|
|
|
—
|
|
|
|
(10,843
|
)
|
|
Adjusted operating income
|
|
|
4,925
|
|
|
|
5,649
|
|
|
|
2,098
|
|
|
|
(667
|
)
|
|
|
—
|
|
|
|
12,005
|
|
|
Equity in net income (loss) of affiliates and other items
|
|
|
2,283
|
|
|
|
608
|
|
|
|
273
|
|
|
|
541
|
|
|
|
—
|
|
|
|
3,705
|
|
|
Tax on net operating income
|
|
|
(2,434
|
)
|
|
|
(1,368
|
)
|
|
|
(672
|
)
|
|
|
164
|
|
|
|
—
|
|
|
|
(4,310
|
)
|
|
Adjusted net operating income
|
|
|
4,774
|
|
|
|
4,889
|
|
|
|
1,699
|
|
|
|
38
|
|
|
|
—
|
|
|
|
11,400
|
|
|
Net cost of net debt
|
|
|
|
|
|
|
|
|
|
|
|
|
|
|
|
|
|
|
|
|
|
|
(702
|
)
|
|
Non-controlling interests
|
|
|
|
|
|
|
|
|
|
|
|
|
|
|
|
|
|
|
|
|
|
|
(180
|
)
|
|
Adjusted net income
|
|
|
|
|
|
|
|
|
|
|
|
|
|
|
|
|
|
|
|
|
|
|
10,518
|
|
|
Adjusted fully-diluted earnings per share ($)
|
|
|
|
|
|
|
|
|
|
|
|
|
|
|
|
|
|
|
|
|
|
|
4.51
|
|
|
(a)
Except for earnings per share.
|
|
|
|
|
|
|
|
|
|
|
|
|
|
|
|
|
|
|
|
|
|
|
|
|
|
For the year ended December 31, 2015
(M$)
|
|
Upstream
|
|
|
Refining &
Chemicals
|
|
|
Marketing
& Services
|
|
|
Corporate
|
|
|
Intercompany
|
|
|
Total
|
|
|
Total expenditures
|
|
|
24,270
|
|
|
|
1,843
|
|
|
|
1,841
|
|
|
|
79
|
|
|
|
—
|
|
|
|
28,033
|
|
|
Total divestments
|
|
|
3,215
|
|
|
|
3,488
|
|
|
|
856
|
|
|
|
25
|
|
|
|
—
|
|
|
|
7,584
|
|
|
Cash flow from operating activities
|
|
|
11,182
|
|
|
|
6,432
|
|
|
|
2,323
|
|
|
|
9
|
|
|
|
—
|
|
|
|
19,946
|
|
|
Balance sheet as of December 31, 2015
|
|
|
|
|
|
|
|
|
|
|
|
|
|
|
|
|
|
|
|
|
|
|
|
|
|
Property, plant and equipment, intangible assets, net
|
|
|
108,218
|
|
|
|
9,317
|
|
|
|
6,223
|
|
|
|
309
|
|
|
|
—
|
|
|
|
124,067
|
|
|
Investments & loans in equity affiliates
|
|
|
15,170
|
|
|
|
3,028
|
|
|
|
1,186
|
|
|
|
—
|
|
|
|
—
|
|
|
|
19,384
|
|
|
Other non-current assets
|
|
|
7,626
|
|
|
|
640
|
|
|
|
1,753
|
|
|
|
(441
|
)
|
|
|
—
|
|
|
|
9,578
|
|
|
Working capital
|
|
|
1,928
|
|
|
|
1,828
|
|
|
|
997
|
|
|
|
(2,977
|
)
|
|
|
—
|
|
|
|
1,776
|
|
|
Provisions and other non-current liabilities
|
|
|
(27,844
|
)
|
|
|
(3,784
|
)
|
|
|
(1,858
|
)
|
|
|
(150
|
)
|
|
|
—
|
|
|
|
(33,636
|
)
|
|
Assets and liabilities classified as held for sale
|
|
|
482
|
|
|
|
—
|
|
|
|
344
|
|
|
|
—
|
|
|
|
—
|
|
|
|
826
|
|
|
Capital Employed (balance sheet)
|
|
|
105,580
|
|
|
|
11,029
|
|
|
|
8,645
|
|
|
|
(3,259
|
)
|
|
|
—
|
|
|
|
121,995
|
|
|
Less inventory valuation effect
|
|
|
—
|
|
|
|
(622
|
)
|
|
|
(230
|
)
|
|
|
—
|
|
|
|
—
|
|
|
|
(852
|
)
|
|
Capital Employed
(Business segment information)
|
|
|
105,580
|
|
|
|
10,407
|
|
|
|
8,415
|
|
|
|
(3,259
|
)
|
|
|
—
|
|
|
|
121,143
|
|
|
ROACE as a percentage
|
|
|
5%
|
|
|
|
41%
|
|
|
|
20%
|
|
|
|
—
|
|
|
|
—
|
|
|
|
9%
|
|
|
|
|
|
|
2015 Form 20-F TOTAL S.A.
|
|
F-19
|
Notes to the Consolidated Financial Statements – Note 4
|
|
|
|
|
|
|
|
|
|
|
|
|
|
|
|
|
|
|
|
|
|
|
|
|
|
|
For the year ended December 31, 2014
(M$)
|
|
Upstream
|
|
|
Refining &
Chemicals
|
|
|
Marketing
& Services
|
|
|
Corporate
|
|
|
Intercompany
|
|
|
Total
|
|
|
Non-Group sales
|
|
|
23,484
|
|
|
|
106,124
|
|
|
|
106,509
|
|
|
|
5
|
|
|
|
—
|
|
|
|
236,122
|
|
|
Intersegment sales
|
|
|
29,183
|
|
|
|
44,950
|
|
|
|
1,615
|
|
|
|
236
|
|
|
|
(75,984
|
)
|
|
|
—
|
|
|
Excise taxes
|
|
|
—
|
|
|
|
(4,850
|
)
|
|
|
(19,254
|
)
|
|
|
—
|
|
|
|
—
|
|
|
|
(24,104
|
)
|
|
Revenues from sales
|
|
|
52,667
|
|
|
|
146,224
|
|
|
|
88,870
|
|
|
|
241
|
|
|
|
(75,984
|
)
|
|
|
212,018
|
|
|
Operating expenses
|
|
|
(26,235
|
)
|
|
|
(145,014
|
)
|
|
|
(86,931
|
)
|
|
|
(1,092
|
)
|
|
|
75,984
|
|
|
|
(183,288
|
)
|
|
Depreciation, depletion and impairment of tangible assets and mineral interests
|
|
|
(15,938
|
)
|
|
|
(2,901
|
)
|
|
|
(781
|
)
|
|
|
(36
|
)
|
|
|
—
|
|
|
|
(19,656
|
)
|
|
Operating income
|
|
|
10,494
|
|
|
|
(1,691
|
)
|
|
|
1,158
|
|
|
|
(887
|
)
|
|
|
—
|
|
|
|
9,074
|
|
|
Equity in net income (loss) of affiliates and other items
|
|
|
4,302
|
|
|
|
90
|
|
|
|
(140
|
)
|
|
|
178
|
|
|
|
—
|
|
|
|
4,430
|
|
|
Tax on net operating income
|
|
|
(8,799
|
)
|
|
|
391
|
|
|
|
(344
|
)
|
|
|
(8
|
)
|
|
|
—
|
|
|
|
(8,760
|
)
|
|
Net operating income
|
|
|
5,997
|
|
|
|
(1,210
|
)
|
|
|
674
|
|
|
|
(717
|
)
|
|
|
—
|
|
|
|
4,744
|
|
|
Net cost of net debt
|
|
|
|
|
|
|
|
|
|
|
|
|
|
|
|
|
|
|
|
|
|
|
(494
|
)
|
|
Non-controlling interests
|
|
|
|
|
|
|
|
|
|
|
|
|
|
|
|
|
|
|
|
|
|
|
(6
|
)
|
|
Net income
|
|
|
|
|
|
|
|
|
|
|
|
|
|
|
|
|
|
|
|
|
|
|
4,244
|
|
|
|
|
|
|
|
|
|
|
|
|
|
|
|
|
|
|
|
|
|
|
|
|
|
|
|
|
For the year ended December 31, 2014
(adjustments)
(a)
(M$)
|
|
Upstream
|
|
|
Refining &
Chemicals
|
|
|
Marketing
& Services
|
|
|
Corporate
|
|
|
Intercompany
|
|
|
Total
|
|
|
Non-Group sales
|
|
|
31
|
|
|
|
—
|
|
|
|
—
|
|
|
|
—
|
|
|
|
—
|
|
|
|
31
|
|
|
Intersegment sales
|
|
|
—
|
|
|
|
—
|
|
|
|
—
|
|
|
|
—
|
|
|
|
—
|
|
|
|
—
|
|
|
Excise taxes
|
|
|
—
|
|
|
|
—
|
|
|
|
—
|
|
|
|
—
|
|
|
|
—
|
|
|
|
—
|
|
|
Revenues from sales
|
|
|
31
|
|
|
|
—
|
|
|
|
—
|
|
|
|
—
|
|
|
|
—
|
|
|
|
31
|
|
|
Operating expenses
|
|
|
(164
|
)
|
|
|
(2,980
|
)
|
|
|
(551
|
)
|
|
|
—
|
|
|
|
—
|
|
|
|
(3,695
|
)
|
|
Depreciation, depletion and impairment of tangible assets and mineral interests
|
|
|
(6,529
|
)
|
|
|
(1,450
|
)
|
|
|
—
|
|
|
|
—
|
|
|
|
—
|
|
|
|
(7,979
|
)
|
|
Operating income
(b)
|
|
|
(6,662
|
)
|
|
|
(4,430
|
)
|
|
|
(551
|
)
|
|
|
—
|
|
|
|
—
|
|
|
|
(11,643
|
)
|
|
Equity in net income (loss) of affiliates and other items
|
|
|
883
|
|
|
|
(282
|
)
|
|
|
(203
|
)
|
|
|
—
|
|
|
|
—
|
|
|
|
398
|
|
|
Tax on net operating income
|
|
|
1,272
|
|
|
|
1,013
|
|
|
|
174
|
|
|
|
—
|
|
|
|
—
|
|
|
|
2,459
|
|
|
Net operating income
(b)
|
|
|
(4,507
|
)
|
|
|
(3,699
|
)
|
|
|
(580
|
)
|
|
|
—
|
|
|
|
—
|
|
|
|
(8,786
|
)
|
|
Net cost of net debt
|
|
|
|
|
|
|
|
|
|
|
|
|
|
|
|
|
|
|
|
|
|
|
—
|
|
|
Non-controlling interests
|
|
|
|
|
|
|
|
|
|
|
|
|
|
|
|
|
|
|
|
|
|
|
193
|
|
|
Net income
|
|
|
|
|
|
|
|
|
|
|
|
|
|
|
|
|
|
|
|
|
|
|
(8,593
|
)
|
|
|
|
|
|
|
|
|
|
|
|
|
|
|
|
|
|
|
|
|
|
|
|
|
|
|
|
(a)
Adjustments
include special items, inventory valuation effect and the effect of changes in fair value.
|
|
|
|
|
|
|
|
|
|
|
(b)
Of which inventory valuation
effect
|
|
|
|
|
|
|
|
|
|
|
|
|
|
|
|
|
|
|
|
|
|
|
|
|
|
On operating income
|
|
|
—
|
|
|
|
(2,944
|
)
|
|
|
(525
|
)
|
|
|
—
|
|
|
|
|
|
|
|
|
|
|
On net operating income
|
|
|
—
|
|
|
|
(2,114
|
)
|
|
|
(384
|
)
|
|
|
—
|
|
|
|
|
|
|
|
|
|
|
|
|
|
|
F-20
|
|
TOTAL S.A. Form 20-F 2015
|
Note 4 – Notes to the Consolidated Financial Statements
|
|
|
|
|
|
|
|
|
|
|
|
|
|
|
|
|
|
|
|
|
|
|
|
|
|
|
For the year ended December 31, 2014
(adjusted) (M$)
(a)
|
|
Upstream
|
|
|
Refining &
Chemicals
|
|
|
Marketing
& Services
|
|
|
Corporate
|
|
|
Intercompany
|
|
|
Total
|
|
|
Non-Group sales
|
|
|
23,453
|
|
|
|
106,124
|
|
|
|
106,509
|
|
|
|
5
|
|
|
|
—
|
|
|
|
236,091
|
|
|
Intersegment sales
|
|
|
29,183
|
|
|
|
44,950
|
|
|
|
1,615
|
|
|
|
236
|
|
|
|
(75,984
|
)
|
|
|
—
|
|
|
Excise taxes
|
|
|
—
|
|
|
|
(4,850
|
)
|
|
|
(19,254
|
)
|
|
|
—
|
|
|
|
—
|
|
|
|
(24,104
|
)
|
|
Revenues from sales
|
|
|
52,636
|
|
|
|
146,224
|
|
|
|
88,870
|
|
|
|
241
|
|
|
|
(75,984
|
)
|
|
|
211,987
|
|
|
Operating expenses
|
|
|
(26,071
|
)
|
|
|
(142,034
|
)
|
|
|
(86,380
|
)
|
|
|
(1,092
|
)
|
|
|
75,984
|
|
|
|
(179,593
|
)
|
|
Depreciation, depletion and impairment of tangible assets and mineral interests
|
|
|
(9,409
|
)
|
|
|
(1,451
|
)
|
|
|
(781
|
)
|
|
|
(36
|
)
|
|
|
—
|
|
|
|
(11,677
|
)
|
|
Adjusted operating income
|
|
|
17,156
|
|
|
|
2,739
|
|
|
|
1,709
|
|
|
|
(887
|
)
|
|
|
—
|
|
|
|
20,717
|
|
|
Equity in net income (loss) of affiliates and other items
|
|
|
3,419
|
|
|
|
372
|
|
|
|
63
|
|
|
|
178
|
|
|
|
—
|
|
|
|
4,032
|
|
|
Tax on net operating income
|
|
|
(10,071
|
)
|
|
|
(622
|
)
|
|
|
(518
|
)
|
|
|
(8
|
)
|
|
|
—
|
|
|
|
(11,219
|
)
|
|
Adjusted net operating income
|
|
|
10,504
|
|
|
|
2,489
|
|
|
|
1,254
|
|
|
|
(717
|
)
|
|
|
—
|
|
|
|
13,530
|
|
|
Net cost of net debt
|
|
|
|
|
|
|
|
|
|
|
|
|
|
|
|
|
|
|
|
|
|
|
(494
|
)
|
|
Non-controlling interests
|
|
|
|
|
|
|
|
|
|
|
|
|
|
|
|
|
|
|
|
|
|
|
(199
|
)
|
|
Ajusted net income
|
|
|
|
|
|
|
|
|
|
|
|
|
|
|
|
|
|
|
|
|
|
|
12,837
|
|
|
Adjusted fully-diluted earnings per share ($)
|
|
|
|
|
|
|
|
|
|
|
|
|
|
|
|
|
|
|
|
|
|
|
5.63
|
|
|
|
|
|
|
|
|
|
|
|
|
|
|
|
|
|
|
|
|
|
|
|
|
|
|
|
|
(a)
Except for earnings per
share.
|
|
|
|
|
|
|
|
|
|
|
|
|
|
|
|
|
|
|
|
|
|
|
|
|
|
|
|
|
|
|
|
|
|
|
|
|
|
|
|
|
|
|
|
|
|
|
|
|
|
|
|
For the year ended December 31, 2014
(M$)
|
|
Upstream
|
|
|
Refining &
Chemicals
|
|
|
Marketing
& Services
|
|
|
Corporate
|
|
|
Intercompany
|
|
|
Total
|
|
|
Total expenditures
|
|
|
26,520
|
|
|
|
2,022
|
|
|
|
1,818
|
|
|
|
149
|
|
|
|
—
|
|
|
|
30,509
|
|
|
Total divestments
|
|
|
5,764
|
|
|
|
192
|
|
|
|
163
|
|
|
|
71
|
|
|
|
—
|
|
|
|
6,190
|
|
|
Cash flow from operating activities
|
|
|
16,666
|
|
|
|
6,302
|
|
|
|
2,721
|
|
|
|
(81
|
)
|
|
|
—
|
|
|
|
25,608
|
|
|
Balance sheet as of December 31, 2014
|
|
|
|
|
|
|
|
|
|
|
|
|
|
|
|
|
|
|
|
|
|
|
|
|
|
Property, plant and equipment, intangible assets, net
|
|
|
105,273
|
|
|
|
9,512
|
|
|
|
6,443
|
|
|
|
330
|
|
|
|
—
|
|
|
|
121,558
|
|
|
Investments & loans in equity affiliates
|
|
|
14,921
|
|
|
|
3,516
|
|
|
|
837
|
|
|
|
—
|
|
|
|
—
|
|
|
|
19,274
|
|
|
Other non-current assets
|
|
|
6,711
|
|
|
|
959
|
|
|
|
1,849
|
|
|
|
151
|
|
|
|
—
|
|
|
|
9,670
|
|
|
Working capital
|
|
|
2,015
|
|
|
|
4,041
|
|
|
|
2,141
|
|
|
|
(2,386
|
)
|
|
|
—
|
|
|
|
5,811
|
|
|
Provisions and other non-current liabilities
|
|
|
(30,385
|
)
|
|
|
(4,290
|
)
|
|
|
(2,097
|
)
|
|
|
(341
|
)
|
|
|
—
|
|
|
|
(37,113
|
)
|
|
Assets and liabilities classified as held for sale
|
|
|
1,962
|
|
|
|
1,032
|
|
|
|
91
|
|
|
|
—
|
|
|
|
—
|
|
|
|
3,085
|
|
|
Capital Employed (balance sheet)
|
|
|
100,497
|
|
|
|
14,770
|
|
|
|
9,264
|
|
|
|
(2,246
|
)
|
|
|
—
|
|
|
|
122,285
|
|
|
Less inventory valuation effect
|
|
|
—
|
|
|
|
(1,319
|
)
|
|
|
(439
|
)
|
|
|
(1
|
)
|
|
|
—
|
|
|
|
(1,759
|
)
|
|
Capital Employed
(Business segment information)
|
|
|
100,497
|
|
|
|
13,451
|
|
|
|
8,825
|
|
|
|
(2,247
|
)
|
|
|
—
|
|
|
|
120,526
|
|
|
ROACE as a percentage
|
|
|
11%
|
|
|
|
15%
|
|
|
|
13%
|
|
|
|
—
|
|
|
|
—
|
|
|
|
11%
|
|
|
|
|
|
|
2015 Form 20-F TOTAL S.A.
|
|
F-21
|
Notes to the Consolidated Financial Statements – Note 4
|
|
|
|
|
|
|
|
|
|
|
|
|
|
|
|
|
|
|
|
|
|
|
|
|
|
|
For the year ended December 31, 2013
(M$)
|
|
Upstream
|
|
|
Refining &
Chemicals
|
|
|
Marketing
& Services
|
|
|
Corporate
|
|
|
Intercompany
|
|
|
Total
|
|
|
Non-Group sales
|
|
|
26,367
|
|
|
|
114,483
|
|
|
|
110,873
|
|
|
|
2
|
|
|
|
—
|
|
|
|
251,725
|
|
|
Intersegment sales
|
|
|
37,650
|
|
|
|
52,275
|
|
|
|
2,159
|
|
|
|
177
|
|
|
|
(92,261
|
)
|
|
|
—
|
|
|
Excise taxes
|
|
|
—
|
|
|
|
(4,814
|
)
|
|
|
(18,942
|
)
|
|
|
—
|
|
|
|
—
|
|
|
|
(23,756
|
)
|
|
Revenues from sales
|
|
|
64,017
|
|
|
|
161,944
|
|
|
|
94,090
|
|
|
|
179
|
|
|
|
(92,261
|
)
|
|
|
227,969
|
|
|
Operating expenses
|
|
|
(31,875
|
)
|
|
|
(160,031
|
)
|
|
|
(91,343
|
)
|
|
|
(794
|
)
|
|
|
92,261
|
|
|
|
(191,782
|
)
|
|
Depreciation, depletion and impairment of tangible assets and mineral interests
|
|
|
(9,484
|
)
|
|
|
(1,736
|
)
|
|
|
(733
|
)
|
|
|
(41
|
)
|
|
|
—
|
|
|
|
(11,994
|
)
|
|
Operating income
|
|
|
22,658
|
|
|
|
177
|
|
|
|
2,014
|
|
|
|
(656
|
)
|
|
|
—
|
|
|
|
24,193
|
|
|
Equity in net income (loss) of affiliates and other items
|
|
|
2,688
|
|
|
|
181
|
|
|
|
55
|
|
|
|
(25
|
)
|
|
|
—
|
|
|
|
2,899
|
|
|
Tax on net operating income
|
|
|
(13,706
|
)
|
|
|
(612
|
)
|
|
|
(560
|
)
|
|
|
(29
|
)
|
|
|
—
|
|
|
|
(14,907
|
)
|
|
Net operating income
|
|
|
11,640
|
|
|
|
(254
|
)
|
|
|
1,509
|
|
|
|
(710
|
)
|
|
|
—
|
|
|
|
12,185
|
|
|
Net cost of net debt
|
|
|
|
|
|
|
|
|
|
|
|
|
|
|
|
|
|
|
|
|
|
|
(664
|
)
|
|
Non-controlling interests
|
|
|
|
|
|
|
|
|
|
|
|
|
|
|
|
|
|
|
|
|
|
|
(293
|
)
|
|
Net income
|
|
|
|
|
|
|
|
|
|
|
|
|
|
|
|
|
|
|
|
|
|
|
11,228
|
|
|
|
|
|
|
|
|
|
|
|
|
|
|
|
|
|
|
|
|
|
|
|
|
|
|
|
For the year ended December 31,
2013
(adjustments)
(a)
(M$)
|
|
Upstream
|
|
|
Refining &
Chemicals
|
|
|
Marketing
& Services
|
|
|
Corporate
|
|
|
Intercompany
|
|
|
Total
|
|
|
Non-Group sales
|
|
|
(74
|
)
|
|
|
—
|
|
|
|
—
|
|
|
|
—
|
|
|
|
—
|
|
|
|
(74
|
)
|
|
Intersegment sales
|
|
|
—
|
|
|
|
—
|
|
|
|
—
|
|
|
|
—
|
|
|
|
—
|
|
|
|
—
|
|
|
Excise taxes
|
|
|
—
|
|
|
|
—
|
|
|
|
—
|
|
|
|
—
|
|
|
|
—
|
|
|
|
—
|
|
|
Revenues from sales
|
|
|
(74
|
)
|
|
|
—
|
|
|
|
—
|
|
|
|
—
|
|
|
|
—
|
|
|
|
(74
|
)
|
|
Operating expenses
|
|
|
(113
|
)
|
|
|
(1,405
|
)
|
|
|
(134
|
)
|
|
|
—
|
|
|
|
—
|
|
|
|
(1,652
|
)
|
|
Depreciation, depletion and impairment of tangible assets and mineral interests
|
|
|
(855
|
)
|
|
|
(184
|
)
|
|
|
(4
|
)
|
|
|
—
|
|
|
|
—
|
|
|
|
(1,043
|
)
|
|
Operating income
(b)
|
|
|
(1,042
|
)
|
|
|
(1,589
|
)
|
|
|
(138
|
)
|
|
|
—
|
|
|
|
—
|
|
|
|
(2,769
|
)
|
|
Equity in net income (loss) of affiliates and other items
|
|
|
(305
|
)
|
|
|
(268
|
)
|
|
|
4
|
|
|
|
(34
|
)
|
|
|
—
|
|
|
|
(603
|
)
|
|
Tax on net operating income
|
|
|
537
|
|
|
|
(254
|
)
|
|
|
89
|
|
|
|
(45
|
)
|
|
|
—
|
|
|
|
327
|
|
|
Net operating income
(b)
|
|
|
(810
|
)
|
|
|
(2,111
|
)
|
|
|
(45
|
)
|
|
|
(79
|
)
|
|
|
—
|
|
|
|
(3,045
|
)
|
|
Net cost of net debt
|
|
|
|
|
|
|
|
|
|
|
|
|
|
|
|
—
|
|
|
Non-controlling interests
|
|
|
|
|
|
|
|
|
|
|
|
|
|
|
|
(19
|
)
|
|
Net income
|
|
|
|
|
|
|
|
|
|
|
|
|
|
|
|
(3,064
|
)
|
|
(a)
|
Adjustments include special items, inventory valuation effect and the effect of changes in fair value.
|
|
|
|
|
|
|
|
|
|
|
|
|
|
|
|
|
|
|
|
|
|
|
|
(b)
Of which inventory valuation
effect
|
|
|
|
|
|
|
|
|
|
|
|
|
|
|
|
|
|
|
|
|
|
On operating income
|
|
|
—
|
|
|
|
(978
|
)
|
|
|
(87
|
)
|
|
|
—
|
|
|
|
|
|
|
On net operating income
|
|
|
—
|
|
|
|
(656
|
)
|
|
|
(63
|
)
|
|
|
—
|
|
|
|
|
|
|
|
|
|
|
F-22
|
|
TOTAL S.A. Form 20-F 2015
|
Note 4 – Notes to the Consolidated Financial Statements
|
|
|
|
|
|
|
|
|
|
|
|
|
|
|
|
|
|
|
|
|
|
|
|
|
|
|
For the year ended December 31, 2013
(adjusted) (M$)
(a)
|
|
Upstream
|
|
|
Refining &
Chemicals
|
|
|
Marketing
& Services
|
|
|
Corporate
|
|
|
Intercompany
|
|
|
Total
|
|
|
Non-Group sales
|
|
|
26,441
|
|
|
|
114,483
|
|
|
|
110,873
|
|
|
|
2
|
|
|
|
—
|
|
|
|
251,799
|
|
|
Intersegment sales
|
|
|
37,650
|
|
|
|
52,275
|
|
|
|
2,159
|
|
|
|
177
|
|
|
|
(92,261
|
)
|
|
|
—
|
|
|
Excise taxes
|
|
|
—
|
|
|
|
(4,814
|
)
|
|
|
(18,942
|
)
|
|
|
—
|
|
|
|
—
|
|
|
|
(23,756
|
)
|
|
Revenues from sales
|
|
|
64,091
|
|
|
|
161,944
|
|
|
|
94,090
|
|
|
|
179
|
|
|
|
(92,261
|
)
|
|
|
228,043
|
|
|
Operating expenses
|
|
|
(31,762
|
)
|
|
|
(158,626
|
)
|
|
|
(91,209
|
)
|
|
|
(794
|
)
|
|
|
92,261
|
|
|
|
(190,130
|
)
|
|
Depreciation, depletion and impairment of tangible assets and mineral interests
|
|
|
(8,629
|
)
|
|
|
(1,552
|
)
|
|
|
(729
|
)
|
|
|
(41
|
)
|
|
|
—
|
|
|
|
(10,951
|
)
|
|
Adjusted operating income
|
|
|
23,700
|
|
|
|
1,766
|
|
|
|
2,152
|
|
|
|
(656
|
)
|
|
|
—
|
|
|
|
26,962
|
|
|
Equity in net income (loss) of affiliates and other items
|
|
|
2,993
|
|
|
|
449
|
|
|
|
51
|
|
|
|
9
|
|
|
|
—
|
|
|
|
3,502
|
|
|
Tax on net operating income
|
|
|
(14,243
|
)
|
|
|
(358
|
)
|
|
|
(649
|
)
|
|
|
16
|
|
|
|
—
|
|
|
|
(15,234
|
)
|
|
Adjusted net operating income
|
|
|
12,450
|
|
|
|
1,857
|
|
|
|
1,554
|
|
|
|
(631
|
)
|
|
|
—
|
|
|
|
15,230
|
|
|
Net cost of net debt
|
|
|
|
|
|
|
|
|
|
|
|
|
|
|
|
|
|
|
|
|
|
|
(664
|
)
|
|
Non-controlling interests
|
|
|
|
|
|
|
|
|
|
|
|
|
|
|
|
|
|
|
|
|
|
|
(274
|
)
|
|
Adjusted net income
|
|
|
|
|
|
|
|
|
|
|
|
|
|
|
|
|
|
|
|
|
|
|
14,292
|
|
|
Adjusted fully-diluted earnings per share ($)
|
|
|
|
|
|
|
|
|
|
|
|
|
|
|
|
|
|
|
|
|
|
|
6.29
|
|
|
(a)
Except for earnings per share.
|
|
|
For the year ended December 31, 2013 (M$)
|
|
Upstream
|
|
|
Refining &
Chemicals
|
|
|
Marketing
& Services
|
|
|
Corporate
|
|
|
Intercompany
|
|
|
Total
|
|
|
Total expenditures
|
|
|
29,750
|
|
|
|
2,708
|
|
|
|
1,814
|
|
|
|
159
|
|
|
|
—
|
|
|
|
34,431
|
|
|
Total divestments
|
|
|
5,786
|
|
|
|
365
|
|
|
|
186
|
|
|
|
62
|
|
|
|
—
|
|
|
|
6,399
|
|
|
Cash flow from operating activities
|
|
|
21,857
|
|
|
|
4,260
|
|
|
|
2,557
|
|
|
|
(161
|
)
|
|
|
—
|
|
|
|
28,513
|
|
|
Balance sheet as of December 31, 2013
|
|
|
|
|
|
|
|
|
|
|
|
|
|
|
|
|
|
|
|
|
|
|
|
|
|
Property, plant and equipment, intangible assets, net
|
|
|
103,667
|
|
|
|
12,407
|
|
|
|
6,441
|
|
|
|
360
|
|
|
|
—
|
|
|
|
122,875
|
|
|
Investments & loans in equity affiliates
|
|
|
15,862
|
|
|
|
3,542
|
|
|
|
1,013
|
|
|
|
—
|
|
|
|
—
|
|
|
|
20,417
|
|
|
Other non-current assets
|
|
|
5,691
|
|
|
|
1,427
|
|
|
|
2,014
|
|
|
|
778
|
|
|
|
—
|
|
|
|
9,910
|
|
|
Working capital
|
|
|
(327
|
)
|
|
|
10,458
|
|
|
|
3,779
|
|
|
|
(2,729
|
)
|
|
|
—
|
|
|
|
11,181
|
|
|
Provisions and other non-current liabilities
|
|
|
(31,574
|
)
|
|
|
(4,437
|
)
|
|
|
(2,303
|
)
|
|
|
(1,288
|
)
|
|
|
—
|
|
|
|
(39,602
|
)
|
|
Assets and liabilities classified as held for sale
|
|
|
2,210
|
|
|
|
—
|
|
|
|
—
|
|
|
|
—
|
|
|
|
—
|
|
|
|
2,210
|
|
|
Capital Employed (balance sheet)
|
|
|
95,529
|
|
|
|
23,397
|
|
|
|
10,944
|
|
|
|
(2,879
|
)
|
|
|
—
|
|
|
|
126,991
|
|
|
Less inventory valuation effect
|
|
|
—
|
|
|
|
(3,645
|
)
|
|
|
(893
|
)
|
|
|
(2
|
)
|
|
|
—
|
|
|
|
(4,540
|
)
|
|
Capital Employed
(Business segment information)
|
|
|
95,529
|
|
|
|
19,752
|
|
|
|
10,051
|
|
|
|
(2,881
|
)
|
|
|
—
|
|
|
|
122,451
|
|
|
ROACE as a percentage
|
|
|
14%
|
|
|
|
9%
|
|
|
|
16%
|
|
|
|
—
|
|
|
|
—
|
|
|
|
13%
|
|
|
|
|
|
|
2015 Form 20-F TOTAL S.A.
|
|
F-23
|
Notes to the Consolidated Financial Statements – Note 4
B) ROE (Return on Equity)
The Group evaluates the return on equity as the ratio of adjusted consolidated net income to average adjusted shareholders’ equity between the beginning and the end of the period. Thus, adjusted
shareholders’ equity for the year ended December 31, 2015 is calculated after payment of a dividend of
€
2.44 per share, subject to approval by the shareholders’ meeting on May 24, 2016.
The ROE is calculated as follows:
|
|
|
|
|
|
|
|
|
|
|
|
|
|
|
For the year ended December 31, (M$)
|
|
2015
|
|
|
2014
|
|
|
2013
|
|
|
Adjusted net income — Group share
|
|
|
10,518
|
|
|
|
12,837
|
|
|
|
14,292
|
|
|
Adjusted non-controlling interests
|
|
|
180
|
|
|
|
199
|
|
|
|
274
|
|
|
Adjusted consolidated net income
|
|
|
10,698
|
|
|
|
13,036
|
|
|
|
14,566
|
|
|
Shareholders’ equity — Group share
|
|
|
92,494
|
|
|
|
90,330
|
|
|
|
100,241
|
|
|
Distribution of the income based on existing shares at the closing date
|
|
|
(1,545
|
)
|
|
|
(1,686
|
)
|
|
|
(1,908
|
)
|
|
Non-controlling interests
|
|
|
2,915
|
|
|
|
3,201
|
|
|
|
3,138
|
|
|
Adjusted shareholders’ equity
(a)
|
|
|
93,864
|
|
|
|
91,845
|
|
|
|
101,471
|
|
|
ROE
|
|
|
11.5%
|
|
|
|
13.5%
|
|
|
|
14.9%
|
|
|
(a)
|
Adjusted shareholders’ equity as of December 31, 2012 amounted to $93,901 million.
|
C) Reconciliation of the information by business segment with Consolidated Financial Statements
The table below presents the impact of adjustment items on the consolidated statement of income:
|
|
|
|
|
|
|
|
|
|
|
|
|
|
|
For the year ended December 31, 2015 (M$)
|
|
Adjusted
|
|
|
Adjustments
(a)
|
|
|
Consolidated
statement of
income
|
|
|
Sales
|
|
|
165,876
|
|
|
|
(519
|
)
|
|
|
165,357
|
|
|
Excise taxes
|
|
|
(21,936
|
)
|
|
|
—
|
|
|
|
(21,936
|
)
|
|
Revenues from sales
|
|
|
143,940
|
|
|
|
(519
|
)
|
|
|
143,421
|
|
|
Purchases, net of inventory variation
|
|
|
(95,558
|
)
|
|
|
(1,113
|
)
|
|
|
(96,671
|
)
|
|
Other operating expenses
|
|
|
(23,984
|
)
|
|
|
(361
|
)
|
|
|
(24,345
|
)
|
|
Exploration costs
|
|
|
(1,550
|
)
|
|
|
(441
|
)
|
|
|
(1,991
|
)
|
|
Depreciation, depletion and impairment of tangible assets and mineral interests
|
|
|
(10,843
|
)
|
|
|
(6,877
|
)
|
|
|
(17,720
|
)
|
|
Other income
|
|
|
1,468
|
|
|
|
2,138
|
|
|
|
3,606
|
|
|
Other expense
|
|
|
(405
|
)
|
|
|
(1,172
|
)
|
|
|
(1,577
|
)
|
|
Financial interest on debt
|
|
|
(956
|
)
|
|
|
(11
|
)
|
|
|
(967
|
)
|
|
Financial income from marketable securities & cash equivalents
|
|
|
94
|
|
|
|
—
|
|
|
|
94
|
|
|
Cost of net debt
|
|
|
(862
|
)
|
|
|
(11
|
)
|
|
|
(873
|
)
|
|
Other financial income
|
|
|
882
|
|
|
|
—
|
|
|
|
882
|
|
|
Other financial expense
|
|
|
(654
|
)
|
|
|
—
|
|
|
|
(654
|
)
|
|
Equity in net income (loss) of affiliates
|
|
|
2,414
|
|
|
|
(53
|
)
|
|
|
2,361
|
|
|
Income taxes
|
|
|
(4,150
|
)
|
|
|
2,497
|
|
|
|
(1,653
|
)
|
|
Consolidated net income
|
|
|
10,698
|
|
|
|
(5,912
|
)
|
|
|
4,786
|
|
|
Group share
|
|
|
10,518
|
|
|
|
(5,431
|
)
|
|
|
5,087
|
|
|
Non-controlling interests
|
|
|
180
|
|
|
|
(481
|
)
|
|
|
(301
|
)
|
|
(a)
|
Adjustments include special items, inventory valuation effect and the effect of changes in fair value.
|
|
|
|
|
|
F-24
|
|
TOTAL S.A. Form 20-F 2015
|
Note 4 – Notes to the Consolidated Financial Statements
|
|
|
|
|
|
|
|
|
|
|
|
|
|
|
For the year ended December 31, 2014 (M$)
|
|
Adjusted
|
|
|
Adjustments
(a)
|
|
|
Consolidated
statement of
income
|
|
|
Sales
|
|
|
236,091
|
|
|
|
31
|
|
|
|
236,122
|
|
|
Excise taxes
|
|
|
(24,104
|
)
|
|
|
—
|
|
|
|
(24,104
|
)
|
|
Revenues from sales
|
|
|
211,987
|
|
|
|
31
|
|
|
|
212,018
|
|
|
Purchases, net of inventory variation
|
|
|
(149,506
|
)
|
|
|
(3,469
|
)
|
|
|
(152,975
|
)
|
|
Other operating expenses
|
|
|
(28,123
|
)
|
|
|
(226
|
)
|
|
|
(28,349
|
)
|
|
Exploration costs
|
|
|
(1,964
|
)
|
|
|
—
|
|
|
|
(1,964
|
)
|
|
Depreciation, depletion and impairment of tangible assets and mineral interests
|
|
|
(11,677
|
)
|
|
|
(7,979
|
)
|
|
|
(19,656
|
)
|
|
Other income
|
|
|
1,272
|
|
|
|
1,305
|
|
|
|
2,577
|
|
|
Other expense
|
|
|
(700
|
)
|
|
|
(254
|
)
|
|
|
(954
|
)
|
|
Financial interest on debt
|
|
|
(748
|
)
|
|
|
—
|
|
|
|
(748
|
)
|
|
Financial income from marketable securities & cash equivalents
|
|
|
108
|
|
|
|
—
|
|
|
|
108
|
|
|
Cost of net debt
|
|
|
(640
|
)
|
|
|
—
|
|
|
|
(640
|
)
|
|
Other financial income
|
|
|
821
|
|
|
|
—
|
|
|
|
821
|
|
|
Other financial expense
|
|
|
(676
|
)
|
|
|
—
|
|
|
|
(676
|
)
|
|
Equity in net income (loss) of affiliates
|
|
|
3,315
|
|
|
|
(653
|
)
|
|
|
2,662
|
|
|
Income taxes
|
|
|
(11,073
|
)
|
|
|
2,459
|
|
|
|
(8,614
|
)
|
|
Consolidated net income
|
|
|
13,036
|
|
|
|
(8,786
|
)
|
|
|
4,250
|
|
|
Group share
|
|
|
12,837
|
|
|
|
(8,593
|
)
|
|
|
4,244
|
|
|
Non-controlling interests
|
|
|
199
|
|
|
|
(193
|
)
|
|
|
6
|
|
|
(a)
|
Adjustments include special items, inventory valuation effect and the effect of changes in fair value.
|
|
|
|
|
|
|
|
|
|
|
|
|
|
|
|
For the year ended December 31, 2013 (M$)
|
|
Adjusted
|
|
|
Adjustments
(a)
|
|
|
Consolidated
statement of
income
|
|
|
Sales
|
|
|
251,799
|
|
|
|
(74
|
)
|
|
|
251,725
|
|
|
Excise taxes
|
|
|
(23,756
|
)
|
|
|
—
|
|
|
|
(23,756
|
)
|
|
Revenues from sales
|
|
|
228,043
|
|
|
|
(74
|
)
|
|
|
227,969
|
|
|
Purchases, net of inventory variation
|
|
|
(159,784
|
)
|
|
|
(1,065
|
)
|
|
|
(160,849
|
)
|
|
Other operating expenses
|
|
|
(28,177
|
)
|
|
|
(587
|
)
|
|
|
(28,764
|
)
|
|
Exploration costs
|
|
|
(2,169
|
)
|
|
|
—
|
|
|
|
(2,169
|
)
|
|
Depreciation, depletion and impairment of tangible assets and mineral interests
|
|
|
(10,951
|
)
|
|
|
(1,043
|
)
|
|
|
(11,994
|
)
|
|
Other income
|
|
|
647
|
|
|
|
1,643
|
|
|
|
2,290
|
|
|
Other expense
|
|
|
(574
|
)
|
|
|
(2,226
|
)
|
|
|
(2,800
|
)
|
|
Financial interest on debt
|
|
|
(889
|
)
|
|
|
—
|
|
|
|
(889
|
)
|
|
Financial income from marketable securities & cash equivalents
|
|
|
85
|
|
|
|
—
|
|
|
|
85
|
|
|
Cost of net debt
|
|
|
(804
|
)
|
|
|
—
|
|
|
|
(804
|
)
|
|
Other financial income
|
|
|
696
|
|
|
|
—
|
|
|
|
696
|
|
|
Other financial expense
|
|
|
(702
|
)
|
|
|
—
|
|
|
|
(702
|
)
|
|
Equity in net income (loss) of affiliates
|
|
|
3,435
|
|
|
|
(20
|
)
|
|
|
3,415
|
|
|
Income taxes
|
|
|
(15,094
|
)
|
|
|
327
|
|
|
|
(14,767
|
)
|
|
Consolidated net income
|
|
|
14,566
|
|
|
|
(3,045
|
)
|
|
|
11,521
|
|
|
Group share
|
|
|
14,292
|
|
|
|
(3,064
|
)
|
|
|
11,228
|
|
|
Non-controlling interests
|
|
|
274
|
|
|
|
19
|
|
|
|
293
|
|
|
(a)
|
Adjustments include special items, inventory valuation effect and the effect of changes in fair value.
|
|
|
|
|
|
2015 Form 20-F TOTAL S.A.
|
|
F-25
|
Notes to the Consolidated Financial Statements – Note 4
D) Additional information on adjustment items and impairments
The adjustment items to income as per Note 2 to the Consolidated Financial Statements are detailed as follows:
|
|
|
|
|
|
|
|
|
|
|
|
|
|
|
|
|
|
|
|
|
|
|
Adjustments to operating income
For the year ended December 31, 2015 (M$)
|
|
Upstream
|
|
|
Refining &
Chemicals
|
|
|
Marketing &
Services
|
|
|
Corporate
|
|
|
Total
|
|
|
Inventory valuation effect
|
|
|
—
|
|
|
|
(859
|
)
|
|
|
(254
|
)
|
|
|
—
|
|
|
|
(1,113
|
)
|
|
Effect of changes in fair value
|
|
|
(16
|
)
|
|
|
—
|
|
|
|
—
|
|
|
|
—
|
|
|
|
(16
|
)
|
|
Restructuring charges
|
|
|
(43
|
)
|
|
|
—
|
|
|
|
(5
|
)
|
|
|
—
|
|
|
|
(48
|
)
|
|
Asset impairment charges
|
|
|
(6,783
|
)
|
|
|
(70
|
)
|
|
|
(24
|
)
|
|
|
—
|
|
|
|
(6,877
|
)
|
|
Other items
|
|
|
(1,024
|
)
|
|
|
(176
|
)
|
|
|
(57
|
)
|
|
|
—
|
|
|
|
(1,257
|
)
|
|
Total
|
|
|
(7,866
|
)
|
|
|
(1,105
|
)
|
|
|
(340
|
)
|
|
|
—
|
|
|
|
(9,311
|
)
|
|
|
|
|
|
|
|
|
|
|
|
|
|
|
|
|
|
|
|
|
|
|
|
Adjustments to net income, Group share
For the year ended December 31,
2015 (M$)
|
|
Upstream
|
|
|
Refining &
Chemicals
|
|
|
Marketing &
Services
|
|
|
Corporate
|
|
|
Total
|
|
|
Inventory valuation effect
|
|
|
—
|
|
|
|
(590
|
)
|
|
|
(157
|
)
|
|
|
—
|
|
|
|
(747
|
)
|
|
Effect of changes in fair value
|
|
|
(9
|
)
|
|
|
—
|
|
|
|
—
|
|
|
|
—
|
|
|
|
(9
|
)
|
|
Restructuring charges
|
|
|
(10
|
)
|
|
|
(52
|
)
|
|
|
(10
|
)
|
|
|
—
|
|
|
|
(72
|
)
|
|
Asset impairment charges
|
|
|
(5,249
|
)
|
|
|
(59
|
)
|
|
|
(127
|
)
|
|
|
(12
|
)
|
|
|
(5,447
|
)
|
|
Gains (losses) on disposals of assets
|
|
|
162
|
|
|
|
1,288
|
|
|
|
360
|
|
|
|
—
|
|
|
|
1,810
|
|
|
Other items
|
|
|
(516
|
)
|
|
|
(257
|
)
|
|
|
(193
|
)
|
|
|
—
|
|
|
|
(966
|
)
|
|
Total
|
|
|
(5,622
|
)
|
|
|
330
|
|
|
|
(127
|
)
|
|
|
(12
|
)
|
|
|
(5,431
|
)
|
|
|
|
|
|
|
|
|
|
|
|
|
|
|
|
|
|
|
|
|
|
|
|
Adjustments to operating income
For the year ended December 31,
2014 (M$)
|
|
Upstream
|
|
|
Refining &
Chemicals
|
|
|
Marketing &
Services
|
|
|
Corporate
|
|
|
Total
|
|
|
Inventory valuation effect
|
|
|
—
|
|
|
|
(2,944
|
)
|
|
|
(525
|
)
|
|
|
—
|
|
|
|
(3,469
|
)
|
|
Effect of changes in fair value
|
|
|
31
|
|
|
|
—
|
|
|
|
—
|
|
|
|
—
|
|
|
|
31
|
|
|
Restructuring charges
|
|
|
—
|
|
|
|
—
|
|
|
|
—
|
|
|
|
—
|
|
|
|
—
|
|
|
Asset impairment charges
|
|
|
(6,529
|
)
|
|
|
(1,450
|
)
|
|
|
—
|
|
|
|
—
|
|
|
|
(7,979
|
)
|
|
Other items
|
|
|
(164
|
)
|
|
|
(36
|
)
|
|
|
(26
|
)
|
|
|
—
|
|
|
|
(226
|
)
|
|
Total
|
|
|
(6,662
|
)
|
|
|
(4,430
|
)
|
|
|
(551
|
)
|
|
|
—
|
|
|
|
(11,643
|
)
|
|
|
|
|
|
|
|
|
|
|
|
|
|
|
|
|
|
|
|
|
|
|
|
Adjustments to net income, Group share
For the year ended December 31,
2014 (M$)
|
|
Upstream
|
|
|
Refining &
Chemicals
|
|
|
Marketing &
Services
|
|
|
Corporate
|
|
|
Total
|
|
|
Inventory valuation effect
|
|
|
—
|
|
|
|
(2,114
|
)
|
|
|
(339
|
)
|
|
|
—
|
|
|
|
(2,453
|
)
|
|
Effect of changes in fair value
|
|
|
25
|
|
|
|
—
|
|
|
|
—
|
|
|
|
—
|
|
|
|
25
|
|
|
Restructuring charges
|
|
|
—
|
|
|
|
(13
|
)
|
|
|
(7
|
)
|
|
|
—
|
|
|
|
(20
|
)
|
|
Asset impairment charges
|
|
|
(5,514
|
)
|
|
|
(1,409
|
)
|
|
|
(140
|
)
|
|
|
—
|
|
|
|
(7,063
|
)
|
|
Gains (losses) on disposals of assets
|
|
|
1,314
|
|
|
|
(105
|
)
|
|
|
—
|
|
|
|
—
|
|
|
|
1,209
|
|
|
Other items
|
|
|
(193
|
)
|
|
|
(58
|
)
|
|
|
(40
|
)
|
|
|
—
|
|
|
|
(291
|
)
|
|
Total
|
|
|
(4,368
|
)
|
|
|
(3,699
|
)
|
|
|
(526
|
)
|
|
|
—
|
|
|
|
(8,593
|
)
|
|
|
|
|
|
|
|
|
|
|
|
|
|
|
|
|
|
|
|
|
|
|
|
Adjustments to operating income
For the year ended December 31,
2013 (M$)
|
|
Upstream
|
|
|
Refining &
Chemicals
|
|
|
Marketing &
Services
|
|
|
Corporate
|
|
|
Total
|
|
|
Inventory valuation effect
|
|
|
—
|
|
|
|
(978
|
)
|
|
|
(87
|
)
|
|
|
—
|
|
|
|
(1,065
|
)
|
|
Effect of changes in fair value
|
|
|
(74
|
)
|
|
|
—
|
|
|
|
—
|
|
|
|
—
|
|
|
|
(74
|
)
|
|
Restructuring charges
|
|
|
—
|
|
|
|
(373
|
)
|
|
|
(3
|
)
|
|
|
—
|
|
|
|
(376
|
)
|
|
Asset impairment charges
|
|
|
(855
|
)
|
|
|
(184
|
)
|
|
|
(4
|
)
|
|
|
—
|
|
|
|
(1,043
|
)
|
|
Other items
|
|
|
(113
|
)
|
|
|
(54
|
)
|
|
|
(44
|
)
|
|
|
—
|
|
|
|
(211
|
)
|
|
Total
|
|
|
(1,042
|
)
|
|
|
(1,589
|
)
|
|
|
(138
|
)
|
|
|
—
|
|
|
|
(2,769
|
)
|
|
|
|
|
|
|
|
|
|
|
|
|
|
|
|
|
|
|
|
|
|
|
|
Adjustments to net income, Group share
For the year ended December 31,
2013 (M$)
|
|
Upstream
|
|
|
Refining &
Chemicals
|
|
|
Marketing
& Services
|
|
|
Corporate
|
|
|
Total
|
|
|
Inventory valuation effect
|
|
|
—
|
|
|
|
(656
|
)
|
|
|
(72
|
)
|
|
|
—
|
|
|
|
(728
|
)
|
|
Effect of changes in fair value
|
|
|
(58
|
)
|
|
|
—
|
|
|
|
—
|
|
|
|
—
|
|
|
|
(58
|
)
|
|
Restructuring charges
|
|
|
—
|
|
|
|
(537
|
)
|
|
|
(30
|
)
|
|
|
—
|
|
|
|
(567
|
)
|
|
Asset impairment charges
|
|
|
(581
|
)
|
|
|
(183
|
)
|
|
|
(9
|
)
|
|
|
—
|
|
|
|
(773
|
)
|
|
Gains (losses) on disposals of assets
|
|
|
(58
|
)
|
|
|
(59
|
)
|
|
|
—
|
|
|
|
—
|
|
|
|
(117
|
)
|
|
Other items
|
|
|
(113
|
)
|
|
|
(676
|
)
|
|
|
47
|
|
|
|
(79
|
)
|
|
|
(821
|
)
|
|
Total
|
|
|
(810
|
)
|
|
|
(2,111
|
)
|
|
|
(64
|
)
|
|
|
(79
|
)
|
|
|
(3,064
|
)
|
|
|
|
|
|
F-26
|
|
TOTAL S.A. Form 20-F 2015
|
Note 4 – Notes to the Consolidated Financial Statements
The main adjustment items for 2015 are the following:
1) The line “Gains (losses) on disposals of assets” includes the 2015 gains and losses on disposals, mainly, in the Upstream segment with the sales of the Group’s interests in onshore blocks in
Nigeria, in the Refining & Chemicals segment with the sales of Bostik, Geosel and the Group’s interest in the Schwedt refinery in Germany and in the Marketing & Services segment with the sale of Totalgaz.
2) The line “Asset impairment charges” ($6,877 million in operating income and $5,447 million in net income, Group share) includes:
2.1) Asset impairment charges for an amount of $5,749 million in operating income and $4,883 million in net income, Group share.
2.1.1) The Group performed an evaluation of the Cash Generating Units (CGU) for which there were indicators of impairment, mostly due to changes
in the operating conditions or the economic environment of their specific businesses.
The principles applied are as follows:
|
|
•
|
|
the recoverable amount of the CGUs was determined based on their value in use, as defined in Note 1 paragraph L to the Consolidated Financial Statements
“Impairment of long-lived assets”;
|
|
|
•
|
|
the future cash flows were determined using the assumptions included in the 2016 budget and in the long-term plan of the Group approved by the Group Executive
Committee and the Board of Directors. These assumptions, including in particular future prices of products, operational costs, estimation of oil and gas reserves, future volumes produced and marketed, represent the best estimate of the Group
management of all economic and technical conditions over the remaining life of the assets.
|
Future oil and natural gas prices were
determined based on short term assumptions reflecting the decrease observed in 2015 as well as a gradual recovery over eight years towards the long term estimated prices. As of December 31, 2015, these price assumptions reflecting the
Group’s strategic vision are consistent with a panel of several external studies.
The future operational costs were determined by taking into
account, on the one hand, the existing technologies and, on the other hand, internal cost reduction programs effectively implemented.
The future cash
flows are estimated over a period consistent with the life of the assets of the CGU. They are prepared post-tax and take into account specific risks related to the CGU’s assets. They are discounted using a 7% post-tax discount rate, this rate
being the weighted-average cost of capital estimated from historical market data. This rate was 7% in 2014 and 8% in 2013. The value in use calculated by discounting the above post-tax cash flows using a 7% post-tax discount rate is not materially
different from the value in use calculated by discounting pre-tax cash flows using a pre-tax discount rate determined by an iterative computation from the post-tax value in use. These pre-tax discount rates range from 7% to 17% in 2015.
The CGUs for the Upstream segment are defined as oil and gas fields or groups of oil and gas fields with industrial assets enabling the production, treatment and
evacuation of the oil and gas. For the year 2015, impairments of assets were recognized over CGUs of the Upstream segment for an impact of $3,636 million in operating income and $2,791 million in net income, Group share.
These impairments were mainly recognized on the following items:
|
|
–
|
|
Assets related to the GLNG project in Australia, for an amount of $1,491 million in operating income and $1,356 million in net income, Group share;
|
|
|
–
|
|
Gas assets in the United Kingdom, for an amount of $584 million in operating income and $292 million in net income, Group share;
|
|
|
–
|
|
assets in the United States of America, for an amount of $413 million in operating income and $267 million in net income, Group share;
|
|
|
–
|
|
Various assets, for an amount of $1,148 million in operating income and $876 million in net income, Group share (mainly in Angola, Gabon, Bolivia, Nigeria).
|
As for the sensitivity analysis:
|
|
–
|
|
a decrease by one point in the discount rate would have a positive impact of approximately $0.8 billion in operating income and approximately $0.5 billion in net
income, Group share;
|
|
|
–
|
|
an increase by one point in the discount rate would have a negative impact of approximately $1.3 billion in operating income and approximately $0.8 billion in
net income, Group share;
|
|
|
–
|
|
a variation of (10)% of the oil and gas prices would have an additional negative impact of approximately $3.1 billion in operating income and $2.1 billion
in net income, Group share.
|
The most sensitive assets would be:
|
|
–
|
|
the assets already impaired (impact of approximately $1.7 billion in operating income and $1.1 billion in net income, Group share), including GLNG in Australia,
gas assets in the United Kingdom and assets in the United States of America.
|
|
|
–
|
|
other assets under construction (impact of approximately $1.4 billion in operating income and $1.0 billion in net income, Group share), including projects in
Canada and Kazakhstan.
|
The CGUs for the Refining & Chemicals segment are defined by the legal entities having the operating
activities for the refining and petrochemical activities. The cash flows of these CGUs are determined using the gross contribution margin (calculated based on sales minus purchases of crude oil and refined products, the effect of inventory valuation
and variable costs). The CGUs for the other activities of the segment are global divisions, each division gathering a set of businesses or homogeneous products for strategic, commercial and industrial plans. In 2015, there was no indicator of
impairment for this segment, therefore, no impairments were recognized by the Group.
The CGUs of the Marketing & Services segment are
subsidiaries or groups of subsidiaries organized by relevant geographical zone. For the year 2015 the Group recognized impairments on CGUs of the Marketing & Services segment for an amount of $92 million in net income, Group share.
These impairments relate mainly to the intangible assets of SunPower, following the deterioration of the economic environment of the solar activity.
2.1.2) Additional impairments were recognized in 2015 for an amount of $2,113 million in operating income and $2,000 million in net
income, Group share on the following assets:
|
–
|
|
Assets, that, prior to their sale, were classified, at the end of each concerned quarter, in “assets held for sale”:
|
|
|
•
|
|
the oil sands assets of the Fort Hills project in Canada. In order to limit its exposure in the oil sands in Canada and
|
|
|
|
|
|
2015 Form 20-F TOTAL S.A.
|
|
F-27
|
Notes to the Consolidated Financial Statements – Notes 4 to 6
|
|
|
to reduce the future investments in the project, the Group decided to sell 10% of its interests in the project;
|
|
|
•
|
|
the Coal assets in South Africa, following the Group’s decision to withdraw from the coal activity;
|
|
–
|
|
Assets located in countries with geopolitical instability, such as in Libya and Yemen. In these two countries, production is stopped since the first quarter of
2015 following a significant deterioration in the safety conditions.
|
|
–
|
|
Exploration assets (mineral interests). Because of the current economic environment, the Group decided to stop some potential development projects, rendering the
associated mineral interests worthless.
|
|
–
|
|
In the Refining & Chemicals and Marketing & Services segments, the Group decided to discontinue some development and production projects
because of a lack of future profitability.
|
2.1.3) In 2014, the Group recognized impairments of assets in the Upstream,
Refining & Chemicals and Marketing & Services segments for an impact of $7,979 million in operating income and of $7,063 million in net income, Group share. These impairments were qualified as adjustments items of the operating
income and net income, Group share.
In 2013, the Group recognized impairments of assets in the Upstream, Refining & Chemicals and
Marketing & Services segments for an impact of $1,043 million in operating income and of $773 million in net income, Group share.
These impairments were qualified as adjustments items of the operating income and net income, Group share.
No reversal of impairment was accounted for in respect of the years 2013, 2014 and 2015.
2.2) Regarding the USAN
assets in Nigeria (impact of $1,128 million in operating income and $564 million in net income, Group share), given the negotiations with the potential acquirer were unsuccessful, the Group decided to reclassify them from “assets classified as
held for sale” to tangible assets, taking into account a catch-up depreciation charge for the depreciation previously not recognized in accordance with the IFRS 5 standard.
3) “Other elements” amount to $1,257 million in operating income and $966 million in net income, Group share and mainly include:
|
–
|
|
The write-off of some exploratory drilling costs previously capitalized, in relation with potential development projects that the Group decided to discontinue
due to the current economic environment;
|
|
–
|
|
Charges related to assets in Yemen and Libya following the shutdown of production in relation with the significant deterioration of the safety conditions;
|
|
–
|
|
A charge following the resolution of a dispute in Qatar and of a gas transportation contract in the United States of America;
|
|
–
|
|
Gains from the impact of changes in the tax regime in the UK and Canada on the deferred tax position.
|
5)
Information by geographical area
|
|
|
|
|
|
|
|
|
|
|
|
|
|
|
|
|
|
|
|
|
|
|
|
|
|
|
(M$)
|
|
France
|
|
|
Rest of
Europe
|
|
|
North
America
|
|
|
Africa
|
|
|
Rest of the
world
|
|
|
Total
|
|
|
For the year ended December 31, 2015
|
|
|
|
|
|
|
|
|
|
|
|
|
|
|
|
|
|
|
|
|
|
|
|
|
|
Non-Group sales
|
|
|
36,536
|
|
|
|
79,463
|
|
|
|
14,857
|
|
|
|
17,612
|
|
|
|
16,889
|
|
|
|
165,357
|
|
|
Property, plant and equipment, intangible assets, net
|
|
|
4,123
|
|
|
|
22,354
|
|
|
|
17,169
|
|
|
|
43,536
|
|
|
|
36,885
|
|
|
|
124,067
|
|
|
Capital expenditures
|
|
|
980
|
|
|
|
4,783
|
|
|
|
3,493
|
|
|
|
9,154
|
|
|
|
9,623
|
|
|
|
28,033
|
|
|
For the year ended December 31, 2014
|
|
|
|
|
|
|
|
|
|
|
|
|
|
|
|
|
|
|
|
|
|
|
|
|
|
Non-Group sales
|
|
|
51,471
|
|
|
|
114,747
|
|
|
|
23,766
|
|
|
|
23,281
|
|
|
|
22,857
|
|
|
|
236,122
|
|
|
Property, plant and equipment, intangible assets, net
|
|
|
4,350
|
|
|
|
25,137
|
|
|
|
16,064
|
|
|
|
41,405
|
|
|
|
34,602
|
|
|
|
121,558
|
|
|
Capital expenditures
|
|
|
1,266
|
|
|
|
5,880
|
|
|
|
3,658
|
|
|
|
9,798
|
|
|
|
9,907
|
|
|
|
30,509
|
|
|
For the year ended December 31, 2013
|
|
|
|
|
|
|
|
|
|
|
|
|
|
|
|
|
|
|
|
|
|
|
|
|
|
Non-Group sales
|
|
|
57,650
|
|
|
|
128,661
|
|
|
|
22,332
|
|
|
|
23,146
|
|
|
|
19,936
|
|
|
|
251,725
|
|
|
Property, plant and equipment, intangible assets, net
|
|
|
6,251
|
|
|
|
26,840
|
|
|
|
19,588
|
|
|
|
37,847
|
|
|
|
32,349
|
|
|
|
122,875
|
|
|
Capital expenditures
|
|
|
1,772
|
|
|
|
6,289
|
|
|
|
4,157
|
|
|
|
10,705
|
|
|
|
11,508
|
|
|
|
34,431
|
|
6)
Operating expenses
|
|
|
|
|
|
|
|
|
|
|
|
|
|
|
For the year ended December 31, (M$)
|
|
2015
|
|
|
2014
|
|
|
2013
|
|
|
Purchases, net of inventory variation
(a)(b)
|
|
|
(96,671
|
)
|
|
|
(152,975
|
)
|
|
|
(160,849
|
)
|
|
Exploration costs
|
|
|
(1,991
|
)
|
|
|
(1,964
|
)
|
|
|
(2,169
|
)
|
|
Other operating expenses
(c)
|
|
|
(24,345
|
)
|
|
|
(28,349
|
)
|
|
|
(28,764
|
)
|
|
of which non-current operating liabilities (allowances) reversals
|
|
|
858
|
|
|
|
717
|
|
|
|
184
|
|
|
of which current operating liabilities (allowances) reversals
|
|
|
(86
|
)
|
|
|
(147
|
)
|
|
|
6
|
|
|
Operating expenses
|
|
|
(123,007
|
)
|
|
|
(183,288
|
)
|
|
|
(191,782
|
)
|
|
(a)
|
Includes taxes paid on oil and gas production in the Upstream segment, namely royalties.
|
|
(b)
|
The Group values under / over lifting at market value.
|
|
(c)
|
Principally composed of production and administrative costs (see in particular the payroll costs as detailed in Note 26 to the Consolidated Financial
Statements “Payroll and staff”).
|
|
|
|
|
|
F-28
|
|
TOTAL S.A. Form 20-F 2015
|
Notes 7 to 9 – Notes to the Consolidated Financial Statements
7)
Other income and other expense
|
|
|
|
|
|
|
|
|
|
|
|
|
|
|
For the year ended December 31, (M$)
|
|
2015
|
|
|
2014
|
|
|
2013
|
|
|
Gains on disposal of assets
|
|
|
2,658
|
|
|
|
2,085
|
|
|
|
1,991
|
|
|
Foreign exchange gains
|
|
|
663
|
|
|
|
216
|
|
|
|
9
|
|
|
Other
|
|
|
285
|
|
|
|
276
|
|
|
|
290
|
|
|
Other income
|
|
|
3,606
|
|
|
|
2,577
|
|
|
|
2,290
|
|
|
Losses on disposal of assets
|
|
|
(199
|
)
|
|
|
(106
|
)
|
|
|
(1,911
|
)
|
|
Foreign exchange losses
|
|
|
(102
|
)
|
|
|
—
|
|
|
|
—
|
|
|
Amortization of other intangible assets (excl. mineral interests)
|
|
|
(332
|
)
|
|
|
(254
|
)
|
|
|
(292
|
)
|
|
Other
|
|
|
(944
|
)
|
|
|
(594
|
)
|
|
|
(597
|
)
|
|
Other expense
|
|
|
(1,577
|
)
|
|
|
(954
|
)
|
|
|
(2,800
|
)
|
Other income
In 2015, gains
on disposal of assets are mainly related to sales of assets in Nigeria in the Upstream segment, to sales of interests in Geosel and the Schwedt refinery in the Refining & Chemicals segment, to the sale of the Bostik adhesives activity, also
in the Refining & Chemicals segment, and to the sale of 100 % of Totalgaz in the Marketing & Services segment (see Note 3 to the Consolidated Financial Statements).
In 2014, gains on disposal of assets mainly related to sales of assets in the Upstream segment in Angola and the United-States and to sales of interests, also in the Upstream segment in: the company GTT
(GazTransport et Technigaz), the Shah Deniz field and the South Caucasus pipeline.
In 2013, gains on disposals were mainly related to the sale of
Transport et Infrastructures Gaz France (TIGF) and the sales of interests in the Upstream segment: 25% interest in the Tempa Rossa field in Italy and all interests in Trinidad & Tobago.
Other expense
In 2015, the loss on disposals is mainly related to the sale of 20% of interests in fields in the United Kingdom (see Note 3 to the Consolidated Financial
Statements). The heading “Other” mainly consists of the impairment of non-consolidated shares and loans granted to non-consolidated subsidiaries and equity affiliates for an amount of $409 million, $180 million of restructuring charges in
the Upstream, Refining & Chemicals and Marketing & Services segments as well as $162 million for expenses relating to a litigation in Qatar.
In 2014, the loss on disposals is mainly related to the sale of CCP Composites to Polynt Group. The heading “Other” mainly consists of the impairment of shares and loans of non-consolidated subsidiaries
for an amount of $88 million, $43 million of restructuring charges as well as $34 million for expenses relating to sales.
In 2013, the loss on disposals
is mainly related to the sale to Suncor Energy Inc. of TOTAL’s 49% interest in the Voyageur upgrader project in Canada. The heading “Other” mainly consists of $281 million of restructuring charges in the Upstream, Refining &
Chemicals and Marketing & Services segments.
8)
Other financial income and expense
|
|
|
|
|
|
|
|
|
|
|
|
|
|
|
As of December 31, (M$)
|
|
2015
|
|
|
2014
|
|
|
2013
|
|
|
Dividend income on non-consolidated subsidiaries
|
|
|
267
|
|
|
|
282
|
|
|
|
202
|
|
|
Capitalized financial expenses
|
|
|
364
|
|
|
|
348
|
|
|
|
343
|
|
|
Other
|
|
|
251
|
|
|
|
191
|
|
|
|
151
|
|
|
Other financial income
|
|
|
882
|
|
|
|
821
|
|
|
|
696
|
|
|
Accretion of asset retirement obligations
|
|
|
(513
|
)
|
|
|
(543
|
)
|
|
|
(584
|
)
|
|
Other
|
|
|
(141
|
)
|
|
|
(133
|
)
|
|
|
(118
|
)
|
|
Other financial expense
|
|
|
(654
|
)
|
|
|
(676
|
)
|
|
|
(702
|
)
|
9)
Income taxes
TOTAL S.A. is taxed in accordance with the common French tax regime.
|
|
|
|
|
|
|
|
|
|
|
|
|
|
|
For the year ended December 31, (M$)
|
|
2015
|
|
|
2014
|
|
|
2013
|
|
|
Current income taxes
|
|
|
(4,552
|
)
|
|
|
(10,904
|
)
|
|
|
(13,607
|
)
|
|
Deferred income taxes
|
|
|
2,899
|
|
|
|
2,290
|
|
|
|
(1,160
|
)
|
|
Total income taxes
|
|
|
(1,653
|
)
|
|
|
(8,614
|
)
|
|
|
(14,767
|
)
|
Before netting deferred tax assets and liabilities by fiscal entity, the components of deferred tax balances are as follows:
|
|
|
|
|
|
|
|
|
|
|
|
|
|
|
As of December 31, (M$)
|
|
2015
|
|
|
2014
|
|
|
2013
|
|
|
Net operating losses and tax carry forwards
|
|
|
4,849
|
|
|
|
5,213
|
|
|
|
4,586
|
|
|
Employee benefits
|
|
|
1,260
|
|
|
|
1,770
|
|
|
|
1,641
|
|
|
Other temporary non-deductible provisions
|
|
|
6,481
|
|
|
|
6,258
|
|
|
|
5,992
|
|
|
Differences in depreciations
|
|
|
(15,932
|
)
|
|
|
(18,129
|
)
|
|
|
(20,948
|
)
|
|
Other temporary tax deductions
|
|
|
(1,795
|
)
|
|
|
(2,542
|
)
|
|
|
(3,267
|
)
|
|
Valuation allowance
|
|
|
(3,241
|
)
|
|
|
(3,301
|
)
|
|
|
(2,016
|
)
|
|
Net deferred tax liability
|
|
|
(8,378
|
)
|
|
|
(10,731
|
)
|
|
|
(14,012
|
)
|
The reserves of TOTAL subsidiaries that would be taxable if distributed but for which no distribution is planned, and for which no
deferred tax liability has therefore been recognized, totaled $10,596 million as of December 31, 2015.
The impairment of deferred tax assets in the
table above for $3,241 million as of December 31, 2015, relates notably to Congo for an amount of $1,034 million, to France for an amount of $607 million, to Canada for an amount of $324 million, to Australia for an amount of $312 million and
to Belgium for an amount of $263 million.
After netting deferred tax assets and liabilities by fiscal entity, deferred taxes are presented on the
balance sheet as follows:
|
|
|
|
|
|
|
|
|
|
|
|
|
|
|
As of December 31, (M$)
|
|
2015
|
|
|
2014
|
|
|
2013
|
|
|
Deferred tax assets, non-current
|
|
|
3,982
|
|
|
|
4,079
|
|
|
|
3,838
|
|
|
Deferred tax liabilities, non-current
|
|
|
(12,360
|
)
|
|
|
(14,810
|
)
|
|
|
(17,850
|
)
|
|
Net amount
|
|
|
(8,378
|
)
|
|
|
(10,731
|
)
|
|
|
(14,012
|
)
|
|
|
|
|
|
2015 Form 20-F TOTAL S.A.
|
|
F-29
|
Notes to the Consolidated Financial Statements – Note 9
The net deferred tax variation in the balance sheet is analyzed as follows:
|
|
|
|
|
|
|
|
|
|
|
|
|
|
|
As of December 31, (M$)
|
|
2015
|
|
|
2014
|
|
|
2013
|
|
|
Opening balance
|
|
|
(10,731
|
)
|
|
|
(14,012
|
)
|
|
|
(13,024
|
)
|
|
Deferred tax on income
|
|
|
2,899
|
|
|
|
2,290
|
|
|
|
(1,160
|
)
|
|
Deferred tax on shareholders’ equity
(a)
|
|
|
(225
|
)
|
|
|
562
|
|
|
|
(349
|
)
|
|
Changes in scope of consolidation
(b)
|
|
|
(552
|
)
|
|
|
356
|
|
|
|
153
|
|
|
Currency translation adjustment
|
|
|
231
|
|
|
|
73
|
|
|
|
368
|
|
|
Closing balance
|
|
|
(8,378
|
)
|
|
|
(10,731
|
)
|
|
|
(14,012
|
)
|
|
(a)
|
This amount includes mainly deferred taxes on actuarial gains and losses, current income taxes and deferred taxes for changes in fair value of listed
securities classified as financial assets available for sale, as well as deferred taxes related to the cash flow hedge (see Note 17 to the Consolidated Financial Statements).
|
|
(b)
|
Changes in scope of consolidation include, as of December 31, 2015 the impact
of reclassifications in assets classified as held for sale and liabilities directly associated with the assets classified as held for sale for $(565) million.
|
Reconciliation between provision for income taxes and pre-tax income:
|
|
|
|
|
|
|
|
|
|
|
|
|
|
|
For the year ended December 31, (M$)
|
|
2015
|
|
|
2014
|
|
|
2013
|
|
|
Consolidated net income
|
|
|
4,786
|
|
|
|
4,250
|
|
|
|
11,521
|
|
|
Provision for income taxes
|
|
|
1,653
|
|
|
|
8,614
|
|
|
|
14,767
|
|
|
Pre-tax income
|
|
|
6,439
|
|
|
|
12,864
|
|
|
|
26,288
|
|
|
French statutory tax rate
|
|
|
38.00
|
%
|
|
|
38.00
|
%
|
|
|
38.00
|
%
|
|
Theoretical tax charge
|
|
|
(2,447
|
)
|
|
|
(4,888
|
)
|
|
|
(9,989
|
)
|
|
Difference between French and foreign income tax rates
|
|
|
(6
|
)
|
|
|
(4,256
|
)
|
|
|
(6,131
|
)
|
|
Tax effect of equity in income (loss) of affiliates
|
|
|
897
|
|
|
|
1,012
|
|
|
|
1,298
|
|
|
Permanent differences
|
|
|
(371
|
)
|
|
|
833
|
|
|
|
1,130
|
|
|
Adjustments on prior years income taxes
|
|
|
100
|
|
|
|
33
|
|
|
|
—
|
|
|
Adjustments on deferred tax related to changes in tax rates
|
|
|
483
|
|
|
|
(1
|
)
|
|
|
3
|
|
|
Changes in valuation allowance of deferred tax assets
|
|
|
(309
|
)
|
|
|
(1,347
|
)
|
|
|
(1,078
|
)
|
|
Net provision for income taxes
|
|
|
(1,653
|
)
|
|
|
(8,614
|
)
|
|
|
(14,767
|
)
|
The difference between the French tax rate and the tax rates of foreign subsidiaries is mainly due to the taxation of profits made
by the Group in countries where it conducts its exploration and production activities at higher tax rates than French tax rates.
The French statutory
tax rate includes the standard corporate tax rate (33.33%) and additional applicable taxes that bring the overall tax rate to 38% (versus 38% in 2014 and 38% in 2013).
Permanent differences are mainly due to impairment of goodwill and to dividends from non-consolidated companies as well as the specific taxation rules applicable to certain activities.
Net operating losses and carried forward tax credits
Deferred tax assets related to carried forward tax credits on net operating losses expire in the following years:
|
|
|
|
|
|
|
|
|
|
|
|
|
|
|
|
|
|
|
|
|
|
|
|
|
|
|
|
|
2015
|
|
|
2014
|
|
|
2013
|
|
|
As of
December 31, (M$)
|
|
Basis
|
|
|
Tax
|
|
|
Basis
|
|
|
Tax
|
|
|
Basis
|
|
|
Tax
|
|
|
2014
|
|
|
—
|
|
|
|
—
|
|
|
|
—
|
|
|
|
—
|
|
|
|
491
|
|
|
|
236
|
|
|
2015
|
|
|
—
|
|
|
|
—
|
|
|
|
443
|
|
|
|
218
|
|
|
|
372
|
|
|
|
178
|
|
|
2016
|
|
|
396
|
|
|
|
193
|
|
|
|
306
|
|
|
|
151
|
|
|
|
226
|
|
|
|
105
|
|
|
2017
|
|
|
617
|
|
|
|
248
|
|
|
|
623
|
|
|
|
229
|
|
|
|
565
|
|
|
|
185
|
|
|
2018
(a)
|
|
|
489
|
|
|
|
182
|
|
|
|
424
|
|
|
|
143
|
|
|
|
4,435
|
|
|
|
1,332
|
|
|
2019
(b)
|
|
|
15
|
|
|
|
3
|
|
|
|
3,313
|
|
|
|
899
|
|
|
|
—
|
|
|
|
—
|
|
|
2020 and after
|
|
|
3,289
|
|
|
|
948
|
|
|
|
—
|
|
|
|
—
|
|
|
|
—
|
|
|
|
—
|
|
|
Unlimited
|
|
|
9,656
|
|
|
|
3,275
|
|
|
|
9,906
|
|
|
|
3,573
|
|
|
|
7,593
|
|
|
|
2,550
|
|
|
Total
|
|
|
14,462
|
|
|
|
4,849
|
|
|
|
15,015
|
|
|
|
5,213
|
|
|
|
13,682
|
|
|
|
4,586
|
|
|
(a)
|
Net operating losses and carried forward tax credits in 2018 and after for 2013.
|
|
(b)
|
Net operating losses and carried forward tax credits in 2019 and after for 2014.
|
As of December 31, 2015 the schedule of the net operating losses and the carried forward tax credits for the main countries is as follows:
|
|
|
|
|
|
|
|
|
|
|
|
|
|
|
|
|
|
|
|
|
|
|
|
|
Tax
|
|
|
As of
December 31, 2015 (M$)
|
|
United
Kingdom
|
|
|
France
|
|
|
Canada
|
|
|
Australia
|
|
|
Belgium
|
|
|
2016
|
|
|
—
|
|
|
|
—
|
|
|
|
—
|
|
|
|
—
|
|
|
|
5
|
|
|
2017
|
|
|
—
|
|
|
|
—
|
|
|
|
—
|
|
|
|
—
|
|
|
|
134
|
|
|
2018
|
|
|
—
|
|
|
|
—
|
|
|
|
—
|
|
|
|
—
|
|
|
|
126
|
|
|
2019
|
|
|
—
|
|
|
|
—
|
|
|
|
—
|
|
|
|
—
|
|
|
|
—
|
|
|
2020 and after
|
|
|
—
|
|
|
|
—
|
|
|
|
649
|
|
|
|
—
|
|
|
|
9
|
|
|
Unlimited
|
|
|
1,019
|
|
|
|
864
|
|
|
|
215
|
|
|
|
684
|
|
|
|
235
|
|
|
Total
|
|
|
1,019
|
|
|
|
864
|
|
|
|
864
|
|
|
|
684
|
|
|
|
509
|
|
|
|
|
|
|
F-30
|
|
TOTAL S.A. Form 20-F 2015
|
Note 10 – Notes to the Consolidated Financial Statements
The Group has unused tax losses for which deferred tax has not been recognized for an
amount of $1,283 million as of December 31, 2015, mainly in the Upstream segment when the affiliate or the field concerned is in its exploration phase. The net operating losses created during this exploration phase will be useable only if
a final investment and development decision is made. Accordingly, the time limit for the utilization of these net operating losses is not known.
10)
Intangible assets
|
|
|
|
|
|
|
|
|
|
|
|
|
|
|
As of December 31, 2015 (M$)
|
|
Cost
|
|
|
Amortization and
impairment
|
|
|
Net
|
|
|
Goodwill
|
|
|
1,597
|
|
|
|
(971
|
)
|
|
|
626
|
|
|
Proved mineral interests
|
|
|
12,800
|
|
|
|
(6,436
|
)
|
|
|
6,364
|
|
|
Unproved mineral interests
|
|
|
11,751
|
|
|
|
(5,082
|
)
|
|
|
6,669
|
|
|
Other intangible assets
|
|
|
4,059
|
|
|
|
(3,169
|
)
|
|
|
890
|
|
|
Total intangible assets
|
|
|
30,207
|
|
|
|
(15,658
|
)
|
|
|
14,549
|
|
|
|
|
|
|
|
|
|
|
|
|
|
|
|
|
As of December 31, 2014 (M$)
|
|
Cost
|
|
|
Amortization and
impairment
|
|
|
Net
|
|
|
Goodwill
|
|
|
1,639
|
|
|
|
(1,020
|
)
|
|
|
619
|
|
|
Proved mineral interests
|
|
|
12,215
|
|
|
|
(5,514
|
)
|
|
|
6,701
|
|
|
Unproved mineral interests
|
|
|
10,673
|
|
|
|
(4,498
|
)
|
|
|
6,175
|
|
|
Other intangible assets
|
|
|
4,387
|
|
|
|
(3,200
|
)
|
|
|
1,187
|
|
|
Total intangible assets
|
|
|
28,914
|
|
|
|
(14,232
|
)
|
|
|
14,682
|
|
|
|
|
|
|
|
|
|
|
|
|
|
|
|
|
As of December 31, 2013 (M$)
|
|
Cost
|
|
|
Amortization and
impairment
|
|
|
Net
|
|
|
Goodwill
|
|
|
2,512
|
|
|
|
(1,263
|
)
|
|
|
1,249
|
|
|
Proved mineral interests
|
|
|
12,309
|
|
|
|
(5,003
|
)
|
|
|
7,306
|
|
|
Unproved mineral interests
|
|
|
10,430
|
|
|
|
(1,785
|
)
|
|
|
8,645
|
|
|
Other intangible assets
|
|
|
4,978
|
|
|
|
(3,783
|
)
|
|
|
1,195
|
|
|
Total intangible assets
|
|
|
30,229
|
|
|
|
(11,834
|
)
|
|
|
18,395
|
|
Changes in net intangible assets are analyzed in the following table:
|
|
|
|
|
|
|
|
|
|
|
|
|
|
|
|
|
|
|
|
|
|
|
|
|
|
|
|
|
|
|
(M$)
|
|
Net
amount
as of
January 1,
|
|
|
Acquisitions
|
|
|
Disposals
|
|
|
Amortization
and
impairment
|
|
|
Currency
translation
adjustment
|
|
|
Other
|
|
|
Net amount
as of
December 31,
|
|
|
2015
|
|
|
14,682
|
|
|
|
2,750
|
|
|
|
(343
|
)
|
|
|
(2,324
|
)
|
|
|
(200
|
)
|
|
|
(16
|
)
|
|
|
14,549
|
|
|
2014
|
|
|
18,395
|
|
|
|
1,000
|
|
|
|
(178
|
)
|
|
|
(3,920
|
)
|
|
|
(276
|
)
|
|
|
(339
|
)
|
|
|
14,682
|
|
|
2013
|
|
|
16,965
|
|
|
|
3,648
|
|
|
|
(388
|
)
|
|
|
(1,527
|
)
|
|
|
(10
|
)
|
|
|
(293
|
)
|
|
|
18,395
|
|
In 2015, the heading “Amortization and impairment” includes the accounting impact of exceptional asset
impairments for an amount of $1,482 million (see Note 4D to the Consolidated Financial Statements).
In 2014, the heading “Amortization and
impairment” included the accounting impact of exceptional asset impairments for an amount of $3,177 million (see Note 4D to the Consolidated Financial Statements).
In 2014, the heading “Other” mainly included mineral interests in Utica reclassified into acquisitions for $(524) million, the recognition of mineral interests in Papua New Guinea for $429 million, the
reclassification of assets in accordance with IFRS 5 “Non-current assets held for sale and discontinued operations” for $(561) million and the reversal of the reclassification under
IFRS 5 as at December 31, 2013 for $96 million corresponding to disposals.
In 2013, the heading “Other” mainly included mineral interests
in Utica reclassified into acquisitions for $(604) million, the reclassification of assets in accordance with IFRS 5 “Non-current assets held for sale and discontinued operations” for $(93) million and the reversal of the reclassification
under IFRS 5 as at December 31, 2012 for $331 million corresponding to disposals.
A summary of changes in the carrying amount of
goodwill by business segment for the year ended December 31, 2015 is as follows:
|
|
|
|
|
|
|
|
|
|
|
|
|
|
|
|
|
|
|
|
|
|
|
(M$)
|
|
Net goodwill as of
January 1, 2015
|
|
|
Increases
|
|
|
Impairments
|
|
|
Other
|
|
|
Net goodwill as of
December 31, 2015
|
|
|
Upstream
|
|
|
—
|
|
|
|
—
|
|
|
|
—
|
|
|
|
—
|
|
|
|
—
|
|
|
Refining & Chemicals
|
|
|
485
|
|
|
|
10
|
|
|
|
—
|
|
|
|
(25
|
)
|
|
|
470
|
|
|
Marketing & Services
|
|
|
104
|
|
|
|
37
|
|
|
|
—
|
|
|
|
(12
|
)
|
|
|
129
|
|
|
Corporate
|
|
|
30
|
|
|
|
—
|
|
|
|
—
|
|
|
|
(3
|
)
|
|
|
27
|
|
|
Total
|
|
|
619
|
|
|
|
47
|
|
|
|
—
|
|
|
|
(40
|
)
|
|
|
626
|
|
|
|
|
|
|
2015 Form 20-F TOTAL S.A.
|
|
F-31
|
Notes to the Consolidated Financial Statements – Note 11
11)
Property, plant and equipment
|
|
|
|
|
|
|
|
|
|
|
|
|
|
|
As of December 31, 2015 (M$)
|
|
Cost
|
|
|
Depreciation and
impairment
|
|
|
Net
|
|
|
Upstream properties
|
|
|
|
|
|
|
|
|
|
|
|
|
|
Proved properties
|
|
|
153,530
|
|
|
|
(94,843
|
)
|
|
|
58,687
|
|
|
Unproved properties
|
|
|
2,423
|
|
|
|
—
|
|
|
|
2,423
|
|
|
Work in progress
|
|
|
36,246
|
|
|
|
(2,284
|
)
|
|
|
33,962
|
|
|
Subtotal
|
|
|
192,199
|
|
|
|
(97,127
|
)
|
|
|
95,072
|
|
|
Other property, plant and equipment
|
|
|
|
|
|
|
|
|
|
|
|
|
|
Land
|
|
|
1,551
|
|
|
|
(581
|
)
|
|
|
970
|
|
|
Machinery, plant and equipment (including transportation equipment)
|
|
|
28,723
|
|
|
|
(22,975
|
)
|
|
|
5,748
|
|
|
Buildings
|
|
|
7,655
|
|
|
|
(5,018
|
)
|
|
|
2,637
|
|
|
Work in progress
|
|
|
2,705
|
|
|
|
(128
|
)
|
|
|
2,577
|
|
|
Other
|
|
|
8,182
|
|
|
|
(5,668
|
)
|
|
|
2,514
|
|
|
Subtotal
|
|
|
48,816
|
|
|
|
(34,370
|
)
|
|
|
14,446
|
|
|
Total property, plant and equipment
|
|
|
241,015
|
|
|
|
(131,497
|
)
|
|
|
109,518
|
|
|
|
|
|
|
|
|
|
|
|
|
|
|
|
|
As of December 31, 2014 (M$)
|
|
Cost
|
|
|
Depreciation and
impairment
|
|
|
Net
|
|
|
Upstream properties
|
|
|
|
|
|
|
|
|
|
|
|
|
|
Proved properties
|
|
|
139,294
|
|
|
|
(86,326
|
)
|
|
|
52,968
|
|
|
Unproved properties
|
|
|
2,153
|
|
|
|
—
|
|
|
|
2,153
|
|
|
Work in progress
|
|
|
38,698
|
|
|
|
(1,574
|
)
|
|
|
37,124
|
|
|
Subtotal
|
|
|
180,145
|
|
|
|
(87,900
|
)
|
|
|
92,245
|
|
|
Other property, plant and equipment
|
|
|
|
|
|
|
|
|
|
|
|
|
|
Land
|
|
|
1,683
|
|
|
|
(613
|
)
|
|
|
1,070
|
|
|
Machinery, plant and equipment (including transportation equipment)
|
|
|
30,966
|
|
|
|
(24,874
|
)
|
|
|
6,092
|
|
|
Buildings
|
|
|
8,141
|
|
|
|
(5,291
|
)
|
|
|
2,850
|
|
|
Work in progress
|
|
|
2,367
|
|
|
|
(324
|
)
|
|
|
2,043
|
|
|
Other
|
|
|
8,673
|
|
|
|
(6,097
|
)
|
|
|
2,576
|
|
|
Subtotal
|
|
|
51,830
|
|
|
|
(37,199
|
)
|
|
|
14,631
|
|
|
Total property, plant and equipment
|
|
|
231,975
|
|
|
|
(125,099
|
)
|
|
|
106,876
|
|
|
|
|
|
|
|
|
|
|
|
|
|
|
|
|
As of December 31, 2013 (M$)
|
|
Cost
|
|
|
Depreciation and
impairment
|
|
|
Net
|
|
|
Upstream properties
|
|
|
|
|
|
|
|
|
|
|
|
|
|
Proved properties
|
|
|
134,512
|
|
|
|
(83,423
|
)
|
|
|
51,089
|
|
|
Unproved properties
|
|
|
1,432
|
|
|
|
—
|
|
|
|
1,432
|
|
|
Work in progress
|
|
|
34,668
|
|
|
|
(56
|
)
|
|
|
34,612
|
|
|
Subtotal
|
|
|
170,612
|
|
|
|
(83,479
|
)
|
|
|
87,133
|
|
|
Other property, plant and equipment
|
|
|
|
|
|
|
|
|
|
|
|
|
|
Land
|
|
|
1,846
|
|
|
|
(582
|
)
|
|
|
1,264
|
|
|
Machinery, plant and equipment (including transportation equipment)
|
|
|
35,215
|
|
|
|
(26,903
|
)
|
|
|
8,312
|
|
|
Buildings
|
|
|
9,050
|
|
|
|
(5,870
|
)
|
|
|
3,180
|
|
|
Work in progress
|
|
|
2,318
|
|
|
|
(465
|
)
|
|
|
1,853
|
|
|
Other
|
|
|
9,717
|
|
|
|
(6,979
|
)
|
|
|
2,738
|
|
|
Subtotal
|
|
|
58,146
|
|
|
|
(40,799
|
)
|
|
|
17,347
|
|
|
Total property, plant and equipment
|
|
|
228,758
|
|
|
|
(124,278
|
)
|
|
|
104,480
|
|
Changes in net property, plant and equipment are analyzed in the following table:
|
|
|
|
|
|
|
|
|
|
|
|
|
|
|
|
|
|
|
|
|
|
|
|
|
|
|
|
|
|
|
(M$)
|
|
Net amount as
of January 1,
|
|
|
Acquisitions
|
|
|
Disposals
|
|
|
Depreciation and
impairment
|
|
|
Currency
translation
adjustment
|
|
|
Other
|
|
|
Net amount as of
December 31,
|
|
|
2015
|
|
|
106,876
|
|
|
|
22,382
|
|
|
|
(1,842
|
)
|
|
|
(17,010
|
)
|
|
|
(3,449
|
)
|
|
|
2,561
|
|
|
|
109,518
|
|
|
2014
|
|
|
104,480
|
|
|
|
25,320
|
|
|
|
(2,211
|
)
|
|
|
(16,939
|
)
|
|
|
(4,438
|
)
|
|
|
664
|
|
|
|
106,876
|
|
|
2013
|
|
|
91,477
|
|
|
|
26,100
|
|
|
|
(2,828
|
)
|
|
|
(11,831
|
)
|
|
|
(361
|
)
|
|
|
1,923
|
|
|
|
104,480
|
|
In 2015, the heading “Disposals” mainly includes the impact of sales in the Upstream segment (sale of 4
blocks in Nigeria, West of Shetland fields in United Kingdom and a part of Fort Hills in Canada).
In 2015, the heading “Depreciation and impairment” includes the impact of impairments of assets recognized
for an amount of $5,544 million (see Note 4D to the Consolidated Financial Statements).
|
|
|
|
|
F-32
|
|
TOTAL S.A. Form 20-F 2015
|
Note 12 – Notes to the Consolidated Financial Statements
In 2015, the heading “Other” principally corresponds to the increase of the asset for site restitution for
an amount of $956 million and the reclassification of assets classified in accordance with IFRS 5 “Non-current assets held for sale and discontinued operations” for $1,128 million, primarily related to the Usan field in Nigeria.
In 2014, the heading “Disposals” mainly included the impact of sales in the Upstream segment (sale of block 15/06 in Angola and the Shah Deniz
field in Azerbaijan).
In 2014, the heading “Depreciation and impairment” included the impact of impairments of assets recognized for an amount
of $4,802 million (see Note 4D to the Consolidated Financial Statements).
In 2014, the heading “Other” principally corresponded to the
increase of the asset for site restitution for an amount of $1,366 million. It also includes $(466) million related to the reclassification
of assets classified in accordance with IFRS 5 “Non-current assets held for sale and discontinued operations” primarily related to the sales of Total Coal South Africa and Bostik.
In 2013, the heading “Disposals” mainly included the impact of sales of assets in the Upstream segment (sale of the Voyageur Upgrader project
in Canada and the sale of TOTAL’s interests in the Tempa Rossa field in Italy).
In 2013, the heading “Depreciation and impairment”
included the impact of impairments of assets recognized for $1,043 million (see Note 4D to the Consolidated Financial Statements).
In 2013, the heading
“Other” principally corresponded to the increase of the asset for site restitution for an amount of $2,748 million. It also includes $(538) million related to the reclassification of assets classified in accordance with IFRS 5
“Non-current assets held for sale and discontinued operations” and $(206) million related to the sale of the fertilizing businesses in Europe.
Property, plant and equipment presented above
include the following amounts for facilities and equipment under finance leases that have been capitalized:
|
|
|
|
|
|
|
|
|
|
|
|
|
|
|
As of December 31, 2015 (M$)
|
|
Cost
|
|
|
Depreciation and
impairment
|
|
|
Net
|
|
|
Machinery, plant and equipment
|
|
|
426
|
|
|
|
(384
|
)
|
|
|
42
|
|
|
Buildings
|
|
|
95
|
|
|
|
(38
|
)
|
|
|
57
|
|
|
Other
|
|
|
175
|
|
|
|
(31
|
)
|
|
|
144
|
|
|
Total
|
|
|
696
|
|
|
|
(453
|
)
|
|
|
243
|
|
|
|
|
|
|
|
|
|
|
|
|
|
|
|
|
As of December 31, 2014 (M$)
|
|
Cost
|
|
|
Depreciation and
impairment
|
|
|
Net
|
|
|
Machinery, plant and equipment
|
|
|
520
|
|
|
|
(443
|
)
|
|
|
77
|
|
|
Buildings
|
|
|
72
|
|
|
|
(45
|
)
|
|
|
27
|
|
|
Other
|
|
|
245
|
|
|
|
(29
|
)
|
|
|
216
|
|
|
Total
|
|
|
837
|
|
|
|
(517
|
)
|
|
|
320
|
|
|
|
|
|
|
|
|
|
|
|
|
|
|
|
|
As of December 31, 2013 (M$)
|
|
Cost
|
|
|
Depreciation and
impairment
|
|
|
Net
|
|
|
Machinery, plant and equipment
|
|
|
519
|
|
|
|
(417
|
)
|
|
|
102
|
|
|
Buildings
|
|
|
72
|
|
|
|
(35
|
)
|
|
|
37
|
|
|
Other
|
|
|
263
|
|
|
|
(17
|
)
|
|
|
246
|
|
|
Total
|
|
|
854
|
|
|
|
(469
|
)
|
|
|
385
|
|
12)
Equity affiliates: investments and loans
The contribution of equity affiliates in the consolidated balance sheet, consolidated statement of income and consolidated statement of comprehensive income is presented below:
|
|
|
|
|
|
|
|
|
|
|
|
|
|
|
Equity value
As of
December 31,
(M$)
|
|
2015
|
|
|
2014
|
|
|
2013
|
|
|
Total Associates
|
|
|
11,255
|
|
|
|
11,632
|
|
|
|
13,717
|
|
|
Total Joint ventures
|
|
|
3,751
|
|
|
|
3,016
|
|
|
|
3,146
|
|
|
Total
|
|
|
15,006
|
|
|
|
14,648
|
|
|
|
16,863
|
|
|
Loans
|
|
|
4,378
|
|
|
|
4,626
|
|
|
|
3,554
|
|
|
Total
|
|
|
19,384
|
|
|
|
19,274
|
|
|
|
20,417
|
|
|
|
|
|
|
|
|
|
|
|
|
|
|
|
|
Equity share in profit/(loss)
As of December 31,
(M$)
|
|
2015
|
|
|
2014
|
|
|
2013
|
|
|
Total Associates
|
|
|
2,004
|
|
|
|
2,786
|
|
|
|
3,238
|
|
|
Total Joint ventures
|
|
|
357
|
|
|
|
(124
|
)
|
|
|
177
|
|
|
Total
|
|
|
2,361
|
|
|
|
2,662
|
|
|
|
3,415
|
|
|
|
|
|
|
2015 Form 20-F TOTAL S.A.
|
|
F-33
|
Notes to the Consolidated Financial Statements – Note 12
|
|
|
|
|
|
|
|
|
|
|
|
|
|
|
Other comprehensive income
As of December 31,
(M$)
|
|
2015
|
|
|
2014
|
|
|
2013
|
|
|
Total Associates
|
|
|
139
|
|
|
|
(1,532
|
)
|
|
|
(669
|
)
|
|
Total Joint ventures
|
|
|
(19
|
)
|
|
|
(6
|
)
|
|
|
(136
|
)
|
|
Total
|
|
|
120
|
|
|
|
(1,538
|
)
|
|
|
(805
|
)
|
In cases where the Group holds less than 20% of the voting rights in another entity, the determination of whether the Group
exercises significant influence is also based on other facts and circumstances: representation on the board of directors or an equivalent governing body of the entity, participation in policy-making processes, including participation in decisions
relating to dividends or other distributions, significant transactions between the investor and the entity, exchange of management personnel, or provision of essential technical information.
Information (100% gross) relating to significant associates is as follows:
Upstream
|
|
|
|
|
|
|
|
|
|
|
|
|
|
|
|
|
|
|
|
|
|
|
|
|
|
|
|
|
|
|
|
|
|
|
|
|
|
|
|
|
Novatek
(a)
|
|
|
Liquefaction entities
|
|
|
PetroCedeño
|
|
|
(M$)
|
|
2015
|
|
|
2014
|
|
|
2013
|
|
|
2015
|
|
|
2014
|
|
|
2013
|
|
|
2015
|
|
|
2014
|
|
|
2013
|
|
|
Non current assets
|
|
|
9,768
|
|
|
|
9,551
|
|
|
|
13,617
|
|
|
|
33,294
|
|
|
|
33,909
|
|
|
|
31,680
|
|
|
|
6,916
|
|
|
|
6,458
|
|
|
|
6,263
|
|
|
Current assets
|
|
|
2,237
|
|
|
|
1,648
|
|
|
|
2,829
|
|
|
|
7,427
|
|
|
|
9,007
|
|
|
|
7,684
|
|
|
|
3,437
|
|
|
|
10,033
|
|
|
|
5,059
|
|
|
Total Assets
|
|
|
12,005
|
|
|
|
11,199
|
|
|
|
16,446
|
|
|
|
40,721
|
|
|
|
42,916
|
|
|
|
39,364
|
|
|
|
10,353
|
|
|
|
16,491
|
|
|
|
11,322
|
|
|
Shareholder’s equity
|
|
|
6,745
|
|
|
|
7,135
|
|
|
|
10,683
|
|
|
|
25,941
|
|
|
|
25,090
|
|
|
|
23,256
|
|
|
|
5,538
|
|
|
|
5,597
|
|
|
|
5,581
|
|
|
Non current liabilities
|
|
|
3,014
|
|
|
|
3,352
|
|
|
|
4,934
|
|
|
|
9,373
|
|
|
|
10,876
|
|
|
|
11,474
|
|
|
|
10
|
|
|
|
274
|
|
|
|
186
|
|
|
Current liabilities
|
|
|
2,246
|
|
|
|
712
|
|
|
|
829
|
|
|
|
5,407
|
|
|
|
6,950
|
|
|
|
4,634
|
|
|
|
4,805
|
|
|
|
10,620
|
|
|
|
5,555
|
|
|
Total Liabilities
|
|
|
12,005
|
|
|
|
11,199
|
|
|
|
16,446
|
|
|
|
40,721
|
|
|
|
42,916
|
|
|
|
39,364
|
|
|
|
10,353
|
|
|
|
16,491
|
|
|
|
11,322
|
|
|
Revenue from sales
|
|
|
7,130
|
|
|
|
9,222
|
|
|
|
9,355
|
|
|
|
22,731
|
|
|
|
39,502
|
|
|
|
38,728
|
|
|
|
1,840
|
|
|
|
3,644
|
|
|
|
4,117
|
|
|
Net income
|
|
|
1,755
|
|
|
|
2,759
|
|
|
|
2,647
|
|
|
|
7,720
|
|
|
|
14,269
|
|
|
|
14,381
|
|
|
|
399
|
|
|
|
343
|
|
|
|
600
|
|
|
Other comprehensive income
|
|
|
(1,682
|
)
|
|
|
(5,431
|
)
|
|
|
(697
|
)
|
|
|
—
|
|
|
|
—
|
|
|
|
—
|
|
|
|
—
|
|
|
|
—
|
|
|
|
—
|
|
|
% owned
|
|
|
18.90%
|
|
|
|
18.24%
|
|
|
|
16.96%
|
|
|
|
|
|
|
|
|
|
|
|
|
|
|
|
30.32%
|
|
|
|
30.32%
|
|
|
|
30.32%
|
|
|
Revaluation identifiable assets on equity afiliates
|
|
|
1,580
|
|
|
|
1,944
|
|
|
|
3,545
|
|
|
|
—
|
|
|
|
—
|
|
|
|
—
|
|
|
|
—
|
|
|
|
—
|
|
|
|
—
|
|
|
Equity value
|
|
|
2,855
|
|
|
|
3,245
|
|
|
|
5,357
|
|
|
|
4,183
|
|
|
|
4,130
|
|
|
|
3,625
|
|
|
|
1,679
|
|
|
|
1,697
|
|
|
|
1,692
|
|
|
Equity share in profit/(loss)
|
|
|
229
|
|
|
|
193
|
|
|
|
221
|
|
|
|
978
|
|
|
|
2,125
|
|
|
|
2,027
|
|
|
|
121
|
|
|
|
104
|
|
|
|
182
|
|
|
Equity other comprehensive income
|
|
|
(135
|
)
|
|
|
(1,844
|
)
|
|
|
(621
|
)
|
|
|
156
|
|
|
|
200
|
|
|
|
(21
|
)
|
|
|
—
|
|
|
|
—
|
|
|
|
—
|
|
|
Dividends paid to the Group
|
|
|
102
|
|
|
|
126
|
|
|
|
102
|
|
|
|
1,072
|
|
|
|
1,687
|
|
|
|
1,579
|
|
|
|
139
|
|
|
|
99
|
|
|
|
182
|
|
|
(a)
|
Information includes estimates at the date of TOTAL’s financial statements.
|
Novatek, listed in Moscow and London, is the 2nd largest producer of natural gas in Russia. The Group share of Novatek’s market value amounted to $
4,577 million as at December 31, 2015. Novatek is consolidated by the equity method. TOTAL considers, in fact, that it exercises significant influence particularly via its representation on the board of directors of Novatek and its
interest in the major project of Yamal LNG.
The Group is not aware of significant restrictions limiting the ability of OAO Novatek to transfer funds to
its shareholder, be it under the form of dividends, repayment of advances or loans made.
The Group’s interests in associates operating liquefaction
plants are combined. The amounts include investments in: Nigeria LNG (15.00%), Angola LNG (13.60%), Yemen LNG (39.62%), Qatargas (10.00%), Qatar Liquefied Gas Company Limited II – Train B (16.70%), Oman LNG (5.54%), Brass LNG (20.48%) and
Abu Dhabi Gas Lc (5.00%).
PetroCedeño produces and upgrades extra-heavy crude oil in Venezuela.
|
|
|
|
|
F-34
|
|
TOTAL S.A. Form 20-F 2015
|
Note 12 – Notes to the Consolidated Financial Statements
Refining & Chemicals
|
|
|
|
|
|
|
|
|
|
|
|
|
|
|
|
|
|
|
|
|
|
|
|
|
|
|
|
|
Saudi Aramco Total
Refining & Petrochemicals
|
|
|
Qatar
|
|
|
(M$)
|
|
2015
|
|
|
2014
|
|
|
2013
|
|
|
2015
|
|
|
2014
|
|
|
2013
|
|
|
Non current assets
|
|
|
12,536
|
|
|
|
12,654
|
|
|
|
12,356
|
|
|
|
2,530
|
|
|
|
3,020
|
|
|
|
2,867
|
|
|
Current assets
|
|
|
960
|
|
|
|
1,250
|
|
|
|
1,331
|
|
|
|
968
|
|
|
|
1,385
|
|
|
|
1,277
|
|
|
Total Assets
|
|
|
13,496
|
|
|
|
13,904
|
|
|
|
13,687
|
|
|
|
3,498
|
|
|
|
4,405
|
|
|
|
4,144
|
|
|
Shareholder’s equity
|
|
|
2,011
|
|
|
|
1,672
|
|
|
|
1,485
|
|
|
|
2,803
|
|
|
|
2,930
|
|
|
|
2,629
|
|
|
Non current liabilities
|
|
|
9,873
|
|
|
|
9,584
|
|
|
|
10,441
|
|
|
|
356
|
|
|
|
409
|
|
|
|
481
|
|
|
Current liabilities
|
|
|
1,612
|
|
|
|
2,648
|
|
|
|
1,761
|
|
|
|
339
|
|
|
|
1,066
|
|
|
|
1,034
|
|
|
Total Liabilities
|
|
|
13,496
|
|
|
|
13,904
|
|
|
|
13,687
|
|
|
|
3,498
|
|
|
|
4,405
|
|
|
|
4,144
|
|
|
Revenue from sales
|
|
|
8,032
|
|
|
|
7,061
|
|
|
|
—
|
|
|
|
1,823
|
|
|
|
1,817
|
|
|
|
2,161
|
|
|
Net income
|
|
|
339
|
|
|
|
(113
|
)
|
|
|
(89
|
)
|
|
|
631
|
|
|
|
875
|
|
|
|
1,009
|
|
|
Other comprehensive income
|
|
|
—
|
|
|
|
—
|
|
|
|
—
|
|
|
|
2
|
|
|
|
—
|
|
|
|
—
|
|
|
% owned
|
|
|
37.50%
|
|
|
|
37.50%
|
|
|
|
37.50%
|
|
|
|
|
|
|
|
|
|
|
|
|
|
|
Revaluation identifiable assets on equity affiliates
|
|
|
—
|
|
|
|
—
|
|
|
|
—
|
|
|
|
—
|
|
|
|
—
|
|
|
|
—
|
|
|
Equity value
|
|
|
754
|
|
|
|
627
|
|
|
|
557
|
|
|
|
818
|
|
|
|
850
|
|
|
|
798
|
|
|
Equity share in profit/(loss)
|
|
|
127
|
|
|
|
(42
|
)
|
|
|
(33
|
)
|
|
|
208
|
|
|
|
312
|
|
|
|
346
|
|
|
Equity other comprehensive income
|
|
|
77
|
|
|
|
89
|
|
|
|
(35
|
)
|
|
|
28
|
|
|
|
25
|
|
|
|
(8
|
)
|
|
Dividends paid to the Group
|
|
|
—
|
|
|
|
—
|
|
|
|
—
|
|
|
|
248
|
|
|
|
261
|
|
|
|
224
|
|
Saudi Aramco Total Refining & Petrochemicals is an entity including a refinery in Jubail, Saudi Arabia, with a capacity of
400,000 barrels/day with integrated petrochemical units which commenced production in June 2014.
The Group’s interests in associates of the
Refining & Chemicals segment, operating steam crackers and polyethylene lines in Qatar have been combined: Qatar Petrochemical Company Ltd. (20.00%) and Qatofin (49.09%).
The information (100% gross) relating to significant joint ventures is as follows:
|
|
|
|
|
|
|
|
|
|
|
|
|
|
|
|
|
|
|
|
|
|
|
|
|
|
|
|
|
Liquefaction
entities
(Upstream)
|
|
|
Hanwha
Total
Petrochemicals
(Refining & Chemicals)
|
|
|
(M$)
|
|
2015
|
|
|
2014
|
|
|
2013
|
|
|
2015
|
|
|
2014
|
|
|
2013
|
|
|
Non current assets
|
|
|
35,341
|
|
|
|
23,326
|
|
|
|
12,569
|
|
|
|
3,543
|
|
|
|
3,754
|
|
|
|
3,785
|
|
|
Current assets excluding cash and cash equivalents
|
|
|
455
|
|
|
|
731
|
|
|
|
52
|
|
|
|
1,501
|
|
|
|
1,972
|
|
|
|
1,335
|
|
|
Cash and cash equivalents
|
|
|
501
|
|
|
|
516
|
|
|
|
359
|
|
|
|
240
|
|
|
|
149
|
|
|
|
157
|
|
|
Total Assets
|
|
|
36,297
|
|
|
|
24,573
|
|
|
|
12,980
|
|
|
|
5,284
|
|
|
|
5,875
|
|
|
|
5,277
|
|
|
Shareholder’s equity
|
|
|
1,840
|
|
|
|
1,198
|
|
|
|
862
|
|
|
|
2,609
|
|
|
|
2,323
|
|
|
|
2,336
|
|
|
Other non current liabilities
|
|
|
349
|
|
|
|
225
|
|
|
|
7
|
|
|
|
107
|
|
|
|
126
|
|
|
|
83
|
|
|
Non current financial debts
|
|
|
32,996
|
|
|
|
21,596
|
|
|
|
10,696
|
|
|
|
1,388
|
|
|
|
1,793
|
|
|
|
1,382
|
|
|
Other current liabilities
|
|
|
1,112
|
|
|
|
1,269
|
|
|
|
1,415
|
|
|
|
713
|
|
|
|
705
|
|
|
|
706
|
|
|
Current financial debts
|
|
|
—
|
|
|
|
285
|
|
|
|
—
|
|
|
|
467
|
|
|
|
928
|
|
|
|
770
|
|
|
Total Liabilities
|
|
|
36,297
|
|
|
|
24,573
|
|
|
|
12,980
|
|
|
|
5,284
|
|
|
|
5,875
|
|
|
|
5,277
|
|
|
Revenue from sales
|
|
|
32
|
|
|
|
5
|
|
|
|
7
|
|
|
|
7,307
|
|
|
|
8,366
|
|
|
|
7,188
|
|
|
Depreciation and amortization
|
|
|
(14
|
)
|
|
|
(5
|
)
|
|
|
—
|
|
|
|
(247
|
)
|
|
|
(223
|
)
|
|
|
(199
|
)
|
|
Interest income
|
|
|
10
|
|
|
|
2
|
|
|
|
—
|
|
|
|
—
|
|
|
|
1
|
|
|
|
—
|
|
|
Interest expense
|
|
|
(10
|
)
|
|
|
(1
|
)
|
|
|
—
|
|
|
|
(64
|
)
|
|
|
(45
|
)
|
|
|
(21
|
)
|
|
Income taxes
|
|
|
(81
|
)
|
|
|
50
|
|
|
|
—
|
|
|
|
(192
|
)
|
|
|
(114
|
)
|
|
|
(98
|
)
|
|
Net income
|
|
|
279
|
|
|
|
36
|
|
|
|
(93
|
)
|
|
|
514
|
|
|
|
79
|
|
|
|
377
|
|
|
Other comprehensive income
|
|
|
61
|
|
|
|
—
|
|
|
|
(295
|
)
|
|
|
(186
|
)
|
|
|
(94
|
)
|
|
|
47
|
|
|
% owned
|
|
|
|
|
|
|
|
|
|
|
|
|
|
|
50.00%
|
|
|
|
50.00%
|
|
|
|
50.00%
|
|
|
Revaluation identifiable assets on equity affiliates
|
|
|
965
|
|
|
|
874
|
|
|
|
978
|
|
|
|
—
|
|
|
|
—
|
|
|
|
—
|
|
|
Equity value
|
|
|
1,355
|
|
|
|
1,130
|
|
|
|
1,164
|
|
|
|
1,305
|
|
|
|
1,161
|
|
|
|
1,169
|
|
|
Equity share in profit/(loss)
|
|
|
55
|
|
|
|
10
|
|
|
|
(21
|
)
|
|
|
257
|
|
|
|
40
|
|
|
|
189
|
|
|
Equity other comprehensive income
|
|
|
18
|
|
|
|
(26
|
)
|
|
|
(137
|
)
|
|
|
(75
|
)
|
|
|
(24
|
)
|
|
|
14
|
|
|
Dividends paid to the Group
|
|
|
—
|
|
|
|
—
|
|
|
|
—
|
|
|
|
20
|
|
|
|
—
|
|
|
|
45
|
|
The Group’s interests in joint ventures operating liquefaction plants have been combined. The amounts include investments in
Yamal LNG in Russia (20.02% direct holding) and Ichthys LNG in Australia (30.00%).
Hanwha Total Petrochemicals is a South Korean company that operates a petrochemical complex in Daesan, South Korea
(condensate separator, steam cracker, styrene, paraxylene, polyolefins).
Off balance sheet commitments relating to joint ventures are disclosed in Note 23 of the Consolidated Financial
Statements.
|
|
|
|
|
2015 Form 20-F TOTAL S.A.
|
|
F-35
|
Notes to the Consolidated Financial Statements – Note 13
In Group share, the main aggregated financial items in equity consolidated affiliates
which have not been presented individually are as follows:
|
|
|
|
|
|
|
|
|
|
|
|
|
|
|
|
|
|
|
|
|
|
|
|
|
|
|
|
|
2015
|
|
|
2014
|
|
|
2013
|
|
|
As of December 31,
(M$)
|
|
Associates
|
|
|
Joint
ventures
|
|
|
Associates
|
|
|
Joint
ventures
|
|
|
Associates
|
|
|
Joint
ventures
|
|
|
Non Current assets
|
|
|
3,491
|
|
|
|
2,005
|
|
|
|
3,502
|
|
|
|
1,456
|
|
|
|
4,018
|
|
|
|
1,460
|
|
|
Current assets
|
|
|
1,440
|
|
|
|
860
|
|
|
|
1,478
|
|
|
|
1,283
|
|
|
|
1,498
|
|
|
|
1,521
|
|
|
Total Assets
|
|
|
4,931
|
|
|
|
2,865
|
|
|
|
4,980
|
|
|
|
2,739
|
|
|
|
5,516
|
|
|
|
2,981
|
|
|
Shareholder’s equity
|
|
|
966
|
|
|
|
1,091
|
|
|
|
1,083
|
|
|
|
725
|
|
|
|
1,688
|
|
|
|
813
|
|
|
Non current liabilities
|
|
|
2,612
|
|
|
|
951
|
|
|
|
2,348
|
|
|
|
877
|
|
|
|
2,227
|
|
|
|
1,050
|
|
|
Current liabilities
|
|
|
1,353
|
|
|
|
823
|
|
|
|
1,549
|
|
|
|
1,137
|
|
|
|
1,601
|
|
|
|
1,118
|
|
|
Total Liabilities
|
|
|
4,931
|
|
|
|
2,865
|
|
|
|
4,980
|
|
|
|
2,739
|
|
|
|
5,516
|
|
|
|
2,981
|
|
|
|
|
|
|
|
|
|
|
|
|
|
|
|
|
|
|
|
|
|
|
|
|
|
|
|
|
|
|
2015
|
|
|
2014
|
|
|
2013
|
|
|
For the year ended December 31,
(M$)
|
|
Associates
|
|
|
Joint
ventures
|
|
|
Associates
|
|
|
Joint
ventures
|
|
|
Associates
|
|
|
Joint
ventures
|
|
|
Revenues from sales
|
|
|
2,661
|
|
|
|
3,362
|
|
|
|
4,124
|
|
|
|
4,473
|
|
|
|
3,910
|
|
|
|
5,512
|
|
|
Net income
|
|
|
341
|
|
|
|
45
|
|
|
|
95
|
|
|
|
(175
|
)
|
|
|
495
|
|
|
|
9
|
|
|
Share of other comprehensive income items
|
|
|
13
|
|
|
|
38
|
|
|
|
(2
|
)
|
|
|
44
|
|
|
|
16
|
|
|
|
(13
|
)
|
|
Equity value
|
|
|
966
|
|
|
|
1,091
|
|
|
|
1,083
|
|
|
|
725
|
|
|
|
1,688
|
|
|
|
813
|
|
|
Dividends paid to the Group
|
|
|
442
|
|
|
|
22
|
|
|
|
470
|
|
|
|
43
|
|
|
|
446
|
|
|
|
48
|
|
13)
Other investments
The investments detailed below are classified as “Financial assets available for sale” (see Note 1 paragraph M(ii) to the Consolidated Financial
Statements).
|
|
|
|
|
|
|
|
|
|
|
|
|
|
|
As of December 31,
2015
(M$)
|
|
Carrying
amount
|
|
|
Unrealized
gain
(loss)
|
|
|
Balance
sheet
value
|
|
|
Areva
(a)
|
|
|
22
|
|
|
|
—
|
|
|
|
22
|
|
|
Other publicly traded equity securities
|
|
|
9
|
|
|
|
28
|
|
|
|
37
|
|
|
Total publicly traded equity
securities
(b)
|
|
|
31
|
|
|
|
28
|
|
|
|
59
|
|
|
BBPP
|
|
|
62
|
|
|
|
—
|
|
|
|
62
|
|
|
BTC Limited
|
|
|
121
|
|
|
|
—
|
|
|
|
121
|
|
|
DUNKERQUE LNG SAS
|
|
|
116
|
|
|
|
—
|
|
|
|
116
|
|
|
Other equity securities
|
|
|
883
|
|
|
|
—
|
|
|
|
883
|
|
|
Total other equity securities
(b)
|
|
|
1,182
|
|
|
|
—
|
|
|
|
1,182
|
|
|
Other investments
|
|
|
1,213
|
|
|
|
28
|
|
|
|
1,241
|
|
|
|
|
|
|
|
|
|
|
|
|
|
|
|
|
As of December 31,
2014
(M$)
|
|
Carrying
amount
|
|
|
Unrealized
gain
(loss)
|
|
|
Balance
sheet
value
|
|
|
Areva
(a)
|
|
|
44
|
|
|
|
(4
|
)
|
|
|
40
|
|
|
Other publicly traded equity securities
|
|
|
21
|
|
|
|
23
|
|
|
|
44
|
|
|
Total publicly traded equity
securities
(b)
|
|
|
65
|
|
|
|
19
|
|
|
|
84
|
|
|
BBPP
|
|
|
62
|
|
|
|
—
|
|
|
|
62
|
|
|
BTC Limited
|
|
|
132
|
|
|
|
—
|
|
|
|
132
|
|
|
DUNKERQUE LNG SAS
|
|
|
100
|
|
|
|
—
|
|
|
|
100
|
|
|
Other equity securities
|
|
|
1,021
|
|
|
|
—
|
|
|
|
1,021
|
|
|
Total other equity securities
(b)
|
|
|
1,315
|
|
|
|
—
|
|
|
|
1,315
|
|
|
Other investments
|
|
|
1,380
|
|
|
|
19
|
|
|
|
1,399
|
|
|
|
|
|
|
F-36
|
|
TOTAL S.A. Form 20-F 2015
|
Notes 14 to 15 – Notes to the Consolidated Financial Statements
|
|
|
|
|
|
|
|
|
|
|
|
|
|
|
As of
December 31,
(M$)
|
|
Carrying
amount
|
|
|
Unrealized
gain
(loss)
|
|
|
Balance
sheet
value
|
|
|
Areva
(a)
|
|
|
51
|
|
|
|
44
|
|
|
|
95
|
|
|
Olympia Energy Fund — energy investment fund
|
|
|
50
|
|
|
|
(10
|
)
|
|
|
40
|
|
|
Other publicly traded equity securities
|
|
|
10
|
|
|
|
15
|
|
|
|
25
|
|
|
Total publicly traded equity
securities
(b)
|
|
|
111
|
|
|
|
49
|
|
|
|
160
|
|
|
BBPP
|
|
|
80
|
|
|
|
—
|
|
|
|
80
|
|
|
BTC Limited
|
|
|
144
|
|
|
|
—
|
|
|
|
144
|
|
|
DUNKERQUE LNG SAS
|
|
|
58
|
|
|
|
—
|
|
|
|
58
|
|
|
Other equity securities
|
|
|
1,224
|
|
|
|
—
|
|
|
|
1,224
|
|
|
Total other equity securities
(b)
|
|
|
1,506
|
|
|
|
—
|
|
|
|
1,506
|
|
|
Other investments
|
|
|
1,617
|
|
|
|
49
|
|
|
|
1,666
|
|
|
(a)
|
Unrealized gain based on the investment certificate.
|
|
(b)
|
Including cumulative impairments of $949 million in 2015, $856 million in 2014 and $995 million in 2013.
|
14)
Other non-current assets
|
|
|
|
|
|
|
|
|
|
|
|
|
|
|
As of December 31, 2015
(M$)
|
|
Gross value
|
|
|
Valuation
allowance
|
|
|
Net value
|
|
|
Loans and advances
(a)
|
|
|
3,687
|
|
|
|
(280
|
)
|
|
|
3,407
|
|
|
Other
|
|
|
948
|
|
|
|
—
|
|
|
|
948
|
|
|
Total
|
|
|
4,635
|
|
|
|
(280
|
)
|
|
|
4,355
|
|
|
|
|
|
|
|
|
|
|
|
|
|
|
|
|
As of December 31, 2014
(M$)
|
|
Gross value
|
|
|
Valuation
allowance
|
|
|
Net value
|
|
|
Loans and advances
(a)
|
|
|
3,998
|
|
|
|
(672
|
)
|
|
|
3,326
|
|
|
Other
|
|
|
866
|
|
|
|
—
|
|
|
|
866
|
|
|
Total
|
|
|
4,864
|
|
|
|
(672
|
)
|
|
|
4,192
|
|
|
|
|
|
|
|
|
|
|
|
|
|
|
|
|
As of December 31, 2013
(M$)
|
|
Gross value
|
|
|
Valuation
allowance
|
|
|
Net value
|
|
|
Loans and advances
(a)
|
|
|
4,073
|
|
|
|
(498
|
)
|
|
|
3,575
|
|
|
Other
|
|
|
831
|
|
|
|
—
|
|
|
|
831
|
|
|
Total
|
|
|
4,904
|
|
|
|
(498
|
)
|
|
|
4,406
|
|
|
(a)
|
Excluding loans to equity affiliates.
|
Changes in the valuation allowance on loans and advances are detailed as follows:
|
|
|
|
|
|
|
|
|
|
|
|
|
|
|
|
|
|
|
|
|
|
|
For the year ended December 31,
(M$)
|
|
Valuation
allowance as of
January 1,
|
|
|
Increases
|
|
|
Decreases
|
|
|
Currency
translation
adjustment and
other variations
|
|
|
Valuation
allowance as of
December 31,
|
|
|
2015
|
|
|
(672
|
)
|
|
|
(62
|
)
|
|
|
393
|
|
|
|
61
|
|
|
|
(280
|
)
|
|
2014
|
|
|
(498
|
)
|
|
|
(63
|
)
|
|
|
102
|
|
|
|
(213
|
)
|
|
|
(672
|
)
|
|
2013
|
|
|
(509
|
)
|
|
|
(21
|
)
|
|
|
9
|
|
|
|
23
|
|
|
|
(498
|
)
|
15)
Inventories
|
|
|
|
|
|
|
|
|
|
|
|
|
|
|
As of December 31, 2015
(M$)
|
|
Gross value
|
|
|
Valuation
allowance
|
|
|
Net value
|
|
|
Crude oil and natural gas
|
|
|
1,788
|
|
|
|
(59
|
)
|
|
|
1,729
|
|
|
Refined products
|
|
|
4,177
|
|
|
|
(130
|
)
|
|
|
4,047
|
|
|
Chemicals products
|
|
|
989
|
|
|
|
(72
|
)
|
|
|
917
|
|
|
Trading inventories
|
|
|
3,168
|
|
|
|
—
|
|
|
|
3,168
|
|
|
Other inventories
|
|
|
4,062
|
|
|
|
(807
|
)
|
|
|
3,255
|
|
|
Total
|
|
|
14,184
|
|
|
|
(1,068
|
)
|
|
|
13,116
|
|
|
|
|
|
|
|
|
|
|
|
|
|
|
|
|
As of December 31, 2014
(M$)
|
|
Gross value
|
|
|
Valuation
allowance
|
|
|
Net value
|
|
|
Crude oil and natural gas
|
|
|
2,697
|
|
|
|
(188
|
)
|
|
|
2,509
|
|
|
Refined products
|
|
|
5,922
|
|
|
|
(422
|
)
|
|
|
5,500
|
|
|
Chemicals products
|
|
|
1,119
|
|
|
|
(85
|
)
|
|
|
1,034
|
|
|
Trading inventories
|
|
|
2,950
|
|
|
|
—
|
|
|
|
2,950
|
|
|
Other inventories
|
|
|
3,903
|
|
|
|
(700
|
)
|
|
|
3,203
|
|
|
Total
|
|
|
16,591
|
|
|
|
(1,395
|
)
|
|
|
15,196
|
|
|
|
|
|
|
2015 Form 20-F TOTAL S.A.
|
|
F-37
|
Notes to the Consolidated Financial Statements – Note 16
|
|
|
|
|
|
|
|
|
|
|
|
|
|
|
As of December 31, 2013
(M$)
|
|
Gross value
|
|
|
Valuation
allowance
|
|
|
Net value
|
|
|
Crude oil and natural gas
|
|
|
4,515
|
|
|
|
(25
|
)
|
|
|
4,490
|
|
|
Refined products
|
|
|
8,868
|
|
|
|
(153
|
)
|
|
|
8,715
|
|
|
Chemicals products
|
|
|
1,616
|
|
|
|
(108
|
)
|
|
|
1,508
|
|
|
Trading inventories
|
|
|
4,401
|
|
|
|
—
|
|
|
|
4,401
|
|
|
Other inventories
|
|
|
3,719
|
|
|
|
(736
|
)
|
|
|
2,983
|
|
|
Total
|
|
|
23,119
|
|
|
|
(1,022
|
)
|
|
|
22,097
|
|
Changes in the valuation allowance on inventories are as follows:
|
|
|
|
|
|
|
|
|
|
|
|
|
|
|
|
|
|
|
For the year ended December 31,
(M$)
|
|
Valuation
allowance as of
January 1,
|
|
|
Increase (net)
|
|
|
Currency
translation
adjustment and
other variations
|
|
|
Valuation
allowance as of
December 31,
|
|
|
2015
|
|
|
(1,395
|
)
|
|
|
256
|
|
|
|
71
|
|
|
|
(1,068
|
)
|
|
2014
|
|
|
(1,022
|
)
|
|
|
(495
|
)
|
|
|
122
|
|
|
|
(1,395
|
)
|
|
2013
|
|
|
(868
|
)
|
|
|
(158
|
)
|
|
|
4
|
|
|
|
(1,022
|
)
|
16)
Accounts receivable and other current assets
|
|
|
|
|
|
|
|
|
|
|
|
|
|
|
As of December 31,
2015
(M$)
|
|
Gross value
|
|
|
Valuation
allowance
|
|
|
Net value
|
|
|
Accounts receivable
|
|
|
11,173
|
|
|
|
(544
|
)
|
|
|
10,629
|
|
|
Recoverable taxes
|
|
|
3,328
|
|
|
|
—
|
|
|
|
3,328
|
|
|
Other operating receivables
|
|
|
11,335
|
|
|
|
(426
|
)
|
|
|
10,909
|
|
|
Prepaid expenses
|
|
|
1,554
|
|
|
|
—
|
|
|
|
1,554
|
|
|
Other current assets
|
|
|
52
|
|
|
|
—
|
|
|
|
52
|
|
|
Other current assets
|
|
|
16,269
|
|
|
|
(426
|
)
|
|
|
15,843
|
|
|
|
|
|
|
|
|
|
|
|
|
|
|
|
|
As of December 31,
2014
(M$)
|
|
Gross value
|
|
|
Valuation
allowance
|
|
|
Net value
|
|
|
Accounts receivable
|
|
|
16,306
|
|
|
|
(602
|
)
|
|
|
15,704
|
|
|
Recoverable taxes
|
|
|
3,242
|
|
|
|
—
|
|
|
|
3,242
|
|
|
Other operating receivables
|
|
|
11,159
|
|
|
|
(367
|
)
|
|
|
10,792
|
|
|
Prepaid expenses
|
|
|
1,609
|
|
|
|
—
|
|
|
|
1,609
|
|
|
Other current assets
|
|
|
59
|
|
|
|
—
|
|
|
|
59
|
|
|
Other current assets
|
|
|
16,069
|
|
|
|
(367
|
)
|
|
|
15,702
|
|
|
|
|
|
|
|
|
|
|
|
|
|
|
|
|
As of December 31,
2013
(M$)
|
|
Gross value
|
|
|
Valuation
allowance
|
|
|
Net value
|
|
|
Accounts receivable
|
|
|
24,165
|
|
|
|
(743
|
)
|
|
|
23,422
|
|
|
Recoverable taxes
|
|
|
3,423
|
|
|
|
—
|
|
|
|
3,423
|
|
|
Other operating receivables
|
|
|
10,071
|
|
|
|
(154
|
)
|
|
|
9,917
|
|
|
Prepaid expenses
|
|
|
1,482
|
|
|
|
—
|
|
|
|
1,482
|
|
|
Other current assets
|
|
|
70
|
|
|
|
—
|
|
|
|
70
|
|
|
Other current assets
|
|
|
15,046
|
|
|
|
(154
|
)
|
|
|
14,892
|
|
Changes in the valuation allowance on “Accounts receivable” and “Other current assets” are as follows:
|
|
|
|
|
|
|
|
|
|
|
|
|
|
|
|
|
|
|
For the year ended December
31,
(M$)
|
|
Valuation
allowance as
of
January 1,
|
|
|
Increase (net)
|
|
|
Currency
translation
adjustments
and
other variations
|
|
|
Valuation
allowance as
of
December 31,
|
|
|
Accounts receivable
|
|
|
|
|
|
|
|
|
|
|
|
|
|
|
|
|
|
2015
|
|
|
(602
|
)
|
|
|
5
|
|
|
|
53
|
|
|
|
(544
|
)
|
|
2014
|
|
|
(743
|
)
|
|
|
46
|
|
|
|
95
|
|
|
|
(602
|
)
|
|
2013
|
|
|
(623
|
)
|
|
|
(117
|
)
|
|
|
(3
|
)
|
|
|
(743
|
)
|
|
Other current assets
|
|
|
|
|
|
|
|
|
|
|
|
|
|
|
|
|
|
2015
|
|
|
(367
|
)
|
|
|
(79
|
)
|
|
|
20
|
|
|
|
(426
|
)
|
|
2014
|
|
|
(154
|
)
|
|
|
(221
|
)
|
|
|
8
|
|
|
|
(367
|
)
|
|
2013
|
|
|
(340
|
)
|
|
|
163
|
|
|
|
23
|
|
|
|
(154
|
)
|
As of December 31, 2015, the net portion of the overdue receivables included in “Accounts receivable”
and “Other current assets” was $3,159 million, of which $1,313 million was due in less than 90 days, $460 million was due between 90 days and 6
months, $570 million was due between 6 and 12 months and $816 million was due after 12 months.
As
of December 31, 2014, the net portion of the overdue receivables included in “Accounts receivable” and “Other current
|
|
|
|
|
F-38
|
|
TOTAL S.A. Form 20-F 2015
|
Note 17 – Notes to the Consolidated Financial Statements
assets” was $3,049 million, of which $1,382 million was due in less than 90 days, $593 million was due between
90 days and 6 months, $226 million was due between 6 and 12 months and $848 million was due after 12 months.
As of December 31, 2013, the net
portion of the overdue receivables included in “Accounts receivable” and “Other current
assets” was $3,812 million, of which $1,565 million was due in less than 90 days, $599 million was due between 90 days and 6 months, $754 million was due between 6 and 12 months and $894
million was due after 12 months.
17)
Shareholders’ equity
Number of TOTAL shares
The Company’s common shares, par value
€
2.50, as of December 31, 2015 are the only category
of shares. Shares may be held in either bearer or registered form.
Double voting rights are granted to holders of shares that are fully-paid and held in
the name of the same shareholder for at least two years, with due consideration for the total portion of the share capital represented. Double voting rights are also assigned to restricted shares in the event of an increase in share capital by
incorporation of reserves, profits or premiums based on shares already held that are entitled to double voting rights.
Pursuant to the Company’s
bylaws (Statutes), no shareholder may cast a vote at a shareholders’ meeting, either by himself or through
an agent, representing more than 10% of the total voting rights for the Company’s shares. This limit applies to the aggregated amount of voting rights held directly, indirectly or through
voting proxies. However, in the case of double voting rights, this limit may be extended to 20%.
These restrictions no longer apply if any individual or
entity, acting alone or in concert, acquires at least two-thirds of the total share capital of the Company, directly or indirectly, following a public tender offer for all of the Company’s shares.
The authorized share capital amounts to 3,467,448,093 shares as of December 31, 2015 compared to 3,416,388,282 shares as of December 31, 2014 and
3,417,495,344 as of December 31, 2013. As of December 31, 2015 the share capital of TOTAL S.A. amounted to
€
6,100,144,708.
Variation of the share capital
|
|
|
|
|
|
|
|
|
As of December 31, 2012
|
|
|
|
2,365,933,146
|
|
|
Shares issued in connection with:
|
|
Capital increase reserved for employees
|
|
|
10,802,215
|
|
|
|
|
Exercise of TOTAL share subscription options
|
|
|
942,799
|
|
|
As of December 31, 2013
|
|
|
|
2,377,678,160
|
|
|
Shares issued in connection with:
|
|
Capital increase as part of the global free share plan intended for the Group employees
|
|
|
666,575
|
|
|
|
|
Exercise of TOTAL share subscription options
|
|
|
6,922,790
|
|
|
As of December 31, 2014
|
|
|
|
2,385,267,525
|
|
|
Shares issued in connection with:
|
|
Capital increase reserved for employees
|
|
|
10,479,410
|
|
|
|
|
Capital increase within stock dividend (2014 remainder and first interim dividend for 2015)
|
|
|
42,841,342
|
|
|
|
|
Exercise of TOTAL share subscription options
|
|
|
1,469,606
|
|
|
As of December 31, 2015
(a)
|
|
|
|
2,440,057,883
|
|
|
(a)
|
Including 113,967,758 treasury shares deducted from consolidated shareholders’ equity.
|
|
|
|
|
|
2015 Form 20-F TOTAL S.A.
|
|
F-39
|
Notes to the Consolidated Financial Statements – Note 17
The variation of both weighted-average number of shares and weighted-average number of
diluted shares respectively used in the calculation of earnings per share and fully-diluted earnings per share is detailed as follows:
|
|
|
|
|
|
|
|
|
|
|
|
|
|
|
|
|
2015
|
|
|
2014
|
|
|
2013
|
|
|
Number of shares as of January 1,
|
|
|
2,385,267,525
|
|
|
|
2,377,678,160
|
|
|
|
2,365,933,146
|
|
|
Number of shares issued during the year (pro rated)
|
|
|
|
|
|
|
|
|
|
|
|
|
|
Exercise of TOTAL share subscription options
|
|
|
662,351
|
|
|
|
3,768,183
|
|
|
|
248,606
|
|
|
Exercise of TOTAL share purchase options
|
|
|
|
|
|
|
—
|
|
|
|
—
|
|
|
TOTAL performance shares
|
|
|
103,131
|
|
|
|
2,121,605
|
|
|
|
1,197,228
|
|
|
Global free TOTAL share plan
(a)
|
|
|
|
|
|
|
333,637
|
|
|
|
227
|
|
|
Capital increase reserved for employees
|
|
|
6,986,273
|
|
|
|
—
|
|
|
|
7,201,477
|
|
|
Capital increase within stock dividend (2014 remainder and first interim dividend for 2015)
|
|
|
13,343,379
|
|
|
|
|
|
|
|
|
|
|
TOTAL shares held by TOTAL S.A. or by its subsidiaries and deducted from shareholders’
equity
|
|
|
(111,324,719
|
)
|
|
|
(111,042,073
|
)
|
|
|
(110,230,889
|
)
|
|
Weighted-average number of shares
|
|
|
2,295,037,940
|
|
|
|
2,272,859,512
|
|
|
|
2,264,349,795
|
|
|
Dilutive effect
|
|
|
|
|
|
|
|
|
|
|
|
|
|
TOTAL share subscription and purchase options
|
|
|
1,168,644
|
|
|
|
2,119,759
|
|
|
|
554,224
|
|
|
TOTAL performance shares
|
|
|
7,647,690
|
|
|
|
3,578,225
|
|
|
|
4,924,693
|
|
|
Global free TOTAL share plan
(a)
|
|
|
|
|
|
|
353,054
|
|
|
|
852,057
|
|
|
Capital increase reserved for employees
|
|
|
581,268
|
|
|
|
2,093,601
|
|
|
|
862,889
|
|
|
Weighted-average number of diluted shares
|
|
|
2,304,435,542
|
|
|
|
2,281,004,151
|
|
|
|
2,271,543,658
|
|
|
(a)
|
The Board of Directors approved on May 21, 2010 the implementation and conditions of a global free share plan intended for the Group employees.
|
The earnings per share in euro, obtained from the earnings per share in dollars, converted by using the average
exchange rate euro/dollar, is 1.96 euro per share for 2015 closing (1.41 euro for 2014 closing). The fully-diluted earnings per share calculated by using the same method is 1.95 per share for 2015 closing (1.40 euro for 2014 closing).
Capital increase reserved for Group employees
The Combined General Meeting of May 16, 2014, delegated to the Board of Directors in its fourteenth resolution, the authority to carry out, a capital increase, in one or more occasions within a maximum period
of twenty-six months, reserved for employees belonging to an employee savings plan.
This capital increase resulted in the subscription of 10,108,918
shares with a par value of
€
2.50 at a unit price of
€
37.50 and of the issuance of 370,492 shares with a par value of
€
2.50 granted as free shares.
The issuance of the shares was acknowledged on April 27, 2015. Moreover, the Board of Directors, during its April 27, 2015 meeting, based on the sixteenth resolution of the Combined General Meeting of May 16, 2014, in its sixteenth
resolution, decided to grant 20,882 free shares to 2,100 beneficiaries subject to a continued employment condition during the 5-year acquisition period that will end at April 27, 2020, as a deferred contribution.
The prior capital increase reserved for employees of the Group was decided by the Board of Directors on September 18, 2012, under the terms of the
authorization of the Combined General Meeting of May 11, 2012, and resulted in the subscription of 10,802,215 shares with a par value of
€
2.50 at a unit price of
€
30.70. The issuance of the shares was acknowledged on April 25, 2013.
Capital increase as part of a global free share plan intended for Group employees
The Combined General
Meeting of May 16, 2008, delegated to the Board of Directors in its seventeenth resolution, the authority to grant, in one or more occasions within a maximum period of thirty-eight months, restricted shares to employees and executive officers
of the Company or companies outside France affiliated with the Company, within a limit of 0.8% of the outstanding share capital of the Company as of the date of the decision of the Board of Directors to grant such shares.
Pursuant to this delegation, the Board of Directors, during its meeting on May 21, 2010, determined the terms of
a global free share plan intended for Group employees and granted the Chairman and Chief Executive Officer all powers necessary to implement this plan.
As a result, and in accordance with the terms defined by the Board of Directors during its meeting on May 21, 2010, the Chairman and Chief Executive Officer
noted:
|
–
|
|
on July 2, 2012, the issuance and the final allocation of 1,366,950 shares with a nominal value of
€
2.50 to the designated beneficiaries after the expiration of the two-year acquisition period; and
|
|
–
|
|
on July 1, 2014, the issuance and the final allocation of 666,575 shares with a nominal value of
€
2.50 after the expiration of the four-year acquisition period.
|
There are no additional shares that may be issued as part of this plan.
Share cancellation
The Group did not proceed with a reduction of capital by cancellation of shares held by the Company during the fiscal years 2013, 2014 and 2015.
Treasury shares (TOTAL shares held by TOTAL S.A.)
As
of December 31, 2015, TOTAL S.A. holds 13,636,490 of its own shares, representing 0.56% of its share capital, detailed as follows:
|
|
•
|
|
13,603,525 shares allocated to TOTAL share grant plans for Group employees; and
|
|
|
•
|
|
32,965 shares intended to be allocated to new TOTAL share purchase option plans or to new share grant plans.
|
These shares are deducted from the consolidated shareholders’ equity.
As of December 31, 2014, TOTAL S.A. held 9,030,145 of its own shares, representing 0.38% of its share capital, detailed as follows:
|
|
•
|
|
8,946,930 shares allocated to TOTAL share grant plans for Group employees; and
|
|
|
|
|
|
F-40
|
|
TOTAL S.A. Form 20-F 2015
|
Note 17 – Notes to the Consolidated Financial Statements
|
|
•
|
|
83,215 shares intended to be allocated to new TOTAL share purchase option plans or to new share grant plans.
|
These shares were deducted from the consolidated shareholders’ equity.
As of December 31, 2013, TOTAL S.A. held 8,883,180 of its own shares, representing 0.37% of its share capital, detailed as follows:
|
|
•
|
|
8,764,020 shares allocated to TOTAL share grant plans for Group employees; and
|
|
|
•
|
|
119,160 shares intended to be allocated to new TOTAL share purchase option plans or to new share grant plans.
|
These shares were deducted from the consolidated shareholders’ equity.
TOTAL shares held by Group subsidiaries
As of December 31, 2015, 2014 and 2013, TOTAL S.A. held
indirectly through its subsidiaries 100,331,268 of its own shares, representing 4.11% of its share capital as of December 31, 2015, 4.21% of its share capital as of December 31, 2014 and 4.22% of its share capital as of December 31,
2013, detailed as follows:
|
|
•
|
|
2,023,672 shares held by a consolidated subsidiary, Total Nucléaire, 100% indirectly controlled by TOTAL S.A.; and
|
|
|
•
|
|
98,307,596 shares held by subsidiaries of Elf Aquitaine (Financière Valorgest, Sogapar and Fingestval), 100% indirectly controlled by TOTAL S.A.
|
These shares are deducted from the consolidated shareholders’ equity.
Dividend
TOTAL S.A. paid on March 25, 2015, the third quarterly interim dividend of
€
0.61 per share for the fiscal year 2014 (the ex-dividend date was March 23, 2015). TOTAL S.A. also paid on July 1, 2015 the
fourth quarter dividend of
€
0.61 per share for the fiscal year 2014 (the ex-dividend date was June 8, 2015).
The shareholders’ meeting on May 29, 2015, approved the option for shareholders to receive the fourth quarter dividend in shares or in cash. The number of
shares issued in lieu of the cash dividend has been based on the dividend amount divided by 42.02
€
per share, equal to 90% of the
average Euronext Paris opening price of the shares for the 20 trading days preceding the shareholders meeting reduced by the amount of the dividend remainder. On July 1, 2015, 18 609 466 shares have been issued at a price of 42.02
€
per share.
Another resolution has been
approved at the shareholders’ meeting on May 29, 2015, being that if one or more interim dividends are decided by the Board of Directors for the fiscal year 2015, then shareholders would have the option to receive each of this or these
interim dividends in shares or in cash.
For the fiscal year 2015, TOTAL S.A. already paid two quarterly interim dividends:
|
|
•
|
|
Payment of the first interim dividend for the fiscal year 2015 of
€
0.61 per share, decided by the Board of Directors on September 22, 2015 has been done in cash or in shares on October 21, 2015 (the ex-dividend date was September 28, 2015). The number of
shares issued in lieu of the cash dividend was based on the dividend amount divided by
€
35.63 per share, equal to 90% of the average
Euronext Paris opening price of the shares for the 20 trading days preceding the Board of Directors meeting, reduced by the amount of the first interim
|
|
|
|
dividend. On October 21, 2015, 24,231,876 shares have been issued at a price of
€
35.63 per share.
|
|
|
•
|
|
Payment of the second interim dividend for the fiscal year 2015 of
€
0.61 per share, decided by the Board of Directors on December 16, 2015 has been done in cash or in shares on January 14, 2016 (the ex-dividend date was December 21, 2015). The number of
shares issued in lieu of the cash dividend was based on the dividend amount divided by
€
39.77 per share, equal to 90% of the average
Euronext Paris opening price of the shares for the 20 trading days preceding the Board of Directors meeting, reduced by the amount of the second interim dividend. On January 14, 2016, 13,945,709 shares have been issued at a price of
€
39.77 per share.
|
The
Board of Directors, during its October 28, 2015 meeting, decided to set the third quarterly interim dividend for the fiscal year 2015 at
€
0.61 per share. This interim dividend will be paid on April 12, 2016 (the ex-dividend date will be March 21, 2016).
A resolution will be submitted at the shareholders’ meeting on May 24, 2016 to pay a dividend of
€
2.44 per share for the 2015 fiscal year, i.e. a balance of
€
0.61 per share to be distributed after deducting the three quarterly interim dividends of
€
0.61 per share that will have already been paid.
Issuance of perpetual subordinated notes
In 2015, the Group issued two tranches of perpetual subordinated
notes in EUR through TOTAL S.A.:
|
|
–
|
|
Deeply subordinated note 2.250% perpetual maturity callable after 6 years (2,500 million EUR)
|
|
|
–
|
|
Deeply subordinated note 2.625% perpetual maturity callable after 10 years (2,500 million EUR)
|
Based on their characteristics and in compliance with the IAS 32 standard —
Financial instruments — Presentation
, these notes were recorded in
equity.
As of December 31, 2015, the amount of the perpetual deeply subordinated note booked in the Group shareholders’ equity is $5,616
million. The coupons attributable to the holders of these securities are booked in deduction of the Group shareholders’ equity for an amount of $114 million for fiscal year 2015 closing. The tax saving due to these coupons is booked in the
statement of income.
Paid-in surplus
In
accordance with French law, the paid-in surplus corresponds to premiums related to shares, contributions or mergers of the parent company which can be capitalized or used to offset losses if the legal reserve has reached its minimum required level.
The amount of the paid-in surplus may also be distributed subject to taxation except in cases of a refund of shareholder contributions to.
As of
December 31, 2015, paid-in surplus relating to TOTAL S.A. amounted to
€
30,265 million (
€
28,319 million as of December 31, 2014 and
€
28,020 million as of December 31, 2013).
Reserves
Under French law, 5% of net income must be transferred to the legal reserve until the legal reserve reaches 10% of the nominal value of the share capital. This
reserve cannot be distributed to the shareholders other than upon liquidation but can be used to offset losses.
If wholly distributed, the unrestricted
reserves of the parent company would be taxed for an approximate amount of $630 million as of December 31, 2015 ($755 million as of December 31, 2014 and $754 million as of December 31, 2013)
|
|
|
|
|
2015 Form 20-F TOTAL S.A.
|
|
F-41
|
Notes to the Consolidated Financial Statements – Note 17
with regards to additional corporation tax to be applied on regulatory reserves so that they become distributable.
Futhermore, the additional tax to corporate income tax of 3%, due on dividends distributed by French companies or foreign organizations subject to
corporate income in France, established
by the second corrective finance act for 2012 would be payable for an amount of $450 million as of December 31, 2015, ($553 million as of December 31, 2014 and $538 million as of
December 31, 2013).
Other comprehensive income
Detail of other comprehensive income showing both items potentially reclassifiable and those not potentially reclassifiable from equity to net
income is presented in the table below:
|
|
|
|
|
|
|
|
|
|
|
|
|
|
|
|
|
|
|
|
|
|
|
|
|
|
|
For the year ended December 31, (M$)
|
|
2015
|
|
|
2014
|
|
|
2013
|
|
|
Actuarial gains and loses
|
|
|
|
|
|
|
557
|
|
|
|
|
|
|
|
(1,526
|
)
|
|
|
|
|
|
|
682
|
|
|
Tax effect
|
|
|
|
|
|
|
(278
|
)
|
|
|
|
|
|
|
580
|
|
|
|
|
|
|
|
(287
|
)
|
|
Currency translation adjustment generated by the parent company
|
|
|
|
|
|
|
(7,268
|
)
|
|
|
|
|
|
|
(9,039
|
)
|
|
|
|
|
|
|
3,129
|
|
|
Sub-total items not potentially reclassifiable to profit & loss
|
|
|
|
|
|
|
(6,989
|
)
|
|
|
|
|
|
|
(9,985
|
)
|
|
|
|
|
|
|
3,524
|
|
|
Currency translation adjustment
|
|
|
|
|
|
|
2,456
|
|
|
|
|
|
|
|
4,245
|
|
|
|
|
|
|
|
(1,925
|
)
|
|
— Unrealized gain/(loss) of the period
|
|
|
3,032
|
|
|
|
|
|
|
|
4,413
|
|
|
|
|
|
|
|
(1,972
|
)
|
|
|
|
|
|
— Less gain/(loss) included in net income
|
|
|
576
|
|
|
|
|
|
|
|
168
|
|
|
|
|
|
|
|
(47
|
)
|
|
|
|
|
|
Available for sale financial assets
|
|
|
|
|
|
|
9
|
|
|
|
|
|
|
|
(29
|
)
|
|
|
|
|
|
|
33
|
|
|
— Unrealized gain/(loss) of the period
|
|
|
10
|
|
|
|
|
|
|
|
(39
|
)
|
|
|
|
|
|
|
33
|
|
|
|
|
|
|
— Less gain/(loss) included in net income
|
|
|
1
|
|
|
|
|
|
|
|
(10
|
)
|
|
|
|
|
|
|
—
|
|
|
|
|
|
|
Cash flow hedge
|
|
|
|
|
|
|
(185
|
)
|
|
|
|
|
|
|
97
|
|
|
|
|
|
|
|
156
|
|
|
— Unrealized gain/(loss) of the period
|
|
|
(390
|
)
|
|
|
|
|
|
|
(198
|
)
|
|
|
|
|
|
|
242
|
|
|
|
|
|
|
— Less gain/(loss) included in net income
|
|
|
(205
|
)
|
|
|
|
|
|
|
(295
|
)
|
|
|
|
|
|
|
86
|
|
|
|
|
|
|
Share of other comprehensive income of equity affiliates, net amount
|
|
|
|
|
|
|
120
|
|
|
|
|
|
|
|
(1,538
|
)
|
|
|
|
|
|
|
(805
|
)
|
|
— Unrealized gain/(loss) of the period
|
|
|
118
|
|
|
|
|
|
|
|
(1,538
|
)
|
|
|
|
|
|
|
(805
|
)
|
|
|
|
|
|
— Less gain/(loss) included in net income
|
|
|
(2
|
)
|
|
|
|
|
|
|
—
|
|
|
|
|
|
|
|
—
|
|
|
|
|
|
|
Other
|
|
|
|
|
|
|
1
|
|
|
|
|
|
|
|
3
|
|
|
|
|
|
|
|
(12
|
)
|
|
Tax effect
|
|
|
|
|
|
|
53
|
|
|
|
|
|
|
|
(18
|
)
|
|
|
|
|
|
|
(62
|
)
|
|
Sub-total items potentially reclassifiable to profit & loss
|
|
|
|
|
|
|
2,454
|
|
|
|
|
|
|
|
2,760
|
|
|
|
|
|
|
|
(2,615
|
)
|
|
Total other comprehensive income, net amount
|
|
|
|
|
|
|
(4,535
|
)
|
|
|
|
|
|
|
(7,225
|
)
|
|
|
|
|
|
|
909
|
|
The currency translation adjustment by currency is detailed in the following table:
|
|
|
|
|
|
|
|
|
|
|
|
|
|
|
|
|
|
|
|
|
|
|
As of December 31, 2015 (M$)
|
|
Total
|
|
|
Euro
|
|
|
Pound
sterling
|
|
|
Ruble
|
|
|
Other
currencies
|
|
|
Currency translation adjustment generated by the parent company
|
|
|
(7,268
|
)
|
|
|
(7,268
|
)
|
|
|
—
|
|
|
|
—
|
|
|
|
—
|
|
|
Currency translation adjustment
|
|
|
2,456
|
|
|
|
3,318
|
|
|
|
(267
|
)
|
|
|
(3
|
)
|
|
|
(592
|
)
|
|
Currency translation adjustment of equity affiliates
|
|
|
87
|
|
|
|
903
|
|
|
|
16
|
|
|
|
(718
|
)
|
|
|
(114
|
)
|
|
Total currency translation adjustment recognized in comprehensive income
|
|
|
(4,725
|
)
|
|
|
(3,047
|
)
|
|
|
(251
|
)
|
|
|
(721
|
)
|
|
|
(706
|
)
|
|
|
|
|
|
|
|
|
|
|
|
|
|
|
|
|
|
|
|
|
|
|
|
As of December 31, 2014 (M$)
|
|
Total
|
|
|
Euro
|
|
|
Pound
sterling
|
|
|
Ruble
|
|
|
Other
currencies
|
|
|
Currency translation adjustment generated by the parent company
|
|
|
(9,039
|
)
|
|
|
(9,039
|
)
|
|
|
—
|
|
|
|
—
|
|
|
|
—
|
|
|
Currency translation adjustment
|
|
|
4,245
|
|
|
|
5,474
|
|
|
|
(372
|
)
|
|
|
(22
|
)
|
|
|
(835
|
)
|
|
Currency translation adjustment of equity affiliates
|
|
|
(1,521
|
)
|
|
|
1,127
|
|
|
|
21
|
|
|
|
(2,586
|
)
|
|
|
(83
|
)
|
|
Total currency translation adjustment recognized in comprehensive income
|
|
|
(6,315
|
)
|
|
|
(2,438
|
)
|
|
|
(351
|
)
|
|
|
(2,608
|
)
|
|
|
(918
|
)
|
|
|
|
|
|
|
|
|
|
|
|
|
|
|
|
|
|
|
|
|
|
|
|
As of December 31, 2013 (M$)
|
|
Total
|
|
|
Euro
|
|
|
Pound
sterling
|
|
|
Ruble
|
|
|
Other
currencies
|
|
|
Currency translation adjustment generated by the parent company
|
|
|
3,129
|
|
|
|
3,129
|
|
|
|
—
|
|
|
|
—
|
|
|
|
—
|
|
|
Currency translation adjustment
|
|
|
(1,925
|
)
|
|
|
(1,632
|
)
|
|
|
153
|
|
|
|
(2
|
)
|
|
|
(444
|
)
|
|
Currency translation adjustment of equity affiliates
|
|
|
(768
|
)
|
|
|
(329
|
)
|
|
|
(8
|
)
|
|
|
(441
|
)
|
|
|
10
|
|
|
Total currency translation adjustment recognized in comprehensive income
|
|
|
436
|
|
|
|
1,168
|
|
|
|
145
|
|
|
|
(443
|
)
|
|
|
(434
|
)
|
|
|
|
|
|
F-42
|
|
TOTAL S.A. Form 20-F 2015
|
Note 18 – Notes to the Consolidated Financial Statements
Tax effects relating to each component of other comprehensive income are as follows:
|
|
|
|
|
|
|
|
|
|
|
|
|
|
|
|
|
|
|
|
|
|
|
|
|
|
|
|
|
|
|
|
|
|
|
|
|
|
|
|
|
2015
|
|
|
2014
|
|
|
2013
|
|
|
For the year ended
December 31, (M$)
|
|
Pre-tax
amount
|
|
|
Tax
effect
|
|
|
Net
amount
|
|
|
Pre-tax
amount
|
|
|
Tax
effect
|
|
|
Net
amount
|
|
|
Pre-tax
amount
|
|
|
Tax
effect
|
|
|
Net
amount
|
|
|
Actuarial gains and losses
|
|
|
557
|
|
|
|
(278
|
)
|
|
|
279
|
|
|
|
(1,526
|
)
|
|
|
580
|
|
|
|
(946
|
)
|
|
|
682
|
|
|
|
(287
|
)
|
|
|
395
|
|
|
Currency translation adjustment generated by the parent company
|
|
|
(7,268
|
)
|
|
|
—
|
|
|
|
(7,268
|
)
|
|
|
(9,039
|
)
|
|
|
—
|
|
|
|
(9,039
|
)
|
|
|
3,129
|
|
|
|
—
|
|
|
|
3,129
|
|
|
Sub-total items not potentially reclassifiable to profit & loss
|
|
|
(6,711
|
)
|
|
|
(278
|
)
|
|
|
(6,989
|
)
|
|
|
(10,565
|
)
|
|
|
580
|
|
|
|
(9,985
|
)
|
|
|
3,811
|
|
|
|
(287
|
)
|
|
|
3,524
|
|
|
Currency translation adjustment
|
|
|
2,456
|
|
|
|
—
|
|
|
|
2,456
|
|
|
|
4,245
|
|
|
|
—
|
|
|
|
4,245
|
|
|
|
(1,925
|
)
|
|
|
—
|
|
|
|
(1,925
|
)
|
|
Available for sale financial assets
|
|
|
9
|
|
|
|
(5
|
)
|
|
|
4
|
|
|
|
(29
|
)
|
|
|
15
|
|
|
|
(14
|
)
|
|
|
33
|
|
|
|
(8
|
)
|
|
|
25
|
|
|
Cash flow hedge
|
|
|
(185
|
)
|
|
|
58
|
|
|
|
(127
|
)
|
|
|
97
|
|
|
|
(33
|
)
|
|
|
64
|
|
|
|
156
|
|
|
|
(54
|
)
|
|
|
102
|
|
|
Share of other comprehensive income of equity affiliates, net amount
|
|
|
120
|
|
|
|
—
|
|
|
|
120
|
|
|
|
(1,538
|
)
|
|
|
—
|
|
|
|
(1,538
|
)
|
|
|
(805
|
)
|
|
|
—
|
|
|
|
(805
|
)
|
|
Other
|
|
|
1
|
|
|
|
—
|
|
|
|
1
|
|
|
|
3
|
|
|
|
—
|
|
|
|
3
|
|
|
|
(12
|
)
|
|
|
—
|
|
|
|
(12
|
)
|
|
Sub-total items potentially reclassifiable to profit & loss
|
|
|
2,401
|
|
|
|
53
|
|
|
|
2,454
|
|
|
|
2,778
|
|
|
|
(18
|
)
|
|
|
2,760
|
|
|
|
(2,553
|
)
|
|
|
(62
|
)
|
|
|
(2,615
|
)
|
|
Total other comprehensive income
|
|
|
(4,310
|
)
|
|
|
(225
|
)
|
|
|
(4,535
|
)
|
|
|
(7,787
|
)
|
|
|
562
|
|
|
|
(7,225
|
)
|
|
|
1,258
|
|
|
|
(349
|
)
|
|
|
909
|
|
Non-controlling interests
As
of December 31, 2015, no subsidiary has non-controlling interests that would have a material effect on the Group financial statements.
18)
Employee benefits obligations
Liabilities for employee benefits obligations consist of the following:
|
|
|
|
|
|
|
|
|
|
|
|
|
|
|
As of December 31, (M$)
|
|
2015
|
|
|
2014
|
|
|
2013
|
|
|
Pension benefits liabilities
|
|
|
2,926
|
|
|
|
3,751
|
|
|
|
3,095
|
|
|
Other benefits liabilities
|
|
|
627
|
|
|
|
757
|
|
|
|
788
|
|
|
Restructuring reserves (early retirement plans)
|
|
|
221
|
|
|
|
250
|
|
|
|
352
|
|
|
Total
|
|
|
3,774
|
|
|
|
4,758
|
|
|
|
4,235
|
|
|
Net liabilities relating to assets held for sale
|
|
|
3
|
|
|
|
208
|
|
|
|
—
|
|
Description of plans and risk management
The Group operates, for the benefit of its current and former employees, both defined benefit plans and defined contribution plans.
The Group recognized a charge of $159 million for defined contribution plans in 2015 ($157 million in 2014).
The
Group’s main defined benefit pension plans are located in France, the United Kingdom, the United States, Belgium and Germany. Their main characteristics, depending on the country-specific regulatory environment, are the following:
|
|
•
|
|
the benefits are usually based on the final salary and seniority;
|
|
|
•
|
|
they are usually funded (pension fund or insurer);
|
|
|
•
|
|
they are usually closed to new employees who benefit from defined contribution pension plans; and
|
|
|
•
|
|
they are paid in annuity or in lump sum.
|
The pension benefits include also termination indemnities and early retirement benefits. The other benefits are
employer contributions to post-employment medical care.
In order to manage the inherent risks, the Group has implemented a dedicated governance
framework to ensure the supervision of the different plans. These governance rules provide for:
|
|
•
|
|
the Group’s representation in key governance bodies or monitoring committees;
|
|
|
•
|
|
the principles of the funding policy;
|
|
|
•
|
|
the general investment policy, including for most plans the establishment of a monitoring committee to define and follow the investment strategy and performance
and to ensure the principles in respect of investment allocation are respected;
|
|
|
•
|
|
a procedure to approve the establishment of new plans or the amendment of existing plans;
|
|
|
•
|
|
principles of administration, communication and reporting.
|
|
|
|
|
|
2015 Form 20-F TOTAL S.A.
|
|
F-43
|
Notes to the Consolidated Financial Statements – Note 18
Change in benefit obligations and plan assets
The fair value of the defined benefit obligation and plan assets in the Consolidated Financial Statements is detailed as follows:
|
|
|
|
|
|
|
|
|
|
|
|
|
|
|
|
|
|
|
|
|
|
|
|
|
|
|
|
|
Pension benefits
|
|
|
Other benefits
|
|
|
As of December 31, (M$)
|
|
2015
|
|
|
2014
|
|
|
2013
|
|
|
2015
|
|
|
2014
|
|
|
2013
|
|
|
Change in benefit obligation
|
|
|
|
|
|
|
|
|
|
|
|
|
|
|
|
|
|
|
|
|
|
|
|
|
|
Benefit obligation at beginning of year
|
|
|
14,297
|
|
|
|
14,310
|
|
|
|
14,372
|
|
|
|
845
|
|
|
|
788
|
|
|
|
927
|
|
|
Current service cost
|
|
|
271
|
|
|
|
281
|
|
|
|
290
|
|
|
|
17
|
|
|
|
16
|
|
|
|
21
|
|
|
Interest cost
|
|
|
402
|
|
|
|
560
|
|
|
|
515
|
|
|
|
22
|
|
|
|
31
|
|
|
|
31
|
|
|
Past service cost
|
|
|
(35
|
)
|
|
|
(84
|
)
|
|
|
12
|
|
|
|
—
|
|
|
|
(4
|
)
|
|
|
(68
|
)
|
|
Settlements
|
|
|
(58
|
)
|
|
|
1
|
|
|
|
(90
|
)
|
|
|
—
|
|
|
|
—
|
|
|
|
(1
|
)
|
|
Plan participants’ contributions
|
|
|
8
|
|
|
|
11
|
|
|
|
10
|
|
|
|
—
|
|
|
|
—
|
|
|
|
—
|
|
|
Benefits paid
|
|
|
(653
|
)
|
|
|
(694
|
)
|
|
|
(717
|
)
|
|
|
(32
|
)
|
|
|
(38
|
)
|
|
|
(45
|
)
|
|
Actuarial losses (gains)
|
|
|
(533
|
)
|
|
|
1,281
|
|
|
|
(362
|
)
|
|
|
(71
|
)
|
|
|
127
|
|
|
|
(92
|
)
|
|
Foreign currency translation and other
|
|
|
(1,226
|
)
|
|
|
(1,369
|
)
|
|
|
280
|
|
|
|
(154
|
)
|
|
|
(75
|
)
|
|
|
15
|
|
|
Benefit obligation at year-end
|
|
|
12,473
|
|
|
|
14,297
|
|
|
|
14,310
|
|
|
|
627
|
|
|
|
845
|
|
|
|
788
|
|
|
Of which plans entirely or partially funded
|
|
|
11,742
|
|
|
|
13,448
|
|
|
|
13,283
|
|
|
|
—
|
|
|
|
—
|
|
|
|
—
|
|
|
Of which plans not funded
|
|
|
731
|
|
|
|
849
|
|
|
|
1,027
|
|
|
|
627
|
|
|
|
845
|
|
|
|
788
|
|
|
Change in fair value of plan assets
|
|
|
|
|
|
|
|
|
|
|
|
|
|
|
|
|
|
|
|
|
|
|
|
|
|
Fair value of plan assets at beginning of year
|
|
|
(10,498
|
)
|
|
|
(11,293
|
)
|
|
|
(10,750
|
)
|
|
|
—
|
|
|
|
—
|
|
|
|
—
|
|
|
Interest income
|
|
|
(318
|
)
|
|
|
(463
|
)
|
|
|
(408
|
)
|
|
|
—
|
|
|
|
—
|
|
|
|
—
|
|
|
Actuarial losses (gains)
|
|
|
48
|
|
|
|
111
|
|
|
|
(249
|
)
|
|
|
—
|
|
|
|
—
|
|
|
|
—
|
|
|
Settlements
|
|
|
44
|
|
|
|
—
|
|
|
|
91
|
|
|
|
—
|
|
|
|
—
|
|
|
|
—
|
|
|
Plan participants’ contributions
|
|
|
(8
|
)
|
|
|
(11
|
)
|
|
|
(10
|
)
|
|
|
—
|
|
|
|
—
|
|
|
|
—
|
|
|
Employer contributions
|
|
|
(311
|
)
|
|
|
(384
|
)
|
|
|
(298
|
)
|
|
|
—
|
|
|
|
—
|
|
|
|
—
|
|
|
Benefits paid
|
|
|
553
|
|
|
|
563
|
|
|
|
602
|
|
|
|
—
|
|
|
|
—
|
|
|
|
—
|
|
|
Foreign currency translation and other
|
|
|
863
|
|
|
|
979
|
|
|
|
(271
|
)
|
|
|
—
|
|
|
|
—
|
|
|
|
—
|
|
|
Fair value of plan assets at year-end
|
|
|
(9,627
|
)
|
|
|
(10,498
|
)
|
|
|
(11,293
|
)
|
|
|
—
|
|
|
|
—
|
|
|
|
—
|
|
|
Unfunded status
|
|
|
2,846
|
|
|
|
3,799
|
|
|
|
3,017
|
|
|
|
627
|
|
|
|
845
|
|
|
|
788
|
|
|
Asset ceiling
|
|
|
27
|
|
|
|
34
|
|
|
|
29
|
|
|
|
—
|
|
|
|
—
|
|
|
|
—
|
|
|
Net recognized amount
|
|
|
2,873
|
|
|
|
3,833
|
|
|
|
3,046
|
|
|
|
627
|
|
|
|
845
|
|
|
|
788
|
|
|
Pension benefits and other benefits liabilities
|
|
|
2,926
|
|
|
|
3,751
|
|
|
|
3,095
|
|
|
|
627
|
|
|
|
757
|
|
|
|
788
|
|
|
Other non-current assets
|
|
|
(56
|
)
|
|
|
(38
|
)
|
|
|
(49
|
)
|
|
|
—
|
|
|
|
—
|
|
|
|
—
|
|
|
Net benefit liabilities relating to assets held for sale
|
|
|
3
|
|
|
|
120
|
|
|
|
—
|
|
|
|
—
|
|
|
|
88
|
|
|
|
—
|
|
As of December 31, 2015, the contribution from the main geographical areas for the net pension liability in the balance sheet
is: 60% for the Euro area, 16% for the United Kingdom and 17% for the United States.
The amounts recognized in the consolidated income statement and the
consolidated statement of comprehensive income for defined benefit plans are detailed as follows:
|
|
|
|
|
|
|
|
|
|
|
|
|
|
|
|
|
|
|
|
|
|
|
|
|
|
|
|
|
Pension benefits
|
|
|
Other benefits
|
|
|
For the year ended December 31,
(M$)
|
|
2015
|
|
|
2014
|
|
|
2013
|
|
|
2015
|
|
|
2014
|
|
|
2013
|
|
|
Current service cost
|
|
|
271
|
|
|
|
281
|
|
|
|
290
|
|
|
|
17
|
|
|
|
16
|
|
|
|
21
|
|
|
Past service cost
|
|
|
(35
|
)
|
|
|
(84
|
)
|
|
|
12
|
|
|
|
—
|
|
|
|
(4
|
)
|
|
|
(68
|
)
|
|
Settlements
|
|
|
(14
|
)
|
|
|
1
|
|
|
|
1
|
|
|
|
—
|
|
|
|
—
|
|
|
|
(1
|
)
|
|
Net interest cost
|
|
|
84
|
|
|
|
97
|
|
|
|
107
|
|
|
|
22
|
|
|
|
31
|
|
|
|
31
|
|
|
Benefit amounts recognized on Profit & Loss
|
|
|
306
|
|
|
|
295
|
|
|
|
410
|
|
|
|
39
|
|
|
|
43
|
|
|
|
(17
|
)
|
|
— Actuarial (Gains) Losses
|
|
|
|
|
|
|
|
|
|
|
|
|
|
|
|
|
|
|
|
|
|
|
|
|
|
* Effect of changes in demographic assumptions
|
|
|
(41
|
)
|
|
|
178
|
|
|
|
5
|
|
|
|
(10
|
)
|
|
|
18
|
|
|
|
(9
|
)
|
|
* Effect of changes in financial assumptions
|
|
|
(384
|
)
|
|
|
1,295
|
|
|
|
(299
|
)
|
|
|
(27
|
)
|
|
|
129
|
|
|
|
(68
|
)
|
|
* Effect of experience adjustments
|
|
|
(108
|
)
|
|
|
(192
|
)
|
|
|
(68
|
)
|
|
|
(34
|
)
|
|
|
(20
|
)
|
|
|
(15
|
)
|
|
* Actual return on plan assets (excluding interest income)
|
|
|
48
|
|
|
|
111
|
|
|
|
(249
|
)
|
|
|
—
|
|
|
|
—
|
|
|
|
—
|
|
|
— Effect of asset ceiling
|
|
|
(1
|
)
|
|
|
7
|
|
|
|
21
|
|
|
|
—
|
|
|
|
—
|
|
|
|
—
|
|
|
Benefit amounts recognized on Equity
|
|
|
(486
|
)
|
|
|
1,399
|
|
|
|
(590
|
)
|
|
|
(71
|
)
|
|
|
127
|
|
|
|
(92
|
)
|
|
Total benefit amounts recognized on other comprehensive income
|
|
|
(180
|
)
|
|
|
1,694
|
|
|
|
(180
|
)
|
|
|
(32
|
)
|
|
|
170
|
|
|
|
(109
|
)
|
Expected future cash out flow
The average duration of accrued benefits is approximately 15 years for defined pension benefits and 21 years for other benefits. The Group expects to pay
contributions of $156 million in respect of funded pension plans in 2016.
|
|
|
|
|
F-44
|
|
TOTAL S.A. Form 20-F 2015
|
Note 19 – Notes to the Consolidated Financial Statements
Estimated future benefits either financed from plan assets or directly paid by the
employer are detailed as follows:
Estimated future payments
|
|
|
|
|
|
|
|
|
|
|
(M$)
|
|
Pension benefits
|
|
|
Other benefits
|
|
|
2016
|
|
|
642
|
|
|
|
28
|
|
|
2017
|
|
|
658
|
|
|
|
29
|
|
|
2018
|
|
|
768
|
|
|
|
29
|
|
|
2019
|
|
|
644
|
|
|
|
29
|
|
|
2020
|
|
|
657
|
|
|
|
28
|
|
|
2021-2025
|
|
|
3,311
|
|
|
|
136
|
|
Type of assets
|
|
|
|
|
|
|
|
|
|
|
|
|
|
|
Asset
allocation
|
|
Pension benefits
|
|
|
As of
December 31,
|
|
2015
|
|
|
2014
|
|
|
2013
|
|
|
Equity securities
|
|
|
28
|
%
|
|
|
29
|
%
|
|
|
30%
|
|
|
Debt securities
|
|
|
42
|
%
|
|
|
43
|
%
|
|
|
64%
|
|
|
Monetary
|
|
|
4
|
%
|
|
|
3
|
%
|
|
|
2%
|
|
|
Annuity contracts
|
|
|
21
|
%
|
|
|
21
|
%
|
|
|
—
|
|
|
Real estate
|
|
|
5
|
%
|
|
|
4
|
%
|
|
|
4%
|
|
Investments on equity and debt markets are quoted on active markets.
Main actuarial assumptions and sensitivity analysis
|
|
|
|
|
|
|
|
|
|
|
|
|
|
|
|
|
|
|
|
|
|
|
|
|
|
|
|
|
Assumptions
used to determine benefits obligations
|
|
|
|
Pension benefits
|
|
|
Other benefits
|
|
|
As of
December 31,
|
|
|
|
2015
|
|
|
2014
|
|
|
2013
|
|
|
2015
|
|
|
2014
|
|
|
2013
|
|
|
Discount rate (weighted average for all regions)
|
|
|
|
|
3.25
|
%
|
|
|
3.06
|
%
|
|
|
4.14
|
%
|
|
|
3.00
|
%
|
|
|
3.12
|
%
|
|
|
4.14
|
%
|
|
|
|
Of which Euro zone
|
|
|
2.18
|
%
|
|
|
1.95
|
%
|
|
|
3.40
|
%
|
|
|
2.42
|
%
|
|
|
2.22
|
%
|
|
|
3.44
|
%
|
|
|
|
Of which United States
|
|
|
4.25
|
%
|
|
|
4.00
|
%
|
|
|
4.74
|
%
|
|
|
4.25
|
%
|
|
|
4.00
|
%
|
|
|
4.71
|
%
|
|
|
|
Of which United Kingdom
|
|
|
3.75
|
%
|
|
|
3.75
|
%
|
|
|
4.50
|
%
|
|
|
—
|
|
|
|
—
|
|
|
|
—
|
|
|
Inflation rate (weighted average for all regions)
|
|
|
|
|
2.43
|
%
|
|
|
2.44
|
%
|
|
|
2.67
|
%
|
|
|
—
|
|
|
|
—
|
|
|
|
—
|
|
|
|
|
Of which Euro zone
|
|
|
1.75
|
%
|
|
|
1.75
|
%
|
|
|
2.00
|
%
|
|
|
—
|
|
|
|
—
|
|
|
|
—
|
|
|
|
|
Of which United States
|
|
|
2.50
|
%
|
|
|
2.50
|
%
|
|
|
2.50
|
%
|
|
|
—
|
|
|
|
—
|
|
|
|
—
|
|
|
|
|
Of which United Kingdom
|
|
|
3.25
|
%
|
|
|
3.25
|
%
|
|
|
3.50
|
%
|
|
|
—
|
|
|
|
—
|
|
|
|
—
|
|
The discount rate retained is determined by reference to the high quality rates for AA-rated corporate bonds for a duration
equivalent to that of the obligations. It derives from a benchmark per monetary area of different market data at the closing date.
Sensitivity to
inflation in respect of defined benefit pension plans is not material in the United States.
A 0.5% increase or decrease in discount rates — all
other things being equal — would have the following approximate impact on the benefit obligation:
|
|
|
|
|
|
|
|
|
|
|
(M$)
|
|
0.5% Increase
|
|
|
0.5% Decrease
|
|
|
Benefit obligation as of December 31, 2015
|
|
|
(840
|
)
|
|
|
930
|
|
A 0.5% increase or decrease in inflation rates — all other things being equal — would have the following approximate
impact on the benefit obligation:
|
|
|
|
|
|
|
|
|
|
|
(M$)
|
|
0.5% Increase
|
|
|
0.5% Decrease
|
|
|
Benefit obligation as of December 31, 2015
|
|
|
626
|
|
|
|
(567
|
)
|
19)
Provisions and other non-current liabilities
|
|
|
|
|
|
|
|
|
|
|
|
|
|
|
As of December 31, (M$)
|
|
2015
|
|
|
2014
|
|
|
2013
|
|
|
Litigations and accrued penalty claims
|
|
|
1,120
|
|
|
|
1,040
|
|
|
|
862
|
|
|
Provisions for environmental contingencies
|
|
|
909
|
|
|
|
994
|
|
|
|
1,160
|
|
|
Asset retirement obligations
|
|
|
13,314
|
|
|
|
13,121
|
|
|
|
12,808
|
|
|
Other non-current provisions
|
|
|
1,357
|
|
|
|
1,528
|
|
|
|
1,522
|
|
|
Other non-current liabilities
|
|
|
802
|
|
|
|
862
|
|
|
|
1,165
|
|
|
Total
|
|
|
17,502
|
|
|
|
17,545
|
|
|
|
17,517
|
|
In 2015, litigation reserves amount to $1,120 million of which $895 million is in the Upstream, notably in Angola and
Nigeria.
In 2015, other non-current provisions mainly include:
|
|
•
|
|
provisions related to restructuring activities in the Refining & Chemicals and Marketing & Services segments for $223 million as of
December 31, 2015;
|
|
|
•
|
|
provisions for financial risks related to non-consolidated and equity consolidated affiliates for $216 million as of December 31, 2015; and
|
|
|
•
|
|
the contingency reserve regarding guarantees granted in relation to solar panels of SunPower for $166 million as of December 31, 2015.
|
|
|
|
|
|
2015 Form 20-F TOTAL S.A.
|
|
F-45
|
Notes to the Consolidated Financial Statements – Note 19
In 2015, other non-current liabilities mainly include debts (whose maturity is more than one year) related to fixed
assets acquisitions.
In 2014, litigation reserves amounted to $1,040 million of which $861 million was in the Upstream, notably in Angola and Nigeria.
In 2014, other non-current provisions mainly include:
|
|
•
|
|
provisions related to restructuring activities in the Refining & Chemicals and Marketing & Services segments for $241 million as of
December 31, 2014;
|
|
|
•
|
|
provisions for financial risks related to non-consolidated and equity consolidated affiliates for $228 million as of December 31, 2014; and
|
|
|
•
|
|
the contingency reserve regarding guarantees granted in relation to solar panels of SunPower for $155 million as of December 31, 2014.
|
In 2014, other non-current liabilities mainly include debts (whose maturity is more than one year) related to fixed assets
acquisitions. This heading is mainly composed of a $32 million debt related to the acquisition of an interest in the liquids-rich area of the Utica shale play.
In 2013, litigation reserves amounted to $862 million of which $698 million was in the Upstream, notably in Angola
and Nigeria.
In 2013, other non-current provisions mainly included:
|
|
•
|
|
provisions related to restructuring activities in the Refining & Chemicals and Marketing & Services segments for $275 million as of
December 31, 2013;
|
|
|
•
|
|
provisions for financial risks related to non-consolidated and equity consolidated affiliates for $238 million as of December 31, 2013; and
|
|
|
•
|
|
the contingency reserve regarding guarantees granted in relation to solar panels of SunPower for $149 million as of December 31, 2013.
|
In 2013, other non-current liabilities mainly included debts (whose maturity is more than one year) related to fixed assets
acquisitions. This heading was mainly composed of a $127 million debt related to the acquisition of an interest in the liquids-rich area of the Utica shale play.
Other risks and commitments that give rise to contingent liabilities are described in Note 32 to the Consolidated Financial Statements.
Changes in provisions and other non-current
liabilities
Changes in provisions and other non-current liabilities are as follows:
|
|
|
|
|
|
|
|
|
|
|
|
|
|
|
|
|
|
|
|
|
|
|
|
|
|
|
(M$)
|
|
As of
January 1,
|
|
|
Allowances
|
|
|
Reversals
|
|
|
Currency
translation
adjustment
|
|
|
Other
|
|
|
As of
December 31,
|
|
|
2015
|
|
|
17,545
|
|
|
|
1,280
|
|
|
|
(1,236
|
)
|
|
|
(958
|
)
|
|
|
871
|
|
|
|
17,502
|
|
|
2014
|
|
|
17,517
|
|
|
|
1,463
|
|
|
|
(1,029
|
)
|
|
|
(1,228
|
)
|
|
|
822
|
|
|
|
17,545
|
|
|
2013
|
|
|
15,285
|
|
|
|
1,738
|
|
|
|
(1,347
|
)
|
|
|
(64
|
)
|
|
|
1,905
|
|
|
|
17,517
|
|
Allowances
In
2015, allowances for the period ($1,280 million) mainly include:
|
|
•
|
|
asset retirement obligations for $513 million (accretion);
|
|
|
•
|
|
environmental contingencies for $105 million in the Marketing & Services and Refining & Chemicals segments;
|
|
|
•
|
|
provisions related to restructuring of activities for $134 million.
|
In 2014, allowances for the period ($1,463 million) mainly included:
|
|
•
|
|
asset retirement obligations for $543 million (accretion);
|
|
|
•
|
|
environmental contingencies for $69 million in the Marketing & Services and Refining & Chemicals segments;
|
|
|
•
|
|
provisions related to restructuring of activities for $38 million.
|
In 2013, allowances for the period ($1,738 million) mainly included:
|
|
•
|
|
asset retirement obligations for $584 million (accretion);
|
|
|
•
|
|
environmental contingencies for $475 million in the Marketing & Services and Refining & Chemicals segments, of which $361 million is related to
the Carling site in France;
|
|
|
•
|
|
provisions related to restructuring of activities for $155 million.
|
Reversals
In 2015, reversals of the period ($1,236 million) are mainly related to the following incurred
expenses:
|
|
•
|
|
provisions for asset retirement obligations for $566 million;
|
|
|
•
|
|
environmental contingencies written back for $95 million;
|
|
|
•
|
|
provisions for restructuring and social plans written back for $60 million.
|
In 2014, reversals of the period ($1,029 million) are mainly related to the following incurred expenses:
|
|
•
|
|
provisions for asset retirement obligations for $440 million;
|
|
|
•
|
|
environmental contingencies written back for $98 million;
|
|
|
•
|
|
provisions for restructuring and social plans written back for $80 million.
|
In 2013, reversals of the period ($1,347 million) were mainly related to the following incurred expenses:
|
|
•
|
|
a provision of $398 million in relation to a transaction in progress with the United States Securities and Exchange Commission (SEC) and the Department of
Justice (DoJ) in the United States;
|
|
|
•
|
|
provisions for asset retirement obligations for $381 million;
|
|
|
•
|
|
environmental contingencies written back for $99 million;
|
|
|
•
|
|
provisions for restructuring and social plans written back for $100 million.
|
Changes in the asset retirement obligation
The discount rate used in 2015 for the valuation of asset
retirement obligation is 4.5% as in 2014 and 2013 (the expenses are estimated at current currency values with an inflation rate of 2%). A decrease of 0.5% of this rate would increase the asset retirement obligation by $860 million, with a
corresponding impact in tangible assets, and with a negative impact of approximately $50 million on the following years net income. Conversely, an increase of 0.5% of this rate would decrease the asset retirement obligation by $860 million and have
a positive impact of approximately $50 million on the following years net income.
|
|
|
|
|
F-46
|
|
TOTAL S.A. Form 20-F 2015
|
Note 20 – Notes to the Consolidated Financial Statements
Changes in the asset retirement obligation are as follows:
|
|
|
|
|
|
|
|
|
|
|
|
|
|
|
|
|
|
|
|
|
|
|
|
|
|
|
|
|
|
|
|
|
|
|
(M$)
|
|
As of
January 1,
|
|
|
Accretion
|
|
|
Revision in
estimates
|
|
|
New
obligations
|
|
|
Spending on
existing
obligations
|
|
|
Currency
translation
adjustment
|
|
|
Other
|
|
|
As of
December 31,
|
|
|
2015
|
|
|
13,121
|
|
|
|
513
|
|
|
|
685
|
|
|
|
271
|
|
|
|
(566
|
)
|
|
|
(676
|
)
|
|
|
(34
|
)
|
|
|
13,314
|
|
|
2014
|
|
|
12,808
|
|
|
|
543
|
|
|
|
1,007
|
|
|
|
359
|
|
|
|
(440
|
)
|
|
|
(902
|
)
|
|
|
(254
|
)
|
|
|
13,121
|
|
|
2013
|
|
|
10,059
|
|
|
|
584
|
|
|
|
2,196
|
|
|
|
552
|
|
|
|
(381
|
)
|
|
|
(156
|
)
|
|
|
(46
|
)
|
|
|
12,808
|
|
In 2015 and in 2014 the heading “Revision in estimates” includes additional provisions in respect of asset
restitution costs.
In 2013 the heading “Revision in estimates” included additional provisions in respect of asset restitution
costs and the impact of the revision of the discount rate.
20)
Financial debt and related financial
instruments
A) Non-current financial debt and related financial instruments
|
|
|
|
|
|
|
|
|
|
|
|
|
|
|
As of December 31, 2015 (M$)
(Assets) / Liabilities
|
|
Secured
|
|
|
Unsecured
|
|
|
Total
|
|
|
Non-current financial debt
|
|
|
655
|
|
|
|
43,809
|
|
|
|
44,464
|
|
|
of which hedging instruments of non-current financial debt (liabilities)
|
|
|
—
|
|
|
|
2,891
|
|
|
|
2,891
|
|
|
Hedging instruments of non-current financial debt (assets)
(a)
|
|
|
—
|
|
|
|
(1,219
|
)
|
|
|
(1,219
|
)
|
|
Non-current financial debt — net of hedging instruments
|
|
|
655
|
|
|
|
42,590
|
|
|
|
43,245
|
|
|
Bonds after fair value hedge
|
|
|
—
|
|
|
|
34,435
|
|
|
|
34,435
|
|
|
Fixed rate bonds and bonds after cash flow hedge
|
|
|
—
|
|
|
|
6,494
|
|
|
|
6,494
|
|
|
Bank and other, floating rate
|
|
|
34
|
|
|
|
1,110
|
|
|
|
1,144
|
|
|
Bank and other, fixed rate
|
|
|
326
|
|
|
|
551
|
|
|
|
877
|
|
|
Financial lease obligations
|
|
|
295
|
|
|
|
—
|
|
|
|
295
|
|
|
Non-current financial debt — net of hedging instruments
|
|
|
655
|
|
|
|
42,590
|
|
|
|
43,245
|
|
|
(a)
|
See the description of these hedging instruments in Notes 1 paragraph M(iii) “Long-term financing”, 28 and 29 to the Consolidated Financial
Statements.
|
|
|
|
|
|
|
|
|
|
|
|
|
|
|
|
As of December 31, 2014 (M$)
(Assets) / Liabilities
|
|
Secured
|
|
|
Unsecured
|
|
|
Total
|
|
|
Non-current financial debt
|
|
|
798
|
|
|
|
44,683
|
|
|
|
45,481
|
|
|
of which hedging instruments of non-current financial debt (liabilities)
|
|
|
—
|
|
|
|
944
|
|
|
|
944
|
|
|
Hedging instruments of non-current financial debt (assets)
(a)
|
|
|
—
|
|
|
|
(1,319
|
)
|
|
|
(1,319
|
)
|
|
Non-current financial debt — net of hedging instruments
|
|
|
798
|
|
|
|
43,364
|
|
|
|
44,162
|
|
|
Bonds after fair value hedge
|
|
|
—
|
|
|
|
36,558
|
|
|
|
36,558
|
|
|
Fixed rate bonds and bonds after cash flow hedge
|
|
|
—
|
|
|
|
6,155
|
|
|
|
6,155
|
|
|
Bank and other, floating rate
|
|
|
265
|
|
|
|
395
|
|
|
|
660
|
|
|
Bank and other, fixed rate
|
|
|
215
|
|
|
|
256
|
|
|
|
471
|
|
|
Financial lease obligations
|
|
|
318
|
|
|
|
—
|
|
|
|
318
|
|
|
Non-current financial debt — net of hedging instruments
|
|
|
798
|
|
|
|
43,364
|
|
|
|
44,162
|
|
|
(a)
|
See the description of these hedging instruments in Notes 1 paragraph M(iii) “Long-term financing”, 28 and 29 to the Consolidated Financial
Statements.
|
|
|
|
|
|
|
|
|
|
|
|
|
|
|
|
As of December 31, 2013 (M$)
(Assets) / Liabilities
|
|
Secured
|
|
|
Unsecured
|
|
|
Total
|
|
|
Non-current financial debt
|
|
|
717
|
|
|
|
33,857
|
|
|
|
34,574
|
|
|
of which hedging instruments of non-current financial debt (liabilities)
|
|
|
—
|
|
|
|
325
|
|
|
|
325
|
|
|
Hedging instruments of non-current financial debt (assets)
(a)
|
|
|
—
|
|
|
|
(1,418
|
)
|
|
|
(1,418
|
)
|
|
Non-current financial debt — net of hedging instruments
|
|
|
717
|
|
|
|
32,439
|
|
|
|
33,156
|
|
|
Bonds after fair value hedge
|
|
|
—
|
|
|
|
25,965
|
|
|
|
25,965
|
|
|
Fixed rate bonds and bonds after cash flow hedge
|
|
|
—
|
|
|
|
6,079
|
|
|
|
6,079
|
|
|
Bank and other, floating rate
|
|
|
173
|
|
|
|
247
|
|
|
|
420
|
|
|
Bank and other, fixed rate
|
|
|
158
|
|
|
|
148
|
|
|
|
306
|
|
|
Financial lease obligations
|
|
|
386
|
|
|
|
—
|
|
|
|
386
|
|
|
Non-current financial debt — net of hedging instruments
|
|
|
717
|
|
|
|
32,439
|
|
|
|
33,156
|
|
|
(a)
|
See the description of these hedging instruments in Notes 1 paragraph M(iii) “Long-term financing”, 28 and 29 to the Consolidated Financial
Statements.
|
|
|
|
|
|
2015 Form 20-F TOTAL S.A.
|
|
F-47
|
Notes to the Consolidated Financial Statements – Note 20
The fair value of bonds, as of December 31, 2015, after taking into account currency
and interest rates swaps, is detailed as follows:
|
|
|
|
|
|
|
|
|
|
|
|
|
|
|
|
|
|
|
|
|
|
|
|
|
|
|
Bonds after fair value hedge (M$)
|
|
Currency of
issuance
|
|
|
Fair value
after hedging
as of
December 31,
2015
|
|
|
Fair value
after hedging
as of
December 31,
2014
|
|
|
Fair value
after hedging
as of
December 31,
2013
|
|
|
Range of
current
maturities
|
|
|
Range of initial current rate
before hedging instruments
|
|
|
Bond
|
|
|
USD
|
|
|
|
13,754
|
|
|
|
16,385
|
|
|
|
12,733
|
|
|
|
2016 to 2024
|
|
|
|
0.750% to 3.750%
|
|
|
Bond
|
|
|
USD
|
|
|
|
2,385
|
|
|
|
2,385
|
|
|
|
2,553
|
|
|
|
2016 to 2020
|
|
|
|
USLIBOR 3 month + 0.03% to
USLIBOR 3 month + 0.75%
|
|
|
Bond
|
|
|
CHF
|
|
|
|
1,910
|
|
|
|
2,161
|
|
|
|
2,234
|
|
|
|
2016 to 2027
|
|
|
|
0.510% to 3.135%
|
|
|
Bond
|
|
|
NZD
|
|
|
|
251
|
|
|
|
251
|
|
|
|
138
|
|
|
|
2019 to 2020
|
|
|
|
4.750% to 5.000%
|
|
|
Bond
|
|
|
AUD
|
|
|
|
1,360
|
|
|
|
1,689
|
|
|
|
1,309
|
|
|
|
2016 to 2025
|
|
|
|
3.750% to 6.500%
|
|
|
Bond
|
|
|
EUR
|
|
|
|
11,365
|
|
|
|
12,127
|
|
|
|
7,956
|
|
|
|
2017 to 2044
|
|
|
|
1.125% to 4.875%
|
|
|
Bond
|
|
|
EUR
|
|
|
|
1,638
|
|
|
|
1,638
|
|
|
|
390
|
|
|
|
2020
|
|
|
|
EURIBOR 3 month + 0.30% to
EURIBOR 3 month + 0.31%
|
|
|
Bond
|
|
|
CAD
|
|
|
|
289
|
|
|
|
288
|
|
|
|
339
|
|
|
|
2017 to 2020
|
|
|
|
2.000% to 2.375%
|
|
|
Bond
|
|
|
GBP
|
|
|
|
2,225
|
|
|
|
1,662
|
|
|
|
1,241
|
|
|
|
2017 to 2022
|
|
|
|
2.250% to 4.250%
|
|
|
Bond
|
|
|
GBP
|
|
|
|
469
|
|
|
|
468
|
|
|
|
—
|
|
|
|
2019
|
|
|
|
GBLIB3M + 0.30%
|
|
|
Bond
|
|
|
JPY
|
|
|
|
—
|
|
|
|
—
|
|
|
|
110
|
|
|
|
|
|
|
|
|
|
|
Bond
|
|
|
NOK
|
|
|
|
566
|
|
|
|
566
|
|
|
|
565
|
|
|
|
2016 to 2018
|
|
|
|
2.250% to 4.000%
|
|
|
Bond
|
|
|
HKD
|
|
|
|
394
|
|
|
|
213
|
|
|
|
150
|
|
|
|
2019 to 2026
|
|
|
|
2.920% to 4.180%
|
|
|
Bond
|
|
|
SEK
|
|
|
|
95
|
|
|
|
95
|
|
|
|
94
|
|
|
|
2016
|
|
|
|
3.625%
|
|
|
Current portion (less than one year)
|
|
|
|
|
|
|
(4,164
|
)
|
|
|
(4,068
|
)
|
|
|
(4,545
|
)
|
|
|
|
|
|
|
|
|
|
Total Principal Financing Entities
(a)+(b)+(c)
|
|
|
|
|
|
|
32,537
|
|
|
|
35,860
|
|
|
|
25,267
|
|
|
|
|
|
|
|
|
|
|
Total S.A.
(d)
|
|
|
|
1,200
|
|
|
|
—
|
|
|
|
—
|
|
|
|
2022
|
|
|
|
0.500
|
%
|
|
Other Consolidated Subsidiaries
|
|
|
|
698
|
|
|
|
698
|
|
|
|
698
|
|
|
|
|
|
|
|
|
|
|
Total bonds after fair value hedge
|
|
|
|
34,435
|
|
|
|
36,558
|
|
|
|
25,965
|
|
|
|
|
|
|
|
|
|
|
|
|
|
|
|
|
|
|
|
|
|
|
|
|
|
|
|
|
|
|
|
|
|
|
|
Bonds after cash flow hedge and
fixed rate bonds (M$)
|
|
Currency of
issuance
|
|
|
Fair value
after hedging
as of
December 31,
2015
|
|
|
Fair value
after hedging
as of
December 31,
2014
|
|
|
Fair value
after hedging
as of
December 31,
2013
|
|
|
Range of
current
maturities
|
|
|
Range of initial current rate
before hedging
instruments
|
|
|
Bond
|
|
|
EUR
|
|
|
|
2,077
|
|
|
|
1,986
|
|
|
|
2,007
|
|
|
|
2019 to 2024
|
|
|
|
4.875% to 5.125%
|
|
|
Bond
|
|
|
USD
|
|
|
|
3,750
|
|
|
|
3,750
|
|
|
|
3,749
|
|
|
|
2020 to 2023
|
|
|
|
2.750% to 4.450%
|
|
|
Bond
|
|
|
CNY
|
|
|
|
164
|
|
|
|
172
|
|
|
|
177
|
|
|
|
2018
|
|
|
|
3.750%
|
|
|
Current portion (less than one year)
|
|
|
|
|
|
|
—
|
|
|
|
—
|
|
|
|
—
|
|
|
|
|
|
|
|
|
|
|
Total Principal Financing Entities
(a)+(b)+(c)
|
|
|
|
|
|
|
5,991
|
|
|
|
5,908
|
|
|
|
5,933
|
|
|
|
|
|
|
|
|
|
|
Other Consolidated Subsidiaries
|
|
|
|
|
|
|
503
|
|
|
|
247
|
|
|
|
146
|
|
|
|
|
|
|
|
|
|
|
Total bonds after cash flow hedge and fixed rate bonds
|
|
|
|
|
|
|
6,494
|
|
|
|
6,155
|
|
|
|
6,079
|
|
|
|
|
|
|
|
|
|
All debt
securities issued through the following subsidiaries are fully and unconditionally guaranteed by TOTAL S.A. as to payment of principal, premium, if any, interest and any other amounts due:
|
(a)
|
TOTAL CAPITAL is a wholly-owned subsidiary of TOTAL S.A. It acts as a financing vehicle for the Group.
|
|
(b)
|
TOTAL CAPITAL CANADA Ltd. is a wholly-owned subsidiary of TOTAL S.A. It acts as a financing vehicle for the activities of the Group in Canada.
|
|
(c)
|
TOTAL CAPITAL INTERNATIONAL is a wholly-owned subsidiary of TOTAL S.A. It acts as a financing vehicle for the Group.
|
|
(d)
|
New debt financing of $1.2 billion through a structure combining the issue of cash-settled convertible bonds with the purchase of cash-settled call options to
hedge Total’s exposure to the exercise of the conversion rights under the bonds.
|
Loan repayment schedule (excluding
current portion)
|
|
|
|
|
|
|
|
|
|
|
|
|
|
|
|
|
|
|
|
|
|
|
As of December 31, 2015 (M$)
|
|
Non-current financial
debt
|
|
|
of which hedging
instruments of
non-current financial
debt (liabilities)
|
|
|
Hedging instruments
of non-current
financial debt (assets)
|
|
|
Non-current financial
debt – net of hedging
instruments
|
|
|
%
|
|
|
2017
|
|
|
4,729
|
|
|
|
213
|
|
|
|
(127
|
)
|
|
|
4,602
|
|
|
|
11%
|
|
|
2018
|
|
|
4,803
|
|
|
|
218
|
|
|
|
(383
|
)
|
|
|
4,420
|
|
|
|
10%
|
|
|
2019
|
|
|
5,716
|
|
|
|
124
|
|
|
|
(174
|
)
|
|
|
5,542
|
|
|
|
13%
|
|
|
2020
|
|
|
4,965
|
|
|
|
434
|
|
|
|
—
|
|
|
|
4,965
|
|
|
|
11%
|
|
|
2021 and beyond
|
|
|
24,251
|
|
|
|
1,902
|
|
|
|
(535
|
)
|
|
|
23,716
|
|
|
|
55%
|
|
|
Total
|
|
|
44,464
|
|
|
|
2,891
|
|
|
|
(1,219
|
)
|
|
|
43,245
|
|
|
|
100%
|
|
|
|
|
|
|
F-48
|
|
TOTAL S.A. Form 20-F 2015
|
Note 20 – Notes to the Consolidated Financial Statements
|
|
|
|
|
|
|
|
|
|
|
|
|
|
|
|
|
|
|
|
|
|
|
As of
December 31, 2014 (M$)
|
|
Non-current financial
debt
|
|
|
of which hedging
instruments of
non-current
financial
debt (liabilities)
|
|
|
Hedging instruments
of non-current
financial debt (assets)
|
|
|
Non-current financial
debt – net of hedging
instruments
|
|
|
%
|
|
|
2016
|
|
|
4,987
|
|
|
|
73
|
|
|
|
(194
|
)
|
|
|
4,793
|
|
|
|
11%
|
|
|
2017
|
|
|
4,689
|
|
|
|
132
|
|
|
|
(142
|
)
|
|
|
4,547
|
|
|
|
10%
|
|
|
2018
|
|
|
4,784
|
|
|
|
108
|
|
|
|
(333
|
)
|
|
|
4,451
|
|
|
|
10%
|
|
|
2019
|
|
|
4,973
|
|
|
|
62
|
|
|
|
(208
|
)
|
|
|
4,765
|
|
|
|
11%
|
|
|
2020 and beyond
|
|
|
26,048
|
|
|
|
569
|
|
|
|
(442
|
)
|
|
|
25,606
|
|
|
|
58%
|
|
|
Total
|
|
|
45,481
|
|
|
|
944
|
|
|
|
(1,319
|
)
|
|
|
44,162
|
|
|
|
100%
|
|
|
|
|
|
|
|
|
|
As of
December 31, 2013 (M$)
|
|
Non-current financial
debt
|
|
|
of which hedging
instruments of
non-current
financial
debt (liabilities)
|
|
|
Hedging instruments
of non-current
financial debt (assets)
|
|
|
Non-current financial
debt – net of hedging
instruments
|
|
|
%
|
|
|
2015
|
|
|
4,999
|
|
|
|
4
|
|
|
|
(352
|
)
|
|
|
4,647
|
|
|
|
14%
|
|
|
2016
|
|
|
4,745
|
|
|
|
26
|
|
|
|
(217
|
)
|
|
|
4,528
|
|
|
|
14%
|
|
|
2017
|
|
|
4,267
|
|
|
|
77
|
|
|
|
(108
|
)
|
|
|
4,159
|
|
|
|
12%
|
|
|
2018
|
|
|
4,670
|
|
|
|
51
|
|
|
|
(309
|
)
|
|
|
4,361
|
|
|
|
13%
|
|
|
2019 and beyond
|
|
|
15,893
|
|
|
|
167
|
|
|
|
(432
|
)
|
|
|
15,461
|
|
|
|
47%
|
|
|
Total
|
|
|
34,574
|
|
|
|
325
|
|
|
|
(1,418
|
)
|
|
|
33,156
|
|
|
|
100%
|
|
Analysis by currency and interest rate
These analyses take into account interest rate and foreign currency swaps to hedge non-current financial debt.
|
|
|
|
|
|
|
|
|
|
|
|
|
|
|
|
|
|
|
|
|
|
|
|
|
|
|
As of December 31, (M$)
|
|
2015
|
|
|
%
|
|
|
2014
|
|
|
%
|
|
|
2013
|
|
|
%
|
|
|
U.S. Dollar
|
|
|
40,337
|
|
|
|
93%
|
|
|
|
41,369
|
|
|
|
94%
|
|
|
|
27,908
|
|
|
|
84%
|
|
|
Euro
|
|
|
1,681
|
|
|
|
4%
|
|
|
|
2,428
|
|
|
|
5%
|
|
|
|
4,885
|
|
|
|
15%
|
|
|
Norwegian krone
|
|
|
907
|
|
|
|
2%
|
|
|
|
—
|
|
|
|
0%
|
|
|
|
—
|
|
|
|
0%
|
|
|
Other currencies
|
|
|
320
|
|
|
|
1%
|
|
|
|
365
|
|
|
|
1%
|
|
|
|
363
|
|
|
|
1%
|
|
|
Total
|
|
|
43,245
|
|
|
|
100%
|
|
|
|
44,162
|
|
|
|
100%
|
|
|
|
33,156
|
|
|
|
100%
|
|
|
|
|
|
|
|
|
|
|
|
|
|
|
|
|
|
|
|
|
|
|
|
|
|
|
|
|
As of December 31, (M$)
|
|
2015
|
|
|
%
|
|
|
2014
|
|
|
%
|
|
|
2013
|
|
|
%
|
|
|
Fixed rate
|
|
|
7,666
|
|
|
|
18%
|
|
|
|
6,944
|
|
|
|
16%
|
|
|
|
6,771
|
|
|
|
20%
|
|
|
Floating rate
|
|
|
35,579
|
|
|
|
82%
|
|
|
|
37,218
|
|
|
|
84%
|
|
|
|
26,385
|
|
|
|
80%
|
|
|
Total
|
|
|
43,245
|
|
|
|
100%
|
|
|
|
44,162
|
|
|
|
100%
|
|
|
|
33,156
|
|
|
|
100%
|
|
B) Current financial assets and liabilities
Current borrowings consist mainly of commercial paper or treasury bills or drawings on bank loans. These instruments bear interest at rates that are close to market rates.
|
|
|
|
|
|
|
|
|
|
|
|
|
|
|
As of December 31, (M$)
|
|
2015
|
|
|
2014
|
|
|
2013
|
|
|
(Assets) / Liabilities
|
|
|
|
|
|
|
|
|
|
|
|
|
|
Current financial debt
(a)
|
|
|
7,836
|
|
|
|
6,164
|
|
|
|
5,780
|
|
|
Current portion of non-current financial debt
|
|
|
4,652
|
|
|
|
4,778
|
|
|
|
5,413
|
|
|
Current borrowings
(Note 28)
|
|
|
12,488
|
|
|
|
10,942
|
|
|
|
11,193
|
|
|
Current portion of hedging instruments of debt (liabilities)
|
|
|
127
|
|
|
|
133
|
|
|
|
314
|
|
|
Other current financial instruments (liabilities)
|
|
|
44
|
|
|
|
47
|
|
|
|
67
|
|
|
Other current financial liabilities
(Note 28)
|
|
|
171
|
|
|
|
180
|
|
|
|
381
|
|
|
Current deposits beyond three months
|
|
|
(5,858
|
)
|
|
|
(469
|
)
|
|
|
(161
|
)
|
|
Current portion of hedging instruments of debt (assets)
|
|
|
(220
|
)
|
|
|
(460
|
)
|
|
|
(469
|
)
|
|
Other current financial instruments (assets)
|
|
|
(112
|
)
|
|
|
(364
|
)
|
|
|
(109
|
)
|
|
Current financial assets
(Note 28)
|
|
|
(6,190
|
)
|
|
|
(1,293
|
)
|
|
|
(739
|
)
|
|
Current borrowings and related financial assets and liabilities, net
|
|
|
6,469
|
|
|
|
9,829
|
|
|
|
10,835
|
|
|
(a)
|
As of December 31, 2015, December 31, 2014 and December 31, 2013, the current financial debt includes a commercial paper program in Total
Capital Canada Ltd. Total Capital Canada Ltd. is a wholly-owned subsidiary of TOTAL S.A. It acts as a financing vehicle for the activities of the Group in Canada. Its debt securities are fully and unconditionally guaranteed by TOTAL S.A. as to
payment of principal, premium, if any, interest and any other amounts due.
|
C) Net-debt-to-equity ratio
For its internal and external communication needs, the Group calculates a debt ratio by dividing its net financial debt by equity. Adjusted shareholders’
equity for the year ended December 31, 2015 is calculated after payment of a dividend of
€
2.44 per share, subject to approval by
the shareholders’ meeting on May 24, 2016.
|
|
|
|
|
2015 Form 20-F TOTAL S.A.
|
|
F-49
|
Notes to the Consolidated Financial Statements – Notes 21 to 22
The net-debt-to-equity ratio is calculated as follows:
|
|
|
|
|
|
|
|
|
|
|
|
|
|
|
As of December 31, (M$)
|
|
2015
|
|
|
2014
|
|
|
2013
|
|
|
(Assets) / Liabilities
|
|
|
|
|
|
|
|
|
|
|
|
|
|
Current borrowings
|
|
|
12,488
|
|
|
|
10,942
|
|
|
|
11,193
|
|
|
Other current financial liabilities
|
|
|
171
|
|
|
|
180
|
|
|
|
381
|
|
|
Current financial assets
|
|
|
(6,190
|
)
|
|
|
(1,293
|
)
|
|
|
(739
|
)
|
|
Net financial assets and liabilities held for sale or exchange
|
|
|
141
|
|
|
|
(56
|
)
|
|
|
(179
|
)
|
|
Non-current financial debt
|
|
|
44,464
|
|
|
|
45,481
|
|
|
|
34,574
|
|
|
Hedging instruments on non-current financial debt
|
|
|
(1,219
|
)
|
|
|
(1,319
|
)
|
|
|
(1,418
|
)
|
|
Cash and cash equivalents
|
|
|
(23,269
|
)
|
|
|
(25,181
|
)
|
|
|
(20,200
|
)
|
|
Net financial debt
|
|
|
26,586
|
|
|
|
28,754
|
|
|
|
23,612
|
|
|
Shareholders’ equity — Group share
|
|
|
92,494
|
|
|
|
90,330
|
|
|
|
100,241
|
|
|
Distribution of the income based on existing shares at the closing date
|
|
|
(1,545
|
)
|
|
|
(1,686
|
)
|
|
|
(1,908
|
)
|
|
Non-controlling interests
|
|
|
2,915
|
|
|
|
3,201
|
|
|
|
3,138
|
|
|
Adjusted shareholders’ equity
|
|
|
93,864
|
|
|
|
91,845
|
|
|
|
101,471
|
|
|
Net-debt-to-equity ratio
|
|
|
28.3%
|
|
|
|
31.3%
|
|
|
|
23.3%
|
|
21)
Other creditors and accrued liabilities
|
|
|
|
|
|
|
|
|
|
|
|
|
|
|
As of December 31, (M$)
|
|
2015
|
|
|
2014
|
|
|
2013
|
|
|
Accruals and deferred income
|
|
|
342
|
|
|
|
469
|
|
|
|
299
|
|
|
Payable to States (including taxes and duties)
|
|
|
5,363
|
|
|
|
6,894
|
|
|
|
8,885
|
|
|
Payroll
|
|
|
1,265
|
|
|
|
1,343
|
|
|
|
1,573
|
|
|
Other operating liabilities
|
|
|
9,914
|
|
|
|
7,935
|
|
|
|
8,191
|
|
|
Total
|
|
|
16,884
|
|
|
|
16,641
|
|
|
|
18,948
|
|
As of December 31, 2015, the heading “Other operating liabilities” includes mainly the second quarterly interim
dividend for the fiscal year 2015 for $1,560 million, which will be paid in January 2016 and the third quarterly interim dividend for the fiscal year 2015 for $1,584 million, which will be paid in March 2016.
As of December 31, 2014, the heading “Other operating liabilities” includes mainly the third quarterly interim dividend for the fiscal year 2014 for
$1,718 million. This interim dividend was paid in March 2015.
As of December 31, 2013, the heading “Other operating liabilities” includes
mainly the third quarterly interim dividend for the fiscal year 2013 for $1,877 million. This interim dividend was paid in March 2014.
22)
Lease
contracts
The Group leases real estate, retail stations, ships, and other equipment (see Note 11 to the Consolidated Financial Statements).
The future minimum lease payments on operating and finance leases to which the Group is committed are as follows:
|
|
|
|
|
|
|
|
|
|
|
For the year ended
December 31, 2015 (M$)
|
|
Operating
leases
|
|
|
Finance
leases
|
|
|
2016
|
|
|
1,430
|
|
|
|
57
|
|
|
2017
|
|
|
1,049
|
|
|
|
23
|
|
|
2018
|
|
|
784
|
|
|
|
23
|
|
|
2019
|
|
|
550
|
|
|
|
23
|
|
|
2020
|
|
|
442
|
|
|
|
23
|
|
|
2021 and beyond
|
|
|
1,718
|
|
|
|
242
|
|
|
Total minimum payments
|
|
|
5,973
|
|
|
|
391
|
|
|
Less financial expenses
|
|
|
|
|
|
|
(55
|
)
|
|
Nominal value of contracts
|
|
|
|
|
|
|
336
|
|
|
Less current portion of finance lease contracts
|
|
|
|
|
|
|
(41
|
)
|
|
Outstanding liability of finance lease contracts
|
|
|
|
|
|
|
295
|
|
|
|
|
|
|
F-50
|
|
TOTAL S.A. Form 20-F 2015
|
Note 23 – Notes to the Consolidated Financial Statements
|
|
|
|
|
|
|
|
|
|
|
For the year ended
December 31, 2014 (M$)
|
|
Operating
leases
|
|
|
Finance
leases
|
|
|
2015
|
|
|
1,218
|
|
|
|
61
|
|
|
2016
|
|
|
978
|
|
|
|
58
|
|
|
2017
|
|
|
768
|
|
|
|
19
|
|
|
2018
|
|
|
590
|
|
|
|
19
|
|
|
2019
|
|
|
391
|
|
|
|
19
|
|
|
2020 and beyond
|
|
|
1,675
|
|
|
|
260
|
|
|
Total minimum payments
|
|
|
5,620
|
|
|
|
436
|
|
|
Less financial expenses
|
|
|
|
|
|
|
(78
|
)
|
|
Nominal value of contracts
|
|
|
|
|
|
|
358
|
|
|
Less current portion of finance lease contracts
|
|
|
|
|
|
|
(40
|
)
|
|
Outstanding liability of finance lease contracts
|
|
|
|
|
|
|
318
|
|
|
|
|
|
|
|
|
|
|
|
|
For the year ended
December 31, 2013 (M$)
|
|
Operating
leases
|
|
|
Finance
leases
|
|
|
2014
|
|
|
1,113
|
|
|
|
72
|
|
|
2015
|
|
|
906
|
|
|
|
70
|
|
|
2016
|
|
|
827
|
|
|
|
66
|
|
|
2017
|
|
|
633
|
|
|
|
23
|
|
|
2018
|
|
|
498
|
|
|
|
23
|
|
|
2019 and beyond
|
|
|
1,619
|
|
|
|
285
|
|
|
Total minimum payments
|
|
|
5,596
|
|
|
|
539
|
|
|
Less financial expenses
|
|
|
|
|
|
|
(113
|
)
|
|
Nominal value of contracts
|
|
|
|
|
|
|
426
|
|
|
Less current portion of finance lease contracts
|
|
|
|
|
|
|
(40
|
)
|
|
Outstanding liability of finance lease contracts
|
|
|
|
|
|
|
386
|
|
Net rental expense incurred under operating leases for the year ended December 31, 2015 is $1,282 million (against $1,091
million in 2014 and $1,126 million in 2013).
23)
Commitments and contingencies
|
|
|
|
|
|
|
|
|
|
|
|
|
|
|
|
|
|
|
|
|
Maturity and installments
|
|
|
As of December 31, 2015
(M$)
|
|
Total
|
|
|
Less than
1 year
|
|
|
Between 1
and 5 years
|
|
|
More than
5 years
|
|
|
Non-current debt obligations net of hedging instruments
(Note 20)
|
|
|
42,950
|
|
|
|
—
|
|
|
|
19,448
|
|
|
|
23,502
|
|
|
Current portion of non-current debt obligations net of hedging instruments
(Note 20)
|
|
|
4,518
|
|
|
|
4,518
|
|
|
|
—
|
|
|
|
—
|
|
|
Finance lease obligations
(Note 22)
|
|
|
336
|
|
|
|
41
|
|
|
|
81
|
|
|
|
214
|
|
|
Asset retirement obligations
(Note 19)
|
|
|
13,314
|
|
|
|
707
|
|
|
|
2,117
|
|
|
|
10,490
|
|
|
Contractual obligations recorded in the balance sheet
|
|
|
61,118
|
|
|
|
5,266
|
|
|
|
21,646
|
|
|
|
34,206
|
|
|
Operating lease obligations
(Note 22)
|
|
|
5,973
|
|
|
|
1,430
|
|
|
|
2,825
|
|
|
|
1,718
|
|
|
Purchase obligations
|
|
|
123,968
|
|
|
|
14,728
|
|
|
|
24,612
|
|
|
|
84,628
|
|
|
Contractual obligations not recorded in the balance sheet
|
|
|
129,941
|
|
|
|
16,158
|
|
|
|
27,437
|
|
|
|
86,346
|
|
|
Total of contractual obligations
|
|
|
191,059
|
|
|
|
21,424
|
|
|
|
49,083
|
|
|
|
120,552
|
|
|
Guarantees given for excise taxes
|
|
|
2,982
|
|
|
|
2,604
|
|
|
|
57
|
|
|
|
321
|
|
|
Guarantees given against borrowings
|
|
|
12,872
|
|
|
|
3,553
|
|
|
|
547
|
|
|
|
8,772
|
|
|
Indemnities related to sales of businesses
|
|
|
371
|
|
|
|
109
|
|
|
|
103
|
|
|
|
159
|
|
|
Guarantees of current liabilities
|
|
|
501
|
|
|
|
102
|
|
|
|
229
|
|
|
|
170
|
|
|
Guarantees to customers / suppliers
|
|
|
4,405
|
|
|
|
1,364
|
|
|
|
194
|
|
|
|
2,847
|
|
|
Letters of credit
|
|
|
1,081
|
|
|
|
785
|
|
|
|
45
|
|
|
|
251
|
|
|
Other operating commitments
|
|
|
3,655
|
|
|
|
1,586
|
|
|
|
248
|
|
|
|
1,821
|
|
|
Total of other commitments given
|
|
|
25,867
|
|
|
|
10,103
|
|
|
|
1,423
|
|
|
|
14,341
|
|
|
Mortgages and liens received
|
|
|
359
|
|
|
|
23
|
|
|
|
7
|
|
|
|
329
|
|
|
Sales obligations
|
|
|
72,278
|
|
|
|
7,889
|
|
|
|
24,589
|
|
|
|
39,800
|
|
|
Other commitments received
|
|
|
7,158
|
|
|
|
2,602
|
|
|
|
1,601
|
|
|
|
2,955
|
|
|
Total of commitments received
|
|
|
79,795
|
|
|
|
10,514
|
|
|
|
26,197
|
|
|
|
43,084
|
|
|
Of which commitments given relating to joint ventures
|
|
|
46,178
|
|
|
|
544
|
|
|
|
2,925
|
|
|
|
42,709
|
|
|
|
|
|
|
2015 Form 20-F TOTAL S.A.
|
|
F-51
|
Notes to the Consolidated Financial Statements – Note 23
|
|
|
|
|
|
|
|
|
|
|
|
|
|
|
|
|
|
|
|
|
Maturity and installments
|
|
|
As of December 31, 2014
(M$)
|
|
Total
|
|
|
Less than
1 year
|
|
|
Between 1
and 5 years
|
|
|
More than
5 years
|
|
|
Non-current debt obligations net of hedging instruments
(Note 20)
|
|
|
43,844
|
|
|
|
—
|
|
|
|
18,458
|
|
|
|
25,386
|
|
|
Current portion of non-current debt obligations net of hedging instruments
(Note 20)
|
|
|
4,411
|
|
|
|
4,411
|
|
|
|
—
|
|
|
|
—
|
|
|
Finance lease obligations
(Note 22)
|
|
|
358
|
|
|
|
40
|
|
|
|
98
|
|
|
|
220
|
|
|
Asset retirement obligations
(Note 19)
|
|
|
13,121
|
|
|
|
651
|
|
|
|
2,430
|
|
|
|
10,040
|
|
|
Contractual obligations recorded in the balance sheet
|
|
|
61,734
|
|
|
|
5,102
|
|
|
|
20,986
|
|
|
|
35,646
|
|
|
Operating lease obligations
(Note 22)
|
|
|
5,620
|
|
|
|
1,218
|
|
|
|
2,727
|
|
|
|
1,675
|
|
|
Purchase obligations
|
|
|
160,837
|
|
|
|
19,987
|
|
|
|
33,908
|
|
|
|
106,942
|
|
|
Contractual obligations not recorded in the balance sheet
|
|
|
166,457
|
|
|
|
21,205
|
|
|
|
36,635
|
|
|
|
108,617
|
|
|
Total of contractual obligations
|
|
|
228,191
|
|
|
|
26,307
|
|
|
|
57,621
|
|
|
|
144,263
|
|
|
Guarantees given for excise taxes
|
|
|
2,382
|
|
|
|
1,855
|
|
|
|
91
|
|
|
|
436
|
|
|
Guarantees given against borrowings
|
|
|
10,192
|
|
|
|
140
|
|
|
|
3,784
|
|
|
|
6,268
|
|
|
Indemnities related to sales of businesses
|
|
|
396
|
|
|
|
121
|
|
|
|
110
|
|
|
|
165
|
|
|
Guarantees of current liabilities
|
|
|
635
|
|
|
|
144
|
|
|
|
165
|
|
|
|
326
|
|
|
Guarantees to customers / suppliers
|
|
|
5,599
|
|
|
|
2,564
|
|
|
|
168
|
|
|
|
2,867
|
|
|
Letters of credit
|
|
|
1,552
|
|
|
|
1,138
|
|
|
|
3
|
|
|
|
411
|
|
|
Other operating commitments
|
|
|
4,762
|
|
|
|
1,455
|
|
|
|
2,700
|
|
|
|
607
|
|
|
Total of other commitments given
|
|
|
25,518
|
|
|
|
7,417
|
|
|
|
7,021
|
|
|
|
11,080
|
|
|
Mortgages and liens received
|
|
|
418
|
|
|
|
17
|
|
|
|
4
|
|
|
|
397
|
|
|
Sales obligations
|
|
|
110,949
|
|
|
|
9,287
|
|
|
|
33,629
|
|
|
|
68,033
|
|
|
Other commitments received
|
|
|
7,081
|
|
|
|
3,321
|
|
|
|
1,388
|
|
|
|
2,372
|
|
|
Total of commitments received
|
|
|
118,448
|
|
|
|
12,625
|
|
|
|
35,021
|
|
|
|
70,802
|
|
|
Of which commitments given relating to joint ventures
|
|
|
57,439
|
|
|
|
298
|
|
|
|
1,915
|
|
|
|
55,226
|
|
|
|
|
|
|
|
|
|
|
|
|
|
|
|
|
|
|
|
|
|
|
Maturity and installments
|
|
|
As of December 31, 2013
(M$)
|
|
Total
|
|
|
Less than
1 year
|
|
|
Between 1
and 5 years
|
|
|
More than
5 years
|
|
|
Non-current debt obligations net of hedging instruments
(Note 20)
|
|
|
32,770
|
|
|
|
—
|
|
|
|
17,545
|
|
|
|
15,225
|
|
|
Current portion of non-current debt obligations net of hedging instruments
(Note 20)
|
|
|
5,218
|
|
|
|
5,218
|
|
|
|
—
|
|
|
|
—
|
|
|
Finance lease obligations
(Note 22)
|
|
|
426
|
|
|
|
40
|
|
|
|
150
|
|
|
|
236
|
|
|
Asset retirement obligations
(Note 19)
|
|
|
12,808
|
|
|
|
735
|
|
|
|
2,368
|
|
|
|
9,705
|
|
|
Contractual obligations recorded in the balance sheet
|
|
|
51,222
|
|
|
|
5,993
|
|
|
|
20,063
|
|
|
|
25,166
|
|
|
Operating lease obligations
(Note 22)
|
|
|
5,596
|
|
|
|
1,113
|
|
|
|
2,864
|
|
|
|
1,619
|
|
|
Purchase obligations
|
|
|
118,982
|
|
|
|
20,060
|
|
|
|
34,013
|
|
|
|
64,909
|
|
|
Contractual obligations not recorded in the balance sheet
|
|
|
124,578
|
|
|
|
21,173
|
|
|
|
36,877
|
|
|
|
66,528
|
|
|
Total of contractual obligations
|
|
|
175,800
|
|
|
|
27,166
|
|
|
|
56,940
|
|
|
|
91,694
|
|
|
Guarantees given for excise taxes
|
|
|
2,444
|
|
|
|
2,048
|
|
|
|
102
|
|
|
|
294
|
|
|
Guarantees given against borrowings
|
|
|
8,276
|
|
|
|
110
|
|
|
|
3,706
|
|
|
|
4,460
|
|
|
Indemnities related to sales of businesses
|
|
|
320
|
|
|
|
7
|
|
|
|
135
|
|
|
|
178
|
|
|
Guarantees of current liabilities
|
|
|
724
|
|
|
|
123
|
|
|
|
233
|
|
|
|
368
|
|
|
Guarantees to customers / suppliers
|
|
|
4,865
|
|
|
|
2,120
|
|
|
|
190
|
|
|
|
2,555
|
|
|
Letters of credit
|
|
|
2,360
|
|
|
|
1,863
|
|
|
|
225
|
|
|
|
272
|
|
|
Other operating commitments
|
|
|
4,197
|
|
|
|
1,364
|
|
|
|
960
|
|
|
|
1,873
|
|
|
Total of other commitments given
|
|
|
23,186
|
|
|
|
7,635
|
|
|
|
5,551
|
|
|
|
10,000
|
|
|
Mortgages and liens received
|
|
|
389
|
|
|
|
21
|
|
|
|
1
|
|
|
|
367
|
|
|
Sales obligations
|
|
|
135,463
|
|
|
|
10,515
|
|
|
|
38,702
|
|
|
|
86,246
|
|
|
Other commitments received
|
|
|
8,193
|
|
|
|
4,428
|
|
|
|
1,750
|
|
|
|
2,015
|
|
|
Total of commitments received
|
|
|
144,045
|
|
|
|
14,964
|
|
|
|
40,453
|
|
|
|
88,628
|
|
|
Of which commitments given relating to joint ventures
|
|
|
11,151
|
|
|
|
98
|
|
|
|
553
|
|
|
|
10,500
|
|
|
A.
|
Contractual obligations
|
Debt obligations
“Non-current debt obligations” are included in the items “Non-current financial debt” and “Hedging instruments of
non-current financial debt” of the Consolidated Balance Sheet. It includes the non-current portion of swaps hedging bonds, and excludes non-current finance lease obligations of $295 million.
The current portion of non-current debt is included in the items “Current borrowings”, “Current
financial assets” and “Other current financial liabilities” of the Consolidated Balance Sheet. It includes the current portion of swaps hedging bonds, and excludes the current portion of finance lease obligations of $41 million.
The information regarding contractual obligations linked to indebtedness is presented in Note 20 to the Consolidated Financial Statements.
|
|
|
|
|
F-52
|
|
TOTAL S.A. Form 20-F 2015
|
Note 24 – Notes to the Consolidated Financial Statements
Lease contracts
The information regarding operating and finance leases is presented in Note 22 to the Consolidated Financial Statements.
Asset retirement obligations
This item represents the discounted present value of Upstream asset
retirement obligations, primarily asset removal costs at the completion date. The information regarding contractual obligations linked to asset retirement obligations is presented in Notes 1Q and 19 to the Consolidated Financial Statements.
Purchase obligations
Purchase obligations
are obligations under contractual agreements to purchase goods or services, including capital projects. These obligations are enforceable and legally binding on the company and specify all significant terms, including the amount and the timing of
the payments.
These obligations mainly include: unconditional hydrocarbon purchase contracts (except where an active, highly-liquid market exists and
when the hydrocarbons are expected to be re-sold shortly after purchase), reservation of transport capacities in pipelines, unconditional exploration works and development works in the Upstream segment, and contracts for capital investment projects
in the Refining & Chemicals segment.
|
B.
|
Other commitments given
|
Guarantees given for
excise taxes
These consist of guarantees given by the Group to customs authorities in order to guarantee the payments of taxes and excise duties
on the importation of oil and gas products, mostly in France.
Guarantees given against borrowings
The Group guarantees bank debt and finance lease obligations of certain non-consolidated subsidiaries and equity affiliates. Maturity dates vary, and guarantees
will terminate on payment and/or cancellation of the obligation. A payment would be triggered by failure of the guaranteed party to fulfill its obligation covered by the guarantee, and no assets are held as collateral for these guarantees. As of
December 31, 2015, the maturities of these guarantees are up to 2028.
Guarantees given against borrowings include the guarantee given in 2008 by
TOTAL S.A. in connection with the financing of the Yemen LNG project for an amount of $551 million.
In 2010, TOTAL S.A. provided guarantees in connection with the financing of the Jubail project (operated by SAUDI
ARAMCO TOTAL Refining and Petrochemical Company (SATORP)) of up to $3,188 million, proportional to TOTAL’s share in the project (37.5%). In addition, in 2015, TOTAL S.A has confirmed and extended guarantees for TOTAL Refining SAUDI ARABIA SAS
shareholders’ advances for an amount of $1,013 million.
As of December 31, 2015, the guarantees provided by TOTAL S.A. in connection with the
financing of the Ichthys LNG project amounted to $6,580 million.
Indemnities related to sales of businesses
In the ordinary course of business, the Group executes contracts involving standard indemnities for the oil industry and indemnities specific to transactions such
as sales of businesses. These indemnities might include claims against any of the following: environmental, tax and shareholder matters, intellectual property rights, governmental regulations and employment-related matters, dealer, supplier, and
other commercial contractual relationships. Performance under these indemnities would generally be triggered by a breach of terms of the contract or by a third party claim. The Group regularly evaluates the probability of having to incur costs
associated with these indemnities.
Other guarantees given
Non-consolidated subsidiaries
The Group also guarantees the current liabilities of certain non-consolidated
subsidiaries. Performance under these guarantees would be triggered by a financial default of the entity.
Operating agreements
As part of normal ongoing business operations and consistent with generally accepted and recognized industry practices, the Group enters into numerous agreements
with other parties. These commitments are often entered into for commercial purposes, for regulatory purposes or for other operating agreements.
Sales obligations
These amounts represent binding obligations under contractual agreements to sell goods, including in particular unconditional hydrocarbon sales
contracts (except where an active, highly-liquid market exists and when the volumes are expected to be re-sold shortly after purchase).
24)
Related parties
The main transactions and receivable and payable balances with related parties (principally non-consolidated subsidiaries and equity consolidated affiliates) are
detailed as follows:
|
|
|
|
|
|
|
|
|
|
|
|
|
|
|
As of December 31, (M$)
|
|
2015
|
|
|
2014
|
|
|
2013
|
|
|
Balance sheet
|
|
|
|
|
|
|
|
|
|
|
|
|
|
Receivables
|
|
|
|
|
|
|
|
|
|
|
|
|
|
Debtors and other debtors
|
|
|
533
|
|
|
|
697
|
|
|
|
845
|
|
|
Loans (excl. loans to equity affiliates)
|
|
|
71
|
|
|
|
155
|
|
|
|
470
|
|
|
Payables
|
|
|
|
|
|
|
|
|
|
|
|
|
|
Creditors and other creditors
|
|
|
835
|
|
|
|
1,199
|
|
|
|
1,208
|
|
|
Debts
|
|
|
10
|
|
|
|
14
|
|
|
|
18
|
|
|
For the year ended December 31, (M$)
|
|
2015
|
|
|
2014
|
|
|
2013
|
|
|
Statement of income
|
|
|
|
|
|
|
|
|
|
|
|
|
|
Sales
|
|
|
3,062
|
|
|
|
4,308
|
|
|
|
5,133
|
|
|
Purchases
|
|
|
6,999
|
|
|
|
9,890
|
|
|
|
7,271
|
|
|
Financial expense
|
|
|
—
|
|
|
|
—
|
|
|
|
—
|
|
|
Financial income
|
|
|
6
|
|
|
|
16
|
|
|
|
139
|
|
|
|
|
|
|
2015 Form 20-F TOTAL S.A.
|
|
F-53
|
Notes to the Consolidated Financial Statements – Note 24
Compensation for the administration and management bodies
The aggregate amount of direct and indirect compensation accounted for by the French and foreign affiliates of the Company, for all executive officers of TOTAL as
of December 31, and for the members of the Board of Directors who are employees of the Group, is detailed below.
The suppression of the Management
Committee in 2015 leads to modify the list of the main Group executive officers previously composed of members of Management Committee and the Treasurer. The main Group executive officers include, effective from 2015, the members of the Executive
Committee and the five directors of the corporate functions members of the Group Performance Management Committee (Communication, Human Resources, Legal, Security, Strategy) and the Group Treasurer.
|
|
|
|
|
|
|
|
|
|
|
|
|
|
|
For the year ended December 31, (M$)
|
|
2015
|
|
|
2014
|
|
|
2013
|
|
|
Number of people
|
|
|
14
|
|
|
|
31
|
|
|
|
31
|
|
|
Direct or indirect compensation
|
|
|
12.8
|
|
|
|
28.3
|
|
|
|
29.4
|
|
|
Pension expenses
(a)
|
|
|
3.9
|
|
|
|
6.8
|
|
|
|
13.3
|
|
|
Other long-term benefits expenses
|
|
|
—
|
|
|
|
—
|
|
|
|
—
|
|
|
Termination benefits expenses
|
|
|
—
|
|
|
|
—
|
|
|
|
—
|
|
|
Share-based payments expense (IFRS 2)
(b)
|
|
|
3.5
|
|
|
|
9.0
|
|
|
|
15.7
|
|
|
(a)
|
The benefits provided for executive officers and certain members of the Board of
Directors, employees and former employees of the Group, include severance to be paid on retirement, supplementary pension schemes and insurance plans, which represent $96.7 million provisioned as of December 31, 2015 (against $233.7 million as
of December 31, 2014 and $260.2 million as of December 31, 2013).
|
|
(b)
|
Share-based payments expense computed for the executive officers and the members of
the Board of Directors who are employees of the Group as described in Note 25 paragraph D to the Consolidated Financial Statements and based on the principles of IFRS 2 “Share-based payments” described in Note 1 paragraph E to the
Consolidated Financial Statements.
|
The compensation allocated to members of the board of directors for directors’ fees
totaled $1.34 million in 2015 (against $1.78 million in 2014 and $1.66 million in 2013).
|
|
|
|
|
F-54
|
|
TOTAL S.A. Form 20-F 2015
|
Note 25 – Notes to the Consolidated Financial Statements
25)
Share-based payments
A. TOTAL share subscription option plans
|
|
|
|
|
|
|
|
|
|
|
|
|
|
|
|
|
|
|
|
|
|
|
|
|
|
|
|
|
|
|
|
|
|
|
|
|
|
|
|
|
2005 Plan
|
|
|
2006 Plan
|
|
|
2007 Plan
|
|
|
2008 Plan
|
|
|
2009 Plan
|
|
|
2010 Plan
|
|
|
2011 Plan
|
|
|
Total
|
|
|
Weighted
average
exercise
price (in
euros)
|
|
|
Date of the shareholders’ meeting
|
|
|
05/14/2004
|
|
|
|
05/14/2004
|
|
|
|
05/11/2007
|
|
|
|
05/11/2007
|
|
|
|
05/11/2007
|
|
|
|
05/21/2010
|
|
|
|
05/21/2010
|
|
|
|
|
|
|
|
|
|
|
Date of the award
(a)
|
|
|
07/19/2005
|
|
|
|
07/18/2006
|
|
|
|
07/17/2007
|
|
|
|
10/09/2008
|
|
|
|
09/15/2009
|
|
|
|
09/14/2010
|
|
|
|
09/14/2011
|
|
|
|
|
|
|
|
|
|
|
Exercise price until May 23, 2006
included (in
euros)
(b)
|
|
|
49.73
|
|
|
|
—
|
|
|
|
—
|
|
|
|
—
|
|
|
|
—
|
|
|
|
—
|
|
|
|
—
|
|
|
|
|
|
|
|
|
|
|
Exercise price since May 24, 2006
(in
euros)
(b)
|
|
|
49.04
|
|
|
|
50.60
|
|
|
|
60.10
|
|
|
|
42.90
|
|
|
|
39.90
|
|
|
|
38.20
|
|
|
|
33.00
|
|
|
|
|
|
|
|
|
|
|
Expiry date
|
|
|
07/19/2013
|
|
|
|
07/18/2014
|
|
|
|
07/17/2015
|
|
|
|
10/09/2016
|
|
|
|
09/15/2017
|
|
|
|
09/14/2018
|
|
|
|
09/14/2019
|
|
|
|
|
|
|
|
|
|
|
Number of options
(c)
|
|
|
|
|
|
|
|
|
|
|
|
|
|
|
|
|
|
|
|
|
|
|
|
|
|
|
|
|
|
|
|
|
|
|
|
|
|
Existing options as of January 1, 2013
|
|
|
6,160,020
|
|
|
|
5,621,526
|
|
|
|
5,848,985
|
|
|
|
4,330,468
|
|
|
|
4,334,900
|
|
|
|
4,661,443
|
|
|
|
1,505,040
|
|
|
|
32,462,382
|
|
|
|
46.96
|
|
|
Granted
|
|
|
—
|
|
|
|
—
|
|
|
|
—
|
|
|
|
—
|
|
|
|
—
|
|
|
|
—
|
|
|
|
—
|
|
|
|
—
|
|
|
|
—
|
|
|
Cancelled
(c)
|
|
|
(6,159,390
|
)
|
|
|
(900
|
)
|
|
|
(1,020
|
)
|
|
|
(360
|
)
|
|
|
(1,080
|
)
|
|
|
(720
|
)
|
|
|
—
|
|
|
|
(6,163,470
|
)
|
|
|
49.04
|
|
|
Exercised
|
|
|
(630
|
)
|
|
|
—
|
|
|
|
—
|
|
|
|
(110,910
|
)
|
|
|
(344,442
|
)
|
|
|
(122,871
|
)
|
|
|
(363,946
|
)
|
|
|
(942,799
|
)
|
|
|
37.37
|
|
|
Existing options as of January 1, 2014
|
|
|
—
|
|
|
|
5,620,626
|
|
|
|
5,847,965
|
|
|
|
4,219,198
|
|
|
|
3,989,378
|
|
|
|
4,537,852
|
|
|
|
1,141,094
|
|
|
|
25,356,113
|
|
|
|
46.82
|
|
|
Granted
|
|
|
—
|
|
|
|
—
|
|
|
|
—
|
|
|
|
—
|
|
|
|
—
|
|
|
|
—
|
|
|
|
—
|
|
|
|
—
|
|
|
|
—
|
|
|
Cancelled
(c)
|
|
|
—
|
|
|
|
(1,797,912
|
)
|
|
|
—
|
|
|
|
—
|
|
|
|
—
|
|
|
|
—
|
|
|
|
—
|
|
|
|
(1,797,912
|
)
|
|
|
50.60
|
|
|
Exercised
|
|
|
—
|
|
|
|
(3,822,714
|
)
|
|
|
—
|
|
|
|
(1,003,314
|
)
|
|
|
(978,109
|
)
|
|
|
(836,634
|
)
|
|
|
(282,019
|
)
|
|
|
(6,922,790
|
)
|
|
|
45.76
|
|
|
Existing options as of January 1, 2015
|
|
|
—
|
|
|
|
—
|
|
|
|
5,847,965
|
|
|
|
3,215,884
|
|
|
|
3,011,269
|
|
|
|
3,701,218
|
|
|
|
859,075
|
|
|
|
16,635,411
|
|
|
|
46.85
|
|
|
Granted
|
|
|
—
|
|
|
|
—
|
|
|
|
—
|
|
|
|
—
|
|
|
|
—
|
|
|
|
—
|
|
|
|
—
|
|
|
|
—
|
|
|
|
—
|
|
|
Cancelled
(c)
|
|
|
—
|
|
|
|
—
|
|
|
|
(5,847,965
|
)
|
|
|
—
|
|
|
|
—
|
|
|
|
—
|
|
|
|
—
|
|
|
|
(5,847,965
|
)
|
|
|
60.10
|
|
|
Exercised
|
|
|
—
|
|
|
|
—
|
|
|
|
—
|
|
|
|
(654,382
|
)
|
|
|
(300,486
|
)
|
|
|
(377,972
|
)
|
|
|
(136,766
|
)
|
|
|
(1,469,606
|
)
|
|
|
40.16
|
|
|
Existing options as of December 31, 2015
|
|
|
—
|
|
|
|
—
|
|
|
|
—
|
|
|
|
2,561,502
|
|
|
|
2,710,783
|
|
|
|
3,323,246
|
|
|
|
722,309
|
|
|
|
9,317,840
|
|
|
|
39.58
|
|
|
(a)
|
The grant date is the date of the Board meeting awarding the share subscription options, except for the grant of October 9, 2008, decided by the Board on
September 9, 2008.
|
|
(b)
|
In order to take into account the four-for-one stock split on May 18, 2006, the exercise prices of TOTAL subscription shares of the plans in force at
that date were multiplied by 0.25 and the number of options awarded, outstanding, canceled or exercised before May 23, 2006 included was multiplied by four. Moreover, following the spin-off of Arkema, the exercise prices of TOTAL subscription
shares of these plans were multiplied by an adjustment factor equal to 0.986147 effective as of May 24, 2006.
|
|
(c)
|
Out of the options canceled in 2013, 2014 and 2015, 6,158,662 options that were not exercised expired on July 19, 2013 due to the expiry of the 2005
Plan, 1,797,912 options that were not exercised expired on July 18, 2014 due to the expiry of the 2006 plan and 5,847,965 options that were not exercised expired on July 17, 2015 due to the expiry of the 2007 plan.
|
Options are exercisable, subject to a continuous employment condition, after a 2-year period from the date of the Board meeting
awarding the options and expire eight years after this date. The underlying shares may not be transferred during four years from the date of grant. For the 2007 to 2011 Plans, the 4-year transfer restriction period does not apply to employees of
non-French subsidiaries as of the date of the grant, who may transfer the underlying shares after a 2-year period from the date of the grant.
Since the
2011 Plan, no new TOTAL share subscription option plan or TOTAL share purchase plan was decided.
|
|
|
|
|
2015 Form 20-F TOTAL S.A.
|
|
F-55
|
Notes to the Consolidated Financial Statements – Note 25
B. TOTAL performance share grants
|
|
|
|
|
|
|
|
|
|
|
|
|
|
|
|
|
|
|
|
|
|
|
|
|
|
|
TOTAL performance share grants
|
|
2011 Plan
|
|
|
2012 Plan
|
|
|
2013 Plan
|
|
|
2014 Plan
|
|
|
Plan 2015
|
|
|
Total
|
|
|
Date of the shareholders’ meeting
|
|
|
05/13/2011
|
|
|
|
05/13/2011
|
|
|
|
05/13/2011
|
|
|
|
05/16/2014
|
|
|
|
05/16/2014
|
|
|
|
|
|
|
Date of the award
|
|
|
09/14/2011
|
|
|
|
07/26/2012
|
|
|
|
07/25/2013
|
|
|
|
07/29/2014
|
|
|
|
07/28/2015
|
|
|
|
|
|
|
Date of the final award (end of the vesting period)
|
|
|
09/15/2013
|
|
|
|
07/27/2014
|
|
|
|
07/26/2016
|
|
|
|
07/30/2017
|
|
|
|
07/29/2018
|
|
|
|
|
|
|
Transfer authorized as from
|
|
|
09/15/2015
|
|
|
|
07/27/2016
|
|
|
|
07/26/2018
|
|
|
|
07/30/2019
|
|
|
|
07/29/2020
|
|
|
|
|
|
|
Number of performance shares
|
|
|
|
|
|
|
|
|
|
|
|
|
|
|
|
|
|
|
|
|
|
|
|
|
|
Outstanding as of January 1, 2013
|
|
|
3,605,806
|
|
|
|
4,295,930
|
|
|
|
—
|
|
|
|
—
|
|
|
|
—
|
|
|
|
7,901,736
|
|
|
Notified
|
|
|
—
|
|
|
|
—
|
|
|
|
4,464,200
|
|
|
|
—
|
|
|
|
—
|
|
|
|
4,464,200
|
|
|
Cancelled
|
|
|
(14,720
|
)
|
|
|
(17,340
|
)
|
|
|
(3,810
|
)
|
|
|
—
|
|
|
|
—
|
|
|
|
(35,870
|
)
|
|
Finally granted
|
|
|
(3,591,086
|
)
|
|
|
(180
|
)
|
|
|
—
|
|
|
|
—
|
|
|
|
—
|
|
|
|
(3,591,266
|
)
|
|
Outstanding as of January 1, 2014
|
|
|
—
|
|
|
|
4,278,410
|
|
|
|
4,460,390
|
|
|
|
—
|
|
|
|
—
|
|
|
|
8,738,800
|
|
|
Notified
|
|
|
—
|
|
|
|
—
|
|
|
|
—
|
|
|
|
4,486,300
|
|
|
|
—
|
|
|
|
4,486,300
|
|
|
Cancelled
|
|
|
—
|
|
|
|
(43,320
|
)
|
|
|
(22,360
|
)
|
|
|
(11,270
|
)
|
|
|
—
|
|
|
|
(76,950
|
)
|
|
Finally granted
|
|
|
—
|
|
|
|
(4,235,090
|
)
|
|
|
(3,570
|
)
|
|
|
—
|
|
|
|
—
|
|
|
|
(4,238,660
|
)
|
|
Outstanding as of January 1, 2015
|
|
|
—
|
|
|
|
—
|
|
|
|
4,434,460
|
|
|
|
4,475,030
|
|
|
|
—
|
|
|
|
8,909,490
|
|
|
Notified
|
|
|
—
|
|
|
|
—
|
|
|
|
—
|
|
|
|
—
|
|
|
|
4,761,935
|
|
|
|
4,761,935
|
|
|
Cancelled
|
|
|
—
|
|
|
|
—
|
|
|
|
(28,230
|
)
|
|
|
(22,630
|
)
|
|
|
(1,430
|
)
|
|
|
(52,290
|
)
|
|
Finally granted
|
|
|
—
|
|
|
|
|
|
|
|
(55,400
|
)
|
|
|
(49,940
|
)
|
|
|
|
|
|
|
(105,340
|
)
|
|
Outstanding as of December 31, 2015
|
|
|
—
|
|
|
|
—
|
|
|
|
4,350,830
|
|
|
|
4,402,460
|
|
|
|
4,760,505
|
|
|
|
13,513,795
|
|
The performance shares, which are bought back by the Company on the market, are finally granted to their
beneficiaries after a 3-year vesting period for the 2013, 2014 and 2015 Plans and a 2-year vesting period for the previous plans, from the date of the grant. The final grant is subject to a continued employment condition and one performance
condition for the 2013 and 2014 Plans and two performance conditions for the 2015 Plan. Moreover, the transfer of the performance shares finally granted will not be permitted until the end of a 2-year holding period from the date of the final grant.
2015 Plan
For the 2015 Plan, the Board of
Directors decided that for senior executives (other than the Chief Executive Officer), the final grant of all shares will be subject to a continued employment condition and two performance conditions. The two performance conditions are the
following:
|
|
•
|
|
For 40% of the shares granted, the acquisition rate is based on the average ROE (Return On Equity) of the Group as published by the Group according to its
consolidated balance sheet and statement of income for fiscal years 2015, 2016 and 2017. The acquisition rate:
|
|
|
•
|
|
Is equal to zero if the average ROE is less than 6.5%
|
|
|
•
|
|
Varies on a straight line basis between 0% and 50% if the average ROE is greater than or equal to 6.5% and less than 9.5%
|
|
|
•
|
|
Varies on a straight line basis between 50% and 100% if the average ROE is greater than or equal to 9.5% and less than 14.5%
|
|
|
•
|
|
Is equal to 100% if the average ROE is greater than or equal to 14.5%
|
|
|
•
|
|
For 60% of the shares granted, the acquisition rate is based on the relative performance of TOTAL’s Adjusted Net Income (ANI) compared to its peers
(ExxonMobil, Chevron, BP and Royal Dutch Shell). The ANI of the Group is calculated on the consolidated financial statements published by the Group for the fiscal years 2013, 2014, 2015, 2016 and 2017. The ANI of the peers are based on estimates
calculated by a pool of top brokers. The acquisition rate:
|
|
|
•
|
|
Is equal to zero if the gap is less than -12%.
|
|
|
•
|
|
Varies on a straight line basis between 0% and 60% if the gap is greater than -12% and less than 0%
|
|
|
•
|
|
Varies on a straight line basis between 60% and 100% if the gap is greater than 0% and less than 12%
|
|
|
•
|
|
Is equal to 100% if the gap is greater than or equal to 12%
|
The Board of Directors also decided that for each beneficiary of more than 150 shares (other than the Chief Executive Officer and the senior executives), and subject to the continuous employment condition, the
shares in excess of this threshold will be subject to the performance conditions described above and will finally be granted if such performance conditions are met.
In addition, concerning the performance shares granted to the Chief Executive Officer, the Board of Directors decided that, subject to a continuous employment condition, the number of the performance shares finally
granted to the Chief Executive Officer under the 2015 plan, would be subject to three performance conditions:
|
|
•
|
|
For 20% of the shares granted, the acquisition rate is based on the average ROE of the Group as published by the Group according to its consolidated balance
sheet and statement of income for fiscal years 2015, 2016 and 2017 and calculated as stated above.
|
|
|
•
|
|
For 20% of the shares granted, the acquisition rate is based on the average of Return on Average Capital Employed (ROACE) as published by the Group according to
its consolidated balance sheet and statement of income for fiscal years 2015, 2016 and 2017. The acquisition rate:
|
|
|
•
|
|
Is equal to zero if the average ROACE is less than 6.5%.
|
|
|
•
|
|
Varies on a straight line basis between 0% and 50% if the average ROACE is greater than or equal to 6.5% and less than or equal to 9%
|
|
|
•
|
|
Varies on a straight line basis between 50% and 100% if the average ROACE is greater than or equal to 9% and less than or equal to 13%
|
|
|
•
|
|
Is equal to 100% if the average ROACE is greater than 13%
|
|
|
|
|
|
F-56
|
|
TOTAL S.A. Form 20-F 2015
|
Note 25 – Notes to the Consolidated Financial Statements
|
|
•
|
|
For 60% of the shares granted, the number of shares is based on the evolution of the ANI (adjusted net income) of TOTAL, compared to a panel of four other oil
and gas companies, as stated above.
|
2013 and 2014 Plans
For the 2013 and 2014 Plans, the Board of Directors decided that for senior executives (other than the former Chairman and Chief Executive Officer), the final grant of all shares will be subject to a continued
employment condition and a performance condition.
The performance condition states that the number of shares finally granted is based on the average ROE
of the Group as published by the Group according to its consolidated balance sheet and statement of income for fiscal years 2013, 2014 and 2015 for the 2013 Plan and for fiscal years 2014, 2015 and 2016 for the 2014 Plan. The acquisition rate:
|
|
•
|
|
is equal to zero if the average ROE is less than or equal to 8%;
|
|
|
•
|
|
varies on a straight-line basis between 0% and 100% if the average ROE is greater than 8% and less than 16%; and
|
|
|
•
|
|
is equal to 100% if the average ROE is greater than or equal to 16%.
|
The Board of Directors also decided that for each beneficiary of more than 100 shares (other than the former Chairman and Chief Executive Officer and the senior executives), and subject to the continuous employment
condition, the shares in excess of this threshold will be subject to the performance condition described above and will be finally granted provided such performance condition is met.
In addition, the Board of Directors had decided that, subject to a continuous employment condition, the number of performance shares finally granted to the former Chairman and Chief Executive Officer would be
subject to two performance conditions:
|
|
•
|
|
For 50% of the shares granted, the performance condition stated that the acquisition rate would have been based on the average ROE of the Group as published by
the Group according to its consolidated balance sheet and statement of income for the three reference fiscal years as defined above.
|
|
|
•
|
|
For 50% of the shares granted, the performance condition stated that the acquisition rate would have been based on the average ROACE of the Group as published by
the Group according to its consolidated balance sheet and statement of income for the three reference fiscal years. The acquisition rate would have been equal to zero if the average ROACE had been less than or equal to 7%; would have varied on a
straight-line basis between 0% and 100% if the average ROACE had been more than 7% and less than 15%; and would have been equal to 100% if the average ROACE had been more than or equal to 15%.
|
C. SunPower plans
SunPower has three stock incentive plans:
the 1996 Stock Plan (“1996 Plan”), the Third Amended and Restated 2005 SunPower Corporation Stock Incentive Plan (“2005 Plan”) and the PowerLight
Corporation Common Stock Option and Common Stock Purchase Plan (“PowerLight Plan”). The PowerLight Plan was assumed by SunPower by way of the acquisition of PowerLight in
fiscal 2007. Under the terms of all three plans, SunPower may issue incentive or non-statutory stock options or stock purchase rights to directors, employees and consultants to purchase common stock. The 2005 Plan was adopted by SunPower’s
Board of Directors in August 2005, and was approved by shareholders in November 2005. The 2005 Plan replaced the 1996 Plan and allows not only for the grant of options, but also for the grant of stock appreciation rights, restricted stock grants,
restricted stock units and other equity rights. The 2005 Plan also allows for tax withholding obligations related to stock option exercises or restricted stock awards to be satisfied through the retention of shares otherwise released upon
vesting. The PowerLight Plan was adopted by PowerLight’s Board of Directors in October 2000.
In May 2008, SunPower’s stockholders
approved an automatic annual increase available for grant under the 2005 Plan, beginning in fiscal 2009. The automatic annual increase is equal to the lower of three percent of the outstanding shares of all classes of SunPower’s common stock
measured on the last day of the immediately preceding fiscal quarter, 6.0 million shares, or such other number of shares as determined by SunPower’s Board of Directors. As of January 3, 2016, approximately 7.2 million shares were
available for grant under the 2005 Plan. In fiscal 2014, SunPower’s Board of Directors voted not to add the three percent annual increase at the beginning of fiscal 2015. In fiscal 2015, SunPower’s Board of Directors voted to reduce the
stock incentive plan’s automatic increase from 3% to 2% for 2016. No new awards are being granted under the 1996 Plan or the PowerLight Plan.
Incentive stock options may be granted at no less than the fair value of the common stock on the date of grant. Non-statutory stock options and stock purchase
rights may be granted at no less than 85% of the fair value of the common stock at the date of grant. The options and rights become exercisable when and as determined by SunPower’s Board of Directors, although these terms generally do not
exceed ten years for stock options. Under the 1996 and 2005 Plans, the options typically vest over five years with a one-year cliff and monthly vesting thereafter. Under the PowerLight Plan, the options typically vest over five years with
yearly cliff vesting. Under the 2005 Plan, the restricted stock grants and restricted stock units typically vest in three equal installments annually over three years.
The majority of shares issued are net of the minimum statutory withholding requirements that SunPower pays on behalf of its employees. During fiscal 2015, 2014, and 2013, SunPower withheld 1,380,891 shares,
1,738,625 shares and 1,329,140 shares, respectively, to satisfy the employees’ tax obligations. SunPower pays such withholding requirements in cash to the appropriate taxing authorities. Shares withheld are treated as common stock repurchases
for accounting and disclosure purposes and reduce the number of shares outstanding upon vesting.
|
|
|
|
|
2015 Form 20-F TOTAL S.A.
|
|
F-57
|
Notes to the Consolidated Financial Statements – Note 25
The following table summarizes SunPower’s stock option activities:
|
|
|
|
|
|
|
|
|
|
|
|
|
|
|
|
|
|
|
|
|
Outstanding Stock Options
|
|
|
|
|
Shares (in
thousands)
|
|
|
Weighted-Average
Exercise Price
Per
Share
(in dollars)
|
|
|
Weighted-Average
Remaining
Contractual Term
(in
years)
|
|
|
Aggregate
Intrinsic Value
(in
thousands
dollars)
|
|
|
Outstanding and exercisable as
of January 3, 2016
|
|
|
151
|
|
|
|
54.04
|
|
|
|
2.19
|
|
|
|
38
|
|
The intrinsic value of options exercised in fiscal 2015, 2014 and 2013 were $1.0 million, $2.4 million, and $0.8
million, respectively. There were no stock options granted in fiscal 2015, 2014 and 2013.
The aggregate intrinsic value in the preceding table
represents the total pre-tax intrinsic value, based on SunPower’s closing stock
price of $30.01 at January 3, 2016 which would have been received by the option holders had all option holders exercised their options as of that date. The total number of in-the-money
options exercisable was 2.6 thousand shares as of January 3, 2016.
The following table summarizes SunPower’s
restricted stock activities:
|
|
|
|
|
|
|
|
|
|
|
|
|
Restricted Stock Awards and Units
|
|
|
|
|
Shares
(in thousands)
|
|
|
Weighted-Average
Grant Date Fair
Value Per
Share
(in dollars)
(a)
|
|
|
Outstanding as of December 30, 2012
|
|
|
8,576
|
|
|
|
8.53
|
|
|
|
|
|
|
|
|
|
|
|
|
Granted
|
|
|
5,607
|
|
|
|
15.88
|
|
|
Vested
(b)
|
|
|
(3,583
|
)
|
|
|
9.48
|
|
|
Forfeited
|
|
|
(1,008
|
)
|
|
|
10.10
|
|
|
|
|
|
|
|
|
|
|
|
|
Outstanding as of December 29, 2013
|
|
|
9,592
|
|
|
|
12.26
|
|
|
|
|
|
|
|
|
|
|
|
|
Granted
|
|
|
2,187
|
|
|
|
31.8
|
|
|
Vested
(b)
|
|
|
(4,432
|
)
|
|
|
11.61
|
|
|
Forfeited
|
|
|
(792
|
)
|
|
|
15.00
|
|
|
|
|
|
|
|
|
|
|
|
|
Outstanding as of December 28, 2014
|
|
|
6,555
|
|
|
|
18.88
|
|
|
|
|
|
|
|
|
|
|
|
|
Granted
|
|
|
2,695
|
|
|
|
29.77
|
|
|
Vested
(b)
|
|
|
(3,560
|
)
|
|
|
15.31
|
|
|
Forfeited
|
|
|
(627
|
)
|
|
|
22.99
|
|
|
|
|
|
|
|
|
|
|
|
|
Outstanding as of January 3, 2016
|
|
|
5,063
|
|
|
|
26.68
|
|
|
(a)
|
SunPower estimates the fair value of the restricted stock unit awards as the stock price on the grant date.
|
|
(b)
|
Restricted stock awards and units vested include shares withheld on behalf of employees to satisfy the minimum statutory tax withholding requirements.
|
D. Share-based payment expense
Share-based payment expense before tax for the year 2015 amounted to $179 million and was broken down as follows:
|
|
•
|
|
$71 million for TOTAL restricted shares plans;
|
|
|
•
|
|
$78 million for SunPower plans;
|
|
|
•
|
|
$30 million for the capital increase reserved for employees (see Note 17).
|
Share-based payment expense before tax for the year 2014 amounted to $194 million and was broken down as follows:
|
|
•
|
|
$114 million for TOTAL restricted shares plans; and
|
|
|
•
|
|
$80 million for SunPower plans.
|
Share-based
payment expense before tax for the year 2013 amounted to $287 million and was broken down as follows:
|
|
•
|
|
$4 million for TOTAL share subscription plans;
|
|
|
•
|
|
$170 million for TOTAL restricted shares plans;
|
|
|
•
|
|
$98 million for SunPower plans;
|
|
|
•
|
|
$14 million for the capital increase reserved for employees (see Note 17).
|
In 2015, 2014 and 2013 no new TOTAL share subscription option plan was decided.
The cost of capital increases reserved for employees is reduced to take into account the non transferability of the
shares that could be subscribed by the employees over a period of five years. The valuation method of non transferability of the shares is based on a strategy cost in two steps consisting, first, in a five years forward sale of the nontransferable
shares, and second, in purchasing the same number of shares in cash with a loan financing reimbursable “in fine”.
The Combined General Meeting
of May 11, 2012 delegated to the Board of Directors, in its seventeenth resolution, the authority to carry out in one or more occasions within a maximum period of twenty-six months, a capital increase reserved for employees belonging to an
employee savings plan.
This same Combined General Meeting also delegated to the Board of Directors the powers necessary to accomplish in one or more
occasions within a maximum period of eighteen months, a capital increase with the objective of providing employees with their registered office located outside France with benefits comparable to those granted to the employees included in the
seventeenth resolution of the Combined General Meeting of May 11, 2012.
Pursuant to these delegations, the Board of Directors, during its
September 18, 2012 meeting, decided to proceed with a capital
|
|
|
|
|
F-58
|
|
TOTAL S.A. Form 20-F 2015
|
Note 26 – Notes to the Consolidated Financial Statements
increase reserved for employees that included a classic offer and a leveraged offer depending on the employees’
choice, within the limit of 18 million shares with dividend rights as of January 1, 2012. This capital increase resulted in the subscription of 10,802,215 shares with a par value of
€
2.50 at a unit price of
€
30.70. The issuance of the shares was acknowledged on April 25, 2013.
The cost of the capital increase reserved for employees consists of the cost related to the discount on all the shares subscribed using both the classic and the leveraged schemes, and the opportunity gain for the
shares subscribed using the leveraged scheme. This opportunity gain corresponds to the benefit of subscribing to the leveraged offer, rather than reproducing the same economic profile through the purchase of options in the market for individual
investors.
The global cost is reduced to take into account the non transferability of the shares that could be subscribed by the employees over a period
of five years. The valuation method of non transferability of the shares is based on a strategy cost in two steps consisting, first, in a five years forward sale of the nontransferable shares, and second, in purchasing the same number of shares in
cash with a loan financing reimbursable “in fine”.
During the year 2013, the main assumptions used for the valuation of the cost of the
capital increase reserved for employees were the following:
|
|
|
|
|
|
|
For the year ended December 31,
|
|
2013
|
|
|
Date of the Board of Directors meeting that decided the issue
|
|
|
September 18, 2012
|
|
|
Subscription price (
€
)
(a)
|
|
|
30.70
|
|
|
Share price at the reference date
(
€
)
(b)
|
|
|
39.57
|
|
|
Number of shares (in millions)
|
|
|
10.80
|
|
|
Risk free interest rate (%)
(c)
|
|
|
0.88
|
|
|
Employees loan financing rate (%)
(d)
|
|
|
6.97
|
|
|
Non transferability cost (% of the reference’s share price)
|
|
|
22.1
|
|
|
(a)
|
Average of the closing TOTAL share prices during the twenty trading days prior to
March 14, 2013, date on which the late Chairman and Chief Executive Officer set the subscription period, after deduction of a 20% discount.
|
|
(b)
|
Share price on March 14, 2013, date on which the late Chairman and Chief Executive Officer set the subscription period.
|
|
(
c
)
|
Zero coupon Euro swap rate at 5 years.
|
|
(d)
|
The employees’ loan financing rate is based on a 5 year consumer’s credit
rate.
|
A cost of $14.1 million related to the capital increase reserved for employees has been accounted to the fiscal year 2013.
The Combined General Meeting of May 16, 2014, in its fourteenth resolution, delegated to the Board of Directors the authority to carry out in one
or more occasions within a maximum period of twenty-six months, a capital increase reserved for employees belonging to an employee savings plan.
Pursuant to this delegation, the Board of Directors, during its July 29, 2014, meeting, decided to proceed with a capital increase reserved for employees that
included a classic offering and a leveraged offering depending on the employees’ choice, within the limit of 18 million shares with dividend rights as of January 1, 2014 and to grant up to ten free shares to employees who have
subscribed to this offering.
This capital increase resulted in the subscription of 10,108,918 shares with a par value of
€
2.50 at a unit price of
€
37.50
and of the issuance of 370,492 shares with a par value of
€
2.50 granted as free shares. The issuance of the shares was acknowledged on
April 27, 2015. Moreover, the Board of Directors, during its
April 27, 2015 meeting, decided to grant 20,882 free shares to 2,100 beneficiaries subject to a continued employment condition during the five-year acquisition period that will end at
April 27, 2020.
The cost of the capital increase reserved for employees consists of the cost related to the discount on all the shares subscribed
using both the classic and the leveraged schemes, and the opportunity gain for the shares subscribed using the leveraged scheme. This opportunity gain corresponds to the benefit of subscribing to the leveraged offer, rather than reproducing the same
economic profile through the purchase of options in the market for individual investors.
The global cost is reduced to take into account the non
transferability of the shares that could be subscribed by the employees over a period of five years.
The valuation method of non transferability of the
shares is based on a strategy cost in two steps consisting, first, in a five years forward sale of the nontransferable shares, and second, in purchasing the same number of shares in cash with a loan financing reimbursable “in fine”.
The global cost also consists of the cost related to the free shares granted to employees who have subscribed to this offering.
During the year 2015, the main assumptions used for the valuation of the cost of the capital increase reserved for employees were the following:
|
|
|
|
|
|
|
For the year ended December 31,
|
|
2015
|
|
|
Date of the Board of Directors meeting that decided the issue
|
|
|
July 29, 2014
|
|
|
Subscription price (
€
)
(a)
|
|
|
37.50
|
|
|
Share price at the reference date
(
€
)
(b)
|
|
|
44.645
|
|
|
Number of shares (in millions)
|
|
|
10.50
|
|
|
Risk free interest rate (%)
(c)
|
|
|
0.013
|
|
|
Employees loan financing rate (%)
(d)
|
|
|
6.32
|
|
|
Non transferability cost (% of the reference’s share price)
|
|
|
23.0
|
|
|
(a)
|
Average of the closing TOTAL share prices during the twenty trading days prior to March 13, 2015, date on which the Chief Executive Officer set the
subscription period, after deduction of a 20% discount.
|
|
(b)
|
Share price on March 13, 2015, date on which the Chief Executive Officer set the subscription period.
|
|
(c)
|
Zero coupon Euro swap rate at 5 years.
|
|
(d)
|
The employees’ loan financing rate is based on a 5 year consumer’s credit
rate.
|
A cost of $30 million related to the capital increase reserved for employees has been accounted for the fiscal year 2015.
26)
Payroll and staff
|
|
|
|
|
|
|
|
|
|
|
|
|
|
|
For the year ended
December 31,
|
|
2015
|
|
|
2014
|
|
|
2013
|
|
|
Personnel expenses
(M$)
|
|
|
|
|
|
|
|
|
|
|
|
|
|
Wages and salaries (including social charges)
|
|
|
8,088
|
|
|
|
9,690
|
|
|
|
9,424
|
|
|
Group employees
|
|
|
|
|
|
|
|
|
|
|
|
|
|
France
|
|
|
|
|
|
|
|
|
|
|
|
|
|
• Management
|
|
|
11,000
|
|
|
|
11,477
|
|
|
|
11,189
|
|
|
• Other
|
|
|
19,219
|
|
|
|
21,120
|
|
|
|
22,010
|
|
|
International
|
|
|
|
|
|
|
|
|
|
|
|
|
|
• Management
|
|
|
16,624
|
|
|
|
17,794
|
|
|
|
17,338
|
|
|
• Other
|
|
|
49,176
|
|
|
|
49,916
|
|
|
|
48,262
|
|
|
Total
|
|
|
96,019
|
|
|
|
100,307
|
|
|
|
98,799
|
|
The number of employees includes only employees of fully consolidated subsidiaries.
|
|
|
|
|
2015 Form 20-F TOTAL S.A.
|
|
F-59
|
Notes to the Consolidated Financial Statements – Note 27
27)
Statement of cash flows
A) Cash flow from operating activities
The following table gives additional information on cash paid or
received in the cash flow from operating activities:
|
|
|
|
|
|
|
|
|
|
|
|
|
|
|
For the year ended
December 31, (M$)
|
|
2015
|
|
|
2014
|
|
|
2013
|
|
|
Interests paid
|
|
|
(862
|
)
|
|
|
(789
|
)
|
|
|
(715
|
)
|
|
Interests received
|
|
|
113
|
|
|
|
119
|
|
|
|
76
|
|
|
Income tax paid
(a)
|
|
|
(4,937
|
)
|
|
|
(11,374
|
)
|
|
|
(13,708
|
)
|
|
Dividends received
|
|
|
2,309
|
|
|
|
2,992
|
|
|
|
2,798
|
|
|
(a)
|
These amounts include taxes paid in kind under production-sharing contracts in Exploration & Production.
|
Changes in working capital are detailed as follows:
|
|
|
|
|
|
|
|
|
|
|
|
|
|
|
For the year ended
December 31, (M$)
|
|
2015
|
|
|
2014
|
|
|
2013
|
|
|
Inventories
|
|
|
888
|
|
|
|
5,289
|
|
|
|
1,079
|
|
|
Accounts receivable
|
|
|
4,153
|
|
|
|
5,916
|
|
|
|
3,181
|
|
|
Other current assets
|
|
|
(726
|
)
|
|
|
(1,605
|
)
|
|
|
(1,678
|
)
|
|
Accounts payable
|
|
|
(2,235
|
)
|
|
|
(4,531
|
)
|
|
|
174
|
|
|
Other creditors and accrued liabilities
|
|
|
(397
|
)
|
|
|
(589
|
)
|
|
|
(231
|
)
|
|
Net amount
|
|
|
1,683
|
|
|
|
4,480
|
|
|
|
2,525
|
|
B) Cash flow used in financing activities
Changes in non-current financial debt are detailed in the following table as a net value due to the high number of multiple drawings on revolving credit lines:
|
|
|
|
|
|
|
|
|
|
|
|
|
|
|
For the year ended
December 31, (M$)
|
|
2015
|
|
|
2014
|
|
|
2013
|
|
|
Issuance of non-current debt
|
|
|
4,468
|
|
|
|
15,874
|
|
|
|
11,221
|
|
|
Repayment of non-current debt
|
|
|
(302
|
)
|
|
|
(88
|
)
|
|
|
(119
|
)
|
|
Net amount
|
|
|
4,166
|
|
|
|
15,786
|
|
|
|
11,102
|
|
C) Cash and cash equivalents
Cash and cash equivalents are detailed as follows:
|
|
|
|
|
|
|
|
|
|
|
|
|
|
|
For the year ended
December 31, (M$)
|
|
2015
|
|
|
2014
|
|
|
2013
|
|
|
Cash
|
|
|
12,291
|
|
|
|
13,874
|
|
|
|
12,895
|
|
|
Cash equivalents
|
|
|
10,978
|
|
|
|
11,307
|
|
|
|
7,305
|
|
|
Total
|
|
|
23,269
|
|
|
|
25,181
|
|
|
|
20,200
|
|
Cash equivalents are mainly composed of deposits less than three months deposited in government institutions or deposit banks
selected in accordance with strict criteria.
As of December 31, 2015, the cash and cash equivalents include $1,644 million subject to restrictions
particularly due to a regulatory framework or due to the fact they are owned by affiliates located in countries with an exchange control.
|
|
|
|
|
F-60
|
|
TOTAL S.A. Form 20-F 2015
|
Note 28 – Notes to the Consolidated Financial Statements
28)
Financial assets and liabilities analysis per instrument class and strategy
The financial assets and liabilities disclosed in the balance sheet are detailed as follows:
|
|
|
|
|
|
|
|
|
|
|
|
|
|
|
|
|
|
|
|
|
|
|
|
|
|
|
|
|
|
|
|
|
|
|
|
|
|
|
|
|
|
|
|
|
Financial instruments related to financing and operational activities
|
|
|
Other financial
instruments
|
|
|
Total
|
|
|
Fair
value
|
|
|
|
|
Amortized
cost
|
|
|
Fair value
|
|
|
Amortized
cost
|
|
|
|
|
|
|
|
|
As of
December 31, 2015 (M$) Assets / (Liabilities)
|
|
|
|
|
Available for
sale
(a)
|
|
|
Held for
trading
|
|
|
Financial
debt
(b)
|
|
|
Hedging of
Financial Debt
|
|
|
Cash flow
hedge
|
|
|
Net investment
hedge and other
|
|
|
|
|
|
|
|
|
|
|
|
Equity affiliates: loans
|
|
|
4,378
|
|
|
|
—
|
|
|
|
—
|
|
|
|
—
|
|
|
|
—
|
|
|
|
—
|
|
|
|
—
|
|
|
|
—
|
|
|
|
4,378
|
|
|
|
4,378
|
|
|
Other investments
|
|
|
—
|
|
|
|
1,241
|
|
|
|
—
|
|
|
|
—
|
|
|
|
—
|
|
|
|
—
|
|
|
|
—
|
|
|
|
—
|
|
|
|
1,241
|
|
|
|
1,241
|
|
|
Hedging instruments of non-current financial debt
|
|
|
—
|
|
|
|
—
|
|
|
|
—
|
|
|
|
—
|
|
|
|
1,075
|
|
|
|
144
|
|
|
|
—
|
|
|
|
—
|
|
|
|
1,219
|
|
|
|
1,219
|
|
|
Other non-current assets
|
|
|
3,407
|
|
|
|
—
|
|
|
|
—
|
|
|
|
—
|
|
|
|
—
|
|
|
|
—
|
|
|
|
—
|
|
|
|
—
|
|
|
|
3,407
|
|
|
|
3,407
|
|
|
Accounts receivable, net(c)
|
|
|
—
|
|
|
|
—
|
|
|
|
—
|
|
|
|
—
|
|
|
|
—
|
|
|
|
—
|
|
|
|
—
|
|
|
|
10,629
|
|
|
|
10,629
|
|
|
|
10,629
|
|
|
Other operating receivables
|
|
|
—
|
|
|
|
—
|
|
|
|
3,379
|
|
|
|
—
|
|
|
|
—
|
|
|
|
9
|
|
|
|
—
|
|
|
|
7,521
|
|
|
|
10,909
|
|
|
|
10,909
|
|
|
Current financial assets
|
|
|
5,858
|
|
|
|
—
|
|
|
|
112
|
|
|
|
—
|
|
|
|
220
|
|
|
|
—
|
|
|
|
—
|
|
|
|
—
|
|
|
|
6,190
|
|
|
|
6,190
|
|
|
Cash and cash equivalents
|
|
|
—
|
|
|
|
—
|
|
|
|
—
|
|
|
|
—
|
|
|
|
—
|
|
|
|
—
|
|
|
|
—
|
|
|
|
23,269
|
|
|
|
23,269
|
|
|
|
23,269
|
|
|
Total financial assets
|
|
|
13,643
|
|
|
|
1,241
|
|
|
|
3,491
|
|
|
|
—
|
|
|
|
1,295
|
|
|
|
153
|
|
|
|
—
|
|
|
|
41,419
|
|
|
|
61,242
|
|
|
|
61,242
|
|
|
Total non-financial assets
|
|
|
—
|
|
|
|
—
|
|
|
|
—
|
|
|
|
—
|
|
|
|
—
|
|
|
|
—
|
|
|
|
—
|
|
|
|
—
|
|
|
|
163,242
|
|
|
|
—
|
|
|
Total assets
|
|
|
—
|
|
|
|
—
|
|
|
|
—
|
|
|
|
—
|
|
|
|
—
|
|
|
|
—
|
|
|
|
—
|
|
|
|
—
|
|
|
|
224,484
|
|
|
|
—
|
|
|
Non-current financial debt
|
|
|
(7,810
|
)
|
|
|
—
|
|
|
|
—
|
|
|
|
(33,762
|
)
|
|
|
(2,891
|
)
|
|
|
(1
|
)
|
|
|
—
|
|
|
|
—
|
|
|
|
(44,464
|
)
|
|
|
(45,294
|
)
|
|
Accounts payable
(c)
|
|
|
—
|
|
|
|
—
|
|
|
|
—
|
|
|
|
—
|
|
|
|
—
|
|
|
|
—
|
|
|
|
—
|
|
|
|
(20,928
|
)
|
|
|
(20,928
|
)
|
|
|
(20,928
|
)
|
|
Other operating liabilities
|
|
|
—
|
|
|
|
—
|
|
|
|
(1,609
|
)
|
|
|
—
|
|
|
|
—
|
|
|
|
(103
|
)
|
|
|
—
|
|
|
|
(8,202
|
)
|
|
|
(9,914
|
)
|
|
|
(9,914
|
)
|
|
Current borrowings
|
|
|
(8,230
|
)
|
|
|
—
|
|
|
|
—
|
|
|
|
(4,258
|
)
|
|
|
—
|
|
|
|
—
|
|
|
|
—
|
|
|
|
—
|
|
|
|
(12,488
|
)
|
|
|
(12,488
|
)
|
|
Other current financial liabilities
|
|
|
—
|
|
|
|
—
|
|
|
|
(44
|
)
|
|
|
—
|
|
|
|
(127
|
)
|
|
|
—
|
|
|
|
—
|
|
|
|
—
|
|
|
|
(171
|
)
|
|
|
(171
|
)
|
|
Total financial liabilities
|
|
|
(16,040
|
)
|
|
|
—
|
|
|
|
(1,653
|
)
|
|
|
(38,020
|
)
|
|
|
(3,018
|
)
|
|
|
(104
|
)
|
|
|
—
|
|
|
|
(29,130
|
)
|
|
|
(87,965
|
)
|
|
|
(88,795
|
)
|
|
Total non-financial liabilities
|
|
|
—
|
|
|
|
—
|
|
|
|
—
|
|
|
|
—
|
|
|
|
—
|
|
|
|
—
|
|
|
|
—
|
|
|
|
—
|
|
|
|
(136,519
|
)
|
|
|
—
|
|
|
Total liabilities
|
|
|
—
|
|
|
|
—
|
|
|
|
—
|
|
|
|
—
|
|
|
|
—
|
|
|
|
—
|
|
|
|
—
|
|
|
|
—
|
|
|
|
(224,484
|
)
|
|
|
—
|
|
|
(a)
|
Financial assets available for sale are measured at their fair value except for
unlisted securities (see Note 1 paragraph M(ii) and Note 13 to the Consolidated Financial Statements).
|
|
(b)
|
The financial debt is adjusted to the hedged risks value (currency and interest
rate) as part of hedge accounting (see Note 1 paragraph M(iii) to the Consolidated Financial Statements).
|
|
(c)
|
The impact of offsetting on accounts receivable, net is $(1,044) million and
$+1,044 million on accounts payable.
|
|
|
|
|
|
2015 Form 20-F TOTAL S.A.
|
|
F-61
|
Notes to the Consolidated Financial Statements – Note 28
|
|
|
|
|
|
|
|
|
|
|
|
|
|
|
|
|
|
|
|
|
|
|
|
|
|
|
|
|
|
|
|
|
|
|
|
|
|
|
|
|
|
|
|
|
Financial instruments related to financing and operational activities
|
|
|
Other financial
instruments
|
|
|
Total
|
|
|
Fair
value
|
|
|
|
|
Amortized
cost
|
|
|
Fair value
|
|
|
Amortized
cost
|
|
|
|
|
|
|
|
|
As of
December 31, 2014 (M$) Assets / (Liabilities)
|
|
|
|
|
Available
for sale
(a)
|
|
|
Held for
trading
|
|
|
Financial
debt
(b)
|
|
|
Hedging of
Financial Debt
|
|
|
Cash flow
hedge
|
|
|
Net investment
hedge and other
|
|
|
|
|
|
|
|
|
|
|
|
Equity affiliates: loans
|
|
|
4,626
|
|
|
|
—
|
|
|
|
—
|
|
|
|
—
|
|
|
|
—
|
|
|
|
—
|
|
|
|
—
|
|
|
|
—
|
|
|
|
4,626
|
|
|
|
4,626
|
|
|
Other investments
|
|
|
—
|
|
|
|
1,399
|
|
|
|
—
|
|
|
|
—
|
|
|
|
—
|
|
|
|
—
|
|
|
|
—
|
|
|
|
—
|
|
|
|
1,399
|
|
|
|
1,399
|
|
|
Hedging instruments of non-current financial debt
|
|
|
—
|
|
|
|
—
|
|
|
|
—
|
|
|
|
—
|
|
|
|
1,084
|
|
|
|
235
|
|
|
|
—
|
|
|
|
—
|
|
|
|
1,319
|
|
|
|
1,319
|
|
|
Other non-current assets
|
|
|
3,326
|
|
|
|
—
|
|
|
|
—
|
|
|
|
—
|
|
|
|
—
|
|
|
|
—
|
|
|
|
—
|
|
|
|
—
|
|
|
|
3,326
|
|
|
|
3,326
|
|
|
Accounts receivable, net
(c)
|
|
|
—
|
|
|
|
—
|
|
|
|
—
|
|
|
|
—
|
|
|
|
—
|
|
|
|
—
|
|
|
|
—
|
|
|
|
15,704
|
|
|
|
15,704
|
|
|
|
15,704
|
|
|
Other operating receivables
|
|
|
—
|
|
|
|
—
|
|
|
|
2,502
|
|
|
|
—
|
|
|
|
—
|
|
|
|
7
|
|
|
|
—
|
|
|
|
8,283
|
|
|
|
10,792
|
|
|
|
10,792
|
|
|
Current financial assets
|
|
|
469
|
|
|
|
—
|
|
|
|
364
|
|
|
|
—
|
|
|
|
460
|
|
|
|
—
|
|
|
|
—
|
|
|
|
—
|
|
|
|
1,293
|
|
|
|
1,293
|
|
|
Cash and cash equivalents
|
|
|
—
|
|
|
|
—
|
|
|
|
—
|
|
|
|
—
|
|
|
|
—
|
|
|
|
—
|
|
|
|
—
|
|
|
|
25,181
|
|
|
|
25,181
|
|
|
|
25,181
|
|
|
Total financial assets
|
|
|
8,421
|
|
|
|
1,399
|
|
|
|
2,866
|
|
|
|
—
|
|
|
|
1,544
|
|
|
|
242
|
|
|
|
—
|
|
|
|
49,168
|
|
|
|
63,640
|
|
|
|
63,640
|
|
|
Total non-financial assets
|
|
|
—
|
|
|
|
—
|
|
|
|
—
|
|
|
|
—
|
|
|
|
—
|
|
|
|
—
|
|
|
|
—
|
|
|
|
—
|
|
|
|
166,158
|
|
|
|
—
|
|
|
Total assets
|
|
|
—
|
|
|
|
—
|
|
|
|
—
|
|
|
|
—
|
|
|
|
—
|
|
|
|
—
|
|
|
|
—
|
|
|
|
—
|
|
|
|
229,798
|
|
|
|
—
|
|
|
Non-current financial debt
|
|
|
(7,179
|
)
|
|
|
—
|
|
|
|
—
|
|
|
|
(37,355
|
)
|
|
|
(944
|
)
|
|
|
(3
|
)
|
|
|
—
|
|
|
|
—
|
|
|
|
(45,481
|
)
|
|
|
(46,472
|
)
|
|
Accounts payable
(c)
|
|
|
—
|
|
|
|
—
|
|
|
|
—
|
|
|
|
—
|
|
|
|
—
|
|
|
|
—
|
|
|
|
—
|
|
|
|
(24,150
|
)
|
|
|
(24,150
|
)
|
|
|
(24,150
|
)
|
|
Other operating liabilities
|
|
|
—
|
|
|
|
—
|
|
|
|
(1,073
|
)
|
|
|
—
|
|
|
|
—
|
|
|
|
(4
|
)
|
|
|
—
|
|
|
|
(6,858
|
)
|
|
|
(7,935
|
)
|
|
|
(7,935
|
)
|
|
Current borrowings
|
|
|
(6,241
|
)
|
|
|
—
|
|
|
|
—
|
|
|
|
(4,701
|
)
|
|
|
—
|
|
|
|
—
|
|
|
|
—
|
|
|
|
—
|
|
|
|
(10,942
|
)
|
|
|
(10,942
|
)
|
|
Other current financial liabilities
|
|
|
—
|
|
|
|
—
|
|
|
|
(47
|
)
|
|
|
—
|
|
|
|
(133
|
)
|
|
|
—
|
|
|
|
—
|
|
|
|
—
|
|
|
|
(180
|
)
|
|
|
(180
|
)
|
|
Total financial liabilities
|
|
|
(13,420
|
)
|
|
|
—
|
|
|
|
(1,120
|
)
|
|
|
(42,056
|
)
|
|
|
(1,077
|
)
|
|
|
(7
|
)
|
|
|
—
|
|
|
|
(31,008
|
)
|
|
|
(88,688
|
)
|
|
|
(89,679
|
)
|
|
Total non-financial liabilities
|
|
|
—
|
|
|
|
—
|
|
|
|
—
|
|
|
|
—
|
|
|
|
—
|
|
|
|
—
|
|
|
|
—
|
|
|
|
—
|
|
|
|
(141,110
|
)
|
|
|
—
|
|
|
Total liabilities
|
|
|
—
|
|
|
|
—
|
|
|
|
—
|
|
|
|
—
|
|
|
|
—
|
|
|
|
—
|
|
|
|
—
|
|
|
|
—
|
|
|
|
(229,798
|
)
|
|
|
—
|
|
|
(a)
|
Financial assets available for sale are measured at their fair value except for unlisted securities (see Note 1 paragraph M(ii) and Note 13 to the
Consolidated Financial Statements).
|
|
(b)
|
The financial debt is adjusted to the hedged risks value (currency and interest rate) as part of hedge accounting (see Note 1 paragraph M(iii) to the
Consolidated Financial Statements).
|
|
(c)
|
The impact of offsetting on accounts receivable, net is $(1,970) million and $+1,970 million on accounts payable.
|
|
|
|
|
|
F-62
|
|
TOTAL S.A. Form 20-F 2015
|
Note 28 – Notes to the Consolidated Financial Statements
|
|
|
|
|
|
|
|
|
|
|
|
|
|
|
|
|
|
|
|
|
|
|
|
|
|
|
|
|
|
|
|
|
|
|
|
|
|
|
|
|
|
|
|
|
Financial instruments related to financing and operational activities
|
|
|
Other financial
instruments
|
|
|
Total
|
|
|
Fair
value
|
|
|
|
|
Amortized
cost
|
|
|
Fair value
|
|
|
Amortized
cost
|
|
|
|
|
|
|
|
|
As of December 31, 2013(M$)
Assets / (Liabilities)
|
|
|
|
|
Available
for sale
(a)
|
|
|
Held for
trading
|
|
|
Financial
debt
(b)
|
|
|
Hedging of
Financial Debt
|
|
|
Cash flow
hedge
|
|
|
Net investment
hedge and other
|
|
|
|
|
|
|
|
|
|
|
|
Equity affiliates: loans
|
|
|
3,554
|
|
|
|
—
|
|
|
|
—
|
|
|
|
—
|
|
|
|
—
|
|
|
|
—
|
|
|
|
—
|
|
|
|
—
|
|
|
|
3,554
|
|
|
|
3,554
|
|
|
Other investments
|
|
|
—
|
|
|
|
1,666
|
|
|
|
—
|
|
|
|
—
|
|
|
|
—
|
|
|
|
—
|
|
|
|
—
|
|
|
|
—
|
|
|
|
1,666
|
|
|
|
1,666
|
|
|
Hedging instruments of non-current financial debt
|
|
|
—
|
|
|
|
—
|
|
|
|
—
|
|
|
|
—
|
|
|
|
1,204
|
|
|
|
214
|
|
|
|
—
|
|
|
|
—
|
|
|
|
1,418
|
|
|
|
1,418
|
|
|
Other non-current assets
|
|
|
3,575
|
|
|
|
—
|
|
|
|
—
|
|
|
|
—
|
|
|
|
—
|
|
|
|
—
|
|
|
|
—
|
|
|
|
—
|
|
|
|
3,575
|
|
|
|
3,575
|
|
|
Accounts receivable, net
(c)
|
|
|
—
|
|
|
|
—
|
|
|
|
—
|
|
|
|
—
|
|
|
|
—
|
|
|
|
—
|
|
|
|
—
|
|
|
|
23,422
|
|
|
|
23,422
|
|
|
|
23,422
|
|
|
Other operating receivables
|
|
|
—
|
|
|
|
—
|
|
|
|
1,278
|
|
|
|
—
|
|
|
|
—
|
|
|
|
—
|
|
|
|
—
|
|
|
|
8,639
|
|
|
|
9,917
|
|
|
|
9,917
|
|
|
Current financial assets
|
|
|
161
|
|
|
|
—
|
|
|
|
108
|
|
|
|
—
|
|
|
|
469
|
|
|
|
1
|
|
|
|
—
|
|
|
|
—
|
|
|
|
739
|
|
|
|
739
|
|
|
Cash and cash equivalents
|
|
|
—
|
|
|
|
—
|
|
|
|
—
|
|
|
|
—
|
|
|
|
—
|
|
|
|
—
|
|
|
|
—
|
|
|
|
20,200
|
|
|
|
20,200
|
|
|
|
20,200
|
|
|
Total financial assets
|
|
|
7,290
|
|
|
|
1,666
|
|
|
|
1,386
|
|
|
|
—
|
|
|
|
1,673
|
|
|
|
215
|
|
|
|
—
|
|
|
|
52,261
|
|
|
|
64,491
|
|
|
|
64,491
|
|
|
Total non-financial assets
|
|
|
—
|
|
|
|
—
|
|
|
|
—
|
|
|
|
—
|
|
|
|
—
|
|
|
|
—
|
|
|
|
—
|
|
|
|
—
|
|
|
|
174,732
|
|
|
|
—
|
|
|
Total assets
|
|
|
—
|
|
|
|
—
|
|
|
|
—
|
|
|
|
—
|
|
|
|
—
|
|
|
|
—
|
|
|
|
—
|
|
|
|
—
|
|
|
|
239,223
|
|
|
|
—
|
|
|
Non-current financial debt
|
|
|
(6,985
|
)
|
|
|
—
|
|
|
|
—
|
|
|
|
(27,264
|
)
|
|
|
(325
|
)
|
|
|
—
|
|
|
|
—
|
|
|
|
—
|
|
|
|
(34,574
|
)
|
|
|
(35,401
|
)
|
|
Accounts payable
(c)
|
|
|
—
|
|
|
|
—
|
|
|
|
—
|
|
|
|
—
|
|
|
|
—
|
|
|
|
—
|
|
|
|
—
|
|
|
|
(30,282
|
)
|
|
|
(30,282
|
)
|
|
|
(30,282
|
)
|
|
Other operating liabilities
|
|
|
—
|
|
|
|
—
|
|
|
|
(848
|
)
|
|
|
—
|
|
|
|
—
|
|
|
|
(26
|
)
|
|
|
—
|
|
|
|
(7,317
|
)
|
|
|
(8,191
|
)
|
|
|
(8,191
|
)
|
|
Current borrowings
|
|
|
(5,901
|
)
|
|
|
—
|
|
|
|
—
|
|
|
|
(5,292
|
)
|
|
|
—
|
|
|
|
—
|
|
|
|
—
|
|
|
|
—
|
|
|
|
(11,193
|
)
|
|
|
(11,193
|
)
|
|
Other current financial liabilities
|
|
|
—
|
|
|
|
—
|
|
|
|
(61
|
)
|
|
|
—
|
|
|
|
(314
|
)
|
|
|
(6
|
)
|
|
|
—
|
|
|
|
—
|
|
|
|
(381
|
)
|
|
|
(381
|
)
|
|
Total financial liabilities
|
|
|
(12,886
|
)
|
|
|
—
|
|
|
|
(909
|
)
|
|
|
(32,556
|
)
|
|
|
(639
|
)
|
|
|
(32
|
)
|
|
|
—
|
|
|
|
(37,599
|
)
|
|
|
(84,621
|
)
|
|
|
(85,448
|
)
|
|
Total non-financial liabilities
|
|
|
—
|
|
|
|
—
|
|
|
|
—
|
|
|
|
—
|
|
|
|
—
|
|
|
|
—
|
|
|
|
—
|
|
|
|
—
|
|
|
|
(154,602
|
)
|
|
|
—
|
|
|
Total liabilities
|
|
|
—
|
|
|
|
—
|
|
|
|
—
|
|
|
|
—
|
|
|
|
—
|
|
|
|
—
|
|
|
|
—
|
|
|
|
—
|
|
|
|
(239,223
|
)
|
|
|
—
|
|
|
(a)
|
Financial assets available for sale are measured at their fair value except for unlisted securities (see Note 1 paragraph M(ii) and Note 13 to the
Consolidated Financial Statements).
|
|
(b)
|
The financial debt is adjusted to the hedged risks value (currency and interest rate) as part of hedge accounting (see Note 1 paragraph M(iii) to the
Consolidated Financial Statements).
|
|
(c)
|
The impact of offsetting on accounts receivable, net is $(3,458) million and $+3,458 million on accounts payable.
|
|
|
|
|
|
2015 Form 20-F TOTAL S.A.
|
|
F-63
|
Notes to the Consolidated Financial Statements – Note 29
29)
Fair value of financial instruments (excluding commodity contracts)
A) Impact on the statement of income per nature of financial instruments
Operating assets and liabilities
The impact on the statement of income is detailed as follows:
|
|
|
|
|
|
|
|
|
|
|
|
|
|
|
For the year ended December 31, (M$)
|
|
2015
|
|
|
2014
|
|
|
2013
|
|
|
Assets available for sale (investments) :
|
|
|
|
|
|
|
|
|
|
|
|
|
|
— dividend income on non-consolidated subsidiaries
|
|
|
267
|
|
|
|
282
|
|
|
|
202
|
|
|
— gains (losses) on disposal of assets
|
|
|
355
|
|
|
|
13
|
|
|
|
149
|
|
|
— other
|
|
|
(161
|
)
|
|
|
(84
|
)
|
|
|
(94
|
)
|
|
Loans and receivables
|
|
|
80
|
|
|
|
9
|
|
|
|
106
|
|
|
Impact on net operating income
|
|
|
541
|
|
|
|
220
|
|
|
|
363
|
|
The impact in the statement of income mainly includes:
|
|
•
|
|
Dividends and gains or losses on disposal of other investments classified as “Other investments”;
|
|
|
•
|
|
Financial gains and depreciation on loans related to equity affiliates, non-consolidated companies and on receivables reported in “Loans and
receivables”.
|
Assets and liabilities from financing activities
The impact on the statement of income of financing assets and liabilities is detailed as follows:
|
|
|
|
|
|
|
|
|
|
|
|
|
|
|
For the year ended December 31, (M$)
|
|
2015
|
|
|
2014
|
|
|
2013
|
|
|
Loans and receivables
|
|
|
121
|
|
|
|
135
|
|
|
|
94
|
|
|
Financing liabilities and associated hedging instruments
|
|
|
(965
|
)
|
|
|
(750
|
)
|
|
|
(899
|
)
|
|
Fair value hedge (ineffective portion)
|
|
|
(1
|
)
|
|
|
2
|
|
|
|
9
|
|
|
Assets and liabilities held for trading
|
|
|
(28
|
)
|
|
|
(27
|
)
|
|
|
(8
|
)
|
|
Impact on the cost of net debt
|
|
|
(873
|
)
|
|
|
(640
|
)
|
|
|
(804
|
)
|
The impact on the statement of income mainly includes:
|
|
•
|
|
Financial income on cash, cash equivalents, and current financial assets (notably current deposits beyond three months) classified as “Loans and
receivables”;
|
|
|
•
|
|
Financial expense of long term subsidiaries financing, associated hedging instruments (excluding ineffective portion of the hedge detailed below) and financial
expense of short term financing classified as “Financing liabilities and associated hedging instruments”;
|
|
|
•
|
|
Ineffective portion of bond hedging; and
|
|
|
•
|
|
Financial income, financial expense and fair value of derivative instruments used for cash management purposes classified as “Assets and liabilities held
for trading”.
|
Financial derivative instruments used for cash management purposes (interest rate and foreign exchange) are
considered to be held for trading. Based on practical documentation issues, the Group did not elect to set up hedge accounting for such instruments. The impact on income of the derivatives is offset by the impact of loans and current liabilities
they are related to. Therefore these transactions taken as a whole do not have a significant impact on the Consolidated Financial Statements.
B)
Impact of the hedging strategies
Fair value hedge
The impact on the statement of income of the bond hedging instruments which is recorded in the item “Financial interest on debt” in the Consolidated Statement of Income is detailed as follows:
|
|
|
|
|
|
|
|
|
|
|
|
|
|
|
For the year ended December 31, (M$)
|
|
2015
|
|
|
2014
|
|
|
2013
|
|
|
Revaluation at market value of bonds
|
|
|
2,133
|
|
|
|
443
|
|
|
|
1,428
|
|
|
Swap hedging of bonds
|
|
|
(2,134
|
)
|
|
|
(441
|
)
|
|
|
(1,419
|
)
|
|
Ineffective portion of the fair value hedge
|
|
|
(1
|
)
|
|
|
2
|
|
|
|
9
|
|
The ineffective portion is not representative of the Group’s performance considering the Group’s objective to hold swaps
to maturity. The current portion of the swaps valuation is not subject to active management.
Net investment hedge
These instruments are recorded directly in other comprehensive income under “Currency translation adjustments”. The variations of the period are detailed
in the table below:
|
|
|
|
|
|
|
|
|
|
|
|
|
|
|
|
|
|
|
For the year ended December 31, (M$)
|
|
As of January 1,
|
|
|
Variations
|
|
|
Disposals
|
|
|
As of December 31
|
|
|
2015
|
|
|
(511
|
)
|
|
|
(163
|
)
|
|
|
—
|
|
|
|
(674
|
)
|
|
2014
|
|
|
(367
|
)
|
|
|
(144
|
)
|
|
|
—
|
|
|
|
(511
|
)
|
|
2013
|
|
|
(384
|
)
|
|
|
17
|
|
|
|
—
|
|
|
|
(367
|
)
|
As of December 31, 2015, 2014 and 2013 the Group had no open forward contracts under these hedging instruments.
Cash flow hedge
The impact on the statement of income and
other comprehensive income of the hedging instruments qualified as cash flow hedges is detailed as follows:
|
|
|
|
|
|
|
|
|
|
|
|
|
|
|
For the year ended December 31, (M$)
|
|
2015
|
|
|
2014
|
|
|
2013
|
|
|
Profit (Loss) recorded in equity during the period
|
|
|
(185
|
)
|
|
|
97
|
|
|
|
156
|
|
|
Recycled amount from equity to the income statement during the period
|
|
|
(205
|
)
|
|
|
(295
|
)
|
|
|
86
|
|
As of December 31, 2015, 2014 and 2013, the ineffective portion of these financial instruments is equal to zero.
|
|
|
|
|
F-64
|
|
TOTAL S.A. Form 20-F 2015
|
Note 29 – Notes to the Consolidated Financial Statements
C) Maturity of derivative instruments
The maturity of the notional amounts of derivative instruments, excluding the commodity contracts, is detailed in the following table:
|
|
|
|
|
|
|
|
|
|
|
|
|
|
|
|
|
|
|
|
|
|
|
|
|
|
|
|
|
|
|
|
|
|
|
|
|
|
|
|
Notional value
(a)
|
|
|
For the year ended December 31, 2015 (M$)
Assets / (Liabilities)
|
|
Fair
value
|
|
|
Total
|
|
|
2016
|
|
|
2017
|
|
|
2018
|
|
|
2019
|
|
|
2020
|
|
|
2021
and
after
|
|
|
Fair value hedge
|
|
|
|
|
|
|
|
|
|
|
|
|
|
|
|
|
|
|
|
|
|
|
|
|
|
|
|
|
|
|
|
|
|
Swaps hedging fixed-rates bonds (liabilities)
|
|
|
(2,891
|
)
|
|
|
21,835
|
|
|
|
—
|
|
|
|
—
|
|
|
|
—
|
|
|
|
—
|
|
|
|
—
|
|
|
|
—
|
|
|
Swaps hedging fixed-rates bonds (assets)
|
|
|
1,075
|
|
|
|
11,701
|
|
|
|
—
|
|
|
|
—
|
|
|
|
—
|
|
|
|
—
|
|
|
|
—
|
|
|
|
—
|
|
|
Total swaps hedging fixed-rates bonds (assets and liabilities)
|
|
|
(1,816
|
)
|
|
|
33,536
|
|
|
|
—
|
|
|
|
4,410
|
|
|
|
4,129
|
|
|
|
3,190
|
|
|
|
3,346
|
|
|
|
18,461
|
|
|
Swaps hedging fixed-rates bonds (current portion) (liabilities)
|
|
|
(127
|
)
|
|
|
579
|
|
|
|
—
|
|
|
|
—
|
|
|
|
—
|
|
|
|
—
|
|
|
|
—
|
|
|
|
—
|
|
|
Swaps hedging fixed-rates bonds (current portion) (assets)
|
|
|
220
|
|
|
|
2,709
|
|
|
|
—
|
|
|
|
—
|
|
|
|
—
|
|
|
|
—
|
|
|
|
—
|
|
|
|
—
|
|
|
Total swaps hedging fixed-rates bonds (current portion) (assets and liabilities)
|
|
|
93
|
|
|
|
3,288
|
|
|
|
3,288
|
|
|
|
—
|
|
|
|
—
|
|
|
|
—
|
|
|
|
—
|
|
|
|
—
|
|
|
Cash flow hedge
|
|
|
|
|
|
|
|
|
|
|
|
|
|
|
|
|
|
|
|
|
|
|
|
|
|
|
|
|
|
|
|
|
|
Swaps hedging fixed-rates bonds (liabilities)
|
|
|
(1
|
)
|
|
|
36
|
|
|
|
—
|
|
|
|
—
|
|
|
|
—
|
|
|
|
—
|
|
|
|
—
|
|
|
|
—
|
|
|
Swaps hedging fixed-rates bonds (assets)
|
|
|
144
|
|
|
|
2,221
|
|
|
|
—
|
|
|
|
—
|
|
|
|
—
|
|
|
|
—
|
|
|
|
—
|
|
|
|
—
|
|
|
Total swaps hedging fixed-rates bonds (assets and liabilities)
|
|
|
143
|
|
|
|
2,257
|
|
|
|
—
|
|
|
|
—
|
|
|
|
—
|
|
|
|
969
|
|
|
|
—
|
|
|
|
1,288
|
|
|
Swaps hedging fixed-rates bonds (current portion) (liabilities)
|
|
|
—
|
|
|
|
—
|
|
|
|
—
|
|
|
|
—
|
|
|
|
—
|
|
|
|
—
|
|
|
|
—
|
|
|
|
—
|
|
|
Swaps hedging fixed-rates bonds (current portion) (assets)
|
|
|
—
|
|
|
|
—
|
|
|
|
—
|
|
|
|
—
|
|
|
|
—
|
|
|
|
—
|
|
|
|
—
|
|
|
|
—
|
|
|
Total swaps hedging fixed-rates bonds (current portion) (assets and liabilities)
|
|
|
—
|
|
|
|
—
|
|
|
|
—
|
|
|
|
—
|
|
|
|
—
|
|
|
|
—
|
|
|
|
—
|
|
|
|
—
|
|
|
Swaps hedging investments (liabilities)
|
|
|
(103
|
)
|
|
|
873
|
|
|
|
—
|
|
|
|
—
|
|
|
|
—
|
|
|
|
—
|
|
|
|
—
|
|
|
|
—
|
|
|
Swaps hedging investments (assets)
|
|
|
9
|
|
|
|
145
|
|
|
|
—
|
|
|
|
—
|
|
|
|
—
|
|
|
|
—
|
|
|
|
—
|
|
|
|
—
|
|
|
Total swaps hedging investments (assets and liabilities)
|
|
|
(94
|
)
|
|
|
1,018
|
|
|
|
642
|
|
|
|
296
|
|
|
|
80
|
|
|
|
—
|
|
|
|
—
|
|
|
|
—
|
|
|
Net investment hedge
|
|
|
|
|
|
|
|
|
|
|
|
|
|
|
|
|
|
|
|
|
|
|
|
|
|
|
|
|
|
|
|
|
|
Currency swaps and forward exchange contracts (assets)
|
|
|
—
|
|
|
|
—
|
|
|
|
—
|
|
|
|
—
|
|
|
|
—
|
|
|
|
—
|
|
|
|
—
|
|
|
|
—
|
|
|
Currency swaps and forward exchange contracts (liabilities)
|
|
|
—
|
|
|
|
—
|
|
|
|
—
|
|
|
|
—
|
|
|
|
—
|
|
|
|
—
|
|
|
|
—
|
|
|
|
—
|
|
|
Total swaps hedging net investments
|
|
|
—
|
|
|
|
—
|
|
|
|
—
|
|
|
|
—
|
|
|
|
—
|
|
|
|
—
|
|
|
|
—
|
|
|
|
—
|
|
|
Held for trading
|
|
|
|
|
|
|
|
|
|
|
|
|
|
|
|
|
|
|
|
|
|
|
|
|
|
|
|
|
|
|
|
|
|
Other interest rate swaps (assets)
|
|
|
8
|
|
|
|
17,310
|
|
|
|
—
|
|
|
|
—
|
|
|
|
—
|
|
|
|
—
|
|
|
|
—
|
|
|
|
—
|
|
|
Other interest rate swaps (liabilities)
|
|
|
(9
|
)
|
|
|
26,973
|
|
|
|
—
|
|
|
|
—
|
|
|
|
—
|
|
|
|
—
|
|
|
|
—
|
|
|
|
—
|
|
|
Total other interest rate swaps (assets and liabilities)
|
|
|
(1
|
)
|
|
|
44,283
|
|
|
|
44,134
|
|
|
|
82
|
|
|
|
67
|
|
|
|
—
|
|
|
|
—
|
|
|
|
—
|
|
|
Currency swaps and forward exchange contracts (assets)
|
|
|
104
|
|
|
|
6,103
|
|
|
|
—
|
|
|
|
—
|
|
|
|
—
|
|
|
|
—
|
|
|
|
—
|
|
|
|
—
|
|
|
Currency swaps and forward exchange contracts (liabilities)
|
|
|
(35
|
)
|
|
|
4,003
|
|
|
|
—
|
|
|
|
—
|
|
|
|
—
|
|
|
|
—
|
|
|
|
—
|
|
|
|
—
|
|
|
Total currency swaps and forward exchange contracts (assets and
liabilities)
|
|
|
69
|
|
|
|
10,106
|
|
|
|
9,446
|
|
|
|
290
|
|
|
|
226
|
|
|
|
58
|
|
|
|
41
|
|
|
|
45
|
|
|
(a)
|
These amounts set the levels of notional commitment and are not indicative of a contingent gain or loss.
|
|
|
|
|
|
2015 Form 20-F TOTAL S.A.
|
|
F-65
|
Notes to the Consolidated Financial Statements – Note 29
|
|
|
|
|
|
|
|
|
|
|
|
|
|
|
|
|
|
|
|
|
|
|
|
|
|
|
|
|
|
|
|
|
|
|
|
|
|
|
|
Notional value
(a)
|
|
|
For the year ended December 31, 2014 (M$)
Assets / (Liabilities)
|
|
Fair
value
|
|
|
Total
|
|
|
2015
|
|
|
2016
|
|
|
2017
|
|
|
2018
|
|
|
2019
|
|
|
2020
and
after
|
|
|
Fair value hedge
|
|
|
|
|
|
|
|
|
|
|
|
|
|
|
|
|
|
|
|
|
|
|
|
|
|
|
|
|
|
|
|
|
|
Swaps hedging fixed-rates bonds (liabilities)
|
|
|
(944
|
)
|
|
|
21,546
|
|
|
|
—
|
|
|
|
—
|
|
|
|
—
|
|
|
|
—
|
|
|
|
—
|
|
|
|
—
|
|
|
Swaps hedging fixed-rates bonds (assets)
|
|
|
1,084
|
|
|
|
14,946
|
|
|
|
—
|
|
|
|
—
|
|
|
|
—
|
|
|
|
—
|
|
|
|
—
|
|
|
|
—
|
|
|
Total swaps hedging fixed-rates bonds (assets and liabilities)
|
|
|
140
|
|
|
|
36,492
|
|
|
|
—
|
|
|
|
3,505
|
|
|
|
4,490
|
|
|
|
5,018
|
|
|
|
3,255
|
|
|
|
20,224
|
|
|
Swaps hedging fixed-rates bonds (current portion) (liabilities)
|
|
|
(133
|
)
|
|
|
1,004
|
|
|
|
—
|
|
|
|
—
|
|
|
|
—
|
|
|
|
—
|
|
|
|
—
|
|
|
|
—
|
|
|
Swaps hedging fixed-rates bonds (current portion) (assets)
|
|
|
460
|
|
|
|
4,163
|
|
|
|
—
|
|
|
|
—
|
|
|
|
—
|
|
|
|
—
|
|
|
|
—
|
|
|
|
—
|
|
|
Total swaps hedging fixed-rates bonds (current portion) (assets and liabilities)
|
|
|
327
|
|
|
|
5,167
|
|
|
|
5,167
|
|
|
|
—
|
|
|
|
—
|
|
|
|
—
|
|
|
|
—
|
|
|
|
—
|
|
|
Cash flow hedge
|
|
|
|
|
|
|
|
|
|
|
|
|
|
|
|
|
|
|
|
|
|
|
|
|
|
|
|
|
|
|
|
|
|
Swaps hedging fixed-rates bonds (liabilities)
|
|
|
(3
|
)
|
|
|
247
|
|
|
|
—
|
|
|
|
—
|
|
|
|
—
|
|
|
|
—
|
|
|
|
—
|
|
|
|
—
|
|
|
Swaps hedging fixed-rates bonds (assets)
|
|
|
235
|
|
|
|
2,221
|
|
|
|
—
|
|
|
|
—
|
|
|
|
—
|
|
|
|
—
|
|
|
|
—
|
|
|
|
—
|
|
|
Total swaps hedging fixed-rates bonds (assets and liabilities)
|
|
|
232
|
|
|
|
2,468
|
|
|
|
—
|
|
|
|
—
|
|
|
|
—
|
|
|
|
—
|
|
|
|
969
|
|
|
|
1,499
|
|
|
Swaps hedging fixed-rates bonds (current portion) (liabilities)
|
|
|
—
|
|
|
|
—
|
|
|
|
—
|
|
|
|
—
|
|
|
|
—
|
|
|
|
—
|
|
|
|
—
|
|
|
|
—
|
|
|
Swaps hedging fixed-rates bonds (current portion) (assets)
|
|
|
—
|
|
|
|
—
|
|
|
|
—
|
|
|
|
—
|
|
|
|
—
|
|
|
|
—
|
|
|
|
—
|
|
|
|
—
|
|
|
Total swaps hedging fixed-rates bonds (current portion) (assets and liabilities)
|
|
|
—
|
|
|
|
—
|
|
|
|
—
|
|
|
|
—
|
|
|
|
—
|
|
|
|
—
|
|
|
|
—
|
|
|
|
—
|
|
|
Swaps hedging investments (liabilities)
|
|
|
(4
|
)
|
|
|
45
|
|
|
|
—
|
|
|
|
—
|
|
|
|
—
|
|
|
|
—
|
|
|
|
—
|
|
|
|
—
|
|
|
Swaps hedging investments (assets)
|
|
|
7
|
|
|
|
146
|
|
|
|
—
|
|
|
|
—
|
|
|
|
—
|
|
|
|
—
|
|
|
|
—
|
|
|
|
—
|
|
|
Total swaps hedging investments (assets and liabilities)
|
|
|
3
|
|
|
|
191
|
|
|
|
191
|
|
|
|
—
|
|
|
|
—
|
|
|
|
—
|
|
|
|
—
|
|
|
|
—
|
|
|
Net investment hedge
|
|
|
|
|
|
|
|
|
|
|
|
|
|
|
|
|
|
|
|
|
|
|
|
|
|
|
|
|
|
|
|
|
|
Currency swaps and forward exchange contracts (assets)
|
|
|
—
|
|
|
|
—
|
|
|
|
—
|
|
|
|
—
|
|
|
|
—
|
|
|
|
—
|
|
|
|
—
|
|
|
|
—
|
|
|
Currency swaps and forward exchange contracts (liabilities)
|
|
|
—
|
|
|
|
—
|
|
|
|
—
|
|
|
|
—
|
|
|
|
—
|
|
|
|
—
|
|
|
|
—
|
|
|
|
—
|
|
|
Total swaps hedging net investments
|
|
|
—
|
|
|
|
—
|
|
|
|
—
|
|
|
|
—
|
|
|
|
—
|
|
|
|
—
|
|
|
|
—
|
|
|
|
—
|
|
|
Held for trading
|
|
|
|
|
|
|
|
|
|
|
|
|
|
|
|
|
|
|
|
|
|
|
|
|
|
|
|
|
|
|
|
|
|
Other interest rate swaps (assets)
|
|
|
10
|
|
|
|
14,537
|
|
|
|
—
|
|
|
|
—
|
|
|
|
—
|
|
|
|
—
|
|
|
|
—
|
|
|
|
—
|
|
|
Other interest rate swaps (liabilities)
|
|
|
(8
|
)
|
|
|
11,443
|
|
|
|
—
|
|
|
|
—
|
|
|
|
—
|
|
|
|
—
|
|
|
|
—
|
|
|
|
—
|
|
|
Total other interest rate swaps (assets and liabilities)
|
|
|
2
|
|
|
|
25,980
|
|
|
|
25,720
|
|
|
|
109
|
|
|
|
83
|
|
|
|
68
|
|
|
|
—
|
|
|
|
—
|
|
|
Currency swaps and forward exchange contracts (assets)
|
|
|
354
|
|
|
|
14,584
|
|
|
|
—
|
|
|
|
—
|
|
|
|
—
|
|
|
|
—
|
|
|
|
—
|
|
|
|
—
|
|
|
Currency swaps and forward exchange contracts (liabilities)
|
|
|
(39
|
)
|
|
|
1,970
|
|
|
|
—
|
|
|
|
—
|
|
|
|
—
|
|
|
|
—
|
|
|
|
—
|
|
|
|
—
|
|
|
Total currency swaps and forward exchange contracts (assets and
liabilities)
|
|
|
315
|
|
|
|
16,554
|
|
|
|
16,106
|
|
|
|
308
|
|
|
|
89
|
|
|
|
45
|
|
|
|
1
|
|
|
|
5
|
|
|
(a)
|
These amounts set the levels of notional commitment and are not indicative of a contingent gain or loss.
|
|
|
|
|
|
F-66
|
|
TOTAL S.A. Form 20-F 2015
|
Note 29 – Notes to the Consolidated Financial Statements
|
|
|
|
|
|
|
|
|
|
|
|
|
|
|
|
|
|
|
|
|
|
|
|
|
|
|
|
|
|
|
|
|
|
|
For the year ended
December 31, 2013 (M$)
Assets / (Liabilities)
|
|
|
|
|
Notional value
(a)
|
|
|
|
Fair
value
|
|
|
Total
|
|
|
2014
|
|
|
2015
|
|
|
2016
|
|
|
2017
|
|
|
2018
|
|
|
2019
and
after
|
|
|
Fair value hedge
|
|
|
|
|
|
|
|
|
|
|
|
|
|
|
|
|
|
|
|
|
|
|
|
|
|
|
|
|
|
|
|
|
|
Swaps hedging fixed-rates bonds (liabilities)
|
|
|
(325
|
)
|
|
|
10,316
|
|
|
|
—
|
|
|
|
—
|
|
|
|
—
|
|
|
|
—
|
|
|
|
—
|
|
|
|
—
|
|
|
Swaps hedging fixed-rates bonds (assets)
|
|
|
1,204
|
|
|
|
16,764
|
|
|
|
—
|
|
|
|
—
|
|
|
|
—
|
|
|
|
—
|
|
|
|
—
|
|
|
|
—
|
|
|
Total swaps hedging fixed-rates bonds (assets and liabilities)
|
|
|
879
|
|
|
|
27,080
|
|
|
|
—
|
|
|
|
4,703
|
|
|
|
3,594
|
|
|
|
4,096
|
|
|
|
5,170
|
|
|
|
9,517
|
|
|
Swaps hedging fixed-rates bonds (current portion) (liabilities)
|
|
|
(314
|
)
|
|
|
1,884
|
|
|
|
—
|
|
|
|
—
|
|
|
|
—
|
|
|
|
—
|
|
|
|
—
|
|
|
|
—
|
|
|
Swaps hedging fixed-rates bonds (current portion) (assets)
|
|
|
469
|
|
|
|
3,852
|
|
|
|
—
|
|
|
|
—
|
|
|
|
—
|
|
|
|
—
|
|
|
|
—
|
|
|
|
—
|
|
|
Total swaps hedging fixed-rates bonds (current portion) (assets and liabilities)
|
|
|
155
|
|
|
|
5,736
|
|
|
|
5,736
|
|
|
|
—
|
|
|
|
—
|
|
|
|
—
|
|
|
|
—
|
|
|
|
—
|
|
|
Cash flow hedge
|
|
|
|
|
|
|
|
|
|
|
|
|
|
|
|
|
|
|
|
|
|
|
|
|
|
|
|
|
|
|
|
|
|
Swaps hedging fixed-rates bonds (liabilities)
|
|
|
—
|
|
|
|
—
|
|
|
|
—
|
|
|
|
—
|
|
|
|
—
|
|
|
|
—
|
|
|
|
—
|
|
|
|
—
|
|
|
Swaps hedging fixed-rates bonds (assets)
|
|
|
214
|
|
|
|
2,220
|
|
|
|
—
|
|
|
|
—
|
|
|
|
—
|
|
|
|
—
|
|
|
|
—
|
|
|
|
—
|
|
|
Total swaps hedging fixed-rates bonds (assets and liabilities)
|
|
|
214
|
|
|
|
2,220
|
|
|
|
—
|
|
|
|
—
|
|
|
|
—
|
|
|
|
—
|
|
|
|
—
|
|
|
|
2,220
|
|
|
Swaps hedging fixed-rates bonds (current portion) (liabilities)
|
|
|
(6
|
)
|
|
|
166
|
|
|
|
—
|
|
|
|
—
|
|
|
|
—
|
|
|
|
—
|
|
|
|
—
|
|
|
|
—
|
|
|
Swaps hedging fixed-rates bonds (current portion) (assets)
|
|
|
1
|
|
|
|
132
|
|
|
|
—
|
|
|
|
—
|
|
|
|
—
|
|
|
|
—
|
|
|
|
—
|
|
|
|
—
|
|
|
Total swaps hedging fixed-rates bonds (current portion) (assets and liabilities)
|
|
|
(5
|
)
|
|
|
298
|
|
|
|
270
|
|
|
|
28
|
|
|
|
—
|
|
|
|
—
|
|
|
|
—
|
|
|
|
—
|
|
|
Swaps hedging investments (liabilities)
|
|
|
(26
|
)
|
|
|
197
|
|
|
|
—
|
|
|
|
—
|
|
|
|
—
|
|
|
|
—
|
|
|
|
—
|
|
|
|
—
|
|
|
Swaps hedging investments (assets)
|
|
|
—
|
|
|
|
—
|
|
|
|
—
|
|
|
|
—
|
|
|
|
—
|
|
|
|
—
|
|
|
|
—
|
|
|
|
—
|
|
|
Total swaps hedging investments (assets and liabilities)
|
|
|
(26
|
)
|
|
|
197
|
|
|
|
182
|
|
|
|
15
|
|
|
|
—
|
|
|
|
—
|
|
|
|
—
|
|
|
|
—
|
|
|
Net investment hedge
|
|
|
|
|
|
|
|
|
|
|
|
|
|
|
|
|
|
|
|
|
|
|
|
|
|
|
|
|
|
|
|
|
|
Currency swaps and forward exchange contracts (assets)
|
|
|
—
|
|
|
|
—
|
|
|
|
—
|
|
|
|
—
|
|
|
|
—
|
|
|
|
—
|
|
|
|
—
|
|
|
|
—
|
|
|
Currency swaps and forward exchange contracts (liabilities)
|
|
|
—
|
|
|
|
—
|
|
|
|
—
|
|
|
|
—
|
|
|
|
—
|
|
|
|
—
|
|
|
|
—
|
|
|
|
—
|
|
|
Total swaps hedging net investments
|
|
|
—
|
|
|
|
—
|
|
|
|
—
|
|
|
|
—
|
|
|
|
—
|
|
|
|
—
|
|
|
|
—
|
|
|
|
—
|
|
|
Held for trading
|
|
|
|
|
|
|
|
|
|
|
|
|
|
|
|
|
|
|
|
|
|
|
|
|
|
|
|
|
|
|
|
|
|
Other interest rate swaps (assets)
|
|
|
3
|
|
|
|
5,645
|
|
|
|
—
|
|
|
|
—
|
|
|
|
—
|
|
|
|
—
|
|
|
|
—
|
|
|
|
—
|
|
|
Other interest rate swaps (liabilities)
|
|
|
(4
|
)
|
|
|
15,606
|
|
|
|
—
|
|
|
|
—
|
|
|
|
—
|
|
|
|
—
|
|
|
|
—
|
|
|
|
—
|
|
|
Total other interest rate swaps (assets and liabilities)
|
|
|
(1
|
)
|
|
|
21,251
|
|
|
|
20,862
|
|
|
|
119
|
|
|
|
114
|
|
|
|
86
|
|
|
|
70
|
|
|
|
—
|
|
|
Currency swaps and forward exchange contracts (assets)
|
|
|
105
|
|
|
|
6,576
|
|
|
|
—
|
|
|
|
—
|
|
|
|
—
|
|
|
|
—
|
|
|
|
—
|
|
|
|
—
|
|
|
Currency swaps and forward exchange contracts (liabilities)
|
|
|
(57
|
)
|
|
|
6,119
|
|
|
|
—
|
|
|
|
—
|
|
|
|
—
|
|
|
|
—
|
|
|
|
—
|
|
|
|
—
|
|
|
Total currency swaps and forward exchange contracts (assets and
liabilities)
|
|
|
48
|
|
|
|
12,695
|
|
|
|
12,336
|
|
|
|
268
|
|
|
|
58
|
|
|
|
14
|
|
|
|
19
|
|
|
|
—
|
|
|
(a)
|
These amounts set the levels of notional commitment and are not indicative of a
contingent gain or loss.
|
D) Fair value hierarchy
The fair value hierarchy for financial instruments, excluding commodity contracts, is as follows:
|
|
|
|
|
|
|
|
|
|
|
|
|
|
|
|
|
|
|
As of December 31, 2015 (M$)
|
|
Quoted prices in
active markets
for
identical
assets
(level 1)
|
|
|
Prices based on
observable data
(level 2)
|
|
|
Prices based on
non observable
data
(level 3)
|
|
|
Total
|
|
|
Fair value hedge instruments
|
|
|
—
|
|
|
|
(1,723
|
)
|
|
|
—
|
|
|
|
(1,723
|
)
|
|
Cash flow hedge instruments
|
|
|
—
|
|
|
|
49
|
|
|
|
—
|
|
|
|
49
|
|
|
Net investment hedge instruments
|
|
|
—
|
|
|
|
—
|
|
|
|
—
|
|
|
|
—
|
|
|
Assets and liabilities held for trading
|
|
|
—
|
|
|
|
68
|
|
|
|
—
|
|
|
|
68
|
|
|
Assets available for sale
|
|
|
59
|
|
|
|
—
|
|
|
|
—
|
|
|
|
59
|
|
|
Total
|
|
|
59
|
|
|
|
(1,606
|
)
|
|
|
—
|
|
|
|
(1,547
|
)
|
|
|
|
|
|
|
|
|
|
|
|
|
|
|
|
|
|
|
|
As of December 31, 2014 (M$)
|
|
Quoted prices in
active markets
for
identical
assets
(level 1)
|
|
|
Prices based on
observable data
(level 2)
|
|
|
Prices based on
non observable
data
(level 3)
|
|
|
Total
|
|
|
Fair value hedge instruments
|
|
|
—
|
|
|
|
467
|
|
|
|
—
|
|
|
|
467
|
|
|
Cash flow hedge instruments
|
|
|
—
|
|
|
|
235
|
|
|
|
—
|
|
|
|
235
|
|
|
Net investment hedge instruments
|
|
|
—
|
|
|
|
—
|
|
|
|
—
|
|
|
|
—
|
|
|
Assets and liabilities held for trading
|
|
|
—
|
|
|
|
317
|
|
|
|
—
|
|
|
|
317
|
|
|
Assets available for sale
|
|
|
84
|
|
|
|
—
|
|
|
|
—
|
|
|
|
84
|
|
|
Total
|
|
|
84
|
|
|
|
1,019
|
|
|
|
—
|
|
|
|
1,103
|
|
|
|
|
|
|
2015 Form 20-F TOTAL S.A.
|
|
F-67
|
Notes to the Consolidated Financial Statements – Note 29
|
|
|
|
|
|
|
|
|
|
|
|
|
|
|
|
|
|
|
As of December 31, 2013 (M$)
|
|
Quoted prices in
active markets
for
identical
assets
(level 1)
|
|
|
Prices based on
observable data
(level 2)
|
|
|
Prices based on
non observable
data
(level 3)
|
|
|
Total
|
|
|
Fair value hedge instruments
|
|
|
—
|
|
|
|
1,034
|
|
|
|
—
|
|
|
|
1,034
|
|
|
Cash flow hedge instruments
|
|
|
—
|
|
|
|
183
|
|
|
|
—
|
|
|
|
183
|
|
|
Net investment hedge instruments
|
|
|
—
|
|
|
|
—
|
|
|
|
—
|
|
|
|
—
|
|
|
Assets and liabilities held for trading
|
|
|
—
|
|
|
|
47
|
|
|
|
—
|
|
|
|
47
|
|
|
Assets available for sale
|
|
|
160
|
|
|
|
—
|
|
|
|
—
|
|
|
|
160
|
|
|
Total
|
|
|
160
|
|
|
|
1,264
|
|
|
|
—
|
|
|
|
1,424
|
|
The description of each fair value level is presented in Note 1 paragraph M(v) to the Consolidated Financial Statements.
|
|
|
|
|
F-68
|
|
TOTAL S.A. Form 20-F 2015
|
Note 30 – Notes to the Consolidated Financial Statements
30)
Financial instruments related to commodity contracts
Financial instruments related to oil, gas and power activities as well as related currency derivatives are recorded at fair value under “Other current
assets” or “Other creditors and accrued liabilities” depending on whether they are assets or liabilities.
|
|
|
|
|
|
|
|
|
|
|
|
|
|
|
|
|
|
|
|
|
|
|
|
|
|
|
|
|
|
|
|
|
|
|
|
|
|
|
As of December 31, 2015 (M$)
Assets / (Liabilities)
|
|
Gross value
before
offsetting –
assets
|
|
|
Gross value
before
offsetting –
liabilities
|
|
|
Amounts
offset-assets
(c)
|
|
|
Amounts
offset –
liabilities
(c)
|
|
|
Net balance
sheet value
presented –
assets
|
|
|
Net balance
sheet value
presented –
liabilities
|
|
|
Other
amounts not
offset
|
|
|
Net carrying
amount
|
|
|
Fair value
(b)
|
|
|
Crude oil, petroleum products and freight rates activities
|
|
|
|
|
|
|
|
|
|
|
|
|
|
|
|
|
|
|
|
|
|
|
|
|
|
|
|
|
|
|
|
|
|
|
|
|
|
Petroleum products and crude oil swaps
|
|
|
1,517
|
|
|
|
(498
|
)
|
|
|
(350
|
)
|
|
|
350
|
|
|
|
1,167
|
|
|
|
(148
|
)
|
|
|
—
|
|
|
|
1,019
|
|
|
|
1,019
|
|
|
Freight rate swaps
|
|
|
—
|
|
|
|
—
|
|
|
|
—
|
|
|
|
—
|
|
|
|
—
|
|
|
|
—
|
|
|
|
—
|
|
|
|
—
|
|
|
|
—
|
|
|
Forwards
(a)
|
|
|
68
|
|
|
|
(130
|
)
|
|
|
(25
|
)
|
|
|
25
|
|
|
|
43
|
|
|
|
(105
|
)
|
|
|
—
|
|
|
|
(62
|
)
|
|
|
(62)
|
|
|
Options
|
|
|
660
|
|
|
|
(468
|
)
|
|
|
(460
|
)
|
|
|
460
|
|
|
|
200
|
|
|
|
(8
|
)
|
|
|
—
|
|
|
|
192
|
|
|
|
192
|
|
|
Futures
|
|
|
9
|
|
|
|
—
|
|
|
|
—
|
|
|
|
—
|
|
|
|
9
|
|
|
|
—
|
|
|
|
—
|
|
|
|
9
|
|
|
|
9
|
|
|
Options on futures
|
|
|
127
|
|
|
|
(128
|
)
|
|
|
(127
|
)
|
|
|
127
|
|
|
|
—
|
|
|
|
(1
|
)
|
|
|
—
|
|
|
|
(1
|
)
|
|
|
(1)
|
|
|
Other / Collateral
|
|
|
—
|
|
|
|
—
|
|
|
|
—
|
|
|
|
—
|
|
|
|
—
|
|
|
|
—
|
|
|
|
(1,145
|
)
|
|
|
(1,145
|
)
|
|
|
(1,145)
|
|
|
Total crude oil, petroleum products and freight rates
|
|
|
2,381
|
|
|
|
(1,224
|
)
|
|
|
(962
|
)
|
|
|
962
|
|
|
|
1,419
|
|
|
|
(262
|
)
|
|
|
(1,145
|
)
|
|
|
12
|
|
|
|
12
|
|
|
Gas activities
|
|
|
|
|
|
|
|
|
|
|
|
|
|
|
|
|
|
|
|
|
|
|
|
|
|
|
|
|
|
|
|
|
|
|
|
|
|
Swaps
|
|
|
50
|
|
|
|
(175
|
)
|
|
|
(19
|
)
|
|
|
19
|
|
|
|
31
|
|
|
|
(156
|
)
|
|
|
—
|
|
|
|
(125
|
)
|
|
|
(125)
|
|
|
Forwards
(a)
|
|
|
2,255
|
|
|
|
(1,498
|
)
|
|
|
(320
|
)
|
|
|
320
|
|
|
|
1,935
|
|
|
|
(1,178
|
)
|
|
|
—
|
|
|
|
757
|
|
|
|
757
|
|
|
Options
|
|
|
5
|
|
|
|
(24
|
)
|
|
|
(11
|
)
|
|
|
11
|
|
|
|
(6
|
)
|
|
|
(13
|
)
|
|
|
—
|
|
|
|
(19
|
)
|
|
|
(19)
|
|
|
Futures
|
|
|
—
|
|
|
|
—
|
|
|
|
—
|
|
|
|
—
|
|
|
|
—
|
|
|
|
—
|
|
|
|
—
|
|
|
|
—
|
|
|
|
—
|
|
|
Other / Collateral
|
|
|
—
|
|
|
|
—
|
|
|
|
—
|
|
|
|
—
|
|
|
|
—
|
|
|
|
—
|
|
|
|
23
|
|
|
|
23
|
|
|
|
23
|
|
|
Total Gas
|
|
|
2,310
|
|
|
|
(1,697
|
)
|
|
|
(350
|
)
|
|
|
350
|
|
|
|
1,960
|
|
|
|
(1,347
|
)
|
|
|
23
|
|
|
|
636
|
|
|
|
636
|
|
|
Total
|
|
|
4,691
|
|
|
|
(2,921
|
)
|
|
|
(1,312
|
)
|
|
|
1,312
|
|
|
|
3,379
|
|
|
|
(1,609
|
)
|
|
|
(1,122
|
)
|
|
|
648
|
|
|
|
648
|
|
|
Total of fair value non recognized in the balance sheet
|
|
|
|
|
|
|
|
|
|
|
|
|
|
|
|
|
|
|
|
|
|
|
|
|
|
|
|
|
|
|
|
|
|
|
—
|
|
|
(a)
|
Forwards: contracts resulting in physical delivery are accounted for as derivative
commodity contracts and included in the amounts shown.
|
|
(b)
|
When the fair value of derivatives listed on an organized exchange market (futures, options on futures and swaps) is offset with the margin call received or
paid in the balance sheet, this fair value is set to zero.
|
|
(c)
|
Amounts offset in accordance with IAS 32.
|
|
|
|
|
|
2015 Form 20-F TOTAL S.A.
|
|
F-69
|
Notes to the Consolidated Financial Statements – Note 30
|
|
|
|
|
|
|
|
|
|
|
|
|
|
|
|
|
|
|
|
|
|
|
|
|
|
|
|
|
|
|
|
|
|
|
|
|
|
|
As of December 31, 2014 (M$)
Assets / (Liabilities)
|
|
Gross value
before
offsetting –
assets
|
|
|
Gross value
before
offsetting –
liabilities
|
|
|
Amounts
offset –
assets
(c)
|
|
|
Amounts
offset –
liabilities
(c)
|
|
|
Net balance
sheet value
presented –
assets
|
|
|
Net balance
sheet value
presented –
liabilities
|
|
|
Other
amounts not
offset
|
|
|
Net carrying
amount
|
|
|
Fair value
(b)
|
|
|
Crude oil, petroleum products and freight rates activities
|
|
|
|
|
|
|
|
|
|
|
|
|
|
|
|
|
|
|
|
|
|
|
|
|
|
|
|
|
|
|
|
|
|
|
|
|
|
Petroleum products and crude oil swaps
|
|
|
1,505
|
|
|
|
(465
|
)
|
|
|
(384
|
)
|
|
|
384
|
|
|
|
1,121
|
|
|
|
(81
|
)
|
|
|
—
|
|
|
|
1,040
|
|
|
|
1,040
|
|
|
Freight rate swaps
|
|
|
—
|
|
|
|
—
|
|
|
|
—
|
|
|
|
—
|
|
|
|
—
|
|
|
|
—
|
|
|
|
—
|
|
|
|
—
|
|
|
|
—
|
|
|
Forwards
(a)
|
|
|
168
|
|
|
|
(197
|
)
|
|
|
(56
|
)
|
|
|
56
|
|
|
|
112
|
|
|
|
(141
|
)
|
|
|
—
|
|
|
|
(29
|
)
|
|
|
(29
|
)
|
|
Options
|
|
|
928
|
|
|
|
(1,224
|
)
|
|
|
(790
|
)
|
|
|
790
|
|
|
|
138
|
|
|
|
(434
|
)
|
|
|
—
|
|
|
|
(296
|
)
|
|
|
(296
|
)
|
|
Futures
|
|
|
5
|
|
|
|
—
|
|
|
|
—
|
|
|
|
—
|
|
|
|
5
|
|
|
|
—
|
|
|
|
—
|
|
|
|
5
|
|
|
|
5
|
|
|
Options on futures
|
|
|
307
|
|
|
|
(130
|
)
|
|
|
(130
|
)
|
|
|
130
|
|
|
|
177
|
|
|
|
—
|
|
|
|
—
|
|
|
|
177
|
|
|
|
177
|
|
|
Other / Collateral
|
|
|
—
|
|
|
|
—
|
|
|
|
—
|
|
|
|
—
|
|
|
|
—
|
|
|
|
—
|
|
|
|
(505
|
)
|
|
|
(505
|
)
|
|
|
(505
|
)
|
|
Total crude oil, petroleum products and freight rates
|
|
|
2,913
|
|
|
|
(2,016
|
)
|
|
|
(1,360
|
)
|
|
|
1,360
|
|
|
|
1,553
|
|
|
|
(656
|
)
|
|
|
(505
|
)
|
|
|
392
|
|
|
|
392
|
|
|
Gas activities
|
|
|
|
|
|
|
|
|
|
|
|
|
|
|
|
|
|
|
|
|
|
|
|
|
|
|
|
|
|
|
|
|
|
|
|
|
|
Swaps
|
|
|
138
|
|
|
|
(41
|
)
|
|
|
(19
|
)
|
|
|
19
|
|
|
|
119
|
|
|
|
(22
|
)
|
|
|
—
|
|
|
|
97
|
|
|
|
97
|
|
|
Forwards
(a)
|
|
|
1,110
|
|
|
|
(671
|
)
|
|
|
(278
|
)
|
|
|
278
|
|
|
|
832
|
|
|
|
(393
|
)
|
|
|
—
|
|
|
|
439
|
|
|
|
439
|
|
|
Options
|
|
|
5
|
|
|
|
(9
|
)
|
|
|
(7
|
)
|
|
|
7
|
|
|
|
(2
|
)
|
|
|
(2
|
)
|
|
|
—
|
|
|
|
(4
|
)
|
|
|
(4
|
)
|
|
Futures
|
|
|
—
|
|
|
|
—
|
|
|
|
—
|
|
|
|
—
|
|
|
|
—
|
|
|
|
—
|
|
|
|
—
|
|
|
|
—
|
|
|
|
—
|
|
|
Other / Collateral
|
|
|
—
|
|
|
|
—
|
|
|
|
—
|
|
|
|
—
|
|
|
|
—
|
|
|
|
—
|
|
|
|
(89
|
)
|
|
|
(89
|
)
|
|
|
(89
|
)
|
|
Total Gas
|
|
|
1,253
|
|
|
|
(721
|
)
|
|
|
(304
|
)
|
|
|
304
|
|
|
|
949
|
|
|
|
(417
|
)
|
|
|
(89
|
)
|
|
|
443
|
|
|
|
443
|
|
|
Total
|
|
|
4,166
|
|
|
|
(2,737
|
)
|
|
|
(1,664
|
)
|
|
|
1,664
|
|
|
|
2,502
|
|
|
|
(1,073
|
)
|
|
|
(594
|
)
|
|
|
835
|
|
|
|
835
|
|
|
Total of fair value non recognized in the balance sheet
|
|
|
|
|
|
|
|
|
|
|
|
|
|
|
|
|
|
|
|
|
|
|
|
|
|
|
|
|
|
|
|
|
|
|
—
|
|
|
(a)
|
Forwards: contracts resulting in physical delivery are accounted for as derivative commodity contracts and included in the amounts shown.
|
|
(b)
|
When the fair value of derivatives listed on an organized exchange market (futures, options on futures and swaps) is offset with the margin call received or
paid in the balance sheet, this fair value is set to zero.
|
|
(c)
|
Amounts offset in accordance with IAS 32.
|
|
|
|
|
|
F-70
|
|
TOTAL S.A. Form 20-F 2015
|
Note 30 – Notes to the Consolidated Financial Statements
|
|
|
|
|
|
|
|
|
|
|
|
|
|
|
|
|
|
|
|
|
|
|
|
|
|
|
|
|
|
|
|
|
|
|
|
|
|
|
As of December 31, 2013 (M$)
Assets / (Liabilities)
|
|
Gross value
before
offsetting –
assets
|
|
|
Gross value
before
offsetting –
liabilities
|
|
|
Amounts
offset –
assets
(c)
|
|
|
Amounts
offset –
liabilities
(c)
|
|
|
Net balance
sheet value
presented –
assets
|
|
|
Net balance
sheet value
presented –
liabilities
|
|
|
Other
amounts not
offset
|
|
|
Net carrying
amount
|
|
|
Fair value
(b)
|
|
|
Crude oil, petroleum products and freight rates activities
|
|
|
|
|
|
|
|
|
|
|
|
|
|
|
|
|
|
|
|
|
|
|
|
|
|
|
|
|
|
|
|
|
|
|
|
|
|
Petroleum products and crude oil swaps
|
|
|
94
|
|
|
|
(204
|
)
|
|
|
(79
|
)
|
|
|
79
|
|
|
|
15
|
|
|
|
(125
|
)
|
|
|
—
|
|
|
|
(110
|
)
|
|
|
(110
|
)
|
|
Freight rate swaps
|
|
|
—
|
|
|
|
—
|
|
|
|
—
|
|
|
|
—
|
|
|
|
—
|
|
|
|
—
|
|
|
|
—
|
|
|
|
—
|
|
|
|
—
|
|
|
Forwards
(a)
|
|
|
58
|
|
|
|
(57
|
)
|
|
|
(8
|
)
|
|
|
8
|
|
|
|
50
|
|
|
|
(49
|
)
|
|
|
—
|
|
|
|
1
|
|
|
|
1
|
|
|
Options
|
|
|
198
|
|
|
|
(234
|
)
|
|
|
(62
|
)
|
|
|
62
|
|
|
|
136
|
|
|
|
(172
|
)
|
|
|
—
|
|
|
|
(36
|
)
|
|
|
(36
|
)
|
|
Futures
|
|
|
7
|
|
|
|
(1
|
)
|
|
|
—
|
|
|
|
—
|
|
|
|
7
|
|
|
|
(1
|
)
|
|
|
—
|
|
|
|
6
|
|
|
|
6
|
|
|
Options on futures
|
|
|
68
|
|
|
|
(57
|
)
|
|
|
(57
|
)
|
|
|
57
|
|
|
|
11
|
|
|
|
—
|
|
|
|
—
|
|
|
|
11
|
|
|
|
11
|
|
|
Other / Collateral
|
|
|
—
|
|
|
|
—
|
|
|
|
—
|
|
|
|
—
|
|
|
|
—
|
|
|
|
—
|
|
|
|
96
|
|
|
|
96
|
|
|
|
96
|
|
|
Total crude oil, petroleum products and freight rates
|
|
|
425
|
|
|
|
(553
|
)
|
|
|
(206
|
)
|
|
|
206
|
|
|
|
219
|
|
|
|
(347
|
)
|
|
|
96
|
|
|
|
(32
|
)
|
|
|
(32
|
)
|
|
Gas activities
|
|
|
|
|
|
|
|
|
|
|
|
|
|
|
|
|
|
|
|
|
|
|
|
|
|
|
|
|
|
|
|
|
|
|
|
|
|
Swaps
|
|
|
69
|
|
|
|
(21
|
)
|
|
|
(11
|
)
|
|
|
11
|
|
|
|
58
|
|
|
|
(10
|
)
|
|
|
—
|
|
|
|
48
|
|
|
|
48
|
|
|
Forwards
(a)
|
|
|
1,052
|
|
|
|
(530
|
)
|
|
|
(40
|
)
|
|
|
40
|
|
|
|
1,012
|
|
|
|
(490
|
)
|
|
|
—
|
|
|
|
522
|
|
|
|
522
|
|
|
Options
|
|
|
—
|
|
|
|
(12
|
)
|
|
|
(11
|
)
|
|
|
11
|
|
|
|
(11
|
)
|
|
|
(1
|
)
|
|
|
—
|
|
|
|
(12
|
)
|
|
|
(12
|
)
|
|
Futures
|
|
|
—
|
|
|
|
—
|
|
|
|
—
|
|
|
|
—
|
|
|
|
—
|
|
|
|
—
|
|
|
|
—
|
|
|
|
—
|
|
|
|
—
|
|
|
Other / Collateral
|
|
|
—
|
|
|
|
—
|
|
|
|
—
|
|
|
|
—
|
|
|
|
—
|
|
|
|
—
|
|
|
|
16
|
|
|
|
16
|
|
|
|
16
|
|
|
Total Gas
|
|
|
1,121
|
|
|
|
(563
|
)
|
|
|
(62
|
)
|
|
|
62
|
|
|
|
1,059
|
|
|
|
(501
|
)
|
|
|
16
|
|
|
|
574
|
|
|
|
574
|
|
|
Total
|
|
|
1,546
|
|
|
|
(1,116
|
)
|
|
|
(268
|
)
|
|
|
268
|
|
|
|
1,278
|
|
|
|
(848
|
)
|
|
|
112
|
|
|
|
542
|
|
|
|
542
|
|
|
Total of fair value non recognized in the balance sheet
|
|
|
|
|
|
|
|
|
|
|
|
|
|
|
|
|
|
|
|
|
|
|
|
|
|
|
|
|
|
|
|
|
|
|
—
|
|
|
(a)
|
Forwards: contracts resulting in physical delivery are accounted for as derivative commodity contracts and included in the amounts shown.
|
|
(b)
|
When the fair value of derivatives listed on an organized exchange market (futures, options on futures and swaps) is offset with the margin call received or
paid in the balance sheet, this fair value is set to zero.
|
|
(c)
|
Amounts offset in accordance with IAS 32.
|
|
|
|
|
|
2015 Form 20-F TOTAL S.A.
|
|
F-71
|
Notes to the Consolidated Financial Statements – Note 31
Most commitments on crude oil and refined products have a short term maturity (less
than one year). The maturity of most Gas division derivatives is less than three years forward.
The changes in fair value of financial instruments
related to commodity contracts are detailed as follows:
|
|
|
|
|
|
|
|
|
|
|
|
|
|
|
|
|
|
|
|
|
|
|
For the year ended December 31, (M$)
|
|
Fair value
as of January 1,
|
|
|
Impact on
income
|
|
|
Settled
contracts
|
|
|
Other
|
|
|
Fair value
as of December 31,
|
|
|
Crude oil, petroleum products and freight rates activities
|
|
|
|
|
|
|
|
|
|
|
|
|
|
|
|
|
|
|
|
|
|
2015
|
|
|
897
|
|
|
|
3,318
|
|
|
|
(3,058
|
)
|
|
|
—
|
|
|
|
1,157
|
|
|
2014
|
|
|
(128
|
)
|
|
|
2,471
|
|
|
|
(1,445
|
)
|
|
|
(1
|
)
|
|
|
897
|
|
|
2013
|
|
|
(62
|
)
|
|
|
2,266
|
|
|
|
(2,330
|
)
|
|
|
(2
|
)
|
|
|
(128
|
)
|
|
Gas activities
|
|
|
|
|
|
|
|
|
|
|
|
|
|
|
|
|
|
|
|
|
|
2015
|
|
|
532
|
|
|
|
113
|
|
|
|
3
|
|
|
|
(35
|
)
|
|
|
613
|
|
|
2014
|
|
|
558
|
|
|
|
922
|
|
|
|
(909
|
)
|
|
|
(39
|
)
|
|
|
532
|
|
|
2013
|
|
|
359
|
|
|
|
624
|
|
|
|
(375
|
)
|
|
|
(50
|
)
|
|
|
558
|
|
The fair value hierarchy for financial instruments related to commodity contracts is as follows:
|
|
|
|
|
|
|
|
|
|
|
|
|
|
|
|
|
|
|
As of December 31, 2015 (M$)
|
|
Quoted prices
in active markets for
identical
assets
(level 1)
|
|
|
Prices based on
observable data
(level 2)
|
|
|
Prices based on
non observable
data (level 3)
|
|
|
Total
|
|
|
Crude oil, petroleum products and freight rates activities
|
|
|
15
|
|
|
|
1,142
|
|
|
|
—
|
|
|
|
1,157
|
|
|
Gas activities
|
|
|
79
|
|
|
|
534
|
|
|
|
—
|
|
|
|
613
|
|
|
Total
|
|
|
94
|
|
|
|
1,676
|
|
|
|
—
|
|
|
|
1,770
|
|
|
|
|
|
|
|
|
|
|
|
|
|
|
|
|
|
|
|
|
As of December 31, 2014 (M$)
|
|
Quoted prices
in active markets for
identical
assets
(level 1)
|
|
|
Prices based on
observable data
(level 2)
|
|
|
Prices based on
non observable
data (level 3)
|
|
|
Total
|
|
|
Crude oil, petroleum products and freight rates activities
|
|
|
239
|
|
|
|
658
|
|
|
|
—
|
|
|
|
897
|
|
|
Gas activities
|
|
|
92
|
|
|
|
440
|
|
|
|
—
|
|
|
|
532
|
|
|
Total
|
|
|
331
|
|
|
|
1,098
|
|
|
|
—
|
|
|
|
1,429
|
|
|
|
|
|
|
|
|
|
|
|
|
|
|
|
|
|
|
|
|
As of December 31, 2013 (M$)
|
|
Quoted prices
in active markets for
identical
assets
(level 1)
|
|
|
Prices based on
observable data
(level 2)
|
|
|
Prices based on
non observable
data (level 3)
|
|
|
Total
|
|
|
Crude oil, petroleum products and freight rates activities
|
|
|
21
|
|
|
|
(149
|
)
|
|
|
—
|
|
|
|
(128
|
)
|
|
Gas activities
|
|
|
—
|
|
|
|
558
|
|
|
|
—
|
|
|
|
558
|
|
|
Total
|
|
|
21
|
|
|
|
409
|
|
|
|
—
|
|
|
|
430
|
|
The description of each fair value level is presented in Note 1 paragraph M(v) to the Consolidated Financial Statements.
31)
Financial risks management
Oil and gas market related risks
Due to the nature of its business, the Group has significant oil and
gas trading activities as part of its day-to-day operations in order to optimize revenues from its oil and gas production and to obtain favorable pricing to supply its refineries.
In its international oil trading business, the Group follows a policy of not selling its future production. However, in connection with this trading business, the Group, like most other oil companies, uses energy
derivative instruments to adjust its exposure to price fluctuations of crude oil, refined products, natural gas, power and coal. The Group also uses freight rate derivative contracts in its shipping business to adjust its exposure to freight-rate
fluctuations. To hedge against this risk, the Group uses various instruments such as futures, forwards, swaps and options on organized markets or over-the-counter markets. The list of the different derivatives held by the Group in these markets is
detailed in Note 30 to the Consolidated Financial Statements.
The Trading & Shipping division measures its market risk exposure, i.e. potential
loss in fair values, on its crude oil, refined
products and freight rates trading activities using a value-at-risk technique. This technique is based on an historical model and makes an assessment of the market risk arising from possible
future changes in market values over a 24-hour period. The calculation of the range of potential changes in fair values takes into account a snapshot of the end-of-day exposures and the set of historical price movements for the last 400 business
days for all instruments and maturities in the global trading activities. Options are systematically re-evaluated using appropriate models.
The
potential movement in fair values corresponds to a 97.5% value-at-risk type confidence level. This means that the Group’s portfolio result is likely to exceed the value-at-risk loss measure once over 40 business days if the portfolio
exposures were left unchanged.
Trading & Shipping : value-at-risk with a 97.5% probability
|
|
|
|
|
|
|
|
|
|
|
|
|
|
|
|
|
|
|
As of December 31,
(M$)
|
|
High
|
|
|
Low
|
|
|
Average
|
|
|
Year
end
|
|
|
2015
|
|
|
11.6
|
|
|
|
5.5
|
|
|
|
8.6
|
|
|
|
7.4
|
|
|
2014
|
|
|
12.9
|
|
|
|
3.3
|
|
|
|
7.7
|
|
|
|
5.1
|
|
|
2013
|
|
|
12.9
|
|
|
|
4.5
|
|
|
|
8.2
|
|
|
|
9.8
|
|
|
|
|
|
|
F-72
|
|
TOTAL S.A. Form 20-F 2015
|
Note 31 – Notes to the Consolidated Financial Statements
As part of its gas, power and coal trading activity, the Group also uses derivative instruments such as futures,
forwards, swaps and options in both organized and over-the-counter markets. In general, the transactions are settled at maturity date through physical delivery. The Gas division measures its market risk exposure, i.e. potential loss in fair values,
on its trading business using a value-at-risk technique. This technique is based on an historical model and makes an assessment of the market risk arising from possible future changes in market values over a one-day period. The calculation of the
range of potential changes in fair values takes into account a snapshot of the end-of-day exposures and the set of historical price movements for the past two years for all instruments and maturities in the global trading business.
Gas division trading : value-at-risk with a 97.5% probability
|
|
|
|
|
|
|
|
|
|
|
|
|
|
|
|
|
|
|
As of December 31,
(M$)
|
|
High
|
|
|
Low
|
|
|
Average
|
|
|
Year
end
|
|
|
2015
|
|
|
15.8
|
|
|
|
2.0
|
|
|
|
7.1
|
|
|
|
8.0
|
|
|
2014
|
|
|
15.4
|
|
|
|
3.2
|
|
|
|
6.0
|
|
|
|
4.0
|
|
|
2013
|
|
|
11.4
|
|
|
|
3.0
|
|
|
|
5.8
|
|
|
|
6.2
|
|
The Group has implemented strict policies and procedures to manage and monitor these market risks. These are based on the separation
of control and front-office functions and on an integrated information system that enables real-time monitoring of trading activities.
Limits on trading
positions are approved by the Group’s Executive Committee and are monitored daily. To increase flexibility and encourage liquidity, hedging operations are performed with numerous independent operators, including other oil companies, major
energy producers or consumers and financial institutions. The Group has established counterparty limits and monitors outstanding amounts with each counterparty on an ongoing basis.
Financial markets related risks
As part of its financing and cash management activities, the Group uses
derivative instruments to manage its exposure to changes in interest rates and foreign exchange rates. These instruments are mainly interest rate and currency swaps. The Group may also occasionally use futures contracts and options. These operations
and their accounting treatment are detailed in Notes 1 paragraph M, 20, 28 and 29 to the Consolidated Financial Statements.
Risks relative to cash
management operations and to interest rate and foreign exchange financial instruments are managed according to rules set by the Group’s senior management, which provide for regular pooling of available cash balances, open positions and
management of the financial instruments by the Treasury Department. Excess cash of the Group is deposited mainly in government institutions, deposit banks, or major companies through deposits, reverse repurchase agreements and purchase of commercial
paper. Liquidity positions and the management of financial instruments are centralized by the Treasury Department, where they are managed by a team specialized in foreign exchange and interest rate market transactions.
The Cash Monitoring-Management Unit within the Treasury Department monitors limits and positions per bank on a daily basis and results of the Front Office. This
unit also prepares marked-to-market valuations of used financial instruments and, when necessary, performs sensitivity analysis.
Counterparty risk
The Group has established standards for market transactions under which bank counterparties must be approved in advance,
based on an assessment of the counterparty’s financial soundness (multi-criteria analysis including a review of market prices and of the Credit Default Swap (CDS), its ratings with
Standard & Poor’s and Moody’s, which must be of high quality, and its overall financial condition).
An overall authorized credit
limit is set for each bank and is allotted among the subsidiaries and the Group’s central treasury entities according to their needs.
To reduce the
market value risk on its commitments, in particular for swaps set as part of bonds issuance, the Treasury Department has concluded margin call contracts with significant counterparties.
Currency exposure
The Group generally seeks to minimize the currency exposure of each entity to its
functional currency (primarily the dollar, the euro, the pound sterling and the Norwegian krone).
For currency exposure generated by commercial
activity, the hedging of revenues and costs in foreign currencies is typically performed using currency operations on the spot market and, in some cases, on the forward market. The Group rarely hedges future cash flows, although it may use options
to do so.
With respect to currency exposure linked to non-current assets, the Group has a hedging policy of financing these assets in their functional
currency.
Net short-term currency exposure is periodically monitored against limits set by the Group’s senior management.
The non-current debt described in Note 20 to the Consolidated Financial Statements is generally raised by the corporate treasury entities either directly in dollars
or in euros, or in other currencies which are then exchanged for dollars or euros through swap issues to appropriately match general corporate needs. The proceeds from these debt issuances are loaned to affiliates whose accounts are kept in dollars
or in euros. Thus, the net sensitivity of these positions to currency exposure is not significant.
The Group’s short-term currency swaps, the
notional value of which appears in Note 29 to the Consolidated Financial Statements, are used to attempt to optimize the centralized cash management of the Group. Thus, the sensitivity to currency fluctuations which may be induced is likewise
considered negligible.
Short-term interest rate exposure and cash
Cash balances, which are primarily composed of euros and dollars, are managed according to the guidelines established by the Group’s senior management (to maintain an adequate level of liquidity, optimize
revenue from investments considering existing interest rate yield curves, and minimize the cost of borrowing) over a less than twelve-month horizon and on the basis of a daily interest rate benchmark, primarily through short-term interest rate swaps
and short-term currency swaps, without modifying currency exposure.
Interest rate risk on non-current debt
The Group’s policy consists of incurring non-current debt primarily at a floating rate, or, if the opportunity arises at the time of an issuance, at a fixed
rate. Debt is incurred in dollars, in euros according to general corporate needs. Long-term interest rate and currency swaps may be used to hedge bonds at their issuance in order to create a variable or fixed rate synthetic debt. In order to
partially modify the interest rate structure of the long-term debt, TOTAL may also enter into long-term interest rate swaps.
|
|
|
|
|
2015 Form 20-F TOTAL S.A.
|
|
F-73
|
Notes to the Consolidated Financial Statements – Note 31
Sensitivity analysis on interest rate and foreign exchange risk
The tables below present the potential impact of an increase or decrease of 10 basis points on the interest rate yield curves for each of the
currencies on the fair value of the current financial instruments as of December 31, 2015, 2014 and 2013.
|
|
|
|
|
|
|
|
|
|
|
|
|
|
|
|
|
|
|
|
|
|
|
|
|
|
|
Change in fair
value due to a change
in interest rate by
|
|
|
Assets /
(Liabilities) (M$)
|
|
Carrying
amount
|
|
|
Estimated
fair value
|
|
|
+ 10 basis
points
|
|
|
- 10 basis
points
|
|
|
As of December 31, 2015
|
|
|
|
|
|
|
|
|
|
|
|
|
|
|
|
|
|
Bonds (non-current portion, before swaps)
|
|
|
(39,257
|
)
|
|
|
(40,087
|
)
|
|
|
156
|
|
|
|
(156
|
)
|
|
Swaps hedging fixed-rates bonds (liabilities)
|
|
|
(2,891
|
)
|
|
|
(2,891
|
)
|
|
|
—
|
|
|
|
—
|
|
|
Swaps hedging fixed-rates bonds (assets)
|
|
|
1,219
|
|
|
|
1,219
|
|
|
|
—
|
|
|
|
—
|
|
|
Total swaps hedging fixed-rates bonds (assets and liabilities)
|
|
|
(1,672
|
)
|
|
|
(1,672
|
)
|
|
|
(144
|
)
|
|
|
144
|
|
|
Current portion of non-current debt after swap (excluding capital lease
obligations)
|
|
|
4,518
|
|
|
|
4,518
|
|
|
|
5
|
|
|
|
(5
|
)
|
|
Other interest rates swaps
|
|
|
(1
|
)
|
|
|
(1
|
)
|
|
|
8
|
|
|
|
(8
|
)
|
|
Currency swaps and forward exchange contracts
|
|
|
(26
|
)
|
|
|
(26
|
)
|
|
|
—
|
|
|
|
—
|
|
|
As of December 31, 2014
|
|
|
|
|
|
|
|
|
|
|
|
|
|
|
|
|
|
Bonds (non-current portion, before swaps)
|
|
|
(43,088
|
)
|
|
|
(44,079
|
)
|
|
|
292
|
|
|
|
(286
|
)
|
|
Swaps hedging fixed-rates bonds (liabilities)
|
|
|
(944
|
)
|
|
|
(944
|
)
|
|
|
—
|
|
|
|
—
|
|
|
Swaps hedging fixed-rates bonds (assets)
|
|
|
1,319
|
|
|
|
1,319
|
|
|
|
—
|
|
|
|
—
|
|
|
Total swaps hedging fixed-rates bonds (assets and liabilities)
|
|
|
375
|
|
|
|
375
|
|
|
|
(153
|
)
|
|
|
149
|
|
|
Current portion of non-current debt after swap (excluding capital lease obligations)
|
|
|
4,411
|
|
|
|
4,411
|
|
|
|
5
|
|
|
|
(4
|
)
|
|
Other interest rates swaps
|
|
|
2
|
|
|
|
2
|
|
|
|
3
|
|
|
|
(3
|
)
|
|
Currency swaps and forward exchange contracts
|
|
|
318
|
|
|
|
318
|
|
|
|
—
|
|
|
|
—
|
|
|
As of December 31, 2013
|
|
|
|
|
|
|
|
|
|
|
|
|
|
|
|
|
|
Bonds (non-current portion, before swaps)
|
|
|
(33,138
|
)
|
|
|
(33,966
|
)
|
|
|
54
|
|
|
|
(54
|
)
|
|
Swaps hedging fixed-rates bonds (liabilities)
|
|
|
(325
|
)
|
|
|
(325
|
)
|
|
|
—
|
|
|
|
—
|
|
|
Swaps hedging fixed-rates bonds (assets)
|
|
|
1,418
|
|
|
|
1,418
|
|
|
|
—
|
|
|
|
—
|
|
|
Total swaps hedging fixed-rates bonds (assets and liabilities)
|
|
|
1,092
|
|
|
|
1,092
|
|
|
|
(39
|
)
|
|
|
37
|
|
|
Current portion of non-current debt after swap (excluding capital lease obligations)
|
|
|
5,218
|
|
|
|
5,218
|
|
|
|
6
|
|
|
|
(6
|
)
|
|
Other interest rates swaps
|
|
|
(1
|
)
|
|
|
(1
|
)
|
|
|
(1
|
)
|
|
|
1
|
|
|
Currency swaps and forward exchange contracts
|
|
|
17
|
|
|
|
17
|
|
|
|
—
|
|
|
|
—
|
|
The impact of changes in interest rates on the cost of net debt before tax is as follows:
|
|
|
|
|
|
|
|
|
|
|
|
|
|
|
For the year ended December 31, (M$)
|
|
2015
|
|
|
2014
|
|
|
2013
|
|
|
Cost of net debt
|
|
|
(873
|
)
|
|
|
(640
|
)
|
|
|
(804
|
)
|
|
Interest rate translation of :
|
|
|
|
|
|
|
|
|
|
|
|
|
|
+ 10 basis points
|
|
|
(20
|
)
|
|
|
(19
|
)
|
|
|
(15
|
)
|
|
- 10 basis points
|
|
|
20
|
|
|
|
19
|
|
|
|
15
|
|
|
+ 100 basis points
|
|
|
(204
|
)
|
|
|
(193
|
)
|
|
|
(150
|
)
|
|
- 100 basis points
|
|
|
204
|
|
|
|
193
|
|
|
|
150
|
|
As a result of the policy for the management of currency exposure previously described, the Group’s sensitivity to currency
exposure is primarily influenced by the net equity of the subsidiaries whose functional currency is the euro and the ruble, and to a lesser extent, the pound sterling, the Norwegian krone.
|
|
|
|
|
F-74
|
|
TOTAL S.A. Form 20-F 2015
|
Note 31 – Notes to the Consolidated Financial Statements
This sensitivity is reflected in the historical evolution of the currency translation
adjustment recorded in the statement of changes in consolidated shareholders’ equity which, over the course of the last three years, is essentially related to the fluctuation of the euro, the ruble and the pound sterling and is set forth in the
table below:
|
|
|
|
|
|
|
|
|
|
|
|
|
|
|
|
|
|
|
|
|
|
|
Dollar / Euro
exchange rates
|
|
|
Dollar / Pound
sterling exchange
rates
|
|
|
Dollar / Ruble
exchange rates
|
|
|
December 31, 2015
|
|
|
|
|
0.92
|
|
|
|
|
|
0.67
|
|
|
|
|
|
74.10
|
|
|
December 31, 2014
|
|
|
|
|
0.82
|
|
|
|
|
|
0.64
|
|
|
|
|
|
59.58
|
|
|
December 31, 2013
|
|
|
|
|
0.73
|
|
|
|
|
|
0.60
|
|
|
|
|
|
32.87
|
|
|
|
|
|
|
|
|
|
|
|
|
|
|
|
|
|
|
|
|
|
|
|
|
|
|
|
|
|
|
|
|
|
|
|
|
As of
December 31, 2015 (M$)
|
|
Total
|
|
|
Euro
|
|
|
Dollar
|
|
|
Pound
sterling
|
|
|
Ruble
|
|
|
Other
currencies
|
|
|
Shareholders’ equity at historical exchange rate
|
|
|
104,613
|
|
|
|
37,345
|
|
|
|
46,272
|
|
|
|
5,926
|
|
|
|
6,816
|
|
|
|
8,254
|
|
|
Currency translation adjustment before net investment hedge
|
|
|
(12,119
|
)
|
|
|
(5,337
|
)
|
|
|
—
|
|
|
|
(1,145
|
)
|
|
|
(3,936
|
)
|
|
|
(1,701
|
)
|
|
Net investment hedge — open instruments
|
|
|
—
|
|
|
|
—
|
|
|
|
—
|
|
|
|
—
|
|
|
|
—
|
|
|
|
—
|
|
|
Shareholders’ equity at exchange rate as of December 31, 2015
|
|
|
92,494
|
|
|
|
32,008
|
|
|
|
46,272
|
|
|
|
4,781
|
|
|
|
2,880
|
|
|
|
6,553
|
|
|
|
|
|
|
|
|
|
|
As of
December 31, 2014 (M$)
|
|
Total
|
|
|
Euro
|
|
|
Dollar
|
|
|
Pound
sterling
|
|
|
Ruble
|
|
|
Other
currencies
|
|
|
Shareholders’ equity at historical exchange rate
|
|
|
97,810
|
|
|
|
26,056
|
|
|
|
50,179
|
|
|
|
6,762
|
|
|
|
6,489
|
|
|
|
8,324
|
|
|
Currency translation adjustment before net investment hedge
|
|
|
(7,480
|
)
|
|
|
(2,290
|
)
|
|
|
—
|
|
|
|
(894
|
)
|
|
|
(3,215
|
)
|
|
|
(1,081
|
)
|
|
Net investment hedge — open instruments
|
|
|
—
|
|
|
|
—
|
|
|
|
—
|
|
|
|
—
|
|
|
|
—
|
|
|
|
—
|
|
|
Shareholders’ equity at exchange rate as of December 31, 2014
|
|
|
90,330
|
|
|
|
23,766
|
|
|
|
50,179
|
|
|
|
5,868
|
|
|
|
3,274
|
|
|
|
7,243
|
|
|
|
|
|
|
|
|
|
|
As of
December 31, 2013 (M$)
|
|
Total
|
|
|
Euro
|
|
|
Dollar
|
|
|
Pound
sterling
|
|
|
Ruble
|
|
|
Other
currencies
|
|
|
Shareholders’ equity at historical exchange rate
|
|
|
101,444
|
|
|
|
30,444
|
|
|
|
50,053
|
|
|
|
6,776
|
|
|
|
6,960
|
|
|
|
7,211
|
|
|
Currency translation adjustment before net investment hedge
|
|
|
(1,203
|
)
|
|
|
148
|
|
|
|
—
|
|
|
|
(543
|
)
|
|
|
(607
|
)
|
|
|
(201
|
)
|
|
Net investment hedge — open instruments
|
|
|
—
|
|
|
|
—
|
|
|
|
—
|
|
|
|
—
|
|
|
|
—
|
|
|
|
—
|
|
|
Shareholders’ equity at exchange rate as of December 31, 2013
|
|
|
100,241
|
|
|
|
30,592
|
|
|
|
50,053
|
|
|
|
6,233
|
|
|
|
6,353
|
|
|
|
7,010
|
|
Based on the 2015 financial statements, a conversion using rates different from + or — 10% for each of the currencies below
would have the following impact on shareholders equity and net income:
|
|
|
|
|
|
|
|
|
|
|
|
|
|
|
As of December 31, 2015 (M$)
|
|
Euro
|
|
|
Pound
sterling
|
|
|
Ruble
|
|
|
Impact of an increase of 10% of exchange rates on :
|
|
|
|
|
|
|
|
|
|
|
|
|
|
— shareholders equity
|
|
|
3,201
|
|
|
|
478
|
|
|
|
288
|
|
|
— net income
|
|
|
225
|
|
|
|
29
|
|
|
|
24
|
|
|
Impact of a decrease of 10% of exchange rates on :
|
|
|
|
|
|
|
|
|
|
|
|
|
|
— shareholders equity
|
|
|
(3,201
|
)
|
|
|
(478
|
)
|
|
|
(288
|
)
|
|
— net income
|
|
|
(225
|
)
|
|
|
(29
|
)
|
|
|
(24
|
)
|
Stock market risk
The
Group holds interests in a number of publicly-traded companies (see Notes 12 and 13 to the Consolidated Financial Statements). The market value of these holdings fluctuates due to various factors, including stock market trends, valuations of the
sectors in which the companies operate, and the economic and financial condition of each individual company.
Liquidity risk
TOTAL S.A. has confirmed lines of credit granted by international banks, which are calculated to allow it to manage its short-term liquidity needs as required.
As of December 31, 2015, these lines of credit amounted to $10,675 million, of which $10,675 million was unused. The agreements for the lines of
credit granted to TOTAL S.A. do not contain conditions related to the Company’s financial ratios, to its financial ratings from specialized agencies, or to the occurrence of events that could have a material adverse effect on its financial
position. As of December 31, 2015, the aggregate amount of the principal confirmed lines of credit granted by international banks to Group companies, including TOTAL S.A., was $11,225 million, of which $11,225 million was unused. The lines
of credit granted to Group companies other than TOTAL S.A. are not intended to finance the Group’s general needs; they are intended to finance either the general needs of the borrowing subsidiary or a specific project.
|
|
|
|
|
2015 Form 20-F TOTAL S.A.
|
|
F-75
|
Notes to the Consolidated Financial Statements – Note 31
The following tables show the maturity of the financial assets and liabilities of the
Group as of December 31, 2015, 2014 and 2013 (see Note 20 to the Consolidated Financial Statements).
|
|
|
|
|
|
|
|
|
|
|
|
|
|
|
|
|
|
|
|
|
|
|
|
|
|
|
|
|
|
|
As of December 31, 2015 (M$)
Assets/(Liabilities)
|
|
Less than
one year
|
|
|
1-2 years
|
|
|
2-3 years
|
|
|
3-4 years
|
|
|
4-5 years
|
|
|
More than 5
years
|
|
|
Total
|
|
|
Non-current financial debt (notional value excluding interests)
|
|
|
—
|
|
|
|
(4,602
|
)
|
|
|
(4,420
|
)
|
|
|
(5,542
|
)
|
|
|
(4,965
|
)
|
|
|
(23,716
|
)
|
|
|
(43,245
|
)
|
|
Current borrowings
|
|
|
(12,488
|
)
|
|
|
—
|
|
|
|
—
|
|
|
|
—
|
|
|
|
—
|
|
|
|
—
|
|
|
|
(12,488
|
)
|
|
Other current financial liabilities
|
|
|
(171
|
)
|
|
|
—
|
|
|
|
—
|
|
|
|
—
|
|
|
|
—
|
|
|
|
—
|
|
|
|
(171
|
)
|
|
Current financial assets
|
|
|
6,190
|
|
|
|
—
|
|
|
|
—
|
|
|
|
—
|
|
|
|
—
|
|
|
|
—
|
|
|
|
6,190
|
|
|
Assets and liabilities available for sale or exchange
|
|
|
(141
|
)
|
|
|
—
|
|
|
|
—
|
|
|
|
—
|
|
|
|
—
|
|
|
|
—
|
|
|
|
(141
|
)
|
|
Cash and cash equivalents
|
|
|
23,269
|
|
|
|
—
|
|
|
|
—
|
|
|
|
—
|
|
|
|
—
|
|
|
|
—
|
|
|
|
23,269
|
|
|
Net amount before financial expense
|
|
|
16,659
|
|
|
|
(4,602
|
)
|
|
|
(4,420
|
)
|
|
|
(5,542
|
)
|
|
|
(4,965
|
)
|
|
|
(23,716
|
)
|
|
|
(26,586
|
)
|
|
Financial expense on non-current financial debt
|
|
|
(763
|
)
|
|
|
(813
|
)
|
|
|
(747
|
)
|
|
|
(663
|
)
|
|
|
(524
|
)
|
|
|
(1,104
|
)
|
|
|
(4,614
|
)
|
|
Interest differential on swaps
|
|
|
131
|
|
|
|
171
|
|
|
|
48
|
|
|
|
(55
|
)
|
|
|
(126
|
)
|
|
|
(610
|
)
|
|
|
(441
|
)
|
|
Net amount
|
|
|
16,027
|
|
|
|
(5,244
|
)
|
|
|
(5,119
|
)
|
|
|
(6,260
|
)
|
|
|
(5,615
|
)
|
|
|
(25,430
|
)
|
|
|
(31,641
|
)
|
|
|
|
|
|
|
|
|
|
|
|
|
|
|
|
|
|
|
|
|
|
|
|
|
|
|
|
|
|
|
|
|
|
|
|
|
|
|
|
|
As of December 31, 2014 (M$)
Assets/(Liabilities)
|
|
Less than
one year
|
|
|
1-2 years
|
|
|
2-3 years
|
|
|
3-4 years
|
|
|
4-5 years
|
|
|
More than 5
years
|
|
|
Total
|
|
|
Non-current financial debt (notional value excluding interests)
|
|
|
—
|
|
|
|
(4,793
|
)
|
|
|
(4,547
|
)
|
|
|
(4,451
|
)
|
|
|
(4,765
|
)
|
|
|
(25,606
|
)
|
|
|
(44,162
|
)
|
|
Current borrowings
|
|
|
(10,942
|
)
|
|
|
—
|
|
|
|
—
|
|
|
|
—
|
|
|
|
—
|
|
|
|
—
|
|
|
|
(10,942
|
)
|
|
Other current financial liabilities
|
|
|
(180
|
)
|
|
|
—
|
|
|
|
—
|
|
|
|
—
|
|
|
|
—
|
|
|
|
—
|
|
|
|
(180
|
)
|
|
Current financial assets
|
|
|
1,293
|
|
|
|
—
|
|
|
|
—
|
|
|
|
—
|
|
|
|
—
|
|
|
|
—
|
|
|
|
1,293
|
|
|
Assets and liabilities available for sale or exchange
|
|
|
56
|
|
|
|
—
|
|
|
|
—
|
|
|
|
—
|
|
|
|
—
|
|
|
|
—
|
|
|
|
56
|
|
|
Cash and cash equivalents
|
|
|
25,181
|
|
|
|
—
|
|
|
|
—
|
|
|
|
—
|
|
|
|
—
|
|
|
|
—
|
|
|
|
25,181
|
|
|
Net amount before financial expense
|
|
|
15,408
|
|
|
|
(4,793
|
)
|
|
|
(4,547
|
)
|
|
|
(4,451
|
)
|
|
|
(4,765
|
)
|
|
|
(25,606
|
)
|
|
|
(28,754
|
)
|
|
Financial expense on non-current financial debt
|
|
|
(901
|
)
|
|
|
(833
|
)
|
|
|
(783
|
)
|
|
|
(718
|
)
|
|
|
(624
|
)
|
|
|
(1,960
|
)
|
|
|
(5,819
|
)
|
|
Interest differential on swaps
|
|
|
369
|
|
|
|
167
|
|
|
|
(31
|
)
|
|
|
(127
|
)
|
|
|
(154
|
)
|
|
|
(790
|
)
|
|
|
(566
|
)
|
|
Net amount
|
|
|
14,876
|
|
|
|
(5,459
|
)
|
|
|
(5,361
|
)
|
|
|
(5,296
|
)
|
|
|
(5,543
|
)
|
|
|
(28,356
|
)
|
|
|
(35,139
|
)
|
|
|
|
|
|
|
|
|
|
|
|
|
|
|
|
|
|
|
|
|
|
|
|
|
|
|
|
|
|
|
|
|
|
|
|
|
|
|
|
|
As of December 31, 2013 (M$)
Assets/(Liabilities)
|
|
Less than
one year
|
|
|
1-2 years
|
|
|
2-3 years
|
|
|
3-4 years
|
|
|
4-5 years
|
|
|
More than 5
years
|
|
|
Total
|
|
|
Non-current financial debt (notional value excluding interests)
|
|
|
—
|
|
|
|
(4,647
|
)
|
|
|
(4,528
|
)
|
|
|
(4,159
|
)
|
|
|
(4,361
|
)
|
|
|
(15,461
|
)
|
|
|
(33,156
|
)
|
|
Current borrowings
|
|
|
(11,193
|
)
|
|
|
—
|
|
|
|
—
|
|
|
|
—
|
|
|
|
—
|
|
|
|
—
|
|
|
|
(11,193
|
)
|
|
Other current financial liabilities
|
|
|
(381
|
)
|
|
|
—
|
|
|
|
—
|
|
|
|
—
|
|
|
|
—
|
|
|
|
—
|
|
|
|
(381
|
)
|
|
Current financial assets
|
|
|
739
|
|
|
|
—
|
|
|
|
—
|
|
|
|
—
|
|
|
|
—
|
|
|
|
—
|
|
|
|
739
|
|
|
Assets and liabilities available for sale or exchange
|
|
|
179
|
|
|
|
—
|
|
|
|
—
|
|
|
|
—
|
|
|
|
—
|
|
|
|
—
|
|
|
|
179
|
|
|
Cash and cash equivalents
|
|
|
20,200
|
|
|
|
—
|
|
|
|
—
|
|
|
|
—
|
|
|
|
—
|
|
|
|
—
|
|
|
|
20,200
|
|
|
Net amount before financial expense
|
|
|
9,544
|
|
|
|
(4,647
|
)
|
|
|
(4,528
|
)
|
|
|
(4,159
|
)
|
|
|
(4,361
|
)
|
|
|
(15,461
|
)
|
|
|
(23,612
|
)
|
|
Financial expense on non-current financial debt
|
|
|
(1,005
|
)
|
|
|
(912
|
)
|
|
|
(764
|
)
|
|
|
(701
|
)
|
|
|
(616
|
)
|
|
|
(1,783
|
)
|
|
|
(5,781
|
)
|
|
Interest differential on swaps
|
|
|
483
|
|
|
|
392
|
|
|
|
138
|
|
|
|
(33
|
)
|
|
|
(110
|
)
|
|
|
(710
|
)
|
|
|
160
|
|
|
Net amount
|
|
|
9,022
|
|
|
|
(5,167
|
)
|
|
|
(5,154
|
)
|
|
|
(4,893
|
)
|
|
|
(5,087
|
)
|
|
|
(17,954
|
)
|
|
|
(29,233
|
)
|
The following table sets forth financial assets and liabilities related to operating activities as of December 31, 2015, 2014
and 2013 (see Note 28 of the Notes to the Consolidated Financial Statements).
|
|
|
|
|
|
|
|
|
|
|
|
|
|
|
As of December 31, (M$)
Assets/(Liabilities)
|
|
2015
|
|
|
2014
|
|
|
2013
|
|
|
Accounts payable
|
|
|
(20,928
|
)
|
|
|
(24,150
|
)
|
|
|
(30,282
|
)
|
|
Other operating liabilities
|
|
|
(9,914
|
)
|
|
|
(7,935
|
)
|
|
|
(8,191
|
)
|
|
including financial instruments related to commodity contracts
|
|
|
(1,609
|
)
|
|
|
(1,073
|
)
|
|
|
(848
|
)
|
|
Accounts receivable, net
|
|
|
10,629
|
|
|
|
15,704
|
|
|
|
23,422
|
|
|
Other operating receivables
|
|
|
10,909
|
|
|
|
10,792
|
|
|
|
9,917
|
|
|
including financial instruments related to commodity
contracts
|
|
|
3,379
|
|
|
|
2,502
|
|
|
|
1,278
|
|
|
Total
|
|
|
(9,304
|
)
|
|
|
(5,589
|
)
|
|
|
(5,134
|
)
|
These financial assets and liabilities mainly have a maturity date below one year.
|
|
|
|
|
F-76
|
|
TOTAL S.A. Form 20-F 2015
|
Note 31 – Notes to the Consolidated Financial Statements
Credit risk
Credit risk is defined as the risk of the counterparty to a contract failing to perform or pay the amounts due.
The Group is exposed to credit risks in its operating and financing activities. The Group’s maximum exposure to credit risk is partially related to financial
assets recorded on its balance sheet, including energy derivative instruments that have a positive market value.
The following table presents the
Group’s maximum credit risk exposure:
|
|
|
|
|
|
|
|
|
|
|
|
|
|
|
As of December 31, (M$)
Assets/(Liabilities)
|
|
2015
|
|
|
2014
|
|
|
2013
|
|
|
Loans to equity affiliates
(Note 12)
|
|
|
4,378
|
|
|
|
4,626
|
|
|
|
3,554
|
|
|
Loans and advances
(Note 14)
|
|
|
3,407
|
|
|
|
3,326
|
|
|
|
3,575
|
|
|
Hedging instruments of non-current financial debt
(Note 20)
|
|
|
1,219
|
|
|
|
1,319
|
|
|
|
1,418
|
|
|
Accounts receivable
(Note 16)
|
|
|
10,629
|
|
|
|
15,704
|
|
|
|
23,422
|
|
|
Other operating receivables
(Note 16)
|
|
|
10,909
|
|
|
|
10,792
|
|
|
|
9,917
|
|
|
Current financial assets
(Note 20)
|
|
|
6,190
|
|
|
|
1,293
|
|
|
|
739
|
|
|
Cash and cash equivalents
(Note 27)
|
|
|
23,269
|
|
|
|
25,181
|
|
|
|
20,200
|
|
|
Total
|
|
|
60,001
|
|
|
|
62,241
|
|
|
|
62,825
|
|
The valuation allowance on loans and advances and on accounts receivable and other operating receivables is detailed respectively in
Notes 14 and 16 to the Consolidated Financial Statements.
As part of its credit risk management related to operating and financing activities, the Group
has developed margin call contracts with certain counterparties. As of December 31, 2015, the net amount paid as part of these margin calls was $124 million (against $1,437 million received as of December 31, 2014 and $1,105 million
received as of December 31, 2013).
The Group has established a number of programs for the sale of receivables, without recourse, with various
banks, primarily to reduce its exposure to such receivables. As a result of these programs the Group retains no risk of payment default after the sale, but may continue to service the customer accounts as part of a service arrangement on behalf of
the buyer and is required to pay to the buyer payments it receives from the customers relating to the receivables sold. As of December 31, 2015, the net value of receivables sold amounted to $4,274 million. The Group has substantially
transferred all the risks and rewards related to receivables. No financial asset or liability remains recognized in the consolidated balance sheet after the date of sale.
Credit risk is managed by the Group’s business segments as follows:
Upstream segment
|
|
•
|
|
Exploration & Production
|
Risks arising under contracts with government authorities or other oil companies or under long-term supply contracts necessary for the development of projects are
evaluated during the project approval process. The long-term aspect of these contracts and the high-quality of the other parties lead to a low level of credit risk.
Risks related to commercial operations, other than those described above (which are, in practice, directly monitored by subsidiaries), are subject to procedures for establishing and reviewing credit.
Customer receivables are subject to provisions on a case-by-case basis, based on prior history and management’s assessment of the facts and circumstances.
Gas activities
deal with counterparties in the energy, industrial and financial sectors throughout the world. Financial institutions providing credit risk coverage are highly rated international bank and insurance groups.
Potential counterparties are subject to credit assessment and approval before concluding transactions and are thereafter subject to regular review, including
re-appraisal and approval of the limits previously granted.
The creditworthiness of counterparties is assessed based on an analysis of quantitative and
qualitative data regarding financial standing and business risks, together with the review of any relevant third party and market information, such as data published by rating agencies. On this basis, credit limits are defined for each potential
counterparty and, where appropriate, transactions are subject to specific authorizations.
Credit exposure, which is essentially an economic exposure or
an expected future physical exposure, is permanently monitored and subject to sensitivity measures.
Credit risk is mitigated by the systematic use of
industry standard contractual frameworks that permit netting, enable requiring added security in case of adverse change in the counterparty risk, and allow for termination of the contract upon occurrence of certain events of default.
Refining & Chemicals segment
Credit risk is primarily related to commercial receivables. Internal procedures of Refining & Chemicals include rules for the management of credit
describing the fundamentals of internal control in this domain. Each division implements procedures for managing and provisioning credit risk that differ based on the size of the subsidiary and the market in which it operates. The principal elements
of these procedures are:
|
|
•
|
|
implementation of credit limits with different authorization procedures for possible credit overruns;
|
|
|
•
|
|
use of insurance policies or specific guarantees (letters of credit);
|
|
|
•
|
|
regular monitoring and assessment of overdue accounts (aging balance), including collection procedures; and
|
|
|
•
|
|
provisioning of bad debts on a customer-by-customer basis, according to payment delays and local payment practices (provisions may also be calculated based on
statistics).
|
Counterparties are subject to credit assessment and approval prior to any transaction being concluded. Regular reviews
are made for all active counterparties including a re-appraisal and renewing of the granted credit limits. The limits of the counterparties are assessed based on quantitative and qualitative data regarding financial standing, together with the
review of any relevant third party and market information, such as that provided by rating agencies and insurance companies.
Trading & Shipping deals with commercial counterparties and financial institutions located throughout the world. Counterparties to physical and derivative
transactions are primarily entities involved in the oil and gas industry or in the trading of energy commodities, or financial institutions. Credit risk coverage is concluded with financial institutions, international banks and insurance groups
selected in accordance with strict criteria.
|
|
|
|
|
2015 Form 20-F TOTAL S.A.
|
|
F-77
|
Notes to the Consolidated Financial Statements – Note 32
The Trading & Shipping division has a strict policy of internal delegation of authority governing
establishment of country and counterparty credit limits and approval of specific transactions. Credit exposures contracted under these limits and approvals are monitored on a daily basis.
Potential counterparties are subject to credit assessment and approval prior to any transaction being concluded and all active counterparties are subject to regular reviews, including re-appraisal and approval of
granted limits. The creditworthiness of counterparties is assessed based on an analysis of quantitative and qualitative data regarding financial standing and business risks, together with the review of any relevant third party and market
information, such as ratings published by Standard & Poor’s, Moody’s Investors Service and other agencies.
Contractual arrangements
are structured so as to maximize the risk mitigation benefits of netting between transactions wherever possible and additional protective terms providing for the provision of security in the event of financial deterioration and the termination of
transactions on the occurrence of defined default events are used to the greatest permitted extent.
Credit risks in excess of approved levels are
secured by means of letters of credit and other guarantees, cash deposits and insurance arrangements. In respect of derivative transactions, risks are secured by margin call contracts wherever possible.
Marketing & Services segment
Internal
procedures for the Marketing & Services division include rules on credit risk that describe the basis of internal control in this domain, including the separation of authority between commercial and financial operations.
Credit policies are defined at the local level and procedures to monitor customer risk are implemented (credit committees at the subsidiary level, the creation of
credit limits for corporate customers, etc.). Each entity also implements monitoring of its outstanding receivables. Risks related to credit may be mitigated or limited by subscription of credit insurance and/or requiring security or guarantees.
Bad debts are provisioned on a case-by-case basis at a rate determined by management based on an assessment of the risk of credit loss.
Internal procedures for
the New Energies division include rules on credit risk management. Procedures to monitor customer risk are defined at the local level, especially for SunPower (rules for the approval of credit limits, use of guarantees, monitoring and assessment of
the receivables portfolio, provisioning of doubtful debts.).
32)
Other risks and contingent liabilities
TOTAL is not currently aware of any exceptional event, dispute, risks or contingent liabilities that could have a material impact on the assets and liabilities,
results, financial position or operations of the Group.
Alitalia
In
the Marketing & Services segment, a civil proceeding was initiated in Italy, in 2013, against TOTAL S.A. and its subsidiary Total Aviazione Italia Srl before the competent Italian civil court. The plaintiff claims against TOTAL S.A., its
subsidiary and other third parties, damages that it estimates to be nearly
€
908 million. This proceeding follows practices that had been
condemned by the Italian competition authority in 2006. The parties have exchanged preliminary findings. The existence and the assessment of the alleged damages in this procedure involving multiple defendants remain contested.
Blue Rapid and the Russian Olympic Committee – Russian regions and Interneft
Blue Rapid, a Panamanian company, and the Russian Olympic Committee filed a claim for damages with the Paris Commercial Court against Elf Aquitaine, alleging a so-called non-completion by a former subsidiary of Elf
Aquitaine of a contract related to an exploration and production project in Russia negotiated in the early 1990s. Elf Aquitaine believed this claim to be unfounded and opposed it. On January 12, 2009, the Commercial Court of Paris rejected Blue
Rapid’s claim against Elf Aquitaine and found that the Russian Olympic Committee did not have standing in the matter. Blue Rapid and the Russian Olympic Committee appealed this decision. On June 30, 2011, the Court of Appeal of Paris
dismissed as inadmissible the claim of Blue Rapid and the Russian Olympic Committee against Elf Aquitaine, notably on the grounds of the contract having lapsed. Blue Rapid and the Russian Olympic Committee appealed this decision to the French
Supreme Court.
In connection with the same facts, and fifteen years after the aforementioned exploration and production contract was rendered null and
void (“caduc”), a Russian company, which was held not to be the contracting party to the contract, and two regions of the Russian Federation that were not even parties to the contract, launched an arbitration procedure against the
aforementioned former subsidiary of Elf Aquitaine that was liquidated in 2005, claiming alleged damages of $22.4 billion. For the same reasons as those successfully adjudicated by Elf Aquitaine against Blue Rapid and the Russian Olympic Committee,
the Group considers this claim to be unfounded as a matter of law and fact.
The Group has lodged a criminal complaint to denounce the fraudulent claim
of which the Group believes it is a victim and, has taken and reserved its rights to take other actions and measures to defend its interests.
FERC
The Office of Enforcement of the U.S. Federal Energy Regulatory Commission (FERC) has begun investigation in connection with the natural gas trading
activities of TOTAL Gas & Power North America, Inc, an American subsidiary of the Group. The investigation covers transactions made by the Group’s subsidiary between June 2009 and June 2012 on the natural gas market. TOTAL Gas & Power
North America, Inc received a Notice of Alleged Violations of the FERC on September 21, 2015.
The Group’s subsidiary is cooperating in the
investigation with the U.S. authorities, while contesting the claims brought against it.
|
|
|
|
|
F-78
|
|
TOTAL S.A. Form 20-F 2015
|
Notes 33 to 34 – Notes to the Consolidated Financial Statements
Russia
Since
July 2014, the United States of America and the European community have adopted economic sanctions against certain Russian persons and entities, including various entities operating in the financial, energy and defense sectors, in response to the
situation in Ukraine.
Among other things, the United States has adopted economic sanctions targeting OAO Novatek
1
(“Novatek”), as well as entities in which Novatek (individually or with other similarly targeted persons or entities collectively) owns an interest of at least 50%,
including OAO Yamal LNG
2
(“Yamal LNG”). These sanctions prohibit U.S. persons from transacting in, providing financing for or otherwise dealing in debt issued by
these entities after July 16, 2014 of greater than 90 days maturity. Consequently, the use of the U.S. dollar for such financing, including for Yamal LNG, is effectively prohibited.
As a result, the financing plan for the Yamal LNG project is being reviewed, and the project’s partners are engaged in efforts to develop a financing plan in compliance with the applicable regulations.
The economic sanctions initially adopted by the European Union in 2014 and subsequently extended do not materially affect TOTAL’s activities in
Russia. TOTAL has been formally authorized to continue all its activities in Russia (in the Kharyaga field as operator, and in the Termokarstovoye field and Yamal project in which the Group holds interests) by the French government that is the
competent authorities for granting authorization under EU sanctions regime.
TOTAL’s activities in Russia are also not materially affected by
restrictive measures adopted by the United States in August 2015 imposing export controls and restrictions relating to the export of certain goods, services, and technologies destined for projects located in Russia in the field of oil exploration.
With respect to the exploration project in the Bazhenov play (tight oil) in western Siberia, which has been suspended since 2014, TOTAL signed in July
2015 an agreement to transfer the exploration licenses it held in this play to OAO Lukoil. This agreement also sets out the conditions under which TOTAL and OAO Lukoil could potentially resume their joint activities in Russia. In January 2016, TOTAL
signed an agreement to sell 50% of its interest in the Kharyaga field and transfer the operatorship to Zarubezhneft. After the sale, which is expected to be completed in 2016, TOTAL’s interest in the Kharyaga field will be 20%.
TOTAL continues to closely monitor the different international economic sanctions with respect to its activities in Russia.
As of December 31, 2015, the Group held 19% of its proved reserves in Russia.
Yemen
Due to the further deterioration in the security situation in the vicinity of its Balhaf site, the
company Yemen LNG, in which the Group holds a 39.62% stake, decided to stop its commercial LNG production and export activities. The plant is in a preservation
mode and no expatriate personnel remain on site. As a consequence of this situation, Yemen LNG declared Force Majeure to its various stakeholders in early April 2015.
33)
Other information
Research and development costs
incurred by the Group in 2015 amounted to $1,068 million ($1,353 million in 2014 and $1,260 million in 2013), corresponding to 0.65% of the sales.
The
staff dedicated in 2015 to these research and development activities are estimated at 4,498 people (4,840 in 2014 and 4,684 in 2013).
34)
Changes in progress in the Group structure
|
|
•
|
|
In August 2015, Total has signed an agreement to sell all of its interests in the FUKA and SIRGE gas pipelines and the St. Fergus Gas Terminal to North Sea
Midstream Partners. Completion of the sale is subject to approval by the relevant authorities. At December 31, 2015 the assets and liabilities have been respectively classified in the consolidated balance sheet in “assets classified as
held for sale” for an amount of $497 million and “liabilities directly associated with the assets classified as held for sale” for an amount of $82 million. The assets concerned mainly include tangible assets for an amount of $497
million.
|
|
|
•
|
|
TOTAL has signed in January 2016 an agreement for the sale to Zarubezhneft of a 20% stake in Kharyaga, Russia. Completion of the sale is subject to approval by
the relevant authorities. At December 31, 2015 the assets and liabilities have been respectively classified in the consolidated balance sheet in “assets classified as held for sale” for an amount of $234 million and “liabilities
directly associated with the assets classified as held for sale” for an amount of $164 million. The assets and liabilities concerned mainly include tangible assets for an amount of $178 million and deferred tax liabilities for an amount of $90
million.
|
|
|
•
|
|
TOTAL has signed in September 2015 an agreement for the sale to Demirören Group of its service station network and commercial sales, supply and logistics
assets located in Turkey. Completion of the sale is subject to approval by the relevant authorities. At December 31, 2015, the assets and liabilities have been respectively classified in the consolidated balance sheet in “assets classified
as held for sale” for an amount of $458 million and “liabilities directly associated with the assets classified as held for sale” for an amount of $258 million. The assets and liabilities concerned mainly include intangible and
tangible assets for an amount of $127 million, trade receivables for an amount of $146 million and current bank debt for an amount of $161 million.
|
|
|
|
|
|
2015 Form 20-F TOTAL S.A.
|
|
F-79
|
|
(1)
|
A Russian company listed on stock exchanges in Moscow and London and in which the Group held an interest of 18.9% as of December 31, 2015.
|
|
(2)
|
A company jointly owned by Novatek (60%), Total E&P Yamal (20%), CNODC (20%), a subsidiary of China National Petroleum Corporation (“CNPC”) and
Silk Road Fund (9.9%). Novatek’s investment in the company OAO Yamal LNG is to be reduced to 50.1% following an agreement signed in September 2015 for the entry of the Silk Road Fund (9.9%). This agreement is expected to be approved by the
authorities in 2016.
|
Notes to the Consolidated Financial Statements – Note 35
35)
Consolidation scope
As of December 31, 2015, 882 entities are consolidated of which 789 are fully consolidated and 93 are accounted for under equity method (E).
The table below sets forth the main Group consolidated entities:
|
|
|
|
|
|
|
|
|
|
|
|
|
|
|
|
|
Business segment
|
|
Statutory corporate name
|
|
% Group
interest
|
|
|
Method
|
|
|
Country of incorporation
|
|
Country of operations
|
|
Upstream
|
|
ABU DHABI GAS INDUSTRIES LIMITED
|
|
|
15.00
|
%
|
|
|
E
|
|
|
UNITED ARAB EMIRATES
|
|
UNITED ARAB EMIRATES
|
|
|
|
ABU DHABI GAS LIQUEFACTION COMPANY LTD
|
|
|
5.00
|
%
|
|
|
E
|
|
|
UNITED ARAB EMIRATES
|
|
UNITED ARAB EMIRATES
|
|
|
|
ABU DHABI MARINE AREAS LIMITED
|
|
|
33.33
|
%
|
|
|
E
|
|
|
UNITED KINGDOM
|
|
UNITED ARAB EMIRATES
|
|
|
|
ABU DHABI PETROLEUM COMPANY LIMITED
|
|
|
23.75
|
%
|
|
|
E
|
|
|
UNITED KINGDOM
|
|
UNITED ARAB EMIRATES
|
|
|
|
ANGOLA BLOCK 14 B.V.
|
|
|
50.01
|
%
|
|
|
|
|
|
NETHERLANDS
|
|
ANGOLA
|
|
|
|
ANGOLA LNG LIMITED
|
|
|
13.60
|
%
|
|
|
E
|
|
|
BERMUDA
|
|
ANGOLA
|
|
|
|
ANGOLA LNG SUPPLY SERVICES LLC
|
|
|
13.60
|
%
|
|
|
E
|
|
|
UNITED STATES
|
|
UNITED STATES
|
|
|
|
BONNY GAS TRANSPORT LIMITED
|
|
|
15.00
|
%
|
|
|
E
|
|
|
BERMUDA
|
|
NIGERIA
|
|
|
|
BRASS HOLDINGS S.A.R.L.
|
|
|
100.00
|
%
|
|
|
|
|
|
LUXEMBOURG
|
|
LUXEMBOURG
|
|
|
|
BRASS LNG LTD
|
|
|
20.48
|
%
|
|
|
E
|
|
|
NIGERIA
|
|
NIGERIA
|
|
|
|
CDF ENERGIE
|
|
|
100.00
|
%
|
|
|
|
|
|
FRANCE
|
|
FRANCE
|
|
|
|
CEPSA GAS COMERCIALIZADORA SA
|
|
|
35.00
|
%
|
|
|
E
|
|
|
SPAIN
|
|
SPAIN
|
|
|
|
DEER CREEK PIPELINES LIMITED
|
|
|
75.00
|
%
|
|
|
|
|
|
CANADA
|
|
CANADA
|
|
|
|
DOLPHIN ENERGY LIMITED
|
|
|
24.50
|
%
|
|
|
E
|
|
|
UNITED ARAB EMIRATES
|
|
UNITED ARAB EMIRATES
|
|
|
|
E. F. OIL AND GAS LIMITED
|
|
|
100.00
|
%
|
|
|
|
|
|
UNITED KINGDOM
|
|
UNITED KINGDOM
|
|
|
|
EASTERN POWER AND ELECTRIC COMPANY LIMITED
|
|
|
28.00
|
%
|
|
|
E
|
|
|
THAILAND
|
|
THAILAND
|
|
|
|
ELF EXPLORATION PRODUCTION
|
|
|
100.00
|
%
|
|
|
|
|
|
FRANCE
|
|
FRANCE
|
|
|
|
ELF EXPLORATION UK LIMITED
|
|
|
100.00
|
%
|
|
|
|
|
|
UNITED KINGDOM
|
|
UNITED KINGDOM
|
|
|
|
ELF PETROLEUM IRAN
|
|
|
100.00
|
%
|
|
|
|
|
|
FRANCE
|
|
IRAN
|
|
|
|
ELF PETROLEUM UK LIMITED
|
|
|
100.00
|
%
|
|
|
|
|
|
UNITED KINGDOM
|
|
UNITED KINGDOM
|
|
|
|
FOSMAX LNG
|
|
|
27.50
|
%
|
|
|
E
|
|
|
FRANCE
|
|
FRANCE
|
|
|
|
GAS DEL LITORAL SRLCV
|
|
|
25.00
|
%
|
|
|
E
|
|
|
MEXICO
|
|
MEXICO
|
|
|
|
GAS INVESTMENT AND SERVICES COMPANY LTD
|
|
|
10.00
|
%
|
|
|
E
|
|
|
BERMUDA
|
|
OMAN
|
|
|
|
GEOMETHANE
|
|
|
28.04
|
%
|
|
|
E
|
|
|
FRANCE
|
|
FRANCE
|
|
|
|
GEOSUD
|
|
|
56.08
|
%
|
|
|
E
|
|
|
FRANCE
|
|
FRANCE
|
|
|
|
GULF TOTAL TRACTEBEL POWER COMPANY PSJC
|
|
|
20.00
|
%
|
|
|
E
|
|
|
UNITED ARAB EMIRATES
|
|
UNITED ARAB EMIRATES
|
|
|
|
HAZIRA LNG PRIVATE LIMITED
|
|
|
26.00
|
%
|
|
|
E
|
|
|
INDIA
|
|
INDIA
|
|
|
|
HAZIRA PORT PRIVATE LIMITED
|
|
|
26.00
|
%
|
|
|
E
|
|
|
INDIA
|
|
INDIA
|
|
|
|
ICHTHYS LNG PTY LTD
|
|
|
30.00
|
%
|
|
|
E
|
|
|
AUSTRALIA
|
|
AUSTRALIA
|
|
|
|
MABRUK OIL OPERATIONS
|
|
|
49.02
|
%
|
|
|
|
|
|
FRANCE
|
|
LIBYA
|
|
|
|
MOATTAMA GAS TRANSPORTATION COMPANY LIMITED
|
|
|
31.24
|
%
|
|
|
E
|
|
|
BERMUDA
|
|
MYANMAR
|
|
|
|
NATIONAL GAS SHIPPING COMPANY LTD.
|
|
|
5.00
|
%
|
|
|
E
|
|
|
UNITED ARAB EMIRATES
|
|
UNITED ARAB EMIRATES
|
|
|
|
NIGERIA LNG LTD
|
|
|
15.00
|
%
|
|
|
E
|
|
|
NIGERIA
|
|
NIGERIA
|
|
|
|
NORPIPE OIL AS
|
|
|
34.93
|
%
|
|
|
E
|
|
|
NORWAY
|
|
NORWAY
|
|
|
|
NORPIPE PETROLEUM UK LTD
|
|
|
32.87
|
%
|
|
|
E
|
|
|
UNITED KINGDOM
|
|
NORWAY
|
|
|
|
NORSEA PIPELINE LIMITED
|
|
|
32.87
|
%
|
|
|
E
|
|
|
UNITED KINGDOM
|
|
NORWAY
|
|
|
|
NOVATEK
|
|
|
18.90
|
%
|
|
|
E
|
|
|
RUSSIAN FEDERATION
|
|
RUSSIAN FEDERATION
|
|
|
|
OMAN LNG LLC
|
|
|
5.54
|
%
|
|
|
E
|
|
|
OMAN
|
|
OMAN
|
|
|
|
PARS LNG LIMITED
|
|
|
40.00
|
%
|
|
|
E
|
|
|
BERMUDA
|
|
IRAN
|
|
|
|
PETROCEDENO
|
|
|
30.32
|
%
|
|
|
E
|
|
|
VENEZUELA
|
|
VENEZUELA
|
|
|
|
PRIVATE OIL HOLDINGS OMAN LTD
|
|
|
10.00
|
%
|
|
|
E
|
|
|
UNITED KINGDOM
|
|
OMAN
|
|
|
|
QATAR LIQUEFIED GAS COMPANY LIMITED (II)
|
|
|
16.70
|
%
|
|
|
E
|
|
|
QATAR
|
|
QATAR
|
|
|
|
QATARGAS LIQUEFIED GAS COMPANY LIMITED
|
|
|
10.00
|
%
|
|
|
E
|
|
|
QATAR
|
|
QATAR
|
|
|
|
RUWAIS FERTILIZER INDUSTRIES LIMITED
|
|
|
33.33
|
%
|
|
|
E
|
|
|
UNITED ARAB EMIRATES
|
|
UNITED ARAB EMIRATES
|
|
|
|
SOUTH HOOK CHP
|
|
|
8.35
|
%
|
|
|
E
|
|
|
UNITED KINGDOM
|
|
UNITED KINGDOM
|
|
|
|
SOUTH HOOK LNG TERMINAL COMPANY LTD
|
|
|
8.35
|
%
|
|
|
E
|
|
|
UNITED KINGDOM
|
|
UNITED KINGDOM
|
|
|
|
TERNEFTEGAS LLC
(a)
|
|
|
58.64
|
%
|
|
|
E
|
|
|
RUSSIAN FEDERATION
|
|
RUSSIAN FEDERATION
|
|
|
|
TOTAL (BTC) B.V.
|
|
|
100.00
|
%
|
|
|
|
|
|
NETHERLANDS
|
|
NETHERLANDS
|
|
(a)
|
% of control different from % of interest : 49%.
|
|
|
|
|
|
F-80
|
|
TOTAL S.A. Form 20-F 2015
|
Note 35 – Notes to the Consolidated Financial Statements
|
|
|
|
|
|
|
|
|
|
|
|
|
|
|
Business segment
|
|
Statutory corporate name
|
|
% Group
interest
|
|
|
Method
|
|
Country of incorporation
|
|
Country of operations
|
|
|
|
TOTAL ABU AL BUKHOOSH
|
|
|
100.00
|
%
|
|
|
|
FRANCE
|
|
UNITED ARAB EMIRATES
|
|
|
|
TOTAL AUSTRAL
|
|
|
100.00
|
%
|
|
|
|
FRANCE
|
|
ARGENTINA
|
|
|
|
TOTAL BRAZIL SERVICES B.V.
|
|
|
100.00
|
%
|
|
|
|
NETHERLANDS
|
|
NETHERLANDS
|
|
|
|
TOTAL COLOMBIA PIPELINE
|
|
|
100.00
|
%
|
|
|
|
FRANCE
|
|
COLOMBIA
|
|
|
|
TOTAL DOLPHIN MIDSTREAM
|
|
|
100.00
|
%
|
|
|
|
FRANCE
|
|
FRANCE
|
|
|
|
TOTAL E&P ABSHERON BV
|
|
|
100.00
|
%
|
|
|
|
NETHERLANDS
|
|
AZERBAIJAN
|
|
|
|
TOTAL E&P ALGERIE
|
|
|
100.00
|
%
|
|
|
|
FRANCE
|
|
ALGERIA
|
|
|
|
TOTAL E&P AMBORIP VI
|
|
|
100.00
|
%
|
|
|
|
FRANCE
|
|
INDONESIA
|
|
|
|
TOTAL E&P ANGOLA
|
|
|
100.00
|
%
|
|
|
|
FRANCE
|
|
ANGOLA
|
|
|
|
TOTAL E&P ANGOLA BLOCK 15/06 LIMITED
|
|
|
100.00
|
%
|
|
|
|
BERMUDA
|
|
ANGOLA
|
|
|
|
TOTAL E&P ANGOLA BLOCK 17.06
|
|
|
100.00
|
%
|
|
|
|
FRANCE
|
|
ANGOLA
|
|
|
|
TOTAL E&P ANGOLA BLOCK 25
|
|
|
100.00
|
%
|
|
|
|
FRANCE
|
|
ANGOLA
|
|
|
|
TOTAL E&P ANGOLA BLOCK 32
|
|
|
100.00
|
%
|
|
|
|
FRANCE
|
|
ANGOLA
|
|
|
|
TOTAL E&P ANGOLA BLOCK 33
|
|
|
100.00
|
%
|
|
|
|
FRANCE
|
|
ANGOLA
|
|
|
|
TOTAL E&P ANGOLA BLOCK 39
|
|
|
100.00
|
%
|
|
|
|
FRANCE
|
|
ANGOLA
|
|
|
|
TOTAL E&P ANGOLA BLOCK 40
|
|
|
100.00
|
%
|
|
|
|
FRANCE
|
|
ANGOLA
|
|
|
|
TOTAL E&P ARAFURA SEA
|
|
|
100.00
|
%
|
|
|
|
FRANCE
|
|
INDONESIA
|
|
|
|
TOTAL E&P ARUBA B.V.
|
|
|
100.00
|
%
|
|
|
|
NETHERLANDS
|
|
ARUBA
|
|
|
|
TOTAL E&P AUSTRALIA
|
|
|
100.00
|
%
|
|
|
|
FRANCE
|
|
AUSTRALIA
|
|
|
|
TOTAL E&P AUSTRALIA II
|
|
|
100.00
|
%
|
|
|
|
FRANCE
|
|
AUSTRALIA
|
|
|
|
TOTAL E&P AUSTRALIA III
|
|
|
100.00
|
%
|
|
|
|
FRANCE
|
|
AUSTRALIA
|
|
|
|
TOTAL E&P AZERBAIJAN BV
|
|
|
100.00
|
%
|
|
|
|
NETHERLANDS
|
|
AZERBAIJAN
|
|
|
|
TOTAL E&P BOLIVIE
|
|
|
100.00
|
%
|
|
|
|
FRANCE
|
|
BOLIVIA
|
|
|
|
TOTAL E&P BORNEO BV
|
|
|
100.00
|
%
|
|
|
|
NETHERLANDS
|
|
BRUNEI DARUSSALAM
|
|
|
|
TOTAL E&P BULGARIA B.V.
|
|
|
100.00
|
%
|
|
|
|
NETHERLANDS
|
|
BULGARIA
|
|
|
|
TOTAL E&P CAMBODGE
|
|
|
100.00
|
%
|
|
|
|
FRANCE
|
|
CAMBODIA
|
|
|
|
TOTAL E&P CANADA LTD
|
|
|
100.00
|
%
|
|
|
|
CANADA
|
|
CANADA
|
|
|
|
TOTAL E&P CHINE
|
|
|
100.00
|
%
|
|
|
|
FRANCE
|
|
CHINA
|
|
|
|
TOTAL E&P COLOMBIE
|
|
|
100.00
|
%
|
|
|
|
FRANCE
|
|
COLOMBIA
|
|
|
|
TOTAL E&P CONGO
|
|
|
85.00
|
%
|
|
|
|
CONGO
|
|
CONGO
|
|
|
|
TOTAL E&P COTE D’IVOIRE
|
|
|
100.00
|
%
|
|
|
|
FRANCE
|
|
COTE D’IVOIRE
|
|
|
|
TOTAL E&P COTE D’IVOIRE CI-514
|
|
|
100.00
|
%
|
|
|
|
FRANCE
|
|
COTE D’IVOIRE
|
|
|
|
TOTAL E&P COTE D’IVOIRE CI-515
|
|
|
100.00
|
%
|
|
|
|
FRANCE
|
|
COTE D’IVOIRE
|
|
|
|
TOTAL E&P COTE D’IVOIRE CI-516
|
|
|
100.00
|
%
|
|
|
|
FRANCE
|
|
COTE D’IVOIRE
|
|
|
|
TOTAL E&P CYPRUS B.V.
|
|
|
100.00
|
%
|
|
|
|
NETHERLANDS
|
|
CYPRUS
|
|
|
|
TOTAL E&P DEEP OFFSHORE BORNEO BV
|
|
|
100.00
|
%
|
|
|
|
NETHERLANDS
|
|
BRUNEI DARUSSALAM
|
|
|
|
TOTAL E&P DENMARK BV
|
|
|
100.00
|
%
|
|
|
|
NETHERLANDS
|
|
DENMARK
|
|
|
|
TOTAL E&P DO BRASIL LTDA
|
|
|
100.00
|
%
|
|
|
|
BRAZIL
|
|
BRAZIL
|
|
|
|
TOTAL E&P DOLPHIN UPSTREAM
|
|
|
100.00
|
%
|
|
|
|
FRANCE
|
|
FRANCE
|
|
|
|
TOTAL E&P EAST EL BURULLUS OFFSHORE B.V.
|
|
|
100.00
|
%
|
|
|
|
NETHERLANDS
|
|
EGYPT
|
|
|
|
TOTAL E&P EGYPT BLOCK 2 B.V.
|
|
|
100.00
|
%
|
|
|
|
NETHERLANDS
|
|
EGYPT
|
|
|
|
TOTAL E&P EGYPTE
|
|
|
100.00
|
%
|
|
|
|
FRANCE
|
|
EGYPT
|
|
|
|
TOTAL E&P FRANCE
|
|
|
100.00
|
%
|
|
|
|
FRANCE
|
|
FRANCE
|
|
|
|
TOTAL E&P GOLFE HOLDINGS
|
|
|
100.00
|
%
|
|
|
|
FRANCE
|
|
FRANCE
|
|
|
|
TOTAL E&P GOLFE LIMITED
|
|
|
100.00
|
%
|
|
|
|
UNITED ARAB EMIRATES
|
|
QATAR
|
|
|
|
TOTAL E&P GUYANE FRANCAISE
|
|
|
100.00
|
%
|
|
|
|
FRANCE
|
|
FRANCE
|
|
|
|
TOTAL E&P HOLDING ICHTHYS
|
|
|
100.00
|
%
|
|
|
|
FRANCE
|
|
FRANCE
|
|
|
|
TOTAL E&P HOLDINGS AUSTRALIA PTY
|
|
|
100.00
|
%
|
|
|
|
AUSTRALIA
|
|
AUSTRALIA
|
|
|
|
TOTAL E&P HOLDINGS RUSSIA
|
|
|
100.00
|
%
|
|
|
|
FRANCE
|
|
FRANCE
|
|
|
|
TOTAL E&P HOLDINGS UAE BV
|
|
|
100.00
|
%
|
|
|
|
NETHERLANDS
|
|
UNITED ARAB EMIRATES
|
|
|
|
TOTAL E&P ICHTHYS B.V.
|
|
|
100.00
|
%
|
|
|
|
NETHERLANDS
|
|
AUSTRALIA
|
|
|
|
TOTAL E&P INDONESIA GMB KUTAI II
|
|
|
100.00
|
%
|
|
|
|
FRANCE
|
|
INDONESIA
|
|
|
|
TOTAL E&P INDONESIA MENTAWAI B.V.
|
|
|
100.00
|
%
|
|
|
|
NETHERLANDS
|
|
INDONESIA
|
|
|
|
TOTAL E&P INDONESIA SOUTH MANDAR
|
|
|
100.00
|
%
|
|
|
|
FRANCE
|
|
INDONESIA
|
|
|
|
TOTAL E&P INDONESIA TELEN B.V.
|
|
|
100.00
|
%
|
|
|
|
NETHERLANDS
|
|
INDONESIA
|
|
|
|
TOTAL E&P INDONESIA WEST PAPUA
|
|
|
100.00
|
%
|
|
|
|
FRANCE
|
|
INDONESIA
|
|
|
|
TOTAL E&P INDONESIE
|
|
|
100.00
|
%
|
|
|
|
FRANCE
|
|
INDONESIA
|
|
|
|
TOTAL E&P IRAN
|
|
|
100.00
|
%
|
|
|
|
FRANCE
|
|
IRAN
|
|
|
|
TOTAL E&P IRAQ
|
|
|
100.00
|
%
|
|
|
|
FRANCE
|
|
IRAQ
|
|
|
|
|
|
2015 Form 20-F TOTAL S.A.
|
|
F-81
|
Notes to the Consolidated Financial Statements – Note 35
|
|
|
|
|
|
|
|
|
|
|
|
|
|
|
Business segment
|
|
Statutory corporate name
|
|
% Group
interest
|
|
|
Method
|
|
Country of incorporation
|
|
Country of operations
|
|
|
|
TOTAL E&P ITALIA
|
|
|
100.00
|
%
|
|
|
|
ITALY
|
|
ITALY
|
|
|
|
TOTAL E&P KAZAKHSTAN
|
|
|
100.00
|
%
|
|
|
|
FRANCE
|
|
KAZAKHSTAN
|
|
|
|
TOTAL E&P KENYA B.V.
|
|
|
100.00
|
%
|
|
|
|
NETHERLANDS
|
|
KENYA
|
|
|
|
TOTAL E&P KURDISTAN REGION OF IRAQ (HARIR) B.V.
|
|
|
100.00
|
%
|
|
|
|
NETHERLANDS
|
|
IRAQ
|
|
|
|
TOTAL E&P KURDISTAN REGION OF IRAQ (SAFEN) B.V.
|
|
|
100.00
|
%
|
|
|
|
NETHERLANDS
|
|
IRAQ
|
|
|
|
TOTAL E&P KURDISTAN REGION OF IRAQ (TAZA) B.V.
|
|
|
100.00
|
%
|
|
|
|
NETHERLANDS
|
|
IRAQ
|
|
|
|
TOTAL E&P KURDISTAN REGION OF IRAQ B.V.
|
|
|
100.00
|
%
|
|
|
|
NETHERLANDS
|
|
IRAQ
|
|
|
|
TOTAL E&P KUTAI TIMUR
|
|
|
100.00
|
%
|
|
|
|
FRANCE
|
|
INDONESIA
|
|
|
|
TOTAL E&P LIBYE
|
|
|
100.00
|
%
|
|
|
|
FRANCE
|
|
LIBYA
|
|
|
|
TOTAL E&P MADAGASCAR
|
|
|
100.00
|
%
|
|
|
|
FRANCE
|
|
MADAGASCAR
|
|
|
|
TOTAL E&P MALAYSIA
|
|
|
100.00
|
%
|
|
|
|
FRANCE
|
|
MALAYSIA
|
|
|
|
TOTAL E&P MAROC
|
|
|
100.00
|
%
|
|
|
|
FRANCE
|
|
MOROCCO
|
|
|
|
TOTAL E&P MAURITANIA BLOCK C9 B.V.
|
|
|
100.00
|
%
|
|
|
|
NETHERLANDS
|
|
MAURITANIA
|
|
|
|
TOTAL E&P MAURITANIE
|
|
|
100.00
|
%
|
|
|
|
FRANCE
|
|
MAURITANIA
|
|
|
|
TOTAL E&P MAURITANIE BLOCK TA29 B.V.
|
|
|
100.00
|
%
|
|
|
|
NETHERLANDS
|
|
MAURITANIA
|
|
|
|
TOTAL E&P MONTELIMAR
|
|
|
100.00
|
%
|
|
|
|
FRANCE
|
|
FRANCE
|
|
|
|
TOTAL E&P MOZAMBIQUE B.V.
|
|
|
100.00
|
%
|
|
|
|
NETHERLANDS
|
|
MOZAMBIQUE
|
|
|
|
TOTAL E&P MYANMAR
|
|
|
100.00
|
%
|
|
|
|
FRANCE
|
|
MYANMAR
|
|
|
|
TOTAL E&P NEDERLAND BV
|
|
|
100.00
|
%
|
|
|
|
NETHERLANDS
|
|
NETHERLANDS
|
|
|
|
TOTAL E&P NEW VENTURES INC
|
|
|
100.00
|
%
|
|
|
|
UNITED STATES
|
|
UNITED STATES
|
|
|
|
TOTAL E&P NIGERIA DEEPWATER A LIMITED
|
|
|
100.00
|
%
|
|
|
|
NIGERIA
|
|
NIGERIA
|
|
|
|
TOTAL E&P NIGERIA DEEPWATER B LIMITED
|
|
|
100.00
|
%
|
|
|
|
NIGERIA
|
|
NIGERIA
|
|
|
|
TOTAL E&P NIGERIA DEEPWATER C LIMITED
|
|
|
100.00
|
%
|
|
|
|
NIGERIA
|
|
NIGERIA
|
|
|
|
TOTAL E&P NIGERIA DEEPWATER D LIMITED
|
|
|
100.00
|
%
|
|
|
|
NIGERIA
|
|
NIGERIA
|
|
|
|
TOTAL E&P NIGERIA DEEPWATER E LIMITED
|
|
|
100.00
|
%
|
|
|
|
NIGERIA
|
|
NIGERIA
|
|
|
|
TOTAL E&P NIGERIA DEEPWATER F LIMITED
|
|
|
100.00
|
%
|
|
|
|
NIGERIA
|
|
NIGERIA
|
|
|
|
TOTAL E&P NIGERIA DEEPWATER G LIMITED
|
|
|
100.00
|
%
|
|
|
|
NIGERIA
|
|
NIGERIA
|
|
|
|
TOTAL E&P NIGERIA DEEPWATER H LIMITED
|
|
|
100.00
|
%
|
|
|
|
NIGERIA
|
|
NIGERIA
|
|
|
|
TOTAL E&P NIGERIA LTD
|
|
|
100.00
|
%
|
|
|
|
NIGERIA
|
|
NIGERIA
|
|
|
|
TOTAL E&P NORGE A/S
|
|
|
100.00
|
%
|
|
|
|
NORWAY
|
|
NORWAY
|
|
|
|
TOTAL E&P NURMUNAI
|
|
|
100.00
|
%
|
|
|
|
FRANCE
|
|
KAZAKHSTAN
|
|
|
|
TOTAL E&P OMAN
|
|
|
100.00
|
%
|
|
|
|
FRANCE
|
|
OMAN
|
|
|
|
TOTAL E&P OMAN PETROLEUM B.V.
|
|
|
100.00
|
%
|
|
|
|
NETHERLANDS
|
|
OMAN
|
|
|
|
TOTAL E&P PHILIPPINES B.V.
|
|
|
100.00
|
%
|
|
|
|
NETHERLANDS
|
|
PHILIPPINES
|
|
|
|
TOTAL E&P PNG 1 B.V.
|
|
|
100.00
|
%
|
|
|
|
NETHERLANDS
|
|
PAPUA NEW GUINEA
|
|
|
|
TOTAL E&P PNG 2 B.V.
|
|
|
100.00
|
%
|
|
|
|
NETHERLANDS
|
|
PAPUA NEW GUINEA
|
|
|
|
TOTAL E&P PNG 3 B.V.
|
|
|
100.00
|
%
|
|
|
|
NETHERLANDS
|
|
PAPUA NEW GUINEA
|
|
|
|
TOTAL E&P PNG 4 B.V.
|
|
|
100.00
|
%
|
|
|
|
NETHERLANDS
|
|
PAPUA NEW GUINEA
|
|
|
|
TOTAL E&P PNG 5 B.V.
|
|
|
100.00
|
%
|
|
|
|
NETHERLANDS
|
|
PAPUA NEW GUINEA
|
|
|
|
TOTAL E&P PNG LIMITED
|
|
|
100.00
|
%
|
|
|
|
PAPUA NEW GUINEA
|
|
PAPUA NEW GUINEA
|
|
|
|
TOTAL E&P POLAND B.V.
|
|
|
100.00
|
%
|
|
|
|
NETHERLANDS
|
|
POLAND
|
|
|
|
TOTAL E&P QATAR
|
|
|
100.00
|
%
|
|
|
|
FRANCE
|
|
QATAR
|
|
|
|
TOTAL E&P RDC
|
|
|
100.00
|
%
|
|
|
|
DEMOCRATIC REPUBLIC OF CONGO
|
|
DEMOCRATIC REPUBLIC OF CONGO
|
|
|
|
TOTAL E&P RESEARCH & TECHNOLOGY USA LLC
|
|
|
100.00
|
%
|
|
|
|
UNITED STATES
|
|
UNITED STATES
|
|
|
|
TOTAL E&P RUSSIE
|
|
|
100.00
|
%
|
|
|
|
FRANCE
|
|
RUSSIAN FEDERATION
|
|
|
|
TOTAL E&P SADANG
|
|
|
100.00
|
%
|
|
|
|
FRANCE
|
|
INDONESIA
|
|
|
|
TOTAL E&P SAGERI
|
|
|
100.00
|
%
|
|
|
|
FRANCE
|
|
INDONESIA
|
|
|
|
TOTAL E&P SEBUKU
|
|
|
100.00
|
%
|
|
|
|
FRANCE
|
|
INDONESIA
|
|
|
|
|
|
F-82
|
|
TOTAL S.A. Form 20-F 2015
|
Note 35 – Notes to the Consolidated Financial Statements
|
|
|
|
|
|
|
|
|
|
|
|
|
|
|
Business segment
|
|
Statutory corporate name
|
|
% Group
interest
|
|
|
Method
|
|
Country of incorporation
|
|
Country of operations
|
|
|
|
TOTAL E&P SERVICES CHINA CO., LTD
|
|
|
100.00
|
%
|
|
|
|
CHINA
|
|
CHINA
|
|
|
|
TOTAL E&P SHTOKMAN
|
|
|
100.00
|
%
|
|
|
|
FRANCE
|
|
RUSSIAN FEDERATION
|
|
|
|
TOTAL E&P SOUTH AFRICA B.V.
|
|
|
100.00
|
%
|
|
|
|
NETHERLANDS
|
|
SOUTH AFRICA
|
|
|
|
TOTAL E&P SOUTH EAST MAHAKAM
|
|
|
100.00
|
%
|
|
|
|
FRANCE
|
|
INDONESIA
|
|
|
|
TOTAL E&P SOUTH SAGERI
|
|
|
100.00
|
%
|
|
|
|
FRANCE
|
|
INDONESIA
|
|
|
|
TOTAL E&P SOUTH SUDAN
|
|
|
100.00
|
%
|
|
|
|
FRANCE
|
|
REPUBLIC OF SOUTH SUDAN
|
|
|
|
TOTAL E&P SYRIE
|
|
|
100.00
|
%
|
|
|
|
FRANCE
|
|
SYRIAN ARAB REPUBLIC
|
|
|
|
TOTAL E&P TAJIKISTAN B.V.
|
|
|
100.00
|
%
|
|
|
|
NETHERLANDS
|
|
TAJIKISTAN
|
|
|
|
TOTAL E&P THAILAND
|
|
|
100.00
|
%
|
|
|
|
FRANCE
|
|
THAILAND
|
|
|
|
TOTAL E&P UGANDA BV
|
|
|
100.00
|
%
|
|
|
|
NETHERLANDS
|
|
UGANDA
|
|
|
|
TOTAL E&P UK LIMITED
|
|
|
100.00
|
%
|
|
|
|
UNITED KINGDOM
|
|
UNITED KINGDOM
|
|
|
|
TOTAL E&P URUGUAY B.V.
|
|
|
100.00
|
%
|
|
|
|
NETHERLANDS
|
|
URUGUAY
|
|
|
|
TOTAL E&P URUGUAY ONSHORE B.V.
|
|
|
100.00
|
%
|
|
|
|
NETHERLANDS
|
|
URUGUAY
|
|
|
|
TOTAL E&P USA INC
|
|
|
100.00
|
%
|
|
|
|
UNITED STATES
|
|
UNITED STATES
|
|
|
|
TOTAL E&P USA OIL SHALE, LLC
|
|
|
100.00
|
%
|
|
|
|
UNITED STATES
|
|
UNITED STATES
|
|
|
|
TOTAL E&P WELL RESPONSE
|
|
|
100.00
|
%
|
|
|
|
FRANCE
|
|
FRANCE
|
|
|
|
TOTAL E&P YAMAL
|
|
|
100.00
|
%
|
|
|
|
FRANCE
|
|
FRANCE
|
|
|
|
TOTAL E&P YEMEN
|
|
|
100.00
|
%
|
|
|
|
FRANCE
|
|
YEMEN
|
|
|
|
TOTAL E&P YEMEN BLOCK 3 BV
|
|
|
100.00
|
%
|
|
|
|
NETHERLANDS
|
|
YEMEN
|
|
|
|
TOTAL ENERGIE GAZ
|
|
|
100.00
|
%
|
|
|
|
FRANCE
|
|
FRANCE
|
|
|
|
TOTAL EXPLORATION M’BRIDGE
|
|
|
100.00
|
%
|
|
|
|
NETHERLANDS
|
|
ANGOLA
|
|
|
|
TOTAL EXPLORATION PRODUCTION NIGERIA
|
|
|
100.00
|
%
|
|
|
|
FRANCE
|
|
FRANCE
|
|
|
|
TOTAL EXPLORATION PRODUCTION TIMAN-PECHORA LLC
|
|
|
100.00
|
%
|
|
|
|
RUSSIAN FEDERATION
|
|
RUSSIAN FEDERATION
|
|
|
|
TOTAL FACILITIES MANAGEMENT BV
|
|
|
100.00
|
%
|
|
|
|
NETHERLANDS
|
|
NETHERLANDS
|
|
|
|
TOTAL GABON
|
|
|
58.28
|
%
|
|
|
|
GABON
|
|
GABON
|
|
|
|
TOTAL GAS & POWER ACTIFS INDUSTRIELS
|
|
|
100.00
|
%
|
|
|
|
FRANCE
|
|
FRANCE
|
|
|
|
TOTAL GAS & POWER ASIA PRIVATE LIMITED
|
|
|
100.00
|
%
|
|
|
|
SINGAPORE
|
|
SINGAPORE
|
|
|
|
TOTAL GAS & POWER BRAZIL
|
|
|
100.00
|
%
|
|
|
|
FRANCE
|
|
FRANCE
|
|
|
|
TOTAL GAS & POWER CHARTERING LIMITED
|
|
|
100.00
|
%
|
|
|
|
UNITED KINGDOM
|
|
UNITED KINGDOM
|
|
|
|
TOTAL GAS & POWER LIMITED
|
|
|
100.00
|
%
|
|
|
|
UNITED KINGDOM
|
|
UNITED KINGDOM
|
|
|
|
TOTAL GAS & POWER NORTH AMERICA INC
|
|
|
100.00
|
%
|
|
|
|
UNITED STATES
|
|
UNITED STATES
|
|
|
|
TOTAL GAS & POWER SERVICES LIMITED
|
|
|
100.00
|
%
|
|
|
|
UNITED KINGDOM
|
|
UNITED KINGDOM
|
|
|
|
TOTAL GAS & POWER THAILAND
|
|
|
100.00
|
%
|
|
|
|
FRANCE
|
|
FRANCE
|
|
|
|
TOTAL GAS CONTRACTS LIMITED
|
|
|
100.00
|
%
|
|
|
|
UNITED KINGDOM
|
|
UNITED KINGDOM
|
|
|
|
TOTAL GAS PIPELINE USA INC
|
|
|
100.00
|
%
|
|
|
|
UNITED STATES
|
|
UNITED STATES
|
|
|
|
TOTAL GAS SHALE EUROPE
|
|
|
100.00
|
%
|
|
|
|
FRANCE
|
|
FRANCE
|
|
|
|
TOTAL GAS Y ELECTRICIDAD ARGENTINA SA
|
|
|
100.00
|
%
|
|
|
|
ARGENTINA
|
|
ARGENTINA
|
|
|
|
TOTAL GASANDES
|
|
|
100.00
|
%
|
|
|
|
FRANCE
|
|
FRANCE
|
|
|
|
TOTAL GASS HANDEL NORGE AS
|
|
|
100.00
|
%
|
|
|
|
NORWAY
|
|
NORWAY
|
|
|
|
TOTAL GASTRANSPORT NEDERLAND BV
|
|
|
100.00
|
%
|
|
|
|
NETHERLANDS
|
|
NETHERLANDS
|
|
|
|
TOTAL GAZ ELECTRICITE HOLDINGS FRANCE
|
|
|
100.00
|
%
|
|
|
|
FRANCE
|
|
FRANCE
|
|
|
|
TOTAL GLNG AUSTRALIA
|
|
|
100.00
|
%
|
|
|
|
FRANCE
|
|
AUSTRALIA
|
|
|
|
TOTAL HOLDING DOLPHIN AMONT
|
|
|
100.00
|
%
|
|
|
|
FRANCE
|
|
FRANCE
|
|
|
|
TOTAL HOLDINGS INTERNATIONAL B.V.
|
|
|
100.00
|
%
|
|
|
|
NETHERLANDS
|
|
NETHERLANDS
|
|
|
|
TOTAL HOLDINGS NEDERLAND BV
|
|
|
100.00
|
%
|
|
|
|
NETHERLANDS
|
|
NETHERLANDS
|
|
|
|
TOTAL LNG ANGOLA
|
|
|
100.00
|
%
|
|
|
|
FRANCE
|
|
FRANCE
|
|
|
|
TOTAL LNG NIGERIA LIMITED
|
|
|
100.00
|
%
|
|
|
|
FRANCE
|
|
FRANCE
|
|
|
|
TOTAL LNG SUPPLY SERVICES USA INC
|
|
|
100.00
|
%
|
|
|
|
UNITED STATES
|
|
UNITED STATES
|
|
|
|
TOTAL MIDSTREAM HOLDINGS UK LIMITED
|
|
|
100.00
|
%
|
|
|
|
UNITED KINGDOM
|
|
UNITED KINGDOM
|
|
|
|
TOTAL NNS LLC
|
|
|
100.00
|
%
|
|
|
|
UNITED STATES
|
|
UNITED KINGDOM
|
|
|
|
TOTAL OIL AND GAS SOUTH AMERICA
|
|
|
100.00
|
%
|
|
|
|
FRANCE
|
|
FRANCE
|
|
|
|
TOTAL OIL AND GAS VENEZUELA BV
|
|
|
100.00
|
%
|
|
|
|
NETHERLANDS
|
|
VENEZUELA
|
|
|
|
|
|
2015 Form 20-F TOTAL S.A.
|
|
F-83
|
Notes to the Consolidated Financial Statements – Note 35
|
|
|
|
|
|
|
|
|
|
|
|
|
|
|
|
|
Business segment
|
|
Statutory corporate name
|
|
% Group
interest
|
|
|
Method
|
|
|
Country of incorporation
|
|
Country of operations
|
|
|
|
TOTAL PARS LNG
|
|
|
100.00
|
%
|
|
|
|
|
|
FRANCE
|
|
IRAN
|
|
|
|
TOTAL PARTICIPATIONS PETROLIERES GABON
|
|
|
100.00
|
%
|
|
|
|
|
|
GABON
|
|
GABON
|
|
|
|
TOTAL PETROLEUM ANGOLA
|
|
|
100.00
|
%
|
|
|
|
|
|
FRANCE
|
|
ANGOLA
|
|
|
|
TOTAL PROFILS PETROLIERS
|
|
|
100.00
|
%
|
|
|
|
|
|
FRANCE
|
|
FRANCE
|
|
|
|
TOTAL QATAR OIL AND GAS
|
|
|
100.00
|
%
|
|
|
|
|
|
FRANCE
|
|
FRANCE
|
|
|
|
TOTAL SHTOKMAN BV
|
|
|
100.00
|
%
|
|
|
|
|
|
NETHERLANDS
|
|
NETHERLANDS
|
|
|
|
TOTAL SOUTH PARS
|
|
|
100.00
|
%
|
|
|
|
|
|
FRANCE
|
|
IRAN
|
|
|
|
TOTAL TENGAH
|
|
|
100.00
|
%
|
|
|
|
|
|
FRANCE
|
|
INDONESIA
|
|
|
|
TOTAL TERMOKARSTOVOYE BV
|
|
|
100.00
|
%
|
|
|
|
|
|
NETHERLANDS
|
|
RUSSIAN FEDERATION
|
|
|
|
TOTAL TRACTEBEL EMIRATES O & M COMPANY
|
|
|
50.00
|
%
|
|
|
E
|
|
|
FRANCE
|
|
UNITED ARAB EMIRATES
|
|
|
|
TOTAL TRACTEBEL EMIRATES POWER COMPANY
|
|
|
50.00
|
%
|
|
|
E
|
|
|
FRANCE
|
|
UNITED ARAB EMIRATES
|
|
|
|
TOTAL UPSTREAM NIGERIA LIMITED
|
|
|
100.00
|
%
|
|
|
|
|
|
NIGERIA
|
|
NIGERIA
|
|
|
|
TOTAL UPSTREAM UK LIMITED
|
|
|
100.00
|
%
|
|
|
|
|
|
UNITED KINGDOM
|
|
UNITED KINGDOM
|
|
|
|
TOTAL VENEZUELA
|
|
|
100.00
|
%
|
|
|
|
|
|
FRANCE
|
|
FRANCE
|
|
|
|
TOTAL YEMEN LNG COMPANY LTD.
|
|
|
100.00
|
%
|
|
|
|
|
|
BERMUDA
|
|
BERMUDA
|
|
|
|
TRANSPORTADORA DE GAS DEL MERCOSUR SA
|
|
|
32.68
|
%
|
|
|
E
|
|
|
ARGENTINA
|
|
ARGENTINA
|
|
|
|
UNITAH COLORADO RESOURCES II, LLC
|
|
|
100.00
|
%
|
|
|
|
|
|
UNITED STATES
|
|
UNITED STATES
|
|
|
|
YAMAL LNG
(b)
|
|
|
31.35
|
%
|
|
|
E
|
|
|
RUSSIAN FEDERATION
|
|
RUSSIAN FEDERATION
|
|
|
|
YEMEN LNG COMPANY LTD
|
|
|
39.62
|
%
|
|
|
E
|
|
|
BERMUDA
|
|
YEMEN
|
|
|
|
YPERGAS SA
|
|
|
37.33
|
%
|
|
|
|
|
|
VENEZUELA
|
|
VENEZUELA
|
|
Refining & Chemicals
|
|
APPRYL SNC
|
|
|
50.00
|
%
|
|
|
|
|
|
FRANCE
|
|
FRANCE
|
|
|
|
ATLANTIC TRADING AND MARKETING INC.
|
|
|
100.00
|
%
|
|
|
|
|
|
UNITED STATES
|
|
UNITED STATES
|
|
|
|
ATOTECH (CHONGQUING) CHEMICALS LTD.
|
|
|
100.00
|
%
|
|
|
|
|
|
CHINA
|
|
CHINA
|
|
|
|
ATOTECH ASIA PACIFIC
|
|
|
100.00
|
%
|
|
|
|
|
|
HONG KONG
|
|
HONG KONG
|
|
|
|
ATOTECH BV
|
|
|
100.00
|
%
|
|
|
|
|
|
NETHERLANDS
|
|
NETHERLANDS
|
|
|
|
ATOTECH CANADA LTD
|
|
|
100.00
|
%
|
|
|
|
|
|
CANADA
|
|
CANADA
|
|
|
|
ATOTECH CZ
|
|
|
100.00
|
%
|
|
|
|
|
|
CZECH REPUBLIC
|
|
CZECH REPUBLIC
|
|
|
|
ATOTECH DE MEXICO
|
|
|
100.00
|
%
|
|
|
|
|
|
MEXICO
|
|
MEXICO
|
|
|
|
ATOTECH DEUTSCHLAND GMBH
|
|
|
100.00
|
%
|
|
|
|
|
|
GERMANY
|
|
GERMANY
|
|
|
|
ATOTECH DO BRASIL GALVANOTECNICA
|
|
|
100.00
|
%
|
|
|
|
|
|
BRAZIL
|
|
BRAZIL
|
|
|
|
ATOTECH ESPANA SA
|
|
|
100.00
|
%
|
|
|
|
|
|
SPAIN
|
|
SPAIN
|
|
|
|
ATOTECH FRANCE
|
|
|
100.00
|
%
|
|
|
|
|
|
FRANCE
|
|
FRANCE
|
|
|
|
ATOTECH INDIA LTD
|
|
|
100.00
|
%
|
|
|
|
|
|
INDIA
|
|
INDIA
|
|
|
|
ATOTECH ISTANBUL KIMYA SANAYI TICARET LIMITED SIRKETI
|
|
|
100.00
|
%
|
|
|
|
|
|
TURKEY
|
|
TURKEY
|
|
|
|
ATOTECH ITALIA
|
|
|
100.00
|
%
|
|
|
|
|
|
ITALY
|
|
ITALY
|
|
|
|
ATOTECH JAPAN
|
|
|
100.00
|
%
|
|
|
|
|
|
JAPAN
|
|
JAPAN
|
|
|
|
ATOTECH KOREA LTD.
|
|
|
100.00
|
%
|
|
|
|
|
|
KOREA, REPUBLIC OF
|
|
KOREA, REPUBLIC OF
|
|
|
|
ATOTECH MALAYSIA SDN BHD
|
|
|
100.00
|
%
|
|
|
|
|
|
MALAYSIA
|
|
MALAYSIA
|
|
|
|
ATOTECH NEDERLAND B.V.
|
|
|
100.00
|
%
|
|
|
|
|
|
NETHERLANDS
|
|
NETHERLANDS
|
|
|
|
ATOTECH ÖSTERREICH GMBH
|
|
|
100.00
|
%
|
|
|
|
|
|
AUSTRIA
|
|
AUSTRIA
|
|
|
|
ATOTECH POLAND
|
|
|
100.00
|
%
|
|
|
|
|
|
POLAND
|
|
POLAND
|
|
|
|
ATOTECH SEA PTE
|
|
|
100.00
|
%
|
|
|
|
|
|
SINGAPORE
|
|
SINGAPORE
|
|
|
|
ATOTECH SERVICIOS DE MEXICO SA DE CV
|
|
|
100.00
|
%
|
|
|
|
|
|
MEXICO
|
|
MEXICO
|
|
|
|
ATOTECH SK
|
|
|
100.00
|
%
|
|
|
|
|
|
SLOVAKIA
|
|
SLOVAKIA
|
|
|
|
ATOTECH SKANDINAVIEN
|
|
|
100.00
|
%
|
|
|
|
|
|
SWEDEN
|
|
SWEDEN
|
|
|
|
ATOTECH SLOVENIJA, PROIZVODNJA KEMICNIH IZDELKOV, D.D.
|
|
|
100.00
|
%
|
|
|
|
|
|
SLOVENIA
|
|
SLOVENIA
|
|
|
|
ATOTECH TAIWAN
|
|
|
100.00
|
%
|
|
|
|
|
|
TAIWAN
|
|
TAIWAN
|
|
|
|
ATOTECH THAILAND
|
|
|
100.00
|
%
|
|
|
|
|
|
THAILAND
|
|
THAILAND
|
|
|
|
ATOTECH U.K.
|
|
|
100.00
|
%
|
|
|
|
|
|
UNITED KINGDOM
|
|
UNITED KINGDOM
|
|
(b)
|
% of control different from % of interest : 20.02%
|
|
|
|
|
|
F-84
|
|
TOTAL S.A. Form 20-F 2015
|
Note 35 – Notes to the Consolidated Financial Statements
|
|
|
|
|
|
|
|
|
|
|
|
|
|
|
|
|
Business segment
|
|
Statutory corporate name
|
|
% Group
interest
|
|
|
Method
|
|
|
Country of incorporation
|
|
Country of operations
|
|
|
|
ATOTECH USA INC
|
|
|
100.00
|
%
|
|
|
|
|
|
UNITED STATES
|
|
UNITED STATES
|
|
|
|
ATOTECH VIETNAM COMPANY LIMITED
|
|
|
100.00
|
%
|
|
|
|
|
|
VIETNAM
|
|
VIETNAM
|
|
|
|
BALZATEX SAS
|
|
|
100.00
|
%
|
|
|
|
|
|
FRANCE
|
|
FRANCE
|
|
|
|
BARRY CONTROL AEROSPACE SNC
|
|
|
100.00
|
%
|
|
|
|
|
|
FRANCE
|
|
FRANCE
|
|
|
|
BASF TOTAL PETROCHEMICALS LLC
|
|
|
40.00
|
%
|
|
|
|
|
|
UNITED STATES
|
|
UNITED STATES
|
|
|
|
BAY JUNCTION, INC.
|
|
|
100.00
|
%
|
|
|
|
|
|
UNITED STATES
|
|
UNITED STATES
|
|
|
|
BORRACHAS PORTALEGRE LTDA
|
|
|
100.00
|
%
|
|
|
|
|
|
PORTUGAL
|
|
PORTUGAL
|
|
|
|
BOU VERWALTUNGS GMBH
|
|
|
100.00
|
%
|
|
|
|
|
|
GERMANY
|
|
GERMANY
|
|
|
|
BUCKEYE PRODUCTS PIPELINE, L.P.
|
|
|
14.66
|
%
|
|
|
E
|
|
|
UNITED STATES
|
|
UNITED STATES
|
|
|
|
CAOUTCHOUCS MODERNES SAS
|
|
|
100.00
|
%
|
|
|
|
|
|
FRANCE
|
|
FRANCE
|
|
|
|
CATELSA-CACERES SAU
|
|
|
100.00
|
%
|
|
|
|
|
|
SPAIN
|
|
SPAIN
|
|
|
|
CIE TUNISIENNE DU CAOUTCHOUC SARL
|
|
|
100.00
|
%
|
|
|
|
|
|
TUNISIA
|
|
TUNISIA
|
|
|
|
COSDEN, LLC
|
|
|
100.00
|
%
|
|
|
|
|
|
UNITED STATES
|
|
UNITED STATES
|
|
|
|
COS-MAR COMPANY
|
|
|
50.00
|
%
|
|
|
|
|
|
UNITED STATES
|
|
UNITED STATES
|
|
|
|
CRAY VALLEY (GUANGZHOU) CHEMICAL CO., LTD
|
|
|
100.00
|
%
|
|
|
|
|
|
CHINA
|
|
CHINA
|
|
|
|
CRAY VALLEY CZECH
|
|
|
100.00
|
%
|
|
|
|
|
|
CZECH REPUBLIC
|
|
CZECH REPUBLIC
|
|
|
|
CRAY VALLEY HSC ASIA LIMITED
|
|
|
100.00
|
%
|
|
|
|
|
|
CHINA
|
|
CHINA
|
|
|
|
CRAY VALLEY ITALIA S.R.L.
|
|
|
100.00
|
%
|
|
|
|
|
|
ITALY
|
|
ITALY
|
|
|
|
CRAY VALLEY SA
|
|
|
100.00
|
%
|
|
|
|
|
|
FRANCE
|
|
FRANCE
|
|
|
|
CSSA—CHARTERING AND SHIPPING SERVICES SA
|
|
|
100.00
|
%
|
|
|
|
|
|
SWITZERLAND
|
|
SWITZERLAND
|
|
|
|
DALIAN TOTAL CONSULTING CO LTD
|
|
|
100.00
|
%
|
|
|
|
|
|
CHINA
|
|
CHINA
|
|
|
|
DALIAN WEST PACIFIC PETROCHEMICAL CO LTD (WEPEC)
|
|
|
22.41
|
%
|
|
|
E
|
|
|
CHINA
|
|
CHINA
|
|
|
|
ESPA SARL
|
|
|
100.00
|
%
|
|
|
|
|
|
FRANCE
|
|
FRANCE
|
|
|
|
ETHYLENE EST
|
|
|
99.98
|
%
|
|
|
|
|
|
FRANCE
|
|
FRANCE
|
|
|
|
FELUY IMMOBATI
|
|
|
100.00
|
%
|
|
|
|
|
|
BELGIUM
|
|
BELGIUM
|
|
|
|
FINA TECHNOLOGY, INC.
|
|
|
100.00
|
%
|
|
|
|
|
|
UNITED STATES
|
|
UNITED STATES
|
|
|
|
FPL ENTERPRISES, INC.
|
|
|
100.00
|
%
|
|
|
|
|
|
UNITED STATES
|
|
UNITED STATES
|
|
|
|
GASKET (SUZHOU) VALVE COMPONENTS CO., LTD.
|
|
|
100.00
|
%
|
|
|
|
|
|
CHINA
|
|
CHINA
|
|
|
|
GASKET INTERNATIONAL S.P.A.
|
|
|
100.00
|
%
|
|
|
|
|
|
ITALY
|
|
ITALY
|
|
|
|
GRACE DEVELOPMENT LIMITED
|
|
|
100.00
|
%
|
|
|
|
|
|
HONG KONG
|
|
HONG KONG
|
|
|
|
GRANDE PAROISSE SA
|
|
|
100.00
|
%
|
|
|
|
|
|
FRANCE
|
|
FRANCE
|
|
|
|
GUANGZHOU SPHERE CHEMICALS LTD
|
|
|
100.00
|
%
|
|
|
|
|
|
CHINA
|
|
CHINA
|
|
|
|
GULF COAST PIPE LINE, L.P.
|
|
|
14.66
|
%
|
|
|
E
|
|
|
UNITED STATES
|
|
UNITED STATES
|
|
|
|
HANWHA TOTAL PETROCHEMICAL CO. LTD
|
|
|
50.00
|
%
|
|
|
E
|
|
|
KOREA, REPUBLIC OF
|
|
KOREA, REPUBLIC OF
|
|
|
|
HBA HUTCHINSON BRASIL AUTOMOTIVE LTDA
|
|
|
100.00
|
%
|
|
|
|
|
|
BRAZIL
|
|
BRAZIL
|
|
|
|
HUTCH MAROC SARL AU
|
|
|
100.00
|
%
|
|
|
|
|
|
MOROCCO
|
|
MOROCCO
|
|
|
|
HUTCHINSON POLYMERS SNC
|
|
|
100.00
|
%
|
|
|
|
|
|
FRANCE
|
|
FRANCE
|
|
|
|
HUTCHINSON SRO
|
|
|
100.00
|
%
|
|
|
|
|
|
CZECH REPUBLIC
|
|
CZECH REPUBLIC
|
|
|
|
HUTCHINSON (UK) LIMITED
|
|
|
100.00
|
%
|
|
|
|
|
|
UNITED KINGDOM
|
|
UNITED KINGDOM
|
|
|
|
HUTCHINSON (WUHAN) AUTOMOTIVE RUBBER PRODUCTS COMPANY LTD
|
|
|
100.00
|
%
|
|
|
|
|
|
CHINA
|
|
CHINA
|
|
|
|
HUTCHINSON AERONAUTIQUE & INDUSTRIE LIMITED
|
|
|
100.00
|
%
|
|
|
|
|
|
CANADA
|
|
CANADA
|
|
|
|
HUTCHINSON AEROSERVICES GMBH
|
|
|
100.00
|
%
|
|
|
|
|
|
GERMANY
|
|
GERMANY
|
|
|
|
HUTCHINSON AEROSERVICES SAS
|
|
|
100.00
|
%
|
|
|
|
|
|
FRANCE
|
|
FRANCE
|
|
|
|
HUTCHINSON AEROSPACE & INDUSTRY, INC.
|
|
|
100.00
|
%
|
|
|
|
|
|
UNITED STATES
|
|
UNITED STATES
|
|
|
|
HUTCHINSON AEROSPACE GMBH
|
|
|
100.00
|
%
|
|
|
|
|
|
GERMANY
|
|
GERMANY
|
|
|
|
HUTCHINSON AFTERMARKET USA INC
|
|
|
100.00
|
%
|
|
|
|
|
|
UNITED STATES
|
|
UNITED STATES
|
|
|
|
HUTCHINSON ANTIVIBRATION SYSTEMS, INC.
|
|
|
100.00
|
%
|
|
|
|
|
|
UNITED STATES
|
|
UNITED STATES
|
|
|
|
HUTCHINSON ARGENTINA SA
|
|
|
100.00
|
%
|
|
|
|
|
|
ARGENTINA
|
|
ARGENTINA
|
|
|
|
HUTCHINSON AUTOPARTES DE MEXICO SA.DE CV
|
|
|
100.00
|
%
|
|
|
|
|
|
MEXICO
|
|
MEXICO
|
|
|
|
HUTCHINSON BORRACHAS DE PORTUGAL LTDA
|
|
|
100.00
|
%
|
|
|
|
|
|
PORTUGAL
|
|
PORTUGAL
|
|
|
|
HUTCHINSON CORPORATION
|
|
|
100.00
|
%
|
|
|
|
|
|
UNITED STATES
|
|
UNITED STATES
|
|
|
|
HUTCHINSON D.O.O. BEOGRAD
|
|
|
100.00
|
%
|
|
|
|
|
|
SERBIA
|
|
SERBIA
|
|
|
|
HUTCHINSON DO BRASIL SA
|
|
|
100.00
|
%
|
|
|
|
|
|
BRAZIL
|
|
BRAZIL
|
|
|
|
|
|
2015 Form 20-F TOTAL S.A.
|
|
F-85
|
Notes to the Consolidated Financial Statements – Note 35
|
|
|
|
|
|
|
|
|
|
|
|
|
|
|
|
|
Business segment
|
|
Statutory corporate name
|
|
% Group
interest
|
|
|
Method
|
|
|
Country of incorporation
|
|
Country of operations
|
|
|
|
HUTCHINSON FLEXIBLE AUTOMOBILE SNC
|
|
|
100.00
|
%
|
|
|
|
|
|
FRANCE
|
|
FRANCE
|
|
|
|
HUTCHINSON FLUID MANAGEMENT SYSTEMS INC
|
|
|
100.00
|
%
|
|
|
|
|
|
UNITED STATES
|
|
UNITED STATES
|
|
|
|
HUTCHINSON GMBH
|
|
|
100.00
|
%
|
|
|
|
|
|
GERMANY
|
|
GERMANY
|
|
|
|
HUTCHINSON HOLDING GMBH
|
|
|
100.00
|
%
|
|
|
|
|
|
GERMANY
|
|
GERMANY
|
|
|
|
HUTCHINSON HOLDINGS UK LIMITED
|
|
|
100.00
|
%
|
|
|
|
|
|
UNITED KINGDOM
|
|
UNITED KINGDOM
|
|
|
|
HUTCHINSON IBERIA, S.A.
|
|
|
100.00
|
%
|
|
|
|
|
|
SPAIN
|
|
SPAIN
|
|
|
|
HUTCHINSON INDUSTRIAL RUBBER PRODUCTS (SUZHOU) CO,LTD
|
|
|
100.00
|
%
|
|
|
|
|
|
CHINA
|
|
CHINA
|
|
|
|
HUTCHINSON INDUSTRIAS DEL CAUCHO SAU
|
|
|
100.00
|
%
|
|
|
|
|
|
SPAIN
|
|
SPAIN
|
|
|
|
HUTCHINSON INDUSTRIES INC.
|
|
|
100.00
|
%
|
|
|
|
|
|
UNITED STATES
|
|
UNITED STATES
|
|
|
|
HUTCHINSON JAPAN CO., LTD
|
|
|
100.00
|
%
|
|
|
|
|
|
JAPAN
|
|
JAPAN
|
|
|
|
HUTCHINSON KOREA LIMITED
|
|
|
100.00
|
%
|
|
|
|
|
|
KOREA, REPUBLIC OF
|
|
KOREA, REPUBLIC OF
|
|
|
|
HUTCHINSON NICHIRIN BRAKE HOSES, S.L.
|
|
|
70.00
|
%
|
|
|
|
|
|
SPAIN
|
|
SPAIN
|
|
|
|
HUTCHINSON PALAMOS
|
|
|
100.00
|
%
|
|
|
|
|
|
SPAIN
|
|
SPAIN
|
|
|
|
HUTCHINSON POLAND SP ZO.O.
|
|
|
100.00
|
%
|
|
|
|
|
|
POLAND
|
|
POLAND
|
|
|
|
HUTCHINSON PORTO TUBOS FLEXIVEIS LTDA
|
|
|
100.00
|
%
|
|
|
|
|
|
PORTUGAL
|
|
PORTUGAL
|
|
|
|
HUTCHINSON RUBBER PRODUCTS PRIVATE LIMITED INDE
|
|
|
100.00
|
%
|
|
|
|
|
|
INDIA
|
|
INDIA
|
|
|
|
HUTCHINSON SA
|
|
|
100.00
|
%
|
|
|
|
|
|
FRANCE
|
|
FRANCE
|
|
|
|
HUTCHINSON SALES CORPORATION
|
|
|
100.00
|
%
|
|
|
|
|
|
UNITED STATES
|
|
UNITED STATES
|
|
|
|
HUTCHINSON SANTE SNC
|
|
|
100.00
|
%
|
|
|
|
|
|
FRANCE
|
|
FRANCE
|
|
|
|
HUTCHINSON SEAL DE MEXICO SA.DE CV.
|
|
|
100.00
|
%
|
|
|
|
|
|
MEXICO
|
|
MEXICO
|
|
|
|
HUTCHINSON SEALING SYSTEMS INC
|
|
|
100.00
|
%
|
|
|
|
|
|
UNITED STATES
|
|
UNITED STATES
|
|
|
|
HUTCHINSON SNC
|
|
|
100.00
|
%
|
|
|
|
|
|
FRANCE
|
|
FRANCE
|
|
|
|
HUTCHINSON SRL (ITALIE)
|
|
|
100.00
|
%
|
|
|
|
|
|
ITALY
|
|
ITALY
|
|
|
|
HUTCHINSON SRL (ROUMANIE)
|
|
|
100.00
|
%
|
|
|
|
|
|
ROMANIA
|
|
ROMANIA
|
|
|
|
HUTCHINSON STOP-CHOC GMBH & CO. KG
|
|
|
100.00
|
%
|
|
|
|
|
|
GERMANY
|
|
GERMANY
|
|
|
|
HUTCHINSON SUISSE SA
|
|
|
100.00
|
%
|
|
|
|
|
|
SWITZERLAND
|
|
SWITZERLAND
|
|
|
|
HUTCHINSON TRANSFERENCIA DE FLUIDOS SA.DE CV
|
|
|
100.00
|
%
|
|
|
|
|
|
MEXICO
|
|
MEXICO
|
|
|
|
HUTCHINSON TUNISIE SARL
|
|
|
100.00
|
%
|
|
|
|
|
|
TUNISIA
|
|
TUNISIA
|
|
|
|
INDUSTRIAS TECNICAS DE LA ESPUMA SL
|
|
|
100.00
|
%
|
|
|
|
|
|
SPAIN
|
|
SPAIN
|
|
|
|
INDUSTRIELLE DESMARQUOY SNC
|
|
|
100.00
|
%
|
|
|
|
|
|
FRANCE
|
|
FRANCE
|
|
|
|
JEHIER SAS
|
|
|
99.89
|
%
|
|
|
|
|
|
FRANCE
|
|
FRANCE
|
|
|
|
JPR SAS
|
|
|
100.00
|
%
|
|
|
|
|
|
FRANCE
|
|
FRANCE
|
|
|
|
KEUMHAN VIETMAN CO., LIMITED
|
|
|
100.00
|
%
|
|
|
|
|
|
VIETNAM
|
|
VIETNAM
|
|
|
|
KTN KUNSTSTOFFTECHNIK NOBITZ GMBH
|
|
|
100.00
|
%
|
|
|
|
|
|
GERMANY
|
|
GERMANY
|
|
|
|
LA PORTE PIPELINE COMPANY, L.P.
|
|
|
50.00
|
%
|
|
|
E
|
|
|
UNITED STATES
|
|
UNITED STATES
|
|
|
|
LA PORTE PIPELINE GP, L.L.C.
|
|
|
50.00
|
%
|
|
|
E
|
|
|
UNITED STATES
|
|
UNITED STATES
|
|
|
|
LAFFAN REFINERY COMPANY LIMITED
|
|
|
10.00
|
%
|
|
|
E
|
|
|
QATAR
|
|
QATAR
|
|
|
|
LAFFAN REFINERY COMPANY LIMITED 2
|
|
|
10.00
|
%
|
|
|
E
|
|
|
QATAR
|
|
QATAR
|
|
|
|
LE JOINT FRANCAIS SNC
|
|
|
100.00
|
%
|
|
|
|
|
|
FRANCE
|
|
FRANCE
|
|
|
|
LEGACY SITE SERVICES LLC
|
|
|
100.00
|
%
|
|
|
|
|
|
UNITED STATES
|
|
UNITED STATES
|
|
|
|
LES STRATIFIES SAS
|
|
|
100.00
|
%
|
|
|
|
|
|
FRANCE
|
|
FRANCE
|
|
|
|
LJF(UK) LIMITED
|
|
|
100.00
|
%
|
|
|
|
|
|
UNITED KINGDOM
|
|
UNITED KINGDOM
|
|
|
|
LONE WOLF LAND CO.
|
|
|
100.00
|
%
|
|
|
|
|
|
UNITED STATES
|
|
UNITED STATES
|
|
|
|
LSS FUNDING INC.
|
|
|
100.00
|
%
|
|
|
|
|
|
UNITED STATES
|
|
UNITED STATES
|
|
|
|
MACHEN LAND LIMITED
|
|
|
100.00
|
%
|
|
|
|
|
|
UNITED KINGDOM
|
|
UNITED KINGDOM
|
|
|
|
MAPA SPONTEX INC
|
|
|
100.00
|
%
|
|
|
|
|
|
UNITED STATES
|
|
UNITED STATES
|
|
|
|
NAPHTACHIMIE
|
|
|
50.00
|
%
|
|
|
|
|
|
FRANCE
|
|
FRANCE
|
|
|
|
OLUTEX OBERLAUSITZER LUFTFAHRTTEXTILIEN GMBH
|
|
|
100.00
|
%
|
|
|
|
|
|
GERMANY
|
|
GERMANY
|
|
|
|
PAMARGAN (MALTA) PRODUCTS LIMITED
|
|
|
100.00
|
%
|
|
|
|
|
|
MALTA
|
|
MALTA
|
|
|
|
PAMARGAN PRODUCTS LIMITED
|
|
|
100.00
|
%
|
|
|
|
|
|
UNITED KINGDOM
|
|
UNITED KINGDOM
|
|
|
|
PAULSTRA SILENTBLOC SA
|
|
|
100.00
|
%
|
|
|
|
|
|
BELGIUM
|
|
BELGIUM
|
|
|
|
|
|
F-86
|
|
TOTAL S.A. Form 20-F 2015
|
Note 35 – Notes to the Consolidated Financial Statements
|
|
|
|
|
|
|
|
|
|
|
|
|
|
|
|
|
Business segment
|
|
Statutory corporate name
|
|
% Group
interest
|
|
|
Method
|
|
|
Country of incorporation
|
|
Country of operations
|
|
|
|
PAULSTRA SNC
|
|
|
100.00
|
%
|
|
|
|
|
|
FRANCE
|
|
FRANCE
|
|
|
|
POLYBLEND GMBH
|
|
|
68.00
|
%
|
|
|
|
|
|
GERMANY
|
|
GERMANY
|
|
|
|
QATAR PETROCHEMICAL COMPANY Q.S.C. (QAPCO)
|
|
|
20.00
|
%
|
|
|
E
|
|
|
QATAR
|
|
QATAR
|
|
|
|
QATOFIN COMPANY LIMITED
|
|
|
49.09
|
%
|
|
|
E
|
|
|
QATAR
|
|
QATAR
|
|
|
|
RESILIUM
|
|
|
100.00
|
%
|
|
|
|
|
|
BELGIUM
|
|
BELGIUM
|
|
|
|
RETIA
|
|
|
100.00
|
%
|
|
|
|
|
|
FRANCE
|
|
FRANCE
|
|
|
|
RETIA USA LLC
|
|
|
100.00
|
%
|
|
|
|
|
|
UNITED STATES
|
|
UNITED STATES
|
|
|
|
SAN JACINTO RAIL LIMITED
|
|
|
17.00
|
%
|
|
|
E
|
|
|
UNITED STATES
|
|
UNITED STATES
|
|
|
|
SAUDI ARAMCO TOTAL REFINING AND PETROCHEMICAL COMPANY
|
|
|
37.50
|
%
|
|
|
E
|
|
|
SAUDI ARABIA
|
|
SAUDI ARABIA
|
|
|
|
SEALANTS EUROPE
|
|
|
34.00
|
%
|
|
|
E
|
|
|
FRANCE
|
|
FRANCE
|
|
|
|
SIGMAKALON GROUP BV
|
|
|
100.00
|
%
|
|
|
|
|
|
NETHERLANDS
|
|
NETHERLANDS
|
|
|
|
STILLMAN SEAL CORPORATION
|
|
|
100.00
|
%
|
|
|
|
|
|
UNITED STATES
|
|
UNITED STATES
|
|
|
|
STOP-CHOC (UK) LIMITED
|
|
|
100.00
|
%
|
|
|
|
|
|
UNITED KINGDOM
|
|
UNITED KINGDOM
|
|
|
|
TECHLAM SAS
|
|
|
100.00
|
%
|
|
|
|
|
|
FRANCE
|
|
FRANCE
|
|
|
|
TOTAL ACTIVITES MARITIMES
|
|
|
100.00
|
%
|
|
|
|
|
|
FRANCE
|
|
FRANCE
|
|
|
|
TOTAL DEUTSCHLAND GMBH
(c)
|
|
|
100.00
|
%
|
|
|
|
|
|
GERMANY
|
|
GERMANY
|
|
|
|
TOTAL DOWNSTREAM UK PLC
|
|
|
100.00
|
%
|
|
|
|
|
|
UNITED KINGDOM
|
|
UNITED KINGDOM
|
|
|
|
TOTAL EUROPEAN TRADING
|
|
|
100.00
|
%
|
|
|
|
|
|
FRANCE
|
|
FRANCE
|
|
|
|
TOTAL LAFFAN REFINERY
|
|
|
100.00
|
%
|
|
|
|
|
|
FRANCE
|
|
FRANCE
|
|
|
|
TOTAL LAFFAN REFINERY II B.V.
|
|
|
100.00
|
%
|
|
|
|
|
|
NETHERLANDS
|
|
NETHERLANDS
|
|
|
|
TOTAL LINDSEY OIL REFINERY LTD
|
|
|
100.00
|
%
|
|
|
|
|
|
UNITED KINGDOM
|
|
UNITED KINGDOM
|
|
|
|
TOTAL OLEFINS ANTWERP
|
|
|
100.00
|
%
|
|
|
|
|
|
BELGIUM
|
|
BELGIUM
|
|
|
|
TOTAL OPSLAG EN PIJPLEIDING NEDERLAND NV
|
|
|
55.00
|
%
|
|
|
|
|
|
NETHERLANDS
|
|
NETHERLANDS
|
|
|
|
TOTAL PAR LLC
|
|
|
100.00
|
%
|
|
|
|
|
|
UNITED STATES
|
|
UNITED STATES
|
|
|
|
TOTAL PETROCHEMICALS & REFINING ORDOS BV
|
|
|
100.00
|
%
|
|
|
|
|
|
NETHERLANDS
|
|
NETHERLANDS
|
|
|
|
TOTAL PETROCHEMICALS & REFINING USA INC
(c)
|
|
|
100.00
|
%
|
|
|
|
|
|
UNITED STATES
|
|
UNITED STATES
|
|
|
|
TOTAL PETROCHEMICALS & REFINING SA/NV
(c)
|
|
|
100.00
|
%
|
|
|
|
|
|
BELGIUM
|
|
BELGIUM
|
|
|
|
TOTAL PETROCHEMICALS (CHINA) TRADING CO LTD
|
|
|
100.00
|
%
|
|
|
|
|
|
CHINA
|
|
CHINA
|
|
|
|
TOTAL PETROCHEMICALS (FOSHAN) LTD
|
|
|
100.00
|
%
|
|
|
|
|
|
CHINA
|
|
CHINA
|
|
|
|
TOTAL PETROCHEMICALS (HONG KONG) LTD
|
|
|
100.00
|
%
|
|
|
|
|
|
HONG KONG
|
|
HONG KONG
|
|
|
|
TOTAL PETROCHEMICALS (NINGBO) LTD
|
|
|
100.00
|
%
|
|
|
|
|
|
CHINA
|
|
CHINA
|
|
|
|
TOTAL PETROCHEMICALS DEVELOPMENT FELUY
|
|
|
100.00
|
%
|
|
|
|
|
|
BELGIUM
|
|
BELGIUM
|
|
|
|
TOTAL PETROCHEMICALS ECAUSSINNES
|
|
|
100.00
|
%
|
|
|
|
|
|
BELGIUM
|
|
BELGIUM
|
|
|
|
TOTAL PETROCHEMICALS FELUY
|
|
|
100.00
|
%
|
|
|
|
|
|
BELGIUM
|
|
BELGIUM
|
|
|
|
TOTAL PETROCHEMICALS FRANCE
|
|
|
100.00
|
%
|
|
|
|
|
|
FRANCE
|
|
FRANCE
|
|
|
|
TOTAL PETROCHEMICALS IBERICA
|
|
|
100.00
|
%
|
|
|
|
|
|
SPAIN
|
|
SPAIN
|
|
|
|
TOTAL PETROCHEMICALS PIPELINE USA INC
|
|
|
100.00
|
%
|
|
|
|
|
|
UNITED STATES
|
|
UNITED STATES
|
|
|
|
TOTAL PETROCHEMICALS UK LTD
|
|
|
100.00
|
%
|
|
|
|
|
|
UNITED KINGDOM
|
|
UNITED KINGDOM
|
|
|
|
TOTAL POLYMERS ANTWERP
|
|
|
100.00
|
%
|
|
|
|
|
|
BELGIUM
|
|
BELGIUM
|
|
|
|
TOTAL RAFFINADERIJ ANTWERPEN NV
|
|
|
100.00
|
%
|
|
|
|
|
|
BELGIUM
|
|
BELGIUM
|
|
|
|
TOTAL RAFFINAGE CHIMIE
|
|
|
100.00
|
%
|
|
|
|
|
|
FRANCE
|
|
FRANCE
|
|
|
|
TOTAL RAFFINAGE FRANCE
|
|
|
100.00
|
%
|
|
|
|
|
|
FRANCE
|
|
FRANCE
|
|
|
|
TOTAL RAFFINERIE MITTELDEUTSCHLAND GMBH
|
|
|
100.00
|
%
|
|
|
|
|
|
GERMANY
|
|
GERMANY
|
|
|
|
TOTAL REFINING & CHEMICALS SAUDI ARABIA SAS
|
|
|
100.00
|
%
|
|
|
|
|
|
FRANCE
|
|
FRANCE
|
|
|
|
TOTAL RESEARCH & TECHNOLOGY FELUY
|
|
|
100.00
|
%
|
|
|
|
|
|
BELGIUM
|
|
BELGIUM
|
|
|
|
TOTAL SPLITTER USA INC
|
|
|
100.00
|
%
|
|
|
|
|
|
UNITED STATES
|
|
UNITED STATES
|
|
|
|
TOTAL TRADING AND MARKETING CANADA LP
|
|
|
100.00
|
%
|
|
|
|
|
|
CANADA
|
|
CANADA
|
|
|
|
TOTAL TRADING ASIA PTE LTD
|
|
|
100.00
|
%
|
|
|
|
|
|
SINGAPORE
|
|
SINGAPORE
|
|
|
|
TOTAL TRADING CANADA LIMITED
|
|
|
100.00
|
%
|
|
|
|
|
|
CANADA
|
|
CANADA
|
|
|
|
TOTAL TRADING PRODUCTS SA
|
|
|
100.00
|
%
|
|
|
|
|
|
SWITZERLAND
|
|
SWITZERLAND
|
|
(c)
|
Multi-segment entities.
|
|
|
|
|
|
2015 Form 20-F TOTAL S.A.
|
|
F-87
|
Notes to the Consolidated Financial Statements – Note 35
|
|
|
|
|
|
|
|
|
|
|
|
|
|
|
|
|
Business segment
|
|
Statutory corporate name
|
|
% Group
interest
|
|
|
Method
|
|
|
Country of incorporation
|
|
Country of operations
|
|
|
|
TOTSA TOTAL OIL TRADING SA
|
|
|
100.00
|
%
|
|
|
|
|
|
SWITZERLAND
|
|
SWITZERLAND
|
|
|
|
TRANSALPES SNC
|
|
|
67.00
|
%
|
|
|
|
|
|
FRANCE
|
|
FRANCE
|
|
|
|
TRANS-ETHYLENE
|
|
|
99.98
|
%
|
|
|
|
|
|
FRANCE
|
|
FRANCE
|
|
|
|
UAB ATOTECH-CHEMETA
|
|
|
100.00
|
%
|
|
|
|
|
|
LITHUANIA
|
|
LITHUANIA
|
|
|
|
VIBRACHOC SAU
|
|
|
100.00
|
%
|
|
|
|
|
|
SPAIN
|
|
SPAIN
|
|
|
|
ZEELAND REFINERY N.V.
|
|
|
55.00
|
%
|
|
|
|
|
|
NETHERLANDS
|
|
NETHERLANDS
|
|
Marketing & Services
|
|
8POINT3 ENERGY PARTNERS LP
|
|
|
22.99
|
%
|
|
|
E
|
|
|
UNITED STATES
|
|
UNITED STATES
|
|
|
|
8POINT3 GENERAL PARTNER, LLC
|
|
|
28.74
|
%
|
|
|
E
|
|
|
UNITED STATES
|
|
UNITED STATES
|
|
|
|
8POINT3 HOLDING COMPANY, LLC
|
|
|
28.74
|
%
|
|
|
E
|
|
|
UNITED STATES
|
|
UNITED STATES
|
|
|
|
8POINT3 OPERATING COMPANY, LLC
|
|
|
22.99
|
%
|
|
|
E
|
|
|
UNITED STATES
|
|
UNITED STATES
|
|
|
|
AETOLIA ENERGY SITE ANONYMI ENERGEIAKI ETAIREIA (DISTINCTIVE TIEL AETOLIA ENERGEIAKI ETAIREIA)
|
|
|
40.23
|
%
|
|
|
|
|
|
GREECE
|
|
GREECE
|
|
|
|
AETOLIA ENERGY SITE MALTA LIMITED
|
|
|
57.48
|
%
|
|
|
|
|
|
MALTA
|
|
MALTA
|
|
|
|
AIR TOTAL (SUISSE) SA
|
|
|
100.00
|
%
|
|
|
|
|
|
SWITZERLAND
|
|
SWITZERLAND
|
|
|
|
AIR TOTAL INTERNATIONAL SA
|
|
|
100.00
|
%
|
|
|
|
|
|
SWITZERLAND
|
|
SWITZERLAND
|
|
|
|
ALEXSUN 1 MALTA LIMITED
|
|
|
57.48
|
%
|
|
|
|
|
|
MALTA
|
|
MALTA
|
|
|
|
ALEXSUN2 MALTA LIMITED
|
|
|
57.48
|
%
|
|
|
|
|
|
MALTA
|
|
MALTA
|
|
|
|
ALMYROS ENERGY SOLUTION ANONYMI ENERGEIAKI ETAIREIA (DISTINCTIVE TITLE ALMYROS ENERGEIAKI A.E.)
|
|
|
40.23
|
%
|
|
|
|
|
|
GREECE
|
|
GREECE
|
|
|
|
ALMYROS ENERGY SOLUTION MALTA LIMITED
|
|
|
57.48
|
%
|
|
|
|
|
|
MALTA
|
|
MALTA
|
|
|
|
ALVEA
|
|
|
100.00
|
%
|
|
|
|
|
|
FRANCE
|
|
FRANCE
|
|
|
|
AMYRIS INC.
|
|
|
31.52
|
%
|
|
|
E
|
|
|
UNITED STATES
|
|
UNITED STATES
|
|
|
|
ANTILLES GAZ
|
|
|
100.00
|
%
|
|
|
|
|
|
FRANCE
|
|
FRANCE
|
|
|
|
ARAGONNE SOLAR, LLC
|
|
|
57.48
|
%
|
|
|
|
|
|
UNITED STATES
|
|
UNITED STATES
|
|
|
|
ARDECHES SOLAIRE—DRAGA 1
|
|
|
57.48
|
%
|
|
|
|
|
|
FRANCE
|
|
FRANCE
|
|
|
|
ARISTEA
|
|
|
51.00
|
%
|
|
|
E
|
|
|
BELGIUM
|
|
BELGIUM
|
|
|
|
ARTECO
|
|
|
49.99
|
%
|
|
|
E
|
|
|
BELGIUM
|
|
BELGIUM
|
|
|
|
AS 24
|
|
|
100.00
|
%
|
|
|
|
|
|
FRANCE
|
|
FRANCE
|
|
|
|
AS 24 BELGIE NV
|
|
|
100.00
|
%
|
|
|
|
|
|
BELGIUM
|
|
BELGIUM
|
|
|
|
AS 24 ESPANOLA SA
|
|
|
100.00
|
%
|
|
|
|
|
|
SPAIN
|
|
SPAIN
|
|
|
|
AS 24 FUEL CARD LIMITED
|
|
|
100.00
|
%
|
|
|
|
|
|
UNITED KINGDOM
|
|
UNITED KINGDOM
|
|
|
|
AS 24 POLSKA SP ZOO
|
|
|
100.00
|
%
|
|
|
|
|
|
POLAND
|
|
POLAND
|
|
|
|
AS 24 TANKSERVICE GMBH
|
|
|
100.00
|
%
|
|
|
|
|
|
GERMANY
|
|
GERMANY
|
|
|
|
AUO SUNPOWER SDN. BHD.
|
|
|
28.74
|
%
|
|
|
E
|
|
|
MALAYSIA
|
|
MALAYSIA
|
|
|
|
BADENHORST PV 2 HOLD CO LLC
|
|
|
57.48
|
%
|
|
|
|
|
|
UNITED STATES
|
|
UNITED STATES
|
|
|
|
BEIT HAGEDI RENEWABLE ENERGIES LTD
|
|
|
57.48
|
%
|
|
|
|
|
|
ISRAEL
|
|
ISRAEL
|
|
|
|
BERTOPHASE (PTY) LTD
|
|
|
57.48
|
%
|
|
|
|
|
|
SOUTH AFRICA
|
|
SOUTH AFRICA
|
|
|
|
BLUESTEM SOLAR LLC
|
|
|
57.48
|
%
|
|
|
|
|
|
UNITED STATES
|
|
UNITED STATES
|
|
|
|
BNB BLOOMFIELD SOLAR LLC
|
|
|
57.48
|
%
|
|
|
|
|
|
UNITED STATES
|
|
UNITED STATES
|
|
|
|
BOULDER SOLAR II, LLC
|
|
|
57.48
|
%
|
|
|
|
|
|
UNITED STATES
|
|
UNITED STATES
|
|
|
|
BOULDER SOLAR III, LLC
|
|
|
57.48
|
%
|
|
|
|
|
|
UNITED STATES
|
|
UNITED STATES
|
|
|
|
BOULDER SOLAR POWER PARENT, LLC
|
|
|
57.48
|
%
|
|
|
|
|
|
UNITED STATES
|
|
UNITED STATES
|
|
|
|
BOULDER SOLAR POWER, LLC
|
|
|
57.48
|
%
|
|
|
|
|
|
UNITED STATES
|
|
UNITED STATES
|
|
|
|
BUFFALO NORTH STAR SOLAR LLC
|
|
|
57.48
|
%
|
|
|
|
|
|
UNITED STATES
|
|
UNITED STATES
|
|
|
|
CALDEO
|
|
|
100.00
|
%
|
|
|
|
|
|
FRANCE
|
|
FRANCE
|
|
|
|
CENTRALE SOLAIRE 1
|
|
|
57.48
|
%
|
|
|
|
|
|
FRANCE
|
|
UNITED STATES
|
|
|
|
CENTRALE SOLAIRE 2
|
|
|
57.48
|
%
|
|
|
|
|
|
FRANCE
|
|
UNITED STATES
|
|
|
|
CHARENTE MARITIME SOLAIRE—ST LEGER 1
|
|
|
57.48
|
%
|
|
|
|
|
|
FRANCE
|
|
FRANCE
|
|
|
|
CHARVET LA MURE BIANCO
|
|
|
100.00
|
%
|
|
|
|
|
|
FRANCE
|
|
FRANCE
|
|
|
|
COGENRA DEVELOPMENT, INC.
|
|
|
57.48
|
%
|
|
|
|
|
|
UNITED STATES
|
|
UNITED STATES
|
|
|
|
COGENRA SOLAR, INC.
|
|
|
57.48
|
%
|
|
|
|
|
|
UNITED STATES
|
|
UNITED STATES
|
|
|
|
COMPAGNIE PETROLIERE DE L’OUEST- CPO
|
|
|
100.00
|
%
|
|
|
|
|
|
FRANCE
|
|
FRANCE
|
|
|
|
COOPER RANCH SOLAR LLC
|
|
|
57.48
|
%
|
|
|
|
|
|
UNITED STATES
|
|
UNITED STATES
|
|
|
|
CORONA SANDS, LLC
|
|
|
28.74
|
%
|
|
|
|
|
|
UNITED STATES
|
|
UNITED STATES
|
|
|
|
CPE ENERGIES
|
|
|
100.00
|
%
|
|
|
|
|
|
FRANCE
|
|
FRANCE
|
|
|
|
CRISTAL MARKETING EGYPT
|
|
|
80.78
|
%
|
|
|
|
|
|
EGYPT
|
|
EGYPT
|
|
|
|
DCA-MORY-SHIPP
|
|
|
100.00
|
%
|
|
|
|
|
|
FRANCE
|
|
FRANCE
|
|
|
|
DEAAR PV HOLD CO LLC
|
|
|
57.48
|
%
|
|
|
|
|
|
UNITED STATES
|
|
UNITED STATES
|
|
|
|
DESERT SUNBURST, LLC
|
|
|
57.48
|
%
|
|
|
|
|
|
UNITED STATES
|
|
UNITED STATES
|
|
|
|
DIAMOND ENERGY PTY LTD
|
|
|
14.37
|
%
|
|
|
E
|
|
|
AUSTRALIA
|
|
AUSTRALIA
|
|
|
|
|
|
F-88
|
|
TOTAL S.A. Form 20-F 2015
|
Note 35 – Notes to the Consolidated Financial Statements
|
|
|
|
|
|
|
|
|
|
|
|
|
|
|
|
|
Business segment
|
|
Statutory corporate name
|
|
% Group
interest
|
|
|
Method
|
|
|
Country of incorporation
|
|
Country of operations
|
|
|
|
DRAGONFLY SYSTEMS, INC
|
|
|
57.48
|
%
|
|
|
|
|
|
UNITED STATES
|
|
UNITED STATES
|
|
|
|
EAU CHAUDE REUNION (ECR)
|
|
|
50.00
|
%
|
|
|
E
|
|
|
FRANCE
|
|
FRANCE
|
|
|
|
EGEDIS
|
|
|
100.00
|
%
|
|
|
|
|
|
FRANCE
|
|
FRANCE
|
|
|
|
ELF OIL UK AVIATION LTD
|
|
|
100.00
|
%
|
|
|
|
|
|
UNITED KINGDOM
|
|
UNITED KINGDOM
|
|
|
|
ELF OIL UK PROPERTIES LTD
|
|
|
100.00
|
%
|
|
|
|
|
|
UNITED KINGDOM
|
|
UNITED KINGDOM
|
|
|
|
FIRST PHILEC SOLAR CORPORATION
|
|
|
8.62
|
%
|
|
|
E
|
|
|
PHILIPPINES
|
|
PHILIPPINES
|
|
|
|
FIWADO BV
|
|
|
100.00
|
%
|
|
|
|
|
|
NETHERLANDS
|
|
NETHERLANDS
|
|
|
|
GEORGIA SUN I, LLC
|
|
|
57.48
|
%
|
|
|
|
|
|
UNITED STATES
|
|
UNITED STATES
|
|
|
|
GILAT RENEWABLE ENERGIES LTD
|
|
|
57.48
|
%
|
|
|
|
|
|
ISRAEL
|
|
ISRAEL
|
|
|
|
GOLDEN FIELDS SOLAR I, LLC
|
|
|
57.48
|
%
|
|
|
|
|
|
UNITED STATES
|
|
UNITED STATES
|
|
|
|
GOLDEN FIELDS SOLAR II, LLC
|
|
|
57.48
|
%
|
|
|
|
|
|
UNITED STATES
|
|
UNITED STATES
|
|
|
|
GOLDEN FIELDS SOLAR III, LLC
|
|
|
57.48
|
%
|
|
|
|
|
|
UNITED STATES
|
|
UNITED STATES
|
|
|
|
GOLDEN FIELDS SOLAR IV, LLC
|
|
|
57.48
|
%
|
|
|
|
|
|
UNITED STATES
|
|
UNITED STATES
|
|
|
|
GREENBOTICS, INC.
|
|
|
57.48
|
%
|
|
|
|
|
|
UNITED STATES
|
|
UNITED STATES
|
|
|
|
GUANGZHOU ELF LUBRICANTS CO LTD
|
|
|
77.00
|
%
|
|
|
|
|
|
CHINA
|
|
CHINA
|
|
|
|
HELIOS RESIDENTIAL SOLAR FUND, LLC
|
|
|
57.48
|
%
|
|
|
|
|
|
UNITED STATES
|
|
UNITED STATES
|
|
|
|
HEMATHIA SUCCESSFUL ANONYMI ENERGEIAKI ETAIREIA (DISTINCTIVE TITLE HEMATHIA SUCCESSFUL A.E.)
|
|
|
40.23
|
%
|
|
|
|
|
|
GREECE
|
|
GREECE
|
|
|
|
HEMETHIA SUCCESSFUL LIMITED
|
|
|
57.48
|
%
|
|
|
|
|
|
MALTA
|
|
MALTA
|
|
|
|
HIGH PLAINS RANCH I, LLC
|
|
|
57.48
|
%
|
|
|
|
|
|
UNITED STATES
|
|
UNITED STATES
|
|
|
|
HUAXIA CPV (INNER MONGOLIA) POWER CO., LTD
|
|
|
14.37
|
%
|
|
|
E
|
|
|
CHINA
|
|
CHINA
|
|
|
|
IMMO ENERGIE
|
|
|
57.48
|
%
|
|
|
|
|
|
FRANCE
|
|
FRANCE
|
|
|
|
INDUSTRIAL POWER SERVICES LLC
|
|
|
57.48
|
%
|
|
|
|
|
|
UNITED STATES
|
|
UNITED STATES
|
|
|
|
INFIGEN ENERGY US DEVELOPMENT LLC
|
|
|
57.48
|
%
|
|
|
|
|
|
UNITED STATES
|
|
UNITED STATES
|
|
|
|
INFIGEN ENERGY US SOLAR ONE LLC
|
|
|
57.48
|
%
|
|
|
|
|
|
UNITED STATES
|
|
UNITED STATES
|
|
|
|
INFINITE SUNSHINE 2015-1, LLC
|
|
|
57.48
|
%
|
|
|
|
|
|
UNITED STATES
|
|
UNITED STATES
|
|
|
|
INSTITUT PHOTOVOLTAIQUE D’ILE DE FRANCE (IPVF)
|
|
|
43.00
|
%
|
|
|
|
|
|
FRANCE
|
|
FRANCE
|
|
|
|
JAVA SOLAR, LLC
|
|
|
57.48
|
%
|
|
|
|
|
|
UNITED STATES
|
|
UNITED STATES
|
|
|
|
JDA OVERSEAS HOLDINGS, LLC
|
|
|
57.48
|
%
|
|
|
|
|
|
UNITED STATES
|
|
UNITED STATES
|
|
|
|
KERN HIGH SCHOOL DISTRICT SOLAR (2), LLC
|
|
|
57.48
|
%
|
|
|
|
|
|
UNITED STATES
|
|
UNITED STATES
|
|
|
|
KERN HIGH SCHOOL DISTRICT SOLAR, LLC
|
|
|
57.48
|
%
|
|
|
|
|
|
UNITED STATES
|
|
UNITED STATES
|
|
|
|
KLIPGATS PV 3 HOLD CO LLC
|
|
|
57.48
|
%
|
|
|
|
|
|
UNITED STATES
|
|
UNITED STATES
|
|
|
|
KLIPGATS PV 7 HOLD CO LLC
|
|
|
57.48
|
%
|
|
|
|
|
|
UNITED STATES
|
|
UNITED STATES
|
|
|
|
KOZANI ENERGY ANONYMI ENERGEIAKI ETAIREIA (DISTINCTIVE TITLE KOZANI ENERGY S.A.)
|
|
|
57.48
|
%
|
|
|
|
|
|
GREECE
|
|
GREECE
|
|
|
|
KOZANI ENERGY MALTA LIMITED
|
|
|
57.48
|
%
|
|
|
|
|
|
MALTA
|
|
MALTA
|
|
|
|
LEMOORE STRATFORD LAND HOLDINGS IV, LLC
|
|
|
57.48
|
%
|
|
|
|
|
|
UNITED STATES
|
|
UNITED STATES
|
|
|
|
LIVINGSTON RIDGE SOLAR LLC
|
|
|
57.48
|
%
|
|
|
|
|
|
UNITED STATES
|
|
UNITED STATES
|
|
|
|
LOVING SOLAR LLC
|
|
|
57.48
|
%
|
|
|
|
|
|
UNITED STATES
|
|
UNITED STATES
|
|
|
|
LUCERNE VALLEY SOLAR I, LLC
|
|
|
57.48
|
%
|
|
|
|
|
|
UNITED STATES
|
|
UNITED STATES
|
|
|
|
LUCERNE VALLEY SOLAR ONE HOLDINGS, LLC
|
|
|
57.48
|
%
|
|
|
|
|
|
UNITED STATES
|
|
UNITED STATES
|
|
|
|
LUIS SOLAR, LLC
|
|
|
57.48
|
%
|
|
|
|
|
|
UNITED STATES
|
|
UNITED STATES
|
|
|
|
LUX RESIDENTIAL SOLAR FUND, LLC
|
|
|
57.48
|
%
|
|
|
|
|
|
UNITED STATES
|
|
UNITED STATES
|
|
|
|
MESQUITE SOLAR I, LLC
|
|
|
57.48
|
%
|
|
|
|
|
|
UNITED STATES
|
|
UNITED STATES
|
|
|
|
MICHEL MINERALÖLHANDEL GMBH
|
|
|
100.00
|
%
|
|
|
|
|
|
GERMANY
|
|
GERMANY
|
|
|
|
MULILO PRIESKA PV (RF) PROPRIETARY LIMITED
|
|
|
27.00
|
%
|
|
|
E
|
|
|
SOUTH AFRICA
|
|
SOUTH AFRICA
|
|
|
|
NAPA SANITATION DISTRICT SOLAR LLC
|
|
|
57.48
|
%
|
|
|
|
|
|
UNITED STATES
|
|
UNITED STATES
|
|
|
|
NATIONAL PETROLEUM REFINERS OF SOUTH AFRICA (PTY) LTD
|
|
|
18.22
|
%
|
|
|
E
|
|
|
SOUTH AFRICA
|
|
SOUTH AFRICA
|
|
|
|
NEVATIM GREEN ENERGIES LTD
|
|
|
57.48
|
%
|
|
|
|
|
|
ISRAEL
|
|
ISRAEL
|
|
|
|
NORTHSTAR MACYS EAST COAST 2016, LLC
|
|
|
57.48
|
%
|
|
|
|
|
|
UNITED STATES
|
|
UNITED STATES
|
|
|
|
NORTHSTAR MACYS MARYLAND 2015, LLC
|
|
|
57.48
|
%
|
|
|
|
|
|
UNITED STATES
|
|
UNITED STATES
|
|
|
|
NORTHSTAR MACYS US WEST 2016, LLC
|
|
|
57.48
|
%
|
|
|
|
|
|
UNITED STATES
|
|
UNITED STATES
|
|
|
|
|
|
2015 Form 20-F TOTAL S.A.
|
|
F-89
|
Notes to the Consolidated Financial Statements – Note 35
|
|
|
|
|
|
|
|
|
|
|
|
|
|
|
|
|
Business segment
|
|
Statutory corporate name
|
|
% Group
interest
|
|
|
Method
|
|
|
Country of incorporation
|
|
Country of operations
|
|
|
|
NORTHSTAR SANTA CLARA COUNTY 2016, LLC
|
|
|
57.48
|
%
|
|
|
|
|
|
UNITED STATES
|
|
UNITED STATES
|
|
|
|
OCHOA SOLAR LLC
|
|
|
57.48
|
%
|
|
|
|
|
|
UNITED STATES
|
|
UNITED STATES
|
|
|
|
PARREY PARENT, LLC
|
|
|
57.48
|
%
|
|
|
|
|
|
UNITED STATES
|
|
UNITED STATES
|
|
|
|
PARREY, LLC
|
|
|
57.48
|
%
|
|
|
|
|
|
UNITED STATES
|
|
UNITED STATES
|
|
|
|
PATISH (WEST) GREEN ENERGIES LTD
|
|
|
57.48
|
%
|
|
|
|
|
|
ISRAEL
|
|
ISRAEL
|
|
|
|
PHANTOM FIELD RESOURCES, LLC
|
|
|
57.48
|
%
|
|
|
|
|
|
UNITED STATES
|
|
UNITED STATES
|
|
|
|
PHOTOVOLTAIC PARK MALTA LIMITED
|
|
|
57.48
|
%
|
|
|
|
|
|
MALTA
|
|
UNITED STATES
|
|
|
|
PHOTOVOTAICA PARKA VEROIA ANONYMI ETAIREIA
|
|
|
57.48
|
%
|
|
|
|
|
|
GREECE
|
|
GREECE
|
|
|
|
PLUTO ACQUISITION COMPANY LLC
|
|
|
57.48
|
%
|
|
|
|
|
|
UNITED STATES
|
|
UNITED STATES
|
|
|
|
PRODUITS PETROLIERS STELA
|
|
|
99.99
|
%
|
|
|
|
|
|
FRANCE
|
|
FRANCE
|
|
|
|
PV SALVADOR SPA
|
|
|
20.00
|
%
|
|
|
E
|
|
|
CHILE
|
|
CHILE
|
|
|
|
QUIMICA VASCA SA UNIPERSONAL
|
|
|
100.00
|
%
|
|
|
|
|
|
SPAIN
|
|
SPAIN
|
|
|
|
RAY OF SUCCESS ANONYMI ENERGEIAKI ETAIREIA (DISTINCTIVE TITLE RAY OF SUCCESS A.E.)
|
|
|
40.23
|
%
|
|
|
|
|
|
GREECE
|
|
GREECE
|
|
|
|
RAY OF SUCCESS MALTA LIMITED
|
|
|
57.48
|
%
|
|
|
|
|
|
MALTA
|
|
MALTA
|
|
|
|
REDSTONE SOLAR I, LLC
|
|
|
57.48
|
%
|
|
|
|
|
|
UNITED STATES
|
|
UNITED STATES
|
|
|
|
RIO BRAVO SOLAR I, LLC
|
|
|
57.48
|
%
|
|
|
|
|
|
UNITED STATES
|
|
UNITED STATES
|
|
|
|
RIO BRAVO SOLAR II, LLC
|
|
|
57.48
|
%
|
|
|
|
|
|
UNITED STATES
|
|
UNITED STATES
|
|
|
|
ROTEM SUNPOWER LTD
|
|
|
57.48
|
%
|
|
|
|
|
|
ISRAEL
|
|
ISRAEL
|
|
|
|
SAHARA SOLAR INVESTMENT, LLC
|
|
|
57.48
|
%
|
|
|
|
|
|
UNITED STATES
|
|
UNITED STATES
|
|
|
|
SANDY HILLS SOLAR I, LLC
|
|
|
57.48
|
%
|
|
|
|
|
|
UNITED STATES
|
|
UNITED STATES
|
|
|
|
SAUDI TOTAL PETROLEUM PRODUCTS
|
|
|
51.00
|
%
|
|
|
E
|
|
|
SAUDI ARABIA
|
|
SAUDI ARABIA
|
|
|
|
SERVAUTO NEDERLAND BV
|
|
|
100.00
|
%
|
|
|
|
|
|
NETHERLANDS
|
|
NETHERLANDS
|
|
|
|
SGS ANTELOPE VALLEY DEVELOPMENT, LLC
|
|
|
57.48
|
%
|
|
|
|
|
|
UNITED STATES
|
|
UNITED STATES
|
|
|
|
SGULA (EAST) GREEN ENERGIES LTD
|
|
|
57.48
|
%
|
|
|
|
|
|
ISRAEL
|
|
UNITED STATES
|
|
|
|
SGULA (WEST) GREEN ENERGIES LTD
|
|
|
57.48
|
%
|
|
|
|
|
|
ISRAEL
|
|
ISRAEL
|
|
|
|
SHAMS POWER COMPANY PJSC
|
|
|
20.00
|
%
|
|
|
E
|
|
|
UNITED ARAB EMIRATES
|
|
UNITED ARAB EMIRATES
|
|
|
|
SICHUAN SHENGTIAN NEW ENERGY DEVELOPMENT CO., LTD
|
|
|
2.64
|
%
|
|
|
E
|
|
|
CHINA
|
|
UNITED STATES
|
|
|
|
SOCIETE DES TRANSPORTS PETROLIERS PAR PIPELINE
|
|
|
35.50
|
%
|
|
|
E
|
|
|
FRANCE
|
|
FRANCE
|
|
|
|
SOCIETE D’EXPLOITATION DE CENTRALES PHOTOVOLTAIQUES 1
|
|
|
28.80
|
%
|
|
|
|
|
|
FRANCE
|
|
FRANCE
|
|
|
|
SOCIETE MAHORAISE DE STOCKAGE DE PRODUITS PETROLIERS
|
|
|
100.00
|
%
|
|
|
|
|
|
FRANCE
|
|
FRANCE
|
|
|
|
SOCIETE POUR L’EXPLOITATION DE L’USINE DE ROUEN
|
|
|
98.98
|
%
|
|
|
|
|
|
FRANCE
|
|
FRANCE
|
|
|
|
SOCIETE URBAINE DES PETROLES
|
|
|
100.00
|
%
|
|
|
|
|
|
FRANCE
|
|
FRANCE
|
|
|
|
S-OIL TOTAL LUBRICANTS CO LTD
|
|
|
50.00
|
%
|
|
|
E
|
|
|
KOREA, REPUBLIC OF
|
|
KOREA, REPUBLIC OF
|
|
|
|
SOLAR ASSURANCE CAPITAL PTY LTD
|
|
|
57.48
|
%
|
|
|
|
|
|
AUSTRALIA
|
|
AUSTRALIA
|
|
|
|
SOLAR GREENHOUSE I, LLC
|
|
|
57.48
|
%
|
|
|
|
|
|
UNITED STATES
|
|
UNITED STATES
|
|
|
|
SOLAR STAR ARIZONA HMR-I, LLC
|
|
|
57.48
|
%
|
|
|
|
|
|
UNITED STATES
|
|
UNITED STATES
|
|
|
|
SOLAR STAR ARIZONA I, LLC
|
|
|
57.48
|
%
|
|
|
|
|
|
UNITED STATES
|
|
UNITED STATES
|
|
|
|
SOLAR STAR ARIZONA II, LLC
|
|
|
57.48
|
%
|
|
|
|
|
|
UNITED STATES
|
|
UNITED STATES
|
|
|
|
SOLAR STAR ARIZONA III, LLC
|
|
|
57.48
|
%
|
|
|
|
|
|
UNITED STATES
|
|
UNITED STATES
|
|
|
|
SOLAR STAR ARIZONA IV, LLC
|
|
|
57.48
|
%
|
|
|
|
|
|
UNITED STATES
|
|
UNITED STATES
|
|
|
|
SOLAR STAR ARIZONA V, LLC
|
|
|
57.48
|
%
|
|
|
|
|
|
UNITED STATES
|
|
UNITED STATES
|
|
|
|
SOLAR STAR ARIZONA VI, LLC
|
|
|
57.48
|
%
|
|
|
|
|
|
UNITED STATES
|
|
UNITED STATES
|
|
|
|
SOLAR STAR ARIZONA VII, LLC
|
|
|
57.48
|
%
|
|
|
|
|
|
UNITED STATES
|
|
UNITED STATES
|
|
|
|
SOLAR STAR ARIZONA XIII, LLC
|
|
|
57.48
|
%
|
|
|
|
|
|
UNITED STATES
|
|
UNITED STATES
|
|
|
|
SOLAR STAR CALIFORNIA I, LLC
|
|
|
57.48
|
%
|
|
|
|
|
|
UNITED STATES
|
|
UNITED STATES
|
|
|
|
SOLAR STAR CALIFORNIA IV, LLC
|
|
|
57.48
|
%
|
|
|
|
|
|
UNITED STATES
|
|
UNITED STATES
|
|
|
|
SOLAR STAR CALIFORNIA VII, LLC
|
|
|
57.48
|
%
|
|
|
|
|
|
UNITED STATES
|
|
UNITED STATES
|
|
|
|
SOLAR STAR CALIFORNIA XII, LLC
|
|
|
57.48
|
%
|
|
|
|
|
|
UNITED STATES
|
|
UNITED STATES
|
|
|
|
SOLAR STAR CALIFORNIA XL, LLC
|
|
|
57.48
|
%
|
|
|
|
|
|
UNITED STATES
|
|
UNITED STATES
|
|
|
|
SOLAR STAR CALIFORNIA XLI PARENT, LLC
|
|
|
57.48
|
%
|
|
|
|
|
|
UNITED STATES
|
|
UNITED STATES
|
|
|
|
SOLAR STAR CALIFORNIA XLI, LLC
|
|
|
57.48
|
%
|
|
|
|
|
|
UNITED STATES
|
|
UNITED STATES
|
|
|
|
SOLAR STAR CALIFORNIA XLII, LLC
|
|
|
57.48
|
%
|
|
|
|
|
|
UNITED STATES
|
|
UNITED STATES
|
|
|
|
SOLAR STAR CALIFORNIA XLIII, LLC
|
|
|
57.48
|
%
|
|
|
|
|
|
UNITED STATES
|
|
UNITED STATES
|
|
|
|
|
|
F-90
|
|
TOTAL S.A. Form 20-F 2015
|
Note 35 – Notes to the Consolidated Financial Statements
|
|
|
|
|
|
|
|
|
|
|
|
|
|
|
|
|
Business segment
|
|
Statutory corporate name
|
|
% Group
interest
|
|
|
Method
|
|
|
Country of incorporation
|
|
Country of operations
|
|
|
|
SOLAR STAR CALIFORNIA XLIV, LLC
|
|
|
57.48
|
%
|
|
|
|
|
|
UNITED STATES
|
|
UNITED STATES
|
|
|
|
SOLAR STAR CALIFORNIA XV PARENT, LLC
|
|
|
57.48
|
%
|
|
|
|
|
|
UNITED STATES
|
|
UNITED STATES
|
|
|
|
SOLAR STAR CALIFORNIA XV, LLC
|
|
|
57.48
|
%
|
|
|
|
|
|
UNITED STATES
|
|
UNITED STATES
|
|
|
|
SOLAR STAR CALIFORNIA XVI, LLC
|
|
|
57.48
|
%
|
|
|
|
|
|
UNITED STATES
|
|
UNITED STATES
|
|
|
|
SOLAR STAR CALIFORNIA XVII, LLC
|
|
|
57.48
|
%
|
|
|
|
|
|
UNITED STATES
|
|
UNITED STATES
|
|
|
|
SOLAR STAR CALIFORNIA XVIII, LLC
|
|
|
57.48
|
%
|
|
|
|
|
|
UNITED STATES
|
|
UNITED STATES
|
|
|
|
SOLAR STAR CALIFORNIA XXI, LLC
|
|
|
57.48
|
%
|
|
|
|
|
|
UNITED STATES
|
|
UNITED STATES
|
|
|
|
SOLAR STAR CALIFORNIA XXII, LLC
|
|
|
57.48
|
%
|
|
|
|
|
|
UNITED STATES
|
|
UNITED STATES
|
|
|
|
SOLAR STAR CALIFORNIA XXIII, LLC
|
|
|
57.48
|
%
|
|
|
|
|
|
UNITED STATES
|
|
UNITED STATES
|
|
|
|
SOLAR STAR CALIFORNIA XXIV, LLC
|
|
|
57.48
|
%
|
|
|
|
|
|
UNITED STATES
|
|
UNITED STATES
|
|
|
|
SOLAR STAR CALIFORNIA XXIX, LLC
|
|
|
57.48
|
%
|
|
|
|
|
|
UNITED STATES
|
|
UNITED STATES
|
|
|
|
SOLAR STAR CALIFORNIA XXV, LLC
|
|
|
57.48
|
%
|
|
|
|
|
|
UNITED STATES
|
|
UNITED STATES
|
|
|
|
SOLAR STAR CALIFORNIA XXVI, LLC
|
|
|
57.48
|
%
|
|
|
|
|
|
UNITED STATES
|
|
UNITED STATES
|
|
|
|
SOLAR STAR CALIFORNIA XXVII, LLC
|
|
|
57.48
|
%
|
|
|
|
|
|
UNITED STATES
|
|
UNITED STATES
|
|
|
|
SOLAR STAR CALIFORNIA XXVIII, LLC
|
|
|
57.48
|
%
|
|
|
|
|
|
UNITED STATES
|
|
UNITED STATES
|
|
|
|
SOLAR STAR CALIFORNIA XXX (2), LLC
|
|
|
57.48
|
%
|
|
|
|
|
|
UNITED STATES
|
|
UNITED STATES
|
|
|
|
SOLAR STAR CALIFORNIA XXXIV, LLC
|
|
|
57.48
|
%
|
|
|
|
|
|
UNITED STATES
|
|
UNITED STATES
|
|
|
|
SOLAR STAR CALIFORNIA XXXIX, LLC
|
|
|
57.48
|
%
|
|
|
|
|
|
UNITED STATES
|
|
UNITED STATES
|
|
|
|
SOLAR STAR CALIFORNIA XXXV, LLC
|
|
|
57.48
|
%
|
|
|
|
|
|
UNITED STATES
|
|
UNITED STATES
|
|
|
|
SOLAR STAR CALIFORNIA XXXVI, LLC
|
|
|
57.48
|
%
|
|
|
|
|
|
UNITED STATES
|
|
UNITED STATES
|
|
|
|
SOLAR STAR CALIFORNIA XXXVII, LLC
|
|
|
57.48
|
%
|
|
|
|
|
|
UNITED STATES
|
|
UNITED STATES
|
|
|
|
SOLAR STAR CALIFORNIA XXXVIII, LLC
|
|
|
57.48
|
%
|
|
|
|
|
|
UNITED STATES
|
|
UNITED STATES
|
|
|
|
SOLAR STAR COLORADO II, LLC
|
|
|
57.48
|
%
|
|
|
|
|
|
UNITED STATES
|
|
UNITED STATES
|
|
|
|
SOLAR STAR COLORADO III PARENT, LLC
|
|
|
57.48
|
%
|
|
|
|
|
|
UNITED STATES
|
|
UNITED STATES
|
|
|
|
SOLAR STAR COLORADO III, LLC
|
|
|
57.48
|
%
|
|
|
|
|
|
UNITED STATES
|
|
UNITED STATES
|
|
|
|
SOLAR STAR CONNECTICUT I, LLC
|
|
|
57.48
|
%
|
|
|
|
|
|
UNITED STATES
|
|
UNITED STATES
|
|
|
|
SOLAR STAR HAWAII I, LLC
|
|
|
57.48
|
%
|
|
|
|
|
|
UNITED STATES
|
|
UNITED STATES
|
|
|
|
SOLAR STAR HAWAII IV, LLC
|
|
|
57.48
|
%
|
|
|
|
|
|
UNITED STATES
|
|
UNITED STATES
|
|
|
|
SOLAR STAR HI AIR, LLC
|
|
|
57.48
|
%
|
|
|
|
|
|
UNITED STATES
|
|
UNITED STATES
|
|
|
|
SOLAR STAR NEW JERSEY IV, LLC
|
|
|
57.48
|
%
|
|
|
|
|
|
UNITED STATES
|
|
UNITED STATES
|
|
|
|
SOLAR STAR NEW YORK I, LLC
|
|
|
57.48
|
%
|
|
|
|
|
|
UNITED STATES
|
|
UNITED STATES
|
|
|
|
SOLAR STAR OCEANSIDE, LLC
|
|
|
57.48
|
%
|
|
|
|
|
|
UNITED STATES
|
|
UNITED STATES
|
|
|
|
SOLAR STAR OREGON I, LLC
|
|
|
57.48
|
%
|
|
|
|
|
|
UNITED STATES
|
|
UNITED STATES
|
|
|
|
SOLAR STAR RANCHO CWD I, LLC
|
|
|
57.48
|
%
|
|
|
|
|
|
UNITED STATES
|
|
UNITED STATES
|
|
|
|
SOLAR STAR TEXAS II, LLC
|
|
|
57.48
|
%
|
|
|
|
|
|
UNITED STATES
|
|
UNITED STATES
|
|
|
|
SOLAR STAR TEXAS IV, LLC
|
|
|
57.48
|
%
|
|
|
|
|
|
UNITED STATES
|
|
UNITED STATES
|
|
|
|
SOLAR STAR YC, LLC
|
|
|
57.48
|
%
|
|
|
|
|
|
UNITED STATES
|
|
UNITED STATES
|
|
|
|
SOLARBRIDGE TECHNOLOGIES, INC.
|
|
|
57.48
|
%
|
|
|
|
|
|
UNITED STATES
|
|
UNITED STATES
|
|
|
|
SOUTH ASIA LPG PRIVATE LIMITED
|
|
|
50.00
|
%
|
|
|
E
|
|
|
INDIA
|
|
INDIA
|
|
|
|
SP CORDOBESA MALTA LIMITED
|
|
|
57.48
|
%
|
|
|
|
|
|
MALTA
|
|
MALTA
|
|
|
|
SP QUINTANA MALTA LIMITED
|
|
|
57.48
|
%
|
|
|
|
|
|
MALTA
|
|
MALTA
|
|
|
|
SPML LAND, INC.
|
|
|
57.48
|
%
|
|
|
|
|
|
PHILIPPINES
|
|
PHILIPPINES
|
|
|
|
SPWR ENERGIAS RENOVAVEIS UNIPESSOAL, LDA.
|
|
|
57.48
|
%
|
|
|
|
|
|
PORTUGAL
|
|
PORTUGAL
|
|
|
|
SPWR EW 2013-1, LLC
|
|
|
0.57
|
%
|
|
|
|
|
|
UNITED STATES
|
|
UNITED STATES
|
|
|
|
SPWR MS 2013-1, LLC
|
|
|
28.74
|
%
|
|
|
|
|
|
UNITED STATES
|
|
UNITED STATES
|
|
|
|
SPWR SOLAR ENERGEIAKI HELLAS SINGLE MEMBER EPE
|
|
|
57.48
|
%
|
|
|
|
|
|
GREECE
|
|
GREECE
|
|
|
|
SPWR USB 2013-1, LLC
|
|
|
0.57
|
%
|
|
|
|
|
|
UNITED STATES
|
|
UNITED STATES
|
|
|
|
SPWR USB 2013-2, LLC
|
|
|
0.57
|
%
|
|
|
|
|
|
UNITED STATES
|
|
UNITED STATES
|
|
|
|
SPWR USB 2013-3, LLC
|
|
|
0.57
|
%
|
|
|
|
|
|
UNITED STATES
|
|
UNITED STATES
|
|
|
|
SSCO III HOLDINGS COMPANY, LLC
|
|
|
57.48
|
%
|
|
|
|
|
|
UNITED STATES
|
|
UNITED STATES
|
|
|
|
SSCO III MANAGING MEMBER, LLC
|
|
|
57.48
|
%
|
|
|
|
|
|
UNITED STATES
|
|
UNITED STATES
|
|
|
|
SSSA, LLC
|
|
|
57.48
|
%
|
|
|
|
|
|
UNITED STATES
|
|
UNITED STATES
|
|
|
|
STRATA SOLAR LLC
|
|
|
57.48
|
%
|
|
|
|
|
|
UNITED STATES
|
|
UNITED STATES
|
|
|
|
SUNFRONT I, LLC
|
|
|
57.48
|
%
|
|
|
|
|
|
UNITED STATES
|
|
UNITED STATES
|
|
|
|
SUNPOWER ACCESS I, LLC
|
|
|
57.48
|
%
|
|
|
|
|
|
UNITED STATES
|
|
UNITED STATES
|
|
|
|
SUNPOWER ASSETCO, LLC
|
|
|
57.48
|
%
|
|
|
|
|
|
UNITED STATES
|
|
UNITED STATES
|
|
|
|
SUNPOWER BERMUDA HOLDINGS
|
|
|
57.48
|
%
|
|
|
|
|
|
BERMUDA
|
|
BERMUDA
|
|
|
|
SUNPOWER CAPITAL AUSTRALIA PTY LTD
|
|
|
57.48
|
%
|
|
|
|
|
|
AUSTRALIA
|
|
AUSTRALIA
|
|
|
|
SUNPOWER CAPITAL SERVICES, LLC
|
|
|
57.48
|
%
|
|
|
|
|
|
UNITED STATES
|
|
UNITED STATES
|
|
|
|
SUNPOWER CAPITAL, LLC
|
|
|
57.48
|
%
|
|
|
|
|
|
UNITED STATES
|
|
UNITED STATES
|
|
|
|
|
|
2015 Form 20-F TOTAL S.A.
|
|
F-91
|
Notes to the Consolidated Financial Statements – Note 35
|
|
|
|
|
|
|
|
|
|
|
|
|
|
|
Business segment
|
|
Statutory corporate name
|
|
% Group
interest
|
|
|
Method
|
|
Country of incorporation
|
|
Country of operations
|
|
|
|
SUNPOWER COMMERCIAL HOLDING COMPANY II, LLC
|
|
|
57.48
|
%
|
|
|
|
UNITED STATES
|
|
UNITED STATES
|
|
|
|
SUNPOWER COMMERCIAL HOLDING COMPANY III, LLC
|
|
|
57.48
|
%
|
|
|
|
UNITED STATES
|
|
UNITED STATES
|
|
|
|
SUNPOWER COMMERCIAL II CLASS B, LLC
|
|
|
57.48
|
%
|
|
|
|
UNITED STATES
|
|
UNITED STATES
|
|
|
|
SUNPOWER COMMERCIAL III CLASS B, LLC
|
|
|
57.48
|
%
|
|
|
|
UNITED STATES
|
|
UNITED STATES
|
|
|
|
SUNPOWER CORP ISRAEL LTD
|
|
|
57.48
|
%
|
|
|
|
ISRAEL
|
|
ISRAEL
|
|
|
|
SUNPOWER CORPORATION
|
|
|
57.48
|
%
|
|
|
|
UNITED STATES
|
|
UNITED STATES
|
|
|
|
SUNPOWER CORPORATION (SWITZERLAND) SARL
|
|
|
57.48
|
%
|
|
|
|
SWITZERLAND
|
|
SWITZERLAND
|
|
|
|
SUNPOWER CORPORATION AUSTRALIA PTY LTD
|
|
|
57.48
|
%
|
|
|
|
AUSTRALIA
|
|
AUSTRALIA
|
|
|
|
SUNPOWER CORPORATION LIMITED
|
|
|
57.48
|
%
|
|
|
|
HONG KONG
|
|
HONG KONG
|
|
|
|
SUNPOWER CORPORATION MALTA HOLDINGS LIMITED
|
|
|
57.48
|
%
|
|
|
|
MALTA
|
|
MALTA
|
|
|
|
SUNPOWER CORPORATION MEXICO, S. DE R.L. DE C.V.
|
|
|
57.48
|
%
|
|
|
|
MEXICO
|
|
MEXICO
|
|
|
|
SUNPOWER CORPORATION SOUTHERN AFRICA (PTY) LTD
|
|
|
57.48
|
%
|
|
|
|
SOUTH AFRICA
|
|
SOUTH AFRICA
|
|
|
|
SUNPOWER CORPORATION SPA
|
|
|
57.48
|
%
|
|
|
|
CHILE
|
|
CHILE
|
|
|
|
SUNPOWER CORPORATION UK LIMITED
|
|
|
57.48
|
%
|
|
|
|
UNITED KINGDOM
|
|
UNITED KINGDOM
|
|
|
|
SUNPOWER CORPORATION, SYSTEMS
|
|
|
57.48
|
%
|
|
|
|
UNITED STATES
|
|
UNITED STATES
|
|
|
|
SUNPOWER DEVCO, LLC
|
|
|
57.48
|
%
|
|
|
|
UNITED STATES
|
|
UNITED STATES
|
|
|
|
SUNPOWER DEVELOPMENT COMPANY
|
|
|
57.48
|
%
|
|
|
|
UNITED STATES
|
|
UNITED STATES
|
|
|
|
SUNPOWER ENERGY CORPORATION LIMITED
|
|
|
57.48
|
%
|
|
|
|
HONG KONG
|
|
UNITED STATES
|
|
|
|
SUNPOWER ENERGY SYSTEMS (PTY) LTD
|
|
|
57.48
|
%
|
|
|
|
SOUTH AFRICA
|
|
SOUTH AFRICA
|
|
|
|
SUNPOWER ENERGY SYSTEMS CANADA CORPORATION
|
|
|
57.48
|
%
|
|
|
|
CANADA
|
|
CANADA
|
|
|
|
SUNPOWER ENERGY SYSTEMS KOREA
|
|
|
57.48
|
%
|
|
|
|
KOREA, REPUBLIC OF
|
|
KOREA, REPUBLIC OF
|
|
|
|
SUNPOWER ENERGY SYSTEMS SINGAPORE PTE LTD
|
|
|
57.48
|
%
|
|
|
|
SINGAPORE
|
|
SINGAPORE
|
|
|
|
SUNPOWER ENERGY SYSTEMS SOUTHERN AFRICA (PTY) LTD
|
|
|
57.48
|
%
|
|
|
|
SOUTH AFRICA
|
|
SOUTH AFRICA
|
|
|
|
SUNPOWER ENERGY SYSTEMS SPAIN, SL
|
|
|
57.48
|
%
|
|
|
|
SPAIN
|
|
SPAIN
|
|
|
|
SUNPOWER FOUNDATION
|
|
|
57.48
|
%
|
|
|
|
UNITED STATES
|
|
UNITED STATES
|
|
|
|
SUNPOWER FRANCE SAS
|
|
|
57.48
|
%
|
|
|
|
FRANCE
|
|
FRANCE
|
|
|
|
SUNPOWER GMBH
|
|
|
57.48
|
%
|
|
|
|
GERMANY
|
|
GERMANY
|
|
|
|
SUNPOWER HOLDCO, LLC
|
|
|
57.48
|
%
|
|
|
|
UNITED STATES
|
|
UNITED STATES
|
|
|
|
SUNPOWER ITALIA S.R.L.
|
|
|
57.48
|
%
|
|
|
|
ITALY
|
|
ITALY
|
|
|
|
SUNPOWER JAPAN KK
|
|
|
57.48
|
%
|
|
|
|
JAPAN
|
|
JAPAN
|
|
|
|
SUNPOWER MALTA LIMITED
|
|
|
57.48
|
%
|
|
|
|
MALTA
|
|
MALTA
|
|
|
|
SUNPOWER MANUFACTURING (PTY) LTD
|
|
|
57.48
|
%
|
|
|
|
SOUTH AFRICA
|
|
SOUTH AFRICA
|
|
|
|
SUNPOWER MANUFACTURING CORPORATION LIMITED
|
|
|
57.48
|
%
|
|
|
|
HONG KONG
|
|
UNITED STATES
|
|
|
|
SUNPOWER MANUFACTURING DE VERNEJOUL
|
|
|
57.48
|
%
|
|
|
|
FRANCE
|
|
FRANCE
|
|
|
|
SUNPOWER MÜHENDISLIK INSAAT ENERJI URETIM VE TICARET
|
|
|
57.48
|
%
|
|
|
|
TURKEY
|
|
TURKEY
|
|
|
|
SUNPOWER NANAO PARENT, LLC
|
|
|
57.48
|
%
|
|
|
|
UNITED STATES
|
|
UNITED STATES
|
|
|
|
SUNPOWER NETHERLANDS HOLD CO 1 B.V.
|
|
|
57.48
|
%
|
|
|
|
NETHERLANDS
|
|
NETHERLANDS
|
|
|
|
SUNPOWER NETHERLANDS HOLD CO 2 B.V.
|
|
|
57.48
|
%
|
|
|
|
NETHERLANDS
|
|
NETHERLANDS
|
|
|
|
SUNPOWER NETHERLANDS HOLD CO 3 B.V.
|
|
|
57.48
|
%
|
|
|
|
NETHERLANDS
|
|
NETHERLANDS
|
|
|
|
SUNPOWER NETHERLANDS HOLD CO 4 B.V.
|
|
|
57.48
|
%
|
|
|
|
NETHERLANDS
|
|
NETHERLANDS
|
|
|
|
SUNPOWER NETHERLANDS HOLD CO 5 B.V.
|
|
|
57.48
|
%
|
|
|
|
NETHERLANDS
|
|
NETHERLANDS
|
|
|
|
|
|
F-92
|
|
TOTAL S.A. Form 20-F 2015
|
Note 35 – Notes to the Consolidated Financial Statements
|
|
|
|
|
|
|
|
|
|
|
|
|
|
|
|
|
Business segment
|
|
Statutory corporate name
|
|
% Group
interest
|
|
|
Method
|
|
|
Country of incorporation
|
|
Country of operations
|
|
|
|
SUNPOWER NETHERLANDS HOLD CO 6 B.V.
|
|
|
57.48
|
%
|
|
|
|
|
|
NETHERLANDS
|
|
NETHERLANDS
|
|
|
|
SUNPOWER NETHERLANDS HOLD CO 7 B.V.
|
|
|
57.48
|
%
|
|
|
|
|
|
NETHERLANDS
|
|
NETHERLANDS
|
|
|
|
SUNPOWER NETHERLANDS HOLDINGS B.V.
|
|
|
57.48
|
%
|
|
|
|
|
|
NETHERLANDS
|
|
NETHERLANDS
|
|
|
|
SUNPOWER NORTH AMERICA, LLC
|
|
|
57.48
|
%
|
|
|
|
|
|
UNITED STATES
|
|
UNITED STATES
|
|
|
|
SUNPOWER PHILIPPINES LTD. — REGIONAL OPERATING HEADQUARTERS
|
|
|
57.48
|
%
|
|
|
|
|
|
CAYMAN ISLANDS
|
|
PHILIPPINES
|
|
|
|
SUNPOWER PHILIPPINES MANUFACTURING LTD.
|
|
|
57.48
|
%
|
|
|
|
|
|
CAYMAN ISLANDS
|
|
PHILIPPINES
|
|
|
|
SUNPOWER SOFTWARE I, INC.
|
|
|
57.48
|
%
|
|
|
|
|
|
UNITED STATES
|
|
UNITED STATES
|
|
|
|
SUNPOWER SOLAR ENERGY TECHNOLOGY (TIANJIN) CO., LTD
|
|
|
57.48
|
%
|
|
|
|
|
|
CHINA
|
|
CHINA
|
|
|
|
SUNPOWER SOLAR INDIA PRIVATE LIMITED
|
|
|
57.48
|
%
|
|
|
|
|
|
INDIA
|
|
INDIA
|
|
|
|
SUNPOWER SOLAR MALAYSIA SDN. BHD.
|
|
|
57.48
|
%
|
|
|
|
|
|
MALAYSIA
|
|
MALAYSIA
|
|
|
|
SUNPOWER SOLARPROGRAM III, LLC
|
|
|
57.48
|
%
|
|
|
|
|
|
UNITED STATES
|
|
UNITED STATES
|
|
|
|
SUNPOWER SOLARPROGRAM IV, LLC
|
|
|
57.48
|
%
|
|
|
|
|
|
UNITED STATES
|
|
UNITED STATES
|
|
|
|
SUNPOWER SOLARPROGRAM V, LLC
|
|
|
57.48
|
%
|
|
|
|
|
|
UNITED STATES
|
|
UNITED STATES
|
|
|
|
SUNPOWER SOLARPROGRAM VI, LLC
|
|
|
57.48
|
%
|
|
|
|
|
|
UNITED STATES
|
|
UNITED STATES
|
|
|
|
SUNPOWER SOLARPROGRAM VII, LLC
|
|
|
57.48
|
%
|
|
|
|
|
|
UNITED STATES
|
|
UNITED STATES
|
|
|
|
SUNPOWER SOLARPROGRAM VIII, LLC
|
|
|
57.48
|
%
|
|
|
|
|
|
UNITED STATES
|
|
UNITED STATES
|
|
|
|
SUNPOWER SOLARPROGRAM IX, LLC
|
|
|
57.48
|
%
|
|
|
|
|
|
UNITED STATES
|
|
UNITED STATES
|
|
|
|
SUNPOWER SYSTEMS BELGIUM SPRL
|
|
|
57.48
|
%
|
|
|
|
|
|
BELGIUM
|
|
BELGIUM
|
|
|
|
SUNPOWER SYSTEMS MEXICO S. DE R.L. DE C.V.
|
|
|
57.48
|
%
|
|
|
|
|
|
MEXICO
|
|
MEXICO
|
|
|
|
SUNPOWER SYSTEMS SARL
|
|
|
57.48
|
%
|
|
|
|
|
|
SWITZERLAND
|
|
SWITZERLAND
|
|
|
|
SUNPOWER TECHNOLOGIES FRANCE SAS
|
|
|
57.48
|
%
|
|
|
|
|
|
FRANCE
|
|
FRANCE
|
|
|
|
SUNPOWER TECHNOLOGY LTD.
|
|
|
57.48
|
%
|
|
|
|
|
|
CAYMAN ISLANDS
|
|
CAYMAN ISLANDS
|
|
|
|
SUNPOWER YC HOLDINGS, LLC
|
|
|
57.48
|
%
|
|
|
|
|
|
UNITED STATES
|
|
UNITED STATES
|
|
|
|
SUNRAY ITALY S.R.L.
|
|
|
57.48
|
%
|
|
|
|
|
|
ITALY
|
|
ITALY
|
|
|
|
SUNRENTE INVESTISSEMENT FRANCE SAS
|
|
|
57.48
|
%
|
|
|
|
|
|
FRANCE
|
|
FRANCE
|
|
|
|
SUNRISE 1, LLC
|
|
|
32.49
|
%
|
|
|
|
|
|
UNITED STATES
|
|
UNITED STATES
|
|
|
|
SUNZIL
|
|
|
50.00
|
%
|
|
|
E
|
|
|
FRANCE
|
|
FRANCE
|
|
|
|
SUNZIL CARAIBES
|
|
|
50.00
|
%
|
|
|
E
|
|
|
FRANCE
|
|
FRANCE
|
|
|
|
SUNZIL MAYOTTE SAS
|
|
|
50.00
|
%
|
|
|
E
|
|
|
FRANCE
|
|
FRANCE
|
|
|
|
SUNZIL OCEAN INDIEN
|
|
|
50.00
|
%
|
|
|
E
|
|
|
FRANCE
|
|
FRANCE
|
|
|
|
SUNZIL PACIFIC
|
|
|
50.00
|
%
|
|
|
E
|
|
|
FRANCE
|
|
FRANCE
|
|
|
|
SUNZIL POLYNESIE
|
|
|
50.00
|
%
|
|
|
E
|
|
|
FRANCE
|
|
FRANCE
|
|
|
|
SUNZIL POLYNESIE SERVICES
|
|
|
50.00
|
%
|
|
|
E
|
|
|
FRANCE
|
|
FRANCE
|
|
|
|
SUNZIL SERVICES CARAIBES
|
|
|
50.00
|
%
|
|
|
E
|
|
|
FRANCE
|
|
FRANCE
|
|
|
|
SUNZIL SERVICES OCEAN INDIEN
|
|
|
50.00
|
%
|
|
|
E
|
|
|
FRANCE
|
|
FRANCE
|
|
|
|
SWINGLETREE OPERATIONS, LLC
|
|
|
57.48
|
%
|
|
|
|
|
|
UNITED STATES
|
|
UNITED STATES
|
|
|
|
TEMASOL
|
|
|
57.48
|
%
|
|
|
|
|
|
MOROCCO
|
|
MOROCCO
|
|
|
|
TENESOL SAS
|
|
|
57.48
|
%
|
|
|
|
|
|
FRANCE
|
|
FRANCE
|
|
|
|
TENESOL SPV1
|
|
|
57.48
|
%
|
|
|
|
|
|
FRANCE
|
|
FRANCE
|
|
|
|
TENESOL SPV2
|
|
|
57.48
|
%
|
|
|
|
|
|
FRANCE
|
|
FRANCE
|
|
|
|
TENESOL VENEZUELA
|
|
|
57.48
|
%
|
|
|
|
|
|
VENEZUELA
|
|
VENEZUELA
|
|
|
|
TORIMODE (PTY) LTD
|
|
|
57.48
|
%
|
|
|
|
|
|
SOUTH AFRICA
|
|
SOUTH AFRICA
|
|
|
|
TORIPROX (PTY) LTD
|
|
|
57.48
|
%
|
|
|
|
|
|
SOUTH AFRICA
|
|
SOUTH AFRICA
|
|
|
|
TORISOL (PTY) LTD
|
|
|
57.48
|
%
|
|
|
|
|
|
SOUTH AFRICA
|
|
SOUTH AFRICA
|
|
|
|
TOTAL (AFRICA) LIMITED
|
|
|
100.00
|
%
|
|
|
|
|
|
UNITED KINGDOM
|
|
UNITED KINGDOM
|
|
|
|
TOTAL (FIJI) LIMITED
|
|
|
100.00
|
%
|
|
|
|
|
|
FIJI ISLANDS
|
|
FIJI ISLANDS
|
|
|
|
TOTAL (TIANJIN) MANUFACTURING CO., LTD.
|
|
|
77.00
|
%
|
|
|
|
|
|
CHINA
|
|
CHINA
|
|
|
|
TOTAL ABENGOA SOLAR EMIRATES INVESTMENT COMPANY BV
|
|
|
50.00
|
%
|
|
|
E
|
|
|
NETHERLANDS
|
|
UNITED ARAB EMIRATES
|
|
|
|
TOTAL ADDITIFS ET CARBURANTS SPECIAUX
|
|
|
100.00
|
%
|
|
|
|
|
|
FRANCE
|
|
FRANCE
|
|
|
|
TOTAL AFRICA S.A.
|
|
|
100.00
|
%
|
|
|
|
|
|
FRANCE
|
|
FRANCE
|
|
|
|
TOTAL AVIATION AND EXPORT LTD
|
|
|
100.00
|
%
|
|
|
|
|
|
ZAMBIA
|
|
ZAMBIA
|
|
|
|
TOTAL BELGIUM
|
|
|
100.00
|
%
|
|
|
|
|
|
BELGIUM
|
|
BELGIUM
|
|
|
|
|
|
2015 Form 20-F TOTAL S.A.
|
|
F-93
|
Notes to the Consolidated Financial Statements – Note 35
|
|
|
|
|
|
|
|
|
|
|
|
|
|
|
Business segment
|
|
Statutory corporate name
|
|
% Group
interest
|
|
|
Method
|
|
Country of incorporation
|
|
Country of operations
|
|
|
|
TOTAL BITUMEN DEUTSCHLAND GMBH
|
|
|
100.00
|
%
|
|
|
|
GERMANY
|
|
GERMANY
|
|
|
|
TOTAL BITUMEN UK LIMITED
|
|
|
100.00
|
%
|
|
|
|
UNITED KINGDOM
|
|
UNITED KINGDOM
|
|
|
|
TOTAL BOTSWANA (PTY) LTD
|
|
|
50.10
|
%
|
|
|
|
BOTSWANA
|
|
BOTSWANA
|
|
|
|
TOTAL BURKINA
|
|
|
100.00
|
%
|
|
|
|
BURKINA FASO
|
|
BURKINA FASO
|
|
|
|
TOTAL CAMBODGE
|
|
|
100.00
|
%
|
|
|
|
CAMBODIA
|
|
CAMBODIA
|
|
|
|
TOTAL CAMEROUN
|
|
|
67.01
|
%
|
|
|
|
CAMEROON
|
|
CAMEROON
|
|
|
|
TOTAL CARAIBES
|
|
|
100.00
|
%
|
|
|
|
FRANCE
|
|
FRANCE
|
|
|
|
TOTAL CESKA REPUBLIKA S.R.O
|
|
|
100.00
|
%
|
|
|
|
CZECH REPUBLIC
|
|
CZECH REPUBLIC
|
|
|
|
TOTAL CHINA INVESTMENT CO LTD
|
|
|
100.00
|
%
|
|
|
|
CHINA
|
|
CHINA
|
|
|
|
TOTAL CONGO
|
|
|
99.70
|
%
|
|
|
|
CONGO
|
|
CONGO
|
|
|
|
TOTAL CORSE
|
|
|
100.00
|
%
|
|
|
|
FRANCE
|
|
FRANCE
|
|
|
|
TOTAL COTE D’IVOIRE
|
|
|
72.99
|
%
|
|
|
|
COTE D’IVOIRE
|
|
COTE D’IVOIRE
|
|
|
|
TOTAL DENMARK A/S
|
|
|
100.00
|
%
|
|
|
|
DENMARK
|
|
DENMARK
|
|
|
|
TOTAL DEUTSCHLAND GMBH
(c)
|
|
|
100.00
|
%
|
|
|
|
GERMANY
|
|
GERMANY
|
|
|
|
TOTAL EGYPT
|
|
|
80.78
|
%
|
|
|
|
EGYPT
|
|
EGYPT
|
|
|
|
TOTAL ENERGIE DEVELOPPEMENT
|
|
|
100.00
|
%
|
|
|
|
FRANCE
|
|
FRANCE
|
|
|
|
TOTAL ENERGIE DO BRASIL
|
|
|
57.48
|
%
|
|
|
|
BRAZIL
|
|
BRAZIL
|
|
|
|
TOTAL ENERGIES NOUVELLES ACTIVITES USA
|
|
|
100.00
|
%
|
|
|
|
FRANCE
|
|
FRANCE
|
|
|
|
TOTAL ESPANA SA
|
|
|
100.00
|
%
|
|
|
|
SPAIN
|
|
SPAIN
|
|
|
|
TOTAL ESPECIALIDADES ARGENTINA
|
|
|
100.00
|
%
|
|
|
|
ARGENTINA
|
|
ARGENTINA
|
|
|
|
TOTAL ETHIOPIA
|
|
|
100.00
|
%
|
|
|
|
ETHIOPIA
|
|
ETHIOPIA
|
|
|
|
TOTAL FLUIDES
|
|
|
100.00
|
%
|
|
|
|
FRANCE
|
|
FRANCE
|
|
|
|
TOTAL FREEPORT CORPORATION
|
|
|
100.00
|
%
|
|
|
|
PHILIPPINES
|
|
PHILIPPINES
|
|
|
|
TOTAL FUELS WUHAN COMPANY LIMITED
|
|
|
100.00
|
%
|
|
|
|
CHINA
|
|
CHINA
|
|
|
|
TOTAL GLASS LUBRICANTS EUROPE GMBH
|
|
|
100.00
|
%
|
|
|
|
GERMANY
|
|
GERMANY
|
|
|
|
TOTAL GUADELOUPE
|
|
|
100.00
|
%
|
|
|
|
FRANCE
|
|
FRANCE
|
|
|
|
TOTAL GUINEA ECUATORIAL
|
|
|
70.00
|
%
|
|
|
|
EQUATORIAL GUINEA
|
|
EQUATORIAL GUINEA
|
|
|
|
TOTAL GUINEE
|
|
|
100.00
|
%
|
|
|
|
GUINEA
|
|
GUINEA
|
|
|
|
TOTAL HOLDING ASIE
|
|
|
100.00
|
%
|
|
|
|
FRANCE
|
|
FRANCE
|
|
|
|
TOTAL HOLDING INDIA
|
|
|
100.00
|
%
|
|
|
|
FRANCE
|
|
FRANCE
|
|
|
|
TOTAL JAMAICA LTD
|
|
|
100.00
|
%
|
|
|
|
JAMAICA
|
|
JAMAICA
|
|
|
|
TOTAL JORDAN PSC
|
|
|
100.00
|
%
|
|
|
|
JORDAN
|
|
JORDAN
|
|
|
|
TOTAL KENYA
|
|
|
93.96
|
%
|
|
|
|
KENYA
|
|
KENYA
|
|
|
|
TOTAL LESOTHO (PTY) LTD
|
|
|
50.10
|
%
|
|
|
|
LESOTHO
|
|
LESOTHO
|
|
|
|
TOTAL LIBAN
|
|
|
100.00
|
%
|
|
|
|
LEBANON
|
|
LEBANON
|
|
|
|
TOTAL LIBERIA INC
|
|
|
100.00
|
%
|
|
|
|
LIBERIA
|
|
LIBERIA
|
|
|
|
TOTAL LUBRICANTS (CHINA) CO LTD
|
|
|
77.00
|
%
|
|
|
|
CHINA
|
|
CHINA
|
|
|
|
TOTAL LUBRICANTS TAIWAN, LTD.
|
|
|
63.00
|
%
|
|
|
|
TAIWAN
|
|
TAIWAN
|
|
|
|
TOTAL LUBRIFIANTS
|
|
|
99.98
|
%
|
|
|
|
FRANCE
|
|
FRANCE
|
|
|
|
TOTAL LUBRIFIANTS SERVICES AUTOMOBILE
|
|
|
99.98
|
%
|
|
|
|
FRANCE
|
|
FRANCE
|
|
|
|
TOTAL LUXEMBOURG SA
|
|
|
100.00
|
%
|
|
|
|
LUXEMBOURG
|
|
LUXEMBOURG
|
|
|
|
TOTAL MADAGASIKARA SA
|
|
|
79.44
|
%
|
|
|
|
MADAGASCAR
|
|
MADAGASCAR
|
|
|
|
TOTAL MALI
|
|
|
100.00
|
%
|
|
|
|
MALI
|
|
MALI
|
|
|
|
TOTAL MARINE FUELS
|
|
|
100.00
|
%
|
|
|
|
SINGAPORE
|
|
SINGAPORE
|
|
|
|
TOTAL MARKETING EGYPT
|
|
|
80.78
|
%
|
|
|
|
EGYPT
|
|
EGYPT
|
|
|
|
TOTAL MARKETING FRANCE
|
|
|
100.00
|
%
|
|
|
|
FRANCE
|
|
FRANCE
|
|
|
|
TOTAL MARKETING GABON
|
|
|
90.00
|
%
|
|
|
|
GABON
|
|
GABON
|
|
|
|
TOTAL MARKETING MIDDLE EAST FREE ZONE
|
|
|
100.00
|
%
|
|
|
|
UNITED ARAB EMIRATES
|
|
UNITED ARAB EMIRATES
|
|
|
|
TOTAL MARKETING SERVICES
|
|
|
100.00
|
%
|
|
|
|
FRANCE
|
|
FRANCE
|
|
|
|
TOTAL MARKETING TCHAD
|
|
|
100.00
|
%
|
|
|
|
CHAD
|
|
CHAD
|
|
|
|
TOTAL MARKETING UGANDA
|
|
|
100.00
|
%
|
|
|
|
UGANDA
|
|
UGANDA
|
|
|
|
TOTAL MAROC
|
|
|
55.00
|
%
|
|
|
|
MOROCCO
|
|
MOROCCO
|
|
|
|
TOTAL MAURITIUS
|
|
|
55.00
|
%
|
|
|
|
MAURITIUS
|
|
MAURITIUS
|
|
|
|
TOTAL MAYOTTE
|
|
|
100.00
|
%
|
|
|
|
FRANCE
|
|
FRANCE
|
|
|
|
TOTAL MEXICO SA DE CV
|
|
|
100.00
|
%
|
|
|
|
MEXICO
|
|
MEXICO
|
|
|
|
TOTAL MINERALOEL UND CHEMIE GMBH
|
|
|
100.00
|
%
|
|
|
|
GERMANY
|
|
GERMANY
|
|
|
|
TOTAL MINERALÖL GMBH
|
|
|
100.00
|
%
|
|
|
|
GERMANY
|
|
GERMANY
|
|
|
|
TOTAL MOZAMBIQUE
|
|
|
100.00
|
%
|
|
|
|
MOZAMBIQUE
|
|
MOZAMBIQUE
|
|
(C)
|
Multi-segment entities.
|
|
|
|
|
|
F-94
|
|
TOTAL S.A. Form 20-F 2015
|
Note 35 – Notes to the Consolidated Financial Statements
|
|
|
|
|
|
|
|
|
|
|
|
|
|
|
|
|
Business segment
|
|
Statutory corporate name
|
|
% Group
interest
|
|
|
Method
|
|
|
Country of incorporation
|
|
Country of operations
|
|
|
|
TOTAL NAMIBIA (PTY) LTD
|
|
|
50.10
|
%
|
|
|
|
|
|
NAMIBIA
|
|
NAMIBIA
|
|
|
|
TOTAL NEDERLAND NV
|
|
|
100.00
|
%
|
|
|
|
|
|
NETHERLANDS
|
|
NETHERLANDS
|
|
|
|
TOTAL NEW ENERGIES LTD
|
|
|
100.00
|
%
|
|
|
|
|
|
UNITED KINGDOM
|
|
UNITED KINGDOM
|
|
|
|
TOTAL NEW ENERGIES USA, INC.
|
|
|
100.00
|
%
|
|
|
|
|
|
UNITED STATES
|
|
UNITED STATES
|
|
|
|
TOTAL NEW ENERGIES VENTURES USA, INC.
|
|
|
100.00
|
%
|
|
|
|
|
|
UNITED STATES
|
|
UNITED STATES
|
|
|
|
TOTAL NIGER SA
|
|
|
100.00
|
%
|
|
|
|
|
|
NIGER
|
|
NIGER
|
|
|
|
TOTAL NIGERIA PLC
|
|
|
61.72
|
%
|
|
|
|
|
|
NIGERIA
|
|
NIGERIA
|
|
|
|
TOTAL NUEVAS ENERGIAS CHILE SPA
|
|
|
100.00
|
%
|
|
|
|
|
|
CHILE
|
|
CHILE
|
|
|
|
TOTAL OIL ASIA-PACIFIC PTE LTD
|
|
|
100.00
|
%
|
|
|
|
|
|
SINGAPORE
|
|
SINGAPORE
|
|
|
|
TOTAL OIL INDIA PVT LTD
|
|
|
100.00
|
%
|
|
|
|
|
|
INDIA
|
|
INDIA
|
|
|
|
TOTAL OIL PAKISTAN (PRIVATE) LIMITED
|
|
|
50.00
|
%
|
|
|
E
|
|
|
PAKISTAN
|
|
PAKISTAN
|
|
|
|
TOTAL OIL TURKIYE AS
|
|
|
100.00
|
%
|
|
|
|
|
|
TURKEY
|
|
TURKEY
|
|
|
|
TOTAL OUTRE MER
|
|
|
100.00
|
%
|
|
|
|
|
|
FRANCE
|
|
FRANCE
|
|
|
|
TOTAL PACIFIQUE
|
|
|
100.00
|
%
|
|
|
|
|
|
FRANCE
|
|
FRANCE
|
|
|
|
TOTAL PARCO MARKETING LIMITED
|
|
|
50.00
|
%
|
|
|
E
|
|
|
BAHAMAS
|
|
PAKISTAN
|
|
|
|
TOTAL PARCO PAKISTAN LIMITED
|
|
|
50.00
|
%
|
|
|
E
|
|
|
PAKISTAN
|
|
PAKISTAN
|
|
|
|
TOTAL PETROLEUM (SHANGHAI) COMPANY LIMITED
|
|
|
100.00
|
%
|
|
|
|
|
|
CHINA
|
|
CHINA
|
|
|
|
TOTAL PETROLEUM GHANA LIMITED
|
|
|
76.74
|
%
|
|
|
|
|
|
GHANA
|
|
GHANA
|
|
|
|
TOTAL PETROLEUM GUANGZHOU CO LTD
|
|
|
100.00
|
%
|
|
|
|
|
|
CHINA
|
|
CHINA
|
|
|
|
TOTAL PETROLEUM PUERTO RICO CORP
|
|
|
100.00
|
%
|
|
|
|
|
|
PUERTO RICO
|
|
PUERTO RICO
|
|
|
|
TOTAL PHILIPPINES CORPORATION
|
|
|
100.00
|
%
|
|
|
|
|
|
PHILIPPINES
|
|
PHILIPPINES
|
|
|
|
TOTAL POLSKA
|
|
|
100.00
|
%
|
|
|
|
|
|
POLAND
|
|
POLAND
|
|
|
|
TOTAL POLYNESIE
|
|
|
99.54
|
%
|
|
|
|
|
|
FRANCE
|
|
FRANCE
|
|
|
|
TOTAL RDC
|
|
|
60.00
|
%
|
|
|
|
|
|
DEMOCRATIC REPUBLIC OF CONGO
|
|
DEMOCRATIC REPUBLIC OF CONGO
|
|
|
|
TOTAL REUNION
|
|
|
100.00
|
%
|
|
|
|
|
|
FRANCE
|
|
FRANCE
|
|
|
|
TOTAL SENEGAL
|
|
|
69.14
|
%
|
|
|
|
|
|
SENEGAL
|
|
SENEGAL
|
|
|
|
TOTAL SINOCHEM FUELS COMPANY LTD
|
|
|
49.00
|
%
|
|
|
E
|
|
|
CHINA
|
|
CHINA
|
|
|
|
TOTAL SINOCHEM OIL COMPANY LIMITED
|
|
|
49.00
|
%
|
|
|
E
|
|
|
CHINA
|
|
CHINA
|
|
|
|
TOTAL SOUTH AFRICA (PTY) LTD
|
|
|
50.10
|
%
|
|
|
|
|
|
SOUTH AFRICA
|
|
SOUTH AFRICA
|
|
|
|
TOTAL SPECIALTIES USA INC
|
|
|
100.00
|
%
|
|
|
|
|
|
UNITED STATES
|
|
UNITED STATES
|
|
|
|
TOTAL SUPPLY MS SA
|
|
|
100.00
|
%
|
|
|
|
|
|
SWITZERLAND
|
|
SWITZERLAND
|
|
|
|
TOTAL SWAZILAND (PTY) LTD
|
|
|
50.10
|
%
|
|
|
|
|
|
SWAZILAND
|
|
SWAZILAND
|
|
|
|
TOTAL TANZANIA LIMITED
|
|
|
100.00
|
%
|
|
|
|
|
|
TANZANIA
|
|
TANZANIA
|
|
|
|
TOTAL TOGO
|
|
|
76.72
|
%
|
|
|
|
|
|
TOGO
|
|
TOGO
|
|
|
|
TOTAL TUNISIE
|
|
|
100.00
|
%
|
|
|
|
|
|
TUNISIA
|
|
TUNISIA
|
|
|
|
TOTAL TURKEY PARSALAMA
|
|
|
100.00
|
%
|
|
|
|
|
|
TURKEY
|
|
TURKEY
|
|
|
|
TOTAL UAE LLC
|
|
|
49.00
|
%
|
|
|
|
|
|
UNITED ARAB EMIRATES
|
|
UNITED ARAB EMIRATES
|
|
|
|
TOTAL UGANDA LIMITED
|
|
|
100.00
|
%
|
|
|
|
|
|
UGANDA
|
|
UGANDA
|
|
|
|
TOTAL UK LIMITED
|
|
|
100.00
|
%
|
|
|
|
|
|
UNITED KINGDOM
|
|
UNITED KINGDOM
|
|
|
|
TOTAL UNION OCEANE
|
|
|
100.00
|
%
|
|
|
|
|
|
FRANCE
|
|
FRANCE
|
|
|
|
TOTAL VOSTOK
|
|
|
100.00
|
%
|
|
|
|
|
|
RUSSIAN FEDERATION
|
|
RUSSIAN FEDERATION
|
|
|
|
TOTAL ZAMBIA
|
|
|
100.00
|
%
|
|
|
|
|
|
ZAMBIA
|
|
ZAMBIA
|
|
|
|
TOTAL ZIMBABWE LTD
|
|
|
80.00
|
%
|
|
|
|
|
|
ZIMBABWE
|
|
ZIMBABWE
|
|
|
|
TOTALERG SPA
|
|
|
49.00
|
%
|
|
|
E
|
|
|
ITALY
|
|
ITALY
|
|
|
|
TUCSON SOLAR COGENERATION I LLC
|
|
|
57.48
|
%
|
|
|
|
|
|
UNITED STATES
|
|
UNITED STATES
|
|
|
|
TYCZKA TOTALGAZ GMBH
|
|
|
50.00
|
%
|
|
|
E
|
|
|
GERMANY
|
|
GERMANY
|
|
|
|
URIM GREEN ENERGIES LTD
|
|
|
57.48
|
%
|
|
|
|
|
|
ISRAEL
|
|
ISRAEL
|
|
|
|
WHIPPLETREE SOLAR LLC
|
|
|
57.48
|
%
|
|
|
|
|
|
UNITED STATES
|
|
UNITED STATES
|
|
|
|
WILDWOOD SOLAR II, LLC
|
|
|
57.48
|
%
|
|
|
|
|
|
UNITED STATES
|
|
UNITED STATES
|
|
|
|
WOOD DRAW SOLAR LLC
|
|
|
57.48
|
%
|
|
|
|
|
|
UNITED STATES
|
|
UNITED STATES
|
|
|
|
ZRUHA GREEN ENERGIES LTD
|
|
|
57.48
|
%
|
|
|
|
|
|
ISRAEL
|
|
ISRAEL
|
|
Corporate
|
|
ELF AQUITAINE
|
|
|
100.00
|
%
|
|
|
|
|
|
FRANCE
|
|
FRANCE
|
|
|
|
ELF AQUITAINE FERTILISANTS
|
|
|
100.00
|
%
|
|
|
|
|
|
FRANCE
|
|
FRANCE
|
|
|
|
ELF AQUITAINE INC.
|
|
|
100.00
|
%
|
|
|
|
|
|
UNITED STATES
|
|
UNITED STATES
|
|
|
|
ELF FOREST PRODUCTS, LLC
|
|
|
100.00
|
%
|
|
|
|
|
|
UNITED STATES
|
|
UNITED STATES
|
|
|
|
|
|
2015 Form 20-F TOTAL S.A.
|
|
F-95
|
Notes to the Consolidated Financial Statements – Note 35
|
|
|
|
|
|
|
|
|
|
|
|
|
|
|
Business segment
|
|
Statutory corporate name
|
|
% Group
interest
|
|
|
Method
|
|
Country of incorporation
|
|
Country of operations
|
|
|
|
ETMOFINA
|
|
|
100.00
|
%
|
|
|
|
BELGIUM
|
|
BELGIUM
|
|
|
|
FINANCIERE VALORGEST
|
|
|
100.00
|
%
|
|
|
|
FRANCE
|
|
FRANCE
|
|
|
|
FINGESTVAL
|
|
|
100.00
|
%
|
|
|
|
FRANCE
|
|
FRANCE
|
|
|
|
OMNIUM REINSURANCE COMPANY SA
|
|
|
100.00
|
%
|
|
|
|
SWITZERLAND
|
|
SWITZERLAND
|
|
|
|
PAN INSURANCE LIMITED
|
|
|
100.00
|
%
|
|
|
|
IRELAND
|
|
IRELAND
|
|
|
|
SEPTENTRION PARTICIPATIONS
|
|
|
100.00
|
%
|
|
|
|
FRANCE
|
|
FRANCE
|
|
|
|
SOCAP SAS
|
|
|
100.00
|
%
|
|
|
|
FRANCE
|
|
FRANCE
|
|
|
|
SOCIETE CIVILE IMMOBILIERE CB2
|
|
|
100.00
|
%
|
|
|
|
FRANCE
|
|
FRANCE
|
|
|
|
SOFAX BANQUE
|
|
|
100.00
|
%
|
|
|
|
FRANCE
|
|
FRANCE
|
|
|
|
SOGAPAR
|
|
|
100.00
|
%
|
|
|
|
FRANCE
|
|
FRANCE
|
|
|
|
TOTAL OVERSEAS HOLDING (PTY) LTD
|
|
|
100.00
|
%
|
|
|
|
SOUTH AFRICA
|
|
SOUTH AFRICA
|
|
|
|
TOTAL AFFILIATES CAPITAL USA INC
|
|
|
100.00
|
%
|
|
|
|
UNITED STATES
|
|
UNITED STATES
|
|
|
|
TOTAL AMERICAN SERVICES INC
|
|
|
100.00
|
%
|
|
|
|
UNITED STATES
|
|
UNITED STATES
|
|
|
|
TOTAL CAPITAL
|
|
|
100.00
|
%
|
|
|
|
FRANCE
|
|
FRANCE
|
|
|
|
TOTAL CAPITAL CANADA LTD.
|
|
|
100.00
|
%
|
|
|
|
CANADA
|
|
CANADA
|
|
|
|
TOTAL CAPITAL INTERNATIONAL
|
|
|
100.00
|
%
|
|
|
|
FRANCE
|
|
FRANCE
|
|
|
|
TOTAL CORPORATE MANAGEMENT (BEIJING) COMPANY LIMITED
|
|
|
100.00
|
%
|
|
|
|
CHINA
|
|
CHINA
|
|
|
|
TOTAL DELAWARE INC
|
|
|
100.00
|
%
|
|
|
|
UNITED STATES
|
|
UNITED STATES
|
|
|
|
TOTAL E&P HOLDINGS
|
|
|
100.00
|
%
|
|
|
|
FRANCE
|
|
FRANCE
|
|
|
|
TOTAL ENERGY VENTURES EUROPE
|
|
|
100.00
|
%
|
|
|
|
FRANCE
|
|
FRANCE
|
|
|
|
TOTAL ENERGY VENTURES INTERNATIONAL
|
|
|
100.00
|
%
|
|
|
|
FRANCE
|
|
FRANCE
|
|
|
|
TOTAL FINANCE
|
|
|
100.00
|
%
|
|
|
|
FRANCE
|
|
FRANCE
|
|
|
|
TOTAL FINANCE CORPORATE SERVICES LIMITED
|
|
|
100.00
|
%
|
|
|
|
UNITED KINGDOM
|
|
UNITED KINGDOM
|
|
|
|
TOTAL FINANCE GLOBAL SERVICES SA
|
|
|
100.00
|
%
|
|
|
|
BELGIUM
|
|
BELGIUM
|
|
|
|
TOTAL FINANCE INTERNATIONAL B.V.
|
|
|
100.00
|
%
|
|
|
|
NETHERLANDS
|
|
NETHERLANDS
|
|
|
|
TOTAL FINANCE NEDERLAND BV
|
|
|
100.00
|
%
|
|
|
|
NETHERLANDS
|
|
NETHERLANDS
|
|
|
|
TOTAL FINANCE USA INC
|
|
|
100.00
|
%
|
|
|
|
UNITED STATES
|
|
UNITED STATES
|
|
|
|
TOTAL FUNDING NEDERLAND BV
|
|
|
100.00
|
%
|
|
|
|
NETHERLANDS
|
|
NETHERLANDS
|
|
|
|
TOTAL FUNDING NEDERLAND INTERNATIONAL B.V.
|
|
|
100.00
|
%
|
|
|
|
NETHERLANDS
|
|
NETHERLANDS
|
|
|
|
TOTAL GESTION FILIALES
|
|
|
100.00
|
%
|
|
|
|
FRANCE
|
|
FRANCE
|
|
|
|
TOTAL GESTION USA
|
|
|
100.00
|
%
|
|
|
|
FRANCE
|
|
FRANCE
|
|
|
|
TOTAL GLOBAL SERVICES
|
|
|
100.00
|
%
|
|
|
|
FRANCE
|
|
FRANCE
|
|
|
|
TOTAL GLOBAL SERVICES BELGIUM SA
|
|
|
99.80
|
%
|
|
|
|
BELGIUM
|
|
BELGIUM
|
|
|
|
TOTAL HOLDING ALLEMAGNE
|
|
|
100.00
|
%
|
|
|
|
FRANCE
|
|
FRANCE
|
|
|
|
TOTAL HOLDINGS EUROPE
|
|
|
100.00
|
%
|
|
|
|
FRANCE
|
|
FRANCE
|
|
|
|
TOTAL HOLDINGS UK LIMITED
|
|
|
100.00
|
%
|
|
|
|
UNITED KINGDOM
|
|
UNITED KINGDOM
|
|
|
|
TOTAL HOLDINGS USA INC
|
|
|
100.00
|
%
|
|
|
|
UNITED STATES
|
|
UNITED STATES
|
|
|
|
TOTAL INTERNATIONAL NV
|
|
|
100.00
|
%
|
|
|
|
NETHERLANDS
|
|
NETHERLANDS
|
|
|
|
TOTAL NUCLEAIRE
|
|
|
100.00
|
%
|
|
|
|
FRANCE
|
|
FRANCE
|
|
|
|
TOTAL OPERATIONS CANADA LTD
|
|
|
100.00
|
%
|
|
|
|
CANADA
|
|
CANADA
|
|
|
|
TOTAL PARTICIPATIONS
|
|
|
100.00
|
%
|
|
|
|
FRANCE
|
|
FRANCE
|
|
|
|
TOTAL PETROCHEMICALS & REFINING USA INC
(c)
|
|
|
100.00
|
%
|
|
|
|
UNITED STATES
|
|
UNITED STATES
|
|
|
|
TOTAL PETROCHEMICALS & REFINING SA/NV
(c)
|
|
|
100.00
|
%
|
|
|
|
BELGIUM
|
|
BELGIUM
|
|
|
|
TOTAL PETROCHEMICALS SECURITY USA INC
|
|
|
100.00
|
%
|
|
|
|
UNITED STATES
|
|
UNITED STATES
|
|
|
|
TOTAL RESOURCES (CANADA) LIMITED
|
|
|
100.00
|
%
|
|
|
|
CANADA
|
|
CANADA
|
|
|
|
TOTAL S.A.
|
|
|
|
|
|
|
|
FRANCE
|
|
FRANCE
|
|
|
|
TOTAL TREASURY
|
|
|
100.00
|
%
|
|
|
|
FRANCE
|
|
FRANCE
|
|
|
|
TOTAL UK FINANCE LIMITED
|
|
|
100.00
|
%
|
|
|
|
UNITED KINGDOM
|
|
UNITED KINGDOM
|
|
(c)
|
Multi-segment entities.
|
|
|
|
|
|
F-96
|
|
TOTAL S.A. Form 20-F 2015
|
TOTAL
SUPPLEMENTAL OIL AND GAS INFORMATION (Unaudited)
|
1.
|
Oil and gas information pursuant to FASB Accounting Standards Codification 932
|
Proved reserves estimates are calculated according to the Securities and Exchange Commission (SEC) Rule 4-10 of
Regulation S-X set forth in the “Modernization of Oil and Gas Reporting” release (SEC Release n° 33-8995) and the Financial Accounting Standard Board (FASB) Accounting Standards Update regarding Extractive Activities — Oil and Gas
(ASC 932), which provide definitions and disclosure requirements.
|
1.1.
|
Assessment process for reserves
|
The estimation of reserves
is an ongoing process that is done within affiliates by experienced geoscientists, engineers and economists under the supervision of each affiliate’s General Management. Staff involved in reserves evaluation are trained to follow SEC-compliant
internal guidelines and policies regarding criteria that must be met before reserves can be considered as proved. All of the Group’s proved reserves held in subsidiaries and equity affiliates are estimated within the affiliates of the Group
with the exception of the proved reserves held by the Russian equity affiliate OAO Novatek. The assessment of the net proved liquids and natural gas reserves of certain properties owned by OAO Novatek was completed as of December 31, 2015, in
accordance with the standards applied by the Group, based on an independent third-party report from DeGolyer & MacNaughton. These independently assessed reserves account for 51% of OAO Novatek’s net proved reserves and 58% of the total
net proved reserves TOTAL held in Russia as of December 31, 2015.
The technical validation process relies on a Technical Reserves Committee that is
responsible for approving proved reserves changes above a certain threshold and technical evaluations of reserves associated with an investment decision that requires approval from the Exploration & Production Executive Committee. The
Chairman of the Technical Reserves Committee is appointed by the Senior Management of Exploration & Production and its members represent expertise in reservoir engineering, production geology, production geophysics, drilling and development
studies.
An internal control process related to reserves estimation is formalized and involves the following elements:
|
•
|
|
A central Reserve Entity whose responsibility is to consolidate, document and archive the Group’s reserves; to ensure coherence of evaluations worldwide; to
maintain the Corporate Reserves Guidelines Standards in line with SEC guidelines and policies; to deliver training on reserves evaluation and classification; and to conduct periodically in-depth technical review of reserves for each affiliate.
|
|
•
|
|
An annual review of affiliates reserves conducted by an internal group of specialists selected for their expertise in geosciences and engineering or their
knowledge of the affiliate. All members of this group, chaired by the Reserves Vice-President (RVP) of the Development and Support to Operations division and composed of at least three Technical Reserves Committee members, are knowledgeable in the
SEC guidelines for proved reserves evaluation. Their responsibility is to provide an independent review of reserves changes proposed by affiliates and ensure that reserves are estimated using appropriate standards and procedures.
|
|
•
|
|
At the end of the annual review carried out by the Development division and Support to Operations, an SEC Reserves Committee chaired by the
Exploration & Production Senior Vice President Corporate Affairs and comprised of the Development and Support to Operations, Exploration,
|
|
|
|
Strategy and Legal Senior Vice Presidents, or their representatives, as well as the Chairman of the Technical Reserves Committee and the RVP, approves the elements of the SEC reserve booking
proposals concerning criteria that are not dependent upon reservoir and geosciences techniques. The results of the annual review and the proposals for including revisions or additions of SEC Proved Reserves are presented to the
Exploration & Production Executive Committee for approval before final validation by the Group’s General Management and Chief Financial Officer.
|
The reserves evaluation and control process is audited periodically by the Group’s internal auditors.
The RVP of
the Development and Support to Operations division is the technical person responsible for preparing the reserves estimates for the Group. Appointed by the President of Exploration & Production, the RVP supervises the Reserve Entity, chairs
the annual review of reserves, and is a member of the Technical Reserves Committee and the SEC Reserves Committee. The current RVP has over thirty years of experience in the oil and gas industry. He previously held several management positions in
the Group in reservoir engineering and geosciences, and has more than fifteen years of experience in the field of reserves evaluation and control process. He holds an engineering degree from Institut National des Sciences Appliquées, Lyon,
France, and a petroleum engineering degree from École Nationale Supérieure du Pétrole et des Moteurs (IFP School), France. He is the current Chairman of the Society of Petroleum Engineers Oil and Gas Reserves Committee and a
member of the UNECE (United Nations Economic Commission for Europe) Expert Group on Resource Classification.
|
1.2.
|
Proved developed reserves
|
As of December 31, 2015,
proved developed reserves of oil and gas were 6,186 Mboe and represented 53% of the proved reserves. As of December 31, 2014, proved developed reserves of oil and gas were 5,706 Mboe and represented 50% of the proved reserves. As of
December 31, 2013, proved developed reserves of oil and gas were 5,674 Mboe and represented 49% of the proved reserves. Over the past three years, the average of proved developed reserves renewal has remained above 900 Mboe per year,
illustrating TOTAL’s ability to consistently transfer proved undeveloped reserves into developed status.
|
1.3.
|
Proved undeveloped reserves
|
As of December 31, 2015,
TOTAL’s combined proved undeveloped reserves of oil and gas were 5,394 Mboe as compared to 5,817 Mboe at the end of 2014. The net decrease of 423 Mboe of proved undeveloped reserves is due to the addition of 152 Mboe of undeveloped reserves
related to extensions and discoveries, the revision of +57 Mboe of previous estimates, a net decrease of 204 Mboe due to acquisitions/divestitures, and the booking of 428 Mboe proved undeveloped reserves to proved developed reserves. In 2015, the
cost incurred to develop proved undeveloped reserves (PUDs) was $15.3 billion, which represents 79% of 2015 development costs incurred, and was related to projects located for the most part in Norway, Canada, Angola, Nigeria, Australia, the Republic
of the Congo and the United Kingdom.
Approximately 51% of the Group’s proved undeveloped reserves are associated with producing projects and are
located for the
|
|
|
|
|
2015 Form 20-F TOTAL S.A.
|
|
S-1
|
most part in Canada, Kazakhstan, Nigeria, Norway, Russia, and Venezuela. These reserves are expected to be developed over time as part of initial field development plans or additional development
phases. The timing to bring these proved reserves into production will depend upon several factors including reservoir performance, surface facilities or plant capacity constraints and contractual limitations on production levels. The remaining
proved undeveloped reserves correspond to undeveloped fields or assets for which a development has been sanctioned or is in progress.
The Group’s
portfolio of projects includes a few large scale and complex developments for which reserves have remained proved undeveloped for more than five years or the Group anticipates that it may take more than five years from the time of recording proved
reserves to the start of production. These specific projects represent approximately 26% of the Group’s proved undeveloped reserves and include deep offshore developments in Nigeria, offshore development in Australia, Argentina, Norway and the
United Kingdom and development of oil sands in Canada.
These projects are highly complex to develop due to a combination of factors that include, among
others, the nature of the reservoir rock and fluid properties, challenging market and operating environments, and the size of the projects. In addition, some of these projects are generally designed and optimized for a given production capacity that
controls the pace at which the field is developed and the wells are drilled. At production start-up, only a portion of the proved reserves are developed in order to deliver sufficient production potential to meet capacity constraints and contractual
obligations. Under these specific circumstances, the Group believes that it is justified to report as proved reserves the level of reserves used in connection with the approved project,
despite the fact that some of these PUDs may remain undeveloped for more than five years. In addition, TOTAL has demonstrated in recent years the Group’s ability to develop and bring into
production similar large scale and complex projects, including the development of deep-offshore fields in Angola, Nigeria, the Republic of the Congo, HP/HT fields in the United Kingdom, heavy oil projects in Venezuela and LNG projects in Qatar,
Yemen, Nigeria and Indonesia.
The tables provided below are presented by the following geographic areas: Europe, Africa, the Americas, Middle East and
Asia — CIS (with figures shown for Russia separately).
|
1.4.
|
Estimated proved reserves of oil, bitumen and gas
|
The
following tables present, for oil, bitumen and gas reserves, an estimate of the Group’s oil, bitumen and gas quantities by geographic areas as of December 31, 2015, 2014 and 2013.
Quantities shown correspond to proved developed and undeveloped reserves together with changes in quantities for 2015, 2014 and 2013.
The definitions used for proved, proved developed and proved undeveloped oil and gas reserves are in accordance with the revised Rule 4-10 of SEC Regulation S-X.
All references in the following tables to reserves or production are to the Group’s entire share of such reserves or production. TOTAL’s worldwide proved
reserves include the proved reserves of its consolidated subsidiaries as well as its proportionate share of the proved reserves of equity affiliates.
|
|
|
|
|
S-2
|
|
TOTAL S.A. Form 20-F 2015
|
|
1.4.1.
|
Changes in oil, bitumen and gas reserves
|
|
|
|
|
|
|
|
|
|
|
|
|
|
|
|
|
|
|
|
|
|
|
|
|
|
|
|
|
|
|
|
Proved developed and undeveloped reserves
|
|
Consolidated subsidiaries
|
|
|
(in million barrels of oil equivalent)
|
|
Europe
|
|
|
Africa
|
|
|
Americas
|
|
|
Middle
East
|
|
|
Asia — CIS
(excl. Russia)
|
|
|
Russia
|
|
|
Total
|
|
|
Balance as of December 31, 2012
|
|
|
1,706
|
|
|
|
2,920
|
|
|
|
1,770
|
|
|
|
422
|
|
|
|
1,515
|
|
|
|
30
|
|
|
|
8,363
|
|
|
Revisions of previous estimates
|
|
|
18
|
|
|
|
(97
|
)
|
|
|
44
|
|
|
|
11
|
|
|
|
48
|
|
|
|
—
|
|
|
|
24
|
|
|
Extensions, discoveries and other
|
|
|
12
|
|
|
|
20
|
|
|
|
135
|
|
|
|
2
|
|
|
|
226
|
|
|
|
1
|
|
|
|
396
|
|
|
Acquisitions of reserves in place
|
|
|
—
|
|
|
|
—
|
|
|
|
—
|
|
|
|
—
|
|
|
|
132
|
|
|
|
—
|
|
|
|
132
|
|
|
Sales of reserves in place
|
|
|
(51
|
)
|
|
|
—
|
|
|
|
(51
|
)
|
|
|
—
|
|
|
|
—
|
|
|
|
—
|
|
|
|
(102
|
)
|
|
Production for the year
|
|
|
(143
|
)
|
|
|
(243
|
)
|
|
|
(74
|
)
|
|
|
(31
|
)
|
|
|
(94
|
)
|
|
|
(3
|
)
|
|
|
(588
|
)
|
|
Balance as of December 31, 2013
|
|
|
1,542
|
|
|
|
2,600
|
|
|
|
1,824
|
|
|
|
404
|
|
|
|
1,827
|
|
|
|
28
|
|
|
|
8,225
|
|
|
Revisions of previous estimates
|
|
|
31
|
|
|
|
48
|
|
|
|
(11
|
)
|
|
|
7
|
|
|
|
21
|
|
|
|
4
|
|
|
|
100
|
|
|
Extensions, discoveries and other
|
|
|
21
|
|
|
|
111
|
|
|
|
151
|
|
|
|
3
|
|
|
|
29
|
|
|
|
—
|
|
|
|
315
|
|
|
Acquisitions of reserves in place
|
|
|
1
|
|
|
|
—
|
|
|
|
—
|
|
|
|
—
|
|
|
|
—
|
|
|
|
—
|
|
|
|
1
|
|
|
Sales of reserves in place
|
|
|
(26
|
)
|
|
|
(21
|
)
|
|
|
—
|
|
|
|
—
|
|
|
|
(206
|
)
|
|
|
—
|
|
|
|
(253
|
)
|
|
Production for the year
|
|
|
(133
|
)
|
|
|
(240
|
)
|
|
|
(76
|
)
|
|
|
(32
|
)
|
|
|
(91
|
)
|
|
|
(3
|
)
|
|
|
(575
|
)
|
|
Balance as of December 31, 2014
|
|
|
1,436
|
|
|
|
2,498
|
|
|
|
1,888
|
|
|
|
382
|
|
|
|
1,580
|
|
|
|
29
|
|
|
|
7,813
|
|
|
Revisions of previous estimates
|
|
|
(10
|
)
|
|
|
(121
|
)
|
|
|
144
|
|
|
|
110
|
|
|
|
73
|
|
|
|
—
|
|
|
|
196
|
|
|
Extensions, discoveries and other
|
|
|
11
|
|
|
|
9
|
|
|
|
6
|
|
|
|
864
|
|
|
|
7
|
|
|
|
—
|
|
|
|
897
|
|
|
Acquisitions of reserves in place
|
|
|
—
|
|
|
|
—
|
|
|
|
—
|
|
|
|
—
|
|
|
|
—
|
|
|
|
—
|
|
|
|
—
|
|
|
Sales of reserves in place
|
|
|
(28
|
)
|
|
|
(76
|
)
|
|
|
(160
|
)
|
|
|
—
|
|
|
|
—
|
|
|
|
—
|
|
|
|
(264
|
)
|
|
Production for the year
|
|
|
(137
|
)
|
|
|
(247
|
)
|
|
|
(79
|
)
|
|
|
(91
|
)
|
|
|
(94
|
)
|
|
|
(4
|
)
|
|
|
(652
|
)
|
|
Balance as of December 31, 2015
|
|
|
1,272
|
|
|
|
2,063
|
|
|
|
1,799
|
|
|
|
1,265
|
|
|
|
1,566
|
|
|
|
25
|
|
|
|
7,990
|
|
|
|
|
|
|
|
|
Minority interest in proved developed and undeveloped
reserves as of
|
|
|
|
|
|
|
|
|
|
|
|
|
|
|
|
|
|
|
December 31, 2013
|
|
|
—
|
|
|
|
159
|
|
|
|
—
|
|
|
|
—
|
|
|
|
—
|
|
|
|
—
|
|
|
|
159
|
|
|
December 31, 2014
|
|
|
—
|
|
|
|
146
|
|
|
|
—
|
|
|
|
—
|
|
|
|
—
|
|
|
|
—
|
|
|
|
146
|
|
|
December 31, 2015
|
|
|
—
|
|
|
|
128
|
|
|
|
—
|
|
|
|
—
|
|
|
|
—
|
|
|
|
—
|
|
|
|
128
|
|
|
|
|
|
Proved developed and undeveloped reserves
|
|
Equity affiliates
|
|
|
(in million barrels of oil equivalent)
|
|
Europe
|
|
|
Africa
|
|
|
Americas
|
|
|
Middle
East
|
|
|
Asia — CIS
(excl. Russia)
|
|
|
Russia
|
|
|
Total
|
|
|
Balance as of December 31, 2012
|
|
|
—
|
|
|
|
80
|
|
|
|
402
|
|
|
|
1,488
|
|
|
|
—
|
|
|
|
1,035
|
|
|
|
3,005
|
|
|
Revisions of previous estimates
|
|
|
—
|
|
|
|
(3
|
)
|
|
|
(141
|
)
|
|
|
(3
|
)
|
|
|
—
|
|
|
|
33
|
|
|
|
(114
|
)
|
|
Extensions, discoveries and other
|
|
|
—
|
|
|
|
—
|
|
|
|
—
|
|
|
|
14
|
|
|
|
—
|
|
|
|
622
|
|
|
|
636
|
|
|
Acquisitions of reserves in place
|
|
|
—
|
|
|
|
—
|
|
|
|
—
|
|
|
|
—
|
|
|
|
—
|
|
|
|
117
|
|
|
|
117
|
|
|
Sales of reserves in place
|
|
|
—
|
|
|
|
—
|
|
|
|
—
|
|
|
|
—
|
|
|
|
—
|
|
|
|
(92
|
)
|
|
|
(92
|
)
|
|
Production for the year
|
|
|
—
|
|
|
|
(1
|
)
|
|
|
(13
|
)
|
|
|
(164
|
)
|
|
|
—
|
|
|
|
(73
|
)
|
|
|
(251
|
)
|
|
Balance as of December 31, 2013
|
|
|
—
|
|
|
|
76
|
|
|
|
248
|
|
|
|
1,335
|
|
|
|
—
|
|
|
|
1,642
|
|
|
|
3,301
|
|
|
Revisions of previous estimates
|
|
|
—
|
|
|
|
(2
|
)
|
|
|
2
|
|
|
|
(8
|
)
|
|
|
—
|
|
|
|
6
|
|
|
|
(2
|
)
|
|
Extensions, discoveries and other
|
|
|
—
|
|
|
|
—
|
|
|
|
—
|
|
|
|
2
|
|
|
|
—
|
|
|
|
516
|
|
|
|
518
|
|
|
Acquisitions of reserves in place
|
|
|
—
|
|
|
|
—
|
|
|
|
—
|
|
|
|
—
|
|
|
|
—
|
|
|
|
107
|
|
|
|
107
|
|
|
Sales of reserves in place
|
|
|
—
|
|
|
|
—
|
|
|
|
—
|
|
|
|
—
|
|
|
|
—
|
|
|
|
(6
|
)
|
|
|
(6
|
)
|
|
Production for the year
|
|
|
—
|
|
|
|
(1
|
)
|
|
|
(14
|
)
|
|
|
(110
|
)
|
|
|
—
|
|
|
|
(83
|
)
|
|
|
(208
|
)
|
|
Balance as of December 31, 2014
|
|
|
—
|
|
|
|
73
|
|
|
|
236
|
|
|
|
1,219
|
|
|
|
—
|
|
|
|
2,182
|
|
|
|
3,710
|
|
|
Revisions of previous estimates
|
|
|
—
|
|
|
|
(2
|
)
|
|
|
(44
|
)
|
|
|
(10
|
)
|
|
|
—
|
|
|
|
96
|
|
|
|
40
|
|
|
Extensions, discoveries and other
|
|
|
—
|
|
|
|
—
|
|
|
|
—
|
|
|
|
—
|
|
|
|
—
|
|
|
|
—
|
|
|
|
—
|
|
|
Acquisitions of reserves in place
|
|
|
—
|
|
|
|
—
|
|
|
|
—
|
|
|
|
—
|
|
|
|
—
|
|
|
|
56
|
|
|
|
56
|
|
|
Sales of reserves in place
|
|
|
—
|
|
|
|
—
|
|
|
|
—
|
|
|
|
—
|
|
|
|
—
|
|
|
|
(12
|
)
|
|
|
(12
|
)
|
|
Production for the year
|
|
|
—
|
|
|
|
—
|
|
|
|
(14
|
)
|
|
|
(88
|
)
|
|
|
—
|
|
|
|
(102
|
)
|
|
|
(204
|
)
|
|
Balance as of December 31, 2015
|
|
|
—
|
|
|
|
71
|
|
|
|
178
|
|
|
|
1,121
|
|
|
|
—
|
|
|
|
2,220
|
|
|
|
3,590
|
|
|
|
|
|
|
2015 Form 20-F TOTAL S.A.
|
|
S-3
|
|
|
|
|
|
|
|
|
|
|
|
|
|
|
|
|
|
|
|
|
|
|
|
|
|
|
|
|
|
|
|
|
|
Consolidated subsidiaries and equity affiliates
|
|
|
(in million barrels of oil equivalent)
|
|
Europe
|
|
|
Africa
|
|
|
Americas
|
|
|
Middle
East
|
|
|
Asia — CIS
(excl. Russia)
|
|
|
Russia
|
|
|
Total
|
|
|
As of December 31, 2013
|
|
|
|
|
|
|
|
|
|
|
|
|
|
|
|
|
|
|
|
|
|
|
|
|
|
|
|
|
|
Proved developed and undeveloped reserves
|
|
|
1,542
|
|
|
|
2,676
|
|
|
|
2,072
|
|
|
|
1,739
|
|
|
|
1,827
|
|
|
|
1,670
|
|
|
|
11,526
|
|
|
Consolidated subsidiaries
|
|
|
1,542
|
|
|
|
2,600
|
|
|
|
1,824
|
|
|
|
404
|
|
|
|
1,827
|
|
|
|
28
|
|
|
|
8,225
|
|
|
Equity affiliates
|
|
|
—
|
|
|
|
76
|
|
|
|
248
|
|
|
|
1,335
|
|
|
|
—
|
|
|
|
1,642
|
|
|
|
3,301
|
|
|
Proved developed reserves
|
|
|
766
|
|
|
|
1,469
|
|
|
|
540
|
|
|
|
1,577
|
|
|
|
539
|
|
|
|
783
|
|
|
|
5,674
|
|
|
Consolidated subsidiaries
|
|
|
766
|
|
|
|
1,452
|
|
|
|
452
|
|
|
|
330
|
|
|
|
539
|
|
|
|
21
|
|
|
|
3,560
|
|
|
Equity affiliates
|
|
|
—
|
|
|
|
17
|
|
|
|
88
|
|
|
|
1,247
|
|
|
|
—
|
|
|
|
762
|
|
|
|
2,114
|
|
|
Proved undeveloped reserves
|
|
|
776
|
|
|
|
1,207
|
|
|
|
1,532
|
|
|
|
162
|
|
|
|
1,288
|
|
|
|
887
|
|
|
|
5,852
|
|
|
Consolidated subsidiaries
|
|
|
776
|
|
|
|
1,148
|
|
|
|
1,372
|
|
|
|
74
|
|
|
|
1,288
|
|
|
|
7
|
|
|
|
4,665
|
|
|
Equity affiliates
|
|
|
—
|
|
|
|
59
|
|
|
|
160
|
|
|
|
88
|
|
|
|
—
|
|
|
|
880
|
|
|
|
1,187
|
|
|
As of December 31, 2014
|
|
|
|
|
|
|
|
|
|
|
|
|
|
|
|
|
|
|
|
|
|
|
|
|
|
|
|
|
|
Proved developed and undeveloped reserves
|
|
|
1,436
|
|
|
|
2,571
|
|
|
|
2,124
|
|
|
|
1,601
|
|
|
|
1,580
|
|
|
|
2,211
|
|
|
|
11,523
|
|
|
Consolidated subsidiaries
|
|
|
1,436
|
|
|
|
2,498
|
|
|
|
1,888
|
|
|
|
382
|
|
|
|
1,580
|
|
|
|
29
|
|
|
|
7,813
|
|
|
Equity affiliates
|
|
|
—
|
|
|
|
73
|
|
|
|
236
|
|
|
|
1,219
|
|
|
|
—
|
|
|
|
2,182
|
|
|
|
3,710
|
|
|
Proved developed reserves
|
|
|
737
|
|
|
|
1,472
|
|
|
|
535
|
|
|
|
1,442
|
|
|
|
453
|
|
|
|
1,067
|
|
|
|
5,706
|
|
|
Consolidated subsidiaries
|
|
|
737
|
|
|
|
1,455
|
|
|
|
450
|
|
|
|
316
|
|
|
|
453
|
|
|
|
18
|
|
|
|
3,429
|
|
|
Equity affiliates
|
|
|
—
|
|
|
|
17
|
|
|
|
85
|
|
|
|
1,126
|
|
|
|
—
|
|
|
|
1,049
|
|
|
|
2,277
|
|
|
Proved undeveloped reserves
|
|
|
699
|
|
|
|
1,099
|
|
|
|
1,589
|
|
|
|
159
|
|
|
|
1,127
|
|
|
|
1,144
|
|
|
|
5,817
|
|
|
Consolidated subsidiaries
|
|
|
699
|
|
|
|
1,043
|
|
|
|
1,438
|
|
|
|
66
|
|
|
|
1,127
|
|
|
|
11
|
|
|
|
4,384
|
|
|
Equity affiliates
|
|
|
—
|
|
|
|
56
|
|
|
|
151
|
|
|
|
93
|
|
|
|
—
|
|
|
|
1,133
|
|
|
|
1,433
|
|
|
As of December 31, 2015
|
|
|
|
|
|
|
|
|
|
|
|
|
|
|
|
|
|
|
|
|
|
|
|
|
|
|
|
|
|
Proved developed and undeveloped reserves
|
|
|
1,272
|
|
|
|
2,134
|
|
|
|
1,977
|
|
|
|
2,386
|
|
|
|
1,566
|
|
|
|
2,245
|
|
|
|
11,580
|
|
|
Consolidated subsidiaries
|
|
|
1,272
|
|
|
|
2,063
|
|
|
|
1,799
|
|
|
|
1,265
|
|
|
|
1,566
|
|
|
|
25
|
|
|
|
7,990
|
|
|
Equity affiliates
|
|
|
—
|
|
|
|
71
|
|
|
|
178
|
|
|
|
1,121
|
|
|
|
—
|
|
|
|
2,220
|
|
|
|
3,590
|
|
|
Proved developed reserves
|
|
|
756
|
|
|
|
1,215
|
|
|
|
626
|
|
|
|
2,020
|
|
|
|
499
|
|
|
|
1,070
|
|
|
|
6,186
|
|
|
Consolidated subsidiaries
|
|
|
756
|
|
|
|
1,203
|
|
|
|
549
|
|
|
|
1,028
|
|
|
|
499
|
|
|
|
16
|
|
|
|
4,051
|
|
|
Equity affiliates
|
|
|
—
|
|
|
|
12
|
|
|
|
77
|
|
|
|
992
|
|
|
|
—
|
|
|
|
1,054
|
|
|
|
2,135
|
|
|
Proved undeveloped reserves
|
|
|
516
|
|
|
|
919
|
|
|
|
1,351
|
|
|
|
366
|
|
|
|
1,067
|
|
|
|
1,175
|
|
|
|
5,394
|
|
|
Consolidated subsidiaries
|
|
|
516
|
|
|
|
860
|
|
|
|
1,250
|
|
|
|
237
|
|
|
|
1,067
|
|
|
|
9
|
|
|
|
3,939
|
|
|
Equity affiliates
|
|
|
—
|
|
|
|
59
|
|
|
|
101
|
|
|
|
129
|
|
|
|
—
|
|
|
|
1,166
|
|
|
|
1,455
|
|
|
|
|
|
|
S-4
|
|
TOTAL S.A. Form 20-F 2015
|
|
1.4.2.
|
Changes in oil reserves
|
The oil
reserves include crude oil, condensates and natural gas liquids reserves.
|
|
|
|
|
|
|
|
|
|
|
|
|
|
|
|
|
|
|
|
|
|
|
|
|
|
|
|
|
|
|
Proved developed and undeveloped reserves
|
|
Consolidated subsidiaries
|
|
|
(in million barrels)
|
|
Europe
|
|
|
Africa
|
|
|
Americas
|
|
|
Middle
East
|
|
|
Asia — CIS
(excl. Russia)
|
|
|
Russia
|
|
|
Total
|
|
|
Balance as of December 31, 2012
|
|
|
762
|
|
|
|
2,049
|
|
|
|
77
|
|
|
|
190
|
|
|
|
548
|
|
|
|
27
|
|
|
|
3,653
|
|
|
Revisions of previous estimates
|
|
|
19
|
|
|
|
50
|
|
|
|
7
|
|
|
|
7
|
|
|
|
75
|
|
|
|
—
|
|
|
|
158
|
|
|
Extensions, discoveries and other
|
|
|
6
|
|
|
|
19
|
|
|
|
20
|
|
|
|
2
|
|
|
|
20
|
|
|
|
1
|
|
|
|
68
|
|
|
Acquisitions of reserves in place
|
|
|
—
|
|
|
|
—
|
|
|
|
—
|
|
|
|
—
|
|
|
|
34
|
|
|
|
—
|
|
|
|
34
|
|
|
Sales of reserves in place
|
|
|
(49
|
)
|
|
|
—
|
|
|
|
(6
|
)
|
|
|
—
|
|
|
|
—
|
|
|
|
—
|
|
|
|
(55
|
)
|
|
Production for the year
|
|
|
(60
|
)
|
|
|
(194
|
)
|
|
|
(12
|
)
|
|
|
(20
|
)
|
|
|
(13
|
)
|
|
|
(3
|
)
|
|
|
(302
|
)
|
|
Balance as of December 31, 2013
|
|
|
678
|
|
|
|
1,924
|
|
|
|
86
|
|
|
|
179
|
|
|
|
664
|
|
|
|
25
|
|
|
|
3,556
|
|
|
Revisions of previous estimates
|
|
|
8
|
|
|
|
33
|
|
|
|
3
|
|
|
|
5
|
|
|
|
10
|
|
|
|
4
|
|
|
|
63
|
|
|
Extensions, discoveries and other
|
|
|
3
|
|
|
|
101
|
|
|
|
14
|
|
|
|
3
|
|
|
|
2
|
|
|
|
—
|
|
|
|
123
|
|
|
Acquisitions of reserves in place
|
|
|
—
|
|
|
|
—
|
|
|
|
—
|
|
|
|
—
|
|
|
|
—
|
|
|
|
—
|
|
|
|
—
|
|
|
Sales of reserves in place
|
|
|
(11
|
)
|
|
|
(20
|
)
|
|
|
—
|
|
|
|
—
|
|
|
|
(32
|
)
|
|
|
—
|
|
|
|
(63
|
)
|
|
Production for the year
|
|
|
(60
|
)
|
|
|
(191
|
)
|
|
|
(15
|
)
|
|
|
(19
|
)
|
|
|
(12
|
)
|
|
|
(3
|
)
|
|
|
(300
|
)
|
|
Balance as of December 31, 2014
|
|
|
618
|
|
|
|
1,847
|
|
|
|
88
|
|
|
|
168
|
|
|
|
632
|
|
|
|
26
|
|
|
|
3,379
|
|
|
Revisions of previous estimates
|
|
|
(18
|
)
|
|
|
(120
|
)
|
|
|
27
|
|
|
|
76
|
|
|
|
20
|
|
|
|
—
|
|
|
|
(15
|
)
|
|
Extensions, discoveries and other
|
|
|
4
|
|
|
|
8
|
|
|
|
2
|
|
|
|
856
|
|
|
|
—
|
|
|
|
—
|
|
|
|
870
|
|
|
Acquisitions of reserves in place
|
|
|
—
|
|
|
|
—
|
|
|
|
—
|
|
|
|
—
|
|
|
|
—
|
|
|
|
—
|
|
|
|
—
|
|
|
Sales of reserves in place
|
|
|
(4
|
)
|
|
|
(57
|
)
|
|
|
—
|
|
|
|
—
|
|
|
|
—
|
|
|
|
—
|
|
|
|
(61
|
)
|
|
Production for the year
|
|
|
(60
|
)
|
|
|
(198
|
)
|
|
|
(16
|
)
|
|
|
(78
|
)
|
|
|
(12
|
)
|
|
|
(3
|
)
|
|
|
(367
|
)
|
|
Balance as of December 31, 2015
|
|
|
540
|
|
|
|
1,480
|
|
|
|
101
|
|
|
|
1,022
|
|
|
|
640
|
|
|
|
23
|
|
|
|
3,806
|
|
|
|
|
|
|
|
|
|
|
Minority interest in proved developed and undeveloped reserves as of
|
|
|
|
|
|
|
|
|
|
|
|
|
|
|
|
|
|
|
|
|
|
|
|
|
|
|
December 31, 2013
|
|
|
—
|
|
|
|
140
|
|
|
|
—
|
|
|
|
—
|
|
|
|
—
|
|
|
|
—
|
|
|
|
140
|
|
|
December 31, 2014
|
|
|
—
|
|
|
|
128
|
|
|
|
—
|
|
|
|
—
|
|
|
|
—
|
|
|
|
—
|
|
|
|
128
|
|
|
December 31, 2015
|
|
|
—
|
|
|
|
115
|
|
|
|
—
|
|
|
|
—
|
|
|
|
—
|
|
|
|
—
|
|
|
|
115
|
|
|
|
|
|
Proved developed and undeveloped reserves
|
|
Equity affiliates
|
|
|
(in million barrels)
|
|
Europe
|
|
|
Africa
|
|
|
Americas
|
|
|
Middle
East
|
|
|
Asia — CIS
(excl. Russia)
|
|
|
Russia
|
|
|
Total
|
|
|
Balance as of December 31, 2012
|
|
|
—
|
|
|
|
15
|
|
|
|
388
|
|
|
|
477
|
|
|
|
—
|
|
|
|
114
|
|
|
|
994
|
|
|
Revisions of previous estimates
|
|
|
—
|
|
|
|
(3
|
)
|
|
|
(138
|
)
|
|
|
(6
|
)
|
|
|
—
|
|
|
|
(4
|
)
|
|
|
(151
|
)
|
|
Extensions, discoveries and other
|
|
|
—
|
|
|
|
—
|
|
|
|
—
|
|
|
|
—
|
|
|
|
—
|
|
|
|
32
|
|
|
|
32
|
|
|
Acquisitions of reserves in place
|
|
|
—
|
|
|
|
—
|
|
|
|
—
|
|
|
|
—
|
|
|
|
—
|
|
|
|
13
|
|
|
|
13
|
|
|
Sales of reserves in place
|
|
|
—
|
|
|
|
—
|
|
|
|
—
|
|
|
|
—
|
|
|
|
—
|
|
|
|
—
|
|
|
|
—
|
|
|
Production for the year
|
|
|
—
|
|
|
|
—
|
|
|
|
(13
|
)
|
|
|
(99
|
)
|
|
|
—
|
|
|
|
(7
|
)
|
|
|
(119
|
)
|
|
Balance as of December 31, 2013
|
|
|
—
|
|
|
|
12
|
|
|
|
237
|
|
|
|
372
|
|
|
|
—
|
|
|
|
148
|
|
|
|
769
|
|
|
Revisions of previous estimates
|
|
|
—
|
|
|
|
(5
|
)
|
|
|
2
|
|
|
|
(3
|
)
|
|
|
—
|
|
|
|
(3
|
)
|
|
|
(9
|
)
|
|
Extensions, discoveries and other
|
|
|
—
|
|
|
|
—
|
|
|
|
—
|
|
|
|
3
|
|
|
|
—
|
|
|
|
81
|
|
|
|
84
|
|
|
Acquisitions of reserves in place
|
|
|
—
|
|
|
|
—
|
|
|
|
—
|
|
|
|
—
|
|
|
|
—
|
|
|
|
9
|
|
|
|
9
|
|
|
Sales of reserves in place
|
|
|
—
|
|
|
|
—
|
|
|
|
—
|
|
|
|
—
|
|
|
|
—
|
|
|
|
(1
|
)
|
|
|
(1
|
)
|
|
Production for the year
|
|
|
—
|
|
|
|
—
|
|
|
|
(13
|
)
|
|
|
(51
|
)
|
|
|
—
|
|
|
|
(9
|
)
|
|
|
(73
|
)
|
|
Balance as of December 31, 2014
|
|
|
—
|
|
|
|
7
|
|
|
|
226
|
|
|
|
321
|
|
|
|
—
|
|
|
|
225
|
|
|
|
779
|
|
|
Revisions of previous estimates
|
|
|
—
|
|
|
|
6
|
|
|
|
(42
|
)
|
|
|
(11
|
)
|
|
|
—
|
|
|
|
34
|
|
|
|
(13
|
)
|
|
Extensions, discoveries and other
|
|
|
—
|
|
|
|
—
|
|
|
|
—
|
|
|
|
—
|
|
|
|
—
|
|
|
|
—
|
|
|
|
—
|
|
|
Acquisitions of reserves in place
|
|
|
—
|
|
|
|
—
|
|
|
|
—
|
|
|
|
—
|
|
|
|
—
|
|
|
|
6
|
|
|
|
6
|
|
|
Sales of reserves in place
|
|
|
—
|
|
|
|
—
|
|
|
|
—
|
|
|
|
—
|
|
|
|
—
|
|
|
|
(2
|
)
|
|
|
(2
|
)
|
|
Production for the year
|
|
|
—
|
|
|
|
—
|
|
|
|
(14
|
)
|
|
|
(50
|
)
|
|
|
—
|
|
|
|
(17
|
)
|
|
|
(81
|
)
|
|
Balance as of December 31, 2015
|
|
|
—
|
|
|
|
13
|
|
|
|
170
|
|
|
|
260
|
|
|
|
—
|
|
|
|
246
|
|
|
|
689
|
|
|
|
|
|
|
2015 Form 20-F TOTAL S.A.
|
|
S-5
|
|
|
|
|
|
|
|
|
|
|
|
|
|
|
|
|
|
|
|
|
|
|
|
|
|
|
|
|
|
|
|
|
|
Consolidated subsidiaries and equity affiliates
|
|
|
(in million barrels)
|
|
Europe
|
|
|
Africa
|
|
|
Americas
|
|
|
Middle
East
|
|
|
Asia — CIS
(excl. Russia)
|
|
|
Russia
|
|
|
Total
|
|
|
As of December 31, 2013
|
|
|
|
|
|
|
|
|
|
|
|
|
|
|
|
|
|
|
|
|
|
|
|
|
|
|
|
|
|
Proved developed and undeveloped reserves
|
|
|
678
|
|
|
|
1,936
|
|
|
|
323
|
|
|
|
551
|
|
|
|
664
|
|
|
|
173
|
|
|
|
4,325
|
|
|
Consolidated subsidiaries
|
|
|
678
|
|
|
|
1,924
|
|
|
|
86
|
|
|
|
179
|
|
|
|
664
|
|
|
|
25
|
|
|
|
3,556
|
|
|
Equity affiliates
|
|
|
—
|
|
|
|
12
|
|
|
|
237
|
|
|
|
372
|
|
|
|
—
|
|
|
|
148
|
|
|
|
769
|
|
|
Proved developed reserves
|
|
|
274
|
|
|
|
1,068
|
|
|
|
128
|
|
|
|
419
|
|
|
|
216
|
|
|
|
88
|
|
|
|
2,193
|
|
|
Consolidated subsidiaries
|
|
|
274
|
|
|
|
1,064
|
|
|
|
45
|
|
|
|
119
|
|
|
|
216
|
|
|
|
19
|
|
|
|
1,737
|
|
|
Equity affiliates
|
|
|
—
|
|
|
|
4
|
|
|
|
83
|
|
|
|
300
|
|
|
|
—
|
|
|
|
69
|
|
|
|
456
|
|
|
Proved undeveloped reserves
|
|
|
404
|
|
|
|
868
|
|
|
|
195
|
|
|
|
132
|
|
|
|
448
|
|
|
|
85
|
|
|
|
2,132
|
|
|
Consolidated subsidiaries
|
|
|
404
|
|
|
|
860
|
|
|
|
41
|
|
|
|
60
|
|
|
|
448
|
|
|
|
6
|
|
|
|
1,819
|
|
|
Equity affiliates
|
|
|
—
|
|
|
|
8
|
|
|
|
154
|
|
|
|
72
|
|
|
|
—
|
|
|
|
79
|
|
|
|
313
|
|
|
As of December 31, 2014
|
|
|
|
|
|
|
|
|
|
|
|
|
|
|
|
|
|
|
|
|
|
|
|
|
|
|
|
|
|
Proved developed and undeveloped reserves
|
|
|
618
|
|
|
|
1,854
|
|
|
|
314
|
|
|
|
489
|
|
|
|
632
|
|
|
|
251
|
|
|
|
4,158
|
|
|
Consolidated subsidiaries
|
|
|
618
|
|
|
|
1,847
|
|
|
|
88
|
|
|
|
168
|
|
|
|
632
|
|
|
|
26
|
|
|
|
3,379
|
|
|
Equity affiliates
|
|
|
—
|
|
|
|
7
|
|
|
|
226
|
|
|
|
321
|
|
|
|
—
|
|
|
|
225
|
|
|
|
779
|
|
|
Proved developed reserves
|
|
|
263
|
|
|
|
1,069
|
|
|
|
136
|
|
|
|
377
|
|
|
|
200
|
|
|
|
136
|
|
|
|
2,181
|
|
|
Consolidated subsidiaries
|
|
|
263
|
|
|
|
1,065
|
|
|
|
54
|
|
|
|
117
|
|
|
|
200
|
|
|
|
16
|
|
|
|
1,715
|
|
|
Equity affiliates
|
|
|
—
|
|
|
|
4
|
|
|
|
82
|
|
|
|
260
|
|
|
|
—
|
|
|
|
120
|
|
|
|
466
|
|
|
Proved undeveloped reserves
|
|
|
355
|
|
|
|
785
|
|
|
|
178
|
|
|
|
112
|
|
|
|
432
|
|
|
|
115
|
|
|
|
1,977
|
|
|
Consolidated subsidiaries
|
|
|
355
|
|
|
|
782
|
|
|
|
34
|
|
|
|
51
|
|
|
|
432
|
|
|
|
10
|
|
|
|
1,664
|
|
|
Equity affiliates
|
|
|
—
|
|
|
|
3
|
|
|
|
144
|
|
|
|
61
|
|
|
|
—
|
|
|
|
105
|
|
|
|
313
|
|
|
As of December 31, 2015
|
|
|
|
|
|
|
|
|
|
|
|
|
|
|
|
|
|
|
|
|
|
|
|
|
|
|
|
|
|
Proved developed and undeveloped reserves
|
|
|
540
|
|
|
|
1,493
|
|
|
|
271
|
|
|
|
1,282
|
|
|
|
640
|
|
|
|
269
|
|
|
|
4,495
|
|
|
Consolidated subsidiaries
|
|
|
540
|
|
|
|
1,480
|
|
|
|
101
|
|
|
|
1,022
|
|
|
|
640
|
|
|
|
23
|
|
|
|
3,806
|
|
|
Equity affiliates
|
|
|
—
|
|
|
|
13
|
|
|
|
170
|
|
|
|
260
|
|
|
|
—
|
|
|
|
246
|
|
|
|
689
|
|
|
Proved developed reserves
|
|
|
262
|
|
|
|
865
|
|
|
|
145
|
|
|
|
1,032
|
|
|
|
200
|
|
|
|
151
|
|
|
|
2,655
|
|
|
Consolidated subsidiaries
|
|
|
262
|
|
|
|
862
|
|
|
|
71
|
|
|
|
817
|
|
|
|
200
|
|
|
|
15
|
|
|
|
2,227
|
|
|
Equity affiliates
|
|
|
—
|
|
|
|
3
|
|
|
|
74
|
|
|
|
215
|
|
|
|
—
|
|
|
|
136
|
|
|
|
428
|
|
|
Proved undeveloped reserves
|
|
|
278
|
|
|
|
628
|
|
|
|
126
|
|
|
|
250
|
|
|
|
440
|
|
|
|
118
|
|
|
|
1,840
|
|
|
Consolidated subsidiaries
|
|
|
278
|
|
|
|
618
|
|
|
|
30
|
|
|
|
205
|
|
|
|
440
|
|
|
|
8
|
|
|
|
1,579
|
|
|
Equity affiliates
|
|
|
—
|
|
|
|
10
|
|
|
|
96
|
|
|
|
45
|
|
|
|
—
|
|
|
|
110
|
|
|
|
261
|
|
|
|
|
|
|
S-6
|
|
TOTAL S.A. Form 20-F 2015
|
|
1.4.3.
|
Changes in bitumen reserves
|
|
|
|
|
|
|
|
|
|
|
|
|
|
|
|
|
|
|
|
|
|
|
|
|
|
|
|
|
|
|
|
Proved developed and undeveloped reserves
|
|
Consolidated subsidiaries
|
|
|
(in million barrels)
|
|
Europe
|
|
|
Africa
|
|
|
Americas
|
|
|
Middle
East
|
|
|
Asia — CIS
(excl. Russia)
|
|
|
Russia
|
|
|
Total
|
|
|
Balance as of December 31, 2012
|
|
|
—
|
|
|
|
—
|
|
|
|
1,038
|
|
|
|
—
|
|
|
|
—
|
|
|
|
—
|
|
|
|
1,038
|
|
|
Revisions of previous estimates
|
|
|
—
|
|
|
|
—
|
|
|
|
2
|
|
|
|
—
|
|
|
|
—
|
|
|
|
—
|
|
|
|
2
|
|
|
Extensions, discoveries and other
|
|
|
—
|
|
|
|
—
|
|
|
|
53
|
|
|
|
—
|
|
|
|
—
|
|
|
|
—
|
|
|
|
53
|
|
|
Acquisitions of reserves in place
|
|
|
—
|
|
|
|
—
|
|
|
|
—
|
|
|
|
—
|
|
|
|
—
|
|
|
|
—
|
|
|
|
—
|
|
|
Sales of reserves in place
|
|
|
—
|
|
|
|
—
|
|
|
|
—
|
|
|
|
—
|
|
|
|
—
|
|
|
|
—
|
|
|
|
—
|
|
|
Production for the year
|
|
|
—
|
|
|
|
—
|
|
|
|
(5
|
)
|
|
|
—
|
|
|
|
—
|
|
|
|
—
|
|
|
|
(5
|
)
|
|
Balance as of December 31, 2013
|
|
|
—
|
|
|
|
—
|
|
|
|
1,088
|
|
|
|
—
|
|
|
|
—
|
|
|
|
—
|
|
|
|
1,088
|
|
|
Revisions of previous estimates
|
|
|
—
|
|
|
|
—
|
|
|
|
(25
|
)
|
|
|
—
|
|
|
|
—
|
|
|
|
—
|
|
|
|
(25
|
)
|
|
Extensions, discoveries and other
|
|
|
—
|
|
|
|
—
|
|
|
|
87
|
|
|
|
—
|
|
|
|
—
|
|
|
|
—
|
|
|
|
87
|
|
|
Acquisitions of reserves in place
|
|
|
—
|
|
|
|
—
|
|
|
|
—
|
|
|
|
—
|
|
|
|
—
|
|
|
|
—
|
|
|
|
—
|
|
|
Sales of reserves in place
|
|
|
—
|
|
|
|
—
|
|
|
|
—
|
|
|
|
—
|
|
|
|
—
|
|
|
|
—
|
|
|
|
—
|
|
|
Production for the year
|
|
|
—
|
|
|
|
—
|
|
|
|
(5
|
)
|
|
|
—
|
|
|
|
—
|
|
|
|
—
|
|
|
|
(5
|
)
|
|
Balance as of December 31, 2014
|
|
|
—
|
|
|
|
—
|
|
|
|
1,145
|
|
|
|
—
|
|
|
|
—
|
|
|
|
—
|
|
|
|
1,145
|
|
|
Revisions of previous estimates
|
|
|
—
|
|
|
|
—
|
|
|
|
130
|
|
|
|
—
|
|
|
|
—
|
|
|
|
—
|
|
|
|
130
|
|
|
Extensions, discoveries and other
|
|
|
—
|
|
|
|
—
|
|
|
|
—
|
|
|
|
—
|
|
|
|
—
|
|
|
|
—
|
|
|
|
—
|
|
|
Acquisitions of reserves in place
|
|
|
—
|
|
|
|
—
|
|
|
|
—
|
|
|
|
—
|
|
|
|
—
|
|
|
|
—
|
|
|
|
—
|
|
|
Sales of reserves in place
|
|
|
—
|
|
|
|
—
|
|
|
|
(160
|
)
|
|
|
—
|
|
|
|
—
|
|
|
|
—
|
|
|
|
(160
|
)
|
|
Production for the year
|
|
|
—
|
|
|
|
—
|
|
|
|
(5
|
)
|
|
|
—
|
|
|
|
—
|
|
|
|
—
|
|
|
|
(5
|
)
|
|
Balance as of December 31, 2015
|
|
|
—
|
|
|
|
—
|
|
|
|
1,110
|
|
|
|
—
|
|
|
|
—
|
|
|
|
—
|
|
|
|
1,110
|
|
|
|
|
|
|
|
|
|
|
|
Proved developed reserves as of
|
|
|
|
|
|
|
|
|
|
|
|
|
|
|
|
|
|
|
|
|
|
|
|
|
|
|
|
|
|
December 31, 2013
|
|
|
—
|
|
|
|
—
|
|
|
|
15
|
|
|
|
—
|
|
|
|
—
|
|
|
|
—
|
|
|
|
15
|
|
|
December 31, 2014
|
|
|
—
|
|
|
|
—
|
|
|
|
17
|
|
|
|
—
|
|
|
|
—
|
|
|
|
—
|
|
|
|
17
|
|
|
December 31, 2015
|
|
|
—
|
|
|
|
—
|
|
|
|
100
|
|
|
|
—
|
|
|
|
—
|
|
|
|
—
|
|
|
|
100
|
|
|
|
|
|
|
|
|
|
|
|
Proved undeveloped reserves as of
|
|
|
|
|
|
|
|
|
|
|
|
|
|
|
|
|
|
|
|
|
|
|
|
|
|
|
|
|
|
December 31, 2013
|
|
|
—
|
|
|
|
—
|
|
|
|
1,073
|
|
|
|
—
|
|
|
|
—
|
|
|
|
—
|
|
|
|
1,073
|
|
|
December 31, 2014
|
|
|
—
|
|
|
|
—
|
|
|
|
1,128
|
|
|
|
—
|
|
|
|
—
|
|
|
|
—
|
|
|
|
1,128
|
|
|
December 31, 2015
|
|
|
—
|
|
|
|
—
|
|
|
|
1,010
|
|
|
|
—
|
|
|
|
—
|
|
|
|
—
|
|
|
|
1,010
|
|
There are no bitumen reserves for equity affiliates.
There are no minority interests for bitumen reserves.
|
|
|
|
|
2015 Form 20-F TOTAL S.A.
|
|
S-7
|
|
1.4.4.
|
Changes in gas reserves
|
|
|
|
|
|
|
|
|
|
|
|
|
|
|
|
|
|
|
|
|
|
|
|
|
|
|
|
|
|
|
|
Proved developed and undeveloped reserves
|
|
Consolidated subsidiaries
|
|
|
(in billion cubic feet)
|
|
Europe
|
|
|
Africa
|
|
|
Americas
|
|
|
Middle
East
|
|
|
Asia — CIS
(excl. Russia)
|
|
|
Russia
|
|
|
Total
|
|
|
Balance as of December 31, 2012
|
|
|
5,144
|
|
|
|
4,521
|
|
|
|
3,691
|
|
|
|
1,317
|
|
|
|
5,347
|
|
|
|
17
|
|
|
|
20,037
|
|
|
Revisions of previous estimates
|
|
|
(6
|
)
|
|
|
(887
|
)
|
|
|
199
|
|
|
|
29
|
|
|
|
(186
|
)
|
|
|
—
|
|
|
|
(851
|
)
|
|
Extensions, discoveries and other
|
|
|
27
|
|
|
|
12
|
|
|
|
336
|
|
|
|
—
|
|
|
|
1,074
|
|
|
|
—
|
|
|
|
1,449
|
|
|
Acquisitions of reserves in place
|
|
|
1
|
|
|
|
—
|
|
|
|
—
|
|
|
|
—
|
|
|
|
506
|
|
|
|
—
|
|
|
|
507
|
|
|
Sales of reserves in place
|
|
|
(13
|
)
|
|
|
—
|
|
|
|
(243
|
)
|
|
|
—
|
|
|
|
—
|
|
|
|
—
|
|
|
|
(256
|
)
|
|
Production for the year
|
|
|
(450
|
)
|
|
|
(248
|
)
|
|
|
(320
|
)
|
|
|
(68
|
)
|
|
|
(457
|
)
|
|
|
(1
|
)
|
|
|
(1,544
|
)
|
|
Balance as of December 31, 2013
|
|
|
4,703
|
|
|
|
3,398
|
|
|
|
3,663
|
|
|
|
1,278
|
|
|
|
6,284
|
|
|
|
16
|
|
|
|
19,342
|
|
|
Revisions of previous estimates
|
|
|
129
|
|
|
|
86
|
|
|
|
54
|
|
|
|
7
|
|
|
|
69
|
|
|
|
—
|
|
|
|
345
|
|
|
Extensions, discoveries and other
|
|
|
99
|
|
|
|
56
|
|
|
|
296
|
|
|
|
1
|
|
|
|
154
|
|
|
|
—
|
|
|
|
606
|
|
|
Acquisitions of reserves in place
|
|
|
6
|
|
|
|
—
|
|
|
|
—
|
|
|
|
—
|
|
|
|
—
|
|
|
|
—
|
|
|
|
6
|
|
|
Sales of reserves in place
|
|
|
(97
|
)
|
|
|
(6
|
)
|
|
|
—
|
|
|
|
—
|
|
|
|
(941
|
)
|
|
|
—
|
|
|
|
(1,044
|
)
|
|
Production for the year
|
|
|
(398
|
)
|
|
|
(250
|
)
|
|
|
(320
|
)
|
|
|
(68
|
)
|
|
|
(451
|
)
|
|
|
(1
|
)
|
|
|
(1,488
|
)
|
|
Balance as of December 31, 2014
|
|
|
4,442
|
|
|
|
3,284
|
|
|
|
3,693
|
|
|
|
1,218
|
|
|
|
5,115
|
|
|
|
15
|
|
|
|
17,767
|
|
|
Revisions of previous estimates
|
|
|
46
|
|
|
|
(33
|
)
|
|
|
(92
|
)
|
|
|
174
|
|
|
|
304
|
|
|
|
1
|
|
|
|
400
|
|
|
Extensions, discoveries and other
|
|
|
40
|
|
|
|
7
|
|
|
|
24
|
|
|
|
42
|
|
|
|
38
|
|
|
|
—
|
|
|
|
151
|
|
|
Acquisitions of reserves in place
|
|
|
—
|
|
|
|
—
|
|
|
|
—
|
|
|
|
—
|
|
|
|
—
|
|
|
|
—
|
|
|
|
—
|
|
|
Sales of reserves in place
|
|
|
(135
|
)
|
|
|
(93
|
)
|
|
|
—
|
|
|
|
—
|
|
|
|
—
|
|
|
|
—
|
|
|
|
(228
|
)
|
|
Production for the year
|
|
|
(424
|
)
|
|
|
(247
|
)
|
|
|
(324
|
)
|
|
|
(75
|
)
|
|
|
(471
|
)
|
|
|
(1
|
)
|
|
|
(1,542
|
)
|
|
Balance as of December 31, 2015
|
|
|
3,969
|
|
|
|
2,918
|
|
|
|
3,301
|
|
|
|
1,359
|
|
|
|
4,986
|
|
|
|
15
|
|
|
|
16,548
|
|
|
|
|
|
Minority interest in proved developed and
undeveloped reserves as of
|
|
|
|
|
|
|
December 31, 2013
|
|
|
—
|
|
|
|
87
|
|
|
|
—
|
|
|
|
—
|
|
|
|
—
|
|
|
|
—
|
|
|
|
87
|
|
|
December 31, 2014
|
|
|
—
|
|
|
|
91
|
|
|
|
—
|
|
|
|
—
|
|
|
|
—
|
|
|
|
—
|
|
|
|
91
|
|
|
December 31, 2015
|
|
|
—
|
|
|
|
64
|
|
|
|
—
|
|
|
|
—
|
|
|
|
—
|
|
|
|
—
|
|
|
|
64
|
|
|
|
|
|
Proved developed and undeveloped reserves
|
|
Equity affiliates
|
|
|
(in billion cubic feet)
|
|
Europe
|
|
|
Africa
|
|
|
Americas
|
|
|
Middle
East
|
|
|
Asia — CIS
(excl. Russia)
|
|
|
Russia
|
|
|
Total
|
|
|
Balance as of December 31, 2012
|
|
|
—
|
|
|
|
341
|
|
|
|
82
|
|
|
|
5,511
|
|
|
|
—
|
|
|
|
4,906
|
|
|
|
10,840
|
|
|
Revisions of previous estimates
|
|
|
—
|
|
|
|
8
|
|
|
|
(18
|
)
|
|
|
16
|
|
|
|
—
|
|
|
|
191
|
|
|
|
197
|
|
|
Extensions, discoveries and other
|
|
|
—
|
|
|
|
—
|
|
|
|
—
|
|
|
|
77
|
|
|
|
—
|
|
|
|
3,209
|
|
|
|
3,286
|
|
|
Acquisitions of reserves in place
|
|
|
—
|
|
|
|
—
|
|
|
|
—
|
|
|
|
—
|
|
|
|
—
|
|
|
|
553
|
|
|
|
553
|
|
|
Sales of reserves in place
|
|
|
—
|
|
|
|
—
|
|
|
|
—
|
|
|
|
—
|
|
|
|
—
|
|
|
|
(485
|
)
|
|
|
(485
|
)
|
|
Production for the year
|
|
|
—
|
|
|
|
(6
|
)
|
|
|
(2
|
)
|
|
|
(354
|
)
|
|
|
—
|
|
|
|
(345
|
)
|
|
|
(707
|
)
|
|
Balance as of December 31, 2013
|
|
|
—
|
|
|
|
343
|
|
|
|
62
|
|
|
|
5,250
|
|
|
|
—
|
|
|
|
8,029
|
|
|
|
13,684
|
|
|
Revisions of previous estimates
|
|
|
—
|
|
|
|
17
|
|
|
|
2
|
|
|
|
(25
|
)
|
|
|
—
|
|
|
|
50
|
|
|
|
44
|
|
|
Extensions, discoveries and other
|
|
|
—
|
|
|
|
—
|
|
|
|
—
|
|
|
|
—
|
|
|
|
—
|
|
|
|
2,328
|
|
|
|
2,328
|
|
|
Acquisitions of reserves in place
|
|
|
—
|
|
|
|
—
|
|
|
|
—
|
|
|
|
—
|
|
|
|
—
|
|
|
|
521
|
|
|
|
521
|
|
|
Sales of reserves in place
|
|
|
—
|
|
|
|
—
|
|
|
|
—
|
|
|
|
—
|
|
|
|
—
|
|
|
|
(28
|
)
|
|
|
(28
|
)
|
|
Production for the year
|
|
|
—
|
|
|
|
(4
|
)
|
|
|
(2
|
)
|
|
|
(328
|
)
|
|
|
—
|
|
|
|
(392
|
)
|
|
|
(726
|
)
|
|
Balance as of December 31, 2014
|
|
|
—
|
|
|
|
356
|
|
|
|
62
|
|
|
|
4,897
|
|
|
|
—
|
|
|
|
10,508
|
|
|
|
15,823
|
|
|
Revisions of previous estimates
|
|
|
—
|
|
|
|
(45
|
)
|
|
|
(11
|
)
|
|
|
6
|
|
|
|
—
|
|
|
|
337
|
|
|
|
287
|
|
|
Extensions, discoveries and other
|
|
|
—
|
|
|
|
—
|
|
|
|
—
|
|
|
|
—
|
|
|
|
—
|
|
|
|
—
|
|
|
|
—
|
|
|
Acquisitions of reserves in place
|
|
|
—
|
|
|
|
—
|
|
|
|
—
|
|
|
|
—
|
|
|
|
—
|
|
|
|
267
|
|
|
|
267
|
|
|
Sales of reserves in place
|
|
|
—
|
|
|
|
—
|
|
|
|
—
|
|
|
|
—
|
|
|
|
—
|
|
|
|
(52
|
)
|
|
|
(52
|
)
|
|
Production for the year
|
|
|
—
|
|
|
|
—
|
|
|
|
(3
|
)
|
|
|
(208
|
)
|
|
|
—
|
|
|
|
(456
|
)
|
|
|
(667
|
)
|
|
Balance as of December 31, 2015
|
|
|
—
|
|
|
|
311
|
|
|
|
48
|
|
|
|
4,695
|
|
|
|
—
|
|
|
|
10,604
|
|
|
|
15,658
|
|
|
|
|
|
|
S-8
|
|
TOTAL S.A. Form 20-F 2015
|
|
|
|
|
|
|
|
|
|
|
|
|
|
|
|
|
|
|
|
|
|
|
|
|
|
|
|
|
|
|
|
|
|
Consolidated subsidiaries and equity affiliates
|
|
|
(in billion cubic feet)
|
|
Europe
|
|
|
Africa
|
|
|
Americas
|
|
|
Middle
East
|
|
|
Asia — CIS
(excl. Russia)
|
|
|
Russia
|
|
|
Total
|
|
|
As of December 31, 2013
|
|
|
|
|
|
|
|
|
|
|
|
|
|
|
|
|
|
|
|
|
|
|
|
|
|
|
|
|
|
Proved developed and undeveloped reserves
|
|
|
4,703
|
|
|
|
3,741
|
|
|
|
3,725
|
|
|
|
6,528
|
|
|
|
6,284
|
|
|
|
8,045
|
|
|
|
33,026
|
|
|
Consolidated subsidiaries
|
|
|
4,703
|
|
|
|
3,398
|
|
|
|
3,663
|
|
|
|
1,278
|
|
|
|
6,284
|
|
|
|
16
|
|
|
|
19,342
|
|
|
Equity affiliates
|
|
|
—
|
|
|
|
343
|
|
|
|
62
|
|
|
|
5,250
|
|
|
|
—
|
|
|
|
8,029
|
|
|
|
13,684
|
|
|
Proved developed reserves
|
|
|
2,687
|
|
|
|
2,009
|
|
|
|
2,240
|
|
|
|
6,366
|
|
|
|
1,821
|
|
|
|
3,693
|
|
|
|
18,816
|
|
|
Consolidated subsidiaries
|
|
|
2,687
|
|
|
|
1,937
|
|
|
|
2,210
|
|
|
|
1,210
|
|
|
|
1,821
|
|
|
|
13
|
|
|
|
9,878
|
|
|
Equity affiliates
|
|
|
—
|
|
|
|
72
|
|
|
|
30
|
|
|
|
5,156
|
|
|
|
—
|
|
|
|
3,680
|
|
|
|
8,938
|
|
|
Proved undeveloped reserves
|
|
|
2,016
|
|
|
|
1,732
|
|
|
|
1,485
|
|
|
|
162
|
|
|
|
4,463
|
|
|
|
4,352
|
|
|
|
14,210
|
|
|
Consolidated subsidiaries
|
|
|
2,016
|
|
|
|
1,461
|
|
|
|
1,453
|
|
|
|
68
|
|
|
|
4,463
|
|
|
|
3
|
|
|
|
9,464
|
|
|
Equity affiliates
|
|
|
—
|
|
|
|
271
|
|
|
|
32
|
|
|
|
94
|
|
|
|
—
|
|
|
|
4,349
|
|
|
|
4,746
|
|
|
As of December 31, 2014
|
|
|
|
|
|
|
|
|
|
|
|
|
|
|
|
|
|
|
|
|
|
|
|
|
|
|
|
|
|
Proved developed and undeveloped reserves
|
|
|
4,442
|
|
|
|
3,640
|
|
|
|
3,755
|
|
|
|
6,115
|
|
|
|
5,115
|
|
|
|
10,523
|
|
|
|
33,590
|
|
|
Consolidated subsidiaries
|
|
|
4,442
|
|
|
|
3,284
|
|
|
|
3,693
|
|
|
|
1,218
|
|
|
|
5,115
|
|
|
|
15
|
|
|
|
17,767
|
|
|
Equity affiliates
|
|
|
—
|
|
|
|
356
|
|
|
|
62
|
|
|
|
4,897
|
|
|
|
—
|
|
|
|
10,508
|
|
|
|
15,823
|
|
|
Proved developed reserves
|
|
|
2,578
|
|
|
|
2,019
|
|
|
|
2,167
|
|
|
|
5,866
|
|
|
|
1,444
|
|
|
|
4,959
|
|
|
|
19,033
|
|
|
Consolidated subsidiaries
|
|
|
2,578
|
|
|
|
1,952
|
|
|
|
2,145
|
|
|
|
1,144
|
|
|
|
1,444
|
|
|
|
9
|
|
|
|
9,272
|
|
|
Equity affiliates
|
|
|
—
|
|
|
|
67
|
|
|
|
22
|
|
|
|
4,722
|
|
|
|
—
|
|
|
|
4,950
|
|
|
|
9,761
|
|
|
Proved undeveloped reserves
|
|
|
1,864
|
|
|
|
1,621
|
|
|
|
1,588
|
|
|
|
249
|
|
|
|
3,671
|
|
|
|
5,564
|
|
|
|
14,557
|
|
|
Consolidated subsidiaries
|
|
|
1,864
|
|
|
|
1,332
|
|
|
|
1,548
|
|
|
|
74
|
|
|
|
3,671
|
|
|
|
6
|
|
|
|
8,495
|
|
|
Equity affiliates
|
|
|
—
|
|
|
|
289
|
|
|
|
40
|
|
|
|
175
|
|
|
|
—
|
|
|
|
5,558
|
|
|
|
6,062
|
|
|
As of December 31, 2015
|
|
|
|
|
|
|
|
|
|
|
|
|
|
|
|
|
|
|
|
|
|
|
|
|
|
|
|
|
|
Proved developed and undeveloped reserves
|
|
|
3,969
|
|
|
|
3,229
|
|
|
|
3,349
|
|
|
|
6,054
|
|
|
|
4,986
|
|
|
|
10,619
|
|
|
|
32,206
|
|
|
Consolidated subsidiaries
|
|
|
3,969
|
|
|
|
2,918
|
|
|
|
3,301
|
|
|
|
1,359
|
|
|
|
4,986
|
|
|
|
15
|
|
|
|
16,548
|
|
|
Equity affiliates
|
|
|
—
|
|
|
|
311
|
|
|
|
48
|
|
|
|
4,695
|
|
|
|
—
|
|
|
|
10,604
|
|
|
|
15,658
|
|
|
Proved developed reserves
|
|
|
2,682
|
|
|
|
1,726
|
|
|
|
2,153
|
|
|
|
5,442
|
|
|
|
1,717
|
|
|
|
4,890
|
|
|
|
18,610
|
|
|
Consolidated subsidiaries
|
|
|
2,682
|
|
|
|
1,680
|
|
|
|
2,133
|
|
|
|
1,207
|
|
|
|
1,717
|
|
|
|
6
|
|
|
|
9,425
|
|
|
Equity affiliates
|
|
|
—
|
|
|
|
46
|
|
|
|
20
|
|
|
|
4,235
|
|
|
|
—
|
|
|
|
4,884
|
|
|
|
9,185
|
|
|
Proved undeveloped reserves
|
|
|
1,287
|
|
|
|
1,503
|
|
|
|
1,196
|
|
|
|
612
|
|
|
|
3,269
|
|
|
|
5,729
|
|
|
|
13,596
|
|
|
Consolidated subsidiaries
|
|
|
1,287
|
|
|
|
1,238
|
|
|
|
1,168
|
|
|
|
152
|
|
|
|
3,269
|
|
|
|
9
|
|
|
|
7,123
|
|
|
Equity affiliates
|
|
|
—
|
|
|
|
265
|
|
|
|
28
|
|
|
|
460
|
|
|
|
—
|
|
|
|
5,720
|
|
|
|
6,473
|
|
|
|
|
|
|
2015 Form 20-F TOTAL S.A.
|
|
S-9
|
|
1.5.
|
Results of operations for oil and gas producing activities
|
The following tables do not include revenues and expenses related to oil and gas transportation activities and LNG liquefaction and transportation.
|
|
|
|
|
|
|
|
|
|
|
|
|
|
|
|
|
|
|
|
|
|
|
|
|
|
|
|
|
|
|
|
|
|
|
|
|
Consolidated subsidiaries
|
|
|
(M$)
|
|
Europe
|
|
|
Africa
|
|
|
Americas
|
|
|
Middle
East
|
|
|
Asia — CIS
(excl. Russia)
|
|
|
Russia
|
|
|
Total
|
|
|
2013
|
|
|
|
|
|
|
|
|
|
|
|
|
|
|
|
|
|
|
|
|
|
|
|
|
|
|
|
|
|
|
|
Revenues
|
|
Non-Group sales
|
|
|
2,170
|
|
|
|
4,575
|
|
|
|
1,331
|
|
|
|
1,079
|
|
|
|
4,626
|
|
|
|
—
|
|
|
|
13,781
|
|
|
|
|
Group sales
|
|
|
7,749
|
|
|
|
16,072
|
|
|
|
808
|
|
|
|
901
|
|
|
|
742
|
|
|
|
268
|
|
|
|
26,540
|
|
|
Total Revenues
|
|
|
9,919
|
|
|
|
20,647
|
|
|
|
2,139
|
|
|
|
1,980
|
|
|
|
5,368
|
|
|
|
268
|
|
|
|
40,321
|
|
|
Production costs
|
|
|
(1,762
|
)
|
|
|
(1,974
|
)
|
|
|
(415
|
)
|
|
|
(498
|
)
|
|
|
(546
|
)
|
|
|
(39
|
)
|
|
|
(5,234
|
)
|
|
Exploration expenses
|
|
|
(483
|
)
|
|
|
(583
|
)
|
|
|
(539
|
)
|
|
|
(165
|
)
|
|
|
(395
|
)
|
|
|
(4
|
)
|
|
|
(2,169
|
)
|
|
Depreciation, depletion and amortization and valuation allowances
|
|
|
(1,817
|
)
|
|
|
(3,433
|
)
|
|
|
(1,214
|
)
|
|
|
(725
|
)
|
|
|
(1,607
|
)
|
|
|
(85
|
)
|
|
|
(8,881
|
)
|
|
Other expenses
(a)
|
|
|
(493
|
)
|
|
|
(1,578
|
)
|
|
|
(434
|
)
|
|
|
(106
|
)
|
|
|
(149
|
)
|
|
|
(33
|
)
|
|
|
(2,793
|
)
|
|
Pre-tax income from producing activities
|
|
|
5,364
|
|
|
|
13,079
|
|
|
|
(463
|
)
|
|
|
486
|
|
|
|
2,671
|
|
|
|
107
|
|
|
|
21,244
|
|
|
Income tax
|
|
|
(3,621
|
)
|
|
|
(8,281
|
)
|
|
|
56
|
|
|
|
(419
|
)
|
|
|
(1,362
|
)
|
|
|
(46
|
)
|
|
|
(13,673
|
)
|
|
Results of oil and gas producing activities
|
|
|
1,743
|
|
|
|
4,798
|
|
|
|
(407
|
)
|
|
|
67
|
|
|
|
1,309
|
|
|
|
61
|
|
|
|
7,571
|
|
|
2014
|
|
|
|
|
|
|
|
|
|
|
|
|
|
|
|
|
|
|
|
|
|
|
|
|
|
|
|
|
|
|
|
Revenues
|
|
Non-Group sales
|
|
|
2,073
|
|
|
|
3,561
|
|
|
|
1,195
|
|
|
|
804
|
|
|
|
4,423
|
|
|
|
—
|
|
|
|
12,056
|
|
|
|
|
Group sales
|
|
|
5,966
|
|
|
|
13,386
|
|
|
|
971
|
|
|
|
972
|
|
|
|
742
|
|
|
|
236
|
|
|
|
22,273
|
|
|
Total Revenues
|
|
|
8,039
|
|
|
|
16,947
|
|
|
|
2,166
|
|
|
|
1,776
|
|
|
|
5,165
|
|
|
|
236
|
|
|
|
34,329
|
|
|
Production costs
|
|
|
(1,729
|
)
|
|
|
(2,221
|
)
|
|
|
(466
|
)
|
|
|
(503
|
)
|
|
|
(738
|
)
|
|
|
(44
|
)
|
|
|
(5,701
|
)
|
|
Exploration expenses
|
|
|
(617
|
)
|
|
|
(631
|
)
|
|
|
(183
|
)
|
|
|
(144
|
)
|
|
|
(381
|
)
|
|
|
(9
|
)
|
|
|
(1,965
|
)
|
|
Depreciation, depletion and amortization and valuation allowances
|
|
|
(1,988
|
)
|
|
|
(4,750
|
)
|
|
|
(5,717
|
)
|
|
|
(545
|
)
|
|
|
(2,058
|
)
|
|
|
(97
|
)
|
|
|
(15,155
|
)
|
|
Other expenses
(a)
|
|
|
(419
|
)
|
|
|
(1,375
|
)
|
|
|
(402
|
)
|
|
|
(114
|
)
|
|
|
(167
|
)
|
|
|
(29
|
)
|
|
|
(2,506
|
)
|
|
Pre-tax income from producing activities
|
|
|
3,286
|
|
|
|
7,970
|
|
|
|
(4,602
|
)
|
|
|
470
|
|
|
|
1,821
|
|
|
|
57
|
|
|
|
9,002
|
|
|
Income tax
|
|
|
(1,683
|
)
|
|
|
(6,066
|
)
|
|
|
882
|
|
|
|
(334
|
)
|
|
|
(1,159
|
)
|
|
|
(32
|
)
|
|
|
(8,392
|
)
|
|
Results of oil and gas producing activities
|
|
|
1,603
|
|
|
|
1,904
|
|
|
|
(3,720
|
)
|
|
|
136
|
|
|
|
662
|
|
|
|
25
|
|
|
|
610
|
|
|
2015
|
|
|
|
|
|
|
|
|
|
|
|
|
|
|
|
|
|
|
|
|
|
|
|
|
|
|
|
|
|
|
|
Revenues
|
|
Non-Group sales
|
|
|
1,343
|
|
|
|
1,191
|
|
|
|
970
|
|
|
|
2,138
|
|
|
|
3,015
|
|
|
|
—
|
|
|
|
8,657
|
|
|
|
|
Group sales
|
|
|
3,821
|
|
|
|
7,959
|
|
|
|
271
|
|
|
|
1,715
|
|
|
|
351
|
|
|
|
129
|
|
|
|
14,246
|
|
|
Total Revenues
|
|
|
5,164
|
|
|
|
9,150
|
|
|
|
1,241
|
|
|
|
3,853
|
|
|
|
3,366
|
|
|
|
129
|
|
|
|
22,903
|
|
|
Production costs
|
|
|
(1,485
|
)
|
|
|
(1,847
|
)
|
|
|
(497
|
)
|
|
|
(591
|
)
|
|
|
(492
|
)
|
|
|
(34
|
)
|
|
|
(4,946
|
)
|
|
Exploration expenses
|
|
|
(572
|
)
|
|
|
(694
|
)
|
|
|
(114
|
)
|
|
|
(147
|
)
|
|
|
(461
|
)
|
|
|
(3
|
)
|
|
|
(1,991
|
)
|
|
Depreciation, depletion and amortization and valuation allowances
|
|
|
(2,335
|
)
|
|
|
(6,941
|
)
|
|
|
(1,548
|
)
|
|
|
(558
|
)
|
|
|
(3,563
|
)
|
|
|
(203
|
)
|
|
|
(15,148
|
)
|
|
Other expenses
(a)
|
|
|
(350
|
)
|
|
|
(841
|
)
|
|
|
(280
|
)
|
|
|
(2,637
|
)
|
|
|
(121
|
)
|
|
|
(16
|
)
|
|
|
(4,245
|
)
|
|
Pre-tax income from producing activities
|
|
|
422
|
|
|
|
(1,173
|
)
|
|
|
(1,198
|
)
|
|
|
(80
|
)
|
|
|
(1,271
|
)
|
|
|
(127
|
)
|
|
|
(3,427
|
)
|
|
Income tax
|
|
|
443
|
|
|
|
(242
|
)
|
|
|
210
|
|
|
|
(101
|
)
|
|
|
(158
|
)
|
|
|
(4
|
)
|
|
|
148
|
|
|
Results of oil and gas producing activities
|
|
|
865
|
|
|
|
(1,415
|
)
|
|
|
(988
|
)
|
|
|
(181
|
)
|
|
|
(1,429
|
)
|
|
|
(131
|
)
|
|
|
(3,279
|
)
|
|
(a)
|
Included production taxes and accretion expense as provided for by IAS 37 ($566 million in 2013, $526 million in 2014, $497 million in 2015).
|
|
|
|
|
|
S-10
|
|
TOTAL S.A. Form 20-F 2015
|
|
|
|
|
|
|
|
|
|
|
|
|
|
|
|
|
|
|
|
|
|
|
|
|
|
|
|
|
|
|
|
|
|
|
|
|
|
Equity affiliates
|
|
|
(M$)
|
|
Europe
|
|
|
Africa
|
|
|
Americas
|
|
|
Middle
East
|
|
|
Asia — CIS
(excl. Russia)
|
|
|
Russia
|
|
|
Total
|
|
|
2013
|
|
|
|
|
|
|
|
|
|
|
|
|
|
|
|
|
|
|
|
|
|
|
|
|
|
|
|
|
|
|
|
Revenues
|
|
Non-Group sales
|
|
|
—
|
|
|
|
—
|
|
|
|
—
|
|
|
|
2,020
|
|
|
|
—
|
|
|
|
756
|
|
|
|
2,776
|
|
|
|
|
Group sales
|
|
|
—
|
|
|
|
—
|
|
|
|
999
|
|
|
|
10,289
|
|
|
|
—
|
|
|
|
14
|
|
|
|
11,302
|
|
|
Total Revenues
|
|
|
—
|
|
|
|
—
|
|
|
|
999
|
|
|
|
12,309
|
|
|
|
—
|
|
|
|
770
|
|
|
|
14,078
|
|
|
Production costs
|
|
|
—
|
|
|
|
—
|
|
|
|
(107
|
)
|
|
|
(481
|
)
|
|
|
—
|
|
|
|
(55
|
)
|
|
|
(643
|
)
|
|
Exploration expenses
|
|
|
—
|
|
|
|
—
|
|
|
|
—
|
|
|
|
—
|
|
|
|
—
|
|
|
|
(3
|
)
|
|
|
(3
|
)
|
|
Depreciation, depletion and amortization and valuation allowances
|
|
|
—
|
|
|
|
—
|
|
|
|
(45
|
)
|
|
|
(464
|
)
|
|
|
—
|
|
|
|
(259
|
)
|
|
|
(768
|
)
|
|
Other expenses
|
|
|
—
|
|
|
|
—
|
|
|
|
(639
|
)
|
|
|
(8,952
|
)
|
|
|
—
|
|
|
|
(121
|
)
|
|
|
(9,712
|
)
|
|
Pre-tax income from producing activities
|
|
|
—
|
|
|
|
—
|
|
|
|
208
|
|
|
|
2,412
|
|
|
|
—
|
|
|
|
332
|
|
|
|
2,952
|
|
|
Income tax
|
|
|
—
|
|
|
|
—
|
|
|
|
(103
|
)
|
|
|
(545
|
)
|
|
|
—
|
|
|
|
(109
|
)
|
|
|
(757
|
)
|
|
Results of oil and gas producing activities
|
|
|
—
|
|
|
|
—
|
|
|
|
105
|
|
|
|
1,867
|
|
|
|
—
|
|
|
|
223
|
|
|
|
2,195
|
|
|
2014
|
|
|
|
|
|
|
|
|
|
|
|
|
|
|
|
|
|
|
|
|
|
|
|
|
|
|
|
|
|
|
|
Revenues
|
|
Non-Group sales
|
|
|
—
|
|
|
|
—
|
|
|
|
—
|
|
|
|
2,094
|
|
|
|
—
|
|
|
|
1,117
|
|
|
|
3,211
|
|
|
|
|
Group sales
|
|
|
—
|
|
|
|
(21
|
)
|
|
|
885
|
|
|
|
4,854
|
|
|
|
—
|
|
|
|
(249
|
)
|
|
|
5,469
|
|
|
Total Revenues
|
|
|
—
|
|
|
|
(21
|
)
|
|
|
885
|
|
|
|
6,948
|
|
|
|
—
|
|
|
|
868
|
|
|
|
8,680
|
|
|
Production costs
|
|
|
—
|
|
|
|
—
|
|
|
|
(123
|
)
|
|
|
(311
|
)
|
|
|
—
|
|
|
|
(121
|
)
|
|
|
(555
|
)
|
|
Exploration expenses
|
|
|
—
|
|
|
|
—
|
|
|
|
—
|
|
|
|
—
|
|
|
|
—
|
|
|
|
(1
|
)
|
|
|
(1
|
)
|
|
Depreciation, depletion and amortization and valuation allowances
|
|
|
—
|
|
|
|
—
|
|
|
|
(87
|
)
|
|
|
(304
|
)
|
|
|
—
|
|
|
|
(54
|
)
|
|
|
(445
|
)
|
|
Other expenses
|
|
|
—
|
|
|
|
—
|
|
|
|
(537
|
)
|
|
|
(3,806
|
)
|
|
|
—
|
|
|
|
(142
|
)
|
|
|
(4,485
|
)
|
|
Pre-tax income from producing activities
|
|
|
—
|
|
|
|
(21
|
)
|
|
|
138
|
|
|
|
2,527
|
|
|
|
—
|
|
|
|
550
|
|
|
|
3,194
|
|
|
Income tax
|
|
|
—
|
|
|
|
—
|
|
|
|
(207
|
)
|
|
|
(689
|
)
|
|
|
—
|
|
|
|
(140
|
)
|
|
|
(1,036
|
)
|
|
Results of oil and gas producing activities
|
|
|
—
|
|
|
|
(21
|
)
|
|
|
(69
|
)
|
|
|
1,838
|
|
|
|
—
|
|
|
|
410
|
|
|
|
2,158
|
|
|
2015
|
|
|
|
|
|
|
|
|
|
|
|
|
|
|
|
|
|
|
|
|
|
|
|
|
|
|
|
|
|
|
|
Revenues
|
|
Non-Group sales
|
|
|
—
|
|
|
|
—
|
|
|
|
380
|
|
|
|
812
|
|
|
|
—
|
|
|
|
670
|
|
|
|
1,862
|
|
|
|
|
Group sales
|
|
|
—
|
|
|
|
—
|
|
|
|
10
|
|
|
|
2,404
|
|
|
|
—
|
|
|
|
—
|
|
|
|
2,414
|
|
|
Total Revenues
|
|
|
—
|
|
|
|
—
|
|
|
|
390
|
|
|
|
3,216
|
|
|
|
—
|
|
|
|
670
|
|
|
|
4,276
|
|
|
Production costs
|
|
|
—
|
|
|
|
—
|
|
|
|
(54
|
)
|
|
|
(295
|
)
|
|
|
—
|
|
|
|
(127
|
)
|
|
|
(476
|
)
|
|
Exploration expenses
|
|
|
—
|
|
|
|
—
|
|
|
|
—
|
|
|
|
—
|
|
|
|
—
|
|
|
|
(1
|
)
|
|
|
(1
|
)
|
|
Depreciation, depletion and amortization and valuation allowances
|
|
|
—
|
|
|
|
—
|
|
|
|
(98
|
)
|
|
|
(400
|
)
|
|
|
—
|
|
|
|
(58
|
)
|
|
|
(556
|
)
|
|
Other expenses
|
|
|
—
|
|
|
|
—
|
|
|
|
(170
|
)
|
|
|
(1,638
|
)
|
|
|
—
|
|
|
|
(134
|
)
|
|
|
(1,942
|
)
|
|
Pre-tax income from producing activities
|
|
|
—
|
|
|
|
—
|
|
|
|
68
|
|
|
|
883
|
|
|
|
—
|
|
|
|
350
|
|
|
|
1,301
|
|
|
Income tax
|
|
|
—
|
|
|
|
—
|
|
|
|
(36
|
)
|
|
|
(184
|
)
|
|
|
—
|
|
|
|
(65
|
)
|
|
|
(285
|
)
|
|
Results of oil and gas producing activities
|
|
|
—
|
|
|
|
—
|
|
|
|
32
|
|
|
|
699
|
|
|
|
—
|
|
|
|
285
|
|
|
|
1,016
|
|
|
|
|
|
|
2015 Form 20-F TOTAL S.A.
|
|
S-11
|
The following tables set forth the costs
incurred in the Group’s oil and gas property acquisition, exploration and development activities, including both capitalized and expensed amounts. They do not include costs incurred related to oil and gas transportation and LNG liquefaction and
transportation activities.
|
|
|
|
|
|
|
|
|
|
|
|
|
|
|
|
|
|
|
|
|
|
|
|
|
|
|
|
|
|
|
|
|
Consolidated subsidiaries
|
|
|
(M$)
|
|
Europe
|
|
|
Africa
|
|
|
Americas
|
|
|
Middle
East
|
|
|
Asia — CIS
(excl. Russia)
(a)
|
|
|
Russia
|
|
|
Total
|
|
|
2013
|
|
|
|
|
|
|
|
|
|
|
|
|
|
|
|
|
|
|
|
|
|
|
|
|
|
|
|
|
|
Proved property acquisition
|
|
|
—
|
|
|
|
175
|
|
|
|
—
|
|
|
|
3
|
|
|
|
487
|
|
|
|
—
|
|
|
|
665
|
|
|
Unproved property acquisition
|
|
|
17
|
|
|
|
512
|
|
|
|
2,105
|
|
|
|
85
|
|
|
|
85
|
|
|
|
—
|
|
|
|
2,804
|
|
|
Exploration costs
|
|
|
679
|
|
|
|
889
|
|
|
|
585
|
|
|
|
231
|
|
|
|
538
|
|
|
|
4
|
|
|
|
2,926
|
|
|
Development costs
(b)
|
|
|
5,239
|
|
|
|
8,545
|
|
|
|
3,191
|
|
|
|
464
|
|
|
|
4,395
|
|
|
|
147
|
|
|
|
21,981
|
|
|
Total cost incurred
|
|
|
5,935
|
|
|
|
10,121
|
|
|
|
5,881
|
|
|
|
783
|
|
|
|
5,505
|
|
|
|
151
|
|
|
|
28,376
|
|
|
2014
|
|
|
|
|
|
|
|
|
|
|
|
|
|
|
|
|
|
|
|
|
|
|
|
|
|
|
|
|
|
Proved property acquisition
|
|
|
57
|
|
|
|
17
|
|
|
|
—
|
|
|
|
(1
|
)
|
|
|
32
|
|
|
|
—
|
|
|
|
105
|
|
|
Unproved property acquisition
|
|
|
17
|
|
|
|
69
|
|
|
|
544
|
|
|
|
7
|
|
|
|
66
|
|
|
|
—
|
|
|
|
703
|
|
|
Exploration costs
|
|
|
466
|
|
|
|
1,057
|
|
|
|
375
|
|
|
|
228
|
|
|
|
485
|
|
|
|
9
|
|
|
|
2,620
|
|
|
Development costs
(b)
|
|
|
4,495
|
|
|
|
8,126
|
|
|
|
3,468
|
|
|
|
478
|
|
|
|
3,680
|
|
|
|
116
|
|
|
|
20,363
|
|
|
Total cost incurred
|
|
|
5,035
|
|
|
|
9,269
|
|
|
|
4,387
|
|
|
|
712
|
|
|
|
4,263
|
|
|
|
125
|
|
|
|
23,791
|
|
|
2015
|
|
|
|
|
|
|
|
|
|
|
|
|
|
|
|
|
|
|
|
|
|
|
|
|
|
|
|
|
|
Proved property acquisition
|
|
|
37
|
|
|
|
59
|
|
|
|
—
|
|
|
|
1,039
|
|
|
|
30
|
|
|
|
—
|
|
|
|
1,165
|
|
|
Unproved property acquisition
|
|
|
—
|
|
|
|
29
|
|
|
|
199
|
|
|
|
1,202
|
|
|
|
4
|
|
|
|
4
|
|
|
|
1,438
|
|
|
Exploration costs
|
|
|
563
|
|
|
|
321
|
|
|
|
515
|
|
|
|
229
|
|
|
|
316
|
|
|
|
3
|
|
|
|
1,947
|
|
|
Development costs
(b)
|
|
|
3,987
|
|
|
|
7,686
|
|
|
|
3,143
|
|
|
|
496
|
|
|
|
3,129
|
|
|
|
97
|
|
|
|
18,538
|
|
|
Total cost incurred
|
|
|
4,587
|
|
|
|
8,095
|
|
|
|
3,857
|
|
|
|
2,966
|
|
|
|
3,479
|
|
|
|
104
|
|
|
|
23,088
|
|
|
|
|
Group’s share of costs of property acquisition,
exploration and development
|
|
Equity affiliates
|
|
|
(M$)
|
|
Europe
|
|
|
Africa
|
|
|
Americas
|
|
|
Middle
East
|
|
|
Asia — CIS
(excl. Russia)
|
|
|
Russia
|
|
|
Total
|
|
|
2013
|
|
|
|
|
|
|
|
|
|
|
|
|
|
|
|
|
|
|
|
|
|
|
|
|
|
|
|
|
|
Proved property acquisition
|
|
|
—
|
|
|
|
—
|
|
|
|
—
|
|
|
|
—
|
|
|
|
—
|
|
|
|
274
|
|
|
|
274
|
|
|
Unproved property acquisition
|
|
|
—
|
|
|
|
—
|
|
|
|
—
|
|
|
|
—
|
|
|
|
—
|
|
|
|
141
|
|
|
|
141
|
|
|
Exploration costs
|
|
|
—
|
|
|
|
—
|
|
|
|
—
|
|
|
|
—
|
|
|
|
—
|
|
|
|
—
|
|
|
|
—
|
|
|
Development costs
(b)
|
|
|
—
|
|
|
|
—
|
|
|
|
170
|
|
|
|
458
|
|
|
|
—
|
|
|
|
319
|
|
|
|
947
|
|
|
Total cost incurred
|
|
|
—
|
|
|
|
—
|
|
|
|
170
|
|
|
|
458
|
|
|
|
—
|
|
|
|
734
|
|
|
|
1,362
|
|
|
2014
|
|
|
|
|
|
|
|
|
|
|
|
|
|
|
|
|
|
|
|
|
|
|
|
|
|
|
|
|
|
Proved property acquisition
|
|
|
—
|
|
|
|
—
|
|
|
|
—
|
|
|
|
—
|
|
|
|
—
|
|
|
|
246
|
|
|
|
246
|
|
|
Unproved property acquisition
|
|
|
—
|
|
|
|
—
|
|
|
|
—
|
|
|
|
—
|
|
|
|
—
|
|
|
|
32
|
|
|
|
32
|
|
|
Exploration costs
|
|
|
—
|
|
|
|
—
|
|
|
|
—
|
|
|
|
—
|
|
|
|
—
|
|
|
|
—
|
|
|
|
—
|
|
|
Development costs
(b)
|
|
|
—
|
|
|
|
—
|
|
|
|
195
|
|
|
|
500
|
|
|
|
—
|
|
|
|
692
|
|
|
|
1,387
|
|
|
Total cost incurred
|
|
|
—
|
|
|
|
—
|
|
|
|
195
|
|
|
|
500
|
|
|
|
—
|
|
|
|
970
|
|
|
|
1,665
|
|
|
2015
|
|
|
|
|
|
|
|
|
|
|
|
|
|
|
|
|
|
|
|
|
|
|
|
|
|
|
|
|
|
Proved property acquisition
|
|
|
—
|
|
|
|
—
|
|
|
|
—
|
|
|
|
—
|
|
|
|
—
|
|
|
|
218
|
|
|
|
218
|
|
|
Unproved property acquisition
|
|
|
—
|
|
|
|
—
|
|
|
|
—
|
|
|
|
—
|
|
|
|
—
|
|
|
|
14
|
|
|
|
14
|
|
|
Exploration costs
|
|
|
—
|
|
|
|
—
|
|
|
|
—
|
|
|
|
8
|
|
|
|
—
|
|
|
|
—
|
|
|
|
8
|
|
|
Development costs
(b)
|
|
|
—
|
|
|
|
—
|
|
|
|
83
|
|
|
|
398
|
|
|
|
—
|
|
|
|
405
|
|
|
|
886
|
|
|
Total cost incurred
|
|
|
—
|
|
|
|
—
|
|
|
|
83
|
|
|
|
406
|
|
|
|
—
|
|
|
|
637
|
|
|
|
1,126
|
|
|
(a)
|
Revision of historical costs out of ASC932 perimeter.
|
|
(b)
|
Including asset retirement costs capitalized during the year and any gains or losses recognized upon settlement of asset retirement obligation during the
year.
|
|
|
|
|
|
S-12
|
|
TOTAL S.A. Form 20-F 2015
|
|
1.7.
|
Capitalized costs related to oil and gas producing activities
|
Capitalized costs represent the amount of capitalized proved and unproved property costs, including support equipement and facilities, along with the related
accumulated depreciation, depletion and amortization. The following tables do not include capitalized costs related to oil and gas transportation and LNG liquefaction and transportation activities.
|
|
|
|
|
|
|
|
|
|
|
|
|
|
|
|
|
|
|
|
|
|
|
|
|
|
|
|
|
|
|
|
|
Consolidated subsidiaries
|
|
|
(M$)
|
|
Europe
|
|
|
Africa
|
|
|
Americas
|
|
|
Middle
East
|
|
|
Asia — CIS
(excl. Russia)
(a)
|
|
|
Russia
|
|
|
Total
|
|
|
As of December 31, 2013
|
|
|
|
|
|
|
|
|
|
|
|
|
|
|
|
|
|
|
|
|
|
|
|
|
|
|
|
|
|
Proved properties
|
|
|
50,313
|
|
|
|
61,728
|
|
|
|
15,002
|
|
|
|
8,941
|
|
|
|
28,047
|
|
|
|
950
|
|
|
|
164,981
|
|
|
Unproved properties
|
|
|
888
|
|
|
|
5,049
|
|
|
|
7,881
|
|
|
|
481
|
|
|
|
1,123
|
|
|
|
—
|
|
|
|
15,422
|
|
|
Total capitalized costs
|
|
|
51,201
|
|
|
|
66,777
|
|
|
|
22,883
|
|
|
|
9,422
|
|
|
|
29,170
|
|
|
|
950
|
|
|
|
180,403
|
|
|
Accumulated depreciation, depletion and amortization
|
|
|
(32,208
|
)
|
|
|
(30,278
|
)
|
|
|
(5,259
|
)
|
|
|
(6,842
|
)
|
|
|
(9,040
|
)
|
|
|
(399
|
)
|
|
|
(84,026
|
)
|
|
Net capitalized costs
|
|
|
18,993
|
|
|
|
36,499
|
|
|
|
17,624
|
|
|
|
2,580
|
|
|
|
20,130
|
|
|
|
551
|
|
|
|
96,377
|
|
|
As of December 31, 2014
|
|
|
|
|
|
|
|
|
|
|
|
|
|
|
|
|
|
|
|
|
|
|
|
|
|
|
|
|
|
Proved properties
|
|
|
46,444
|
|
|
|
69,277
|
|
|
|
17,774
|
|
|
|
8,115
|
|
|
|
30,622
|
|
|
|
1,066
|
|
|
|
173,298
|
|
|
Unproved properties
|
|
|
628
|
|
|
|
5,045
|
|
|
|
8,309
|
|
|
|
566
|
|
|
|
1,730
|
|
|
|
—
|
|
|
|
16,278
|
|
|
Total capitalized costs
|
|
|
47,072
|
|
|
|
74,322
|
|
|
|
26,083
|
|
|
|
8,681
|
|
|
|
32,352
|
|
|
|
1,066
|
|
|
|
189,576
|
|
|
Accumulated depreciation, depletion and amortization
|
|
|
(28,748
|
)
|
|
|
(34,438
|
)
|
|
|
(10,657
|
)
|
|
|
(6,304
|
)
|
|
|
(11,005
|
)
|
|
|
(496
|
)
|
|
|
(91,648
|
)
|
|
Net capitalized costs
|
|
|
18,324
|
|
|
|
39,884
|
|
|
|
15,426
|
|
|
|
2,377
|
|
|
|
21,347
|
|
|
|
570
|
|
|
|
97,928
|
|
|
As of December 31, 2015
|
|
|
|
|
|
|
|
|
|
|
|
|
|
|
|
|
|
|
|
|
|
|
|
|
|
|
|
|
|
Proved properties
|
|
|
44,104
|
|
|
|
77,032
|
|
|
|
19,630
|
|
|
|
9,626
|
|
|
|
33,832
|
|
|
|
1,163
|
|
|
|
185,387
|
|
|
Unproved properties
|
|
|
524
|
|
|
|
4,573
|
|
|
|
8,915
|
|
|
|
1,847
|
|
|
|
1,491
|
|
|
|
4
|
|
|
|
17,354
|
|
|
Total capitalized costs
|
|
|
44,628
|
|
|
|
81,605
|
|
|
|
28,545
|
|
|
|
11,473
|
|
|
|
35,323
|
|
|
|
1,167
|
|
|
|
202,741
|
|
|
Accumulated depreciation, depletion and amortization
|
|
|
(28,064
|
)
|
|
|
(41,737
|
)
|
|
|
(11,488
|
)
|
|
|
(6,805
|
)
|
|
|
(13,924
|
)
|
|
|
(699
|
)
|
|
|
(102,717
|
)
|
|
Net capitalized costs
|
|
|
16,564
|
|
|
|
39,868
|
|
|
|
17,057
|
|
|
|
4,668
|
|
|
|
21,399
|
|
|
|
468
|
|
|
|
100,024
|
|
|
(a)
|
Revision of historical costs out of ASC932 perimeter.
|
|
|
|
|
|
|
|
|
|
|
|
|
|
|
|
|
|
|
|
|
|
|
|
|
|
|
|
|
|
|
|
|
|
Equity affiliates
|
|
|
(M$)
|
|
Europe
|
|
|
Africa
|
|
|
Americas
|
|
|
Middle
East
|
|
|
Asia — CIS
(excl. Russia)
|
|
|
Russia
|
|
|
Total
|
|
|
As of December 31, 2013
|
|
|
|
|
|
|
|
|
|
|
|
|
|
|
|
|
|
|
|
|
|
|
|
|
|
|
|
|
|
Proved properties
|
|
|
—
|
|
|
|
—
|
|
|
|
1,228
|
|
|
|
5,433
|
|
|
|
—
|
|
|
|
6,299
|
|
|
|
12,960
|
|
|
Unproved properties
|
|
|
—
|
|
|
|
—
|
|
|
|
—
|
|
|
|
—
|
|
|
|
—
|
|
|
|
1,687
|
|
|
|
1,687
|
|
|
Total capitalized costs
|
|
|
—
|
|
|
|
—
|
|
|
|
1,228
|
|
|
|
5,433
|
|
|
|
—
|
|
|
|
7,986
|
|
|
|
14,647
|
|
|
Accumulated depreciation, depletion and amortization
|
|
|
—
|
|
|
|
—
|
|
|
|
(221
|
)
|
|
|
(4,015
|
)
|
|
|
—
|
|
|
|
(890
|
)
|
|
|
(5,126
|
)
|
|
Net capitalized costs
|
|
|
—
|
|
|
|
—
|
|
|
|
1,007
|
|
|
|
1,418
|
|
|
|
—
|
|
|
|
7,096
|
|
|
|
9,521
|
|
|
As of December 31, 2014
|
|
|
|
|
|
|
|
|
|
|
|
|
|
|
|
|
|
|
|
|
|
|
|
|
|
|
|
|
|
Proved properties
|
|
|
—
|
|
|
|
—
|
|
|
|
1,411
|
|
|
|
5,916
|
|
|
|
—
|
|
|
|
4,347
|
|
|
|
11,674
|
|
|
Unproved properties
|
|
|
—
|
|
|
|
—
|
|
|
|
—
|
|
|
|
—
|
|
|
|
—
|
|
|
|
895
|
|
|
|
895
|
|
|
Total capitalized costs
|
|
|
—
|
|
|
|
—
|
|
|
|
1,411
|
|
|
|
5,916
|
|
|
|
—
|
|
|
|
5,242
|
|
|
|
12,569
|
|
|
Accumulated depreciation, depletion and amortization
|
|
|
—
|
|
|
|
—
|
|
|
|
(310
|
)
|
|
|
(4,764
|
)
|
|
|
—
|
|
|
|
(635
|
)
|
|
|
(5,709
|
)
|
|
Net capitalized costs
|
|
|
—
|
|
|
|
—
|
|
|
|
1,101
|
|
|
|
1,152
|
|
|
|
—
|
|
|
|
4,607
|
|
|
|
6,860
|
|
|
As of December 31, 2015
|
|
|
|
|
|
|
|
|
|
|
|
|
|
|
|
|
|
|
|
|
|
|
|
|
|
|
|
|
|
Proved properties
|
|
|
—
|
|
|
|
—
|
|
|
|
1,500
|
|
|
|
4,323
|
|
|
|
—
|
|
|
|
4,573
|
|
|
|
10,396
|
|
|
Unproved properties
|
|
|
—
|
|
|
|
—
|
|
|
|
—
|
|
|
|
—
|
|
|
|
—
|
|
|
|
202
|
|
|
|
202
|
|
|
Total capitalized costs
|
|
|
—
|
|
|
|
—
|
|
|
|
1,500
|
|
|
|
4,323
|
|
|
|
—
|
|
|
|
4,775
|
|
|
|
10,598
|
|
|
Accumulated depreciation, depletion and amortization
|
|
|
—
|
|
|
|
—
|
|
|
|
(403
|
)
|
|
|
(3,192
|
)
|
|
|
—
|
|
|
|
(655
|
)
|
|
|
(4,250
|
)
|
|
Net capitalized costs
|
|
|
—
|
|
|
|
—
|
|
|
|
1,097
|
|
|
|
1,131
|
|
|
|
—
|
|
|
|
4,120
|
|
|
|
6,348
|
|
|
|
|
|
|
2015 Form 20-F TOTAL S.A.
|
|
S-13
|
|
1.8.
|
Standardized measure of discounted future net cash flows (excluding transportation)
|
The standardized measure of discounted future net cash flows relating to proved oil and gas reserve quantities was developed as follows:
|
|
–
|
|
estimates of proved reserves and the corresponding production profiles are based on existing technical and economic conditions;
|
|
|
–
|
|
the estimated future cash flows are determined based on prices used in estimating the Group’s proved oil and gas reserves;
|
|
|
–
|
|
the future cash flows incorporate estimated production costs (including production taxes), future development costs and asset retirement costs. All cost
estimates are based on year-end technical and economic conditions;
|
|
|
–
|
|
future income taxes are computed by applying the year-end statutory tax rate to future net cash flows after consideration of permanent differences and future
income tax credits; and
|
|
|
–
|
|
future net cash flows are discounted at a standard discount rate of 10 percent.
|
These principles applied are those required by ASC 932 and do not reflect the expectations of real revenues from these reserves, nor their present value; hence, they do not constitute criteria for investment
decisions. An estimate of the fair value of reserves should also take into account, among other things, the recovery of reserves not presently classified as proved, anticipated future changes in prices and costs and a discount factor more
representative of the time value of money and the risks inherent in reserves estimates.
|
|
|
|
|
|
|
|
|
|
|
|
|
|
|
|
|
|
|
|
|
|
|
|
|
|
|
|
|
|
|
|
|
Consolidated subsidiaries
|
|
|
(M$)
|
|
Europe
|
|
|
Africa
|
|
|
Americas
|
|
|
Middle
East
|
|
|
Asia — CIS
(excl. Russia)
|
|
|
Russia
|
|
|
Total
|
|
|
As of December 31, 2013
|
|
|
|
|
|
|
|
|
|
|
|
|
|
|
|
|
|
|
|
|
|
|
|
|
|
|
|
|
|
Future cash inflows
|
|
|
106,968
|
|
|
|
205,741
|
|
|
|
78,813
|
|
|
|
19,413
|
|
|
|
93,404
|
|
|
|
2,332
|
|
|
|
506,671
|
|
|
Future production costs
|
|
|
(24,973
|
)
|
|
|
(50,531
|
)
|
|
|
(36,172
|
)
|
|
|
(6,950
|
)
|
|
|
(18,548
|
)
|
|
|
(1,456
|
)
|
|
|
(138,630
|
)
|
|
Future development costs
|
|
|
(30,534
|
)
|
|
|
(34,364
|
)
|
|
|
(18,844
|
)
|
|
|
(4,282
|
)
|
|
|
(16,570
|
)
|
|
|
(526
|
)
|
|
|
(105,120
|
)
|
|
Future income taxes
|
|
|
(27,307
|
)
|
|
|
(73,232
|
)
|
|
|
(5,190
|
)
|
|
|
(3,030
|
)
|
|
|
(14,946
|
)
|
|
|
(219
|
)
|
|
|
(123,924
|
)
|
|
Future net cash flows, after income taxes
|
|
|
24,154
|
|
|
|
47,614
|
|
|
|
18,607
|
|
|
|
5,151
|
|
|
|
43,340
|
|
|
|
131
|
|
|
|
138,997
|
|
|
Discount at 10%
|
|
|
(10,813
|
)
|
|
|
(19,397
|
)
|
|
|
(15,304
|
)
|
|
|
(2,490
|
)
|
|
|
(27,670
|
)
|
|
|
(49
|
)
|
|
|
(75,723
|
)
|
|
Standardized measure of discounted future net cash flows
|
|
|
13,341
|
|
|
|
28,217
|
|
|
|
3,303
|
|
|
|
2,661
|
|
|
|
15,670
|
|
|
|
82
|
|
|
|
63,274
|
|
|
As of December 31, 2014
|
|
|
|
|
|
|
|
|
|
|
|
|
|
|
|
|
|
|
|
|
|
|
|
|
|
|
|
|
|
Future cash inflows
|
|
|
87,950
|
|
|
|
184,975
|
|
|
|
87,965
|
|
|
|
17,214
|
|
|
|
86,184
|
|
|
|
2,294
|
|
|
|
466,582
|
|
|
Future production costs
|
|
|
(23,722
|
)
|
|
|
(49,796
|
)
|
|
|
(38,776
|
)
|
|
|
(6,240
|
)
|
|
|
(16,700
|
)
|
|
|
(1,255
|
)
|
|
|
(136,489
|
)
|
|
Future development costs
|
|
|
(28,529
|
)
|
|
|
(35,683
|
)
|
|
|
(16,728
|
)
|
|
|
(3,534
|
)
|
|
|
(12,177
|
)
|
|
|
(780
|
)
|
|
|
(97,431
|
)
|
|
Future income taxes
|
|
|
(15,363
|
)
|
|
|
(59,063
|
)
|
|
|
(5,891
|
)
|
|
|
(2,881
|
)
|
|
|
(13,475
|
)
|
|
|
(172
|
)
|
|
|
(96,845
|
)
|
|
Future net cash flows, after income taxes
|
|
|
20,336
|
|
|
|
40,433
|
|
|
|
26,570
|
|
|
|
4,559
|
|
|
|
43,832
|
|
|
|
87
|
|
|
|
135,817
|
|
|
Discount at 10%
|
|
|
(7,928
|
)
|
|
|
(16,026
|
)
|
|
|
(19,489
|
)
|
|
|
(2,173
|
)
|
|
|
(29,422
|
)
|
|
|
(5
|
)
|
|
|
(75,043
|
)
|
|
Standardized measure of discounted future net cash flows
|
|
|
12,408
|
|
|
|
24,407
|
|
|
|
7,081
|
|
|
|
2,386
|
|
|
|
14,410
|
|
|
|
82
|
|
|
|
60,774
|
|
|
As of December 31, 2015
|
|
|
|
|
|
|
|
|
|
|
|
|
|
|
|
|
|
|
|
|
|
|
|
|
|
|
|
|
|
Future cash inflows
|
|
|
46,490
|
|
|
|
76,719
|
|
|
|
40,866
|
|
|
|
55,819
|
|
|
|
49,825
|
|
|
|
1,045
|
|
|
|
270,764
|
|
|
Future production costs
|
|
|
(14,787
|
)
|
|
|
(28,159
|
)
|
|
|
(24,103
|
)
|
|
|
(45,806
|
)
|
|
|
(13,831
|
)
|
|
|
(512
|
)
|
|
|
(127,198
|
)
|
|
Future development costs
|
|
|
(17,956
|
)
|
|
|
(25,035
|
)
|
|
|
(11,104
|
)
|
|
|
(4,907
|
)
|
|
|
(8,751
|
)
|
|
|
(495
|
)
|
|
|
(68,248
|
)
|
|
Future income taxes
|
|
|
(6,720
|
)
|
|
|
(12,479
|
)
|
|
|
(1,105
|
)
|
|
|
(1,409
|
)
|
|
|
(3,843
|
)
|
|
|
(28
|
)
|
|
|
(25,584
|
)
|
|
Future net cash flows, after income taxes
|
|
|
7,027
|
|
|
|
11,046
|
|
|
|
4,554
|
|
|
|
3,697
|
|
|
|
23,400
|
|
|
|
10
|
|
|
|
49,734
|
|
|
Discount at 10%
|
|
|
(887
|
)
|
|
|
(3,550
|
)
|
|
|
(4,014
|
)
|
|
|
(2,095
|
)
|
|
|
(15,195
|
)
|
|
|
18
|
|
|
|
(25,723
|
)
|
|
Standardized measure of discounted future net cash flows
|
|
|
6,140
|
|
|
|
7,496
|
|
|
|
540
|
|
|
|
1,602
|
|
|
|
8,205
|
|
|
|
28
|
|
|
|
24,011
|
|
|
|
|
|
|
|
|
|
|
|
(M$)
Minority interests in future net cash flows as of
|
|
|
|
|
|
|
|
|
|
|
|
|
|
|
|
|
|
|
|
|
|
|
|
|
|
|
|
|
|
As of December 31, 2013
|
|
|
—
|
|
|
|
808
|
|
|
|
—
|
|
|
|
—
|
|
|
|
—
|
|
|
|
—
|
|
|
|
808
|
|
|
As of December 31, 2014
|
|
|
—
|
|
|
|
1,103
|
|
|
|
—
|
|
|
|
—
|
|
|
|
—
|
|
|
|
—
|
|
|
|
1,103
|
|
|
As of December 31, 2015
|
|
|
—
|
|
|
|
448
|
|
|
|
—
|
|
|
|
—
|
|
|
|
—
|
|
|
|
—
|
|
|
|
448
|
|
|
|
|
|
|
S-14
|
|
TOTAL S.A. Form 20-F 2015
|
|
|
|
|
|
|
|
|
|
|
|
|
|
|
|
|
|
|
|
|
|
|
|
|
|
|
|
|
|
|
|
|
|
|
|
|
Equity affiliates
|
|
|
(M$)
|
|
Europe
|
|
|
Africa
|
|
|
Americas
|
|
|
Middle
East
|
|
|
Asia — CIS
(excl. Russia)
|
|
|
Russia
|
|
|
Total
|
|
|
As of December 31, 2013
|
|
|
|
|
|
|
|
|
|
|
|
|
|
|
|
|
|
|
|
|
|
|
|
|
|
|
|
|
|
Future cash inflows
|
|
|
—
|
|
|
|
1,337
|
|
|
|
19,690
|
|
|
|
74,872
|
|
|
|
—
|
|
|
|
37,237
|
|
|
|
133,136
|
|
|
Future production costs
|
|
|
—
|
|
|
|
(139
|
)
|
|
|
(11,975
|
)
|
|
|
(38,526
|
)
|
|
|
—
|
|
|
|
(12,555
|
)
|
|
|
(63,195
|
)
|
|
Future development costs
|
|
|
—
|
|
|
|
—
|
|
|
|
(1,675
|
)
|
|
|
(3,388
|
)
|
|
|
—
|
|
|
|
(5,119
|
)
|
|
|
(10,182
|
)
|
|
Future income taxes
|
|
|
—
|
|
|
|
(347
|
)
|
|
|
(2,865
|
)
|
|
|
(6,722
|
)
|
|
|
—
|
|
|
|
(2,189
|
)
|
|
|
(12,123
|
)
|
|
Future net cash flows, after income taxes
|
|
|
—
|
|
|
|
851
|
|
|
|
3,175
|
|
|
|
26,236
|
|
|
|
—
|
|
|
|
17,374
|
|
|
|
47,636
|
|
|
Discount at 10%
|
|
|
—
|
|
|
|
(636
|
)
|
|
|
(1,871
|
)
|
|
|
(13,402
|
)
|
|
|
—
|
|
|
|
(16,308
|
)
|
|
|
(32,217
|
)
|
|
Standardized measure of discounted future net cash flows
|
|
|
—
|
|
|
|
215
|
|
|
|
1,304
|
|
|
|
12,834
|
|
|
|
—
|
|
|
|
1,066
|
|
|
|
15,419
|
|
|
As of December 31, 2014
|
|
|
|
|
|
|
|
|
|
|
|
|
|
|
|
|
|
|
|
|
|
|
|
|
|
|
|
|
|
Future cash inflows
|
|
|
—
|
|
|
|
1,698
|
|
|
|
16,209
|
|
|
|
68,109
|
|
|
|
—
|
|
|
|
45,472
|
|
|
|
131,488
|
|
|
Future production costs
|
|
|
—
|
|
|
|
—
|
|
|
|
(9,393
|
)
|
|
|
(36,848
|
)
|
|
|
—
|
|
|
|
(13,536
|
)
|
|
|
(59,777
|
)
|
|
Future development costs
|
|
|
—
|
|
|
|
(132
|
)
|
|
|
(1,683
|
)
|
|
|
(3,814
|
)
|
|
|
—
|
|
|
|
(3,190
|
)
|
|
|
(8,819
|
)
|
|
Future income taxes
|
|
|
—
|
|
|
|
(630
|
)
|
|
|
(1,327
|
)
|
|
|
(5,525
|
)
|
|
|
—
|
|
|
|
(3,886
|
)
|
|
|
(11,368
|
)
|
|
Future net cash flows, after income taxes
|
|
|
—
|
|
|
|
936
|
|
|
|
3,806
|
|
|
|
21,922
|
|
|
|
—
|
|
|
|
24,860
|
|
|
|
51,524
|
|
|
Discount at 10%
|
|
|
—
|
|
|
|
(575
|
)
|
|
|
(2,078
|
)
|
|
|
(10,331
|
)
|
|
|
—
|
|
|
|
(19,447
|
)
|
|
|
(32,431
|
)
|
|
Standardized measure of discounted future net cash flows
|
|
|
—
|
|
|
|
361
|
|
|
|
1,728
|
|
|
|
11,591
|
|
|
|
—
|
|
|
|
5,413
|
|
|
|
19,093
|
|
|
As of December 31, 2015
|
|
|
|
|
|
|
|
|
|
|
|
|
|
|
|
|
|
|
|
|
|
|
|
|
|
|
|
|
|
Future cash inflows
|
|
|
—
|
|
|
|
52
|
|
|
|
7,736
|
|
|
|
36,231
|
|
|
|
—
|
|
|
|
21,779
|
|
|
|
65,798
|
|
|
Future production costs
|
|
|
—
|
|
|
|
—
|
|
|
|
(2,884
|
)
|
|
|
(16,814
|
)
|
|
|
—
|
|
|
|
(7,973
|
)
|
|
|
(27,671
|
)
|
|
Future development costs
|
|
|
—
|
|
|
|
(28
|
)
|
|
|
(547
|
)
|
|
|
(2,638
|
)
|
|
|
—
|
|
|
|
(1,146
|
)
|
|
|
(4,359
|
)
|
|
Future income taxes
|
|
|
—
|
|
|
|
(29
|
)
|
|
|
(918
|
)
|
|
|
(2,818
|
)
|
|
|
—
|
|
|
|
(3,540
|
)
|
|
|
(7,305
|
)
|
|
Future net cash flows, after income taxes
|
|
|
—
|
|
|
|
(5
|
)
|
|
|
3,387
|
|
|
|
13,961
|
|
|
|
—
|
|
|
|
9,120
|
|
|
|
26,463
|
|
|
Discount at 10%
|
|
|
—
|
|
|
|
(98
|
)
|
|
|
(1,759
|
)
|
|
|
(7,009
|
)
|
|
|
—
|
|
|
|
(8,116
|
)
|
|
|
(16,982
|
)
|
|
Standardized measure of discounted future net cash flows
|
|
|
—
|
|
|
|
(103
|
)
|
|
|
1,628
|
|
|
|
6,952
|
|
|
|
—
|
|
|
|
1,004
|
|
|
|
9,481
|
|
|
1.9.
|
Changes in the standardized measure of discounted future net cash flows
|
|
|
|
|
|
|
|
|
|
|
|
|
|
|
|
|
|
Consolidated subsidiaries
|
|
|
(M$)
|
|
2013
|
|
|
2014
|
|
|
2015
|
|
|
Beginning of year
|
|
|
67,152
|
|
|
|
63,274
|
|
|
|
60,774
|
|
|
Sales and transfers, net of production costs
|
|
|
(32,860
|
)
|
|
|
(26,647
|
)
|
|
|
(14,209
|
)
|
|
Net change in sales and transfer prices and in production costs and other expenses
|
|
|
(8,007
|
)
|
|
|
(16,703
|
)
|
|
|
(88,615
|
)
|
|
Extensions, discoveries and improved recovery
|
|
|
1,106
|
|
|
|
1,912
|
|
|
|
933
|
|
|
Changes in estimated future development costs
|
|
|
(10,803
|
)
|
|
|
(5,407
|
)
|
|
|
4,412
|
|
|
Previously estimated development costs incurred during the year
|
|
|
18,218
|
|
|
|
21,484
|
|
|
|
19,694
|
|
|
Revisions of previous quantity estimates
|
|
|
1,511
|
|
|
|
(1,505
|
)
|
|
|
(4,800
|
)
|
|
Accretion of discount
|
|
|
6,715
|
|
|
|
6,327
|
|
|
|
6,077
|
|
|
Net change in income taxes
|
|
|
20,178
|
|
|
|
20,116
|
|
|
|
42,252
|
|
|
Purchases of reserves in place
|
|
|
1,459
|
|
|
|
26
|
|
|
|
—
|
|
|
Sales of reserves in place
|
|
|
(1,395
|
)
|
|
|
(2,103
|
)
|
|
|
(2,507
|
)
|
|
End of year
|
|
|
63,274
|
|
|
|
60,774
|
|
|
|
24,011
|
|
|
|
|
|
|
|
Equity affiliates
|
|
|
(M$)
|
|
2013
|
|
|
2014
|
|
|
2015
|
|
|
Beginning of year
|
|
|
15,891
|
|
|
|
15,419
|
|
|
|
19,093
|
|
|
Sales and transfers, net of production costs
|
|
|
(3,723
|
)
|
|
|
(3,639
|
)
|
|
|
(1,860
|
)
|
|
Net change in sales and transfer prices and in production costs and other expenses
|
|
|
(1,056
|
)
|
|
|
(1,546
|
)
|
|
|
(14,821
|
)
|
|
Extensions, discoveries and improved recovery
|
|
|
4,980
|
|
|
|
4,444
|
|
|
|
—
|
|
|
Changes in estimated future development costs
|
|
|
540
|
|
|
|
190
|
|
|
|
1,572
|
|
|
Previously estimated development costs incurred during the year
|
|
|
1,101
|
|
|
|
1,330
|
|
|
|
1,272
|
|
|
Revisions of previous quantity estimates
|
|
|
(5,020
|
)
|
|
|
19
|
|
|
|
315
|
|
|
Accretion of discount
|
|
|
1,589
|
|
|
|
1,542
|
|
|
|
1,909
|
|
|
Net change in income taxes
|
|
|
1,107
|
|
|
|
834
|
|
|
|
1,881
|
|
|
Purchases of reserves in place
|
|
|
520
|
|
|
|
543
|
|
|
|
186
|
|
|
Sales of reserves in place
|
|
|
(510
|
)
|
|
|
(43
|
)
|
|
|
(66
|
)
|
|
End of year
|
|
|
15,419
|
|
|
|
19,093
|
|
|
|
9,481
|
|
|
|
|
|
|
2015 Form 20-F TOTAL S.A.
|
|
S-15
|
|
2.1.
|
Net gas production, production prices and production costs
|
|
|
|
|
|
|
|
|
|
|
|
|
|
|
|
|
|
|
|
|
|
|
|
|
|
|
|
|
|
|
|
|
|
Consolidated subsidiaries
|
|
|
|
|
Europe
|
|
|
Africa
|
|
|
Americas
|
|
|
Middle
East
|
|
|
Asia — CIS
(excl. Russia)
|
|
|
Russia
|
|
|
Total
|
|
|
2013
|
|
|
|
|
|
|
|
|
|
|
|
|
|
|
|
|
|
|
|
|
|
|
|
|
|
|
|
|
|
Natural gas production available for sale (Mcf/d)
(a)
|
|
|
1,134
|
|
|
|
569
|
|
|
|
860
|
|
|
|
149
|
|
|
|
1,193
|
|
|
|
—
|
|
|
|
3,905
|
|
|
Production
prices
(b)
|
|
|
|
|
|
|
|
|
|
|
|
|
|
|
|
|
|
|
|
|
|
|
|
|
|
|
|
|
|
Oil ($/b)
|
|
|
97.75
|
|
|
|
102.67
|
|
|
|
65.94
|
|
|
|
98.57
|
|
|
|
95.32
|
|
|
|
85.20
|
|
|
|
99.34
|
|
|
Bitumen ($/b)
|
|
|
—
|
|
|
|
—
|
|
|
|
45.73
|
|
|
|
—
|
|
|
|
—
|
|
|
|
—
|
|
|
|
45.73
|
|
|
Natural gas ($/kcf)
|
|
|
9.52
|
|
|
|
2.65
|
|
|
|
3.53
|
|
|
|
1.13
|
|
|
|
10.15
|
|
|
|
—
|
|
|
|
7.02
|
|
|
Production costs per unit of production ($/boe)
(c)
|
|
|
|
|
|
|
|
|
|
|
|
|
|
|
|
|
|
|
|
|
|
|
|
|
|
|
|
|
|
Total liquids and natural gas
|
|
|
12.91
|
|
|
|
8.39
|
|
|
|
5.68
|
|
|
|
17.17
|
|
|
|
6.13
|
|
|
|
12.19
|
|
|
|
9.24
|
|
|
Bitumen
|
|
|
—
|
|
|
|
—
|
|
|
|
31.74
|
|
|
|
—
|
|
|
|
—
|
|
|
|
—
|
|
|
|
31.74
|
|
|
|
|
|
|
|
Equity affiliates
|
|
|
|
|
Europe
|
|
|
Africa
|
|
|
Americas
|
|
|
Middle
East
|
|
|
Asia — CIS
(excl. Russia)
|
|
|
Russia
(d)
|
|
|
Total
|
|
|
2013
|
|
|
|
|
|
|
|
|
|
|
|
|
|
|
|
|
|
|
|
|
|
|
|
|
|
|
|
|
|
Natural gas production available for sale (Mcf/d)
(a)
|
|
|
—
|
|
|
|
—
|
|
|
|
—
|
|
|
|
942
|
|
|
|
—
|
|
|
|
927
|
|
|
|
1,869
|
|
|
Production
prices
(b)
|
|
|
|
|
|
|
|
|
|
|
|
|
|
|
|
|
|
|
|
|
|
|
|
|
|
|
|
|
|
Oil ($/b)
|
|
|
—
|
|
|
|
—
|
|
|
|
82.47
|
|
|
|
104.42
|
|
|
|
—
|
|
|
|
53.81
|
|
|
|
99.70
|
|
|
Bitumen ($/b)
|
|
|
—
|
|
|
|
—
|
|
|
|
—
|
|
|
|
—
|
|
|
|
—
|
|
|
|
—
|
|
|
|
—
|
|
|
Natural gas ($/kcf)
|
|
|
—
|
|
|
|
—
|
|
|
|
—
|
|
|
|
2.36
|
|
|
|
—
|
|
|
|
1.60
|
|
|
|
2.16
|
|
|
Production costs per unit of production ($/boe)
(c)
|
|
|
|
|
|
|
|
|
|
|
|
|
|
|
|
|
|
|
|
|
|
|
|
|
|
|
|
|
|
Total liquids and natural gas
|
|
|
—
|
|
|
|
—
|
|
|
|
8.31
|
|
|
|
2.97
|
|
|
|
—
|
|
|
|
0.78
|
|
|
|
2.61
|
|
|
Bitumen
|
|
|
—
|
|
|
|
—
|
|
|
|
—
|
|
|
|
—
|
|
|
|
—
|
|
|
|
—
|
|
|
|
—
|
|
|
|
|
|
|
|
Consolidated subsidiaries
|
|
|
|
|
Europe
|
|
|
Africa
|
|
|
Americas
|
|
|
Middle
East
|
|
|
Asia — CIS
(excl. Russia)
|
|
|
Russia
|
|
|
Total
|
|
|
2014
|
|
|
|
|
|
|
|
|
|
|
|
|
|
|
|
|
|
|
|
|
|
|
|
|
|
|
|
|
|
Natural gas production available for sale (Mcf/d)
(a)
|
|
|
1,008
|
|
|
|
567
|
|
|
|
849
|
|
|
|
156
|
|
|
|
1,179
|
|
|
|
—
|
|
|
|
3,759
|
|
|
Production
prices
(b)
|
|
|
|
|
|
|
|
|
|
|
|
|
|
|
|
|
|
|
|
|
|
|
|
|
|
|
|
|
|
Oil ($/b)
|
|
|
85.57
|
|
|
|
89.97
|
|
|
|
60.38
|
|
|
|
88.34
|
|
|
|
86.51
|
|
|
|
81.38
|
|
|
|
87.26
|
|
|
Bitumen ($/b)
|
|
|
—
|
|
|
|
—
|
|
|
|
42.83
|
|
|
|
—
|
|
|
|
—
|
|
|
|
—
|
|
|
|
42.83
|
|
|
Natural gas ($/kcf)
|
|
|
7.93
|
|
|
|
2.64
|
|
|
|
3.56
|
|
|
|
1.16
|
|
|
|
9.32
|
|
|
|
—
|
|
|
|
6.34
|
|
|
Production costs per unit of production ($/boe)
(c)
|
|
|
|
|
|
|
|
|
|
|
|
|
|
|
|
|
|
|
|
|
|
|
|
|
|
|
|
|
|
Total liquids and natural gas
|
|
|
13.57
|
|
|
|
9.60
|
|
|
|
6.24
|
|
|
|
17.41
|
|
|
|
8.40
|
|
|
|
14.72
|
|
|
|
10.31
|
|
|
Bitumen
|
|
|
—
|
|
|
|
—
|
|
|
|
42.04
|
|
|
|
—
|
|
|
|
—
|
|
|
|
—
|
|
|
|
42.04
|
|
|
|
|
|
|
|
Equity affiliates
|
|
|
|
|
Europe
|
|
|
Africa
|
|
|
Americas
|
|
|
Middle
East
|
|
|
Asia — CIS
(excl. Russia)
|
|
|
Russia
(d)
|
|
|
Total
|
|
|
2014
|
|
|
|
|
|
|
|
|
|
|
|
|
|
|
|
|
|
|
|
|
|
|
|
|
|
|
|
|
|
Natural gas production available for sale (Mcf/d)
(a)
|
|
|
—
|
|
|
|
—
|
|
|
|
—
|
|
|
|
872
|
|
|
|
—
|
|
|
|
1,059
|
|
|
|
1,931
|
|
|
Production
prices
(b)
|
|
|
|
|
|
|
|
|
|
|
|
|
|
|
|
|
|
|
|
|
|
|
|
|
|
|
|
|
|
Oil ($/b)
|
|
|
—
|
|
|
|
—
|
|
|
|
85.72
|
|
|
|
88.92
|
|
|
|
—
|
|
|
|
54.19
|
|
|
|
87.51
|
|
|
Bitumen ($/b)
|
|
|
—
|
|
|
|
—
|
|
|
|
—
|
|
|
|
—
|
|
|
|
—
|
|
|
|
—
|
|
|
|
—
|
|
|
Natural gas ($/kcf)
|
|
|
—
|
|
|
|
—
|
|
|
|
—
|
|
|
|
3.37
|
|
|
|
—
|
|
|
|
2.35
|
|
|
|
3.02
|
|
|
Production costs per unit of production ($/boe)
(c)
|
|
|
|
|
|
|
|
|
|
|
|
|
|
|
|
|
|
|
|
|
|
|
|
|
|
|
|
|
|
Total liquids and natural gas
|
|
|
—
|
|
|
|
—
|
|
|
|
9.19
|
|
|
|
2.86
|
|
|
|
—
|
|
|
|
1.48
|
|
|
|
2.72
|
|
|
Bitumen
|
|
|
—
|
|
|
|
—
|
|
|
|
—
|
|
|
|
—
|
|
|
|
—
|
|
|
|
—
|
|
|
|
—
|
|
|
|
|
|
|
S-16
|
|
TOTAL S.A. Form 20-F 2015
|
|
|
|
|
|
|
|
|
|
|
|
|
|
|
|
|
|
|
|
|
|
|
|
|
|
|
|
|
|
|
|
|
|
Consolidated subsidiaries
|
|
|
|
|
Europe
|
|
|
Africa
|
|
|
Americas
|
|
|
Middle
East
|
|
|
Asia — CIS
(excl. Russia)
|
|
|
Russia
|
|
|
Total
|
|
|
2015
|
|
|
|
|
|
|
|
|
|
|
|
|
|
|
|
|
|
|
|
|
|
|
|
|
|
|
|
|
|
Natural gas production available for sale (Mcf/d)
(a)
|
|
|
1,091
|
|
|
|
557
|
|
|
|
872
|
|
|
|
166
|
|
|
|
1,230
|
|
|
|
—
|
|
|
|
3,916
|
|
|
Production
prices
(b)
|
|
|
|
|
|
|
|
|
|
|
|
|
|
|
|
|
|
|
|
|
|
|
|
|
|
|
|
|
|
Oil ($/b)
|
|
|
45.90
|
|
|
|
44.71
|
|
|
|
25.68
|
|
|
|
49.65
|
|
|
|
47.43
|
|
|
|
39.83
|
|
|
|
45.12
|
|
|
Bitumen ($/b)
|
|
|
—
|
|
|
|
—
|
|
|
|
12.16
|
|
|
|
—
|
|
|
|
—
|
|
|
|
—
|
|
|
|
12.16
|
|
|
Natural gas ($/kcf)
|
|
|
6.00
|
|
|
|
1.97
|
|
|
|
2.53
|
|
|
|
1.16
|
|
|
|
6.62
|
|
|
|
—
|
|
|
|
4.65
|
|
|
Production costs per unit of production ($/boe)
(c)
|
|
|
|
|
|
|
|
|
|
|
|
|
|
|
|
|
|
|
|
|
|
|
|
|
|
|
|
|
|
Total liquids and natural gas
|
|
|
11.25
|
|
|
|
7.74
|
|
|
|
6.35
|
|
|
|
6.67
|
|
|
|
5.45
|
|
|
|
9.77
|
|
|
|
7.84
|
|
|
Bitumen
|
|
|
—
|
|
|
|
—
|
|
|
|
37.92
|
|
|
|
—
|
|
|
|
—
|
|
|
|
—
|
|
|
|
37.92
|
|
|
|
|
|
|
|
Equity affiliates
|
|
|
|
|
Europe
|
|
|
Africa
|
|
|
Americas
|
|
|
Middle
East
|
|
|
Asia —CIS
(excl. Russia)
|
|
|
Russia
|
|
|
Total
|
|
|
2015
|
|
|
|
|
|
|
|
|
|
|
|
|
|
|
|
|
|
|
|
|
|
|
|
|
|
|
|
|
|
Natural gas production available for sale (Mcf/d)
(a)
|
|
|
—
|
|
|
|
—
|
|
|
|
—
|
|
|
|
548
|
|
|
|
—
|
|
|
|
1,228
|
|
|
|
1,776
|
|
|
Production
prices
(b)
|
|
|
|
|
|
|
|
|
|
|
|
|
|
|
|
|
|
|
|
|
|
|
|
|
|
|
|
|
|
Oil ($/b)
|
|
|
—
|
|
|
|
—
|
|
|
|
32.20
|
|
|
|
50.33
|
|
|
|
—
|
|
|
|
25.37
|
|
|
|
43.92
|
|
|
Bitumen ($/b)
|
|
|
—
|
|
|
|
—
|
|
|
|
—
|
|
|
|
—
|
|
|
|
—
|
|
|
|
—
|
|
|
|
—
|
|
|
Natural gas ($/kcf)
|
|
|
—
|
|
|
|
—
|
|
|
|
—
|
|
|
|
1.00
|
|
|
|
—
|
|
|
|
1.23
|
|
|
|
1.08
|
|
|
Production costs per unit of production ($/boe)
(c)
|
|
|
|
|
|
|
|
|
|
|
|
|
|
|
|
|
|
|
|
|
|
|
|
|
|
|
|
|
|
Total liquids and natural gas
|
|
|
—
|
|
|
|
—
|
|
|
|
4.05
|
|
|
|
3.40
|
|
|
|
—
|
|
|
|
1.26
|
|
|
|
2.37
|
|
|
Bitumen
|
|
|
—
|
|
|
|
—
|
|
|
|
—
|
|
|
|
—
|
|
|
|
—
|
|
|
|
—
|
|
|
|
—
|
|
|
(a)
|
The reported volumes are different from those shown in the reserves table due to gas consumed in operations.
|
|
(b)
|
The volumes used for calculation of the average sales prices are the ones sold from the Group’s own production.
|
|
(c)
|
The volumes of liquids used for this computation are shown in the proved reserves tables of this report. The reported volumes for natural gas are different
from those shown in the reserves table due to gas consumed in operations.
|
|
(d)
|
Perimeter correction.
|
|
|
|
|
|
2015 Form 20-F TOTAL S.A.
|
|
S-17
|
|
3.
|
Report on the payments made to governments (Article L. 225-102-3 of the French Commercial Code)
|
Article L. 225-102-3 of the French Commercial Code
(1)
(1) requires that large undertakings and public-interest entities that are active in the extractive industry or logging of primary forests disclose in an annual report
payments of at least
€
100,000 made to governments in the countries in which they operate.
The consolidated report of TOTAL is presented below pursuant to the aforementioned provisions. This report covers the aforementioned payments made by the
Group’s extractive companies as defined below, for the benefit of each government of states or territories in which TOTAL carries out its activities, by detailing the total amount of payments made, the total amount by payment type, the total
amount by project and the total amount by payment type for each project.
This report has been approved by the Board of Directors of TOTAL S.A.
Definitions
The meaning of
certain terms used in this report are set forth below:
Extractive Companies:
TOTAL S.A. and any company or undertaking of which the activities
consist, in whole or in part, of the exploration, prospection, discovery, development and extraction of minerals, crude oil and natural gas, amongst others, fully consolidated by TOTAL S.A.
Payment:
a single payment or multiple interconnected payments of an amount equal to, or in excess of,
€
100,000 (or its equivalent) paid, whether in money or in kind, for extractives activities.
Payment types included in this report are the following:
|
•
|
|
Taxes:
taxes and levies paid on income, production or profits, excluding taxes levied on consumption such as value added taxes, custom duties, personal
income taxes and sales taxes.
|
|
•
|
|
Royalties:
percentage of production payable to the owner of mineral rights.
|
|
•
|
|
License Fees:
license fees, surface or rental fees, and other consideration for licenses and/or concessions that are paid for access to the area where the
extractive activities will be conducted.
|
|
•
|
|
License Bonus:
bonuses paid for and in consideration of signature, discovery, production, awards, grants and transfers of extraction rights; bonuses
related to achievement or failure
|
|
|
|
to achieve certain production levels or certain targets, and discovery of additional mineral reserves / deposits.
|
|
•
|
|
Dividends:
dividends paid to a host government holding an interest in an Extractive Company.
|
|
•
|
|
Payments for infrastructure improvements:
payments for local development, including the improvement of infrastructure, not directly necessary for the
conduct of extractive activities but mandatory pursuant to the terms of a production sharing contract or to the terms of a law relating to oil and gas activities.
|
|
•
|
|
Production entitlement:
host Government’s share of production. This payment is generally made in kind. It does not include the working interest
production share of government-owned companies where said companies are acting as partners in a joint venture.
|
Government:
any
national, regional or local authority of a country or territory, or any department, agency or undertaking controlled by that authority.
Project:
operational activities governed by a single contract, license, lease, concession or similar legal agreement and that form the basis for payment liabilities with a Government. If multiple such agreements are substantially interconnected, they shall
be considered as a single Project. Payments (such as company income tax when it concerns several projects which cannot be separated in application of the fiscal regulations) unable to be attributed to a Project are disclosed under the item
“non-attributable”.
Reporting Principles
This report sets forth all payments as booked in the Extractive Companies’ accounts.
Production entitlement and
Royalties that are mandatorily paid in kind and that are owed to host Governments pursuant to legal or contractual provisions (not booked in the Extractive Companies’ accounts pursuant to the accounting standards) are reported in proportion to
the interest held by the Extractive Company in the Project as of the date on which such Production entitlements and Royalties are deemed to be acquired.
Payments in kind are estimated at fair value. Fair value corresponds to the contractual price of oil and gas used to calculate Production entitlement, market price
(if available) or an appropriate benchmark price. These prices might be calculated on an averaged basis over a given period.
|
|
|
|
|
S-18
|
|
TOTAL S.A. Form 20-F 2015
|
|
(1
)
|
Article L. 225-102-3 of the French Commercial Code transposes certain provisions set out in Directive 2013/34/EU of the European Parliament and of the Council
of June 26, 2013 (Chapter 10).
|
|
3.1.
|
Reporting by country and type of Payment
|
|
|
|
|
|
|
|
|
|
|
|
|
|
|
|
|
|
|
|
|
|
|
|
|
|
|
|
|
|
|
|
|
|
|
|
(in thousands of dollars)
|
|
Taxes
|
|
|
Royalties
|
|
|
License
fees
|
|
|
License
bonus
|
|
|
Dividends
|
|
|
Infrastructure
improvements
|
|
|
Production
entitlements
|
|
|
Total of
Payments
|
|
|
Africa
|
|
|
2,701,336
|
|
|
|
1,823
|
|
|
|
57,179
|
|
|
|
4,045
|
|
|
|
11,250
|
|
|
|
176,171
|
|
|
|
2,119,767
|
|
|
|
5,071,571
|
|
|
Algeria
|
|
|
96,226
|
|
|
|
—
|
|
|
|
—
|
|
|
|
—
|
|
|
|
—
|
|
|
|
—
|
|
|
|
209,142
|
|
|
|
305,368
|
|
|
Angola
|
|
|
804,228
|
|
|
|
—
|
|
|
|
20,885
|
|
|
|
—
|
|
|
|
—
|
|
|
|
13,586
|
|
|
|
1,648,069
|
|
|
|
2,486,768
|
|
|
Côte d’Ivoire
|
|
|
—
|
|
|
|
—
|
|
|
|
1,781
|
|
|
|
—
|
|
|
|
—
|
|
|
|
—
|
|
|
|
—
|
|
|
|
1,781
|
|
|
Democratic Republic
of the Congo
|
|
|
—
|
|
|
|
—
|
|
|
|
910
|
|
|
|
—
|
|
|
|
—
|
|
|
|
—
|
|
|
|
—
|
|
|
|
910
|
|
|
Egypt
|
|
|
—
|
|
|
|
—
|
|
|
|
3,505
|
|
|
|
3,000
|
|
|
|
—
|
|
|
|
—
|
|
|
|
—
|
|
|
|
6,505
|
|
|
Gabon
|
|
|
346,205
|
|
|
|
—
|
|
|
|
9,443
|
|
|
|
1,045
|
|
|
|
11,250
|
|
|
|
62,688
|
|
|
|
—
|
|
|
|
430,631
|
|
|
Kenya
|
|
|
—
|
|
|
|
—
|
|
|
|
228
|
|
|
|
—
|
|
|
|
—
|
|
|
|
—
|
|
|
|
—
|
|
|
|
228
|
|
|
Libya
|
|
|
160,461
|
|
|
|
—
|
|
|
|
—
|
|
|
|
—
|
|
|
|
—
|
|
|
|
—
|
|
|
|
203,176
|
|
|
|
363,637
|
|
|
Madagascar
|
|
|
—
|
|
|
|
—
|
|
|
|
425
|
|
|
|
—
|
|
|
|
—
|
|
|
|
—
|
|
|
|
—
|
|
|
|
425
|
|
|
Mauritania
|
|
|
—
|
|
|
|
—
|
|
|
|
345
|
|
|
|
—
|
|
|
|
—
|
|
|
|
—
|
|
|
|
—
|
|
|
|
345
|
|
|
Morocco
|
|
|
—
|
|
|
|
—
|
|
|
|
3,859
|
|
|
|
—
|
|
|
|
—
|
|
|
|
—
|
|
|
|
—
|
|
|
|
3,859
|
|
|
Nigeria
|
|
|
853,905
|
|
|
|
—
|
|
|
|
5,621
|
|
|
|
—
|
|
|
|
—
|
|
|
|
99,897
|
|
|
|
58,961
|
|
|
|
1,018,384
|
|
|
Republic of the Congo
|
|
|
439,842
|
|
|
|
—
|
|
|
|
9,598
|
|
|
|
—
|
|
|
|
—
|
|
|
|
—
|
|
|
|
419
|
|
|
|
449,859
|
|
|
South Africa
|
|
|
469
|
|
|
|
1,823
|
|
|
|
—
|
|
|
|
—
|
|
|
|
—
|
|
|
|
—
|
|
|
|
—
|
|
|
|
2,292
|
|
|
Uganda
|
|
|
—
|
|
|
|
—
|
|
|
|
579
|
|
|
|
—
|
|
|
|
—
|
|
|
|
—
|
|
|
|
—
|
|
|
|
579
|
|
|
North America
|
|
|
9,348
|
|
|
|
26,576
|
|
|
|
5,034
|
|
|
|
3,600
|
|
|
|
—
|
|
|
|
—
|
|
|
|
—
|
|
|
|
44,558
|
|
|
Canada
|
|
|
(599
|
)
(1)
|
|
|
2,450
|
|
|
|
434
|
|
|
|
—
|
|
|
|
—
|
|
|
|
—
|
|
|
|
—
|
|
|
|
2,285
|
|
|
United States
|
|
|
9,947
|
|
|
|
24,126
|
|
|
|
4,600
|
|
|
|
3,600
|
|
|
|
—
|
|
|
|
—
|
|
|
|
—
|
|
|
|
42,273
|
|
|
South America
|
|
|
477,165
|
|
|
|
—
|
|
|
|
10,267
|
|
|
|
—
|
|
|
|
—
|
|
|
|
—
|
|
|
|
75,183
|
|
|
|
562,615
|
|
|
Argentina
|
|
|
259,522
|
|
|
|
—
|
|
|
|
7,254
|
|
|
|
—
|
|
|
|
—
|
|
|
|
—
|
|
|
|
—
|
|
|
|
266,776
|
|
|
Bolivia
|
|
|
216,245
|
|
|
|
—
|
|
|
|
2,075
|
|
|
|
—
|
|
|
|
—
|
|
|
|
—
|
|
|
|
75,183
|
|
|
|
293,503
|
|
|
Brazil
|
|
|
—
|
|
|
|
—
|
|
|
|
336
|
|
|
|
—
|
|
|
|
—
|
|
|
|
—
|
|
|
|
—
|
|
|
|
336
|
|
|
Colombia
|
|
|
907
|
|
|
|
—
|
|
|
|
379
|
|
|
|
—
|
|
|
|
—
|
|
|
|
—
|
|
|
|
—
|
|
|
|
1,286
|
|
|
Uruguay
|
|
|
—
|
|
|
|
—
|
|
|
|
223
|
|
|
|
—
|
|
|
|
—
|
|
|
|
—
|
|
|
|
—
|
|
|
|
223
|
|
|
Venezuela
|
|
|
491
|
|
|
|
—
|
|
|
|
—
|
|
|
|
—
|
|
|
|
—
|
|
|
|
—
|
|
|
|
—
|
|
|
|
491
|
|
|
Asia Pacific
|
|
|
962,432
|
|
|
|
—
|
|
|
|
13
|
|
|
|
37,352
|
|
|
|
—
|
|
|
|
—
|
|
|
|
1,007,922
|
|
|
|
2,007,719
|
|
|
Brunei
|
|
|
152,862
|
|
|
|
—
|
|
|
|
13
|
|
|
|
—
|
|
|
|
—
|
|
|
|
—
|
|
|
|
—
|
|
|
|
152,875
|
|
|
China
|
|
|
7,313
|
|
|
|
—
|
|
|
|
—
|
|
|
|
—
|
|
|
|
—
|
|
|
|
—
|
|
|
|
16,833
|
|
|
|
24,146
|
|
|
Indonesia
|
|
|
402,803
|
|
|
|
—
|
|
|
|
—
|
|
|
|
—
|
|
|
|
—
|
|
|
|
—
|
|
|
|
857,611
|
|
|
|
1,260,414
|
|
|
Myanmar
|
|
|
39,037
|
|
|
|
—
|
|
|
|
—
|
|
|
|
—
|
|
|
|
—
|
|
|
|
—
|
|
|
|
133,478
|
|
|
|
172,515
|
|
|
Thailand
|
|
|
360,417
|
|
|
|
—
|
|
|
|
—
|
|
|
|
37,352
|
|
|
|
—
|
|
|
|
—
|
|
|
|
—
|
|
|
|
397,769
|
|
|
Commonwealth of Independent States
|
|
|
78,201
|
|
|
|
—
|
|
|
|
476
|
|
|
|
20,172
|
|
|
|
—
|
|
|
|
11,612
|
|
|
|
70,973
|
|
|
|
181,434
|
|
|
Azerbaijan
|
|
|
1,619
|
|
|
|
—
|
|
|
|
—
|
|
|
|
—
|
|
|
|
—
|
|
|
|
—
|
|
|
|
—
|
|
|
|
1,619
|
|
|
Kazakhstan
|
|
|
—
|
|
|
|
—
|
|
|
|
120
|
|
|
|
20,172
|
|
|
|
—
|
|
|
|
11,612
|
|
|
|
—
|
|
|
|
31,904
|
|
|
Russia
|
|
|
76,582
|
|
|
|
—
|
|
|
|
356
|
|
|
|
—
|
|
|
|
—
|
|
|
|
—
|
|
|
|
70,973
|
|
|
|
147,911
|
|
|
Europe
|
|
|
976,269
|
|
|
|
—
|
|
|
|
22,178
|
|
|
|
—
|
|
|
|
—
|
|
|
|
—
|
|
|
|
—
|
|
|
|
998,447
|
|
|
Bulgaria
|
|
|
—
|
|
|
|
—
|
|
|
|
329
|
|
|
|
—
|
|
|
|
—
|
|
|
|
—
|
|
|
|
—
|
|
|
|
329
|
|
|
Cyprus
|
|
|
—
|
|
|
|
—
|
|
|
|
9,123
|
|
|
|
—
|
|
|
|
—
|
|
|
|
—
|
|
|
|
—
|
|
|
|
9,123
|
|
|
France
|
|
|
5,102
|
|
|
|
—
|
|
|
|
—
|
|
|
|
—
|
|
|
|
—
|
|
|
|
—
|
|
|
|
—
|
|
|
|
5,102
|
|
|
Italy
|
|
|
—
|
|
|
|
—
|
|
|
|
139
|
|
|
|
—
|
|
|
|
—
|
|
|
|
—
|
|
|
|
—
|
|
|
|
139
|
|
|
Norway
|
|
|
837,188
|
|
|
|
—
|
|
|
|
3,238
|
|
|
|
—
|
|
|
|
—
|
|
|
|
—
|
|
|
|
—
|
|
|
|
840,426
|
|
|
The Netherlands
|
|
|
10,172
|
|
|
|
—
|
|
|
|
2,229
|
|
|
|
—
|
|
|
|
—
|
|
|
|
—
|
|
|
|
—
|
|
|
|
12,401
|
|
|
United Kingdom
|
|
|
123,807
|
|
|
|
—
|
|
|
|
7,120
|
|
|
|
—
|
|
|
|
—
|
|
|
|
—
|
|
|
|
—
|
|
|
|
130,927
|
|
|
Middle East
|
|
|
4,923,064
|
|
|
|
—
|
|
|
|
3,059
|
|
|
|
2,220,000
|
|
|
|
—
|
|
|
|
21,136
|
|
|
|
644,604
|
|
|
|
7,811,863
|
|
|
Iraq
|
|
|
3,892
|
|
|
|
—
|
|
|
|
565
|
|
|
|
—
|
|
|
|
—
|
|
|
|
—
|
|
|
|
—
|
|
|
|
4,457
|
|
|
Oman
|
|
|
252,720
|
|
|
|
—
|
|
|
|
—
|
|
|
|
—
|
|
|
|
—
|
|
|
|
—
|
|
|
|
13,437
|
|
|
|
266,157
|
|
|
Qatar
|
|
|
214,131
|
|
|
|
—
|
|
|
|
—
|
|
|
|
—
|
|
|
|
—
|
|
|
|
21,136
|
|
|
|
603,365
|
|
|
|
838,632
|
|
|
United Arab Emirates
|
|
|
4,443,748
|
|
|
|
—
|
|
|
|
2,344
|
|
|
|
2,220,000
|
|
|
|
—
|
|
|
|
—
|
|
|
|
—
|
|
|
|
6,666,092
|
|
|
Yemen
|
|
|
8,573
|
|
|
|
—
|
|
|
|
150
|
|
|
|
—
|
|
|
|
—
|
|
|
|
—
|
|
|
|
27,802
|
|
|
|
36,525
|
|
|
Total
|
|
|
10,127,815
|
|
|
|
28,399
|
|
|
|
98,206
|
|
|
|
2,285,169
|
|
|
|
11,250
|
|
|
|
208,919
|
|
|
|
3,918,449
|
|
|
|
16,678,207
|
|
|
|
|
|
|
2015 Form 20-F TOTAL S.A.
|
|
S-19
|
|
(1)
|
Reimbursement of the Alberta Scientific Research and Experimental Development tax credit.
|
|
3.2.
|
Reporting of Payments by Project and by type of Payment, and by Government and by type of Payment
|
|
|
|
|
|
|
|
|
|
|
|
|
|
|
|
|
|
|
|
|
|
|
|
|
|
|
|
|
|
|
|
|
|
|
|
(in thousands of dollars)
|
|
Taxes
|
|
|
Royalties
|
|
|
License
fees
|
|
|
License
bonus
|
|
|
Dividends
|
|
|
Infrastructure
improvements
|
|
|
Production
entitlements
|
|
|
Total of
Payments
|
|
|
|
|
|
|
|
|
|
|
|
|
Algeria
|
|
|
|
|
|
|
|
|
|
|
|
|
|
|
|
|
|
|
|
|
|
|
|
|
|
|
|
|
|
|
|
|
|
Payments per Project
|
|
|
|
|
|
|
|
|
|
|
|
|
|
|
|
|
|
|
|
|
|
|
|
|
|
|
|
|
|
|
|
|
|
Tin Fouyé Tabenkort
|
|
|
96,226
|
|
|
|
—
|
|
|
|
—
|
|
|
|
—
|
|
|
|
—
|
|
|
|
—
|
|
|
|
209,142
|
|
|
|
305,368
|
|
|
Total
|
|
|
96,226
|
|
|
|
—
|
|
|
|
—
|
|
|
|
—
|
|
|
|
—
|
|
|
|
—
|
|
|
|
209,142
|
|
|
|
305,368
|
|
|
Payments per Government
|
|
|
|
|
|
|
|
|
|
|
|
|
|
|
|
|
|
|
|
|
|
|
|
|
|
|
|
|
|
|
|
|
|
Direction Générale des Impôts,
|
|
|
|
|
|
|
|
|
|
|
|
|
|
|
|
|
|
|
|
|
|
|
|
|
|
|
|
|
|
|
|
|
|
Direction des Grandes Entreprises
c/o Sonatrach
|
|
|
96,226
|
|
|
|
—
|
|
|
|
—
|
|
|
|
—
|
|
|
|
—
|
|
|
|
—
|
|
|
|
—
|
|
|
|
96,226
|
|
|
Sonatrach
|
|
|
—
|
|
|
|
—
|
|
|
|
—
|
|
|
|
—
|
|
|
|
—
|
|
|
|
—
|
|
|
|
209,142
|
|
|
|
209,142
|
|
|
Total
|
|
|
96,226
|
|
|
|
—
|
|
|
|
—
|
|
|
|
—
|
|
|
|
—
|
|
|
|
—
|
|
|
|
209,142
|
|
|
|
305,368
|
|
|
|
|
|
|
|
|
|
|
|
|
Angola
|
|
|
|
|
|
|
|
|
|
|
|
|
|
|
|
|
|
|
|
|
|
|
|
|
|
|
|
|
|
|
|
|
|
Payments per Project
|
|
|
|
|
|
|
|
|
|
|
|
|
|
|
|
|
|
|
|
|
|
|
|
|
|
|
|
|
|
|
|
|
|
Block 17
|
|
|
660,639
|
|
|
|
—
|
|
|
|
19,476
|
|
|
|
—
|
|
|
|
—
|
|
|
|
—
|
|
|
|
1,535,173
|
|
|
|
2,215,288
|
|
|
Block 0
|
|
|
116,489
|
|
|
|
—
|
|
|
|
—
|
|
|
|
—
|
|
|
|
—
|
|
|
|
—
|
|
|
|
—
|
|
|
|
116,489
|
|
|
Block 14
|
|
|
27,100
|
|
|
|
—
|
|
|
|
—
|
|
|
|
—
|
|
|
|
—
|
|
|
|
—
|
|
|
|
112,476
|
|
|
|
139,576
|
|
|
Block 14k
|
|
|
—
|
|
|
|
—
|
|
|
|
—
|
|
|
|
—
|
|
|
|
—
|
|
|
|
—
|
|
|
|
420
|
|
|
|
420
|
|
|
Block 32
|
|
|
—
|
|
|
|
—
|
|
|
|
616
|
|
|
|
—
|
|
|
|
—
|
|
|
|
—
|
|
|
|
—
|
|
|
|
616
|
|
|
Block 33
|
|
|
—
|
|
|
|
—
|
|
|
|
38
|
|
|
|
—
|
|
|
|
—
|
|
|
|
—
|
|
|
|
—
|
|
|
|
38
|
|
|
Block 17/06
|
|
|
—
|
|
|
|
—
|
|
|
|
163
|
|
|
|
—
|
|
|
|
—
|
|
|
|
—
|
|
|
|
—
|
|
|
|
163
|
|
|
Block 25
|
|
|
—
|
|
|
|
—
|
|
|
|
171
|
|
|
|
—
|
|
|
|
—
|
|
|
|
5,000
|
|
|
|
—
|
|
|
|
5,171
|
|
|
Block 39
|
|
|
—
|
|
|
|
—
|
|
|
|
214
|
|
|
|
—
|
|
|
|
—
|
|
|
|
2,872
|
|
|
|
—
|
|
|
|
3,086
|
|
|
Block 40
|
|
|
—
|
|
|
|
—
|
|
|
|
207
|
|
|
|
—
|
|
|
|
—
|
|
|
|
5,714
|
|
|
|
—
|
|
|
|
5,921
|
|
|
Total
|
|
|
804,228
|
|
|
|
—
|
|
|
|
20,885
|
|
|
|
—
|
|
|
|
—
|
|
|
|
13,586
|
|
|
|
1,648,069
|
|
|
|
2,486,768
|
|
|
Payments per Government
|
|
|
|
|
|
|
|
|
|
|
|
|
|
|
|
|
|
|
|
|
|
|
|
|
|
|
|
|
|
|
|
|
|
Caixa do Tesouro Nacional
|
|
|
804,228
|
|
|
|
—
|
|
|
|
1,058
|
|
|
|
—
|
|
|
|
—
|
|
|
|
—
|
|
|
|
—
|
|
|
|
805,286
|
|
|
Ministério dos Petróleos
|
|
|
—
|
|
|
|
—
|
|
|
|
19,260
|
|
|
|
—
|
|
|
|
—
|
|
|
|
—
|
|
|
|
—
|
|
|
|
19,260
|
|
|
Sonangol, E.P. -
|
|
|
—
|
|
|
|
—
|
|
|
|
567
|
|
|
|
—
|
|
|
|
—
|
|
|
|
13,586
|
|
|
|
1,648,069
|
|
|
|
1,662,222
|
|
|
Total
|
|
|
804,228
|
|
|
|
—
|
|
|
|
20,885
|
|
|
|
—
|
|
|
|
—
|
|
|
|
13,586
|
|
|
|
1,648,069
|
|
|
|
2,486,768
|
|
|
|
|
|
|
|
|
|
|
|
|
Argentina
|
|
|
|
|
|
|
|
|
|
|
|
|
|
|
|
|
|
|
|
|
|
|
|
|
|
|
|
|
|
|
|
|
|
Payments per Project
|
|
|
|
|
|
|
|
|
|
|
|
|
|
|
|
|
|
|
|
|
|
|
|
|
|
|
|
|
|
|
|
|
|
Neuquen
|
|
|
25,310
|
|
|
|
—
|
|
|
|
1,290
|
|
|
|
—
|
|
|
|
—
|
|
|
|
—
|
|
|
|
—
|
|
|
|
26,600
|
|
|
Tierra del Fuego
|
|
|
45,704
|
|
|
|
—
|
|
|
|
5,964
|
|
|
|
—
|
|
|
|
—
|
|
|
|
—
|
|
|
|
—
|
|
|
|
51,668
|
|
|
Non-attributable
|
|
|
188,508
|
|
|
|
—
|
|
|
|
—
|
|
|
|
—
|
|
|
|
—
|
|
|
|
—
|
|
|
|
—
|
|
|
|
188,508
|
|
|
Total
|
|
|
259,522
|
|
|
|
—
|
|
|
|
7,254
|
|
|
|
—
|
|
|
|
—
|
|
|
|
—
|
|
|
|
—
|
|
|
|
266,776
|
|
|
Payments per Government
|
|
|
|
|
|
|
|
|
|
|
|
|
|
|
|
|
|
|
|
|
|
|
|
|
|
|
|
|
|
|
|
|
|
Administracion Federal de Ingresos Publicos
|
|
|
188,508
|
|
|
|
—
|
|
|
|
—
|
|
|
|
—
|
|
|
|
—
|
|
|
|
—
|
|
|
|
—
|
|
|
|
188,508
|
|
|
Secretaria de Energia, Republica Argentina
|
|
|
27,328
|
|
|
|
—
|
|
|
|
2,826
|
|
|
|
—
|
|
|
|
—
|
|
|
|
—
|
|
|
|
—
|
|
|
|
30,154
|
|
|
Provincia del Neuquen
|
|
|
25,310
|
|
|
|
—
|
|
|
|
1,290
|
|
|
|
—
|
|
|
|
—
|
|
|
|
—
|
|
|
|
—
|
|
|
|
26,600
|
|
|
Provincia del Tierra del Fuego
|
|
|
18,376
|
|
|
|
—
|
|
|
|
3,138
|
|
|
|
—
|
|
|
|
—
|
|
|
|
—
|
|
|
|
—
|
|
|
|
21,514
|
|
|
Total
|
|
|
259,522
|
|
|
|
—
|
|
|
|
7,254
|
|
|
|
—
|
|
|
|
—
|
|
|
|
—
|
|
|
|
—
|
|
|
|
266,776
|
|
|
|
|
|
|
S-20
|
|
TOTAL S.A. Form 20-F 2015
|
|
|
|
|
|
|
|
|
|
|
|
|
|
|
|
|
|
|
|
|
|
|
|
|
|
|
|
|
|
|
|
|
|
|
|
(in thousands of dollars)
|
|
Taxes
|
|
|
Royalties
|
|
|
License
fees
|
|
|
License
bonus
|
|
|
Dividends
|
|
|
Infrastructure
improvements
|
|
|
Production
entitlements
|
|
|
Total of
Payments
|
|
|
|
|
|
|
|
|
|
|
|
|
Azerbaijan
|
|
|
|
|
|
|
|
|
|
|
|
|
|
|
|
|
|
|
|
|
|
|
|
|
|
|
|
|
|
|
|
|
|
Payments per Project
|
|
|
|
|
|
|
|
|
|
|
|
|
|
|
|
|
|
|
|
|
|
|
|
|
|
|
|
|
|
|
|
|
|
Shah Deniz
|
|
|
1,619
|
|
|
|
—
|
|
|
|
—
|
|
|
|
—
|
|
|
|
—
|
|
|
|
—
|
|
|
|
—
|
|
|
|
1,619
|
|
|
Total
|
|
|
1,619
|
|
|
|
—
|
|
|
|
—
|
|
|
|
—
|
|
|
|
—
|
|
|
|
—
|
|
|
|
—
|
|
|
|
1,619
|
|
|
Payments per Government
|
|
|
|
|
|
|
|
|
|
|
|
|
|
|
|
|
|
|
|
|
|
|
|
|
|
|
|
|
|
|
|
|
|
Ministry of Taxes of the Republic of Azerbaijan
|
|
|
1,619
|
|
|
|
—
|
|
|
|
—
|
|
|
|
—
|
|
|
|
—
|
|
|
|
—
|
|
|
|
—
|
|
|
|
1,619
|
|
|
Total
|
|
|
1,619
|
|
|
|
—
|
|
|
|
—
|
|
|
|
—
|
|
|
|
—
|
|
|
|
—
|
|
|
|
—
|
|
|
|
1,619
|
|
|
|
|
|
|
|
|
|
|
|
|
Bolivia
|
|
|
|
|
|
|
|
|
|
|
|
|
|
|
|
|
|
|
|
|
|
|
|
|
|
|
|
|
|
|
|
|
|
Payments per Project
|
|
|
|
|
|
|
|
|
|
|
|
|
|
|
|
|
|
|
|
|
|
|
|
|
|
|
|
|
|
|
|
|
|
Ipati
|
|
|
—
|
|
|
|
—
|
|
|
|
464
|
|
|
|
—
|
|
|
|
—
|
|
|
|
—
|
|
|
|
—
|
|
|
|
464
|
|
|
Azero
|
|
|
—
|
|
|
|
—
|
|
|
|
1,330
|
|
|
|
—
|
|
|
|
—
|
|
|
|
—
|
|
|
|
—
|
|
|
|
1,330
|
|
|
Aquio
|
|
|
—
|
|
|
|
—
|
|
|
|
281
|
|
|
|
—
|
|
|
|
—
|
|
|
|
—
|
|
|
|
—
|
|
|
|
281
|
|
|
Itau
|
|
|
43,005
|
|
|
|
—
|
|
|
|
—
|
|
|
|
—
|
|
|
|
—
|
|
|
|
—
|
|
|
|
43
|
|
|
|
43,048
|
|
|
San Alberto
|
|
|
35,401
|
|
|
|
—
|
|
|
|
—
|
|
|
|
—
|
|
|
|
—
|
|
|
|
—
|
|
|
|
11,442
|
|
|
|
46,843
|
|
|
San Antonio
|
|
|
113,375
|
|
|
|
—
|
|
|
|
—
|
|
|
|
—
|
|
|
|
—
|
|
|
|
—
|
|
|
|
63,698
|
|
|
|
177,073
|
|
|
Non-attributable
|
|
|
24,464
|
|
|
|
—
|
|
|
|
—
|
|
|
|
—
|
|
|
|
—
|
|
|
|
—
|
|
|
|
—
|
|
|
|
24,464
|
|
|
Total
|
|
|
216,245
|
|
|
|
—
|
|
|
|
2,075
|
|
|
|
—
|
|
|
|
—
|
|
|
|
—
|
|
|
|
75,183
|
|
|
|
293,503
|
|
|
Payments per Government
|
|
|
|
|
|
|
|
|
|
|
|
|
|
|
|
|
|
|
|
|
|
|
|
|
|
|
|
|
|
|
|
|
|
Yacimientos Petroliferos Fiscales Bolivianos (YPFB)
|
|
|
—
|
|
|
|
—
|
|
|
|
2,075
|
|
|
|
—
|
|
|
|
—
|
|
|
|
—
|
|
|
|
75,183
|
|
|
|
77,258
|
|
|
Servicio de Impuestos Nacionales (SIN)
|
|
|
24,464
|
|
|
|
—
|
|
|
|
—
|
|
|
|
—
|
|
|
|
—
|
|
|
|
—
|
|
|
|
—
|
|
|
|
24,464
|
|
|
Servicio de Impuestos Nacionales (SIN) c/o YPFB
|
|
|
122,740
|
|
|
|
—
|
|
|
|
—
|
|
|
|
—
|
|
|
|
—
|
|
|
|
—
|
|
|
|
—
|
|
|
|
122,740
|
|
|
Departamentos c/o YPFB
|
|
|
69,041
|
|
|
|
—
|
|
|
|
—
|
|
|
|
—
|
|
|
|
—
|
|
|
|
—
|
|
|
|
—
|
|
|
|
69,041
|
|
|
Total
|
|
|
216,245
|
|
|
|
—
|
|
|
|
2,075
|
|
|
|
—
|
|
|
|
—
|
|
|
|
—
|
|
|
|
75,183
|
|
|
|
293,503
|
|
|
|
|
|
|
|
|
|
|
|
|
Brazil
|
|
|
|
|
|
|
|
|
|
|
|
|
|
|
|
|
|
|
|
|
|
|
|
|
|
|
|
|
|
|
|
|
|
Payments per Project
|
|
|
|
|
|
|
|
|
|
|
|
|
|
|
|
|
|
|
|
|
|
|
|
|
|
|
|
|
|
|
|
|
|
Foz de Amazonas
|
|
|
—
|
|
|
|
—
|
|
|
|
95
|
|
|
|
—
|
|
|
|
—
|
|
|
|
—
|
|
|
|
—
|
|
|
|
95
|
|
|
Ceara (CE-M-661)
|
|
|
—
|
|
|
|
—
|
|
|
|
192
|
|
|
|
—
|
|
|
|
—
|
|
|
|
—
|
|
|
|
—
|
|
|
|
192
|
|
|
Xerelete (BC-2)
|
|
|
—
|
|
|
|
—
|
|
|
|
49
|
|
|
|
—
|
|
|
|
—
|
|
|
|
—
|
|
|
|
—
|
|
|
|
49
|
|
|
Total
|
|
|
—
|
|
|
|
—
|
|
|
|
336
|
|
|
|
—
|
|
|
|
—
|
|
|
|
—
|
|
|
|
—
|
|
|
|
336
|
|
|
Payments per Government
|
|
|
|
|
|
|
|
|
|
|
|
|
|
|
|
|
|
|
|
|
|
|
|
|
|
|
|
|
|
|
|
|
|
Agencia National de Petroleo,
|
|
|
|
|
|
|
|
|
|
|
|
|
|
|
|
|
|
|
|
|
|
|
|
|
|
|
|
|
|
|
|
|
|
Gas Natural e Biocombustiveis
|
|
|
—
|
|
|
|
—
|
|
|
|
336
|
|
|
|
—
|
|
|
|
—
|
|
|
|
—
|
|
|
|
—
|
|
|
|
336
|
|
|
Total
|
|
|
—
|
|
|
|
—
|
|
|
|
336
|
|
|
|
—
|
|
|
|
—
|
|
|
|
—
|
|
|
|
—
|
|
|
|
336
|
|
|
|
|
|
|
|
|
|
|
|
|
Brunei
|
|
|
|
|
|
|
|
|
|
|
|
|
|
|
|
|
|
|
|
|
|
|
|
|
|
|
|
|
|
|
|
|
|
Payments per Project
|
|
|
|
|
|
|
|
|
|
|
|
|
|
|
|
|
|
|
|
|
|
|
|
|
|
|
|
|
|
|
|
|
|
Block B
|
|
|
152,862
|
|
|
|
—
|
|
|
|
13
|
|
|
|
—
|
|
|
|
—
|
|
|
|
—
|
|
|
|
—
|
|
|
|
152,875
|
|
|
Total
|
|
|
152,862
|
|
|
|
—
|
|
|
|
13
|
|
|
|
—
|
|
|
|
—
|
|
|
|
—
|
|
|
|
—
|
|
|
|
152,875
|
|
|
Payments per Government
|
|
|
|
|
|
|
|
|
|
|
|
|
|
|
|
|
|
|
|
|
|
|
|
|
|
|
|
|
|
|
|
|
|
Brunei Government
|
|
|
152,862
|
|
|
|
—
|
|
|
|
13
|
|
|
|
—
|
|
|
|
—
|
|
|
|
—
|
|
|
|
—
|
|
|
|
152,875
|
|
|
Total
|
|
|
152,862
|
|
|
|
—
|
|
|
|
13
|
|
|
|
—
|
|
|
|
—
|
|
|
|
—
|
|
|
|
—
|
|
|
|
152,875
|
|
|
|
|
|
|
|
|
|
|
|
|
Bulgaria
|
|
|
|
|
|
|
|
|
|
|
|
|
|
|
|
|
|
|
|
|
|
|
|
|
|
|
|
|
|
|
|
|
|
Payments per Project
|
|
|
|
|
|
|
|
|
|
|
|
|
|
|
|
|
|
|
|
|
|
|
|
|
|
|
|
|
|
|
|
|
|
Khan Asparuh
|
|
|
—
|
|
|
|
—
|
|
|
|
323
|
|
|
|
—
|
|
|
|
—
|
|
|
|
—
|
|
|
|
—
|
|
|
|
323
|
|
|
Silistar
|
|
|
—
|
|
|
|
—
|
|
|
|
6
|
|
|
|
—
|
|
|
|
—
|
|
|
|
—
|
|
|
|
—
|
|
|
|
6
|
|
|
Total
|
|
|
—
|
|
|
|
—
|
|
|
|
329
|
|
|
|
—
|
|
|
|
—
|
|
|
|
—
|
|
|
|
—
|
|
|
|
329
|
|
|
Payments per Government
|
|
|
|
|
|
|
|
|
|
|
|
|
|
|
|
|
|
|
|
|
|
|
|
|
|
|
|
|
|
|
|
|
|
Ministry of Energy of Bulgaria
|
|
|
—
|
|
|
|
—
|
|
|
|
329
|
|
|
|
—
|
|
|
|
—
|
|
|
|
—
|
|
|
|
—
|
|
|
|
329
|
|
|
Total
|
|
|
—
|
|
|
|
—
|
|
|
|
329
|
|
|
|
—
|
|
|
|
—
|
|
|
|
—
|
|
|
|
—
|
|
|
|
329
|
|
|
|
|
|
|
2015 Form 20-F TOTAL S.A.
|
|
S-21
|
|
|
|
|
|
|
|
|
|
|
|
|
|
|
|
|
|
|
|
|
|
|
|
|
|
|
|
|
|
|
|
|
|
|
|
(in thousands of dollars)
|
|
Taxes
|
|
|
Royalties
|
|
|
License
fees
|
|
|
License
bonus
|
|
|
Dividends
|
|
|
Infrastructure
improvements
|
|
|
Production
entitlements
|
|
|
Total of
Payments
|
|
|
|
|
|
|
|
|
|
|
|
|
Canada
|
|
|
|
|
|
|
|
|
|
|
|
|
|
|
|
|
|
|
|
|
|
|
|
|
|
|
|
|
|
|
|
|
|
Payments per Project
|
|
|
|
|
|
|
|
|
|
|
|
|
|
|
|
|
|
|
|
|
|
|
|
|
|
|
|
|
|
|
|
|
|
Joslyn
|
|
|
(599
|
)
(1)
|
|
|
—
|
|
|
|
249
|
|
|
|
—
|
|
|
|
—
|
|
|
|
—
|
|
|
|
—
|
|
|
|
(350
|
)
|
|
Surmont
|
|
|
—
|
|
|
|
2,450
|
|
|
|
—
|
|
|
|
—
|
|
|
|
—
|
|
|
|
—
|
|
|
|
—
|
|
|
|
2,450
|
|
|
Northern Lights
|
|
|
—
|
|
|
|
—
|
|
|
|
83
|
|
|
|
—
|
|
|
|
—
|
|
|
|
—
|
|
|
|
—
|
|
|
|
83
|
|
|
Other oil sands projects
|
|
|
—
|
|
|
|
—
|
|
|
|
102
|
|
|
|
—
|
|
|
|
—
|
|
|
|
—
|
|
|
|
—
|
|
|
|
102
|
|
|
Total
|
|
|
(599
|
)
|
|
|
2,450
|
|
|
|
434
|
|
|
|
—
|
|
|
|
—
|
|
|
|
—
|
|
|
|
—
|
|
|
|
2,285
|
|
|
Payments per Government
|
|
|
|
|
|
|
|
|
|
|
|
|
|
|
|
|
|
|
|
|
|
|
|
|
|
|
|
|
|
|
|
|
|
Province of Alberta
|
|
|
(599
|
)
(1)
|
|
|
2,450
|
|
|
|
434
|
|
|
|
—
|
|
|
|
—
|
|
|
|
—
|
|
|
|
—
|
|
|
|
2,285
|
|
|
Total
|
|
|
(599
|
)
|
|
|
2,450
|
|
|
|
434
|
|
|
|
—
|
|
|
|
—
|
|
|
|
—
|
|
|
|
—
|
|
|
|
2,285
|
|
|
|
|
|
|
|
|
|
|
|
|
China
|
|
|
|
|
|
|
|
|
|
|
|
|
|
|
|
|
|
|
|
|
|
|
|
|
|
|
|
|
|
|
|
|
|
Payments per Project
|
|
|
|
|
|
|
|
|
|
|
|
|
|
|
|
|
|
|
|
|
|
|
|
|
|
|
|
|
|
|
|
|
|
Sulige
|
|
|
7,313
|
|
|
|
—
|
|
|
|
—
|
|
|
|
—
|
|
|
|
—
|
|
|
|
—
|
|
|
|
16,833
|
|
|
|
24,146
|
|
|
Total
|
|
|
7,313
|
|
|
|
—
|
|
|
|
—
|
|
|
|
—
|
|
|
|
—
|
|
|
|
—
|
|
|
|
16,833
|
|
|
|
24,146
|
|
|
Payments per Government
|
|
|
|
|
|
|
|
|
|
|
|
|
|
|
|
|
|
|
|
|
|
|
|
|
|
|
|
|
|
|
|
|
|
China National Petroleum Company
|
|
|
7,313
|
|
|
|
—
|
|
|
|
—
|
|
|
|
—
|
|
|
|
—
|
|
|
|
—
|
|
|
|
16,833
|
|
|
|
24,146
|
|
|
Total
|
|
|
7,313
|
|
|
|
—
|
|
|
|
—
|
|
|
|
—
|
|
|
|
—
|
|
|
|
—
|
|
|
|
16,833
|
|
|
|
24,146
|
|
|
|
|
|
|
|
|
|
|
|
|
Colombia
|
|
|
|
|
|
|
|
|
|
|
|
|
|
|
|
|
|
|
|
|
|
|
|
|
|
|
|
|
|
|
|
|
|
Payments per Project
|
|
|
|
|
|
|
|
|
|
|
|
|
|
|
|
|
|
|
|
|
|
|
|
|
|
|
|
|
|
|
|
|
|
Non-attributable
|
|
|
907
|
|
|
|
—
|
|
|
|
379
|
|
|
|
—
|
|
|
|
—
|
|
|
|
—
|
|
|
|
—
|
|
|
|
1,286
|
|
|
Total
|
|
|
907
|
|
|
|
—
|
|
|
|
379
|
|
|
|
—
|
|
|
|
—
|
|
|
|
—
|
|
|
|
—
|
|
|
|
1,286
|
|
|
Payments per Government
|
|
|
|
|
|
|
|
|
|
|
|
|
|
|
|
|
|
|
|
|
|
|
|
|
|
|
|
|
|
|
|
|
|
Dirección de Impuestos y aduanas Nacionales
|
|
|
907
|
|
|
|
—
|
|
|
|
—
|
|
|
|
—
|
|
|
|
—
|
|
|
|
—
|
|
|
|
—
|
|
|
|
907
|
|
|
Camara de comercio de Bogota
|
|
|
—
|
|
|
|
—
|
|
|
|
379
|
|
|
|
—
|
|
|
|
—
|
|
|
|
—
|
|
|
|
—
|
|
|
|
379
|
|
|
Total
|
|
|
907
|
|
|
|
—
|
|
|
|
379
|
|
|
|
—
|
|
|
|
—
|
|
|
|
—
|
|
|
|
—
|
|
|
|
1,286
|
|
|
|
|
|
|
|
|
|
|
|
|
Côte d’Ivoire
|
|
|
|
|
|
|
|
|
|
|
|
|
|
|
|
|
|
|
|
|
|
|
|
|
|
|
|
|
|
|
|
|
|
Payments per Project
|
|
|
|
|
|
|
|
|
|
|
|
|
|
|
|
|
|
|
|
|
|
|
|
|
|
|
|
|
|
|
|
|
|
CI-100
|
|
|
—
|
|
|
|
—
|
|
|
|
157
|
|
|
|
—
|
|
|
|
—
|
|
|
|
—
|
|
|
|
—
|
|
|
|
157
|
|
|
CI-514
|
|
|
—
|
|
|
|
—
|
|
|
|
1,624
|
|
|
|
—
|
|
|
|
—
|
|
|
|
—
|
|
|
|
—
|
|
|
|
1,624
|
|
|
Total
|
|
|
—
|
|
|
|
—
|
|
|
|
1,781
|
|
|
|
—
|
|
|
|
—
|
|
|
|
—
|
|
|
|
—
|
|
|
|
1,781
|
|
|
Payments per Government
|
|
|
|
|
|
|
|
|
|
|
|
|
|
|
|
|
|
|
|
|
|
|
|
|
|
|
|
|
|
|
|
|
|
République de Côte d’Ivoire, Direction Généraledes
Hydrocarbures
|
|
|
—
|
|
|
|
—
|
|
|
|
1,781
|
|
|
|
—
|
|
|
|
—
|
|
|
|
—
|
|
|
|
—
|
|
|
|
1,781
|
|
|
Total
|
|
|
—
|
|
|
|
—
|
|
|
|
1,781
|
|
|
|
—
|
|
|
|
—
|
|
|
|
—
|
|
|
|
—
|
|
|
|
1,781
|
|
|
|
|
|
|
|
|
|
|
|
|
Cyprus
|
|
|
|
|
|
|
|
|
|
|
|
|
|
|
|
|
|
|
|
|
|
|
|
|
|
|
|
|
|
|
|
|
|
Payments per Project
|
|
|
|
|
|
|
|
|
|
|
|
|
|
|
|
|
|
|
|
|
|
|
|
|
|
|
|
|
|
|
|
|
|
Block 10
|
|
|
—
|
|
|
|
—
|
|
|
|
8,614
|
|
|
|
—
|
|
|
|
—
|
|
|
|
—
|
|
|
|
—
|
|
|
|
8,614
|
|
|
Block 11
|
|
|
—
|
|
|
|
—
|
|
|
|
509
|
|
|
|
—
|
|
|
|
—
|
|
|
|
—
|
|
|
|
—
|
|
|
|
509
|
|
|
Total
|
|
|
—
|
|
|
|
—
|
|
|
|
9,123
|
|
|
|
—
|
|
|
|
—
|
|
|
|
—
|
|
|
|
—
|
|
|
|
9,123
|
|
|
Payments per Government
|
|
|
|
|
|
|
|
|
|
|
|
|
|
|
|
|
|
|
|
|
|
|
|
|
|
|
|
|
|
|
|
|
|
Ministry of Energy, Commerce, Industry and Tourism
|
|
|
—
|
|
|
|
—
|
|
|
|
9,123
|
|
|
|
—
|
|
|
|
—
|
|
|
|
—
|
|
|
|
—
|
|
|
|
9,123
|
|
|
Total
|
|
|
—
|
|
|
|
—
|
|
|
|
9,123
|
|
|
|
—
|
|
|
|
—
|
|
|
|
—
|
|
|
|
—
|
|
|
|
9,123
|
|
|
|
|
|
|
S-22
|
|
TOTAL S.A. Form 20-F 2015
|
|
(1)
|
Reimbursement of the Alberta Scientific Research and Experimental Development tax credit.
|
|
|
|
|
|
|
|
|
|
|
|
|
|
|
|
|
|
|
|
|
|
|
|
|
|
|
|
|
|
|
|
|
|
|
|
(in thousands of dollars)
|
|
Taxes
|
|
|
Royalties
|
|
|
License
fees
|
|
|
License
bonus
|
|
|
Dividends
|
|
|
Infrastructure
improvements
|
|
|
Production
entitlements
|
|
|
Total of
Payments
|
|
|
|
|
|
|
|
|
|
|
|
|
Democratic Republic of the Congo
|
|
|
|
|
|
|
|
|
|
|
|
|
|
|
|
|
|
|
|
|
|
|
|
|
|
|
|
|
|
|
|
|
|
Payments per Project
|
|
|
|
|
|
|
|
|
|
|
|
|
|
|
|
|
|
|
|
|
|
|
|
|
|
|
|
|
|
|
|
|
|
Block 3
|
|
|
—
|
|
|
|
—
|
|
|
|
910
|
|
|
|
—
|
|
|
|
—
|
|
|
|
—
|
|
|
|
—
|
|
|
|
910
|
|
|
Total
|
|
|
—
|
|
|
|
—
|
|
|
|
910
|
|
|
|
—
|
|
|
|
—
|
|
|
|
—
|
|
|
|
—
|
|
|
|
910
|
|
|
Payments per Government
|
|
|
|
|
|
|
|
|
|
|
|
|
|
|
|
|
|
|
|
|
|
|
|
|
|
|
|
|
|
|
|
|
|
Ministère des Hydrocarbures
|
|
|
—
|
|
|
|
—
|
|
|
|
760
|
|
|
|
—
|
|
|
|
—
|
|
|
|
—
|
|
|
|
—
|
|
|
|
760
|
|
|
Ministère de l’Environnement
|
|
|
—
|
|
|
|
—
|
|
|
|
150
|
|
|
|
—
|
|
|
|
—
|
|
|
|
—
|
|
|
|
—
|
|
|
|
150
|
|
|
Total
|
|
|
—
|
|
|
|
—
|
|
|
|
910
|
|
|
|
—
|
|
|
|
—
|
|
|
|
—
|
|
|
|
—
|
|
|
|
910
|
|
|
|
|
|
|
|
|
|
|
|
|
Egypt
|
|
|
|
|
|
|
|
|
|
|
|
|
|
|
|
|
|
|
|
|
|
|
|
|
|
|
|
|
|
|
|
|
|
Payments per Project
|
|
|
|
|
|
|
|
|
|
|
|
|
|
|
|
|
|
|
|
|
|
|
|
|
|
|
|
|
|
|
|
|
|
Block 4 East El Burullus
|
|
|
—
|
|
|
|
—
|
|
|
|
3,275
|
|
|
|
—
|
|
|
|
—
|
|
|
|
—
|
|
|
|
—
|
|
|
|
3,275
|
|
|
North El Mahala Onshore
|
|
|
—
|
|
|
|
—
|
|
|
|
230
|
|
|
|
3,000
|
|
|
|
—
|
|
|
|
—
|
|
|
|
—
|
|
|
|
3,230
|
|
|
Total
|
|
|
—
|
|
|
|
—
|
|
|
|
3,505
|
|
|
|
3,000
|
|
|
|
—
|
|
|
|
—
|
|
|
|
—
|
|
|
|
6,505
|
|
|
Payments per Government
|
|
|
|
|
|
|
|
|
|
|
|
|
|
|
|
|
|
|
|
|
|
|
|
|
|
|
|
|
|
|
|
|
|
Egyptian Natural Gas
|
|
|
|
|
|
|
|
|
|
|
|
|
|
|
|
|
|
|
|
|
|
|
|
|
|
|
|
|
|
|
|
|
|
Holding Company
|
|
|
—
|
|
|
|
—
|
|
|
|
3,505
|
|
|
|
3,000
|
|
|
|
—
|
|
|
|
—
|
|
|
|
—
|
|
|
|
6,505
|
|
|
Total
|
|
|
—
|
|
|
|
—
|
|
|
|
3,505
|
|
|
|
3,000
|
|
|
|
—
|
|
|
|
—
|
|
|
|
—
|
|
|
|
6,505
|
|
|
|
|
|
|
|
|
|
|
|
|
France
|
|
|
|
|
|
|
|
|
|
|
|
|
|
|
|
|
|
|
|
|
|
|
|
|
|
|
|
|
|
|
|
|
|
Payments per Project
|
|
|
|
|
|
|
|
|
|
|
|
|
|
|
|
|
|
|
|
|
|
|
|
|
|
|
|
|
|
|
|
|
|
Pécorade
|
|
|
397
|
|
|
|
—
|
|
|
|
—
|
|
|
|
—
|
|
|
|
—
|
|
|
|
—
|
|
|
|
—
|
|
|
|
397
|
|
|
Meillon
|
|
|
754
|
|
|
|
—
|
|
|
|
—
|
|
|
|
—
|
|
|
|
—
|
|
|
|
—
|
|
|
|
—
|
|
|
|
754
|
|
|
Lacq
|
|
|
3,951
|
|
|
|
—
|
|
|
|
—
|
|
|
|
—
|
|
|
|
—
|
|
|
|
—
|
|
|
|
—
|
|
|
|
3,951
|
|
|
Total
|
|
|
5,102
|
|
|
|
—
|
|
|
|
—
|
|
|
|
—
|
|
|
|
—
|
|
|
|
—
|
|
|
|
—
|
|
|
|
5,102
|
|
|
Payments per Government
|
|
|
|
|
|
|
|
|
|
|
|
|
|
|
|
|
|
|
|
|
|
|
|
|
|
|
|
|
|
|
|
|
|
Trésor Public
|
|
|
5,102
|
|
|
|
—
|
|
|
|
—
|
|
|
|
—
|
|
|
|
—
|
|
|
|
—
|
|
|
|
—
|
|
|
|
5,102
|
|
|
Total
|
|
|
5,102
|
|
|
|
—
|
|
|
|
—
|
|
|
|
—
|
|
|
|
—
|
|
|
|
—
|
|
|
|
—
|
|
|
|
5,102
|
|
|
|
|
|
|
|
|
|
|
|
|
Gabon
|
|
|
|
|
|
|
|
|
|
|
|
|
|
|
|
|
|
|
|
|
|
|
|
|
|
|
|
|
|
|
|
|
|
Payments
per Project
|
|
|
|
|
|
|
|
|
|
|
|
|
|
|
|
|
|
|
|
|
|
|
|
|
|
|
|
|
|
|
|
|
|
Concession Fields (Non-attributable)
|
|
|
115,754
|
|
|
|
—
|
|
|
|
4,262
|
|
|
|
—
|
|
|
|
—
|
|
|
|
62,688
|
(1)
|
|
|
—
|
|
|
|
182,704
|
|
|
Concession Anguille
|
|
|
50,186
|
|
|
|
—
|
|
|
|
—
|
|
|
|
—
|
|
|
|
—
|
|
|
|
—
|
|
|
|
—
|
|
|
|
50,186
|
|
|
Concession Grondin
|
|
|
48,452
|
|
|
|
—
|
|
|
|
—
|
|
|
|
—
|
|
|
|
—
|
|
|
|
—
|
|
|
|
—
|
|
|
|
48,452
|
|
|
Concession Torpille
|
|
|
38,446
|
|
|
|
—
|
|
|
|
—
|
|
|
|
—
|
|
|
|
—
|
|
|
|
—
|
|
|
|
—
|
|
|
|
38,446
|
|
|
Atora CEPP
|
|
|
10,820
|
|
|
|
—
|
|
|
|
320
|
|
|
|
—
|
|
|
|
—
|
|
|
|
—
|
|
|
|
—
|
|
|
|
11,140
|
|
|
Coucal CEPP
|
|
|
1,728
|
|
|
|
—
|
|
|
|
533
|
|
|
|
—
|
|
|
|
—
|
|
|
|
—
|
|
|
|
—
|
|
|
|
2,261
|
|
|
Avocette CEPP
|
|
|
16,593
|
|
|
|
—
|
|
|
|
1,873
|
|
|
|
—
|
|
|
|
—
|
|
|
|
—
|
|
|
|
—
|
|
|
|
18,466
|
|
|
Baudroie Mérou CEPP
|
|
|
18,009
|
|
|
|
—
|
|
|
|
648
|
|
|
|
1,000
|
|
|
|
—
|
|
|
|
—
|
|
|
|
—
|
|
|
|
19,657
|
|
|
Mboga CEPP
|
|
|
5,795
|
|
|
|
—
|
|
|
|
41
|
|
|
|
—
|
|
|
|
—
|
|
|
|
—
|
|
|
|
—
|
|
|
|
5,836
|
|
|
Hylia II CEPP
|
|
|
7,169
|
|
|
|
—
|
|
|
|
893
|
|
|
|
—
|
|
|
|
—
|
|
|
|
—
|
|
|
|
—
|
|
|
|
8,062
|
|
|
Diaba CEPP
|
|
|
—
|
|
|
|
—
|
|
|
|
873
|
|
|
|
—
|
|
|
|
—
|
|
|
|
—
|
|
|
|
—
|
|
|
|
873
|
|
|
Nziembou CEPP
|
|
|
—
|
|
|
|
—
|
|
|
|
—
|
|
|
|
45
|
|
|
|
—
|
|
|
|
—
|
|
|
|
—
|
|
|
|
45
|
|
|
Rabi CEPP
|
|
|
33,253
|
|
|
|
—
|
|
|
|
—
|
|
|
|
—
|
|
|
|
—
|
|
|
|
—
|
|
|
|
—
|
|
|
|
33,253
|
|
|
Non-attributable
|
|
|
—
|
|
|
|
—
|
|
|
|
—
|
|
|
|
—
|
|
|
|
11,250
|
|
|
|
—
|
|
|
|
—
|
|
|
|
11,250
|
|
|
Total
|
|
|
346,205
|
|
|
|
—
|
|
|
|
9,443
|
|
|
|
1,045
|
|
|
|
11,250
|
|
|
|
62,688
|
|
|
|
—
|
|
|
|
430,631
|
|
|
Payments per Government
|
|
|
|
|
|
|
|
|
|
|
|
|
|
|
|
|
|
|
|
|
|
|
|
|
|
|
|
|
|
|
|
|
|
Trésor Public Gabonais
|
|
|
189,653
|
|
|
|
—
|
|
|
|
1,999
|
|
|
|
—
|
|
|
|
—
|
|
|
|
—
|
|
|
|
—
|
|
|
|
191,652
|
|
|
Direction Générale des Hydrocarbures
|
|
|
—
|
|
|
|
—
|
|
|
|
5,687
|
|
|
|
1,045
|
|
|
|
—
|
|
|
|
—
|
|
|
|
—
|
|
|
|
6,732
|
|
|
République du Gabon
|
|
|
156,552
|
|
|
|
—
|
|
|
|
—
|
|
|
|
—
|
|
|
|
11,250
|
|
|
|
62,688
|
(1)
|
|
|
—
|
|
|
|
230,490
|
|
|
Direction Générale des Impôts
|
|
|
—
|
|
|
|
—
|
|
|
|
693
|
|
|
|
—
|
|
|
|
—
|
|
|
|
—
|
|
|
|
—
|
|
|
|
693
|
|
|
Ville de Port-Gentil
|
|
|
—
|
|
|
|
—
|
|
|
|
1,064
|
|
|
|
—
|
|
|
|
—
|
|
|
|
—
|
|
|
|
—
|
|
|
|
1,064
|
|
|
Total
|
|
|
346,205
|
|
|
|
—
|
|
|
|
9,443
|
|
|
|
1,045
|
|
|
|
11,250
|
|
|
|
62,688
|
|
|
|
—
|
|
|
|
430,631
|
|
|
|
|
|
|
2015 Form 20-F TOTAL S.A.
|
|
S-23
|
|
(1)
|
Financing of projects (infrastructure, education, health) under joint control of the State and TOTAL within the framework of the Provision pour
Investissements Diversifiés (contribution to diversified investments) and of the Provision pour Investissements dans les Hydrocarbures (contribution to investments in hydrocarbons).
|
|
|
|
|
|
|
|
|
|
|
|
|
|
|
|
|
|
|
|
|
|
|
|
|
|
|
|
|
|
|
|
|
|
|
|
(in thousands of dollars)
|
|
Taxes
|
|
|
Royalties
|
|
|
License
fees
|
|
|
License
bonus
|
|
|
Dividends
|
|
|
Infrastructure
improvements
|
|
|
Production
entitlements
|
|
|
Total of
Payments
|
|
|
|
|
|
|
|
|
|
|
|
|
Indonesia
|
|
|
|
|
|
|
|
|
|
|
|
|
|
|
|
|
|
|
|
|
|
|
|
|
|
|
|
|
|
|
|
|
|
Payments per Project
|
|
|
|
|
|
|
|
|
|
|
|
|
|
|
|
|
|
|
|
|
|
|
|
|
|
|
|
|
|
|
|
|
|
Mahakam PSC
|
|
|
400,729
|
|
|
|
—
|
|
|
|
—
|
|
|
|
—
|
|
|
|
—
|
|
|
|
—
|
|
|
|
841,410
|
(1)
|
|
|
1,242,139
|
|
|
Tengah PSC
|
|
|
2,074
|
|
|
|
—
|
|
|
|
—
|
|
|
|
—
|
|
|
|
—
|
|
|
|
—
|
|
|
|
16,201
|
|
|
|
18,275
|
|
|
Total
|
|
|
402,803
|
|
|
|
—
|
|
|
|
—
|
|
|
|
—
|
|
|
|
—
|
|
|
|
—
|
|
|
|
857,611
|
|
|
|
1,260,414
|
|
|
Payments per Government
|
|
|
|
|
|
|
|
|
|
|
|
|
|
|
|
|
|
|
|
|
|
|
|
|
|
|
|
|
|
|
|
|
|
Directorate General of Taxation, Ministry of Finance
|
|
|
402,803
|
|
|
|
—
|
|
|
|
—
|
|
|
|
—
|
|
|
|
—
|
|
|
|
—
|
|
|
|
—
|
|
|
|
402,803
|
|
|
Satuan Khusus Kegiatan Usaha Hulu Minyak dan Gas Bumi (SKK Migas)
|
|
|
—
|
|
|
|
—
|
|
|
|
—
|
|
|
|
—
|
|
|
|
—
|
|
|
|
—
|
|
|
|
857,611
|
(1)
|
|
|
857,611
|
|
|
Total
|
|
|
402,803
|
|
|
|
—
|
|
|
|
—
|
|
|
|
—
|
|
|
|
—
|
|
|
|
—
|
|
|
|
857,611
|
|
|
|
1,260,414
|
|
|
|
|
|
|
|
|
|
|
|
|
Iraq
|
|
|
|
|
|
|
|
|
|
|
|
|
|
|
|
|
|
|
|
|
|
|
|
|
|
|
|
|
|
|
|
|
|
Payments per Project
|
|
|
|
|
|
|
|
|
|
|
|
|
|
|
|
|
|
|
|
|
|
|
|
|
|
|
|
|
|
|
|
|
|
Baranan Block
|
|
|
—
|
|
|
|
—
|
|
|
|
565
|
|
|
|
—
|
|
|
|
—
|
|
|
|
—
|
|
|
|
—
|
|
|
|
565
|
|
|
Halfaya
|
|
|
3,892
|
|
|
|
—
|
|
|
|
—
|
|
|
|
—
|
|
|
|
—
|
|
|
|
—
|
|
|
|
—
|
|
|
|
3,892
|
|
|
Total
|
|
|
3,892
|
|
|
|
—
|
|
|
|
565
|
|
|
|
—
|
|
|
|
—
|
|
|
|
—
|
|
|
|
—
|
|
|
|
4,457
|
|
|
Payments per Government
|
|
|
|
|
|
|
|
|
|
|
|
|
|
|
|
|
|
|
|
|
|
|
|
|
|
|
|
|
|
|
|
|
|
Ministry of Natural Resources, Erbil, Kurdistan region of Iraq
|
|
|
—
|
|
|
|
—
|
|
|
|
565
|
|
|
|
—
|
|
|
|
—
|
|
|
|
—
|
|
|
|
—
|
|
|
|
565
|
|
|
Iraq government
|
|
|
3,892
|
|
|
|
—
|
|
|
|
—
|
|
|
|
—
|
|
|
|
—
|
|
|
|
—
|
|
|
|
—
|
|
|
|
3,892
|
|
|
Total
|
|
|
3,892
|
|
|
|
—
|
|
|
|
565
|
|
|
|
—
|
|
|
|
—
|
|
|
|
—
|
|
|
|
—
|
|
|
|
4,457
|
|
|
|
|
|
|
|
|
|
|
|
|
Italy
|
|
|
|
|
|
|
|
|
|
|
|
|
|
|
|
|
|
|
|
|
|
|
|
|
|
|
|
|
|
|
|
|
|
Payments per Project
|
|
|
|
|
|
|
|
|
|
|
|
|
|
|
|
|
|
|
|
|
|
|
|
|
|
|
|
|
|
|
|
|
|
Gorgoglione Unified License
|
|
|
—
|
|
|
|
—
|
|
|
|
139
|
|
|
|
—
|
|
|
|
—
|
|
|
|
—
|
|
|
|
—
|
|
|
|
139
|
|
|
Total
|
|
|
—
|
|
|
|
—
|
|
|
|
139
|
|
|
|
—
|
|
|
|
—
|
|
|
|
—
|
|
|
|
—
|
|
|
|
139
|
|
|
Payments per Government
|
|
|
|
|
|
|
|
|
|
|
|
|
|
|
|
|
|
|
|
|
|
|
|
|
|
|
|
|
|
|
|
|
|
Regione Basilicata
|
|
|
—
|
|
|
|
—
|
|
|
|
139
|
|
|
|
—
|
|
|
|
—
|
|
|
|
—
|
|
|
|
—
|
|
|
|
139
|
|
|
Total
|
|
|
—
|
|
|
|
—
|
|
|
|
139
|
|
|
|
—
|
|
|
|
—
|
|
|
|
—
|
|
|
|
—
|
|
|
|
139
|
|
|
|
|
|
|
|
|
|
|
|
|
Kazakhstan
|
|
|
|
|
|
|
|
|
|
|
|
|
|
|
|
|
|
|
|
|
|
|
|
|
|
|
|
|
|
|
|
|
|
Payments per Project
|
|
|
|
|
|
|
|
|
|
|
|
|
|
|
|
|
|
|
|
|
|
|
|
|
|
|
|
|
|
|
|
|
|
Nurmunaï
|
|
|
—
|
|
|
|
—
|
|
|
|
120
|
|
|
|
—
|
|
|
|
—
|
|
|
|
—
|
|
|
|
—
|
|
|
|
120
|
|
|
Kashagan
|
|
|
—
|
|
|
|
—
|
|
|
|
—
|
|
|
|
20,172
|
|
|
|
—
|
|
|
|
11,612
|
|
|
|
—
|
|
|
|
31,784
|
|
|
Total
|
|
|
—
|
|
|
|
—
|
|
|
|
120
|
|
|
|
20,172
|
|
|
|
—
|
|
|
|
11,612
|
|
|
|
—
|
|
|
|
31,904
|
|
|
Payments per Government
|
|
|
|
|
|
|
|
|
|
|
|
|
|
|
|
|
|
|
|
|
|
|
|
|
|
|
|
|
|
|
|
|
|
Aktobe Region Akimat
|
|
|
—
|
|
|
|
—
|
|
|
|
120
|
|
|
|
—
|
|
|
|
—
|
|
|
|
—
|
|
|
|
—
|
|
|
|
120
|
|
|
Government of the Republic of Kazakhstan
|
|
|
—
|
|
|
|
—
|
|
|
|
—
|
|
|
|
20,172
|
|
|
|
—
|
|
|
|
—
|
|
|
|
—
|
|
|
|
20,172
|
|
|
Atyrau region c/o North Caspian Operating Company b.v.
|
|
|
—
|
|
|
|
—
|
|
|
|
—
|
|
|
|
—
|
|
|
|
—
|
|
|
|
8,864
|
|
|
|
—
|
|
|
|
8,864
|
|
|
Mangistau region c/o North Caspian Operating Company b.v.
|
|
|
—
|
|
|
|
—
|
|
|
|
—
|
|
|
|
—
|
|
|
|
—
|
|
|
|
2,748
|
|
|
|
—
|
|
|
|
2,748
|
|
|
Total
|
|
|
—
|
|
|
|
—
|
|
|
|
120
|
|
|
|
20,172
|
|
|
|
—
|
|
|
|
11,612
|
|
|
|
—
|
|
|
|
31,904
|
|
|
|
|
|
|
|
|
|
|
|
|
Kenya
|
|
|
|
|
|
|
|
|
|
|
|
|
|
|
|
|
|
|
|
|
|
|
|
|
|
|
|
|
|
|
|
|
|
Payments per Project
|
|
|
|
|
|
|
|
|
|
|
|
|
|
|
|
|
|
|
|
|
|
|
|
|
|
|
|
|
|
|
|
|
|
Block L22
|
|
|
—
|
|
|
|
—
|
|
|
|
228
|
|
|
|
—
|
|
|
|
—
|
|
|
|
—
|
|
|
|
—
|
|
|
|
228
|
|
|
Total
|
|
|
—
|
|
|
|
—
|
|
|
|
228
|
|
|
|
—
|
|
|
|
—
|
|
|
|
—
|
|
|
|
—
|
|
|
|
228
|
|
|
Payments per Government
|
|
|
|
|
|
|
|
|
|
|
|
|
|
|
|
|
|
|
|
|
|
|
|
|
|
|
|
|
|
|
|
|
|
Kenya Ministry of Energy
|
|
|
—
|
|
|
|
—
|
|
|
|
228
|
|
|
|
—
|
|
|
|
—
|
|
|
|
—
|
|
|
|
—
|
|
|
|
228
|
|
|
Total
|
|
|
—
|
|
|
|
—
|
|
|
|
228
|
|
|
|
—
|
|
|
|
—
|
|
|
|
—
|
|
|
|
—
|
|
|
|
228
|
|
|
|
|
|
|
S-24
|
|
TOTAL S.A. Form 20-F 2015
|
|
(1)
|
Government Production entitlement for export LNG is valued on a net-back price
basis (revenues less costs, such as liquefaction and transportation costs). Production entitlement includes volume of oil taken by the Government to meet domestic obligation. The fees received from the Government are deducted from the valuation of
these volumes.
|
|
|
|
|
|
|
|
|
|
|
|
|
|
|
|
|
|
|
|
|
|
|
|
|
|
|
|
|
|
|
|
|
|
|
|
(in thousands of dollars)
|
|
Taxes
|
|
|
Royalties
|
|
|
License
fees
|
|
|
License
bonus
|
|
|
Dividends
|
|
|
Infrastructure
improvements
|
|
|
Production
entitlements
|
|
|
Total of
Payments
|
|
|
|
|
|
|
|
|
|
|
|
|
Libya
|
|
|
|
|
|
|
|
|
|
|
|
|
|
|
|
|
|
|
|
|
|
|
|
|
|
|
|
|
|
|
|
|
|
Payments per Project
|
|
|
|
|
|
|
|
|
|
|
|
|
|
|
|
|
|
|
|
|
|
|
|
|
|
|
|
|
|
|
|
|
|
Areas 15, 16 & 32 (Al Jurf)
|
|
|
160,461
|
|
|
|
—
|
|
|
|
—
|
|
|
|
—
|
|
|
|
—
|
|
|
|
—
|
|
|
|
203,176
|
|
|
|
363,637
|
|
|
Total
|
|
|
160,461
|
|
|
|
—
|
|
|
|
—
|
|
|
|
—
|
|
|
|
—
|
|
|
|
—
|
|
|
|
203,176
|
|
|
|
363,637
|
|
|
Payments per Government
|
|
|
|
|
|
|
|
|
|
|
|
|
|
|
|
|
|
|
|
|
|
|
|
|
|
|
|
|
|
|
|
|
|
National Oil Corporation
|
|
|
—
|
|
|
|
—
|
|
|
|
—
|
|
|
|
—
|
|
|
|
—
|
|
|
|
—
|
|
|
|
203,176
|
|
|
|
203,176
|
|
|
Ministry of Finance c/o National Oil Corporation
|
|
|
160,461
|
|
|
|
—
|
|
|
|
—
|
|
|
|
—
|
|
|
|
—
|
|
|
|
—
|
|
|
|
—
|
|
|
|
160,461
|
|
|
Total
|
|
|
160,461
|
|
|
|
—
|
|
|
|
—
|
|
|
|
—
|
|
|
|
—
|
|
|
|
—
|
|
|
|
203,176
|
|
|
|
363,637
|
|
|
|
|
|
|
|
|
|
|
|
|
Madagascar
|
|
|
|
|
|
|
|
|
|
|
|
|
|
|
|
|
|
|
|
|
|
|
|
|
|
|
|
|
|
|
|
|
|
Payments per Project
|
|
|
|
|
|
|
|
|
|
|
|
|
|
|
|
|
|
|
|
|
|
|
|
|
|
|
|
|
|
|
|
|
|
Bemolanga
|
|
|
—
|
|
|
|
—
|
|
|
|
425
|
|
|
|
—
|
|
|
|
—
|
|
|
|
—
|
|
|
|
—
|
|
|
|
425
|
|
|
Total
|
|
|
—
|
|
|
|
—
|
|
|
|
425
|
|
|
|
—
|
|
|
|
—
|
|
|
|
—
|
|
|
|
—
|
|
|
|
425
|
|
|
Payments per Government
|
|
|
|
|
|
|
|
|
|
|
|
|
|
|
|
|
|
|
|
|
|
|
|
|
|
|
|
|
|
|
|
|
|
Office des Mines Nationaleset des Industries Stratégiques
|
|
|
—
|
|
|
|
—
|
|
|
|
425
|
|
|
|
—
|
|
|
|
—
|
|
|
|
—
|
|
|
|
—
|
|
|
|
425
|
|
|
Total
|
|
|
—
|
|
|
|
—
|
|
|
|
425
|
|
|
|
—
|
|
|
|
—
|
|
|
|
—
|
|
|
|
—
|
|
|
|
425
|
|
|
|
|
|
|
|
|
|
|
|
|
Mauritania
|
|
|
|
|
|
|
|
|
|
|
|
|
|
|
|
|
|
|
|
|
|
|
|
|
|
|
|
|
|
|
|
|
|
Payments per Project
|
|
|
|
|
|
|
|
|
|
|
|
|
|
|
|
|
|
|
|
|
|
|
|
|
|
|
|
|
|
|
|
|
|
Block C9
|
|
|
—
|
|
|
|
—
|
|
|
|
170
|
|
|
|
—
|
|
|
|
—
|
|
|
|
—
|
|
|
|
—
|
|
|
|
170
|
|
|
Block TA29
|
|
|
—
|
|
|
|
—
|
|
|
|
175
|
|
|
|
—
|
|
|
|
—
|
|
|
|
—
|
|
|
|
—
|
|
|
|
175
|
|
|
Total
|
|
|
—
|
|
|
|
—
|
|
|
|
345
|
|
|
|
—
|
|
|
|
—
|
|
|
|
—
|
|
|
|
—
|
|
|
|
345
|
|
|
Payments per Government
|
|
|
|
|
|
|
|
|
|
|
|
|
|
|
|
|
|
|
|
|
|
|
|
|
|
|
|
|
|
|
|
|
|
Trésor Public de Mauritanie
|
|
|
—
|
|
|
|
—
|
|
|
|
345
|
|
|
|
—
|
|
|
|
—
|
|
|
|
—
|
|
|
|
—
|
|
|
|
345
|
|
|
Total
|
|
|
—
|
|
|
|
—
|
|
|
|
345
|
|
|
|
—
|
|
|
|
—
|
|
|
|
—
|
|
|
|
—
|
|
|
|
345
|
|
|
|
|
|
|
|
|
|
|
|
|
Morocco
|
|
|
|
|
|
|
|
|
|
|
|
|
|
|
|
|
|
|
|
|
|
|
|
|
|
|
|
|
|
|
|
|
|
Payments per Project
|
|
|
|
|
|
|
|
|
|
|
|
|
|
|
|
|
|
|
|
|
|
|
|
|
|
|
|
|
|
|
|
|
|
Anzarane
|
|
|
—
|
|
|
|
—
|
|
|
|
3,859
|
|
|
|
—
|
|
|
|
—
|
|
|
|
—
|
|
|
|
—
|
|
|
|
3,859
|
|
|
Total
|
|
|
—
|
|
|
|
—
|
|
|
|
3,859
|
|
|
|
—
|
|
|
|
—
|
|
|
|
—
|
|
|
|
—
|
|
|
|
3,859
|
|
|
Payments per Government
|
|
|
|
|
|
|
|
|
|
|
|
|
|
|
|
|
|
|
|
|
|
|
|
|
|
|
|
|
|
|
|
|
|
Office National des Hydrocarbures
|
|
|
—
|
|
|
|
—
|
|
|
|
3,859
|
|
|
|
—
|
|
|
|
—
|
|
|
|
—
|
|
|
|
—
|
|
|
|
3,859
|
|
|
Total
|
|
|
—
|
|
|
|
—
|
|
|
|
3,859
|
|
|
|
—
|
|
|
|
—
|
|
|
|
—
|
|
|
|
—
|
|
|
|
3,859
|
|
|
|
|
|
|
|
|
|
|
|
|
Myanmar
|
|
|
|
|
|
|
|
|
|
|
|
|
|
|
|
|
|
|
|
|
|
|
|
|
|
|
|
|
|
|
|
|
|
Payments per Project
|
|
|
|
|
|
|
|
|
|
|
|
|
|
|
|
|
|
|
|
|
|
|
|
|
|
|
|
|
|
|
|
|
|
Blocks M5 and M6
|
|
|
39,037
|
|
|
|
—
|
|
|
|
—
|
|
|
|
—
|
|
|
|
—
|
|
|
|
—
|
|
|
|
133,478
|
|
|
|
172,515
|
|
|
Total
|
|
|
39,037
|
|
|
|
—
|
|
|
|
—
|
|
|
|
—
|
|
|
|
—
|
|
|
|
—
|
|
|
|
133,478
|
|
|
|
172,515
|
|
|
Payments per Government
|
|
|
|
|
|
|
|
|
|
|
|
|
|
|
|
|
|
|
|
|
|
|
|
|
|
|
|
|
|
|
|
|
|
Myanmar Ministry of Finance
|
|
|
39,037
|
|
|
|
—
|
|
|
|
—
|
|
|
|
—
|
|
|
|
—
|
|
|
|
—
|
|
|
|
—
|
|
|
|
39,037
|
|
|
Myanmar Oil and Gas Enterprise
|
|
|
—
|
|
|
|
—
|
|
|
|
—
|
|
|
|
—
|
|
|
|
—
|
|
|
|
—
|
|
|
|
133,478
|
|
|
|
133,478
|
|
|
Total
|
|
|
39,037
|
|
|
|
—
|
|
|
|
—
|
|
|
|
—
|
|
|
|
—
|
|
|
|
—
|
|
|
|
133,478
|
|
|
|
172,515
|
|
|
|
|
|
|
2015 Form 20-F TOTAL S.A.
|
|
S-25
|
|
|
|
|
|
|
|
|
|
|
|
|
|
|
|
|
|
|
|
|
|
|
|
|
|
|
|
|
|
|
|
|
|
|
|
(in thousands of dollars)
|
|
Taxes
|
|
|
Royalties
|
|
|
License
fees
|
|
|
License
bonus
|
|
|
Dividends
|
|
|
Infrastructure
improvements
|
|
|
Production
entitlements
|
|
|
Total of
Payments
|
|
|
|
|
|
|
|
|
|
|
|
|
Nigeria
|
|
|
|
|
|
|
|
|
|
|
|
|
|
|
|
|
|
|
|
|
|
|
|
|
|
|
|
|
|
|
|
|
|
Payments per Project
|
|
|
|
|
|
|
|
|
|
|
|
|
|
|
|
|
|
|
|
|
|
|
|
|
|
|
|
|
|
|
|
|
|
Joint ventures with NNPC, operated – non-attributable
|
|
|
16,158
|
|
|
|
—
|
|
|
|
3,749
|
|
|
|
—
|
|
|
|
—
|
|
|
|
46,122
|
|
|
|
—
|
|
|
|
66,029
|
|
|
Joint ventures with NNPC, non operated – non-attributable
|
|
|
132,899
|
|
|
|
—
|
|
|
|
182
|
|
|
|
—
|
|
|
|
—
|
|
|
|
—
|
|
|
|
—
|
|
|
|
133,081
|
|
|
OML58 (joint venture with NNPC, operated)
|
|
|
30,805
|
|
|
|
—
|
|
|
|
—
|
|
|
|
—
|
|
|
|
—
|
|
|
|
—
|
|
|
|
—
|
|
|
|
30,805
|
|
|
OML99 (joint venture with NNPC, operated)
|
|
|
41,401
|
|
|
|
—
|
|
|
|
—
|
|
|
|
—
|
|
|
|
—
|
|
|
|
—
|
|
|
|
—
|
|
|
|
41,401
|
|
|
OML100 (joint venture with NNPC, operated)
|
|
|
23,770
|
|
|
|
—
|
|
|
|
—
|
|
|
|
—
|
|
|
|
—
|
|
|
|
—
|
|
|
|
—
|
|
|
|
23,770
|
|
|
OML102 (joint venture with NNPC, operated)
|
|
|
29,361
|
|
|
|
—
|
|
|
|
—
|
|
|
|
—
|
|
|
|
—
|
|
|
|
—
|
|
|
|
—
|
|
|
|
29,361
|
|
|
OML102 Ekanga (joint venture with NNPC, non operated)
|
|
|
15,429
|
|
|
|
—
|
|
|
|
—
|
|
|
|
—
|
|
|
|
—
|
|
|
|
—
|
|
|
|
—
|
|
|
|
15,429
|
|
|
OML130
|
|
|
—
|
|
|
|
—
|
|
|
|
1,517
|
|
|
|
—
|
|
|
|
—
|
|
|
|
—
|
|
|
|
—
|
|
|
|
1,517
|
|
|
OML130 PSA (Akpo & Egina)
|
|
|
108,594
|
|
|
|
—
|
|
|
|
—
|
|
|
|
—
|
|
|
|
—
|
|
|
|
53,385
|
|
|
|
—
|
|
|
|
161,979
|
|
|
OML118 (Bonga)
|
|
|
92,383
|
|
|
|
—
|
|
|
|
—
|
|
|
|
—
|
|
|
|
—
|
|
|
|
—
|
|
|
|
58,961
|
|
|
|
151,344
|
|
|
OML138 (Usan)
|
|
|
32,028
|
|
|
|
—
|
|
|
|
—
|
|
|
|
—
|
|
|
|
—
|
|
|
|
—
|
|
|
|
—
|
|
|
|
32,028
|
|
|
OPL223
|
|
|
—
|
|
|
|
—
|
|
|
|
—
|
|
|
|
—
|
|
|
|
—
|
|
|
|
390
|
|
|
|
—
|
|
|
|
390
|
|
|
OPL285
|
|
|
—
|
|
|
|
—
|
|
|
|
173
|
|
|
|
—
|
|
|
|
—
|
|
|
|
—
|
|
|
|
—
|
|
|
|
173
|
|
|
Non-attributable
|
|
|
331,077
|
(1)
|
|
|
—
|
|
|
|
—
|
|
|
|
—
|
|
|
|
—
|
|
|
|
—
|
|
|
|
—
|
|
|
|
331,077
|
|
|
Total
|
|
|
853,905
|
|
|
|
—
|
|
|
|
5,621
|
|
|
|
—
|
|
|
|
—
|
|
|
|
99,897
|
|
|
|
58,961
|
|
|
|
1,018,384
|
|
|
Payments per Government
|
|
|
|
|
|
|
|
|
|
|
|
|
|
|
|
|
|
|
|
|
|
|
|
|
|
|
|
|
|
|
|
|
|
Federal Inland Revenue Service
|
|
|
389,700
|
(1)
|
|
|
—
|
|
|
|
—
|
|
|
|
—
|
|
|
|
—
|
|
|
|
—
|
|
|
|
—
|
|
|
|
389,700
|
|
|
Department of Petroleum Resources, Federal Government of Nigeria
|
|
|
273,177
|
|
|
|
—
|
|
|
|
581
|
|
|
|
—
|
|
|
|
—
|
|
|
|
—
|
|
|
|
—
|
|
|
|
273,758
|
|
|
Niger Delta Development Commission
|
|
|
—
|
|
|
|
—
|
|
|
|
—
|
|
|
|
—
|
|
|
|
—
|
|
|
|
99,897
|
|
|
|
—
|
|
|
|
99,897
|
|
|
Nigerian Maritime Administration & Safety Agency, Federal Government of Nigeria
|
|
|
—
|
|
|
|
—
|
|
|
|
5,040
|
|
|
|
—
|
|
|
|
—
|
|
|
|
—
|
|
|
|
—
|
|
|
|
5,040
|
|
|
Nigerian National Petroleum Corporation
|
|
|
98,645
|
|
|
|
—
|
|
|
|
—
|
|
|
|
—
|
|
|
|
—
|
|
|
|
—
|
|
|
|
58,961
|
|
|
|
157,606
|
|
|
Federal Inland Revenue Service c/o Nigerian National Petroleum Corporation
|
|
|
87,654
|
|
|
|
—
|
|
|
|
—
|
|
|
|
—
|
|
|
|
—
|
|
|
|
—
|
|
|
|
—
|
|
|
|
87,654
|
|
|
Department of Petroleum Resources c/o Nigerian National Petroleum Corporation
|
|
|
4,729
|
|
|
|
—
|
|
|
|
—
|
|
|
|
—
|
|
|
|
—
|
|
|
|
—
|
|
|
|
—
|
|
|
|
4,729
|
|
|
Total
|
|
|
853,905
|
|
|
|
—
|
|
|
|
5,621
|
|
|
|
—
|
|
|
|
—
|
|
|
|
99,897
|
|
|
|
58,961
|
|
|
|
1,018,384
|
|
|
|
|
|
|
|
|
|
|
|
|
Norway
|
|
|
|
|
|
|
|
|
|
|
|
|
|
|
|
|
|
|
|
|
|
|
|
|
|
|
|
|
|
|
|
|
|
Payments per Project
|
|
|
|
|
|
|
|
|
|
|
|
|
|
|
|
|
|
|
|
|
|
|
|
|
|
|
|
|
|
|
|
|
|
Non-attributable
|
|
|
837,188
|
|
|
|
—
|
|
|
|
—
|
|
|
|
—
|
|
|
|
—
|
|
|
|
—
|
|
|
|
—
|
|
|
|
837,188
|
|
|
Martin Linge
|
|
|
—
|
|
|
|
—
|
|
|
|
(3,761
|
)
(2)
|
|
|
—
|
|
|
|
—
|
|
|
|
—
|
|
|
|
—
|
|
|
|
(3,761)
|
|
|
Trell
|
|
|
—
|
|
|
|
—
|
|
|
|
(385
|
)
(2)
|
|
|
—
|
|
|
|
—
|
|
|
|
—
|
|
|
|
—
|
|
|
|
(385)
|
|
|
Alve North
|
|
|
—
|
|
|
|
—
|
|
|
|
1,580
|
|
|
|
—
|
|
|
|
—
|
|
|
|
—
|
|
|
|
—
|
|
|
|
1,580
|
|
|
Skirne & Bygve
|
|
|
—
|
|
|
|
—
|
|
|
|
408
|
|
|
|
—
|
|
|
|
—
|
|
|
|
—
|
|
|
|
—
|
|
|
|
408
|
|
|
Victoria
|
|
|
—
|
|
|
|
—
|
|
|
|
1,308
|
|
|
|
—
|
|
|
|
—
|
|
|
|
—
|
|
|
|
—
|
|
|
|
1,308
|
|
|
Garantiana
|
|
|
—
|
|
|
|
—
|
|
|
|
1,424
|
|
|
|
—
|
|
|
|
—
|
|
|
|
—
|
|
|
|
—
|
|
|
|
1,424
|
|
|
Islay
|
|
|
—
|
|
|
|
—
|
|
|
|
51
|
|
|
|
—
|
|
|
|
—
|
|
|
|
—
|
|
|
|
—
|
|
|
|
51
|
|
|
Atla
|
|
|
—
|
|
|
|
—
|
|
|
|
2,276
|
|
|
|
—
|
|
|
|
—
|
|
|
|
—
|
|
|
|
—
|
|
|
|
2,276
|
|
|
PL026 Rind
|
|
|
—
|
|
|
|
—
|
|
|
|
149
|
|
|
|
—
|
|
|
|
—
|
|
|
|
—
|
|
|
|
—
|
|
|
|
149
|
|
|
PL006 Tor
|
|
|
—
|
|
|
|
—
|
|
|
|
188
|
|
|
|
—
|
|
|
|
—
|
|
|
|
—
|
|
|
|
—
|
|
|
|
188
|
|
|
Total
|
|
|
837,188
|
|
|
|
—
|
|
|
|
3,238
|
|
|
|
—
|
|
|
|
—
|
|
|
|
—
|
|
|
|
—
|
|
|
|
840,426
|
|
|
Payments per Government
|
|
|
|
|
|
|
|
|
|
|
|
|
|
|
|
|
|
|
|
|
|
|
|
|
|
|
|
|
|
|
|
|
|
Norwegian Tax Administration
|
|
|
837,188
|
|
|
|
—
|
|
|
|
—
|
|
|
|
—
|
|
|
|
—
|
|
|
|
—
|
|
|
|
—
|
|
|
|
837,188
|
|
|
Norwegian Petroleum Directorate
|
|
|
—
|
|
|
|
—
|
|
|
|
3,238
|
(2)
|
|
|
—
|
|
|
|
—
|
|
|
|
—
|
|
|
|
—
|
|
|
|
3,238
|
|
|
Total
|
|
|
837,188
|
|
|
|
—
|
|
|
|
3,238
|
|
|
|
—
|
|
|
|
—
|
|
|
|
—
|
|
|
|
—
|
|
|
|
840,426
|
|
|
|
|
|
|
S-26
|
|
TOTAL S.A. Form 20-F 2015
|
|
(1)
|
This amount includes $59 million which reduce the actual tax liability of 2015 in accordance with the provisions of the Modified Carry Agreement (MCA).
Under the MCA, Total E&P Nigeria is entitled to recover 85% of the Carry Capital Cost through claims of capital allowance, described in the MCA as “Carry Tax Relief”. The balance of 15% is to be recovered from NNPC’s share of
crude oil produced.
|
|
(2)
|
Includes refunds of area fees paid in 2012, 2013 and 2014 after revision of the areas’ surface.
|
|
|
|
|
|
|
|
|
|
|
|
|
|
|
|
|
|
|
|
|
|
|
|
|
|
|
|
|
|
|
|
|
|
|
|
(in thousands of dollars)
|
|
Taxes
|
|
|
Royalties
|
|
|
License
fees
|
|
|
License
bonus
|
|
|
Dividends
|
|
|
Infrastructure
improvements
|
|
|
Production
entitlements
|
|
|
Total of
Payments
|
|
|
|
|
|
|
|
|
|
|
|
|
Oman
|
|
|
|
|
|
|
|
|
|
|
|
|
|
|
|
|
|
|
|
|
|
|
|
|
|
|
|
|
|
|
|
|
|
Payments per Project
|
|
|
|
|
|
|
|
|
|
|
|
|
|
|
|
|
|
|
|
|
|
|
|
|
|
|
|
|
|
|
|
|
|
Block 6
|
|
|
250,033
|
|
|
|
—
|
|
|
|
—
|
|
|
|
—
|
|
|
|
—
|
|
|
|
—
|
|
|
|
—
|
|
|
|
250,033
|
|
|
Block 53
|
|
|
2,687
|
|
|
|
—
|
|
|
|
—
|
|
|
|
—
|
|
|
|
—
|
|
|
|
—
|
|
|
|
13,437
|
|
|
|
16,124
|
|
|
Total
|
|
|
252,720
|
|
|
|
—
|
|
|
|
—
|
|
|
|
—
|
|
|
|
—
|
|
|
|
—
|
|
|
|
13,437
|
|
|
|
266,157
|
|
|
Payments per Government
|
|
|
|
|
|
|
|
|
|
|
|
|
|
|
|
|
|
|
|
|
|
|
|
|
|
|
|
|
|
|
|
|
|
Oman Ministry of Oil and Gas
|
|
|
—
|
|
|
|
—
|
|
|
|
—
|
|
|
|
—
|
|
|
|
—
|
|
|
|
—
|
|
|
|
13,437
|
|
|
|
13,437
|
|
|
Oman Ministry of Finance
|
|
|
252,720
|
|
|
|
—
|
|
|
|
—
|
|
|
|
—
|
|
|
|
—
|
|
|
|
—
|
|
|
|
—
|
|
|
|
252,720
|
|
|
Total
|
|
|
252,720
|
|
|
|
—
|
|
|
|
—
|
|
|
|
—
|
|
|
|
—
|
|
|
|
—
|
|
|
|
13,437
|
|
|
|
266,157
|
|
|
|
|
|
|
|
|
|
|
|
|
Qatar
|
|
|
|
|
|
|
|
|
|
|
|
|
|
|
|
|
|
|
|
|
|
|
|
|
|
|
|
|
|
|
|
|
|
Payments per Project
|
|
|
|
|
|
|
|
|
|
|
|
|
|
|
|
|
|
|
|
|
|
|
|
|
|
|
|
|
|
|
|
|
|
Al Khalij
|
|
|
115,485
|
|
|
|
—
|
|
|
|
—
|
|
|
|
—
|
|
|
|
—
|
|
|
|
21,136
|
|
|
|
—
|
|
|
|
136,621
|
|
|
Qatargas 1
|
|
|
39,650
|
|
|
|
—
|
|
|
|
—
|
|
|
|
—
|
|
|
|
—
|
|
|
|
—
|
|
|
|
62,245
|
|
|
|
101,895
|
|
|
Dolphin
|
|
|
58,996
|
|
|
|
—
|
|
|
|
—
|
|
|
|
—
|
|
|
|
—
|
|
|
|
—
|
|
|
|
541,120
|
|
|
|
600,116
|
|
|
Total
|
|
|
214,131
|
|
|
|
—
|
|
|
|
—
|
|
|
|
—
|
|
|
|
—
|
|
|
|
21,136
|
|
|
|
603,365
|
|
|
|
838,632
|
|
|
Payments per Government
|
|
|
|
|
|
|
|
|
|
|
|
|
|
|
|
|
|
|
|
|
|
|
|
|
|
|
|
|
|
|
|
|
|
Qatar Petroleum
|
|
|
—
|
|
|
|
—
|
|
|
|
—
|
|
|
|
—
|
|
|
|
—
|
|
|
|
21,136
|
|
|
|
603,365
|
|
|
|
624,501
|
|
|
Qatar Ministry of Finance
|
|
|
214,131
|
|
|
|
—
|
|
|
|
—
|
|
|
|
—
|
|
|
|
—
|
|
|
|
—
|
|
|
|
—
|
|
|
|
214,131
|
|
|
Total
|
|
|
214,131
|
|
|
|
—
|
|
|
|
—
|
|
|
|
—
|
|
|
|
—
|
|
|
|
21,136
|
|
|
|
603,365
|
|
|
|
838,632
|
|
|
|
|
|
|
|
|
|
|
|
|
Republic of the Congo
|
|
|
|
|
|
|
|
|
|
|
|
|
|
|
|
|
|
|
|
|
|
|
|
|
|
|
|
|
|
|
|
|
|
Payments per Project
|
|
|
|
|
|
|
|
|
|
|
|
|
|
|
|
|
|
|
|
|
|
|
|
|
|
|
|
|
|
|
|
|
|
CPP Haute Mer - Zone A
|
|
|
95,539
|
|
|
|
—
|
|
|
|
—
|
|
|
|
—
|
|
|
|
—
|
|
|
|
—
|
|
|
|
—
|
|
|
|
95,539
|
|
|
CPP Haute Mer - Zone B
|
|
|
12,708
|
|
|
|
—
|
|
|
|
282
|
|
|
|
—
|
|
|
|
—
|
|
|
|
—
|
|
|
|
—
|
|
|
|
12,990
|
|
|
CPP Haute Mer - Zone D
|
|
|
92,369
|
|
|
|
—
|
|
|
|
4,344
|
|
|
|
—
|
|
|
|
—
|
|
|
|
—
|
|
|
|
—
|
|
|
|
96,713
|
|
|
CPP Pointe Noire Grands Fonds (PNGF)
|
|
|
101,602
|
|
|
|
—
|
|
|
|
3,257
|
|
|
|
—
|
|
|
|
—
|
|
|
|
—
|
|
|
|
—
|
|
|
|
104,859
|
|
|
CPP Tchendo 2
|
|
|
16,433
|
|
|
|
—
|
|
|
|
425
|
|
|
|
—
|
|
|
|
—
|
|
|
|
—
|
|
|
|
—
|
|
|
|
16,858
|
|
|
Kombi, Likalala & Libondo
|
|
|
77,287
|
|
|
|
—
|
|
|
|
125
|
|
|
|
—
|
|
|
|
—
|
|
|
|
—
|
|
|
|
—
|
|
|
|
77,412
|
|
|
Litanzi & Tchibeli
|
|
|
14,990
|
|
|
|
—
|
|
|
|
11
|
|
|
|
—
|
|
|
|
—
|
|
|
|
—
|
|
|
|
—
|
|
|
|
15,001
|
|
|
Lianzi
|
|
|
—
|
|
|
|
—
|
|
|
|
—
|
|
|
|
—
|
|
|
|
—
|
|
|
|
—
|
|
|
|
419
|
|
|
|
419
|
|
|
Madingo
|
|
|
28,914
|
|
|
|
—
|
|
|
|
1,154
|
|
|
|
—
|
|
|
|
—
|
|
|
|
—
|
|
|
|
—
|
|
|
|
30,068
|
|
|
Total
|
|
|
439,842
|
|
|
|
—
|
|
|
|
9,598
|
|
|
|
—
|
|
|
|
—
|
|
|
|
—
|
|
|
|
419
|
|
|
|
449,859
|
|
|
Payments per Government
|
|
|
|
|
|
|
|
|
|
|
|
|
|
|
|
|
|
|
|
|
|
|
|
|
|
|
|
|
|
|
|
|
|
Ministère des hydrocarbures
|
|
|
405,756
|
|
|
|
—
|
|
|
|
—
|
|
|
|
—
|
|
|
|
—
|
|
|
|
—
|
|
|
|
—
|
|
|
|
405,756
|
|
|
Trésor Public
|
|
|
34,086
|
|
|
|
—
|
|
|
|
9,598
|
|
|
|
—
|
|
|
|
—
|
|
|
|
—
|
|
|
|
—
|
|
|
|
43,684
|
|
|
Société Nationale des Pétroles Congolais
|
|
|
—
|
|
|
|
—
|
|
|
|
—
|
|
|
|
—
|
|
|
|
—
|
|
|
|
—
|
|
|
|
419
|
|
|
|
419
|
|
|
Total
|
|
|
439,842
|
|
|
|
—
|
|
|
|
9,598
|
|
|
|
—
|
|
|
|
—
|
|
|
|
—
|
|
|
|
419
|
|
|
|
449,859
|
|
|
|
|
|
|
|
|
|
|
|
|
Russia
|
|
|
|
|
|
|
|
|
|
|
|
|
|
|
|
|
|
|
|
|
|
|
|
|
|
|
|
|
|
|
|
|
|
Payments per Project
|
|
|
|
|
|
|
|
|
|
|
|
|
|
|
|
|
|
|
|
|
|
|
|
|
|
|
|
|
|
|
|
|
|
Kharyaga
|
|
|
76,582
|
|
|
|
—
|
|
|
|
356
|
|
|
|
—
|
|
|
|
—
|
|
|
|
—
|
|
|
|
70,973
|
|
|
|
147,911
|
|
|
Total
|
|
|
76,582
|
|
|
|
—
|
|
|
|
356
|
|
|
|
—
|
|
|
|
—
|
|
|
|
—
|
|
|
|
70,973
|
|
|
|
147,911
|
|
|
Payments per Government
|
|
|
|
|
|
|
|
|
|
|
|
|
|
|
|
|
|
|
|
|
|
|
|
|
|
|
|
|
|
|
|
|
|
Nenets Tax Inspection
|
|
|
76,582
|
|
|
|
—
|
|
|
|
356
|
|
|
|
—
|
|
|
|
—
|
|
|
|
—
|
|
|
|
—
|
|
|
|
76,938
|
|
|
Ministry of Energy
|
|
|
—
|
|
|
|
—
|
|
|
|
—
|
|
|
|
—
|
|
|
|
—
|
|
|
|
—
|
|
|
|
70,973
|
|
|
|
70,973
|
|
|
Total
|
|
|
76,582
|
|
|
|
—
|
|
|
|
356
|
|
|
|
—
|
|
|
|
—
|
|
|
|
—
|
|
|
|
70,973
|
|
|
|
147,911
|
|
|
|
|
|
|
|
|
|
|
|
|
South Africa
|
|
|
|
|
|
|
|
|
|
|
|
|
|
|
|
|
|
|
|
|
|
|
|
|
|
|
|
|
|
|
|
|
|
Payments per Project
|
|
|
|
|
|
|
|
|
|
|
|
|
|
|
|
|
|
|
|
|
|
|
|
|
|
|
|
|
|
|
|
|
|
Forzando and Dorstfontein
|
|
|
469
|
|
|
|
1,823
|
|
|
|
—
|
|
|
|
—
|
|
|
|
—
|
|
|
|
—
|
|
|
|
—
|
|
|
|
2,292
|
|
|
Total
|
|
|
469
|
|
|
|
1,823
|
|
|
|
—
|
|
|
|
—
|
|
|
|
—
|
|
|
|
—
|
|
|
|
—
|
|
|
|
2,292
|
|
|
Payments per Government
|
|
|
|
|
|
|
|
|
|
|
|
|
|
|
|
|
|
|
|
|
|
|
|
|
|
|
|
|
|
|
|
|
|
South African Revenue Service
|
|
|
469
|
|
|
|
1,823
|
|
|
|
—
|
|
|
|
—
|
|
|
|
—
|
|
|
|
—
|
|
|
|
—
|
|
|
|
2,292
|
|
|
Total
|
|
|
469
|
|
|
|
1,823
|
|
|
|
—
|
|
|
|
—
|
|
|
|
—
|
|
|
|
—
|
|
|
|
—
|
|
|
|
2,292
|
|
|
|
|
|
|
2015 Form 20-F TOTAL S.A.
|
|
S-27
|
|
|
|
|
|
|
|
|
|
|
|
|
|
|
|
|
|
|
|
|
|
|
|
|
|
|
|
|
|
|
|
|
|
|
|
(in thousands of dollars)
|
|
Taxes
|
|
|
Royalties
|
|
|
License
fees
|
|
|
License
bonus
|
|
|
Dividends
|
|
|
Infrastructure
improvements
|
|
|
Production
entitlements
|
|
|
Total of
Payments
|
|
|
|
|
|
|
|
|
|
|
|
|
Thailand
|
|
|
|
|
|
|
|
|
|
|
|
|
|
|
|
|
|
|
|
|
|
|
|
|
|
|
|
|
|
|
|
|
|
Payments per Project
|
|
|
|
|
|
|
|
|
|
|
|
|
|
|
|
|
|
|
|
|
|
|
|
|
|
|
|
|
|
|
|
|
|
Bongkot
|
|
|
360,417
|
|
|
|
—
|
|
|
|
—
|
|
|
|
37,352
|
|
|
|
—
|
|
|
|
—
|
|
|
|
—
|
|
|
|
397,769
|
|
|
Total
|
|
|
360,417
|
|
|
|
—
|
|
|
|
—
|
|
|
|
37,352
|
|
|
|
—
|
|
|
|
—
|
|
|
|
—
|
|
|
|
397,769
|
|
|
Payments per Government
|
|
|
|
|
|
|
|
|
|
|
|
|
|
|
|
|
|
|
|
|
|
|
|
|
|
|
|
|
|
|
|
|
|
Revenue Department
|
|
|
242,865
|
|
|
|
—
|
|
|
|
—
|
|
|
|
—
|
|
|
|
—
|
|
|
|
—
|
|
|
|
—
|
|
|
|
242,865
|
|
|
Department of Mineral Fuels,
|
|
|
|
|
|
|
|
|
|
|
|
|
|
|
|
|
|
|
|
|
|
|
|
|
|
|
|
|
|
|
|
|
|
Ministry Of Energy
|
|
|
117,552
|
|
|
|
—
|
|
|
|
—
|
|
|
|
—
|
|
|
|
—
|
|
|
|
—
|
|
|
|
—
|
|
|
|
117,552
|
|
|
Ministry Of Energy
|
|
|
—
|
|
|
|
—
|
|
|
|
—
|
|
|
|
37,352
|
|
|
|
—
|
|
|
|
—
|
|
|
|
—
|
|
|
|
37,352
|
|
|
Total
|
|
|
360,417
|
|
|
|
—
|
|
|
|
—
|
|
|
|
37,352
|
|
|
|
—
|
|
|
|
—
|
|
|
|
—
|
|
|
|
397,769
|
|
|
|
|
|
|
|
|
|
|
|
|
The Netherlands
|
|
|
|
|
|
|
|
|
|
|
|
|
|
|
|
|
|
|
|
|
|
|
|
|
|
|
|
|
|
|
|
|
|
Payments per Project
|
|
|
|
|
|
|
|
|
|
|
|
|
|
|
|
|
|
|
|
|
|
|
|
|
|
|
|
|
|
|
|
|
|
Non-attributable
|
|
|
10,172
|
|
|
|
—
|
|
|
|
—
|
|
|
|
—
|
|
|
|
—
|
|
|
|
—
|
|
|
|
—
|
|
|
|
10,172
|
|
|
Offshore Blocks
|
|
|
—
|
|
|
|
—
|
|
|
|
2,229
|
|
|
|
—
|
|
|
|
—
|
|
|
|
—
|
|
|
|
—
|
|
|
|
2,229
|
|
|
Total
|
|
|
10,172
|
|
|
|
—
|
|
|
|
2,229
|
|
|
|
—
|
|
|
|
—
|
|
|
|
—
|
|
|
|
—
|
|
|
|
12,401
|
|
|
Payments per Government
|
|
|
|
|
|
|
|
|
|
|
|
|
|
|
|
|
|
|
|
|
|
|
|
|
|
|
|
|
|
|
|
|
|
Belastingdienst Nederland
|
|
|
10,172
|
|
|
|
—
|
|
|
|
2,229
|
|
|
|
—
|
|
|
|
—
|
|
|
|
—
|
|
|
|
—
|
|
|
|
12,401
|
|
|
Total
|
|
|
10,172
|
|
|
|
—
|
|
|
|
2,229
|
|
|
|
—
|
|
|
|
—
|
|
|
|
—
|
|
|
|
—
|
|
|
|
12,401
|
|
|
|
|
|
|
|
|
|
|
|
|
Uganda
|
|
|
|
|
|
|
|
|
|
|
|
|
|
|
|
|
|
|
|
|
|
|
|
|
|
|
|
|
|
|
|
|
|
Payments per Project
|
|
|
|
|
|
|
|
|
|
|
|
|
|
|
|
|
|
|
|
|
|
|
|
|
|
|
|
|
|
|
|
|
|
Block EA-1
|
|
|
—
|
|
|
|
—
|
|
|
|
378
|
|
|
|
—
|
|
|
|
—
|
|
|
|
—
|
|
|
|
—
|
|
|
|
378
|
|
|
Block EA-1A
|
|
|
—
|
|
|
|
—
|
|
|
|
201
|
|
|
|
—
|
|
|
|
—
|
|
|
|
—
|
|
|
|
—
|
|
|
|
201
|
|
|
Total
|
|
|
—
|
|
|
|
—
|
|
|
|
579
|
|
|
|
—
|
|
|
|
—
|
|
|
|
—
|
|
|
|
—
|
|
|
|
579
|
|
|
Payments per Government
|
|
|
|
|
|
|
|
|
|
|
|
|
|
|
|
|
|
|
|
|
|
|
|
|
|
|
|
|
|
|
|
|
|
Ministry of Energy and Mineral Development
|
|
|
—
|
|
|
|
—
|
|
|
|
579
|
|
|
|
—
|
|
|
|
—
|
|
|
|
—
|
|
|
|
—
|
|
|
|
579
|
|
|
Total
|
|
|
—
|
|
|
|
—
|
|
|
|
579
|
|
|
|
—
|
|
|
|
—
|
|
|
|
—
|
|
|
|
—
|
|
|
|
579
|
|
|
|
|
|
|
|
|
|
|
|
|
United Arab Emirates
|
|
|
|
|
|
|
|
|
|
|
|
|
|
|
|
|
|
|
|
|
|
|
|
|
|
|
|
|
|
|
|
|
|
Payments per Project
|
|
|
|
|
|
|
|
|
|
|
|
|
|
|
|
|
|
|
|
|
|
|
|
|
|
|
|
|
|
|
|
|
|
Abu Al Bukhoosh
|
|
|
44,240
|
|
|
|
—
|
|
|
|
—
|
|
|
|
—
|
|
|
|
—
|
|
|
|
—
|
|
|
|
—
|
|
|
|
44,240
|
|
|
Abu Dhabi Gas Industries Ltd (GASCO)
|
|
|
363,274
|
|
|
|
—
|
|
|
|
2,344
|
|
|
|
—
|
|
|
|
—
|
|
|
|
—
|
|
|
|
—
|
|
|
|
365,618
|
|
|
Abu Dhabi Company for Onshore Oil Operation (ADCO)
|
|
|
2,602,274
|
|
|
|
—
|
|
|
|
—
|
|
|
|
2,220,000
|
|
|
|
—
|
|
|
|
—
|
|
|
|
—
|
|
|
|
4,822,274
|
|
|
Abu Dhabi Marine Areas Ltd (ADMA)
|
|
|
1,433,960
|
|
|
|
—
|
|
|
|
—
|
|
|
|
—
|
|
|
|
—
|
|
|
|
—
|
|
|
|
—
|
|
|
|
1,433,960
|
|
|
Total
|
|
|
4,443,748
|
|
|
|
—
|
|
|
|
2,344
|
|
|
|
2,220,000
|
|
|
|
—
|
|
|
|
—
|
|
|
|
—
|
|
|
|
6,666,092
|
|
|
Payments per Government
|
|
|
|
|
|
|
|
|
|
|
|
|
|
|
|
|
|
|
|
|
|
|
|
|
|
|
|
|
|
|
|
|
|
Supreme Petroleum Council – Government of Abu Dhabi
|
|
|
44,240
|
|
|
|
—
|
|
|
|
—
|
|
|
|
—
|
|
|
|
—
|
|
|
|
—
|
|
|
|
—
|
|
|
|
44,240
|
|
|
Abu Dhabi Fiscal Authorities c/o Abu Dhabi Marine Areas Ltd
|
|
|
1,433,960
|
|
|
|
—
|
|
|
|
—
|
|
|
|
—
|
|
|
|
—
|
|
|
|
—
|
|
|
|
—
|
|
|
|
1,433,960
|
|
|
Abu Dhabi Fiscal Authorities
|
|
|
2,965,548
|
|
|
|
—
|
|
|
|
—
|
|
|
|
2,220,000
|
|
|
|
—
|
|
|
|
—
|
|
|
|
—
|
|
|
|
5,185,548
|
|
|
Petroleum Institute
|
|
|
—
|
|
|
|
—
|
|
|
|
2,344
|
|
|
|
—
|
|
|
|
—
|
|
|
|
—
|
|
|
|
—
|
|
|
|
2,344
|
|
|
Total
|
|
|
4,443,748
|
|
|
|
—
|
|
|
|
2,344
|
|
|
|
2,220,000
|
|
|
|
—
|
|
|
|
—
|
|
|
|
—
|
|
|
|
6,666,092
|
|
|
|
|
|
|
S-28
|
|
TOTAL S.A. Form 20-F 2015
|
|
|
|
|
|
|
|
|
|
|
|
|
|
|
|
|
|
|
|
|
|
|
|
|
|
|
|
|
|
|
|
|
|
|
|
(in thousands of dollars)
|
|
Taxes
|
|
|
Royalties
|
|
|
License
fees
|
|
|
License
bonus
|
|
|
Dividends
|
|
|
Infrastructure
improvements
|
|
|
Production
entitlements
|
|
|
Total of
Payments
|
|
|
|
|
|
|
|
|
|
|
|
|
United Kingdom
|
|
|
|
|
|
|
|
|
|
|
|
|
|
|
|
|
|
|
|
|
|
|
|
|
|
|
|
|
|
|
|
|
|
Payments per Project
|
|
|
|
|
|
|
|
|
|
|
|
|
|
|
|
|
|
|
|
|
|
|
|
|
|
|
|
|
|
|
|
|
|
Alwyn North
|
|
|
31,902
|
|
|
|
—
|
|
|
|
—
|
|
|
|
—
|
|
|
|
—
|
|
|
|
—
|
|
|
|
—
|
|
|
|
31,902
|
|
|
Bruce
|
|
|
38,948
|
|
|
|
—
|
|
|
|
—
|
|
|
|
—
|
|
|
|
—
|
|
|
|
—
|
|
|
|
—
|
|
|
|
38,948
|
|
|
Northern North Sea
|
|
|
—
|
|
|
|
—
|
|
|
|
760
|
|
|
|
—
|
|
|
|
—
|
|
|
|
—
|
|
|
|
—
|
|
|
|
760
|
|
|
Central Graben Area
|
|
|
44,778
|
|
|
|
—
|
|
|
|
1,327
|
|
|
|
—
|
|
|
|
—
|
|
|
|
—
|
|
|
|
—
|
|
|
|
46,105
|
|
|
Markham Area
|
|
|
—
|
|
|
|
—
|
|
|
|
194
|
|
|
|
—
|
|
|
|
—
|
|
|
|
—
|
|
|
|
—
|
|
|
|
194
|
|
|
Greater Laggan Area
|
|
|
—
|
|
|
|
—
|
|
|
|
4,259
|
|
|
|
—
|
|
|
|
—
|
|
|
|
—
|
|
|
|
—
|
|
|
|
4,259
|
|
|
Non-attributable
|
|
|
8,179
|
|
|
|
—
|
|
|
|
580
|
|
|
|
—
|
|
|
|
—
|
|
|
|
—
|
|
|
|
—
|
|
|
|
8,759
|
|
|
Total
|
|
|
123,807
|
|
|
|
—
|
|
|
|
7,120
|
|
|
|
—
|
|
|
|
—
|
|
|
|
—
|
|
|
|
—
|
|
|
|
130,927
|
|
|
Payments per Government
|
|
|
|
|
|
|
|
|
|
|
|
|
|
|
|
|
|
|
|
|
|
|
|
|
|
|
|
|
|
|
|
|
|
HM Revenue & Customs
|
|
|
123,807
|
|
|
|
—
|
|
|
|
—
|
|
|
|
—
|
|
|
|
—
|
|
|
|
—
|
|
|
|
—
|
|
|
|
123,807
|
|
|
Department of Energy & Climate Change
|
|
|
—
|
|
|
|
—
|
|
|
|
6,540
|
|
|
|
—
|
|
|
|
—
|
|
|
|
—
|
|
|
|
—
|
|
|
|
6,540
|
|
|
Crown Estate
|
|
|
—
|
|
|
|
—
|
|
|
|
580
|
|
|
|
—
|
|
|
|
—
|
|
|
|
—
|
|
|
|
—
|
|
|
|
580
|
|
|
Total
|
|
|
123,807
|
|
|
|
—
|
|
|
|
7,120
|
|
|
|
—
|
|
|
|
—
|
|
|
|
—
|
|
|
|
—
|
|
|
|
130,927
|
|
|
|
|
|
|
|
|
|
|
|
|
United States
|
|
|
|
|
|
|
|
|
|
|
|
|
|
|
|
|
|
|
|
|
|
|
|
|
|
|
|
|
|
|
|
|
|
Payments per Project
|
|
|
|
|
|
|
|
|
|
|
|
|
|
|
|
|
|
|
|
|
|
|
|
|
|
|
|
|
|
|
|
|
|
Tahiti
|
|
|
—
|
|
|
|
20,037
|
|
|
|
—
|
|
|
|
—
|
|
|
|
—
|
|
|
|
—
|
|
|
|
—
|
|
|
|
20,037
|
|
|
Barnett Shale
|
|
|
5,877
|
|
|
|
4,089
|
|
|
|
—
|
|
|
|
—
|
|
|
|
—
|
|
|
|
—
|
|
|
|
—
|
|
|
|
9,966
|
|
|
Utica
|
|
|
4,070
|
|
|
|
—
|
|
|
|
—
|
|
|
|
—
|
|
|
|
—
|
|
|
|
—
|
|
|
|
—
|
|
|
|
4,070
|
|
|
Gulf of Mexico
|
|
|
—
|
|
|
|
—
|
|
|
|
4,600
|
|
|
|
3,600
|
|
|
|
—
|
|
|
|
—
|
|
|
|
—
|
|
|
|
8,200
|
|
|
Total
|
|
|
9,947
|
|
|
|
24,126
|
|
|
|
4,600
|
|
|
|
3,600
|
|
|
|
—
|
|
|
|
—
|
|
|
|
—
|
|
|
|
42,273
|
|
|
Payments per Government
|
|
|
|
|
|
|
|
|
|
|
|
|
|
|
|
|
|
|
|
|
|
|
|
|
|
|
|
|
|
|
|
|
|
Bureau of Ocean Energy Management
|
|
|
—
|
|
|
|
—
|
|
|
|
4,600
|
|
|
|
3,600
|
|
|
|
—
|
|
|
|
—
|
|
|
|
—
|
|
|
|
8,200
|
|
|
Office of Natural Resources Revenue
|
|
|
—
|
|
|
|
20,037
|
|
|
|
—
|
|
|
|
—
|
|
|
|
—
|
|
|
|
—
|
|
|
|
—
|
|
|
|
20,037
|
|
|
State of Ohio
|
|
|
3,356
|
|
|
|
—
|
|
|
|
—
|
|
|
|
—
|
|
|
|
—
|
|
|
|
—
|
|
|
|
—
|
|
|
|
3,356
|
|
|
Johnson County Tax Assessor
|
|
|
1,165
|
|
|
|
—
|
|
|
|
—
|
|
|
|
—
|
|
|
|
—
|
|
|
|
—
|
|
|
|
—
|
|
|
|
1,165
|
|
|
Tarrant County Tax Assessor
|
|
|
3,003
|
|
|
|
—
|
|
|
|
—
|
|
|
|
—
|
|
|
|
—
|
|
|
|
—
|
|
|
|
—
|
|
|
|
3,003
|
|
|
Texas State Comptroller’s Office
|
|
|
1,709
|
|
|
|
—
|
|
|
|
—
|
|
|
|
—
|
|
|
|
—
|
|
|
|
—
|
|
|
|
—
|
|
|
|
1,709
|
|
|
City of Fort Worth
|
|
|
—
|
|
|
|
1,722
|
|
|
|
—
|
|
|
|
—
|
|
|
|
—
|
|
|
|
—
|
|
|
|
—
|
|
|
|
1,722
|
|
|
Dallas/Fort Worth International Airport Board
|
|
|
—
|
|
|
|
655
|
|
|
|
—
|
|
|
|
—
|
|
|
|
—
|
|
|
|
—
|
|
|
|
—
|
|
|
|
655
|
|
|
City of Arlington
|
|
|
—
|
|
|
|
423
|
|
|
|
—
|
|
|
|
—
|
|
|
|
—
|
|
|
|
—
|
|
|
|
—
|
|
|
|
423
|
|
|
Tarrant Regional Water District
|
|
|
—
|
|
|
|
414
|
|
|
|
—
|
|
|
|
—
|
|
|
|
—
|
|
|
|
—
|
|
|
|
—
|
|
|
|
414
|
|
|
State of Texas
|
|
|
—
|
|
|
|
261
|
|
|
|
—
|
|
|
|
—
|
|
|
|
—
|
|
|
|
—
|
|
|
|
—
|
|
|
|
261
|
|
|
City of North Richland Hills
|
|
|
—
|
|
|
|
149
|
|
|
|
—
|
|
|
|
—
|
|
|
|
—
|
|
|
|
—
|
|
|
|
—
|
|
|
|
149
|
|
|
Fort Worth Independent School District
|
|
|
—
|
|
|
|
125
|
|
|
|
—
|
|
|
|
—
|
|
|
|
—
|
|
|
|
—
|
|
|
|
—
|
|
|
|
125
|
|
|
Burleson Independent School District
|
|
|
—
|
|
|
|
215
|
|
|
|
—
|
|
|
|
—
|
|
|
|
—
|
|
|
|
—
|
|
|
|
—
|
|
|
|
215
|
|
|
Arlington Independent School District
|
|
|
—
|
|
|
|
125
|
|
|
|
—
|
|
|
|
—
|
|
|
|
—
|
|
|
|
—
|
|
|
|
—
|
|
|
|
125
|
|
|
Harrison County
|
|
|
140
|
|
|
|
—
|
|
|
|
—
|
|
|
|
—
|
|
|
|
—
|
|
|
|
—
|
|
|
|
—
|
|
|
|
140
|
|
|
Carroll County
|
|
|
574
|
|
|
|
—
|
|
|
|
—
|
|
|
|
—
|
|
|
|
—
|
|
|
|
—
|
|
|
|
—
|
|
|
|
574
|
|
|
Total
|
|
|
9,947
|
|
|
|
24,126
|
|
|
|
4,600
|
|
|
|
3,600
|
|
|
|
—
|
|
|
|
—
|
|
|
|
—
|
|
|
|
42,273
|
|
|
|
|
|
|
|
|
|
|
|
|
Uruguay
|
|
|
|
|
|
|
|
|
|
|
|
|
|
|
|
|
|
|
|
|
|
|
|
|
|
|
|
|
|
|
|
|
|
Payments per Project
|
|
|
|
|
|
|
|
|
|
|
|
|
|
|
|
|
|
|
|
|
|
|
|
|
|
|
|
|
|
|
|
|
|
Block 14 (Offshore)
|
|
|
—
|
|
|
|
—
|
|
|
|
100
|
|
|
|
—
|
|
|
|
—
|
|
|
|
—
|
|
|
|
—
|
|
|
|
100
|
|
|
Blocks 1 & 2 (Onshore)
|
|
|
—
|
|
|
|
—
|
|
|
|
123
|
|
|
|
—
|
|
|
|
—
|
|
|
|
—
|
|
|
|
—
|
|
|
|
123
|
|
|
Total
|
|
|
—
|
|
|
|
—
|
|
|
|
223
|
|
|
|
—
|
|
|
|
—
|
|
|
|
—
|
|
|
|
—
|
|
|
|
223
|
|
|
Payments per Government
|
|
|
|
|
|
|
|
|
|
|
|
|
|
|
|
|
|
|
|
|
|
|
|
|
|
|
|
|
|
|
|
|
|
Administracion Nacionalde Combustibles Alcohol y Portland
|
|
|
—
|
|
|
|
—
|
|
|
|
223
|
|
|
|
—
|
|
|
|
—
|
|
|
|
—
|
|
|
|
—
|
|
|
|
223
|
|
|
Total
|
|
|
—
|
|
|
|
—
|
|
|
|
223
|
|
|
|
—
|
|
|
|
—
|
|
|
|
—
|
|
|
|
—
|
|
|
|
223
|
|
|
|
|
|
|
2015 Form 20-F TOTAL S.A.
|
|
S-29
|
|
|
|
|
|
|
|
|
|
|
|
|
|
|
|
|
|
|
|
|
|
|
|
|
|
|
|
|
|
|
|
|
|
|
|
(in thousands of dollars)
|
|
Taxes
|
|
|
Royalties
|
|
|
License
fees
|
|
|
License
bonus
|
|
|
Dividends
|
|
|
Infrastructure
improvements
|
|
|
Production
entitlements
|
|
|
Total of
Payments
|
|
|
|
|
|
|
|
|
|
|
|
|
Venezuela
|
|
|
|
|
|
|
|
|
|
|
|
|
|
|
|
|
|
|
|
|
|
|
|
|
|
|
|
|
|
|
|
|
|
Payments per Project
|
|
|
|
|
|
|
|
|
|
|
|
|
|
|
|
|
|
|
|
|
|
|
|
|
|
|
|
|
|
|
|
|
|
Yucal Placer
|
|
|
491
|
|
|
|
—
|
|
|
|
—
|
|
|
|
—
|
|
|
|
—
|
|
|
|
—
|
|
|
|
—
|
|
|
|
491
|
|
|
Total
|
|
|
491
|
|
|
|
—
|
|
|
|
—
|
|
|
|
—
|
|
|
|
—
|
|
|
|
—
|
|
|
|
—
|
|
|
|
491
|
|
|
Payments per Government
|
|
|
|
|
|
|
|
|
|
|
|
|
|
|
|
|
|
|
|
|
|
|
|
|
|
|
|
|
|
|
|
|
|
Fondo Nacional de Cienca, Tecnologia e Innovacion
|
|
|
491
|
|
|
|
—
|
|
|
|
—
|
|
|
|
—
|
|
|
|
—
|
|
|
|
—
|
|
|
|
—
|
|
|
|
491
|
|
|
Total
|
|
|
491
|
|
|
|
—
|
|
|
|
—
|
|
|
|
—
|
|
|
|
—
|
|
|
|
—
|
|
|
|
—
|
|
|
|
491
|
|
|
|
|
|
|
|
|
|
|
|
|
Yemen
|
|
|
|
|
|
|
|
|
|
|
|
|
|
|
|
|
|
|
|
|
|
|
|
|
|
|
|
|
|
|
|
|
|
Payments per Project
|
|
|
|
|
|
|
|
|
|
|
|
|
|
|
|
|
|
|
|
|
|
|
|
|
|
|
|
|
|
|
|
|
|
Block 10
|
|
|
5,147
|
|
|
|
—
|
|
|
|
—
|
|
|
|
—
|
|
|
|
—
|
|
|
|
—
|
|
|
|
18,833
|
|
|
|
23,980
|
|
|
Block 5
|
|
|
3,426
|
|
|
|
—
|
|
|
|
—
|
|
|
|
—
|
|
|
|
—
|
|
|
|
—
|
|
|
|
8,969
|
|
|
|
12,395
|
|
|
Block 70
|
|
|
—
|
|
|
|
—
|
|
|
|
57
|
|
|
|
—
|
|
|
|
—
|
|
|
|
—
|
|
|
|
—
|
|
|
|
57
|
|
|
Block 72
|
|
|
—
|
|
|
|
—
|
|
|
|
93
|
|
|
|
—
|
|
|
|
—
|
|
|
|
—
|
|
|
|
—
|
|
|
|
93
|
|
|
Total
|
|
|
8,573
|
|
|
|
—
|
|
|
|
150
|
|
|
|
—
|
|
|
|
—
|
|
|
|
—
|
|
|
|
27,802
|
|
|
|
36,525
|
|
|
Payments per Government
|
|
|
|
|
|
|
|
|
|
|
|
|
|
|
|
|
|
|
|
|
|
|
|
|
|
|
|
|
|
|
|
|
|
Ministry of Oil & Minerals
|
|
|
8,573
|
|
|
|
—
|
|
|
|
150
|
|
|
|
—
|
|
|
|
—
|
|
|
|
—
|
|
|
|
27,802
|
|
|
|
36,525
|
|
|
Total
|
|
|
8,573
|
|
|
|
—
|
|
|
|
150
|
|
|
|
—
|
|
|
|
—
|
|
|
|
—
|
|
|
|
27,802
|
|
|
|
36,525
|
|
|
|
|
|
|
S-30
|
|
TOTAL S.A. Form 20-F 2015
|
