TETRA TECH INC
10-Ks and 10-Qs
|
|
|
|
|
|
|
|
|
|
|
|
|
|
|
|
|
|
|
|
|
|
|
|
|
|
|
|
|
|
|
|
|
|
|
|
|
|
|
|
|
|
|
|
|
|
|
|
|
|
|
|
|
|
|
|
|
|
|
UNITED STATES
SECURITIES AND EXCHANGE COMMISSION
Washington, D.C. 20549
____________________________________________________________________________
FORM 10-K
|
(Mark One)
|
|
|
|
x
|
ANNUAL REPORT PURSUANT TO SECTION 13 OR 15(d) OF THE SECURITIES EXCHANGE ACT OF 1934
|
|
|
For the Fiscal Year Ended October 1, 2017
|
||
|
or
|
||
|
¨
|
TRANSITION REPORT PURSUANT TO SECTION 13 OR 15(d) OF THE SECURITIES EXCHANGE ACT OF 1934
|
|
|
For the Transition Period from
to
|
||
Commission File Number 0-19655
____________________________________________________________________________
TETRA TECH, INC.
(
Exact name of registrant as specified in its charter)
|
Delaware
(State or other jurisdiction of incorporation or organization)
|
95-4148514
(I.R.S. Employer Identification No.)
|
|
3475 East Foothill Boulevard, Pasadena, California 91107
(Address of principal executive offices) (Zip Code)
|
|
|
(626) 351-4664
(Registrant's telephone number, including area code)
|
|
|
Securities registered pursuant to Section 12(b) of the Act:
|
|
|
Common Stock, $.01 par value
(Title of class)
|
The NASDAQ Stock Market LLC
(Name of exchange)
|
Securities registered pursuant to Section 12(g) of the Act:
None
____________________________________________________________________________
Indicate by check mark if the registrant is a well-known seasoned issuer, as defined in Rule 405 of the Securities Act. Yes
x
No
¨
Indicate by check mark if the registrant is not required to file reports pursuant to Section 13 or Section 15(d) of the Act. Yes
¨
No
x
Indicate by check mark whether the registrant (1) has filed all reports required to be filed by Section 13 or 15(d) of the Securities Exchange Act of 1934 during the preceding 12 months (or for such shorter period that the registrant was required to file such reports), and (2) has been subject to such filing requirements for the past 90 days. Yes
x
No
¨
Indicate by check mark whether the registrant has submitted electronically and posted on its corporate Website, if any, every Interactive Data File required to be submitted and posted pursuant to Rule 405 of Regulation S-T (§232.405 of this chapter) during the preceding 12 months (or for such shorter period that the registrant was required to submit and post such files). Yes
x
No
¨
Indicate by check mark if disclosure of delinquent filers pursuant to Item 405 of Regulation S-K (§229.405 of this chapter) is not contained herein, and will not be contained, to the best of registrant's knowledge, in definitive proxy or information statements incorporated by reference in Part III of this Form 10-K or any amendment to this Form 10-K.
¨
Indicate by check mark whether the registrant is a large accelerated filer, an accelerated filer, a non-accelerated filer, or a smaller reporting company, or an emerging growth company. See the definitions of "large accelerated filer," "accelerated filer" and "smaller reporting company," and "emerging growth company" in Rule 12b-2 of the Exchange Act. Large accelerated filer
x
Accelerated filer
¨
Non-accelerated filer (Do not check if a smaller reporting company)
¨
Smaller reporting company
¨
Emerging growth company
¨
If an emerging growth company, indicate by check mark if the registrant has elected not to use the extended transition period for complying with any new or revised financial accounting standards provided pursuant to section 13(a) of the Exchange Act.
¨
Indicate by check mark whether the registrant is a shell company (as defined in Rule 12b-2 of the Act). Yes
¨
No
x
The aggregate market value of the registrant's common stock held by non-affiliates on April 2, 2017, was $2.3 billion (based upon the closing price of a share of registrant's common stock as reported by the Nasdaq National Market on that date).
On
November 1, 2017
, 55,722,592 shares of the registrant's common stock were outstanding.
DOCUMENT INCORPORATED BY REFERENCE
Portions of registrant's Proxy Statement for its 2018 Annual Meeting of Stockholders are incorporated by reference in Part III of this report where indicated.
TABLE OF CONTENTS
|
|
|
Page
|
2
This Annual Report on Form 10-K ("Report"), including the "Management's Discussion and Analysis of Financial Condition and Results of Operations," contains forward-looking statements regarding future events and our future results that are subject to the safe harbors created under the Securities Act of 1933 (the "Securities Act") and the Securities Exchange Act of 1934 (the "Exchange Act"). All statements other than statements of historical facts are statements that could be deemed forward-looking statements. These statements are based on current expectations, estimates, forecasts and projections about the industries in which we operate and the beliefs and assumptions of our management. Words such as "expects," "anticipates," "targets," "goals," "projects," "intends," "plans," "believes," "estimates," "seeks," "continues," "may," variations of such words, and similar expressions are intended to identify such forward-looking statements. In addition, statements that refer to projections of our future financial performance, our anticipated growth and trends in our businesses, and other characterizations of future events or circumstances are forward-looking statements. Readers are cautioned that these forward-looking statements are only predictions and are subject to risks, uncertainties and assumptions that are difficult to predict, including those identified below under "Risk Factors," and elsewhere herein. Therefore, actual results may differ materially and adversely from those expressed in any forward-looking statements. We undertake no obligation to revise or update publicly any forward-looking statements for any reason.
General
Tetra Tech, Inc. is a leading provider of consulting and engineering services that focuses on water, environment, infrastructure, resource management, energy, and international development. We are a global company that leads with science and is renowned for our expertise in providing water-related solutions for public and private clients. We typically begin at the earliest stage of a project to identify plans that are tailored to our clients' needs and resources. Our solutions may span the entire life cycle of consulting and engineering projects and include applied science, data analytics, research, engineering, design, construction management, and operations and maintenance.
Engineering News-Record ("ENR"), the leading trade journal for our industry, has ranked us the number one water services firm for the past 14 years, most recently in its May 2017 "Top 500 Design Firms" issue. In 2017, Tetra Tech was also ranked number one in water treatment/desalination, water treatment and supply, environmental management, dams and reservoirs, solid waste, and wind power. ENR ranks Tetra Tech among the largest 10 firms in numerous other service lines, including engineering/design, environmental science, chemical and soil remediation, site assessment and compliance, and hazardous waste.
Our reputation for high-end consulting and engineering services and our ability to apply our skills to develop solutions for water and environmental management has supported our growth for over 50 years since the founding of our predecessor company. By combining ingenuity and practical experience, we have helped to advance solutions for managing water, protecting the environment, providing energy, and engineering the infrastructure for our cities and communities. Today, we are working on projects worldwide, and currently have more than
16,000
staff, and over 400 offices.
Mission
Our mission is to be the premier worldwide consulting and engineering firm, focusing on water, environment, infrastructure, resource management, energy, and international development services. The following core principles form the underpinning of how we work together to serve our clients:
|
•
|
Service.
We put our clients first. We listen closely to better understand our clients' needs and deliver smart, cost-effective solutions that meet their needs.
|
|
•
|
Value.
We solve our clients' problems as if they were our own. We develop and implement real-world solutions that are innovative, efficient and practical.
|
|
•
|
Excellence.
We bring superior technical capability, disciplined project management, and excellence in safety and quality to all of our services.
|
|
•
|
Opportunity.
Our people are our number one asset. Opportunity means new technical challenges that provide advancement within our company, encouraging a diverse workforce, and ensuring a safe workplace.
|
The Tetra Tech Strategy
To continue our successful growth and our competitive position in the markets we serve, we have implemented the following strategy that is integral to our future success. Our approach is to lead with science and provide high-end solutions that are differentiated and of long-lasting sustainable benefit to our clients. Our approach encompasses five key aspects of differentiation:
3
Technical Differentiation.
Since our inception, we have provided innovative consulting and engineering services, with a focus on providing solutions that integrate innovation with practical experience. Adaptation of emerging science and technology in the development of high-end consulting and engineering solutions is central to our approach to
Leading with Science
®
in the delivery of our services.
Relationships and Trust.
We have achieved a broad client and contract base by proactively understanding our clients' priorities and demonstrating a long track record of successful performance that results in repeat business and limits competition. We believe that proximity to our clients is also instrumental to integrating global experience and resources with an understanding of our local clients' needs. Over the past year, we worked in over
100 countries
, helping government and private sector clients address complex water, environment, energy and related infrastructure needs.
Institutional Knowledge.
Over our history, we have supported both public and private clients, many for multiple decades of continuous contracts and repeat business. Long-term relationships provide us with institutional knowledge of our clients' programs, past projects and internal resources. Institutional knowledge is often a significant factor in providing competitive proposals and cost-effective solutions tailored to our clients' needs.
One-of-a-Kind Solutions.
We are often at the leading edge of new challenges where we are providing one-of-a-kind solutions. These might be a new water reuse technology, a unique solution to addressing new regulatory requirements, a new monitoring approach for assessing infrastructure assets or a computer model for real time management of water resources. We are constantly evolving and adding to our intellectual property, including a wide range of computer models, algorithms, analytical software, and environmental treatment approaches and instrumentation, often in collaboration with our forward-thinking clients. Bringing our one-of-a-kind solutions to real world problems is a differentiator in expanding our services and growing our business.
Smart Solutions and Innovation.
Smart solutions often require taking the same pieces of the puzzle and putting them together in a different way for a better outcome. Complex projects for the public and private sectors, at the leading edge of policy and technology development, often require innovative solutions that combine multiple aspects of our interdisciplinary capabilities, technical resources and institutional knowledge.
Our strategy leverages our five differentiators to drive growth in our water, environment, infrastructure, resource management, energy, and international development markets. We are focused on continuing to expand our leadership position in these markets, while also investing in emerging growth areas. Our differentiated capabilities provide us a competitive advantage to address new opportunities in the marketplace and apply new technologies to the fastest growing areas of our business.
To support our growth plans, we actively attract, recruit and retain key hires. Our combination of high-end science and consulting with practical applications provides challenging and rewarding opportunities for our employees, thereby enhancing our ability to recruit and retain top quality talent. Our internal networking programs, leadership training, entrepreneurial environment, focus on technical excellence, and global project portfolio help to attract and retain highly qualified individuals.
We also maintain a strong emphasis on project management at all levels of the organization. Our client-focused project management is supported by strong fiscal management and financial tools. We take a disciplined approach to monitoring, managing and improving our return on investment in each of our business areas through our efforts to negotiate appropriate contract terms, manage our contract performance to minimize schedule delays and cost overruns, and promptly bill and collect accounts receivable.
Our strategic growth plans are augmented by our selective investment in acquisitions aligned with our business. Acquisitions enhance plans to broaden our service offerings, add contract capacity and extend our geographic presence. Our experience with acquisitions strengthens our ability to integrate and rapidly leverage the resources of the acquired companies post-acquisition.
Reportable Segments
In fiscal
2017
, we managed our operations under three reportable segments. We reported our water resources, water and wastewater treatment, environment, and infrastructure engineering activities in the Water, Environment and Infrastructure ("WEI") reportable segment. Our Resource Management and Energy ("RME") reportable segment included our oil and gas, energy, international development, waste management, remediation, and utilities services. In addition, we reported the results of the wind-down of our non-core construction activities in the Remediation and Construction Management ("RCM") reportable segment. The following table presents the percentage of our revenue by reportable segment:
4
|
|
Fiscal Year
|
|||||
|
Reportable Segment
|
2017
|
2016
|
2015
|
|||
|
WEI
|
41.6%
|
39.8%
|
43.2%
|
|||
|
RME
|
60.5
|
60.8
|
55.8
|
|||
|
RCM
|
0.7
|
2.0
|
3.7
|
|||
|
Inter-segment elimination
|
(2.8)
|
(2.6)
|
(2.7)
|
|||
|
|
100.0%
|
100.0%
|
100.0%
|
|||
For additional information regarding our reportable segments, see Note
18
, "
Reportable Segments
" of the "Notes to Consolidated Financial Statements" included in Item 8.
Beginning in fiscal 2018, we further aligned our operations to better serve our clients and markets, resulting in two renamed reportable segments. Our Government Services Group ("GSG") reportable segment primarily includes activities with U.S. government clients (federal, state and local) and all activities with development agencies worldwide. Our Commercial/International Services Group ("CIG") reportable segment primarily includes activities with U.S. commercial clients and all international activities other than work for development agencies. This alignment allows us to capitalize on our growing market opportunities and enhance the development of high-end consulting and technical solutions to meet our growing client demand. We will continue to report the results of the wind-down of our non-core construction activities in the RCM segment.
Further descriptions of our GSG and CIG segments are included below under “2018 Reportable Segments”. For more information on risks related to our business, segments and geographic regions, including risks related to foreign operations, see Item 1A, “Risk Factors” of this report.
Water, Environment and Infrastructure
WEI provides consulting and engineering services worldwide for a broad range of water, environment, and infrastructure-related needs in both developed and emerging economies. WEI supports both public and private clients including federal, state/provincial and local governments, and commercial clients. The primary WEI markets include water resources analysis and water management, environmental monitoring, data analytics, government consulting, and a broad range of civil infrastructure master planning and engineering design for facilities, transportation, and local development projects. WEI's services span from early data collection and monitoring, to data analysis and information technology, to science and engineering applied research, to engineering design, to construction management, and operations and maintenance.
WEI provides our clients with sustainable solutions that optimize their water management and environmental programs to address regulatory requirements, improve operational efficiencies, manage assets, and promote corporate responsibility. Our services advance sustainability through the "greening" of infrastructure, design of energy efficiency and resource conservation programs, innovation in the capture and sequestration of carbon, formulation of emergency preparedness and response plans, and improvement in water and land resource management practices. We provide climate change and energy management consulting, and greenhouse gas inventory assessment, certification, reduction, and management services.
Many government and commercial organizations face complex problems due to increased demand and competition for water and natural resources, newly understood threats to human health and the environment, aging infrastructure, and demand for new and more resilient infrastructure in emerging economies. Our integrated water management services support government agencies responsible for managing water supplies, wastewater treatment, storm water management, and flood protection. These services also support private sector clients that require water supply and treatment for industrial processes. We help our clients develop water supplies and manage water resources, while addressing a wide range of local and national government requirements and policies. Fluctuations in weather patterns and extreme events, such as prolonged droughts and more frequent flooding, are increasing concerns over the reliability of water supplies, the need to protect coastal areas, and flood mitigation and adaptation in metropolitan areas.
Examples of our services include the following:
|
•
|
Providing high-end water analysis services world-wide, including master planning; data analytics, modeling of surface and groundwater behavior, particularly in the areas of water resources, watershed management, and climate adaptation analysis; drought mitigation and water supply development; and flood mitigation and management.
|
|
•
|
Supporting innovative software and system design services for a wide range of water resource, environmental and infrastructure data management needs, including informational technology systems, portals, dashboards, data management, data analytics, and statistical analysis.
|
5
|
•
|
Providing smart water infrastructure solutions that integrate water modeling, instrumentation and controls, and real-time controls to create flexible water systems that respond to changing conditions, optimize use of infrastructure, and provide clients with the ability to more efficiently monitor and manage their water infrastructure.
|
|
•
|
Providing consulting and engineering design services that are applied to numerous aspects of water quality and quantity management, including major water and wastewater treatment plants, combined sewer storage and separation, water reuse (indirect and potable reuse) programs, regional storm water management and green infrastructure design, and drainage and flood control; supporting master planning, permitting, design, and construction of water-related redevelopment projects, and parks and river corridor restoration projects; and providing water supply, water treatment, and water reuse services.
|
|
•
|
Providing comprehensive services for environmental planning, cleanup and reuse of sites contaminated with hazardous materials, toxic chemicals, and oil and petroleum products, which cover all phases of the remedial planning process, starting with emergency response and initial site assessment through removal actions, remedial design and implementation oversight; and supporting both commercial and government clients in planning and implementing remedial activities at numerous sites around the world, and providing a broad range of environmental analysis and planning services.
|
|
•
|
Offering engineering design services for commercial clients; helping to renovate, upgrade, and modernize industrial water supplies, and address water treatment and water reuse needs; and providing plant engineering, project execution, and program management services for industrial water treatment projects throughout the world.
|
|
•
|
Providing analytical, engineering, architecture, geotechnical, and construction management services for infrastructure projects, including roadway monitoring and asset management services, collecting condition data, optimizing upgrades and long-term planning for expansion; providing multi-model design services for commuter railway stations, airport expansions, bridges and major highways, and ports and harbors; and designing solutions to repair, replace, and upgrade older transportation infrastructure.
|
|
•
|
Providing infrastructure design services in extreme and remote areas by using specialized techniques that are adapted to local resources, while minimizing environmental impacts, and considering potential climate change impacts. These include providing consulting, geotechnical, and design services to owners of transportation, natural resources, energy and community infrastructure in the Arctic and areas of permafrost around the globe.
|
|
•
|
Providing planning, architectural, and engineering services for U.S. federal, state and local government, and commercial facilities and their related infrastructure needs including military housing, and educational, institutional, corporate headquarters, healthcare, and research facilities; providing civil, electrical, mechanical, structural, plumbing and fire protection engineering and design services for buildings and surrounding developments around the world; and providing engineering and construction management projects for a wide range of clients with specialized needs, such as security systems, training and audiovisual facilities, clean rooms, laboratories, medical facilities and emergency preparedness facilities.
|
|
•
|
Providing technology systems to optimize the airspace system and related aviation systems integration for the U.S. and other countries. Our aviation airspace services include data management, data processing, communications and outreach, and systems development; and providing systems analysis and information management.
|
Resource Management and Energy
RME provides consulting and engineering services worldwide for a broad range of resource management and energy needs. RME supports both private and public clients, including global industrial and commercial clients, major international development agencies, and U.S. federal agencies in large-scale remediation. The primary markets for RME's services include natural resources, energy, international development, remediation, waste management, and utilities. RME's services span from early data collection and monitoring, to data analysis and information technology, to feasibility studies and assessments, to science and engineering applied research, to engineering design, to construction management, and operations and maintenance. RME also supports engineering, procurement and construction management ("EPCM") for full service implementation of commercial projects.
RME supports our clients in addressing emerging policies, resource limitations and concern about climate change, including the design of energy conservation measures, retrofits to existing structures, upgrades to energy transmission infrastructure, and the development of renewable energy resources. We also support governments in deploying international development programs for developing nations to help them overcome numerous challenges, including access to potable water, agricultural programs, governance and infrastructure programs, education, and human health.
Examples of our services include the following:
6
|
•
|
Providing a full range of services to electric power utilities and independent power producers worldwide, ranging from macro-level planning and management advisory services to project-specific environmental, engineering, construction management, and operational services, and advising on the design and implementation of a smart grid both in the U.S. and internationally, including increasing utility automation, information and operational technologies, and critical infrastructure security. For utilities and governmental regulatory agencies, services include policy and regulatory development, utility management, performance improvement, asset management and evaluation, and transaction support services. For developers and owners of renewable energy resources such as solar grid and off-grid, on-shore and off-shore wind, biogas and biomass, tidal, and hydropower, and conventional power generation facilities, as well as transmission and distribution assets, services include environmental, engineering, procurement, operations and maintenance, and regulatory support for all project phases.
|
|
•
|
Supporting oil and gas clients across North America, Australia, Papua New Guinea, and the Middle East in the upstream, midstream and downstream market sectors. Our services include environmental permitting support, siting studies, strategic planning and analyses; design of well pads and surface impoundments for drilling sites; water management for exploration activities; design of midstream pipelines and associated pumping stations and storage facilities; construction monitoring, design and construction management for downstream sustaining capital projects; biological and cultural assessments, and site investigations; and hazardous waste site remediation.
|
|
•
|
Providing international development services to many donor agencies to develop safe and reliable water supplies and sanitation services, support the eradication of poverty, improve livelihoods, promote democracy and increase economic growth; planning, designing, implementing, researching, and monitoring projects in the areas of climate change, agriculture and rural development, governance and institutional development, natural resources and the environment, infrastructure, economic growth, energy, rule of law and justice systems, land tenure and property rights, and training and consulting for public-private partnerships; and building capacity and strengthening institutions in areas such as global health, energy sector reform, utility management, education, food security, and local governance.
|
|
•
|
Offering a wide range of consulting and engineering services for solid waste management, including landfill design and management, throughout the United States and Canada; providing design, construction management, and maintenance services to manage solid and hazardous waste, for environmental, wastewater, energy, oil and gas containment, mining, utilities, aquaculture, and other industrial clients; designing and installing geosynthetic liners for large lining and capping projects, as well as innovative renewable energy projects such as solar energy-generating landfill caps; and providing full-service solutions for gas-to-energy facilities to efficiently use landfill methane gas.
|
|
•
|
Providing environmental remediation and reconstruction services to evaluate and restore lands to beneficial use, including the identification, evaluation and destruction of unexploded ordinance, both domestically and internationally; investigating, remediating, and restoring contaminated facilities at military locations in the U.S. and around the world; managing large, complex sediment remediation programs that help restore rivers and coastal waters to beneficial use; constructing state-of-the-art water treatment plants for commercial clients; and supporting utilities in the U.S. in implementing infrastructure needs, including broadband, wired utilities, and natural gas distribution systems.
|
Remediation and Construction Management
We report the results of the wind-down of our non-core construction activities in the RCM reportable segment. The remaining work to be performed in this segment will be substantially completed by the end of calendar 2017.
Project Examples
The following table presents brief examples of projects in our ongoing operations during fiscal
2017
:
|
Segment
|
Representative Projects
|
||
|
WEI
|
•
|
For the District of Columbia Department of the Environment, providing consulting and environmental analysis for the assessment and cleanup of contaminated sediments in a 12-mile portion of the Anacostia River and sites located within its watershed.
|
|
|
•
|
Providing emergency management and planning services for multiple state and local agencies, especially in coastal regions, such as response to and recovery from wildfires in California, flooding in the Gulf Coast and hurricanes in Texas, along the U.S. Atlantic coast, and continued infrastructure recovery services following Superstorm Sandy in New York and New Jersey.
|
||
7
|
Segment
|
Representative Projects
|
||
|
•
|
Providing the U.S. Environmental Protection Agency ("EPA") Superfund Technical Assessment and Response Team program support with emergency preparedness, environmental response, removal action, site assessment, community involvement, and other Superfund technical services at locations in 23 states.
|
||
|
•
|
For the Montana Department of Environmental Quality at the Carpenter-Snow Creek Mining District Superfund site, providing services including investigation, risk assessment, engineering study, design, cleanup oversight, and long-term monitoring services for an area that includes 70 abandoned mines and associated impacted lands.
|
||
|
•
|
Providing smart water infrastructure solutions for stormwater capture and water quality management for municipalities in Los Angeles and San Diego, California.
|
||
|
•
|
Providing smart water solutions using real time control systems to reduce overflows, maximize use of retention in the system, and improve operational efficiency in cities in the U.S., Canada, and France.
|
||
|
•
|
Providing engineering services to the City of Clearwater, Florida for the design of potable first-of-a-kind water reuse project in Florida, using a combination of innovative groundwater recharge and treatment.
|
||
|
•
|
Providing engineering services to the City of Daytona Beach, Florida for a first-of-its-kind demonstration program for direct potable reuse in Florida, testing full advanced treatment of their wastewater effluent as a direct supply source to the front end of their co-located water treatment plant.
|
||
|
•
|
Providing program management for the City of Detroit, Michigan for the broad implementation of community-based stormwater management and green infrastructure, effectively combining city revitalization initiatives and reduction of overflows.
|
||
|
•
|
Providing master planning services to Miami-Dade County, Florida in smart, energy efficient and resilient water infrastructure solutions for the most populous county in Florida.
|
||
|
•
|
Providing transportation planning, data collection and design services for the Province of Alberta, Canada, with specialized expertise in arctic region infrastructure.
|
||
|
•
|
Providing sustainable project development and asset management services for the U.S. military, including the Army, Navy and Air Force.
|
||
|
•
|
Providing energy, environmental assessment and studies to mitigate the impact of military operations on sensitive flora and fauna at U.S. bases, such as the endangered desert tortoise on a Marine Corps base.
|
||
|
•
|
Providing master planning and engineering design services to the U.S. Army Corps of Engineers ("USACE") on U.S. bases and in international facilities through multiple district and program specific contracts.
|
||
|
RME
|
•
|
For the U.S. Agency for International Development ("USAID"), implementing projects in Africa, Asia, the Middle East, Latin America, and Eastern Europe including the USAID Power Africa program with technical and capacity building expertise to accelerate clean energy project development; and for USAID and the government of Afghanistan, implementing project to empower women to increase gender diversity and engagement in civil society.
|
|
|
•
|
For USAID, designing and implementing resiliency programs, including mitigation of changes in agriculture and fisheries, and strengthening of community resilience to withstand extreme weather events through programs in Southeast Asia, Latin America, and West Africa.
|
||
|
•
|
For the U.K. Department for International Development, designing and implementing projects in Africa, Asia, and the Middle East.
|
||
|
•
|
For the Australian Department of Foreign Affairs and Trade, implementing a range of development projects in the Asia Pacific region.
|
||
8
|
Segment
|
Representative Projects
|
||
|
•
|
For DONG Energy, providing constraints analyses, siting studies, marine geophysical surveys, submarine cable routing analyses, specialty marine impact studies, permitting services, biological and cultural resource surveys, construction compliance, and support for U.S. east coast offshore energy projects.
|
||
|
•
|
For multiple oil & gas clients, providing engineering, detailed design, and construction monitoring for midstream pipeline companies; performing in-plant engineering and sustaining capital project work at downstream refineries; building a specialty insulated pipeline for the transport of hot bitumen in Alberta, Canada; and preparing the Federal Energy Regulatory Commission environmental permitting for the Mountain Valley gas pipeline project.
|
||
|
•
|
Using our proprietary Solar Thermal Aerobic Recirculation Treatment system to implement enhanced remediation of contaminated groundwater at multiple Caltex sites in Australia.
|
||
|
•
|
Designing the Puente Hills Intermodel Facility for the Los Angeles County Sanitation District.
|
||
|
•
|
Providing turn-key design, construction, dredging, and treatment services on the Lower Fox River in Wisconsin.
|
||
|
•
|
Preparing a third party environmental impact statement for Clean Line Energy and the U. S. Department of Energy ("DOE") for a 720-mile overhead 600 kilovolt high voltage direct current electric transmission line across Oklahoma, Arkansas, and Tennessee.
|
||
|
•
|
For the Australian Department of Defence, serving as lead consultant for the comprehensive investigation of polyfluorolkyl substances and Royal Australian Air Force ("RAAF") Base Tindal and RAAF Base Darwin.
|
||
Fiscal 2018 Reportable Segments
As described above, we realigned our operations beginning in fiscal 2018. The operations of the GSG and CIG business groups were aligned to facilitate the coordination of our services by client and market across our global operations. The types of clients served and work performed in the GSG and CIG segments are described below.
Government Services Group
GSG provides consulting and engineering services primarily to U.S. government clients (federal, state and local) and development agencies worldwide. GSG supports U.S. government civilian and defense agencies with services in water, environment, infrastructure, information technology, and emergency management services. GSG also provides engineering design services for municipal and commercial clients, especially in water infrastructure, solid waste, and high-end sustainable infrastructure designs. Additionally, GSG provides a wide range of support to development agencies worldwide.
Commercial/International Group
CIG provides consulting and engineering services primarily to U.S. commercial clients and international clients, both commercial and local government. GSG supports commercial clients across the Fortune 500, oil and gas, energy utilities, and mining markets. CIG also provides infrastructure and related environmental and geotechnical services, testing, engineering and project management services to commercial and local government clients across Canada, in Asia Pacific (primarily Australia and New Zealand), as well as Brazil and Chile. CIG also provides field construction management activities in the U.S. and Western Canada.
Clients
We provide services to a diverse base of international, U.S. state and local government, U.S. federal government, U.S. commercial and international clients. The following table presents the percentage of our revenue by client sector:
9
|
|
Fiscal Year
|
|||||
|
Client Sector
|
2017
|
2016
|
2015
|
|||
|
U.S. state and local government
|
12.8%
|
12.0%
|
12.5%
|
|||
|
U.S. federal government
(1)
|
32.7
|
30.4
|
30.9
|
|||
|
U.S. commercial
|
27.8
|
29.5
|
32.0
|
|||
|
International
(2)
|
26.7
|
28.1
|
24.6
|
|||
|
100.0%
|
100.0%
|
100.0%
|
||||
|
(1)
|
Includes revenue generated under U.S. federal government contracts performed outside the United States.
|
|
(2)
|
Includes revenue generated from foreign operations, primarily in Canada and Australia, and revenue generated from non-U.S. clients.
|
U.S. federal government agencies are significant clients. USAID accounted for 14.3%, 13.1% and 9.6% of our revenue in fiscal
2017
,
2016
and
2015
, respectively. The Department of Defense ("DoD") accounted for 9.2%, 8.2%, and 10.4% of our revenue in fiscal
2017
,
2016
and
2015
, respectively. We typically support multiple programs within a single U.S. federal government agency, both domestically and internationally. We also assist U.S. state and local government clients in a variety of jurisdictions across the United States. In Canada, we work for several provinces and a variety of local jurisdictions. Our commercial clients include companies in the chemical, energy, mining, pharmaceutical, retail, aerospace, automotive, petroleum, and communications industries. No single client, except for U.S. federal government clients, accounted for more than 10% of our revenue in fiscal
2017
.
Contracts
Our services are performed under three principal types of contracts with our clients: fixed-price, time-and-materials, and cost-plus. The following table presents the percentage of our revenue by contract type:
|
|
Fiscal Year
|
|||||
|
Contract Type
|
2017
|
2016
|
2015
|
|||
|
Fixed-price
|
33.0%
|
30.0%
|
35.4%
|
|||
|
Time-and-materials
|
45.9
|
50.9
|
45.8
|
|||
|
Cost-plus
|
21.1
|
19.1
|
18.8
|
|||
|
100.0%
|
100.0%
|
100.0%
|
||||
Under a fixed-price contract, the client agrees to pay a specified price for our performance of the entire contract or a specified portion of the contract. Some fixed-price contracts can include date-certain and/or performance obligations. Fixed-price contracts carry certain inherent risks, including risks of losses from underestimating costs, delays in project completion, problems with new technologies, price increases for materials, and economic and other changes that may occur over the contract period. Consequently, the profitability of fixed-price contracts may vary substantially. Under our time-and-materials contracts, we are paid for labor at negotiated hourly billing rates and also paid for other expenses. Profitability on these contracts is driven by billable headcount and cost control. Many of our time-and-materials contracts are subject to maximum contract values and, accordingly, revenue related to these contracts is recognized as if these contracts were fixed-price contracts. Under our cost-plus contracts, some of which are subject to a contract ceiling amount, we are reimbursed for allowable costs and fees, which may be fixed or performance-based. If our costs exceed the contract ceiling or are not allowable, we may not be able to obtain full reimbursement. Further, the amount of the fee received for a cost-plus award fee contract partially depends upon the client's discretionary periodic assessment of our performance on that contract.
Some contracts with the U.S. federal government are subject to annual funding approval. U.S. federal government agencies may impose spending restrictions that limit the continued funding of our existing contracts and may limit our ability to obtain additional contracts. These limitations, if significant, could have a material adverse effect on us. All contracts with the U.S. federal government may be terminated by the government at any time, with or without cause.
U.S. federal government agencies have formal policies against continuing or awarding contracts that would create actual or potential conflicts of interest with other activities of a contractor. These policies may prevent us from bidding for or performing government contracts resulting from or related to certain work we have performed. In addition, services performed for a commercial or government sector client may create conflicts of interest that preclude or limit our ability to obtain work for a private organization. We attempt to identify actual or potential conflicts of interest and to minimize the possibility that such conflicts could affect our work under current contracts or our ability to compete for future contracts. We have, on occasion, declined to bid on a project because of an existing or potential conflict of interest.
10
Some of our operating units have contracts with the U.S. federal government that are subject to audit by the government, primarily by the Defense Contract Audit Agency ("DCAA"). The DCAA generally seeks to (i) identify and evaluate all activities that contribute to, or have an impact on, proposed or incurred costs of government contracts; (ii) evaluate a contractor's policies, procedures, controls, and performance; and (iii) prevent or avoid wasteful, careless, and inefficient production or service. To accomplish this, the DCAA examines our internal control systems, management policies, and financial capability; evaluates the accuracy, reliability, and reasonableness of our cost representations and records; and assesses our compliance with Cost Accounting Standards ("CAS") and defective-pricing clauses found within the Federal Acquisition Regulation ("FAR"). The DCAA also performs an annual review of our overhead rates and assists in the establishment of our final rates. This review focuses on the allowability of cost items and the applicability of CAS. The DCAA also audits cost-based contracts, including the close-out of those contracts.
The DCAA reviews all types of U.S. federal government proposals, including those of award, administration, modification, and re-pricing. The DCAA considers our cost accounting system, estimating methods and procedures, and specific proposal requirements. Operational audits are also performed by the DCAA. A review of our operations at every major organizational level is conducted during the proposal review period. During the course of its audit, the U.S. federal government may disallow costs if it determines that we accounted for such costs in a manner inconsistent with CAS. Under a government contract, only those costs that are reasonable, allocable, and allowable are recoverable. A disallowance of costs by the U.S. federal government could have a material adverse effect on our financial results.
In accordance with our corporate policies, we maintain controls to minimize any occurrence of fraud or other unlawful activities that could result in severe legal remedies, including the payment of damages and/or penalties, criminal and civil sanctions, and debarment. In addition, we maintain preventative audit programs and mitigation measures to ensure that appropriate control systems are in place.
We provide our services under contracts, purchase orders, or retainer letters. Our policy requires that all contracts must be in writing. We bill our clients in accordance with the contract terms and periodically based on costs incurred, on either an hourly-fee basis or on a percentage-of-completion basis, as the project progresses. Most of our agreements permit our clients to terminate the agreements without cause upon payment of fees and expenses through the date of the termination. Generally, our contracts do not require that we provide performance bonds. If required, a performance bond, issued by a surety company, guarantees a contractor's performance under the contract. If the contractor defaults under the contract, the surety will, at its discretion, complete the job or pay the client the amount of the bond. If the contractor does not have a performance bond and defaults in the performance of a contract, the contractor is responsible for all damages resulting from the breach of contract. These damages include the cost of completion, together with possible consequential damages such as lost profits.
Marketing and Business Development
Our management team establishes our overall business strategy focused on
Leading with Science
®
and providing solutions for our clients. Our strategic plan defines and guides our investment in marketing and business development to leverage our differentiators and target priority programs and growth markets. We maintain centralized business development resources to develop our corporate branding and marketing materials, support proposal preparation and planning, conduct market research, and manage promotional and professional activities, including appearances at trade shows, direct mailings, advertising, and public relations.
We have established company-wide growth initiatives that reinforce internal coordination, track the development of new programs, identify and coordinate collective resources for major bids, and help us build interdisciplinary teams and provide innovative solutions for major pursuits. Our growth initiatives provide a forum for cross-sector collaboration and the development of interdisciplinary solutions. We continuously identify new markets that are consistent with our strategic plan and service offerings, and we leverage our full-service capabilities and internal coordination structure to develop and implement strategies to research, anticipate, and position us for future procurements and emerging programs.
Business development activities are implemented by our technical and professional management staff throughout the company with the support of company-wide resources and expertise. Our project managers and technical staff have the best understanding of a client's needs and the effect of local or client-specific issues, laws and regulations, and procurement procedures. Our professional staff members hold frequent meetings with existing and potential clients; give presentations to civic and professional organizations; and present seminars on research and technical applications. Essential to the effective development of business is each staff member's access to all of our service offerings through our internal technical and geographic networks. Our strong internal networking programs help our professional staff members to pursue new opportunities for both existing and new clients. These networks also facilitate our ability to provide services throughout the project life cycle from the early studies to operations and maintenance. Our enterprise-wide knowledge management systems include skills search tools, business development tracking, and collaboration tools.
Sustainability Program
11
Tetra Tech supports clients in more than
100 countries
around the world, helping them to solve complex problems and achieve solutions that are technically, socially, and economically resilient. Our high-end consulting and engineering services focus on using innovative technologies and creative solutions to minimize environmental impacts. Our greatest contribution toward sustainability is through the projects we perform every day for our clients. Sustainability is embedded in our projects – from recycling freshwater supplies to recycling waste products, reducing energy consumption, and reducing greenhouse gas emissions in developing countries.
Our Sustainability Program allows us to further expand our commitment to sustainability by encouraging, coordinating, and reporting on actions to minimize our collective impacts on the environment. Our Sustainability Program has three primary pillars: Projects – the solutions we provide for our clients; Procurement – our procurement and subcontracting approaches; and Processes – the internal policies and processes that promote sustainable practices, reduce costs, and minimize environmental impacts. In addition, our program is based on the Global Reporting Initiative ("GRI") Sustainability Report Framework, the internationally predominant sustainability reporting protocol for corporate sustainability plans, which includes three fundamental areas: environmental, economic, and social sustainability.
Our Sustainability Program is led by our Chief Sustainability Officer, who has been appointed by executive management and is supported by other key corporate and operations representatives via our Sustainability Council. We have established a clear set of metrics to evaluate our progress toward our sustainability goals. Each metric corresponds with one or more performance indicators from GRI. These metrics include economic, health and safety, information technology, human resources, and real estate. We continuously implement sustainability-related policies and practices, and we assess the results of our efforts in order to improve upon them in the future. Our executive management team reviews and approves the Sustainability Program and evaluates our progress in achieving the goals and objectives outlined in our plan. We publish an annual sustainability report that documents our progress and is posted on our website.
Acquisitions and Divestitures
Acquisitions.
We continuously evaluate the marketplace for acquisition opportunities to further our strategic growth plans. Due to our reputation, size, financial resources, geographic presence and range of services, we have numerous opportunities to acquire privately and publicly held companies or selected portions of such companies. We evaluate an acquisition opportunity based on its ability to strengthen our leadership in the markets we serve, broaden our service offerings, add new geographies, and provide complementary skills. Also, during our evaluation, we examine an acquisition's ability to drive organic growth, its accretive effect on long-term earnings, and its ability to generate return on investment. Generally, we proceed with an acquisition if we believe that it could strategically expand our service offerings, improve our long-term financial performance, and increase shareholder returns.
We view acquisitions as a key component in the execution of our growth strategy, and we intend to use cash, debt or equity, as we deem appropriate, to fund acquisitions. We may acquire other businesses that we believe are synergistic and will ultimately increase our revenue and net income, strengthen our ability to achieve our strategic goals, provide critical mass with existing clients, and further expand our lines of service. We typically pay a purchase price that results in the recognition of goodwill, generally representing the intangible value of a successful business with an assembled workforce specialized in our areas of interest. Acquisitions are inherently risky, and no assurance can be given that our previous or future acquisitions will be successful or will not have a material adverse effect on our financial position, results of operations, or cash flows. All acquisitions require the approval of our Board of Directors.
For detailed information regarding acquisitions, see Note
5
, "
Mergers and Acquisitions
" of the "Notes to Consolidated Financial Statements" included in Item 8.
Divestitures.
We regularly review and evaluate our existing operations to determine whether our business model should change through the divestiture of certain businesses. Accordingly, from time to time, we may divest or wind-down certain non-core businesses and reallocate our resources to businesses that better align with our long-term strategic direction. We did not have any divestitures in fiscal
2017
,
2016
, or
2015
.
Competition
The market for our services is generally competitive. We often compete with many other firms ranging from small regional firms to large international firms.
We perform a broad spectrum of consulting, engineering, and technical services across the water, environment, infrastructure, resource management, energy, and international development markets. Our client base includes U.S. federal government agencies such as the DoD, USAID, DOE, EPA and the Federal Aviation Administration; U.S. state and local government agencies; government and commercial clients in Canada and Australia; the U.S. commercial sector, which consists primarily of large industrial companies and utilities; and our international commercial clients. Our competition varies and is a function of the
12
business areas in which, and the client sectors for which, we perform our services. The number of competitors for any procurement can vary widely, depending upon technical qualifications, the relative value of the project, geographic location, the financial terms and risks associated with the work, and any restrictions placed upon competition by the client. Historically, clients have chosen among competing firms by weighing the quality, innovation and timeliness of the firm's service versus its cost to determine which firm offers the best value. When less work becomes available in certain markets, price could become an increasingly important factor.
Our competitors vary depending on end markets and clients, and often we may only compete with a portion of a firm. We believe that our principal competitors include the following firms, in alphabetical order: AECOM Technology Corporation; Arcadis NV; Black & Veatch Corporation; Brown & Caldwell; CDM Smith Inc.; CH2M HILL Companies, Ltd.; Chemonics International, Inc.; Exponent, Inc.; GHD; ICF International, Inc.; Jacobs Engineering Group Inc.; Leidos, Inc.; SNC-Lavalin Group Inc.; Stantec Inc.; TRC Companies, Inc.; Weston Solutions, Inc.; and WSP Global Inc.
Backlog
We include in our backlog only those contracts for which funding has been provided and work authorization has been received. We estimate that approximately 70% of our backlog at the end of fiscal
2017
will be recognized as revenue in fiscal 2018, as work is being performed. However, we cannot guarantee that the revenue projected in our backlog will be realized or, if realized, will result in profits. In addition, project cancellations or scope adjustments may occur with respect to contracts reflected in our backlog. For example, certain of our contracts with the U.S. federal government and other clients are terminable at the discretion of the client, with or without cause. These types of backlog reductions could adversely affect our revenue and margins. Accordingly, our backlog as of any particular date is an uncertain indicator of our future earnings.
At fiscal
2017
year-end, our backlog was $
2.5 billion
, an increase of $
162.2 million
, or
6.8%
, compared to fiscal
2016
year-end. Approximately $1.0 billion and $1.5 billion of our backlog at the end of fiscal
2017
related to WEI and RME, respectively.
Regulations
We engage in various service activities that are subject to government oversight, including environmental laws and regulations, general government procurement laws and regulations, and other regulations and requirements imposed by the specific government agencies with which we conduct business.
Environmental.
A significant portion of our business involves the planning, design, program management and construction management of pollution control facilities, as well as the assessment and management of remediation activities at hazardous waste sites, U.S. Superfund sites, and military bases. In addition, we contract with U.S. federal government entities to destroy hazardous materials. These activities require us to manage, handle, remove, treat, transport, and dispose of toxic or hazardous substances.
Some environmental laws, such as the U.S. Superfund law and similar state, provincial and local statutes, can impose liability for the entire cost of clean-up for contaminated facilities or sites upon present and former owners and operators, as well as generators, transporters, and persons arranging for the treatment or disposal of such substances. In addition, while we strive to handle hazardous and toxic substances with care and in accordance with safe methods, the possibility of accidents, leaks, spills, and events of force majeure always exist. Humans exposed to these materials, including workers or subcontractors engaged in the transportation and disposal of hazardous materials and persons in affected areas, may be injured or become ill. This could result in lawsuits that expose us to liability and substantial damage awards. Liabilities for contamination or human exposure to hazardous or toxic materials, or a failure to comply with applicable regulations, could result in substantial costs, including clean-up costs, fines, civil or criminal sanctions, third party claims for property damage or personal injury, or the cessation of remediation activities.
Certain of our business operations are covered by U.S. Public Law 85-804, which provides for government indemnification against claims and damages arising out of unusually hazardous activities performed at the request of the government. Due to changes in public policies and law, however, government indemnification may not be available in the case of any future claims or liabilities relating to other hazardous activities that we perform.
Government Procurement.
The services we provide to the U.S. federal government are subject to the FAR and other rules and regulations applicable to government contracts. These rules and regulations:
|
•
|
require certification and disclosure of all cost and pricing data in connection with the contract negotiations under certain contract types;
|
|
•
|
impose accounting rules that define allowable and unallowable costs and otherwise govern our right to reimbursement under certain cost-based government contracts; and
|
|
•
|
restrict the use and dissemination of information classified for national security purposes and the exportation of certain products and technical data.
|
13
In addition, services provided to the DoD are monitored by the Defense Contract Management Agency and audited by the DCAA. Our government clients can also terminate any of their contracts, and many of our government contracts are subject to renewal or extension annually. Further, the services we provide to state and local government clients are subject to various government rules and regulations.
Seasonality
We experience seasonal trends in our business. Our revenue and operating income are typically lower in the first half of our fiscal year, primarily due to the Thanksgiving (in the U.S.), Christmas and New Year's holidays. Many of our clients' employees, as well as our own employees, take vacations during these holiday periods. Further, seasonal inclement weather conditions occasionally cause some of our offices to close temporarily or may hamper our project field work in the northern hemisphere's temperate and arctic regions. These occurrences result in fewer billable hours worked on projects and, correspondingly, less revenue recognized.
Potential Liability and Insurance
Our business activities could expose us to potential liability under various laws and under workplace health and safety regulations. In addition, we occasionally assume liability by contract under indemnification agreements. We cannot predict the magnitude of such potential liabilities.
We maintain a comprehensive general liability insurance policy with an umbrella policy that covers losses beyond the general liability limits. We also maintain professional errors and omissions liability and contractor's pollution liability insurance policies. We believe that both policies provide adequate coverage for our business. When we perform higher-risk work, we obtain, if available, the necessary types of insurance coverage for such activities, as is typically required by our clients.
We obtain insurance coverage through a broker that is experienced in our industry. The broker and our risk manager regularly review the adequacy of our insurance coverage. Because there are various exclusions and retentions under our policies, or an insurance carrier may become insolvent, there can be no assurance that all potential liabilities will be covered by our insurance policies or paid by our carrier.
We evaluate the risk associated with insurance claims. If we determine that a loss is probable and reasonably estimable, we establish an appropriate reserve. A reserve is not established if we determine that a claim has no merit or is not probable or reasonably estimable. Our historic levels of insurance coverage and reserves have been adequate. However, partially or completely uninsured claims, if successful and of significant magnitude, could have a material adverse effect on our business.
Employees
At fiscal
2017
year-end, we had more than
16,000
staff worldwide. A large percentage of our employees have technical and professional backgrounds and undergraduate and/or advanced degrees, including the employees of recently acquired companies. Our professional staff includes archaeologists, architects, biologists, chemical engineers, chemists, civil engineers, data scientists, computer scientists, economists, electrical engineers, environmental engineers, environmental scientists, geologists, hydrogeologists, mechanical engineers, oceanographers, project managers and toxicologists. We consider the current relationships with our employees to be favorable. We are not aware of any employment circumstances that are likely to disrupt work at any of our facilities. See Part I, Item 1A, "Risk Factors" for a discussion of the risks related to the loss of key personnel or our inability to attract and retain qualified personnel.
Executive Officers of the Registrant
The following table shows the name, age and position of each of our executive officers at November 15, 2017:
|
Name
|
Age
|
Position
|
|||
|
Dan L. Batrack
|
59
|
|
Chairman, Chief Executive Officer and President
|
||
|
|
Mr. Batrack joined our predecessor in 1980 and was named Chairman in January 2008. He has served as our Chief Executive Officer and a director since November 2005, and as our President since October 2008. Mr. Batrack has served in numerous capacities over the last 30 years, including project scientist, project manager, operations manager, Senior Vice President and President of an operating unit. He has managed complex programs for many small and Fortune 500 clients, both in the United States and internationally. Mr. Batrack holds a B.A. degree in Business Administration from the University of Washington.
|
||||
14
|
Name
|
Age
|
Position
|
|||
|
Steven M. Burdick
|
53
|
|
Executive Vice President, Chief Financial Officer
|
||
|
|
Mr. Burdick has served as our Executive Vice President, Chief Financial Officer since April 2011. He served as our Senior Vice President and Corporate Controller from January 2004 to March 2011. Mr. Burdick joined us in April 2003 as Vice President, Management Audit. Previously, Mr. Burdick served in financial executive management roles in private industry and with Ernst & Young LLP. Mr. Burdick holds a B.S. degree in Business Administration from Santa Clara University and is a Certified Public Accountant.
|
||||
|
Leslie L. Shoemaker
|
60
|
|
Executive Vice President, Operations and President of CIG
|
||
|
|
Dr. Shoemaker was named Executive Vice President, Operations and President of CIG in November 2017. Dr. Shoemaker joined us in 1991, and served as President of WEI from April 2015 to November 2017. Previously she served in various management capacities, including project and program manager, water resources manager and infrastructure group president. From 2005 to 2015, she led our strategic planning, business development and company-wide collaboration programs. Her technical expertise is in the management of large-scale watershed and master planning studies, development of modeling tools and application of optimization tools for decision making. Additionally, she is our Chief Sustainability Officer who leads our Sustainability Council to implement sustainability-related policies and practices company-wide. Dr. Shoemaker holds a B.A. degree in Mathematics from Hamilton College, a Master of Engineering from Cornell University and a Ph.D. in Agricultural Engineering from the University of Maryland.
|
||||
|
Roger R. Argus
|
56
|
|
Senior Vice President and President of GSG and President of the U.S. Government Division of GSG
|
||
|
Mr. Argus is a chemical engineer with 33 years of experience, including 25 years with Tetra Tech, in operational leadership, program and project management, and quality assurance for projects encompassing a broad spectrum of environmental, engineering, and emergency management services. Mr. Argus has also been responsible for managing multidisciplinary contracts and projects in support of the U.S. federal government (i.e., Navy, USACE, and the EPA), state and municipal agencies, and private clients nationwide. The scope of his technical experience includes planning and directing environmental field investigations, engineering feasibility studies and designs, construction management, and research and development support for innovative environmental technologies and waste treatment systems. Mr. Argus holds a B.S. in Chemical Engineering from California State University, Long Beach.
|
|||||
|
Derek G. Amidon
|
50
|
|
Senior Vice President, President of the Commercial Account Management Division of CIG
|
||
|
Mr. Amidon has served as a project manager, key account manager, operations manager, and regional manager since joining Tetra Tech in 2012. He has managed a variety of complex, high profile programs for key Tetra Tech clients, including Fortune 100 companies. His focus has been on leading high value consulting services that deliver scientific, engineering and regulatory solutions for challenging environmental, engineering, permitting and public relations problems for oil and gas, mining, industrial, institutional and custodial trust clients. He has a demonstrated track record in leading complex environmental investigations and developing creative remedial solutions for client environmental liabilities. He has managed projects in the U.S., Africa, Australia, Europe, and the Caribbean. In addition to experience in both public and private consulting and engineering firms over his 24-year career, Mr. Amidon also served in a variety of business leadership and project development roles at Hess Corporation, a leading independent oil and gas company. Mr. Amidon is a registered Professional Engineer. He holds B.S. and M.S. degrees in Civil Engineering from Brigham Young University and a M.S. in Management from Rensselaer Polytechnic Institute.
|
|||||
15
|
Name
|
Age
|
Position
|
|||
|
Jan K. Auman
|
62
|
|
Senior Vice President, President of the Global Development Services Division of GSG
|
||
|
Mr. Auman has over 40 years of experience managing large, complex international development and technical assistance operations, having served 10 years with the United States federal government and 30 years in the private sector. With 20 years of residence overseas in eight countries, Mr. Auman has hands-on technical expertise in the areas of natural resources management, conflict resolution, political transformation, institutional development, and policy formulation in the Middle East, the South Pacific, the Caribbean, and Africa. Mr. Auman’s overall direction for Tetra Tech's international development operations includes technical, operational, administrative, fiscal, and representational responsibilities involving operations that manage projects in over 60 countries. Mr. Auman joined Tetra Tech through an acquisition in 2007. He holds a B.A. in Political Science and Government from Pennsylvania State University and an M.I.A in International Administration from the School for International Training.
|
|||||
|
William R. Brownlie
|
64
|
|
Senior Vice President, Chief Engineer and Corporate Risk Management Officer
|
||
|
|
Dr. Brownlie was named Senior Vice President and Chief Engineer in September 2009, and Corporate Risk Management Officer in November 2013. From December 2005 to September 2009, he served as a Group President. Dr. Brownlie joined our predecessor in 1981 and was named a Senior Vice President in December 1993. Dr. Brownlie has managed various operating units and programs focusing on water resources and environmental services, including work with USACE, the U.S. Air Force, the U.S. Bureau of Reclamation and DOE. He is a registered professional engineer and has a strong technical background in water resources. Dr. Brownlie holds B.S. and M.S. degrees in Civil Engineering from the State University of New York at Buffalo and a Ph.D. in Civil Engineering from the California Institute of Technology.
|
||||
|
Brian N. Carter
|
50
|
|
Senior Vice President, Corporate Controller and Chief Accounting Officer
|
||
|
|
Mr. Carter joined Tetra Tech as Vice President, Corporate Controller and Chief Accounting Officer in June 2011 and was appointed Senior Vice President in October 2012. Previously, Mr. Carter served in finance and auditing positions in private industry and with Ernst & Young LLP. Mr. Carter holds a B.S. in Business Administration from Miami University and is a Certified Public Accountant.
|
||||
|
Craig L. Christensen
|
64
|
|
Senior Vice President, Chief Information Officer
|
||
|
|
Mr. Christensen is responsible for our information services and technologies, including the implementation of our enterprise resource planning system. Mr. Christensen joined us in 1998 through the acquisition of our Tetra Tech NUS, Inc. ("NUS") subsidiary. Previously, Mr. Christensen held positions at NUS, Brown and Root Services, and Landmark Graphics subsidiaries of Halliburton Company where his responsibilities included contracts administration, finance, and system development. Prior to his service at Halliburton, Mr. Christensen held positions at Burroughs Corporation and Apple Computer. Mr. Christensen holds B.A. and M.B.A. degrees from Brigham Young University.
|
||||
|
Richard A. Lemmon
|
58
|
|
Senior Vice President, Corporate Administration
|
||
|
|
Mr. Lemmon joined our predecessor in 1981 in a technical capacity and became a member of its corporate staff in a management position in 1985. In 1988, at the time of our predecessor's divestiture from Honeywell, Inc., Mr. Lemmon structured and managed many of our corporate functions. He is currently responsible for insurance, risk management, human resources, safety and facilities.
|
||||
16
|
Name
|
Age
|
Position
|
|||
|
Kevin P. McDonald
|
58
|
|
Senior Vice President, Human Resources and Leadership Development
|
||
|
|
Mr. McDonald is responsible for all areas of human resources ("HR"), including executive compensation, employee benefits, succession planning, human resources information systems, and employment law compliance. Mr. McDonald joined us in 2003 through the acquisition of Foster Wheeler Environmental Corporation. Prior to leading our corporate HR organization, Mr. McDonald was the HR Director for one of our subsidiaries. He has more than 30 years' experience in the engineering and construction services industry. Mr. McDonald earned a B.S. degree in Management from the University of Scranton and an M.B.A. from Farleigh Dickinson University.
|
||||
|
Mark A. Rynning
|
56
|
|
Senior Vice President, President of the U.S. Infrastructure Division of GSG
|
||
|
|
Mr. Rynning has more than 30 years of experience in the engineering consulting industry, including 27 years with Tetra Tech. He is a registered professional engineer and has served Tetra Tech in numerous capacities including project manager, operations manager, and operating unit leader. He has managed large water infrastructure programs for state and local agencies throughout the United States. Mr. Rynning has broad experience in planning and design of water and wastewater infrastructure, utility master planning, and design of water and wastewater transmission and collection systems. In addition, Mr. Rynning has planned and designed reverse osmosis water treatment plants and advanced wastewater treatment systems. He has provided expert advisory services to numerous municipal clients for utility system acquisitions. He holds a B.S. in Civil Engineering and a Master of Business Administration, both from the University of Florida.
|
||||
|
Janis B. Salin
|
64
|
|
Senior Vice President, General Counsel and Secretary
|
||
|
|
Ms. Salin joined us in February 2002. For the prior 18 years, Ms. Salin was a Principal with the law firm of Riordan & McKinzie in Los Angeles, and served as Managing Principal of that firm from 1990 to 1992. She served as our outside counsel from the time of our formation in 1988. Ms. Salin holds B.A. and J.D. degrees from the University of California at Los Angeles.
|
||||
|
Bernard Teufele
|
52
|
|
Senior Vice President, President of the Canada and South America Division of CIG
|
||
|
|
Mr. Teufele has over 22 years of consulting engineering experience as a leader of a highly diversified, high-end infrastructure practice and as a technical expert in the field of infrastructure monitoring and asset management. Prior to his current role, Mr. Teufele has managed operating units of increasing size and complexity with a primary focus on infrastructure, environmental sciences, civil transportation, and mining-related services doing work for municipal, provincial, and federal government clients in Canada. He has managed key provincial infrastructure programs in Canada with a particular focus on the monitoring and assessment of roadway infrastructure and the development of asset management programs. Mr. Teufele, who joined Tetra Tech through an acquisition in 2010, has also been instrumental in advancing Tetra Tech’s involvement with private sector infrastructure clients on large alternate delivery projects (design-build and public-private partnership P3 projects). Mr. Teufele has a B.Sc. in Applied Science from the University of British Columbia.
|
||||
Available Information
All of our periodic report filings with the Securities and Exchange Commission ("SEC") pursuant to Section 13(a) or 15(d) of the Securities Exchange Act of 1934, as amended (the "Exchange Act"), are made available, free of charge, through our website located at www.tetratech.com, including our Annual Reports on Form 10-K, Quarterly Reports on Form 10-Q, Current Reports on Form 8-K and any amendments to these reports. These reports are available on our website as soon as reasonably practicable after we electronically file with or furnish the reports to the SEC. You may also request an electronic or paper copy of these filings at no cost by writing or telephoning us at the following: Tetra Tech, Inc., Attention: Investor Relations, 3475 East Foothill Boulevard, Pasadena, California 91107, (626) 351-4664.
17
We operate in a changing environment that involves numerous known and unknown risks and uncertainties that could materially adversely affect our operations. Set forth below and elsewhere in this report and in other documents we file with the SEC are descriptions of the risks and uncertainties that could cause our actual results to differ materially from the results contemplated by the forward-looking statements contained in this report. Additional risks we do not yet know of or that we currently think are immaterial may also affect our business operations. If any of the events or circumstances described in the following risks actually occurs, our business, financial condition or results of operations could be materially adversely affected.
Continuing worldwide political and economic uncertainties may adversely affect our revenue and profitability.
The last several years have been periodically marked by political and economic concerns, including decreased consumer confidence, the lingering effects of international conflicts, energy costs and inflation. Although certain indices and economic data have shown signs of stabilization in the United States and certain global markets, there can be no assurance that these improvements will be broad-based or sustainable. This instability can make it extremely difficult for our clients, our vendors and us to accurately forecast and plan future business activities, and could cause constrained spending on our services, delays and a lengthening of our business development efforts, the demand for more favorable pricing or other terms, and/or difficulty in collection of our accounts receivable. Our government clients may face budget deficits that prohibit them from funding proposed and existing projects. Further, ongoing economic instability in the global markets could limit our ability to access the capital markets at a time when we would like, or need, to raise capital, which could have an impact on our ability to react to changing business conditions or new opportunities. If economic conditions remain uncertain or weaken, or government spending is reduced, our revenue and profitability could be adversely affected.
The current U.S. Administration may make changes to fiscal and tax policies that may adversely affect our business.
The current U.S. Administration has called for changes to fiscal and tax policies, which may include comprehensive tax reform. We cannot predict the impact, if any, of these changes to our business. However, it is possible that these changes could adversely affect our business. It is likely that some policies adopted by the new administration will benefit us and others will negatively affect us. Until we know what changes are enacted, we will not know whether in total we benefit from, or are negatively affected by, the changes.
Demand for our services is cyclical and vulnerable to economic downturns. If economic growth slows, government fiscal conditions worsen, or client spending declines further, then our revenue, profits and financial condition may deteriorate.
Demand for our services is cyclical, and vulnerable to economic downturns and reductions in government and private industry spending. Such downturns or reductions may result in clients delaying, curtailing or canceling proposed and existing projects. Our business traditionally lags the overall recovery in the economy; therefore, our business may not recover immediately when the economy improves. If economic growth slows, government fiscal conditions worsen, or client spending declines, then our revenue, profits and overall financial condition may deteriorate. Our government clients may face budget deficits that prohibit them from funding new or existing projects. In addition, our existing and potential clients may either postpone entering into new contracts or request price concessions. Difficult financing and economic conditions may cause some of our clients to demand better pricing terms or delay payments for services we perform, thereby increasing the average number of days our receivables are outstanding, and the potential of increased credit losses of uncollectible invoices. Further, these conditions may result in the inability of some of our clients to pay us for services that we have already performed. If we are not able to reduce our costs quickly enough to respond to the revenue decline from these clients, our operating results may be adversely affected. Accordingly, these factors affect our ability to forecast our future revenue and earnings from business areas that may be adversely impacted by market conditions.
Demand for our oil and gas, and mining services fluctuates and a decline in demand could adversely affect our revenue, profits and financial condition.
Demand for our oil and gas services fluctuates, and we depend on our customers’ willingness to make future expenditures to explore for, develop, produce and transport oil and natural gas in the United States and Canada. Our customers’ willingness to undertake these activities depends largely upon prevailing industry conditions that are influenced by numerous factors over which we have no control, including:
|
•
|
prices, and expectations about future prices, of oil and natural gas;
|
|
•
|
domestic and foreign supply of and demand for oil and natural gas;
|
|
•
|
the cost of exploring for, developing, producing and delivering oil and natural gas;
|
18
|
•
|
transportation capacity, including but not limited to train transportation capacity and its future regulation;
|
|
•
|
available pipeline, storage and other transportation capacity;
|
|
•
|
availability of qualified personnel and lead times associated with acquiring equipment and products;
|
|
•
|
federal, state, provincial and local regulation of oilfield activities;
|
|
•
|
environmental concerns regarding the methods our customers use to produce hydrocarbons;
|
|
•
|
the availability of water resources and the cost of disposal and recycling services; and
|
|
•
|
seasonal limitations on access to work locations.
|
Anticipated future prices for natural gas and crude oil are a primary factor affecting spending by our customers. Lower prices or volatility in prices for oil and natural gas typically decrease spending, which can cause rapid and material declines in demand for our services and in the prices we are able to charge for our services. Worldwide political, economic, military and terrorist events, as well as natural disasters and other factors beyond our control, contribute to oil and natural gas price levels and volatility and are likely to continue to do so in the future.
Further, the businesses of our global mining clients are, to varying degrees, cyclical and have experienced declines over the last three years due to lower global growth expectations and the associated decline in market prices. For example, depending on the market prices of uranium, precious metals, aluminum, copper, iron ore, and potash, our mining company clients may cancel or curtail their mining projects, which could result in a corresponding decline in the demand for our services among these clients. Accordingly, the cyclical nature of the mining industry could adversely affect our business, operating results or financial condition.
Our international operations expose us to legal, political, and economic risks in different countries as well as currency exchange rate fluctuations that could harm our business and financial results.
In fiscal 2017, we generated
26.7%
of our revenue from our international operations, primarily in Canada and Australia, and from international clients for work that is performed by our domestic operations. International business is subject to a variety of risks, including:
|
•
|
imposition of governmental controls and changes in laws, regulations, or policies;
|
|
•
|
lack of developed legal systems to enforce contractual rights;
|
|
•
|
greater risk of uncollectible accounts and longer collection cycles;
|
|
•
|
currency exchange rate fluctuations, devaluations, and other conversion restrictions;
|
|
•
|
uncertain and changing tax rules, regulations, and rates;
|
|
•
|
the potential for civil unrest, acts of terrorism, force majeure, war or other armed conflict, and greater physical security risks, which may cause us to leave a country quickly;
|
|
•
|
logistical and communication challenges;
|
|
•
|
changes in regulatory practices, including tariffs and taxes;
|
|
•
|
changes in labor conditions;
|
|
•
|
general economic, political, and financial conditions in foreign markets; and
|
|
•
|
exposure to civil or criminal liability under the U.S. Foreign Corrupt Practices Act (“FCPA”), the U.K. Bribery Act, the Canadian Corruption of Foreign Public Officials Act, the Brazilian Clean Companies Act, the anti-boycott rules, trade and export control regulations, as well as other international regulations.
|
For example, an ongoing government investigation into political corruption in Quebec contributed to the slow-down in procurements and business activity in that province, which adversely affected our business. The Province of Quebec has adopted legislation that requires businesses and individuals seeking contracts with governmental bodies be certified by a Quebec regulatory authority for contracts over a specified size. Our failure to maintain certification could adversely affect our business.
International risks and violations of international regulations may significantly reduce our revenue and profits, and subject us to criminal or civil enforcement actions, including fines, suspensions, or disqualification from future U.S. federal procurement contracting. Although we have policies and procedures to monitor legal and regulatory compliance, our employees, subcontractors, and agents could take actions that violate these requirements. As a result, our international risk exposure may be more or less than the percentage of revenue attributed to our international operations.
We derive a substantial amount of our revenue from U.S. federal, state and local government agencies, and any disruption in government funding or in our relationship with those agencies could adversely affect our business.
In fiscal 2017, we generated
45.5%
of our revenue from contracts with U.S. federal, and state and local government agencies. A significant amount of this revenue is derived under multi-year contracts, many of which are appropriated on an annual basis. As a result, at the beginning of a project, the related contract may be only partially funded, and additional funding is normally
19
committed only as appropriations are made in each subsequent year. These appropriations, and the timing of payment of appropriated amounts, may be influenced by numerous factors as noted below. Our backlog includes only the projects that have funding appropriated.
The demand for our U.S. government-related services is generally driven by the level of government program funding. Accordingly, the success and further development of our business depends, in large part, upon the continued funding of these U.S. government programs, and upon our ability to obtain contracts and perform well under these programs. Under the Budget Control Act of 2011, an automatic sequestration process, or across-the-board budget cuts (a large portion of which was defense-related), was triggered. The sequestration began on March 1, 2013. Although the Bipartisan Budget Act of 2013 provided some sequester relief through the end of fiscal year 2015, the sequestration requires reduced U.S. federal government spending through fiscal year 2021. A significant reduction in federal government spending, the absence of a bipartisan agreement on the federal government budget, or a change in budgetary priorities could reduce demand for our services, cancel or delay federal projects, result in the closure of federal facilities and significant personnel reductions, and have a material and adverse impact on our business, financial condition, results of operations and cash flows.
There are several additional factors that could materially affect our U.S. government contracting business, which could cause U.S. government agencies to delay or cancel programs, to reduce their orders under existing contracts, to exercise their rights to terminate contracts or not to exercise contract options for renewals or extensions. Such factors, which include the following, could have a material adverse effect on our revenue or the timing of contract payments from U.S. government agencies:
|
•
|
the failure of the U.S. government to complete its budget and appropriations process before its fiscal year-end, which would result in the funding of government operations by means of a continuing resolution that authorizes agencies to continue to operate but does not authorize new spending initiatives. As a result, U.S. government agencies may delay the procurement of services;
|
|
•
|
changes in and delays or cancellations of government programs, requirements or appropriations;
|
|
•
|
budget constraints or policy changes resulting in delay or curtailment of expenditures related to the services we provide;
|
|
•
|
re-competes of government contracts;
|
|
•
|
the timing and amount of tax revenue received by federal, and state and local governments, and the overall level of government expenditures;
|
|
•
|
curtailment in the use of government contracting firms;
|
|
•
|
delays associated with insufficient numbers of government staff to oversee contracts;
|
|
•
|
the increasing preference by government agencies for contracting with small and disadvantaged businesses;
|
|
•
|
competing political priorities and changes in the political climate with regard to the funding or operation of the services we provide;
|
|
•
|
the adoption of new laws or regulations affecting our contracting relationships with the federal, state or local governments;
|
|
•
|
unsatisfactory performance on government contracts by us or one of our subcontractors, negative government audits or other events that may impair our relationship with federal, state or local governments;
|
|
•
|
a dispute with or improper activity by any of our subcontractors; and
|
|
•
|
general economic or political conditions.
|
Our inability to win or renew U.S. government contracts during regulated procurement processes could harm our operations and significantly reduce or eliminate our profits.
U.S. government contracts are awarded through a regulated procurement process. The U.S. federal government has increasingly relied upon multi-year contracts with pre-established terms and conditions, such as indefinite delivery/indefinite quantity (“IDIQ”) contracts, which generally require those contractors who have previously been awarded the IDIQ to engage in an additional competitive bidding process before a task order is issued. As a result, new work awards tend to be smaller and of shorter duration, since the orders represent individual tasks rather than large, programmatic assignments. In addition, we believe that there has been an increase in the award of federal contracts based on a low-price, technically acceptable criteria emphasizing price over qualitative factors, such as past performance. As a result, pricing pressure may reduce our profit margins on future federal contracts. The increased competition and pricing pressure, in turn, may require us to make sustained efforts to reduce costs in order to realize revenue, and profits under government contracts. If we are not successful in reducing the amount of costs we incur, our profitability on government contracts will be negatively impacted. In addition, the U.S. federal government has scaled back outsourcing of services in favor of “insourcing” jobs to its employees, which could reduce our revenue. Moreover, even if we are qualified to work on a government contract, we may not be awarded the contract because of existing government policies designed to protect small businesses and under-represented minority contractors. Our inability to win or renew government contracts
during regulated procurement processes could harm our operations and significantly reduce or eliminate our profits.
20
Each year, client funding for some of our U.S. government contracts may rely on government appropriations or public-supported financing. If adequate public funding is delayed or is not available, then our profits and revenue could decline.
Each year, client funding for some of our U.S. government contracts may directly or indirectly rely on government appropriations or public-supported financing. Legislatures may appropriate funds for a given project on a year-by-year basis, even though the project may take more than one year to perform. In addition, public-supported financing such as U.S. state and local municipal bonds may be only partially raised to support existing projects. Similarly, the impact of the economic downturn on U.S. state and local governments may make it more difficult for them to fund projects. In addition to the state of the economy and competing political priorities, public funds and the timing of payment of these funds may be influenced by, among other things, curtailments in the use of government contracting firms, increases in raw material costs, delays associated with insufficient numbers of government staff to oversee contracts, budget constraints, the timing and amount of tax receipts, and the overall level of government expenditures. If adequate public funding is not available or is delayed, then our profits and revenue could decline.
Our U.S. federal government contracts may give government agencies the right to modify, delay, curtail, renegotiate, or terminate existing contracts at their convenience at any time prior to their completion, which may result in a decline in our profits and revenue.
U.S. federal government projects in which we participate as a contractor or subcontractor may extend for several years. Generally, government contracts include the right to modify, delay, curtail, renegotiate, or terminate contracts and subcontracts at the government’s convenience any time prior to their completion. Any decision by a U.S. federal government client to modify, delay, curtail, renegotiate, or terminate our contracts at their convenience may result in a decline in our profits and revenue.
As a U.S. government contractor, we must comply with various procurement laws and regulations and are subject to regular government audits; a violation of any of these laws and regulations or the failure to pass a government audit could result in sanctions, contract termination, forfeiture of profit, harm to our reputation or loss of our status as an eligible government contractor and could reduce our profits and revenue.
We must comply with and are affected by U.S. federal, state, local, and foreign laws and regulations relating to the formation, administration and performance of government contracts. For example, we must comply with FAR, the Truth in Negotiations Act, CAS, the American Recovery and Reinvestment Act of 2009, the Services Contract Act, and the DoD security regulations, as well as many other rules and regulations. In addition, we must also comply with other government regulations related to employment practices, environmental protection, health and safety, tax, accounting, and anti-fraud measures, as well as many other regulations in order to maintain our government contractor status. These laws and regulations affect how we do business with our clients and, in some instances, impose additional costs on our business operations. Although we take precautions to prevent and deter fraud, misconduct, and non-compliance, we face the risk that our employees or outside partners may engage in misconduct, fraud, or other improper activities. U.S. government agencies, such as the DCAA, routinely audit and investigate government contractors. These government agencies review and audit a government contractor’s performance under its contracts and cost structure, and evaluate compliance with applicable laws, regulations, and standards. In addition, during the course of its audits, the DCAA may question our incurred project costs. If the DCAA believes we have accounted for such costs in a manner inconsistent with the requirements for FAR or CAS, the DCAA auditor may recommend to our U.S. government corporate administrative contracting officer that such costs be disallowed. Historically, we have not experienced significant disallowed costs as a result of government audits. However, we can provide no assurance that the DCAA or other government audits will not result in material disallowances for incurred costs in the future. In addition, U.S. government contracts are subject to various other requirements relating to the formation, administration, performance, and accounting for these contracts. We may also be subject to
qui tam
litigation brought by private individuals on behalf of the U.S. government under the Federal Civil False Claims Act, which could include claims for treble damages. U.S. government contract violations could result in the imposition of civil and criminal penalties or sanctions, contract termination, forfeiture of profit, and/or suspension of payment, any of which could make us lose our status as an eligible government contractor. We could also suffer serious harm to our reputation. Any interruption or termination of our U.S. government contractor status could reduce our profits and revenue significantly.
If we extend a significant portion of our credit to clients in a specific geographic area or industry, we may experience disproportionately high levels of collection risk and nonpayment if those clients are adversely affected by factors particular to their geographic area or industry.
Our clients include public and private entities that have been, and may continue to be, negatively impacted by the changing landscape in the global economy. While outside of the U.S. federal government
no
one client accounted for over 10% of our revenue for fiscal 2017, we face collection risk as a normal part of our business where we perform services and subsequently bill our clients for such services. In the event that we have concentrated credit risk from clients in a specific geographic area or industry,
21
continuing negative trends or a worsening in the financial condition of that specific geographic area or industry could make us susceptible to disproportionately high levels of default by those clients. Such defaults could materially adversely impact our revenues and our results of operations.
We have made and expect to continue to make acquisitions that could disrupt our operations and adversely impact our business and operating results. Our failure to conduct due diligence effectively, or our inability to successfully integrate acquisitions, could impede us from realizing all of the benefits of the acquisitions, which could weaken our results of operations.
A key part of our growth strategy is to acquire other companies that complement our lines of business or that broaden our technical capabilities and geographic presence. We expect to continue to acquire companies as an element of our growth strategy; however, our ability to make acquisitions is restricted under our credit agreement. Acquisitions involve certain known and unknown risks that could cause our actual growth or operating results to differ from our expectations or the expectations of securities analysts. For example:
|
•
|
we may not be able to identify suitable acquisition candidates or to acquire additional companies on acceptable terms;
|
|
•
|
we are pursuing international acquisitions, which inherently pose more risk than domestic acquisitions;
|
|
•
|
we compete with others to acquire companies, which may result in decreased availability of, or increased price for, suitable acquisition candidates;
|
|
•
|
we may not be able to obtain the necessary financing, on favorable terms or at all, to finance any of our potential acquisitions;
|
|
•
|
we may ultimately fail to consummate an acquisition even if we announce that we plan to acquire a company; and
|
|
•
|
acquired companies may not perform as we expect, and we may fail to realize anticipated revenue and profits.
|
In addition, our acquisition strategy may divert management’s attention away from our existing businesses, resulting in the loss of key clients or key employees, and expose us to unanticipated problems or legal liabilities, including responsibility as a successor-in-interest for undisclosed or contingent liabilities of acquired businesses or assets.
If we fail to conduct due diligence on our potential targets effectively, we may, for example, not identify problems at target companies, or fail to recognize incompatibilities or other obstacles to successful integration. Our inability to successfully integrate future acquisitions could impede us from realizing all of the benefits of those acquisitions and could severely weaken our business operations. The integration process may disrupt our business and, if implemented ineffectively, may preclude realization of the full benefits expected by us and could harm our results of operations. In addition, the overall integration of the combining companies may result in unanticipated problems, expenses, liabilities, and competitive responses, and may cause our stock price to decline. The difficulties of integrating an acquisition include, among others:
|
•
|
issues in integrating information, communications, and other systems;
|
|
•
|
incompatibility of logistics, marketing, and administration methods;
|
|
•
|
maintaining employee morale and retaining key employees;
|
|
•
|
integrating the business cultures of both companies;
|
|
•
|
preserving important strategic client relationships;
|
|
•
|
consolidating corporate and administrative infrastructures, and eliminating duplicative operations; and
|
|
•
|
coordinating and integrating geographically separate organizations.
|
In addition, even if the operations of an acquisition are integrated successfully, we may not realize the full benefits of the acquisition, including the synergies, cost savings or growth opportunities that we expect. These benefits may not be achieved within the anticipated time frame, or at all.
Further, acquisitions may cause us to:
|
•
|
issue common stock that would dilute our current stockholders’ ownership percentage;
|
|
•
|
use a substantial portion of our cash resources;
|
|
•
|
increase our interest expense, leverage, and debt service requirements (if we incur additional debt to pay for an acquisition);
|
|
•
|
assume liabilities, including environmental liabilities, for which we do not have indemnification from the former owners. Further, indemnification obligations may be subject to dispute or concerns regarding the creditworthiness of the former owners;
|
|
•
|
record goodwill and non-amortizable intangible assets that are subject to impairment testing and potential impairment charges;
|
22
|
•
|
experience volatility in earnings due to changes in contingent consideration related to acquisition earn-out liability estimates;
|
|
•
|
incur amortization expenses related to certain intangible assets;
|
|
•
|
lose existing or potential contracts as a result of conflict of interest issues;
|
|
•
|
incur large and immediate write-offs; or
|
|
•
|
become subject to litigation.
|
Finally, acquired companies that derive a significant portion of their revenue from the U.S. federal government and do not follow the same cost accounting policies and billing practices that we follow may be subject to larger cost disallowances for greater periods than we typically encounter. If we fail to determine the existence of unallowable costs and do not establish appropriate reserves in advance of an acquisition, we may be exposed to material unanticipated liabilities, which could have a material adverse effect on our business.
If our goodwill or other intangible assets become impaired, then our profits may be significantly reduced.
Because we have historically acquired a significant number of companies, goodwill and other intangible assets represent a substantial portion of our assets. As of October 1, 2017, our goodwill was $
740.9 million
and other intangible assets were $
26.7 million
. We are required to perform a goodwill impairment test for potential impairment at least on an annual basis. We also assess the recoverability of the unamortized balance of our intangible assets when indications of impairment are present based on expected future profitability and undiscounted expected cash flows and their contribution to our overall operations. The goodwill impairment test requires us to determine the fair value of our reporting units, which are the components one level below our reportable segments. In determining fair value, we make significant judgments and estimates, including assumptions about our strategic plans with regard to our operations. We also analyze current economic indicators and market valuations to help determine fair value. To the extent economic conditions that would impact the future operations of our reporting units change, our goodwill may be deemed to be impaired, and we would be required to record a non-cash charge that could result in a material adverse effect on our financial position or results of operations.
For example, we wrote-off all of our Global Mining Practice’s goodwill and identifiable intangible assets and recorded a related impairment charge of $60.8 million ($57.3 million after-tax) in the fourth quarter of fiscal 2015. We had no goodwill impairment in fiscal 2017 or 2016.
We could be adversely affected by violations of the FCPA and similar worldwide anti-bribery laws.
The FCPA and similar anti-bribery laws generally prohibit companies and their intermediaries from making improper payments to foreign government officials for the purpose of obtaining or retaining business. The U.K. Bribery Act of 2010 prohibits both domestic and international bribery, as well as bribery across both private and public sectors. In addition, an organization that “fails to prevent bribery” by anyone associated with the organization can be charged under the U.K. Bribery Act unless the organization can establish the defense of having implemented “adequate procedures” to prevent bribery. Improper payments are also prohibited under the Canadian Corruption of Foreign Public Officials Act and the Brazilian Clean Companies Act. Practices in the local business community of many countries outside the United States have a level of government corruption that is greater than that found in the developed world. Our policies mandate compliance with these anti-bribery laws, and we have established policies and procedures designed to monitor compliance with these anti-bribery law requirements; however, we cannot ensure that our policies and procedures will protect us from potential reckless or criminal acts committed by individual employees or agents. If we are found to be liable for anti-bribery law violations, we could suffer from criminal or civil penalties or other sanctions that could have a material adverse effect on our business.
We could be adversely impacted if we fail to comply with domestic and international export laws.
To the extent we export technical services, data and products outside of the United States, we are subject to U.S. and international laws and regulations governing international trade and exports, including but not limited to the International Traffic in Arms Regulations, the Export Administration Regulations, and trade sanctions against embargoed countries. A failure to comply with these laws and regulations could result in civil or criminal sanctions, including the imposition of fines, the denial of export privileges, and suspension or debarment from participation in U.S. government contracts, which could have a material adverse effect on our business.
If we fail to complete a project in a timely manner, miss a required performance standard, or otherwise fail to adequately perform on a project, then we may incur a loss on that project, which may reduce or eliminate our overall profitability.
23
Our engagements often involve large-scale, complex projects. The quality of our performance on such projects depends in large part upon our ability to manage the relationship with our clients and our ability to effectively manage the project and deploy appropriate resources, including third-party contractors and our own personnel, in a timely manner. We may commit to a client that we will complete a project by a scheduled date. We may also commit that a project, when completed, will achieve specified performance standards. If the project is not completed by the scheduled date or fails to meet required performance standards, we may either incur significant additional costs or be held responsible for the costs incurred by the client to rectify damages due to late completion or failure to achieve the required performance standards. The uncertainty of the timing of a project can present difficulties in planning the amount of personnel needed for the project. If the project is delayed or canceled, we may bear the cost of an underutilized workforce that was dedicated to fulfilling the project. In addition, performance of projects can be affected by a number of factors beyond our control, including unavoidable delays from government inaction, public opposition, inability to obtain financing, weather conditions, unavailability of vendor materials, changes in the project scope of services requested by our clients, industrial accidents, environmental hazards, and labor disruptions. To the extent these events occur, the total costs of the project could exceed our estimates, and we could experience reduced profits or, in some cases, incur a loss on a project, which may reduce or eliminate our overall profitability. Further, any defects or errors, or failures to meet our clients’ expectations, could result in claims for damages against us. Failure to meet performance standards or complete performance on a timely basis could also adversely affect our reputation.
The loss of key personnel or our inability to attract and retain qualified personnel could impair our ability to provide services to our clients and otherwise conduct our business effectively.
As primarily a professional and technical services company, we are labor-intensive and, therefore, our ability to attract, retain, and expand our senior management and our professional and technical staff is an important factor in determining our future success. The market for qualified scientists and engineers is competitive and, from time to time, it may be difficult to attract and retain qualified individuals with the required expertise within the timeframe demanded by our clients. For example, some of our U.S. government contracts may require us to employ only individuals who have particular government security clearance levels. In addition, we rely heavily upon the expertise and leadership of our senior management. If we are unable to retain executives and other key personnel, the roles and responsibilities of those employees will need to be filled, which may require that we devote time and resources to identify, hire, and integrate new employees. With limited exceptions, we do not have employment agreements with any of our key personnel. The loss of the services of any of these key personnel could adversely affect our business. Although we have obtained non-compete agreements from certain principals and stockholders of companies we have acquired, we generally do not have non-compete or employment agreements with key employees who were once equity holders of these companies. Further, many of our non-compete agreements have expired. We do not maintain key-man life insurance policies on any of our executive officers or senior managers. Our failure to attract and retain key individuals could impair our ability to provide services to our clients and conduct our business effectively.
Our revenue and growth prospects may be harmed if we or our employees are unable to obtain government granted eligibility or other qualifications we and they need to perform services for our customers.
A number of government programs require contractors to have certain kinds of government granted eligibility, such as security clearance credentials. Depending on the project, eligibility can be difficult and time-consuming to obtain. If we or our employees are unable to obtain or retain the necessary eligibility, we may not be able to win new business, and our existing customers could terminate their contracts with us or decide not to renew them. To the extent we cannot obtain or maintain the required security clearances for our employees working on a particular contract, we may not derive the revenue or profit anticipated from such contract.
Our actual business and financial results could differ from the estimates and assumptions that we use to prepare our financial statements, which may significantly reduce or eliminate our profits.
To prepare financial statements in conformity with generally accepted accounting principles in the United States of America ("GAAP"), management is required to make estimates and assumptions as of the date of the financial statements. These estimates and assumptions affect the reported values of assets, liabilities, revenue and expenses, as well as disclosures of contingent assets and liabilities. For example, we typically recognize revenue over the life of a contract based on the proportion of costs incurred to date compared to the total costs estimated to be incurred for the entire project. Areas requiring significant estimates by our management include:
|
•
|
the application of the percentage-of-completion method of accounting and revenue recognition on contracts, change orders, and contract claims, including related unbilled accounts receivable;
|
24
|
•
|
unbilled accounts receivable, including amounts related to requests for equitable adjustment to contracts that provide for price redetermination, primarily with the U.S. federal government. These amounts are recorded only when they can be reliably estimated and realization is probable;
|
|
•
|
provisions for uncollectible receivables, client claims, and recoveries of costs from subcontractors, vendors, and others;
|
|
•
|
provisions for income taxes, research and development tax credits, valuation allowances, and unrecognized tax benefits;
|
|
•
|
value of goodwill and recoverability of other intangible assets;
|
|
•
|
valuations of assets acquired and liabilities assumed in connection with business combinations;
|
|
•
|
valuation of contingent earn-out liabilities recorded in connection with business combinations;
|
|
•
|
valuation of employee benefit plans;
|
|
•
|
valuation of stock-based compensation expense; and
|
|
•
|
accruals for estimated liabilities, including litigation and insurance reserves.
|
Our actual business and financial results could differ from those estimates, which may significantly reduce or eliminate our profits.
Our profitability could suffer if we are not able to maintain adequate utilization of our workforce.
The cost of providing our services, including the extent to which we utilize our workforce, affects our profitability. The rate at which we utilize our workforce is affected by a number of factors, including:
|
•
|
our ability to transition employees from completed projects to new assignments and to hire and assimilate new employees;
|
|
•
|
our ability to forecast demand for our services and thereby maintain an appropriate headcount in each of our geographies and workforces;
|
|
•
|
our ability to manage attrition;
|
|
•
|
our need to devote time and resources to training, business development, professional development, and other non-chargeable activities; and
|
|
•
|
our ability to match the skill sets of our employees to the needs of the marketplace.
|
If we over-utilize our workforce, our employees may become disengaged, which could impact employee attrition. If we under-utilize our workforce, our profit margin and profitability could suffer.
Our use of the percentage-of-completion method of revenue recognition could result in a reduction or reversal of previously recorded revenue and profits.
We account for most of our contracts on the percentage-of-completion method of revenue recognition. Generally, our use of this method results in recognition of revenue and profit ratably over the life of the contract, based on the proportion of costs incurred to date to total costs expected to be incurred for the entire project. The effects of revisions to estimated revenue and costs, including the achievement of award fees and the impact of change orders and claims, are recorded when the amounts are known and can be reasonably estimated. Such revisions could occur in any period and their effects could be material. Although we have historically made reasonably reliable estimates of the progress towards completion of long-term contracts, the uncertainties inherent in the estimating process make it possible for actual costs to vary materially from estimates, including reductions or reversals of previously recorded revenue and profit.
If we are unable to accurately estimate and control our contract costs, then we may incur losses on our contracts, which could decrease our operating margins and reduce our profits. In particular, our fixed-price contracts could increase the unpredictability of our earnings.
It is important for us to accurately estimate and control our contract costs so that we can maintain positive operating margins and profitability. We generally enter into three principal types of contracts with our clients: fixed-price, time-and-materials and cost-plus.
The U.S. federal government and certain other clients have increased the use of fixed-priced contracts. Under fixed-price contracts, we receive a fixed price irrespective of the actual costs we incur and, consequently, we are exposed to a number of risks. We realize a profit on fixed-price contracts only if we can control our costs and prevent cost over-runs on our contracts. Fixed-price contracts require cost and scheduling estimates that are based on a number of assumptions, including those about future economic conditions, costs, and availability of labor, equipment and materials, and other exigencies. We could experience cost
25
over-runs if these estimates are originally inaccurate as a result of errors or ambiguities in the contract specifications, or become inaccurate as a result of a change in circumstances following the submission of the estimate due to, among other things, unanticipated technical problems, difficulties in obtaining permits or approvals, changes in local laws or labor conditions, weather delays, changes in the costs of raw materials, or the inability of our vendors or subcontractors to perform. If cost overruns occur, we could experience reduced profits or, in some cases, a loss for that project. If a project is significant, or if there are one or more common issues that impact multiple projects, costs overruns could increase the unpredictability of our earnings, as well as have a material adverse impact on our business and earnings.
Under our time-and-materials contracts, we are paid for labor at negotiated hourly billing rates and also paid for other expenses. Profitability on these contracts is driven by billable headcount and cost control. Many of our time-and-materials contracts are subject to maximum contract values and, accordingly, revenue relating to these contracts is recognized as if these contracts were fixed-price contracts. Under our cost-plus contracts, some of which are subject to contract ceiling amounts, we are reimbursed for allowable costs and fees, which may be fixed or performance-based. If our costs exceed the contract ceiling or are not allowable under the provisions of the contract or any applicable regulations, we may not be able to obtain reimbursement for all of the costs we incur.
Profitability on our contracts is driven by billable headcount and our ability to manage our subcontractors, vendors, and material suppliers. If we are unable to accurately estimate and manage our costs, we may incur losses on our contracts, which could decrease our operating margins and significantly reduce or eliminate our profits. Certain of our contracts require us to satisfy specific design, engineering, procurement, or construction milestones in order to receive payment for the work completed or equipment or supplies procured prior to achievement of the applicable milestone. As a result, under these types of arrangements, we may incur significant costs or perform significant amounts of services prior to receipt of payment. If a client determines not to proceed with the completion of the project or if the client defaults on its payment obligations, we may face difficulties in collecting payment of amounts due to us for the costs previously incurred or for the amounts previously expended to purchase equipment or supplies.
Accounting for a contract requires judgments relative to assessing the contract’s estimated risks, revenue, costs, and other technical issues. Due to the size and nature of many of our contracts, the estimation of overall risk, revenue, and cost at completion is complicated and subject to many variables. Changes in underlying assumptions, circumstances, or estimates may also adversely affect future period financial performance. If we are unable to accurately estimate the overall revenue or costs on a contract, then we may experience a lower profit or incur a loss on the contract.
Our failure to adequately recover on claims brought by us against clients for additional contract costs could have a negative impact on our liquidity and profitability.
We have brought claims against clients for additional costs exceeding the contract price or for amounts not included in the original contract price. These types of claims occur due to matters such as client-caused delays or changes from the initial project scope, both of which may result in additional cost. Often, these claims can be the subject of lengthy arbitration or litigation proceedings, and it is difficult to accurately predict when these claims will be fully resolved. When these types of events occur and unresolved claims are pending, we have used working capital in projects to cover cost overruns pending the resolution of the relevant claims. A failure to promptly recover on these types of claims could have a negative impact on our liquidity and profitability. Total accounts receivable at October 1, 2017 included approximately
$59 million
related to such claims.
Our failure to win new contracts and renew existing contracts with private and public sector clients could adversely affect our profitability.
Our business depends on our ability to win new contracts and renew existing contracts with private and public sector clients. Contract proposals and negotiations are complex and frequently involve a lengthy bidding and selection process, which is affected by a number of factors. These factors include market conditions, financing arrangements, and required governmental approvals. For example, a client may require us to provide a bond or letter of credit to protect the client should we fail to perform under the terms of the contract. If negative market conditions arise, or if we fail to secure adequate financial arrangements or the required government approval, we may not be able to pursue particular projects, which could adversely affect our profitability.
If we are not able to successfully manage our growth strategy, our business and results of operations may be adversely affected.
Our expected future growth presents numerous managerial, administrative, operational, and other challenges. Our ability to manage the growth of our operations will require us to continue to improve our management information systems and our other internal systems and controls. In addition, our growth will increase our need to attract, develop, motivate, and retain both our
26
management and professional employees. The inability to effectively manage our growth or the inability of our employees to achieve anticipated performance could have a material adverse effect on our business.
Our backlog is subject to cancellation, unexpected adjustments and changing economic conditions, and is an uncertain indicator of future operating results.
Our backlog at October 1, 2017 was $
2.5 billion
, an increase of $
162.2 million
, or
6.8%
, compared to the end of fiscal 2016. We include in backlog only those contracts for which funding has been provided and work authorizations have been received. We cannot guarantee that the revenue projected in our backlog will be realized or, if realized, will result in profits. In addition, project cancellations or scope adjustments may occur, from time to time, with respect to contracts reflected in our backlog. For example, certain of our contracts with the U.S. federal government and other clients are terminable at the discretion of the client, with or without cause. These types of backlog reductions could adversely affect our revenue and margins. As a result of these factors, our backlog as of any particular date is an uncertain indicator of our future earnings.
Cyber security breaches of our systems and information technology could adversely impact our ability to operate.
We develop, install and maintain information technology systems for ourselves, as well as for customers. Client contracts for the performance of information technology services, as well as various privacy and securities laws, require us to manage and protect sensitive and confidential information, including federal and other government information, from disclosure. We also need to protect our own internal trade secrets and other business confidential information from disclosure. We face the threat to our computer systems of unauthorized access, computer hackers, computer viruses, malicious code, organized cyber-attacks and other security problems and system disruptions, including possible unauthorized access to our and our clients' proprietary or classified information. We rely on industry-accepted security measures and technology to securely maintain all confidential and proprietary information on our information systems. We have devoted and will continue to devote significant resources to the security of our computer systems, but they may still be vulnerable to these threats. A user who circumvents security measures could misappropriate confidential or proprietary information, including information regarding us, our personnel and/or our clients, or cause interruptions or malfunctions in operations. As a result, we may be required to expend significant resources to protect against the threat of these system disruptions and security breaches or to alleviate problems caused by these disruptions and breaches. Any of these events could damage our reputation and have a material adverse effect on our business, financial condition, results of operations and cash flows.
If our business partners fail to perform their contractual obligations on a project, we could be exposed to legal liability, loss of reputation and profit reduction or loss on the project.
We routinely enter into subcontracts and, occasionally, joint ventures, teaming arrangements, and other contractual arrangements so that we can jointly bid and perform on a particular project. Success under these arrangements depends in large part on whether our business partners fulfill their contractual obligations satisfactorily. In addition, when we operate through a joint venture in which we are a minority holder, we have limited control over many project decisions, including decisions related to the joint venture’s internal controls, which may not be subject to the same internal control procedures that we employ. If these unaffiliated third parties do not fulfill their contract obligations, the partnerships or joint ventures may be unable to adequately perform and deliver their contracted services. Under these circumstances, we may be obligated to pay financial penalties, provide additional services to ensure the adequate performance and delivery of the contracted services, and may be jointly and severally liable for the other’s actions or contract performance. These additional obligations could result in reduced profits and revenues or, in some cases, significant losses for us with respect to the joint venture, which could also affect our reputation in the industries we serve.
If our contractors and subcontractors fail to satisfy their obligations to us or other parties, or if we are unable to maintain these relationships, our revenue, profitability, and growth prospects could be adversely affected.
We depend on contractors and subcontractors in conducting our business. There is a risk that we may have disputes with our subcontractors arising from, among other things, the quality and timeliness of work performed by the subcontractor, client concerns about the subcontractor, or our failure to extend existing task orders or issue new task orders under a subcontract. In addition, if a subcontractor fails to deliver on a timely basis the agreed-upon supplies, fails to perform the agreed-upon services, or goes out of business, then we may be required to purchase the services or supplies from another source at a higher price, and our ability to fulfill our obligations as a prime contractor may be jeopardized. This may reduce the profit to be realized or result in a loss on a project for which the services or supplies are needed.
We also rely on relationships with other contractors when we act as their subcontractor or joint venture partner. The absence of qualified subcontractors with which we have a satisfactory relationship could adversely affect the quality of our service
27
and our ability to perform under some of our contracts. Our future revenue and growth prospects could be adversely affected if other contractors eliminate or reduce their subcontracts or teaming arrangement relationships with us, or if a government agency terminates or reduces these other contractors’ programs, does not award them new contracts, or refuses to pay under a contract.
Our failure to meet contractual schedule or performance requirements that we have guaranteed could adversely affect our operating results
.
In certain circumstances, we can incur liquidated or other damages if we do not achieve project completion by a scheduled date. If we or an entity for which we have provided a guarantee subsequently fails to complete the project as scheduled and the matter cannot be satisfactorily resolved with the client, we may be responsible for cost impacts to the client resulting from any delay or the cost to complete the project. Our costs generally increase from schedule delays and/or could exceed our projections for a particular project. In addition, project performance can be affected by a number of factors beyond our control, including unavoidable delays from governmental inaction, public opposition, inability to obtain financing, weather conditions, unavailability of vendor materials, changes in the project scope of services requested by our clients, industrial accidents, environmental hazards, labor disruptions and other factors. As a result, material performance problems for existing and future contracts could cause actual results of operations to differ from those anticipated by us and also could cause us to suffer damage to our reputation within our industry and client base.
New legal requirements could adversely affect our operating results
.
Our business and results of operations could be adversely affected by U.S. health care reform, climate change, defense, environmental and infrastructure industry specific and other legislation and regulations. We are continually assessing the impact that health care reform could have on our employer-sponsored medical plans. Growing concerns about climate change may result in the imposition of additional environmental regulations. For example, legislation, international protocols, regulation or other restrictions on emissions could increase the costs of projects for our clients or, in some cases, prevent a project from going forward, thereby potentially reducing the need for our services. In addition, relaxation or repeal of laws and regulations, or changes in governmental policies regarding environmental, defense, infrastructure or other industries we serve could result in a decline in demand for our services, which could in turn negatively impact our revenues. We cannot predict when or whether any of these various proposals may be enacted or what their effect will be on us or on our customers.
Changes in resource management, environmental, or infrastructure industry laws, regulations, and programs could directly or indirectly reduce the demand for our services, which could in turn negatively impact our revenue.
Some of our services are directly or indirectly impacted by changes in U.S. federal, state, local or foreign laws and regulations pertaining to the resource management, environmental, and infrastructure industries. Accordingly, a relaxation or repeal of these laws and regulations, or changes in governmental policies regarding the funding, implementation or enforcement of these programs, could result in a decline in demand for our services, which could in turn negatively impact our revenue.
Changes in capital markets could adversely affect our access to capital and negatively impact our business.
Our results could be adversely affected by an inability to access the revolving credit facility under our credit agreement. Unfavorable financial or economic conditions could impact certain lenders' willingness or ability to fund our revolving credit facility. In addition, increases in interest rates or credit spreads, volatility in financial markets or the interest rate environment, significant political or economic events, defaults of significant issuers, and other market and economic factors, may negatively impact the general level of debt issuance, the debt issuance plans of certain categories of borrowers, the types of credit-sensitive products being offered, and/or a sustained period of market decline or weakness could have a material adverse effect on us.
Restrictive covenants in our credit agreement may restrict our ability to pursue certain business strategies.
Our credit agreement limits or restricts our ability to, among other things:
|
•
|
incur additional indebtedness;
|
|
•
|
create liens securing debt or other encumbrances on our assets;
|
|
•
|
make loans or advances;
|
|
•
|
pay dividends or make distributions to our stockholders;
|
|
•
|
purchase or redeem our stock;
|
|
•
|
repay indebtedness that is junior to indebtedness under our credit agreement;
|
|
•
|
acquire the assets of, or merge or consolidate with, other companies; and
|
|
•
|
sell, lease, or otherwise dispose of assets.
|
28
Our credit agreement also requires that we maintain certain financial ratios, which we may not be able to achieve. The covenants may impair our ability to finance future operations or capital needs or to engage in other favorable business activities.
Our industry is highly competitive and we may be unable to compete effectively, which could result in reduced revenue, profitability and market share.
We are engaged in a highly competitive business. The markets we serve are highly fragmented and we compete with a large number of regional, national and international companies. Certain of these competitors have greater financial and other resources than we do. Others are smaller and more specialized, and concentrate their resources in particular areas of expertise. The extent of our competition varies according to the particular markets and geographic area. In addition, the technical and professional aspects of some of our services generally do not require large upfront capital expenditures and provide limited barriers against new competitors. The degree and type of competition we face is also influenced by the type and scope of a particular project. Our clients make competitive determinations based upon qualifications, experience, performance, reputation, technology, customer relationships and ability to provide the relevant services in a timely, safe and cost-efficient manner. This competitive environment could force us to make price concessions or otherwise reduce prices for our services. If we are unable to maintain our competitiveness and win bids for future projects, our market share, revenue, and profits will decline.
Legal proceedings, investigations, and disputes could result in substantial monetary penalties and damages, especially if such penalties and damages exceed or are excluded from existing insurance coverage.
We engage in consulting, engineering, program management, construction management, construction, and technical services that can result in substantial injury or damages that may expose us to legal proceedings, investigations, and disputes. For example, in the ordinary course of our business, we may be involved in legal disputes regarding personal injury claims, employee or labor disputes, professional liability claims, and general commercial disputes involving project cost overruns and liquidated damages, as well as other claims. In addition, in the ordinary course of our business, we frequently make professional judgments and recommendations about environmental and engineering conditions of project sites for our clients, and we may be deemed to be responsible for these judgments and recommendations if they are later determined to be inaccurate. Any unfavorable legal ruling against us could result in substantial monetary damages or even criminal violations. We maintain insurance coverage as part of our overall legal and risk management strategy to minimize our potential liabilities; however, insurance coverage contains exclusions and other limitations that may not cover our potential liabilities. Generally, our insurance program covers workers’ compensation and employer’s liability, general liability, automobile liability, professional errors and omissions liability, property, and contractor’s pollution liability (in addition to other policies for specific projects). Our insurance program includes deductibles or self-insured retentions for each covered claim that may increase over time. In addition, our insurance policies contain exclusions that insurance providers may use to deny or restrict coverage. Excess liability and professional liability insurance policies provide for coverage on a “claims-made” basis, covering only claims actually made and reported during the policy period currently in effect. If we sustain liabilities that exceed or that are excluded from our insurance coverage, or for which we are not insured, it could have a material adverse impact on our financial condition, results of operations and cash flows.
Unavailability or cancellation of third-party insurance coverage would increase our overall risk exposure as well as disrupt the management of our business operations.
We maintain insurance coverage from third-party insurers as part of our overall risk management strategy and because some of our contracts require us to maintain specific insurance coverage limits. If any of our third-party insurers fail, suddenly cancel our coverage, or otherwise are unable to provide us with adequate insurance coverage, then our overall risk exposure and our operational expenses would increase and the management of our business operations would be disrupted. In addition, there can be no assurance that any of our existing insurance coverage will be renewable upon the expiration of the coverage period or that future coverage will be affordable at the required limits.
Our inability to obtain adequate bonding could have a material adverse effect on our future revenue and business prospects.
Certain clients require bid bonds, and performance and payment bonds. These bonds indemnify the client should we fail to perform our obligations under a contract. If a bond is required for a particular project and we are unable to obtain an appropriate bond, we cannot pursue that project. In some instances, we are required to co-venture with a small or disadvantaged business to pursue certain U.S. federal or state government contracts. In connection with these ventures, we are sometimes required to utilize our bonding capacity to cover all of the payment and performance obligations under the contract with the client. We have a bonding facility but, as is typically the case, the issuance of bonds under that facility is at the surety’s sole discretion. Moreover, due to events that can negatively affect the insurance and bonding markets, bonding may be more difficult to obtain or may only be available at significant additional cost. There can be no assurance that bonds will continue to be available to us on reasonable
29
terms. Our inability to obtain adequate bonding and, as a result, to bid on new work could have a material adverse effect on our future revenue and business prospects.
Employee, agent, or partner misconduct, or our failure to comply with anti-bribery and other laws or regulations, could harm our reputation, reduce our revenue and profits, and subject us to criminal and civil enforcement actions.
Misconduct, fraud, non-compliance with applicable laws and regulations, or other improper activities by one of our employees, agents, or partners could have a significant negative impact on our business and reputation. Such misconduct could include the failure to comply with government procurement regulations, regulations regarding the protection of classified information, regulations prohibiting bribery and other foreign corrupt practices, regulations regarding the pricing of labor and other costs in government contracts, regulations on lobbying or similar activities, regulations pertaining to the internal controls over financial reporting, environmental laws, and any other applicable laws or regulations. For example, as previously noted, the FCPA and similar anti-bribery laws in other jurisdictions generally prohibit companies and their intermediaries from making improper payments to non-U.S. officials for the purpose of obtaining or retaining business. Our policies mandate compliance with these regulations and laws, and we take precautions to prevent and detect misconduct. However, since our internal controls are subject to inherent limitations, including human error, it is possible that these controls could be intentionally circumvented or become inadequate because of changed conditions. As a result, we cannot assure that our controls will protect us from reckless or criminal acts committed by our employees or agents. Our failure to comply with applicable laws or regulations, or acts of misconduct could subject us to fines and penalties, loss of security clearances, and suspension or debarment from contracting, any or all of which could harm our reputation, reduce our revenue and profits, and subject us to criminal and civil enforcement actions.
Our business activities may require our employees to travel to and work in countries where there are high security risks, which may result in employee death or injury, repatriation costs or other unforeseen costs.
Certain of our contracts may require our employees travel to and work in high-risk countries that are undergoing political, social, and economic upheavals resulting from war, civil unrest, criminal activity, acts of terrorism, or public health crises. For example, we currently have employees working in high security risk countries such as Afghanistan and Iraq. As a result, we risk loss of or injury to our employees and may be subject to costs related to employee death or injury, repatriation, or other unforeseen circumstances. We may choose or be forced to leave a country with little or no warning due to physical security risks.
Our failure to implement and comply with our safety program could adversely affect our operating results or financial condition.
Our project sites often put our employees and others in close proximity with mechanized equipment, moving vehicles, chemical and manufacturing processes, and highly regulated materials. On some project sites, we may be responsible for safety, and, accordingly, we have an obligation to implement effective safety procedures. Our safety program is a fundamental element of our overall approach to risk management, and the implementation of the safety program is a significant issue in our dealings with our clients. We maintain an enterprise-wide group of health and safety professionals to help ensure that the services we provide are delivered safely and in accordance with standard work processes. Unsafe job sites and office environments have the potential to increase employee turnover, increase the cost of a project to our clients, expose us to types and levels of risk that are fundamentally unacceptable, and raise our operating costs. The implementation of our safety processes and procedures are monitored by various agencies, including the U.S. Mine Safety and Health Administration (“MSHA”), and rating bureaus, and may be evaluated by certain clients in cases in which safety requirements have been established in our contracts. Our failure to meet these requirements or our failure to properly implement and comply with our safety program could result in reduced profitability, the loss of projects or clients, or potential litigation, and could have a material adverse effect on our business, operating results, or financial condition.
We may be precluded from providing certain services due to conflict of interest issues.
Many of our clients are concerned about potential or actual conflicts of interest in retaining management consultants. U.S. federal government agencies have formal policies against continuing or awarding contracts that would create actual or potential conflicts of interest with other activities of a contractor. These policies, among other things, may prevent us from bidding for or performing government contracts resulting from or relating to certain work we have performed. In addition, services performed for a commercial or government client may create a conflict of interest that precludes or limits our ability to obtain work from other public or private organizations. We have, on occasion, declined to bid on projects due to conflict of interest issues.
If our reports and opinions are not in compliance with professional standards and other regulations, we could be subject to monetary damages and penalties.
30
We issue reports and opinions to clients based on our professional engineering expertise, as well as our other professional credentials. Our reports and opinions may need to comply with professional standards, licensing requirements, securities regulations, and other laws and rules governing the performance of professional services in the jurisdiction in which the services are performed. In addition, we could be liable to third parties who use or rely upon our reports or opinions even if we are not contractually bound to those third parties. For example, if we deliver an inaccurate report or one that is not in compliance with the relevant standards, and that report is made available to a third party, we could be subject to third-party liability, resulting in monetary damages and penalties.
We may be subject to liabilities under environmental laws and regulations.
Our services are subject to numerous U.S. and international environmental protection laws and regulations that are complex and stringent. For example, we must comply with a number of U.S. federal government laws that strictly regulate the handling, removal, treatment, transportation, and disposal of toxic and hazardous substances. Under the Comprehensive Environmental Response Compensation and Liability Act of 1980, as amended (“CERCLA”), and comparable state laws, we may be required to investigate and remediate regulated hazardous materials. CERCLA and comparable state laws typically impose strict, joint and several liabilities without regard to whether a company knew of or caused the release of hazardous substances. The liability for the entire cost of clean-up could be imposed upon any responsible party. Other principal U.S. federal environmental, health, and safety laws affecting us include, but are not limited to, the Resource Conversation and Recovery Act, National Environmental Policy Act, the Clean Air Act, the Occupational Safety and Health Act, the Federal Mine Safety and Health Act of 1977 (the “Mine Act”), the Toxic Substances Control Act, and the Superfund Amendments and Reauthorization Act. Our business operations may also be subject to similar state and international laws relating to environmental protection. Further, past business practices at companies that we have acquired may also expose us to future unknown environmental liabilities. Liabilities related to environmental contamination or human exposure to hazardous substances, or a failure to comply with applicable regulations, could result in substantial costs to us, including clean-up costs, fines, civil or criminal sanctions, and third-party claims for property damage or personal injury or cessation of remediation activities. Our continuing work in the areas governed by these laws and regulations exposes us to the risk of substantial liability.
Force majeure events, including natural disasters and terrorist actions, could negatively impact the economies in which we operate or disrupt our operations, which may affect our financial condition, results of operations, or cash flows.
Force majeure or extraordinary events beyond the control of the contracting parties, such as natural and man-made disasters, as well as terrorist actions, could negatively impact the economies in which we operate by causing the closure of offices, interrupting projects, and forcing the relocation of employees. We typically remain obligated to perform our services after a terrorist action or natural disaster unless the contract contains a force majeure clause that relieves us of our contractual obligations in such an extraordinary event. If we are not able to react quickly to force majeure, our operations may be affected significantly, which would have a negative impact on our financial condition, results of operations, or cash flows.
We have only a limited ability to protect our intellectual property rights, and our failure to protect our intellectual property rights could adversely affect our competitive position.
Our success depends, in part, upon our ability to protect our proprietary information and other intellectual property. We rely principally on trade secrets to protect much of our intellectual property where we do not believe that patent or copyright protection is appropriate or obtainable. However, trade secrets are difficult to protect. Although our employees are subject to confidentiality obligations, this protection may be inadequate to deter or prevent misappropriation of our confidential information. In addition, we may be unable to detect unauthorized use of our intellectual property or otherwise take appropriate steps to enforce our rights. Failure to obtain or maintain trade secret protection could adversely affect our competitive business position. In addition, if we are unable to prevent third parties from infringing or misappropriating our trademarks or other proprietary information, our competitive position could be adversely affected.
Our stock price could become more volatile and stockholders’ investments could lose value.
In addition to the macroeconomic factors that have affected the prices of many securities generally, all of the factors discussed in this section could affect our stock price. Our common stock has previously experienced substantial price volatility. In addition, the stock market has experienced extreme price and volume fluctuations that have affected the market price of many companies, and that have often been unrelated to the operating performance of these companies. The overall market and the price of our common stock may fluctuate greatly. The trading price of our common stock may be significantly affected by various factors, including:
31
|
•
|
quarter-to-quarter variations in our financial results, including revenue, profits, days sales outstanding, backlog, and other measures of financial performance or financial condition, which may be affected by the following:
|
|
•
|
loss of key employees;
|
|
•
|
the number and significance of client contracts commenced and completed during a quarter;
|
|
•
|
creditworthiness and solvency of clients;
|
|
•
|
the ability of our clients to terminate contracts without penalties;
|
|
•
|
general economic or political conditions;
|
|
•
|
unanticipated changes in contract performance that may affect profitability, particularly with contracts that are fixed-price or have funding limits;
|
|
•
|
contract negotiations on change orders, requests for equitable adjustment, and collections of related billed and unbilled accounts receivable;
|
|
•
|
seasonality of the spending cycle of our public sector clients, notably the U.S. federal government, the spending patterns of our commercial sector clients, and weather conditions;
|
|
•
|
budget constraints experienced by our U.S. federal, and state and local government clients;
|
|
•
|
integration of acquired companies;
|
|
•
|
changes in contingent consideration related to acquisition earn-outs;
|
|
•
|
divestiture or discontinuance of operating units;
|
|
•
|
employee hiring, utilization and turnover rates;
|
|
•
|
delays incurred in connection with a contract;
|
|
•
|
the size, scope and payment terms of contracts;
|
|
•
|
the timing of expenses incurred for corporate initiatives;
|
|
•
|
reductions in the prices of services offered by our competitors;
|
|
•
|
threatened or pending litigation;
|
|
•
|
legislative and regulatory enforcement policy changes that may affect demand for our services;
|
|
•
|
the impairment of goodwill or identifiable intangible assets;
|
|
•
|
the fluctuation of a foreign currency exchange rate;
|
|
•
|
stock-based compensation expense;
|
|
•
|
actual events, circumstances, outcomes, and amounts differing from judgments, assumptions, and estimates used in determining the value of certain assets (including the amounts of related valuation allowances), liabilities, and other items reflected in our consolidated financial statements;
|
|
•
|
success in executing our strategy and operating plans;
|
|
•
|
changes in tax laws or regulations or accounting rules;
|
|
•
|
results of income tax examinations;
|
|
•
|
the timing of announcements in the public markets regarding new services or potential problems with the performance of services by us or our competitors, or any other material announcements;
|
|
•
|
speculation in the media and analyst community, changes in recommendations or earnings estimates by financial analysts, changes in investors’ or analysts’ valuation measures for our stock, and market trends unrelated to our stock;
|
|
•
|
our announcements concerning the payment of dividends or the repurchase of our shares;
|
|
•
|
resolution of threatened or pending litigation;
|
|
•
|
changes in investors’ and analysts’ perceptions of our business or any of our competitors’ businesses;
|
|
•
|
changes in environmental legislation;
|
|
•
|
broader market fluctuations; and
|
|
•
|
general economic or political conditions.
|
Volatility in the financial markets could cause a decline in our stock price, which could trigger an impairment of the goodwill of individual reporting units that could be material to our consolidated financial statements. A significant drop in the price of our stock could also expose us to the risk of securities class action lawsuits, which could result in substantial costs and divert management’s attention and resources, which could adversely affect our business. Additionally, volatility or a lack of positive performance in our stock price may adversely affect our ability to retain key employees, many of whom are awarded equity securities, the value of which is dependent on the performance of our stock price.
Delaware law and our charter documents may impede or discourage a merger, takeover, or other business combination even if the business combination would have been in the short-term best interests of our stockholders.
We are a Delaware corporation and the anti-takeover provisions of Delaware law impose various impediments to the ability of a third party to acquire control of us, even if a change in control would be beneficial to our stockholders. In addition, our Board of Directors has the power, without stockholder approval, to designate the terms of one or more series of preferred stock and issue shares of preferred stock, which could be used defensively if a takeover is threatened. Our incorporation under Delaware
32
law, the ability of our Board of Directors to create and issue a new series of preferred stock, and provisions in our certificate of incorporation and bylaws, such as those relating to advance notice of certain stockholder proposals and nominations, could impede a merger, takeover, or other business combination involving us, or discourage a potential acquirer from making a tender offer for our common stock, even if the business combination would have been in the best interests of our current stockholders.
None.
At fiscal
2017
year-end, we owned three facilities located in the United States and leased approximately 350 operating facilities in domestic and foreign locations. Our significant lease agreements expire at various dates through 2025. We believe that our current facilities are adequate for the operation of our business, and that suitable additional space in various local markets is available to accommodate any needs that may arise.
The following table summarizes our ten most significant leased properties by location based on annual rental expenses (listed alphabetically, except for our Corporate headquarters):
|
Location
|
|
Description
|
|
Reportable Segment
|
|
Pasadena, CA
|
|
Corporate Headquarters
|
|
Corporate
|
|
Adelaide, South Australia, Australia
|
|
Office Building
|
|
RME
|
|
Arlington, VA
|
|
Office Building
|
|
WEI / RME
|
|
Calgary, AB, Canada
|
|
Office Building
|
|
WEI / RME
|
|
London, United Kingdom
|
|
Office Building
|
|
RME
|
|
New York, NY
|
|
Office Building
|
|
RME
|
|
Perth, Western Australia, Australia
|
|
Office Building
|
|
RME
|
|
Seattle, WA
|
|
Office Building
|
|
WEI
|
|
Sydney, New South Wales, Australia
|
|
Office Building
|
|
RME
|
|
Vancouver, BC, Canada
|
Office Building
|
WEI
|
||
For a description of our material pending legal and regulatory proceedings and settlements, see Note
17
, "
Commitments and Contingencies
" of the "Notes to Consolidated Financial Statements" included in Item 8.
Section 1503 of the Dodd-Frank Wall Street Reform and Consumer Protection Act (the "Dodd-Frank Act") requires domestic mine operators to disclose violations and orders issued under the Mine Act by MSHA. We do not act as the owner of any mines, but we may act as a mining operator as defined under the Mine Act where we may be an independent contractor performing services or construction at such mine. Information concerning mine safety violations or other regulatory matters required by Section 1503(a) of the Dodd-Frank Act and Item 104 of Regulation S-K is included in Exhibit 95.
33
Market Information
Our common stock is traded on the NASDAQ Global Select Market under the symbol TTEK. There were 1,394 stockholders of record at October 31, 2017. The high and low sales prices per share for the common stock for the last two fiscal years, as reported by the NASDAQ Global Select Market, are set forth in the following tables.
|
|
Prices
|
||||||
|
|
High
|
Low
|
|||||
|
Fiscal 2017
|
|
|
|||||
|
First quarter
|
$
|
44.30
|
|
$
|
34.78
|
|
|
|
Second quarter
|
44.85
|
|
38.85
|
|
|||
|
Third quarter
|
47.75
|
|
39.90
|
|
|||
|
Fourth quarter
|
48.35
|
|
39.95
|
|
|||
|
Fiscal 2016
|
|
|
|||||
|
First quarter
|
$
|
28.20
|
|
$
|
23.80
|
|
|
|
Second quarter
|
29.60
|
|
22.85
|
|
|||
|
Third quarter
|
31.74
|
|
28.01
|
|
|||
|
Fourth quarter
|
36.24
|
|
29.13
|
|
|||
Dividends
During fiscal
2017
, we declared and paid dividends totaling
$0.38
per share (
$0.09
for the first and second quarters and $
0.10
for the third and fourth quarters) of our common stock. In fiscal
2016
, we paid dividends totaling
$0.34
per share (
$0.08
for the first and second quarters, and
$0.09
for the third and fourth quarters) of our common stock. We currently intend to continue paying dividends on a quarterly basis, although the declaration of any future dividends will be determined by our Board of Directors and will depend on available cash, estimated cash needs, earnings, and capital requirements, as well as limitations in our long-term debt agreements.
Subsequent Event.
On November 6, 2017, the Board of Directors declared a quarterly cash dividend of $0.10 per share payable on December 15, 2017 to stockholders of record as of the close of business on November 30, 2017.
Stock-Based Compensation
For information regarding our stock-based compensation, see Note
11
, "
Stockholders' Equity and Stock Compensation Plans
" of the "Notes to Consolidated Financial Statements" included in Item 8.
Performance Graph
The following graph shows a comparison of our cumulative total returns with those of the NASDAQ Market Index and the S&P 1500 Construction and Engineering Index. The graph assumes that the value of an investment in our common stock and in each such index was $100 on September 30, 2012, and that all dividends have been reinvested. During fiscal
2017
, we declared and paid dividends in the first and second quarters totaling
$0.18
per share (
$0.09
each quarter) on our common stock and paid dividends in the third and fourth quarters totaling
$0.20
per share ($
0.10
each quarter) on our common stock. We declared and paid dividends totaling
$0.34
,
$0.30
and
$0.14
per share in fiscal
2016
,
2015
and
2014
, respectively. We did not pay any dividends prior to fiscal
2014
. Our self-selected Peer Group Index is the S&P 1500 Construction and Engineering Index. The comparison in the graph below is based on historical data and is not intended to forecast the possible future performance of our common stock.
34
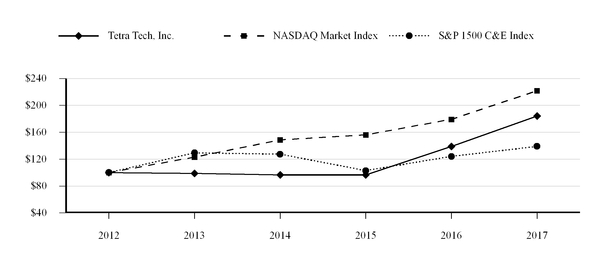
ASSUMES $100 INVESTED ON SEPTEMBER 30, 2012
ASSUMES DIVIDEND REINVESTED
FISCAL YEAR ENDED
OCTOBER 1, 2017
|
2012
|
2013
|
2014
|
2015
|
2016
|
2017
|
||||||||||||||||||
|
Tetra Tech, Inc.
|
$
|
100.00
|
|
$
|
98.93
|
|
$
|
96.49
|
|
$
|
96.51
|
|
$
|
138.98
|
|
$
|
184.02
|
|
|||||
|
NASDAQ Market Index
|
100.00
|
|
123.09
|
|
148.66
|
|
156.18
|
|
179.29
|
|
221.75
|
|
|||||||||||
|
S&P 1500 C&E Index
|
100.00
|
|
129.40
|
|
127.22
|
|
102.79
|
|
123.91
|
|
139.06
|
|
|||||||||||
The performance graph above and related text are being furnished solely to accompany this annual report on Form 10-K pursuant to Item 201(e) of Regulation S-K, and are not being filed for purposes of Section 18 of the Exchange Act, and are not to be incorporated by reference into any of our filings with the SEC, whether made before or after the date hereof, regardless of any general incorporation language in such filing.
Stock Repurchase Program
On November 10, 2014, the Board authorized a stock repurchase program under which we could repurchase up to $200 million of our common stock over the next two years. As of
October 2, 2016
, we repurchased through open market purchases a total of 7.4 million shares at an average price of $26.91, for a total cost of $200 million under this repurchase program. On November 7, 2016, our Board of Directors authorized a new stock repurchase program under which we could repurchase up to $200 million of our common stock. As of
October 1, 2017
, we repurchased through open market purchases a total of
2,266,397
shares at an average price of
$44.12
for a total cost of $
100.0 million
under this repurchase program. These shares were repurchased during the period from October 3, 2016 through
October 1, 2017
.
35
A summary of the repurchase activity for the 12 months ended
October 1, 2017
is as follows:
|
Period
|
Total Number
of Shares
Purchased
|
Average Price
Paid per Share
|
Total Number
of Shares
Purchased as
Part of Publicly
Announced
Plans or
Programs
|
Maximum
Dollar Value
that May Yet
be Purchased
Under the
Plans or
Programs
|
||||||||||
|
October 3, 2016 - October 30, 2016
|
—
|
|
$
|
—
|
|
—
|
|
$
|
200,000,000
|
|
||||
|
October 31, 2016 - November 27, 2016
|
48,697
|
41.26
|
|
48,697
|
|
197,990,958
|
|
|||||||
|
November 28, 2016 - January 1, 2017
|
183,968
|
43.44
|
|
183,968
|
|
190,000,264
|
|
|||||||
|
January 2, 2017 - January 29, 2017
|
60,619
|
42.28
|
|
60,619
|
|
187,437,171
|
|
|||||||
|
January 30, 2017 - February 26, 2017
|
76,712
|
42.25
|
|
76,712
|
|
184,195,798
|
|
|||||||
|
February 27, 2017 - April 2, 2017
|
103,631
|
40.49
|
|
103,631
|
|
180,000,269
|
|
|||||||
|
April 3, 2017 - April 30, 2017
|
64,908
|
41.38
|
|
64,908
|
|
177,314,587
|
|
|||||||
|
May 1, 2017 - May 28, 2017
|
294,925
|
45.25
|
|
294,925
|
|
163,969,280
|
|
|||||||
|
May 29, 2017 - July 2, 2017
|
519,539
|
46.13
|
|
519,539
|
|
140,000,468
|
|
|||||||
|
July 3, 2017 - July 30, 2017
|
231,350
|
46.33
|
|
231,350
|
|
129,281,056
|
|
|||||||
|
July 31, 2017 - August 27, 2017
|
310,826
|
43.09
|
|
310,826
|
|
115,886,290
|
|
|||||||
|
August 28, 2017 - October 1, 2017
|
371,222
|
42.79
|
|
371,222
|
|
100,000,479
|
|
|||||||
The following selected financial data was derived from our audited consolidated financial statements. The selected financial data presented below should be read in conjunction with the information contained in Item 7, "Management's Discussion and Analysis of Financial Condition and Results of Operations," and our consolidated financial statements and the notes thereto contained in Item 8, "Financial Statements and Supplementary Data," of this report.
|
Fiscal Year Ended
|
|||||||||||||||||||
|
October 1,
2017 |
October 2,
2016 |
September 27,
2015 |
September 28,
2014 |
September 29,
2013 |
|||||||||||||||
|
(in thousands, except per share data)
|
|||||||||||||||||||
|
Statements of Operations Data
|
|||||||||||||||||||
|
Revenue
|
$
|
2,753,360
|
|
$
|
2,583,469
|
|
$
|
2,299,321
|
|
$
|
2,483,814
|
|
$
|
2,613,755
|
|
||||
|
Operating income
|
183,342
|
|
135,855
|
87,684
|
|
153,833
|
|
20,218
|
|
||||||||||
|
Net income (loss) attributable to Tetra Tech
|
117,874
|
|
83,783
|
39,074
|
|
108,266
|
|
(2,141
|
)
|
||||||||||
|
Diluted net income (loss) attributable to Tetra Tech per share
|
2.04
|
|
1.42
|
0.64
|
|
1.66
|
|
(0.03
|
)
|
||||||||||
|
Cash dividends paid per share
|
0.38
|
|
0.34
|
0.30
|
|
0.14
|
|
—
|
|
||||||||||
|
Balance Sheet Data
|
|||||||||||||||||||
|
Total assets
|
$
|
1,902,745
|
|
$
|
1,800,779
|
|
$
|
1,559,242
|
|
$
|
1,776,404
|
|
$
|
1,799,092
|
|
||||
|
Long-term debt, net of current portion
|
341,283
|
|
331,501
|
|
180,972
|
|
192,842
|
|
203,438
|
|
|||||||||
|
Tetra Tech stockholders' equity
|
928,453
|
|
869,259
|
|
856,325
|
|
1,012,079
|
|
997,763
|
|
|||||||||
36
The following analysis of our financial condition and results of operations should be read in conjunction with Part I of this report, as well as our consolidated financial statements and accompanying notes in Item 8. The following analysis contains forward-looking statements about our future results of operations and expectations. Our actual results and the timing of events could differ materially from those described herein. See Part 1, Item 1A, "Risk Factors" for a discussion of the risks, assumptions, and uncertainties affecting these statements.
OVERVIEW OF RESULTS AND BUSINESS TRENDS
General.
In fiscal
2017
, our revenue increased
6.6%
compared to the prior-year period. This growth includes year-over-year increases for Coffey International Limited ("Coffey") and INDUS Corporation ("INDUS") for the first half of fiscal 2017 compared to the first half of last year since these acquisitions were completed in the second quarter of fiscal 2016. Coffey and INDUS together contributed revenue of $
213.4
million in the first six months of fiscal 2017 compared to $
94.3
million in the first six months of last year. Excluding these contributions, our revenue increased
2.0
% in fiscal 2017 compared to fiscal 2016. Our revenue also reflects a reduction in construction activities compared to last year. This reduction resulted from our decision to exit from select fixed-price construction markets, which are reported in our RCM segment. Revenue from our ongoing business, excluding RCM, Coffey and INDUS, increased
3.5
% in fiscal 2017 compared to last year. We report results of operations based on 52 or 53-week periods ending on the Sunday nearest September 30. Fiscal years 2017, 2016 and 2015 contained 52, 53 and 52 weeks, respectively. We estimate that our revenue comparisons for fiscal 2017 versus last year were consequently reduced by approximately 2%.
U.S. State and Local Government.
Our U.S. state and local government revenue increased
13.6%
in fiscal
2017
compared to fiscal 2016. We experienced this increase despite the reduction in certain construction activities noted above, especially those related to state transportation projects in the RCM segment. Excluding these activities, our U.S. state and local government revenue increased
19.9
% in fiscal 2017 compared to last year. Many state and local government agencies are experiencing improved financial conditions that enable them to address major long-term infrastructure requirements, including the need for maintenance, repair, and upgrading of existing critical infrastructure and the need to build new facilities. As a result, we experienced broad-based growth in our U.S. state and local government project-related infrastructure revenue. We expect our U.S. state and local government business to continue to grow in fiscal 2018.
U.S. Federal Government.
Our U.S. federal government revenue increased
14.9%
in fiscal
2017
compared to fiscal 2016. Excluding the first half contributions from Coffey and INDUS, our U.S. federal government business increased
9.1
% in fiscal 2017 compared to last year. This growth primarily reflects increased international development and DoD activities. During periods of economic volatility, our U.S. federal government clients have historically been the most stable and predictable. We anticipate growth in U.S. federal government revenue in fiscal 2018.
U.S. Commercial.
Our U.S. commercial revenue was flat in fiscal
2017
compared to fiscal 2016. This result primarily reflects reduced work for oil and gas clients, which was partially offset by increased environmental activities. We expect our U.S. commercial revenue to grow modestly in fiscal 2018.
International.
Our international revenue increased
1.3%
in fiscal
2017
compared to last year. This growth was primarily due to the six month comparisons for Coffey, which contributed international revenue of $
138.6
million in the first six months of fiscal 2017 compared to $68.2 million in the first six months of fiscal 2016. Excluding this contribution, our international business decreased
9.3
% in fiscal 2017 compared to last year. This decrease reflects the commodity-driven slow-down in economic activity in Canada, primarily in the oil and gas market. We anticipate our international revenue to be stable in fiscal 2018. However, if commodity prices remain low or decrease further, our international business could be negatively impacted.
37
RESULTS OF OPERATIONS
Fiscal 2017 Compared to Fiscal 2016
Consolidated Results of Operations
|
Fiscal Year Ended
|
|||||||||||||
|
October 1,
2017 |
October 2,
2016 |
Change
|
|||||||||||
|
$
|
%
|
||||||||||||
|
($ in thousands)
|
|||||||||||||
|
Revenue
|
$
|
2,753,360
|
|
$
|
2,583,469
|
|
$
|
169,891
|
|
6.6%
|
|||
|
Subcontractor costs
|
(719,350
|
)
|
(654,264
|
)
|
(65,086
|
)
|
(9.9)
|
||||||
|
Revenue, net of subcontractor costs
(
1)
|
2,034,010
|
|
1,929,205
|
|
104,805
|
|
5.4
|
||||||
|
Other costs of revenue
|
(1,680,372
|
)
|
(1,598,994
|
)
|
(81,378
|
)
|
(5.1)
|
||||||
|
Gross profit
|
353,638
|
|
330,211
|
|
23,427
|
|
7.1
|
||||||
|
Selling, general and administrative expenses
|
(177,219
|
)
|
(171,985
|
)
|
(5,234
|
)
|
(3.0)
|
||||||
|
Acquisition and integration expenses
|
—
|
|
(19,548
|
)
|
19,548
|
|
NM
|
||||||
|
Contingent consideration – fair value adjustments
|
6,923
|
|
(2,823
|
)
|
9,746
|
|
NM
|
||||||
|
Operating income
|
183,342
|
|
135,855
|
|
47,487
|
|
35.0
|
||||||
|
Interest expense – net
|
(11,581
|
)
|
(11,389
|
)
|
(192
|
)
|
(1.7)
|
||||||
|
Income before income tax expense
|
171,761
|
|
124,466
|
|
47,295
|
|
38.0
|
||||||
|
Income tax expense
|
(53,844
|
)
|
(40,613
|
)
|
(13,231
|
)
|
(32.6)
|
||||||
|
Net income including noncontrolling interests
|
117,917
|
|
83,853
|
|
34,064
|
|
40.6
|
||||||
|
Net income from noncontrolling interests
|
(43
|
)
|
(70
|
)
|
27
|
|
38.6
|
||||||
|
Net income attributable to Tetra Tech
|
$
|
117,874
|
|
$
|
83,783
|
|
$
|
34,091
|
|
40.7
|
|||
|
Diluted earnings per share
|
$
|
2.04
|
|
$
|
1.42
|
|
$
|
0.62
|
|
43.7
|
|||
|
(1)
|
We believe that the presentation of "Revenue, net of subcontractor costs", which is a non-GAAP financial measure, enhances investors' ability to analyze our business trends and performance because it substantially measures the work performed by our employees. In the course of providing services, we routinely subcontract various services and, under certain USAID programs, issue grants. Generally, these subcontractor costs and grants are passed through to our clients and, in accordance with GAAP and industry practice, are included in our revenue when it is our contractual responsibility to procure or manage these activities. Because subcontractor services can vary significantly from project to project and period to period, changes in revenue may not necessarily be indicative of our business trends. Accordingly, we segregate subcontractor costs from revenue to promote a better understanding of our business by evaluating revenue exclusive of costs associated with external service providers.
|
38
The following table reconciles our reported results to non-GAAP ongoing results, which exclude the RCM results and certain purchase accounting-related adjustments. Ongoing results also exclude Coffey-related acquisition and integration expenses, and debt pre-payment fees in fiscal 2016. Additionally, ongoing diluted earnings per share ("EPS") for fiscal 2016 excludes the benefit of the retroactive extension of the research and development ("R&D") credit described below. The effective tax rates applied to the adjustments to EPS to arrive at ongoing EPS averaged
33
% and 25% in fiscal 2017 and 2016, respectively. We apply the relevant marginal statutory tax rate based on the nature of the adjustments and tax jurisdiction in which they occur. In fiscal 2016, this average rate was lower than our overall effective tax rate due to certain acquisition and integration expenses, which had no tax benefit. Both EPS and ongoing EPS were calculated using diluted weighted-average common shares outstanding for the respective years as reflected in our consolidated statements of income.
|
Fiscal Year Ended
|
|||||||||||||
|
October 1,
2017 |
October 2,
2016 |
Change
|
|||||||||||
|
$
|
%
|
||||||||||||
|
Revenue
|
$
|
2,753,360
|
|
$
|
2,583,469
|
|
$
|
169,891
|
|
6.6%
|
|||
|
RCM
|
(18,207
|
)
|
(52,150
|
)
|
33,943
|
|
NM
|
||||||
|
Ongoing revenue
|
$
|
2,735,153
|
|
$
|
2,531,319
|
|
$
|
203,834
|
|
8.1
|
|||
|
Revenue, net of subcontractor costs
|
$
|
2,034,010
|
|
$
|
1,929,205
|
|
$
|
104,805
|
|
5.4
|
|||
|
RCM
|
86
|
|
(17,267
|
)
|
17,353
|
|
NM
|
||||||
|
Ongoing revenue, net of subcontractors costs
|
$
|
2,034,096
|
|
$
|
1,911,938
|
|
$
|
122,158
|
|
6.4
|
|||
|
Operating income
|
$
|
183,342
|
|
$
|
135,855
|
|
$
|
47,487
|
|
35.0
|
|||
|
Acquisition and integration expenses
|
—
|
|
19,548
|
|
(19,548
|
)
|
NM
|
||||||
|
Contingent consideration – fair value adjustments
|
(6,923
|
)
|
2,823
|
|
(9,746
|
)
|
NM
|
||||||
|
Subtotal
|
176,419
|
|
158,226
|
|
18,193
|
|
11.5
|
||||||
|
RCM
|
14,712
|
|
11,834
|
|
2,878
|
|
NM
|
||||||
|
Ongoing operating income
|
$
|
191,131
|
|
$
|
170,060
|
|
$
|
21,071
|
|
12.4
|
|||
|
EPS
|
$
|
2.04
|
|
$
|
1.42
|
|
$
|
0.62
|
|
43.7
|
|||
|
Contingent consideration – fair value adjustments
|
(0.08
|
)
|
0.03
|
|
(0.11
|
)
|
NM
|
||||||
|
RCM
|
0.17
|
|
0.14
|
|
0.03
|
|
NM
|
||||||
|
Acquisition and integration expenses
|
—
|
|
0.29
|
|
(0.29
|
)
|
NM
|
||||||
|
Coffey debt prepayment
|
—
|
|
0.03
|
|
(0.03
|
)
|
NM
|
||||||
|
Retroactive R&D tax
|
—
|
|
(0.03
|
)
|
0.03
|
|
NM
|
||||||
|
Ongoing EPS
|
$
|
2.13
|
|
$
|
1.88
|
|
$
|
0.25
|
|
13.3
|
|||
NM = not meaningful
In fiscal
2017
, revenue and revenue, net of subcontractor costs, increased
$169.9 million
, or
6.6%
, and
$104.8 million
, or
5.4%
, respectively, compared to the same period last year. The year-over-year comparisons include the above-described reduction in certain construction activities. Revenue and revenue, net of subcontractor costs, from these construction activities, which are reported in the RCM segment, declined $
33.9
million and $
17.4
million, respectively, in fiscal 2017 compared to last year. In fiscal
2017
, our ongoing revenue and revenue, net of subcontractor costs, increased
$203.8 million
, or
8.1%
, and
$122.2 million
, or
6.4%
, compared to the same period last year. These increases include first half contributions from acquisitions of Coffey and INDUS that were completed in the second quarter of fiscal 2016. Together, these acquisitions contributed revenue of $213
.4
million and revenue, net of subcontractor costs, of $
154.4
million in the first six months of fiscal 2017 compared to revenue of $
94.3
million and revenue, net of subcontractor costs, of $
71.0
million in the first six months of fiscal 2016. Excluding these first half contributions, our ongoing revenue and revenue, net of subcontractor costs, increased 3.5% and 2.1%, respectively, in fiscal 2017 compared to the same period in fiscal 2016. These results reflect increased U.S. federal and U.S. state and local government activity partially offset by a decline in our oil and gas activities in North America, particularly in Canada.
Our operating income increased
$47.5 million
in fiscal
2017
compared to fiscal
2016
. The loss from exited construction activities in our RCM segment was $14.7 million in fiscal 2017 compared to $
11.8
million last year. Our RCM results are described below under “Remediation and Construction Management.” Additionally, our operating income in fiscal 2016 was reduced by acquisition and integration expenses of $19.5 million related to the acquisition of Coffey. For further detailed information regarding
39
these expenses, see "Fiscal 2016 Acquisition and Integration Expenses" below. Also, our operating income for fiscal 2017 reflects gains of $6.9 million related to changes in the estimated fair value of contingent earn-out liabilities. Conversely, our operating income for fiscal 2016 reflects losses of $
2.8
million related to changes in the estimated fair value of contingent earn-out liabilities. These gains and losses are described below under “Fiscal 2017 and 2016 Earn-Out Adjustments.”
Excluding these items, ongoing operating income increased $
21.0
million, or
12.4
%, in fiscal 2017 compared to fiscal 2016. The increase in our ongoing operating income primarily reflects improved results in our WEI segment. WEI’s operating income increased $21.9 million in fiscal 2017 compared to last year. These results are described below under “Water, Environment and Infrastructure.”
Interest expense, net was $
11.6
million in fiscal
2017
, compared to $
11.4
million last year. Interest expense in the second quarter of fiscal 2016 included debt pre-payment fees of $1.9 million related to the Coffey acquisition. Excluding this item, interest expense, net increased $2.1 million in fiscal 2017 compared to fiscal 2016. This increase reflects higher interest rates (primarily LIBOR), and additional borrowings to fund the Coffey acquisition and other working capital needs.
The effective tax rates for fiscal
2017
and
2016
were
31.3
% and
32.6
%, respectively. During fiscal 2017, we adopted accounting guidance which requires excess tax benefits and deficiencies on share-based payments to be recorded as an income tax benefit or expense, respectively, in the statement of income rather than being recorded in additional paid-in capital on the balance sheet. As a result, we recognized an income tax benefit of $
4.9
million in fiscal 2017. Excluding this item, the effective tax rate for fiscal 2017 was 34.2%. In fiscal 2016, we incurred $13.3 million of acquisition and integration expenses and debt pre-payment fees for which no tax benefit was recognized. Of this amount, $6.4 million resulted from acquisition expenses that were not tax deductible and $6.9 million resulted from integration expenses and debt pre-payment fees incurred in jurisdictions with current and historical net operating losses where the related deferred tax asset was fully reserved. Additionally, during the first quarter of fiscal 2016, the Protecting Americans from Tax Hikes Act of 2015 was signed into law which permanently extended the R&D credit retroactive to January 1, 2015. Our income tax expense for fiscal 2016 included an income tax benefit of $2.0 million attributable to operating income during the last nine months of fiscal 2015, primarily related to the retroactive recognition of the R&D credit. Excluding these items, the effective tax rate for fiscal 2016 was
30.9
%.
EPS was $
2.04
in fiscal 2017, compared to $
1.42
in fiscal 2016. This increase includes the acquisition and integration expenses and debt pre-payment fees of $21.5 million ($19.0 million after tax) in fiscal 2016. These charges reduced EPS by $0.32 per share in fiscal 2016. The other non-operating items described above (RCM segment results and earn-out gains/losses) also affected the year-over-year comparisons. On the same basis as our ongoing operating income, EPS was $
2.13
in fiscal 2017, compared to $
1.88
last year.
Fiscal 2017 and 2016 Earn-Out Adjustments
We review and re-assess the estimated fair value of contingent consideration on a quarterly basis, and the updated fair value could differ materially from the initial estimates. During fiscal 2017, we recorded updated valuations to our contingent earn-out liabilities and reported related net gains in operating income totaling $
6.9
million. The fiscal 2017 gains primarily resulted from updated valuations of the contingent consideration liabilities for INDUS, which is part of our WEI segment, and Cornerstone Environmental Group ("CEG"), which is part of our RME segment.
INDUS’ actual financial performance in the first earn-out period was profitable, but below our original expectations at the acquisition date. As a result, in the second quarter of fiscal 2017, we evaluated our estimate of INDUS’ contingent consideration liability for both earn-out periods. This assessment included a review of INDUS’ financial results in the first earn-out period, the status of ongoing projects in INDUS’ backlog, and the inventory of prospective new contract awards. As a result of this assessment, we concluded that INDUS’ operating income in both the first and second earn-out periods would be lower than the minimum requirements of $3.2 million and $3.6 million, respectively, to earn any contingent consideration. Accordingly, in the second quarter of fiscal 2017, we reduced INDUS’ contingent earn-out liability to $0, which resulted in a gain of $5.0 million.
During fiscal 2017, we also evaluated our estimate of CEG’s contingent consideration liability. This assessment included a review of CEG’s financial results to-date, the status of ongoing projects in CEG’s backlog, and the inventory of prospective new contract awards. As a result of this assessment, we concluded that CEG’s financial results in the remaining earn-out periods would be at a lower level of profitability than our previous estimates. Accordingly, in fiscal 2017, we reduced the CEG contingent earn-out liability, which resulted in a gain of $1.1 million.
In the second quarter of fiscal 2016, we recorded an increase in our contingent earn-out liabilities and related losses in operating income of $1.8 million, which reflected our updated valuation of the contingent consideration liability for CEG. This valuation included our updated projection of CEG’s financial performance during the earn-out period, which exceeded our original
40
estimate at the acquisition date. In the first quarter of fiscal 2016, we recognized a $1.0 million loss, which represented the final cash settlement of an earn-out liability that was valued at $0 at the end of fiscal 2015.
At October 1, 2017, there was a total maximum of $8.9 million of outstanding contingent consideration related to acquisitions. Of this amount, $2.4 million was estimated as the fair value and accrued on our consolidated balance sheet.
Segment Results of Operations
In fiscal
2017
, we managed our operations under three reportable segments. We reported our water resources, water and wastewater treatment, environment, and infrastructure engineering activities in the WEI reportable segment. Our RME reportable segment included our oil and gas, energy, international development, waste management, remediation, and utilities services. In addition, we reported the results of the wind-down of our non-core construction activities in the RCM reportable segment.
Water, Environment and Infrastructure (WEI)
|
Fiscal Year Ended
|
|||||||||||||
|
|
October 1,
2017 |
October 2,
2016 |
Change
|
||||||||||
|
|
$
|
%
|
|||||||||||
|
($ in thousands)
|
|||||||||||||
|
Revenue
|
$
|
1,146,366
|
|
$
|
1,028,281
|
|
$
|
118,085
|
|
11.5%
|
|||
|
Subcontractor costs
|
(299,459
|
)
|
(274,826
|
)
|
(24,633
|
)
|
(9.0)
|
||||||
|
Revenue, net of subcontractor costs
|
$
|
846,907
|
|
$
|
753,455
|
|
$
|
93,452
|
|
12.4
|
|||
|
Operating income
|
$
|
117,894
|
|
$
|
95,996
|
|
$
|
21,898
|
|
22.8
|
|||
Revenue and revenue, net of subcontractor costs, increased
$118.1 million
, or
11.5%
, and
$93.5 million
, or
12.4%
, in fiscal 2017 compared to fiscal 2016. These increases primarily reflect broad-based revenue growth in our U.S. state and local government project-related infrastructure business. Our U.S. state and local government revenue and revenue, net of subcontractor costs, increased $
59.8
million and $
53.2
million, respectively, in fiscal 2017 compared to fiscal 2016. Our U.S. commercial business, primarily related to environmental activities, also grew compared to last year. Our U.S. commercial revenue and revenue, net of subcontractor costs, increased $
38.7
million and $
8.9
million, respectively, in fiscal 2017 compared to the same period last year. Our U.S. federal business also improved compared to last year, primarily due to an increase in work for the DoD. Operating income increased
$21.9 million
in fiscal
2017
compared to last year, reflecting the higher revenue. In addition, our operating margin, based on revenue, net of subcontractor costs, improved to
13.9
% in fiscal 2017 from
12.7
% in fiscal 2016. This increase in profitability primarily reflects improved revenue and better utilization of resources.
Resource Management and Energy (RME)
|
|
Fiscal Year Ended
|
||||||||||||
|
|
October 1,
2017 |
October 2,
2016 |
Change
|
||||||||||
|
|
$
|
%
|
|||||||||||
|
($ in thousands)
|
|||||||||||||
|
Revenue
|
$
|
1,666,364
|
|
$
|
1,569,702
|
|
$
|
96,662
|
|
6.2%
|
|||
|
Subcontractor costs
|
(479,175
|
)
|
(411,219
|
)
|
(67,956
|
)
|
(16.5)
|
||||||
|
Revenue, net of subcontractor costs
|
$
|
1,187,189
|
|
$
|
1,158,483
|
|
$
|
28,706
|
|
2.5
|
|||
|
Operating income
|
$
|
111,122
|
|
$
|
112,202
|
|
$
|
(1,080
|
)
|
(1.0)
|
|||
Revenue and revenue, net of subcontractor costs, increased
$96.7 million
and
$28.7 million
, respectively, compared to fiscal 2016. These increases include Coffey contributions of $201.2 million of revenue and $144.9 million of revenue, net of subcontractor costs, in the first six months of fiscal 2017, compared to $94.3 million and $71.0 million, respectively, in the first half of last year. Coffey’s contributions included the benefit of post-acquisition integration with our existing environmental and international development businesses. Excluding the Coffey contributions, our revenue and revenue, net of subcontractor costs, decreased $
10.2
million and $
45.2
million, respectively, in fiscal 2017 compared to last year. These decreases reflect the reduction in oil and gas activity in North America, particularly in Canada. Operating income decreased $1.1 million in fiscal 2017 compared to last year. This decrease also reflects the reduction in oil and gas activity.
41
Remediation and Construction Management (RCM)
|
Fiscal Year Ended
|
|||||||||||||
|
|
October 1,
2017 |
October 2,
2016 |
Change
|
||||||||||
|
|
$
|
%
|
|||||||||||
|
|
($ in thousands)
|
||||||||||||
|
Revenue
|
$
|
18,207
|
|
$
|
52,150
|
|
$
|
(33,943
|
)
|
(65.1)%
|
|||
|
Subcontractor costs
|
(18,293
|
)
|
(34,883
|
)
|
16,590
|
|
47.6
|
||||||
|
Revenue, net of subcontractor costs
|
$
|
(86
|
)
|
$
|
17,267
|
|
$
|
(17,353
|
)
|
(100.5)
|
|||
|
Operating loss
|
$
|
(14,712
|
)
|
$
|
(11,834
|
)
|
$
|
(2,878
|
)
|
(24.3)
|
|||
Revenue and revenue, net of subcontractor costs, decreased $33.9 million and $17.4 million, respectively, in fiscal
2017
compared to fiscal 2016. These decreases primarily resulted from our decision at the end of fiscal 2014 to wind-down the RCM construction activities. In addition, in fiscal 2017, we updated our evaluation of unsettled claims and recognized a reduction in revenue of $
4.9
million and a related loss in operating income of $
3.6
million. In fiscal 2017, we also recognized unfavorable operating income adjustments of $
5.7
million related to our updated estimate of the costs to complete fixed-price construction projects. The remaining loss in fiscal 2017 primarily reflects legal costs related to outstanding claims. The operating loss in fiscal 2016 resulted from adverse changes in the estimated costs to complete several projects and legal expenses to resolve various outstanding project claims. In addition, the fiscal 2016 operating loss of $11.8 million includes $
7.9
million of losses related to uncollectible accounts receivable, including claims. This loss was partially offset by a gain of $
4.6
million resulting from the settlement of a claim with a U.S. federal government client for work completed in fiscal 2013. The remaining RCM backlog at the end of fiscal 2017 was $
5.0
million, which will be substantially completed in calendar 2017.
42
Fiscal 2016 Compared to Fiscal 2015
Consolidated Results of Operations
|
Fiscal Year Ended
|
|||||||||||||
|
October 2,
2016 |
September 27,
2015 |
Change
|
|||||||||||
|
$
|
%
|
||||||||||||
|
($ in thousands)
|
|||||||||||||
|
Revenue
|
$
|
2,583,469
|
|
$
|
2,299,321
|
|
$
|
284,148
|
|
12.4%
|
|||
|
Subcontractor costs
|
(654,264
|
)
|
(580,606
|
)
|
(73,658
|
)
|
(12.7)
|
||||||
|
Revenue, net of subcontractor costs
(
1)
|
1,929,205
|
|
1,718,715
|
|
210,490
|
|
12.2
|
||||||
|
Other costs of revenue
|
(1,598,994
|
)
|
(1,402,925
|
)
|
(196,069
|
)
|
(14.0)
|
||||||
|
Gross profit
|
330,211
|
|
315,790
|
|
14,421
|
|
4.6
|
||||||
|
Selling, general and administrative expenses
|
(171,985
|
)
|
(170,456
|
)
|
(1,529
|
)
|
(0.9)
|
||||||
|
Acquisition and integration expenses
|
(19,548
|
)
|
—
|
|
(19,548
|
)
|
NM
|
||||||
|
Contingent consideration – fair value adjustments
|
(2,823
|
)
|
3,113
|
|
(5,936
|
)
|
NM
|
||||||
|
Impairment of goodwill and other intangible assets
|
—
|
|
(60,763
|
)
|
60,763
|
|
NM
|
||||||
|
Operating income
|
135,855
|
|
87,684
|
|
48,171
|
|
54.9
|
||||||
|
Interest expense – net
|
(11,389
|
)
|
(7,363
|
)
|
(4,026
|
)
|
(54.7)
|
||||||
|
Income before income tax expense
|
124,466
|
|
80,321
|
|
44,145
|
|
55.0
|
||||||
|
Income tax expense
|
(40,613
|
)
|
(41,093
|
)
|
480
|
|
1.2
|
||||||
|
Net income including noncontrolling interests
|
83,853
|
|
39,228
|
|
44,625
|
|
113.8
|
||||||
|
Net income from noncontrolling interests
|
(70
|
)
|
(154
|
)
|
84
|
|
54.5
|
||||||
|
Net income attributable to Tetra Tech
|
$
|
83,783
|
|
$
|
39,074
|
|
$
|
44,709
|
|
114.4
|
|||
|
Diluted earnings per share
|
$
|
1.42
|
|
$
|
0.64
|
|
$
|
0.78
|
|
121.9
|
|||
|
(1)
|
We believe that the presentation of "Revenue, net of subcontractor costs", which is a non-GAAP financial measure, enhances investors' ability to analyze our business trends and performance because it substantially measures the work performed by our employees. In the course of providing services, we routinely subcontract various services and, under certain USAID programs, issue grants. Generally, these subcontractor costs and grants are passed through to our clients and, in accordance with GAAP and industry practice, are included in our revenue when it is our contractual responsibility to procure or manage these activities. Because subcontractor services can vary significantly from project to project and period to period, changes in revenue may not necessarily be indicative of our business trends. Accordingly, we segregate subcontractor costs from revenue to promote a better understanding of our business by evaluating revenue exclusive of costs associated with external service providers.
|
NM = not meaningful
The following table reconciles our reported results to non-GAAP ongoing results, which exclude the RCM results, certain purchase accounting-related adjustments, and the impact of changes in foreign exchange translation rates in fiscal 2016 compared to fiscal 2015. Ongoing results also exclude Coffey-related acquisition and integration expenses, and debt pre-payment fees in fiscal 2016. Additionally, ongoing EPS for fiscal 2016 excludes the benefit of the retroactive extension of the R&D credit described below. The effective tax rate applied to the adjustments to EPS to arrive at ongoing EPS averaged 25% and 8% in fiscal 2016 and fiscal 2015, respectively. We apply the relevant marginal statutory tax rate based on the nature of the adjustments and the tax jurisdiction in which they occur. These average rates are lower than our overall effective tax rates due to certain acquisition and integration expenses incurred in fiscal 2016 and most of the impairment of goodwill and other intangible assets in fiscal 2015, which had no tax benefit. Both EPS and ongoing EPS were calculated using diluted weighted-average common shares outstanding for the respective periods as reflected in our consolidated statements of income.
43
|
Fiscal Year Ended
|
|||||||||||||
|
October 2,
2016 |
September 27,
2015 |
Change
|
|||||||||||
|
$
|
%
|
||||||||||||
|
Revenue
|
$
|
2,583,469
|
|
$
|
2,299,321
|
|
$
|
284,148
|
|
12.4%
|
|||
|
Foreign exchange
|
40,749
|
|
—
|
|
40,749
|
|
NM
|
||||||
|
RCM
|
(52,150
|
)
|
(86,575
|
)
|
34,425
|
|
NM
|
||||||
|
Ongoing revenue
|
$
|
2,572,068
|
|
$
|
2,212,746
|
|
$
|
359,322
|
|
16.2
|
|||
|
Revenue, net of subcontractor costs
|
$
|
1,929,205
|
|
$
|
1,718,715
|
|
$
|
210,490
|
|
12.2
|
|||
|
Foreign exchange
|
37,684
|
|
—
|
|
37,684
|
|
NM
|
||||||
|
RCM
|
(17,267
|
)
|
(23,275
|
)
|
6,008
|
|
NM
|
||||||
|
Ongoing revenue, net of subcontractors costs
|
$
|
1,949,622
|
|
$
|
1,695,440
|
|
$
|
254,182
|
|
15.0
|
|||
|
Operating income
|
$
|
135,855
|
|
$
|
87,684
|
|
$
|
48,171
|
|
54.9
|
|||
|
Foreign exchange
|
1,944
|
|
—
|
|
1,944
|
|
NM
|
||||||
|
Acquisition and integration expenses
|
19,548
|
|
—
|
|
19,548
|
|
NM
|
||||||
|
Contingent consideration – fair value adjustments
|
2,823
|
|
(3,113
|
)
|
5,936
|
|
NM
|
||||||
|
Impairment of goodwill and other intangible assets
|
—
|
|
60,763
|
|
(60,763
|
)
|
NM
|
||||||
|
Subtotal
|
160,170
|
|
145,334
|
|
14,836
|
|
10.2
|
||||||
|
RCM
|
11,834
|
|
8,614
|
|
3,220
|
|
NM
|
||||||
|
Ongoing operating income
|
$
|
172,004
|
|
$
|
153,948
|
|
$
|
18,056
|
|
11.7%
|
|||
|
EPS
|
$
|
1.42
|
|
$
|
0.64
|
|
$
|
0.78
|
|
121.9
|
|||
|
Contingent consideration – fair value adjustments
|
0.03
|
|
(0.04
|
)
|
0.07
|
|
NM
|
||||||
|
RCM
|
0.14
|
|
0.10
|
|
0.04
|
|
NM
|
||||||
|
Acquisition and integration expenses
|
0.29
|
|
—
|
|
0.29
|
|
NM
|
||||||
|
Coffey debt prepayment
|
0.03
|
|
—
|
|
0.03
|
|
NM
|
||||||
|
Impairment of goodwill and other intangible assets
|
—
|
|
0.93
|
|
(0.93
|
)
|
NM
|
||||||
|
Retroactive R&D tax
|
(0.03
|
)
|
(0.02
|
)
|
(0.01
|
)
|
NM
|
||||||
|
Ongoing EPS
|
$
|
1.88
|
|
$
|
1.61
|
|
$
|
0.27
|
|
16.8
|
|||
|
Foreign exchange
|
0.03
|
|
—
|
|
0.03
|
|
NM
|
||||||
|
Ongoing EPS, net of foreign exchange
|
$
|
1.91
|
|
$
|
1.61
|
|
$
|
0.30
|
|
18.6
|
|||
NM = not meaningful
In fiscal 2016, revenue and revenue, net of subcontractor costs, increased $284.1 million, or 12.4%, and $210.5 million, or 12.2%, respectively, compared to fiscal 2015. These results include the above-described fluctuation in foreign exchange rates and the reduction in certain construction activities compared to last year. Revenue declines caused by foreign exchange rate fluctuations resulted from a stronger U.S. dollar versus most of the foreign currencies in which we conduct our international business, particularly the Canadian dollar. These fluctuations negatively impacted revenue and revenue, net of subcontractor costs, by $40.7 million and $37.7 million, respectively, in fiscal 2016 compared to last year. Revenue and revenue, net of subcontractor costs, from the exited construction activities, which are reported in the RCM segment, declined $34.4 million and $6.0 million, respectively, in fiscal 2016 compared to fiscal 2015.
Our ongoing revenue and revenue, net of subcontractor costs, increased 16.2% and 15.0%, respectively, in fiscal 2016 compared to fiscal 2015. These increases reflect combined revenue and revenue, net of subcontractor costs, of $320.6 million and $233.1 million, respectively, in fiscal 2016 from the fiscal 2016 acquisitions since their respective acquisition dates in the second quarter of fiscal 2016. Excluding these contributions, our ongoing revenue and revenue, net of subcontractor costs, increased 1.8% and 1.2%, respectively, in fiscal 2016 compared to last year. These results reflect increased commercial and state and local government activity in our ongoing U.S. operations. On a combined basis, commercial and state and local government revenue and revenue, net of subcontractor costs in our ongoing U.S. operations increased $52.5 million and $34.1 million, respectively, in fiscal 2016 compared to fiscal 2015, primarily due to increased waste management, environmental remediation, and infrastructure
44
activities. However, these increases were offset by a decline in our international activities that was caused primarily by the commodity-driven slowdown in economic activity in Canada.
Our operating income increased $48.2 million in fiscal 2016 compared to fiscal 2015. Our operating income in 2016 was reduced by Coffey-related acquisition and integration expenses of $19.5 million. For further detailed information regarding these expenses, see "Fiscal 2016 Acquisition and Integration Expenses" below. In addition, losses of $2.8 million resulting from changes in the estimated fair value of contingent earn-out liabilities reduced our operating income in fiscal 2016. These earn-out losses compare to a gain of $3.1 million in fiscal 2015 and are described below under "Fiscal 2016 and 2015 Earn-Out Adjustments." Further, we recognized a non-cash goodwill and other intangible asset impairment charge of $60.8 million in fiscal 2015 related to our GMP reporting unit, which is described below under "Fiscal 2015 Impairment of Goodwill and Other Intangible Assets." The aforementioned year-over-year foreign exchange rate fluctuations reduced operating income by $1.9 million in fiscal 2016 compared to fiscal 2015. The loss from exited construction activities in our RCM segment was $11.8 million in fiscal 2016 compared to $8.6 million last year. Our RCM results are described below under "Remediation and Construction Management." Excluding these non-operating items, ongoing operating income increased $18.1 million, or 11.7%, in fiscal 2016 compared to fiscal 2015.
The increase in our ongoing operating income in fiscal 2016 primarily reflects improved results in our RME segment compared to last year. On a constant currency basis, RME's ongoing operating income increased $21.1 million in fiscal 2016 compared to last year. This increase includes operating income of $12.5 million from Coffey since the acquisition date. Our RME results are described below under "Resource Management and Energy." The higher operating income in the RME segment was partially offset by intangible amortization, which increased by $1.9 million in fiscal 2016 compared to last year.
Interest expense, net was $11.4 million in fiscal 2016, compared to $7.4 million in the same period last year. Interest expense in fiscal 2016 includes Coffey-related debt pre-payment fees of $1.9 million that were incurred in the second quarter. The remaining increase in interest expense reflects additional borrowings to fund the Coffey acquisition.
Our effective tax rates for fiscal 2016 and 2015 were 32.6% and 51.2%, respectively. In fiscal 2016, we incurred $13.3 million of acquisition and integration expenses and debt pre-payment fees for which no tax benefit was recognized. Of this amount, $6.4 million resulted from acquisition expenses that were not tax deductible, and $6.9 million resulted from integration expenses and debt pre-payment fees incurred in jurisdictions with current and historical net operating losses where the related deferred tax asset was fully reserved. Additionally, during the first quarter of fiscal 2016, the Protecting Americans from Tax Hikes Act of 2015 was signed into law which permanently extended the federal R&D credit retroactive to January 1, 2015. Our income tax expense for fiscal 2016 included a tax benefit of $2.0 million attributable to operating income during the last nine months of fiscal 2015, primarily related to the retroactive recognition of the R&D credit. Our income tax expense for fiscal 2015 included a similar retroactive tax benefit of $1.2 million attributable to operating income during the last nine months of fiscal 2014. Our effective tax rate in fiscal 2015 also reflected the impact of the $60.8 million goodwill and intangible asset impairment charge, of which most was not tax deductible. Excluding these items, our effective tax rates for fiscal 2016 and 2015 were 30.9% and 32.5%, respectively. The lower tax rate this year primarily reflects a measurement change in tax positions taken in prior years relating in large part to developments in our ongoing IRS examination that reduced our effective tax rate by 2.0% in fiscal 2016.
EPS was $1.42 in fiscal 2016, compared to $0.64 in fiscal 2015. This comparison reflects the acquisition and integration expenses and debt pre-payment fees of $21.5 million ($19.0 million after tax) in fiscal 2016. These charges reduced EPS by $0.32 per share in fiscal 2016. Additionally, EPS in fiscal 2015 was lower due to the $60.8 million ($57.3 million after-tax) non-cash impairment charge for goodwill and other intangible assets, which reduced EPS by $0.93. The other non-operating items described above (foreign exchange, earn-out gains/losses, and RCM segment results) also adversely affected the year-over-year EPS comparisons. On the same basis as our ongoing operating income, EPS was $1.88 in fiscal 2016 compared to $1.61 last year.
Fiscal 2016 Acquisition and Integration Expenses
In fiscal 2016, we incurred Coffey-related acquisition and integration expenses of $19.5 million. The $7.9 million of acquisition expenses were primarily for professional services, such as legal and investment banking, to support the transaction. Throughout the remainder of fiscal 2016 subsequent to the acquisition date, we incurred costs of $11.6 million on integration activities, including the elimination of redundant general and administrative costs, real estate consolidation, and conversion of information technology platforms. As of October 2, 2016, these activities were substantially complete and all of the related costs had been paid.
Fiscal 2016 and 2015 Earn-Out Adjustments
In both fiscal 2016 and 2015, our operating income included significant non-cash adjustments related to our estimated contingent earn-out liabilities. We review and re-assess the estimated fair value of contingent consideration on a quarterly basis, and the updated fair value could differ materially from the initial estimates. During fiscal 2016, we increased our contingent earn-out liabilities and reported related losses in operating income of $2.8 million. These losses include a $1.8 million charge that reflected our updated valuation of the contingent consideration liability for CEG. This valuation included our updated projection
45
of CEG's financial performance during the earn-out period, which exceeded our original estimate at the acquisition date. The remaining $1.0 million loss represented the final cash settlement of an earn-out liability that was valued at $0 at the end of fiscal 2015.
During fiscal 2015, we recorded a decrease in our contingent earn-out liabilities and reported a related gain in operating income of $3.1 million. This gain resulted from an updated valuation of the contingent consideration liability for Caber Engineering Inc. ("Caber"). Our assessment of the Caber liability included a review of the status of on-going projects in Caber's backlog and the inventory of prospective new contract awards. We also considered the status of the upstream oil and gas industry in Western Canada, particularly in light of the recent decline in oil prices. As a result of this assessment, we concluded that Caber's operating income in the second year post-acquisition would be lower than our original estimate at the acquisition date and our subsequent estimates through fiscal 2014. We also concluded that Caber's operating income for the second earn-out period, which ended in the first quarter of fiscal 2015, would be lower than the minimum requirement of C$4.6 million to earn any contingent consideration. Accordingly, in fiscal 2015, we reduced the Caber contingent earn-out liability to $0, which resulted in a gain of $3.1 million. When we determined that Caber's operating income would be lower than our original estimate at the acquisition date, we also evaluated the related goodwill for potential impairment. We determined that the lower income projections were the result of temporary events, and did not negatively impact Caber's longer-term performance or result in a goodwill impairment.
Fiscal 2015 Impairment of Goodwill and Other Intangible Assets
In the fourth quarter of fiscal 2015, the mining sector continued to contract in response to lower global growth expectations driven in large part by China's actual and projected slower economic growth. Consistent with this trend, our mining customers continued their curtailment of capital spending for new mining projects. As a result, our Global Mining Practice ("GMP") reporting unit experienced a 25% decline in revenue in the fourth quarter of fiscal 2015 compared to the same period of fiscal 2014. This negative trend was compared to the expected revenue growth of approximately 3% in the previous goodwill impairment test, performed as of June 30, 2014. Because of these results, we performed a strategic review of GMP in the fourth quarter of fiscal 2015, and determined that our mining activities would likely decline further in fiscal 2016, and that revenue and profits would not return to acceptable levels of performance in the foreseeable future. We also decided to redeploy our mining resources into other operational areas that have better growth and profitability prospects. Consequently, as of the first day of fiscal 2016, GMP was no longer a reporting unit. We considered GMP's financial performance and prospects in our goodwill impairment analysis in the fourth quarter of fiscal 2015 and determined that GMP's fair value had fallen significantly below its carrying value, including goodwill. As required, we performed further analysis to measure the amount of the impairment loss and, as a result, we wrote-off all of GMP's goodwill and identifiable intangible assets and recorded a related impairment charge of $60.8 million ($57.3 million after-tax) in the fourth quarter of fiscal 2015. The related goodwill and identifiable intangible assets that were determined not to be recoverable totaled $58.1 million and $2.7 million, respectively. We had no goodwill impairment in fiscal 2016.
Segment Results of Operations
Water, Environment and Infrastructure (WEI)
|
Fiscal Year Ended
|
|||||||||||||
|
|
October 2,
2016 |
September 27,
2015 |
Change
|
||||||||||
|
|
$
|
%
|
|||||||||||
|
($ in thousands)
|
|||||||||||||
|
Revenue
|
$
|
1,028,281
|
|
$
|
993,631
|
|
$
|
34,650
|
|
3.5%
|
|||
|
Subcontractor costs
|
(274,826
|
)
|
(230,355
|
)
|
(44,471
|
)
|
(19.3)
|
||||||
|
Revenue, net of subcontractor costs
|
$
|
753,455
|
|
$
|
763,276
|
|
$
|
(9,821
|
)
|
(1.3)
|
|||
|
Operating income
|
$
|
95,996
|
|
$
|
93,142
|
|
$
|
2,854
|
|
3.1
|
|||
Revenue increased 3.5% and revenue, net of subcontractor costs, decreased 1.3% in fiscal 2016 compared to fiscal 2015. On a constant currency basis, revenue and revenue, net of subcontractor costs, increased 5.0% and 0.5%, respectively, in fiscal 2016 compared to last year. As described above, foreign exchange rate fluctuations negatively impacted revenue and revenue, net of subcontractor costs, in the amounts of $15.3 million and $14.0 million, respectively, for fiscal 2016 compared to last year. The increases in revenue and revenue, net of subcontractor costs, resulted primarily from increased U.S. federal activity and additional work on infrastructure projects for U.S. state and local government clients.
Operating income increased $2.9 million in fiscal 2016 compared to fiscal 2015. Operating margin, based on revenue, net of subcontractor costs, improved to 12.7% in fiscal 2016 from 12.2% last year. This improved profitability primarily reflects the full-year benefit in fiscal 2016 of measures taken throughout last year to improve operational efficiency, primarily in our Canadian operations. These actions included the right-sizing of general and administrative staff and real estate consolidations.
46
Resource Management and Energy (RME)
|
|
Fiscal Year Ended
|
||||||||||||
|
|
October 2,
2016 |
September 27,
2015 |
Change
|
||||||||||
|
|
$
|
%
|
|||||||||||
|
($ in thousands)
|
|||||||||||||
|
Revenue
|
$
|
1,569,702
|
|
$
|
1,282,046
|
|
$
|
287,656
|
|
22.4%
|
|||
|
Subcontractor costs
|
(411,219
|
)
|
(349,882
|
)
|
(61,337
|
)
|
(17.5)
|
||||||
|
Revenue, net of subcontractor costs
|
$
|
1,158,483
|
|
$
|
932,164
|
|
$
|
226,319
|
|
24.3
|
|||
|
Operating income
|
$
|
112,202
|
|
$
|
93,359
|
|
$
|
18,843
|
|
20.2
|
|||
Revenue and revenue, net of subcontractor costs, increased 22.4% and 24.3%, respectively, in fiscal 2016 compared to fiscal 2015. On a constant currency basis, revenue and revenue, net of subcontractor costs, increased 24.5% and 26.8%, respectively, in fiscal 2016, compared to last year. As in the WEI segment, foreign exchange rate fluctuations negatively impacted revenue and revenue, net of subcontractor costs in the amounts of $26.4 million and $23.7 million, respectively, in fiscal 2016 compared to last year. The increases are primarily due to Coffey contributions of $302.9 million of revenue and $220.6 million of revenue, net of subcontractor costs in fiscal 2016 since the acquisition date. On a constant currency basis, excluding the Coffey contribution, our revenue and revenue, net of subcontractor costs, increased 0.9% and 3.2%, respectively, in fiscal 2016 compared to fiscal 2015. The increases primarily reflect higher waste management and international development revenue.
Operating income increased $18.8 million ($21.1 million on a constant currency basis) in fiscal 2016 compared to fiscal 2015. Coffey contributed operating income of $12.5 million in fiscal 2016 since the acquisition date. The $6.3 million increase in operating income, excluding Coffey, in fiscal 2016 reflects the higher waste management and international development revenue.
Remediation and Construction Management (RCM)
|
Fiscal Year Ended
|
|||||||||||||
|
|
October 2,
2016 |
September 27,
2015 |
Change
|
||||||||||
|
|
$
|
%
|
|||||||||||
|
|
($ in thousands)
|
||||||||||||
|
Revenue
|
$
|
52,150
|
|
$
|
86,575
|
|
$
|
(34,425
|
)
|
(39.8)%
|
|||
|
Subcontractor costs
|
(34,883
|
)
|
(63,300
|
)
|
28,417
|
|
44.9
|
||||||
|
Revenue, net of subcontractor costs
|
$
|
17,267
|
|
$
|
23,275
|
|
$
|
(6,008
|
)
|
(25.8)
|
|||
|
Operating loss
|
$
|
(11,834
|
)
|
$
|
(8,614
|
)
|
$
|
(3,220
|
)
|
(37.4)
|
|||
Revenue and revenue, net of subcontractor costs, decreased $34.4 million and $6.0 million, respectively, in fiscal 2016 compared to fiscal 2015. These decreases resulted from our decision to wind-down the RCM construction activities. The operating loss in fiscal 2016 resulted from adverse changes in the estimated costs to complete several of the remaining projects and legal expenses to resolve various outstanding project claims. In addition, the fiscal 2016 operating loss of $11.8 million includes $7.9 million of losses related to uncollectible accounts receivable, including claims. This loss was partially offset by a gain of $4.6 million from the settlement of a claim with a U.S. federal government client for work completed in fiscal 2013. The remaining RCM backlog at the end of fiscal 2016 was $26 million. The related work to be performed in this segment will be substantially completed in calendar 2017.
47
FINANCIAL CONDITION, LIQUIDITY AND CAPITAL RESOURCES
Capital Requirements.
Our primary sources of liquidity are cash flows from operations and borrowings under our credit facilities. Our primary uses of cash are to fund working capital, capital expenditures, stock repurchases, cash dividends and repayment of debt, as well as to fund acquisitions and earn-out obligations from prior acquisitions. We believe that our existing cash and cash equivalents, operating cash flows and borrowing capacity under our credit agreement, as described below, will be sufficient to meet our capital requirements for at least the next 12 months. On November 7, 2016, the Board of Directors authorized a stock repurchase program under which we could repurchase up to $200 million of our common stock, of which $100 million has been repurchased as of October 1, 2017. During fiscal
2017
, we declared and paid dividends totaling
$0.38
per share (
$0.09
for the first and second quarters and $
0.10
for the third and fourth quarters) of our common stock. In fiscal
2016
, we paid dividends totaling
$0.34
per share (
$0.08
for the first and second quarters, and
$0.09
for the third and fourth quarters) of our common stock.
Subsequent Event.
On November 6, 2017, the Board of Directors declared a quarterly cash dividend of $0.10 per share payable on December 15, 2017 to stockholders of record as of the close of business on November 30, 2017.
We use a variety of tax planning and financing strategies to manage our worldwide cash and deploy funds to locations where they are needed. We also indefinitely reinvest our foreign earnings, and our current plans do not demonstrate a need to repatriate these earnings. If we were to repatriate these foreign funds, we would be required to accrue and pay additional U.S. taxes less applicable foreign tax credits.
As of
October 1, 2017
, cash and cash equivalents were
$190.0 million
, an increase of
$29.5 million
compared to the fiscal
2016
year-end. The
increase was due to cash generated from operating activities and net borrowings, partially offset by cash used for capital expenditures, business acquisitions, share repurchases and dividends.
Operating Activities.
For fiscal
2017
, net cash provided by operating activities was
$138.0 million
compared to $142.0 million in fiscal 2016. The fiscal 2017 amount was lowered by payments to tax authorities related to completed examinations totaling $21.5 million, which was accrued in prior years. Cash provided by operating activities in fiscal 2016 included $30.5 million in acquisition and integration expenses related to Coffey. Excluding these items, net cash provided by operating activities decreased $13.0 million in fiscal 2017 compared to last year primarily due to the timing of collections from projects with milestone payment schedules.
Investing Activities.
Net cash used in investing activities was
$17.0 million
in fiscal 2017, a decrease of
$77.1 million
compared to the prior-year period, primarily due to the acquisitions of Coffey and INDUS in fiscal 2016.
Financing Activities.
For fiscal
2017
, net cash used in financing activities was
$94.8 million
, which primarily reflected stock repurchases of $100.0 million, partially offset by net borrowings of $9.7 million. For fiscal 2016, net cash used in financing activities was $25.4 million, which primarily reflected stock repurchases of $99.5 million, partially offset by net borrowings of $80.5 million.
Debt Financing.
On May 7, 2013, we entered into a credit agreement that provided for a $205 million term loan facility and a $460 million revolving credit facility that was scheduled to mature in May 2018. On May 29, 2015, we entered into a third amendment to our credit agreement (as amended, the “Credit Agreement”) that extended the maturity date for these facilities to May 2020. The Credit Agreement is a $654.8 million senior secured, five-year facility that provides for a $194.8 million term loan facility (the “Term Loan Facility”) and a $460 million revolving credit facility (the “Revolving Credit Facility”). The Credit Agreement allows us to, among other things, finance certain permitted open market repurchases of our common stock, make permitted acquisitions, and pay cash dividends and distributions. The Revolving Credit Facility includes a $150 million sublimit for the issuance of standby letters of credit, a $20 million sublimit for swingline loans, and a $150 million sublimit for multicurrency borrowings. The interest rate provisions of the Term Loan Facility and the Revolving Credit Facility did not materially change.
The Term Loan Facility is subject to quarterly amortization of principal, with $10.3 million payable in year 1, and $15.4 million payable in years 2 through 5. The Term Loan may be prepaid at any time without penalty. We may borrow on the Revolving Credit Facility, at our option, at either (a) a Eurocurrency rate plus a margin that ranges from 1.15% to 2.00% per annum, or (b) a base rate for loans in U.S. dollars (the highest of the U.S. federal funds rate plus 0.50% per annum, the bank’s prime rate or the Eurocurrency rate plus 1.00%) plus a margin that ranges from 0.15% to 1.00% per annum. In each case, the applicable margin is based on our Consolidated Leverage Ratio, calculated quarterly. The Term Loan Facility is subject to the same interest rate provisions. The interest rate of the Term Loan Facility at the date of inception was 1.57%. The Credit Agreement expires on May 29, 2020, or earlier at our discretion, upon payment in full of loans and other obligations.
As of
October 1, 2017
, we had
$356.4 million
in outstanding borrowings under the Credit Agreement, which was comprised of
$161.4 million
under the Term Loan Facility and
$195 million
under the Revolving Credit Facility at a weighted-average interest rate of
2.45%
per annum. In addition, we had
$0.9 million
in standby letters of credit under the Credit Agreement.
48
Our average effective weighted-average interest rate on borrowings outstanding at
October 1, 2017
under the Credit Agreement, including the effects of interest rate swap agreements described in Note
14
, “
Derivative Financial Instruments
” of the “Notes to Consolidated Financial Statements”, was
2.65%
. At
October 1, 2017
, we had
$264 million
of available credit under the Revolving Credit Facility, all of which could be borrowed without a violation of our debt covenants. In addition, we entered into agreements with four banks to issue standby letters of credit. The aggregate amount of standby letters of credit outstanding under these additional agreements and other bank guarantees was
$23.9 million
, of which
$4.9 million
was issued in currencies other than the U.S. dollar.
The Credit Agreement contains certain affirmative and restrictive covenants, and customary events of default. The financial covenants provide for a maximum Consolidated Leverage Ratio of 3.00 to 1.00 (total funded debt/EBITDA, as defined in the Credit Agreement) and a minimum Consolidated Fixed Charge Coverage Ratio of 1.25 to 1.00 (EBITDA, as defined in the Credit Agreement minus capital expenditures/cash interest plus taxes plus principal payments of indebtedness including capital leases, notes and post-acquisition payments).
At
October 1, 2017
, we were in compliance with these covenants with a consolidated leverage ratio of
1.62
x and a consolidated fixed charge coverage ratio of
2.27
x. Our obligations under the Credit Agreement are guaranteed by certain of our subsidiaries and are secured by first priority liens on (i) the equity interests of certain of our subsidiaries, including those subsidiaries that are guarantors or borrowers under the Credit Agreement, and (ii) our accounts receivable, general intangibles and intercompany loans, and those of our subsidiaries that are guarantors or borrowers.
At the time of acquisition, Coffey had an existing secured credit facility with a bank, comprised of an overdraft facility, a term facility and a bank guaranty facility. The facility was amended to provide for a secured AUD$30 million facility, which was used by Coffey for bank overdrafts, short-term cash advances or bank guarantees. This facility expired on April 5, 2017, and prior to its expiration, a new facility was entered into with a new bank to provide for an AUD$30 million facility, which may be used by Coffey for bank overdrafts, short-term cash advances or bank guarantees. This facility expires in March 2019 and is secured by a parent guarantee. At
October 1, 2017
, there were no borrowings outstanding under this facility; there are bank guarantees outstanding of
$5.6 million
, which were issued in currencies other than the U.S. dollar.
Inflation.
We believe our operations have not been, and, in the foreseeable future, are not expected to be, materially adversely affected by inflation or changing prices due to the average duration of our projects and our ability to negotiate prices as contracts end and new contracts begin.
Dividends.
Our Board of Directors has authorized the following dividends:
|
Dividend Per Share
|
Record Date
|
Total Maximum
Payment
|
Payment Date
|
||||||||
|
|
(in thousands, except per share data)
|
||||||||||
|
November 7, 2016
|
$
|
0.09
|
|
December 1, 2016
|
$
|
5,144
|
|
December 14, 2016
|
|||
|
January 30, 2017
|
$
|
0.09
|
|
February 17, 2017
|
$
|
5,157
|
|
March 3, 2017
|
|||
|
May 1, 2017
|
$
|
0.10
|
|
May 18, 2017
|
$
|
5,738
|
|
June 2, 2017
|
|||
|
July 31, 2017
|
$
|
0.10
|
|
August 17, 2017
|
$
|
5,633
|
|
September 1, 2017
|
|||
|
November 6, 2017
|
$
|
0.10
|
|
November 30, 2017
|
N/A
|
|
December 15, 2017
|
||||
49
Contractual Obligations.
The following sets forth our contractual obligations at
October 1, 2017
:
|
|
Total
|
Year 1
|
Years 2 - 3
|
Years 4 - 5
|
Beyond
|
|||||||||||||||
|
(in thousands)
|
||||||||||||||||||||
|
Debt:
|
|
|
|
|
|
|
|
|
|
|
||||||||||
|
Credit facility
|
$
|
356,436
|
|
$
|
15,374
|
|
$
|
341,062
|
|
$
|
—
|
|
$
|
—
|
|
|||||
|
Other debt
|
68
|
|
58
|
|
10
|
|
—
|
|
—
|
|
||||||||||
|
Interest
(1)
|
10,015
|
|
4,151
|
|
5,864
|
|
—
|
|
—
|
|
||||||||||
|
Capital leases
|
369
|
|
158
|
|
211
|
|
—
|
|
—
|
|
||||||||||
|
Operating leases
(2)
|
254,165
|
|
77,854
|
|
108,539
|
|
46,002
|
|
21,770
|
|
||||||||||
|
Contingent earn-outs
(3)
|
2,438
|
|
2,024
|
|
414
|
|
—
|
|
—
|
|
||||||||||
|
Deferred compensation liability
|
25,176
|
|
—
|
|
—
|
|
—
|
|
25,176
|
|
||||||||||
|
Unrecognized tax benefits
(4)
|
9,337
|
|
6,458
|
|
2,879
|
|
—
|
|
—
|
|
||||||||||
|
Total
|
$
|
658,004
|
|
$
|
106,077
|
|
$
|
458,979
|
|
$
|
46,002
|
|
$
|
46,946
|
|
|||||
|
(1)
|
Interest primarily related to the Term Loan Facility is based on a weighted-average interest rate at
October 1, 2017
, on borrowings that are presently outstanding.
|
|
(2)
|
Predominantly represents real estate leases.
|
|
(3)
|
Represents the estimated fair value recorded for contingent earn-out obligations for acquisitions. The remaining maximum contingent earn-out obligations for these acquisitions total $8.9 million.
|
|
(4)
|
Represents liabilities for unrecognized tax benefits related to uncertain tax positions, excluding amounts related primarily to outstanding refund claims. We are unable to reasonably predict the timing of tax settlements, as tax audits can involve complex issues and the resolution of those issues may span multiple years, particularly if subject to negotiation or litigation. For more information, see Note
8
,
"
Income Taxes
" of the "Notes to Consolidated Financial Statements" included in Item 8.
|
Income Taxes
We evaluate the realizability of our deferred tax assets by assessing the valuation allowance and adjust the allowance, if necessary. The factors used to assess the likelihood of realization are our forecast of future taxable income and available tax planning strategies that could be implemented to realize the net deferred tax assets. The ability or failure to achieve the forecasted taxable income in the applicable taxing jurisdictions could affect the ultimate realization of deferred tax assets. Based on future operating results in certain jurisdictions, it is possible that the current valuation allowance positions of those jurisdictions could be adjusted in the next 12 months.
As of
October 1, 2017
and
October 2, 2016
, the liability for income taxes associated with uncertain tax positions was $
6.0
million and $13.3 million, respectively. The net decrease in the liability during fiscal 2017 was primarily attributable to activity related to examinations conducted by various taxing authorities.
It is reasonably possible that the amount of the unrecognized benefit with respect to certain of our unrecognized tax positions may significantly decrease within the next 12 months. These changes would be the result of ongoing examinations.
Off-Balance Sheet Arrangements
In the ordinary course of business, we may use off-balance sheet arrangements if we believe that such arrangements would be an efficient way to lower our cost of capital or help us manage the overall risks of our business operations. We do not believe that such arrangements have had a material adverse effect on our financial position or our results of operations.
The following is a summary of our off-balance sheet arrangements:
|
•
|
Letters of credit and bank guarantees are used primarily to support project performance and insurance programs. We are required to reimburse the issuers of letters of credit and bank guarantees for any payments they make under the outstanding letters of credit or bank guarantees. Our Credit Agreement and additional letter of credit facilities cover the issuance of our standby letters of credit and bank guarantees and are critical for our normal operations. If we default on the Credit Agreement or additional credit facilities, our inability to issue or renew standby letters of credit and bank guarantees would impair our ability to maintain normal operations. At
October 1, 2017
, we had $0.9 million in standby letters of credit outstanding under our Credit Agreement, $23.9 million in standby letters of credit outstanding under our additional letter of credit facilities and $5.6 million of bank guarantees under the existing Coffey facility.
|
50
|
•
|
From time to time, we provide guarantees and indemnifications related to our services. If our services under a guaranteed or indemnified project are later determined to have resulted in a material defect or other material deficiency, then we may be responsible for monetary damages or other legal remedies. When sufficient information about claims on guaranteed or indemnified projects is available and monetary damages or other costs or losses are determined to be probable, we recognize such guaranteed losses.
|
|
•
|
In the ordinary course of business, we enter into various agreements as part of certain unconsolidated subsidiaries, joint ventures, and other jointly executed contracts where we are jointly and severally liable. We enter into these agreements primarily to support the project execution commitments of these entities. The potential payment amount of an outstanding performance guarantee is typically the remaining cost of work to be performed by or on behalf of third parties under engineering and construction contracts. However, we are not able to estimate other amounts that may be required to be paid in excess of estimated costs to complete contracts and, accordingly, the total potential payment amount under our outstanding performance guarantees cannot be estimated. For cost-plus contracts, amounts that may become payable pursuant to guarantee provisions are normally recoverable from the client for work performed under the contract. For lump sum or fixed-price contracts, this amount is the cost to complete the contracted work less amounts remaining to be billed to the client under the contract. Remaining billable amounts could be greater or less than the cost to complete. In those cases where costs exceed the remaining amounts payable under the contract, we may have recourse to third parties, such as owners, co-venturers, subcontractors or vendors, for claims.
|
|
•
|
In the ordinary course of business, our clients may request that we obtain surety bonds in connection with contract performance obligations that are not required to be recorded in our consolidated balance sheets. We are obligated to reimburse the issuer of our surety bonds for any payments made thereunder. Each of our commitments under performance bonds generally ends concurrently with the expiration of our related contractual obligation.
|
CRITICAL ACCOUNTING POLICIES AND ESTIMATES
The preparation of our financial statements in conformity with U.S. GAAP requires us to make estimates and assumptions in the application of certain accounting policies that affect amounts reported in our consolidated financial statements and accompanying footnotes included in Item 8 of this report. In order to understand better the changes that may occur to our financial condition, results of operations and cash flows, readers should be aware of the critical accounting policies we apply and estimates we use in preparing our consolidated financial statements. Although such estimates and assumptions are based on management's best knowledge of current events and actions we may undertake in the future, actual results could differ materially from those estimates.
Our significant accounting policies are described in the "Notes to Consolidated Financial Statements" included in Item 8. Highlighted below are the accounting policies that management considers most critical to investors' understanding of our financial results and condition, and that require complex judgments by management.
Revenue Recognition and Contract Costs
We recognize revenue for most of our contracts using the percentage-of-completion method, primarily based on contract costs incurred to date compared to total estimated contract costs. We generally utilize the cost-to-cost approach to estimate the progress towards completion in order to determine the amount of revenue and profit to recognize. This method of revenue recognition requires us to prepare estimates of costs to complete contracts in progress. In making such estimates, judgments are required to evaluate contingencies such as potential variances in schedule; the cost of materials and labor productivity; and the impact of change orders, liability claims, contract disputes and achievement of contractual performance standards. Changes in total estimated contract cost and losses, if any, could materially impact our financial condition, results of operations or cash flows.
We recognize revenue for work performed under three major types of contracts: fixed-price, time-and-materials and cost-plus.
Fixed-Price.
Under fixed-price contracts, our clients pay us an agreed fixed-amount negotiated in advance for a specified scope of work. We generally recognize revenue on fixed-price contracts using the percentage-of-completion method. If the nature or circumstances of the contract prevent us from preparing a reliable estimate at completion, we will delay profit recognition until adequate information about the contract's progress becomes available.
Time-and-Materials.
Under time-and-materials contracts, we negotiate hourly billing rates and charge our clients based on the actual time that we spend on a project. In addition, clients reimburse us for our actual out-of-pocket costs of materials and other direct incidental expenditures that we incur in connection with our performance under the contract. The majority of our time-and-material contracts are subject to maximum contract values and, accordingly, revenue under these contracts is generally recognized under the percentage-of-completion method. However, time and materials contracts that are service-related contracts
51
are accounted for utilizing the proportional performance method. Revenue on contracts that are not subject to maximum contract values is recognized based on the actual number of hours we spend on the projects plus any actual out-of-pocket costs of materials and other direct incidental expenditures that we incur on the projects. Our time-and-materials contracts also generally include annual billing rate adjustment provisions.
Cost-Plus.
Under cost-plus contracts, we are reimbursed for allowable or otherwise defined costs incurred plus a negotiated fee. The contracts may also include incentives for various performance criteria, including quality, timeliness, ingenuity, safety and cost-effectiveness. In addition, our costs are generally subject to review by our clients and regulatory audit agencies, and such reviews could result in costs being disputed as non-reimbursable under the terms of the contract. Revenue for cost-plus contracts is recognized at the time services are performed. Revenue is not recognized for non-recoverable costs. Performance incentives are included in our estimates of revenue when their realization is reasonably assured.
If estimated total costs on any contract indicate a loss, we recognize the entire estimated loss in the period the loss becomes known. The cumulative effect of revisions to revenue, estimated costs to complete contracts, including penalties, incentive awards, change orders, claims, anticipated losses and others are recorded in the period in which the revisions are identified and the loss can be reasonably estimated. Such revisions could occur in any reporting period and the effects may be material depending on the size of the project or the adjustment.
Once contract performance is underway, we may experience changes in conditions, client requirements, specifications, designs, materials and expectations regarding the period of performance. Such changes are "change orders" and may be initiated by us or by our clients. In many cases, agreement with the client as to the terms of change orders is reached prior to work commencing; however, sometimes circumstances require that work progress without obtaining client agreement. Revenue related to change orders is recognized as costs are incurred. Change orders that are unapproved as to both price and scope are evaluated as claims.
Claims are amounts in excess of agreed contract prices that we seek to collect from our clients or other third parties for delays, errors in specifications and designs, contract terminations, change orders in dispute or unapproved as to both scope and price or other causes of unanticipated additional costs. Revenue on claims is recognized only to the extent that contract costs related to the claims have been incurred and when it is probable that the claim will result in a bona fide addition to contract value that can be reliably estimated. No profit is recognized on a claim until final settlement occurs. This can lead to a situation in which costs are recognized in one period and revenue is recognized in a subsequent period when a client agreement is obtained or a claim resolution occurs.
Insurance Matters, Litigation and Contingencies
In the normal course of business, we are subject to certain contractual guarantees and litigation. Generally, such guarantees relate to project schedules and performance. Most of the litigation involves us as a defendant in contractual disagreements, workers' compensation, personal injury and other similar lawsuits. We maintain insurance coverage for various aspects of our business and operations. However, we have elected to retain a portion of losses that may occur through the use of various deductibles, limits and retentions under our insurance programs. This practice may subject us to some future liability for which we are only partially insured or are completely uninsured.
We record in our consolidated balance sheets amounts representing our estimated liability for self-insurance claims. We utilize actuarial analyses to assist in determining the level of accrued liabilities to establish for our employee medical and workers' compensation self-insurance claims that are known and have been asserted against us, as well as for self-insurance claims that are believed to have been incurred based on actuarial analyses but have not yet been reported to our claims administrators at the balance sheet date. We include any adjustments to such insurance reserves in our consolidated statements of income.
Except as described in Note
17
, "
Commitments and Contingencies
" of the "Notes to Consolidated Financial Statements" included in Item 8, we do not have any litigation or other contingencies that have had, or are currently anticipated to have, a material impact on our results of operations or financial position. As additional information about current or future litigation or other contingencies becomes available, management will assess whether such information warrants the recording of additional expenses relating to those contingencies. Such additional expenses could potentially have a material impact on our results of operations and financial position.
Stock-Based Compensation
Our stock-based compensation plans include stock options, restricted stock, restricted stock units ("RSUs"), performance share units ("PSUs"), and an employee stock purchase plan for our eligible employees and outside directors. Stock-based compensation cost is measured at the grant date based on the fair value of the award and is recognized as expense over the requisite service period. Determining the fair value of stock-based awards at the grant date requires management to make assumptions and apply judgment to determine the fair value of our awards. These assumptions and judgments include future employee turnover rates, along with estimating the future volatility of our stock price, future stock option exercise behaviors and, for performance-
52
based awards, the achievement of company performance goals. Our stock-based compensation expense was
$13.5 million
,
$13.0 million
and
$10.9 million
for fiscal
2017
,
2016
and
2015
, respectively.
Goodwill and Intangibles
The cost of an acquired company is assigned to the tangible and intangible assets purchased and the liabilities assumed on the basis of their fair values at the date of acquisition. The determination of fair values of assets and liabilities acquired requires us to make estimates and use valuation techniques when a market value is not readily available. Any excess of purchase price over the fair value of net tangible and intangible assets acquired is allocated to goodwill. Goodwill typically represents the value paid for the assembled workforce and enhancement of our service offerings.
Identifiable intangible assets include backlog, non-compete agreements, client relations, trade names, patents and other assets. The costs of these intangible assets are amortized over their contractual or economic lives, which range from one to ten years. We assess the recoverability of the unamortized balance of our intangible assets when indicators of impairment are present based on expected future profitability and undiscounted expected cash flows and their contribution to our overall operations. Should the review indicate that the carrying value is not fully recoverable, the excess of the carrying value over the fair value of the intangible assets would be recognized as an impairment loss.
We perform our annual goodwill impairment review at the beginning of our fiscal fourth quarter. In addition, we regularly evaluate whether events and circumstances have occurred that may indicate a potential change in recoverability of goodwill. We perform interim goodwill impairment reviews between our annual reviews if certain events and circumstances have occurred, including a deterioration in general economic conditions, an increased competitive environment, a change in management, key personnel, strategy or customers, negative or declining cash flows, or a decline in actual or planned revenue or earnings compared with actual and projected results of relevant prior periods (see Note
6
, "
Goodwill and Intangible Assets
" of the "Notes to Consolidated Financial Statements" in Item 8 for further discussion).
We believe the methodology that we use to review impairment of goodwill, which includes a significant amount of judgment and estimates, provides us with a reasonable basis to determine whether impairment has occurred. However, many of the factors employed in determining whether our goodwill is impaired are outside of our control and it is reasonably likely that assumptions and estimates will change in future periods. These changes could result in future impairments.
The goodwill impairment review involves the determination of the fair value of our reporting units, which for us are the components one level below our reportable segments. This process requires us to make significant judgments and estimates, including assumptions about our strategic plans with regard to our operations as well as the interpretation of current economic indicators and market valuations. Furthermore, the development of the present value of future cash flow projections includes assumptions and estimates derived from a review of our expected revenue growth rates, profit margins, business plans, cost of capital and tax rates. We also make certain assumptions about future market conditions, market prices, interest rates and changes in business strategies. Changes in assumptions or estimates could materially affect the determination of the fair value of a reporting unit. This could eliminate the excess of fair value over carrying value of a reporting unit entirely and, in some cases, result in impairment. Such changes in assumptions could be caused by a loss of one or more significant contracts, reductions in government or commercial client spending, or a decline in the demand for our services due to changing economic conditions. In the event that we determine that our goodwill is impaired, we would be required to record a non-cash charge that could result in a material adverse effect on our results of operations or financial position.
We use two methods to determine the fair value of our reporting units: (i) the Income Approach and (ii) the Market Approach. While each of these approaches is initially considered in the valuation of the business enterprises, the nature and characteristics of the reporting units indicate which approach is most applicable. The Income Approach utilizes the discounted cash flow method, which focuses on the expected cash flow of the reporting unit. In applying this approach, the cash flow available for distribution is calculated for a finite period of years. Cash flow available for distribution is defined, for purposes of this analysis, as the amount of cash that could be distributed as a dividend without impairing the future profitability or operations of the reporting unit. The cash flow available for distribution and the terminal value (the value of the reporting unit at the end of the estimation period) are then discounted to present value to derive an indication of the value of the business enterprise. The Market Approach is comprised of the guideline company method and the similar transactions method. The guideline company method focuses on comparing the reporting unit to select reasonably similar (or "guideline") publicly traded companies. Under this method, valuation multiples are (i) derived from the operating data of selected guideline companies; (ii) evaluated and adjusted based on the strengths and weaknesses of the reporting units relative to the selected guideline companies; and (iii) applied to the operating data of the reporting unit to arrive at an indication of value. In the similar transactions method, consideration is given to prices paid in recent transactions that have occurred in the reporting unit's industry or in related industries. For our annual impairment analysis, we weighted the Income Approach and the Market Approach at 70% and 30%, respectively. The Income Approach was given a higher weight because it has the most direct correlation to the specific economics of the reporting unit, as compared to the Market Approach, which is based on multiples of broad-based (i.e., less comparable) companies. Our last review at July 3, 2017 (i.e. the first day of our fourth quarter in fiscal
2017
), indicated that we had no impairment of goodwill, and all of our reporting units had
53
estimated fair values that were in excess of their carrying values, including goodwill. We had no reporting units that had estimated fair values that exceeded their carrying values by less than 20%.
Contingent Consideration.
Certain of our acquisition agreements include contingent earn-out arrangements, which are generally based on the achievement of future operating income thresholds. The contingent earn-out arrangements are based upon our valuations of the acquired companies and reduce the risk of overpaying for acquisitions if the projected financial results are not achieved.
The fair values of these earn-out arrangements are included as part of the purchase price of the acquired companies on their respective acquisition dates. For each transaction, we estimate the fair value of contingent earn-out payments as part of the initial purchase price and record the estimated fair value of contingent consideration as a liability in "Estimated contingent earn-out liabilities" and "Long-term estimated contingent earn-out liabilities" on the consolidated balance sheets. We consider several factors when determining that contingent earn-out liabilities are part of the purchase price, including the following: (1) the valuation of our acquisitions is not supported solely by the initial consideration paid, and the contingent earn-out formula is a critical and material component of the valuation approach to determining the purchase price; and (2) the former shareholders of acquired companies that remain as key employees receive compensation other than contingent earn-out payments at a reasonable level compared with the compensation of our other key employees. The contingent earn-out payments are not affected by employment termination.
We measure our contingent earn-out liabilities at fair value on a recurring basis using significant unobservable inputs classified within Level 3 of the fair value hierarchy (See Note
2
, "
Basis of Presentation and Preparation
– Fair Value of Financial Instruments" of the "Notes to Consolidated Financial Statements" included in Item 8). We use a probability weighted discounted income approach as a valuation technique to convert future estimated cash flows to a single present value amount. The significant unobservable inputs used in the fair value measurements are operating income projections over the earn-out period (generally two or three years), and the probability outcome percentages we assign to each scenario. Significant increases or decreases to either of these inputs in isolation would result in a significantly higher or lower liability with a higher liability capped by the contractual maximum of the contingent earn-out obligation. Ultimately, the liability will be equivalent to the amount paid, and the difference between the fair value estimate and amount paid will be recorded in earnings. The amount paid that is less than or equal to the liability on the acquisition date is reflected as cash used in financing activities in our consolidated statements of cash flows. Any amount paid in excess of the liability on the acquisition date is reflected as cash used in operating activities in our consolidated statements of cash flows.
We review and re-assess the estimated fair value of contingent consideration on a quarterly basis, and the updated fair value could differ materially from the initial estimates. Changes in the estimated fair value of our contingent earn-out liabilities related to the time component of the present value calculation are reported in interest expense. Adjustments to the estimated fair value related to changes in all other unobservable inputs are reported in operating income.
Income Taxes
We file a consolidated U.S. federal income tax return and a combined California franchise tax return. In addition, we file other returns that are required in the states, foreign jurisdictions and other jurisdictions in which we do business. We account for certain income and expense items differently for financial reporting and income tax purposes. Deferred tax assets and liabilities are computed for the differences between the financial statement and tax bases of assets and liabilities that will result in taxable or deductible amounts in the future based on enacted tax laws and rates applicable to the periods in which the differences are expected to reverse. In determining the need for a valuation allowance on deferred tax assets, management reviews both positive and negative evidence, including current and historical results of operations, future income projections and potential tax planning strategies. Based on our assessment, we have concluded that a portion of the deferred tax assets at October 1, 2017, primarily net operating losses and certain foreign intangibles, will not be realized, and we have reserved accordingly.
According to the authoritative guidance on accounting for uncertainty in income taxes, we may recognize the tax benefit from an uncertain tax position only if it is more likely than not that the tax position will be sustained on examination by the taxing authorities based on the technical merits of the position. The tax benefits recognized in the financial statements from such a position should be measured based on the largest benefit that has a greater than 50% likelihood of being realized upon ultimate settlement. For more information related to our unrecognized tax benefits, see Note
8
, "
Income Taxes
" of the "Notes to Consolidated Financial Statements" included in Item 8.
RECENT ACCOUNTING PRONOUNCEMENTS
For a discussion of recent accounting standards and the effect they could have on the consolidated financial statements, see Note
2
, "
Basis of Presentation and Preparation
" of the "Notes to Consolidated Financial Statements" included in Item 8.
54
We do not enter into derivative financial instruments for trading or speculation purposes. In the normal course of business, we have exposure to both interest rate risk and foreign currency transaction and translation risk, primarily related to the Canadian and Australian dollar.
We are exposed to interest rate risk under our Credit Agreement. We can borrow, at our option, under both the Term Loan Facility and Revolving Credit Facility. We may borrow on the Revolving Credit Facility, at our option, at either (a) a Eurocurrency rate plus a margin that ranges from 1.15% to 2.00% per annum, or (b) a base rate for loans in U.S. dollars (the highest of the U.S. federal funds rate plus 0.50% per annum, the bank’s prime rate or the Eurocurrency rate plus 1.00%) plus a margin that ranges from 0.15% to 1.00% per annum. Borrowings at the base rate have no designated term and may be repaid without penalty any time prior to the Facility’s maturity date. Borrowings at a Eurodollar rate have a term no less than 30 days and no greater than 90 days. Typically, at the end of such term, such borrowings may be rolled over at our discretion into either a borrowing at the base rate or a borrowing at a Eurodollar rate with similar terms, not to exceed the maturity date of the Facility. The Facility matures on May 29, 2020. At
October 1, 2017
, we had borrowings outstanding under the Credit Agreement of $356.4 million at a weighted-average interest rate of 2.45% per annum.
In fiscal 2013, we entered into three interest rate swap agreements with three banks to fix the variable interest rate on $153.8 million of our Term Loan Facility. In fiscal 2014, we entered into two interest rate swap agreements with two banks to fix the variable interest rate on $51.3 million of our Term Loan Facility. The objective of these interest rate swaps was to eliminate the variability of our cash flows on the amount of interest expense we pay under our Credit Agreement. Our average effective interest rate on borrowings outstanding under the Credit Agreement, including the effects of interest rate swap agreements, at
October 1, 2017
, was 2.65%. For more information, see Note
14
, “
Derivative Financial Instruments
” of the “Notes to Consolidated Financial Statements” in Item 8.
Most of our transactions are in U.S. dollars; however, some of our subsidiaries conduct business in foreign currencies, primarily the Canadian and Australian dollar. Therefore, we are subject to currency exposure and volatility because of currency fluctuations. We attempt to minimize our exposure to these fluctuations by matching revenue and expenses in the same currency for our contracts. Foreign currency gains and losses were immaterial for both fiscal
2017
and fiscal
2016
. Foreign currency gains and losses are reported as part of “Selling, general and administrative expenses” in our consolidated statements of income.
We have foreign currency exchange rate exposure in our results of operations and equity primarily as a result of the currency translation related to our foreign subsidiaries where the local currency is the functional currency. To the extent the U.S. dollar strengthens against foreign currencies, the translation of these foreign currency denominated transactions will result in reduced revenue, operating expenses, assets and liabilities. Similarly, our revenue, operating expenses, assets and liabilities will increase if the U.S. dollar weakens against foreign currencies. For fiscal
2017
and
2016
,
26.7%
and 28.1% of our consolidated revenue, respectively, was generated by our international business. For fiscal
2017
, the effect of foreign exchange rate translation on the consolidated balance sheets was an increase in equity of $29.5 million compared to an increase in equity of $15.2 million in fiscal 2016. These amounts were recognized as an adjustment to equity through other comprehensive income.
55
INDEX TO FINANCIAL STATEMENTS AND FINANCIAL STATEMENT SCHEDULE
|
|
Page
|
56
REPORT OF INDEPENDENT REGISTERED PUBLIC ACCOUNTING FIRM
To the Board of Directors and Stockholders of Tetra Tech, Inc.:
In our opinion, the accompanying consolidated balance sheets and the related consolidated statements of income, comprehensive income (loss), equity and cash flows present fairly, in all material respects, the financial position of Tetra Tech, Inc. and its subsidiaries as of October 1, 2017 and October 2, 2016, and the results of their operations and their cash flows for each of the three years in the period ended October 1, 2017 in conformity with accounting principles generally accepted in the United States of America. In addition, in our opinion, the financial statement schedule listed in the accompanying index presents fairly, in all material respects, the information set forth therein when read in conjunction with the related consolidated financial statements. Also in our opinion, the Company maintained, in all material respects, effective internal control over financial reporting as of October 1, 2017, based on criteria established in
Internal Control - Integrated Framework
(2013) issued by the Committee of Sponsoring Organizations of the Treadway Commission ("COSO"). The Company's management is responsible for these financial statements and financial statement schedule, for maintaining effective internal control over financial reporting and for its assessment of the effectiveness of internal control over financial reporting, included in Management's Report on Internal Control over Financial Reporting, appearing under Item 9A of this Form 10-K. Our responsibility is to express opinions on these financial statements, on the financial statement schedule, and on the Company's internal control over financial reporting based on our integrated audits. We conducted our audits in accordance with the standards of the Public Company Accounting Oversight Board (United States). Those standards require that we plan and perform the audits to obtain reasonable assurance about whether the financial statements are free of material misstatement and whether effective internal control over financial reporting was maintained in all material respects. Our audits of the financial statements included examining, on a test basis, evidence supporting the amounts and disclosures in the financial statements, assessing the accounting principles used and significant estimates made by management, and evaluating the overall financial statement presentation. Our audit of internal control over financial reporting included obtaining an understanding of internal control over financial reporting, assessing the risk that a material weakness exists, and testing and evaluating the design and operating effectiveness of internal control based on the assessed risk. Our audits also included performing such other procedures as we considered necessary in the circumstances. We believe that our audits provide a reasonable basis for our opinions.
A company's internal control over financial reporting is a process designed to provide reasonable assurance regarding the reliability of financial reporting and the preparation of financial statements for external purposes in accordance with generally accepted accounting principles. A company's internal control over financial reporting includes those policies and procedures that (i) pertain to the maintenance of records that, in reasonable detail, accurately and fairly reflect the transactions and dispositions of the assets of the company; (ii) provide reasonable assurance that transactions are recorded as necessary to permit preparation of financial statements in accordance with generally accepted accounting principles, and that receipts and expenditures of the company are being made only in accordance with authorizations of management and directors of the company; and (iii) provide reasonable assurance regarding prevention or timely detection of unauthorized acquisition, use, or disposition of the company's assets that could have a material effect on the financial statements.
Because of its inherent limitations, internal control over financial reporting may not prevent or detect misstatements. Also, projections of any evaluation of effectiveness to future periods are subject to the risk that controls may become inadequate because of changes in conditions, or that the degree of compliance with the policies or procedures may deteriorate.
/s/ PRICEWATERHOUSECOOPERS LLP
PricewaterhouseCoopers LLP
Los Angeles, California
November 20, 2017
57
TETRA TECH, INC.
(in thousands, except par value)
|
ASSETS
|
October 1,
2017 |
October 2,
2016 |
|||||
|
Current assets:
|
|
|
|
|
|||
|
Cash and cash equivalents
|
$
|
189,975
|
|
$
|
160,459
|
|
|
|
Accounts receivable – net
|
788,767
|
|
714,336
|
|
|||
|
Prepaid expenses and other current assets
|
49,969
|
|
46,262
|
|
|||
|
Income taxes receivable
|
13,312
|
|
14,371
|
|
|||
|
Total current assets
|
1,042,023
|
|
935,428
|
|
|||
|
Property and equipment – net
|
56,835
|
|
67,827
|
|
|||
|
Investments in and advances to unconsolidated joint ventures
|
2,700
|
|
2,064
|
|
|||
|
Goodwill
|
740,886
|
|
717,988
|
|
|||
|
Intangible assets – net
|
26,688
|
|
48,962
|
|
|||
|
Deferred income taxes
|
1,763
|
|
630
|
|
|||
|
Other long-term assets
|
31,850
|
|
27,880
|
|
|||
|
Total assets
|
$
|
1,902,745
|
|
$
|
1,800,779
|
|
|
|
LIABILITIES AND EQUITY
|
|
|
|
|
|||
|
Current liabilities:
|
|
|
|
|
|||
|
Accounts payable
|
$
|
177,638
|
|
$
|
158,773
|
|
|
|
Accrued compensation
|
143,408
|
|
129,184
|
|
|||
|
Billings in excess of costs on uncompleted contracts
|
117,499
|
|
88,223
|
|
|||
|
Current portion of long-term debt
|
15,588
|
|
15,510
|
|
|||
|
Current contingent earn-out liabilities
|
2,024
|
|
4,296
|
|
|||
|
Other current liabilities
|
81,511
|
|
85,100
|
|
|||
|
Total current liabilities
|
537,668
|
|
481,086
|
|
|||
|
Deferred income taxes
|
43,781
|
|
60,348
|
|
|||
|
Long-term debt
|
341,283
|
|
331,501
|
|
|||
|
Long-term contingent earn-out liabilities
|
414
|
|
4,461
|
|
|||
|
Other long-term liabilities
|
50,975
|
|
53,980
|
|
|||
|
Commitments and contingencies (Note 17)
|
|
|
|
|
|||
|
Equity:
|
|
|
|
|
|||
|
Preferred stock – Authorized, 2,000 shares of $0.01 par value; no shares issued and outstanding at October 1, 2017 and October 2, 2016
|
—
|
|
—
|
|
|||
|
Common stock – Authorized, 150,000 shares of $0.01 par value; issued and outstanding, 55,873 and 57,042 shares at October 1, 2017 and October 2, 2016, respectively
|
559
|
|
570
|
|
|||
|
Additional paid-in capital
|
193,835
|
|
260,340
|
|
|||
|
Accumulated other comprehensive loss
|
(98,500
|
)
|
(128,008
|
)
|
|||
|
Retained earnings
|
832,559
|
|
736,357
|
|
|||
|
Tetra Tech stockholders' equity
|
928,453
|
|
869,259
|
|
|||
|
Noncontrolling interests
|
171
|
|
144
|
|
|||
|
Total equity
|
928,624
|
|
869,403
|
|
|||
|
Total liabilities and equity
|
$
|
1,902,745
|
|
$
|
1,800,779
|
|
|
See accompanying Notes to Consolidated Financial Statements.
58
TETRA TECH, INC.
(in thousands, except per share data)
|
|
Fiscal Year Ended
|
||||||||||
|
|
October 1,
2017 |
October 2,
2016 |
September 27,
2015 |
||||||||
|
Revenue
|
$
|
2,753,360
|
|
$
|
2,583,469
|
|
$
|
2,299,321
|
|
||
|
Subcontractor costs
|
(719,350
|
)
|
(654,264
|
)
|
(580,606
|
)
|
|||||
|
Other costs of revenue
|
(1,680,372
|
)
|
(1,598,994
|
)
|
(1,402,925
|
)
|
|||||
|
Gross profit
|
353,638
|
|
330,211
|
|
315,790
|
|
|||||
|
Selling, general and administrative expenses
|
(177,219
|
)
|
(171,985
|
)
|
(170,456
|
)
|
|||||
|
Acquisition and integration expenses
|
—
|
|
(19,548
|
)
|
—
|
|
|||||
|
Contingent consideration – fair value adjustments
|
6,923
|
|
(2,823
|
)
|
3,113
|
|
|||||
|
Impairment of goodwill and other intangible assets
|
—
|
|
—
|
|
(60,763
|
)
|
|||||
|
Operating income
|
183,342
|
|
135,855
|
|
87,684
|
|
|||||
|
Interest income
|
729
|
|
996
|
|
680
|
|
|||||
|
Interest expense
|
(12,310
|
)
|
(12,385
|
)
|
(8,043
|
)
|
|||||
|
Income before income tax expense
|
171,761
|
|
124,466
|
|
80,321
|
|
|||||
|
Income tax expense
|
(53,844
|
)
|
(40,613
|
)
|
(41,093
|
)
|
|||||
|
Net income including noncontrolling interests
|
117,917
|
|
83,853
|
|
39,228
|
|
|||||
|
Net income from noncontrolling interests
|
(43
|
)
|
(70
|
)
|
(154
|
)
|
|||||
|
Net income attributable to Tetra Tech
|
$
|
117,874
|
|
$
|
83,783
|
|
$
|
39,074
|
|
||
|
Earnings per share attributable to Tetra Tech:
|
|
|
|
|
|
|
|||||
|
Basic
|
$
|
2.07
|
|
$
|
1.44
|
|
$
|
0.64
|
|
||
|
Diluted
|
$
|
2.04
|
|
$
|
1.42
|
|
$
|
0.64
|
|
||
|
Weighted-average common shares outstanding:
|
|
|
|
|
|
|
|||||
|
Basic
|
56,911
|
|
58,186
|
|
60,913
|
|
|||||
|
Diluted
|
57,913
|
|
58,966
|
|
61,532
|
|
|||||
|
Cash dividends paid per share
|
$
|
0.38
|
|
$
|
0.34
|
|
$
|
0.30
|
|
||
See accompanying Notes to Consolidated Financial Statements.
59
TETRA TECH, INC.
Consolidated Statements of Comprehensive Income (Loss)
(in thousands)
|
|
Fiscal Year Ended
|
||||||||||
|
|
October 1,
2017 |
October 2,
2016 |
September 27,
2015 |
||||||||
|
Net income including noncontrolling interests
|
$
|
117,917
|
|
$
|
83,853
|
|
$
|
39,228
|
|
||
|
Foreign currency translation adjustments
|
27,902
|
|
14,392
|
|
(98,287
|
)
|
|||||
|
Gain (loss) on cash flow hedge valuations
|
1,614
|
|
774
|
|
(2,489
|
)
|
|||||
|
Other comprehensive income (loss), net of tax
|
29,516
|
|
15,166
|
|
(100,776
|
)
|
|||||
|
Comprehensive income (loss) including noncontrolling interests
|
147,433
|
|
99,019
|
|
(61,548
|
)
|
|||||
|
Net income attributable to noncontrolling interests
|
(43
|
)
|
(70
|
)
|
(154
|
)
|
|||||
|
Foreign currency translation adjustments, net of tax
|
(8
|
)
|
(3
|
)
|
143
|
|
|||||
|
Comprehensive income attributable to noncontrolling interests
|
(51
|
)
|
(73
|
)
|
(11
|
)
|
|||||
|
Comprehensive income (loss) attributable to Tetra Tech
|
$
|
147,382
|
|
$
|
98,946
|
|
$
|
(61,559
|
)
|
||
See accompanying Notes to Consolidated Financial Statements.
60
TETRA TECH, INC.
Consolidated Statements of Equity
Fiscal Years Ended
September 27, 2015
,
October 2, 2016
, and
October 1, 2017
(in thousands)
|
|
Common Stock
|
Additional
Paid-in
Capital
|
Accumulated
Other
Comprehensive
Income (Loss)
|
Retained
Earnings
|
Total
Tetra Tech
Equity
|
Non-Controlling
Interests
|
Total
Equity
|
|||||||||||||||||||||||
|
|
Shares
|
Amount
|
||||||||||||||||||||||||||||
|
BALANCE AT SEPTEMBER 28, 2014
|
62,591
|
|
$
|
626
|
|
$
|
402,516
|
|
$
|
(42,538
|
)
|
$
|
651,475
|
|
$
|
1,012,079
|
|
$
|
977
|
|
$
|
1,013,056
|
|
|||||||
|
Comprehensive income, net of tax:
|
|
|
|
|
|
|
|
|
|
|
|
|
|
|
|
|
||||||||||||||
|
Net income
|
|
|
|
|
|
|
|
|
39,074
|
|
39,074
|
|
154
|
|
39,228
|
|
||||||||||||||
|
Foreign currency translation adjustments
|
|
|
|
|
|
|
(98,144
|
)
|
|
|
(98,144
|
)
|
(143
|
)
|
(98,287
|
)
|
||||||||||||||
|
Loss on cash flow hedge valuations
|
|
|
|
|
|
|
(2,489
|
)
|
|
|
(2,489
|
)
|
|
|
(2,489
|
)
|
||||||||||||||
|
Comprehensive income (loss), net of tax
|
|
|
|
|
|
|
|
|
|
|
(61,559
|
)
|
11
|
|
(61,548
|
)
|
||||||||||||||
|
Distributions paid to noncontrolling interests
|
|
|
|
|
|
|
|
|
|
|
|
|
(515
|
)
|
(515
|
)
|
||||||||||||||
|
Cash dividend of $0.30 per common share
|
|
|
|
|
|
|
|
|
(18,240
|
)
|
(18,240
|
)
|
|
|
(18,240
|
)
|
||||||||||||||
|
Stock-based compensation
|
|
|
|
|
10,926
|
|
|
|
|
|
10,926
|
|
|
|
10,926
|
|
||||||||||||||
|
Stock options exercised
|
510
|
|
5
|
|
8,985
|
|
|
|
|
|
8,990
|
|
|
|
8,990
|
|
||||||||||||||
|
Shares issued for Employee Stock Purchase Plan
|
243
|
|
3
|
|
5,200
|
|
|
|
|
|
5,203
|
|
|
|
5,203
|
|
||||||||||||||
|
Stock repurchases
|
(3,963
|
)
|
(40
|
)
|
(100,460
|
)
|
|
|
|
|
(100,500
|
)
|
|
|
(100,500
|
)
|
||||||||||||||
|
Tax benefit for stock options
|
|
|
|
|
(574
|
)
|
|
|
|
|
(574
|
)
|
|
|
(574
|
)
|
||||||||||||||
|
BALANCE AT SEPTEMBER 27, 2015
|
59,381
|
|
594
|
|
326,593
|
|
(143,171
|
)
|
672,309
|
|
856,325
|
|
473
|
|
856,798
|
|
||||||||||||||
|
Comprehensive income, net of tax:
|
|
|
|
|
|
|
|
|
|
|
|
|
|
|
|
|
||||||||||||||
|
Net income
|
|
|
|
|
|
|
|
|
83,783
|
|
83,783
|
|
70
|
|
83,853
|
|
||||||||||||||
|
Foreign currency translation adjustments
|
|
|
|
|
|
|
14,389
|
|
|
|
14,389
|
|
3
|
|
14,392
|
|
||||||||||||||
|
Gain on cash flow hedge valuations
|
|
|
|
|
|
|
774
|
|
|
|
774
|
|
|
|
774
|
|
||||||||||||||
|
Comprehensive income, net of tax
|
|
|
|
|
|
|
|
|
|
|
98,946
|
|
73
|
|
99,019
|
|
||||||||||||||
|
Distributions paid to noncontrolling interests
|
|
|
|
|
|
|
|
|
|
|
|
|
(402
|
)
|
(402
|
)
|
||||||||||||||
|
Cash dividends of $0.34 per common share
|
|
|
|
|
|
|
|
|
(19,735
|
)
|
(19,735
|
)
|
|
|
(19,735
|
)
|
||||||||||||||
|
Stock-based compensation
|
|
|
|
|
12,964
|
|
|
|
|
|
12,964
|
|
|
|
12,964
|
|
||||||||||||||
|
Stock options exercised
|
920
|
|
9
|
|
15,814
|
|
|
|
|
|
15,823
|
|
|
|
15,823
|
|
||||||||||||||
|
Shares issued for Employee Stock Purchase Plan
|
209
|
|
2
|
|
4,705
|
|
|
|
|
|
4,707
|
|
|
|
4,707
|
|
||||||||||||||
|
Stock repurchases
|
(3,468
|
)
|
(35
|
)
|
(99,465
|
)
|
|
|
|
|
(99,500
|
)
|
|
|
(99,500
|
)
|
||||||||||||||
|
Tax benefit for stock options
|
|
|
|
|
(271
|
)
|
|
|
|
|
(271
|
)
|
|
|
(271
|
)
|
||||||||||||||
|
BALANCE AT OCTOBER 2, 2016
|
57,042
|
|
570
|
|
260,340
|
|
(128,008
|
)
|
736,357
|
|
869,259
|
|
144
|
|
869,403
|
|
||||||||||||||
|
Comprehensive income, net of tax:
|
|
|
|
|
|
|
|
|
|
|
|
|
|
|
|
|
||||||||||||||
|
Net income
|
|
|
|
|
|
|
|
|
117,874
|
|
117,874
|
|
43
|
|
117,917
|
|
||||||||||||||
|
Foreign currency translation adjustments
|
|
|
|
|
|
|
27,894
|
|
|
|
27,894
|
|
8
|
|
27,902
|
|
||||||||||||||
|
Gain on cash flow hedge valuations
|
|
|
|
|
|
|
1,614
|
|
|
|
1,614
|
|
|
|
1,614
|
|
||||||||||||||
|
Comprehensive income, net of tax
|
|
|
|
|
|
|
|
|
|
|
147,382
|
|
51
|
|
147,433
|
|
||||||||||||||
|
Distributions paid to noncontrolling interests
|
|
|
|
|
|
|
|
|
|
|
|
|
(24
|
)
|
(24
|
)
|
||||||||||||||
|
Cash dividends of $0.38 per common share
|
|
|
|
|
|
|
|
|
(21,672
|
)
|
(21,672
|
)
|
|
|
(21,672
|
)
|
||||||||||||||
|
Stock-based compensation
|
|
|
|
|
13,450
|
|
|
|
|
|
13,450
|
|
|
|
13,450
|
|
||||||||||||||
|
Stock options exercised
|
907
|
|
10
|
|
15,084
|
|
|
|
|
|
15,094
|
|
|
|
15,094
|
|
||||||||||||||
|
Shares issued for Employee Stock Purchase Plan
|
190
|
|
2
|
|
4,938
|
|
|
|
|
|
4,940
|
|
|
|
4,940
|
|
||||||||||||||
|
Stock repurchases
|
(2,266
|
)
|
(23
|
)
|
(99,977
|
)
|
|
|
|
|
(100,000
|
)
|
|
|
(100,000
|
)
|
||||||||||||||
|
BALANCE AT OCTOBER 1, 2017
|
55,873
|
|
$
|
559
|
|
$
|
193,835
|
|
$
|
(98,500
|
)
|
$
|
832,559
|
|
$
|
928,453
|
|
$
|
171
|
|
$
|
928,624
|
|
|||||||
See accompanying Notes to Consolidated Financial Statements.
61
TETRA TECH, INC.
(in thousands)
|
|
Fiscal Year Ended
|
||||||||||
|
|
October 1,
2017 |
October 2,
2016 |
September 27,
2015 |
||||||||
|
Cash flows from operating activities:
|
|
|
|
|
|
|
|||||
|
Net income including noncontrolling interests
|
$
|
117,917
|
|
$
|
83,853
|
|
$
|
39,228
|
|
||
|
Adjustments to reconcile net income to net cash from operating activities:
|
|
|
|
|
|
|
|||||
|
Depreciation and amortization
|
45,756
|
|
45,588
|
|
44,201
|
|
|||||
|
Equity in income of unconsolidated joint ventures
|
(4,699
|
)
|
(1,652
|
)
|
(5,131
|
)
|
|||||
|
Distributions of earnings from unconsolidated joint ventures
|
4,052
|
|
2,796
|
|
5,252
|
|
|||||
|
Stock-based compensation
|
13,450
|
|
12,964
|
|
10,926
|
|
|||||
|
Excess tax benefits from stock-based compensation
|
—
|
|
(918
|
)
|
(172
|
)
|
|||||
|
Deferred income taxes
|
(9,957
|
)
|
6,051
|
|
8,412
|
|
|||||
|
Provision (recovery) for doubtful accounts
|
2,847
|
|
8,082
|
|
(1,034
|
)
|
|||||
|
Impairment of goodwill and other intangible assets
|
—
|
|
—
|
|
60,763
|
|
|||||
|
Fair value adjustments to contingent consideration
|
(6,923
|
)
|
2,823
|
|
(3,113
|
)
|
|||||
|
Lease termination costs and related asset impairment
|
—
|
|
2,946
|
|
342
|
|
|||||
|
Gain on disposal of property and equipment
|
(103
|
)
|
(537
|
)
|
(6,014
|
)
|
|||||
|
Changes in operating assets and liabilities, net of effects of business acquisitions:
|
|
|
|
|
|
|
|||||
|
Accounts receivable
|
(64,781
|
)
|
9,062
|
|
40,345
|
|
|||||
|
Prepaid expenses and other assets
|
(8,317
|
)
|
3,720
|
|
12,970
|
|
|||||
|
Accounts payable
|
18,597
|
|
(3,002
|
)
|
(26,901
|
)
|
|||||
|
Accrued compensation
|
13,413
|
|
8,434
|
|
(7,676
|
)
|
|||||
|
Billings in excess of costs on uncompleted contracts
|
28,298
|
|
(13,874
|
)
|
(10,319
|
)
|
|||||
|
Other liabilities
|
2,167
|
|
(19,321
|
)
|
(7,143
|
)
|
|||||
|
Income taxes receivable/payable
|
(13,725
|
)
|
(4,995
|
)
|
7,911
|
|
|||||
|
Net cash provided by operating activities
|
137,992
|
|
142,020
|
|
162,847
|
|
|||||
|
Cash flows from investing activities:
|
|
|
|
|
|
|
|||||
|
Capital expenditures
|
(9,741
|
)
|
(11,945
|
)
|
(24,296
|
)
|
|||||
|
Payments for business acquisitions, net of cash acquired
|
(8,039
|
)
|
(81,259
|
)
|
(11,680
|
)
|
|||||
|
Changes in restricted cash
|
—
|
|
(2,519
|
)
|
4,530
|
|
|||||
|
Proceeds from sale of property and equipment
|
905
|
|
3,076
|
|
10,426
|
|
|||||
|
Investments in unconsolidated joint ventures
|
(85
|
)
|
(1,368
|
)
|
—
|
|
|||||
|
Net cash used in investing activities
|
(16,960
|
)
|
(94,015
|
)
|
(21,020
|
)
|
|||||
|
Cash flows from financing activities:
|
|
|
|
|
|
|
|||||
|
Payments on long-term debt
|
(233,865
|
)
|
(148,485
|
)
|
(75,459
|
)
|
|||||
|
Proceeds from borrowings
|
243,553
|
|
229,049
|
|
64,794
|
|
|||||
|
Payments of contingent earn-out liabilities
|
(1,319
|
)
|
(3,251
|
)
|
(3,199
|
)
|
|||||
|
Debt pre-payment costs
|
—
|
|
(1,935
|
)
|
(1,457
|
)
|
|||||
|
Distributions paid to noncontrolling interests
|
(24
|
)
|
(402
|
)
|
(515
|
)
|
|||||
|
Excess tax benefits from stock-based compensation
|
—
|
|
918
|
|
172
|
|
|||||
|
Repurchases of common stock
|
(100,000
|
)
|
(99,500
|
)
|
(100,500
|
)
|
|||||
|
Net proceeds from issuance of common stock
|
18,555
|
|
17,953
|
|
10,825
|
|
|||||
|
Dividends paid
|
(21,672
|
)
|
(19,735
|
)
|
(18,240
|
)
|
|||||
|
Net cash used in financing activities
|
(94,772
|
)
|
(25,388
|
)
|
(123,579
|
)
|
|||||
|
Effect of foreign exchange rate changes on cash
|
3,256
|
|
2,516
|
|
(5,301
|
)
|
|||||
|
Net increase in cash and cash equivalents
|
29,516
|
|
25,133
|
|
12,947
|
|
|||||
|
Cash and cash equivalents at beginning of year
|
160,459
|
|
135,326
|
|
122,379
|
|
|||||
|
Cash and cash equivalents at end of year
|
$
|
189,975
|
|
$
|
160,459
|
|
$
|
135,326
|
|
||
|
Supplemental information:
|
|
|
|
|
|
|
|||||
|
Cash paid during the year for:
|
|
|
|
|
|
|
|||||
|
Interest
|
$
|
11,504
|
|
$
|
12,575
|
|
$
|
7,323
|
|
||
|
Income taxes, net of refunds of $2.1 million, $3.2 million and $5.4 million
|
$
|
72,578
|
|
$
|
35,273
|
|
$
|
23,268
|
|
||
See accompanying Notes to Consolidated Financial Statements.
62
TETRA TECH, INC.
NOTES TO CONSOLIDATED FINANCIAL STATEMENTS
1. Description of Business
We are a leading provider of consulting and engineering services that focuses on water, environment, infrastructure, resource management, energy, and international development. We are a global company that is renowned for our expertise in providing water-related services for public and private clients. We typically begin at the earliest stage of a project by identifying technical solutions and developing execution plans tailored to our clients' needs and resources. Our solutions may span the entire life cycle of consulting and engineering projects and include applied science, data analysis, research, engineering, design, construction management, and operations and maintenance.
In fiscal
2017
, we managed our operations under
three
reportable segments. We report our water resources, water and wastewater treatment, environment, and infrastructure engineering activities in the Water, Environment and Infrastructure ("WEI") reportable segment. Our Resource Management and Energy ("RME") reportable segment includes our oil and gas, energy, international development, waste management, remediation, and utilities services. In addition, we report the results of the wind-down of our non-core construction activities in the Remediation and Construction Management ("RCM") reportable segment.
2
.
Basis of Presentation and Preparation
Principles of Consolidation and Presentation.
The consolidated financial statements include our accounts and those of joint ventures of which we are the primary beneficiary. All significant intercompany balances and transactions have been eliminated in consolidation.
Fiscal Year.
We report results of operations based on 52 or 53-week periods ending on the Sunday nearest September 30. Fiscal years
2017
,
2016
and
2015
contained 52, 53 and 52 weeks, respectively.
Use of Estimates.
The preparation of financial statements in conformity with accounting principles generally accepted in the United States of America ("U.S. GAAP") requires us to make estimates and assumptions. These estimates and assumptions affect the amounts reported in our consolidated financial statements and accompanying notes. Although such estimates and assumptions are based on management's best knowledge of current events and actions we may take in the future, actual results could differ materially from those estimates.
Revenue Recognition and Contract Costs.
We recognize revenue for most of our contracts using the percentage-of-completion method, primarily based on contract costs incurred to date compared to total estimated contract costs. We generally utilize the cost-to-cost approach to estimate the progress towards completion in order to determine the amount of revenue and profit to recognize. Revenue and cost estimates for each significant contract are reviewed and reassessed quarterly. Changes in those estimates could result in recognition of cumulative catch-up adjustments to the contract's inception-to-date revenue, costs, and profit in the period in which such changes are made. Changes in revenue and cost estimates could also result in a projected loss that would be recorded immediately in earnings.
We recognize revenue for work performed under
three
major types of contracts: fixed-price, time-and-materials and cost-plus.
Fixed-Price.
Under fixed-price contracts, our clients pay us an agreed fixed-amount negotiated in advance for a specified scope of work. We generally recognize revenue on fixed-price contracts using the percentage-of-completion method. If the nature or circumstances of the contract prevent us from preparing a reliable estimate at completion, we will delay profit recognition until adequate information about the contract's progress becomes available.
Time-and-Materials.
Under time-and-materials contracts, we negotiate hourly billing rates and charge our clients based on the actual time that we spend on a project. In addition, clients reimburse us for our actual out-of-pocket costs for materials and other direct incidental expenditures that we incur in connection with our performance under the contract. The majority of our time-and-material contracts are subject to maximum contract values and, accordingly, revenue under these contracts is generally recognized under the percentage-of-completion method. However, time and materials contracts that are service-related contracts are accounted for utilizing the proportional performance method. Revenue on contracts that are not subject to maximum contract values is recognized based on the actual number of hours we spend on the projects plus any actual out-of-pocket costs of materials and other direct incidental expenditures that we incur on the projects. Our time-and-materials contracts also generally include annual billing rate adjustment provisions.
Cost-Plus.
Under cost-plus contracts, we are reimbursed for allowable or otherwise defined costs incurred plus a negotiated fee. The contracts may also include incentives for various performance criteria, including quality, timeliness, ingenuity, safety and cost-effectiveness. In addition, our costs are generally subject to review by our clients and regulatory audit agencies, and such reviews could result in costs being disputed as non-reimbursable under the terms of the contract. Revenue for cost-plus
63
contracts is recognized at the time services are performed. Revenue is not recognized for non-recoverable costs. Performance incentives are included in our estimates of revenue when their realization is reasonably assured.
If estimated total costs on any contract indicate a loss, we recognize the entire estimated loss in the period the loss becomes known. The cumulative effect of revisions to revenue, estimated costs to complete contracts, including penalties, incentive awards, change orders, claims, liquidated damages, anticipated losses, and other revisions are recorded in the period in which the revisions are identified and the loss can be reasonably estimated. Such revisions could occur in any reporting period and the effects may be material depending on the size of the project or the adjustment.
Once contract performance is underway, we may experience changes in conditions, client requirements, specifications, designs, materials, and expectations regarding the period of performance. Such changes are "change orders" and may be initiated by us or by our clients. In many cases, agreement with the client as to the terms of change orders is reached prior to work commencing; however, sometimes circumstances require that work progress without obtaining client agreement. Revenue related to change orders is recognized as costs are incurred. Change orders that are unapproved as to both price and scope are evaluated as claims.
Claims are amounts in excess of agreed contract prices that we seek to collect from our clients or other third parties for delays, errors in specifications and designs, contract terminations, change orders in dispute or unapproved as to both scope and price, or other causes of unanticipated additional costs. Revenue on claims is recognized only to the extent that contract costs related to the claims have been incurred and when it is probable that the claim will result in a bona fide addition to contract value that can be reliably estimated. No profit is recognized on a claim until final settlement occurs. This can lead to a situation in which costs are recognized in one period and revenue is recognized in a subsequent period when a client agreement is obtained or a claims resolution occurs.
Cash and Cash Equivalents.
Cash and cash equivalents include all highly liquid investments with maturities of
90
days or less at the date of purchase. Restricted cash of
$2.7 million
was included in "Prepaid expenses and other current assets" on the consolidated balance sheet at fiscal
2017
year-end.
Insurance Matters, Litigation and Contingencies.
In the normal course of business, we are subject to certain contractual guarantees and litigation. In addition, we maintain insurance coverage for various aspects of our business and operations. We record in our consolidated balance sheets amounts representing our estimated liability for these legal and insurance obligations. We include any adjustments to these liabilities in our consolidated statements of income.
Accounts Receivable – Net.
Net accounts receivable is primarily comprised of billed and unbilled accounts receivable, contract retentions and allowances for doubtful accounts. Billed accounts receivable represent amounts billed to clients that have not been collected. Unbilled accounts receivable represent revenue recognized but not yet billed pursuant to contract terms or billed after the period end date. Most of our unbilled receivables at
October 1, 2017
are expected to be billed and collected within
12
months. Unbilled accounts receivable also include amounts related to requests for equitable adjustment to contracts that provide for price redetermination. These amounts are recorded only when they can be reliably estimated and realization is probable. Contract retentions represent amounts withheld by clients until certain conditions are met or the project is completed, which may be several months or years. Allowances for doubtful accounts represent the amounts that may become uncollectible or unrealizable in the future. We determine an estimated allowance for uncollectible accounts based on management's consideration of trends in the actual and forecasted credit quality of our clients, including delinquency and payment history; type of client, such as a government agency or a commercial sector client; and general economic and particular industry conditions that may affect a client's ability to pay. Billings in excess of costs on uncompleted contracts represent the amount of cash collected from clients and billings to clients on contracts in advance of work performed and revenue recognized. The majority of these amounts will be earned within
12
months.
Property and Equipment.
Property and equipment are recorded at cost and are depreciated over their estimated useful lives using the straight-line method. When property and equipment are retired or otherwise disposed of, the cost and accumulated depreciation are removed from our consolidated balance sheets and any resulting gain or loss is reflected in our consolidated statements of income. Expenditures for maintenance and repairs are expensed as incurred. Generally, estimated useful lives range from
three
to
ten
years for equipment, furniture and fixtures. Buildings are depreciated over periods not exceeding
40
years. Leasehold improvements are amortized on a straight-line basis over the shorter of their estimated useful lives or the length of the lease.
Long-Lived Assets.
Our policy regarding long-lived assets is to evaluate the recoverability of our assets when the facts and circumstances suggest that the assets may be impaired. This assessment is performed based on the estimated undiscounted cash flows compared to the carrying value of the assets. If the future cash flows (undiscounted and without interest charges) are less than the carrying value, a write-down would be recorded to reduce the related asset to its estimated fair value.
We recognize a liability for contract termination costs associated with an exit activity for costs that will continue to be incurred under a lease for its remaining term without economic benefit to us, initially measured at its fair value at the cease-use
64
date. The fair value is determined based on the remaining lease rentals, adjusted for the effects of any prepaid or deferred items recognized under the lease, and reduced by estimated sublease rentals.
Business Combinations.
The cost of an acquired company is assigned to the tangible and intangible assets purchased and the liabilities assumed on the basis of their fair values at the date of acquisition. The determination of fair values of assets and liabilities acquired requires us to make estimates and use valuation techniques when a market value is not readily available. Any excess of purchase price over the fair value of net tangible and intangible assets acquired is allocated to goodwill. Goodwill typically represents the value paid for the assembled workforce and enhancement of our service offerings. Transaction costs associated with business combinations are expensed as they are incurred.
Goodwill and Intangible Assets.
Goodwill represents the excess of the aggregate purchase price over the fair value of the net assets acquired in a business acquisition. Following an acquisition, we perform an analysis to value the acquired company's tangible and identifiable intangible assets and liabilities. With respect to identifiable intangible assets, we consider backlog, non-compete agreements, client relations, trade names, patents and other assets. We amortize our intangible assets based on the period over which the contractual or economic benefits of the intangible assets are expected to be realized. We assess the recoverability of the unamortized balance of our intangible assets when indicators of impairment are present based on expected future profitability and undiscounted expected cash flows and their contribution to our overall operations. Should the review indicate that the carrying value is not fully recoverable, the excess of the carrying value over the fair value of the intangible assets would be recognized as an impairment loss.
We test our goodwill for impairment on an annual basis, and more frequently when an event occurs or circumstances indicate that the carrying value of the asset may not be recoverable. We believe the methodology that we use to review impairment of goodwill, which includes a significant amount of judgment and estimates, provides us with a reasonable basis to determine whether impairment has occurred. However, many of the factors employed in determining whether our goodwill is impaired are outside of our control and it is reasonably likely that assumptions and estimates will change in future periods. These changes could result in future impairments.
We perform our annual goodwill impairment review at the beginning of our fiscal fourth quarter. Our last annual review was performed at July 3, 2017 (i.e., the first day of our fiscal fourth quarter). In addition, we regularly evaluate whether events and circumstances have occurred that may indicate a potential change in recoverability of goodwill. We perform interim goodwill impairment reviews between our annual reviews if certain events and circumstances have occurred, including a deterioration in general economic conditions, an increased competitive environment, a change in management, key personnel, strategy or customers, negative or declining cash flows, or a decline in actual or planned revenue or earnings compared with actual and projected results of relevant prior periods (See Note
6
, "
Goodwill and Intangible Assets
" for further discussion). We assess goodwill for impairment at the reporting unit level, which is defined as an operating segment or
one
level below an operating segment, referred to as a component. Our operating segments are the same as our reportable segments and our reporting units for goodwill impairment testing are the components one level below our reportable segments. These components constitute a business for which discrete financial information is available and where segment management regularly reviews the operating results of that component. We aggregate components within an operating segment that have similar economic characteristics.
The impairment test for goodwill is a
two
-step process involving the comparison of the estimated fair value of each reporting unit to the reporting unit's carrying value, including goodwill. We estimate the fair value of reporting units based on a comparison and weighting of the income approach, specifically the discounted cash flow method and the market approach, which estimates the fair value of our reporting units based upon comparable market prices and recent transactions and also validates the reasonableness of the multiples from the income approach. If the fair value of a reporting unit exceeds its carrying amount, the goodwill of the reporting unit is not considered impaired; therefore, the second step of the impairment test is unnecessary. If the carrying amount of a reporting unit exceeds its fair value, we perform the second step of the goodwill impairment test to measure the amount of impairment loss to be recorded. If our goodwill is impaired, we are required to record a non-cash charge that could have a material adverse effect on our consolidated financial statements.
Contingent Consideration.
Most of our acquisition agreements include contingent earn-out arrangements, which are generally based on the achievement of future operating income thresholds. The contingent earn-out arrangements are based upon our valuations of the acquired companies and reduce the risk of overpaying for acquisitions if the projected financial results are not achieved.
The fair values of these earn-out arrangements are included as part of the purchase price of the acquired companies on their respective acquisition dates. For each transaction, we estimate the fair value of contingent earn-out payments as part of the initial purchase price and record the estimated fair value of contingent consideration as a liability in "Current contingent earn-out liabilities" and "Long-term contingent earn-out liabilities" on the consolidated balance sheets. We consider several factors when determining that contingent earn-out liabilities are part of the purchase price, including the following: (1) the valuation of our acquisitions is not supported solely by the initial consideration paid, and the contingent earn-out formula is a critical and material
65
component of the valuation approach to determining the purchase price; and (2) the former owners of acquired companies that remain as key employees receive compensation other than contingent earn-out payments at a reasonable level compared with the compensation of our other key employees. The contingent earn-out payments are not affected by employment termination.
We measure our contingent earn-out liabilities at fair value on a recurring basis using significant unobservable inputs classified within Level 3 of the fair value hierarchy. We use a probability weighted discounted income approach as a valuation technique to convert future estimated cash flows to a single present value amount. The significant unobservable inputs used in the fair value measurements are operating income projections over the earn-out period (generally
two
or
three
years), and the probability outcome percentages we assign to each scenario. Significant increases or decreases to either of these inputs in isolation would result in a significantly higher or lower liability with a higher liability capped by the contractual maximum of the contingent earn-out obligation. Ultimately, the liability will be equivalent to the amount paid, and the difference between the fair value estimate and amount paid will be recorded in earnings. The amount paid that is less than or equal to the liability on the acquisition date is reflected as cash used in financing activities in our consolidated statements of cash flows. Any amount paid in excess of the liability on the acquisition date is reflected as cash used in operating activities.
We review and re-assess the estimated fair value of contingent consideration on a quarterly basis, and the updated fair value could differ materially from the initial estimates. Changes in the estimated fair value of our contingent earn-out liabilities related to the time component of the present value calculation are reported in interest expense. Adjustments to the estimated fair value related to changes in all other unobservable inputs are reported in operating income.
Fair Value of Financial Instruments.
We determine the fair values of our financial instruments, including short-term investments, debt instruments and derivative instruments based on inputs or assumptions that market participants would use in pricing an asset or a liability. We categorize our instruments using a valuation hierarchy for disclosure of the inputs used to measure fair value. This hierarchy prioritizes the inputs into three broad levels as follows: Level 1 inputs are quoted prices (unadjusted) in active markets for identical assets or liabilities; Level 2 inputs are quoted prices for similar assets and liabilities in active markets or inputs that are observable for the asset or liability, either directly or indirectly through market corroboration, for substantially the full term of the financial instrument; and Level 3 inputs are unobservable inputs based on our own assumptions used to measure assets and liabilities at fair value. The classification of a financial asset or liability within the hierarchy is determined based on the lowest level input that is significant to the fair value measurement.
The carrying amounts of cash and cash equivalents, accounts receivable and accounts payable approximate fair values based on their short-term nature. The carrying amounts of our revolving credit facility approximates fair value because the interest rates are based upon variable reference rates (see Note
9
, "
Long-Term Debt
" and Note
14
, "
Derivative Financial Instruments
" for additional disclosure). Certain other assets and liabilities, such as contingent earn-out liabilities, assets held for sale and amounts related to cash-flow hedges, are required to be carried in our consolidated financial statements at fair value.
Our fair value measurement methods may produce a fair value calculation that may not be indicative of net realizable value or reflective of future fair values. Although we believe our valuation methods are appropriate and consistent with those used by other market participants, the use of different methodologies or assumptions to determine fair value could result in a different fair value measurement at the reporting date.
Derivative Financial Instruments.
We account for our derivative instruments as either assets or liabilities and carry them at fair value. For derivative instruments that hedge the exposure to variability in expected future cash flows that are designated as cash flow hedges, the effective portion of the gain or loss on the derivative instrument is reported as a component of accumulated other comprehensive income (loss) in stockholders' equity and reclassified into income in the same period or periods during which the hedged transaction affects earnings. The ineffective portion of the gain or loss on the derivative instrument, if any, is recognized in current income. To receive hedge accounting treatment, cash flow hedges must be highly effective in offsetting changes to expected future cash flows on hedged transactions.
The net gain or loss on the effective portion of a derivative instrument that is designated as an economic hedge of the foreign currency translation exposure generated by the re-measurement of certain assets and liabilities denominated in a non-functional currency in a foreign operation is reported in the same manner as a foreign currency translation adjustment. Accordingly, any gains or losses related to these derivative instruments are recognized in current income. Derivatives that do not qualify as hedges are adjusted to fair value through current income.
Deferred Compensation.
We maintain a non-qualified defined contribution supplemental retirement plan for certain key employees and non-employee directors that is accounted for in accordance with applicable authoritative guidance on accounting for deferred compensation arrangements where amounts earned are held in a rabbi trust and invested. Employee deferrals and our match are deposited into a rabbi trust, and the funds are generally invested in individual variable life insurance contracts that we own and are specifically designed to informally fund savings plans of this nature. Our consolidated balance sheets reflect our investment in variable life insurance contracts in "Other long-term assets." Our obligation to participating employees is reflected
66
in "Other long-term liabilities." All income and expenses related to the rabbi trust are reflected in our consolidated statements of income.
Income Taxes.
We file a consolidated U.S. federal income tax return and a combined California franchise tax return. In addition, we file other returns that are required in the states, foreign jurisdictions and other jurisdictions in which we do business. We account for certain income and expense items differently for financial reporting and income tax purposes. Deferred tax assets and liabilities are computed for the difference between the financial statement and tax bases of assets and liabilities that will result in taxable or deductible amounts in the future based on enacted tax laws and rates applicable to the periods in which the differences are expected to reverse. In determining the need for a valuation allowance, management reviews both positive and negative evidence, including current and historical results of operations, future income projections and potential tax planning strategies. Based on our assessment, we have concluded that a portion of the deferred tax assets at
October 1, 2017
will not be realized.
According to the authoritative guidance on accounting for uncertainty in income taxes, we may recognize the tax benefit from an uncertain tax position only if it is more likely than not that the tax position will be sustained on examination by the taxing authorities based on the technical merits of the position. The tax benefits recognized in the financial statements from such a position should be measured based on the largest benefit that has a greater than 50% likelihood of being realized upon ultimate settlement. This guidance also addresses de-recognition, classification, interest and penalties on income taxes, accounting in interim periods and disclosure requirements for uncertain tax positions.
Concentration of Credit Risk.
Financial instruments that subject us to credit risk consist primarily of cash and cash equivalents and net accounts receivable. In the event that we have surplus cash, we place our temporary cash investments with lower risk financial institutions and, by policy, limit the amount of investment exposure to any
one
financial institution. Approximately
23%
of accounts receivable were due from various agencies of the U.S. federal government at fiscal
2017
year-end. The remaining accounts receivable are generally diversified due to the large number of organizations comprising our client base and their geographic dispersion. We perform ongoing credit evaluations of our clients and maintain an allowance for potential credit losses. Approximately
45%
,
28%
and
27%
of our fiscal
2017
revenue was generated from our U.S government, U.S. commercial and international clients, respectively (see Note
18
, "
Reportable Segments
" for more information).
Foreign Currency Translation.
We determine the functional currency of our foreign operating units based upon the primary currency in which they operate. These operating units maintain their accounting records in their local currency, primarily Canadian and Australian dollars. Where the functional currency is not the U.S. dollar, translation of assets and liabilities to U.S. dollars is based on exchange rates at the balance sheet date. Translation of revenue and expenses to U.S. dollars is based on the average rate during the period. Translation gains or losses are reported as a component of other comprehensive income (loss). Gains or losses from foreign currency transactions are included in results of operations, with the exception of intercompany foreign transactions that are considered long-term investments, which are recorded in "Accumulated other comprehensive income (loss)" on the consolidated balance sheets.
Recently Adopted and Pending Accounting Guidance.
In March 2016, the Financial Accounting Standards Board (“FASB”) issued updated guidance which requires excess tax benefits and deficiencies on share-based payments to be recorded as income tax expense or benefit in the income statement rather than being recorded in additional paid-in capital. This guidance is effective for annual and interim periods beginning after December 15, 2016, with early adoption permitted. During the first quarter of fiscal 2017, we adopted this guidance and, as a result, we recognized income tax benefits of
$4.9 million
in our consolidated statement of income for fiscal
2017
. We also reported
$4.9 million
as part of our cash flows from operating activities on our consolidated statement of cash flows for fiscal
2017
.
In May 2014, the FASB issued an accounting standard that will supersede existing revenue recognition guidance under current U.S. GAAP. The new standard is a comprehensive new revenue recognition model that requires a company to recognize revenue to depict the transfer of goods or services to a customer at an amount that reflects the consideration it expects to receive in exchange for those goods and services. The standard may be applied retrospectively to each prior period presented or retrospectively with the cumulative effect recognized as of the date of initial application. We continue to evaluate the impact of the new guidance on our consolidated financial statements. We expect to adopt the new standard on October 1, 2018 (the first day of fiscal 2019), using the modified retrospective method that may result in a cumulative effect adjustment as of the date of adoption.
In January 2015, the FASB issued an amendment to the accounting guidance related to the income statement presentation of extraordinary and unusual items. The amendment eliminates from U.S. GAAP the concept of extraordinary items. The guidance was effective for us in the first quarter of fiscal 2017, and the adoption of this guidance had no impact on our consolidated financial statements.
In January 2016, the FASB issued guidance that generally requires companies to measure investments in other entities, except those accounted for under the equity method, at fair value and recognize any changes in fair value in net income. The
67
guidance is effective for us in the first quarter of fiscal 2018. We do not expect the adoption of this guidance to have a significant impact on our consolidated financial statements.
In February 2016, the FASB issued guidance that primarily requires lessees to recognize most leases on their balance sheets but record expenses on their income statements in a manner similar to current accounting. For lessors, the guidance modifies the classification criteria and the accounting for sales-type and direct financing leases. The guidance is effective for us in the first quarter of fiscal 2020, with early adoption permitted. We are currently evaluating the impact that this guidance will have on our consolidated financial statements.
In June 2016, the FASB issued updated guidance which requires entities to estimate all expected credit losses for certain types of financial instruments, including trade receivables, held at the reporting date based on historical experience, current conditions, and reasonable and supportable forecasts. The updated guidance also expands the disclosure requirements to enable users of financial statements to understand the entity’s assumptions, models and methods for estimating expected credit losses. This guidance is effective for us in the first quarter of fiscal 2021, with early adoption permitted. We are currently evaluating the impact that this guidance will have on our consolidated financial statements.
In August 2016, the FASB issued guidance to address eight specific cash flow issues to reduce the existing diversity in practice in how certain cash receipts and cash payments are presented and classified in the statement of cash flows. This guidance is effective for us in the first quarter of fiscal 2019, with early adoption permitted. We are currently evaluating the impact that this guidance will have on our consolidated financial statements.
In October 2016, the FASB issued updated guidance which requires entities to recognize the income tax consequences of an intra-entity transfer of an asset other than inventory when the transfer occurs. This guidance is effective for us in the first quarter of fiscal 2019, with early adoption permitted. We are currently evaluating the impact that this guidance will have on our consolidated financial statements.
In November 2016, the FASB issued updated guidance which provides amendments to address the classification and presentation of changes in restricted cash and in the statement of cash flows. This guidance is effective for us in the first quarter of fiscal 2018. We do not expect that this guidance will have a material impact on our consolidated financial statements.
In January 2017, the FASB issued new guidance that changes the definition of a business to assist entities with evaluating when a set of transferred assets and activities is a business. The guidance requires an entity to evaluate if substantially all of the fair value of the gross assets acquired is concentrated in a single identifiable asset or a group of similar identifiable assets; if so, the set of transferred assets and activities is not a business. This guidance is effective for us in the first quarter of fiscal year 2019, and interim periods within those years, with early adoption permitted. We adopted this guidance in the first quarter of fiscal 2017, and the adoption of this guidance had no impact on our consolidated financial statements.
In January 2017, the FASB issued updated guidance to simplify the test for goodwill impairment. This guidance eliminates step two from the goodwill impairment test. Under the updated guidance, an entity should recognize an impairment charge for the amount by which the carrying amount of a reporting unit exceeds its fair value; however, the loss recognized should not exceed the total amount of goodwill allocated to the reporting unit. This guidance is effective for us in the first quarter of fiscal 2021, on a prospective basis, and earlier adoption is permitted for goodwill impairment tests performed on testing dates after January 1, 2017. We plan to adopt this guidance in the first quarter of fiscal 2018 and we do not expect the adoption of this guidance to have a material impact on our consolidated financial statements.
In May 2017, the FASB issued updated guidance to clarify when changes to the terms or conditions of a share-based payment award must be accounted for as modifications. Under the updated guidance, modification accounting is required only if the fair value, the vesting conditions, or the classification of the award changes as a result of the change in terms or conditions. This guidance is effective for us in the first quarter of fiscal year 2019, on a prospective basis, with early adoption permitted. We are currently evaluating the impact that this guidance will have on our consolidated financial statements.
In August 2017, the FASB issued accounting guidance on hedging activities. The amendment better aligns an entity’s risk management activities and financial reporting for hedging relationships through changes to both the designation and measurement guidance for qualifying hedging relationships and the presentation of hedge results. This guidance is effective for us in the first quarter of fiscal 2020, and interim periods within those years, with early adoption permitted. We are currently evaluating the impact of this guidance will have on our consolidated financial statements.
3. Stock Repurchase and Dividends
68
On November 7, 2016, the Board of Directors authorized a new stock repurchase program under which we could repurchase up to
$200 million
of our common stock. In fiscal
2017
, we repurchased through open market purchases under this program a total of
2,266,397
shares at an average price of
$44.12
for a total cost of $
100.0 million
.
On November 7, 2016, the Board of Directors declared a quarterly cash dividend of
$0.09
per share payable on December 14, 2016 to stockholders of record as of the close of business on December 1, 2016. On January 30, 2017, the Board of Directors declared a quarterly cash dividend of
$0.09
per share payable on March 3, 2017 to stockholders of record as of the close of business on February 17, 2017.
On May 1, 2017, the Board of Directors declared a quarterly cash dividend of
$0.10
per share payable on June 2, 2017 to stockholders of record as of the close of business on May 18, 2017. On July 31, 2017, the Board of Directors declared a quarterly cash dividend of
$0.10
per share payable on September 1, 2017 to stockholders of record as of the close of business on August 17, 2017. Dividends totaling
21.7
million and $
19.7
million were paid in fiscal
2017
and
2016
, respectively.
Subsequent Events.
On November 6, 2017, the Board of Directors declared a quarterly cash dividend of $0.10 per share payable on December 15, 2017 to stockholders of record as of the close of business on November 30, 2017.
4. Accounts Receivable – Net and Revenue Recognition
Net accounts receivable and billings in excess of costs on uncompleted contracts consisted of the following at
October 1, 2017
and
October 2, 2016
:
|
October 1,
2017 |
October 2,
2016 |
||||||
|
(in thousands)
|
|||||||
|
Billed
|
$
|
376,287
|
|
$
|
364,287
|
|
|
|
Unbilled
|
404,899
|
|
356,147
|
|
|||
|
Contract retentions
|
39,840
|
|
29,135
|
|
|||
|
Total accounts receivable – gross
|
821,026
|
|
749,569
|
|
|||
|
Allowance for doubtful accounts
|
(32,259
|
)
|
(35,233
|
)
|
|||
|
Total accounts receivable – net
|
$
|
788,767
|
|
$
|
714,336
|
|
|
|
Billings in excess of costs on uncompleted contracts
|
$
|
117,499
|
|
$
|
88,223
|
|
|
Billed accounts receivable represent amounts billed to clients that have not been collected. Unbilled accounts receivable represent revenue recognized but not yet billed pursuant to contract terms or billed after the period end date. Except for amounts related to claims as discussed below, most of our unbilled receivables at
October 1, 2017
are expected to be billed and collected within
12
months. Contract retentions represent amounts withheld by clients until certain conditions are met or the project is completed, which may be several months or years. The allowance for doubtful accounts represents amounts that are expected to become uncollectible or unrealizable in the future. We determine an estimated allowance for uncollectible accounts based on management's consideration of trends in the actual and forecasted credit quality of our clients, including delinquency and payment history; type of client, such as a government agency or a commercial sector client; and general economic and particular industry conditions that may affect a client's ability to pay. Billings in excess of costs on uncompleted contracts represent the amount of cash collected from clients and billings to clients on contracts in advance of revenue recognized. The majority of billings in excess of costs on uncompleted contracts will be earned within
12
months.
Once contract performance is underway, we may experience changes in conditions, client requirements, specifications, designs, materials and expectations regarding the period of performance. Such changes result in "change orders" and may be initiated by us or by our clients. In many cases, agreement with the client as to the terms of change orders is reached prior to work commencing; however, sometimes circumstances require that work progress without a definitive client agreement. Unapproved change orders constitute claims in excess of agreed contract prices that we seek to collect from our clients for delays, errors in specifications and designs, contract terminations, or other causes of unanticipated additional costs. Revenue on claims is recognized when contract costs related to claims have been incurred and when their addition to contract value can be reliably estimated. This can lead to a situation in which costs are recognized in one period and revenue is recognized in a subsequent period, such as when client agreement is obtained or a claims resolution occurs.
Total accounts receivable at
October 1, 2017
and
October 2, 2016
included
$59 million
and
$45 million
, respectively, related to claims, including requests for equitable adjustment, on contracts that provide for price redetermination. We regularly evaluate all unsettled claim amounts and record appropriate adjustments to operating earnings when it is probable that the claim
69
will result in a different contract value than the amount previously estimated. As a result of this assessment, in fiscal
2017
, we recognized a reduction of revenue of
$4.9 million
and related losses in operating income of
$3.6 million
in our RCM segment. In fiscal
2016
, we collected
$13.4 million
to settle claims of
$8.8 million
, which resulted in gains in operating income of
$4.6 million
in the RCM segment. In fiscal 2016, we also recognized reductions in operating income in our RCM segment and a related increase in the allowance for doubtful accounts of
$7.9 million
as a result of our updated assessment of the collectability of certain accounts receivable, of which
$4.6 million
related to unsettled claims. Related to these same projects, we have claims and potential claims against us from both our subcontractors and customers for back charges. We believe these claims are without merit and thus any liability is considered remote at this time. However, changes in these estimates could result in the recognition of additional project costs and losses in the period when changes to estimate are made.
Billed accounts receivable related to U.S. federal government contracts were
$45.4 million
and
$47.4 million
at
October 1, 2017
and
October 2, 2016
, respectively. U.S. federal government contracts unbilled receivables were
$109.7 million
and
$92.2 million
at
October 1, 2017
and
October 2, 2016
, respectively. Other than the U.S. federal government, no single client accounted for more than
10%
of our accounts receivable at
October 1, 2017
and
October 2, 2016
.
We recognize revenue for most of our contracts using the percentage-of-completion method, primarily utilizing the cost-to-cost approach, to estimate the progress towards completion in order to determine the amount of revenue and profit to recognize. Changes in those estimates could result in the recognition of cumulative catch-up adjustments to the contract’s inception-to-date revenue, costs and profit in the period in which such changes are made. As a result, we recognized net unfavorable operating income adjustments of
$8.0 million
(
$2.3 million
in the RME segment and
$5.7 million
in the RCM segment) during fiscal 2017. We recognized net unfavorable operating income adjustments during fiscal
2016
of
$2.3 million
(all in the RCM segment) and during fiscal 2015 of
$8.9 million
. Changes in revenue and cost estimates could also result in a projected loss that would be recorded immediately in earnings. As of
October 1, 2017
and
October 2, 2016
, our consolidated balance sheets included liabilities for anticipated losses of
$8.1 million
and
$6.7 million
, respectively. The estimated cost to complete the related contracts as of
October 1, 2017
was
$5.0 million
.
5
.
Mergers and Acquisitions
In fiscal 2015, we acquired Cornerstone Environmental Group, LLC ("CEG"), headquartered in Middletown, New York. CEG is an environmental engineering and consulting firm focused on solid waste markets in the United States, and is included in our RME segment. The fair value of the purchase price for CEG was
$15.9 million
. Of this amount,
$11.8 million
was paid to the former owners and
$4.1 million
was the estimated fair value of contingent earn-out obligations, with a maximum of
$9.8 million
, based upon the achievement of specified financial objectives. The results of this acquisition were included in the consolidated financial statements from the closing date. The acquisition was not considered material to our consolidated financial statements. As a result, no pro forma information has been provided.
In the second quarter of fiscal 2016, we acquired control of Coffey International Limited ("Coffey"), headquartered in Sydney, Australia. Coffey had approximately
3,300
staff delivering technical and engineering solutions in international development and geoscience. Coffey significantly expands our geographic presence, particularly in Australia and Asia Pacific, and is part of our RME segment. In addition to Australia, Coffey's international development business has operations supporting federal government agencies in the U.S., Australia and the United Kingdom. The fair value of the purchase price for Coffey was
$76.1 million
, in addition to
$65.1 million
of assumed debt, which consisted of secured bank term debt of
$37.1 million
and unsecured corporate bond obligations of
$28.0 million
. All of this debt was paid in full in the second quarter of fiscal 2016 subsequent to the acquisition.
In the second quarter of fiscal 2016, we also acquired INDUS Corporation ("INDUS"), headquartered in Vienna, Virginia. INDUS is an information technology solutions firm focused on water data analytics, geospatial analysis, secure infrastructure, and software applications management for U.S. federal government customers, and is included in our WEI segment. The fair value of the purchase price for INDUS was
$18.7 million
. Of this amount,
$14.0 million
was paid to the sellers and
$4.7 million
was the estimated fair value of contingent earn-out obligations, with a maximum of
$8.0 million
, based upon the achievement of specified operating income targets in each of the
two years
following the acquisition.
In the second quarter of fiscal 2017, we completed the acquisition of Eco Logical Australia (“ELA”), headquartered in Sydney, Australia. ELA is a multi-disciplinary consulting firm with over
160
staff that provides innovative, high-end environmental and ecological services, and is part of our RME segment. The fair value of the purchase price for ELA was
$9.9 million
. Of this amount,
$8.3 million
was paid to the sellers and
$1.6 million
was the estimated fair value of contingent earn-out obligations, with a maximum of
$1.7 million
, based upon the achievement of specified operating income targets in each of the
two years
following the acquisition.
The following table summarizes the estimated fair values of assets acquired and liabilities assumed as of the respective acquisition dates for our acquisitions completed in fiscal 2016 (in thousands):
70
|
Accounts receivable
|
$
|
71,515
|
|
|
Other current assets
|
18,869
|
|
|
|
Property and equipment
|
14,218
|
|
|
|
Goodwill
|
108,323
|
|
|
|
Backlog and trade name intangible assets
|
29,445
|
|
|
|
Other assets
|
747
|
|
|
|
Current liabilities
|
(78,311
|
)
|
|
|
Borrowings
|
(65,086
|
)
|
|
|
Other long-term liabilities
|
(4,885
|
)
|
|
|
Net assets acquired
|
$
|
94,835
|
|
Goodwill additions resulting from the above business combinations are primarily attributable to the existing workforce of the acquired companies and the synergies expected to arise after the acquisitions. The goodwill addition related to the fiscal
2017
acquisition primarily represents the value of a workforce with distinct expertise in the environmental and ecological markets. The goodwill additions related to the fiscal
2016
acquisitions primarily represent the value of workforces with distinct expertise in the international development, geoscience, and software applications management markets. In addition, these acquired capabilities, when combined with our existing global consulting and engineering business, result in opportunities that allow us to provide services under contracts that could not have been pursued individually by either us or the acquired companies. The results of these acquisitions were included in the consolidated financial statements from their respective closing dates.
Backlog and trade name intangible assets include the fair value of existing contracts and the underlying customer relationships with lives ranging from
1
to
5
years (weighted average of approximately
3
years) and the fair value of trade names with lives ranging from
3
to
5
years.
The table below presents summarized unaudited consolidated pro forma operating results including the related acquisition, integration and debt pre-payment charges, assuming we had acquired Coffey and INDUS at the beginning of fiscal
2016
. These pro-forma operating results are presented for illustrative purposes only and are not indicative of the operating results that would have been achieved had the related events occurred at the beginning of fiscal
2016
.
|
Pro-Forma
|
|||||||
|
Fiscal Year Ended
|
|||||||
|
October 1,
2017 |
October 2,
2016 |
||||||
|
(in thousands, except per share data)
|
|||||||
|
Revenue
|
$
|
2,753,360
|
|
$
|
2,714,658
|
|
|
|
Operating income
|
183,342
|
|
152,676
|
|
|||
|
Net income attributable to Tetra Tech
|
117,874
|
|
98,871
|
|
|||
|
Earnings per share attributable to Tetra Tech
|
|
|
|
|
|||
|
Basic
|
$
|
2.07
|
|
$
|
1.70
|
|
|
|
Diluted
|
$
|
2.04
|
|
$
|
1.68
|
|
|
Acquisition and integration expenses in the accompanying consolidated statements of income are comprised of the following:
|
Fiscal Year Ended
October 2, 2016 |
|||
|
(in thousands)
|
|||
|
Severance including change in control payments
|
$
|
10,917
|
|
|
Professional services
|
5,685
|
|
|
|
Real estate-related
|
2,946
|
|
|
|
Total
|
$
|
19,548
|
|
71
As of
October 2, 2016
, all of the acquisition and integration expenses incurred to date had been paid. All acquisition and integration expenses are included in our Corporate reportable segment, as presented in Note
18
, "
Reportable Segments
"
. In addition, in the second quarter of fiscal
2016
, we repaid Coffey's bank loans and corporate bonds in full, including
$1.9 million
in pre-payment charges that are included in interest expense.
Most of our acquisition agreements include contingent earn-out agreements, which are generally based on the achievement of future operating income thresholds. The contingent earn-out arrangements are based on our valuations of the acquired companies, and reduce the risk of overpaying for acquisitions if the projected financial results are not achieved. The fair values of any earn-out arrangements are included as part of the purchase price of the acquired companies on their respective acquisition dates. For each transaction, we estimate the fair value of contingent earn-out payments as part of the initial purchase price and record the estimated fair value of contingent consideration as a liability in "Current contingent earn-out liabilities" and "Long-term contingent earn-out liabilities" on the consolidated balance sheets. We consider several factors when determining that contingent earn-out liabilities are part of the purchase price, including the following: (1) the valuation of our acquisitions is not supported solely by the initial consideration paid, and the contingent earn-out formula is a critical and material component of the valuation approach to determining the purchase price; and (2) the former owners of acquired companies that remain as key employees receive compensation other than contingent earn-out payments at a reasonable level compared with the compensation of our other key employees. The contingent earn-out payments are not affected by employment termination.
We measure our contingent earn-out liabilities at fair value on a recurring basis using significant unobservable inputs classified within Level 3 of the fair value hierarchy. We use a probability-weighted discounted income approach as a valuation technique to convert future estimated cash flows to a single present value amount. The significant unobservable inputs used in the fair value measurements are operating income projections over the earn-out period (generally
two
or
three
years), and the probability outcome percentages we assign to each scenario. Significant increases or decreases to either of these inputs in isolation would result in a significantly higher or lower liability, with a higher liability capped by the contractual maximum of the contingent earn-out obligation. Ultimately, the liability will be equivalent to the amount paid, and the difference between the fair value estimate and amount paid will be recorded in earnings. The amount paid that is less than or equal to the contingent earn-out liability on the acquisition date is reflected as cash used in financing activities in our consolidated statements of cash flows. Any amount paid in excess of the contingent earn-out liability on the acquisition date is reflected as cash used in operating activities in our consolidated statements of cash flows.
We review and re-assess the estimated fair value of contingent consideration on a quarterly basis, and the updated fair value could differ materially from the initial estimates. Changes in the estimated fair value of our contingent earn-out liabilities related to the time component of the present value calculation are reported in interest expense. Adjustments to the estimated fair value related to changes in all other unobservable inputs are reported in operating income. During fiscal 2017, we recorded adjustments to our contingent earn-out liabilities and reported related net gains in operating income totaling
$6.9 million
. These gains resulted from updated valuations of the contingent consideration liabilities for INDUS and CEG. During fiscal 2016, we increased our contingent earn-out liabilities and reported related losses in operating income of
$2.8 million
. These losses include a
$1.8 million
charge that reflected our updated valuation of the contingent consideration liability for CEG. This valuation included our updated projection of CEG's financial performance during the earn-out period, which exceeded our original estimate at the acquisition date. The remaining
$1.0 million
loss represented the final cash settlement of an earn-out liability that was valued at
$0
at the end of fiscal 2015.
The acquisition agreement for INDUS included a contingent earn-out agreement based on the achievement of operating income thresholds in each of the first
two years
beginning on the acquisition date, which was in the second quarter of fiscal 2016. The maximum earn-out obligation over the
two
-year earn-out period was
$8.0 million
(
$4.0 million
in each year). These amounts could be earned on a pro-rata basis starting at
50%
of the earn-out maximum for operating income within a predetermined range in each year. INDUS was required to meet a minimum operating income threshold in each year to earn any contingent consideration. These minimum thresholds were
$3.2 million
and
$3.6 million
in years one and two, respectively. In order to earn the maximum contingent consideration, INDUS needed to generate operating income of
$3.6 million
in year one and
$4.0 million
in year two.
The determination of the fair value of the purchase price for INDUS on the acquisition date included our estimate of the fair value of the related contingent earn-out obligation. The initial valuation was primarily based on probability-weighted internal estimates of INDUS’ operating income during each earn-out period. As a result of these estimates, we calculated an initial fair value at the acquisition date of INDUS’ contingent earn-out liability of
$4.7 million
in the second quarter of fiscal 2016. This amount had increased to
$4.9 million
at the end of fiscal 2016 due to the passage of time for the present value calculation. In determining that INDUS would earn
59%
of the maximum potential earn-out, we considered several factors including INDUS’ recent historical revenue and operating income levels and growth rates. We also considered the recent trend in INDUS’ backlog level.
72
INDUS’ actual financial performance in the first earn-out period was below our original expectation at the acquisition date. As a result, in the second quarter of fiscal 2017, we evaluated our estimate of INDUS’ contingent consideration liability for both earn-out periods. This assessment included a review of INDUS’ financial results in the first earn-out period, the status of ongoing projects in INDUS’ backlog, and the inventory of prospective new contract awards. As a result of this assessment, we concluded that INDUS’ operating income in both the first and second earn-out periods would be lower than the minimum requirements of
$3.2 million
and
$3.6 million
, respectively, to earn any contingent consideration. Accordingly, in the second quarter of fiscal 2017, we reduced the INDUS contingent earn-out liability to
$0
, which resulted in a gain of
$5.0 million
.
The acquisition agreement for CEG included a contingent earn-out agreement based on the achievement of operating income thresholds in each of the first
three years
beginning on the acquisition date, which was in the third quarter of fiscal 2015. The maximum earn-out obligation over the
three
-year earn-out period was
$9.8 million
(
$3.25 million
in each year). The annual amounts could be earned primarily on a pro-rata basis for operating income within a predetermined range in each year. To a lesser extent, additional earn-out consideration could be earned for operating income above the high-end of the range up to the contractual maximum of
$9.8 million
. CEG was required to meet a minimum operating income threshold in each year to earn any contingent consideration. These minimum thresholds were
$2.0 million
,
$2.3 million
and
$2.6 million
in years one, two and three, respectively. In order to earn the maximum contingent consideration, CEG needed to achieve operating income of
$4.5 million
in year one,
$4.8 million
in year two and
$5.1 million
in year three.
The determination of the fair value of the purchase price for CEG on the acquisition date included our estimate of the fair value of the related contingent earn-out obligation. The initial valuation was primarily based on probability-weighted internal estimates of CEG’s operating income during each earn-out period. As a result of these estimates, we calculated an initial fair value at the acquisition date of CEG’s contingent earn-out liability of
$4.1 million
in the third quarter of fiscal 2015. In determining that CEG would earn
42%
of the maximum potential earn-out, we considered several factors including CEG’s recent historical revenue and operating income levels and growth rates. We also considered the recent trend in CEG’s backlog level.
In the second quarter of fiscal 2016, we recorded an increase in our contingent earn-out liabilities and related losses in operating income of
$1.8 million
, which reflected our updated valuation of the contingent consideration liability for CEG. This valuation included our updated projection of CEG’s financial performance during the earn-out period, which exceeded our original estimate at the acquisition date. The first earn-out payment of
$2.3 million
was made in the fourth quarter of fiscal 2016, at which time a
$3.9 million
contingent consideration liability remained for the last
two years
of CEG’s earn-out period.
During the second quarter of fiscal 2017, we evaluated our estimate of CEG’s contingent consideration liability for the remaining two earn-out periods. This assessment included a review of CEG’s financial results to-date in the second earn-out period, the status of ongoing projects in CEG’s backlog, and the inventory of prospective new contract awards. As a result of this assessment, we concluded that CEG’s operating income in both the second and third earn-out periods would be lower than our previous estimate. Accordingly, we reduced the CEG contingent earn-out liability to
$1.8 million
as of April 2, 2017, which resulted in a gain of
$2.1 million
in the second quarter of fiscal 2017. The second earn-out payment of
$1.3 million
was made in the fourth quarter of fiscal 2017.
During the second quarter of fiscal 2017, when we determined that INDUS’ and CEG’s operating income would be lower than our previous estimates, including our original estimates at the acquisition dates, we also evaluated the related goodwill for potential impairment. In each case, we determined that the related reporting units’ long-term performance was not materially impacted and there was
no
resulting goodwill impairment.
During fiscal 2016, we also recognized a
$1.0 million
loss, which represented the final cash settlement of an earn-out liability that was valued at
$0
at the end of fiscal 2015.
During fiscal 2015, we decreased our contingent earn-out liabilities and reported a related gain in operating income of
$3.1 million
. This gain resulted from an updated valuation of the contingent consideration liability for Caber Engineering Inc. ("Caber"), which is part of our RME segment.
The acquisition agreement for Caber included a contingent earn-out agreement based on the achievement of operating income thresholds (in Canadian dollars) in each of the first
two years
beginning on the acquisition date, which was in the first quarter of fiscal 2014. The maximum earn-out obligation over the
two
-year earn-out period was
C$8.0 million
(
C$4.0 million
in each year). These amounts could be earned on a pro-rata basis for operating income within a predetermined range in each year. Caber was required to meet a minimum operating income threshold in each year to earn any contingent consideration. These thresholds were
C$4.0 million
and
C$4.6 million
in years one and two, respectively. In order to earn the maximum contingent consideration, Caber needed to generate operating income of
C$4.4 million
in year one and
C$5.1 million
in year two.
73
The determination of the fair value of the purchase price for Caber on the acquisition date included our estimate of the fair value of the related contingent earn-out obligation. This initial valuation was primarily based on probability-weighted internal estimates of Caber's operating income during each earn-out period. As a result of these estimates, we calculated an initial fair value at the acquisition date of Caber's contingent earn-out liability of
C$6.5 million
in the first quarter of fiscal 2014. In determining that Caber would earn
81%
of the maximum potential earn-out, we considered several factors including Caber's recent historical revenue and operating income levels and growth rates. We also considered the recent trend in Caber's backlog level and the prospects for the oil and gas industry in Western Canada.
Caber's actual financial performance in the first earn-out period exceeded our original estimate at the acquisition date. As a result, in the fourth quarter of fiscal 2014, we increased the related contingent consideration liability and recognized a loss of
$1.0 million
. This updated valuation included our assumption that Caber would earn the maximum amount of contingent consideration of
$4.0 million
in the first earn-out period. In the second quarter of fiscal 2015, we completed our final calculation of the contingent consideration for the first earn-out period and paid contingent consideration of
C$4.0 million
(USD
$3.2 million
). At that time we also evaluated our estimate of Caber's contingent consideration liability for the second earn-out period. This assessment included a review of the status of ongoing projects in Caber's backlog, and the inventory of prospective new contract awards. We also considered the status of the oil and gas industry in Western Canada, particularly in light of the decline in oil prices at the time. As a result of this assessment, we concluded that Caber's operating income in the second earn-out period would be lower than our original estimate at the acquisition date and our subsequent estimates through the first quarter of fiscal 2015. We also concluded that Caber's operating income for the second earn-out period would be lower than the minimum requirement of
C$4.6 million
to earn any contingent consideration. Accordingly, in the second quarter of fiscal 2015, we reduced the Caber contingent earn-out liability to
$0
, which resulted in a gain of
$3.1 million
. The second earn-out period ended in the first quarter of fiscal 2016 with
no
further adjustments.
At
October 1, 2017
, there was a total maximum of
$8.9 million
of outstanding contingent consideration related to acquisitions. Of this amount,
$2.4 million
was estimated as the fair value and accrued on our consolidated balance sheet.
The following table summarizes the changes in the carrying value of estimated contingent earn-out liabilities:
|
|
Fiscal Year Ended
|
||||||||||
|
|
October 1,
2017 |
October 2,
2016 |
September 27,
2015 |
||||||||
|
|
(in thousands)
|
||||||||||
|
Beginning balance (at fair value)
|
$
|
8,757
|
|
$
|
4,169
|
|
$
|
7,030
|
|
||
|
Estimated earn-out liabilities for acquisitions during the fiscal year
|
1,604
|
|
4,745
|
|
4,100
|
|
|||||
|
Increases due to re-measurement of fair value reported in interest expense
|
260
|
|
271
|
|
136
|
|
|||||
|
Net increase (decrease) due to re-measurement of fair value reported as losses (gains) in operating income
|
(6,923
|
)
|
2,823
|
|
(3,113
|
)
|
|||||
|
Foreign exchange impact
|
59
|
|
—
|
|
(785
|
)
|
|||||
|
Earn-out payments:
|
|
|
|
|
|
|
|||||
|
Reported as cash used in operating activities
|
—
|
|
—
|
|
—
|
|
|||||
|
Reported as cash used in financing activities
|
(1,319
|
)
|
(3,251
|
)
|
(3,199
|
)
|
|||||
|
Ending balance (at fair value)
|
$
|
2,438
|
|
$
|
8,757
|
|
$
|
4,169
|
|
||
Subsequent Event.
On October 2, 2017, we acquired Glumac, a leader in sustainable infrastructure design. The company has more than
300
employees and incorporates innovative sustainable technologies and solutions into each of its designs, including the design and engineering of Leadership in Energy and Environmental Design (LEED) standard and Net-Zero infrastructure
.
6
.
Goodwill and Intangible Assets
The following table summarizes the changes in the carrying value of goodwill:
74
|
WEI
|
RME
|
Total
|
|||||||||
|
|
(in thousands)
|
||||||||||
|
Balance at September 27, 2015
|
$
|
210,748
|
|
$
|
390,631
|
|
$
|
601,379
|
|
||
|
Goodwill additions
|
9,080
|
|
98,538
|
|
107,618
|
|
|||||
|
Goodwill adjustments
|
—
|
|
1,687
|
|
1,687
|
|
|||||
|
Foreign exchange translation
|
2,125
|
|
5,179
|
|
7,304
|
|
|||||
|
Balance at October 2, 2016
|
221,953
|
|
496,035
|
|
717,988
|
|
|||||
|
Goodwill additions
|
—
|
|
7,055
|
|
7,055
|
|
|||||
|
Goodwill adjustments
|
13,509
|
|
(12,804
|
)
|
705
|
|
|||||
|
Foreign exchange translation
|
6,273
|
|
8,865
|
|
15,138
|
|
|||||
|
Balance at October 1, 2017
|
$
|
241,735
|
|
$
|
499,151
|
|
$
|
740,886
|
|
||
We perform our annual goodwill impairment review at the beginning of our fiscal fourth quarter. Our last review at July 3, 2017 (i.e. the first day of our fourth quarter in fiscal
2017
), indicated that we had
no
impairment of goodwill, and all of our reporting units had estimated fair values that were in excess of their carrying values, including goodwill. We had
no
reporting units that had estimated fair values that exceeded their carrying values by less than
20%
. In addition, we regularly evaluate whether events and circumstances have occurred that may indicate a potential change in the recoverability of goodwill. We perform interim goodwill impairment reviews between our annual reviews if certain events and circumstances have occurred, such as a deterioration in general economic conditions; an increase in the competitive environment; a change in management, key personnel, strategy or customers; negative or declining cash flows; or a decline in actual or planned revenue or earnings compared with actual and projected results of relevant prior periods.
In the fourth quarter of fiscal 2015, the mining sector continued to contract in response to lower global growth expectations driven in large part by China's actual and projected slower economic growth. Consistent with this trend, our mining customers continued their curtailment of capital spending for new mining projects. As a result, our Global Mining Practice ("GMP") reporting unit experienced a
25%
decline in revenue in the fourth quarter of fiscal 2015 compared to the same period of fiscal 2014. This negative trend was compared to the expected revenue growth of approximately
3%
in the previous goodwill impairment test, performed as of June 30, 2014. In response to these results, we performed a strategic review of GMP in the fourth quarter of fiscal 2015, and determined that our mining activities would likely decline further in fiscal 2016, and that revenue and profits would not return to acceptable levels of performance in the foreseeable future. We also decided to redeploy a significant portion of our mining resources into other operational areas that have better growth and profitability prospects. Consequently, as of the first day of fiscal 2016, GMP was no longer a reporting unit. We considered GMP's financial performance and prospects in our goodwill impairment analysis in the fourth quarter of fiscal 2015 and determined that GMP's fair value had fallen significantly below its carrying value, including goodwill. As required, we performed further analysis to measure the amount of the impairment loss and, as a result, we wrote-off all of GMP's goodwill and identifiable intangible assets and recorded a related impairment charge of
$60.8 million
(
$57.3 million
after-tax) in the fourth quarter of fiscal 2015. The related goodwill and identifiable intangible assets that were determined not to be recoverable totaled
$58.1 million
and
$2.7 million
, respectively.
Our fourth quarter
2017
and
2016
goodwill impairment reviews indicated that we had no other impairment of goodwill, and all of our other reporting units had estimated fair values that were in excess of their carrying values, including goodwill. Although we believe that our estimates of fair value for these reporting units are reasonable, if financial performance for these reporting units falls significantly below our expectations or market prices for similar business decline, the goodwill for these reporting units could become impaired.
Foreign exchange translation relates to our foreign subsidiaries with functional currencies that are different than our reporting currency. The gross amounts of goodwill for WEI were
$324.1 million
and
$304.4 million
at
October 1, 2017
and
October 2, 2016
, respectively, excluding
$82.4 million
of accumulated impairment. The gross amounts of goodwill for RME were
$532.4 million
and
$529.2 million
at
October 1, 2017
and
October 2, 2016
, respectively, excluding
$33.2 million
of accumulated impairment.
75
The gross amount and accumulated amortization of our acquired identifiable intangible assets with finite useful lives included in "Intangible assets – net" on the consolidated balance sheets, were as follows:
|
Fiscal Year Ended
|
|||||||||||||||||
|
October 1, 2017
|
October 2, 2016
|
||||||||||||||||
|
Weighted-
Average
Remaining
Life
(in years)
|
Gross
Amount
|
Accumulated
Amortization
|
Gross
Amount
|
Accumulated
Amortization
|
|||||||||||||
|
($ in thousands)
|
|||||||||||||||||
|
Non-compete agreements
|
0.1
|
$
|
495
|
|
$
|
(493
|
)
|
$
|
881
|
|
$
|
(840
|
)
|
||||
|
Client relations
|
2.9
|
90,297
|
|
(75,074
|
)
|
112,367
|
|
(83,514
|
)
|
||||||||
|
Backlog
|
1.4
|
21,518
|
|
(13,301
|
)
|
23,018
|
|
(7,536
|
)
|
||||||||
|
Technology and trade names
|
3.3
|
6,685
|
|
(3,439
|
)
|
7,778
|
|
(3,192
|
)
|
||||||||
|
Total
|
|
$
|
118,995
|
|
$
|
(92,307
|
)
|
$
|
144,044
|
|
$
|
(95,082
|
)
|
||||
Foreign currency translation adjustments reduced net identifiable intangible assets by
$0.1 million
and
$1.1 million
in fiscal
2017
and 2016, respectively. Amortization expense for the identifiable intangible assets for fiscal
2017
,
2016
and
2015
was
$22.8 million
,
$22.1 million
and
$20.2 million
, respectively.
Estimated amortization expense for the succeeding five years and beyond is as follows:
|
|
Amount
|
||
|
|
(in thousands)
|
||
|
2018
|
$
|
14,548
|
|
|
2019
|
7,034
|
|
|
|
2020
|
2,802
|
|
|
|
2021
|
1,664
|
|
|
|
2022
|
411
|
|
|
|
Beyond
|
229
|
|
|
|
Total
|
$
|
26,688
|
|
7. Property and Equipment
Property and equipment consisted of the following:
|
|
Fiscal Year Ended
|
||||||
|
|
October 1,
2017 |
October 2,
2016 |
|||||
|
|
(in thousands)
|
||||||
|
Land and buildings
|
$
|
3,680
|
|
$
|
3,683
|
|
|
|
Equipment, furniture and fixtures
|
150,026
|
|
180,750
|
|
|||
|
Leasehold improvements
|
27,689
|
|
30,261
|
|
|||
|
Total property and equipment
|
181,395
|
|
214,694
|
|
|||
|
Accumulated depreciation
|
(124,560
|
)
|
(146,867
|
)
|
|||
|
Property and equipment, net
|
$
|
56,835
|
|
$
|
67,827
|
|
|
The depreciation expense related to property and equipment was
$22.2 million
,
$22.8 million
and
$23.1 million
for fiscal
2017
,
2016
and
2015
, respectively.
76
8
.
Income Taxes
The income before income taxes, by geographic area, was as follows:
|
|
Fiscal Year Ended
|
||||||||||
|
|
October 1,
2017 |
October 2,
2016 |
September 27,
2015 |
||||||||
|
|
(in thousands)
|
||||||||||
|
Income before income taxes:
|
|
|
|
|
|
|
|||||
|
United States
|
$
|
166,074
|
|
$
|
113,576
|
|
$
|
118,822
|
|
||
|
Foreign
|
5,687
|
|
10,890
|
|
(38,501
|
)
|
|||||
|
Total income before income taxes
|
$
|
171,761
|
|
$
|
124,466
|
|
$
|
80,321
|
|
||
Income tax expense consisted of the following:
|
|
Fiscal Year Ended
|
||||||||||
|
|
October 1,
2017 |
October 2,
2016 |
September 27,
2015 |
||||||||
|
|
|
(in thousands)
|
|
||||||||
|
Current:
|
|
|
|
|
|
|
|||||
|
Federal
|
$
|
45,604
|
|
$
|
22,277
|
|
$
|
23,836
|
|
||
|
State
|
8,860
|
|
5,634
|
|
5,072
|
|
|||||
|
Foreign
|
9,337
|
|
6,651
|
|
3,773
|
|
|||||
|
Total current income tax expense
|
63,801
|
|
34,562
|
|
32,681
|
|
|||||
|
Deferred:
|
|
|
|
|
|
|
|||||
|
Federal
|
(4,251
|
)
|
6,231
|
|
7,218
|
|
|||||
|
State
|
(945
|
)
|
(16
|
)
|
2,335
|
|
|||||
|
Foreign
|
(4,761
|
)
|
(164
|
)
|
(1,141
|
)
|
|||||
|
Total deferred income tax expense
|
(9,957
|
)
|
6,051
|
|
8,412
|
|
|||||
|
Total income tax expense
|
$
|
53,844
|
|
$
|
40,613
|
|
$
|
41,093
|
|
||
77
Total income tax expense was different from the amount computed by applying the U.S. federal statutory rate to pre-tax income as follows:
|
|
Fiscal Year Ended
|
||||
|
|
October 1,
2017 |
October 2,
2016 |
September 27,
2015 |
||
|
Tax at federal statutory rate
|
35.0%
|
35.0%
|
35.0%
|
||
|
State taxes, net of federal benefit
|
3.4
|
3.1
|
5.0
|
||
|
Research and Development ("R&D") credit
|
(1.8)
|
(3.4)
|
(3.8)
|
||
|
Domestic production deduction
|
(0.7)
|
(0.7)
|
(0.8)
|
||
|
Tax differential on foreign earnings
|
—
|
(1.6)
|
(3.8)
|
||
|
Non-taxable foreign interest income
|
(2.9)
|
(3.9)
|
(5.9)
|
||
|
Non-deductible executive compensation
|
—
|
2.0
|
—
|
||
|
Goodwill and contingent consideration
|
—
|
—
|
19.2
|
||
|
Stock compensation
|
(2.8)
|
0.3
|
0.5
|
||
|
Valuation allowance
|
(0.5)
|
2.4
|
5.7
|
||
|
Change in uncertain tax positions
|
1.8
|
(2.0)
|
—
|
||
|
Other
|
(0.2)
|
1.4
|
0.1
|
||
|
Total income tax expense
|
31.3%
|
32.6%
|
51.2%
|
||
The effective tax rates for fiscal
2017
and
2016
were
31.3%
and
32.6%
, respectively. During fiscal 2017, we adopted accounting guidance which requires excess tax benefits and deficiencies on share-based payments to be recorded as an income tax benefit or expense, respectively, in the statement of income rather than being recorded in additional paid-in capital on the balance sheet. As a result, we recognized an income tax benefit of
$4.9 million
in fiscal 2017. Excluding this items, the effective tax rate for fiscal 2017 was
34.2%
. In fiscal 2017, the Internal Revenue Service (“IRS”) concluded their examination for fiscal years 2010 through 2013, and we recognized a related
$1.2 million
tax benefit in fiscal 2017. Additionally, as a result of prior-year tax examinations, we made payments to tax authorities totaling approximately
$23 million
in fiscal 2017.
In fiscal 2016, we incurred
$13.3 million
of acquisition and integration expenses and debt pre-payment fees for which
no
tax benefit was recognized. Of this amount,
$6.4 million
resulted from acquisition expenses that were not tax deductible and
$6.9 million
resulted from integration expenses and debt pre-payment fees incurred in jurisdictions with current and historical net operating losses where the related deferred tax asset was fully reserved. Additionally, during the first quarter of fiscal 2016, the Protecting Americans from Tax Hikes Act of 2015 was signed into law which permanently extended the R&D credit retroactive to January 1, 2015. Our income tax expense for fiscal 2016 included an income tax benefit of
$2.0 million
attributable to operating income during the last nine months of fiscal 2015, primarily related to the retroactive recognition of the R&D credit. Excluding these items, the effective tax rate for fiscal 2016 was
30.9%
.
We are currently under examination by the Internal Revenue Service for fiscal years 2014 through 2016, and by the California Franchise Tax Board for fiscal years 2004 through 2009. We are also subject to various other state audits. With a few exceptions, we are no longer subject to U.S. federal, state and local, or non-U.S. income tax examinations for fiscal years before 2010.
78
Temporary differences comprising the net deferred income tax liability shown on the accompanying consolidated balance sheets were as follows:
|
|
Fiscal Year Ended
|
||||||
|
|
October 1,
2017 |
October 2,
2016 |
|||||
|
|
(in thousands)
|
||||||
|
Deferred Tax Assets:
|
|
|
|
|
|||
|
State taxes
|
$
|
598
|
|
$
|
697
|
|
|
|
Reserves and contingent liabilities
|
2,941
|
|
2,539
|
|
|||
|
Allowance for doubtful accounts
|
4,273
|
|
3,817
|
|
|||
|
Accrued liabilities
|
22,466
|
|
24,663
|
|
|||
|
Stock-based compensation
|
10,069
|
|
10,684
|
|
|||
|
Intangibles
|
—
|
|
—
|
|
|||
|
Loss carry-forwards
|
28,261
|
|
23,514
|
|
|||
|
Valuation allowance
|
(25,326
|
)
|
(25,447
|
)
|
|||
|
Total deferred tax assets
|
43,282
|
|
40,467
|
|
|||
|
Deferred Tax Liabilities:
|
|
|
|
|
|||
|
Unbilled revenue
|
(46,408
|
)
|
(54,638
|
)
|
|||
|
Prepaid expense
|
(6,253
|
)
|
(2,921
|
)
|
|||
|
Intangibles
|
(24,328
|
)
|
(33,268
|
)
|
|||
|
Property and equipment
|
(8,311
|
)
|
(9,358
|
)
|
|||
|
Total deferred tax liability
|
(85,300
|
)
|
(100,185
|
)
|
|||
|
Net deferred tax liabilities
|
$
|
(42,018
|
)
|
$
|
(59,718
|
)
|
|
At October 1, 2017, undistributed earnings of our foreign subsidiaries, primarily in Canada, amounting to approximately
$68.4 million
are expected to be permanently reinvested. Accordingly,
no
provision for U.S. income taxes or foreign withholding taxes has been made. Upon distribution of those earnings, we would be subject to U.S. income taxes and foreign withholding taxes. Assuming the permanently reinvested foreign earnings were repatriated under the laws and rates applicable at October 1, 2017, the incremental federal tax applicable to those earnings would be approximately
$6.2 million
.
At October 1, 2017, we had available unused state net operating loss ("NOL") carry forwards of
$43.7 million
that expire at various dates from 2023 to 2036; and available foreign NOL carry forwards of
$92.9 million
, of which
$28.8 million
expire at various dates from 2023 to 2037, and
$64.0 million
have no expiration date. We have performed an assessment of positive and negative evidence regarding the realization of the deferred tax assets. This assessment included the evaluation of scheduled reversals of deferred tax liabilities, availability of carrybacks, cumulative losses in recent years, and estimates of projected future taxable income. Although realization is not assured, based on our assessment, we have concluded that it is more likely than not that the assets will be realized except for the assets related to the loss carry-forwards and certain foreign intangibles for which a valuation allowance of
$25.3 million
has been provided.
At October 1, 2017, we had
$9.3 million
of unrecognized tax benefits. Included in the balance of unrecognized tax benefits at the end of fiscal year 2017 were
$9.3 million
of tax benefits that, if recognized, would affect our effective tax rate. It is not expected that there will be a significant change in the unrecognized tax benefits in the next
12
months. A reconciliation of the beginning and ending amount of unrecognized tax benefits is as follows:
79
|
|
Fiscal Year Ended
|
||||||||||
|
|
October 1,
2017 |
October 2,
2016 |
September 27,
2015 |
||||||||
|
|
(in thousands)
|
||||||||||
|
Beginning balance
|
$
|
22,786
|
|
$
|
21,618
|
|
$
|
21,717
|
|
||
|
Additions for current year tax positions
|
1,060
|
|
2,802
|
|
1,147
|
|
|||||
|
Additions for prior year tax positions
|
2,365
|
|
1,466
|
|
2,309
|
|
|||||
|
Reductions for prior year tax positions
|
(6,875
|
)
|
(3,100
|
)
|
(23
|
)
|
|||||
|
Settlements
|
(9,999
|
)
|
—
|
|
(3,532
|
)
|
|||||
|
Ending balance
|
$
|
9,337
|
|
$
|
22,786
|
|
$
|
21,618
|
|
||
We recognize potential interest and penalties related to unrecognized tax benefits in income tax expense. During fiscal years 2017 and 2016, we accrued additional interest expense of
$0.4 million
$0.2 million
, respectively, and recorded reductions in accrued interest of
$0.9 million
and
$0 million
, respectively, as a result of audit settlements and other prior-year adjustments. The amount of interest and penalties accrued at October 1, 2017 and October 2, 2016 was
$1.1 million
and
$1.0 million
, respectively.
9
.
Long-Term Debt
Long-term debt consisted of the following:
|
Fiscal Year Ended
|
|||||||
|
October 1,
2017 |
October 2,
2016 |
||||||
|
(in thousands)
|
|||||||
|
Credit facilities
|
$
|
356,438
|
|
$
|
346,813
|
|
|
|
Other
|
433
|
|
198
|
|
|||
|
Total long-term debt
|
356,871
|
|
347,011
|
|
|||
|
Less: Current portion of long-term debt
|
(15,588
|
)
|
(15,510
|
)
|
|||
|
Long-term debt, less current portion
|
$
|
341,283
|
|
$
|
331,501
|
|
|
On May 7, 2013, we entered into a credit agreement that provided for a
$205 million
term loan facility and a
$460 million
revolving credit facility that was scheduled to mature in May 2018. On May 29, 2015, we entered into a third amendment to our credit agreement (as amended, the "Credit Agreement") that extended the maturity date for these facilities to May 2020. The Credit Agreement is a
$654.8 million
senior secured,
five
-year facility that provides for a
$194.8 million
term loan facility (the "Term Loan Facility") and a
$460 million
revolving credit facility (the "Revolving Credit Facility"). The Credit Agreement allows us to, among other things, finance certain permitted open market repurchases of our common stock, permitted acquisitions, and cash dividends and distributions. The Revolving Credit Facility includes a
$150 million
sublimit for the issuance of standby letters of credit, a
$20 million
sublimit for swingline loans, and a
$150 million
sublimit for multicurrency borrowings. The interest rate provisions of the Term Loan Facility and the Revolving Credit Facility did not materially change.
The Term Loan Facility is subject to quarterly amortization of principal, with
$10.3 million
payable in year 1, and
$15.4 million
payable in years 2 through 5. The Term Loan may be prepaid at any time without penalty. We may borrow on the Revolving Credit Facility, at our option, at either (a) a Eurocurrency rate plus a margin that ranges from
1.15%
to
2.00%
per annum, or (b) a base rate for loans in U.S. dollars (the highest of the U.S. federal funds rate plus
0.50%
per annum, the bank's prime rate or the Eurocurrency rate plus
1.00%
) plus a margin that ranges from
0.15%
to
1.00%
per annum. In each case, the applicable margin is based on our Consolidated Leverage Ratio, calculated quarterly. The Term Loan Facility is subject to the same interest rate provisions. The interest rate of the Term Loan Facility at the date of inception was
1.57%
. The Credit Agreement expires on
May 29, 2020
, or earlier at our discretion upon payment in full of loans and other obligations.
As of
October 1, 2017
, we had
$356.4 million
in outstanding borrowings under the Credit Agreement, which was comprised of
$161.4 million
under the Term Loan Facility and
$195.0 million
under the Revolving Credit Facility at a weighted-average interest rate of
2.45%
per annum. In addition, we had
$0.9 million
in standby letters of credit under the Credit Agreement. Our average effective weighted-average interest rate on borrowings outstanding at
October 1, 2017
under the Credit Agreement, including the effects of interest rate swap agreements described in Note 14, "Derivative Financial Instruments", was
2.65%
. At
80
October 1, 2017
, we had
$264.0 million
of available credit under the Revolving Credit Facility, all of which could be borrowed without a violation of our debt covenants. In addition, we entered into agreements with
four
banks to issue standby letters of credit. The aggregate amount of standby letters of credit outstanding under these additional agreements and other bank guarantees was
$23.9 million
, of which
$4.9 million
was issued in currencies other than the U.S. dollar.
The Credit Agreement contains certain affirmative and restrictive covenants, and customary events of default. The financial covenants provide for a maximum Consolidated Leverage Ratio of
3.00
to 1.00 (total funded debt/EBITDA, as defined in the Credit Agreement) and a minimum Consolidated Fixed Charge Coverage Ratio of
1.25
to 1.00 (EBITDA, as defined in the Credit Agreement minus capital expenditures/cash interest plus taxes plus principal payments of indebtedness including capital leases, notes and post-acquisition payments).
At
October 1, 2017
, we were in compliance with these covenants with a consolidated leverage ratio of
1.62
x and a consolidated fixed charge coverage ratio of
2.27
x. Our obligations under the Credit Agreement are guaranteed by certain of our subsidiaries and are secured by first priority liens on (i) the equity interests of certain of our subsidiaries, including those subsidiaries that are guarantors or borrowers under the Credit Agreement, and (ii) our accounts receivable, general intangibles and intercompany loans, and those of our subsidiaries that are guarantors or borrowers.
At the time of the acquisition, Coffey had an existing secured credit facility with a bank, comprised of an overdraft facility, a term facility and a bank guaranty facility. This facility was amended in March 2016 to extend the term to April 2016, and allow for the issuance of a parent guarantee and release of certain subsidiary guarantors. The facility was amended again to provide for a secured AUD
$30 million
facility, which may be used by Coffey for bank overdrafts, short-term cash advances or bank guarantees. This facility expired in April 2017, and prior to its expiration, a new facility was entered into with a new bank to provide for an AUD
$30 million
facility, which may be used by Coffey for bank overdrafts, short-term cash advances or bank guarantees. This facility expires in March 2019 and is secured by a parent guarantee. At
October 1, 2017
, there were
no
borrowings outstanding under this facility; bank guarantees outstanding were
$5.6 million
, which was issued in currencies other than the U.S. dollar.
The following table presents scheduled maturities of our long-term debt:
|
|
Amount
|
||
|
|
(in thousands)
|
||
|
2018
|
$
|
15,588
|
|
|
2019
|
15,595
|
|
|
|
2020
|
325,688
|
|
|
|
2021
|
—
|
|
|
|
2022
|
—
|
|
|
|
Beyond
|
—
|
|
|
|
Total
|
$
|
356,871
|
|
81
10. Leases
We lease office and field equipment, vehicles and buildings under various operating leases. In fiscal
2017
,
2016
and
2015
, we recognized
$71.3 million
,
$75.0 million
and
$66.4 million
of expense associated with operating leases, respectively. The following are amounts payable under non-cancelable operating and capital lease commitments for the next five fiscal years and beyond:
|
|
Operating
|
Capital
|
|||||
|
|
(in thousands)
|
||||||
|
2018
|
$
|
77,854
|
|
$
|
158
|
|
|
|
2019
|
62,634
|
|
211
|
|
|||
|
2020
|
45,906
|
|
—
|
|
|||
|
2021
|
28,740
|
|
—
|
|
|||
|
2022
|
17,261
|
|
—
|
|
|||
|
Beyond
|
21,770
|
|
—
|
|
|||
|
Total
|
$
|
254,165
|
|
$
|
369
|
|
|
|
Less: Amounts representing interest
|
|
|
2
|
|
|||
|
Net present value
|
|
|
$
|
367
|
|
||
We vacated certain facilities under long-term non-cancelable leases and recorded contract termination costs of
$2.9 million
in fiscal
2016
. These amounts were initially measured at the fair value of the portion of the lease payments associated with the vacated facilities, reduced by estimated sublease rentals, less the write off of a prorated portion of existing deferred items previously recognized on these leases. We expect the remaining lease payments to be paid through the various lease expiration dates that continue until 2025.
We initially measured the lease contract termination liability at the fair value of the prorated portion of the lease payments associated with the vacated facilities, reduced by estimated sublease rentals and other costs. If the actual timing and potential termination costs or realization of sublease income differ from our estimates, the resulting liabilities could vary from recorded amounts. These liabilities are reviewed periodically and adjusted when necessary.
The following is a reconciliation of the beginning and ending balances of these liabilities related to lease contract termination costs:
|
|
WEI
|
RME
|
RCM
|
Total
|
|||||||||||
|
|
(in thousands)
|
||||||||||||||
|
Balance at September 27, 2015
|
$
|
531
|
|
$
|
2,461
|
|
$
|
177
|
|
$
|
3,169
|
|
|||
|
Cost transfer between groups
|
637
|
(637)
|
—
|
|
—
|
|
|||||||||
|
Cost incurred and charged to expense
|
1,418
|
|
749
|
—
|
|
2,167
|
|
||||||||
|
Adjustments
(1)
|
(1,034
|
)
|
(1,060)
|
(138
|
)
|
(2,232
|
)
|
||||||||
|
Balance at October 2, 2016
|
1,552
|
|
1,513
|
|
39
|
|
$
|
3,104
|
|
||||||
|
Adjustments
(1)
|
(1,009
|
)
|
(365
|
)
|
(36
|
)
|
(1,410
|
)
|
|||||||
|
Balance at October 1, 2017
|
$
|
543
|
|
$
|
1,148
|
|
$
|
3
|
|
$
|
1,694
|
|
|||
|
(1)
|
Adjustments of the actual timing and potential termination costs or realization of sublease income.
|
11
.
Stockholders' Equity and Stock Compensation Plans
At
October 1, 2017
, we had the following stock-based compensation plans:
|
•
|
Employee Stock Purchase Plan ("ESPP").
Purchase rights to purchase common stock are granted to our eligible full and part-time employees, and shares of common stock are issued upon exercise of the purchase rights. An aggregate of
2,373,290
shares may be issued pursuant to such exercise. The maximum amount that an employee can contribute during a purchase right period is
$5,000
. The exercise price of a purchase right is the lesser of
100%
of the fair market value of a share of common stock on the first day of the purchase right period or
85%
of the fair
|
82
market value on the last day of the purchase right period (December 15, or the business day preceding December 15 if December 15 is not a business day).
|
•
|
2005 Equity Incentive Plan ("2005 EIP").
Key employees and non-employee directors may be granted equity awards, including stock options, restricted stock and restricted stock units ("RSUs"). Options granted before March 6, 2006 vested at
25%
on the first anniversary of the grant date, and the balance vests monthly thereafter, such that these options become fully vested no later than
four years
from the date of grant. These options expire no later than
ten years
from the date of grant. Options granted on and after March 6, 2006 vest at
25%
on each anniversary of the grant date. These options expire no later than
eight years
from the grant date. RSUs granted to date vest at
25%
on each anniversary of the grant date.
|
Our Compensation Committee has also awarded restricted stock to executive officers and non-employee directors under the 2005 EIP. Restricted stock grants generally vest over a minimum
three
-year period, and may be performance-based, determined by EPS growth, or service-based. No awards have made under the 2005 EIP since the adoption of the 2015 Equity Incentive Plan described below.
|
•
|
2015 Equity Incentive Plan ("2015 EIP").
Key employees and non-employee directors may be granted equity awards, including stock options, performance share units ("PSUs") and RSUs. Shares issued with respect to awards granted under the 2015 EIP other than stock options or stock appreciation rights, which are referred to as "full value awards", are counted against the 2015 EIP's aggregate share limit as
three
shares for every share or unit actually issued. At
October 1, 2017
, there were
2.6 million
shares available for future awards pursuant to the 2015 EIP.
|
The stock-based compensation and related income tax benefits were as follows:
|
|
Fiscal Year Ended
|
||||||||||
|
|
October 1,
2017 |
October 2,
2016 |
September 27,
2015 |
||||||||
|
|
(in thousands)
|
||||||||||
|
Total stock-based compensation
|
$
|
13,450
|
|
$
|
12,964
|
|
$
|
10,926
|
|
||
|
Income tax benefit related to stock-based compensation
|
(4,715
|
)
|
(4,656
|
)
|
(3,811
|
)
|
|||||
|
Stock-based compensation, net of tax benefit
|
$
|
8,735
|
|
$
|
8,308
|
|
$
|
7,115
|
|
||
Stock Options
Stock option activity for the fiscal year ended
October 1, 2017
was as follows:
|
|
Number of
Options
(in thousands)
|
Weighted-
Average
Exercise Price
per Share
|
Weighted-
Average
Remaining
Contractual
Term
(in years)
|
Aggregate
Intrinsic Value
(in thousands)
|
||||||||
|
Outstanding on October 2, 2016
|
2,367
|
|
$
|
24.88
|
|
|
|
|
||||
|
Granted
|
183
|
|
40.67
|
|
|
|
|
|||||
|
Exercised
|
(791
|
)
|
44.19
|
|
|
|
|
|||||
|
Forfeited
|
(6
|
)
|
17.72
|
|
|
|
|
|||||
|
Outstanding at October 1, 2017
|
1,753
|
|
27.18
|
|
4.59
|
$
|
33,963
|
|
||||
|
Vested or expected to vest at October 1, 2017
|
1,696
|
|
27.31
|
|
4.50
|
32,640
|
|
|||||
|
Exercisable on October 1, 2017
|
1,242
|
|
25.10
|
|
3.43
|
26,636
|
|
|||||
The aggregate intrinsic value in the table above represents the total intrinsic value (the difference between our closing stock price on the last trading day of fiscal
2017
and the exercise price, times the number of shares) that would have been received by the in-the-money option holders if they had exercised their options on
October 1, 2017
. This amount will change based on the fair market value of our stock. At
October 1, 2017
, we expect to recognize
$3.5 million
of unrecognized compensation cost related to stock option grants over a weighted-average period of
2 years
.
83
The weighted-average fair value of stock options granted during fiscal
2017
,
2016
and
2015
was
$12.35
,
$8.05
and
$8.20
, respectively. The aggregate intrinsic value of options exercised during fiscal
2017
,
2016
and
2015
was
$16.4 million
,
$7.3 million
and
$2.3 million
, respectively.
The fair value of our stock options was estimated on the date of grant using the Black-Scholes option pricing model. The following assumptions were used in the calculation:
|
|
Fiscal Year Ended
|
||||
|
|
October 1,
2017 |
October 2,
2016 |
September 27,
2015 |
||
|
Dividend yield
|
1.0%
|
1.2%
|
1.0%
|
||
|
Expected stock price volatility
|
36.1% - 38.8%
|
36.1% - 38.8%
|
36.2% - 38.8%
|
||
|
Risk-free rate of return, annual
|
1.7% - 1.9%
|
1.6% - 1.8%
|
1.5% - 1.7%
|
||
For purposes of the Black-Scholes model, forfeitures were estimated based on historical experience. For the fiscal
2017
,
2016
and
2015
year-ends, we based our expected stock price volatility on historical volatility behavior and current implied volatility behavior. Our risk-free rate of return was based on constant maturity rates provided by the U.S. Treasury. The expected life was based on historical experience.
Net cash proceeds from the exercise of stock options were
$18.6 million
,
$18.0 million
and
$10.8 million
for fiscal
2017
,
2016
and
2015
, respectively. Our policy is to issue shares from our authorized shares upon the exercise of stock options. The actual income tax benefit realized from exercises of nonqualified stock options and disqualifying dispositions of qualified options for fiscal
2017
,
2016
and
2015
was
$4.9 million
,
$5.3 million
and
$3.0 million
, respectively.
Restricted Stock, PSUs and RSUs
The fair value of the total compensation cost of each restricted stock award was determined at the date of grant using the market price of the underlying common stock as of the date of grant. For performance-based awards, our expected performance is reviewed to estimate the percentage of shares that will vest. The total compensation cost of the awards is then amortized over their applicable vesting period on a straight-line basis.
Restricted stock activity for the fiscal year ended
October 1, 2017
was as follows:
|
|
Number of
Shares
(in thousands)
|
Weighted-
Average Grant
Date Fair
Value
|
||||
|
Nonvested balance at October 2, 2016
|
35
|
|
$
|
28.58
|
|
|
|
Granted
|
14
|
|
28.58
|
|
||
|
Vested
|
(49
|
)
|
28.58
|
|
||
|
Forfeited
|
—
|
|
—
|
|
||
|
Nonvested balance at October 1, 2017
|
—
|
|
—
|
|
||
|
Vested or expected to vest at October 1, 2017
|
—
|
|
—
|
|
||
In fiscal
2017
,
2016
and
2015
, we did not award shares of restricted stock to our executive officers or non-employee directors.
PSU activity for the fiscal year ended
October 1, 2017
was as follows:
|
|
Number of
Shares
(in thousands)
|
Weighted-
Average Grant
Date Fair
Value
|
||||
|
Nonvested balance at October 2, 2016
|
277
|
|
$
|
31.65
|
|
|
|
Granted
|
99
|
|
48.36
|
|
||
|
Nonvested balance at October 1, 2017
|
376
|
|
36.05
|
|
||
84
In fiscal
2017
, we awarded
99,180
PSUs to our executive officers and non-employee directors at the weighted-average fair value of
$48.36
per share on the award date. All of the PSUs are performance-based and vest, if at all, after the conclusion of the
three
-year performance period. The number of PSUs that ultimately vest is based
50%
on the growth in our EPS and
50%
on our relative total shareholder return over the vesting period.
In fiscal
2016
, we awarded
137,777
PSUs to our executive officers and non-employee directors at the weighted-average fair value of
$31.63
per share on the award date. All of the PSUs are performance-based and vest, if at all, after the conclusion of the
three
-year performance period. The number of PSUs that ultimately vest is based
50%
on the growth in our EPS and
50%
on our relative total shareholder return over the vesting period.
RSU activity for the fiscal year ended
October 1, 2017
was as follows:
|
|
Number of
Shares
(in thousands)
|
Weighted-
Average Grant
Date Fair
Value
|
||||
|
Nonvested balance at October 2, 2016
|
499
|
|
$
|
27.16
|
|
|
|
Granted
|
226
|
|
41.00
|
|
||
|
Vested
|
(186
|
)
|
26.98
|
|
||
|
Forfeited
|
(28
|
)
|
30.15
|
|
||
|
Nonvested balance at October 1, 2017
|
511
|
|
33.19
|
|
||
In fiscal
2017
, we also awarded
226,241
RSUs to our key employees and non-employee directors at a weighted average fair value of
$41.00
per share on the award date. All of the RSUs have time-based vesting over a
four
-year period, except that RSUs awarded to directors vest after
one year
. At
October 1, 2017
, there were
510,975
RSUs outstanding. RSU forfeitures result from employment terminations prior to vesting. Forfeited shares return to the pool of authorized shares available for award.
In fiscal
2016
, we awarded
216,539
RSUs to our key employees and non-employee directors at the weighted average fair value of
$27.14
per share on the award date. All of the RSUs have time-based vesting over a
four
-year period, except that RSUs awarded to directors vest after
one year
. At
October 2, 2016
, there were
499,021
RSUs outstanding. RSU forfeitures result from employment terminations prior to vesting. Forfeited RSUs return to the pool of authorized shares available for award.
The stock-based compensation expense related to restricted stock, PSUs and RSUs for fiscal years
2017
,
2016
and
2015
was
$10.6 million
,
$10.3 million
and
$7.5 million
, respectively, and was included in total stock-based compensation expense. At
October 1, 2017
, there was
$15.1 million
of unrecognized compensation costs related to restricted stock, PSUs and RSUs that will be substantially recognized by the end of fiscal 2019.
ESPP
The following table summarizes shares purchased, weighted-average purchase price, cash received and the aggregate intrinsic value for shares purchased under the ESPP:
|
|
Fiscal Year Ended
|
||||||||||
|
|
October 1,
2017 |
October 2,
2016 |
September 27,
2015 |
||||||||
|
|
(in thousands, except for purchase price)
|
||||||||||
|
Shares purchased
|
190
|
|
209
|
|
243
|
|
|||||
|
Weighted-average purchase price
|
$
|
26.02
|
|
$
|
22.54
|
|
$
|
21.44
|
|
||
|
Cash received from exercise of purchase rights
|
$
|
4,940
|
|
$
|
4,707
|
|
$
|
5,204
|
|
||
|
Aggregate intrinsic value
|
$
|
—
|
|
$
|
710
|
|
$
|
1,277
|
|
||
85
The grant date fair value of each award granted under the ESPP was estimated using the Black-Scholes option pricing model with the following assumptions:
|
|
Fiscal Year Ended
|
||||
|
|
October 1,
2017 |
October 2,
2016 |
September 27,
2015 |
||
|
Dividend yield
|
1.0%
|
1.3%
|
1.1%
|
||
|
Expected stock price volatility
|
22.4%
|
23.7%
|
23.7%
|
||
|
Risk-free rate of return, annual
|
0.9%
|
0.2%
|
0.2%
|
||
|
Expected life (in years)
|
1
|
1
|
1
|
||
For fiscal
2017
,
2016
and
2015
, we based our expected stock price volatility on historical volatility behavior and current implied volatility behavior. The risk-free rate of return was based on constant maturity rates provided by the U.S. Treasury. The expected life was based on the ESPP terms and conditions.
Included in stock-based compensation expense for fiscal
2017
,
2016
and
2015
was
$0.5 million
,
$0.4 million
and
$0.6 million
, respectively, related to the ESPP. The unrecognized stock-based compensation costs for awards granted under the ESPP at
October 1, 2017
and
October 2, 2016
were
$0.1 million
and
$0.1 million
, respectively. At
October 1, 2017
, ESPP participants had accumulated
$3.1 million
to purchase our common stock.
12. Retirement Plans
We have established defined contribution plans including 401(k) plans. Generally, employees are eligible to participate in the defined contribution plans upon completion of
one
year of service and in the 401(k) plans upon commencement of employment. For fiscal
2017
,
2016
and
2015
, employer contributions to the plans were
$11.4 million
,
$10.7 million
and
$9.8 million
, respectively.
We have established a non-qualified deferred compensation plan for certain key employees and non-employee directors. Eligible employees and non-employee directors may elect to defer the receipt of salary, incentive payments, restricted stock, PSU and RSU awards, and non-employee director fees, which are generally invested by us in individual variable life insurance contracts we own that are designed to informally fund savings plans of this nature. At
October 1, 2017
and
October 2, 2016
, the consolidated balance sheets reflect assets of
$25.0 million
and
$20.9 million
, respectively, related to the deferred compensation plan in "Other long-term assets," and liabilities of
$25.2 million
and
$20.8 million
, respectively, related to the deferred compensation plan in "Other long-term liabilities."
13. Earnings Per Share
The following table sets forth the number of weighted-average shares used to compute basic and diluted EPS:
|
Fiscal Year Ended
|
|||||||||||
|
October 1,
2017 |
October 2,
2016 |
September 27,
2015 |
|||||||||
|
(in thousands, except per share data)
|
|||||||||||
|
Net income attributable to Tetra Tech
|
$
|
117,874
|
|
$
|
83,783
|
|
$
|
39,074
|
|
||
|
Weighted-average common shares outstanding – basic
|
56,911
|
|
58,186
|
|
60,913
|
|
|||||
|
Effect of diluted stock options and unvested restricted stock
|
1,002
|
|
780
|
|
619
|
|
|||||
|
Weighted-average common stock outstanding – diluted
|
57,913
|
|
58,966
|
|
61,532
|
|
|||||
|
Earnings per share attributable to Tetra Tech:
|
|
|
|
|
|
|
|||||
|
Basic
|
$
|
2.07
|
|
$
|
1.44
|
|
$
|
0.64
|
|
||
|
Diluted
|
$
|
2.04
|
|
$
|
1.42
|
|
$
|
0.64
|
|
||
For fiscal 2017 and 2016,
no
options were excluded from the calculation of dilutive potential common shares. For fiscal
2015
,
1.0 million
options were excluded from the calculation of dilutive potential common shares. These options were not included in the computation of dilutive potential common shares because the assumed proceeds per share exceeded the average market price per share for that period. Therefore, their inclusion would have been anti-dilutive.
86
14
.
Derivative Financial Instruments
We use certain interest rate derivative contracts to hedge interest rate exposures on our variable rate debt. We enter into foreign currency derivative contracts with financial institutions to reduce the risk that cash flows and earnings will be adversely affected by foreign currency exchange rate fluctuations. Our hedging program is not designated for trading or speculative purposes.
We recognize derivative instruments as either assets or liabilities on the accompanying consolidated balance sheets at fair value. We record changes in the fair value (i.e., gains or losses) of the derivatives that have been designated as cash flow hedges in our consolidated balance sheets as accumulated other comprehensive income (loss), and in our consolidated statements of income for those derivatives designated as fair value hedges.
In fiscal 2013, we entered into
three
interest rate swap agreements that we have designated as cash flow hedges to fix the variable interest rates on a portion of borrowings under our term loan facility. In the first quarter of fiscal 2014, we entered into
two
interest rate swap agreements that we designated as cash flow hedges to fix the variable interest rates on the borrowings under our term loan facility. At
October 1, 2017
and
October 2, 2016
, the effective portion of our interest rate swap agreements designated as cash flow hedges before tax effect was
$(0.05) million
and
$1.6 million
, respectively, all of which we expect to be reclassified from accumulated other comprehensive income (loss) to interest expense within the next
12
months.
As of
October 1, 2017
, the notional principal, fixed rates and related expiration dates of our outstanding interest rate swap agreements are as follows:
|
Notional Amount
(in thousands)
|
Fixed
Rate
|
Expiration
Date
|
||
|
$40,359
|
1.36%
|
May 2018
|
||
|
40,359
|
1.34%
|
May 2018
|
||
|
40,359
|
1.35%
|
May 2018
|
||
|
20,180
|
1.23%
|
May 2018
|
||
|
20,180
|
1.24%
|
May 2018
|
||
The fair values of our outstanding derivatives designated as hedging instruments were as follows:
|
Fair Value of Derivative
Instruments as of
|
|||||||||
|
Balance Sheet Location
|
October 1,
2017 |
October 2,
2016 |
|||||||
|
(in thousands)
|
|||||||||
|
Interest rate swap agreements
|
Other current assets (liabilities)
|
$
|
49
|
|
$
|
(1,572
|
)
|
||
The impact of the effective portions of derivative instruments in cash flow hedging relationships and fair value relationships on income and other comprehensive income was immaterial for the fiscal years ended
October 1, 2017
and
October 2, 2016
. Additionally, there were
no
ineffective portions of derivative instruments. Accordingly,
no
amounts were excluded from effectiveness testing for our interest rate swap agreements. We had
no
derivative instruments that were not designated as hedging instruments for fiscal
2017
,
2016
and
2015
.
87
15. Reclassifications Out of Accumulated Other Comprehensive Income (Loss)
The accumulated balances and reporting period activities for fiscal
2017
and
2016
related to reclassifications out of accumulated other comprehensive income (loss) are summarized as follows:
|
|
Foreign
Currency
Translation
Adjustments
|
Gain (Loss)
on Derivative
Instruments
|
Accumulated
Other
Comprehensive
Income (Loss)
|
||||||||
|
|
(in thousands)
|
||||||||||
|
Balances at September 27, 2015
|
$
|
(141,229
|
)
|
$
|
(1,942
|
)
|
$
|
(143,171
|
)
|
||
|
Other comprehensive income before reclassifications
|
14,389
|
|
2,718
|
|
17,107
|
|
|||||
|
Amounts reclassified from accumulated other comprehensive income
|
|
|
|
|
|
|
|||||
|
Interest rate contracts, net of tax
(1)
|
—
|
|
(1,944
|
)
|
(1,944
|
)
|
|||||
|
Net current-period other comprehensive income
|
14,389
|
|
774
|
|
15,163
|
|
|||||
|
Balances at October 2, 2016
|
$
|
(126,840
|
)
|
$
|
(1,168
|
)
|
$
|
(128,008
|
)
|
||
|
Other comprehensive income before reclassifications
|
27,894
|
|
2,363
|
|
30,257
|
|
|||||
|
Amounts reclassified from accumulated other comprehensive income
|
|
|
|
|
|
|
|||||
|
Interest rate contracts, net of tax
(1)
|
—
|
|
(749
|
)
|
(749
|
)
|
|||||
|
Net current-period other comprehensive income
|
27,894
|
|
1,614
|
|
29,508
|
|
|||||
|
Balances at October 1, 2017
|
$
|
(98,946
|
)
|
$
|
446
|
|
$
|
(98,500
|
)
|
||
|
(1)
|
This accumulated other comprehensive component is reclassified to "Interest expense" in our consolidated statements of income. See Note
14
, "
Derivative Financial Instruments
", for more information.
|
16. Fair Value Measurements
Derivative Instruments.
For additional information about our derivative financial instruments (see Note
2
, "
Basis of Presentation and Preparation
" and Note
14
, "
Derivative Financial Instruments
").
Contingent Consideration.
We measure our contingent earn-out liabilities at fair value on a recurring basis (see Note
2
, "
Basis of Presentation and Preparation
" and Note
5
, "
Mergers and Acquisitions
" for further information).
Debt.
The fair value of long-term debt was determined using the present value of future cash flows based on the borrowing rates currently available for debt with similar terms and maturities (Level 2 measurement, as described in Note
2
, "
Basis of Presentation and Preparation
– Fair Value of Financial Instruments"). The carrying value of our long-term debt approximated fair value at
October 1, 2017
and
October 2, 2016
. At
October 1, 2017
, we had borrowings of
$356.4 million
outstanding under our Credit Agreement, which were used to fund our business acquisitions, working capital needs, capital expenditures and contingent earn-outs (see Note
9
, "
Long-Term Debt
" for more information).
17
.
Commitments and Contingencies
We are subject to certain claims and lawsuits typically filed against the engineering, consulting and construction profession, alleging primarily professional errors or omissions. We carry professional liability insurance, subject to certain deductibles and policy limits, against such claims. However, in some actions, parties are seeking damages that exceed our insurance coverage or for which we are not insured. While management does not believe that the resolution of these claims will have a material adverse effect, individually or in aggregate, on our financial position, results of operations or cash flows, management acknowledges the uncertainty surrounding the ultimate resolution of these matters.
18
.
Reportable Segments
Our reportable segments are described as follows:
WEI:
WEI provides consulting and engineering services worldwide for a broad range of water and infrastructure-related needs in both developed and emerging economies. WEI supports both public and private clients including federal, state/provincial, and local governments, and global and local commercial clients. The primary markets for WEI’s services include water resources analysis and water management, environmental restoration, government consulting, and a broad range of civil infrastructure master planning and engineering design for facilities, transportation, and regional and local development. WEI’s services span from early
88
data collection and monitoring, to data analysis and information technology, to science and engineering applied research, to engineering design, to construction management and operations and maintenance.
RME:
RME provides consulting and engineering services worldwide for a broad range of resource management and energy needs. RME supports both private and public clients, including global industrial and commercial clients, U.S. federal agencies in large scale remediation, and major international development agencies. The primary markets for RME’s services include natural resources, energy, international development, remediation, waste management and utilities. RME’s services span from early data collection and monitoring, to data analysis and information technology, to science and engineering applied research, to engineering design, to construction management and operations and maintenance. RME also supports engineering, procurement and construction management (“EPCM”) for full service implementation of commercial projects.
RCM:
We report the results of the wind-down of our non-core construction activities in the RCM reportable segment. The remaining work to be performed in this segment will be substantially completed in calendar 2017.
Management evaluates the performance of these reportable segments based upon their respective segment operating income before the effect of amortization expense related to acquisitions, and other unallocated corporate expenses. We account for inter-segment sales and transfers as if the sales and transfers were to third parties; that is, by applying a negotiated fee onto the costs of the services performed. All significant intercompany balances and transactions are eliminated in consolidation. In fiscal
2016
, the Corporate segment operating losses included
$19.5 million
of acquisition and integration expenses, as described in Note
5
, "
Mergers and Acquisitions
".
The following tables set forth summarized financial information concerning our reportable segments:
Reportable Segments
|
|
Fiscal Year Ended
|
||||||||||
|
|
October 1,
2017 |
October 2,
2016 |
September 27,
2015 |
||||||||
|
|
(in thousands)
|
||||||||||
|
Revenue
|
|
|
|
|
|
|
|||||
|
WEI
|
$
|
1,146,366
|
|
$
|
1,028,281
|
|
$
|
993,631
|
|
||
|
RME
|
1,666,364
|
|
1,569,702
|
|
1,282,046
|
|
|||||
|
RCM
|
18,207
|
|
52,150
|
|
86,575
|
|
|||||
|
Elimination of inter-segment revenue
|
(77,577
|
)
|
(66,664
|
)
|
(62,931
|
)
|
|||||
|
Total revenue
|
$
|
2,753,360
|
|
$
|
2,583,469
|
|
$
|
2,299,321
|
|
||
|
Operating Income (Loss)
|
|||||||||||
|
WEI
|
$
|
117,894
|
|
$
|
95,996
|
|
$
|
93,142
|
|
||
|
RME
|
111,122
|
|
112,202
|
|
93,359
|
|
|||||
|
RCM
|
(14,712
|
)
|
(11,834
|
)
|
(8,614
|
)
|
|||||
|
Corporate
(1)
|
(30,962
|
)
|
(60,509
|
)
|
(90,203
|
)
|
|||||
|
Total operating income
|
$
|
183,342
|
|
$
|
135,855
|
|
$
|
87,684
|
|
||
|
Depreciation
|
|||||||||||
|
WEI
|
$
|
4,690
|
|
$
|
4,797
|
|
$
|
5,335
|
|
||
|
RME
|
15,142
|
|
15,703
|
|
13,342
|
|
|||||
|
RCM
|
1,062
|
|
736
|
|
1,801
|
|
|||||
|
Corporate
|
1,313
|
|
1,520
|
|
2,632
|
|
|||||
|
Total depreciation
|
$
|
22,207
|
|
$
|
22,756
|
|
$
|
23,110
|
|
||
|
(1)
|
Includes goodwill and other intangible assets impairment charges, amortization of intangibles, other costs and other income not allocable to segments. The impairment charges of
$60.8 million
for fiscal
2015
was recorded at Corporate. The intangible asset amortization expense for fiscal
2017
,
2016
and
2015
was
22.8 million
,
$22.1 million
and
20.2 million
, respectively. Corporate results also included income (loss) for fair value adjustments to contingent consideration liabilities of
6.9 million
,
$(2.8) million
and
$3.1 million
for fiscal
2017
,
2016
and
2015
, respectively. Fiscal
2016
also included
19.5 million
of acquisition and integration related expenses recorded at Corporate.
|
89
|
|
October 1,
2017 |
October 2,
2016 |
|||||
|
|
(in thousands)
|
||||||
|
Total Assets
|
|
|
|
|
|||
|
WEI
|
$
|
354,709
|
|
$
|
308,438
|
|
|
|
RME
|
555,485
|
|
522,895
|
|
|||
|
RCM
|
33,620
|
|
39,107
|
|
|||
|
Corporate
(1)
|
958,931
|
|
930,339
|
|
|||
|
Total assets
|
$
|
1,902,745
|
|
$
|
1,800,779
|
|
|
|
(1)
|
Corporate assets consist of intercompany eliminations and assets not allocated to segments including goodwill, intangible assets, deferred income taxes and certain other assets.
|
Geographic Information
|
|
Fiscal Year Ended
|
||||||||||||||||||||||
|
|
October 1, 2017
|
October 2, 2016
|
September 27, 2015
|
||||||||||||||||||||
|
|
Revenue
|
Long-Lived
Assets
(2)
|
Revenue
|
Long-Lived
Assets
(2)
|
Revenue
|
Long-Lived
Assets
(2)
|
|||||||||||||||||
|
United States
|
$
|
2,018,841
|
|
$
|
58,965
|
|
$
|
1,858,551
|
|
$
|
59,334
|
|
$
|
1,734,439
|
|
$
|
61,526
|
|
|||||
|
Foreign countries
(1)
|
734,519
|
|
34,183
|
|
724,918
|
|
39,067
|
|
564,882
|
|
32,230
|
|
|||||||||||
|
(1)
|
Includes revenue generated from our foreign operations, primarily in Canada and Australia, and revenue generated from non-U.S. clients. Long-lived assets consist primarily of amounts from our Canadian operations.
|
|
(2)
|
Excludes goodwill and other intangible assets.
|
Major Clients
Other than the U.S. federal government, we had
no
single client that accounted for more than
10%
of our revenue. All of our segments generated revenue from all client sectors.
The following table presents our revenue by client sector:
|
|
Fiscal Year Ended
|
||||||||||
|
|
October 1,
2017 |
October 2,
2016 |
September 27,
2015 |
||||||||
|
(in thousands)
|
|||||||||||
|
Client Sector
|
|
|
|
|
|
|
|||||
|
International
(1)
|
$
|
734,519
|
|
$
|
724,918
|
|
$
|
564,882
|
|
||
|
U.S commercial
|
764,643
|
|
763,443
|
|
736,815
|
|
|||||
|
U.S. federal government
(2)
|
901,136
|
|
784,368
|
|
709,600
|
|
|||||
|
U.S. state and local government
|
353,062
|
|
310,740
|
|
288,024
|
|
|||||
|
Total
|
$
|
2,753,360
|
|
$
|
2,583,469
|
|
$
|
2,299,321
|
|
||
|
(1)
|
Includes revenue generated from foreign operations, primarily in Canada and Australia, and revenue generated from non-U.S. clients.
|
|
(2)
|
Includes revenue generated under U.S. federal government contracts performed outside the United States.
|
19. Quarterly Financial Information – Unaudited
In the opinion of management, the following unaudited quarterly data for the fiscal years ended
October 1, 2017
and
October 2, 2016
reflect all adjustments necessary for a fair statement of the results of operations.
90
In fiscal
2016
, we incurred Coffey-related acquisition and integration expenses totaling
$19.5 million
. These costs were recognized in the second, third, and fourth quarters of fiscal
2016
in the amounts of
$15.9 million
,
$1.0 million
, and
$2.6 million
, respectively. In addition, interest expense in fiscal
2016
includes Coffey-related debt pre-payment fees of
$1.9 million
that were incurred in the second quarter.
|
|
First
Quarter
|
Second
Quarter
|
Third
Quarter
|
Fourth
Quarter
|
|||||||||||
|
|
(in thousands, except per share data)
|
||||||||||||||
|
Fiscal Year 2017
|
|
|
|
|
|
|
|
|
|||||||
|
Revenue
|
$
|
668,851
|
|
$
|
663,781
|
|
$
|
685,539
|
|
$
|
735,188
|
|
|||
|
Operating income
|
39,855
|
|
42,956
|
|
45,884
|
|
54,647
|
|
|||||||
|
Net income attributable to Tetra Tech
|
26,562
|
|
26,862
|
|
29,983
|
|
34,467
|
|
|||||||
|
Earnings per share attributable to Tetra Tech
(1)
:
|
|
|
|
|
|
|
|
|
|||||||
|
Basic
|
$
|
0.47
|
|
$
|
0.47
|
|
$
|
0.52
|
|
$
|
0.61
|
|
|||
|
Diluted
|
$
|
0.46
|
|
$
|
0.46
|
|
$
|
0.52
|
|
$
|
0.60
|
|
|||
|
Weighted-average common shares outstanding:
|
|
|
|
|
|
|
|
|
|||||||
|
Basic
|
57,099
|
|
57,270
|
|
57,184
|
|
56,338
|
|
|||||||
|
Diluted
|
58,145
|
|
58,270
|
|
58,161
|
|
57,326
|
|
|||||||
|
Fiscal Year 2016
|
|
|
|
|
|
|
|
|
|||||||
|
Revenue
|
$
|
560,708
|
|
$
|
627,384
|
|
$
|
666,869
|
|
$
|
728,508
|
|
|||
|
Operating income
|
32,930
|
|
16,650
|
|
39,085
|
|
47,190
|
|
|||||||
|
Net income attributable to Tetra Tech
|
23,239
|
|
3,744
|
|
25,694
|
|
31,106
|
|
|||||||
|
Earnings per share attributable to Tetra Tech
(1)
:
|
|
|
|
|
|
|
|
|
|||||||
|
Basic
|
$
|
0.39
|
|
$
|
0.06
|
|
$
|
0.44
|
|
$
|
0.54
|
|
|||
|
Diluted
|
$
|
0.39
|
|
$
|
0.06
|
|
$
|
0.44
|
|
$
|
0.53
|
|
|||
|
Weighted-average common shares outstanding:
|
|
|
|
|
|
|
|
|
|||||||
|
Basic
|
59,058
|
|
58,451
|
|
57,796
|
|
57,309
|
|
|||||||
|
Diluted
|
59,793
|
|
59,131
|
|
58,616
|
|
58,192
|
|
|||||||
|
(1)
|
The sum of the quarterly EPS may not add up to the full-year EPS due to rounding
.
|
91
None.
Evaluation of disclosure controls and procedures and changes in internal control over financial reporting
At
October 1, 2017
, we carried out an evaluation of the effectiveness of the design and operation of our disclosure controls and procedures. Based on our management's evaluation (with the participation of our principal executive officer and principal financial officer), our principal executive officer and principal financial officer have concluded that, as of the end of the period covered by this report, our disclosure controls and procedures (as defined in Rules 13a-15(e) and 15d-15(e) under the Exchange Act), were effective.
Management's Report on Internal Control over Financial Reporting
Our management is responsible for establishing and maintaining adequate internal control over financial reporting. As defined in Exchange Act Rule 13a-15(f), internal control over financial reporting is a process designed by, or under the supervision of, our principal executive and principal financial officer and effected by our Board of Directors, management and other personnel to provide reasonable assurance regarding the reliability of financial reporting and the preparation of consolidated financial statements for external purposes in accordance with U.S. GAAP. Internal controls include those policies and procedures that (i) pertain to the maintenance of records that in reasonable detail accurately and fairly reflect the transactions and dispositions of our assets; (ii) provide reasonable assurance that transactions are recorded as necessary to permit preparation of financial statements in accordance with U.S. GAAP and that our receipts and expenditures are being made only in accordance with authorizations of our management and directors; and (iii) provide reasonable assurance regarding prevention or timely detection of unauthorized acquisition, use or disposition of our assets that could have a material effect on our consolidated financial statements. Because of its inherent limitations, internal control over financial reporting may not prevent or detect misstatements. Also, projections of any evaluation of effectiveness to future periods are subject to the risk that controls may become inadequate because of changes in conditions, or that the degree of compliance with the policies or procedures may deteriorate. Accordingly, even effective internal control over financial reporting can only provide reasonable assurance of achieving their control objectives.
Under the supervision and with the participation of our management, including our Chief Executive Officer and Chief Financial Officer, we assessed the effectiveness of our internal control over financial reporting at
October 1, 2017
, based on the criteria in
Internal Control – Integrated Framework
(2013) issued by the COSO. Based upon this assessment, management has concluded that our internal control over financial reporting was effective at
October 1, 2017
, at a reasonable assurance level.
PricewaterhouseCoopers LLP, the independent registered public accounting firm that audited the consolidated financial statements included in this Form 10-K, has issued a report on our internal control over financial reporting. This report, dated
November 20, 2017
, appears on page 57 of this Form 10-K.
Changes in Internal Control over Financial Reporting
There were no changes in our internal control over financial reporting during the three months ended
October 1, 2017
that have materially affected, or are reasonably likely to materially affect, our internal control over financial reporting.
None.
The information required by this item relating to our directors and nominees, regarding compliance with Section 16(a) of the Exchange Act, and regarding our Audit Committee is included under the captions "Item No. 1 – Election of Directors" and "Section 16(a) Beneficial Ownership Reporting Compliance" in our Proxy Statement related to the 2018 Annual Meeting of Stockholders and is incorporated by reference.
Pursuant to General Instruction G(3) of Form 10-K, the information required by this item relating to our executive officers is included under the caption "Executive Officers of the Registrant" in Part I of this Report.
We have adopted a code of ethics that applies to our principal executive officer and all members of our finance department, including our principal financial officer and principal accounting officer. This code of ethics, entitled "Finance Code of Professional Conduct," is posted on our website. The Internet address for our website is www.tetratech.com, and the code of ethics may be found through a link to the Investor Relations section of our website.
92
We intend to satisfy the disclosure requirement under Item 5.05 of Form 8-K for any amendment to, or waiver from, a provision of this code of ethics by posting any such information on our website, at the address and location specified above.
The information required by this item is included under the captions "Item No. 1 – Election of Directors" and "Executive Compensation Tables" in our Proxy Statement related to the 2018 Annual Meeting of Stockholders and is incorporated by reference.
The information required by this item relating to security ownership of certain beneficial owners and management, and securities authorized for issuance under equity compensation plans, is included under the caption "Security Ownership of Management and Significant Stockholders" in our Proxy Statement related to the 2018 Annual Meeting of Stockholders and is incorporated by reference.
The information required by this item relating to review, approval or ratification of transactions with related persons is included under the caption "Related Person Transactions," and the information required by this item relating to director independence is included under the caption "Item No. 1 – Election of Directors," in each case in our Proxy Statement related to the 2018 Annual Meeting of Stockholders and is incorporated by reference.
The information required by this item is included under the caption "Item No. 4 – Ratification of Independent Registered Public Accounting Firm" in our Proxy Statement related to the 2018 Annual Meeting of Stockholders and is incorporated by reference.
|
(a.)
|
1.
|
Financial Statements
|
|
|
|
The Index to Financial Statements and Financial Statement Schedule on page
56
is incorporated by reference as the list of financial statements required as part of this Report.
|
|
|
2.
|
Financial Statement Schedule
|
|
|
|
The Index to Financial Statements and Financial Statement Schedule on page
56
is incorporated by reference as the list of financial statement schedules required as part of this Report.
|
|
|
3.
|
Exhibits
|
|
|
|
The exhibit list in the Index to Exhibits on pages
95
is incorporated by reference as the list of exhibits required as part of this Report.
|
93
TETRA TECH, INC.
SCHEDULE II – VALUATION AND QUALIFYING ACCOUNTS AND RESERVES
For the Fiscal Years Ended
September 27, 2015
,
October 2, 2016
and
October 1, 2017
(in thousands)
|
|
Balance at
Beginning of
Period
|
Charged to
Costs, Expenses
and Revenue
|
Deductions
(1)
|
Other
(2)
|
Balance at
End of Period
|
|||||||||||||||
|
Allowance for doubtful accounts:
|
||||||||||||||||||||
|
Fiscal 2015
|
$
|
39,780
|
|
$
|
(1,034
|
)
|
$
|
(5,965
|
)
|
(1,291
|
)
|
$
|
31,490
|
|
||||||
|
Fiscal 2016
|
31,490
|
|
8,082
|
|
(12,191
|
)
|
7,852
|
|
35,233
|
|
||||||||||
|
Fiscal 2017
|
35,233
|
|
2,848
|
|
(6,233
|
)
|
411
|
|
32,259
|
|
||||||||||
|
Income tax valuation allowance:
|
||||||||||||||||||||
|
Fiscal 2015
|
$
|
7,576
|
|
$
|
4,609
|
|
$
|
—
|
|
$
|
(4,394
|
)
|
$
|
7,791
|
|
|||||
|
Fiscal 2016
|
7,791
|
|
3,856
|
|
—
|
|
13,800
|
|
25,447
|
|
||||||||||
|
Fiscal 2017
|
25,447
|
|
(121
|
)
|
—
|
|
—
|
|
25,326
|
|
||||||||||
|
(1)
|
Primarily represents uncollectible accounts written off, net of recoveries.
|
|
(2)
|
Includes allowances from new business acquisitions, loss in foreign jurisdictions, currency adjustments, and valuation allowance adjustments related to net operating loss carry-forwards
.
|
94
INDEX TO EXHIBITS
|
3.1
|
|
|
|
3.2
|
|
|
|
10.1
|
|
|
|
10.2
|
|
|
|
10.3
|
|
|
|
10.4
|
|
|
|
10.5
|
|
|
|
10.6
|
|
|
|
10.7
|
|
|
|
10.8
|
|
|
|
10.9
|
|
|
|
10.10
|
|
|
|
10.11
|
|
|
95
|
10.12
|
|
|
|
10.13
|
|
|
|
10.14
|
|
|
|
10.15
|
|
|
|
10.16
|
|
|
|
10.17
|
|
|
|
10.18
|
|
|
|
10.19
|
|
|
|
10.20
|
|
|
|
21
|
|
|
|
23
|
|
|
|
24
|
|
|
|
31.1
|
|
|
|
31.2
|
|
|
|
32.1
|
|
|
|
32.2
|
|
|
|
95
|
|
|
|
101
|
|
The following financial information from our Company's Annual Report on Form 10-K, for the period ended October 1, 2017, formatted in eXtensible Business Reporting Language: (i) Consolidated Balance Sheets, (ii) Consolidated Statements of Income, (iii) Consolidated Statement of Comprehensive Income (Loss), (iv) Consolidated Statements of Equity, (v) Consolidated Statements of Cash Flows, (vi) Notes to Consolidated Financial Statements.+(1)
|
_______________________________________________________________________________
|
*
|
|
Indicates a management contract or compensatory arrangement.
|
|
+
|
|
Filed herewith.
|
|
(1
|
)
|
Pursuant to Rule 406T of Regulation S-T, the XBRL related information in Exhibit 101 to this Annual Report on Form 10-K shall not be deemed to be "filed" for purposes of Section 18 of the Exchange Act or otherwise subject to the liability of the section, and shall not be deemed part of a registration statement, prospectus or other document filed under the Securities Act or the Exchange Act, except as shall be expressly set forth by specific reference in such filings.
|
96
SIGNATURES
Pursuant to the requirements of Section 13 or 15(d) of the Securities Exchange Act of 1934, the registrant has duly caused this Report on Form 10-K to be signed on its behalf by the undersigned, thereunto duly authorized.
|
|
TETRA TECH, INC.
|
|
|
|
By:
|
/s/ DAN L. BATRACK
|
|
Date: November 15, 2017
|
|
Dan L. Batrack
Chairman, Chief Executive Officer and President
|
POWER OF ATTORNEY
KNOW ALL PERSONS BY THESE PRESENTS, that each person whose signature appears below constitutes and appoints Dan L. Batrack and Steven M. Burdick, jointly and severally, his attorney-in-fact, each with the full power of substitution, for such person, in any and all capacities, to sign any and all amendments to this Annual Report on Form 10-K, and to file the same, with all exhibits thereto and other documents in connection therewith, with the Securities and Exchange Commission, granting unto said attorney-in-fact and agent full power and authority to do and perform each and every act and thing requisite and necessary to be done in connection therewith, as fully to all intents and purposes as he might do or could do in person, hereby ratifying and confirming all that each of said attorneys-in-fact and agents, or his substitute, may do or cause to be done by virtue hereof.
Pursuant to the requirements of the Securities Exchange Act of 1934, this Report on Form 10-K has been signed below by the following persons on behalf of the registrant and in the capacities and on the dates indicated.
|
Signature
|
|
Title
|
|
Date
|
|
/s/ DAN L. BATRACK |
|
Chairman, Chief Executive Officer and President
|
|
November 15, 2017
|
|
Dan L. Batrack
|
|
(Principal Executive Officer)
|
|
|
|
/s/ STEVEN M. BURDICK |
|
Chief Financial Officer
|
|
November 15, 2017
|
|
Steven M. Burdick
|
|
(Principal Financial Officer)
|
|
|
|
/s/ BRIAN N. CARTER |
|
Senior Vice President, Corporate Controller
|
|
November 15, 2017
|
|
Brian N. Carter
|
|
(Principal Accounting Officer)
|
|
|
|
/s/ ALBERT E. SMITH |
|
Director
|
|
November 15, 2017
|
|
Albert E. Smith
|
|
|
|
|
|
/s/ HUGH M. GRANT |
|
Director
|
|
November 15, 2017
|
|
Hugh M. Grant
|
|
|
|
|
|
/s/ PATRICK C. HADEN |
|
Director
|
|
November 15, 2017
|
|
Patrick C. Haden
|
|
|
|
|
|
/s/ J. CHRISTOPHER LEWIS |
|
Director
|
|
November 15, 2017
|
|
J. Christopher Lewis
|
|
|
|
|
|
/s/ JOANNE M. MAGUIRE |
|
Director
|
|
November 15, 2017
|
|
Joanne M. Maguire
|
|
|
|
|
|
/s/ J. KENNETH THOMPSON |
|
Director
|
|
November 15, 2017
|
|
J. Kenneth Thompson
|
|
|
|
|
|
/s/ KIRSTEN M. VOLPI |
|
Director
|
|
November 15, 2017
|
|
Kirsten M. Volpi
|
|
|
|
|
|
/s/ KIMBERLY E. RITRIEVI |
|
Director
|
|
November 15, 2017
|
|
Kimberly E. Ritrievi
|
|
|
|
|
97
TABLE OF CONTENTS
Part IItem 1. BusinessItem 1A. Risk FactorsItem 1B Unresolved Staff CommentsItem 2. PropertiesItem 3. Legal ProceedingsItem 4. Mine Safety DisclosuresPart IIItem 5. Market For Registrant's Common Equity, Related Stockholder Matters and Issuer Purchases Of Equity SecuritiesItem 6. Selected Financial DataItem 7. Management's Discussion and Analysis Of Financial Condition and Results Of OperationsItem 7A. Quantitative and Qualitative Disclosures About Market RiskItem 8. Financial Statements and Supplementary DataItem 9. Changes in and Disagreements with Accountants on Accounting and Financial DisclosureItem 9A. Controls and ProceduresItem 9B. Other InformationPart IIIItem 10. Directors, Executive Officers and Corporate GovernanceItem 11. Executive CompensationItem 12. Security Ownership Of Certain Beneficial Owners and Management and Related Stockholder MattersItem 13. Certain Relationships and Related Transactions, and Director IndependenceItem 14. Principal Accounting Fees and ServicesPart IVItem 15. Exhibits, Financial Statement Schedules