MAMMOTH ENERGY SERVICES, INC.
10-Ks and 10-Qs
|
|
|
|
|
|
|
|
|
|
|
|
|
|
|
|
|
|
|
|
|
|
|
|
|
|
|
|
|
|
|
|
|
|
|
|
|
|
|
|
|
|
|
|
|
|
|
|
|
|
|
|
|
|
|
|
|
|
|
|
|
|
|
|
|
|
|
|
|
|
|
|
|
|
|
|
|
|
|
|
|
|
|
|
|
|
|
|
|
|
|
|
|
|
|
|
|
|
|
|
|
|
|
|
|
|
|
|
|
|
|
|
|
|
|
|
|
|
|
|
|
|
|
|
|
|
|
|
|
|
|
|
|
|
|
|
|
|
|
|
|
|
|
|
|
|
|
|
UNITED STATES
SECURITIES AND EXCHANGE COMMISSION
Washington, D.C. 20549
Form 10-K
|
ý
|
ANNUAL REPORT PURSUANT TO SECTION 13 OR 15(d) OF THE SECURITIES EXCHANGE ACT OF 1934
|
FOR THE FISCAL YEAR ENDED DECEMBER 31, 2018
|
o
|
TRANSITION REPORT PURSUANT TO SECTION 13 OR 15(d) OF THE SECURITIES EXCHANGE ACT OF 1934
|
Commission File No. 001-37917
Mammoth Energy Services, Inc.
(Exact name of registrant as specified in its charter)
|
Delaware
|
|
32-0498321
|
|
(State or other jurisdiction of
incorporation or organization)
|
|
(I.R.S. Employer
Identification No.)
|
|
|
|
|
|
14201 Caliber Drive, Suite 300
Oklahoma City, Oklahoma
|
(405) 608-6007
|
73134
|
|
(Address of principal executive offices)
|
(Registrant’s telephone number, including area code)
|
(Zip Code)
|
|
Securities registered pursuant to Section 12(b) of the Act:
|
||
|
Title of Each Class
|
Name of Each Exchange on Which Registered
|
|
|
Common Stock, par value $0.01 per share
|
The Nasdaq Stock Market LLC
|
|
|
Securities registered pursuant to Section 12(g) of the Act
: None
|
||
Indicate by check mark if the registrant is a well-known seasoned issuer, as defined in Rule 405 of the Securities Act. Yes
¨
No
ý
Indicate by check mark if the registrant is not required to file reports pursuant to Section 13 or Section 15(d) of the Act. Yes
¨
No
ý
Indicate by check mark whether the registrant (1) has filed all reports required to be filed by Section 13 or 15(d) of the Securities Exchange Act of 1934 during the preceding 12 months (or for such shorter period that the registrant was required to file such reports), and (2) has been subject to such filing requirements for the past 90 days. Yes
ý
No
¨
Indicate by check mark whether the registrant has submitted electronically every Interactive Data File required to be submitted pursuant to Rule 405 of Regulation S-T (§ 232.405 of this chapter) during the preceding 12 months (or for such shorter period that the registrant was required to submit such files). Yes
ý
No
¨
Indicate by check mark if disclosure of delinquent filers pursuant to Item 405 of Regulation S-K (§ 229.405 of this chapter) is not contained herein, and will not be contained, to the best of registrant’s knowledge, in definitive proxy or information statements incorporated by reference in Part III of this Form 10-K or any amendment to this Form 10-K. Yes
¨
No
ý
Indicate by check mark whether the registrant is a large accelerated filer, an accelerated filer, a non-accelerated filer, a smaller reporting company or an emerging growth company. See the definitions of “large accelerated filer,” “accelerated filer,” “smaller reporting company” and “emerging growth company” in Rule 12b-2 of the Exchange Act.
|
Large accelerated filer
|
o
|
Accelerated filer
|
ý
|
|
Non-accelerated filer
|
o
|
Smaller reporting company
|
o
|
|
Emerging growth company
|
o
|
||
If an emerging growth company, indicate by check mark if the registrant has elected not to use the extended transition period complying with any new or revised financial accounting standards provided pursuant to Section 13(a) of the Exchange Act.
¨
Indicate by check mark whether the registrant is a shell company (as defined in Rule 12b-2 of the Exchange Act). Yes
¨
No
ý
The aggregate market value of common equity held by non-affiliates of the registrant as of June 29, 2018 was approximately
$422.7 million
, calculated based on the closing price of the common stock on the Nasdaq Global Select Market on that date.
As of
March 13, 2019
, there were 44,876,649 shares of our $0.01 par value common stock outstanding.
DOCUMENTS INCORPORATION BY REFERENCE
Portions of Mammoth Energy Services, Inc.'s Proxy Statement for the 2019 Annual Meeting of Stockholders are incorporated by reference in Items 10, 11, 12, 13 and 14 of Part III of this Form 10-K.
TABLE OF CONTENTS
|
|
|
Page
|
|
Item 1.
|
||
|
Item 1A.
|
||
|
Item 1B.
|
||
|
Item 2.
|
||
|
Item 3.
|
||
|
Item 4.
|
||
|
|
||
|
Item 5.
|
||
|
Item 6.
|
||
|
Item 7.
|
||
|
Item 7A.
|
||
|
Item 8.
|
||
|
Item 9.
|
||
|
Item 9A.
|
||
|
Item 9B.
|
||
|
Item 10.
|
||
|
Item 11.
|
||
|
Item 12.
|
||
|
Item 13.
|
||
|
Item 14.
|
||
|
Item 15.
|
||
|
Item 16.
|
||
|
|
||
GLOSSARY OF OIL AND NATURAL GAS AND ELECTRICAL INFRASTRUCTURE TERMS
|
The following is a glossary of certain oil and natural gas and natural sand proppant industry terms used in this report:
|
|
|
Acidizing
|
To pump acid into a wellbore to improve a well's productivity or injectivity.
|
|
Blowout
|
An uncontrolled flow of reservoir fluids into the wellbore, and sometimes catastrophically to the surface. A blowout may consist of salt water, oil, natural gas or a mixture of these. Blowouts can occur in all types of exploration and production operations, not just during drilling operations. If reservoir fluids flow into another formation and do not flow to the surface, the result is called an underground blowout. If the well experiencing a blowout has significant open-hole intervals, it is possible that the well will bridge over (or seal itself with rock fragments from collapsing formations) down-hole and intervention efforts will be averted.
|
|
Bottomhole assembly
|
The lower portion of the drillstring, consisting of (from the bottom up in a vertical well) the bit, bit sub, a mud motor (in certain cases), stabilizers, drill collar, heavy-weight drillpipe, jarring devices (“jars”) and crossovers for various threadforms. The bottomhole assembly must provide force for the bit to break the rock (weight on bit), survive a hostile mechanical environment and provide the driller with directional control of the well. Oftentimes the assembly includes a mud motor, directional drilling and measuring equipment, measurements-while-drilling tools, logging-while-drilling tools and other specialized devices.
|
|
Cementing
|
To prepare and pump cement into place in a wellbore.
|
|
Coiled tubing
|
A long, continuous length of pipe wound on a spool. The pipe is straightened prior to pushing into a wellbore and rewound to coil the pipe back onto the transport and storage spool. Depending on the pipe diameter (1 in. to 4 1/2 in.) and the spool size, coiled tubing can range from 2,000 ft. to 23,000 ft. (610 m to 6,096 m) or greater length.
|
|
Completion
|
A generic term used to describe the assembly of down-hole tubulars and equipment required to enable safe and efficient production from an oil or gas well. The point at which the completion process begins may depend on the type and design of the well.
|
|
Directional drilling
|
The intentional deviation of a wellbore from the path it would naturally take. This is accomplished through the use of whipstocks, bottomhole assembly (BHA) configurations, instruments to measure the path of the wellbore in three-dimensional space, data links to communicate measurements taken down-hole to the surface, mud motors and special BHA components and drill bits, including rotary steerable systems, and drill bits. The directional driller also exploits drilling parameters such as weight on bit and rotary speed to deflect the bit away from the axis of the existing wellbore. In some cases, such as drilling steeply dipping formations or unpredictable deviation in conventional drilling operations, directional-drilling techniques may be employed to ensure that the hole is drilled vertically. While many techniques can accomplish this, the general concept is simple: point the bit in the direction that one wants to drill. The most common way is through the use of a bend near the bit in a down-hole steerable mud motor. The bend points the bit in a direction different from the axis of the wellbore when the entire drillstring is not rotating. By pumping mud through the mud motor, the bit turns while the drillstring does not rotate, allowing the bit to drill in the direction it points. When a particular wellbore direction is achieved, that direction may be maintained by rotating the entire drillstring (including the bent section) so that the bit does not drill in a single direction off the wellbore axis, but instead sweeps around and its net direction coincides with the existing wellbore. Rotary steerable tools allow steering while rotating, usually with higher rates of penetration and ultimately smoother boreholes.
|
|
Down-hole
|
Pertaining to or in the wellbore (as opposed to being on the surface).
|
|
Down-hole motor
|
A drilling motor located in the drill string above the drilling bit powered by the flow of drilling mud. Down-hole motors are used to increase the speed and efficiency of the drill bit or can be used to steer the bit in directional drilling operations. Drilling motors have become very popular because of horizontal and directional drilling applications and the day rates for drilling rigs.
|
|
Drilling rig
|
The machine used to drill a wellbore.
|
|
Drillpipe or Drill pipe
|
Tubular steel conduit fitted with special threaded ends called tool joints. The drillpipe connects the rig surface equipment with the bottomhole assembly and the bit, both to pump drilling fluid to the bit and to be able to raise, lower and rotate the bottomhole assembly and bit.
|
|
Drillstring or Drill string
|
The combination of the drillpipe, the bottomhole assembly and any other tools used to make the drill bit turn at the bottom of the wellbore.
|
|
Flowback
|
The process of allowing fluids to flow from the well following a treatment, either in preparation for a subsequent phase of treatment or in preparation for cleanup and returning the well to production.
|
|
Horizontal drilling
|
A subset of the more general term “directional drilling,” used where the departure of the wellbore from vertical exceeds about 80 degrees. Note that some horizontal wells are designed such that after reaching true 90-degree horizontal, the wellbore may actually start drilling upward. In such cases, the angle past 90 degrees is continued, as in 95 degrees, rather than reporting it as deviation from vertical, which would then be 85 degrees. Because a horizontal well typically penetrates a greater length of the reservoir, it can offer significant production improvement over a vertical well.
|
|
Hydraulic fracturing
|
A stimulation treatment routinely performed on oil and gas wells in low permeability reservoirs. Specially engineered fluids are pumped at high pressure and rate into the reservoir interval to be treated, causing a vertical fracture to open. The wings of the fracture extend away from the wellbore in opposing directions according to the natural stresses within the formation. Proppant, such as grains of sand of a particular size, is mixed with the treatment fluid to keep the fracture open when the treatment is complete. Hydraulic fracturing creates high-conductivity communication with a large area of formation and bypasses any damage that may exist in the near-wellbore area.
|
|
Hydrocarbon
|
A naturally occurring organic compound comprising hydrogen and carbon. Hydrocarbons can be as simple as methane, but many are highly complex molecules, and can occur as gases, liquids or solids. Petroleum is a complex mixture of hydrocarbons. The most common hydrocarbons are natural gas, oil and coal.
|
i
|
Mesh size
|
The size of the proppant that is determined by sieving the proppant through screens with uniform openings corresponding to the desired size of the proppant. Each type of proppant comes in various sizes, categorized as mesh sizes, and the various mesh sizes are used in different applications in the oil and natural gas industry. The mesh number system is a measure of the number of equally sized openings per square inch of screen through which the proppant is sieved.
|
|
Mud motors
|
A positive displacement drilling motor that uses hydraulic horsepower of the drilling fluid to drive the drill bit. Mud motors are used extensively in directional drilling operations.
|
|
Natural gas liquids
|
Components of natural gas that are liquid at surface in field facilities or in gas processing plants. Natural gas liquids can be classified according to their vapor pressures as low (condensate), intermediate (natural gasoline) and high (liquefied petroleum gas) vapor pressure.
|
|
Nitrogen pumping unit
|
A high-pressure pump or compressor unit capable of delivering high-purity nitrogen gas for use in oil or gas wells. Two basic types of units are commonly available: a nitrogen converter unit that pumps liquid nitrogen at high pressure through a heat exchanger or converter to deliver high-pressure gas at ambient temperature, and a nitrogen generator unit that compresses and separates air to provide a supply of high pressure nitrogen gas.
|
|
Plugging
|
The process of permanently closing oil and gas wells no longer capable of producing in economic quantities. Plugging work can be performed with a well servicing rig along with wireline and cementing equipment; however, this service is typically provided by companies that specialize in plugging work.
|
|
Plug
|
A down-hole packer assembly used in a well to seal off or isolate a particular formation for testing, acidizing, cementing, etc.; also a type of plug used to seal off a well temporarily while the wellhead is removed.
|
|
Pounds per square inch
|
A unit of pressure. It is the pressure resulting from a one pound force applied to an area of one square inch.
|
|
Pressure pumping
|
Services that include the pumping of liquids under pressure.
|
|
Producing formation
|
An underground rock formation from which oil, natural gas or water is produced. Any porous rock will contain fluids of some sort, and all rocks at considerable distance below the Earth’s surface will initially be under pressure, often related to the hydrostatic column of ground waters above the reservoir. To produce, rocks must also have permeability, or the capacity to permit fluids to flow through them.
|
|
Proppant
|
Sized particles mixed with fracturing fluid to hold fractures open after a hydraulic fracturing treatment. In addition to naturally occurring sand grains, man-made or specially engineered proppants, such as resin-coated sand or high-strength ceramic materials like sintered bauxite, may also be used. Proppant materials are carefully sorted for size and sphericity to provide an efficient conduit for production of fluid from the reservoir to the wellbore.
|
|
Resource play
|
Accumulation of hydrocarbons known to exist over a large area.
|
|
Shale
|
A fine-grained, fissile, sedimentary rock formed by consolidation of clay- and silt-sized particles into thin, relatively impermeable layers.
|
|
Tight oil
|
Conventional oil that is found within reservoirs with very low permeability. The oil contained within these reservoir rocks typically will not flow to the wellbore at economic rates without assistance from technologically advanced drilling and completion processes. Commonly, horizontal drilling coupled with multistage fracturing is used to access these difficult to produce reservoirs.
|
|
Tight sands
|
A type of unconventional tight reservoir. Tight reservoirs are those which have low permeability, often quantified as less than 0.1 millidarcies.
|
|
Tubulars
|
A generic term pertaining to any type of oilfield pipe, such as drill pipe, drill collars, pup joints, casing, production tubing and pipeline.
|
|
Unconventional resource
|
A term for the different manner by which resources are exploited as compared to the extraction of conventional resources. In unconventional drilling, the wellbore is generally drilled to specific objectives within narrow parameters, often across long, lateral intervals within narrow horizontal formations offering greater contact area with the producing formation. Typically, the well is then hydraulically fractured at multiple stages to optimize production.
|
|
Wellbore
|
The physical conduit from surface into the hydrocarbon reservoir.
|
|
Well stimulation
|
A treatment performed to restore or enhance the productivity of a well. Stimulation treatments fall into two main groups, hydraulic fracturing treatments and matrix treatments. Fracturing treatments are performed above the fracture pressure of the reservoir formation and create a highly conductive flow path between the reservoir and the wellbore. Matrix treatments are performed below the reservoir fracture pressure and generally are designed to restore the natural permeability of the reservoir following damage to the near wellbore area. Stimulation in shale gas reservoirs typically takes the form of hydraulic fracturing treatments.
|
|
Wireline
|
A general term used to describe well-intervention operations conducted using single-strand or multi-strand wire or cable for intervention in oil or gas wells. Although applied inconsistently, the term commonly is used in association with electric logging and cables incorporating electrical conductors.
|
|
Workover
|
The process of performing major maintenance or remedial treatments on an oil or gas well. In many cases, workover implies the removal and replacement of the production tubing string after the well has been killed and a workover rig has been placed on location. Through-tubing workover operations, using coiled tubing, snubbing or slickline equipment, are routinely conducted to complete treatments or well service activities that avoid a full workover where the tubing is removed. This operation saves considerable time and expense.
|
ii
|
The following is a glossary of certain electrical infrastructure industry terms used in this report:
|
|
|
Distribution
|
The distribution of electricity from the transmission system to individual customers.
|
|
Substation
|
A part of an electrical transmission and distribution system that transforms voltage from high to low, or the reverse.
|
|
Transmission
|
The movement of electrical energy from a generating site, such as a power plant, to an electric substation.
|
iii
CAUTIONARY NOTE REGARDING FORWARD-LOOKING STATEMENTS
Various statements contained in this Annual Report on Form 10-K (this "annual report" or "report") that express a belief, expectation, or intention, or that are not statements of historical fact, are forward-looking statements within the meaning of Section 27A of the Securities Act of 1933, as amended, or the Securities Act, and Section 21E of the Securities Exchange Act of 1934, or the Exchange Act and the Private Securities Litigation Reform Act of 1995.
Forward-looking statements may include statements about our:
|
•
|
business strategy;
|
|
•
|
pending or future acquisitions and future capital expenditures;
|
|
•
|
ability to obtain permits and governmental approvals;
|
|
•
|
technology;
|
|
•
|
financial strategy;
|
|
•
|
future operating results; and
|
|
•
|
plans, objectives, expectations and intentions.
|
All of these types of statements, other than statements of historical fact included in this annual report, are forward-looking statements. These forward-looking statements may be found in the “Business,” “Risk Factors,” “Management’s Discussion and Analysis of Financial Condition and Results of Operations,” and other sections of this annual report. In some cases, you can identify forward-looking statements by terminology such as “may,” “will,” “could,” “should,” “would,” “expect,” “plan,” “project,” “budget,” “intend,” “anticipate,” “believe,” “estimate,” “predict,” “potential,” “pursue,” “target,” “seek,” “objective,” “continue,” “will be,” “will benefit,” or “will continue,” the negative of such terms or other comparable terminology.
The forward-looking statements contained in this annual report are largely based on our expectations, which reflect estimates and assumptions made by our management. These estimates and assumptions reflect our best judgment based on currently known market conditions and other factors, which are difficult to predict and many of which are beyond our control. Although we believe such estimates and assumptions to be reasonable, they are inherently uncertain and involve a number of risks and uncertainties that are beyond our control. In addition, our management’s assumptions about future events may prove to be inaccurate. Our management cautions all readers that the forward-looking statements contained in this annual report are not guarantees of future performance, and we cannot assure any reader that such statements will be realized or the forward-looking events and circumstances will occur. Actual results may differ materially from those anticipated or implied in the forward-looking statements due to the many factors including those described in Item 1A. “Risk Factors” and Item 7. "Management's Discussion and Analysis of Financial Condition and Results of Operations" and elsewhere in this annual report. All forward-looking statements speak only as of the date of this annual report. We do not intend to publicly update or revise any forward-looking statements as a result of new information, future events or otherwise. These cautionary statements qualify all forward-looking statements attributable to us or persons acting on our behalf.
iv
PART I.
The historical financial information for periods prior to October 12, 2016, contained in this annual report relates to Mammoth Energy Partners LP, a Delaware limited partnership, or the Partnership. On October 12, 2016, the Partnership was converted into a Delaware limited liability company named Mammoth Energy Partners LLC, or Mammoth LLC, and then each member of Mammoth LLC contributed all of its membership interests in Mammoth LLC to Mammoth Energy Services, Inc., a Delaware corporation, or Mammoth Inc. Prior to the conversion and the contribution, Mammoth Inc. was a wholly-owned subsidiary of the Partnership. Following the conversion and the contribution, Mammoth LLC (as the converted successor to the Partnership) became a wholly-owned subsidiary of Mammoth Inc.
On October 13, 2016, Mammoth Inc. priced 7,750,000 shares of its common stock in its initial public offering, or the IPO, at a price to the public of $15.00 per share and, on October 14, 2016, Mammoth Inc.’s common stock began trading on The Nasdaq Global Select Market under the symbol “TUSK.” On October 19, 2016, Mammoth Inc. closed its IPO. Unless the context otherwise requires, references in this report to “we,” “our,” “us” or like terms, when used in a historical context for periods prior to October 12, 2016 refer to the Partnership and its subsidiaries. References in this report to “we,” “our,” “us” or like terms, when used for periods beginning on or after October 12, 2016 refer to Mammoth Inc. and its subsidiaries.
On June 5, 2017, we acquired Sturgeon Acquisitions LLC, or Sturgeon, and Sturgeon's wholly owned subsidiaries Taylor Frac, LLC, or Taylor Frac, Taylor Real Estate Investments, LLC, or Taylor Real Estate, and South River Road, LLC, or South River Road. Prior to the acquisition, we and Sturgeon were under common control and, in accordance with generally accepted accounting principles in the United States, or GAAP, we have accounted for this acquisition in a manner similar to the pooling of interest method of accounting. Therefore, our historical financial information for all periods included in this Annual Report on Form 10-K has been recast to combine Sturgeon's financial results with our financial results as if the acquisition had been effective since Sturgeon commenced operations.
Item 1. Business
Overview
We are an integrated, growth-oriented company serving both the electric utility and oil and gas industries in North America and US territories. Our primary business objective is to grow our operations and create value for stockholders through organic growth opportunities and accretive acquisitions. Our suite of services includes infrastructure services, pressure pumping services, natural sand proppant services and other services, including contract land and directional drilling, coil tubing, flowback, cementing, acidizing, equipment rental, crude oil hauling and remote accommodations. Our infrastructure services division provides construction, upgrade, maintenance and repair services to the electrical infrastructure industry. Our pressure pumping services division provides hydraulic fracturing, sand hauling and water transfer services. Our natural sand proppant services division mines, processes and sells proppant used for hydraulic fracturing. In addition to these service divisions, we also provide contract land and directional drilling services, coil tubing services, pressure control services, flowback services, cementing services, acidizing services, equipment rentals, crude oil hauling services and remote accommodations. We believe that the services we offer play a critical role in maintaining and improving electrical infrastructure as well as in increasing the ultimate recovery and present value of production streams from unconventional resources. Our complementary suite of services provides us with the opportunity to cross-sell our services and expand our customer base and geographic positioning. We are exploring several opportunities to expand our business lines including, but not limited to, full service transportation, telecommunications and general industrial manufacturing as we shift to a broader industrial focus.
“Unconventional resources” references the different manner by which they are exploited as compared to the extraction of conventional resources. In unconventional drilling, the wellbore is generally drilled to specific objectives within narrow parameters, often across long, lateral intervals within narrow horizontal formations offering greater contact area with the producing formation. Typically, the well is then hydraulically fractured at multiple stages to optimize production.
Our facilities and service centers are strategically located in Ohio, Texas, Oklahoma, Wisconsin, Minnesota, West Virginia, Kentucky, Puerto Rico and Alberta, Canada primarily to serve the following areas:
|
•
|
The Utica Shale in Eastern Ohio;
|
|
•
|
Southern Ohio;
|
|
•
|
The Permian Basin in West Texas;
|
|
•
|
The Appalachian Basin in the Northeast;
|
|
•
|
The SCOOP and STACK in Oklahoma;
|
1
|
•
|
The Arkoma Basin in Arkansas and Oklahoma;
|
|
•
|
The Anadarko Basin in Oklahoma;
|
|
•
|
The Marcellus Shale in West Virginia and Pennsylvania;
|
|
•
|
Southeastern New Mexico;
|
|
•
|
The Barnett Shale in Texas;
|
|
•
|
The Granite Wash and Mississippi Shale in Oklahoma and Texas;
|
|
•
|
The Cana Woodford and Woodford Shales and the Cleveland Sand in Oklahoma;
|
|
•
|
The Eagle Ford Shale in Texas;
|
|
•
|
Puerto Rico; and
|
|
•
|
The oil sands in Alberta, Canada.
|
Our operational division heads have an extensive track record in the infrastructure and oilfield service businesses with an average of over 25 years of infrastructure services experience and over 35 years of oilfield services experience. They bring valuable regional expertise and long-term customer relationships to our business. We provide our infrastructure services to government-funded utilities, private utilities, public investor owned utilities, or IOUs, and cooperatives, or Co-Ops, and our pressure pumping, natural sand proppant and other services to a diversified range of both public and private independent oil and natural gas producers. Our top five customers for the year ended
December 31, 2018
, representing
77%
of our revenue, were the Puerto Rico Electric Power Authority, or PREPA, Gulfport Energy Corporation, or Gulfport, Roan Resources LLC, or Roan Resources, Blue Ridge Mountain Resources, Inc., or Blue Ridge, and HG Energy LLC, or HG Energy. For the year ended
December 31, 2017
, our top five customers, representing
71%
of our revenue, were Gulfport, PREPA, Newfield Exploration Company, or Newfield, Rice Energy, Inc., or Rice Energy, and Surge Operating LLC, or Surge Operating. For the year ended
December 31, 2016
, our top five customers, representing
80%
of our revenue, were Gulfport, Japan Canada Oil Sands Limited, or Oil Sands Limited, Rice Energy, Surge Operating and Hilcorp Energy Corporation.
Our Services
Our revenues, operating profits and identifiable assets are primarily attributable to three reportable segments: infrastructure services, pressure pumping services and natural sand proppant services. For the year ended December 31, 2017, we identified four reportable segments consisting of infrastructure services, pressure pumping services, natural sand proppant services and contract land and directional drilling services. We changed our reportable segment presentation in 2018, as we determined, based upon both a quantitative and qualitative basis, that the contract land and directional drilling services segment, which included Bison Drilling and Field Services, LLC, Bison Trucking, LLC, Panther Drilling Systems LLC, White Wing Tubular Services LLC and Mako Acquisitions LLC, is not of continuing significance for accounting reporting purposes. We now include the results of our contract land and directional drilling activities with our other services. For additional information, see Note 21 to our consolidated financial statements included elsewhere in this annual report.
Infrastructure Services
Our infrastructure services business provides restoration, repair, transmission and distribution, or T&D, and commercial services. We offer a broad range of services on electric transmission and distribution networks and substation facilities, which include construction, upgrade, maintenance and repair services. Our T&D services include the construction, upgrade, maintenance and repair of high voltage transmission lines, substations and lower voltage overhead and underground distribution systems. Our commercial services include the installation, maintenance and repair of commercial wiring.
We also provide storm repair and restoration services in response to storms and other disasters, including hurricane Maria. We provide infrastructure services primarily in the northeast, southwest and midwest portions of the United States and in Puerto Rico.
We currently have agreements in place with government-funded utilities, private utilities, public IOUs and Co-Ops. To date, substantially all of our infrastructure services have been performed in Puerto Rico under two emergency master services agreements entered into by one of our subsidiaries, Cobra Acquisitions LLC, or Cobra, with PREPA for up to an aggregate of approximately $1.8 billion of services. The scope of the work contemplated by these agreements includes labor, supervision, tools, equipment and materials to perform storm repair, restoration and reconstruction services at various locations in Puerto Rico. Cobra performed the full $945 million of services under the initial contract as of July 21, 2018. The second contract with PREPA has a one-year term ending on May 25, 2019 and provides for total payments not to exceed $900 million. As of December 31, 2018 and March 8, 2019, Cobra had performed an aggregate of $280 million and $354 million, respectively, of services under the second contract. Although we continue to perform services under the second contract, we expect these services will end by March 31, 2019, and we do not expect that any further work orders will be issued to Cobra under this contract prior to the May 25, 2019 termination date.
2
As previously reported, during the third quarter of 2018, our staffing levels in Puerto Rico fluctuated between 500 and 600 people. During the fourth quarter of 2018, our staffing levels generally ranged from 475 to 550, dropping to approximately 130 at year end for a period of three days due to the holidays. To date in 2019, our staffing levels in Puerto Rico have decreased from approximately 500 in January to 200 as of March 8, 2019. We currently expect our staffing levels in Puerto Rico to decline to approximately 50 by early April 2019 as we complete the work contemplated by our existing work orders and undertake demobilization efforts. For additional information regarding our services to PREPA, see Item 7. Management’s Discussion and Analysis of Financial Condition and Results of Operations.
The demand for our infrastructure services in the continental United States has continued to increase. We have grown our distribution crew count to a total of approximately 120 crews as of March 1, 2019, an increase of 15 from approximately 105 at December 31, 2018 and an increase of 70 from approximately 50 at December 31, 2017. Each distribution crew generally consists of five employees. These distribution crews, which include employees previously located in Puerto Rico, are working for multiple utilities primarily across the northeastern, midwestern and southwestern portions of the United States. We believe we will be able to continue to grow our customer base and increase our revenues in the continental United States over the coming years.
Pressure Pumping Services
Pressure Pumping
. We provide pressure pumping services, also known as hydraulic fracturing, to exploration and production companies. These services are intended to optimize hydrocarbon flow paths during the completion phase of horizontal shale wellbores. Currently, we provide pressure pumping services in the Utica Shale of Eastern Ohio and the mid-continent region in Oklahoma. We currently own six fleets, four of which are currently providing services in the Utica Shale. Two of these fleets operate under a contract expiring in December 2021. Additionally, we have two fleets operating in the mid-continent region.
Our pressure pumping services include high-pressure hydraulic fracturing services. Fracturing services are performed to enhance the production of oil and natural gas from formations having low permeability such that the flow of hydrocarbons is restricted. We have significant expertise in multistage fracturing of horizontal oil and natural gas producing wells in shale and other unconventional geological formations.
The fracturing process consists of pumping a fracturing fluid into a well at sufficient pressure to fracture the formation. Materials known as proppants, in our case primarily sand or ceramic beads, are suspended in the fracturing fluid and are pumped into the fracture to prop it open. The fracturing fluid is designed to “break,” or loosen viscosity, and be forced out of the formation by its pressure, leaving the proppants suspended in the fractures created, thereby increasing the mobility of the hydrocarbons. As a result of the fracturing process, production rates are usually enhanced substantially, thus increasing the rate of return for the operator.
We own and operate fleets of mobile hydraulic fracturing units and other auxiliary heavy equipment to perform fracturing services. Our hydraulic fracturing units consist primarily of a high pressure hydraulic pump, a diesel engine, a transmission and various hoses, valves, tanks and other supporting equipment that are typically mounted to a flat-bed trailer. As of
December 31, 2018
, our pressure pumping business included six high pressure fleets consisting of an aggregate 117 high pressure fracturing units with pump nameplate capacity of 291,750 horsepower.
We refer to the group of fracturing units, other equipment and vehicles necessary to perform a typical fracturing job as a “fleet” and the personnel assigned to each fleet as a “crew.” We operate on a 24-hour-per-day basis and we typically staff three crews per fleet. All of our fracturing units and high pressure pumps are manufactured to our specifications to enhance the performance and durability of our equipment and meet our customers’ needs.
Each hydraulic fracturing fleet includes a mobile, on-site control center that monitors pressures, rates and volumes, as applicable. From there, our field-level managers supervise the job-site by radio. Each control center is equipped with high bandwidth satellite hardware that provides continuous upload and download of job telemetry data. The data is delivered on a real-time basis to on-site job personnel, the operator and personnel at our headquarters for display in both digital and graphical form.
An important element of fracturing services is determining the proper fracturing fluid, proppants and injection program to maximize results. In virtually all of our hydraulic fracturing jobs, our customers specify the composition of the fracturing fluid to be used. The fracturing fluid may contain hazardous substances, such as hydrochloric acid and certain petrochemicals. Our customers are responsible for the disposal of the fracturing fluid that flows back out of the well as waste
3
water. The customers remove the water from the well using a controlled flow-back process, and we are generally not involved in that process or in the disposal of the fluid.
Sand Hauling
.
Our sand hauling services provide last-mile trucking and logistics services for proppant used in completion activities in the Utica shale, Permian basin and SCOOP/STACK. As of
December 31, 2018
, we owned a fleet of 57 trucks.
Water Transfer
. Our water transfer services provide water sourcing and water transfer services primarily for completion activities. As of
December 31, 2018
, we owned 136 water transfer pumps and 88 miles of layflat hose.
Master Services Agreements
. We contract with most of our pressure pumping customers under master service agreements, or MSAs. Generally, our MSAs, including those relating to our hydraulic fracturing services, specify payment terms, audit rights and insurance requirements and allocate certain operational risks through indemnity and similar provision.
Natural Sand Proppant Services
In our natural sand proppant business, we mine, process and sell sand. We also buy processed sand from suppliers on the spot market and resell that sand. Natural sand proppant, also known as frac sand, is the most widely used type of proppant due to its broad applicability in unconventional oil and natural gas wells and its cost advantage relative to other proppants. Natural frac sand may be used as proppant in all but the highest pressure and temperature environments and is being employed in nearly all major U.S. unconventional oil and natural gas producing basins, including those in which we operate.
At our Barron County and Jackson County, Wisconsin plants, we mine and process sand into premium monocrystalline sand (also known as frac sand), a specialized mineral that is used as a proppant. We can also purchase raw or washed sand and process it at our indoor sand processing plant located in Pierce County, Wisconsin, however, this facility has been temporarily idled since September 2018 due to market conditions. We sell sand to our customers for use in their hydraulic fracturing operations to enhance recovery rates from unconventional wells. Our sand processing plants produce a range of frac sand sizes for use in all major North American shale basins, including a majority of the standard proppant sizes as defined by the ISO/API 13503-2 specifications. These grain sizes can be customized to meet the demands of our customers with respect to a specific well. Our supply of Jordan substrate exhibits the physical properties necessary to withstand the completion and production environments of the wells in these shale basins. Our indoor processing plant in Pierce County, Wisconsin is designed for year-round continuous wet and dry plant operation. Our processing plants in Barron County and Jackson County, Wisconsin have indoor dry plants designed to operate year-round and outdoor wet plants that generally operate eight months per year.
We also provide logistics solutions to facilitate delivery of our frac sand products to our customers. Our frac sand products are primarily shipped by rail to our customers in the Utica Shale, SCOOP/STACK, DJ Basin, Permian Basin and the Montney Shale in British Columbia and Alberta, Canada. Our logistics capabilities in this regard are important to our customers, who focus on both the reliability and flexibility of product delivery. Because our customers generally find it impractical to store frac sand in large quantities near their job sites, they typically prefer product to be delivered where and as needed, which requires predictable and efficient loading and shipping capabilities. We contract with third party providers to transport our frac sand products to railroad facilities for delivery to our customers. We currently lease or have access to origin transloading facilities on the Canadian National Railway Company (CN), Union Pacific (UP), Burlington Northern Santa Fe (BNSF) and the Canadian Pacific (CP) rail systems and use an in-house railcar fleet that we lease from various third parties to deliver our frac sand products to our customers. Origin transloading facilities on multiple railways allow us to provide predictable and efficient loading and shipping of our frac sand products. We also utilize a destination transloading facility in Yorkville, Ohio, to serve the Utica Shale, and utilize destination transloading facilities located in other North American resource plays, including the Montney Shale, to meet our customers’ delivery needs.
Other Services
We also offer a variety of other energy services including contract land and directional drilling services, coil tubing services, pressure control services, flowback services, cementing services, acidizing services, equipment rental services, crude oil hauling services and remote accommodation services.
Contract Drilling
. As part of our contract drilling services, we provide both vertical and horizontal drilling services to our customers. Currently, we perform our contract drilling services in the Permian Basin of West Texas.
4
A majority of the wells we drill for our customers are drilled in unconventional basins or resource plays. These plays are generally characterized by complex geologic formations that often require higher horsepower, premium rigs and experienced crews to reach targeted depths. As of
December 31, 2018
, we owned 12 land drilling rigs, ranging from 800 to 1,600 horsepower, eight of which are specifically designed for drilling horizontal and directional wells, which continue to increase as a percentage of total wells drilled in North America and are frequently utilized in unconventional resource plays. As of
December 31, 2018
, three of our 12 drilling rigs were operating under term contracts with a term of more than one well or a stated period of time. To facilitate the provision of our contract drilling services, as of
December 31, 2018
, we also owned 42 trucks specifically tailored to move rigs and seven cranes to assist us in moving rigs in the Permian Basin.
A land drilling rig generally consists of engines, a hoisting system, a rotating system, a drawworks, a mast, pumps and related equipment to circulate the drilling fluid under various pressures, blowout preventers, drill string and related equipment. The engines power the different pieces of equipment, including a rotary table or top drive that turns the drill pipe, or drill string, causing the drill bit to bore through the subsurface rock layers. Drilling rigs use long strings of drill pipe and drill collars to drill wells. Drilling rigs are also used to set heavy strings of large-diameter pipe, or casing, inside the borehole. Because the total weight of the drill string and the casing can exceed 500,000 pounds, drilling rigs require significant hoisting and braking capacities. Generally, a drilling rig’s hoisting system is made up of a mast, or derrick, a drilling line, a traveling block and hook assembly and ancillary equipment that attaches to the rotating system, a mechanism known as the drawworks. The drawworks mechanism consists of a revolving drum, around which the drilling line is wound, and a series of shafts, clutches and chain and gear drives for generating speed changes and reverse motion. The drawworks also houses the main brake, which has the capacity to stop and sustain the weights used in the drilling process. When heavy loads are being lowered, a hydromatic or electric auxiliary brake assists the main brake to absorb the great amount of energy developed by the mass of the traveling block, hook assembly, drill pipe, drill collars and drill bit or casing being lowered into the well.
The rotating equipment from top to bottom consists of a swivel, the kelly bushing, the kelly, the rotary table, drill pipe, drill collars and the drill bit. We refer to the equipment between the swivel and the drill bit as the drill stem. The swivel assembly sustains the weight of the drill stem, permits its rotation and affords a rotating pressure seal and passageway for circulating drilling fluid into the top of the drill string. The swivel also has a large handle that fits inside the hook assembly at the bottom of the traveling block. Drilling fluid enters the drill stem through a hose, called the rotary hose, attached to the side of the swivel. The kelly is a triangular, square or hexagonal piece of pipe, usually 40 feet long, that transmits torque from the rotary table to the drill stem and permits its vertical movement as it is lowered into the hole. The bottom end of the kelly fits inside a corresponding triangular, square or hexagonal opening in a device called the kelly bushing. The kelly bushing, in turn, fits into a part of the rotary table called the master bushing. As the master bushing rotates, the kelly bushing also rotates, turning the kelly, which rotates the drill pipe and thus the drill bit. Drilling fluid is pumped through the kelly on its way to the bottom. The rotary table, equipped with its master bushing and kelly bushing, supplies the necessary torque to turn the drill stem. The drill pipe and drill collars are both steel tubes through which drilling fluid can be pumped. Drill pipe comes in 30-foot sections, or joints, with threaded sections on each end. Drill collars are heavier than drill pipe and are also threaded on the ends. Collars are used on the bottom of the drill stem to apply weight to the drill bit. At the end of the drill stem is the bit, which chews up the formation rock and dislodges it so that drilling fluid can circulate the fragmented material back up to the surface where the circulating system filters it out of the fluid.
Drilling fluid, often called drilling mud, is a mixture of clays, chemicals and water or oil, which is carefully formulated for the particular well being drilled. Bulk storage of drilling fluid materials, the pumps and the mud-mixing equipment are placed at the start of the circulating system. Working mud pits and reserve storage are at the other end of the system. Between these two points the circulating system includes auxiliary equipment for drilling fluid maintenance and equipment for well pressure control. Within the system, the drilling mud is typically routed from the mud pits to the mud pump and from the mud pump through a standpipe and the rotary hose to the drill stem. The drilling mud travels down the drill stem to the bit, up the annular space between the drill stem and the borehole and through the blowout preventer stack to the return flow line. It then travels to a shale shaker for removal of rock cuttings, and then back to the mud pits, which are usually steel tanks. The reserve pits, usually one or two fairly shallow excavations, are used for waste material and excess water around the location.
There are numerous factors that differentiate drilling rigs, including their power generation systems, horsepower, maximum drilling depth and horizontal drilling capabilities. The actual drilling depth capability of a rig may be less than or more than its rated depth capability due to numerous factors, including the size, weight and amount of the drill pipe on the rig. The intended well depth and the drill site conditions determine the amount of drill pipe and other equipment needed to drill a well.
Our drilling rigs have rated maximum depth capabilities ranging from 12,500 feet to 20,000 feet. Of these drilling rigs, seven are electric rigs and five are mechanical rigs. An electric rig differs from a mechanical rig in that the electric rig converts
5
the power from its generators (which in the case of mechanical rigs, power the rig directly) into electricity to power the rig. Depth and complexity of the well and drill site conditions are the principal factors in determining the specifications of the rig selected for a particular job. Power requirements for drilling jobs may vary considerably, but most of our mechanical drilling rigs employ six engines to generate between 800 and 1,200 horsepower, depending on well depth and rig design. Most drilling rigs capable of drilling in deep formations drill to measured depths greater than 10,000 to 18,000 feet. Generally, land rigs operate with four crews of five people and two tool pushers, or rig managers, rotating on a weekly or bi-weekly schedule.
We believe that our drilling rigs and other related equipment are in good operating condition. Our employees perform periodic maintenance and minor repair work on our drilling rigs.
We obtain our contracts for drilling oil and natural gas wells either through competitive bidding or through direct negotiations with customers. We typically enter into drilling contracts that provide for compensation on a daywork basis. Occasionally, we enter into drilling contracts that provide for compensation on a footage basis, however, a majority of such footage drilling contracts also provide for daywork rates for work outside core drilling activities contemplated by such footage contracts and under certain other circumstances. We have not historically entered into turnkey contracts; however, we may decide to enter into such contracts in the future. It is also possible that we may acquire such contracts in connection with future acquisitions of drilling assets. Contract terms we offer generally depend on the complexity and risk of operations, the on-site drilling conditions, the type of equipment used, the anticipated duration of the work to be performed and market conditions.
Daywork Contracts
. Under daywork drilling contracts, we provide equipment and labor and perform services under the direction, supervision and control of our customers. We are paid a specified operating daywork rate from the time the drilling unit is rigged up at the drilling location and is ready to commence operations. Additionally, the daywork drilling contracts typically provide for fees and/or a daywork rates for mobilization, demobilization, moving, standby time and for any continuous period that normal operations are suspended or cannot be carried on because of force majeure conditions. The daywork drilling contracts also generally provide that the customer has the right to designate the points at which casing will be set and the manner of setting, cementing and testing. Such specifications include hole size, casing size, weight, grade and approximate setting depth. Furthermore, the daywork drilling contracts specify the equipment, materials and services to be separately furnished by us and our customer. Under these contracts, liability is typically allocated so that our customer is solely responsible for the following: (i) damage to our surface equipment as a result of certain corrosive elements; (ii) damage to customer’s equipment; (iii) damage to our in-hole equipment; (iv) damage or loss to the hole; (v) damage to the underground; and (vi) costs and damages associated with a wild well. We remain responsible for any damage to our surface equipment (except for damage resulting from the presence of certain corrosive elements) and for pollution or contamination from spills of materials that originate above the surface, are wholly in our control and are directly associated with our equipment. Daywork drilling contracts generally allow the customer to terminate the contract prior to drilling to a specified depth. This right, however, is generally subject to early termination compensation, the amount of which depends on when the termination occurs.
Footage Contracts
. Under footage contracts, the contractor is typically paid a fixed amount for each foot drilled, regardless of the time required or the problems encountered in drilling the well. A majority of these types of drilling contracts, however, contain both footage and daywork basis provisions, the applicability of which typically depends on the depth of drilling and/or the type of services being performed. For instance, when drilling occurs below a specified drilling depth or when work is considered outside the scope of the footage basis, which we refer to as core drilling, then daywork contract terms apply similar to those described above. Otherwise, the footage contract terms apply. These include a footage rate price that is a specific dollar amount per linear foot of hole drilled within the contract footage depth. Also, under the footage contract terms, we assume more responsibility for base drilling activities compared to daywork drilling. For instance, in addition to assuming responsibility for damage to our surface equipment and damage caused by certain pollution and contamination, we are responsible for the following: (i) damage to our in-hole equipment; (ii) damage to the hole that is attributable to our performance; and (iii) any costs or expenditures associated with drilling a new hole after such damage. Our customers remain responsible for any loss to their equipment, for any damage to a hole caused by them and for any underground damage. As with contracts for daywork drilling, footage drilling contracts generally allow the customer to terminate the contract before drilling to a specified depth. This right, however, is generally subject to early termination compensation, the amount of which depends on when the termination occurs.
Because we assume higher risk in a footage drilling contract, we typically pay more of the out-of-pocket costs associated with such contracts as compared to daywork contracts. We endeavor to manage these additional risks through the use of our engineering expertise and bid the footage contracts accordingly. We typically maintain insurance coverage against some, but not all, drilling hazards. However, the occurrence of uninsured or under-insured losses or operating cost overruns on our footage jobs could have a negative impact on our profitability. While we have historically entered into few footage contracts, we may enter into more such arrangements in the future to the extent warranted by market conditions.
6
Turnkey Contracts
. Turnkey contracts typically provide for a drilling company to drill a well for a customer to a specified depth and under specified conditions for a fixed price, regardless of the time required or the problems encountered in drilling the well. The drilling company would provide technical expertise and engineering services, as well as most of the equipment and drilling supplies required to drill the well. The drilling company may subcontract for related services, such as the provision of casing crews, cementing and well logging. Under typical turnkey drilling arrangements, a drilling company would not receive progress payments and would be paid by its customer only after it had performed the terms of the drilling contract in full. The risks to the drilling company under a turnkey contract are substantially greater than those under a daywork basis. This is primarily because under a turnkey contract, the drilling company assumes most of the risks associated with drilling operations generally assumed by the operator in a daywork contract, including the risk of blowout, loss of hole, stuck drill pipe, machinery breakdowns, abnormal drilling conditions and risks associated with subcontractors’ services, supplies, cost escalations and personnel.
Directional Drilling
. Our directional drilling services provide for the efficient drilling and production of oil and natural gas from unconventional resource plays. Our directional drilling equipment includes mud motors used to propel drill bits and kits for measurement-while-drilling, or MWD, and electromagnetic, or EM, technology. MWD kits are down-hole tools that provide real-time measurements of the location and orientation of the bottom-hole assembly, which is necessary to adjust the drilling process and guide the wellbore to a specific target. This technology, coupled with our complementary services, allows our customers to drill wellbores to specific objectives within narrow location parameters within target horizons. The evolution of unconventional resource reserve recovery has increased the need for the precise placement of a wellbore. Wellbores often travel across long-lateral intervals within narrow formations as thin as ten feet. Our personnel are involved in all aspects of a well from the initial planning of a customer’s drilling program to the management and execution of the horizontal or directional drilling operation.
As of
December 31, 2018
, we owned ten MWD kits and three EM kits used in vertical, horizontal and directional drilling applications, 89 mud motors, 16 air motors and an inventory of related parts and equipment. Currently, we perform our directional drilling services in the Utica Shale, Anadarko Basin, Arkoma Basin, Powder River Basin and Permian Basin.
Coil Tubing
. Coiled tubing services involve injecting coiled tubing into wells to perform various well-servicing and workover operations. Coiled tubing is a flexible steel pipe with a diameter of typically less than three inches and manufactured in continuous lengths of thousands of feet. It is wound or coiled on a truck-mounted reel for onshore applications. Due to its small diameter, coiled tubing can be inserted into existing production tubing and used to perform a variety of services to enhance the flow of oil or natural gas without using a larger, more costly workover rig. The principal advantages of using coiled tubing in a workover include the ability to (i) continue production from the well without interruption, thus reducing the risk of formation damage, (ii) move continuous coiled tubing in and out of a well significantly faster than conventional pipe in the case of a workover rig, which must be jointed and unjointed, (iii) direct fluids into a wellbore with more precision, allowing for improved stimulation fluid placement, (iv) provide a source of energy to power a downhole mud motor or manipulate down-hole tools and (v) enhance access to remote fields due to the smaller size and mobility of a coiled tubing unit. As of
December 31, 2018
, we had one coiled tubing unit capable of running 23,000 feet of two and three eighths inch coil rated at 15,000 pounds per square inch, or psi, one coiled tubing unit capable of running over 22,000 feet of two inch coil rated at 15,000 psi, two coiled tubing units capable of running over 22,000 feet of two inch coil rated at 10,000 psi and two coiled tubing units capable of running over 20,000 feet of two and three eighths inch coil rated at 15,000 psi in service. Subsequent to
December 31, 2018
, we took possession of a new coiled tubing unit capable of running 25,000 feet of two and five eighths inch coil rated at 15,000 psi.
Pressure Control
. Our pressure control services consist of nitrogen and fluid pumping services. Our pressure control services equipment is designed to support activities in unconventional resource plays with the ability to operate under high pressures without having to delay or cease production during completion operations. Ceasing or suppressing production during the completion phase of an unconventional well could result in formation damage impacting the overall recovery of reserves. Our pressure control services help operators minimize the risk of such damage during completion activities. As of
December 31, 2018
, we had a total of
four
nitrogen pumping units and
seven
fluid pumping units. We provide pressure control services in the Eagle Ford Shale in South Texas and the Permian Basin in West Texas.
|
•
|
Nitrogen Services.
Nitrogen services involve the use of nitrogen, an inert gas, in various pressure pumping operations. When provided as a stand-alone service, nitrogen is used in displacing fluids in various oilfield applications. As of
December 31, 2018
, we had a total of
four
nitrogen pumping units capable of pumping at a rate of up to 3,000 standard cubic feet per minute with pressures up to 10,000 psi. Pumping at these rates and pressures is typically required for the unconventional oil and natural gas resource plays we serve.
|
|
•
|
Fluid Pumping Services.
Fluid pumping services consist of maintaining well pressure, pumping down wireline tools, assisting coiled tubing units and the removal of fluids and solids from the wellbore for clean-out operations. As of
|
7
December 31, 2018
, we had
seven
fluid pumping units. Five of these units are coiled tubing double pump units capable of output of up to eight barrels per minute, and are rated for pressures up to 15,000 psi. Two of these units are quintuplex pump units capable of output of up to 15 barrels per minute, and are rated for pressures up to 15,000 psi.
Flowback
. Our flowback services consist of production testing, solids control, hydrostatic testing and torque services. Flowback involves the process of allowing fluids to flow from the well following a treatment, either in preparation for an impending phase of treatment or to return the well to production. Our flowback equipment consists of manifolds, accumulators, valves, flare stacks and other associated equipment that combine to form up to a total of five well-testing spreads. We provide flowback services in the Appalachian Basin, the Eagle Ford Shale, the Haynesville Shale and mid-continent markets.
|
•
|
Production Testing.
Production testing focuses on testing production potential. Key measurements are recorded to determine activity both above and below ground. Production testing and the knowledge it provides help our customers determine where they can more efficiently deploy capital. As of
December 31, 2018
, we had five production testing packages.
|
|
•
|
Solids Control.
Solids control services provide prepared drilling fluids for drilling rigs with equipment such as sand separators and plug catchers. These services reduce costs throughout the entire drilling process. As of
December 31, 2018
, we had 20 solids control packages.
|
|
•
|
Hydrostatic Testing.
Hydrostatic testing is a procedure in which pressure vessels, such as pipelines, are tested for damage or leaks. This method of testing helps maintain safety standards and increases the durability of the pipeline. We employ hydrostatic testing at industry standards and to a customer’s desired specifications and configuration. As of
December 31, 2018
, we had four hydrostatic testing packages.
|
|
•
|
Torque Services.
Torque refers to the force applied to a rotary device to make it rotate. We offer a comprehensive range of torque services, offering a customer the dual benefit of reducing costs on the rig as well as reducing hazards for both personnel and equipment. We had seven torque service packages as of
December 31, 2018
.
|
Cementing and Acidizing
. Cementing services involve preparing and pumping cement into place in a wellbore to support and protect well casings and help achieve zonal isolation. Acidizing services involve pumping acid into a wellbore to improve productivity or injectivity. We currently own 13 twin cementers and associated equipment and seven acidizing pumps. We provide cementing and acidizing services in the Permian Basin.
Equipment Rentals
. Our equipment rental services provide a wide range of oilfield related equipment used in drilling, flowback and hydraulic fracturing services. Our equipment rentals consist of cranes, light plants and other oilfield related equipment. We provide equipment rental in the Utica Shale, Eagle Ford Shale and mid-continent region.
Crude Oil Hauling
. We provide crude transportation services in the Permian Basin and mid-continent region. As of
December 31, 2018
, we had a fleet of 51 crude oil hauling trucks.
Remote Accommodations.
Our remote accommodations business provides housing, kitchen and dining, and recreational service facilities for oilfield workers located in remote areas away from readily available lodging. We provide a turnkey solution for our customers’ accommodation needs. These modular camps, when assembled together, form large dormitories, with kitchen/dining facilities and recreation areas. These camps are operated as “all inclusive,” where meals are prepared and provided for the guests. The primary revenue source for these camps is lodging fees. As of
December 31, 2018
, we had a capacity of 1,005 rooms, 877 of which are at Sand Tiger Lodge, our camp in northern Alberta, Canada, and 128 of which are available to be leased as rental equipment to a third party. As of December 31, 2018, 401 of our rooms were utilized.
Our Industries
Electric Infrastructure Industry
The electrical infrastructure industry involves the construction and maintenance of the electrical power grid, including, but not limited to, power generation, high voltage transmission lines, substations and low voltage distribution lines, all of which connect power generation facilities to end users. The industry also provides storm repair and restoration services in response to storms and other disasters, including hurricanes Florence, Michael and Maria. The industry is highly fragmented with more than 3,300 separate utility companies identified in the United States in 2018, spread across the following subgroups: IOUs, private utilities and Co-Ops.
Demand for our services is driven by the construction of transmission lines, substations and distribution networks and is determined by the level of expenditures of utility companies. While expansion of the electrical grid is occurring, the majority of capital expenditures spent in recent years has surrounded the repair and maintenance of existing networks. Another factor
8
that significantly influences the level of spending in the industry are natural disasters, which impact the electrical grid. These natural disasters include, but are not limited to, thunderstorms, ice storms, snow storms, tornadoes, hurricanes, earthquakes, wildfires and lightning strikes.
Certain barriers to entry exist in the markets in which we operate, including adequate financial resources, technical expertise, high safety ratings and a proven track record of operational success. We compete based upon our industry experience, technical expertise, financial and operational resources, geographic presence, industry reputation, our safety record and customer service. While we believe our customers consider a number of factors when selecting a service provider, they award most of their work through a bid process, although our work with PREPA has not been obtained through a formal bid process. Consequently, price is often a principal factor in determining which service provider is selected.
We believe that the age of the existing infrastructure across the United States and the spending trends in North America will benefit our operations and our ability to achieve our business objectives.
Oil and Natural Gas Industry
The oil and natural gas industry has traditionally been volatile and is influenced by a combination of long-term, short-term and cyclical trends, including the domestic and international supply and demand for oil and natural gas, current and expected future prices for oil and natural gas and the perceived stability and sustainability of those prices, production depletion rates and the resultant levels of cash flows generated and allocated by exploration and production companies to their drilling, completion and related services and products budget. The oil and natural gas industry is also impacted by general domestic and international economic conditions, political instability in oil producing countries, government regulations (both in the United States and elsewhere), levels of customer demand, the availability of pipeline capacity and other conditions and factors that are beyond our control.
Demand for most of our oil and natural gas products and services depends substantially on the level of expenditures by companies in the oil and natural gas industry. The levels of capital expenditures of our customers are predominantly driven by the oil and natural gas prices. Over the past several years, commodity prices, particularly oil, has seen significant volatility with pricing ranging from a high of $110.53 per barrel on September 6, 2013 to a low of $26.19 per barrel on February 11, 2016. During early 2017, oil prices stabilized around the $50 per barrel level and started a gradual upward trend which continued into the fourth quarter of 2018, when oil prices peaked at $76.41 on October 3, 2018. Due to certain factors related to world politics and major oil producers, the price of oil experienced increased volatility during the fourth quarter of 2018, with prices falling to a low of $42.53 on December 24, 2018.
We anticipate demand for our oil and natural gas services and products will continue to be dependent on the level of expenditures by companies in the oil and natural gas industry and, ultimately, commodity prices. We experienced a weakening in demand for our oilfield services beginning in the third quarter of 2018 and accelerating in the fourth quarter of 2018 as a result of oil prices softening and budget exhaustion. If commodity prices stabilize at current levels or continue to increase, we expect the capital expenditures of our customers would increase above the levels we saw in the fourth quarter of 2018, which in turn should increase demand for our services and products, particularly in our completion and production, natural sand proppant and contract land and directional drilling businesses. Decreases in commodity prices, however, would be expected to result in a reduction in the capital expenditures of our customers and impact the demand for our drilling, completion and other products and services.
Although the ongoing volatility and depressed levels of activity are expected to persist until supply and demand for oil and natural gas come into balance, we believe that the following trends in our industry should benefit our operations and our ability to achieve our primary business objective as commodity prices recover:
|
•
|
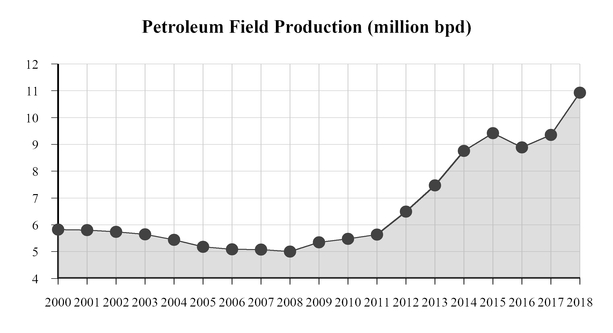
Increased U.S. Petroleum field Production.
According to the U.S. Energy Information Administration, or EIA, U.S. average petroleum field production was approximately 10.9 million barrels per day during 2018, an increase of 16.8% from 2018, with December 2018 average production of approximately 11.8 million barrels per day. U.S. average petroleum field production has grown at a compound annual growth rate of 7.4% over the period from 2009 through 2018 due to production gains from unconventional reservoirs. We expect that this continued growth will result in increased demand for our services as commodity prices continue to stabilize and increase.
|
9
|
•
|
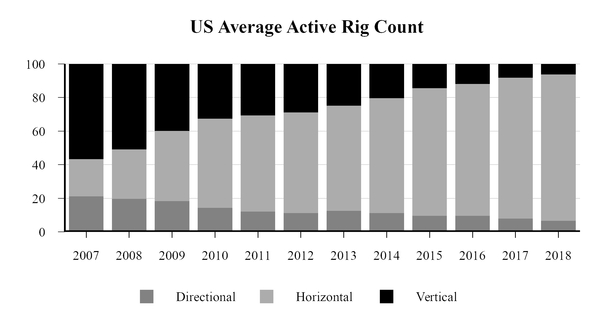
Increased use of horizontal drilling to develop unconventional resource plays.
According to Baker Hughes, the horizontal rig count on December 28, 2018 was 945, or approximately 87% of the total U.S. onshore rig count. The overall onshore rig count increased significantly from May 2016 to December 2018 from 404 rigs operating to 1083 rigs operating. The horizontal rig count as a percentage of the overall onshore rig count has increased every year since 2007 when horizontal rigs represented only approximately 25% of the total U.S. onshore rig count at year-end. As a result of improvements in drilling and production enhancement technologies, oil and natural gas companies are increasingly developing unconventional resources such as tight sands and shales. Successful and economic production of these unconventional resource plays frequently requires horizontal drilling, fracturing and stimulation services. Drilling related activity for unconventional resources is typically done on tighter acre spacing and thus requires that more wells be drilled relative to conventional resources. We believe that all of these characteristics will drive the demand for our services in an improved commodity price environment.
|
|
•
|
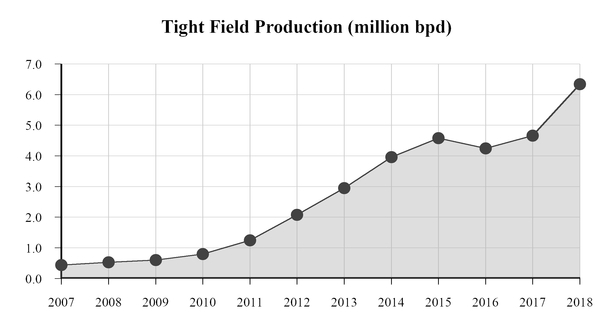
Tight oil production growth is expected to continue to be the primary driver of U.S. oil production growth.
According to the EIA, U.S. tight oil production grew from approximately 430,000 barrels per day in 2007 to over 6.3 million barrels per day in 2018, representing approximately 58% of total U.S. crude oil production in 2018. A majority of this increase came from the Eagle Ford play in South Texas, the SCOOP/STACK plays in the mid-continent of Oklahoma,
|
10
the Bakken Shale in the Williston Basin of North Dakota and Montana, and the Permian Basin in West Texas. We believe the Utica Shale and the Permian Basin, our primary business locations, will be key drivers of U.S. tight oil and natural gas production as those plays are developed further in the coming years due to the favorable well economics in those basins.
|
•
|
Horizontal wells are heavily dependent on oilfield services.
According to Baker Hughes, as of December 28, 2018, horizontal rigs accounted for approximately 88% of all rigs drilling in the United States, up from 25% at year-end 2007. The scope of services for a horizontal well are greater than for a conventional well. Industry analysts report that the average horsepower, length of the lateral and number of fracture stages has continued to increase since 2008. We believe our commitment to provide services in unconventional plays, such as the Utica Shale and the Permian Basin, provide us the opportunity to compete in those regional markets where the majority of total footage is drilled each year in the United States.
|
|
•
|
New and emerging unconventional resource plays.
In addition to the development of existing unconventional resource plays such as the Permian, Utica, Bakken, Eagle Ford, Barnett, Fayetteville, Cotton Valley, Haynesville, Marcellus and Woodford Shales, exploration and production companies continue to find new unconventional resources. These include oil and liquids-based shales in the Cana Woodford, Granite Wash, Niobrara, Woodford and SCOOP/STACK resource plays. In certain cases, exploration and production companies have acquired vast acreage positions in these plays that require them to drill and produce hydrocarbons to hold the leased acreage. We believe these unconventional resource plays will increasingly drive demand for our services as commodity prices continue to recover as they typically require the use of extended reach horizontal drilling, multiple stage fracture stimulation and high pressure completion capabilities. We also believe we are well positioned to expand our services in two major unconventional plays, the Utica Shale in Ohio and the Permian Basin in West Texas.
|
|
•
|
Need for additional drilling activity to maintain production levels.
With the increased maturity of the onshore conventional and, in many cases, unconventional resource plays, oil and natural gas production may be characterized as having steeper initial decline curves. Given average decline rates and the substantial reduction in activity over the past year, we believe that the number of wells drilled is likely to increase in coming years as commodity prices continue to recover. Once a well has been drilled, it requires recurring production and completion services, which we believe will also drive demand for our services.
|
11
Natural Sand Proppant Industry
Demand growth for frac sand and other proppants is primarily driven by advancements in oil and natural gas drilling and well completion technology and techniques, such as horizontal drilling and hydraulic fracturing, as well as overall industry activity growth. These advancements have made the extraction of oil and natural gas increasingly cost-effective in formations that historically would have been unprofitable to develop, resulting in a greater number of wells being drilled. We believe that demand for proppant will grow over the long-term, primarily driven by the increase in the average amount of proppant consumed per horizontal rig and as a result of the following demand drivers:
|
•
|
improvements in drilling rig productivity (from, among other things, pad drilling), resulting in more wells drilled per rig per year;
|
|
•
|
increases in the number of wells drilled per acre;
|
|
•
|
increases in the length of the typical horizontal wellbore;
|
|
•
|
increases in the number of fracture stages per lateral foot in the typical completed horizontal wellbore;
|
|
•
|
increases in the volume of proppant used per fracturing stage; and
|
|
•
|
recurring efforts to offset steep production declines in unconventional oil and natural gas reservoirs, including the drilling of new wells and secondary hydraulic fracturing of existing wells.
|
Demand declined in the second half of 2018 as a result of budget exhaustion and pipeline take-away constraints among other factors. We expect demand to improve in 2019 as some of these factors limiting demand are alleviated. Additionally, the number of drilled but uncompleted wells has increased from 6,548 as of December 31, 2017 to 8,591 as of December 31, 2018, representing a buildup of demand for completion services and thus, we expect increased demand for proppant in 2019.
In 2018, several new and existing suppliers completed planned capacity additions of frac sand supply, particularly in the Permian Basin. The industry expansion coupled with budget exhaustion caused the frac sand market to become oversupplied, particularly in finer grades, during the second half of 2018. With the frac sand market oversupplied, pricing for certain grades have fallen significantly from the peaks experienced during the first half of 2018. Given the mix of grades of sand used to complete modern unconventional wells, we believe that certain of the grades we produce will remain in demand in the coming years.
Our proppant sand reserves consist of Northern White silica sand, giving us access to a range of high-quality sand grades meeting or exceeding all API specifications, including a mix between concentrations of coarse grades (20/40 and 30/50 mesh size) and finer grades (40/70 and 100 mesh size). Our sample boring data and our historical production data have indicated that our reserves contain deposits of approximately 60% 40 mesh size or finer substrate. The coarseness and conductivity of Northern White frac sand significantly enhances recovery of oil and liquids-rich gas by allowing hydrocarbons to flow more freely than is sometimes possible with native sand. The low acid-solubility increases the integrity of Northern White frac sand relative to other proppants with higher acid-solubility, especially in shales where hydrogen sulfide and other acidic chemicals are co-mingled with the targeted hydrocarbons. In addition, its crush resistant properties enable Northern White frac sand to be used in deeper drilling applications than the frac sand produced from many native mineral deposits.
We believe that the coarseness, conductivity, sphericity, acid-solubility, and crush-resistant properties of our Northern White sand reserves and our facilities’ connectivity to rail and other transportation infrastructure afford us an advantage over our competitors and make us one of a select group of sand producers capable of delivering high volumes of frac sand that is optimal for oil and natural gas production to all major unconventional resource basins currently producing throughout North America.
Our Strengths
Our primary business objective is to grow our operations and create value for our stockholders through organic growth opportunities and accretive acquisitions. We believe that the following strengths position us well to capitalize on activity in unconventional resource plays and achieve our primary business objective:
|
•
|
Long-term contractual and other regional relationships with a stable customer base.
We are party to two long-term contracts with Gulfport to provide pressure pumping services and natural sand proppant services through December 2021. In addition, our operational division heads and field managers have formed long-term relationships with our customer base. We believe these contractual and other relationships help provide us a more stable and growth-oriented client base in the unconventional shale markets as well as the infrastructure markets that we currently serve. Our customers include large independent oil and natural gas exploration and production companies, government-funded
|
12
utilities, private utilities, public IOUs and Co-Ops. For the year ended
December 31, 2018
, our top five customers, representing
77%
of our revenue, were PREPA, Gulfport, Roan Resources, Blue Ridge and HG Energy. For the year ended
December 31, 2017
, our top five customers, representing
71%
of our revenue, were Gulfport, PREPA, Newfield, Rice Energy and Surge Operating.
|
•
|
Strategic geographic positioning, including primary presence in the Utica Shale, the SCOOP/STACK and the Permian Basin.
We currently operate facilities and service centers to support our operations in major unconventional resource plays in the United States, including the Utica Shale in Eastern Ohio, the Permian Basin in West Texas, the SCOOP/STACK in Oklahoma, the Marcellus Shale in West Virginia, the Granite Wash in Oklahoma and Texas, the Cana Woodford Shale and the Cleveland Sand in Oklahoma, the Eagle Ford Shale in South Texas and the oil sands in Alberta, Canada. We believe our geographic positioning within active oil and natural gas liquids resource plays will benefit us strategically as activity increases in these unconventional resource plays.
|
|
•
|
Experienced management and operating team.
Our operational division heads have an extensive track record in the oilfield and infrastructure service businesses with an average of over 25 years of infrastructure services experience and over 35 years of oilfield services experience. In addition, our field managers have expertise in the areas in which they operate and understand the regional challenges that our customers face. We believe their knowledge of our industries and business lines enhances our ability to provide innovative, client-focused and basin-specific customer service, which we also believe strengthens our relationships with our customers.
|
|
•
|
Modern fleet of hydraulic fracturing equipment designed for horizontal wells
. Our service fleet is predominantly comprised of equipment designed to optimize recovery from unconventional wells. Three of our pressure pumping fleets with total combined horsepower of 132,500 were built in 2017. We believe that our modern fleet of quality equipment will allow us to provide a high level of service to our customers and capitalize on future growth in the unconventional resource plays that we serve.
|
Our Business Strategy
We intend to achieve our primary business objective in connection with our infrastructure services by the successful execution of our business plan to strategically deploy equipment and personnel to provide infrastructure services in Puerto Rico as well as the northeast, southwest and midwest portions of the United States. In the case of our oilfield services, we intend to achieve our primary business objective by the successful execution of our business plan to strategically deploy our equipment and personnel to provide pressure pumping services, natural sand proppant services and other energy services in unconventional resource plays, including the Utica Shale in Ohio, the SCOOP/STACK in Oklahoma and the Permian Basin in West Texas. We believe our infrastructure services optimize our customers’ ability to maintain, improve and expand their infrastructure and that our oil and natural gas services optimize our customers’ ultimate resources recovery and present value of hydrocarbon reserves. We seek to create cost efficiencies for our customers by providing a suite of complementary services designed to address a wide range of our customers’ needs. Specifically, we strive to create value for our stockholders through the following strategies:
|
•
|
Leverage our broad range of services for cross-selling opportunities.
We offer a complementary suite of services and products. Our infrastructure services division provides construction, upgrade, maintenance and repair services to the electrical infrastructure industry. Our pressure pumping services provide hydraulic fracturing services for unconventional wells as well as sand hauling services and water transfer services. Our natural sand proppant services division mines, processes and sells natural sand proppant for hydraulic fracturing. Additionally, we provide contract land and directional drilling services, coil tubing services, pressure control services, flowback services, cementing services, acidizing services, equipment rentals, crude oil hauling and remote accommodations. We intend to leverage our existing customer relationships and operational track record to cross sell our services and increase our exposure and product offerings to our existing customers, broaden our customer base and expand opportunistically to other geographic regions in which our customers have operations, as well as to create operational efficiencies for our customers.
|
|
•
|
Expand through selected, accretive acquisitions.
To complement our organic growth, we intend to actively pursue selected, accretive acquisitions of businesses and assets, primarily related to our completion and production services, infrastructure services and natural sand proppant services, that can meet our targeted returns on invested capital and enhance our portfolio of products and services, market positioning and/or geographic presence. We believe this strategy will facilitate the continued expansion of our customer base, geographic presence and service offerings. We also believe that our industry contacts and those of Wexford, our equity sponsor and largest stockholder, may be
|
13
helpful to facilitate the identification of acquisition opportunities. We may use our common stock as consideration for accretive acquisitions.
|
•
|
Maintain a conservative balance sheet.
We seek to maintain a conservative balance sheet, which allows us to better react to changes in commodity prices and related demand for our services, as well as overall market conditions. During 2018, we used a portion of our cash flows from operations to repay our outstanding debt and, as of
December 31, 2018
, had zero borrowings outstanding and a cash balance of
$68 million
.
|
|
•
|
Expand our services to meet expanding customer demand.
The scope of services for horizontal wells is greater than that for conventional wells. Industry analysts have reported that the average horsepower required for current completion designs, amount of sand per lateral foot, length of lateral and number of fracture stages has continued to increase since 2008. We consistently monitor market conditions and intend to expand the capacity and scope of our business lines as demand warrants in resource plays in which we currently operate, as well as in new resource plays. If we perceive unmet demand in our principal geographic locations for different service lines, we will seek to expand our current service offerings to meet that demand.
|
|
•
|
Expand our energy infrastructure business unit in the Lower 48.
Industry analysts have reported that spending in the T&D industry will exceed $60 billion each year through 2022. We consistently monitor market conditions and intend to expand the capacity and scope of our energy infrastructure services as demand warrants in geographic areas in which we currently operate, as well as in new geographic areas.
|
|
•
|
Leverage our experienced operational management team expertise.
We seek to manage the services we provide as closely as possible to the needs of our customer base. Our operational division heads have long-term relationships with our largest customers. We intend to leverage these relationships and our operational management team’s expertise to deliver innovative, client focused and services to our customers.
|
|
•
|
Capitalize on activity in the unconventional resource plays.
Our oil and natural gas service equipment is designed to provide a broad range of services for unconventional wells, and our operations are strategically located in major unconventional resource plays. During 2017, the posted price for WTI stabilized and increased following the significant declines experienced in 2016. The average price per barrel in 2018 was $64.81 with a low of $42.53 per barrel on December 24, 2018 and a high of $76.41 per barrel on October 3, 2018. If commodity prices stabilize at current levels or recover further, we expect to experience further increases in demand for our services and products. We intend to capitalize on the anticipated increase in activity in these markets and diversify our operations across additional unconventional resource basins. Our core operations are currently focused in the Utica Shale in Ohio, the SCOOP/STACK in Oklahoma and the Permian Basin in West Texas. We intend to continue to strategically deploy assets to these and other unconventional resource basins and will look to capitalize on further growth in emerging unconventional resource plays as they develop.
|
Marketing and Customers
Our customers consist primarily of government-funded utilities, private utilities, IOUs, Co-Ops, independent oil and natural gas producers and land-based drilling contractors in North America. For the years ended
December 31, 2018
and
2017
, we had approximately 460 and 364 customers, respectively, including PREPA, Gulfport, Roan Resources, Blue Ridge and HG Energy. Our top five customers accounted for approximately
77%
,
71%
, and
80%
, respectively, of our revenue for the years ended
December 31, 2018
,
2017
and
2016
. During the year ended
December 31, 2018
, PREPA and Gulfport accounted for
60%
and
8%
, respectively, of our revenue. For the year ended
December 31, 2017
, Gulfport and PREPA accounted for
30%
and
29%
, respectively, of our revenue. For the year ended
December 31, 2016
, Gulfport and Oil Sands Limited accounted for
57%
and 11%, respectively, of our revenue. Although we believe we have a broad customer base and wide geographic coverage of operations, it is likely that we will continue to derive a significant portion of our revenue from a relatively small number of customers in the future. If a major customer decided not to continue to use our services, revenue could decline and our operating results and financial condition could be harmed.
Infrastructure Services Backlog
Estimated backlog for our infrastructure services represents the amount of revenue we expect to realize over the next 36 months from future work on uncompleted construction projects, including new contracts under which work has not begun. Our estimated backlog also includes amounts payable to us under master service and other service agreements, including demobilization costs in the case of Puerto Rico. Estimated infrastructure services backlog for work under master service and other service agreements is determined based on historical trends, experience from similar projects and estimates of customer
14
demand based on communications with our customers. As of
December 31, 2018
, our infrastructure services backlog was $765 million, of which $625 million is attributable to operations in the continental United States and $140 million is attributable to operations in Puerto Rico. In 2019, we expect to realize approximately $200 million of our continental United States backlog and all $140 million of our Puerto Rico backlog for a total of $340 million.
Approximately $691 million of our infrastructure services backlog as of
December 31, 2018
is attributable to amounts under master service or other service agreements pursuant to which our customers are not contractually committed to purchase a minimum amount of services. Most of these agreements can be canceled on short or no advance notice. Timing of revenue for our infrastructure services backlog can be subject to change as a result of our delays, customer delays, regulatory delays or other factors. These changes could cause estimated revenue to be realized in periods later than originally expected, or not at all. We occasionally experience postponements, cancellations and reductions in expected future work from master service agreements or other service agreements due to changes in our customers’ spending plans, market volatility, governmental funding and regulatory factors. There can be no assurance as to our customers’ requirements or the accuracy of our estimates. As a result, our backlog as of any particular date is an uncertain indicator of future revenue and earnings.
Backlog is not a term recognized under accounting principles generally accepted in the United States; however, it is a common measurement used in the infrastructure industry. As such, our methodology for determining backlog is not comparable to the methodologies used by others.
Operating Risks and Insurance
Our operations are subject to hazards inherent in the energy services industry, such as accidents, blowouts, explosions, fires and spills and releases that can cause:
|
•
|
personal injury or loss of life;
|
|
•
|
damage or destruction of property, equipment, natural resources and the environment; and
|
|
•
|
suspension of operations.
|
In addition, claims for loss of oil and natural gas production and damage to formations can occur in the oilfield services industry. If a serious accident were to occur at a location where our equipment and services are being used, it could result in us being named as a defendant in lawsuits asserting large claims.
Because our business involves the transportation of heavy equipment and materials, we may also experience traffic accidents which may result in spills, property damage and personal injury.
Despite our efforts to maintain safety standards, from time to time we have suffered accidents in the past and anticipate that we could experience accidents in the future. In addition to the property damage, personal injury and other losses from these accidents, the frequency and severity of these incidents affect our operating costs and insurability and our relationships with customers, employees, regulatory agencies and other parties. Any significant increase in the frequency or severity of these incidents, or the general level of compensation awards, could adversely affect the cost of, or our ability to obtain, workers’ compensation and other forms of insurance, and could have other material adverse effects on our financial condition and results of operations.
We maintain commercial general liability, workers’ compensation, business auto, commercial property, motor truck cargo, umbrella liability, in certain instances, excess liability, and directors and officers insurance policies providing coverages of risks and amounts that we believe to be customary in our industry. With respect to our hydraulic fracturing operations, coverage would be available under our policy for any surface or subsurface environmental clean-up and liability to third parties arising from any surface or subsurface contamination. We also have certain specific coverages for some of our businesses, including our remote accommodation services, pressure pumping services and contract and directional drilling services.
Although we maintain insurance coverage of types and amounts that we believe to be customary in the industry, we are not fully insured against all risks, either because insurance is not available or because of the high premium costs relative to perceived risk. Further, insurance rates have in the past been subject to wide fluctuation and changes in coverage could result in less coverage, increases in cost or higher deductibles and retentions. Liabilities for which we are not insured, or which exceed the policy limits of our applicable insurance, could have a material adverse effect on us. See Item 1A. “
Risk Factors
” on page
23
of this annual report for a description of certain risks associated with our insurance policies.
Safety and Remediation Program
15
In the energy services industry, an important competitive factor in establishing and maintaining long-term customer relationships is having an experienced and skilled workforce. Many of our large customers place an emphasis not only on pricing, but also on safety records and quality management systems of contractors. We have committed resources toward employee safety and quality management training programs. Our field employees are required to complete both technical and safety training programs. Further, as part of our safety program and remediation procedures, we check treating iron for any defects on a periodic basis to avoid iron failure during hydraulic fracturing operations, marking such treating iron to reflect the most recent testing date. We also regularly monitor pressure levels in the treating iron used for fracturing and the surface casing to verify that the pressure and flow rates are consistent with the job specific model in an effort to avoid failure. As part of our safety procedures, we also have the capability to shut down our pressure pumping and fracturing operations both at the pumps and in our data van. In addition, we maintain spill kits on location for containment of pollutants that may be spilled in the process of providing our hydraulic fracturing services. The spill kits are generally comprised of pads and booms for absorption and containment of spills, as well as soda ash for neutralizing acid. Fire extinguishers are also in place on job sites at each pump.
Historically, we have used third-party contractors to provide remediation and spill response services when necessary to address spills that were beyond our containment capabilities. None of these prior spills were significant, and we have not experienced any incidents, citations or legal proceeding relating to our hydraulic fracturing services for environmental concerns. To the extent our hydraulic fracturing or other energy services operations result in a future spill, leak or other environmental impact that is beyond our ability to contain, we intend to engage the services of such remediation company or an alternative company to assist us with clean-up and remediation.
Competition
The markets in which we operate are highly competitive. To be successful, a company must provide services and products that meet the specific needs of oil and natural gas exploration and production companies, drilling services contractors, government-funded utilities, private utilities, IOUs and Co-Ops at competitive prices.
We provide our services and products across the United States, Puerto Rico and in Alberta, Canada and we compete against different companies in each service and product line we offer. Our competition includes many large and small energy service companies, including the largest integrated oilfield services companies and energy infrastructure companies. Our major competitors for our infrastructure services business include MYR Group, Inc, Quanta Services, Inc, MasTec, Inc. and EMCOR Group, Inc. Our major competitors in pressure pumping services include Halliburton Company, U.S. Well Services, LLC, Schlumberger Limited, Keane Group, Inc., C&J Energy Services Ltd., RPC Incorporated, Complete Energy Services, Inc., Liberty Oilfield Services, Inc. and FTS International, Inc. Our major competitors in our natural sand proppant services business are Badger Mining Corporation, Covia Holdings Corporation, Hi-Crush Partners LP, Preferred Proppants LLC, Smart Sand, Inc., Emerge Energy Services LP and U.S. Silica Holdings Inc.
We believe that the principal competitive factors in the market areas that we serve are quality of service and products, reputation for safety and technical proficiency, availability and price. While we must be competitive in our pricing, we believe our customers select our services and products based on the local leadership and expertise that our field management and operating personnel use to deliver quality services and products.
Regulation
We operate under the jurisdiction of a number of regulatory bodies that regulate worker safety standards, permitting and inspection requirements applicable to construction projects, building and electrical codes regulations, government project regulations, the handling of hazardous materials, the transportation of explosives, the protection of human health and the environment and driving standards of operation. Regulations concerning equipment certification create an ongoing need for regular maintenance which is incorporated into our daily operating procedures. The oil and natural gas and infrastructure industries are subject to environmental and other regulation pursuant to local, state and federal legislation.
Regulation of Infrastructure Services
In our infrastructure business, our operations are subject to various federal, state and local laws and regulations including:
|
•
|
licensing, permitting and inspection requirements applicable to contractors, electricians and engineers;
|
|
•
|
regulations relating to worker safety;
|
|
•
|
permitting and inspection requirements applicable to construction projects;
|
16
|
•
|
wage and hour regulations;
|
|
•
|
building and electrical codes; and
|
|
•
|
special bidding, procurement and other requirements on government projects.
|
We believe that we have all the licenses required to conduct our energy infrastructure services and that we are in
substantial compliance with applicable regulatory requirements. Our failure to comply with applicable regulations could result in substantial fines or revocation of our operating licenses, as well as give rise to termination or cancellation rights under our contracts or disqualify us from future bidding opportunities.
Transportation Matters
In connection with the transportation and relocation of our equipment and shipment of frac sand, we operate trucks and other heavy equipment. As such, we operate as a motor carrier in providing certain of our services and therefore are subject to regulation by the United States Department of Transportation and by various state agencies. These regulatory authorities exercise broad powers, governing activities such as the authorization to engage in motor carrier operations, driver licensing and insurance requirements, financial reporting and review of certain mergers, consolidations and acquisitions, and transportation of hazardous materials (HAZMAT). Our trucking operations are subject to possible regulatory and legislative changes that may increase our costs. Some of these possible changes include increasingly stringent environmental regulations, changes in the hours of service regulations which govern the amount of time a driver may drive or work in any specific period, onboard black box recorder device requirements or limits on vehicle weight and size.
Interstate motor carrier operations are subject to safety requirements prescribed by the Federal Motor Carrier Safety Administration, or FMCSA, a unit within the United States Department of Transportation. To a large degree, intrastate motor carrier operations are subject to state safety regulations that mirror federal regulations. Matters such as the weight and dimensions of equipment are also subject to federal and state regulations. From time to time, various legislative proposals are introduced, including proposals to increase federal, state or local taxes, including taxes on motor fuels, which may increase our costs or adversely impact the recruitment of drivers. We cannot predict whether, or in what form, any increase in such taxes applicable to us will be enacted.
Certain motor vehicle operators require registration with the Department of Transportation. This registration requires an acceptable operating record. The Department of Transportation periodically conducts compliance reviews and may revoke registration privileges based on certain safety performance criteria which could result in a suspension of operations. The rating scale consists of “satisfactory,” “conditional” and “unsatisfactory” ratings. As of
December 31, 2018
, all of our trucking operations have “satisfactory” ratings with the Department of Transportation. We have undertaken comprehensive efforts that we believe are adequate to comply with the regulations. Further information regarding our safety performance is available at the FMCSA website at www.fmcsa.dot.gov.
In December 2010, the FMCSA launched a program called Compliance, Safety, Accountability, or CSA, in an effort to improve commercial truck and bus safety. A component of CSA is the Safety Measurement System, or SMS, which analyzes all safety violations recorded by federal and state law enforcement personnel to determine a carrier’s safety performance. The SMS is intended to allow FMCSA to identify carriers with safety issues and intervene to address those problems. However, the agency has announced a future intention to revise its safety rating system by making greater use of SMS data in lieu of on-site compliance audits of carriers. At this time, we cannot predict the effect such a revision may have on our safety rating.
17
Environmental Matters and Regulation
Our operations are subject to stringent laws and regulations governing the discharge of materials into the environment or otherwise relating to environmental protection. Numerous federal, state and local governmental agencies, such as the U.S. Environmental Protection Agency, or the EPA, issue regulations that often require difficult and costly compliance measures that carry substantial administrative, civil and criminal penalties and may result in injunctive obligations for non-compliance. These laws and regulations may require the acquisition of a permit before commencing operations, restrict the types, quantities and concentrations of various substances that can be released into the environment in connection with our operations, limit or prohibit construction or drilling activities on certain lands lying within wilderness, wetlands, ecologically or seismically sensitive areas and other protected areas, require action to prevent or remediate pollution from current or former operations, such as plugging abandoned wells or closing pits, result in the suspension or revocation of necessary permits, licenses and authorizations, require that additional pollution controls be installed and impose substantial liabilities for pollution resulting from our operations or related to our owned or operated facilities. Liability under such laws and regulations is strict (i.e., no showing of “fault” is required) and can be joint and several. Moreover, it is not uncommon for neighboring landowners and other third parties to file claims for personal injury and property damage allegedly caused by the release of hazardous substances, hydrocarbons or other waste products into the environment. Changes in environmental laws and regulations occur frequently, and any changes that result in more stringent and costly pollution control or waste handling, storage, transport, disposal or cleanup requirements could materially adversely affect our operations and financial position, as well as the oil and natural gas industry and infrastructure industry in general. We have not experienced any material adverse effect from compliance with these environmental requirements. This trend, however, may not continue in the future.
Waste Handling
. We handle, transport, store and dispose of wastes that are subject to the federal Resource Conservation and Recovery Act, as amended, or RCRA, and comparable state statutes and regulations promulgated thereunder, which affect our activities by imposing requirements regarding the generation, transportation, treatment, storage, disposal and cleanup of hazardous and non-hazardous wastes. With federal approval, the individual states administer some or all of the provisions of RCRA, sometimes in conjunction with their own, more stringent requirements. Although certain petroleum production wastes are exempt from regulation as hazardous wastes under RCRA, such wastes may constitute “solid wastes” that are subject to the less stringent requirements of non-hazardous waste provisions.
Administrative, civil and criminal penalties can be imposed for failure to comply with waste handling requirements. Moreover, the EPA or state or local governments may adopt more stringent requirements for the handling of non-hazardous wastes or categorize some non-hazardous wastes as hazardous for future regulation. Indeed, legislation has been proposed from time to time in Congress to re-categorize certain oil and natural gas exploration, development and production wastes as “hazardous wastes.” Several environmental organizations have also petitioned the EPA to modify existing regulations to recategorize certain oil and natural gas exploration, development and production wastes as “hazardous.” Also, in December 2015, the EPA agreed in a consent decree to review its regulation of oil and gas waste. It has until March 2019 to determine whether any revisions are necessary. Any such changes in the laws and regulations could have a material adverse effect on our capital expenditures and operating expenses. Although we do not believe the current costs of managing our wastes, as presently classified, to be significant, any legislative or regulatory reclassification of oil and natural gas exploration and production wastes could increase our costs to manage and dispose of such wastes.
Remediation of Hazardous Substances
. The Comprehensive Environmental Response, Compensation and Liability Act, as amended, which we refer to as CERCLA, or the “Superfund” law, and analogous state laws, generally imposes liability, without regard to fault or legality of the original conduct, on classes of persons who are considered to be responsible for the release of a “hazardous substance” into the environment. These persons include the current owner or operator of a contaminated facility, a former owner or operator of the facility at the time of contamination and those persons that disposed or arranged for the disposal of the hazardous substance at the facility. Under CERCLA and comparable state statutes, persons deemed “responsible parties” are subject to strict liability, that, in some circumstances, may be joint and several for the costs of removing or remediating previously disposed substances (including substances disposed of or released by prior owners or operators) or property contamination (including groundwater contamination), for damages to natural resources and for the costs of certain health studies. In addition, it is not uncommon for neighboring landowners and other third parties to file claims for personal injury and property damage allegedly caused by the hazardous substances released into the environment. In the course of our operations, we use materials that, if released, would be subject to CERCLA and comparable state statutes. Therefore, governmental agencies or third parties may seek to hold us responsible under CERCLA and comparable state statutes for all or part of the costs to clean up sites at which such “hazardous substances” have been released.
NORM
. In the course of our operations, some of our equipment may be exposed to naturally occurring radioactive materials associated with oil and gas deposits and, accordingly may result in the generation of wastes and other materials containing naturally occurring radioactive materials, or NORM. NORM exhibiting levels of naturally occurring radiation in
18
excess of established state standards are subject to special handling and disposal requirements, and any storage vessels, piping and work area affected by NORM may be subject to remediation or restoration requirements. Because certain of the properties presently or previously owned, operated or occupied by us may have been used for oil and gas production operations, it is possible that we may incur costs or liabilities associated with NORM.
Water Discharges
. The Federal Water Pollution Control Act of 1972, as amended, also known as the “Clean Water Act,” the Safe Drinking Water Act, the Oil Pollution Act and analogous state laws and regulations promulgated thereunder impose restrictions and strict controls regarding the unauthorized discharge of pollutants, including produced waters and other gas and oil wastes, into navigable waters of the United States, as well as state waters. The discharge of pollutants into regulated waters is prohibited, except in accordance with the terms of a permit issued by the EPA or the state. The Clean Water Act and regulations implemented thereunder also prohibit the discharge of dredge and fill material into regulated waters, including jurisdictional wetlands, unless authorized by a permit issued by the U.S. Army Corps of Engineers, which we refer to as the Corps. On June 29, 2015, the EPA and the Corps jointly promulgated final rules redefining the scope of waters protected under the Clean Water Act. The rules are subject to ongoing litigation and have been stayed in more than half the States. Also, on December 11, 2018, the EPA and the Corps released a proposed rule that would replace the 2015 rule, and significantly reduce the waters subject to federal regulation under the Clean Water Act. The proposal is currently subject to public review and comment, after which additional legal challenges are anticipated. As a result of such recent developments, substantial uncertainty exists regarding the scope of waters protected under the Clean Water Act. To the extent the rule expands the range of properties subject to the Clean Water Act’s jurisdiction, certain energy companies could face increased costs and delays with respect to obtaining permits for dredge and fill activities in wetland areas.
The EPA has also adopted regulations requiring certain oil and natural gas exploration and production facilities to obtain individual permits or coverage under general permits for storm water discharges. In addition, on June 28, 2016, the EPA published a final rule prohibiting the discharge of wastewater from onshore unconventional oil and gas extraction facilities to publicly owned wastewater treatment plants, which regulations are discussed in more detail below under the caption “—Regulation of Hydraulic Fracturing.” Costs may be associated with the treatment of wastewater or developing and implementing storm water pollution prevention plans, as well as for monitoring and sampling the storm water runoff from certain of our facilities. Also, spill prevention, control and countermeasure plan requirements under federal law require appropriate containment berms and similar structures to help prevent the contamination of navigable waters. Some states also maintain groundwater protection programs that require permits for discharges or operations that may impact groundwater conditions. Noncompliance with these requirements may result in substantial administrative, civil and criminal penalties, as well as injunctive obligations.
Air Emissions
. The federal Clean Air Act, as amended, and comparable state laws and regulations, regulate emissions of various air pollutants through the issuance of permits and the imposition of other requirements. The EPA has developed, and continues to develop, stringent regulations governing emissions of air pollutants at specified sources. New facilities may be required to obtain permits before work can begin, and existing facilities may be required to obtain additional permits and incur capital costs in order to remain in compliance. For example, our sand proppant services operations are subject to air permits issued by the Wisconsin Department of Natural Resources regulating our emission of fugitive dust and other constituents. These and other laws and regulations may increase the costs of compliance for some facilities where we operate, and federal and state regulatory agencies can impose administrative, civil and criminal penalties for non-compliance with air permits or other requirements of the federal Clean Air Act and associated state laws and regulations. Obtaining or renewing permits has the potential to delay the development of oil and natural gas and infrastructure projects.
Climate Change
. In recent years, federal, state and local governments have taken steps to reduce emissions of carbon dioxide, methane and other greenhouse gases, collectively referred to as GHGs. The EPA has finalized a series of GHG monitoring, reporting and emissions control rules for the oil and natural gas industry, and the U.S. Congress has, from time to time, considered adopting legislation to reduce emissions. Almost one-half of the states have already taken measures to reduce emissions of GHGs primarily through the development of GHG emission inventories and/or regional GHG cap-and-trade programs. While we are subject to certain federal GHG monitoring and reporting requirements, our operations currently are not adversely impacted by existing federal, state and local climate change initiatives.
At the international level, in December 2015, the United States participated in the 21st Conference of the Parties of the United Nations Framework Convention on Climate Change in Paris, France. The resulting Paris Agreement calls for the parties to undertake “ambitious efforts” to limit the average global temperature, and to conserve and enhance sinks and reservoirs of GHGs. The Agreement went into effect on November 4, 2016. The Paris Agreement establishes a framework for the parties to cooperate and report actions to reduce GHG emissions. However, on June 1, 2017, President Trump announced that the United States would withdraw from the Paris Agreement, and begin negotiations to either re-enter or negotiate an entirely new agreement with more favorable terms for the United States. The Paris Agreement sets forth a specific exit process, whereby a
19
party may not provide notice of its withdrawal until three years from the effective date, with such withdrawal taking effect one year from such notice. It is not clear what steps the Trump Administration plans to take to withdraw from the Paris Agreement, whether a new agreement can be negotiated, or what terms would be included in such an agreement. Furthermore, in response to the announcement, many state and local leaders have stated their intent to intensify efforts to uphold the commitments set forth in the international accord.
Restrictions on emissions of methane or carbon dioxide that may be imposed could adversely affect the oil and natural gas industry by reducing demand for hydrocarbons and by making it more expensive to develop and produce hydrocarbons, either of which could have a material adverse effect on future demand for our services. At this time, it is not possible to accurately estimate how potential future laws or regulations addressing GHG emissions would impact our business.
In addition, there have also been efforts in recent years to influence the investment community, including investment
advisors and certain sovereign wealth, pension and endowment funds promoting divestment of fossil fuel equities and pressuring lenders to limit funding to companies engaged in the extraction of fossil fuel reserves. Such environmental activism and initiatives aimed at limiting climate change and reducing air pollution could interfere with our business activities, operations and ability to access capital. Furthermore, claims have been made against certain energy companies alleging that GHG emissions from oil and natural gas operations constitute a public nuisance under federal and/or state common law. As a result, private individuals or public entities may seek to enforce environmental laws and regulations against certain energy companies and could allege personal injury, property damages or other liabilities. While our business is not a party to any such litigation, we could be named in actions making similar allegations. An unfavorable ruling in any such case could significantly impact our operations and could have an adverse impact on our financial condition.
Moreover, climate change may cause more extreme weather conditions such as more intense hurricanes, thunderstorms, tornadoes and snow or ice storms, as well as rising sea levels and increased volatility in seasonal temperatures. Extreme weather conditions can interfere with our productivity and increase our costs and damage resulting from extreme weather may not be fully insured. However, at this time, we are unable to determine the extent to which climate change may lead to increased storm or weather hazards affecting our operations.
Endangered Species Act
Environmental laws such as the Endangered Species Act, as amended, or the ESA, may impact exploration, development and production activities on public or private lands. The ESA provides broad protection for species of fish, wildlife and plants that are listed as threatened or endangered in the U.S. Similar protections are offered to migratory birds under the Migratory Bird Treaty Act, though, in December 2017, the U.S. Fish and Wildlife Service provided guidance limiting the reach of the Act. Federal agencies are required to insure that any action authorized, funded or carried out by them is not likely to jeopardize the continued existence of listed species or modify their critical habitat. While some of our facilities may be located in areas that are designated as habitat for endangered or threatened species, we believe that we are in substantial compliance with the ESA. The U.S. Fish and Wildlife Service may identify, however, previously unidentified endangered or threatened species or may designate critical habitat and suitable habitat areas that it believes are necessary for survival of a threatened or endangered species, which could cause us to incur additional costs or become subject to operating restrictions or bans in the affected areas.
Regulation of Hydraulic Fracturing
A portion of our business is dependent on our ability to conduct hydraulic fracturing and horizontal drilling activities. Hydraulic fracturing is an important and common practice that is used to stimulate production of hydrocarbons, particularly natural gas, from tight formations, including shales. The process, which involves the injection of water, sand and chemicals (also called “proppants”) under pressure into formations to fracture the surrounding rock and stimulate production, is typically regulated by state oil and natural gas commissions. However, federal agencies have asserted regulatory authority over certain aspects of the process. For example, the EPA has taken the position that hydraulic fracturing with fluids containing diesel fuel is subject to regulation under the Underground Injection Control program, specifically as “Class II” Underground Injection Control wells under the Safe Drinking Water Act. In addition, on June 28, 2016, the EPA published a final rule prohibiting the discharge of wastewater from onshore unconventional oil and natural gas extraction facilities to publicly owned wastewater treatment plans. The EPA is also conducting a study of private wastewater treatment facilities (also known as centralized waste treatment, or CWT, facilities) accepting oil and natural gas extraction wastewater. The EPA is collecting data and information related to the extent to which CWT facilities accept such wastewater, available treatment technologies (and their associated costs), discharge characteristics, financial characteristics of CWT facilities and the environmental impacts of discharges from CWT facilities. Furthermore, legislation to amend the Safe Drinking Water Act, or SDWA, to repeal the exemption for hydraulic fracturing (except when diesel fuels are used) from the definition of “underground injection” and require federal
20
permitting and regulatory control of hydraulic fracturing, as well as legislative proposals to require disclosure of the chemical constituents of the fluids used in the fracturing process, were proposed in recent sessions of Congress.
On August 16, 2012, the EPA published final regulations under the federal Clean Air Act that establish new air emission controls for oil and natural gas production and natural gas processing operations. Specifically, the EPA’s rule package includes New Source Performance standards, which we refer to as NSP standards, to address emissions of sulfur dioxide and volatile organic compounds and a separate set of emission standards to address hazardous air pollutants frequently associated with oil and natural gas production and processing activities. The final rules seek to achieve a 95% reduction in volatile organic compounds emitted by requiring the use of reduced emission completions or “green completions” on all hydraulically-fractured wells constructed or refractured after January 1, 2015. The rules also establish specific new requirements regarding emissions from compressors, controllers, dehydrators, storage tanks and other production equipment. The EPA received numerous requests for reconsideration of these rules from both industry and the environmental community, and court challenges to the rules were also filed. In response, the EPA has issued, and will likely continue to issue, revised rules responsive to some of the requests for reconsideration. In particular, on May 12, 2016, the EPA amended the NSP standards to impose new standards for methane and VOC emissions for certain new, modified and reconstructed equipment, processes and activities across the oil and natural gas sector. However, in a March 28, 2017 executive order, President Trump directed the EPA to review the 2016 regulations and, if appropriate, to initiate a rulemaking to rescind or revise them consistent with the stated policy of promoting clean and safe development of the nation’s energy resources, while at the same time avoiding regulatory burdens that unnecessarily encumber energy production. On June 16, 2017, the EPA published a proposed rule to stay for two years certain requirements of the 2016 regulations, including fugitive emission requirements. Also, on October 15, 2018, the EPA published a proposed rule to significantly reduce regulatory burdens imposed by the 2016 regulations, including, for example, reducing the monitoring frequency for fugitive emissions and revising the requirements for pneumatic pumps at well sites. The above standards, to the extent implemented, as well as any future laws and their implementing regulations, may require us to obtain pre-approval for the expansion or modification of existing facilities or the construction of new facilities expected to produce air emissions, impose stringent air permit requirements, or mandate the use of specific equipment or technologies to control emissions.
In addition, on March 26, 2015, the Bureau of Land Management, or BLM, published a final rule governing hydraulic fracturing on federal and Indian lands. The rule requires public disclosure of chemicals used in hydraulic fracturing, implementation of a casing and cementing program, management of recovered fluids, and submission to the BLM of detailed information about the proposed operation, including wellbore geology, the location of faults and fractures, and the depths of all usable water. Also, on November 15, 2016, the BLM finalized a waste prevention rule to reduce the flaring, venting and leaking of methane from oil and gas operations on federal and Indian lands. The rule requires operators to use currently available technologies and equipment to reduce flaring, periodically inspect their operations for leaks, and replace outdated equipment that vents large quantities of gas into the air. The rule also clarifies when operators owe the government royalties for flared gas. On March 28, 2017, President Trump signed an executive order directing the BLM to review the above rules and, if appropriate, to initiate a rulemaking to rescind or revise them. Accordingly, on December 29, 2017, the BLM published a final rule to rescind the 2015 hydraulic fracturing rule; however, a coalition of environmentalists, tribal advocates and the State of California filed lawsuits challenging the rule rescission. Also, on April 4, 2018, a federal district court stayed certain provisions of the waste prevention rule and, on September 28, 2018, the BLM finalized revisions to the rule to reduce “unnecessary compliance burdens.” The States of California and New Mexico have challenged the scaled-back rule. At this time, it is uncertain when, or if, the rules will be implemented, and what impact they would have on our operations.
There are certain governmental reviews either underway or being proposed that focus on the environmental aspects of hydraulic fracturing practices. On December 13, 2016, the EPA released a study examining the potential for hydraulic fracturing activities to impact drinking water resources, finding that, under some circumstances, the use of water in hydraulic fracturing activities can impact drinking water resources. Also, on February 6, 2015, the EPA released a report with findings and recommendations related to public concern about induced seismic activity from disposal wells. The report recommends strategies for managing and minimizing the potential for significant injection-induced seismic events. Other governmental agencies, including the U.S. Department of Energy, the U.S. Geological Survey, and the U.S. Government Accountability Office, have evaluated or are evaluating various other aspects of hydraulic fracturing. These ongoing or proposed studies, depending on their degree of pursuit and whether any meaningful results are obtained, could spur initiatives to further regulate hydraulic fracturing, and could ultimately make it more difficult or costly for us to perform fracturing and increase our costs of compliance and doing business.
Several states and local jurisdictions in which we or our customers operate have adopted or are considering adopting regulations that could restrict or prohibit hydraulic fracturing in certain circumstances, impose more stringent operating standards and/or require the disclosure of the composition of hydraulic fracturing fluids. Any increased regulation of hydraulic fracturing could reduce the demand for our services and materially and adversely affect our reserves and results of operations.
21
There has been increasing public controversy regarding hydraulic fracturing with regard to the use of fracturing fluids, induced seismic activity, impacts on drinking water supplies, use of water and the potential for impacts to surface water, groundwater and the environment generally. A number of lawsuits and enforcement actions have been initiated across the country implicating hydraulic fracturing practices. If new laws or regulations that significantly restrict hydraulic fracturing are adopted, such laws could make it more difficult or costly for us to perform fracturing to stimulate production from tight formations as well as make it easier for third parties opposing the hydraulic fracturing process to initiate legal proceedings based on allegations that specific chemicals used in the fracturing process could adversely affect groundwater. In addition, if hydraulic fracturing is further regulated at the federal, state or local level, our customers’ fracturing activities could become subject to additional permitting and financial assurance requirements, more stringent construction specifications, increased monitoring, reporting and recordkeeping obligations, plugging and abandonment requirements and also to attendant permitting delays and potential increases in costs. Such legislative or regulatory changes could cause us or our customers to incur substantial compliance costs, and compliance or the consequences of any failure to comply by us could have a material adverse effect on our financial condition and results of operations. At this time, it is not possible to estimate the impact on our business of newly enacted or potential federal, state or local laws governing hydraulic fracturing.
Regulation of Sand Proppant Services
The MSHA has primary regulatory jurisdiction over commercial silica operations, including quarries, surface mines, underground mines and industrial mineral processing facilities. MSHA representatives perform at least two annual inspections of our production facilities to ensure employee and general site safety. To date, these inspections have not resulted in any citations for material violations of MSHA standards, and we believe we are in material compliance with MSHA requirements.
Other Regulation of the Oil and Natural Gas Industry
The oil and natural gas industry is extensively regulated by numerous federal, state and local authorities. Legislation affecting the oil and natural gas industry is under constant review for amendment or expansion, frequently increasing the regulatory burden. Also, numerous departments and agencies, both federal and state, are authorized by statute to issue rules and regulations that are binding on the oil and natural gas industry and its individual members, some of which carry substantial penalties for failure to comply. Although changes to the regulatory burden on the oil and natural gas industry could affect the demand for our services, we would not expect to be affected any differently or to any greater or lesser extent than other companies in the industry with similar operations.
Drilling
. Our operations are subject to various types of regulation at the federal, state and local level. These types of regulation include requiring permits for the drilling of wells, drilling bonds and reports concerning operations. The states, and some counties and municipalities, in which we operate also regulate one or more of the following:
|
•
|
the location of wells;
|
|
•
|
the method of drilling and casing wells;
|
|
•
|
the timing of construction or drilling activities, including seasonal wildlife closures;
|
|
•
|
the surface use and restoration of properties upon which wells are drilled;
|
|
•
|
the plugging and abandoning of wells; and
|
|
•
|
notice to, and consultation with, surface owners and other third parties.
|
Federal, state and local regulations provide detailed requirements for the plugging and abandonment of wells, closure or decommissioning of production facilities and pipelines and for site restoration in areas where we operate. Although the Corps does not require bonds or other financial assurances, some state agencies and municipalities do have such requirements.
State Regulation
. The states in which we or our customers operate regulate the drilling for, and the production and gathering of, oil and natural gas, including through requirements relating to the method of developing new fields, the spacing and operation of wells and the prevention of waste of oil and natural gas resources. States may also regulate rates of production and may establish maximum daily production allowables from oil and natural gas wells based on market demand or resource conservation, or both. States do not regulate wellhead prices or engage in other similar direct economic regulation, but they may do so in the future. The effect of these regulations may be to limit the amount of oil and natural gas that may be produced from wells and to limit the number of wells or locations our customers can drill.
The Ohio Department of Natural Resources, or the ODNR, has enacted a comprehensive set of rules to regulate the construction of well pads. Under these new rules, operators must submit detailed horizontal well pad site plans certified by a professional engineer for review by the ODNR Division of Oil and Gas Resources Management prior to the construction of a well pad. These rules have resulted in increased construction costs for operators. Also, on November 20, 2018, Ohio EPA
22
announced that it intends to develop new rules that would cover air pollution emissions associated with non-conventional oil and gas facilities.
The petroleum industry is also subject to compliance with various other federal, state and local regulations and laws. Some of those laws relate to resource conservation and equal employment opportunity. We do not believe that compliance with these laws will have a material adverse effect on us.
OSHA Matters
We are also subject to the requirements of the federal Occupational Safety and Health Act, or OSHA, and comparable state statutes that regulate the protection of the health and safety of workers. In addition, the OSHA hazard communication standard requires that information be maintained about hazardous materials used or produced in operations and that this information be provided to employees, state and local government authorities and the public. Compliance with these laws and regulations has not had a material adverse effect on our operations or financial position.
Employees
As of
December 31, 2018
, we had 2,285 full time employees. None of our employees are represented by labor unions or covered by any collective bargaining agreements. We also hire independent contractors and consultants involved in land, technical, regulatory and other disciplines to assist our full time employees.
Availability of Company Reports
Our annual report on Form 10-K, quarterly reports on Form 10-Q, current reports on Form 8-K and all amendments to those reports filed or furnished pursuant to Section 13(a) or 15(d) of the Exchange Act are made available free of charge on the Investor Relations page of our website at www.mammothenergy.com as soon as reasonably practicable after such material is electronically filed with, or furnished to, the SEC. Information contained on our website, or on other websites that may be linked to our website, is not incorporated by reference into this annual report on Form 10-K and should not be considered part of this report or any other filing that we make with the SEC.
Item 1A. Risk Factors
Risks Related to Our Business and the Industries We Serve
Our customer base is concentrated and the loss of one or more of our significant customers, or their failure to pay the amounts they owe us, could cause our revenue to decline substantially.
Our top five customers accounted for approximately
77%
and
71%
, respectively, of our revenue for the years ended
December 31, 2018
and
2017
. PREPA was our largest customer for the year ended
December 31, 2018
accounting for approximately
60%
of our revenue and our second largest customer for the year ended
December 31, 2017
accounting for approximately
29%
of our revenue. Gulfport was our second largest customer for the year ended
December 31, 2018
accounting for approximately
8%
of our revenue and our largest customer for the year ended
December 31, 2017
accounting for approximately
30%
of our revenue. It is likely that we will continue to derive a significant portion of our revenue from a relatively small number of customers in the future. If a major customer decided not to continue to use our services, our revenue would decline and our operating results and financial condition could be harmed. In addition, we are subject to credit risk due to the concentration of our customer base. In particular, as of December 31, 2018, PREPA owed us approximately $225 million for services performed on or before December 31, 2018. As of March 8, 2019, the amount owed to us by PREPA had increased to approximately $281 million. Any nonperformance by our counterparties, including their failure to pay the amounts they owe us on a timely basis or at all, either as a result of changes in financial and economic conditions or otherwise, could have an adverse impact on our operating results and could adversely affect our liquidity.
Cobra, one of our infrastructure services subsidiaries, has entered into service contracts with PREPA, which provide for aggregate payments to us of up to approximately $1.8 billion. PREPA is currently subject to pending bankruptcy proceedings. In the event that PREPA (i) does not have or does not obtain the funds necessary to satisfy its payment obligations to our subsidiary under the contracts, (ii) obtains the necessary funds but refuses to pay the amounts owed to us, (iii) terminates the contracts or curtails our services prior to the end of the contract terms or (iv) otherwise fails to pay amounts owed to us for services performed, our financial condition, results of operations and cash flows would be materially and adversely affected.
23
On October 19, 2017, one of our subsidiaries, Cobra, and PREPA entered into an emergency master services agreement for repairs to PREPA’s electrical grid as a result of Hurricane Maria. The one-year contract, as amended, provided for payments of up to $945 million. On May 26, 2018, Cobra and PREPA entered into a new one-year, $900 million master services agreement to provide additional repair services and begin the initial phase of reconstruction of the electrical power system on Puerto Rico. PREPA is currently subject to bankruptcy proceedings pending in the U.S. District Court for the District of Puerto Rico. As a result, PREPA’s ability to meet its payment obligations under the contracts is largely dependent upon funding from the Federal Emergency Management Agency, or FEMA, or other sources. PREPA’s contracting practices in connection with restoration and repair of PREPA’s electrical grid on Puerto Rico, and the terms of certain of those contracts, have been subject to critical comment and are the subject of review and hearings by U.S. federal and Puerto Rican governmental entities. In 2017, a contract for restoration and repair services entered into by PREPA with an unrelated third party was terminated by PREPA. As of December 31, 2018, PREPA owed us approximately $225 million for services performed on or before December 31, 2018. As of March 8, 2019, the amount owed to us by PREPA had increased to approximately $281 million. In the event that PREPA (i) does not have or does not obtain the funds necessary to satisfy its current obligations to Cobra under the contracts, (ii) obtains the necessary funds but refuses to pay the amounts owed to us, (iii) terminates the contracts or curtails our services prior to the end of the contract terms or (iv) otherwise fails to pay amounts owed to us for services performed, our financial condition, results of operations and cash flows would be materially and adversely affected. In addition, government contracts are subject to various uncertainties, restrictions and regulations, including oversight audits by government representatives and profit and cost controls, which could result in withholding or delayed payments to us or efforts to recover payments already made.
We provide the majority of our infrastructure services to one customer, and the termination of this relationship could adversely affect our operations.
We provide infrastructure services that focus on the repair, maintenance and construction of transmission and distribution networks. Substantially all of our revenue from this business has been derived from two contracts with PREPA, each with a term of up to one year. The first contract was entered into in October 2017 and the $945 million of services contracted for under that agreement were performed by July 21, 2018. The term of the second contract expires on May 25, 2019. We are not involved in discussions to extend the term of the second contract with PREPA and we cannot assure you that we will be able to obtain one or more replacement contracts with PREPA or other customers sufficient to continue providing the level of services that we currently provide to PREPA. The termination of our relationship with PREPA could have a material adverse effect on our business, financial condition, results of operations and cash flows.
We provide our hydraulic fracturing completion services to a limited number of customers, and the termination of one or more of these relationships could adversely affect our operations.
We provide completion services, which services include hydraulic fracturing. A portion of our revenue from this business is derived from Gulfport pursuant to a contract that expires in December 2021. We cannot assure you that we will be able to extend or renew our contract with Gulfport on favorable terms and conditions or at all. Likewise, we cannot assure you that we would be able to obtain replacement long-term contracts with other customers sufficient to continue providing the level of services that we currently provide to Gulfport. The termination of our relationship or nonrenewal of our contract with Gulfport, or one or more of our other customers, could have a material adverse effect on our business, financial condition, results of operations and cash flows.
We provide natural sand proppant to a limited number of customers, and the termination of one or more of these relationships could adversely affect our operations.
We provide natural sand proppant used for hydraulic fracturing. Historically, we have derived a large portion of our revenue from this business from Gulfport pursuant to a contract that expires in December 2021. The termination of our relationship or nonrenewal of our contract with Gulfport, or one or more of our other customers, could have a material adverse effect on our business, financial condition, results of operations and cash flows.
Our failure to receive payment for contract change orders or adequately recover on claims brought by us against customers related to payment terms and costs could materially and adversely affect our financial position, results of operations and cash flows.
We have in the past brought, and may in the future bring, claims against our customers related to, among other things, the payment terms of our contracts and change orders relating to such contracts. These types of claims can occur due to, among other things, customer-caused delays or changes in project scope, both of which may result in additional costs. In some instances, these claims can be the subject of lengthy legal proceedings, and it is difficult to predict the timing and outcome of
24
such proceedings. Our failure to promptly and adequately recover on these types of claims could have an adverse impact on our financial condition, results of operations and cash flows.
Competition within the energy services industry may adversely affect our ability to market our services.
The energy services industry is highly competitive and fragmented and includes numerous small companies capable of competing effectively in our markets on a local basis, as well as large companies that possess substantially greater financial and other resources than we do. Our larger competitors’ greater resources could allow those competitors to compete more effectively than we can. The amount of equipment available may exceed demand, which could result in active price competition. Many contracts are awarded on a bid basis, which may further increase competition based primarily on price. In addition, adverse market conditions lower demand for well servicing equipment, which results in excess equipment and lower utilization rates. If market conditions in our oil-oriented operating areas were to deteriorate or if adverse market conditions in our natural gas-oriented operating areas persist, utilization rates may decline.
We may not accurately estimate the costs associated with infrastructure services provided under fixed price contracts, which could have an adverse effect on our financial condition, results of operations and cash flows.
We derive a portion of our infrastructure services revenue from fixed-price master service and other service agreements. Under these contracts, we typically set the price of our services on a per unit or aggregate basis and assume the risk that costs associated with our performance may be greater than what we estimated. In addition to master service and other service agreements, we enter into contracts for specific projects or jobs that may require the installation or construction of an entire infrastructure system or specified units within an infrastructure system, which are priced on a per unit basis. Profitability will be reduced if actual costs to complete a project exceed our original estimates. Our profitability is dependent upon our ability to accurately estimate the costs associated with our services and our ability to execute in accordance with our plans. A variety of factors could negatively affect these costs, such as lower than anticipated productivity, conditions at work sites differing materially from those anticipated at the time we bid on the contract and higher than expected costs of materials and labor. These variations, along with other risks inherent in performing fixed price contracts, could cause actual project revenue and profits to differ from original estimates, which could result in lower margins than anticipated, or losses, which could reduce our profitability, cash flows and liquidity.
We may be unable to obtain sufficient bonding capacity to support certain service offerings, and the need for performance and surety bonds could reduce availability under our credit facility.
Some of our infrastructure services contracts require performance and payment bonds. If we are not able to renew or obtain a sufficient level of bonding capacity in the future, we may be precluded from being able to bid for certain contracts or successfully contract with certain customers. In addition, even if we are able to successfully renew or obtain performance or payment bonds, we may be required to post letters of credit in connection with the bonds, which would reduce availability under our credit facility. Furthermore, under standard terms in the surety market, sureties issue bonds on a project-by-project basis and can decline to issue bonds at any time or require the posting of additional collateral as a condition to issuing or renewing any bonds. If we were to experience an interruption or reduction in the availability of bonding capacity as a result of these or any other reasons, we may be unable to compete for or work on projects that require bonding.
The nature of our infrastructure services business exposes us to potential liability for warranty claims and faulty engineering, which may reduce our profitability.
Under some of our infrastructure services contracts with customers, we provide a warranty for the services we provide, guaranteeing the work performed against defects in workmanship and material. As much of the work we perform is inspected by our customers for any defects in construction prior to acceptance of the project, we have not historically incurred warranty claims. Additionally, materials used in construction are often provided by the customer or are warranted against defects from the supplier. However, certain projects may have longer warranty periods and include facility performance warranties that may be broader than the warranties we generally provide. In these circumstances, if warranty claims occurred, it could require us to re-perform the services or to repair or replace the warranted item, at a cost to us, and could also result in other damages if we are not able to adequately satisfy our warranty obligations. In addition, we may be required under contractual arrangements with our customers to warrant any defects or failures in materials we provide that we purchase from third parties. While we generally require suppliers to provide us warranties that are consistent with those we provide to the customers, if any of these suppliers default on their warranty obligations to us, we may incur costs to repair or replace the defective materials for which we are not reimbursed. Costs incurred as a result of warranty claims could adversely affect our financial condition, results of operations and cash flows.
25
Our infrastructure services business involves professional judgments regarding the planning, design, development, construction, operations and management of electric power transmission and commercial construction. Because our projects are often technically complex, our failure to make judgments and recommendations in accordance with applicable professional standards, including engineering standards, could result in damages. While we do not generally accept liability for consequential damages, and although we have adopted a range of insurance, risk management and risk avoidance programs designed to reduce potential liabilities, a significantly adverse or catastrophic event at one of our project sites or completed projects resulting from the services we have performed could result in significant warranty, professional liability, or other claims against us as well as reputational harm, especially if public safety is impacted. These liabilities could exceed our insurance limits or could impact our ability to obtain insurance in the future. In addition, customers, subcontractors or suppliers who have agreed to indemnify us against any such liabilities or losses might refuse or be unable to pay us. An uninsured claim, either in part or in whole, if successful and of a material magnitude, could have a substantial impact on our business, financial condition, results of operations and cash flows.
The timing of new contracts and termination of existing contracts may result in unpredictable fluctuations in our cash flows and financial results.
A substantial portion of our continental United States-based infrastructure services revenue is derived from project-based work that is awarded through a competitive bid process. It is generally very difficult to predict the timing and geographic distribution of the projects that we will be awarded. The selection of, timing of, or failure to obtain projects, delays in awards of projects, the re-bidding or termination of projects due to budget overruns, cancellations of projects or delays in completion of contracts could result in the under-utilization of our assets, which could lower our overall profitability and reduce our cash flows. Even if we are awarded contracts, we face additional risks that could affect whether, or when, work will begin. This can present difficulty in matching workforce size and equipment location with contract needs. In some cases, we may be required to bear the cost of a ready workforce and equipment that is larger than necessary, which could impact our cash flow, expenses and profitability. If an expected contract award or the related work release is delayed or not received, we could incur substantial costs without receipt of any corresponding revenues. Moreover, construction projects for which our services are contracted may require significant expenditures by us prior to receipt of relevant payments from the customer. Finally, the winding down or completion of work on significant projects that were active in previous periods will reduce our revenue and earnings if such significant projects have not been replaced in the current period.
Many of our contracts may be canceled upon short notice, typically 30 to 90 days, even if we are not in default under the contract, and we may be unsuccessful in replacing our contracts if they are canceled or as they are completed or expire. We could experience a decrease in our revenue, net income and liquidity if contracts are canceled and if we are unable to replace canceled, completed or expired contracts. Certain of our infrastructure services customers assign work to us on a project-by-project basis under MSAs. Under these agreements, our customers often have no obligation to assign a specific amount of work to us. Our operations could decline significantly if the anticipated volume of work is not assigned to us or is canceled. Many of our contracts, including our MSAs, are opened to competitive bid at the expiration of their terms. There can be no assurance that we will be the successful bidder on our existing contracts that come up for re-bid.
Timing of revenue for our infrastructure services backlog can be subject to change as a result of our delays, customer delays, regulatory delays or other factors. These changes could cause estimated revenue to be realized in periods later than originally expected, or not at all. As a result, our backlog as of any particular date is an uncertain indicator of future revenue and earnings.
Estimated backlog for our infrastructure services represents the amount of revenue we expect to realize over the next 36 months from future work on uncompleted construction projects, including new contracts under which work has not begun. Our estimated backlog also includes amounts payable to us under master service and other service agreements, including demobilization costs in the case of Puerto Rico. Estimated infrastructure services backlog for work under master service and other service agreements is determined based on historical trends, experience from similar projects and estimates of customer demand based on communications with our customers. As of
December 31, 2018
, our infrastructure services backlog was $765 million, of which $625 million is attributable to operations in the continental United States and $140 million is attributable to operations in Puerto Rico. In 2019, we expect to realize approximately $200 million of our continental United States backlog and all $140 million of our Puerto Rico backlog for a total of $340 million.
Approximately $691 million of our infrastructure services backlog as of
December 31, 2018
is attributable to amounts under master service or other service agreements pursuant to which our customers are not contractually committed to purchase a minimum amount of services. Most of these agreements can be canceled on short or no advance notice. Timing of revenue for our infrastructure services backlog can be subject to change as a result of our delays, customer delays, regulatory delays or other factors. These changes could cause estimated revenue to be realized in periods later than originally expected, or not at all.
26
We occasionally experience postponements, cancellations and reductions in expected future work from master service agreements or other service agreements due to changes in our customers’ spending plans, market volatility, governmental funding and regulatory factors. There can be no assurance as to our customers’ requirements or the accuracy of our estimates. As a result, our backlog as of any particular date is an uncertain indicator of future revenue and earnings.
Backlog is not a term recognized under accounting principles generally accepted in the United States; however, it is a common measurement used in the infrastructure industry. As such, our methodology for determining backlog is not comparable to the methodologies used by others.
Opportunities associated with government contracts could lead to increased governmental regulation applicable to us.
Most government contracts are awarded through a regulated competitive bidding process. If we were to be successful in being awarded government contracts, significant costs could be incurred by us before any revenues were realized from these contracts. Government agencies may review a contractor’s performance, cost structure and compliance with applicable laws, regulations and standards. If government agencies determine through these reviews that costs were improperly allocated to specific contracts, they will not reimburse the contractor for those costs or may require the contractor to refund previously reimbursed costs. If government agencies determine that we engaged in improper activity, we may be subject to civil and criminal penalties. Government contracts are also subject to renegotiation of profit and termination by the government prior to the expiration of the term.
Delays and reductions in government appropriations can negatively impact energy infrastructure construction, maintenance and repair projects and may impair the ability of our energy infrastructure customers to timely pay for products or services provided or result in their insolvency or bankruptcy, any of which exposes us to credit risk of our infrastructure customers.
Many of our infrastructure customers derive funding from federal, state and local bodies. Delayed or reduced appropriations may cancel, curtail or delay projects and may have an adverse effect on our business, results of operations, cash flows and financial condition.
A portion of our business depends on the oil and natural gas industry and particularly on the level of exploration and production activity within the United States and Canada, and the ongoing volatility in prices for oil and natural gas has had, and continues to have, an adverse effect on our revenue, cash flows, profitability and growth.
Demand for our oil and natural gas products and services depends substantially on the level of expenditures by companies in the oil and natural gas industry. The significant decline in oil and natural gas prices during 2015 continued during the first part of 2016 before seeing a rebound during the second half of 2016. Oil prices began to stabilize during 2017 and increased during the first three quarters of 2018. However, during the fourth quarter of 2018, oil prices declined significantly. The low commodity price environment caused many of our customers to reduce spending on drilling, completion and other production activities. Although the prices for oil have increased from the lows experienced in the fourth quarter of 2018, industry conditions are dynamic and the continuation or a weakening of commodity prices from current levels may result in a material adverse impact on certain of our customers’ liquidity and financial position resulting in spending reductions, delays in the collection of amounts owing to us and similar impacts. These conditions have had and may continue to have an adverse impact on our financial condition, results of operations and cash flows, and it is difficult to predict how long the current commodity price environment will continue.
Many factors over which we have no control affect the supply of and demand for, and our customers’ willingness to explore, develop and produce oil and natural gas, and therefore, influence prices for our products and services, including:
|
•
|
the domestic and foreign supply of and demand for oil and natural gas;
|
|
•
|
the level of prices, and expectations about future prices, of oil and natural gas;
|
|
•
|
the level of global oil and natural gas exploration and production;
|
|
•
|
the cost of exploring for, developing, producing and delivering oil and natural gas;
|
|
•
|
the expected decline rates of current production;
|
|
•
|
the price and quantity of foreign imports;
|
|
•
|
political and economic conditions in oil producing countries, including the Middle East, Africa, South America and Russia;
|
|
•
|
the ability of members of the Organization of Petroleum Exporting Countries to agree to and maintain oil price and production controls;
|
|
•
|
speculative trading in crude oil and natural gas derivative contracts;
|
|
•
|
the level of consumer product demand;
|
27
|
•
|
the discovery rates of new oil and natural gas reserves;
|
|
•
|
contractions in the credit market;
|
|
•
|
the strength or weakness of the U.S. dollar;
|
|
•
|
available pipeline and other transportation capacity;
|
|
•
|
the levels of oil and natural gas storage;
|
|
•
|
weather conditions and other natural disasters;
|
|
•
|
political instability in oil and natural gas producing countries;
|
|
•
|
domestic and foreign tax policy;
|
|
•
|
domestic and foreign governmental approvals and regulatory requirements and conditions;
|
|
•
|
the continued threat of terrorism and the impact of military and other action, including military action in the Middle East;
|
|
•
|
technical advances affecting energy consumption;
|
|
•
|
the proximity and capacity of oil and natural gas pipelines and other transportation facilities;
|
|
•
|
the price and availability of alternative fuels;
|
|
•
|
the ability of oil and natural gas producers to raise equity capital and debt financing;
|
|
•
|
merger and divestiture activity among oil and natural gas producers; and
|
|
•
|
overall domestic and global economic conditions.
|
These factors and the volatility of the energy markets make it extremely difficult to predict future oil and natural gas price movements with any certainty. Any of the above factors could impact the level of oil and natural gas exploration and production activity and could ultimately have a material adverse effect on our business, financial condition, results of operations and cash flows. Further, future weakness in commodity prices could impact our business going forward, and we could encounter difficulties such as an inability to access needed capital on attractive terms or at all, recognizing asset impairment charges, an inability to meet financial ratios contained in our debt agreements, a need to reduce our capital spending and other similar impacts.
The cyclicality of the oil and natural gas industry may cause our operating results to fluctuate.
We derive a portion of our revenues from companies in the oil and natural gas exploration and production industry, a historically cyclical industry with levels of activity that are significantly affected by the levels and volatility of oil and natural gas prices. We have, and may in the future, experience significant fluctuations in operating results as a result of the reactions of our customers to changes in oil and natural gas prices. For example, prolonged low commodity prices experienced by the oil and natural gas industry during 2015 and the first part of 2016 and again in the fourth quarter of 2018, combined with adverse changes in the capital and credit markets, caused many exploration and production companies to reduce their capital budgets and drilling activity. This resulted in a significant decline in demand for oilfield services and adversely impacted the prices oilfield services companies could charge for their services. In addition, a majority of the service revenue we earn is based upon a charge for a relatively short period of time (e.g., an hour, a day, a week) for the actual period of time the service is provided to our customers. By contracting services on a short-term basis, we are exposed to the risks of a rapid reduction in market prices and utilization, with resulting volatility in our revenues.
If oil prices or natural gas prices decline, the demand for our oil and natural gas services could be adversely affected.
The demand for our oil and natural gas services is primarily determined by current and anticipated oil and natural gas prices and the related general production spending and level of drilling activity in the areas in which we have operations. Volatility or weakness in oil prices or natural gas prices (or the perception that oil prices or natural gas prices will decrease) affects the spending patterns of our customers and may result in the drilling of fewer new wells or lower production spending on existing wells. This, in turn, could result in lower demand for our services and may cause lower rates and lower utilization of our well service equipment.
Any future decline in oil and gas prices could materially affect the demand for our services. Prices for oil and natural gas historically have been extremely volatile and are expected to continue to be volatile in the years to come. During 2018, West Texas Intermediate posted prices ranged from $42.53 to $76.41 per barrel and the New York Mercantile Exchange natural gas futures prices ranged from $2.55 to $4.84 per MMBtu. If the prices of oil and natural gas decline from current levels, our operations, financial condition and level of expenditures may be materially and adversely affected.
Deterioration of the commodity price environment can negatively impact oil and natural gas exploration and production companies and, in some cases, impair their ability to timely pay for products or services provided or result in their insolvency or bankruptcy, any of which exposes us to credit risk of our oil and natural gas exploration and production customers.
28
In weak economic and commodity price environments, we may experience increased difficulties, delays or failures in collecting outstanding receivables from our customers, due to, among other reasons, a reduction in their cash flow from operations, their inability to access the credit markets and, in certain cases, their insolvencies. Such increases in collection issues could have a material adverse effect on our business, results of operations, cash flows and financial condition. We cannot assure you that the reserves we have established for potential credit losses will be sufficient to meet write-offs of uncollectible receivables or that our losses from such receivables will be consistent with our expectations. To the extent one or more of our key customers commences bankruptcy proceedings, our contracts with these customers may be subject to rejection under applicable provisions of the United States Bankruptcy Code, or may be renegotiated. Further, during any such bankruptcy proceeding, prior to assumption, rejection or renegotiation of such contracts, the bankruptcy court may temporarily authorize the payment of value for our services less than contractually required, which could also have a material adverse effect on our business, results of operations, cash flows and financial condition.
Shortages, delays in delivery and interruptions in supply of drill pipe, replacement parts, other equipment, supplies and materials may adversely affect our contract land and directional drilling business or our pressure pumping business.
During periods of increased demand for drilling and completion services, the industry has experienced shortages of drill pipe, replacement parts, other equipment, supplies and materials, including, in the case of our pressure pumping operations, replacement parts, other equipment, proppants, acid, gel and water. These shortages can cause the price of these items to increase significantly and require that orders for the items be placed well in advance of expected use. In addition, any interruption in supply could result in significant delays in delivery of equipment and materials or prevent operations. Interruptions may be caused by, among other reasons:
|
•
|
weather issues, whether short-term such as a hurricane, or long-term such as a drought; and
|
|
•
|
shortage in the number of vendors able or willing to provide the necessary equipment, supplies and materials, including as a result of commitments of vendors to other customers or third parties.
|
These price increases, delays in delivery and interruptions in supply may require us to increase capital and repair expenditures and incur higher operating costs. Severe shortages, delays in delivery and interruptions in supply could limit our ability to construct and operate our drilling rigs or pressure pumping fleets and could have a material adverse effect on our business, results of operations, cash flows and financial condition.
Oilfield services equipment, refurbishment and new asset construction projects, as well as the reactivation of oilfield service assets that have been idle for six months or longer, are subject to risks which could cause delays or cost overruns and adversely affect our business, cash flows, results of operations and financial position.
Oilfield services equipment or assets being upgraded, converted or re-activated following a period of inactivity may experience start-up complications and may encounter other operational problems that could result in significant delays, uncompensated downtime, reduced dayrates or the cancellation, termination or non-renewal of contracts. Construction and upgrade projects are subject to risks of delay or significant cost overruns inherent in any large construction project from numerous factors, including the following:
|
•
|
shortages of equipment, materials or skilled labor;
|
|
•
|
unscheduled delays in the delivery of ordered materials and equipment or shipyard construction;
|
|
•
|
failure of equipment to meet quality and/or performance standards;
|
|
•
|
financial or operating difficulties of equipment vendors;
|
|
•
|
unanticipated actual or purported change orders;
|
|
•
|
inability by us or our customers to obtain required permits or approvals, or to meet applicable regulatory standards in our areas of operations;
|
|
•
|
unanticipated cost increases between order and delivery;
|
|
•
|
adverse weather conditions and other events of force majeure;
|
|
•
|
design or engineering changes; and
|
|
•
|
work stoppages and other labor disputes.
|
The occurrence of any of these events could have a material adverse effect on our business, cash flows, results of operations and financial position.
29
Advancements in oilfield service technologies could have a material adverse effect on our business, financial condition, results of operations and cash flows.
The oilfield services industry is characterized by rapid and significant technological advancements and introductions of new products and services using new technologies. As new horizontal and directional drilling, pressure pumping, pressure control and well service technologies develop, we may be placed at a competitive disadvantage, and competitive pressure may force us to implement new technologies at a substantial cost. We may not be able to successfully acquire or use new technologies. Further, our customers are increasingly demanding the services of newer, higher specification drilling rigs. There can be no assurance that we will:
|
•
|
have sufficient capital resources to build new, technologically advanced equipment and other assets;
|
|
•
|
successfully integrate additional oilfield service equipment and other assets;
|
|
•
|
effectively manage the growth and increased size of our organization, equipment and other assets;
|
|
•
|
successfully deploy idle, stacked or additional oilfield service assets;
|
|
•
|
maintain crews necessary to operate additional drilling rigs or pressure pumping service equipment; or
|
|
•
|
successfully improve our financial condition, results of operations, business or prospects.
|
If we are not successful in building or acquiring new oilfield service equipment and other assets or upgrading our existing rigs and equipment in a timely and cost-effective manner, we could lose market share. New technologies, services or standards could render some of our services, equipment and other assets obsolete, which could have a material adverse impact on our business, cash flows, results of operations and financial condition.
Our business depends upon our ability to obtain specialized equipment and parts from third-party suppliers, and we may be vulnerable to delayed deliveries and future price increases.
We purchase specialized equipment and parts from third party suppliers. At times during the business cycle, there is a high demand for hydraulic fracturing, coiled tubing and other oilfield services and extended lead times to obtain equipment needed to provide these services. Further, there are a limited number of suppliers that manufacture the equipment we use. Should our current suppliers be unable or unwilling to provide the necessary equipment and parts or otherwise fail to deliver the products timely and in the quantities required, any resulting delays in the provision of our services could have a material adverse effect on our business, financial condition, results of operations and cash flows. In addition, future price increases for this type of equipment and parts could negatively impact our ability to purchase new equipment to update or expand our existing fleet or to timely repair equipment in our existing fleet.
An increase in the prices of certain materials used in our businesses could adversely affect our business, financial condition, results of operation and cash flows.
We are exposed to market risk of increases in certain commodity prices of materials, such as copper and steel, which are used as components of supplies or materials utilized in some of our infrastructure and pressure pumping businesses. An increase in these materials could increase our operating costs, limit our ability to service our customers’ needs or otherwise materially and adversely affect our business, financial condition, results of operation and cash flows.
Inaccuracies in estimates of volumes and qualities of our sand reserves could result in lower than expected sales and higher than expected production costs.
On May 26, 2017, we acquired substantially all of the assets of Chieftain Sand and Proppant, LLC and Chieftain Sand and Proppant Barron, LLC, unrelated third party sellers, which we collectively refer to as Chieftain, following our successful bid in a bankruptcy court auction, which assets include a wet and dry plant and sand mine located on approximately 608 acres in New Auburn, Wisconsin. Also, on June 5, 2017, we acquired from Gulfport, certain affiliates of Wexford Capital LP, which we refer to as Wexford, and Rhino Exploration LLC, which we refer to as Rhino, all outstanding membership interests in Sturgeon Acquisitions LLC, which owns Taylor Frac, LLC, Taylor Real Estate Investments, LLC and South River Road, LLC (collectively referred to as Taylor Frac). These acquisitions added sand reserves to our operations and increased our production capacity.
Estimates of our sand reserves are by nature imprecise and depend to some extent on statistical inferences drawn from available data, which may prove unreliable. There are numerous uncertainties inherent in estimating quantities and qualities of sand reserves and costs to mine recoverable reserves, including many factors beyond our control. Estimates of economically recoverable sand reserves necessarily depend on a number of factors and assumptions, all of which may vary considerably from actual results, such as:
30
|
•
|
geological and mining conditions and/or effects from prior mining that may not be fully identified by available data or that may differ from experience;
|
|
•
|
assumptions concerning future prices of frac sand, operating costs, mining technology improvements, development costs and reclamation costs; and
|
|
•
|
assumptions concerning future effects of regulation, including the issuance of required permits and taxes by governmental agencies.
|
Any inaccuracy in the estimates related to our sand reserves could result in lower than expected sales and higher than expected costs. For example, these estimates assume that our revenue and cost structure will remain relatively constant over the life of our reserves. If these assumptions prove to be inaccurate, some or all of our reserves may not be economically mineable, which could have a material adverse effect on our business, financial condition, results of operations and cash flows. In addition, our current customer contracts require us to deliver frac sand that meets certain specifications. If the estimates of the quality of our sand reserves, including the volumes of the various specifications of those reserves, prove to be inaccurate, we may incur significantly higher excavation costs without corresponding increases in revenues, we may not be able to meet our contractual obligations, or our facilities may have a shorter than expected reserve life, which could have a material adverse effect on our business, financial condition, results of operations and cash flows.
As part of our natural sand proppant services business, we rely on third parties for raw materials and transportation, and the suspension or termination of our relationship with one or more of these third parties could adversely affect our business, financial conditions, results of operations and cash flows.
As part of our natural sand proppant services business, we mine and process sand into premium monocrystalline sand, a specialized mineral that is used as a proppant (also known as frac sand) at our Barron County and Jackson County, Wisconsin plants. We also buy processed sand from suppliers on the spot market. In addition, we also buy raw or washed sand and process it at our indoor sand processing plant located in Pierce County, Wisconsin. We sell natural sand proppant to our customers for use in their hydraulic fracturing operations to enhance the recovery rates of hydrocarbons from oil and natural gas wells. We also provide logistics solutions to deliver our frac sand products to our customers. Because our customers generally find it impractical to store frac sand in large quantities near their job sites, they seek to arrange for product to be delivered where and as needed, which requires predictable and efficient loading and shipping of product. To facilitate our logistics and transload facility capabilities, we contract with third party providers to transport our frac sand products to railroad facilities for delivery to our customers. We also lease a railcar fleet from various third parties to deliver our frac sand products to our customers and lease or otherwise utilize origin and destination transloading facilities. The suspension, termination or nonrenewal of our relationship with any one or more of these third parties involved in the sourcing, transportation and delivery of our frac sand products could result in material operational delays, increase our operating costs, limit our ability to service our customers’ wells or otherwise materially and adversely affect our business, financial condition, results of operations and cash flows.
Future performance of our natural sand proppant services business will depend on our ability to succeed in competitive markets, and on our ability to appropriately react to potential fluctuations in the demand for and supply of frac sand.
In our natural sand proppant services business, we operate in a highly competitive market that is characterized by a small number of large, national producers and a larger number of small, regional or local producers. Competition in the industry is based on price, consistency and quality of product, site location, distribution and logistics capabilities, customer service, reliability of supply and breadth of product offering. The large, national producers with whom we compete include Badger Mining Corporation, Covia Holdings Corporation, Hi-Crush Partners LP, Preferred Proppants LLC, Smart Sand, Inc., Emerge Energy Services LP and U.S. Silica Holdings Inc. Our larger competitors may have greater financial and other resources than we do, may develop technology superior to ours, may have production facilities that are located closer to sand mines from which raw sand is mined or to their key customers than our facilities or have a more cost effective access to raw sand and transportation facilities than we do. Should the demand for hydraulic fracturing services decrease, prices in the frac sand market could materially decrease as producers may seek to preserve market share or exit the market and sell frac sand at below market prices. In addition, oil and natural gas exploration and production companies and other providers of hydraulic fracturing services could acquire their own frac sand reserves, develop or expand frac sand production capacity or otherwise fulfill their own proppant requirements and existing or new frac sand producers could add to or expand their frac sand production capacity, which may negatively impact pricing and demand for our frac sand. We may not be able to compete successfully against either our larger or smaller competitors in the future, and competition could have a material adverse effect on our business, financial condition, results of operations and cash flows.
31
Demand for our frac sand products could be reduced by changes in well stimulation processes and technologies, as well as changes in governmental regulations and other applicable law.
As part of our natural sand proppant services business, we mine, process and sell frac sand products to our customers for use in their hydraulic fracturing operations to enhance the recovery rates of hydrocarbons from oil and natural gas wells.
A significant shift in demand from frac sand to other proppants, or the development of new processes to replace hydraulic fracturing altogether, could cause a decline in the demand for the frac sand we produce and result in a material adverse effect on our business, financial condition, results of operations and cash flows. Further, federal and state governments and agencies have adopted various laws and regulations or are evaluating proposed legislation and regulations that are focused on the extraction of shale gas or oil using hydraulic fracturing, a process which utilizes proppants such as those that we produce. Future hydraulic fracturing-related legislation or regulations could restrict the ability of our customers to utilize, or increase the cost associated with, hydraulic fracturing, which could reduce demand for our proppants and adversely affect our business, financial condition, results of operations and cash flows. For additional information regarding the regulation of hydraulic fracturing, see “
—Risks Related to Our Business and the Oil and Natural Gas Industry—Federal and state legislative and regulatory initiatives relating to hydraulic fracturing could result in increased costs and additional operating restrictions or delays
.”
An increase in the supply of raw frac sand having similar characteristics as the raw frac sand we produce and sell could make it more difficult for us to market our sand on favorable terms or at all.
From time to time we have entered into take-or-pay contracts with our principal raw frac sand supplier for our Pierce County, Wisconsin plant.
If significant new reserves of raw frac sand continue to be discovered and developed, and those frac sands have similar characteristics to the frac sand we produce and sell, the market price for our frac sand may decline. If the market price for our frac sand falls below an amount equal to the contracted purchase price in our take-or-pay contract plus our processing and related transportation costs, this could have an adverse effect on our business, financial condition, results of operations and cash flows over the remaining term of this contract.
We face distribution and logistics challenges in our business.
In response to various factors, including fluctuations in oil and natural gas prices, our customers may shift their focus among resource plays, some of which can be located in geographic areas that do not have well-developed transportation and distribution infrastructure systems. Some geographic areas, including the areas in which our sand facilities are located, have limited access to railroads. Any interruption or delay in the railroad access or service may affect our ability to ship and/or the timing of shipment of our frac sand to our customers, which may adversely affect our revenues or result in increased costs, and thus could negatively impact our results of operations and financial condition. Serving our customers in these less-developed areas presents distribution and other operational challenges that may affect our sales and could negatively impact our operating costs. Labor disputes, system constraints, derailments, adverse weather conditions or other environmental events, an increasingly tight railcar leasing market and changes to rail freight systems, among other factors, could interrupt or limit available transportation services, could affect our ability to timely and cost-effectively deliver our frac sand to our customers and could provide a competitive advantage to our competitors located in closer proximity to our customers. Failure to find long-term solutions to these logistics challenges could adversely affect our business, financial condition, results of operations and cash flows.
Increasing transportation and related costs could have a material adverse effect on our business.
Because of the relatively low cost of producing frac sand, transportation expenses and related costs, including freight charges, fuel surcharges, transloading fees, switching fees, railcar lease costs, demurrage costs and storage fees, comprise a significant component of the total delivered cost of frac sand sales. The relatively high transportation expenses and related costs tend to favor frac sand producers located in close proximity to their customers. As we expand our frac sand production, our need for additional transportation services and transload network access increases. We contract with truck and rail services to move frac sand from our production facilities to transload sites and our customers, and increased costs under these contracts could adversely affect our results of operations. In addition, we bear the risk of non-delivery under our contracts. A significant increase in transportation service rates, a reduction in the dependability or availability of transportation or transload services, or relocation of our customers’ businesses to areas farther from our plants or transloading facilities could impair our ability to deliver our products economically to our customers and our ability to expand into different markets.
Diminished access to water and inability to secure or maintain necessary permits may adversely affect operations of our frac sand processing plants.
32
The processing of raw sand and production of natural sand proppant require significant amounts of water. As a result, securing water rights and water access is necessary to operate our processing facilities. If the areas where our facilities are located experience water shortages, restrictions or any other constraints due to drought, contamination or otherwise, there may be additional costs associated with securing water access. Although we have obtained water rights to service our activities when we are operating our processing plants, the amount of water that we are entitled to use pursuant to our water rights must be determined by the appropriate regulatory authorities. Such regulatory authorities may amend the regulations regarding such water rights, increase the cost of maintaining such water rights or eliminate our current water rights, and we may be unable to retain all or a portion of such water rights. If implemented, these new regulations could also affect local municipalities and other industrial operations and could have a material adverse effect on costs involved in operating our processing plant. Such changes in laws, regulations or government policy and related interpretations pertaining to water rights may alter the environment in which we do business, which may have an adverse effect on our business, financial condition, results of operations and cash flows. Additionally, a water discharge permit may be required to properly dispose of water at our processing sites when in operation. Certain of our facilities are also required to obtain storm water permits. The water discharge, storm water or any other permits we may be required to have in order to conduct our frac sand processing operations is subject to regulatory discretion, and any inability to obtain or maintain the necessary permits could have an adverse effect on our ability to run such operations.
Similar to our natural sand proppant services, certain of our completion and production services, particularly our hydraulic fracturing services, are substantially dependent on the availability of water. Restrictions on our ability, or our customers’ ability, to obtain water may have an adverse effect on our business, financial condition, results of operations and cash flows.
Water is an essential component of deep shale oil and natural gas production during both the drilling and hydraulic fracturing processes. In recent years, certain areas in which we operate have experienced drought conditions and competition for water in such areas is growing. As a result, some local water districts have begun restricting the use of water subject to their jurisdiction for hydraulic fracturing to protect local water supply. Our inability, or customers’ inability, to obtain water to use in our operations from local sources or to effectively utilize flowback water could have an adverse effect on our business, financial condition, results of operations and cash flows.
The customized nature, and remote location, of the modular camps that we provide and service present unique challenges that could adversely affect our ability to successfully operate our remote accommodations business.
We rely on a third-party subcontractor to manufacture and install the customized modular units used in our remote accommodations business. These customized units often take a considerable amount of time to manufacture and, once manufactured, often need to be delivered to remote areas that are frequently difficult to access by traditional means of transportation. In the event we are unable to provide these modular units in a timely fashion, we may not be entitled to full, or any, payment therefor under the terms of our contracts with customers. In addition, the remote location of the modular camps often makes it difficult to install and maintain the units, and our failure, on a timely basis, to have such units installed and provide maintenance services could result in our breach of, and non-payment by our customers under, the terms of our customer contracts. Any of these factors could have a material adverse effect on our remote accommodation business and our overall financial condition and results of operations.
Health and food safety issues and food-borne illness concerns could adversely affect our remote accommodations business.
We provide food services to our customers as part of our remote accommodations business and, as a result, face health and food safety issues that are common in the food and hospitality industries. Food-borne illnesses, such as E. coli, hepatitis A, trichinosis or salmonella, and food safety issues have occurred in the food industry in the past and could occur in the future. Our reliance on third-party food suppliers and distributors increases the risk that food-borne illness incidents could be caused by factors outside of our control. New illnesses resistant to any precautions may develop in the future, or diseases with long incubation periods could arise. Further, the remote nature of our accommodation facilities and related food services may increase the risk of contamination of our food supply and create additional health and hygiene concerns due to the limited access to modern amenities and conveniences that may not be faced by other food service providers or hospitality businesses operating in an urban environment. If our customers become ill from food-borne illness, we could be forced to close some or all of our remote accommodation facilities on a temporary basis or otherwise. Any such incidents and/or any report of publicity linking us to incidents of food-borne illness or other food safety issues, including food tampering or contamination, could adversely affect our remote accommodations business as well as our overall financial condition and results of operations.
33
Development of permanent infrastructure in the Canadian oil sands region or other locations where we locate our remote accommodations could negatively impact our remote accommodations business.
Our remote accommodations business specializes in providing modular housing and related services for work forces in remote areas which lack the infrastructure typically available in towns and cities. If permanent towns, cities and municipal infrastructure develop in the oil sands region of northern Alberta, Canada or other regions where we locate our modular camps, then demand for our accommodations could decrease as customer employees move to the region and choose to utilize permanent housing and food services.
Revenue generated and expenses incurred by our remote accommodation business are denominated in the Canadian dollar and could be negatively impacted by currency fluctuations.
Our remote accommodation business generates revenue and incurs expenses that are denominated in the Canadian dollar. These transactions could be materially affected by currency fluctuations. Changes in currency exchange rates could adversely affect our combined results of operations or financial position. We also maintain cash balances denominated in the Canadian dollar. At
December 31, 2018
, we had
$2 million
of cash in Canadian dollars, in Canadian accounts. A 10% increase in the strength of the Canadian dollar versus the U.S. dollar would have resulted in a decrease in pre-tax income of approximately
$0.2 million
as of
December 31, 2018
. Conversely, a corresponding decrease in the strength of the Canadian dollar would have resulted in a comparable increase in pre-tax income. We have not hedged our exposure to changes in foreign currency exchange rates and, as a result, could incur unanticipated translation gains and losses.
Our business is difficult to evaluate because we have a limited operating history.
Mammoth Energy Services, Inc. was formed in June 2016, and did not conduct any material business operations prior to its initial public offering, or the IPO, which closed on October 19, 2016. Prior to the IPO, Mammoth Energy Services, Inc. was a wholly-owned subsidiary of Mammoth Energy Partners LP, referred to as Mammoth Partners, which was originally formed in February 2014. Except as expressly noted otherwise, the historical financial information of Mammoth Energy Services, Inc. and operational data for the periods prior to October 12, 2016 is that of Mammoth Partners and its consolidated subsidiaries. These subsidiaries were formed or acquired between 2007 and 2016. As a result, there is only limited historical financial and operating information available upon which to base your evaluation of our performance.
We rely on a few key employees whose absence or loss could adversely affect our business.
Many key responsibilities within our business have been assigned to a small number of employees. The loss of their services could adversely affect our business. In particular, the loss of the services of our Chief Executive Officer or Chief Financial Officer could disrupt our operations. We do not have any written employment agreement with our executives at this time. Further, we do not maintain “key person” life insurance policies on any of our employees. As a result, we are not insured against any losses resulting from the death of our key employees.
If we are unable to employ a sufficient number of skilled and qualified workers, our capacity and profitability could be diminished and our growth potential could be impaired.
The delivery of our products and services requires skilled and qualified workers with specialized skills and experience who can perform physically demanding work. As a result of the volatility of the energy services industry and the demanding nature of the work, workers may choose to pursue employment in fields that offer a more desirable work environment at wage rates that are competitive. Our ability to be productive and profitable will depend upon our ability to employ and retain skilled workers. In addition, our ability to expand our operations depends in part on our ability to increase the size of our skilled labor force. The demand for skilled workers is high, and the supply is limited. As a result, competition for experienced energy service personnel is intense, and we face significant challenges in competing for crews and management with large and well established competitors. A significant increase in the wages paid by competing employers could result in a reduction of our skilled labor force, increases in the wage rates that we must pay, or both. If either of these events were to occur, our capacity and profitability could be diminished and our growth potential could be impaired.
Unionization efforts could increase our costs or limit our flexibility.
Presently, none of our employees work under collective bargaining agreements. Unionization efforts have been made from time to time within our industries, to varying degrees of success. Any such unionization could increase our costs or limit our flexibility.
34
Our operations may be limited or disrupted in certain parts of the continental U.S., Puerto Rico and Canada during severe weather conditions, which could have a material adverse effect on our financial condition and results of operations.
We provide pressure pumping and well services and contract land and directional drilling services in the Utica, SCOOP, STACK, Permian Basin, Marcellus, Granite Wash, Cana Woodford and Eagle Ford resource plays located in the continental U.S. We provide infrastructure services in the northeast, southwest and midwest portions of the United States and Puerto Rico. We provide remote accommodation services in the oil sands in Alberta, Canada. We serve these markets through our facilities and service centers located in Ohio, Oklahoma, Texas, Wisconsin, Minnesota, Kentucky, Puerto Rico and Alberta, Canada. For the years ended
December 31, 2018
and
2017
, we generated approximately
17%
and
42%
, respectively, of our revenue from our operations in Ohio, Wisconsin, Minnesota, North Dakota, Pennsylvania, West Virginia and Canada where weather conditions may be severe, particularly during winter and spring months. Repercussions of severe weather conditions may include:
|
•
|
curtailment of services;
|
|
•
|
weather-related damage to equipment resulting in suspension of operations;
|
|
•
|
weather-related damage to our facilities;
|
|
•
|
inability to deliver equipment and materials to jobsites in accordance with contract schedules; and
|
|
•
|
loss of productivity.
|
Many municipalities, including those in Ohio and Wisconsin, impose bans or other restrictions on the use of roads and highways, which include weight restrictions on the paved roads that lead to our jobsites due to the muddy conditions caused by spring thaws. This can limit our access to these jobsites and our ability to service wells in these areas. These constraints and the resulting shortages or high costs could delay our operations and materially increase our operating and capital costs in those regions. Weather conditions may also affect the price of crude oil and natural gas, and related demand for our services. Any of these factors could have a material adverse effect on our financial condition and results of operations.
Concerns over general economic, business or industry conditions may have a material adverse effect on our results of operations, liquidity and financial condition.
Concerns over global economic conditions, energy costs, geopolitical issues, inflation, the availability and cost of credit and the European, Asian and the United States financial markets have contributed to economic uncertainty and diminished expectations for the global economy. These factors, combined with volatility in commodity prices, business and consumer confidence and unemployment rates, have in the past precipitated and may in the future precipitate an economic slowdown. Concerns about global economic growth may have a significant adverse impact on global financial markets and commodity prices. If the economic climate in the United States or abroad deteriorates, worldwide demand for petroleum products could diminish, which could impact the price at which oil, natural gas and natural gas liquids can be sold, which could affect the ability of our customers to continue operations and ultimately adversely impact our results of operations, liquidity and financial condition.
A terrorist attack or armed conflict could harm our business.
The occurrence or threat of terrorist attacks in the United States or other countries, anti-terrorist efforts and other armed conflicts involving the United States or other countries, including continued hostilities in the Middle East, may adversely affect the United States and global economies and could prevent us from meeting our financial and other obligations. If any of these events occur, the resulting political instability and societal disruption could reduce overall demand for oil and natural gas, potentially putting downward pressure on demand for our services and causing a reduction in our revenues. Oil and natural gas related facilities could be direct targets of terrorist attacks, and our operations could be adversely impacted if infrastructure integral to our customers’ operations is destroyed or damaged. Costs for insurance and other security may increase as a result of these threats, and some insurance coverage may become more difficult to obtain, if available at all.
Our operations require substantial capital and we may be unable to obtain needed capital or financing on satisfactory terms or at all, which could limit our ability to grow.
Our capital budget for 2019 is estimated to be $80 million. Since November 2014, we have funded our capital expenditures primarily with cash on hand, cash proceeds from our initial public offering, cash generated by operations and borrowings under our revolving credit facility (other than our acquisitions in June 2017, which we completed with the issuance of shares of our common stock). We may be unable to generate sufficient cash from operations and other capital resources to maintain planned or future levels of capital expenditures which, among other things, may prevent us from acquiring new equipment or properly maintaining our existing equipment. Further, any disruptions or continuing volatility in the global
35
financial markets may lead to an increase in interest rates or a contraction in credit availability impacting our ability to finance our operations. This could put us at a competitive disadvantage or interfere with our growth plans. Further, our actual capital expenditures for 2019 or future years could exceed our capital expenditure budget. In the event our capital expenditure requirements at any time are greater than the amount we have available, we could be required to seek additional sources of capital, which may include debt financing, joint venture partnerships, sales of assets, offerings of debt or equity securities or other means. We may not be able to obtain any such alternative source of capital. We may be required to curtail or eliminate contemplated activities. If we can obtain alternative sources of capital, the terms of such alternative may not be favorable to us. In particular, the terms of any debt financing may include covenants that significantly restrict our operations. Our inability to grow as planned may reduce our chances of maintaining and improving profitability.
The growth of our business through acquisitions may expose us to various risks, including those relating to difficulties in identifying suitable, accretive acquisition opportunities and integrating businesses, assets and personnel, as well as difficulties in obtaining financing for targeted acquisitions and the potential for increased leverage or debt service requirements.
As a component of our business strategy, we have pursued and intend to continue to pursue selected, accretive acquisitions of complementary assets, businesses and technologies. Acquisitions involve numerous risks, including:
|
•
|
unanticipated costs and assumption of liabilities and exposure to unforeseen liabilities of acquired businesses, including but not limited to environmental liabilities;
|
|
•
|
difficulties in integrating the operations and assets of the acquired business and the acquired personnel;
|
|
•
|
limitations on our ability to properly assess and maintain an effective internal control environment over an acquired business, in order to comply with public reporting requirements;
|
|
•
|
potential losses of key employees and customers of the acquired businesses;
|
|
•
|
inability to commercially develop acquired technologies;
|
|
•
|
risks of entering markets in which we have limited prior experience; and
|
|
•
|
increases in our expenses and working capital requirements.
|
The process of integrating an acquired business may involve unforeseen costs and delays or other operational, technical and financial difficulties and may require a disproportionate amount of management attention and financial and other resources. Our failure to achieve consolidation savings, to incorporate the acquired businesses and assets into our existing operations successfully or to minimize any unforeseen operational difficulties could have a material adverse effect on our financial condition and results of operations. Furthermore, there is intense competition for acquisition opportunities in our industries. Competition for acquisitions may increase the cost of, or cause us to refrain from, completing acquisitions. In addition, we may not have sufficient capital resources to complete additional acquisitions. Historically, we have financed capital expenditures primarily with funding from our initial public offering, cash generated by operations, borrowings under our revolving credit facility and funding from our equity investors. We may incur substantial indebtedness to finance future acquisitions and also may issue equity, debt or convertible securities in connection with such acquisitions. Debt service requirements could represent a significant burden on our results of operations and financial condition and the issuance of additional equity or convertible securities could be dilutive to our existing stockholders. Furthermore, we may not be able to obtain additional financing on satisfactory terms. Even if we have access to the necessary capital, we may be unable to continue to identify additional suitable acquisition opportunities, negotiate acceptable terms or successfully acquire identified targets. Our ability to grow through acquisitions and manage growth will require us to continue to invest in operational, financial and management information systems and to attract, retain, motivate and effectively manage our employees. The inability to effectively manage the integration of acquisitions could reduce our focus on subsequent acquisitions and current operations, which, in turn, could negatively impact our earnings and growth. Our financial position and results of operations may fluctuate significantly from period to period, based on whether or not significant acquisitions are completed in particular periods.
We may have difficulty managing growth in our business, which could adversely affect our financial condition and results of operations.
As a recently formed company, growth in accordance with our business plan, if achieved, could place a significant strain on our financial, technical, operational and management resources. As we expand the scope of our activities, lines of our businesses and our geographic coverage through both organic growth and acquisitions, there will be additional demands on our financial, technical, operational and management resources. The failure to continue to upgrade our technical, administrative, operating and financial control systems or the occurrences of unexpected expansion difficulties, including the failure to recruit and retain experienced managers, engineers and other professionals in the energy services industry, could have a material adverse effect on our business, financial condition, results of operations and our ability to successfully or timely execute our business plan.
36
If our intended expansion of our business is not successful, our financial condition, profitability and results of operations could be adversely affected, and we may not achieve increases in revenue and profitability that we hope to realize.
A key element of our business strategy involves the expansion of our services, geographic presence and customer base. These aspects of our strategy are subject to numerous risks and uncertainties, including:
|
•
|
an inability to retain or hire experienced crews and other personnel;
|
|
•
|
a lack of customer demand for the services we intend to provide;
|
|
•
|
an inability to secure necessary equipment, raw materials (particularly sand and other proppants) or technology to successfully execute our expansion plans;
|
|
•
|
shortages of water used in our sand processing operations and our hydraulic fracturing operations;
|
|
•
|
unanticipated delays that could limit or defer the provision of services by us and jeopardize our relationships with existing customers and adversely affect our ability to obtain new customers for such services; and
|
|
•
|
competition from new and existing services providers.
|
Encountering any of these or any unforeseen problems in implementing our planned expansion could have a material adverse impact on our business, financial condition, results of operations and cash flows, and could prevent us from achieving the increases in revenues and profitability that we hope to realize.
Our liquidity needs could restrict our operations and make us more vulnerable to adverse economic conditions.
Our future indebtedness, whether incurred in connection with acquisitions, operations or otherwise, may adversely affect our operations and limit our growth, and we may have difficulty making debt service payments on such indebtedness as payments become due. Our level of indebtedness may affect our operations in several ways, including the following:
|
•
|
increasing our vulnerability to general adverse economic and industry conditions;
|
|
•
|
the covenants that are contained in the agreements governing our indebtedness could limit our ability to borrow funds, dispose of assets, pay dividends and make certain investments;
|
|
•
|
our debt covenants could also affect our flexibility in planning for, and reacting to, changes in the economy and in our industries;
|
|
•
|
any failure to comply with the financial or other covenants of our debt, including covenants that impose requirements to maintain certain financial ratios, could result in an event of default, which could result in some or all of our indebtedness becoming immediately due and payable;
|
|
•
|
our level of debt could impair our ability to obtain additional financing in the future for working capital, capital expenditures, acquisitions or other general corporate purposes; and
|
|
•
|
our business may not generate sufficient cash flow from operations to enable us to meet our obligations under our indebtedness.
|
Our revolving credit facility imposes, and any of our future credit facilities may impose, restrictions on us that may affect our ability to successfully operate our business.
Our revolving credit facility limits, and any of our future credit facilities may limit, our ability to take various actions, such as:
|
•
|
incurring additional indebtedness;
|
|
•
|
paying dividends;
|
|
•
|
creating certain additional liens on our assets;
|
|
•
|
entering into sale and leaseback transactions;
|
|
•
|
making investments;
|
|
•
|
entering into transactions with affiliates;
|
|
•
|
making material changes to the type of business we conduct or our business structure;
|
|
•
|
making guarantees;
|
|
•
|
entering into hedges;
|
|
•
|
disposing of assets in excess of certain permitted amounts;
|
|
•
|
merging or consolidating with other entities; and
|
|
•
|
selling all or substantially all of our assets.
|
37
In addition, our revolving credit facility requires, and any future debt may require, us to maintain certain financial ratios and to satisfy certain financial conditions, which may require us to reduce our debt or take some other action in order to comply with each of them. These restrictions could also limit our ability to obtain future financings, make needed capital expenditures, withstand a downturn in our business or the economy in general, or otherwise conduct necessary corporate activities. We also may be prevented from taking advantage of business opportunities that arise because of the limitations imposed on us by the restrictive covenants under our revolving credit facility and any future debt agreements. If we fail to comply with the covenants in our existing revolving credit facility or any future debt agreements and such failure is not waived by the lender, a default may be declared by the lenders, which could have a material adverse effect on us.
Our revolving credit facility provides, and any future credit facilities may provide, for variable interest rates, which may increase or decrease our interest expense.
At
December 31, 2018
, we had no borrowings outstanding under our revolving credit facility and availability under our credit facility was approximately
$176 million
, after giving effect to
$8 million
of outstanding letters of credit. As of July 31, 2018, the last day on which we had material outstanding borrowings under our revolving credit facility, a 1% increase or decrease in the interest rate at that time would have increased or decreased our interest expense by approximately
$0.1 million
per year, based on $6 million outstanding and a weighted average interest rate of 6.5%. We do not currently hedge our interest rate exposure.
We may not be able to provide services that meet the specific needs of oil and natural gas exploration and production companies or utilities at competitive prices.
The markets in which we operate are generally highly competitive and have relatively few barriers to entry. The principal competitive factors in our markets are price, product and service quality and availability, responsiveness, experience, technology, equipment quality and reputation for safety. We compete with large national and multi-national companies that have longer operating histories, greater financial, technical and other resources and greater name recognition than we do. Several of our competitors provide a broader array of services and have a stronger presence in more geographic markets. In addition, we compete with several smaller companies capable of competing effectively on a regional or local basis. Our competitors may be able to respond more quickly to new or emerging technologies and services and changes in customer requirements. Some contracts are awarded on a bid basis, which further increases competition based on price. Pricing is often the primary factor in determining which qualified contractor is awarded a job. The competitive environment may be further intensified by mergers and acquisitions among oil and natural gas or utility companies or other events that have the effect of reducing the number of available customers. As a result of competition, we may lose market share or be unable to maintain or increase prices for our present services or to acquire additional business opportunities, which could have a material adverse effect on our business, financial condition, results of operations and cash flows.
In addition, some exploration and production companies have begun performing hydraulic fracturing and directional drilling on their wells using their own equipment and personnel. Any increase in the development and utilization of in-house fracturing and directional drilling capabilities by our customers could decrease the demand for our oil and natural gas services and have a material adverse impact on our business.
Our operations are subject to hazards inherent in the oil and natural gas and energy infrastructure industries, which could expose us to substantial liability and cause us to lose customers and substantial revenue.
Our operations include hazards inherent in the oil and natural gas and energy infrastructure industries, such as equipment defects, vehicle accidents, fires, explosions, blowouts, surface cratering, uncontrollable flows of gas or well fluids, pipe or pipeline failures, abnormally pressured formations and various environmental hazards such as oil spills and releases of, and exposure to, hazardous substances. For example, our operations are subject to risks associated with hydraulic fracturing, including any mishandling, surface spillage or potential underground migration of fracturing fluids, including chemical additives. The occurrence of any of these events could result in substantial losses to us due to injury or loss of life, severe damage to or destruction of property, natural resources and equipment, pollution or other environmental damage, clean-up responsibilities, regulatory investigations and penalties, suspension of operations and repairs required to resume operations. The cost of managing such risks may be significant. The frequency and severity of such incidents will affect operating costs, insurability and relationships with customers, employees and regulators. In particular, our customers may elect not to purchase our services if they view our environmental or safety record as unacceptable, which could cause us to lose customers and substantial revenues. In addition, these risks may be greater for us than some of our competitors because we sometimes acquire companies that may not have allocated significant resources and management focus to safety and environmental matters and may have a poor environmental and safety record and associated possible exposure. Our insurance may not be adequate to cover all losses or liabilities we may suffer. Also, insurance may no longer be available to us or, if it is, its availability may be at
38
premium levels that do not justify its purchase. The occurrence of a significant uninsured claim, a claim in excess of the insurance coverage limits maintained by us or a claim at a time when we are not able to obtain liability insurance could have a material adverse effect on our ability to conduct normal business operations and on our financial condition, results of operations and cash flows. In addition, we may not be able to secure additional insurance or bonding that might be required by new governmental regulations. This may cause us to restrict our operations, which might severely impact our financial position.
Since hydraulic fracturing activities are part of our operations, they are covered by our insurance against claims made for bodily injury, property damage and clean-up costs stemming from a sudden and accidental pollution event. However, we may not have coverage if we are unaware of the pollution event and unable to report the “occurrence” to our insurance company within the time frame required under our insurance policy. We have no coverage for gradual, long-term pollution events. In addition, these policies do not provide coverage for all liabilities, and the insurance coverage may not be adequate to cover claims that may arise, or we may not be able to maintain adequate insurance at rates we consider reasonable. A loss not fully covered by insurance could have a material adverse effect on our financial position, results of operations and cash flows.
We are subject to extensive environmental, health and safety laws and regulations that may subject us to substantial liability or require us to take actions that will adversely affect our results of operations.
Our business is significantly affected by stringent and complex federal, state and local laws and regulations governing the discharge of substances into the environment or otherwise relating to environmental protection and health and safety matters. As part of our business, we handle, transport and dispose of a variety of fluids and substances, including hydraulic fracturing fluids which can contain hydrochloric acid and certain petrochemicals. This activity poses some risks of environmental liability, including leakage of hazardous substances from the wells to surface and subsurface soils, surface water or groundwater. We also handle, transport and store these substances. The handling, transportation, storage and disposal of these fluids are regulated by a number of laws, including: the Resource Conservation and Recovery Act; the Comprehensive Environmental Response, Compensation, and Liability Act; the Clean Water Act; the Safe Drinking Water Act; and other federal and state laws and regulations promulgated thereunder. The cost of compliance with these laws can be significant. Failure to properly handle, transport or dispose of these materials or otherwise conduct our operations in accordance with these and other environmental laws could expose us to substantial liability for administrative, civil and criminal penalties, cleanup and site restoration costs and liability associated with releases of such materials, damages to natural resources and other damages, as well as potentially impair our ability to conduct our operations. We could be exposed to liability for cleanup costs, natural resource damages and other damages under these and other environmental laws. Such liability is commonly on a strict, joint and several liability basis, without regard to fault. Liability may be imposed as a result of our conduct that was lawful at the time it occurred or the conduct of, or conditions caused by, prior operators or other third parties. Environmental laws and regulations have changed in the past, and they are likely to change in the future. If existing environmental requirements or enforcement policies change and become more stringent, we may be required to make significant unanticipated capital and operating expenditures.
Regulation of greenhouse gas emissions could result in increased operating costs and reduced demand for oil and natural gas.
In recent years, federal, state and local governments have taken steps to reduce emissions of greenhouse gases, or GHGs. The Environmental Protection Agency, or the EPA, has finalized a series of GHG monitoring, reporting and emissions control rules for the oil and natural gas industry, and the U.S. Congress has, from time to time, considered adopting legislation to reduce emissions. Almost one-half of the states have already taken measures to reduce emissions of GHGs primarily through the development of GHG emission inventories and/or regional GHG cap-and-trade programs. While we are subject to certain federal GHG monitoring and reporting requirements, our operations currently are not adversely impacted by existing federal, state and local climate change initiatives. For a description of existing and proposed GHG rules and regulations, see “—Regulation of Hydraulic Fracturing.”
At the international level, in December 2015, the United States participated in the 21st Conference of the Parties (COP-21) of the United Nations Framework Convention on Climate Change in Paris, France. The resulting Paris Agreement calls for the parties to undertake “ambitious efforts” to limit the average global temperature, and to conserve and enhance sinks and reservoirs of GHGs. The Agreement went into effect on November 4, 2016. The Agreement establishes a framework for the parties to cooperate and report actions to reduce GHG emissions. However, on June 1, 2017, President Trump announced that the United States would withdraw from the Paris Agreement, and begin negotiations to either re-enter or negotiate an entirely new agreement with more favorable terms for the United States. The Paris Agreement sets forth a specific exit process, whereby a party may not provide notice of its withdrawal until three years from the effective date, with such withdrawal taking effect one year from such notice. It is not clear what steps the Trump Administration plans to take to withdraw from the Paris Agreement, whether a new agreement can be negotiated or what terms would be included in such an
39
agreement. Furthermore, in response to the announcement, many state and local leaders have stated their intent to intensify efforts to uphold the commitments set forth in the international accord.
Although it is not possible at this time to predict how legislation or new regulations that may be adopted to address GHG emissions would impact our business, any such future laws and regulations imposing reporting obligations on, or limiting emissions of GHGs from, our equipment and operations could require us to incur costs to reduce emissions of GHGs associated with our operations. In addition, substantial limitations on GHG emissions could adversely affect demand for oil and natural gas and, consequently, the services we provide.
In addition, there have also been efforts in recent years to influence the investment community, including investment
advisors and certain sovereign wealth, pension and endowment funds promoting divestment of fossil fuel equities and pressuring lenders to limit funding to companies engaged in the extraction of fossil fuel reserves. Such environmental activism and initiatives aimed at limiting climate change and reducing air pollution could interfere with our business activities, operations and ability to access capital. Furthermore, claims have been made against certain energy companies alleging that GHG emissions from oil and natural gas operations constitute a public nuisance under federal and/or state common law. As a result, private individuals or public entities may seek to enforce environmental laws and regulations against us and could allege personal injury, property damage or other liabilities. While our business is not a party to any such litigation, we could be named in actions making similar allegations. An unfavorable ruling in any such case could significantly impact our operations and could have an adverse impact on our financial condition.
Moreover, climate change may cause more extreme weather conditions such as more intense hurricanes,
thunderstorms, tornadoes and snow or ice storms, as well as rising sea levels and increased volatility in seasonal
temperatures. Extreme weather conditions can interfere with our productivity and increase our costs and damage resulting
from extreme weather may not be fully insured. However, at this time, we are unable to determine the extent to which climate
change may lead to increased storm or weather hazards affecting our operations.
Federal and state legislative and regulatory initiatives relating to hydraulic fracturing could result in increased costs and additional operating restrictions or delays.
Our business is dependent on our ability to conduct hydraulic fracturing and horizontal drilling activities. Hydraulic fracturing is an important and common practice that is used to stimulate production of hydrocarbons, particularly natural gas, from tight formations, including shales. The process involves the injection of water, sand and chemicals (also called “proppants”) under pressure into formations to fracture the surrounding rock and stimulate production. There has been increasing public controversy regarding hydraulic fracturing with regard to the use of fracturing fluids, induced seismic activity, impacts on drinking water supplies, use of water and the potential for impacts to surface water, groundwater and the environment generally. A number of lawsuits and enforcement actions have been initiated across the country implicating hydraulic fracturing practices. The hydraulic fracturing process is typically regulated by state oil and natural gas commissions. However, legislation has been proposed in recent sessions of Congress to amend the federal Safe Drinking Water Act, or SDWA, to repeal the exemption for hydraulic fracturing from the definition of “underground injection,” to require federal permitting and regulatory control of hydraulic fracturing, and to require disclosure of the chemical constituents of the fluids used in the fracturing process. Furthermore, several federal agencies have asserted regulatory authority over certain aspects of the process. In addition, several states and local jurisdictions in which we operate have adopted or are considering adopting regulations that could restrict or prohibit hydraulic fracturing in certain circumstances, impose more stringent operating standards and/or require the disclosure of the composition of hydraulic fracturing fluids. For a more detailed description, see "Business—Regulation—Regulation of Hydraulic Fracturing."
If new laws or regulations are adopted that significantly restrict hydraulic fracturing, such laws could make it more difficult or costly for us to perform fracturing to stimulate production from tight formations as well as make it easier for third parties opposing the hydraulic fracturing process to initiate legal proceedings based on allegations that specific chemicals used in the fracturing process could adversely affect groundwater. In addition, if hydraulic fracturing is further regulated at the federal, state or local level, our fracturing activities could become subject to additional permitting and financial assurance requirements, more stringent construction specifications, increased monitoring, reporting and recordkeeping obligations and also to attendant permitting delays and potential increases in costs, which could reduce the demand for our services. Such legislative or regulatory changes could cause us to incur substantial compliance costs, and compliance or the consequences of any failure to comply by us could have a material adverse effect on our business, financial condition, results of operations and cash flows. At this time, it is not possible to estimate the impact on our business of newly enacted or potential federal, state or local laws governing hydraulic fracturing.
40
Legislation or regulatory initiatives intended to address seismic activity could restrict certain of our customers’ drilling and production activities, as well as well as their ability to dispose of produced water gathered from such activities, which could have a material adverse effect on our business.
State and federal regulatory agencies have recently focused on a possible connection between hydraulic fracturing related activities, particularly the underground injection of wastewater into disposal wells, and the increased occurrence of seismic activity, and regulatory agencies at all levels are continuing to study the possible linkage between oil and gas activity and induced seismicity. In addition, a number of lawsuits have been filed in some states alleging that disposal well operations have caused damage to neighboring properties or otherwise violated state and federal rules regulating waste disposal. In response to these concerns, regulators in some states are seeking to impose additional requirements, including requirements regarding the permitting of produced water disposal wells or otherwise to assess the relationship between seismicity and the use of such wells.
Certain of our customers dispose of large volumes of produced water gathered from their drilling and production operations by injecting it into wells pursuant to permits issued to them by governmental authorities overseeing such disposal activities. While these permits are issued pursuant to existing laws and regulations, these legal requirements are subject to change, which could result in the imposition of more stringent operating constraints or new monitoring and reporting requirements, owing to, among other things, concerns of the public or governmental authorities regarding such gathering or disposal activities. The adoption and implementation of any new laws or regulations that restrict our ability to use hydraulic fracturing or dispose of produced water gathered from certain of our customers’ drilling and production activities by owned disposal wells, could have a material adverse effect on our business, financial condition and results of operations.
Our operations in our natural sand proppant services business are dependent on our rights and ability to mine our properties and on our having renewed or received the required permits and approvals from governmental authorities and other third parties.
We hold numerous governmental, environmental, mining and other permits, water rights and approvals authorizing operations at our production facilities. For our extraction and processing in Wisconsin, the permitting process is subject to federal, state and local authority. For example, at the federal level, a Mine Identification Request must be filed and obtained before mining commences. If wetlands are implicated, a U.S. Army Corps of Engineers Wetland Permit is required. At the state level, a series of permits are required related to air quality, wetlands, water quality (waste water and storm water), grading, endangered species and archaeological assessments in addition to other permits depending upon site specific factors and operational detail. At the local level, zoning, building, storm water, erosion control, wellhead protection, road usage and access are all regulated and require permitting to some degree. A non-metallic mining reclamation permit is required. A decision by a governmental agency or other third party to deny or delay issuing a new or renewed permit or approval, or to revoke or substantially modify an existing permit or approval, could have a material adverse effect on our ability to continue operations.
Title to, and the area of, mineral properties and water rights may also be disputed. Mineral properties sometimes contain claims or transfer histories that examiners cannot verify. A successful claim that we do not have title to our property or lack appropriate water rights could cause us to lose any rights to explore, develop and extract minerals, without compensation for our prior expenditures relating to such property. Our business may suffer a material adverse effect in the event we have title deficiencies.
In some instances, we have received access rights or easements from third parties, which allow for a more efficient operation than would exist without the access or easement. A third party could take action to suspend the access or easement, and any such action could be materially adverse to our business, results of operations, cash flows or financial condition.
Penalties, fines or sanctions that may be imposed by the U.S. Mine Safety and Health Administration could have a material adverse effect on our proppant production and sales business and our overall financial condition, results of operations and cash flows.
The U.S. Mine Safety and Health Administration, or MSHA, has primary regulatory jurisdiction over commercial silica operations, including quarries, surface mines, underground mines, and industrial mineral process facilities. In addition, MSHA representatives perform at least two annual inspections of our production facilities to ensure employee and general site safety. As a result of these and future inspections and alleged violations and potential violations, we and our suppliers could be subject to material fines, penalties or sanctions. Any of our production facilities or our suppliers’ mines could be subject to a temporary or extended shut down as a result of an alleged MSHA violation. Any such penalties, fines or sanctions could have a material adverse effect on our proppant production and sales business and our overall financial condition, results of operations and cash flows.
41
Increasing trucking regulations may increase our costs and negatively impact our results of operations.
In connection with our business operations, including the transportation and relocation of our energy service equipment and shipment of frac sand, we operate trucks and other heavy equipment. As such, we operate as a motor carrier in providing certain of our services and therefore are subject to regulation by the United States Department of Transportation and by various state agencies. These regulatory authorities exercise broad powers, governing activities such as the authorization to engage in motor carrier operations, driver licensing, insurance requirements, financial reporting and review of certain mergers, consolidations and acquisitions, and transportation of hazardous materials (HAZMAT). Our trucking operations are subject to possible regulatory and legislative changes that may increase our costs. Some of these possible changes include increasingly stringent environmental regulations, changes in the hours of service regulations which govern the amount of time a driver may drive or work in any specific period, onboard black box recorder device requirements or limits on vehicle weight and size. Interstate motor carrier operations are subject to safety requirements prescribed by the United States Department of Transportation. To a large degree, intrastate motor carrier operations are subject to state safety regulations that mirror federal regulations. Matters such as the weight and dimensions of equipment are also subject to federal and state regulations. From time to time, various legislative proposals are introduced, including proposals to increase federal, state, or local taxes, including taxes on motor fuels, which may increase our costs or adversely impact the recruitment of drivers. We cannot predict whether, or in what form, any increase in such taxes applicable to us will be enacted.
Certain motor vehicle operators require registration with the Department of Transportation. This registration requires an acceptable operating record. The Department of Transportation periodically conducts compliance reviews and may revoke registration privileges based on certain safety performance criteria that could result in a suspension of operations.
Restrictions on drilling activities intended to protect certain species of wildlife may adversely affect our ability to conduct mining or drilling activities in some of the areas where we operate.
Oil and natural gas operations in our operating areas can be adversely affected by seasonal or permanent restrictions on mining or drilling activities designed to protect various wildlife, which may limit our ability to operate in protected areas. Permanent restrictions imposed to protect endangered species could prohibit drilling in certain areas or require the implementation of expensive mitigation measures. Additionally, the designation of previously unprotected species as threatened or endangered in areas where we operate could result in increased costs arising from species protection measures. Restrictions on oil and natural gas operations to protect wildlife could reduce demand for our services.
Conservation measures and technological advances could reduce demand for oil and natural gas and our services.
Fuel conservation measures, alternative fuel requirements, increasing consumer demand for alternatives to oil and natural gas, technological advances in fuel economy and energy generation devices could reduce demand for oil and natural gas, resulting in reduced demand for oilfield services. The impact of the changing demand for oil and natural gas services and products may have a material adverse effect on our business, financial condition, results of operations and cash flows.
Changes in tax laws and regulations or adverse outcomes resulting from examination of our tax returns may adversely affect our business, results of operations, financial condition and cash flow.
On December 22, 2017, the President of the United States signed into law Public Law No. 115-97, a comprehensive tax reform bill commonly referred to as the Tax Cuts and Jobs Act, or the Tax Act, that significantly reforms the Internal Revenue Code of 1986, as amended, or the Code. Among other changes, the Tax Act (i) permanently reduced the U.S. corporate income tax rate, (ii) provided for a transition tax (toll tax) on a one-time “deemed repatriation” of accumulated foreign earnings, (iii) repealed the corporate alternative minimum tax, (iv) imposed new limitations on the utilization of net operating losses, and (v) provided for more general changes to the taxation of corporations, including changes to the deductibility of interest expense, the adoption of a modified territorial tax system, and introducing certain anti-base erosion provisions. The Tax Act is complex and far-reaching, and we cannot predict with certainty the resulting impact its enactment will have on us. The ultimate impact of the Tax Act may differ from our estimates due to changes in interpretations and assumptions made by us as well as additional regulatory guidance that may be issued, and any such changes in our interpretations and assumptions could have an adverse effect on our business, results of operations, financial condition and cash flow.
On December 10, 2018, the Governor of Puerto Rico signed into law House Bill 1544 as Act 257-2018, or Act 257, which amended the Puerto Rico Internal Revenue Code. Among other changes, Act 257 (i) reduces the corporate income tax rate from 39% to 37.5%, (ii) provides that the 51% disallowance with respect to expenses paid or incurred with a related party
42
may not apply under certain circumstances and (iii) adds requirements for the deductibility of expenses, including meals and entertainment, travel and motor vehicles. We cannot predict with certainty the resulting impact the enactment of Act 257 will have on us. The ultimate impact of Act 257 may differ from our estimates due to changes in interpretations and assumptions made by us as well as additional regulatory guidance that may be issued, and any such changes in our interpretations and assumptions could have an adverse effect on our business, results of operations, financial condition and cash flow.
In addition, we are subject to tax liabilities imposed by multiple jurisdictions, including income taxes, indirect taxes (excise/duty, sales/use and value-added taxes), payroll taxes, franchise taxes, withholding taxes and ad valorem taxes. New tax laws and regulations and changes in existing tax laws and regulations are continuously being enacted or proposed that could result in increased expenditures for tax liabilities in the future, which could have a material adverse effect on our results of operations, financial condition and cash flows. Additionally, many of these liabilities are subject to periodic audits by the respective taxing authority. Subsequent changes to our tax liabilities as a result of these audits may subject us to interest and penalties.
Our income tax returns are subject to review and examination by the applicable tax authorities. We regularly assess the likelihood of an adverse outcome resulting from these examinations to determine the adequacy of our provision for income taxes. We do not recognize the benefit of income tax positions we believe are more likely than not to be disallowed upon challenge by a tax authority. Although we believe our tax provisions are adequate, the final determination of tax audits and any related disputes could be materially different from our historical income tax provisions and accruals. The results of audits or related disputes could have an adverse effect on our financial statements for the periods for which the applicable final determinations are made.
Our operations are subject to a number of operational risks which may result in unexpected costs or liabilities.
Unexpected costs or liabilities may arise from lawsuits or indemnity claims related to the services we perform or have performed in the past. We have in the past been, and may in the future be, named as a defendant in lawsuits, claims and other legal proceedings during the ordinary course of our business. These actions may seek, among other things, compensation for alleged personal injury, workers’ compensation, employment discrimination, breach of contract, property damage, environmental remediation, punitive damages, civil penalties or other losses, consequential damages or injunctive or declaratory relief. In addition, pursuant to our service arrangements, we generally indemnify our customers for claims related to the services we provide under those service arrangements. In some instances, our services are integral to the operation and performance of the electric distribution and transmission infrastructure. As a result, we may become subject to lawsuits or claims for any failure of the systems we work on, even if our services are not the cause for such failures. In addition, we may incur civil and criminal liabilities to the extent that our services contributed to any personal injury or property damage. The outcome of any of these lawsuits, claims or legal proceedings could result in significant costs and diversion of managements’ attention to the business.
Losses and liabilities from uninsured or underinsured activities could have a material adverse effect on our financial condition and operations.
The operational insurance coverage we maintain for our business may not fully insure us against all risks, either because insurance is not available or because of the high premium costs relative to perceived risk. Further, any insurance obtained by us may not be adequate to cover any losses or liabilities and this insurance may not continue to be available at all or on terms which are acceptable to us. Insurance rates have in the past been subject to wide fluctuation and changes in coverage could result in less coverage, increases in cost or higher deductibles and retentions. Liabilities for which we are not insured, or which exceed the policy limits of our applicable insurance, could have a material adverse effect on our business activities, financial condition and results of operations.
We may be subject to claims for personal injury and property damage, which could materially adversely affect our financial condition and results of operations.
We operate with most of our customers under master service agreements, or MSAs. We endeavor to allocate potential liabilities and risks between the parties in the MSAs. Generally, under our MSAs, including those relating to our hydraulic fracturing services, we assume responsibility for, including control and removal of, pollution or contamination which originates above surface and originates from our equipment or services. Our customer assumes responsibility for, including control and removal of, all other pollution or contamination which may occur during operations, including that which may result from seepage or any other uncontrolled flow of drilling fluids. We may have liability in such cases if we are negligent or commit willful acts. Generally, our customers also agree to indemnify us against claims arising from their employees’ personal injury or death to the extent that, in the case of our hydraulic fracturing operations, their employees are injured or their properties are
43
damaged by such operations, unless resulting from our gross negligence or willful misconduct. Similarly, we generally agree to indemnify our customers for liabilities arising from personal injury to or death of any of our employees, unless resulting from gross negligence or willful misconduct of the customer. In addition, our customers generally agree to indemnify us for loss or destruction of customer-owned property or equipment and in turn, we agree to indemnify our customers for loss or destruction of property or equipment we own. Losses due to catastrophic events, such as blowouts, are generally the responsibility of the customer. However, despite this general allocation of risk, we might not succeed in enforcing such contractual allocation, might incur an unforeseen liability falling outside the scope of such allocation or may be required to enter into an MSA with terms that vary from the above allocations of risk. As a result, we may incur substantial losses which could materially and adversely affect our financial condition and results of operation.
Loss of our information and computer systems could adversely affect our business.
We are heavily dependent on our information systems and computer based programs, including our well operations information and accounting data. If any of such programs or systems were to fail or create erroneous information in our hardware or software network infrastructure, whether due to cyberattack or otherwise, possible consequences include our loss of communication links and inability to automatically process commercial transactions or engage in similar automated or computerized business activities. Any such consequence could have a material adverse effect on our business.
We are subject to cyber security risks. A cyber incident could occur and result in information theft, data corruption, operational disruption and/or financial loss.
The energy services industry has become increasingly dependent on digital technologies to conduct certain processing activities. For example, we depend on digital technologies to perform many of our services and process and record financial and operating data. At the same time, cyber incidents, including deliberate attacks or unintentional events, have increased. The U.S. government has issued public warnings that indicate that energy assets might be specific targets of cyber security threats. Our technologies, systems and networks, and those of our vendors, suppliers and other business partners, may become the target of cyberattacks or information security breaches that could result in the unauthorized release, gathering, monitoring, misuse, loss or destruction of proprietary and other information, or other disruption of our business operations. In addition, certain cyber incidents, such as surveillance, may remain undetected for an extended period. Our systems and insurance coverage for protecting against cyber security risks may not be sufficient. As cyber incidents continue to evolve, we may be required to expend additional resources to continue to modify or enhance our protective measures or to investigate and remediate any vulnerability to cyber incidents. Our insurance coverage for cyberattacks may not be sufficient to cover all the losses we may experience as a result of such cyberattacks.
Risks Inherent to Our Common Stock
Our two largest stockholders control a significant percentage of our common stock, and their interests may conflict with those of our other stockholders.
Wexford, through its affiliate MEH Sub LLC, and Gulfport beneficially own approximately
49.0%
and
21.9%
, respectively, of our outstanding common stock. As a result, each of Wexford and Gulfport can exercise significant influence over matters requiring stockholder approval, including the election of directors, changes to our organizational documents and significant corporate transactions. Further, three individuals who serve as our directors are affiliates of Wexford or Gulfport. This concentration of ownership and relationships with Wexford and Gulfport make it unlikely that any other holder or group of holders of our common stock will be able to affect the way we are managed or the direction of our business. In addition, we have engaged, and expect to continue to engage, in related party transactions involving Wexford and Gulfport, and certain companies they control. The interests of Wexford and Gulfport with respect to matters potentially or actually involving or affecting us, such as services provided, future acquisitions, financings and other corporate opportunities, and attempts to acquire us, may conflict with the interests of our other stockholders. This concentrated ownership will make it impossible for another company to acquire us and for you to receive any related takeover premium for your shares unless these stockholders approve the acquisition.
A significant reduction by Wexford or Gulfport of their ownership interests in us could adversely affect us.
We believe that Wexford’s and Gulfport’s substantial ownership interests in us provide them with an economic incentive to assist us to be successful. Neither Wexford nor Gulfport is subject to any obligation to maintain its ownership interest in us and may elect at any time to sell all or a substantial portion of or otherwise reduce its ownership interest in us. If Wexford or Gulfport sells all or a substantial portion of its ownership interest in us, it may have less incentive to assist in our
44
success and its affiliates that serve as members of our board of directors may resign. Such actions could adversely affect our ability to successfully implement our business strategies which could adversely affect our cash flows or results of operations.
We have ceased to be an emerging growth company as of December 31, 2018 and, as a result, we are required to comply with enhanced internal control provisions of the Sarbanes-Oxley Act and increased disclosure and corporate governance requirements.
We generated over $1.07 billion in revenue in 2018. As a result, we ceased to be an emerging growth company as defined in the JOBS Act as of December 31, 2018. We are an accelerated filer as of December 31, 2018 and are subject to certain requirements that apply to other public companies, but did not previously apply to us due to our status as an emerging growth company. These requirements include:
|
•
|
the provisions of Section 404(b) of the Sarbanes-Oxley Act requiring that our independent registered public accounting firm provide an attestation report on the effectiveness of our internal control over financial reporting;
|
|
•
|
the requirement to provide detailed compensation discussion and analysis in proxy statements and reports filed under the Exchange Act; and
|
|
•
|
the "say on pay" provisions, which require a non-binding stockholder vote to approve compensation of certain executive officers, and the "say on golden parachute" provisions, which require a non-binding stockholder vote to approve golden parachute arrangements for certain executive officers in connection with mergers and certain other business combinations, of the Dodd-Frank Act.
|
These changes require a commitment of additional resources. If we are unable to comply with these obligations or if the costs related to compliance are significant, our business, results of operations and financial condition could be adversely affected.
We have and will continue to incur increased costs and obligations as a result of being a public company.
As a public company, we have incurred and will continue to incur significant legal, accounting and other expenses. These include costs associated with our public company reporting requirements and corporate governance requirements, including requirements under the Sarbanes-Oxley Act of 2002 and the Dodd-Frank Act of 2010, as well as rules implemented by the SEC, The Nasdaq Global Select Market and the Financial Industry Regulatory Authority. These rules and regulations have increased our legal and financial compliance costs and made some activities more time-consuming and costly. These rules and regulations may also make it more difficult and more expensive for us to obtain director and officer liability insurance and we may be required to accept reduced policy limits and coverage or incur substantially higher costs to obtain the same or similar coverage. As a result, it may be more difficult for us to attract and retain qualified individuals to serve on our board of directors or as executive officers. We estimate that we incur approximately $2.5 million of incremental costs per year associated with being a publicly traded company; however, it is possible that our incremental costs of being a publicly traded company will be higher than we currently estimate. As we ceased to be an “emerging growth company” as of December 31, 2018, we have incurred and expect to continue to incur significant additional expenses and devote substantial management effort toward ensuring compliance with those requirements applicable to companies that are not “emerging growth companies,” including Section 404 of the Sarbanes-Oxley Act. See “-Risks Related to Our Common Stock-We are subject to certain requirements of Section 404 of the Sarbanes-Oxley Act. If we are unable to continue to comply with Section 404 or if the costs related to compliance are significant, our profitability, stock price, results of operations and financial condition could be materially adversely affected.”
We are subject to certain requirements of Section 404 of the Sarbanes-Oxley Act. If we are unable to continue comply with Section 404 or if the costs related to compliance are significant, our profitability, stock price, results of operations and financial condition could be materially adversely affected.
As discussed above, as of December 31, 2018, we ceased to be an “emerging growth company” and are now required to comply with the enhanced provisions of Section 404 of the Sarbanes-Oxley Act of 2002 applicable to non-emerging growth companies. Section 404 requires that we not only document and test our internal control over financial reporting and issue management’s assessment of our internal control over financial reporting, as we have done in the past, but also that our independent registered public accounting firm attest to and report on the internal control assessments made by our management. As we perform the required testing of, and our auditors’ audit, our internal control over financial reporting, we or they may identify areas requiring improvement, and we may have to design enhanced processes and controls to address issues identified through this review. We believe that the out-of-pocket costs, the diversion of management’s attention from running the day-to-day operations and operational changes caused by the need to comply with the enhanced requirements of Section
45
404 of the Sarbanes-Oxley Act applicable to non-emerging growth companies could be significant. If the time and costs associated with such compliance exceed our current expectations, our results of operations could be adversely affected.
If we fail to comply with the requirements of Section 404 of the Sarbanes-Oxley Act, or if we or our auditors identify and report material weaknesses in internal control over financial reporting, the accuracy and timeliness of the filing of our annual and quarterly reports may be materially adversely affected and could cause investors to lose confidence in our reported financial information, which could have a negative effect on the trading price of our common stock. In addition, a material weakness in the effectiveness of our internal control over financial reporting could result in an increased chance of fraud and the loss of customers, reduce our ability to obtain financing and require additional expenditures to comply with these requirements, each of which could have a material adverse effect on our business, results of operations and financial condition.
The corporate opportunity provisions in our certificate of incorporation could enable Wexford, Gulfport or other affiliates of ours to benefit from corporate opportunities that might otherwise be available to us.
Subject to the limitations of applicable law, our certificate of incorporation, among other things:
|
•
|
permits us to enter into transactions with entities in which one or more of our officers or directors are financially or otherwise interested;
|
|
•
|
permits any of our stockholders, officers or directors to conduct business that competes with us and to make investments in any kind of property in which we may make investments; and
|
|
•
|
provides that if any director or officer of one of our affiliates who is also one of our officers or directors becomes aware of a potential business opportunity, transaction or other matter (other than one expressly offered to that director or officer in writing solely in his or her capacity as our director or officer), that director or officer will have no duty to communicate or offer that opportunity to us, and will be permitted to communicate or offer that opportunity to such affiliates and that director or officer will not be deemed to have (i) acted in a manner inconsistent with his or her fiduciary or other duties to us regarding the opportunity or (ii) acted in bad faith or in a manner inconsistent with our best interests.
|
These provisions create the possibility that a corporate opportunity that would otherwise be available to us may be used for the benefit of one of our affiliates.
We have engaged in transactions with our affiliates and expect to do so in the future. The terms of such transactions and the resolution of any conflicts that may arise may not always be in our or our common stockholders’ best interests.
We have engaged in transactions and expect to continue to engage in transactions with affiliated companies. As described elsewhere in this report, including in the notes to our consolidated financial statements, these transactions include, among others, a joint venture, agreements to provide our services and frac sand products to our affiliates and agreements pursuant to which our affiliates provide or will provide us with certain services, including administrative and advisory services and office space. Each of these entities is either controlled by or affiliated with Wexford or Gulfport, as the case may be, and the resolution of any conflicts that may arise in connection with such related party transactions, including pricing, duration or other terms of service, may not always be in our or our stockholders’ best interests because Wexford and/or Gulfport may have the ability to influence the outcome of these conflicts. For a discussion of potential conflicts, see “
—Risks Inherent to Our Common Stock—Our two largest stockholders control a significant percentage of our common stock, and their interests may conflict with those of our other stockholders
.”
Prior to the IPO, there was no public market for our common stock and if the price of our common stock fluctuates significantly, your investment could lose value.
Prior to the completion of the IPO in October 2016, there was no public market for our common stock. Although our common stock is listed on The Nasdaq Global Select Market, an active public market for our common stock may not be maintained. If an active public market for our common stock is not maintained, the trading price and liquidity of our common stock will be materially and adversely affected. If there is a thin trading market or “float” for our common stock, the market price for our common stock may fluctuate significantly more than the stock market as a whole. Without a large float, our common stock is less liquid than the securities of companies with broader public ownership and, as a result, the trading prices of our common stock may be more volatile. In addition, in the absence of an active public trading market, investors may be unable to liquidate their investment in us. In addition, the stock market is subject to significant price and volume fluctuations, and the price of our common stock could fluctuate widely in response to several factors, including:
|
•
|
our quarterly or annual operating results;
|
46
|
•
|
changes in our earnings estimates;
|
|
•
|
investment recommendations by securities analysts following our business or our industries;
|
|
•
|
additions or departures of key personnel;
|
|
•
|
changes in the business, earnings estimates or market perceptions of our competitors;
|
|
•
|
our failure to achieve operating results consistent with securities analysts’ projections;
|
|
•
|
changes in industry, general market or economic conditions; and
|
|
•
|
announcements of legislative or regulatory change.
|
The stock market has experienced extreme price and volume fluctuations in recent years that have significantly affected the quoted prices of the securities of many companies, including companies in our industries. The changes often appear to occur without regard to specific operating performance. The price of our common stock could fluctuate based upon factors that have little or nothing to do with our company and these fluctuations could materially reduce the price for our common stock.
Wexford and Gulfport beneficially own a substantial amount of our common stock and may sell such common stock in the public or private markets. Sales of these shares of common stock or sales of substantial amounts of our common stock by other stockholders, or the perception that such sales may occur, could adversely affect the prevailing market price of our common stock.
As of
December 31, 2018
, Wexford and Gulfport beneficially owned
49.0%
and
21.9%
shares of our common stock, respectively. Sales of these shares of common stock or sales of substantial amounts of our common stock by other stockholders, or the perception that such sales may occur, could cause the price of our common stock to decline. In addition, the sale of these shares could impair our ability to raise capital through the sale of additional common or preferred stock.
If securities or industry analysts do not publish research or reports about our business, if they adversely revise their recommendations regarding our stock or if our operating results do not meet their expectations, the price of our stock could decline.
The trading market for our common stock will be influenced by the research and reports that industry or securities analysts publish about us or our business. If one or more of these analysts cease coverage of our company or fail to publish reports on us regularly, we could lose visibility in the financial markets, which in turn could cause our stock price or trading volume to decline. Moreover, if one or more of the analysts who cover our company downgrades our stock or if our operating results do not meet their expectations, our stock price could decline.
We may issue preferred stock whose terms could adversely affect the voting power or value of our common stock.
Our certificate of incorporation authorizes us to issue, without the approval of our stockholders, one or more classes or series of preferred stock having such designations, preferences, limitations and relative rights, including preferences over our common stock respecting dividends and distributions, as our board of directors may determine. The terms of one or more classes or series of preferred stock could adversely impact the voting power or value of our common stock. For example, we might grant holders of preferred stock the right to elect some number of our directors in all events or on the happening of specified events or the right to veto specified transactions. Similarly, the repurchase or redemption rights or liquidation preferences we might assign to holders of preferred stock could affect the residual value of the common stock.
Provisions in our certificate of incorporation and bylaws and Delaware law make it more difficult to effect a change in control of the company, which could adversely affect the price of our common stock.
The existence of some provisions in our certificate of incorporation and bylaws and Delaware corporate law could delay or prevent a change in control of our company, even if that change would be beneficial to our stockholders. Our certificate of incorporation and bylaws contain provisions that may make acquiring control of our company difficult, including:
|
•
|
provisions regulating the ability of our stockholders to nominate directors for election or to bring matters for action at annual meetings of our stockholders;
|
|
•
|
limitations on the ability of our stockholders to call a special meeting and act by written consent;
|
|
•
|
the ability of our board of directors to adopt, amend or repeal bylaws, and the requirement that the affirmative vote of holders representing at least 66 2/3% of the voting power of all outstanding shares of capital stock be obtained for stockholders to amend our bylaws;
|
|
•
|
the requirement that the affirmative vote of holders representing at least 66 2/3% of the voting power of all outstanding shares of capital stock be obtained to remove directors;
|
47
|
•
|
the requirement that the affirmative vote of holders representing at least 66 2/3% of the voting power of all outstanding shares of capital stock be obtained to amend our certificate of incorporation; and
|
|
•
|
the authorization given to our board of directors to issue and set the terms of preferred stock without the approval of our stockholders.
|
These provisions also could discourage proxy contests and make it more difficult for you and other stockholders to elect directors and take other corporate actions. As a result, these provisions could make it more difficult for a third party to acquire us, even if doing so would benefit our stockholders, which may limit the price that investors are willing to pay in the future for shares of our common stock.
Our certificate of incorporation designates courts in the State of Delaware as the sole and exclusive forum for certain types of actions and proceedings that may be initiated by our stockholders, which could limit our stockholders’ ability to obtain a favorable judicial forum for disputes with us or our directors, officers or other employees.
Our certificate of incorporation provides that, subject to limited exceptions, the Court of Chancery of the State of Delaware will be the sole and exclusive forum for:
|
•
|
Any derivative action or proceeding brought on our behalf;
|
|
•
|
Any action asserting a claim of breach of fiduciary duty owed by any of our directors, officers or other employees to us or our stockholders;
|
|
•
|
Any action asserting a claim against us arising pursuant to any provision of the Delaware General Corporation Law; or
|
|
•
|
Any other action asserting a claim against us that is governed by the internal affairs doctrine.
|
In addition, our certificate of incorporation provides that if any action specified above (each is referred to herein as a covered proceeding), is filed in a court other than the specified Delaware courts without the approval of our board of directors (each is referred to herein as a foreign action), the claiming party will be deemed to have consented to (i) the personal jurisdiction of the specified Delaware courts in connection with any action brought in any such courts to enforce the exclusive forum provision described above and (ii) having service of process made upon such claiming party in any such enforcement action by service upon such claiming party’s counsel in the foreign action as agent for such claiming party. These provisions may limit a stockholder’s ability to bring a claim in a judicial forum that it finds favorable for disputes with us or our directors, officers or other employees, which may discourage such lawsuits against us and our directors, officers and employees. Alternatively, if a court were to find these provisions of our certificate of incorporation inapplicable to, or unenforceable in respect of, one or more of the covered proceedings, we may incur additional costs associated with resolving such matters in other jurisdictions, which could adversely affect our business and financial condition.
The declaration of dividends on our common stock is within the discretion of our board of directors based upon a review of relevant considerations, and there is no guarantee that we will pay any dividends in the future or at levels anticipated by our stockholders.
On July 16, 2018, our board of directors initiated a quarterly dividend policy on shares of our common stock payable quarterly beginning with the second quarter of 2018. The decision to pay dividends, however, is solely within the discretion of, and subject to approval by, our board of directors. Our board of directors’ determination with respect to any such dividends, including the record date, the payment date and the actual amount of the dividend, will depend upon our profitability and financial condition, contractual restrictions, restrictions imposed by applicable law and other factors that the board deems relevant at the time of such determination. Based on its evaluation of these factors, the board of directors may determine not to declare a dividend, or declare dividends at rates that are less than currently anticipated, either of which could reduce returns to our stockholders.
Item 1B. Unresolved Staff Comments
None.
Item 2. Properties
Our corporate headquarters are located at 14201 Caliber Drive, Suite 300, Oklahoma City, Oklahoma 73134. We currently own 16 properties, five located in Wisconsin, five located in Texas, four located in Ohio and two located in Oklahoma, which are used for field offices, yards, production plants or housing. In addition to our headquarters, we also lease
48
43 properties that are used for field offices, yards or transloading facilities for frac sand. We believe that our facilities are adequate for our current operations.
Sand Properties
On May 26, 2017, we acquired substantially all of the assets of Chieftain Sand and Proppant, LLC and Chieftain Sand and Proppant Barron, LLC, unrelated third party sellers, which we collectively refer to as Chieftain, following our successful bid in a bankruptcy court auction, which assets included our Piranha facilities described in more detail below, for approximately $36.3 million. On June 5, 2017, we acquired from Gulfport, Rhino and certain affiliates of Wexford all outstanding membership interests in Sturgeon Acquisitions LLC, which owns Taylor Frac, LLC, Taylor Real Estate Investments, LLC and South River Road, LLC, which acquisition included our Taylor facilities, described in more detail below, in exchange for our issuance of an aggregate of 5,607,452 shares of our common stock to the sellers, with an aggregate value of $103.7 million as of the closing date. These acquisitions expanded our natural sand proppant business operations, added sand reserves and increased our production capacity.
Our natural sand proppant business mines, processes and sells high quality silica, a key input for the hydraulic fracturing of oil and gas wells, which we refer to as frac sand. All of our frac sand facilities are located in Wisconsin, with our Taylor facilities located in Jackson County, our Piranha facilities located in Barron County and our Muskie facilities located in Pierce County. Our frac sand facilities consist of three dry plants with a total permitted capacity of 6.6 million tons of sand per year, and two wet plants that supply two of the dry plants with Northern White silica sand, which we believe is some of the highest quality raw frac sand available. Our Muskie dry plant in Pierce County, Wisconsin also has a wet plant, but is currently supplied by washed sand that is purchased from a third party supplier.
The production of our frac sand consists of three basic processes: mining, wet plant operations and dry plant operations. All mining activities take place in an open pit environment, whereby we remove the topsoil, which is set aside, and then remove other non-economic minerals, or “overburden,” to expose the sand deposits. We then “bump” the sand using explosives on the mine face, which causes the sand to fall into the pit, where it is then carried by truck or conveyor to the wet plant operations. At our wet plants, the mined sand goes through a series of processes designed to separate the sand from unusable materials. The resulting wet sand is then conveyed to a wet sand stockpile where most of the water is allowed to drain into our on-site recycling facility, while the remaining fine grains and materials, if any, are separated through a series of settlement ponds. We reuse the water that does not evaporate in our wet process. Wet sand from our stockpile is then conveyed or trucked to our dry plants where the sand is dried, screened into specific mesh categories and stored in silos. From the silos, we load sand directly into railcars or trucks, which we then ship to one of our transloading facilities or directly to our customers. For information regarding our transloading facilities and shipping capabilities, see “Item 1. Business-Our Services-Natural Sand Proppant Services.”
Taylor.
Our Taylor facilities are located in Taylor, Wisconsin and encompass a total of approximately 393 acres. The site contains a mine with 26.3 million tons of proven recoverable proppant sand reserves as of
December 31, 2018
, based on estimates prepared by John T. Boyd Company, our third party mining and geological consultant. Our Taylor wet plant can currently process up to 2.6 million tons of wet frac sand per year. Our Taylor dry plant is adjacent to our Taylor wet plant and wash facilities. As of
December 31, 2018
, the dry plant had a rated production capacity of 2.2 million tons per year. Our current air permit allows us to produce up to 2.2 million tons per year of finished product. Prior to the expansion in the first quarter of 2018, our Taylor facility had a 100 ton per hour natural gas fluid bed dryer as well as five high capacity gyratory mineral separators, or screeners, capable of producing 0.9 million tons of frac sand per year. The expanded Taylor facility now includes a new 150 ton per hour natural gas fluid bed dryer in addition to the existing 100 ton per hour natural gas fluid bed dryer as well as nine high capacity screeners that are capable of producing 2.2 million tons of frac sand per year. During the year ended
December 31, 2018
, our Taylor facility produced 0.9 million tons of sand. Our finished product is transported via truck to our transloading facility with rail access.
Piranha.
Our Piranha facilities are located in New Auburn, Wisconsin and encompass a total of approximately 608 acres. The site contains 42.4 tons of proven recoverable proppant sand reserves as of
December 31, 2018
, based on estimates prepared by John T. Boyd Company. Our Piranha wet plant, which is adjacent to the mine, can process up to 4.7 million tons of wet sand per year and is located two miles from our Piranha dry plant, to which we have year-round trucking access. As of
December 31, 2018
, the dry plant facility had a rated production capacity of 2.6 million tons per year. Our current air permit allows us to produce up to 3.5 million tons per year of finished product. Prior to upgrades completed in the third quarter of 2018, our Piranha facility had a 150 ton per hour natural gas fired fluid bed dryer and a 90 ton per hour natural gas fired rotary dryer as well as seven high capacity screeners capable of producing 2.1 million tons of frac sand per year. During the third quarter of 2018, we upgraded our 90 ton per hour natural gas fired rotary dryer to a 200 ton per hour natural gas fluid bed dryer. Our Piranha dry plant facility is now capable of producing 2.6 million tons of frac sand per year. During the year ended
49
December 31, 2018
, our Piranha facility produced 1.2 million tons of sand. Our finished product is loaded directly into railcars. Our Piranha facility is capable of storing up to 400 railcars.
Muskie.
Our Muskie facilities are located in Plum City, Wisconsin and encompass a total of approximately 40 acres. Although we are currently purchasing washed sand from a third party supplier, our Muskie wet plant can process up to 1.3 million tons of wet sand per year. The site includes an indoor facility capable of washing sand year-round and an enclosed dry plant facility that has a rated production capacity of 2,400 tons per day. Our current air permit allows us to produce up to 0.9 million tons per year of finished product. The facility has a 100 ton per hour natural gas fired fluid bed dryer as well as six high capacity screeners that are capable of producing 0.9 million tons per year. During the year ended
December 31, 2018
, our Muskie facility produced 0.2 million tons of sand. As a result of adverse market conditions, production at our Muskie facility has been temporarily idled since September 2018. Our finished product is transported via truck to a third-party facility with rail access. The site does not contain any proppant sand reserves.
Our Wisconsin dry plants are enclosed facilities capable of running year-round, regardless of the weather. Under normal market conditions, we typically operate our plants with work crews of ten to 15 employees. These crews typically work 40-hour weeks, with shifts between eight and twelve hours, depending on the employee’s function. Because raw sand cannot be wet-processed during extremely cold temperatures, we typically mine and wet-process sand eight months out of the year at our Taylor and Piranha locations. Our Muskie location has an indoor wash facility, which is capable of being run year-round.
Each of our facilities undergoes regular maintenance to minimize unscheduled downtime and to ensure that the quality of our frac sand meets API standards and our customers’ specifications. In addition, we make capital investments in our facilities as required to support customer demand, and our performance goals.
We are currently capable of producing up to 5.7 million dry tons and 8.7 million washed tons of sand per year. The following tables provides information regarding our rated production capacities of our sand production facilities as of
December 31, 2018
:
|
Wet Plant Location
|
Annual Rated Plant Capacity
(Thousands of Tons)
|
||
|
Taylor in Jackson County, Wisconsin
|
2,646
|
|
|
|
Piranha in Barron County, Wisconsin
|
4,704
|
|
|
|
Muskie in Pierce County, Wisconsin
|
1,314
|
|
|
|
Dry Plant Location
|
Annual Rated Plant Capacity
(Thousands of Tons)
(a)
|
||
|
Taylor in Jackson County, Wisconsin
|
2,190
|
|
|
|
Piranha in Barron County, Wisconsin
|
2,628
|
|
|
|
Muskie in Pierce County, Wisconsin
|
876
|
|
|
|
a.
|
Amounts represent rated production capacity. We estimate our annual company-wide functional production capacity is 4.4 million tons per year.
|
Mineral Reserves
The quantity and nature of the mineral reserves for our Taylor and Piranha properties are estimated by our third-party geologists and mining engineers, while we internally track depletion rate on an interim basis. John T. Boyd Company, third party mining and geological consultants, estimated our proven sand reserves for our Taylor property as of December 31, 2018, 2017 and 2016 and for our Piranha property, which we acquired in May 2017, as of December 31, 2018 and 2017, which estimates are set forth in the table below. There were no reserves attributable to our Muskie properties as of December 31, 2018, 2017 and 2016. Our external mining and geological engineers will update our reserve estimates annually, making necessary adjustments for operations at each location during the year and additions or surveying, drill core analysis and other tests to confirm the quantity and quality of the reserves.
50
|
Estimated Proven Reserves (Thousands of Tons)
|
|||||||||
|
Mine Location
|
December 31, 2018
|
December 31, 2017
|
December 31, 2016
|
||||||
|
Taylor in Jackson County, Wisconsin
(a)
|
26,325
|
|
25,029
|
|
25,844
|
|
|||
|
Piranha in Barron County, Wisconsin
(b)
|
42,358
|
|
38,150
|
|
N/A
|
|
|||
|
Total
|
68,683
|
|
63,179
|
|
25,844
|
|
|||
|
a.
|
Prior to our June 5, 2017 Sturgeon acquisition, which included our Taylor facilities, we and Sturgeon were under common control and, as a result, our historical financial information for all periods included in this Annual Report on Form 10-K has been recast to combine Sturgeon's financial results with our financial results as if the acquisition had been effective since Sturgeon commenced operations in September 2014.
|
|
b.
|
We acquired our Piranha mine in Barron County on May 26, 2017.
|
We categorize our reserves as proven recoverable within SEC definitions. Reserves, as defined by SEC Industry Guide 7, consist of sand which could be economically and legally extracted or produced at the time of the reserve determination. Proven reserves are defined by SEC Industry Guide 7 as those for which (a) the quantity is computed from dimensions revealed in outcrops, trenches, workings or drill holes; grade and/or quality are computed from the results of detailed sampling and (b) the sites for inspection, sampling and measurement are spaced so closely and the geologic character is so well defined that size, shape, depth and mineral content of reserves are well-established. We have further limited the definition to apply only to sand reserves that we believe could be extracted at an average cost that is economically feasible.
John T. Boyd updates our reserve estimates annually, making necessary adjustments for operations at each location during the year and additions or surveying, drill core analysis and other tests to confirm the quantity and quality of the reserves. To opine as to the economic viability of our reserves, John T. Boyd reviewed our financial cost and revenue per ton data at the time of the proven reserve determination. Our 2018 average monthly sales prices ranged from approximately $24 to $46 per ton free on board mine. Based on its review of our cost structure and its extensive experience with similar operations, John T. Boyd concluded that it is reasonable to assume that we will operate under a similar cost structure over the remaining life of our reserves. Based on these assumptions, and taking into account possible cost increases associated with a maturing mine, John T. Boyd concluded that our current operating margins are sufficient to expect continued profitability throughout the life of our reserves.
Our proppant sand reserves consist of Northern White silica sand, giving us access to a range of high-quality sand grades meeting or exceeding all API specifications, including a mix between concentrations of coarse grades (20/40 and 30/50 mesh sands) and finer grades (40/70 and 100 mesh). Our sample boring data and our historical production data have indicated that our reserves contain deposits of approximately 40% 40 mesh or coarser substrate. The coarseness and conductivity of Northern White frac sand significantly enhances recovery of oil and liquids-rich gas by allowing hydrocarbons to flow more freely than is sometimes possible with native sand. The low acid-solubility increases the integrity of Northern White frac sand relative to other proppants with higher acid-solubility, especially in shales where hydrogen sulfide and other acidic chemicals are co-mingled with the targeted hydrocarbons. In addition, its crush resistant properties enable Northern White frac sand to be used in deeper drilling applications than the frac sand produced from many native mineral deposits.
We believe that the coarseness, conductivity, sphericity, acid-solubility, and crush-resistant properties of our Northern White sand reserves and our facilities’ connectivity to rail and other transportation infrastructure afford us an advantage over our competitors and make us one of a select group of sand producers capable of delivering high volumes of frac sand that is optimal for oil and natural gas production to all major unconventional resource basins currently producing throughout North America.
Surface and Mineral Rights
For each of our frac sand facilities, we own surface and mineral rights.
Item 3. Legal Proceedings
Due to the nature of our business, we are, from time to time, involved in other routine litigation or subject to disputes or claims related to our business activities, including workers’ compensation claims and employment related disputes. In the opinion of our management, none of the pending litigation, disputes or claims against us, if decided adversely, will have a material adverse effect on our financial condition, cash flows or results of operations. For additional information, see Note 20 to our consolidated financial statements included elsewhere in this annual report.
51
MAMMOTH ENERGY SERVICES, INC.
Item 4. Mine Safety Disclosures
Our operations are subject to the Federal Mine Safety and Health Act of 1977, as amended by the Mine Improvement and New Emergency Response Act of 2006, which imposes stringent health and safety standards on numerous aspects of mineral extraction and processing operations, including the training of personnel, operating procedures, operating equipment and other matters. Our failure to comply with such standards, or changes in such standards or the interpretation or enforcement thereof, could have a material adverse effect on our business and financial condition or otherwise impose significant restrictions on our ability to conduct mineral extraction and processing operations. Following passage of The Mine Improvement and New Emergency Response Act of 2006, MSHA significantly increased the numbers of citations and orders charged against mining operations. The dollar penalties assessed for citations issued has also increased in recent years. Information concerning mine safety violations or other regulatory matters required by Section 1503(a) of the Dodd-Frank Wall Street Reform and Consumer Protection Act and Item 104 of Regulation S-K (17 CFR 229.104) is included in Exhibit 95.1 to this Report.
52
PART II. OTHER INFORMATION
|
Item 5.
|
Market for Registrant's Common Equity, Related Stockholder Matters and Issuer Purchases of Equity Securities.
|
Market Information
Our common stock is traded on the Nasdaq Global Select Market under the symbol "TUSK." The following table presents the high and low closing prices of our common stock for each quarter in
2018
and
2017
based on the closing price of a given trading day:
|
2018
|
High
|
Low
|
||||
|
First Quarter
|
$
|
32.91
|
|
$
|
19.63
|
|
|
Second Quarter
|
$
|
40.88
|
|
$
|
30.68
|
|
|
Third Quarter
|
$
|
39.82
|
|
$
|
25.90
|
|
|
Fourth Quarter
|
$
|
30.03
|
|
$
|
17.11
|
|
|
2017
|
||||||
|
First Quarter
|
$
|
22.45
|
|
$
|
15.38
|
|
|
Second Quarter
|
$
|
21.72
|
|
$
|
16.25
|
|
|
Third Quarter
|
$
|
19.40
|
|
$
|
11.05
|
|
|
Fourth Quarter
|
$
|
20.89
|
|
$
|
14.49
|
|
Holders of Record
As of the close of business on February 22, 2019, there were five holders of record of our common stock. The number of holders of record of our common stock is not representative of the number of beneficial holders because many of the shares are held by depositories, brokers or nominees. As of February 22, 2019, there were 7,455 beneficial holders of record of our common stock.
Unregistered Sales of Equity Securities
None.
Issuer Purchases of Equity Securities
None.
Dividends
On July 16, 2018, we initiated a quarterly dividend policy and declared our first quarterly cash dividend. Prior to this date, we had never declared or paid any cash dividends. The following table presents cash dividends paid during 2018.
|
Per Share
|
Total
|
||||||
|
2018
|
(in thousands)
|
||||||
|
Paid on August 14, 2018
|
$
|
0.125
|
|
$
|
5,595
|
|
|
|
Paid on November 15, 2018
|
0.125
|
|
5,606
|
|
|||
|
Total cash dividends
|
$
|
0.25
|
|
$
|
11,201
|
|
|
On January 28, 2019, our Board of Directors declared a quarterly cash dividend of $0.125 per share of common stock, which was paid on February 14, 2019 to stockholders of record as of the close of business on February 7, 2019. Our board of directors’ determination with respect to any future dividends will depend upon our profitability and financial condition, contractual restrictions, restrictions imposed by applicable law and other factors that the board deems relevant at the time of such determination. Based on its evaluation of these factors, the board of directors may determine not to declare a dividend, or declare dividends at rates that are less than currently anticipated.
53
Performance Graph
The following graph and table compares the cumulative total return of a $100 investment in our common stock from October 14, 2016, the date on which our stock began trading on the Nasdaq Global Select Market, through
December 31, 2018
, with the total cumulative return of a $100 investment in the Standard & Poors 500 Stock Index, the Dow Jones Industrial Average Market Index and the PHLX Oil Service Sector Index during that period.
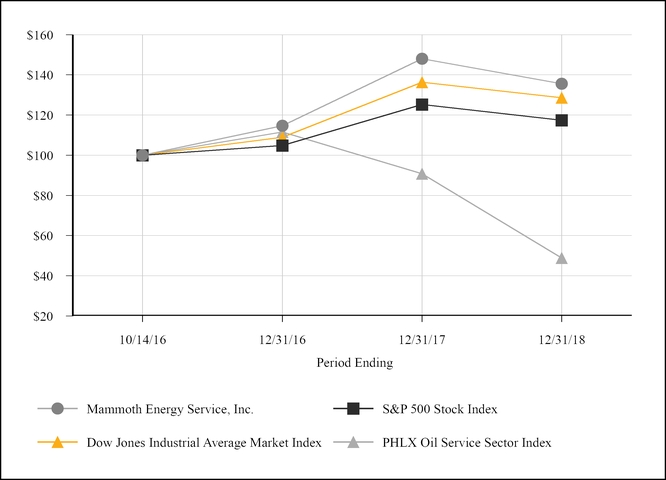
|
October 14, 2016
|
December 31, 2016
|
December 31, 2017
|
December 31, 2018
|
|||||||||
|
Mammoth Energy Service, Inc.
|
$
|
100.00
|
|
$
|
114.63
|
|
$
|
148.04
|
|
$
|
135.60
|
|
|
S&P 500 Stock Index
|
$
|
100.00
|
|
$
|
104.88
|
|
$
|
125.25
|
|
$
|
117.44
|
|
|
Dow Jones Industrial Average Market Index
|
$
|
100.00
|
|
$
|
108.96
|
|
$
|
136.28
|
|
$
|
128.61
|
|
|
PHLX Oil Service Sector Index
|
$
|
100.00
|
|
$
|
111.51
|
|
$
|
90.74
|
|
$
|
48.90
|
|
This graph shall not be deemed to be "soliciting material" or to be "filed" with the SEC.
Item 6. Selected Financial Data
This section presents our selected historical combined consolidated financial data. The selected historical combined consolidated financial data presented below is not intended to replace our historical combined consolidated financial statements. You should read the following data along with Item 7. "Management’s Discussion and Analysis of Financial Condition and Results of Operations” and the consolidated financial statements and related notes, each of which is included elsewhere in this annual report.
54
The historical financial information for periods prior to October 12, 2016, contained in this annual report relates to Mammoth Energy Partners LP, a Delaware limited partnership, or the Partnership. On October 12, 2016, the Partnership was converted into a Delaware limited liability company named Mammoth Energy Partners LLC, or Mammoth LLC, and then each member of Mammoth LLC contributed all of its membership interests in Mammoth LLC to Mammoth Energy Services, Inc., a Delaware corporation, or Mammoth Inc. Prior to the conversion and the contribution, Mammoth Inc. was a wholly-owned subsidiary of the Partnership. Upon the conversion and the contribution, Mammoth LLC (as the converted successor to the Partnership) became a wholly-owned subsidiary of Mammoth Inc.
On October 13, 2016, Mammoth Inc. priced 7,750,000 shares of its common stock in the IPO at a price to the public of $15.00 per share and, on October 14, 2016, Mammoth Inc.’s common stock began trading on The Nasdaq Global Select Market under the symbol “TUSK.” On October 19, 2016, Mammoth Inc. closed its IPO. Unless the context otherwise requires, references in this report to “we,” “our,” “us” or like terms, when used in a historical context for periods prior to October 12, 2016 refer to the Partnership and its subsidiaries. References in this report to “we,” “our,” “us” or like terms, when used for periods beginning on or after October 12, 2016 refer to Mammoth Inc. and its subsidiaries.
On June 5, 2017, we acquired Sturgeon Acquisitions LLC, or Sturgeon, and Sturgeon's wholly owned subsidiaries Taylor Frac, LLC, Taylor Real Estate Investments, LLC and South River Road, LLC. Prior to the acquisition, we and Sturgeon were under common control and, in accordance with generally accepted accounting principles in the United States, or GAAP, we have accounted for this acquisition in a manner similar to the pooling of interest method of accounting. Therefore, our historical financial information for all periods included in this Annual Report on Form 10-K has been recast to combine Sturgeon's financial results with our financial results as if the acquisition had been effective since Sturgeon commenced operations.
Presented below is our historical financial data for the periods and as of the dates indicated. The selected statements of comprehensive income (loss) and cash flow data for the
years ended December 31,
2018
,
2017
and
2016
and the selected balance sheet data as of
December 31,
2018
and
2017
are derived from our audited consolidated financial statements included elsewhere in this annual report. The selected statements of comprehensive income (loss) and cash flow data for the
years ended December 31,
2015
and
2014
and selected balance sheet data as of
December 31,
2016
,
2015
and
2014
are derived from our audited financial statements that are not included in this report.
55
|
Years Ended December 31,
|
|||||||||||||||||||
|
2018
|
2017
|
2016
|
2015
|
2014
|
|||||||||||||||
|
STATEMENT OF COMPREHENSIVE INCOME (LOSS) DATA:
|
(in thousands, except per share data)
|
||||||||||||||||||
|
Total revenues
|
$
|
1,690,084
|
|
$
|
691,496
|
|
$
|
230,625
|
|
$
|
367,937
|
|
$
|
275,729
|
|
||||
|
Total cost and expenses
|
$
|
1,295,633
|
|
$
|
628,725
|
|
$
|
265,255
|
|
$
|
383,710
|
|
$
|
253,436
|
|
||||
|
Operating income (loss)
|
$
|
394,451
|
|
$
|
62,771
|
|
$
|
(34,630
|
)
|
$
|
(15,773
|
)
|
$
|
22,293
|
|
||||
|
Total other expense
|
$
|
(5,223
|
)
|
$
|
(975
|
)
|
$
|
(3,938
|
)
|
$
|
(7,636
|
)
|
$
|
(10,301
|
)
|
||||
|
Income (loss) before income taxes
|
$
|
389,228
|
|
$
|
61,796
|
|
$
|
(38,568
|
)
|
$
|
(23,409
|
)
|
$
|
11,992
|
|
||||
|
Net income (loss)
|
$
|
235,965
|
|
$
|
58,964
|
|
$
|
(92,453
|
)
|
$
|
(21,820
|
)
|
$
|
4,478
|
|
||||
|
Comprehensive income (loss)
|
$
|
234,545
|
|
$
|
59,519
|
|
$
|
(89,742
|
)
|
$
|
(26,635
|
)
|
$
|
4,951
|
|
||||
|
Net income (loss) per share (basic)
|
$
|
5.27
|
|
$
|
1.42
|
|
$
|
(2.94
|
)
|
$
|
(0.73
|
)
|
$
|
0.21
|
|
||||
|
Net income (loss) per share (diluted)
|
$
|
5.24
|
|
$
|
1.42
|
|
$
|
(2.94
|
)
|
$
|
(0.73
|
)
|
$
|
0.21
|
|
||||
|
Weighted average number of shares outstanding (basic)
|
44,750
|
|
41,548
|
|
31,500
|
|
30,000
|
|
21,056
|
|
|||||||||
|
Weighted average number of shares outstanding (diluted)
|
45,021
|
|
41,639
|
|
31,500
|
|
30,000
|
|
21,056
|
|
|||||||||
|
Cash dividends per common share
|
$
|
0.25
|
|
$
|
—
|
|
$
|
—
|
|
$
|
—
|
|
$
|
—
|
|
||||
|
Pro forma information (unaudited):
|
|
||||||||||||||||||
|
Net (loss) income, as reported
|
$
|
(92,453
|
)
|
$
|
(21,820
|
)
|
$
|
4,478
|
|
||||||||||
|
Taxes on income earned as a non-taxable entity
|
$
|
15,224
|
|
$
|
391
|
|
$
|
(7,590
|
)
|
||||||||||
|
Taxes due to change to C corporation
|
$
|
53,089
|
|
$
|
—
|
|
$
|
—
|
|
||||||||||
|
Pro forma net loss
|
$
|
(24,140
|
)
|
$
|
(21,429
|
)
|
$
|
(3,112
|
)
|
||||||||||
|
Pro forma loss per common share
|
|||||||||||||||||||
|
Basic and diluted
|
$
|
(0.56
|
)
|
$
|
(0.50
|
)
|
$
|
(0.14
|
)
|
||||||||||
|
Weighted average pro forma shares outstanding—basic and diluted
|
43,107
|
|
43,107
|
|
22,731
|
|
|||||||||||||
|
CASH FLOW DATA:
|
|||||||||||||||||||
|
Cash flows provided by operations
|
$
|
386,668
|
|
$
|
57,616
|
|
$
|
29,689
|
|
$
|
69,639
|
|
$
|
15,853
|
|
||||
|
Cash flows used in investing activities
|
$
|
(211,955
|
)
|
$
|
(172,283
|
)
|
$
|
(7,718
|
)
|
$
|
(27,035
|
)
|
$
|
(190,411
|
)
|
||||
|
Cash flows (used in) provided by financing activities
|
$
|
(112,592
|
)
|
$
|
91,049
|
|
$
|
3,075
|
|
$
|
(55,557
|
)
|
$
|
185,911
|
|
||||
|
December 31,
|
|||||||||||||||||||
|
2018
|
2017
|
2016
|
2015
|
2014
|
|||||||||||||||
|
BALANCE SHEET DATA:
|
(in thousands)
|
||||||||||||||||||
|
Cash and cash equivalents
|
$
|
67,625
|
|
$
|
5,637
|
|
$
|
29,239
|
|
$
|
4,039
|
|
$
|
17,219
|
|
||||
|
Property, plant and equipment, net
|
$
|
436,699
|
|
$
|
351,017
|
|
$
|
242,120
|
|
$
|
294,883
|
|
$
|
355,082
|
|
||||
|
Total assets
|
$
|
1,073,091
|
|
$
|
867,243
|
|
$
|
502,362
|
|
$
|
536,412
|
|
$
|
669,902
|
|
||||
|
Total current liabilities
|
$
|
233,823
|
|
$
|
219,988
|
|
$
|
29,246
|
|
$
|
25,433
|
|
$
|
71,022
|
|
||||
|
Long-term debt
|
$
|
—
|
|
$
|
99,900
|
|
$
|
—
|
|
$
|
95,000
|
|
$
|
146,041
|
|
||||
|
Total liabilities
|
$
|
319,039
|
|
$
|
359,447
|
|
$
|
79,581
|
|
$
|
122,465
|
|
$
|
225,419
|
|
||||
|
Total equity
|
$
|
754,052
|
|
$
|
507,796
|
|
$
|
422,781
|
|
$
|
413,947
|
|
$
|
444,484
|
|
||||
56
Item 7. Management’s Discussion and Analysis of Financial Condition and Results of Operations
The following discussion and analysis should be read in conjunction with the consolidated financial statements and related notes included elsewhere in this Annual Report on Form 10-K. This discussion contains forward-looking statements reflecting our current expectations, estimates and assumptions concerning events and financial trends that may affect our future operating results or financial position. Actual results and the timing of events may differ materially from those contained in these forward-looking statements due to a number of factors, including those discussed in Item 1A. "Risk Factors” and the section entitled “Forward-Looking Statements” appearing elsewhere in this Annual Report on Form 10-K.
Overview
We are an integrated, growth-oriented company serving both the electric utility and oil and gas industries in North America and US territories. Our primary business objective is to grow our operations and create value for stockholders through organic growth opportunities and accretive acquisitions. Our suite of services includes infrastructure services, pressure pumping services, natural sand proppant services and other energy services, including contract land and directional drilling, coil tubing, flowback, cementing, acidizing, equipment rental, crude oil hauling and remote accommodations. Our infrastructure services division provides construction, upgrade, maintenance and repair services to the electrical infrastructure industry. Our pressure pumping services division provides hydraulic fracturing and water transfer services. Our natural sand proppant services division mines, processes and sells proppant used for hydraulic fracturing. In addition to these service divisions, we also provide contract land and directional drilling services, coil tubing services, pressure control services, flowback services, cementing services, acidizing services, equipment rentals, crude oil hauling services and remote accommodations. We believe that the services we offer play a critical role in maintaining and improving electrical infrastructure as well as in increasing the ultimate recovery and present value of production streams from unconventional resources. Our complementary suite of services provides us with the opportunity to cross-sell our services and expand our customer base and geographic positioning. We are exploring several opportunities to expand our business lines including, but not limited to, full service transportation, telecommunications and general industrial manufacturing as we shift to a broader industrial focus.
On November 24, 2014, Mammoth Energy Holdings LLC, or Mammoth Holdings, Gulfport Energy Corporation, or Gulfport, and Rhino Exploration LLC, or Rhino, contributed to the Company their respective interests in the following entities: Bison Drilling and Field Services, LLC, or Bison Drilling; Bison Trucking LLC, or Bison Trucking; White Wing Tubular Services LLC, or White Wing; Barracuda Logistics LLC, or Barracuda; Panther Drilling Systems LLC, or Panther Drilling; Redback Energy Services LLC, or Redback Energy Services; Redback Coil Tubing LLC, or Redback Coil Tubing; Muskie Proppant LLC, or Muskie Proppant; Stingray Pressure Pumping LLC, or Pressure Pumping; Stingray Logistics LLC, or Logistics; and Great White Sand Tiger Lodging Ltd., or Sand Tiger. Upon completion of these contributions, Mammoth Holdings, Gulfport and Rhino beneficially owned a 68.7%, 30.5% and 0.8% equity interest, respectively, in the Partnership. Subsequently, the Partnership formed Redback Pumpdown Services LLC, or Pumpdown, Mr. Inspections LLC, or Mr. Inspections, Silverback Energy Services LLC, or Silverback, and Mammoth Inc. as wholly-owned subsidiaries.
On October 12, 2016, prior to and in connection with the IPO, the Partnership converted to a Delaware limited liability company named Mammoth Energy Partners LLC, or Mammoth LLC, and Mammoth Holdings, Gulfport and Rhino contributed their respective membership interests in Mammoth LLC to us in exchange for shares of our common stock, and Mammoth LLC became our wholly-owned subsidiary.
On October 19, 2016, Mammoth Inc. closed its IPO of 7,750,000 shares of common stock, of which 7,500,000 shares were sold by Mammoth Inc. and the remaining 250,000 shares were sold by certain selling stockholders, at a price to the public of $15.00 per share. Mammoth Inc.’s common stock is traded on the Nasdaq Global Select Market under the symbol “TUSK.” Unless the context otherwise requires, references in this report to “we,” “our,” “us,” or like terms, when used in a historical context for periods prior to October 12, 2016 refer to the Partnership and its subsidiaries. References in this report to “we,” “our,” “us,” or like terms, when used in the present tense or for periods commencing on or after October 12, 2016 refer to Mammoth Inc. and its subsidiaries. Mammoth Inc. was formed in June 2016, and did not conduct any material business operations prior to the completion of the IPO and the contribution described below completed on October 12, 2016 immediately prior to the IPO. Prior to the IPO, Mammoth Inc. was a wholly-owned subsidiary of the Partnership.
On June 29, 2018, Gulfport and certain entities controlled by Wexford Capital LP, as the selling stockholders, completed an underwritten secondary public offering of 4,000,000 shares of the Company’s common stock at a purchase price to the selling stockholders of $38.01 per share. The selling stockholders received all proceeds from this offering. The selling stockholders also granted the underwriters an option to purchase up to an aggregate of 600,000 additional shares of our common stock at the same purchase price. This option was exercised, in part, and on July 30, 2018, the underwriters purchased an additional 385,000 shares of common stock from the selling stockholders at the same price per share.
57
On June 5, 2017, we acquired Sturgeon Acquisitions LLC, or Sturgeon, and Sturgeon's wholly owned subsidiaries Taylor Frac, LLC, or Taylor Frac, Taylor Real Estate Investments, LLC, or Taylor Real Estate, and South River Road, LLC, or South River Road. Prior to the acquisition, we and Sturgeon were under common control and, in accordance with generally accepted accounting principles in the United States, or GAAP, we have accounted for this acquisition in a manner similar to the pooling of interest method of accounting. Therefore, our historical financial information for all periods included in this Annual Report on Form 10-K has been recast to combine Sturgeon's financial results with our financial results as if the acquisition had been effective since Sturgeon commenced operations.
Our revenues, operating profits and identifiable assets are primarily attributable to three reportable segments: infrastructure services; pressure pumping services; and natural sand proppant services. For the year ended December 31, 2017, we identified four reportable segments consisting of infrastructure services, pressure pumping services, natural sand proppant services and contract land and directional drilling services. We changed our reportable segment presentation in 2018, as we determined based upon both a quantitative and qualitative basis that the contract land and directional drilling services segment, which included Bison Drilling, Bison Trucking, Panther Drilling Systems, White Wing Tubular Services and Mako Acquisitions, is not of continuing significance for accounting reporting purposes. We now present the results of our contract land and directional drilling activities as "Other." Segment evaluation is determined on a quantitative basis based on a function of operating income (loss), as well as a qualitative basis, such as nature of the product and service offerings and types of customers. The results of operations for 2017 and 2016 below have been retroactively adjusted to reflect this change in reportable segments.
Since the dates presented below, we have conducted our operations through the following entities:
Pressure Pumping Services Segment
|
•
|
Pressure Pumping—March 2012
|
|
•
|
Silverback Energy, formerly Logistics—November 2012
|
|
•
|
Barracuda—October 2014
|
|
•
|
Pumpdown—January 2015
|
|
•
|
Mr. Inspections—January 2015
|
|
•
|
Mammoth Equipment Leasing LLC—November 2016
|
|
•
|
Bison Sand Logistics LLC—January 2018
|
|
•
|
Aquahawk Energy LLC, or Aquahawk—June 2018
|
Infrastructure Services Segment
|
•
|
Cobra Acquisitions LLC, or Cobra—January 2017
|
|
•
|
Cobra Energy LLC—January 2017
|
|
•
|
Higher Power Electrical LLC, or Higher Power—April 2017
|
|
•
|
5 Star Electric LLC, or 5 Star—July 2017
|
|
•
|
Dire Wolf Energy Services LLC—January 2018
|
|
•
|
Cobra Aviation LLC, or Cobra Aviation—January 2018
|
|
•
|
Cobra Logistics LLC—February 2018
|
|
•
|
Cobra Caribbean LLC—October 2018
|
|
•
|
Air Rescue Systems LLC, or ARS—December 2018
|
|
•
|
Python Equipment LLC—December 2018
|
Natural Sand Proppant Services Segment
|
•
|
Muskie Proppant—September 2011
|
|
•
|
Piranha Proppant LLC, or Piranha—May 2017
|
|
•
|
Sturgeon Acquisitions—June 2017
|
|
•
|
Taylor Frac—June 2017
|
|
•
|
Taylor Real Estate—June 2017
|
|
•
|
South River Road—June 2017
|
Other
|
•
|
Sand Tiger—October 2007
|
|
•
|
Bison Drilling—November 2010
|
|
•
|
Redback Energy Services—October 2011
|
|
•
|
Redback Coil Tubing—May 2012
|
|
•
|
Panther Drilling—December 2012
|
58
|
•
|
Bison Trucking—August 2013
|
|
•
|
White Wing—September 2014
|
|
•
|
WTL Oil LLC, or WTL, formerly Silverback—June 2016
|
|
•
|
Mammoth Energy Partners, LLC—June 2016
|
|
•
|
Mako—March 2017
|
|
•
|
Stingray Energy Services LLC, or Stingray Energy Services—June 2017
|
|
•
|
Stingray Cementing LLC—June 2017
|
|
•
|
Tiger Shark Logistics LLC—October 2017
|
|
•
|
Black Mamba Energy LLC—March 2018
|
|
•
|
RTS Energy Services LLC, or RTS—June 2018
|
|
•
|
Ivory Freight Solutions LLC—July 2018
|
2018 Highlights
Executed Amendments to Existing Contract and New Contract with PREPA
On October 19, 2017, our wholly owned subsidiary Cobra entered into an emergency master services agreement with the Puerto Rico Electric Power Authority, or PREPA, for repairs to PREPA’s electrical grid as a result of Hurricane Maria, which we refer to as the Original PREPA Contract. During the first quarter of 2018, we executed amendments to the contract that increased the total contract value to $945 million from $200 million originally. Cobra performed the full $945 million of services under this contract as of July 21, 2018.
At the conclusion of a request for proposal (RFP) bid process that began in February 2018, Cobra entered into a new master services agreement with PREPA on May 26, 2018, to complete the restoration of the electrical transmission and distribution system components damaged by Hurricane Maria and to support the initial phase of reconstruction of the electrical power system in Puerto Rico, which we refer to as the New PREPA Contract. Cobra has agreed to provide the labor, supervision, tools and materials necessary to provide the restoration and reconstruction services under the New PREPA Contract, which has a one-year term ending May 25, 2019 and provides for total payments not to exceed $900 million. As of December 31, 2018 and March 8, 2019, Cobra had performed an aggregate of $280 million and $354 million, respectively, of services under the New PREPA Contract. Although we continue to perform services under the New PREPA Contract, we expect these services will end by March 31, 2019 and we do not expect that any further work orders will be issued to Cobra under the New PREPA Contract prior to the May 25, 2019 termination date.
For additional information regarding our services to PREPA, see Item 1.
“Business-Our Services-Infrastructure Services”
and
"-Overview of Our Industries-Energy Infrastructure Industry."
Initiated Payments of Quarterly Dividends on Our Common Stock
On July 16, 2018, our board of directors initiated a quarterly dividend on shares of our common stock payable quarterly beginning with the second quarter of 2018. We paid a quarterly dividend of $0.125 per share on August 14, 2018, November 15, 2018 and February 14, 2019. The decision to declare future dividends, however, is solely within the discretion of our board of directors.
Upgrades to Sand Facilities
During the first quarter of 2018, we completed the expansion of our Taylor sand facility in Jackson County, Wisconsin. We added an additional 150 ton per hour natural gas fired fluid bed dryer as well as four additional high capacity screeners. These upgrades added rated production capacity of 1.3 million tons per year. Additionally, during the third quarter or 2018, we upgraded our 90 ton per hour natural gas fired rotary dryer to a 200 ton per hour natural gas fired fluid bed dryer at our Piranha sand facility in Barron County, Wisconsin. This upgrade added rated production capacity of 0.5 million tons per year. After these upgrades to our Taylor and Piranha sand facilities, our annual company-wide rated production capacity is approximately 5.7 million tons per year and our annual company-wide functional production capacity is approximately 4.4 million tons per year.
Acquisition of WTL Oil and RTS Energy Services
During the second quarter of 2018, we completed the acquisitions of WTL and RTS for approximately $6 million and $8 million, respectively. WTL provides crude oil hauling services in the Permian Basin and mid-continent region. RTS provides cementing and acidizing services in the Permian Basin.
59
Extended Pressure Pumping Services and Sand Supply Agreements with Gulfport
On July 10, 2018, we amended our existing agreement with Gulfport pursuant to which we, through our subsidiary Pressure Pumping, provide hydraulic fracturing, stimulation and related completion and rework services to Gulfport with two dedicated frac spreads and related equipment. The amendment extended the term of the existing pressure pumping agreement until December 31, 2021, unless it is terminated earlier in accordance with its terms, and expanded the service area to include both Ohio and Oklahoma. The pressure pumping amendment also provides that Gulfport has the right to suspend pressure pumping services for up to one crew by upon a minimum of 90 days prior written notice to Pressure Pumping, with no further payment or other obligation to Pressure Pumping for such suspended crew. Pressure Pumping will be obligated to resume any such suspended pressure pumping services upon 90 days prior written notice by Gulfport, unless such notice is waived by Pressure Pumping.
On August 6, 2018, we amended our existing agreement with Gulfport pursuant to which we, through our subsidiary Muskie Proppant, sell and deliver specified amounts of sand to Gulfport. The amendment extends the term of the existing sand supply agreement until December 31, 2021.
Expanded our Rental Offerings
During 2018, we significantly expanded our subsidiary, Stingray Energy Services, from its core operation located in Ohio, Pennsylvania and West Virginia into Oklahoma. Our rental division provides a full suite of oilfield and general construction equipment for rent on a short term, medium term or long term basis.
Formed a Water Transfer Business
During 2018, we formed a water transfer business named Aquahawk. Aquahawk’s primary business is the acquisition, transfer and sale of fresh water for use throughout the well construction process. Aquahawk’s operations are located primarily in Oklahoma serving the SCOOP and STACK plays.
Amended and Restated Credit Facility
On October 19, 2018, Mammoth entered into an amended and restated five-year asset backed revolving credit facility led by PNC Capital Markets with a maximum revolving advance amount at closing of $185 million and the potential to increase the facility by up to an additional $165 million. For additional information related to this amended and restated agreement, see "—Liquidity and Capital Resources—Our Revolving Credit Facility" below.
Expanded Logistics/Transmission Offerings through ARS/Brim Helicopter Acquisition
On December 21, 2018, Cobra Aviation, a variable interest entity of Mammoth, purchased two commercial helicopters and spare equipment and all of the equity interests in Air Rescue Systems Corporation, which indirectly owns one commercial helicopter, from unrelated third-party sellers for an aggregate purchase price of approximately $7 million. Also on December 21, 2018, Cobra Aviation and an affiliate of Wexford formed a joint venture under the name of Brim Acquisitions LLC, or Brim Acquisitions, to acquire all outstanding equity interest in Brim Equipment Leasing, Inc., or Brim Equipment, from an unrelated third-party seller for approximately $2 million. At the time of the acquisition, Brim Equipment owned one commercial helicopter and leased one commercial helicopter. Wexford owns a 51% economic interest and Cobra Aviation owns a 49% economic interest in Brim Acquisitions. These transactions provide vertical integration for Mammoth's infrastructure subsidiaries via aerial powerline construction services and a platform to pursue additional aviation service opportunities.
Overview of Our Industries
Energy Infrastructure Industry
In 2017, we expanded into the electric infrastructure business, offering both commercial and storm restoration services to government-funded utilities, private utilities, public investor owned utilities and cooperatives. Since we commenced operations in this line of business, substantially all of our infrastructure revenues has been generated from storm restoration work, primarily from PREPA due to damage caused by Hurricane Maria. On October 19, 2017, Cobra and PREPA entered into an emergency master services agreement for repairs to PREPA’s electrical grid. The one-year contract, as amended, provides for payments of up to $945 million. On May 26, 2018, Cobra and PREPA entered into a new one-year, $900 million master services agreement to provide additional repair services and begin the initial phase of reconstruction of the electrical power
60
system in Puerto Rico. As of December 31, 2018, PREPA owed us approximately $225 million for services performed by us as of that date. As of March 8, 2019, the amount owed to us by PREPA had increased to approximately $281 million. PREPA is currently subject to bankruptcy proceedings pending in the U.S. District Court for the District of Puerto Rico. As a result, PREPA's ability to meet its payment obligations under the contract is largely dependent upon funding from the Federal Emergency Management Agency or other sources. In the event PREPA (i) does not have or does not obtain the funds necessary to satisfy its obligations to Cobra under the contracts, (ii) obtains the necessary funds but refuses to pay the amounts owed to us, (iii) terminates the contracts or curtails our services prior to the end of the contract terms or (iv) otherwise fails to pay amounts owed to us for services performed, our financial condition, results of operations and cash flows would be materially and adversely affected. In addition, government contracts are subject to various uncertainties, restrictions and regulations, including oversight audits by government representatives and profit and cost controls, which could result in withholding or delayed payments to us or efforts to recover payments already made. Further, we are not currently involved in discussions to extend the term of our second contract with PREPA and there can be no assurance that we will be able to obtain one or more replacement contracts with PREPA or other customers sufficient to continue providing the level of services that we currently provide to PREPA.
As previously reported, during the third quarter of 2018, our staffing levels in Puerto Rico fluctuated between 500 and 600 people. During the fourth quarter of 2018, our staffing levels generally ranged from 475 to 550, dropping to approximately 130 at year end for a period of three days due to the holidays. To date in 2019, our staffing levels in Puerto Rico have decreased from approximately 500 in January to 200 as of March 8, 2019. We currently expect our staffing levels in Puerto Rico to decline to approximately 50 by early April 2019 as we complete the services contemplated by our existing work orders and undertake demobilization efforts. We do not expect that Cobra will be issued any further work orders under its contract with PREPA prior to the May 25, 2019 termination date.
The demand for our infrastructure services in the continental United States has continued to increase. We have grown our crew count to a total of approximately 120 crews as of March 1, 2019, an increase of 15 from approximately105 at December 31, 2018 and an increase of 70 from approximately 50 at December 31, 2017. Each distribution crew generally consists of five employees. These distribution crews, which include employees previously located in Puerto Rico, are working for multiple utilities primarily across the northeastern, midwestern and southwestern portions of the United States. We believe we will be able to continue to grow our customer base and increase our revenues in the continental United States over the coming years.
Oil and Natural Gas Industry
The oil and natural gas industry has traditionally been volatile and is influenced by a combination of long-term, short-term and cyclical trends, including the domestic and international supply and demand for oil and natural gas, current and expected future prices for oil and natural gas and the perceived stability and sustainability of those prices, production depletion rates and the resultant levels of cash flows generated and allocated by exploration and production companies to their drilling, completion and related services and products budget. The oil and natural gas industry is also impacted by general domestic and international economic conditions, political instability in oil producing countries, government regulations (both in the United States and elsewhere), levels of customer demand, the availability of pipeline capacity and other conditions and factors that are beyond our control.
Demand for most of our oil and natural gas products and services depends substantially on the level of expenditures by companies in the oil and natural gas industry. The levels of capital expenditures of our customers are predominantly driven by the oil and natural gas prices. Over the past several years, commodity prices, particularly oil, has seen significant volatility with pricing ranging from a high of $110.53 per barrel on September 6, 2013 to a low of $26.19 per barrel on February 11, 2016. During early 2017, oil prices stabilized around the $50 per barrel level and started a gradual upward trend which continued into the fourth quarter of 2018, when oil prices peaked at $76.41 on October 3, 2018. Due to certain factors related to world politics and major oil producers, the price of oil experienced increased volatility during the fourth quarter of 2018, with prices falling to a low of $42.53 on December 24, 2018.
We anticipate demand for our oil and natural gas services and products will continue to be dependent on the level of expenditures by companies in the oil and natural gas industry and, ultimately, commodity prices. We experienced a weakening in demand for our oilfield services beginning in the third quarter of 2018 and accelerating in the fourth quarter of 2018 as a result of oil prices softening and budget exhaustion. If commodity prices stabilize at current levels or continue to increase, we expect the capital expenditures of our customers would increase above the levels we saw in the fourth quarter of 2018, which in turn should increase demand for our services and products, particularly in our completion and production, natural sand proppant and contract land and directional drilling businesses. Decreases in commodity prices, however, would be expected to
61
result in a reduction in the capital expenditures of our customers and impact the demand for our drilling, completion and other products and services.
Based on current feedback from our exploration and production customers, we expect them to take a cautious approach to activity levels in early 2019 given the recent volatility in oil prices. Accordingly, we do not anticipate material increases in the overall pricing for our products and services in the near term. While we intend to continue to monitor our cost structure in response to market conditions, we do not believe it is necessary to significantly reduce costs or infrastructure at this time based on the current slowdown in activity levels.
Natural Sand Proppant Industry
In the natural sand proppant industry, demand growth for frac sand and other proppants is primarily driven by advancements in oil and natural gas drilling and well completion technology and techniques, such as horizontal drilling and hydraulic fracturing, as well as overall industry activity growth. Demand for proppant declined in 2015 and throughout most of 2016 and again in late 2018 due to reduced well completion activity; however, we believe that demand for proppant will continue to grow over the long-term, as it did throughout 2017 and the first half of 2018. We are seeing increased demand in the first quarter of 2019 with pricing for 40/70 up approximately 30% from an average low of $17 seen in the fourth quarter of 2018.
Over the past 18 months, several new and existing suppliers completed planned capacity additions of frac sand supply, particularly in the Permian Basin. The industry expansion caused the frac sand market to become oversupplied, particularly in finer grades. With the frac sand market currently oversupplied, pricing for certain grades have fallen significantly from the peaks experienced during the first half of 2018. We believe that the coarseness, conductivity, sphericity, acid-solubility and crush-resistant properties of our Northern White sand reserves and our transportation infrastructure afford us an advantage over many of our competitors and make us one of a select group of sand producers capable of delivering high volumes of frac sand that is optimal for oil and natural gas production to all major unconventional resource basins currently producing throughout North America.
During the first half of 2018, constraints in the rail system adversely impacted frac sand deliveries from our Taylor sand facility in Jackson County, Wisconsin. As a result, we estimate production at our Taylor facility was 23% lower during the first half of 2018 than it would have been in the absence of these constraints. These rail system constraints were largely alleviated during the third quarter of 2018. Production at our Piranha facility was not impacted by these rail constraints, however, another railroad recently instituted a policy that shifts from utilizing unit trains (100 car dedicated trains specifically set up to move sand in large quantities) to manifest shipments (smaller number of sand cars coupled with other types of loads to make up a full train shipment). This shift to manifest shipments has not had a material impact on the movement of sand from our Piranha facility to date, but may in the future. Further, as a result of adverse market conditions, production at our Muskie sand facility in Pierce County, Wisconsin has been temporarily idled since September 2018.
62
Results of Operations
Year Ended
December 31, 2018
Compared to Year Ended
December 31, 2017
|
Years Ended
|
|||||||
|
December 31, 2018
|
December 31, 2017
|
||||||
|
Revenue:
|
(in thousands)
|
||||||
|
Infrastructure services
|
$
|
1,082,371
|
|
$
|
224,425
|
|
|
|
Pressure pumping services
|
369,492
|
|
279,352
|
|
|||
|
Natural sand proppant services
|
168,275
|
|
117,037
|
|
|||
|
Other
|
149,922
|
|
102,249
|
|
|||
|
Eliminations
|
(79,976
|
)
|
(31,567
|
)
|
|||
|
Total revenue
|
1,690,084
|
|
691,496
|
|
|||
|
Cost of Revenue:
|
|||||||
|
Infrastructure services (exclusive of depreciation and amortization of $20,485 and $3,181, respectively, for 2018 and 2017)
|
610,600
|
|
121,560
|
|
|||
|
Pressure pumping services (exclusive of depreciation and amortization of $51,417 and $45,381, respectively, for 2018 and 2017)
|
293,661
|
|
211,236
|
|
|||
|
Natural sand proppant services (exclusive of depreciation, depletion and accretion of $13,512 and $9,389, respectively, for 2018 and 2017)
|
132,817
|
|
92,780
|
|
|||
|
Other services (exclusive of depreciation and amortization of $34,380 and $34,124, respectively, for 2018 and 2017)
|
136,675
|
|
88,525
|
|
|||
|
Eliminations
|
(79,949
|
)
|
(31,532
|
)
|
|||
|
Total cost of revenue
|
1,093,804
|
|
482,569
|
|
|||
|
Selling, general and administrative expenses
|
73,097
|
|
49,886
|
|
|||
|
Depreciation, depletion, amortization and accretion
|
119,877
|
|
92,124
|
|
|||
|
Impairment of long-lived assets
|
8,855
|
|
4,146
|
|
|||
|
Operating income
|
394,451
|
|
62,771
|
|
|||
|
Interest expense, net
|
(3,187
|
)
|
(4,310
|
)
|
|||
|
Bargain purchase gain
|
—
|
|
4,012
|
|
|||
|
Other expense, net
|
(2,036
|
)
|
(677
|
)
|
|||
|
Income before income taxes
|
389,228
|
|
61,796
|
|
|||
|
Provision for income taxes
|
153,263
|
|
2,832
|
|
|||
|
Net income
|
$
|
235,965
|
|
$
|
58,964
|
|
|
Revenue
. Revenue for
2018
increased
$999 million
, or
144%
, to
$1.7 billion
from
$691 million
for
2017
. The increase in total revenue is primarily attributable to a
$858 million
increase in infrastructure services revenue, representing 86% of the overall increase. Additionally, pressure pumping services revenue increased
$90 million
, representing 9% of the overall increase. Revenue derived from related parties was
$143 million
, or
8%
of our total revenues, for
2018
and
$209 million
, or
30%
of our total revenues, for
2017
. Substantially all of our related party revenue is derived from Gulfport under pressure pumping and sand contracts, which are effective through December 31, 2021. Revenue by division was as follows:
Infrastructure Services.
Infrastructure services division revenue
increased
$858 million
, or
382%
, to
$1 billion
for
2018
from
$224 million
for
2017
. For
2018
and
2017
, we generated
94%
and
90%
, respectively, of total infrastructure services revenue from our contracts with PREPA for repairs to and reconstruction of Puerto Rico's electrical grid as a result of Hurricane Maria. For additional information regarding our contracts with PREPA and our infrastructure services, see "Overview of Our Industries - Electrical Infrastructure Industry" above.
Pressure Pumping Services
. Pressure pumping services division revenue
increased
$90 million
, or
32%
, to
$369 million
for
2018
from
$279 million
for
2017
. Revenue derived from related parties was
$96 million
, or
26%
of total pressure pumping revenues, for
2018
and
$144 million
, or
52%
of total pressure pumping revenues, for
2017
. Substantially all of our related party revenue is derived from Gulfport under a pressure pumping contract, which is
63
effective through December 31, 2021. Intersegment revenues, consisting primarily of revenue derived from our sand segment, totaled
$7 million
and
$2 million
, respectively, for
2018
and
2017
.
The increase in our pressure pumping services revenue was primarily driven by the startup of our fourth, fifth and sixth pressure pumping fleets in June, August and October 2017, respectively, in the SCOOP/STACK and Permian Basin, which contributed revenues of $148 million in
2018
compared to $100 million in
2017
. Additionally, the number of stages completed increased to
6,245
for
2018
from
5,139
for
2017
.
Natural Sand Proppant Services.
Natural sand proppant services division revenue
increased
$51 million
, or
44%
, to
$168 million
for
2018
, from
$117 million
for
2017
. Revenue derived from related parties was
$25 million
, or
15%
of total sand revenues, for
2018
and
$43 million
, or
37%
of total sand revenues, for
2017
. Substantially all of our related party revenue is derived from Gulfport under a contract effective through December 31, 2021. Intersegment revenues, consisting primarily of revenue derived from our pressure pumping segment, totaled
$67 million
, or
40%
of total sand revenues, for
2018
and
$27 million
, or
23%
of total sand revenues, for
2017
.
The increase in our natural sand proppant services revenue was primarily attributable to a
59%
increase in tons of sand sold from approximately
1.7 million
tons in
2017
to
2.7 million
tons in
2018
. In May 2017, we acquired a wet and dry plant and sand mine located on approximately 600 acres in New Auburn, Wisconsin through our purchase of the assets of Chieftain. These assets contributed revenue of $38 million to our natural sand proppant services division in
2018
compared to $23 million in
2017
.
Other Services.
Other revenue, consisting of revenue derived from our contract land and directional drilling, coil tubing, pressure control, flowback, cementing, acidizing, equipment rental, crude oil hauling and remote accommodation businesses,
increased
$48 million
, or
47%
, to
$150 million
for
2018
from
$102 million
for
2017
. Revenue derived from related parties, consisting primarily of equipment rental, cementing and directional drilling revenue from Gulfport, was
$22 million
, or
15%
of total other revenues, for
2018
and
$22 million
, or
21%
of total other revenues, for
2017
. Intersegment revenues, consisting primarily of revenue derived from our infrastructure and pressure pumping segments, totaled
$6 million
and
$3 million
, respectively, for
2018
and
2017
.
Revenue for Stingray Cementing and Stingray Energy, which we acquired in June 2017, increased $16 million for 2018 compared to 2017. During the second quarter of 2018, we acquired RTS, a cementing and acidizing business, and WTL, a crude oil hauling business. These businesses contributed revenue of $14 million during 2018. Revenue for our directional drilling services increased $13 million in 2018 compared to 2017 primarily due to an increase in utilization from 27% in 2017 to 49% in 2018. Revenue from our coil tubing, pressure control and flowback services increased $7 million for 2018 compared to 2017 primarily due to increases in utilization. These increases were partially offset by a $6 million decrease in revenue from our remote accommodations business due to a decline in utilization.
Cost of Revenue (exclusive of depreciation, depletion, amortization and accretion expense)
. Cost of revenue
increased
$611 million
from
$483 million
, or
70%
of total revenue, for
2017
to
$1.1 billion
, or
65%
of total revenue, for
2018
. The increase was primarily due to an expansion of our infrastructure services business, which represented a
$489 million
increase in cost of revenue, as well as an increase in pressure pumping division costs of $83 million, primarily related to the addition of three new fleets in 2017. Cost of revenue by operating division was as follows:
Infrastructure Services.
Infrastructure services division cost of revenue
increased
$489 million
from
$122 million
for
2017
to
$611 million
for
2018
. The increase is due to the expansion of our infrastructure business in late 2017 and 2018. The largest components of our cost of revenue include labor-related costs, contract labor and travel, meals and lodging expense. As a percentage of revenue, cost of revenue, exclusive of depreciation and amortization expense of $20 million in
2018
and $3 million in
2017
, was
56%
and
54%
, respectively, for
2018
and
2017
.
Pressure Pumping Services
. Pressure pumping services division cost of revenue
increased
$83 million, or
39%
, from
$211 million
for
2017
to
$294 million
for
2018
. The increase was primarily due to the expansion of services into the SCOOP/STACK and Permian Basin with the addition of three fleets in 2017. As a percentage of revenue, our pressure pumping services division cost of revenue, exclusive of depreciation and amortization expense of
$51 million
in
2018
and $45 million in
2017
, was
79%
and
76%
, respectively, for
2018
and
2017
. The increase in costs as a percentage of revenue was primarily due to an increase in cost of goods sold as a result of selling sand with our service package to customers in the mid-continent region.
64
Natural Sand Proppant Services.
Natural sand proppant services division cost of revenue
increased
$40 million
, or
43%
, from
$93 million
for
2017
to
$133 million
for
2018
, primarily due to an increase in cost of goods sold as a result of a
59%
increase in tons of sand sold in
2018
compared to
2017
, partially offset by a decrease in production costs per ton of sand in
2018
. As a percentage of revenue, cost of revenue, exclusive of depreciation, depletion and accretion expense of
$14 million
in
2018
and
$9 million
in
2017
, was
79%
for both
2018
and
2017
.
Other Services
. Other cost of revenue
increased
$48 million
, or
54%
, from
$89 million
for
2017
to
$137 million
for
2018
, primarily due to the acquisition of Stingray Cementing and Stingray Energy in June 2017, the acquisitions of RTS and WTL in the second quarter of 2018 and increased costs for our directional drilling business. As a percentage of revenues, cost of revenue, exclusive of depreciation and amortization expense of
$34 million
in both
2018
and
2017
, was
91%
and
87%
, respectively, for
2018
and
2017
. The increase is primarily the result of integration costs related to RTS and WTL as well as an increase in equipment rental expense as a percentage of revenue.
Selling, General and Administrative Expenses
. Selling, general and administrative expenses, or SG&A, represent the costs associated with managing and supporting our operations. These expenses
increased
$23 million
, or
47%
, to
$73 million
for
2018
, from
$50 million
for
2017
, primarily related to costs incurred for the expansion of our infrastructure business and the recognition of equity based compensation. The equity based compensation represents compensation expense for awards issued by certain Wexford affiliates and had no cash impact to the Company and no dilutive impact relative to the number of shares outstanding. These increases were partially offset by a decrease in bad debt expense. Following is a breakout of SG&A expenses for the periods indicated (in thousands):
|
Years Ended
|
|||||||
|
December 31, 2018
|
December 31, 2017
|
||||||
|
Cash expenses:
|
|||||||
|
Compensation and benefits
|
$
|
42,950
|
|
$
|
15,322
|
|
|
|
Professional services
|
11,854
|
|
7,765
|
|
|||
|
Other
(a)
|
10,718
|
|
7,503
|
|
|||
|
Total cash SG&A expense
|
65,522
|
|
30,590
|
|
|||
|
Non-cash expenses:
|
|||||||
|
Bad debt provision
(b)
|
(14,578
|
)
|
16,098
|
|
|||
|
Equity based compensation
(c)
|
17,487
|
|
—
|
|
|||
|
Stock based compensation
|
4,666
|
|
3,198
|
|
|||
|
Total non-cash SG&A expense
|
7,575
|
|
19,296
|
|
|||
|
Total SG&A expense
|
$
|
73,097
|
|
$
|
49,886
|
|
|
|
a.
|
Includes travel-related costs, IT expenses, rent, utilities and other general and administrative-related costs.
|
|
b.
|
During the year ended
December 31, 2018
, the Company received payment for amounts previously reserved in 2017. As a result, during the year ended
December 31, 2018
, the Company reversed bad debt expense of
$16 million
recognized in 2017.
|
|
c.
|
Represents compensation expense for non-employee awards, which were issued and are payable by certain affiliates of Wexford (the sponsor level).
|
Depreciation, Depletion, Amortization and Accretion
. Depreciation, depletion, amortization and accretion
increased
$28 million
, or
30%
, to
$120 million
for
2018
from
$92 million
in
2017
. The increase is primarily attributable to an increase in property and equipment purchases in the second half of 2017 and 2018, resulting in increased depreciation expense. Additionally, depletion expense increased in 2018 as a result of the Chieftain assets purchased in 2017.
Impairment of Long-lived Assets
. We recorded impairments of long-lived assets of
$9 million
in 2018, of which $5 million related to impairment of goodwill and intangible assets as a result of the movement of certain cementing equipment from the Utica shale to the Permian basin and $4 million related to specified drilling rigs. Impairments were
$4 million
in 2017, primarily related to specified drilling rig assets.
Operating Income.
Operating income
increased
$331 million, or 525%, to
$394 million
for
2018
compared to
$63 million
for
2017
. The increase was primarily the result of an expansion of our infrastructure businesses, which accounted for
$346 million
of the increase in operating income and a
$9 million
increase in natural sand proppant operating income. These were partially offset by a
$19 million
decrease in pressure pumping operating income primarily due to the recognition of non-cash equity compensation expense during
2018
.
65
Interest Expense, net
. Interest expense
decreased
$1 million
, or
26%
, to
$3 million
during
2018
compared to
$4 million
during
2017
. The decline in interest expense was attributable to a decrease in average borrowings on our credit facility during 2018 compared to 2017.
Bargain Purchase Gain.
The purchase of the Chieftain assets resulted in a bargain purchase gain of
$4 million
for
2017
. See Note 4 to our consolidated financial statements included elsewhere in this annual report for more information.
Other Expense, net.
Non-operating charges resulted in other expense, net, of
$2 million
for
2018
compared to
$1 million
for
2017
. The
2018
amount included $1 million of loss on the disposal of assets during the period compared to a nominal loss for
2017
.
Income Taxes
. During
2018
, we recorded income tax expense of
$153 million
on pre-tax income of
$389 million
compared to income tax expense of
$3 million
on pre-tax loss of
$62 million
for
2017
. Our effective tax rate was 39.4% for
2018
and 4.9% for
2017
.
2017
included the recognition of a
$31 million
credit related to the Tax Act enacted in
2017
. Our tax rate is affected by recurring items, such as tax rates in foreign jurisdictions and the relative amounts of income we earn in those jurisdictions, as well as discrete items, such as equity based compensation that may not be consistent from year to year. See Note 15 to our consolidated financial statements for additional detail regarding our change in tax expense.
66
Year Ended
December 31, 2017
Compared to Year Ended
December 31, 2016
|
Years Ended
|
|||||||
|
December 31, 2017
|
December 31, 2016
|
||||||
|
Revenue:
|
(in thousands)
|
||||||
|
Infrastructure services
|
$
|
224,425
|
|
$
|
—
|
|
|
|
Pressure pumping services
|
279,352
|
|
124,425
|
|
|||
|
Natural sand proppant services
|
117,037
|
|
38,102
|
|
|||
|
Other
|
102,249
|
|
73,013
|
|
|||
|
Eliminations
|
(31,567
|
)
|
(4,915
|
)
|
|||
|
Total revenue
|
691,496
|
|
230,625
|
|
|||
|
Cost of Revenue:
|
|||||||
|
Infrastructure services (exclusive of depreciation and amortization of $3,181 and $0, respectively, for 2017 and 2016)
|
121,560
|
|
—
|
|
|||
|
Pressure pumping services (exclusive of depreciation and amortization of $45,381 and $36,938, respectively, for 2017 and 2016)
|
211,236
|
|
86,888
|
|
|||
|
Natural sand proppant services (exclusive of depreciation, depletion and accretion of $9,389 and $6,477, respectively, for 2017 and 2016)
|
92,780
|
|
32,456
|
|
|||
|
Other (exclusive of depreciation and amortization of $34,124 and $28,767, respectively, for 2017 and 2016)
|
88,525
|
|
58,592
|
|
|||
|
Eliminations
|
(31,532
|
)
|
(4,915
|
)
|
|||
|
Total cost of revenue
|
482,569
|
|
173,021
|
|
|||
|
Selling, general and administrative expenses
|
49,886
|
|
18,048
|
|
|||
|
Depreciation, depletion, accretion and amortization
|
92,124
|
|
72,315
|
|
|||
|
Impairment of long-lived assets
|
4,146
|
|
1,871
|
|
|||
|
Operating income (loss)
|
62,771
|
|
(34,630
|
)
|
|||
|
Interest expense, net
|
(4,310
|
)
|
(4,096
|
)
|
|||
|
Bargain purchase gain
|
4,012
|
|
—
|
|
|||
|
Other (expense) income, net
|
(677
|
)
|
158
|
|
|||
|
Income (loss) before income taxes
|
61,796
|
|
(38,568
|
)
|
|||
|
Provision for income taxes
|
2,832
|
|
53,885
|
|
|||
|
Net income (loss)
|
$
|
58,964
|
|
$
|
(92,453
|
)
|
|
Revenue
. Revenue for
2017
increased
$460 million, or
200%
, to
$691 million
from
$231 million
for
2016
. Revenue derived from related parties was
$209 million
, or
30%
of our total revenues, for
2017
and
$133 million
, or
58%
of our total revenues, for
2016
. Substantially all of our related party revenue is derived from Gulfport under pressure pumping and sand contracts. The increase in total revenues was primarily attributable to an expansion of our service offerings into the energy infrastructure business in late 2017, representing $224 million, or 49%, of the overall increase. Additionally, we organically added three pressure pumping fleets to our pressure pumping segment operations, resulting in an increase in revenues of $100 million, or 22% of the consolidated increase, for 2017. Revenues related to 2017 acquisitions, including the Chieftain assets, Stingray Energy and Stingray Cementing, totaled $42 million, or 9% of the increase in revenues. The remaining increase in revenues is primarily due to increased utilization across all divisions. Revenue by division was as follows:
Infrastructure Services
. Infrastructure services division revenue was $224 million for 2017. We began offering electric utility infrastructure services in 2017 through the formation of Cobra and the acquisitions of Higher Power and 5 Star. We generated $203 million, or 90% of total infrastructure services revenue, from our contract with PREPA for repairs to Puerto Rico's electrical grid as a result of Hurricane Maria. We did not provide infrastructure services in 2016.
Pressure Pumping Services
. Pressure pumping services division revenue
increased
$155 million
, or
125%
, to
$279 million
for
2017
from
$124 million
for
2016
. Revenue derived from related parties was
$144 million
, or
52%
of
67
total pressure pumping revenues, for
2017
and
$102 million
, or
82%
of total pressure pumping revenues, for
2016
. Substantially all of our related party revenue was derived from Gulfport. Intersegment revenues, consisting primarily of revenues derived from our sand segment, were
$2 million
and
$1 million
, respectively, for
2017
and
2016
.
The increase in our pressure pumping services revenue was primarily driven by the startup of our fourth, fifth and sixth pressure pumping fleets in June, August and October 2017, respectively, in the SCOOP/STACK and Permian Basin, which contributed revenues of $100 million in 2017. Additionally, fleet utilization increased from 50%, on an average of two active fleets, for 2016 to 72%, on an average of four active fleets, for 2017.
Natural Sand Proppant Services.
Natural sand proppant services division revenue
increased
$79 million
, or
207%
, to
$117 million
for
2017
, from
$38 million
for
2016
. Revenue derived from related parties was
$43 million
, or
37%
of total sand revenues, for
2017
and
$26 million
, or
68%
of total sand revenues, for
2016
. Substantially all of our related party revenue was derived from Gulfport. Intersegment revenues, consisting primarily of revenues derived from our pressure pumping segment, were
$27 million
, or 23% of total sand revenues, for
2017
and
$4 million
, or 11% of total sand revenues, for
2016
.
The increase in our natural sand proppant services revenue was primarily attributable to a 147% increase in tons of sand sold from approximately
683,768
tons in
2016
to
1,690,032
tons in
2017
coupled with a 41% increase in average sales price per ton of sand from $49 in
2016
to $69 in
2017
. As previously discussed, we acquired a wet and dry plant and sand mine located on approximately 600 acres in New Auburn, Wisconsin through our purchase of the assets of Chieftain in May 2017. These assets contributed revenues of $23 million to our natural sand proppant division in
2017
.
Other
. Other revenue, consisting of revenue derived from our contract land and directional drilling, coil tubing, pressure control, flowback, cementing, equipment rental and remote accommodation businesses,
increased
$29 million
, or
40%
, to
$102 million
for
2017
from
$73 million
for
2016
. Revenue derived from related parties, consisting primarily of directional drilling revenue from Gulfport and coil tubing and flowback revenue from El Toro Resources LLC, was
$22 million
, or
21%
of total other revenues, for
2017
and
$5 million
, or
6%
of total other revenues, for
2016
. Intersegment revenues, consisting primarily of revenues derived from our infrastructure and pressure pumping segments, were
$3 million
for
2017
and a nominal amount for 2016.
Stingray Cementing and Stingray Energy, which we acquired in June 2017, contributed revenues of $19 million in 2017. Revenue for our contract land and directional drilling services increased $19 million in 2017 primarily due to an increase in dayrates for our land drilling services and an increase in average active rigs in 2017 compared to 2016. Revenues from our coil tubing and flowback services increased $12 million in 2017 as compared to 2016 primarily due to increases in utilization. These increases were partially offset by a $20 million decrease in revenues for our remote accommodations business due to a decline in room nights rented.
Cost of Revenue (exclusive of depreciation, depletion, amortization and accretion)
. Cost of revenue
increased
$310 million
from
$173 million
, or
75%
of total revenue, for
2016
to
$483 million
, or
70%
of total revenue, for
2017
. The increase was primarily due to an expansion of our service offerings into the infrastructure services business, which represented a
$122 million
increase in cost of revenue, as well as an increase in pressure pumping division costs of
$124 million
, primarily related to the addition of three new fleets and increased utilization of existing fleets, and an increase in natural sand proppant division costs of
$60 million
, primarily due to an increase in tons of sand sold in
2017
compared to
2016
. Cost of revenue by division was as follows:
Infrastructure Services
. Infrastructure services division cost of revenue was
$122 million
for
2017
. The largest components of our cost of revenue include labor-related costs, including contract labor, and travel, meals and lodging expense. As a percentage of revenue, cost of revenue, exclusive of depreciation and amortization expense of $3 million, was 54% for
2017
. We did not provide infrastructure services in
2016
.
Pressure Pumping Services
. Pressure pumping services division cost of revenue
increased
$124 million
, or
143%
, from
$87 million
for
2016
to
$211 million
for
2017
. The increase was primarily due to the expansion of services into the SCOOP/STACK and Permian Basin with the addition of three fleets, which accounted for $91 million, or 73% of the increase. As a percentage of revenue, our pressure pumping services division cost of revenue, exclusive of depreciation and amortization expense of $45 million in 2017 and $37 million in 2016, was 76% and 70%, respectively, for
2017
and
2016
. The increase in costs as a percentage of revenue was primarily due to an increase in cost of goods sold as we began selling sand as part of our service package to customers in the mid-continent region in
2017
.
68
Natural Sand Proppant Services.
Natural sand proppant services division cost of revenue
increased
$61 million, or
186%
, from
$32 million
for
2016
to
$93 million
for
2017
, primarily due to an increase in cost of goods sold as a result of a 147% increase in tons of sand sold in 2017 compared to 2016, combined with increased production costs per ton of sand in 2017. As a percentage of revenue, cost of revenue, exclusive of depreciation, depletion and accretion expense of $9 million in 2017 and $7 million in 2016, was 79% and 85%, respectively, for
2017
and
2016
. The decrease is primarily due to decreases in labor-related costs and cost of goods sold as a percentage of revenue.
Other Services
. Other services cost of revenue
increased
$30 million
, or
51%
, from
$59 million
for
2016
to
$89 million
for
2017
, primarily due to the acquisition of Stingray Cementing and Stingray Energy and an increase in labor-related costs and repairs and maintenance costs for our contract land and directional drilling business as a result of increased utilization. These increases were partially offset by costs for our remote accommodations business and declines in labor-related costs and repairs and maintenance expense for our coil tubing and flowback businesses. As a percentage of revenues, cost of revenue, exclusive of depreciation and amortization expense of
$34 million
in
2017
and
$29 million
in
2016
, was
87%
and
80%
, respectively, for
2017
and
2016
.
Selling, General and Administrative Expenses
. Selling, general and administrative expenses represent the costs associated with managing and supporting our operations. These expenses
increased
$32 million
, or
176%
, to
$50 million
for
2017
, from
$18 million
for
2016
. Following is a breakout of SG&A expenses for the periods indicated (in thousands):
|
Years Ended
|
|||||||
|
December 31, 2017
|
December 31, 2016
|
||||||
|
Cash expenses:
|
|||||||
|
Compensation and benefits
|
$
|
15,322
|
|
$
|
9,789
|
|
|
|
Professional services
|
7,765
|
|
4,552
|
|
|||
|
Other
(a)
|
7,503
|
|
1,960
|
|
|||
|
Total cash SG&A expense
|
30,590
|
|
16,301
|
|
|||
|
Non-cash expenses:
|
|||||||
|
Bad debt provision
(b)
|
16,098
|
|
1,246
|
|
|||
|
Stock based compensation
|
3,198
|
|
501
|
|
|||
|
Total non-cash SG&A expense
|
19,296
|
|
1,747
|
|
|||
|
Total SG&A expense
|
$
|
49,886
|
|
$
|
18,048
|
|
|
|
a.
|
Includes travel-related costs, IT expenses, rent, utilities and other general and administrative-related costs.
|
|
b.
|
During the year ended
December 31, 2018
, the Company received payment for amounts reserved in 2017. As a result, during the year ended
December 31, 2018
, the Company reversed bad debt expense of
$16 million
recognized in 2017.
|
Depreciation, Depletion, Accretion and Amortization
. Depreciation, depletion, accretion and amortization
increased
$20 million
, or
27%
, to
$92 million
for
2017
from
$72 million
in
2016
. The increase was primarily attributable to $193 million in capital additions placed in service in 2017.
Impairment of Long-lived Assets
. We recorded an impairment of long-lived assets of
$4 million
in
2017
, primarily related to drilling rigs and railroad improvements. Impairments were $2 million for 2016 attributable to various fixed assets.
Operating Income (Loss).
Operating income increased
$97 million
, or
281%
, to
$63 million
for
2017
compared to a loss of
$35 million
for
2016
. The increase was primarily the result of an expansion of our service offerings into the infrastructure business, which accounted for 80%, or $78 million, of the overall increase in operating income. Operating income from our pressure pumping division increased $17 million, or 18% of the overall increase, primarily due to the expansion into the SCOOP/STACK and Permian Basin with the addition of three fleets in 2017 as well as increased utilization for our existing fleets. Operating income for our natural sand proppant division increased $11 million, representing an 11% increase overall, primarily due to an increase in sales price per ton of sand sold. These increases were partially offset by a $8 million decrease in operating income for our other services, primarily related to a decrease in utilization in our remote accommodations business.
Interest Expense, net
. Interest expense increased
$0.2 million
, or
5%
, during
2017
primarily attributable to an increase in average borrowings on our credit facility during 2017.
69
Bargain Purchase Gain
. The purchase of the Chieftain assets resulted in a bargain purchase gain of $4 million for 2017. See Note 4 to our consolidated financial statements included elsewhere in this annual report for more information.
Other (Expense) Income, net.
Non-operating charges resulted in other expense, net, of
$1 million
for
2017
compared to other income, net of
$0.2 million
for
2016
. The 2017 amount included $0.1 million of loss on the disposal of assets compared to a $0.7 million gain for
2016
.
Income Taxes
. During 2017, we recorded income tax expense of $3 million on pre-tax income of $62 million compared to income tax expense of $54 million on pre-tax loss of $39 million for 2016. Our effective tax rate was 4.9% for 2017 and 34.6% for 2016. The decrease in effective tax rate was primarily driven by the recognition of a $31 million credit related to the Tax Act enacted in 2017. Additionally, during 2016, in connection with the IPO, we became subject to federal income taxes which triggered recognition of federal income tax liabilities associated with historical earnings (See Note 1 to our consolidated financial statements included elsewhere in this annual report for more information). The 2016 amount included recognition of other items related to the change in classification to a C corporation resulting in total one-time effect of $53 million. Additionally, the 2016 amount included recognition of deferred taxes recorded on income from Sand Tiger in the U.S. related to an entity election that required us to disregard previously recorded deferred tax liabilities. See Note 15 to our consolidated financial statements included elsewhere in this annual report for additional detail regarding our change in tax expense.
Non-GAAP Financial Measures
Adjusted EBITDA
Adjusted EBITDA is a supplemental non-GAAP financial measure that is used by management and external users of our financial statements, such as industry analysts, investors, lenders and rating agencies. We define Adjusted EBITDA as net income (loss) before depreciation, depletion, amortization and accretion expense, impairment of long-lived assets, acquisition related costs, public offering costs, one-time compensation charges associated with the IPO, equity based compensation, stock based compensation, bargain purchase gain, interest expense, net, other (income) expense, net (which is comprised of the (gain) or loss on disposal of long-lived assets) and provision (benefit) for income taxes. We exclude the items listed above from net income (loss) in arriving at Adjusted EBITDA because these amounts can vary substantially from company to company within our industries depending upon accounting methods and book values of assets, capital structures and the method by which the assets were acquired. Adjusted EBITDA should not be considered as an alternative to, or more meaningful than, net income (loss) or cash flows from operating activities as determined in accordance with GAAP or as an indicator of our operating performance or liquidity. Certain items excluded from Adjusted EBITDA are significant components in understanding and assessing a company’s financial performance, such as a company’s cost of capital and tax structure, as well as the historic costs of depreciable assets, none of which are components of Adjusted EBITDA. Our computations of Adjusted EBITDA may not be comparable to other similarly titled measures of other companies. We believe that Adjusted EBITDA is a widely followed measure of operating performance and may also be used by investors to measure our ability to meet debt service requirements.
The following tables also provide a reconciliation of Adjusted EBITDA to the GAAP financial measure of net income or (loss) for each of our operating segments for the specified periods (in thousands).
70
Consolidated
|
Years Ended December 31,
|
|||||||||||
|
Reconciliation of Adjusted EBITDA to net income (loss):
|
2018
|
2017
|
2016
|
||||||||
|
Net income (loss)
|
$
|
235,965
|
|
$
|
58,964
|
|
$
|
(92,453
|
)
|
||
|
Depreciation, depletion, amortization and accretion
|
119,877
|
|
92,124
|
|
72,315
|
|
|||||
|
Impairment of long-lived assets
|
8,855
|
|
4,146
|
|
1,871
|
|
|||||
|
Acquisition related costs
|
191
|
|
2,506
|
|
—
|
|
|||||
|
Public offering costs
|
982
|
|
—
|
|
—
|
|
|||||
|
One-time IPO compensation charges
|
—
|
|
—
|
|
1,201
|
|
|||||
|
Equity based compensation
|
17,487
|
|
—
|
|
—
|
|
|||||
|
Stock based compensation
|
5,425
|
|
3,741
|
|
501
|
|
|||||
|
Bargain purchase gain
|
—
|
|
(4,012
|
)
|
—
|
|
|||||
|
Interest expense, net
|
3,187
|
|
4,310
|
|
4,096
|
|
|||||
|
Other expense (income), net
|
2,036
|
|
677
|
|
(158
|
)
|
|||||
|
Provision for income taxes
|
153,263
|
|
2,832
|
|
53,885
|
|
|||||
|
Adjusted EBITDA
|
$
|
547,268
|
|
$
|
165,288
|
|
$
|
41,258
|
|
||
Infrastructure Services
|
Years Ended December 31,
|
|||||||||||
|
Reconciliation of Adjusted EBITDA to net income (loss):
|
2018
|
2017
|
2016
|
||||||||
|
Net income
|
$
|
319,940
|
|
$
|
48,537
|
|
$
|
—
|
|
||
|
Depreciation, depletion, amortization and accretion
|
20,516
|
|
3,185
|
|
—
|
|
|||||
|
Impairment of long-lived assets
|
308
|
|
—
|
|
—
|
|
|||||
|
Acquisition related costs
|
58
|
|
98
|
|
—
|
|
|||||
|
Public offering costs
|
473
|
|
—
|
|
—
|
|
|||||
|
Stock based compensation
|
2,089
|
|
345
|
|
—
|
|
|||||
|
Interest expense
|
423
|
|
241
|
|
—
|
|
|||||
|
Other expense, net
|
573
|
|
6
|
|
—
|
|
|||||
|
Provision for income taxes
|
102,885
|
|
29,290
|
|
—
|
|
|||||
|
Adjusted EBITDA
|
$
|
447,265
|
|
$
|
81,702
|
|
$
|
—
|
|
||
Pressure Pumping Services
|
Years Ended December 31,
|
|||||||||||
|
Reconciliation of Adjusted EBITDA to net income (loss):
|
2018
|
2017
|
2016
|
||||||||
|
Net income (loss)
|
$
|
(7,165
|
)
|
$
|
11,451
|
|
$
|
(4,568
|
)
|
||
|
Depreciation, depletion, amortization and accretion
|
51,487
|
|
45,413
|
|
37,013
|
|
|||||
|
Impairment of long-lived assets
|
143
|
|
—
|
|
139
|
|
|||||
|
Acquisition related costs
|
39
|
|
1
|
|
—
|
|
|||||
|
Public offering costs
|
264
|
|
—
|
|
—
|
|
|||||
|
One-time IPO compensation charges
|
—
|
|
—
|
|
102
|
|
|||||
|
Equity based compensation
|
17,487
|
|
—
|
|
—
|
|
|||||
|
Stock based compensation
|
1,612
|
|
1,641
|
|
176
|
|
|||||
|
Interest expense
|
1,171
|
|
1,622
|
|
599
|
|
|||||
|
Other expense, net
|
434
|
|
129
|
|
27
|
|
|||||
|
Adjusted EBITDA
|
$
|
65,472
|
|
$
|
60,257
|
|
$
|
33,488
|
|
||
71
Natural Sand Proppant Services
|
Years Ended December 31,
|
|||||||||||
|
Reconciliation of Adjusted EBITDA to net income (loss):
|
2018
|
2017
|
2016
|
||||||||
|
Net income (loss)
|
$
|
14,962
|
|
$
|
9,474
|
|
$
|
(4,709
|
)
|
||
|
Depreciation, depletion, amortization and accretion
|
13,519
|
|
9,394
|
|
6,483
|
|
|||||
|
Impairment of long-lived assets
|
—
|
|
324
|
|
—
|
|
|||||
|
Acquisition related costs
|
(38
|
)
|
2,163
|
|
—
|
|
|||||
|
Public offering costs
|
144
|
|
—
|
|
—
|
|
|||||
|
One-time IPO compensation charges
|
—
|
|
—
|
|
33
|
|
|||||
|
Stock based compensation
|
783
|
|
708
|
|
57
|
|
|||||
|
Bargain purchase gain
|
—
|
|
(4,012
|
)
|
—
|
|
|||||
|
Interest expense
|
234
|
|
679
|
|
434
|
|
|||||
|
Other expense, net
|
525
|
|
211
|
|
96
|
|
|||||
|
(Benefit) provision for income taxes
|
—
|
|
(4
|
)
|
4
|
|
|||||
|
Adjusted EBITDA
|
$
|
30,129
|
|
$
|
18,937
|
|
$
|
2,398
|
|
||
Other Services
(a)
|
Years Ended December 31,
|
|||||||||||
|
Reconciliation of Adjusted EBITDA to net income (loss):
|
2018
|
2017
|
2016
|
||||||||
|
Net loss
|
$
|
(91,745
|
)
|
$
|
(10,464
|
)
|
$
|
(83,177
|
)
|
||
|
Depreciation, depletion, amortization and accretion
|
34,355
|
|
34,132
|
|
28,819
|
|
|||||
|
Impairment of long-lived assets
|
8,404
|
|
3,822
|
|
1,732
|
|
|||||
|
Acquisition related costs
|
132
|
|
244
|
|
—
|
|
|||||
|
Public offering costs
|
101
|
|
—
|
|
—
|
|
|||||
|
One-time IPO compensation charges
|
—
|
|
—
|
|
1,066
|
|
|||||
|
Stock based compensation
|
941
|
|
1,047
|
|
267
|
|
|||||
|
Interest expense, net
|
1,359
|
|
1,768
|
|
3,063
|
|
|||||
|
Other expense (income), net
|
504
|
|
331
|
|
(281
|
)
|
|||||
|
(Benefit) provision for income taxes
|
50,378
|
|
(26,454
|
)
|
53,881
|
|
|||||
|
Adjusted EBITDA
|
$
|
4,429
|
|
$
|
4,426
|
|
$
|
5,370
|
|
||
|
a.
|
Includes results for our contract land and directional drilling, coil tubing, pressure control, flowback, cementing, acidizing, equipment rentals, crude oil hauling and remote accommodations services and corporate related activities. Our corporate related activities do not generate revenue.
|
Adjusted Net Income and Adjusted Earnings per Share
Adjusted net income and adjusted basic and diluted earnings per share are supplemental non-GAAP financial measures that are used by management to evaluate our operating and financial performance. Management believes these measures provide meaningful information about the Company's performance by excluding certain non-cash charges, such as equity based compensation, that may not be indicative of the Company's ongoing operating results. Adjusted net income and adjusted earnings per share should not be considered in isolation or as a substitute for net income and earnings per share prepared in accordance with GAAP and may not be comparable to other similarly titled measures of other companies. The following tables provide a reconciliation of adjusted net income and adjusted earnings per share to the GAAP financial measures of net income and earnings per share for the periods specified.
72
|
Years Ended December 31,
|
|||||||||||
|
2018
|
2017
|
2016
|
|||||||||
|
Net income (loss), as reported
|
$
|
235,965
|
|
$
|
58,964
|
|
$
|
(92,453
|
)
|
||
|
Equity based compensation
|
17,487
|
|
—
|
|
—
|
|
|||||
|
Adjusted net income (loss)
|
$
|
253,452
|
|
$
|
58,964
|
|
$
|
(92,453
|
)
|
||
|
Basic earnings (loss) per share, as reported
|
$
|
5.27
|
|
$
|
1.42
|
|
$
|
(2.94
|
)
|
||
|
Equity based compensation
|
0.39
|
|
—
|
|
—
|
|
|||||
|
Adjusted basic earnings (loss) per share
|
$
|
5.66
|
|
$
|
1.42
|
|
$
|
(2.94
|
)
|
||
|
Diluted earnings (loss) per share, as reported
|
$
|
5.24
|
|
$
|
1.42
|
|
$
|
(2.94
|
)
|
||
|
Equity based compensation
|
0.39
|
|
—
|
|
—
|
|
|||||
|
Adjusted diluted earnings (loss) per share
|
$
|
5.63
|
|
$
|
1.42
|
|
$
|
(2.94
|
)
|
||
Liquidity and Capital Resources
We require capital to fund ongoing operations, including maintenance expenditures on our existing fleet and equipment, organic growth initiatives, investments and acquisitions. Since November 2014, our primary sources of liquidity have been cash on hand, borrowings under our revolving credit facility and cash flows from operations in addition to our proceeds from our initial public offering in October 2016. Our primary use of capital has been for investing in property and equipment used to provide our services and to acquire complementary businesses. In addition, on July 16, 2018, we initiated a quarterly dividend policy and paid cash dividends of $0.125 per share in August 2018, November 2018 and February 2019. Our board of directors’ determination with respect to any future dividends will depend upon our profitability and financial condition, contractual restrictions, restrictions imposed by applicable law and other factors that the board deems relevant at the time of such determination. Based on its evaluation of these factors, the board of directors may determine not to declare a dividend, or declare dividends at rates that are less than currently anticipated.
As of
December 31, 2018
, we had no outstanding borrowing under our revolving credit facility and
$176 million
of available borrowing capacity under this facility, after giving effect to
$8 million
of outstanding letters of credit.
The following table summarizes our liquidity as of the dates indicated (in thousands):
|
December 31,
|
|||||||
|
2018
|
2017
|
||||||
|
Cash and cash equivalents
|
$
|
67,625
|
|
$
|
5,637
|
|
|
|
Revolving credit facility availability
|
184,233
|
|
169,233
|
|
|||
|
Less borrowings
|
—
|
|
(99,900
|
)
|
|||
|
Less letter of credit facilities (insurance programs)
|
(4,105
|
)
|
(2,486
|
)
|
|||
|
Less letter of credit facilities (environmental remediation)
|
(3,877
|
)
|
(3,582
|
)
|
|||
|
Less letter of credit facilities (rail car commitments)
|
(455
|
)
|
(455
|
)
|
|||
|
Net working capital (less cash)
(a)
|
148,108
|
|
88,798
|
|
|||
|
Total
|
$
|
391,529
|
|
$
|
157,245
|
|
|
|
a.
|
Net working capital (less cash) is a non-GAAP measure and, as of
December 31, 2018
, is calculated by subtracting total current liabilities of
$234 million
and cash and cash equivalents of
$68 million
from total current assets of
$450 million
. As of
December 31, 2017
, net working capital (less cash) is calculated by subtracting total current liabilities of
$220 million
and cash and cash equivalents of
$6 million
from total current assets of
$314 million
.
|
On
March 13, 2019
, we borrowed
$82 million
under our amended and restated revolving credit facility for 2018 Puerto Rico income taxes to be paid by March 15, 2019. Pursuant to the terms of our Original PREPA Contract, once our 2018 Puerto Rico income taxes are paid and the applicable returns are filed we are entitled to receive payment from PREPA of $45 million related to a contractual income tax provision. The $45 million is included in our accounts receivable balance as of
73
December 31, 2018. As of
March 13, 2019
, we had available borrowing capacity under our amended and restated revolving facility of
$93 million
, after giving effect to
$9 million
of outstanding letters of credit.
Liquidity and Cash Flows
The following table sets forth our cash flows for the periods indicated (in thousands):
|
Years Ended December 31,
|
|||||||||
|
2018
|
2017
|
2016
|
|||||||
|
Net cash provided by operating activities
|
$
|
386,668
|
|
$
|
57,616
|
|
$
|
29,689
|
|
|
Net cash used in investing activities
|
(211,955
|
)
|
(172,283
|
)
|
(7,718
|
)
|
|||
|
Net cash (used in) provided by financing activities
|
(112,592
|
)
|
91,049
|
|
3,075
|
|
|||
|
Effect of foreign exchange rate on cash
|
(133
|
)
|
16
|
|
154
|
|
|||
|
Net change in cash
|
$
|
61,988
|
|
$
|
(23,602
|
)
|
$
|
25,200
|
|
Operating Activities
Net cash provided by operating activities was
$387 million
,
$58 million
and
$30 million
, respectively, for the years ended
December 31, 2018
,
2017
and
2016
. The change in operating cash flows from
2017
to
2018
was primarily attributable to an increase in net income as a result of the expansion of our infrastructure services business. The decrease in operating cash flows from
2016
to
2017
was primarily attributable to the increase in net income as a result of increased utilization across all service divisions and the expansion of services with our infrastructure business and in our pressure pumping division in
2017
.
Investing Activities
Net cash used in investing activities was
$212 million
,
$172 million
and
$8 million
, respectively, for the years ended
December 31, 2018
,
2017
and
2016
. Net cash used for acquisitions totaled
$21 million
and
$42 million
, respectively, for
2018
and
2017
. Substantially all remaining cash used in investing activities was used to purchase property and equipment that is utilized to provide our services.
The following table summarizes our capital expenditures by operating division for the periods indicated (in thousands):
|
Years Ended December 31,
|
|||||||||
|
2018
|
2017
|
2016
|
|||||||
|
Infrastructure services
(a)
|
$
|
100,701
|
|
$
|
20,144
|
|
$
|
—
|
|
|
Pressure pumping services
(b)
|
33,774
|
|
85,853
|
|
7,673
|
|
|||
|
Natural sand proppant services
(c)
|
17,935
|
|
16,376
|
|
528
|
|
|||
|
Other
(d)
|
39,533
|
|
11,480
|
|
3,539
|
|
|||
|
Total capital expenditures
|
$
|
191,943
|
|
$
|
133,853
|
|
$
|
11,740
|
|
|
a.
|
Capital expenditures primarily for truck, tooling and equipment purchases for new infrastructure crews for the years ended
December 31, 2018
and
2017
.
|
|
b.
|
Capital expenditures primarily for pressure pumping equipment, including three new fleets, for the year ended
December 31, 2017
and various pressure pumping and water transfer equipment for the years ended
December 31, 2018
and
2016
.
|
|
c.
|
Capital expenditures primarily for the upgrade and expansion of our plants for the year ended
December 31, 2018
and a conveyor and plant additions for the years ended
December 31, 2017
and
2016
.
|
|
d.
|
Capital expenditures primarily for equipment for our equipment rental and crude hauling businesses for the year ended
December 31, 2018
and upgrades to our rig fleet and purchase of other equipment for the years ended
December 31, 2017
and
2016
.
|
Financing Activities
Net cash (used in) provided by financing activities was
($113) million
,
$91 million
and
$3 million
, respectively, for the years ended
December 31, 2018
,
2017
and
2016
. In 2018, net cash used in financing activities was primarily attributable to
74
net repayments under our revolving credit facility of
$100 million
and cash dividends paid totaling
$11 million
. In 2017, net cash provided by financing activities was primarily attributable to net borrowings under our revolving credit facility of $100 million, which was partially offset by the repayment of acquiree debt of $9 million. In 2016, net cash provided by financing activities was primarily attributable to net proceeds of $103 million from the IPO, offset by net repayments of $95 million under our revolving credit facility and $5 million in capital distributions.
Effect of Foreign Exchange Rate on Cash
The effect of foreign exchange rate on cash was
($0.1) million
, a nominal amount and
$0.2 million
, respectively, for the years ended
December 31, 2018
,
2017
and
2016
. The year-over-year effect was driven primarily by a favorable (unfavorable) shift in the weakness (strength) of the Canadian dollar relative to the U.S. dollar for the cash held in Canadian accounts.
Working Capital
Our working capital totaled
$216 million
and
$94 million
, respectively, at
December 31, 2018
and
2017
. Our cash balances totaled
$68 million
and
$6 million
, respectively, at
December 31, 2018
and
2017
.
Our Revolving Credit Facility
On October 19, 2018, we and certain of our direct and indirect subsidiaries, as borrowers, entered into an amended and restated revolving credit and security agreement with the lenders party thereto and PNC Bank, National Association, as a lender and as administrative agent for the lenders, which amends and restates our prior revolving credit and security agreement dated as of July 9, 2018, as amended prior to October 19, 2018, to, among other things, (i) extend the maturity date to October 19, 2023, (ii) increase the maximum revolving advance amount to $185 million, with the ability to further increase the maximum revolving advance amount to $350 million under certain circumstances, (iii) increase the letter of credit sublimit to 20% of the maximum revolving advance amount and (iv) decrease the interest rates applicable to loans.
Outstanding borrowings under this amended and restated revolving credit facility bear interest at a per annum rate elected by us that is equal to an alternate base rate or LIBOR, in each case plus the applicable margin. The applicable margin ranges from 1.00% to 1.50% per annum in the case of the alternate base rate, and from 2.00% to 2.50% per annum in the case of LIBOR. The applicable margin depends on the amount of excess availability under this amended and restated revolving credit facility.
At
December 31, 2018
, we had no outstanding borrowings under our revolving credit facility. At
March 13, 2019
, we had
$82 million
in borrowings outstanding under our amended and restated revolving credit facility, leaving an aggregate of
$93 million
of available borrowing capacity under this facility, after giving effect to
$9 million
of outstanding letters of credit.
Our amended and restated revolving credit facility contains various customary affirmative and restrictive covenants. Among the covenants are two financial covenants, including a minimum interest coverage ratio (3.0 to 1.0), and a maximum leverage ratio (4.0 to 1.0), and minimum availability ($10.0 million). As of
December 31, 2018
, we were in compliance with the financial covenants under our revolving credit facility.
Capital Requirements and Sources of Liquidity
During
2018
, our capital expenditures totaled
$192 million
and included
$101 million
in our infrastructure segment primarily related to truck, tooling and equipment purchases for new crews,
$34 million
in our pressure pumping segment primarily related to various pressure pumping and water transfer equipment,
$18 million
in our natural sand proppant services segment for the upgrade and expansion of our plants and $39 million for our other businesses primarily related to equipment additions for our equipment rental and crude hauling businesses.
During
2019
, we currently estimate that our aggregate capital expenditures will be approximately
$80 million
. These capital expenditures include $25 million in our infrastructure segment for assets for additional crews, $20 million in our pressure pumping segment for the expansion of our water transfer operations and maintenance to our existing pressure pumping fleet, $6 million for our natural sand proppant segment for upgrades and maintenance and $29 million for our other divisions, primarily for the expansion of our trucking fleet and rental division and upgrades to our drilling rigs.
75
We believe that our cash on hand, operating cash flow and available borrowings under our revolving credit facility will be sufficient to fund our operations for at least the next twelve months. However, future cash flows are subject to a number of variables (including receipt of payments from PREPA), and significant additional capital expenditures could be required to conduct our operations. There can be no assurance that operations and other capital resources will provide cash in sufficient amounts to maintain planned or future levels of capital expenditures. Further, we regularly evaluate acquisition opportunities, and the number of opportunities coming to our attention has increased substantially since our IPO in October 2016. We do not have a specific acquisition budget for
2019
since the timing and size of acquisitions cannot be accurately forecasted, however, we continue to evaluate opportunities, including transactions involving entities controlled by Wexford and Gulfport. Our acquisitions may be undertaken with cash, our common stock or a combination of cash, common stock and/or other consideration. In the event we make one or more acquisitions and the amount of capital required is greater than the amount we have available for acquisitions at that time, we could be required to reduce the expected level of capital expenditures and/or seek additional capital. If we seek additional capital for that or other reasons, we may do so through borrowings under our revolving credit facility, joint venture partnerships, asset sales, offerings of debt or equity securities or other means. We cannot assure you that this additional capital will be available on acceptable terms or at all. If we are unable to obtain funds we need, we may not be able to complete acquisitions that may be favorable to us or finance the capital expenditures necessary to conduct our operations.
Contractual and Commercial Commitments
The following table summarizes our contractual obligations and commercial commitments as of
December 31, 2018
(in thousands):
|
Total
|
Less than 1 year
|
1-3 Years
|
3-5 Years
|
More than 5 Years
|
|||||||||||||||
|
Contractual obligations:
|
|||||||||||||||||||
|
Operating lease obligations
(a)
|
66,184
|
|
20,161
|
|
29,146
|
|
14,329
|
|
2,548
|
|
|||||||||
|
Purchase commitments
(b)
|
52,691
|
|
32,483
|
|
20,180
|
|
24
|
|
4
|
|
|||||||||
|
Capital purchase commitments
(c)
|
10,557
|
|
10,557
|
|
—
|
|
—
|
|
—
|
|
|||||||||
|
Capital lease and equipment financing obligations
(d)
|
4,917
|
|
1,901
|
|
1,850
|
|
1,134
|
|
32
|
|
|||||||||
|
Commitment fees on long-term debt
(e)
|
3,328
|
|
694
|
|
1,387
|
|
1,247
|
|
—
|
|
|||||||||
|
$
|
137,677
|
|
$
|
65,796
|
|
$
|
52,563
|
|
$
|
16,734
|
|
$
|
2,584
|
|
|||||
|
a.
|
Operating lease obligations primarily relate to rail cars, real estate and other equipment.
|
|
b.
|
Purchase commitments are comprised primarily of sand and coil tubing string. Included in these amounts are sand purchase commitments of
$47 million
. Pricing for certain sand purchase agreements is variable and, therefore, the total sand purchase commitments could be as much as
$54 million
. The minimum amount due in the form of shortfall fees under certain sand purchase agreements was
$4 million
as of
December 31, 2018
.
|
|
c.
|
Obligations arising from capital improvements/equipment purchases.
|
|
d.
|
Capital lease and equipment financing obligations relate to vehicles and other equipment.
|
|
e.
|
Assumption of zero long-term debt outstanding balance as of
December 31, 2018
.
|
Off-Balance Sheet Arrangements
Lease Obligations
We lease real estate, rail cars and other equipment under long-term operating leases with varying terms and expiration dates through 2062.
Minimum Purchase Commitments
We have entered into agreements with suppliers that contain minimum purchase obligations. Our failure to purchase the minimum amounts specified may require us to pay shortfall fees. However, the minimum quantities set forth in the agreements are not in excess of our current expected future requirements.
76
Capital Spend Commitments
We have entered into agreements with suppliers to acquire capital equipment. These commitments are included in our 2019 capital budget discussed under the heading "Capital Requirements and Sources of Liquidity."
Aggregate future minimum lease payments under these agreements in effect at
December 31, 2018
are as follows (in thousands):
|
Year ended December 31:
|
Operating Leases
|
Capital Spend Commitments
|
Minimum Purchase Commitments
(a)
|
||||||||
|
2019
|
$
|
20,161
|
|
$
|
10,557
|
|
$
|
32,483
|
|
||
|
2020
|
16,579
|
|
—
|
|
19,679
|
|
|||||
|
2021
|
12,567
|
|
—
|
|
501
|
|
|||||
|
2022
|
9,329
|
|
—
|
|
12
|
|
|||||
|
2023
|
5,000
|
|
—
|
|
12
|
|
|||||
|
Thereafter
|
2,548
|
|
—
|
|
4
|
|
|||||
|
$
|
66,184
|
|
$
|
10,557
|
|
$
|
52,691
|
|
|||
a. Included in these amounts are sand purchase commitments of
$47 million
. Pricing for certain sand purchase agreements is variable and, therefore, the total sand purchase commitments could be as much as
$54 million
. The minimum amount due in the form of shortfall fees under certain sand purchase agreements was
$4 million
as of
December 31, 2018
.
Other Commitments
Subsequent to
December 31, 2018
, we ordered additional capital equipment with aggregate commitments of
$13 million
.
77
Critical Accounting Policies and Estimates
The discussion and analysis of our financial condition and results of operations are based upon our combined financial statements, which have been prepared in accordance with accounting principles generally accepted in the United States. Below, we have provided expanded discussion of our more significant accounting policies, estimates and judgments. We believe these accounting policies reflect our more significant estimates and assumptions used in preparation of our financial statements. See Note 2 of our consolidated financial statements included elsewhere in this annual report for a discussion of additional accounting policies and estimates made by management.
Use of Estimates
. In preparing the financial statements, our management makes informed judgments and estimates that affect the reported amounts of assets and liabilities, the disclosure of contingent assets and liabilities at the date of the financial statements and reported amounts of revenues and expenses during the reporting period. Actual results could differ from those estimates. Significant estimates include but are not limited to the Company's sand reserves and their impact on calculating depletion expense, allowance for doubtful accounts, asset retirement obligations, reserves for self-insurance, depreciation and amortization of property and equipment, business combination valuations, amortization of intangible assets, and future cash flows and fair values used to assess recoverability and impairment of long-lived assets, including goodwill.
Revenue Recognition
. On January 1, 2018, we adopted the new revenue guidance under ASC 606,
Revenue from Contracts with Customers
, using the modified retrospective method applied to contracts which were not completed as of January 1, 2018. Revenues for reporting periods beginning after January 1, 2018 are presented under ASC 606, while prior period amounts continue to be reported under previous revenue recognition guidance. The adoption of ASC 606 did not have a material impact on our consolidated financial statements. The Company's primary revenue streams include infrastructure services, pressure pumping services, natural sand proppant services and other services, which includes contract land and directional drilling services, coil tubing, pressure control, flowback, cementing, acidizing, equipment rentals, crude oil hauling and remote accommodations services.
Infrastructure Services.
Infrastructure services are typically provided pursuant to master service agreements, repair and maintenance contracts or fixed price and non-fixed price installation contracts. Pricing under these contracts may be unit priced, cost-plus/hourly (or time and materials basis) or fixed price (or lump sum basis). We account for infrastructure services as a single performance obligation satisfied over time. Revenue is recognized over time as work progresses based on the days completed or as the contract is completed. Under certain customer contracts in our infrastructure services segment, the Company warranties equipment and labor performed for a specified period following substantial completion of the work.
Pressure Pumping Services.
Pressure pumping services are typically provided based upon a purchase order, contract or on a spot market basis. Services are provided on a day rate, contracted or hourly basis. Generally, we account for pressure pumping services as a single performance obligation satisfied over time. In certain circumstances, we supply proppant that is utilized for pressure pumping as part of the agreement with the customer. These pressure pumping agreements are accounted for as multiple performance obligations satisfied over time. Jobs for pressure pumping services are typically short-term in nature and range from a few hours to multiple days. Generally, revenue is recognized over time upon the completion of each segment of work based upon a completed field ticket, which includes the charges for the services performed, mobilization of the equipment to the location and personnel.
Pursuant to a contract with one of its customers, we have agreed to provide that customer with use of up to two pressure pumping fleets for the period covered by the contract. Under this agreement, performance obligations are satisfied as services are rendered based on the passage of time rather than the completion of each segment of work. We have the right to receive consideration from this customer even if circumstances prevent us from performing work. All consideration owed to us for services performed during the contractual period is fixed and the right to receive it is unconditional.
Additional revenue is generated through labor charges and the sale of consumable supplies that are incidental to the service being performed. Such amounts are recognized ratably over the period during which the corresponding goods and services are consumed.
Natural Sand Proppant Services.
We sell natural sand proppant through sand supply agreements with our customers. Under these agreements, sand is typically sold at a flat rate per ton or a flat rate per ton with an index-based adjustment. We recognize revenue at the point in time when the customer obtains legal title to the product, which may occur at the production facility, rail origin or at the destination terminal.
78
Certain of our sand supply agreements contain a minimum volume commitment related to sand purchases whereby we charge a shortfall payment if the customer fails to meet the required minimum volume commitment. These agreements may also contain make-up provisions whereby shortfall payments can be applied in future periods against purchased volumes exceeding the minimum volume commitment. If a make-up right exists, we have future performance obligations to deliver excess volumes of product in subsequent periods. In accordance with ASC 606, if the customer fails to meet the minimum volume commitment, we assess whether we expect the customer to fulfill its unmet commitment during the contractually specified make-up period based on discussions with the customer and management's knowledge of the business. If we expect the customer will make-up deficient volumes in future periods, revenue related to shortfall payments is deferred and recognized on the earlier of the date on which the customer utilizes make-up volumes or the likelihood that the customer will exercise its right to make-up deficient volumes becomes remote. If we do not expect the customer will make-up deficient volumes in future periods, we apply the breakage model and revenue related to shortfall payments is recognized when the model indicates the customer's inability to take delivery of excess volumes.
In certain of our sand supply agreements, the customer obtains control of the product when it is loaded into rail cars and the customer reimburses us for all freight charges incurred. We have elected to account for shipping and handling as activities to fulfill the promise to transfer the sand. If revenue is recognized for the related product before the shipping and handling activities occur, we accrue the related costs of those shipping and handling activities.
Other Services.
We
also provide contract land and directional drilling, coil tubing, pressure control, flowback, cementing, acidizing, equipment rentals, crude oil hauling and remote accommodations services, which are reported under other services. Contract drilling services are provided under daywork contracts. Mobilization revenue and costs are recognized over the days of actual drilling. Other services are typically provided based upon a purchase order, contract or on a spot market basis. Services are provided on a day rate, contracted or hourly basis. Performance obligations for these services are satisfied over time and revenue is recognized as the work progresses based on the measure of output. Jobs for these services are typically short-term in nature and range from a few hours to multiple days.
Allowance for Doubtful Accounts
. We regularly review receivables and provide for estimated losses through an allowance for doubtful accounts. In evaluating the level of established reserves, we make judgments regarding our customers’ ability to make required payments, economic events and other factors. As the financial condition of customers change, circumstances develop or additional information becomes available, adjustments to the allowance for doubtful accounts may be required. In the event we were to determine that a customer may not be able to make required payments, we would increase the allowance through a charge to income in the period in which that determination is made. Uncollectable accounts receivable are periodically charged against the allowance for doubtful accounts once final determination is made of their uncollectibility.
Depreciation, Depletion, Amortization and Accretion
. In order to depreciate and amortize our property and equipment, we estimate useful lives, attrition factors and salvage values of these items. Our estimates may be affected by such factors as changing market conditions, technological advances in the industries in which we operate or changes in regulations governing such industries. Depletion of our mining property and development costs is calculated using the units-of-production method on estimated measured tons of in-place reserves.
Impairment of Long-Lived Assets
. Long-lived assets are reviewed for impairment when events or changes in circumstances indicate that the carrying amount of such assets may not be recoverable. Recoverability of such assets is evaluated by measuring the carrying amount of the assets against the estimated undiscounted future cash flows associated with the assets. If such evaluations indicate that the future undiscounted cash flow from the assets is not sufficient to recover the carrying value of such assets, the assets are adjusted to their estimated fair values.
Goodwill
.
Goodwill is tested for impairment annually, or more frequently if events or changes in circumstances indicate that goodwill might be impaired. If it is determined that an impairment exists, an impairment charge is recognized for the excess of carrying value over implied value. The fair value of the reporting unit is determined using the discounted cash flow approach, excluding interest.
Asset Retirement Obligations.
Mine reclamation costs, future remediation costs for inactive mines or other contractual site remediation costs are accrued based on management’s best estimate at the end of each period of the costs expected to be incurred at a site. Such cost estimates include, where applicable, ongoing care, maintenance and monitoring costs. Changes in estimates at inactive mines are reflected in earnings in the period an estimate is revised.
79
Equity-based Compensation.
The Company measures equity-based payments at fair value on the date of grant, and expenses the value of these equity-based payments in compensation expense over the applicable vesting periods.
Share-based Compensation.
The share-based compensation program consists of restricted stock units granted to employees and restricted stock units granted to non-employee directors under the Mammoth Energy Services, Inc. 2016 Incentive Plan (the "2016 Plan"). The Company recognizes in its financial statements the cost of employee services received in exchange for restricted stock based on the fair value of the equity instruments as of the grant date. In general, this value is amortized over the vesting period; for grants with a non-substantive service condition, this value is recognized immediately. Amounts are recognized in cost of revenues and selling, general, and administrative expenses.
Income Taxes
. Prior to our IPO in October 2016, the Partnership and each of its subsidiaries, except Sand Tiger, was treated as a pass-through entity for federal income tax and most state income tax purposes. Accordingly, income taxes on net earnings were payable by the stockholders, members or partners and are not reflected in the historical financial statements. In connection with our IPO, we became a C corporation subject to federal income taxes, which triggered the recognition of federal income tax liabilities associated with historical earnings. See Notes 1 and 2 to our consolidated financial statements included elsewhere in this annual report for more information. Sand Tiger is subject to corporate income taxes and they are provided in the financial statements based upon Financial Accounting Standards Board, Accounting Standard Codification 740 Income Taxes. As such, deferred tax assets and liabilities are recognized for the future tax consequences attributable to differences between the financial statement carrying amounts of existing assets and liabilities and their respective tax bases. Deferred tax assets and liabilities are measured using statutory tax rates expected to apply to taxable income in the years in which those temporary differences are expected to be recovered or settled. The effect of deferred tax assets and liabilities as a result of a change in tax rate is recognized in the period that includes the statutory enactment date. A valuation allowance for deferred tax assets is recognized when it is more likely than not that the benefit of deferred tax assets will not be realized.
New Accounting Pronouncements
In February 2016, the Financial Accounting Standards Board, or FASB, issued Accounting Standards Update, or ASU, No. 2016-02 “Leases (Topic 842)” amending the current accounting for leases. Under the new provisions, all lessees will report a right of use asset and lease liability on the balance sheet for all leases with a term longer than one year, while maintaining substantially similar classifications for financing and operating leases. Lessor accounting remains substantially unchanged with the exception that no leases entered into after the effective date will be classified as leveraged leases. ASU 2016-02 is effective for fiscal years beginning after December 15, 2018, and interim periods within that fiscal year. We will adopt this ASU effective January 1, 2019 utilizing the transition method permitted by ASU No. 2018-11 "Leases (Topic 842): Targeted Improvements", issued in August 2018, which permits an entity to recognize a cumulative-effect adjustment to the opening balance of retained earnings in the period of adoption with no adjustment made to the comparative periods presented in the consolidated financial statements. We will elect the transition practical expedient package whereby an entity need not reassess (i) whether any expired or existing contracts are or contains leases, (ii) the lease classification for any expired or existing leases and (iii) initial direct costs for any existing leases.
We have concluded that our agreements for contract land drilling services, aviation services and remote accommodation services contain a lease component under Topic 842. We will elect the practical expedient provided to lessors in ASU 2018-11 to combine the lease and non-lease components of a contract where the revenue recognition pattern is the same and where the lease component, when accounted for separately, would be considered an operating lease. The practical expedient also allows a lessor to account for the combined lease and non-lease components under ASC 606, Revenue from Contracts with Customers, when the non-lease component is the predominant element of the combined component. We expect to continue to report revenue for our contract land drilling services under ASC 606.
We are finalizing our evaluation with respect to leases where we are the lessee and expect to recognize right of use assets and offsetting lease liabilities of approximately $60 million upon the adoption of ASU 2016-02. Adoption of this standard will not have a material impact to our Consolidated Statement of Comprehensive Income (Loss). We will elect the practical expedient provided to lessees to combine the lease and non-lease components of a contract as well as the short-term lease recognition exemption. We are finalizing our implementation processes and controls needed to comply with the requirement of the new standard, which includes the implementation of a lease software solution to support lease portfolio management and lease accounting and disclosures.
In June 2018, the FASB issued ASU No. 2018-07, “Compensation - Stock Compensation (Topic 718): Improvements to Non-employee Share-Based Accounting,” which simplifies the accounting for share-based payments granted to non-employees by aligning the accounting with requirements for employee share-based compensation. Upon transition, this ASU requires non-employee awards to be measured at fair value as of the adoption date. This ASU is effective for fiscal years
80
beginning after December 15, 2018, and interim periods within that fiscal year. We adopted this ASU effective January 1, 2019 and estimate the fair value of our non-employee equity awards was approximately $18.9 million as of this date.
81
Item 7A. Quantitative and Qualitative Disclosures About Market Risk
The demand, pricing and terms for our products and services are largely dependent upon the level of activity for the U.S. oil and natural gas industry, energy infrastructure industry and natural sand proppant industry. Industry conditions are influenced by numerous factors over which we have no control, including, but not limited to: the supply of and demand for oil and natural gas services, energy infrastructure services and natural sand proppant; the level of construction of transmission lines, substations and distribution networks in the energy infrastructure industry and the level of expenditures of utility companies; the level of prices of, and expectations about future prices for, oil and natural gas and natural sand proppant, as well as energy infrastructure services; the cost of exploring for, developing, producing and delivering oil and natural gas; the expected rates of declining current production; the discovery rates of new oil and natural gas reserves and frac sand reserves meeting industry specifications and consisting of the mesh size in demand; access to pipeline, transloading and other transportation facilities and their capacity; weather conditions; domestic and worldwide economic conditions; political instability in oil-producing countries; environmental regulations; technical advances affecting energy consumption; the price and availability of alternative fuels; the ability of oil and natural gas producers and other users of our services to raise equity capital and debt financing; and merger and divestiture activity in industries in which we operate.
The level of activity in the U.S. oil and natural gas exploration and production, energy infrastructure and natural sand proppant industries is volatile. Expected trends may not continue and demand for our products and services may not reflect the level of activity in these industries. Any prolonged substantial reduction in pricing environment would likely affect demand for our services. A material decline in pricing levels or U.S. activity levels could have a material adverse effect on our business, financial condition, results of operations and cash flows.
Interest Rate Risk
We had a cash and cash equivalents balance of
$68 million
at
December 31, 2018
. We do not enter into investments for trading or speculative purposes. We do not believe that we have any material exposure to changes in the fair value of these investments as a result of changes in interest rates. Declines in interest rates, however, will reduce future income.
Interest under our credit facility is payable at a base rate plus an applicable margin. Additionally, at our request, outstanding balances are permitted to be converted to LIBOR rate plus applicable margin tranches. The applicable margin for either the base rate or the LIBOR rate option can vary from 1.5% to 3.0%, based upon a calculation of the excess availability of the line as a percentage of the maximum credit limit. At
December 31, 2018
, we had no outstanding borrowings under our revolving credit facility. As of July 31, 2018, the last day on which we had any material outstanding borrowings under our revolving credit facility, a 1% increase or decrease in the interest rate would have increased or decreased our interest expense by approximately $0.1 million per year, based on $6 million outstanding and a weighted average interest rate of 6.5%. We do not currently hedge our interest rate exposure.
Foreign Currency Risk
Our energy services business generates revenue and incurs expenses that are denominated in the Canadian dollar. These transactions could be materially affected by currency fluctuations. Changes in currency exchange rates could adversely affect our consolidated results of operations or financial position. We also maintain cash balances denominated in the Canadian dollar. At
December 31, 2018
, we had
$2 million
of cash in Canadian accounts. A 10% increase in the strength of the Canadian dollar versus the U.S. dollar would have resulted in a decrease in pre-tax income of approximately
$0.2 million
as of
December 31, 2018
. Conversely, a corresponding decrease in the strength of the Canadian dollar would have resulted in a comparable increase in pre-tax income. We have not hedged our exposure to changes in foreign currency exchange rates and, as a result, could incur unanticipated translation gains and losses.
Seasonality
We provide completion and production services as well as contract land and drilling services primarily in the Utica, Permian Basin, Eagle Ford, Marcellus, Granite Wash, Cana Woodford and Cleveland sand resource plays located in the continental U.S. We provide infrastructure services in the northeast, southwest and midwest portions of the United States and in Puerto Rico. We provide remote accommodation services in the oil sands in Alberta, Canada. We serve these markets through our facilities and service centers that are strategically located to serve our customers in Ohio, Texas, Oklahoma, Wisconsin, Minnesota, Kentucky, Puerto Rico and Alberta, Canada. For the years ended
December 31, 2018
,
2017
and
2016
, we generated approximately
17%
,
42%
and 84%, respectively, of our revenue from our operations in Ohio, Wisconsin, Minnesota, North Dakota, Pennsylvania, West Virginia and Canada where weather conditions may be severe. As a result, our operations may be limited or disrupted, particularly during winter and spring months, in these geographic regions, which would have a material
82
adverse effect on our financial condition and results of operations. Our operations in Oklahoma and Texas are generally not affected by seasonal weather conditions.
Inflation
Inflation in the United States has been relatively low in recent years and did not have a material impact on our results of operations for the years ended
December 31, 2018
,
2017
or
2016
. Although the impact of inflation has been insignificant in recent years, it is still a factor in the United States economy and we tend to experience inflationary pressure on the cost of oilfield services and equipment as increasing oil and gas prices increase drilling activity in our areas of operations.
Item 8. Financial Statements and Supplementary Data
The information required by this item appears beginning on page F-1 following the signature pages of this report.
Item 9. Changes in and Disagreements with Accountants on Accounting and Financial Disclosure
Not applicable.
Item 9A. Controls and Procedures
Evaluation of Disclosure Control and Procedures
Under the direction of our Chief Executive Officer and Chief Financial Officer, we have established disclosure controls and procedures, as defined in Rule 13a-15(e) and 15d-15(e) under the Exchange Act, that are designed to ensure that information required to be disclosed by us in the reports that we file or submit under the Exchange Act is recorded, processed, summarized and reported within the time periods specified in the SEC’s rules and forms. The disclosure controls and procedures are also intended to ensure that such information is accumulated and communicated to management, including our Chief Executive Officer and Chief Financial Officer, as appropriate to allow timely decisions regarding required disclosures. In designing and evaluating the disclosure controls and procedures, management recognizes that any controls and procedures, no matter how well designed and operated, can provide only reasonable assurance of achieving the desired control objectives. In addition, the design of disclosure controls and procedures must reflect the fact that there are resource constraints and that management is required to apply judgment in evaluating the benefits of possible controls and procedures relative to their costs.
As of
December 31, 2018
, an evaluation was performed under the supervision and with the participation of management, including our Chief Executive Officer and Chief Financial Officer, of the effectiveness of the design and operation of our disclosure controls and procedures pursuant to Rule 13a-15(b) under the Exchange Act. Based upon our evaluation, our Chief Executive Officer and Chief Financial Officer have concluded that as of
December 31, 2018
, our disclosure controls and procedures are effective.
C
hanges in Internal Controls Over Financial Reporting
There was no change in our internal control over financial reporting (as defined in Rules 13a-15(d) and 15d-15(d) under the Exchange Act) that occurred during the quarter ended
December 31, 2018
that has materially affected, or is reasonably likely to materially affect, our internal control over financial reporting.
Management’s Annual Report on Internal Control Over Financial Reporting and Attestation Report of the Registered Public Accounting Firm
Our management is responsible for establishing and maintaining adequate internal control over financial reporting as defined in Rule 13a-15(f) and 15d-15(f) under the Securities Exchange Act of 1934, as amended. Our internal control over financial reporting is a process designed under the supervision of the Company’s Chief Executive Officer and Chief Financial Officer to provide reasonable assurance regarding the reliability of financial reporting and the preparation of our financial statements for external purposes in accordance with generally accepted accounting principles.
As of
December 31, 2018
, management conducted an evaluation of the effectiveness of our internal control over financial reporting based on the framework in the 2013 Internal Control-Integrated Framework issued by the Committee of Sponsoring Organizations of the Treadway Commission. Based on its evaluation, management did not identify any material weaknesses in our internal control over financial reporting and determined that we maintained effective internal control over financial reporting as of
December 31, 2018
.
83
Because of its inherent limitations, internal control over financial reporting may not prevent or detect misstatements. Also, projections of any evaluation of effectiveness to future periods are subject to the risk that controls may become inadequate because of changes in conditions, or that the degree of compliance with the policies or procedures may deteriorate.
Grant Thornton LLP, the independent registered public accounting firm that audited our financial statements for the year ended
December 31, 2018
included with this Annual Report on Form 10-K, has also audited the effectiveness of our internal control over financial reporting as of
December 31, 2018
, as stated in their accompanying report.
84
Report of Independent Registered Public Accounting Firm
Board of Directors and Shareholders
Mammoth Energy Services, Inc.
Opinion on internal control over financial reporting
We have audited the internal control over financial reporting of Mammoth Energy Services, Inc. (a Delaware corporation) and subsidiaries (the “Company”) as of December 31, 2018, based on criteria established in the 2013 Internal Control-Integrated Framework issued by the Committee of Sponsoring Organizations of the Treadway Commission (“COSO”). In our opinion, the Company maintained, in all material respects, effective internal control over financial reporting as of December 31, 2018, based on criteria established in the 2013 Internal Control-Integrated Framework issued by COSO.
We also have audited, in accordance with the standards of the Public Company Accounting Oversight Board (United States) (“PCAOB”), the consolidated financial statements of the Company as of and for the year ended December 31, 2018, and our report dated March 15, 2019 expressed an unqualified opinion on those financial statements.
Basis for opinion
The Company’s management is responsible for maintaining effective internal control over financial reporting and for its assessment of the effectiveness of internal control over financial reporting, included in the accompanying Management’s Annual Report on Internal Control Over Financial Reporting. Our responsibility is to express an opinion on the Company’s internal control over financial reporting based on our audit. We are a public accounting firm registered with the PCAOB and are required to be independent with respect to the Company in accordance with the U.S. federal securities laws and the applicable rules and regulations of the Securities and Exchange Commission and the PCAOB.
We conducted our audit in accordance with the standards of the PCAOB. Those standards require that we plan and perform the audit to obtain reasonable assurance about whether effective internal control over financial reporting was maintained in all material respects. Our audit included obtaining an understanding of internal control over financial reporting, assessing the risk that a material weakness exists, testing and evaluating the design and operating effectiveness of internal control based on the assessed risk, and performing such other procedures as we considered necessary in the circumstances. We believe that our audit provides a reasonable basis for our opinion.
Definition and limitations of internal control over financial reporting
A company’s internal control over financial reporting is a process designed to provide reasonable assurance regarding the reliability of financial reporting and the preparation of financial statements for external purposes in accordance with generally accepted accounting principles. A company’s internal control over financial reporting includes those policies and procedures that (1) pertain to the maintenance of records that, in reasonable detail, accurately and fairly reflect the transactions and dispositions of the assets of the company; (2) provide reasonable assurance that transactions are recorded as necessary to permit preparation of financial statements in accordance with generally accepted accounting principles, and that receipts and expenditures of the company are being made only in accordance with authorizations of management and directors of the company; and (3) provide reasonable assurance regarding prevention or timely detection of unauthorized acquisition, use, or disposition of the company’s assets that could have a material effect on the financial statements.
Because of its inherent limitations, internal control over financial reporting may not prevent or detect misstatements. Also, projections of any evaluation of effectiveness to future periods are subject to the risk that controls may become inadequate because of changes in conditions, or that the degree of compliance with the policies or procedures may deteriorate.
/s/ GRANT THORNTON LLP
Oklahoma City, Oklahoma
March 15, 2019
85
Item 9B. Other Information
Not applicable.
86
PART III.
Item 10. Directors, Executive Officers and Corporate Governance
Information required by Item 10 of Part III is incorporated herein by reference to the definitive Proxy Statement to be filed by us pursuant to Regulation 14A of the General Rules and Regulations under the Securities Exchange Act of 1934 within 120 days after the close of the year ended December 31, 2018.
We have adopted a Code of Business Conduct and Ethics that applies to directors and employees, including the Chief Executive Officer, the Chief Financial Officer, controller and persons performing similar functions. The Code of Business Conduct and Ethics is posted on our website at http://ir.mammothenergy.com/corporate-governance.cfm. We intend to satisfy the disclosure requirements under Item 5.05 of Form 8-K regarding an amendment to, or waiver from, a provision of the Code of Business Conduct and Ethics by posting such information on our website at the address specified above.
Item 11. Executive Compensation
The information required by Item 11 of Part III is incorporated by reference to our definitive Proxy Statement within 120 days after the close of the year ended December 31, 2018.
Item 12. Security Ownership of Certain Beneficial Owners and Management and Related Stockholder Matters
The information required by Item 12 of Part III is incorporated by reference to our definitive Proxy Statement within 120 days after the close of the year ended December 31, 2018.
Item 13. Certain Relationships and Related Transactions and Director Independence
The information required by Item 13 of Part III is incorporated by reference to our definitive Proxy Statement within 120 days after the close of the year ended December 31, 2018.
Item 14. Principal Accountant Fees and Services
The information required by Item 14 of Part III is incorporated by reference to our definitive Proxy Statement within 120 days after the close of the year ended December 31, 2018.
87
PART IV.
Item 15. Exhibits, Financial Statement Schedules
The following documents are filed as part of this report or incorporated by reference herein:
(1)
Financial Statements
|
|
|
Page
|
|
Financial Statements
|
||
(2)
Financial Statement Schedules
All financial statement schedules have been omitted because they are not applicable or the required disclosure is presented in the financial statements or notes thereto.
(3)
Exhibits
|
Exhibit Number
|
|
Exhibit Description
|
||
|
2.1#
|
Amended and Restated Contribution Agreement by and among MEH Sub LLC, Gulfport Energy Corporation, Rhino Exploration LLC, Mammoth Energy Partners LLC and Mammoth Energy Services, Inc. dated as of May 12, 2017 (incorporated by reference to Exhibit A-1 to the Company’s Definitive Schedule 14C, filed with the SEC on May 15, 2017).
|
|||
|
2.2#
|
Amended and Restated Contribution Agreement by and among MEH Sub LLC, Gulfport Energy Corporation, Mammoth Energy Partners LLC and Mammoth Energy Services, Inc. dated as of May 12, 2017 (incorporated by reference to Exhibit A-2 to the Company’s Definitive Schedule 14C, filed with the SEC on May 15, 2017).
|
|||
|
2.3#
|
Amended and Restated Contribution Agreement by and among MEH Sub LLC, Gulfport Energy Corporation, Mammoth Energy Partners LLC and Mammoth Energy Services, Inc. dated as of May 12, 2017 (incorporated by reference to Exhibit A-3 to the Company’s Definitive Schedule 14C, filed with the SEC on May 15, 2017).
|
|||
|
2.4#
|
Purchase and Sale Agreement, dated as of March 27, 2017, by and between Mammoth Energy Services, Inc., as purchaser, and Chieftain Sand and Proppant, LLC and Chieftain Sand and Proppant Barron, LLC, as sellers (incorporated by reference to Exhibit 2.1 to the Company’s Current Report on Form 8-K (File No. 001-37917), filed with the SEC on May 15, 2017).
|
|||
|
|
||||
|
|
||||
|
|
||||
|
|
||||
|
|
||||
|
|
||||
|
|
||||
|
|
||||
|
|
||||
|
|
||||
88
|
|
||||
|
|
||||
|
|
||||
|
|
||||
|
|
||||
|
|
||||
|
|
||||
|
|
||||
|
|
||||
|
|
||||
|
|
||||
|
|
||||
|
|
||||
|
|
||||
|
|
||||
89
|
|
||||
|
|
||||
|
|
||||
|
|
||||
|
|
||||
|
101.INS*
|
|
XBRL Instance Document.
|
||
|
101.SCH*
|
|
XBRL Taxonomy Extension Schema Document.
|
||
|
101.CAL*
|
|
XBRL Taxonomy Extension Calculation Linkbase Document.
|
||
|
101.DEF*
|
|
XBRL Taxonomy Extension Definition Linkbase Document.
|
||
|
101.LAB*
|
|
XBRL Taxonomy Extension Labels Linkbase Document.
|
||
|
101.PRE*
|
|
XBRL Taxonomy Extension Presentation Linkbase Document.
|
||
|
*
|
Filed herewith.
|
|||
|
**
|
Furnished herewith, not filed.
|
|||
|
+
|
Management contract, compensatory plan or arrangement.
|
|||
|
#
|
The schedules (or similar attachments) referenced in this agreement have been omitted in accordance with Item 601(b)(2) of Regulation S-K. A copy of any omitted schedule (or similar attachment) will be furnished supplementally to the Securities and Exchange Commission.
|
|||
|
##
|
Confidential treatment with respect to certain portions of this agreement was granted by the SEC which portions have been omitted and filed separately with the SEC.
|
|||
Item 16. Form 10-K Summary
None.
90
Signatures
Pursuant to the requirements of the Securities Exchange Act of 1934, the registrant has duly caused this report to be signed on its behalf by the undersigned thereunto duly authorized.
|
MAMMOTH ENERGY SERVICES, INC.
|
|||||
|
Date:
|
March 15, 2019
|
By:
|
/s/ Mark Layton
|
||
|
Mark Layton
|
|||||
|
Chief Financial Officer
|
|||||
Pursuant to the requirements of the Securities and Exchange Act of 1934, this report has been signed below by the following persons on behalf of the Registrant and in the capacities and on the dates indicated.
|
Signature
|
Title
|
Date
|
|
/s/ Arty Straehla
|
Chief Executive Officer (principal executive officer) and Director
|
March 15, 2019
|
|
Arty Straehla
|
||
|
/s/ Mark Layton
|
Chief Financial Officer (principal financial and accounting officer)
|
March 15, 2019
|
|
Mark Layton
|
||
|
/s/ Marc McCarthy
|
Director (Chairman of the Board)
|
March 15, 2019
|
|
Marc McCarthy
|
||
|
/s/ Paul K. Heerwagen IV
|
Director
|
March 15, 2019
|
|
Paul K. Heerwagen IV
|
||
|
/s/ Matthew Ross
|
Director
|
March 15, 2019
|
|
Matthew Ross
|
||
|
/s/ Arthur Smith
|
Director
|
March 15, 2019
|
|
Arthur Smith
|
||
|
/s/ James D. Palm
|
Director
|
March 15, 2019
|
|
James D. Palm
|
||
|
/s/ Arthur Amron
|
Director
|
March 15, 2019
|
|
Arthur Amron
|
||
91
Report of Independent Registered Public Accounting Firm
Board of Directors and Shareholders
Mammoth Energy Services, Inc.
Opinion on the financial statements
We have audited the accompanying consolidated balance sheets of Mammoth Energy Services Inc. (a Delaware corporation) and subsidiaries (the “Company”) as of December 31, 2018 and 2017, the related consolidated statements of comprehensive income (loss), changes in equity, and cash flows for each of the three years in the period ended December 31, 2018, and the related notes (collectively referred to as the “financial statements”). In our opinion, based on our audits and the report of the other auditors, the financial statements present fairly, in all material respects, the financial position of the Company as of December 31, 2018 and 2017, and the results of its operations and its cash flows for each of the three years in the period ended December 31, 2018, in conformity with accounting principles generally accepted in the United States of America.
We did not audit the financial statements of Sturgeon Acquisitions LLC, a wholly-owned subsidiary, which statements reflect total revenues of $27,473,025 of consolidated total revenues for the year ended December 31, 2016. Those statements were audited by other auditors whose report has been furnished to us, and our opinion, insofar as it relates to the amounts included for Sturgeon Acquisitions LLC, is based solely on the report of the other auditors.
We also have audited, in accordance with the standards of the Public Company Accounting Oversight Board (United States) (“PCAOB”), the Company’s internal control over financial reporting as of December 31, 2018, based on criteria established in the 2013 Internal Control-Integrated Framework issued by the Committee of Sponsoring Organizations of the Treadway Commission (“COSO”), and our report dated March 15, 2019 expressed an unqualified opinion.
Basis for opinion
These financial statements are the responsibility of the Company’s management. Our responsibility is to express an opinion on the Company’s financial statements based on our audits. We are a public accounting firm registered with the PCAOB and are required to be independent with respect to the Company in accordance with the U.S. federal securities laws and the applicable rules and regulations of the Securities and Exchange Commission and the PCAOB.
We conducted our audits in accordance with the standards of the PCAOB. Those standards require that we plan and perform the audit to obtain reasonable assurance about whether the financial statements are free of material misstatement, whether due to error or fraud. Our audits included performing procedures to assess the risks of material misstatement of the financial statements, whether due to error or fraud, and performing procedures that respond to those risks. Such procedures included examining, on a test basis, evidence supporting the amounts and disclosures in the financial statements. Our audits also included evaluating the accounting principles used and significant estimates made by management, as well as evaluating the overall presentation of the financial statements. We believe that our audits and the report of the other auditors provide a reasonable basis for our opinion.
/s/ GRANT THORNTON LLP
We have served as the Company’s auditor since 2012.
Oklahoma City, Oklahoma
March 15, 2019
F-1
Report of Independent Registered Public Accounting Firm
To the Management of Sturgeon Acquisitions LLC
In our opinion, the consolidated statements of net income, of cash flows, and of members’ equity (not presented herein) for the year ended December 31, 2016 present fairly, in all material respects, the results of operations and cash flows of Sturgeon Acquisitions LLC and its subsidiaries for the year ended December 31, 2016, in conformity with accounting principles generally accepted in the United States of America. These financial statements are the responsibility of the Company’s management. Our responsibility is to express an opinion on these financial statements based on our audit. We conducted our audit of these financial statements in accordance with the standards of the Public Company Accounting Oversight Board (United States). Those standards require that we plan and perform the audit to obtain reasonable assurance about whether the financial statements are free of material misstatement. An audit includes examining, on a test basis, evidence supporting the amounts and disclosures in the financial statements, assessing the accounting principles used and significant estimates made by management, and evaluating the overall financial statement presentation. We believe that our audit provides a reasonable basis for our opinion.
/s/ PricewaterhouseCoopers LLP
Oklahoma City, Oklahoma
August 14, 2017
F-2
MAMMOTH ENERGY SERVICES, INC.
CONSOLIDATED BALANCE SHEETS
|
ASSETS
|
December 31,
|
|||||||
|
2018
|
2017
|
|||||||
|
CURRENT ASSETS
|
(in thousands)
|
|||||||
|
Cash and cash equivalents
|
$
|
67,625
|
|
$
|
5,637
|
|
||
|
Accounts receivable, net
|
337,460
|
|
243,746
|
|
||||
|
Receivables from related parties
|
11,164
|
|
33,788
|
|
||||
|
Inventories
|
21,302
|
|
17,814
|
|
||||
|
Prepaid expenses
|
11,317
|
|
12,552
|
|
||||
|
Other current assets
|
688
|
|
886
|
|
||||
|
Total current assets
|
449,556
|
|
314,423
|
|
||||
|
Property, plant and equipment, net
|
436,699
|
|
351,017
|
|
||||
|
Sand reserves
|
71,708
|
|
74,769
|
|
||||
|
Intangible assets, net - customer relationships
|
1,711
|
|
9,623
|
|
||||
|
Intangible assets, net - trade names
|
6,045
|
|
6,516
|
|
||||
|
Goodwill
|
101,245
|
|
99,811
|
|
||||
|
Deferred income tax asset
|
—
|
|
6,739
|
|
||||
|
Other non-current assets
|
6,127
|
|
4,345
|
|
||||
|
Total assets
|
$
|
1,073,091
|
|
$
|
867,243
|
|
||
|
LIABILITIES AND EQUITY
|
||||||||
|
CURRENT LIABILITIES
|
||||||||
|
Accounts payable
|
$
|
68,843
|
|
$
|
141,306
|
|
||
|
Payables to related parties
|
370
|
|
1,378
|
|
||||
|
Accrued expenses and other current liabilities
|
59,652
|
|
40,895
|
|
||||
|
Income taxes payable
|
104,958
|
|
36,409
|
|
||||
|
Total current liabilities
|
233,823
|
|
219,988
|
|
||||
|
Long-term debt
|
—
|
|
99,900
|
|
||||
|
Deferred income taxes
|
79,309
|
|
34,147
|
|
||||
|
Asset retirement obligations
|
3,164
|
|
2,123
|
|
||||
|
Other liabilities
|
2,743
|
|
3,289
|
|
||||
|
Total liabilities
|
319,039
|
|
359,447
|
|
||||
|
COMMITMENTS AND CONTINGENCIES (Note 20)
|
|
|
||||||
|
EQUITY
|
||||||||
|
Equity:
|
||||||||
|
Common stock, $0.01 par value, 200,000,000 shares authorized, 44,876,649 and 44,589,306 issued and outstanding at December 31, 2018 and 2017
|
449
|
|
446
|
|
||||
|
Additional paid in capital
|
530,919
|
|
508,010
|
|
||||
|
Retained earnings
|
226,765
|
|
2,001
|
|
||||
|
Accumulated other comprehensive loss
|
(4,081
|
)
|
(2,661
|
)
|
||||
|
Total equity
|
754,052
|
|
507,796
|
|
||||
|
Total liabilities and equity
|
$
|
1,073,091
|
|
$
|
867,243
|
|
||
The accompanying notes are an integral part of these consolidated financial statements.
F-3
MAMMOTH ENERGY SERVICES, INC.
CONSOLIDATED STATEMENTS OF COMPREHENSIVE INCOME (LOSS)
|
Years Ended December 31,
|
|||||||||||
|
2018
|
2017
(a)
|
2016
(b)
|
|||||||||
|
REVENUE
|
(in thousands, except per share amounts)
|
||||||||||
|
Services revenue
|
$
|
1,471,085
|
|
$
|
435,409
|
|
$
|
89,643
|
|
||
|
Services revenue - related parties
|
118,183
|
|
166,064
|
|
107,147
|
|
|||||
|
Product revenue
|
75,766
|
|
47,067
|
|
8,052
|
|
|||||
|
Product revenue - related parties
|
25,050
|
|
42,956
|
|
25,783
|
|
|||||
|
Total revenue
|
1,690,084
|
|
691,496
|
|
230,625
|
|
|||||
|
COST AND EXPENSES
|
|||||||||||
|
Services cost of revenue (exclusive of depreciation and amortization of $106,282, $82,686 and $65,705, respectively, for 2018, 2017 and 2016)
|
961,205
|
|
390,112
|
|
140,063
|
|
|||||
|
Services cost of revenue - related parties (exclusive of depreciation and amortization of $0, $0 and $0, respectively, for 2018, 2017 and 2016)
|
5,885
|
|
1,408
|
|
1,063
|
|
|||||
|
Product cost of revenue (exclusive of depreciation, depletion, amortization and accretion of $13,512, $9,389 and $6,477, respectively, for 2018, 2017 and 2016)
|
126,714
|
|
91,049
|
|
31,892
|
|
|||||
|
Product cost of revenue - related parties (exclusive of depreciation, depletion, amortization and accretion of $0, $0 and $0, respectively, for 2018, 2017 and 2016)
|
—
|
|
—
|
|
3
|
|
|||||
|
Selling, general and administrative
|
71,199
|
|
48,405
|
|
17,290
|
|
|||||
|
Selling, general and administrative - related parties
|
1,898
|
|
1,481
|
|
758
|
|
|||||
|
Depreciation, depletion, amortization and accretion
|
119,877
|
|
92,124
|
|
72,315
|
|
|||||
|
Impairment of long-lived assets
|
8,855
|
|
4,146
|
|
1,871
|
|
|||||
|
Total cost and expenses
|
1,295,633
|
|
628,725
|
|
265,255
|
|
|||||
|
Operating income (loss)
|
394,451
|
|
62,771
|
|
(34,630
|
)
|
|||||
|
OTHER (EXPENSE) INCOME
|
|||||||||||
|
Interest expense, net
|
(3,187
|
)
|
(4,310
|
)
|
(4,096
|
)
|
|||||
|
Bargain purchase gain
|
—
|
|
4,012
|
|
—
|
|
|||||
|
Other, net
|
(2,036
|
)
|
(677
|
)
|
158
|
|
|||||
|
Total other expense
|
(5,223
|
)
|
(975
|
)
|
(3,938
|
)
|
|||||
|
Income (loss) before income taxes
|
389,228
|
|
61,796
|
|
(38,568
|
)
|
|||||
|
Provision for income taxes
|
153,263
|
|
2,832
|
|
53,885
|
|
|||||
|
Net income (loss)
|
$
|
235,965
|
|
$
|
58,964
|
|
$
|
(92,453
|
)
|
||
|
OTHER COMPREHENSIVE INCOME (LOSS)
|
|||||||||||
|
Foreign currency translation adjustment, net of tax of $397, $645 and $1,732, respectively, for 2018, 2017 and 2016
|
(1,420
|
)
|
555
|
|
2,711
|
|
|||||
|
Comprehensive income (loss)
|
$
|
234,545
|
|
$
|
59,519
|
|
$
|
(89,742
|
)
|
||
|
Net income (loss) per share (basic) (Note 16)
|
$
|
5.27
|
|
$
|
1.42
|
|
$
|
(2.94
|
)
|
||
|
Net income (loss) per share (diluted) (Note 16)
|
$
|
5.24
|
|
$
|
1.42
|
|
$
|
(2.94
|
)
|
||
|
Weighted average number of shares outstanding (Note 16)
|
44,750
|
|
41,548
|
|
31,500
|
|
|||||
|
Weighted average number of shares outstanding, including dilutive effect (Note 16)
|
45,021
|
|
41,639
|
|
31,500
|
|
|||||
|
|
|
|
|||||||||
|
Pro Forma C Corporation Data (unaudited):
|
|
|
|||||||||
|
Net loss, as reported
|
$
|
(92,453
|
)
|
||||||||
|
Taxes on income earned as a non-taxable entity (Note 16)
|
|
15,224
|
|
||||||||
|
Taxes due to change to C corporation (Note 16)
|
|
53,089
|
|
||||||||
|
Pro forma net loss
|
|
$
|
(24,140
|
)
|
|||||||
|
Basic and Diluted (Note 16)
|
|
$
|
(0.56
|
)
|
|||||||
|
Weighted average pro forma shares outstanding—basic and diluted (Note 16)
|
|
43,107
|
|
||||||||
|
(a) Financial information includes the results attributable to Sturgeon for the entire period presented. See Note 4.
|
|||||||||||
|
(b) Financial information has been recast to include results attributable to Sturgeon. See Note 4.
|
|||||||||||
The accompanying notes are an integral part of these consolidated financial statements.
F-4
MAMMOTH ENERGY SERVICES, INC.
CONSOLIDATED STATEMENTS OF CHANGES IN EQUITY
|
Accumulated
|
|||||||||||||||||||||||
|
Retained
|
Additional
|
Other
|
|||||||||||||||||||||
|
Common Stock
|
Common
|
Members'
|
Earnings
|
Paid-In
|
Comprehensive
|
||||||||||||||||||
|
Shares
|
Amount
|
Partners
|
Equity
|
(Deficit)
|
Capital
|
Loss
|
Total
|
||||||||||||||||
|
(in thousands)
|
|||||||||||||||||||||||
|
Balance at January 1, 2016
(a)
|
—
|
|
$
|
—
|
|
$
|
329,090
|
|
$
|
90,784
|
|
$
|
—
|
|
$
|
—
|
|
$
|
(5,927
|
)
|
$
|
413,947
|
|
|
Net loss prior to LLC conversion
|
—
|
|
—
|
|
(32,085
|
)
|
—
|
|
—
|
|
—
|
|
—
|
|
(32,085
|
)
|
|||||||
|
Net loss of Sturgeon prior to acquisition
|
—
|
|
—
|
|
—
|
|
(4,045
|
)
|
—
|
|
—
|
|
—
|
|
(4,045
|
)
|
|||||||
|
Distributions
|
—
|
|
—
|
|
—
|
|
(5,000
|
)
|
—
|
|
—
|
|
—
|
|
(5,000
|
)
|
|||||||
|
Stock based compensation
|
—
|
|
—
|
|
(19
|
)
|
—
|
|
—
|
|
—
|
|
—
|
|
(19
|
)
|
|||||||
|
LLC Conversion (Note 1)
|
—
|
|
—
|
|
(296,986
|
)
|
—
|
|
—
|
|
296,986
|
|
—
|
|
—
|
|
|||||||
|
Issuance of common stock at public offering, net of offering costs
|
37,500
|
|
375
|
|
—
|
|
—
|
|
—
|
|
102,700
|
|
—
|
|
103,075
|
|
|||||||
|
Stock based compensation
|
—
|
|
—
|
|
—
|
|
—
|
|
—
|
|
520
|
|
—
|
|
520
|
|
|||||||
|
Net loss subsequent to LLC conversion
|
—
|
|
—
|
|
—
|
|
—
|
|
(56,323
|
)
|
—
|
|
—
|
|
(56,323
|
)
|
|||||||
|
Other comprehensive income
|
—
|
|
—
|
|
—
|
|
—
|
|
—
|
|
—
|
|
2,711
|
|
2,711
|
|
|||||||
|
Balance at December 31, 2016
(a)
|
37,500
|
|
$
|
375
|
|
$
|
—
|
|
$
|
81,739
|
|
$
|
(56,323
|
)
|
$
|
400,206
|
|
$
|
(3,216
|
)
|
$
|
422,781
|
|
|
Net income of Sturgeon prior to acquisition
|
—
|
|
—
|
|
—
|
|
640
|
|
—
|
|
—
|
|
—
|
|
640
|
|
|||||||
|
Stingray acquisition
|
1,393
|
|
14
|
|
—
|
|
—
|
|
—
|
|
25,748
|
|
—
|
|
25,762
|
|
|||||||
|
Sturgeon acquisition
|
5,607
|
|
56
|
|
—
|
|
(82,379
|
)
|
—
|
|
78,313
|
|
—
|
|
(4,010
|
)
|
|||||||
|
Stock based compensation
|
89
|
|
1
|
|
—
|
|
—
|
|
—
|
|
3,743
|
|
—
|
|
3,744
|
|
|||||||
|
Net income
|
—
|
|
—
|
|
—
|
|
—
|
|
58,324
|
|
—
|
|
—
|
|
58,324
|
|
|||||||
|
Other comprehensive income
|
—
|
|
—
|
|
—
|
|
—
|
|
—
|
|
—
|
|
555
|
|
555
|
|
|||||||
|
Balance at December 31, 2017
|
44,589
|
$
|
446
|
|
$
|
—
|
|
$
|
—
|
|
$
|
2,001
|
|
$
|
508,010
|
|
$
|
(2,661
|
)
|
$
|
507,796
|
|
|
|
Equity based compensation (Note 17)
|
—
|
|
—
|
|
—
|
|
—
|
|
—
|
|
17,487
|
|
—
|
|
17,487
|
|
|||||||
|
Stock based compensation
|
288
|
|
3
|
|
—
|
|
—
|
|
—
|
|
5,422
|
|
—
|
|
5,425
|
|
|||||||
|
Net income
|
—
|
|
—
|
|
—
|
|
—
|
|
235,965
|
|
—
|
|
—
|
|
235,965
|
|
|||||||
|
Cash dividends declared ($0.25 per share)
|
—
|
|
—
|
|
—
|
|
—
|
|
(11,201
|
)
|
—
|
|
—
|
|
(11,201
|
)
|
|||||||
|
Other comprehensive loss
|
—
|
|
—
|
|
—
|
|
—
|
|
—
|
|
—
|
|
(1,420
|
)
|
(1,420
|
)
|
|||||||
|
Balance at December 31, 2018
|
44,877
|
$
|
449
|
|
$
|
—
|
|
$
|
—
|
|
$
|
226,765
|
|
$
|
530,919
|
|
$
|
(4,081
|
)
|
$
|
754,052
|
|
|
|
(a) Financial information has been recast to include the financial position and results attributable to Sturgeon. See Note 4.
|
|||||||||||||||||||||||
The accompanying notes are an integral part of these consolidated financial statements.
F-5
MAMMOTH ENERGY SERVICES, INC.
CONSOLIDATED STATEMENTS OF CASH FLOWS
|
Years Ended December 31,
|
|||||||||||
|
2018
|
2017
(a)
|
2016
(b)
|
|||||||||
|
Cash flows from operating activities
|
(in thousands)
|
||||||||||
|
Net income (loss)
|
$
|
235,965
|
|
$
|
58,964
|
|
$
|
(92,453
|
)
|
||
|
Adjustments to reconcile net income (loss) to cash provided by operating activities:
|
|||||||||||
|
Equity based compensation (Note 17)
|
17,487
|
|
—
|
|
—
|
|
|||||
|
Stock based compensation
|
5,425
|
|
3,741
|
|
501
|
|
|||||
|
Depreciation, depletion, amortization and accretion
|
119,877
|
|
92,124
|
|
72,315
|
|
|||||
|
Amortization of coil tubing strings
|
2,193
|
|
2,855
|
|
2,028
|
|
|||||
|
Amortization of debt origination costs
|
387
|
|
399
|
|
603
|
|
|||||
|
Bad debt expense (Note 2)
|
(14,578
|
)
|
16,206
|
|
1,968
|
|
|||||
|
Loss (gain) on disposal of property and equipment
|
947
|
|
69
|
|
(702
|
)
|
|||||
|
Gain on bargain purchase
|
—
|
|
(4,012
|
)
|
—
|
|
|||||
|
Impairment of long-lived assets
|
8,855
|
|
4,146
|
|
1,871
|
|
|||||
|
Deferred income taxes
|
52,226
|
|
(34,425
|
)
|
47,899
|
|
|||||
|
Loss from equity investee
|
16
|
|
—
|
|
—
|
|
|||||
|
Changes in assets and liabilities:
|
|||||||||||
|
Accounts receivable, net
|
(78,840
|
)
|
(231,751
|
)
|
(4,641
|
)
|
|||||
|
Receivables from related parties
|
22,624
|
|
(1,096
|
)
|
(2,462
|
)
|
|||||
|
Inventories
|
(5,502
|
)
|
(14,238
|
)
|
(624
|
)
|
|||||
|
Prepaid expenses and other assets
|
1,423
|
|
(7,628
|
)
|
(198
|
)
|
|||||
|
Accounts payable
|
(64,966
|
)
|
101,725
|
|
1,412
|
|
|||||
|
Payables to related parties
|
(1,008
|
)
|
1,174
|
|
(249
|
)
|
|||||
|
Accrued expenses and other liabilities
|
15,445
|
|
32,968
|
|
2,420
|
|
|||||
|
Income taxes payable
|
68,692
|
|
36,395
|
|
1
|
|
|||||
|
Net cash provided by operating activities
|
386,668
|
|
57,616
|
|
29,689
|
|
|||||
|
Cash flows from investing activities:
|
|||||||||||
|
Purchases of property and equipment
|
(187,285
|
)
|
(132,295
|
)
|
(11,740
|
)
|
|||||
|
Purchases of property and equipment from related parties
|
(4,658
|
)
|
(1,558
|
)
|
—
|
|
|||||
|
Business acquisitions, net
|
(20,824
|
)
|
(42,008
|
)
|
—
|
|
|||||
|
Contributions to equity investee
|
(702
|
)
|
—
|
|
—
|
|
|||||
|
Proceeds from disposal of property and equipment
|
1,514
|
|
907
|
|
4,022
|
|
|||||
|
Business combination cash acquired (Note 4)
|
—
|
|
2,671
|
|
—
|
|
|||||
|
Net cash used in investing activities
|
(211,955
|
)
|
(172,283
|
)
|
(7,718
|
)
|
|||||
|
Cash flows from financing activities:
|
|||||||||||
|
Borrowings on long-term debt
|
77,000
|
|
156,850
|
|
28,734
|
|
|||||
|
Repayments of long-term debt
|
(176,900
|
)
|
(56,950
|
)
|
(123,734
|
)
|
|||||
|
Dividends paid
|
(11,201
|
)
|
—
|
|
—
|
|
|||||
|
Repayments of equipment financing note
|
(292
|
)
|
—
|
|
—
|
|
|||||
|
Proceeds from initial public offering
|
—
|
|
—
|
|
105,839
|
|
|||||
|
Initial public offering costs
|
—
|
|
—
|
|
(2,764
|
)
|
|||||
|
Debt issuance costs
|
(1,199
|
)
|
—
|
|
—
|
|
|||||
|
Repayment of acquisition-related long-term debt
|
—
|
|
(8,851
|
)
|
—
|
|
|||||
|
Capital distributions
|
—
|
|
—
|
|
(5,000
|
)
|
|||||
|
Net cash (used in) provided by financing activities
|
(112,592
|
)
|
91,049
|
|
3,075
|
|
|||||
|
Effect of foreign exchange rate on cash
|
(133
|
)
|
16
|
|
154
|
|
|||||
|
Net increase (decrease) in cash and cash equivalents
|
61,988
|
|
(23,602
|
)
|
25,200
|
|
|||||
|
Cash and cash equivalents at beginning of period
|
5,637
|
|
29,239
|
|
4,039
|
|
|||||
|
Cash and cash equivalents at end of period
|
$
|
67,625
|
|
$
|
5,637
|
|
$
|
29,239
|
|
||
F-6
MAMMOTH ENERGY SERVICES, INC.
CONSOLIDATED STATEMENTS OF CASH FLOWS
|
Years Ended December 31,
|
|||||||||||
|
2018
|
2017
(a)
|
2016
(b)
|
|||||||||
|
Supplemental disclosure of cash flow information:
|
(in thousands)
|
||||||||||
|
Cash paid for interest
|
$
|
3,212
|
|
$
|
3,656
|
|
$
|
3,707
|
|
||
|
Cash paid for income taxes
|
$
|
32,757
|
|
$
|
840
|
|
$
|
3,588
|
|
||
|
Supplemental disclosure of non-cash transactions:
|
|||||||||||
|
Acquisition of Stingray Cementing LLC and Stingray Energy Services LLC
|
$
|
—
|
|
$
|
23,091
|
|
$
|
—
|
|
||
|
Purchases of property and equipment included in accounts payable
|
$
|
11,908
|
|
$
|
15,038
|
|
$
|
2,789
|
|
||
|
(a) Financial information includes the results attributable to Sturgeon for the entire period presented. See Note 4.
|
|||||||||||
|
(b) Financial information has been recast to include results attributable to Sturgeon. See Note 4.
|
|||||||||||
The accompanying notes are an integral part of these consolidated financial statements.
F-7
MAMMOTH ENERGY SERVICES, INC.
NOTES TO CONSOLIDATED FINANCIAL STATEMENTS
|
1.
|
Organization and Basis of Presentation
|
The accompanying consolidated financial statements were prepared in accordance with the rules and regulations of the Securities and Exchange Commission, and reflect all adjustments, which in the opinion of management are necessary for the fair presentation of the results.
Mammoth Energy Services, Inc. ("Mammoth Inc." or the "Company"), together with its subsidiaries, is an integrated, growth-oriented company serving both the oil and gas and the electric utility industries in North America and US territories. Mammoth's infrastructure division provides construction, upgrade, maintenance and repair services to various public and private owned utilities throughout the US and Puerto Rico. Its oilfield services division provides a diversified set of services to the exploration and production industry including pressure pumping and natural sand and proppant services as well as contract land and directional drilling, coil tubing, flowback, cementing, acidizing, equipment rental, crude oil hauling and remote accommodation services. The Company was incorporated in Delaware in June 2016 as a wholly-owned subsidiary of Mammoth Energy Partners, LP, a Delaware partnership (the "Partnership" or the "Predecessor"). The Partnership was originally formed by Wexford Capital LP (“Wexford”) in February 2014 as a holding company under the name Redback Energy Services Inc. and was converted to a Delaware limited partnership in August 2014. On November 24, 2014, Mammoth Energy Holdings, LLC (“Mammoth Holdings,” an entity controlled by Wexford), Gulfport Energy Corporation (“Gulfport”) and Rhino Resource Partners LP (“Rhino”) (collectively known as “Predecessor Interest”) contributed their interest in certain of the entities presented below to the Partnership in exchange for
20 million
limited partner units. Mammoth Energy Partners GP, LLC (the “General Partner”) held a non-economic general partner interest in the Partnership.
The following companies (“Operating Entities”) are included in these consolidated financial statements: Bison Drilling and Field Services, LLC (“Bison Drilling”), formed November 15, 2010; Bison Trucking LLC (“Bison Trucking”), formed August 9, 2013; White Wing Tubular Services LLC (“White Wing”), formed July 29, 2014; Barracuda Logistics LLC (“Barracuda”), formed October 24, 2014; Mr. Inspections LLC (“MRI”), formed January 25, 2015; Panther Drilling Systems LLC (“Panther”), formed December 11, 2012; Redback Energy Services, LLC (“Redback Energy”), formed October 6, 2011; Redback Coil Tubing, LLC (“Coil Tubing”), formed May 15, 2012; Redback Pump Down Services LLC (“Pump Down”), formed January 16, 2015; Muskie Proppant LLC (“Muskie”), formed September 14, 2011; Stingray Pressure Pumping LLC (“Pressure Pumping”), acquired November 24, 2014; Silverback Energy LLC (“Silverback”), formerly known as Stingray Logistics LLC, acquired November 24, 2014; Great White Sand Tiger Lodging Ltd. (“Sand Tiger”), formed October 1, 2007; WTL Oil LLC (“WTL”), formerly known as Silverback Energy Services LLC, formed June 8, 2016; Mammoth Equipment Leasing LLC, formed on November 14, 2016; Cobra Acquisitions LLC (“Cobra”), formed January 9, 2017; Cobra Energy LLC (“Cobra Energy”), formed January 25, 2017; Mako Acquisitions LLC (“Mako”), formed March 28, 2017; Piranha Proppant LLC (“Piranha”), formed March 28, 2017; Higher Power Electrical LLC (“Higher Power”), acquired April 21, 2017; Stingray Energy Services LLC (“SR Energy”), acquired June 5, 2017; Stingray Cementing LLC (“Cementing”), acquired June 5, 2017; Sturgeon Acquisitions LLC (“Sturgeon”), acquired June 5, 2017; Taylor Frac, LLC (“Taylor Frac”), acquired June 5, 2017; Taylor Real Estate Investments, LLC (“Taylor RE”), acquired June 5, 2017; South River Road, LLC (“South River”), acquired June 5, 2017; 5 Star Electric, LLC (“5 Star”), acquired July 1, 2017; Tiger Shark Logistics LLC (“Tiger Shark”), formed October 20, 2017; Cobra Aviation Services LLC (“Cobra Aviation”), formed January 2, 2018; Bison Sand Logistics LLC (“Bison Sand”), formed January 8, 2018; Dire Wolf Energy Services LLC (“Dire Wolf”), formed January 8, 2018; Cobra Logistics Holdings LLC (“Cobra Logistics”), formed February 13, 2018; Black Mamba Energy LLC (“Black Mamba”), formed March 28, 2018; RTS Energy Services LLC (“RTS”), acquired June 15, 2018; Aquahawk Energy LLC (“Aquahawk”), formed June 28, 2018; Ivory Freight Solutions LLC (“Ivory Freight”), formed July 26, 2018; Cobra Caribbean LLC (“Cobra Caribbean”), formed October 3, 2018; Python Equipment LLC (“Python”), formed December 5, 2018; and Air Rescue Systems LLC (“ARS”), acquired December 21, 2018.
On October 12, 2016, the Partnership was converted into a Delaware limited liability company named Mammoth Energy Partners LLC (“Mammoth LLC”), and then Mammoth Holdings, Gulfport and Rhino, as all the members of Mammoth LLC, contributed their member interests in Mammoth LLC to Mammoth Inc. Prior to the conversion and the contribution, Mammoth Inc. was a wholly-owned subsidiary of the Partnership. Following the conversion and the contribution, Mammoth LLC (as the converted successor to the Partnership) was a wholly-owned subsidiary of Mammoth Inc. Mammoth Inc. did not conduct any material business operations until Mammoth LLC was contributed to it. On October 19, 2016, Mammoth Inc. closed its initial public offering of
7,750,000
shares of common stock (the "IPO"), which included an aggregate of
250,000
shares that were offered by Mammoth Holdings, Gulfport and Rhino, at a price to the public of
$15.00
per share.
F-8
MAMMOTH ENERGY SERVICES, INC.
NOTES TO CONSOLIDATED FINANCIAL STATEMENTS
Net proceeds to Mammoth Inc. from its sale of
7,500,000
shares of common stock were approximately
$103.1 million
. On the closing date of the IPO, Mammoth Inc. repaid all outstanding borrowings under its revolving credit facility and used the remaining net proceeds for general corporate purposes, including the acquisition of additional equipment and complementary businesses that enhanced its existing service offerings, broadened its service offerings and expanded its customer relationships.
On June 5, 2017, the Company completed the acquisition of (1) Sturgeon, a Delaware limited liability company, which included the acquisition of Sturgeon's wholly-owned subsidiaries Taylor Frac, a Wisconsin limited liability company, Taylor RE, a Wisconsin limited liability company, and South River, a Wisconsin limited liability company, (2) SR Energy, a Delaware limited liability company; and (3) Cementing, a Delaware limited liability company (together with SR Energy, the “Stingray Acquisition”) in exchange for the issuance by Mammoth of an aggregate of
7,000,000
shares of its common stock. Prior to its acquisition of Sturgeon, the Company and Sturgeon were under common control and it is required under accounting principles generally accepted in the Unites States of America ("GAAP") to account for this common control acquisition in a manner similar to the pooling of interest method of accounting. Therefore, the Company's historical financial information for all periods included in the accompanying financial statements has been recast to combine Sturgeon with the Company as if the acquisition had been effective since the date Sturgeon commenced operations. Refer to Note 4 for additional disclosure regarding the acquisition of Sturgeon.
On June 29, 2018, Gulfport and MEH Sub LLC ("MEH Sub"), an entity controlled by Wexford, (collectively, the "Selling Stockholders") completed an underwritten secondary public offering of
4,000,000
shares of the Company’s common stock at a purchase price to the Selling Stockholders of
$38.01
per share. The Selling Stockholders granted the underwriters an option to purchase up to an aggregate of
600,000
additional shares of the Company's common stock at the same purchase price. This option was exercised, in part, and on July 30, 2018, the underwriters purchased an additional
385,000
shares of common stock from the Selling Stockholders at the same price per share. The Selling Stockholders received all proceeds from this offering.
At
December 31, 2018
and
December 31, 2017
, Wexford, Gulfport and Rhino beneficially owned the following shares of outstanding common stock of Mammoth Inc.:
|
December 31, 2018
|
December 31, 2017
|
||||||||||
|
Share Count
|
% Ownership
|
Share Count
|
% Ownership
|
||||||||
|
Wexford
|
21,988,473
|
|
49.0
|
%
|
25,009,319
|
|
56.1
|
%
|
|||
|
Gulfport
|
9,826,893
|
|
21.9
|
%
|
11,171,887
|
|
25.1
|
%
|
|||
|
Rhino
|
104,100
|
|
0.2
|
%
|
568,794
|
|
1.3
|
%
|
|||
|
Outstanding shares owned by related parties
|
31,919,466
|
|
71.1
|
%
|
36,750,000
|
|
82.5
|
%
|
|||
|
Total outstanding
|
44,876,649
|
|
100.0
|
%
|
44,589,306
|
|
100.0
|
%
|
|||
Operations
The Company's infrastructure services include electric utility contracting services focused on the repair, upgrade, maintenance and construction of transmission and distribution networks. The Company’s infrastructure services also provide storm repair and restoration services in response to natural disasters including hurricanes, ice or other storm-related damage. The Company's pressure pumping services include equipment and personnel used in connection with the completion and early production of oil and natural gas wells. The Company's natural sand proppant services include the distribution and production of natural sand proppant that is used primarily for hydraulic fracturing in the oil and gas industry. The Company also provides other services, including contract land and directional drilling, coil tubing, flowback, cementing, aciziding, equipment rentals, crude oil hauling and remote accommodations.
All of the Company’s operations are in North America and in the Caribbean. The Company operates its energy infrastructure services primarily in the northeast, southwest and midwest portions of the United States and in Puerto Rico. During the periods presented, the Company has operated its oil and natural gas businesses in the Permian Basin, the Utica Shale, the Eagle Ford Shale, the Marcellus Shale, the Granite Wash, the SCOOP, the STACK, the Cana-Woodford Shale, the Cleveland Sand and the oil sands located in Northern Alberta, Canada. The Company’s business depends on infrastructure spending on maintenance, upgrade, expansion and repair and restoration. Any prolonged decrease in
F-9
MAMMOTH ENERGY SERVICES, INC.
NOTES TO CONSOLIDATED FINANCIAL STATEMENTS
spending by electric utility companies or delays or reductions in government appropriations could have a material adverse effect on the Company’s results of operations and financial condition. The Company's oil and natural gas business depends in large part on the conditions in the oil and natural gas industry and, specifically, on the amount of capital spending by its customers. Any prolonged increase or decrease in oil and natural gas prices affects the levels of exploration, development and production activity, as well as the entire health of the oil and natural gas industry. Changes in the commodity prices for oil and natural gas could have a material effect on the Company’s results of operations and financial condition.
|
2.
|
Summary of Significant Accounting Policies
|
Principles of Consolidation
The accompanying consolidated financial statements are prepared in accordance with GAAP and include the accounts of the Company and its subsidiaries and the variable interest entity ("VIE") for which the Company is the primary beneficiary. All material intercompany accounts and transactions between the entities within the Company have been eliminated.
Variable Interest Entity
The Company consolidates a VIE when it is determined to be the primary beneficiary, which is the party that has both (i) the power to direct the activities that most significantly impact the VIE's economic performance and (ii) through its interests in the VIE, the obligation to absorb losses or the right to receive benefits from the VIE that could potentially be significant to the VIE. See Note 13 for more information on the Company's VIE.
Use of Estimates
The preparation of financial statements in conformity with GAAP requires management to make estimates and assumptions that affect the reported amounts of assets and liabilities, the disclosure of contingent assets and liabilities at the date of the financial statements, and the reported amounts of revenues and expenses during the reporting period. Actual results could differ from those estimates. Significant estimates include, but are not limited to, the Company's sand reserves and their impact on calculating depletion expense, allowance for doubtful accounts, asset retirement obligations, reserves for self-insurance, depreciation and amortization of property and equipment, business combination valuations, amortization of intangible assets and future cash flows, fair values used to assess recoverability and impairment of long-lived assets, including goodwill and estimates of income taxes.
Cash and Cash Equivalents
All highly liquid investments with an original maturity of three months or less are considered cash equivalents. The Company maintains its cash accounts in financial institutions that are insured by the Federal Deposit Insurance Corporation, with the exception of cash held by Sand Tiger in a Canadian financial institution. At
December 31, 2018
, we had
$1.9 million
, in Canadian dollars, of cash in Canadian accounts. Cash balances from time to time may exceed the insured amounts; however, the Company has not experienced any losses in such accounts and does not believe it is exposed to any significant credit risks on such accounts.
Accounts Receivable
Accounts receivable include amounts due from customers for services performed or goods sold. The Company grants credit to customers in the ordinary course of business and generally does not require collateral. Most areas in which the Company operates provide for a mineral lien or mechanic’s lien against the property on which the service is performed if the lien is filed within the statutorily specified time frame. Customer balances are generally considered delinquent if unpaid by the 30
th
day following the invoice date and credit privileges may be revoked if balances remain unpaid.
The Company regularly reviews receivables and provides for estimated losses through an allowance for doubtful accounts. In evaluating the level of established reserves, the Company makes judgments regarding its customers’ ability to make required payments, economic events and other factors. As the financial conditions of customers change, circumstances develop or additional information becomes available, adjustments to the allowance for doubtful accounts may be required. In the event the Company was to determine that a customer may not be able to make required payments, the Company would increase the allowance through a charge to income in the period in which that determination is made. If it is determined that previously reserved amounts are collectible, the Company would decrease the allowance through a credit to income in the period in which that determination is made. Uncollectible accounts receivable are periodically charged against the allowance for doubtful accounts once final determination is made of their uncollectability.
F-10
MAMMOTH ENERGY SERVICES, INC.
NOTES TO CONSOLIDATED FINANCIAL STATEMENTS
Following is a roll forward of the allowance for doubtful accounts for the years ended
December 31, 2018
,
2017
and
2016
(in thousands):
|
Balance, January 1, 2016
|
$
|
4,012
|
|
|
|
Additions charged to expense
|
1,968
|
|
||
|
Deductions for uncollectible receivables written off
|
(603
|
)
|
||
|
Balance, December 31, 2016
|
5,377
|
|
||
|
Additions charged to expense
|
16,206
|
|
||
|
Additions - other
|
179
|
|
||
|
Deductions for uncollectible receivables written off
|
(25
|
)
|
||
|
Balance, December 31, 2017
|
21,737
|
|
||
|
Additions charged to expense
|
(14,589
|
)
|
||
|
Deductions for uncollectible receivables written off
|
(1,950
|
)
|
||
|
Balance, December 31, 2018
|
$
|
5,198
|
|
|
In October 2017, Cobra, one of the Company's subsidiaries, entered into a contract with the Puerto Rico Electric Power Authority ("PREPA") to perform repairs to PREPA’s electrical grid as a result of Hurricane Maria. At December 31, 2017, the Company reviewed receivables due from PREPA and made specific reserves consistent with Company policy which resulted in additions to allowance for doubtful accounts totaling
$16.0 million
. During the year ended
December 31, 2018
, the Company received payment from PREPA for the amount reserved at December 31, 2017. As a result, the Company reversed the 2017 additions to the allowance for doubtful accounts from PREPA.
Additionally, the Company has made specific reserves consistent with Company policy which resulted in additions to allowance for doubtful accounts totaling
$1.4 million
for the year ended
December 31, 2018
. The Company will continue to pursue collection until such time as final determination is made consistent with Company policy.
Inventory
Inventory consists of raw sand and processed sand available for sale, chemicals and other products sold as a bi-product of completion and production operations, and supplies used in performing services. Inventory is stated at the lower of cost or market (net realizable value) on an average cost basis. The Company assesses the valuation of its inventories based upon specific usage and future utility.
Inventory manufactured at the Company’s sand production facilities includes direct excavation costs, processing costs and overhead allocation. Stockpile tonnages are calculated by measuring the number of tons added and removed from the stockpile. Costs are calculated on a per ton basis and are applied to the stockpiles based on the number of tons in the stockpile. Inventory transported for sale at the Company’s terminal facility includes the cost of purchased or manufactured sand, plus transportation related charges.
Coil tubing strings of various widths, diameters and lengths are included in inventory. The strings are used in providing specialized services to customers who are primarily operators of oil or gas wells and are used at various rates based on factors such as well conditions (i.e. pressure and friction), vertical and horizontal length of the well, running speed of the string in the well and total running feet accumulated to the string. The Company obtains usage information from data acquisition software and other established assessment methods and attempts to amortize the strings over their estimated useful life. In no event will a string be amortized over a period longer than
12 months
. Amortization of coil strings is included in services cost of revenue in the Consolidated Statements of Comprehensive Income (Loss) and totaled
$2.2 million
,
$2.9 million
and
$2.0 million
for the years ended
December 31, 2018
,
2017
and
2016
, respectively.
Prepaid Expenses
Prepaid expenses primarily consist of insurance costs and rail car lease expense. These costs are expensed over the periods that they benefit.
Property and Equipment
Property and equipment, including renewals and betterments, are capitalized and stated at cost, while maintenance and repairs that do not increase the capacity, improve the efficiency or safety, or improve or extend the useful life are charged to operations as incurred. Disposals are removed at cost, less accumulated depreciation, and any resulting gain or loss is recorded in operations. Depreciation is calculated using the straight-line method over the shorter of the estimated useful life, or the remaining lease term, as applicable. Depreciation does not begin until property and equipment is placed in
F-11
MAMMOTH ENERGY SERVICES, INC.
NOTES TO CONSOLIDATED FINANCIAL STATEMENTS
service. Once placed in service, depreciation on property and equipment continues while being repaired, refurbished, or between periods of deployment.
Sand Reserves
Sand reserve costs include engineering, mineralogical studies and other related costs to develop the mine, the removal of overburden to initially expose the mineral and building access ways. Exploration costs are expensed as incurred and classified as product cost of revenue. Capitalization of mine development project costs begins once the deposit is classified as proven and probable reserves. Drilling and related costs are capitalized for deposits where proven and probable reserves exist and the activities are directed at obtaining additional information on the deposit or converting non-reserve minerals to proven and probable reserves and the benefit is to be realized over a period greater than one year. Mining property and development costs are amortized using the units-of-production method on estimated measured tons in in-place reserves. The impact of revisions to reserve estimates is recognized on a prospective basis.
Long-Lived Assets
The Company reviews long-lived assets for recoverability in accordance with the provisions of Financial Accounting Standards Board ("FASB") Accounting Standard Codification (“ASC”) 360,
Impairment or Disposal of Long-Lived Assets
, which requires that long-lived assets be reviewed for impairment whenever events or changes in circumstances indicate that the carrying amount of the assets may not be recoverable. Recoverability of assets is measured by comparing the carrying amount of an asset to future undiscounted net cash flows expected to be generated by the asset. These evaluations for impairment are significantly impacted by estimates of revenues, costs and expenses, and other factors. If long-lived assets are considered to be impaired, the impairment to be recognized is measured by the amount in which the carrying amount of the assets exceeds the fair value of the assets. For the years ended
December 31, 2018
,
2017
and
2016
, the Company recognized impairment losses of
$4.3 million
,
$4.1 million
and
$1.9 million
, respectively, on various fixed assets included in property, plant and equipment, net in the Consolidated Balance Sheets.
Goodwill
Goodwill is tested for impairment annually, or more frequently if events or changes in circumstances indicate that goodwill might be impaired. If it is determined that an impairment exists, an impairment charge is recognized for the excess of carrying value over implied value. The fair value of the reporting unit is determined using the discounted cash flow approach, excluding interest. During the third quarter of 2018, the Company moved Cementing's equipment from the Utica shale to the Permian basin. As a result, the Company recognized impairment on Cementing's goodwill of
$3.2 million
. Additionally, goodwill was tested for impairment as of
December 31, 2018
. No additional impairment losses were recognized for the year ended
December 31, 2018
and
no
impairment losses were recognized for the years ended
December 31, 2017
and
2016
.
Other Non-Current Assets
Other non-current assets primarily consist of deferred financing costs on our credit facility (see Note 11), sales tax receivables and our equity method investment (see Note 9). Investments are accounted for under the equity method in circumstances where the Company has the ability to exercise significant influence over the operating and investing policies of the investee, but does not have control. Under the equity method, the Company recognizes its share of the investee's earnings in its Consolidated Statements of Comprehensive Income (Loss). Investments are evaluated for impairment and a charge to earnings is recognized when any identified impairment is determined to be other than temporary.
Asset Retirement Obligations
Mine reclamation costs, future remediation costs for inactive mines and other contractual site remediation costs are accrued based on management’s best estimate at the end of each period of the costs expected to be incurred at a site. Such cost estimates include, where applicable, ongoing care, maintenance and monitoring costs. Changes in estimates at inactive mines are reflected in earnings in the period an estimate is revised.
F-12
MAMMOTH ENERGY SERVICES, INC.
NOTES TO CONSOLIDATED FINANCIAL STATEMENTS
Following is a roll forward of the Company's asset retirement obligations for the years ended
December 31, 2018
and
2017
(in thousands):
|
December 31,
|
||||||||
|
2018
|
2017
|
|||||||
|
Balance as of beginning of period
|
$
|
2,123
|
|
$
|
260
|
|
||
|
Additions
|
989
|
|
—
|
|
||||
|
Liabilities assumed through acquisition
|
—
|
|
1,732
|
|
||||
|
Accretion expense
|
60
|
|
124
|
|
||||
|
Foreign currency translation adjustment
|
(8
|
)
|
7
|
|
||||
|
Asset retirement obligation as of end of period
|
$
|
3,164
|
|
$
|
2,123
|
|
||
Business Combinations
The Company accounts for its business acquisitions under the acquisition method of accounting as indicated in FASB ASC 805,
Business Combinations
, which requires the acquiring entity in a business combination to recognize the fair value of all assets acquired, liabilities assumed and any noncontrolling interest in the acquiree and establishes the acquisition date as the fair value measurement point. Accordingly, the Company recognizes assets acquired and liabilities assumed in business combinations, including contingent assets and liabilities and noncontrolling interest in the acquiree, based on fair value estimates as of the date of acquisition. In accordance with FASB ASC 805, the Company recognizes and measures goodwill, if any, as of the acquisition date, as the excess of the fair value of the consideration paid over the fair value of the identified net assets acquired.
When the Company acquires a business from an entity under common control, whereby the companies are ultimately controlled by the same party or parties both before and after the transaction, it is treated for accounting purposes in a manner similar to the pooling of interest method of accounting. The assets and liabilities are recorded at the transferring entity’s historical cost instead of reflecting the fair market value of assets and liabilities.
Amortizable Intangible Assets
Intangible assets subject to amortization include customer relationships and trade names. Customer relationships are amortized based on an estimated attrition factor and trade names are amortized over their estimated useful lives. During the year ended
December 31, 2018
, the Company moved Cementing's equipment from the Utica shale to the Permian basin and, as a result, recognized impairment on Cementing's intangible assets, including non-contractual customer relationships and trade name of
$1.0 million
and
$0.2 million
, respectively. Additionally, the Company recognized impairment of trade name totaling
$0.2 million
related to the name change of Stingray Logistics to Silverback Energy. There were
no
impairment losses recognized for amortizable intangible assets for the years ended
December 31, 2017
or
2016
.
Fair Value of Financial Instruments
The Company's financial instruments consist of cash and cash equivalents, trade receivables, trade payables, amounts receivable or payable to related parties and long-term debt. The carrying amount of cash and cash equivalents, trade receivables, receivables from related parties and trade payables approximates fair value because of the short-term nature of the instruments. The fair value of long-term debt approximates it
s carrying value because the cost of borrowing fluctuates based upon market conditions.
Revenue Recognition
On January 1, 2018, the Company adopted Accounting Standards Update (“ASU”) 2014-09 and its related amendments (collectively, "ASC 606") using the modified retrospective method applied to contracts which were not completed as of January 1, 2018. Revenues for reporting periods beginning after January 1, 2018 are presented under ASC 606, while prior period amounts continue to be reported under previous revenue recognition guidance. See Note 3 for additional discussion of the Company's revenue.
During the year ended December 31, 2016, the Company recognized and collected
$0.5 million
in business interruption insurance proceeds which is included in service revenue in the accompanying Consolidated Statements of Comprehensive Income (Loss). The proceeds resulted from loss of revenue relating to wildfires that forced evacuation of personnel.
The timing of revenue recognition may differ from contract billing or payment schedules, resulting in revenues that have been earned but not billed (“unbilled revenue”) or amounts that have been billed, but not earned (“deferred revenue”). The
F-13
MAMMOTH ENERGY SERVICES, INC.
NOTES TO CONSOLIDATED FINANCIAL STATEMENTS
Company had
$56.2 million
and
$65.9 million
, respectively, of unbilled revenue included in accounts receivable, net in the Consolidated Balance Sheets at
December 31, 2018
and
2017
. The Company had
$4.1 million
and
$9.1 million
, respectively, of unbilled revenue included in receivables from related parties in the Consolidated Balance Sheets at
December 31, 2018
and
2017
. The Company had
$4.3 million
and
$15.2 million
, respectively, of deferred revenue included in accrued expenses and other current liabilities in the Consolidated Balance Sheets at
December 31, 2018
and
2017
.
Earnings (Loss) per Share
Earnings (loss) per share is computed by dividing net income (loss) by the weighted average number of outstanding shares. See Note 16.
Unaudited Pro Forma Earnings (Loss) per Share
The Company’s pro forma basic earnings (loss) per share amounts have been computed based on the weighted-average number of shares of common stock outstanding for the period, as if the common shares issued at the IPO were outstanding for the full year of 2016. Diluted earnings per share reflects the potential dilution, using the treasury stock method. During periods in which the Company realizes a net loss, restricted stock awards would be anti-dilutive to net loss per share and conversion into common stock is assumed not to occur.
Equity-based Compensation
The Company measures equity-based payments at fair value on the date of grant and expenses the value of these equity-based payments in compensation expense over the applicable vesting periods. See Note 17.
Stock-based Compensation
The Company's stock-based compensation program consists of restricted stock units granted to employees and restricted stock units granted to non-employee directors under the Mammoth Energy Services, Inc. 2016 Incentive Plan (the "2016 Plan"). The Company recognizes in its financial statements the cost of employee services received in exchange for restricted stock based on the fair value of the equity instruments as of the grant date. In general, this value is amortized over the vesting period; for grants with a non-substantive service condition, this value is recognized immediately. Amounts are recognized in cost of revenues and selling, general and administrative expenses. See Note 18.
Income Taxes
On October 12, 2016, immediately prior to the IPO of Mammoth Inc., the Partnership converted into a limited liability company named Mammoth LLC. All equity interests in Mammoth LLC were contributed to Mammoth Inc. and Mammoth LLC became a wholly owned subsidiary of Mammoth Inc. Mammoth Inc. is a C corporation under the Internal Revenue Code and is subject to income tax. Historically, Mammoth LLC and each of the Operating Entities other than Sand Tiger was treated as a partnership for federal income tax purposes. As a result, essentially all taxable earnings and losses were passed through to its members, and Mammoth LLC did not pay any federal income taxes at the entity level. Mammoth Inc. owns the member interests in several single member limited liability companies. These LLCs are subject to taxation in Texas where the Company does business; therefore, the Company may provide for income taxes attributable to that state on a current basis. The income tax provision for the period before the IPO has been prepared on a separate return basis for Mammoth LLC and all of its subsidiaries that were treated as a partnership for federal income tax purposes.
Subsequent to the IPO, the Company's operations are included in a consolidated federal income tax return and other state returns. Accordingly, the Company has recognized deferred tax assets and liabilities for the future tax consequences attributable to differences between the financial statement carrying amounts of existing assets and liabilities and their respective tax bases for all our subsidiaries as if each entity were a corporation, regardless of its actual characterization for U.S. federal income tax purposes.
The Company has included a pro forma provision for income taxes assuming it had been taxed as a C corporation in all periods prior to the conversion and contribution as part of its earnings per share calculation in Note 16. The unaudited pro forma data are presented for informational purposes only, and do not purport to project the Company's results of operations for any future period or its financial position as of any future date.
Under FASB ASC 740,
Income Taxes
, deferred tax assets and liabilities are recognized for the future tax consequences attributable to differences between the financial statement carrying amounts of existing assets and liabilities and their respective tax bases. Deferred tax assets and liabilities are measured using statutory tax rates expected to apply to taxable income in the years in which those temporary differences are expected to be recovered or settled. The effect of deferred tax assets and liabilities as a result of a change in tax rate are recognized in the period that includes the statutory
F-14
MAMMOTH ENERGY SERVICES, INC.
NOTES TO CONSOLIDATED FINANCIAL STATEMENTS
enactment date. A valuation allowance for deferred tax assets is recognized when it is more likely than not that the benefit of deferred tax assets will not be realized. To assess that likelihood, the Company uses estimates and judgments regarding future taxable income, as well as the jurisdiction in which such taxable income is generated, to determine whether a valuation allowance is required. Certain income from our infrastructure services segment and income from our remote accommodations business is subject to foreign income taxes, and such taxes are provided in the financial statements pursuant to FASB ASC 740
.
On December 22, 2017, the United States enacted the Tax Cuts and Jobs Act (the “Tax Act”). The Tax Act significantly changed US corporate income tax laws by, among other things, reducing the US corporate income tax rate from 35% to 21% starting in 2018 and creating a territorial tax system with a one-time mandatory tax on previously deferred foreign earnings of US subsidiaries. As a result, the Company recorded a one-time reduction to income tax expense of
$31.0 million
during the year ended December 31, 2017, which is included in provision for income taxes in the Consolidated Statements of Comprehensive Income (Loss). See Note 15 for further information.
The Company evaluates tax positions taken or expected to be taken in preparation of its tax returns and disallows the recognition of tax positions that do not meet a “more likely than not” threshold of being sustained upon examination by the taxing authorities. During the years ended
December 31, 2018
and
2017
,
no
material uncertain tax positions existed. Penalties and interest, if any, are recognized in selling, general and administrative expense.
Foreign Currency Translation
For foreign operations, assets and liabilities are translated at the period-end exchange rate and income statement items are translated at the average exchange rate for the period. Resulting translation adjustments are recorded within accumulated other comprehensive income (loss). Assets and liabilities denominated in foreign currencies, if any, are re-measured at the balance sheet date. Transaction gains or losses are included as a component of current period earnings.
Environmental Matters
The Company is subject to various federal, state and local laws and regulations relating to the protection of the environment. Management has established procedures for the ongoing evaluation of the Company’s operations, to identify potential environmental exposures and to comply with regulatory policies and procedures. Environmental expenditures that relate to current operations are expensed or capitalized as appropriate. Expenditures that relate to an existing condition caused by past operations and do not contribute to current or future revenue generation are expensed as incurred. Liabilities are recorded when environmental costs are probable and the costs can be reasonably estimated. The Company maintains insurance which may cover in whole or in part certain environmental expenditures. As of
December 31, 2018
and
2017
, there were no probable environmental matters.
Other Comprehensive Income (Loss)
Comprehensive income (loss) consists of net income (loss) and other comprehensive income (loss). Other comprehensive income (loss) included certain changes in equity that are excluded from net income (loss). Specifically, cumulative foreign currency translation adjustments are included in accumulated other comprehensive income (loss).
Concentrations of Credit Risk and Significant Customers
Financial instruments that potentially subject the Company to concentrations of credit risk consist of cash and cash equivalents in excess of federally insured limits and trade receivables. Following is a summary of our significant customers based on accounts receivable balances at
December 31, 2018
and
2017
and revenues derived for the years ended
December 31, 2018
,
2017
and
2016
:
|
REVENUES
|
ACCOUNTS RECEIVABLE
|
||||||||||
|
Years Ended December 31,
|
At December 31,
|
||||||||||
|
2018
|
2017
|
2016
|
2018
|
2017
|
|||||||
|
Customer A
(a)
|
60
|
%
|
29
|
%
|
—
|
|
65
|
%
|
56
|
%
|
|
|
Customer B
(b)
|
8
|
%
|
30
|
%
|
57
|
%
|
3
|
%
|
12
|
%
|
|
|
Customer C
(c)
|
—
|
%
|
1
|
%
|
11
|
%
|
—
|
%
|
—
|
%
|
|
|
a.
|
Customer A is a third-party customer. Revenues and the related accounts receivable balances earned from Customer A were derived from the Company's infrastructure services segment.
|
|
b.
|
Customer B is a related party customer. Revenues and the related accounts receivable balances earned from Customer B were derived from the Company's pressure pumping services segment, natural sand proppant services segment and other businesses.
|
|
c.
|
Customer C is a third-party customer. Revenues earned from Customer C were derived from the Company's remote accommodations business.
|
F-15
MAMMOTH ENERGY SERVICES, INC.
NOTES TO CONSOLIDATED FINANCIAL STATEMENTS
New Accounting Pronouncements
In February 2016, the FASB issued ASU No. 2016-02 “Leases (Topic 842)” amending the current accounting for leases. Under the new provisions, all lessees will report a right of use asset and lease liability on the balance sheet for all leases with a term longer than one year, while maintaining substantially similar classifications for financing and operating leases. Lessor accounting remains substantially unchanged with the exception that no leases entered into after the effective date will be classified as leveraged leases. ASU 2016-02 is effective for fiscal years beginning after December 15, 2018, and interim periods within that fiscal year. The Company will adopt this ASU effective January 1, 2019 utilizing the transition method permitted by ASU No. 2018-11 "Leases (Topic 842): Targeted Improvements", issued in August 2018, which permits an entity to recognize a cumulative-effect adjustment to the opening balance of retained earnings in the period of adoption with no adjustment made to the comparative periods presented in the consolidated financial statements. The Company will elect the transition practical expedient package whereby an entity need not reassess (i) whether any expired or existing contracts are or contains leases, (ii) the lease classification for any expired or existing leases and (iii) initial direct costs for any existing leases.
The Company has concluded that its agreements for contract land drilling services, aviation services and remote accommodation services contain a lease component under Topic 842. The Company will elect the practical expedient provided to lessors in ASU 2018-11 to combine the lease and non-lease components of a contract where the revenue recognition pattern is the same and where the lease component, when accounted for separately, would be considered an operating lease. The practical expedient also allows a lessor to account for the combined lease and non-lease components under ASC 606, Revenue from Contracts with Customers, when the non-lease component is the predominant element of the combined component. The Company expects to continue to report revenue for its contract land drilling services under ASC 606.
The Company is finalizing its evaluation with respect to leases where it is the lessee and expects to recognize right of use assets and offsetting lease liabilities of approximately
$60.0 million
upon the adoption of ASU 2016-02. Adoption of this standard will not have a material impact to the Consolidated Statement of Comprehensive Income (Loss). The Company will elect the practical expedient provided to lessees to combine the lease and non-lease components of a contract as well as the short-term lease recognition exemption. The Company is finalizing its implementation processes and controls needed to comply with the requirement of the new standard, which includes the implementation of a lease software solution to support lease portfolio management and lease accounting and disclosures.
In June 2018, the FASB issued ASU No. 2018-07, “Compensation - Stock Compensation (Topic 718): Improvements to Non-employee Share-Based Accounting,” which simplifies the accounting for share-based payments granted to non-employees by aligning the accounting with requirements for employee share-based compensation. Upon transition, this ASU requires non-employee awards to be measured at fair value as of the adoption date. This ASU is effective for fiscal years beginning after December 15, 2018, and interim periods within that fiscal year. The Company adopted this ASU effective January 1, 2019 and estimates the fair value of its non-employee equity awards (see Note 17) was approximately
$18.9 million
as of this date.
|
3.
|
Revenues
|
Adoption of ASC 606 "Revenues from Contracts with Customers"
In May 2014, the FASB issued ASU 2014-09, “
Revenue from Contracts with Customers
,” which supersedes the revenue recognition requirements in ASC 605,
Revenue Recognition
, and most industry-specific guidance. The new guidance requires entities to recognize revenue when control of the promised goods or services is transferred to customers at an amount that reflects the consideration to which the entity expects to be entitled to in exchange for those goods or services.
On January 1, 2018, the Company adopted ASU 2014-09 and its related amendments (collectively, "ASC 606") using the modified retrospective method applied to contracts which were not completed as of January 1, 2018. Revenues for reporting periods beginning after January 1, 2018 are presented under ASC 606, while prior period amounts continue to be reported under previous revenue recognition guidance. While ASC 606 requires additional disclosure of the nature, amount, timing and uncertainty of revenue and cash flows arising from contracts with customers, its adoption has not had a material impact on the measurement or recognition of the Company's revenues.
The adoption of ASC 606 represents a change in accounting principle. After evaluation of all contracts not completed as of January 1, 2018, the Company determined the cumulative effect of adopting ASC 606 was immaterial, and as such, has not recorded an adjustment to the opening balance of retained earnings on January 1, 2018.
F-16
MAMMOTH ENERGY SERVICES, INC.
NOTES TO CONSOLIDATED FINANCIAL STATEMENTS
Revenue Recognition
The Company's primary revenue streams include infrastructure services, pressure pumping services, natural sand proppant services and other services, which includes contract land and directional drilling services, coil tubing, pressure control, flowback, cementing, acidizing, equipment rentals, crude oil hauling and remote accommodations services. See Note 21 for the Company's revenue disaggregated by type.
Infrastructure Services
Infrastructure services are typically provided pursuant to master service agreements, repair and maintenance contracts or fixed price and non-fixed price installation contracts. Pricing under these contracts may be unit priced, cost-plus/hourly (or time and materials basis) or fixed price (or lump sum basis). The Company accounts for infrastructure services as a single performance obligation satisfied over time. Revenue is recognized over time as work progresses based on the days completed or as the contract is completed. Under certain customer contracts in our infrastructure services segment, the Company warranties equipment and labor performed for a specified period following substantial completion of the work.
Pressure Pumping Services
Pressure pumping services are typically provided based upon a purchase order, contract or on a spot market basis. Services are provided on a day rate, contracted or hourly basis. Generally, the Company accounts for pressure pumping services as a single performance obligation satisfied over time. In certain circumstances, the Company supplies proppant that is utilized for pressure pumping as part of the agreement with the customer. The Company accounts for these pressure pumping agreements as multiple performance obligations satisfied over time. Jobs for these services are typically short-term in nature and range from a few hours to multiple days. Generally, revenue is recognized over time upon the completion of each segment of work based upon a completed field ticket, which includes the charges for the services performed, mobilization of the equipment to the location and personnel.
Pursuant to a contract with one of its customers, the Company has agreed to provide that customer with use of up to two pressure pumping fleets for the period covered by the contract. Under this agreement, performance obligations are satisfied as services are rendered based on the passage of time rather than the completion of each segment of work. The Company has the right to receive consideration from this customer even if circumstances prevent us from performing work. All consideration owed to the Company for services performed during the contractual period is fixed and the right to receive it is unconditional.
Additional revenue is generated through labor charges and the sale of consumable supplies that are incidental to the service being performed. Such amounts are recognized ratably over the period during which the corresponding goods and services are consumed.
Natural Sand Proppant Services
The Company sells natural sand proppant through sand supply agreements with its customers. Under these agreements, sand is typically sold at a flat rate per ton or a flat rate per ton with an index-based adjustment. The Company recognizes revenue at the point in time when the customer obtains legal title to the product, which may occur at the production facility, rail origin or at the destination terminal.
Certain of the Company's sand supply agreements contain a minimum volume commitment related to sand purchases whereby the Company charges a shortfall payment if the customer fails to meet the required minimum volume commitment. These agreements may also contain make-up provisions whereby shortfall payments can be applied in future periods against purchased volumes exceeding the minimum volume commitment. If a make-up right exists, the Company has future performance obligations to deliver excess volumes of product in subsequent periods. In accordance with ASC 606, if the customer fails to meet the minimum volume commitment, the Company will assess whether it expects the customer to fulfill its unmet commitment during the contractually specified make-up period based on discussions with the customer and management's knowledge of the business. If the Company expects the customer will make-up deficient volumes in future periods, revenue related to shortfall payments will be deferred and recognized on the earlier of the date on which the customer utilizes make-up volumes or the likelihood that the customer will exercise its right to make-up deficient volumes becomes remote. As of
December 31, 2018
, the Company deferred revenue totaling
$4.2 million
related to shortfall payments. This amount is included in accrued expenses and other current liabilities on the consolidated balance sheet. If the Company does not expect the customer will make-up deficient volumes in future periods, the breakage model will be applied and revenue related to shortfall payments will be recognized when the model indicates the customer's inability to take delivery of excess volumes. During the year ended
December 31, 2018
, the Company recognized revenue totaling
$1.5 million
related to shortfall payments.
F-17
MAMMOTH ENERGY SERVICES, INC.
NOTES TO CONSOLIDATED FINANCIAL STATEMENTS
In certain of the Company's sand supply agreements, the customer obtains control of the product when it is loaded into rail cars and the customer reimburses the Company for all freight charges incurred. The Company has elected to account for shipping and handling as activities to fulfill the promise to transfer the sand. If revenue is recognized for the related product before the shipping and handling activities occur, the Company accrues the related costs of those shipping and handling activities.
Other Services
The Company also provides contract land and directional drilling, coil tubing, pressure control, flowback, cementing, acidizing, equipment rentals, crude oil hauling and remote accommodations services, which are reported under other services. Contract drilling services are provided under daywork contracts. Mobilization revenue and costs are recognized over the days of actual drilling. Other services are typically provided based upon a purchase order, contract or on a spot market basis. Services are provided on a day rate, contracted or hourly basis. Performance obligations for these services are satisfied over time and revenue is recognized as the work progresses based on the measure of output. Jobs for these services are typically short-term in nature and range from a few hours to multiple days.
Practical Expedients
The Company does not disclose the value of unsatisfied performance obligations for (i) contracts with an original expected length of one year or less and (ii) contracts in which variable consideration is allocated entirely to a wholly unsatisfied performance obligation or to a wholly unsatisfied distinct good or service that forms part of a single performance obligation.
Contract Balances
Following is a rollforward of the Company's contract liabilities (in thousands):
|
Balance, January 1, 2018
|
$
|
15,000
|
|
|
|
Deduction for recognition of revenue
|
(15,000
|
)
|
||
|
Increase for deferral of shortfall payments
|
4,246
|
|
||
|
Increase for deferral of customer prepayments
|
58
|
|
||
|
Balance, December 31, 2018
|
$
|
4,304
|
|
|
The Company did
no
t have any contract assets as of
December 31, 2018
or January 1, 2018.
Performance Obligations
Revenue recognized in the current period from performance obligations satisfied in previous periods was a nominal amount for the year ended
December 31, 2018
. As of
December 31, 2018
, the Company had unsatisfied performance obligations totaling
$136.9 million
, which will be recognized over the next
three
years.
|
4.
|
Acquisitions
|
Acquisition of Air Rescue Systems and Brim Equipment Assets
On December 21, 2018, Cobra Aviation, a variable interest entity of the Company, completed a series of transactions that provided for an expansion of its aviation service business. These transactions include (i) the acquisition of all outstanding equity interests in ARS, (ii) the purchase of
two
commercial helicopters, spare parts, support equipment and aircraft documents from Brim Equipment Leasing, Inc. ("Brim Equipment") (the "Brim Equipment Assets") and (iii) the formation of a joint venture between Cobra Aviation and Wexford Partners Investment Co. LLC ("Wexford Investment"), a related party, under the name of Brim Acquisitions LLC ("Brim Acquisitions"), which acquired all outstanding equity interest in Brim Equipment. Cobra Aviation owns a
49%
economic interest and Wexford Investment owns a
51%
economic interest in Brim Acquisitions, and each member contributed its pro rata portion of Brim Acquisitions initial capital of
$2.0 million
.
The acquisition of ARS qualifies under FASB ASC 805,
Business Combinations
, as a business combination. The purchase of the Brim Equipment Assets was negotiated and funded as part of the acquisition. Therefore, the purchase of the Brim Equipment Assets also qualifies as a business combination under ASC 805. Cobra Aviation is able to exercise significant influence over Brim Acquisitions, but is a minority owner and does not have controlling financial interest. As a result, Cobra Aviation's investment in Brim Acquisitions is accounted for as an equity method investment under FASB ASC 323,
Investments-Equity Method and Joint Ventures
. See Note 9 for additional information on our investment in Brim Acquisitions.
F-18
MAMMOTH ENERGY SERVICES, INC.
NOTES TO CONSOLIDATED FINANCIAL STATEMENTS
Total consideration paid for ARS was
$2.4 million
in cash to the sellers plus
$0.3 million
in consideration to be paid upon completion of certain contractual obligations. Total consideration paid for the Brim Equipment Assets was
$4.2 million
. The Company used cash on hand to fund the acquisitions.
The following table summarizes the fair value of ARS and the Brim Equipment Assets as of December 21, 2018 (in thousands):
|
ARS
|
Brim Equipment Assets
|
||||||
|
Accounts receivable
|
$
|
146
|
|
$
|
—
|
|
|
|
Property, plant and equipment
|
1,702
|
|
1,990
|
|
|||
|
Identifiable intangible assets - trade name
(a)
|
120
|
|
—
|
|
|||
|
Goodwill
(b)
|
694
|
|
2,243
|
|
|||
|
Other non-current assets
|
5
|
|
—
|
|
|||
|
Total assets acquired
|
$
|
2,667
|
|
$
|
4,233
|
|
|
|
a.
|
Trade name was valued using a "Relief-from-Royalty" method and will be amortized over
20 years
.
|
|
b.
|
Goodwill was the excess of the consideration transferred over the net assets recognized and represents the future economic benefits arising from other assets acquired that could not be individually identified and separately recognized. Goodwill recorded in connection with the acquisition is attributable to assembled workforces and future profitability expected to arise from the acquired entity.
|
From the acquisition date through
December 31, 2018
, ARS and the Brim Equipment Assets provided the following activity (in thousands):
|
2018
|
|||||||
|
ARS
|
Brim Equipment Assets
|
||||||
|
Revenues
|
$
|
—
|
|
$
|
—
|
|
|
|
Net loss
(a)
|
(25
|
)
|
—
|
|
|||
a. Includes depreciation expense of
$0.02 million
for ARS.
The following table presents unaudited pro forma information as if the ARS and the Brim Equipment Assets acquisitions had occurred as of January 1, 2017 (in thousands):
|
Years Ended December 31,
|
Years Ended December 31,
|
||||||||||||||
|
2018
|
2017
|
2018
|
2017
|
||||||||||||
|
ARS
|
Brim Equipment Assets
|
||||||||||||||
|
Revenues
|
$
|
3,055
|
|
$
|
2,641
|
|
$
|
4,478
|
|
$
|
1,448
|
|
|||
|
Net (loss) income
|
207
|
|
(39
|
)
|
2,410
|
|
459
|
|
|||||||
The Company recognized
$0.3 million
of transaction related costs during the year ended
December 31, 2018
related to these acquisitions.
Acquisition of WTL Oil
On May 31, 2018, the Company completed its acquisition of WTL for total consideration of
$5.5 million
in cash to the sellers plus
$0.6 million
in consideration to be paid upon completion of certain contractual obligations. The seller completed these obligations and the Company paid the additional
$0.6 million
to the seller during the three months ended
September 30, 2018
.
The Company used cash on hand and borrowings under its credit facility to fund the acquisition. The acquisition of WTL expanded the Company's service offerings into the crude oil hauling business.
F-19
MAMMOTH ENERGY SERVICES, INC.
NOTES TO CONSOLIDATED FINANCIAL STATEMENTS
The following table summarizes the fair value of WTL as of May 31, 2018 (in thousands):
|
WTL
|
||||
|
Property, plant and equipment
|
$
|
2,960
|
|
|
|
Identifiable intangible assets - customer relationships
(a)
|
930
|
|
||
|
Identifiable intangible assets - trade name
(a)
|
650
|
|
||
|
Goodwill
(b)
|
1,567
|
|
||
|
Total assets acquired
|
$
|
6,107
|
|
|
|
a.
|
Identifiable intangible assets were measured using a combination of income approaches. Trade names were valued using a "Relief-from-Royalty" method. Non-contractual customer relationships were valued using a "Multi-period excess earnings" method. Identifiable intangible assets will be amortized over
10
-
20
years.
|
|
b.
|
Goodwill was the excess of the consideration transferred over the net assets recognized and represents the future economic benefits arising from other assets acquired that could not be individually identified and separately recognized. Goodwill recorded in connection with the acquisition is attributable to the assembled workforce and future profitability expected to arise from the acquired entity.
|
From the acquisition date through
December 31, 2018
, WTL provided the following activity (in thousands):
|
2018
|
||||
|
Revenues
|
$
|
7,511
|
|
|
|
Net loss
(a)
|
(149
|
)
|
||
a. Includes depreciation and amortization expense of
$1.0 million
.
The following table presents unaudited pro forma information as if the acquisition of WTL had occurred as of January 1, 2017 (in thousands):
|
Years Ended December 31,
|
|||||||
|
2018
|
2017
|
||||||
|
Revenues
|
$
|
10,270
|
|
$
|
4,229
|
|
|
|
Net (loss) income
|
(64
|
)
|
165
|
|
|||
The Company recognized
$0.1 million
of transaction related costs during the year ended
December 31, 2018
related to this acquisition.
Acquisition of RTS Energy Services
On June 15, 2018, the Company completed its acquisition of RTS for total consideration of
$7.6 million
in cash to the sellers plus
$0.5 million
to be paid 90 days after closing subject to contractual conditions. The seller completed these obligations and the Company paid the additional
$0.5 million
to the seller during the three months ended
September 30, 2018
.
The Company used cash on hand and borrowings under its credit facility to fund the acquisition. The acquisition of RTS expanded Mammoth's cementing services into the Permian Basin and added acidizing to the Company's service offerings.
The following table summarizes the fair value of RTS as of June 15, 2018 (in thousands):
a.
Goodwill was the excess of the consideration transferred over the net assets recognized and represents the future economic benefits arising from other assets acquired that could not be individually identified and separately recognized. Goodwill recorded in connection with the acquisition is attributable to the assembled workforce and future profitability expected to arise from the acquired entity.
|
RTS
|
||||
|
Inventory
|
$
|
180
|
|
|
|
Property, plant and equipment
|
7,787
|
|
||
|
Goodwill
(a)
|
133
|
|
||
|
Total assets acquired
|
$
|
8,100
|
|
|
F-20
MAMMOTH ENERGY SERVICES, INC.
NOTES TO CONSOLIDATED FINANCIAL STATEMENTS
From the acquisition date through
December 31, 2018
, RTS provided the following activity (in thousands):
a. Includes depreciation expense of
$0.9 million
.
|
2018
|
||||
|
Revenues
|
$
|
6,682
|
|
|
|
Net loss
(a)
|
(3,210
|
)
|
||
The following table presents unaudited pro forma information as if the acquisition of RTS had occurred as of January 1, 2017 (in thousands):
|
Years Ended December 31,
|
|||||||
|
2018
|
2017
|
||||||
|
Revenues
|
$
|
16,212
|
|
$
|
20,877
|
|
|
|
Net (loss) income
|
(4,066
|
)
|
1,141
|
|
|||
The Company recognized
$0.1 million
of transaction related costs during the year ended
December 31, 2018
related to this acquisition.
Acquisition of 5 Star
On July 1, 2017, the Company completed its acquisition of 5 Star for total consideration of
$2.4 million
in cash to the sellers. Mammoth funded the purchase price for 5 Star with cash on hand and borrowings under its credit facility. The acquisition of 5 Star added to the infrastructure component of the Company's business and provided expansion of the infrastructure segment into the eastern United States.
The Company recognized
$0.1 million
of transaction related costs during the year ended December 31, 2017 related to this acquisition.
The following table summarizes the fair value of 5 Star as of July 1, 2017 (in thousands):
|
5 Star
|
||||
|
Accounts receivable
|
$
|
2,440
|
|
|
|
Property, plant and equipment
|
1,863
|
|
||
|
Identifiable intangible assets - trade names
(a)
|
300
|
|
||
|
Goodwill
(b)
|
248
|
|
||
|
Total assets acquired
|
$
|
4,851
|
|
|
|
Long-term debt and other liabilities
|
$
|
2,413
|
|
|
|
Total liabilities assumed
|
$
|
2,413
|
|
|
|
Net assets acquired
|
$
|
2,438
|
|
|
|
a.
|
Identifiable intangible assets were measured using a combination of income approaches. Trade names were valued using a "Relief-from-Royalty" method. Non-contractual customer relationships were valued using a "Multi-period excess earnings" method. Identifiable intangible assets will be amortized over
10
years.
|
|
b.
|
Goodwill was the excess of the consideration transferred over the net assets recognized and represents the future economic benefits arising from other assets acquired that could not be individually identified and separately recognized. Goodwill recorded in connection with the acquisition is attributable to assembled workforces and future profitability expected to arise from the acquired entity.
|
From its acquisition date through
December 31, 2018
, 5 Star has provided the following activity (in thousands):
|
2018
|
2017
|
||||||
|
Revenues
(a)
|
$
|
143,302
|
|
$
|
25,216
|
|
|
|
Net income
(b)
|
4,149
|
|
4,191
|
|
|||
a.
Includes intercompany revenues of
$112.6 million
and
$16.0 million
, respectively, for 2018 and 2017
b.
Includes depreciation and amortization expense of
$3.5 million
and
$0.8 million
, respectively, for 2018 and 2017
F-21
MAMMOTH ENERGY SERVICES, INC.
NOTES TO CONSOLIDATED FINANCIAL STATEMENTS
The following table presents unaudited pro forma information as if the acquisition of 5 Star had occurred as of January 1, 2017 (in thousands):
|
Year Ended
|
||||
|
December 31, 2017
|
||||
|
Revenues
|
$
|
31,548
|
|
|
|
Net income
|
3,910
|
|
||
Acquisition of Higher Power
On April 21, 2017, the Company completed its acquisition of Higher Power for total consideration of
$4.0 million
, including
$3.3 million
in cash to the sellers plus
$0.8 million
in consideration to be paid in equal annual installments over the next
three
years. The Company accelerated payout and funded the remaining consideration of
$0.8 million
during the year ended
December 31, 2018
. Mammoth funded the purchase price for Higher Power with cash on hand and borrowings under its credit facility. The acquisition of Higher Power added an energy infrastructure component to the Company's business, helping to diversify its service offerings.
The Company recognized
$0.1 million
of transaction related costs during the year ended December 31, 2017 related to this acquisition.
The following table summarizes the fair value of Higher Power as of April 21, 2017 (in thousands):
|
Higher Power
|
||||
|
Property, plant and equipment
|
$
|
1,744
|
|
|
|
Identifiable intangible assets - customer relationships
|
1,613
|
|
||
|
Goodwill
(a)
|
643
|
|
||
|
Total assets acquired
|
$
|
4,000
|
|
|
|
a.
|
Goodwill was the excess of the consideration transferred over the net assets recognized and represents the future economic benefits arising from other assets acquired that could not be individually identified and separately recognized. Goodwill recorded in connection with the acquisition is attributable to assembled workforces and future profitability expected to arise from the acquired entity.
|
From its acquisition date through
December 31, 2018
, Higher Power has provided the following activity (in thousands):
|
2018
|
2017
|
||||||
|
Revenues
(a)
|
$
|
220,281
|
|
$
|
39,571
|
|
|
|
Net income
(b)
|
(5,868
|
)
|
5,127
|
|
|||
a.
Includes intercompany revenues of
$191.2 million
and
$27.4 million
, respectively, for 2018 and 2017
b.
Includes depreciation and amortization of
$7.1 million
and
$2.0 million
, respectively, for 2018 and 2017
The following table presents unaudited pro forma information as if the acquisition of Higher Power had occurred as of January 1, 2017 (in thousands):
|
Year Ended
|
||||
|
December 31, 2017
|
||||
|
Revenues
|
$
|
42,343
|
|
|
|
Net income
|
5,004
|
|
||
Acquisition of Sturgeon
On March 20, 2017, and as amended on May 12, 2017, the Company entered into a definitive contribution agreement with MEH Sub, Wexford Offshore Sturgeon Corp., Gulfport, Rhino and Mammoth Energy Partners LLC (the “Sturgeon Contribution Agreement”). Under the Sturgeon Contribution Agreement, the Company agreed to acquire all outstanding
F-22
MAMMOTH ENERGY SERVICES, INC.
NOTES TO CONSOLIDATED FINANCIAL STATEMENTS
membership interests, through its wholly-owned subsidiary Mammoth LLC, in Sturgeon, which owns all of the membership interests in Taylor Frac, Taylor RE and South River (collectively, the "Sturgeon subsidiaries"). The acquisition added sand reserves, increased our production capacity and provided access to the Canadian National Railway, which affords access to the Appalachian basin in support of the Company’s pressure pumping services as well as to western Canada.
The acquisition of Sturgeon closed on June 5, 2017. Pursuant to the Sturgeon Contribution Agreement, Mammoth issued
5,607,452
shares of its common stock, par value
$0.01
per share, for all outstanding equity interests in Sturgeon. Based upon a closing price of Mammoth's common stock of
$18.50
per share on June 5, 2017, the total purchase price was
$103.7 million
.
As a result of this transaction, the Company's historical financial information has been recast to combine the Consolidated Statements of Comprehensive Income (Loss) and the Consolidated Balance Sheets of the Company for all periods included in the accompanying financial statements with those of Sturgeon as if the combination had been in effect since Sturgeon commenced operations on September 13, 2014. Any material transactions between the Company and Sturgeon were eliminated. Sturgeon's financial results were incorporated into the Company's natural sand proppant services division.
The Company recognized
$1.3 million
of transaction related costs during the year ended December 31, 2017 related to this acquisition.
Acquisition of Chieftain
On March 27, 2017, as amended as of May 24, 2017, the Company entered into a purchase agreement with the Chieftain Sellers, following the Company's successful bid in a bankruptcy court auction for substantially all of the assets of the Chieftain Sellers (the "Chieftain Assets"). The Chieftain acquisition closed on May 26, 2017. Mammoth funded the purchase price for the Chieftain Assets with cash on hand and borrowings under its revolving credit facility. The Chieftain Assets are held by the Company's wholly owned subsidiary Piranha and are included in the Company's natural sand proppant services segment. The Chieftain acquisition added sand reserves, increased our production capacity and provided access to the Union Pacific railroad, which affords access to both the Mid-Continent and Permian basins in support of the Company’s pressure pumping services.
The following table summarizes the fair value of the Chieftain Acquisition as of May 26, 2017 (in thousands):
|
Total
|
||||
|
Property, plant and equipment
(a)
|
$
|
23,373
|
|
|
|
Sand reserves
(b)
|
20,910
|
|
||
|
Total assets acquired
|
$
|
44,283
|
|
|
|
Asset retirement obligation
|
1,732
|
|
||
|
Total liabilities assumed
|
$
|
1,732
|
|
|
|
Total allocation of purchase price
|
$
|
42,551
|
|
|
|
Bargain purchase price
(c, d)
|
(6,231
|
)
|
||
|
Total purchase price
|
$
|
36,320
|
|
|
|
a.
|
Property, plant and equipment fair value measurements were prepared by utilizing a combined fair market value and cost approach. The market approach relies on comparability of assets using market data information. The cost approach places emphasis on the physical components and characteristics of the asset. It places reliance on estimated replacement cost, depreciation and economic obsolescence.
|
|
b.
|
The fair value of the sand reserves was determined based on the excess cash flow method, a form of the income approach. The method provides a value based on the estimated remaining life of sand reserves, projected financial information and industry projections.
|
|
c.
|
Amount in Consolidated Statements of Comprehensive Income (Loss) reflected net of income taxes of
$2.2 million
.
|
|
d.
|
The fair value of the business was determined based on the excess cash flow method, a form of the income approach.
|
F-23
MAMMOTH ENERGY SERVICES, INC.
NOTES TO CONSOLIDATED FINANCIAL STATEMENTS
Since the acquisition date, the Chieftain Assets have provided the following activity (in thousands):
|
2018
|
2017
|
||||||
|
Revenues
(a)
|
$
|
52,628
|
|
$
|
22,847
|
|
|
|
Net income
(b)
|
8,379
|
|
5,520
|
|
|||
a.
Includes intercompany revenues of
$14.8 million
and
$12.3 million
, respectively, for 2018 and 2017
b.
Includes depreciation and amortization of
$4.9 million
and
$2.8 million
, respectively, for 2018 and 2017
The following table presents unaudited pro forma information as if the acquisition of the Chieftain Assets had occurred as of January 1, 2017 (in thousands):
|
Year Ended
|
||||
|
December 31, 2017
|
||||
|
Revenues
|
$
|
22,847
|
|
|
|
Net income
|
5,655
|
|
||
The Company's historical financial information was adjusted to give pro forma effect to the events that were directly attributable to the Chieftain Acquisition. The Company recognized
$0.8 million
of transaction related costs related to this acquisition.
Acquisition of Stingray
On March 20, 2017, and as amended on May 12, 2017, the Company entered into
two
definitive contribution agreements, one such agreement with MEH Sub, Wexford Offshore Stingray Energy Corp., Gulfport and Mammoth LLC and the other with MEH Sub, Wexford Offshore Stingray Pressure Pumping Corp., Gulfport and Mammoth LLC (collectively, the “Stingray Contribution Agreements”). Under the Stingray Contribution Agreements, the Company agreed to acquire all outstanding membership interests, through its wholly-owned subsidiary Mammoth LLC, in Cementing and SR Energy (the "2017 Stingray Acquisition"). The addition of their water transfer, equipment rentals and cementing services further expanded and vertically integrated Mammoth’s service offerings.
The 2017 Stingray Acquisition closed on June 5, 2017. Pursuant to the Stingray Contribution Agreements, Mammoth issued
1,392,548
shares of its common stock, par value
$0.01
per share, for all outstanding equity interests in SR Energy and Cementing. Based upon a closing price of Mammoth's common stock of
$18.50
per share on June 5, 2017, the total purchase price was
$25.8 million
.
At the acquisition date, the components of the consideration transferred were as follows (in thousands):
|
Consideration attributable to Cementing
(a)
|
$
|
12,975
|
|
|
|
Consideration attributable to SR Energy
(a)
|
12,787
|
|
||
|
Total consideration transferred
|
$
|
25,762
|
|
|
a. See summary of acquired assets and liabilities below
F-24
MAMMOTH ENERGY SERVICES, INC.
NOTES TO CONSOLIDATED FINANCIAL STATEMENTS
|
SR Energy
|
Cementing
|
Total
|
|||||||||
|
(in thousands)
|
|||||||||||
|
Cash and cash equivalents
|
$
|
1,611
|
|
$
|
1,060
|
|
$
|
2,671
|
|
||
|
Accounts receivable, net
|
3,913
|
|
495
|
|
4,408
|
|
|||||
|
Receivables from related parties
|
3,684
|
|
1,418
|
|
5,102
|
|
|||||
|
Inventories
|
—
|
|
306
|
|
306
|
|
|||||
|
Prepaid expenses
|
35
|
|
32
|
|
67
|
|
|||||
|
Property, plant and equipment
(a)
|
13,061
|
|
7,459
|
|
20,520
|
|
|||||
|
Identifiable intangible assets - customer relationships
(b)
|
—
|
|
1,140
|
|
1,140
|
|
|||||
|
Identifiable intangible assets - trade names
(b)
|
550
|
|
270
|
|
820
|
|
|||||
|
Goodwill
(c)
|
3,929
|
|
6,264
|
|
10,193
|
|
|||||
|
Other assets
|
7
|
|
—
|
|
7
|
|
|||||
|
Total assets acquired
|
$
|
26,790
|
|
$
|
18,444
|
|
$
|
45,234
|
|
||
|
Accounts payable and accrued liabilities
|
$
|
5,890
|
|
$
|
2,063
|
|
$
|
7,953
|
|
||
|
Long-term debt
(d)
|
5,074
|
|
2,000
|
|
7,074
|
|
|||||
|
Deferred tax liability
|
3,039
|
|
1,406
|
|
4,445
|
|
|||||
|
Total liabilities assumed
|
$
|
14,003
|
|
$
|
5,469
|
|
$
|
19,472
|
|
||
|
Net assets acquired
|
$
|
12,787
|
|
$
|
12,975
|
|
$
|
25,762
|
|
||
|
a.
|
Property, plant and equipment fair value measurements were prepared by utilizing a combined fair market value and cost approach. The market approach relies on comparability of assets using market data information. The cost approach places emphasis on the physical components and characteristics of the asset. It places reliance on estimated replacement cost, depreciation and economic obsolescence.
|
|
b.
|
Identifiable intangible assets were measured using a combination of income approaches. Trade names were valued using a "relief-from-Royalty" method. Non-contractual customer relationships were valued using a "multi-period excess earnings" method. Identifiable intangible assets will be amortized over
5
-
10
years.
|
|
c.
|
Goodwill was the excess of the consideration transferred over the net assets recognized and represents the future economic benefits arising from other assets acquired that could not be individually identified and separately recognized. Goodwill recorded in connection with the acquisition is attributable to assembled workforces and future profitability based on the synergies expected to arise from the acquired entities.
|
|
d.
|
Long-term debt assumed was paid off subsequent to the acquisition.
|
Since the acquisition date, the businesses acquired have provided the following activity (in thousands):
|
2018
|
2017
|
|||||||||||||
|
SR Energy
|
Cementing
|
SR Energy
|
Cementing
|
|||||||||||
|
Revenues
(a)
|
$
|
29,287
|
|
$
|
6,426
|
|
$
|
11,572
|
|
$
|
7,500
|
|
||
|
Net loss
(b, c)
|
(2,539
|
)
|
(5,869
|
)
|
(1,626
|
)
|
(1,963
|
)
|
||||||
|
a.
|
Includes intercompany revenues of
$3.0 million
and
$0.6 million
, respectively, for SR Energy for 2018 and 2017 and
$0.3 million
and a nominal amount, respectively, for Cementing for 2018 and 2017.
|
|
b.
|
Includes depreciation and amortization of
$5.4 million
and
$3.4 million
, respectively, for SR Energy for 2018 and 2017 and
$1.5 million
and
$4.1 million
, respectively, for Cementing for 2018 and 2017.
|
|
c.
|
Includes non-cash impairment expense of
$4.4 million
for Cementing in 2018 related to the impairment of intangible assets and goodwill as a result of moving Cementing equipment from the Utica shale to the Permian basin.
|
The following table presents unaudited pro forma information as if the acquisition of SR Energy and Cementing had occurred on January 1, 2017 (in thousands):
|
Year Ended
|
||||
|
December 31, 2017
|
||||
|
Revenues
|
$
|
35,142
|
|
|
|
Net loss
|
(4,066
|
)
|
||
F-25
MAMMOTH ENERGY SERVICES, INC.
NOTES TO CONSOLIDATED FINANCIAL STATEMENTS
The historical financial information was adjusted to give effect to the pro forma events that were directly attributable to the 2017 Stingray Acquisition. For the year ended December 31, 2017, there were
$0.2 million
transaction related costs expensed. The unaudited pro forma consolidated results are not necessarily indicative of what the consolidated results of operations actually would have been had the 2017 Stingray Acquisition been completed on January 1, 2017. In addition, the unaudited pro forma consolidated results do not purport to project the future results of operations of the Company.
|
5.
|
Inventories
|
A summary of the Company's inventories is shown below (in thousands):
|
December 31,
|
||||||||
|
2018
|
2017
|
|||||||
|
Supplies
|
$
|
12,571
|
|
$
|
9,437
|
|
||
|
Raw materials
|
199
|
|
219
|
|
||||
|
Work in process
|
3,273
|
|
2,370
|
|
||||
|
Finished goods
|
5,259
|
|
5,788
|
|
||||
|
Total inventory
|
$
|
21,302
|
|
$
|
17,814
|
|
||
|
6.
|
Property, Plant and Equipment
|
Property, plant and equipment include the following (in thousands):
|
December 31,
|
|||||||||
|
|
Useful Life
|
2018
|
2017
|
||||||
|
Pressure pumping equipment
|
3-5 years
|
$
|
208,968
|
|
$
|
190,211
|
|
||
|
Drilling rigs and related equipment
|
3-15 years
|
122,198
|
|
132,260
|
|
||||
|
Machinery and equipment
(a)
|
7-20 years
|
173,867
|
|
97,569
|
|
||||
|
Buildings
|
15-39 years
|
46,380
|
|
45,992
|
|
||||
|
Vehicles, trucks and trailers
(b)
|
5-10 years
|
132,337
|
|
54,055
|
|
||||
|
Coil tubing equipment
|
4-10 years
|
29,128
|
|
28,053
|
|
||||
|
Land
|
N/A
|
14,235
|
|
11,317
|
|
||||
|
Land improvements
|
15 years or life of lease
|
9,614
|
|
9,614
|
|
||||
|
Rail improvements
|
10-20 years
|
13,806
|
|
5,540
|
|
||||
|
Other property and equipment
|
3-12 years
|
18,551
|
|
12,687
|
|
||||
|
769,084
|
|
587,298
|
|
||||||
|
Deposits on equipment and equipment in process of assembly
(c)
|
16,865
|
|
20,348
|
|
|||||
|
785,949
|
|
607,646
|
|
||||||
|
Less: accumulated depreciation, depletion, amortization and accretion
(d)
|
349,250
|
|
256,629
|
|
|||||
|
Property, plant and equipment, net
|
$
|
436,699
|
|
$
|
351,017
|
|
|||
|
a.
|
Included in machinery and equipment are assets under capital leases totaling
$1.8 million
and
$1.8 million
, respectively, for the years ended
December 31, 2018
and
2017
.
|
|
b.
|
Included in vehicles, trucks and trailers are assets under capital leases totaling
$0.3 million
and
$1.0 million
, respectively, for the years ended
December 31, 2018
and
2017
.
|
|
c.
|
Included in deposits on equipment and equipment in process of assembly are assets under capital leases totaling
$1.7 million
for the year ended
December 31, 2018
. These assets were received on
December 31, 2018
and were not yet placed in service.
|
|
d.
|
Accumulated depreciation for assets under capital leases totaled
$0.6 million
and
$0.8 million
, respectively, for the years ended
December 31, 2018
and
2017
.
|
Proceeds from customers for horizontal and directional drilling services equipment, damaged or lost down-hole are reflected in revenue with the carrying value of the related equipment charged to cost of service revenues and are reported as cash inflows from investing activities in the statement of cash flows. For the years ended
December 31, 2018
,
2017
and
F-26
MAMMOTH ENERGY SERVICES, INC.
NOTES TO CONSOLIDATED FINANCIAL STATEMENTS
2016
, proceeds from the sale of equipment damaged or lost down-hole were
$1.0 million
,
$0.5 million
and
$0.7 million
, respectively, and gain on sales of equipment damaged or lost down-hole were
$0.9 million
,
$0.3 million
and
$0.4 million
, respectively.
A summary of depreciation, depletion, amortization and accretion expense is shown below (in thousands):
|
Years Ended December 31,
|
||||||||||||
|
2018
|
2017
|
2016
|
||||||||||
|
Depreciation expense
(a)
|
$
|
107,634
|
|
$
|
81,191
|
|
$
|
62,196
|
|
|||
|
Accretion and depletion expense (see Note 2)
|
3,539
|
|
1,632
|
|
1,048
|
|
||||||
|
Amortization expense (see Note 8)
|
8,704
|
|
9,301
|
|
9,071
|
|
||||||
|
Depreciation, depletion, amortization and accretion
|
$
|
119,877
|
|
$
|
92,124
|
|
$
|
72,315
|
|
|||
|
a.
|
Includes depreciation expense for assets under capital leases totaling
$0.5 million
,
$0.4 million
and
$0.5 million
, respectively, for the years ended
December 31, 2018
,
2017
and
2016
.
|
Deposits on equipment and equipment in process of assembly represents deposits placed with vendors for equipment that is in the process of assembly and purchased equipment that is being outfitted for its intended use. The equipment is not yet placed in service.
|
7.
|
Impairments
|
A summary of our impairments is as follows (in thousands):
|
December 31,
|
|||||||||||
|
2018
|
2017
|
2016
|
|||||||||
|
Drilling rigs
(a)
|
$
|
3,966
|
|
$
|
3,822
|
|
$
|
347
|
|
||
|
Flowback equipment
(a)
|
—
|
|
—
|
|
1,385
|
|
|||||
|
Other property, plant and equipment
(a)
|
307
|
|
324
|
|
139
|
|
|||||
|
Impairment of goodwill
(b)
|
3,203
|
|
—
|
|
—
|
|
|||||
|
Impairment of intangible assets
(b)
|
1,379
|
|
—
|
|
—
|
|
|||||
|
$
|
8,855
|
|
$
|
4,146
|
|
$
|
1,871
|
|
|||
|
a.
|
For the years ended
December 31, 2018
,
2017
and
2016
, the Company recognized impairments of
$4.3 million
,
$4.1 million
and
$1.9 million
, respectively, to reduce the carrying value of certain assets which were deemed impaired based on future expected cash flows of the equipment. The Company measured impairment using significant unobservable inputs (Level 3) based on an income approach.
|
|
b.
|
During the year ended
December 31, 2018
, the Company moved Cementing's equipment from the Utica shale to the Permian basin. As a result, the Company recognized impairment on Cementing's intangible assets, including goodwill, non-contractual customer relationships and trade name of
$3.2 million
,
$1.0 million
and
$0.2 million
, respectively. Additionally, the Company recognized impairment of trade name totaling
$0.2 million
related to the name change of Stingray Logistics to Silverback Energy. The Company measured Cementing's goodwill using an income approach, which provides an estimated fair value based on anticipated cash flows that are discounted using a weighted average cost of capital rate.
|
The assumptions used in the impairment evaluation for long-lived assets are inherently uncertain and require management’s judgment. A continued period of low oil and natural gas prices or continued reductions in capital expenditures by our customers would likely have an adverse impact on our utilization and the prices that we receive for our services. This could result in the recognition of future material impairment charges on the same, or additional, property and equipment if future cash flow estimates, based upon information then available to management, indicate that their carrying values are not recoverable.
F-27
MAMMOTH ENERGY SERVICES, INC.
NOTES TO CONSOLIDATED FINANCIAL STATEMENTS
|
8.
|
Goodwill and Intangible Assets
|
The Company had the following definite lived intangible assets recorded as of the dates presented below (in thousands):
|
December 31,
|
||||||||
|
2018
|
2017
|
|||||||
|
Customer relationships
|
$
|
2,255
|
|
$
|
35,795
|
|
||
|
Trade names
|
9,063
|
|
8,793
|
|
||||
|
Less: accumulated amortization - customer relationships
|
(544
|
)
|
(26,172
|
)
|
||||
|
Less: accumulated amortization - trade names
|
(3,018
|
)
|
(2,277
|
)
|
||||
|
Intangible assets, net
|
$
|
7,756
|
|
$
|
16,139
|
|
||
Amortization expense for intangible assets was
$8.7 million
,
$9.3 million
and
$9.1 million
for the years ended
December 31, 2018
,
2017
and
2016
, respectively. The original lives of customer relationships range from
6
to
10
years with a remaining average useful life of
6.87
years. The original lives of trade names range from
10
to
20
years useful life and as of
December 31, 2018
the remaining useful life was
8.97
years.
Aggregated expected amortization expense for the future periods is expected to be as follows (in thousands):
|
Year ended December 31:
|
Amount
|
|||
|
2019
|
$
|
1,135
|
|
|
|
2020
|
1,135
|
|
||
|
2021
|
1,129
|
|
||
|
2022
|
1,108
|
|
||
|
2023
|
991
|
|
||
|
Thereafter
|
2,258
|
|
||
|
$
|
7,756
|
|
||
Goodwill was
$101.2 million
and
$99.8 million
at
December 31, 2018
and
2017
, respectively. Changes in goodwill for the years ended
December 31, 2018
and
2017
are set forth below (in thousands):
|
Balance, January 1, 2017
|
$
|
88,727
|
|
|
|
Additions:
|
||||
|
2017 Stingray Acquisition
|
10,193
|
|
||
|
Higher Power Acquisition
|
643
|
|
||
|
5 Star Acquisition
|
248
|
|
||
|
Balance, December 31, 2017
|
99,811
|
|
||
|
Additions:
|
||||
|
WTL Acquisition
|
1,567
|
|
||
|
RTS Acquisition
|
133
|
|
||
|
ARS Acquisition
|
694
|
|
||
|
Brim Equipment Assets Acquisition
|
2,243
|
|
||
|
Impairment
|
(3,203
|
)
|
||
|
Balance, December 31, 2018
|
$
|
101,245
|
|
|
During the year ended
December 31, 2018
, the Company moved Cementing's equipment from the Utica shale to the Permian basin. As a result, during the year ended
December 31, 2018
, the Company recognized impairment on Cementing's intangible assets, including goodwill, non-contractual customer relationships and trade name of
$3.2 million
,
$1.0 million
and
$0.2 million
, respectively. Additionally, the Company recognized impairment of trade name totaling
$0.2 million
related to the name change of Stingray Logistics to Silverback Energy.
F-28
MAMMOTH ENERGY SERVICES, INC.
NOTES TO CONSOLIDATED FINANCIAL STATEMENTS
|
9.
|
Equity Method Investment
|
On December 21, 2018, Cobra Aviation and Wexford Investment, a related party, formed a joint venture under the name of Brim Acquisitions to acquire all outstanding equity interest in Brim Equipment for a total purchase price of approximately
$1.4 million
in cash to the sellers plus
$0.6 million
in consideration to be paid upon completion of certain contractual obligations. Cobra Aviation owns a
49%
economic interest and Wexford Investment owns a
51%
economic interest in Brim Acquisitions, and each member contributed its pro rata portion of Brim Acquisitions initial capital of
$2.0 million
. Brim Acquisitions, through Brim Equipment, owns one commercial helicopter and leases one commercial helicopter for operation, which it uses to provide a variety of services, including short haul, aerial ignition, hoist operations, aerial photography, fire suppression, construction services, animal/capture/survey, search and rescue, airborne law enforcement, power line construction, precision long line operations, pipeline construction and survey, mineral and seismic exploration, and aerial seeding and fertilization.
The Company uses the equity method of accounting to account for its investment in Brim Acquisitions, which had a carrying value of approximately
$1.0 million
at
December 31, 2018
. The investment is included in other non-current assets on the Consolidated Balance Sheets. The Company recorded an equity method adjustment to its investment of
($0.02) million
for its share of Brim Acquisitions' loss for the period between the acquisition date and
December 31, 2018
, which is included in other, net on the Consolidated Statements of Comprehensive Income (Loss).
|
10.
|
Accrued Expenses and Other Current Liabilities
|
Accrued expense and other current liabilities included the following (in thousands):
|
December 31,
|
||||||||
|
2018
|
2017
|
|||||||
|
Accrued compensation, benefits and related taxes
|
$
|
20,898
|
|
$
|
11,552
|
|
||
|
State and local taxes payable
|
18,687
|
|
2,126
|
|
||||
|
Financed insurance premiums
|
6,761
|
|
4,876
|
|
||||
|
Insurance reserves
|
4,678
|
|
2,942
|
|
||||
|
Deferred revenue
|
4,304
|
|
15,210
|
|
||||
|
Other
|
4,324
|
|
4,189
|
|
||||
|
Total
|
$
|
59,652
|
|
$
|
40,895
|
|
||
Financed insurance premiums are due in monthly installments, are unsecured and mature within the twelve-month period following the close of the year. As of
December 31, 2018
and
2017
, the applicable interest rates associated with financed insurance premiums were
3.45%
and
2.75%
, respectively.
|
11.
|
Debt
|
Mammoth Credit Facility
On October 19, 2018, Mammoth and certain of its direct and indirect subsidiaries, as borrowers, entered into an amended and restated revolving credit and security agreement with the lenders party thereto and PNC Bank, National Association, as a lender and as administrative agent for the lenders, which amends and restates the Company's prior revolving credit and security agreement dated as of July 9, 2018, as amended prior to October 19, 2018. The facility matures on October 19, 2023. Borrowings under this facility are secured by the assets of Mammoth Inc., inclusive of the subsidiary companies. The maximum availability of the facility is subject to a borrowing base calculation prepared monthly.
Outstanding borrowings under this amended and restated revolving credit facility bear interest at a per annum rate elected by Mammoth that is equal to an alternate base rate or LIBOR, in each case plus the applicable margin. The applicable margin ranges from
1.00%
to
1.50%
per annum in the case of the alternate base rate, and from
2.00%
to
2.50%
per annum in the case of LIBOR. The applicable margin depends on the amount of excess availability under this amended and restated revolving credit facility.
F-29
MAMMOTH ENERGY SERVICES, INC.
NOTES TO CONSOLIDATED FINANCIAL STATEMENTS
At
December 31, 2018
, there were
no
outstanding borrowings under the amended and restated revolving credit facility and
$175.8 million
of available borrowing capacity, after giving effect to
$8.4 million
of outstanding letters of credit. At
December 31, 2017
, there were outstanding borrowings under Mammoth's then existing credit facility of
$99.9 million
, leaving an aggregate of
$62.8 million
of borrowing capacity under the facility, after giving effect to
$6.5 million
of outstanding letters of credit.
The amended and restated revolving credit facility contains various customary affirmative and restrictive covenants. Among the covenants are two financial covenants, including a minimum interest coverage ratio (
3.0
to 1.0), and a maximum leverage ratio (
4.0
to 1.0), and minimum availability (
$10.0 million
). As of
December 31, 2018
and
2017
, the Company was in compliance with its covenants under the facility.
Sturgeon Credit Facility
On June 30, 2015, Sturgeon entered in to a
three
-year
$25.0 million
revolving line of credit secured by substantially all of the assets of Sturgeon (“the Sturgeon revolver”). Advances under the Sturgeon revolver bore interest at
2%
plus the greater of (a) the Base Rate as set by the lender's commercial lending group, (b) the sum of the Federal Funds Open Rate plus one half of one percent and (c) the sum of the Daily LIBOR rate. Additionally, at Sturgeon’s request, advances could be obtained at LIBOR plus
3%
. The LIBOR rate option allowed Sturgeon to select interest periods from one, two, three or six month LIBOR futures spot rates. The Sturgeon revolver was terminated on June 6, 2017.
|
12.
|
Other Liabilities
|
Other liabilities included the following (in thousands):
|
December 31,
|
||||||||
|
2018
|
2017
|
|||||||
|
Capital lease obligations
|
$
|
3,190
|
|
$
|
2,015
|
|
||
|
Equipment financing arrangement
|
1,313
|
|
1,605
|
|
||||
|
Other
|
—
|
|
500
|
|
||||
|
Total
|
4,503
|
|
4,120
|
|
||||
|
Less: Current portion of capital lease and equipment financing obligations included in accrued expenses and other current liabilities
|
1,760
|
|
831
|
|
||||
|
Total Other Liabilities
|
$
|
2,743
|
|
$
|
3,289
|
|
||
The Company leases vehicles and other equipment under capital leases with varying terms and expiration dates through 2020. The weighted average implied interest rate under our capital leases as of
December 31, 2018
and
2017
was
9.2%
and
19.1%
, respectively. Additionally, the Company is party to a
five
-year equipment financing arrangement maturing in 2022 that bears interest at
4.6%
as of
December 31, 2018
. Principal and interest on capital leases and the equipment financing arrangement are paid monthly. Aggregate future payments under the Company's non-cancelable capital leases and equipment financing arrangement as of
December 31, 2018
are as follows (in thousands):
|
2019
|
$
|
1,901
|
|
|
2020
|
1,075
|
|
|
|
2021
|
775
|
|
|
|
2022
|
747
|
|
|
|
2023
|
387
|
|
|
|
Thereafter
|
32
|
|
|
|
Total future minimum payments
|
4,917
|
|
|
|
Less: interest payments
|
414
|
|
|
|
Present value of future minimum payments
|
$
|
4,503
|
|
F-30
MAMMOTH ENERGY SERVICES, INC.
NOTES TO CONSOLIDATED FINANCIAL STATEMENTS
|
13.
|
Variable Interest Entity
|
On April 6, 2018, Dire Wolf Energy Services LLC ("Dire Wolf"), a wholly owned subsidiary of the Company, entered into a Voting Trust Agreement with TVPX Aircraft Solutions Inc. (the "Voting Trustee"). Under the Voting Trust Agreement, Dire Wolf transferred
100%
of its membership interest in Cobra Aviation to the Voting Trustee in exchange for Voting Trust Certificates. Dire Wolf retained the obligation to absorb all expected returns or losses of Cobra Aviation. Prior to the transfer of membership interest to the Voting Trustee, Cobra Aviation was a wholly owned subsidiary of Dire Wolf. Cobra Aviation owns three helicopters and support equipment,
100%
of the equity interest in ARS and
49%
of the equity interest in Brim Acquisitions. Dire Wolf entered into the Voting Trust Agreement in order to meet certain registration requirements.
Dire Wolf's voting rights are not proportional to its obligation to absorb expected returns or losses of Cobra Aviation and all of Cobra Aviation's activities are conducted on behalf of Dire Wolf, which has disproportionately fewer voting rights; therefore, Cobra Aviation meets the criteria of a VIE. Cobra Aviation's operational activities are directed by Dire Wolf's officers and Dire Wolf has the option to terminate the Voting Trust Agreement at any time. Therefore, the Company, through Dire Wolf, is considered the primary beneficiary of the VIE and consolidates Cobra Aviation at
December 31, 2018
.
|
14.
|
Selling, General and Administrative Expense
|
Selling, general and administrative ("SG&A") expense includes of the following (in thousands):
|
Years Ended December 31,
|
|||||||||||
|
2018
|
2017
|
2016
|
|||||||||
|
Cash expenses:
|
|||||||||||
|
Compensation and benefits
|
$
|
42,950
|
|
$
|
15,322
|
|
$
|
9,789
|
|
||
|
Professional services
|
11,854
|
|
7,765
|
|
4,552
|
|
|||||
|
Other
(a)
|
10,718
|
|
7,503
|
|
1,960
|
|
|||||
|
Total cash SG&A expense
|
65,522
|
|
30,590
|
|
16,301
|
|
|||||
|
Non-cash expenses:
|
|||||||||||
|
Bad debt provision
(b)
|
(14,578
|
)
|
16,098
|
|
1,246
|
|
|||||
|
Equity based compensation
(c)
|
17,487
|
|
—
|
|
—
|
|
|||||
|
Stock based compensation
|
4,666
|
|
3,198
|
|
501
|
|
|||||
|
Total non-cash SG&A expense
|
7,575
|
|
19,296
|
|
1,747
|
|
|||||
|
Total SG&A expense
|
$
|
73,097
|
|
$
|
49,886
|
|
$
|
18,048
|
|
||
|
a.
|
Includes travel-related costs, IT expenses, rent, utilities and other general and administrative-related costs.
|
|
b.
|
During the year ended
December 31, 2018
, the Company received payment for amounts previously reserved in 2017. As a result, during the year ended
December 31, 2018
, the Company reversed bad debt expense of
$16.0 million
recognized in 2017.
|
|
c.
|
Represents compensation expense for non-employee awards, which were issued and are payable by certain affiliates of Wexford (the sponsor level). See Note 17 for additional detail.
|
|
15.
|
Income Taxes
|
As discussed in Note 1, the Partnership was converted into a limited liability company on October 12, 2016 and the membership interests in the limited liability company were contributed to the Company. As a result, the Company filed a consolidated return for the period October 12, 2016 through December 31, 2016. Prior to the conversion, the Partnership, other than Sand Tiger, was not subject to corporate income taxes.
The components of income tax expense (benefit) attributable to the Company for the year ended
December 31, 2018
,
2017
and
2016
, respectively, are as follows (in thousands):
F-31
MAMMOTH ENERGY SERVICES, INC.
NOTES TO CONSOLIDATED FINANCIAL STATEMENTS
|
Year Ended December 31,
|
||||||||||||
|
2018
|
2017
|
2016
|
||||||||||
|
U.S. current income tax expense
|
$
|
25,656
|
|
$
|
804
|
|
$
|
2,307
|
|
|||
|
U.S. deferred income tax expense (benefit)
|
25,372
|
|
(27,764
|
)
|
47,957
|
|
||||||
|
Foreign current income tax expense
|
75,381
|
|
36,565
|
|
3,594
|
|
||||||
|
Foreign deferred income tax expense (benefit)
|
26,854
|
|
(6,773
|
)
|
27
|
|
||||||
|
Total
|
$
|
153,263
|
|
$
|
2,832
|
|
$
|
53,885
|
|
|||
A reconciliation of the statutory federal income tax amount to the recorded expense is as follows (in thousands):
|
Year Ended December 31,
|
||||||||||||
|
2018
|
2017
|
2016
|
||||||||||
|
Income (loss) before income taxes, as reported
|
$
|
389,228
|
|
$
|
61,796
|
|
$
|
(38,568
|
)
|
|||
|
Bargain purchase gain, net of tax
|
—
|
|
(4,012
|
)
|
—
|
|
||||||
|
Income (loss) before income taxes, as taxed
|
389,228
|
|
57,784
|
|
(38,568
|
)
|
||||||
|
Statutory income tax rate
|
21
|
%
|
35
|
%
|
35
|
%
|
||||||
|
Expected income tax expense (benefit)
|
81,738
|
|
20,224
|
|
(13,499
|
)
|
||||||
|
Income earned as non-taxable entity (See Note 2)
|
—
|
|
—
|
|
15,167
|
|
||||||
|
Effect due to change to C corporation (See Note 2)
|
—
|
|
—
|
|
53,089
|
|
||||||
|
Change in tax rate
|
(103
|
)
|
(21,309
|
)
|
(25
|
)
|
||||||
|
Tax reform - unrepatriated foreign earnings
|
—
|
|
(9,727
|
)
|
—
|
|
||||||
|
Foreign income tax rate differential
|
39,080
|
|
6,286
|
|
(1,078
|
)
|
||||||
|
Foreign earnings not in reported income
|
46,834
|
|
22,054
|
|
—
|
|
||||||
|
Foreign tax credits
|
(89,677
|
)
|
(29,551
|
)
|
—
|
|
||||||
|
Withholding taxes
|
13,930
|
|
—
|
|
—
|
|
||||||
|
Other permanent differences
|
13,045
|
|
503
|
|
210
|
|
||||||
|
State tax expenses
|
5,394
|
|
39
|
|
21
|
|
||||||
|
Return to provision
|
6,071
|
|
—
|
|
—
|
|
||||||
|
Other
|
680
|
|
(1,192
|
)
|
—
|
|
||||||
|
Change in valuation allowance
|
36,271
|
|
15,505
|
|
—
|
|
||||||
|
Total
|
$
|
153,263
|
|
$
|
2,832
|
|
$
|
53,885
|
|
|||
The Company's effective tax rate was
39.4%
for the year ended
December 31, 2018
compared to
4.9%
for the year ended
December 31, 2017
. The Company's effective tax rate was
34.6%
, excluding the conversion to a C Corporation, for the year ended
December 31, 2016
. The increase in effective tax rate from 2017 to 2018 is primarily the result of a tax rate change recorded in 2017 related to the Tax Act as discussed below. Additionally, the Company's tax rate was affected by the mix of earnings between the US and Puerto Rico, increased foreign tax credits resulting from increased profitability in foreign jurisdictions, changes in valuation allowance on excess foreign tax credit carryforwards and withholding taxes on foreign source income, as well as other items, such as equity compensation expense and certain non-deductible expenses. The difference in effective tax rate from 2016 to 2017 is primarily due to income earned as a non-taxable entity and the effect of the Company’s change in tax status to a C corporation, as discussed in further detail in Note 2.
On December 22, 2017, the United States enacted the Tax Act. The Tax Act significantly changed US corporate income tax laws by, among other things, reducing the US corporate income tax rate from 35% to 21% starting in 2018 and creating a territorial tax system with a one-time mandatory tax on previously deferred foreign earnings of US subsidiaries. Under the accounting rules, companies were required to recognize the effects of changes in tax laws and tax rates on deferred tax assets and liabilities in
2017
, the period in which the new legislation was enacted. The effects of the Tax Act on the Company included (i) remeasurement of deferred taxes and (ii) recognition of liabilities for taxes on mandatory deemed repatriation. As a result of the Tax Act, the Company recorded a credit of
$31.0 million
during the fourth quarter of 2017. This amount, which is included in provision (benefit) for income taxes in the Consolidated
F-32
MAMMOTH ENERGY SERVICES, INC.
NOTES TO CONSOLIDATED FINANCIAL STATEMENTS
Statements of Comprehensive Income (Loss), consists of two components: (i) a
$21.3 million
credit resulting from the remeasurement of the Company's net deferred tax liabilities in the US based on the new lower corporate income tax rate, and (ii) a
$9.7 million
credit related to a reversal of deferred liabilities for unrepatriated foreign earnings. The SEC staff issued Staff Accounting Bulletin No. 118 in December 2017, which allowed registrants to record provisional amounts for effects of the Tax Act during a one-year measurement period. The Company completed its analysis of the Tax Act during the fourth quarter of 2018 and recorded a nominal adjustment to its provisional estimates.
Deferred tax liabilities attributable to the Company consisted of the following (in thousands):
|
Year Ended December 31,
|
||||||||
|
2018
|
2017
|
|||||||
|
Deferred tax assets:
|
||||||||
|
Allowance for doubtful accounts
|
$
|
1,180
|
|
$
|
11,973
|
|
||
|
Deferred compensation
|
1,032
|
|
1,032
|
|
||||
|
Accrued liabilities
|
3,428
|
|
1,442
|
|
||||
|
Foreign tax credits
|
51,776
|
|
15,505
|
|
||||
|
Other
|
2,094
|
|
1,448
|
|
||||
|
Valuation allowance
|
(51,776
|
)
|
(15,505
|
)
|
||||
|
Deferred tax assets
|
7,734
|
|
15,895
|
|
||||
|
Deferred tax liabilities:
|
||||||||
|
Property and equipment
|
$
|
(63,181
|
)
|
$
|
(40,390
|
)
|
||
|
Intangible assets
|
(4,936
|
)
|
(2,839
|
)
|
||||
|
Withholding taxes
|
(17,419
|
)
|
—
|
|
||||
|
Other
|
(1,507
|
)
|
(74
|
)
|
||||
|
Deferred tax liabilities
|
(87,043
|
)
|
(43,303
|
)
|
||||
|
Net deferred tax liability
|
$
|
(79,309
|
)
|
$
|
(27,408
|
)
|
||
|
Reflected in accompanying balance sheet as:
|
||||||||
|
Deferred income tax asset
|
$
|
—
|
|
$
|
6,739
|
|
||
|
Deferred income tax liability
|
(79,309
|
)
|
(34,147
|
)
|
||||
|
Total
|
$
|
(79,309
|
)
|
|
$
|
(27,408
|
)
|
|
At December 31, 2018, the Company maintains a full valuation allowance related to US foreign tax credit carryforwards, as it cannot objectively assert that these deferred tax assets are more likely than not to be realized. All available positive and negative evidence was weighed to determine whether a valuation allowance was necessary. The more significant evidential matter is the higher foreign tax rate applied to foreign source income in comparison to the US Federal tax rate of 21%. As such, excess foreign tax credits are generated each year through payment of foreign taxes over the amount that can be credited against the US income tax due on the corresponding foreign source income. As such, while the Company has utilized and is expected to continue utilizing a portion of foreign tax credits generated in each period, the difference in tax rates between the US and foreign jurisdiction is expected to continue generating excess foreign tax credits that are not expected to be utilized in the future.
During the years ended
December 31, 2018
and
2017
, the Company recorded changes in its valuation allowance of
$36.3 million
and
$15.5 million
, respectively, related to excess foreign tax credits that are not expected to be utilized. The Company has foreign tax credits carryforwards of
$51.8 million
as of December 31, 2018. These credits have a 10 year carryforward period and begin to expire in 2027.
At December 31, 2018, the Company had foreign subsidiaries with undistributed earnings, primarily in Puerto Rico. Due to the tax status of these entities as passthrough entities for US tax purposes, all taxable earnings have been considered in the tax provision for the US Federal and state jurisdictions. As it is expected these earnings will be eventually subject to
F-33
MAMMOTH ENERGY SERVICES, INC.
NOTES TO CONSOLIDATED FINANCIAL STATEMENTS
distribution to the US, the Company has accrued for associated withholdings taxes resulting from such eventual distribution.
The Company does not have any material uncertain tax positions for either 2018 or 2017.
The Company’s U.S. and state tax returns for tax years 2015 through 2018, Puerto Rico tax returns for tax years 2017 and 2018 and Canada tax returns for the tax years 2014 through 2018 remain open to examination by the respective tax authorities.
|
16.
|
Stockholders' Equity and Earnings (Loss) Per Share
|
Common Stock Offering
On October 14, 2016, Mammoth Inc.’s common stock began trading on The Nasdaq Global Select Market under the symbol “TUSK.” On October 19, 2016, the Company closed the IPO of
7,750,000
shares of common stock at
$15.00
per share. Net proceeds to Mammoth Inc. from its sale of
7,500,000
shares of common stock were approximately
$103.1 million
.
The authorized capital stock of the Company consists of
200 million
shares of common stock, par value
$0.01
per share.
Dividends
On July 16, 2018, the Company initiated a quarterly dividend policy. The table below summarized the dividends paid on the Company's common stock.
|
Per Share
|
Total
|
||||||
|
2018
|
(in thousands)
|
||||||
|
Paid on August 14, 2018
|
$
|
0.125
|
|
$
|
5,595
|
|
|
|
Paid on November 15, 2018
|
0.125
|
|
5,606
|
|
|||
|
Total cash dividends
|
$
|
0.25
|
|
$
|
11,201
|
|
|
On January 28, 2018, the Company's board of Directors declared a quarterly cash dividend of
$0.125
per share of common stock, which was paid on February 14, 2018 to stockholders of record as of the close of business on February 7, 2019. The total dividend paid was
$5.6 million
. The Company's board of directors’ determination with respect to any future dividends will depend upon the Company's profitability and financial condition, contractual restrictions, restrictions imposed by applicable law and other factors that the board deems relevant at the time of such determination. Based on its evaluation of these factors, the board of directors may determine not to declare a dividend, or declare dividends at rates that are less than currently anticipated.
Earnings (Loss) Per Share
The number of common shares outstanding on a fully-converted basis was the same before and after any conversion of our owner units. Each time one common share was issued upon conversion of investor units, the number of common shares went up by one, and the number of common units outstanding that were convertible went down by one.
|
Year Ended December 31,
|
Weighted Average Shares Outstanding
|
Share Issuance at IPO
(a)
|
Conversion
|
Weighted Average Units Outstanding
|
||||||||
|
2016
|
31,500,000
|
|
1,500,000
|
|
(30,000,000
|
)
|
30,000,000
|
|
||||
|
a.
|
Weighted average of
7,500,000
shares issued from the closing date of the IPO on October 19, 2016 to December 31, 2016.
|
F-34
MAMMOTH ENERGY SERVICES, INC.
NOTES TO CONSOLIDATED FINANCIAL STATEMENTS
|
Year Ended December 31,
|
||||||||||||
|
2018
|
2017
|
2016
|
||||||||||
|
(in thousands, except per share data)
|
||||||||||||
|
Basic earnings (loss) per share:
|
||||||||||||
|
Allocation of earnings:
|
||||||||||||
|
Net income (loss)
|
$
|
235,965
|
|
$
|
58,964
|
|
$
|
(92,453
|
)
|
|||
|
Weighted average common shares outstanding
|
44,750
|
|
41,548
|
|
31,500
|
|
||||||
|
Basic earnings (loss) per share
|
$
|
5.27
|
|
$
|
1.42
|
|
$
|
(2.94
|
)
|
|||
|
Diluted earnings (loss) per share:
|
||||||||||||
|
Allocation of earnings:
|
||||||||||||
|
Net income (loss)
|
$
|
235,965
|
|
$
|
58,964
|
|
$
|
(92,453
|
)
|
|||
|
Weighted average common shares, including dilutive effect
(a)
|
45,021
|
|
41,639
|
|
31,500
|
|
||||||
|
Diluted earnings (loss) per share
|
$
|
5.24
|
|
$
|
1.42
|
|
$
|
(2.94
|
)
|
|||
|
a.
|
No
incremental shares of potentially dilutive restricted stock awards were included for the year ended December 31, 2016 as their effect was antidilutive under the treasury stock method.
|
Unaudited Pro Forma Loss Per Share
The Company’s pro forma basic loss per share amounts have been computed based on the weighted-average number of shares of common stock outstanding for the period, as if the common shares issued upon the conversion to Mammoth Inc. were outstanding for the entire year. A reconciliation of the components of pro forma basic and diluted loss per common share is presented in the table below:
|
Year Ended
|
||||
|
December 31, 2016
|
||||
|
(in thousands, except per share data)
|
||||
|
Pro Forma C Corporation Data (unaudited):
|
||||
|
Net loss, as reported
|
$
|
(92,453
|
)
|
|
|
Taxes on income earned as a non-taxable entity (Note 15)
|
15,224
|
|
||
|
Taxes due to change to C corporation (Note 15)
|
53,089
|
|
||
|
Pro forma net loss
|
$
|
(24,140
|
)
|
|
|
Basic loss per share:
|
||||
|
Allocation of earnings:
|
||||
|
Net loss
|
$
|
(24,140
|
)
|
|
|
Weighted average common shares outstanding
|
43,107
|
|
||
|
Basic loss per share
|
$
|
(0.56
|
)
|
|
|
Diluted loss per share:
|
||||
|
Allocation of earnings:
|
||||
|
Net loss
|
$
|
(24,140
|
)
|
|
|
Weighted average common shares, including dilutive effect
(a)
|
43,107
|
|
||
|
Diluted loss per share
|
$
|
(0.56
|
)
|
|
|
a.
|
No
incremental shares of potentially dilutive restricted stock awards were included as their effect was antidilutive under the treasury stock method.
|
F-35
MAMMOTH ENERGY SERVICES, INC.
NOTES TO CONSOLIDATED FINANCIAL STATEMENTS
Pro forma basic and diluted loss per share has been computed by dividing pro forma net loss attributable to the Company by the number of shares of common stock determined as if the shares of common stock issued were outstanding for all periods presented. Management believes that these assumptions provide a reasonable basis for presenting the pro forma effects.
|
17.
|
Equity Based Compensation
|
Upon formation of certain operating entities by Wexford, Gulfport and Rhino, specified members of management (the “Specified Members”) and certain non-employee members (the “Non-Employee Members”) were granted the right to receive distributions from the operating entities after the contribution member’s unreturned capital balance was recovered (referred to as “Payout” provision).
On November 24, 2014, the awards were modified in conjunction with the contribution of the operating entities to Mammoth. These awards were not granted in limited or general partner units. The awards are for interests in the distributable earnings of the members of MEH Sub, Mammoth’s majority equity holder.
On the IPO closing date, the unreturned capital balance of Mammoth's majority equity holder was not fully recovered from its sale of common stock in the IPO. As a result, Payout did not occur and no compensation cost was recorded.
On June 29, 2018, as part of an underwritten secondary public offering, MEH Sub sold
2,764,400
shares of the Company’s common stock at a purchase price to MEH Sub of
$38.01
per share. Additionally, the selling stockholders granted the underwriters an option to purchase additional shares of the Company's common stock at the same purchase price. On July 30, 2018, in connection with the partial exercise of this option, MEH Sub sold an additional
266,026
shares of common stock to the underwriters. MEH Sub received the proceeds from this offering. As a result of the June 29, 2018 offering, a portion of the Non-Employee Member awards reached Payout. During the year ended
December 31, 2018
, the Company recognized equity compensation expense totaling
$17.5 million
related to these non-employee awards. These awards are at the sponsor level and this transaction had no dilutive impact or cash impact to the Company.
Payout for the remaining awards is expected to occur as the contribution member's unreturned capital balance is recovered from additional sales by MEH Sub of its shares of the Company's common stock or from dividend distributions, which is not considered probable until the event occurs. For the Specified Member awards, the unrecognized amount, which represents the fair value of the award as of the modification dates or grant date, was
$5.6 million
. For the Non-Employees Member awards, the unrecognized cost, which represents the fair value of the awards as of
December 31, 2018
, was
$18.9 million
.
|
18.
|
Stock-Based Compensation
|
The 2016 Plan authorizes the Company's Board of Directors or the compensation committee of the Company's Board of Directors to grant incentive restricted stock, restricted stock unit, stock appreciation rights, stock options and performance awards. There are
4.5 million
shares of common stock reserved for issuance under the 2016 Plan.
Restricted Stock Units
The fair value of restricted stock unit awards was determined based on the fair market value of the Company's common stock on the date of the grant. This value is amortized over the vesting period. Forfeitures are recognized as they occur.
A summary of the status and changes of the unvested shares of restricted stock units under the 2016 Plan is presented below.
F-36
MAMMOTH ENERGY SERVICES, INC.
NOTES TO CONSOLIDATED FINANCIAL STATEMENTS
|
Number of Unvested Restricted Stock Units
|
Weighted Average Grant-Date Fair Value
|
||||||
|
Unvested restricted stock units as of October 19, 2016
|
—
|
|
$
|
—
|
|
||
|
Granted
|
298,335
|
|
$
|
14.97
|
|
||
|
Vested
|
(11,110
|
)
|
$
|
(14.69
|
)
|
||
|
Forfeited
|
(4,445
|
)
|
$
|
(15.00
|
)
|
||
|
Unvested restricted stock units as of December 31, 2016
|
282,780
|
|
$
|
14.98
|
|
||
|
Granted
|
460,185
|
|
$
|
20.72
|
|
||
|
Vested
|
(97,890
|
)
|
$
|
(15.07
|
)
|
||
|
Forfeited
|
(4,443
|
)
|
$
|
(15.00
|
)
|
||
|
Unvested restricted stock units as of December 31, 2017
|
640,632
|
|
$
|
19.44
|
|
||
|
Granted
|
103,556
|
|
$
|
27.74
|
|
||
|
Vested
|
(270,069
|
)
|
$
|
19.26
|
|
||
|
Forfeited
|
(40,000
|
)
|
$
|
20.68
|
|
||
|
Unvested restricted stock units as of December 31, 2018
|
434,119
|
|
$
|
22.78
|
|
||
As of
December 31, 2018
, there was
$6.2 million
of total unrecognized compensation cost related to the unvested restricted stock. The cost is expected to be recognized over a weighted average period of approximately
seventeen months
.
Included in cost of revenue and selling, general and administrative expenses is stock-based compensation expense of
$5.4 million
,
$3.7 million
and
$0.5 million
, respectively, for the years ended
December 31, 2018
,
2017
and
2016
.
|
19.
|
Related Party Transactions
|
Transactions between the subsidiaries of the Company and the following companies are included in Related Party Transactions: Gulfport; Grizzly Oil Sands ULC (“Grizzly”); El Toro Resources LLC ("El Toro"); Diamondback E&P, LLC ("Diamondback"); Cementing and SR Energy (collectively, prior to the 2017 Stingray Acquisition, the "2017 Stingray Companies"); Everest Operations Management LLC ("Everest"); Elk City Yard LLC ("Elk City Yard"); Double Barrel Downhole Technologies LLC ("DBDHT"); Orange Leaf Holdings LLC ("Orange Leaf"); Caliber Investment Group LLC ("Caliber"); Dunvegan North Oilfield Services ULC (“Dunvegan”); Predator Drilling LLC ("Predator"); and T&E Flow Services LLC ("T&E").
Following is a summary of related party transactions (in thousands):
|
REVENUES
|
ACCOUNTS RECEIVABLE
|
||||||||||||||||
|
Years Ended December 31,
|
At December 31,
|
||||||||||||||||
|
2018
|
2017
|
2016
|
2018
|
2017
|
|||||||||||||
|
Pressure Pumping and Gulfport
|
(a)
|
$
|
96,013
|
|
$
|
144,473
|
|
$
|
102,390
|
|
$
|
8,175
|
|
$
|
25,054
|
|
|
|
Muskie and Gulfport
|
(b)
|
25,050
|
|
42,956
|
|
25,783
|
|
1,193
|
|
1,947
|
|
||||||
|
Panther and Gulfport
|
(c)
|
44
|
|
3,253
|
|
3,011
|
|
—
|
|
872
|
|
||||||
|
Cementing and Gulfport
|
(d)
|
5,853
|
|
7,410
|
|
—
|
|
—
|
|
2,255
|
|
||||||
|
SR Energy and Gulfport
|
(e)
|
14,717
|
|
10,129
|
|
—
|
|
1,658
|
|
3,348
|
|
||||||
|
Panther and El Toro
|
(f)
|
918
|
|
96
|
|
172
|
|
64
|
|
—
|
|
||||||
|
Redback Energy and El Toro
|
(g)
|
92
|
|
216
|
|
530
|
|
—
|
|
—
|
|
||||||
|
Coil Tubing and El Toro
|
(h)
|
514
|
|
161
|
|
319
|
|
—
|
|
—
|
|
||||||
|
Other Relationships
|
32
|
|
326
|
|
725
|
|
74
|
|
312
|
|
|||||||
|
$
|
143,233
|
|
$
|
209,020
|
|
$
|
132,930
|
|
$
|
11,164
|
|
$
|
33,788
|
|
|||
|
a.
|
Pressure Pumping provides pressure pumping, stimulation and related completion services to Gulfport.
|
|
b.
|
Muskie has agreed to sell and deliver, and Gulfport has agreed to purchase, specified annual and monthly amounts of natural sand proppant, subject to certain exceptions specified in the agreement, and pay certain costs and expenses.
|
|
c.
|
Panther performs drilling services for Gulfport pursuant to a master service agreement.
|
|
d.
|
Cementing performs well cementing services for Gulfport.
|
F-37
MAMMOTH ENERGY SERVICES, INC.
NOTES TO CONSOLIDATED FINANCIAL STATEMENTS
|
e.
|
SR Energy provides rental services for Gulfport.
|
|
f.
|
Panther provides directional drilling services for El Toro, an affiliate of Wexford, pursuant to a master service agreement.
|
|
g.
|
Redback Energy performs completion and production services for El Toro pursuant to a master service agreement.
|
|
h.
|
Coil Tubing provides El Toro services in connection with completion activities.
|
|
COST OF REVENUE
|
ACCOUNTS PAYABLE
|
||||||||||||||||
|
Years Ended December 31,
|
At December 31,
|
||||||||||||||||
|
2018
|
2017
|
2016
|
2018
|
2017
|
|||||||||||||
|
Cobra and T&E
|
(a)
|
4,042
|
|
610
|
|
—
|
|
—
|
|
457
|
|
||||||
|
Higher Power and T&E
|
(a)
|
1,603
|
|
25
|
|
—
|
|
—
|
|
3
|
|
||||||
|
Panther and DBDHT
|
(b)
|
240
|
|
196
|
|
49
|
|
240
|
|
77
|
|
||||||
|
The Company and 2017 Stingray Companies
|
(c)
|
—
|
|
432
|
|
724
|
|
—
|
|
—
|
|
||||||
|
Other Relationships
|
—
|
|
145
|
|
293
|
|
—
|
|
218
|
|
|||||||
|
$
|
5,885
|
|
$
|
1,408
|
|
$
|
1,066
|
|
$
|
240
|
|
$
|
755
|
|
|||
|
SELLING, GENERAL AND ADMINISTRATIVE COSTS
|
|||||||||||||||||
|
Consolidated and Everest
|
(d)
|
$
|
145
|
|
$
|
175
|
|
$
|
262
|
|
$
|
27
|
|
$
|
19
|
|
|
|
Consolidated and Wexford
|
(e)
|
992
|
|
892
|
|
394
|
|
100
|
|
150
|
|
||||||
|
Mammoth and Caliber
|
(f)
|
648
|
|
335
|
|
—
|
|
3
|
|
1
|
|
||||||
|
Other Relationships
|
113
|
|
79
|
|
102
|
|
—
|
|
2
|
|
|||||||
|
$
|
1,898
|
|
$
|
1,481
|
|
$
|
758
|
|
$
|
130
|
|
$
|
172
|
|
|||
|
CAPITAL EXPENDITURES
|
|||||||||||||||||
|
Cobra and T&E
|
(a)
|
1,247
|
|
629
|
|
—
|
|
—
|
|
66
|
|
||||||
|
Higher Power and T&E
|
(a)
|
2,960
|
|
1,380
|
|
—
|
|
—
|
|
385
|
|
||||||
|
$
|
4,207
|
|
$
|
2,009
|
|
$
|
—
|
|
$
|
—
|
|
$
|
451
|
|
|||
|
$
|
370
|
|
$
|
1,378
|
|
||||||||||||
|
a.
|
Cobra, Higher Power and Cobra Logistics purchase materials and services from T&E, an entity in which a member of management's family owned a minority interest. T&E ceased to be a related party as of September 30, 2018.
|
|
b.
|
Panther rents rotary steerable equipment in connection with its directional drilling services from DBDHT, an affiliate of Wexford.
|
|
c.
|
Prior to the 2017 Stingray Acquisition, the 2017 Stingray Companies provided certain services to the Company and, from time to time, the 2017 Stingray Companies paid for goods and services on behalf of the Company.
|
|
d.
|
Everest, a subsidiary of Wexford, has historically provided office space and certain technical, administrative and payroll services to the Company and the Company has reimbursed Everest in amounts determined by Everest based on estimates of the amount of office space provided and the amount of employees’ time spent performing services for the Company.
|
|
e.
|
Wexford provides certain administrative and analytical services to the Company and, from time to time, the Company pays for goods and services on behalf of Wexford.
|
|
f.
|
Mammoth leases office space from Caliber, an entity controlled by Wexford.
|
On June 29, 2018, Gulfport and certain entities controlled by Wexford (the "Selling Stockholders") completed an underwritten secondary public offering of
4,000,000
shares of the Company’s common stock at a purchase price to the Selling Stockholders of
$38.01
per share. The Selling Stockholders granted the underwriters an option to purchase up to an aggregate of
600,000
additional shares of the Company's common stock at the same purchase price. This option was exercised, in part, and on July 30, 2018, the underwriters purchased an additional
385,000
shares of common stock from the Selling Stockholders at the same price per share. The Selling Stockholders received all proceeds from this offering. The Company incurred costs of approximately
$1.0 million
related to the secondary public offering during the year ended
December 31, 2018
.
On December 21, 2018, Cobra Aviation acquired all outstanding equity interest in ARS and purchased two commercial helicopters, spare parts, support equipment and aircraft documents from Brim Equipment. Following these transactions, and also on December 21, 2018, Cobra Aviation formed a joint venture with Wexford Investments named Brim Acquisitions to acquire all outstanding equity interests in Brim Equipment. Cobra Aviation owns a
49%
economic interest and Wexford Investment owns a
51%
economic interest in Brim Acquisitions, and each member contributed its pro rata portion of Brim Acquisitions' initial capital of
$2.0 million
. Wexford Investments is an entity controlled by Wexford, which owns approximately
49%
of the Company's outstanding common stock. ARS leases a helicopter to Brim
F-38
MAMMOTH ENERGY SERVICES, INC.
NOTES TO CONSOLIDATED FINANCIAL STATEMENTS
Equipment and Cobra Aviation leases the two helicopters purchased as part of these transactions to Brim Equipment under the terms of aircraft lease and management agreements.
|
20.
|
Commitments and Contingencies
|
Lease Obligations
The Company leases real estate, rail cars and other equipment under long-term operating leases with varying terms and expiration dates through 2062.
Minimum Purchase Commitments
The Company has entered into agreements with suppliers that contain minimum purchase obligations. Failure to purchase the minimum amounts may require the Company to pay shortfall fees. However, the minimum quantities set forth in the agreements are not in excess of currently expected future requirements.
Capital Spend Commitments
The Company has entered into agreements with suppliers to acquire capital equipment.
Aggregate future minimum payments under the Company's non-cancelable operating, capital spend commitments and minimum purchase commitments as of
December 31, 2018
are as follows (in thousands):
|
Year ended December 31:
|
Operating Leases
|
Capital Spend Commitments
|
Minimum Purchase Commitments
(a)
|
||||||||
|
2019
|
$
|
20,161
|
|
$
|
10,557
|
|
$
|
32,483
|
|
||
|
2020
|
16,579
|
|
—
|
|
19,679
|
|
|||||
|
2021
|
12,567
|
|
—
|
|
501
|
|
|||||
|
2022
|
9,329
|
|
—
|
|
12
|
|
|||||
|
2023
|
5,000
|
|
—
|
|
12
|
|
|||||
|
Thereafter
|
2,548
|
|
—
|
|
4
|
|
|||||
|
$
|
66,184
|
|
$
|
10,557
|
|
$
|
52,691
|
|
|||
|
a.
|
Included in these amounts are sand purchase commitments of
$47.1 million
. Pricing for certain sand purchase agreements is variable and, therefore, the total sand purchase commitments could be as much as
$53.7 million
. The minimum amount due in the form of shortfall fees under certain sand purchase agreements was
$3.6 million
as of
December 31, 2018
.
|
For the years ended
December 31, 2018
,
2017
and
2016
, the Company recognized rent expense of
$22.1 million
,
$11.4 million
and
$8.2 million
, respectively.
The Company has various letters of credit that were issued under the Company's revolving credit agreement which is collateralized by substantially all of the assets of the Company. The letters of credit are categorized below (in thousands):
|
December 31,
|
||||||||
|
2018
|
2017
|
|||||||
|
Insurance programs
|
$
|
4,105
|
|
$
|
2,486
|
|
||
|
Environmental remediation
|
3,877
|
|
3,582
|
|
||||
|
Rail car commitments
|
455
|
|
455
|
|
||||
|
Total letters of credit
|
$
|
8,437
|
|
$
|
6,523
|
|
||
The Company has insurance coverage for physical partial loss to its assets, employer’s liability, automobile liability, commercial general liability, workers’ compensation and insurance for other specific risks. The Company has also elected in some cases to accept a greater amount of risk through increased deductibles on certain insurance policies. As of
December 31, 2018
and
2017
, the policies required a deductible per occurrence of up to
$0.1 million
and
$0.3 million
,
F-39
MAMMOTH ENERGY SERVICES, INC.
NOTES TO CONSOLIDATED FINANCIAL STATEMENTS
respectively. As of
December 31, 2018
and
2017
, the policies contained an aggregate stop loss of
$5.4 million
and
$3.5 million
, respectively. The Company establishes liabilities for the unpaid deductible portion of claims incurred relating to workers’ compensation and auto liability based on estimates. As of
December 31, 2018
and
2017
, accrued claims were
$4.7 million
and
$2.9 million
, respectively.
The Company also self-insures its employee health insurance. The Company has coverage on its self-insurance program in the form of a stop loss of
$0.2 million
per participant and an aggregate stop-loss of
$5.8 million
for the calendar year ending
December 31, 2018
. As of
December 31, 2018
and
2017
, accrued claims were
$3.2 million
and
$2.1 million
, respectively. These estimates may change in the near term as actual claims continue to develop.
Pursuant to certain customer contracts in our infrastructure services segment, the Company warrants equipment and labor performed under the contracts for a specified period following substantial completion of the work. Generally, the warranty is for one year or less.
No
liabilities were accrued as of
December 31, 2018
or
2017
and
no
expense was recognized during the years ended
December 31, 2018
,
2017
or
2016
related to warranty claims. However, if warranty claims occur, the Company could be required to repair or replace warrantied items, which in most cases are covered by warranties extended from the manufacturer of the equipment. In the event the manufacturer of equipment failed to perform on a warranty obligation or denied a warranty claim made by the Company, the Company could be required to pay for the cost of the repair or replacement.
In the ordinary course of business, the Company is required to provide bid bonds to certain customers in the infrastructure services segment as part of the bidding process. These bonds provide a guarantee to the customer that the Company, if awarded the project, will perform under the terms of the contract. Bid bonds are typically provided for a percentage of the total contract value. Additionally, the Company may be required to provide performance and payment bonds for contractual commitments related to projects in process. These bonds provide a guarantee to the customer that the Company will perform under the terms of a contract and that the Company will pay subcontractors and vendors. If the Company fails to perform under a contract or to pay subcontractors and vendors, the customer may demand that the surety make payments or provide services under the bond. The Company must reimburse the surety for expenses or outlays it incurs. As of
December 31, 2018
, outstanding bid bonds and performance and payment bonds totaled
$3.6 million
and
$22.3 million
, respectively. The estimated cost to complete projects secured by the performance and payment bonds totaled
$17.0 million
as of
December 31, 2018
. As of December 31, 2017, the Company did not have any outstanding bid bonds or performance and payment bonds.
The Company is routinely involved in state and local tax audits. During 2015, the State of Ohio assessed taxes on the purchase of equipment the Company believes is exempt under state law. The Company appealed the assessment and a hearing was held in 2017. As a result of the hearing, the Company received a decision from the State of Ohio. The Company is appealing the decision and while it is not able to predict the outcome of the appeal, this matter is not expected to have a material adverse effect on the Company's financial position, results of operations or cash flows.
On June 27, 2018, the Company's registered agent notified the Company that it had been served with a putative class action lawsuit titled Wendco of Puerto Rico Inc.; Multisystem Restaurant Inc.; Restaurant Operators Inc.; Apple Caribe, Inc.; on their own behalf and in representation of all businesses that conduct business in the Commonwealth of Puerto Rico vs. Mammoth Energy Services Inc.; Cobra Acquisitions, LLC; D. Grimm Puerto Rico, LLC; Aseguradoras A, B & C; John Doe; Richard Doe, in the Commonwealth of Puerto Rico Superior Court of San Juan. The plaintiffs allege negligent acts by the defendants caused an electrical failure in Puerto Rico resulting in damages of at least
$300 million
. The Company believes this claim is without merit and will vigorously defend the action. However, the Company continues to evaluate the facts and circumstances and at this time is not able to predict the outcome of this lawsuit or whether it will have a material impact on the Company's financial position, results of operations or cash flows.
In late 2018 and early 2019, Cobra was served with four lawsuits from municipalities in Puerto Rico alleging failure to pay municipal license and construction excise taxes. The Government of Puerto Rico's Central Recovery and Reconstruction Office ("COR3") has noted the unique nature of work executed by entities such as Cobra in Puerto Rico and that taxes, such as those in these matters, may be eligible for reimbursement by the government. Further, COR3 indicated that it is working to develop a solution that will result in payment of taxes owed to the municipalities without placing an undue burden on entities such as Cobra. The Company continues to work with COR3 to resolve these matters. However, the Company continues to evaluate the facts and circumstances and at this time is not able to predict the outcome of this lawsuit or whether it will have a material impact on the Company's financial position, results of operations or cash flows.
F-40
MAMMOTH ENERGY SERVICES, INC.
NOTES TO CONSOLIDATED FINANCIAL STATEMENTS
The Company is involved in various other legal proceedings in the ordinary course of business. Although the Company cannot predict the outcome of these proceedings, legal matters are subject to inherent uncertainties and there exists the possibility that the ultimate resolution of these matters could have a material adverse effect on the Company's business, financial condition, results of operations or cash flows.
Defined contribution plan
The Company sponsors a 401(k) defined contribution plan for the benefit of substantially all employees at their date of hire. The plan allows eligible employees to contribute up to
92%
of their annual compensation, not to exceed annual limits established by the federal government. The Company makes discretionary matching contributions of up to
3%
of an employee’s compensation and may make additional discretionary contributions for eligible employees. For the years ended
December 31, 2018
and
2016
the Company paid
$5.6 million
and
$0.1 million
, respectively, in contributions to the plan. The Company did not pay any contributions for the year ended December 31, 2017.
|
21.
|
Reporting Segments and Geographic Areas
|
Reporting Segments
As of
December 31, 2018
, our revenues, income before income taxes and identifiable assets are primarily attributable to
three
reportable segments. The Company principally provides electric infrastructure services to government-funded utilities, private utilities, public investor-owned utilities and co-operative utilities and services in connection with on-shore drilling of oil and natural gas wells for small to large domestic independent oil and natural gas producers.
The Company's Chief Executive Officer and Chief Financial Officer comprise the Company's Chief Operating Decision Maker function ("CODM"). Segment information is prepared on the same basis that the CODM manages the segments, evaluates the segment financial statements, and makes key operating and resource utilization decisions. Segment evaluation is determined on a quantitative basis based on a function of operating income (loss), as well as a qualitative basis, such as nature of the product and service offerings and types of customers.
In 2017, the Company had
four
reportable segments, including pressure pumping services, infrastructure services, natural sand proppant services and contract land and directional drilling services. Based on its assessment of FASB ASC 280,
Segment Reporting
, guidance at
December 31, 2018
, the Company changed its reportable segment presentation in 2018, as it determined based upon both a quantitative and qualitative basis that the contract land and directional drilling services segment, which previously included Bison Drilling, Bison Trucking, Panther Drilling, Mako Acquisitions and White Wing Tubular, is not of continuing significance for accounting reporting purposes. The Company now includes the results of the entities previously included in the contract land and directional drilling services segment in its reconciling column titled "All Other" in the tables below for the years ended
December 31, 2018
and
2017
. As of
December 31, 2018
, the Company’s
three
reportable segments include infrastructure services ("Infrastructure"), pressure pumping services ("Pressure Pumping") and natural sand proppant services ("Sand"). The results for the year ended
December 31, 2017
have been retroactively adjusted to reflect his change in reportable segments.
In 2016, the Company had five reportable segments, including pressure pumping services, well services, natural sand proppant services, contract land and directional drilling services and other energy services. The results for the years ended December 31, 2016 continue to be reported under these
five
segments, and therefore, are not directly comparable to the results for the years ended
December 31, 2018
and
2017
.
The infrastructure services segment provides electric utility infrastructure services to government-funded utilities, private utilities, public investor-owned utilities and co-operative utilities in Puerto Rico and the northeast, southwest and midwest portions of the United States. The pressure pumping services segment provides hydraulic fracturing services primarily in the Utica Shale of Eastern Ohio, Marcellus Shale in Pennsylvania, Eagle Ford and Permian Basins in Texas and the mid-continent region. The sand segment mines, processes and sells sand for use in hydraulic fracturing. The sand segment primarily services the Utica Shale, Permian Basin, SCOOP, STACK and Montney Shale in British Columbia and Alberta, Canada.
The Company also provides contract land and directional drilling services, coil tubing services, flowback services, cementing services, acidizing services, equipment rental services, crude oil hauling services and remote accommodation services. The businesses that provide these services are distinct operating segments, which the CODM reviews independently when making key operating and resource utilization decisions. None of these operating segments met the
F-41
MAMMOTH ENERGY SERVICES, INC.
NOTES TO CONSOLIDATED FINANCIAL STATEMENTS
quantitative thresholds of a reporting segment and did not meet the aggregation criteria set forth in ASC 280 Segment Reporting for the year ended
December 31, 2018
. Therefore, results for these operating segments are included in the column labeled "All Other" in the tables below for the years ended
December 31, 2018
and
2017
. Additionally, assets for corporate activities, which primarily include cash and cash equivalents, inter-segment accounts receivable, prepaid insurance and certain property and equipment, are included in the All Other column. Although Mammoth LLC, which holds these corporate assets, meets one of the quantitative thresholds of a reporting segment, it does not engage in business activities from which it may earn revenues and its results are not regularly reviewed by the Company's CODM when making key operating and resource utilization decisions. Therefore, the Company does not include it as a reportable segment.
Prior to 2017, information used by the CODM in measuring segment profits or losses did not include intersegment revenues and costs as they were deemed immaterial for decision-making purposes. In 2017, the Company's CODM changed the way segment profits and losses are measured to include intersegment revenues and expenses. The historical results by segment below for the year ended
December 31, 2016
have been revised to reflect this change in measurement method.
Sales from one segment to another are generally priced at estimated equivalent commercial selling prices. Total revenue and total cost of revenue amounts included in the Eliminations column in the following tables include inter-segment transactions conducted between segments. Receivables due for sales from one segment to another and for corporate allocations to each segment are included in the Eliminations column for total assets in the following tables. All transactions conducted between segments are eliminated in consolidation. Transactions conducted by companies within the same reporting segment are eliminated within each reporting segment. The following tables set forth certain financial information with respect to the Company’s reportable segments (in thousands):
|
Year Ended December 31, 2018
|
Infrastructure
|
Pressure Pumping
|
Sand
|
All Other
|
Eliminations
|
Total
|
||||||||||||
|
Revenue from external customers
|
$
|
1,082,371
|
|
$
|
362,491
|
|
$
|
100,816
|
|
$
|
144,406
|
|
$
|
—
|
|
$
|
1,690,084
|
|
|
Intersegment revenues
|
—
|
|
7,001
|
|
67,459
|
|
5,516
|
|
(79,976
|
)
|
—
|
|
||||||
|
Total revenue
|
1,082,371
|
|
369,492
|
|
168,275
|
|
149,922
|
|
(79,976
|
)
|
1,690,084
|
|
||||||
|
Cost of revenue, exclusive of depreciation, depletion, amortization and accretion
|
608,017
|
|
223,296
|
|
126,714
|
|
135,777
|
|
—
|
|
1,093,804
|
|
||||||
|
Intersegment cost of revenues
|
2,583
|
|
70,365
|
|
6,103
|
|
898
|
|
(79,949
|
)
|
—
|
|
||||||
|
Total cost of revenue
|
610,600
|
|
293,661
|
|
132,817
|
|
136,675
|
|
(79,949
|
)
|
1,093,804
|
|
||||||
|
Selling, general and administrative
(a)
|
27,126
|
|
29,761
|
|
6,218
|
|
9,992
|
|
—
|
|
73,097
|
|
||||||
|
Depreciation, depletion, amortization and accretion
|
20,516
|
|
51,487
|
|
13,519
|
|
34,355
|
|
—
|
|
119,877
|
|
||||||
|
Impairment of long-lived assets
|
308
|
|
143
|
|
—
|
|
8,404
|
|
—
|
|
8,855
|
|
||||||
|
Operating income (loss)
|
423,821
|
|
(5,560
|
)
|
15,721
|
|
(39,504
|
)
|
(27
|
)
|
394,451
|
|
||||||
|
Interest expense
|
423
|
|
1,171
|
|
234
|
|
1,359
|
|
—
|
|
3,187
|
|
||||||
|
Other expense
|
573
|
|
434
|
|
525
|
|
504
|
|
—
|
|
2,036
|
|
||||||
|
Income (loss) before income taxes
|
$
|
422,825
|
|
$
|
(7,165
|
)
|
$
|
14,962
|
|
$
|
(41,367
|
)
|
$
|
(27
|
)
|
$
|
389,228
|
|
|
Total expenditures for property, plant and equipment
|
$
|
100,701
|
|
$
|
33,774
|
|
$
|
17,935
|
|
$
|
39,533
|
|
$
|
—
|
|
$
|
191,943
|
|
|
As of December 31, 2018:
|
||||||||||||||||||
|
Goodwill
|
$
|
3,828
|
|
$
|
86,043
|
|
$
|
2,684
|
|
$
|
8,690
|
|
$
|
—
|
|
$
|
101,245
|
|
|
Intangible assets, net
|
$
|
1,650
|
|
$
|
4,059
|
|
$
|
—
|
|
$
|
2,047
|
|
$
|
—
|
|
$
|
7,756
|
|
|
Total assets
|
$
|
366,457
|
|
$
|
254,278
|
|
$
|
177,870
|
|
$
|
122,442
|
|
$
|
152,044
|
|
$
|
1,073,091
|
|
|
a.
|
Included in Pressure Pumping selling, general and administrative expense is non-cash equity based compensation expense of
$17.5 million
.
|
F-42
MAMMOTH ENERGY SERVICES, INC.
NOTES TO CONSOLIDATED FINANCIAL STATEMENTS
|
Year Ended December 31, 2017
|
Infrastructure
|
Pressure Pumping
|
Sand
|
All Other
|
Eliminations
|
Total
|
||||||||||||
|
Revenue from external customers
|
$
|
224,425
|
|
$
|
277,326
|
|
$
|
90,023
|
|
$
|
99,722
|
|
$
|
—
|
|
$
|
691,496
|
|
|
Intersegment revenue
|
—
|
|
2,026
|
|
27,014
|
|
2,527
|
|
(31,567
|
)
|
—
|
|
||||||
|
Total revenue
|
224,425
|
|
279,352
|
|
117,037
|
|
102,249
|
|
(31,567
|
)
|
691,496
|
|
||||||
|
Cost of revenue, exclusive of depreciation, depletion, amortization and accretion
|
120,117
|
|
183,089
|
|
91,049
|
|
88,314
|
|
—
|
|
482,569
|
|
||||||
|
Intersegment cost of revenues
|
1,443
|
|
28,147
|
|
1,731
|
|
211
|
|
(31,532
|
)
|
—
|
|
||||||
|
Total cost of revenue
|
121,560
|
|
211,236
|
|
92,780
|
|
88,525
|
|
(31,532
|
)
|
482,569
|
|
||||||
|
Selling, general and administrative
|
21,606
|
|
9,501
|
|
8,190
|
|
10,589
|
|
—
|
|
49,886
|
|
||||||
|
Depreciation and amortization
|
3,185
|
|
45,413
|
|
9,394
|
|
34,132
|
|
—
|
|
92,124
|
|
||||||
|
Impairment of long-lived assets
|
—
|
|
—
|
|
324
|
|
3,822
|
|
—
|
|
4,146
|
|
||||||
|
Operating income (loss)
|
78,074
|
|
13,202
|
|
6,349
|
|
(34,819
|
)
|
(35
|
)
|
62,771
|
|
||||||
|
Interest expense
|
241
|
|
1,622
|
|
679
|
|
1,768
|
|
—
|
|
4,310
|
|
||||||
|
Bargain purchase gain
|
—
|
|
—
|
|
(4,012
|
)
|
—
|
|
—
|
|
(4,012
|
)
|
||||||
|
Other expense
|
6
|
|
129
|
|
211
|
|
331
|
|
—
|
|
677
|
|
||||||
|
Income (loss) before income taxes
|
$
|
77,827
|
|
$
|
11,451
|
|
$
|
9,471
|
|
$
|
(36,918
|
)
|
$
|
(35
|
)
|
$
|
61,796
|
|
|
Total expenditures for property, plant and equipment
|
$
|
20,144
|
|
$
|
85,853
|
|
$
|
16,376
|
|
$
|
11,480
|
|
$
|
—
|
|
$
|
133,853
|
|
|
As of December 31, 2017:
|
||||||||||||||||||
|
Goodwill
|
$
|
891
|
|
$
|
86,043
|
|
$
|
2,684
|
|
$
|
10,193
|
|
$
|
—
|
|
$
|
99,811
|
|
|
Intangible assets, net
|
$
|
1,770
|
|
$
|
12,392
|
|
$
|
—
|
|
$
|
1,977
|
|
$
|
—
|
|
$
|
16,139
|
|
|
Total assets
|
$
|
205,275
|
|
$
|
297,140
|
|
$
|
190,859
|
|
$
|
255,641
|
|
$
|
(81,672
|
)
|
$
|
867,243
|
|
|
Year Ended December 31, 2016
|
Pressure Pumping
|
Well Services
|
Sand
|
Drilling
|
Other Energy Services
|
Eliminations
|
Total
|
||||||||||||||
|
Revenue from external customers
|
$
|
123,856
|
|
$
|
10,024
|
|
$
|
33,835
|
|
$
|
32,043
|
|
$
|
30,867
|
|
$
|
—
|
|
$
|
230,625
|
|
|
Intersegment revenues
|
569
|
|
79
|
|
4,267
|
|
—
|
|
—
|
|
(4,915
|
)
|
—
|
|
|||||||
|
Total revenue
|
124,425
|
|
10,103
|
|
38,102
|
|
32,043
|
|
30,867
|
|
(4,915
|
)
|
230,625
|
|
|||||||
|
Cost of revenue, exclusive of depreciation, depletion, amortization and accretion
|
82,552
|
|
13,540
|
|
31,895
|
|
31,848
|
|
13,186
|
|
—
|
|
173,021
|
|
|||||||
|
Intersegment cost of revenues
|
4,336
|
|
26
|
|
561
|
|
(8
|
)
|
—
|
|
(4,915
|
)
|
—
|
|
|||||||
|
Total cost of revenue
|
86,888
|
|
13,566
|
|
32,456
|
|
31,840
|
|
13,186
|
|
(4,915
|
)
|
173,021
|
|
|||||||
|
Selling, general and administrative
|
4,327
|
|
2,336
|
|
3,337
|
|
5,625
|
|
2,423
|
|
—
|
|
18,048
|
|
|||||||
|
Depreciation, depletion, amortization and accretion
|
37,013
|
|
5,128
|
|
6,483
|
|
21,512
|
|
2,179
|
|
—
|
|
72,315
|
|
|||||||
|
Impairment of long-lived assets
|
139
|
|
1,385
|
|
—
|
|
347
|
|
—
|
|
—
|
|
1,871
|
|
|||||||
|
Operating loss
|
(3,942
|
)
|
(12,312
|
)
|
(4,174
|
)
|
(27,281
|
)
|
13,079
|
|
—
|
|
(34,630
|
)
|
|||||||
|
Interest expense
|
599
|
|
134
|
|
434
|
|
2,829
|
|
100
|
|
—
|
|
4,096
|
|
|||||||
|
Other expense (income)
|
27
|
|
(566
|
)
|
96
|
|
248
|
|
37
|
|
—
|
|
(158
|
)
|
|||||||
|
(Loss) income before income taxes
|
$
|
(4,568
|
)
|
$
|
(11,880
|
)
|
$
|
(4,704
|
)
|
$
|
(30,358
|
)
|
$
|
12,942
|
|
$
|
—
|
|
$
|
(38,568
|
)
|
|
Total expenditures for property, plant and equipment
|
7,673
|
|
405
|
|
528
|
|
2,709
|
|
425
|
|
—
|
|
11,740
|
|
|||||||
|
As of December 31, 2016:
|
|||||||||||||||||||||
|
Goodwill
|
$
|
86,043
|
|
$
|
—
|
|
$
|
2,684
|
|
$
|
—
|
|
$
|
—
|
|
$
|
—
|
|
$
|
88,727
|
|
|
Intangible assets, net
|
$
|
21,435
|
|
$
|
132
|
|
$
|
—
|
|
$
|
—
|
|
$
|
—
|
|
$
|
—
|
|
$
|
21,567
|
|
|
Total assets
|
$
|
197,635
|
|
$
|
128,698
|
|
$
|
109,128
|
|
$
|
99,868
|
|
$
|
48,653
|
|
$
|
(81,620
|
)
|
$
|
502,362
|
|
F-43
MAMMOTH ENERGY SERVICES, INC.
NOTES TO CONSOLIDATED FINANCIAL STATEMENTS
Geographic Areas
The following table presents consolidated revenues by country based on sales destination of the products or services (in thousands):
|
Year Ended December 31,
|
||||||||||||
|
2018
|
2017
|
2016
|
||||||||||
|
United States
|
$
|
654,506
|
|
$
|
471,745
|
|
$
|
196,573
|
|
|||
|
Puerto Rico
|
1,022,558
|
|
203,087
|
|
—
|
|
||||||
|
Canada
|
13,020
|
|
16,664
|
|
34,052
|
|
||||||
|
Total
|
$
|
1,690,084
|
|
$
|
691,496
|
|
$
|
230,625
|
|
|||
The following table presents long-lived assets, excluding deferred income tax assets, by country (in thousands):
|
Year Ended December 31,
|
||||||||||||
|
2018
|
2017
|
2016
|
||||||||||
|
United States
|
$
|
571,555
|
|
$
|
515,904
|
|
$
|
389,575
|
|
|||
|
Puerto Rico
|
32,604
|
|
6,923
|
|
—
|
|
||||||
|
Canada
|
19,376
|
|
23,254
|
|
23,848
|
|
||||||
|
Total
|
$
|
623,535
|
|
$
|
546,081
|
|
$
|
413,423
|
|
|||
22. Quarterly Financial Data (unaudited)
|
Three Months Ended
|
|||||||||||||||
|
March 31,
|
June 30,
|
September 30,
|
December 31,
|
Total
|
|||||||||||
|
2018
|
2018
|
2018
|
2018
|
||||||||||||
|
(in thousands, except per share data)
|
|||||||||||||||
|
Revenue from external customers
|
$
|
433,699
|
|
$
|
483,253
|
|
$
|
361,323
|
|
$
|
268,576
|
|
$
|
1,546,851
|
|
|
Revenue from related parties
|
60,550
|
|
50,341
|
|
22,720
|
|
9,622
|
|
143,233
|
|
|||||
|
Cost of revenue, exclusive of depreciation, depletion, amortization and accretion
|
326,101
|
|
339,828
|
|
247,565
|
|
180,310
|
|
1,093,804
|
|
|||||
|
Selling, general and administrative expenses
(a, b)
|
38,511
|
|
65,127
|
|
(45,324
|
)
|
14,783
|
|
73,097
|
|
|||||
|
Depreciation, depletion, amortization and accretion
|
26,908
|
|
30,795
|
|
32,015
|
|
30,159
|
|
119,877
|
|
|||||
|
Impairment of long-lived assets
|
—
|
|
187
|
|
4,582
|
|
4,086
|
|
8,855
|
|
|||||
|
Operating income
|
102,729
|
|
97,657
|
|
145,205
|
|
48,860
|
|
394,451
|
|
|||||
|
Interest expense
|
1,237
|
|
959
|
|
458
|
|
533
|
|
3,187
|
|
|||||
|
Other expense
|
28
|
|
486
|
|
400
|
|
1,122
|
|
2,036
|
|
|||||
|
Income before income taxes
|
101,464
|
|
96,212
|
|
144,347
|
|
47,205
|
|
389,228
|
|
|||||
|
Provision for income taxes
|
45,918
|
|
53,512
|
|
74,835
|
|
(21,002
|
)
|
153,263
|
|
|||||
|
Net income
|
$
|
55,546
|
|
$
|
42,700
|
|
$
|
69,512
|
|
$
|
68,207
|
|
$
|
235,965
|
|
|
Net income per share (basic) (Note 16)
|
$
|
1.24
|
|
$
|
0.95
|
|
$
|
1.55
|
|
$
|
1.52
|
|
$
|
5.27
|
|
|
Net income per share (diluted) (Note 16)
|
$
|
1.24
|
|
$
|
0.95
|
|
$
|
1.54
|
|
$
|
1.51
|
|
$
|
5.24
|
|
|
Weighted average number of shares outstanding (Note 16)
|
44,650
|
|
44,737
|
|
44,756
|
|
44,845
|
|
44,750
|
|
|||||
|
Weighted average number of shares outstanding, including dilutive effect (Note 16)
|
44,884
|
|
45,059
|
|
45,082
|
|
45,048
|
|
45,021
|
|
|||||
|
a.
|
Includes bad debt expense of
$25.5 million
and
$28.3 million
, respectively, for the three months ended March 31, 2018 and June 30, 2018 primarily related to specific reserves made related to the Company's contract with PREPA. During the three months ended September 30, 2018, the Company received payment for amounts previously reserved in 2017 related to the contract with PREPA. As a result, during the three months ended September 30, 2018, the Company reversed bad debt expense of
$16.0 million
recognized in 2017 and
$53.6 million
recognized in the first half of 2018.
|
F-44
MAMMOTH ENERGY SERVICES, INC.
NOTES TO CONSOLIDATED FINANCIAL STATEMENTS
|
b.
|
Includes
$17.5 million
for the three months ended June 30, 2018 related to non-employee non-cash equity compensation expense.
|
|
Three Months Ended
|
|||||||||||||||
|
March 31,
|
June 30,
|
September 30,
|
December 31,
|
Total
|
|||||||||||
|
2017
|
2017
|
2017
|
2017
|
||||||||||||
|
(in thousands, except per share data)
|
|||||||||||||||
|
Revenue from external customers
|
$
|
30,464
|
|
$
|
40,054
|
|
$
|
78,389
|
|
$
|
333,569
|
|
$
|
482,476
|
|
|
Revenue from related parties
|
44,502
|
|
58,208
|
|
70,916
|
|
35,394
|
|
209,020
|
|
|||||
|
Cost of revenue, exclusive of depreciation, depletion, amortization and accretion
|
58,498
|
|
77,340
|
|
114,533
|
|
232,198
|
|
482,569
|
|
|||||
|
Selling, general and administrative expenses
(a)
|
6,737
|
|
7,700
|
|
8,023
|
|
27,426
|
|
49,886
|
|
|||||
|
Depreciation, depletion, amortization and accretion
|
17,237
|
|
19,893
|
|
27,224
|
|
27,770
|
|
92,124
|
|
|||||
|
Impairment of long-lived assets
|
—
|
|
—
|
|
—
|
|
4,146
|
|
4,146
|
|
|||||
|
Operating (loss) income
|
(7,506
|
)
|
(6,671
|
)
|
(475
|
)
|
77,423
|
|
62,771
|
|
|||||
|
Interest expense
|
397
|
|
1,112
|
|
1,420
|
|
1,381
|
|
4,310
|
|
|||||
|
Bargain purchase gain
|
—
|
|
(4,012
|
)
|
—
|
|
—
|
|
(4,012
|
)
|
|||||
|
Other expense (income)
|
184
|
|
202
|
|
319
|
|
(28
|
)
|
677
|
|
|||||
|
(Loss) income before income taxes
|
(8,087
|
)
|
(3,973
|
)
|
(2,214
|
)
|
76,070
|
|
61,796
|
|
|||||
|
(Benefit) provision for income taxes
|
(3,106
|
)
|
(2,804
|
)
|
(1,413
|
)
|
10,155
|
|
2,832
|
|
|||||
|
Net (loss) income
|
$
|
(4,981
|
)
|
$
|
(1,169
|
)
|
$
|
(801
|
)
|
$
|
65,915
|
|
$
|
58,964
|
|
|
Net (loss) income per share (basic) (Note 16)
|
$
|
(0.13
|
)
|
$
|
(0.03
|
)
|
$
|
(0.02
|
)
|
$
|
1.48
|
|
$
|
1.42
|
|
|
Net (loss) income per share (diluted) (Note 16)
|
$
|
(0.13
|
)
|
$
|
(0.03
|
)
|
$
|
(0.02
|
)
|
$
|
1.48
|
|
$
|
1.42
|
|
|
Weighted average number of shares outstanding (basic) (Note 16)
|
37,500
|
|
39,500
|
|
44,502
|
|
44,579
|
|
41,548
|
|
|||||
|
Weighted average number of shares outstanding (diluted) (Note 16)
|
37,500
|
|
39,500
|
|
44,502
|
|
44,683
|
|
41,639
|
|
|||||
|
a.
|
Includes bad debt expense of
$16.0 million
for the three months ended December 31, 2017 primarily related to specific reserves made related to the Company's contract with PREPA. As noted above, the Company received payment from PREPA and, as a result, reversed the expense of
$16.0 million
during the three months ended September 30, 2018.
|
|
23.
|
Subsequent Events
|
On March 13, 2019, the Company borrowed
$82.0 million
on its amended and restated revolving credit facility.
On January 28, 2019, the Company's board of Directors declared a quarterly cash dividend of
$0.125
per share of common stock, which was paid on February 14, 2019 to stockholders of record as of the close of business on February 7, 2019. The total dividend paid was
$5.6 million
.
Subsequent to
December 31, 2018
, the Company ordered additional capital equipment with aggregate commitments of
$13.0 million
.
Subsequent to
December 31, 2018
, the Company issued additional bid bonds and payment and performance bonds totaling
$1.8 million
and
$1.8 million
, respectively.
F-45
TABLE OF CONTENTS
Part IItem 1. BusinessItem 1A. Risk FactorsItem 1B. Unresolved Staff CommentsItem 2. PropertiesItem 3. Legal ProceedingsItem 4. Mine Safety DisclosuresPart II. Other InformationItem 5. Market For Registrant's Common Equity, Related Stockholder Matters and Issuer Purchases Of Equity SecuritiesItem 6. Selected Financial DataItem 7. Management S Discussion and Analysis Of Financial Condition and Results Of OperationsItem 7A. Quantitative and Qualitative Disclosures About Market RiskItem 8. Financial Statements and Supplementary DataItem 9. Changes in and Disagreements with Accountants on Accounting and Financial DisclosureItem 9A. Controls and ProceduresItem 9B. Other InformationPart IIIItem 10. Directors, Executive Officers and Corporate GovernanceItem 11. Executive CompensationItem 12. Security Ownership Of Certain Beneficial Owners and Management and Related Stockholder MattersItem 13. Certain Relationships and Related Transactions and Director IndependenceItem 14. Principal Accountant Fees and ServicesPart IVItem 15. Exhibits, Financial Statement SchedulesItem 16. Form 10-k Summary