TENNESSEE VALLEY AUTHORITY
10-Ks and 10-Qs
UNITED STATES
SECURITIES AND EXCHANGE COMMISSION
Washington, D.C. 20549
FORM 10-K
(MARK ONE)
x
ANNUAL REPORT PURSUANT TO
SECTION 13, 15(d), OR 37 OF THE SECURITIES EXCHANGE ACT OF 1934
For the fiscal year ended
September 30, 2018
OR
o
TRANSITION REPORT PURSUANT TO SECTION 13 OR 15(d) OF THE SECURITIES EXCHANGE ACT OF 1934
For the transition period from _____ to _____

Commission file number 000-52313
TENNESSEE VALLEY AUTHORITY
(Exact name of registrant as specified in its charter)
|
A corporate agency of the United States created by an act of Congress
(State or other jurisdiction of incorporation or organization)
|
62-0474417
(IRS Employer Identification No.)
|
||
|
|
|||
|
400 W. Summit Hill Drive
Knoxville, Tennessee
(Address of principal executive offices)
|
|
37902
(Zip Code)
|
|
(865) 632-2101
(Registrant’s telephone number, including area code)
Securities registered pursuant to Section 12(b) of the Act: None
Securities registered pursuant to Section 12(g) of the Act: None
Indicate by check mark whether the registrant (1) has filed all reports required to be filed by Section 13, 15(d), or 37 of the Securities Exchange Act of 1934 during the preceding 12 months (or for such shorter period that the registrant was required to file such reports), and (2) has been subject to such filing requirements for the past 90 days.
Yes
x
No
o
Indicate by check mark whether the registrant has submitted electronically every Interactive Data File required to be submitted pursuant to Rule 405 of Regulation S-T (§ 232.405 of this chapter) during the preceding 12 months (or for such shorter period that the registrant was required to submit such files).
Yes
x
No
o
Indicate by check mark whether the registrant is a large accelerated filer, an accelerated filer, a non-accelerated filer, a smaller reporting company, or an emerging growth company. See the definitions of “large accelerated filer,” “accelerated filer,” “smaller reporting company,” and "emerging growth company" in Rule 12b-2 of the Exchange Act.
Large accelerated filer
o
Accelerated filer
o
Non-accelerated filer
x
Smaller reporting company
o
Emerging growth company
o
If an emerging growth company, indicate by check mark if the registrant has elected not to use the extended transition period for complying with any new or revised financial accounting standards provided pursuant to Section 13(a) of the Exchange Act.
o
Indicate by check mark whether the registrant is a shell company (as defined in Rule 12b-2 of the Exchange Act).
Yes
o
No
x
1
|
Table of Contents
|
|
|
GLOSSARY OF COMMON ACRONYMS
.......................................................................................................................................................................................................
|
|
|
FORWARD-LOOKING INFORMATION
.........................................................................................................................................................................................................
|
|
|
GENERAL INFORMATION
............................................................................................................................................................................................................................
|
|
|
|
|
|
|
|
|
ITEM 1. BUSINESS......................................................................................................................................................................................................................................
|
|
|
The Corporation
.................................................................................................................................................................................................................................
|
|
|
Service Area
.......................................................................................................................................................................................................................................
|
|
|
Customers
..........................................................................................................................................................................................................................................
|
|
|
Rates
..................................................................................................................................................................................................................................................
|
|
|
Power Supply and Load Management Resources.............................................................................................................................................................................
|
|
|
Fuel Supply
.........................................................................................................................................................................................................................................
|
|
|
Transmission
......................................................................................................................................................................................................................................
|
|
|
Weather and Seasonality
....................................................................................................................................................................................................................
|
|
|
Competition
........................................................................................................................................................................................................................................
|
|
|
Research and Development
...............................................................................................................................................................................................................
|
|
|
Flood Control
Activities
.......................................................................................................................................................................................................................
|
|
|
Environmental Stewardship Activities
.................................................................................................................................................................................................
|
|
|
Economic Development Activities
......................................................................................................................................................................................................
|
|
|
Regulation
..........................................................................................................................................................................................................................................
|
|
|
Taxation and Tax Equivalents
.............................................................................................................................................................................................................
|
|
|
Environmental Matters
.......................................................................................................................................................................................................................
|
|
|
Employees
..........................................................................................................................................................................................................................................
|
|
|
|
|
|
ITEM 1A. RISK FACTORS
............................................................................................................................................................................................................................
|
|
|
|
|
|
ITEM 1B. UNRESOLVED STAFF COMMENTS
............................................................................................................................................................................................
|
|
|
|
|
|
ITEM 2. PROPERTIES
..................................................................................................................................................................................................................................
|
|
|
Generating Properties
........................................................................................................................................................................................................................
|
|
|
Transmission Properties
.....................................................................................................................................................................................................................
|
|
|
Natural Resource Stewardship Properties
.........................................................................................................................................................................................
|
|
|
Buildings
.............................................................................................................................................................................................................................................
|
|
|
Disposal of Property
...........................................................................................................................................................................................................................
|
|
|
|
|
|
ITEM 3. LEGAL PROCEEDINGS
..................................................................................................................................................................................................................
|
|
|
|
|
|
ITEM 4.
MINE SAFETY DISCLOSURES......................................................................................................................................................................................................
|
|
|
|
|
|
|
|
|
|
|
|
ITEM 6. SELECTED FINANCIAL DATA
........................................................................................................................................................................................................
|
|
|
|
|
|
ITEM 7. MANAGEMENT’S DISCUSSION AND ANALYSIS OF FINANCIAL CONDITION AND RESULTS OF OPERATIONS
...................................................................
|
|
|
Business and Mission.........................................................................................................................................................................................................................
|
|
|
Executive
Overview............................................................................................................................................................................................................................
|
|
|
Results of Operations.........................................................................................................................................................................................................................
|
|
|
Liquidity and Capital Resources.........................................................................................................................................................................................................
|
|
|
Off-Balance Sheet Arrangements.......................................................................................................................................................................................................
|
|
|
Key Initiatives and Challenges...........................................................................................................................................................................................................
|
|
|
Critical Accounting Policies and Estimates
.........................................................................................................................................................................................
|
|
|
Fair Value Measurements...................................................................................................................................................................................................................
|
|
|
New Accounting Standards and Interpretations
.................................................................................................................................................................................
|
|
|
Legislative and Regulatory Matters
....................................................................................................................................................................................................
|
|
|
Environmental Matters.......................................................................................................................................................................................................................
|
|
|
Legal Proceedings..............................................................................................................................................................................................................................
|
|
|
Risk Management Activities
...............................................................................................................................................................................................................
|
|
|
|
|
|
ITEM 7A. QUANTITATIVE AND QUALITATIVE DISCLOSURES ABOUT MARKET RISK
...........................................................................................................................
|
|
|
|
|
|
ITEM 8. FINANCIAL STATEMENTS AND SUPPLEMENTARY DATA
..........................................................................................................................................................
|
|
|
Consolidated Balance Sheets............................................................................................................................................................................................................
|
|
|
Consolidated
Statements of Operations
.............................................................................................................................................................................................
|
|
|
Consolidated
Statements of
Comprehensive Income (Loss).............................................................................................................................................................
|
|
|
Consolidated
Statements of Cash Flows
...........................................................................................................................................................................................
|
|
|
Consolidated
Statements of Changes in Proprietary Capital
.............................................................................................................................................................
|
|
2
|
Notes to Consolidated Financial Statements.....................................................................................................................................................................................
|
|
|
Report of Independent Registered Public Accounting Firm
...............................................................................................................................................................
|
|
|
|
|
|
ITEM 9. CHANGES IN AND DISAGREEMENTS WITH ACCOUNTANTS ON ACCOUNTING AND FINANCIAL DISCLOSURE
...............................................................
|
|
|
|
|
|
ITEM 9A. CONTROLS AND PROCEDURES
...............................................................................................................................................................................................
|
|
|
Disclosure Controls and Procedures
..................................................................................................................................................................................................
|
|
|
Internal Control over Financial Reporting
...........................................................................................................................................................................................
|
|
|
Report of Independent Registered Public Accounting Firm
................................................................................................................................................................
|
|
|
|
|
|
ITEM 9B. OTHER INFORMATION
................................................................................................................................................................................................................
|
|
|
ITEM 10. DIRECTORS, EXECUTIVE OFFICERS, AND CORPORATE GOVERNANCE
.............................................................................................................................
|
|
|
Directors..............................................................................................................................................................................................................................................
|
|
|
Executive Officers...............................................................................................................................................................................................................................
|
|
|
Disclosure and Financial Code of Ethics............................................................................................................................................................................................
|
|
|
Committees of the TVA Board............................................................................................................................................................................................................
|
|
|
|
|
|
ITEM 11. EXECUTIVE COMPENSATION
.....................................................................................................................................................................................................
|
|
|
Compensation Discussion and Analysis.............................................................................................................................................................................................
|
|
|
Executive Compensation Tables and Narrative Disclosures..............................................................................................................................................................
|
|
|
Retirement and Pension Plans...........................................................................................................................................................................................................
|
|
|
Nonqualified Deferred Compensation................................................................................................................................................................................................
|
|
|
Potential Payments on Account of Retirement/Resignation, Termination without Cause, Termination with Cause, Death, or Disability...........................................
|
|
|
Other Agreements..............................................................................................................................................................................................................................
|
|
|
CEO Pay Ratio Disclosure.................................................................................................................................................................................................................
|
|
|
Director Compensation.......................................................................................................................................................................................................................
|
|
|
Compensation Committee Interlocks and Insider Participation..........................................................................................................................................................
|
|
|
Compensation Committee Report......................................................................................................................................................................................................
|
|
|
ITEM 12. SECURITY OWNERSHIP OF CERTAIN BENEFICIAL OWNERS AND MANAGEMENT AND RELATED STOCKHOLDER MATTERS
......................................
|
|
|
|
|
|
ITEM 13. CERTAIN RELATIONSHIPS AND RELATED TRANSACTIONS, AND DIRECTOR INDEPENDENCE
.........................................................................................
|
|
|
Director Independence.......................................................................................................................................................................................................................
|
|
|
Related Party Transactions................................................................................................................................................................................................................
|
|
|
|
|
|
ITEM 14. PRINCIPAL ACCOUNTANT FEES AND SERVICES
......................................................................................................................................................................
|
|
|
|
|
|
|
|
|
ITEM 15. EXHIBITS, FINANCIAL STATEMENT SCHEDULES
.....................................................................................................................................................................
|
|
|
|
|
|
ITEM 16. FORM 10-K SUMMARY.................................................................................................................................................................................................................
|
|
|
SIGNATURES
................................................................................................................................................................................................................................................
|
|
|
|
|
3
|
GLOSSARY OF COMMON ACRONYMS
|
||
|
Following are definitions of some of the terms or acronyms that may be used in this Annual Report on Form 10-K for the fiscal year ended September 30, 2018 (the “Annual Report”):
|
||
|
|
||
|
Term or Acronym
|
Definition
|
|
|
AFUDC
|
Allowance for funds used during construction
|
|
|
AOCI
|
Accumulated other comprehensive income (loss)
|
|
|
ARO
|
Asset retirement obligation
|
|
|
ART
|
Asset Retirement Trust
|
|
|
ASLB
|
Atomic Safety and Licensing Board
|
|
|
BLEU
|
Blended low-enriched uranium
|
|
|
Bonds
|
Bonds, notes, or other evidences of indebtedness
|
|
|
BSER
|
Best system of emission reduction
|
|
|
CAA
|
Clean Air Act
|
|
|
CAIR
|
Clean Air Interstate Rule
|
|
|
CCR
|
Coal combustion residuals
|
|
|
CERCLA
|
Comprehensive Environmental Response, Compensation, and Liability Act
|
|
|
CME
|
Chicago Mercantile Exchange
|
|
|
CO
2
|
Carbon dioxide
|
|
|
COL
|
Combined construction and operating license application
|
|
|
COLA
|
Cost-of-living adjustment
|
|
|
CSAPR
|
Cross-State Air Pollution Rule
|
|
|
CTs
|
Combustion turbine unit(s)
|
|
|
CVA
|
Credit valuation adjustment
|
|
|
CY
|
Calendar year
|
|
|
DCP
|
Deferred Compensation Plan
|
|
|
DER
|
Distributed Energy Resources
|
|
|
DOE
|
Department of Energy
|
|
|
EIS
|
Environmental Impact Statement
|
|
|
EPA
|
Environmental Protection Agency
|
|
|
EPRI
|
Electric Power Research Institute
|
|
|
ERS
|
EnergyRight
®
Solutions programs
|
|
|
ESPA
|
Early Site Permit Application
|
|
|
FASB
|
Financial Accounting Standards Board
|
|
|
FCM
|
Futures Commission Merchant
|
|
|
FERC
|
Federal Energy Regulatory Commission
|
|
|
FPA
|
Federal Power Act
|
|
|
FTP
|
Financial Trading Program
|
|
|
GAAP
|
Accounting principles generally accepted in the United States of America
|
|
|
GHG
|
Greenhouse gas
|
|
|
GP
|
Generation Partners
|
|
|
GPP
|
Green Power Providers
|
|
|
GPS
|
Green Power Switch
®
|
|
|
GWh
|
Gigawatt hour(s)
|
|
|
HMM
|
Hydro Major Maintenance Program
|
|
|
IRP
|
Integrated Resource Plan
|
|
|
IRUs
|
Indefeasible rights of use
|
|
|
JSCCG
|
John Sevier Combined Cycle Generation LLC
|
|
|
kW
|
Kilowatts
|
|
|
kWh
|
Kilowatt hour(s)
|
|
|
LPC
|
Local power company customer of TVA
|
|
|
LTDCP
|
Long-Term Deferred Compensation Plan
|
|
|
MATS
|
Mercury and Air Toxics Standards
|
|
|
MD&A
|
Management’s Discussion and Analysis of Financial Condition and Results of Operations
|
|
|
MLGW
|
Memphis Light, Gas and Water Division
|
|
|
MLPs
|
Master Limited Partnerships
|
|
|
mmBtu
|
Million British thermal unit(s)
|
|
|
MtM
|
Mark-to-market
|
|
4
|
MW
|
Megawatt
|
|
|
NAAQS
|
National Ambient Air Quality Standards
|
|
|
NAV
|
Net asset value
|
|
|
NDT
|
Nuclear Decommissioning Trust
|
|
|
NEIL
|
Nuclear Electric Insurance Limited
|
|
|
NEPA
|
National Environmental Policy Act
|
|
|
NERC
|
North American Electric Reliability Corporation
|
|
|
NES
|
Nashville Electric Service
|
|
|
NO
2
|
Nitrogen dioxide
|
|
|
NO
x
|
Nitrogen oxides
|
|
|
NPDES
|
National Pollutant Discharge Elimination System
|
|
|
NRC
|
Nuclear Regulatory Commission
|
|
|
NSR
|
New Source Review
|
|
|
NYSE
|
New York Stock Exchange
|
|
|
OCI
|
Other comprehensive income (loss)
|
|
|
OMB
|
Office of Management and Budget
|
|
|
PARRS
|
Putable Automatic Rate Reset Securities
|
|
|
PM
|
Particulate matter
|
|
|
QER
|
Quadrennial Energy Review
|
|
|
QTE
|
Qualified technological equipment and software
|
|
|
RECs
|
Renewable Energy Certificates
|
|
|
REIT
|
Real Estate Investment Trust
|
|
|
RSO
|
Renewable Standard Offer
|
|
|
SCCG
|
Southaven Combined Cycle Generation LLC
|
|
|
SCRs
|
Selective catalytic reduction systems
|
|
|
SEC
|
Securities and Exchange Commission
|
|
|
SERP
|
Supplemental Executive Retirement Plan
|
|
|
SHLLC
|
Southaven Holdco LLC
|
|
|
SMR
|
Small modular reactor(s)
|
|
|
SO
2
|
Sulfur dioxide
|
|
|
SOA
|
Society of Actuaries
|
|
|
SSSL
|
Seven States Southaven, LLC
|
|
|
TCWN
|
Tennessee Clean Water Network
|
|
|
TDEC
|
Tennessee Department of Environment & Conservation
|
|
|
TIPS
|
Treasury Inflation-Protected Securities
|
|
|
TOU
|
Time-of-use
|
|
|
TVA Act
|
The Tennessee Valley Authority Act of 1933, as amended, 16 U.S.C. §§ 831-831ee
|
|
|
TVARS
|
Tennessee Valley Authority Retirement System
|
|
|
U.S. Treasury
|
United States Department of the Treasury
|
|
|
USACE
|
U.S. Army Corps of Engineers
|
|
|
VIE
|
Variable interest entity
|
|
|
XBRL
|
eXtensible Business Reporting Language
|
|
5
FORWARD-LOOKING INFORMATION
This
Annual Report on Form 10-K ("Annual Report")
contains forward-looking statements relating to future events and future performance. All statements other than those that are purely historical may be forward-looking statements. In certain cases, forward-looking statements can be identified by the use of words such as "may," "will," "should," "expect," "anticipate," "believe," "intend," "project," "plan," "predict," "assume," "forecast," "estimate," "objective," "possible," "probably," "likely," "potential," "speculate," the negative of such words, or other similar expressions.
Although the
Tennessee Valley Authority ("TVA")
believes that the assumptions underlying the forward-looking statements are reasonable, TVA does not guarantee the accuracy of these statements. Numerous factors could cause actual results to differ materially from those in the forward-looking statements. These factors include, among other things:
|
•
|
New, amended, or existing laws, regulations, or administrative orders or interpretations, including those related to environmental matters, and the costs of complying with these laws, regulations, or administrative orders or interpretations;
|
|
•
|
The cost of complying with known, anticipated, or new emissions reduction requirements, some of which could render continued operation of many of TVA's aging coal-fired generation units not cost-effective or result in their removal from service, perhaps permanently;
|
|
•
|
Significant reductions in demand for electricity produced through non-renewable or centrally located generation sources that may result from, among other things, economic downturns, increased energy efficiency and conservation, increased utilization of distributed generation and microgrids, and improvements in alternative generation and energy storage technologies;
|
|
•
|
Changes in customer preferences for energy produced from cleaner generation sources;
|
|
•
|
Changes in technology;
|
|
•
|
Actions taken, or inaction, by the U.S. government relating to the national or TVA debt ceiling or automatic spending cuts in government programs;
|
|
•
|
Costs or liabilities that are not anticipated in TVA’s financial statements for third-party claims, natural resource damages, environmental clean-up activities, or fines or penalties associated with unexpected events such as failures of a facility or infrastructure;
|
|
•
|
Addition or loss of customers by TVA or the
local power company customers of TVA ("LPCs")
;
|
|
•
|
Significant delays, cost increases, or cost overruns associated with the construction and maintenance of generation, transmission, navigation, flood control, or related assets;
|
|
•
|
Changes in the amount or timing of funding obligations associated with TVA's pension plans, other post-retirement benefit plans, or health care plans;
|
|
•
|
Increases in TVA's financial liabilities for decommissioning its nuclear facilities or retiring other assets;
|
|
•
|
Risks associated with the operation of nuclear facilities or coal combustion residual ("CCR") facilities;
|
|
•
|
Physical attacks on TVA's assets;
|
|
•
|
Cyber attacks on TVA's assets or the assets of third parties upon which TVA relies;
|
|
•
|
The outcome of legal or administrative proceedings, including the CCR proceedings involving the
Gallatin Fossil Plant ("Gallatin")
as well as any other CCR proceedings that may be brought in the future;
|
|
•
|
The failure of TVA's generation, transmission, navigation, flood control, and related assets and infrastructure, including CCR facilities, to operate as anticipated, resulting in lost revenues, damages, or other costs that are not reflected in TVA’s financial statements or projections;
|
|
•
|
Differences between estimates of revenues and expenses and actual revenues earned and expenses incurred;
|
|
•
|
Weather conditions;
|
|
•
|
Catastrophic events such as fires, earthquakes, explosions, solar events,
electromagnetic pulses ("EMP")
,
geomagnetic disturbances ("GMDs")
, droughts, floods, hurricanes, tornadoes, or other casualty events or pandemics, wars, national emergencies, terrorist activities, or other similar events, especially if these events occur in or near TVA's service area;
|
|
•
|
Events at a TVA facility, which, among other things, could result in loss of life, damage to the environment, damage to or loss of the facility, and damage to the property of others;
|
|
•
|
Events or changes involving transmission lines, dams, and other facilities not operated by TVA, including those that affect the reliability of the interstate transmission grid of which TVA's transmission system is a part and those that increase flows across TVA's transmission grid;
|
|
•
|
Disruption of fuel supplies, which may result from, among other things, economic conditions, weather conditions, production or transportation difficulties, labor challenges, or environmental laws or regulations affecting TVA's fuel suppliers or transporters;
|
|
•
|
Purchased power price volatility and disruption of purchased power supplies;
|
|
•
|
Events which affect the supply of water for TVA's generation facilities;
|
|
•
|
Changes in TVA's determinations of the appropriate mix of generation assets;
|
|
•
|
Ineffectiveness of TVA's efforts at adapting its organization to an evolving marketplace and remaining cost competitive;
|
|
•
|
Inability to obtain, or loss of, regulatory approval for the construction or operation of assets;
|
|
•
|
The requirement or decision to make additional contributions to TVA's
Nuclear Decommissioning Trust ("NDT")
or
Asset Retirement Trust ("ART")
;
|
6
|
•
|
Limitations on TVA's ability to borrow money which may result from, among other things, TVA's approaching or substantially reaching the limit on bonds, notes, and other evidences of indebtedness specified in the Tennessee Valley Authority Act of 1933, as amended, 16 U.S.C. §§ 831-831ee (the “TVA Act”);
|
|
•
|
An increase in TVA's cost of capital that may result from, among other things, changes in the market for TVA's debt securities, changes in the credit rating of TVA or the U.S. government, or, potentially, an increased reliance by TVA on alternative financing should TVA approach its debt limit;
|
|
•
|
Changes in the economy and volatility in financial markets;
|
|
•
|
Reliability or creditworthiness of counterparties;
|
|
•
|
Changes in the market price of commodities such as coal, uranium, natural gas, fuel oil, crude oil, construction materials, reagents, electricity, or emission allowances;
|
|
•
|
Changes in the market price of equity securities, debt securities, or other investments;
|
|
•
|
Changes in interest rates, currency exchange rates, or inflation rates;
|
|
•
|
Ineffectiveness of TVA's disclosure controls and procedures or its internal control over financial reporting;
|
|
•
|
Inability to eliminate identified deficiencies in TVA's systems, standards, controls, or corporate culture;
|
|
•
|
Inability to attract or retain a skilled workforce;
|
|
•
|
Inability to respond quickly enough to current or potential customer demands or needs;
|
|
•
|
Events at a nuclear facility, whether or not operated by or licensed to TVA, which, among other things, could lead to increased regulation or restriction on the construction, ownership, operation, or decommissioning of nuclear facilities or on the storage of spent fuel, obligate TVA to pay retrospective insurance premiums, reduce the availability and affordability of insurance, increase the costs of operating TVA's existing nuclear units, or cause TVA to forego future construction at these or other facilities;
|
|
•
|
Loss of quorum of the TVA Board of Directors (the "TVA Board");
|
|
•
|
Changes in the priorities of the TVA Board or TVA senior management; or
|
|
•
|
Other unforeseeable events.
|
See also Item 1A, Risk Factors, and Item 7, Management’s Discussion and Analysis of Financial Condition and Results of Operations. New factors emerge from time to time, and it is not possible for management to predict all such factors or to assess the extent to which any factor, or combination of factors, may impact TVA’s business or cause results to differ materially from those contained in any forward-looking statement. TVA undertakes no obligation to update any forward-looking statement to reflect developments that occur after the statement is made.
GENERAL INFORMATION
Fiscal Year
References to years (
2018
,
2017
, etc.) in this Annual Report are to TVA’s fiscal years ending September 30 except for references to years in the biographical information about directors and executive officers in Item 10, Directors, Executive Officers and Corporate Governance, as well as to years that are preceded by “CY,” which references are to calendar years.
Notes
References to “Notes” are to the Notes to Consolidated Financial Statements contained in Item 8, Financial Statements and Supplementary Data in this Annual Report.
Property
TVA does not own real property and real property interests (collectively, "real property"). TVA acquires real property in the name of the United States, and such legal title in real property is entrusted to TVA as the agent of the United States to accomplish the purposes of the TVA Act. TVA acquires personal property in the name of TVA. Accordingly, unless the context indicates the reference is to TVA’s personal property, any statement in this Annual Report referring to TVA property shall be read as referring to the real property of the United States that has been entrusted to TVA as its agent.
Available Information
TVA files annual, quarterly, and current reports with the
Securities and Exchange Commission ("SEC")
under Section 37 of the Securities Exchange Act of 1934. TVA’s SEC filings are available to the public on the SEC’s website at www.sec.gov or on TVA's website at www.tva.gov. Information contained on TVA's website shall not be deemed to be incorporated into, or to be a part of, this Annual Report.
7
The Corporation
Tennessee Valley Authority ("TVA")
is a corporate agency and instrumentality of the
United States ("U.S.")
that was created in 1933 by federal legislation in response to a proposal by President Franklin D. Roosevelt. TVA was created to, among other things, improve navigation on the Tennessee River, reduce the damage from destructive flood waters within the Tennessee River system and downstream on the lower Ohio and Mississippi Rivers, further the economic development of TVA’s service area in the southeastern United States, and sell the electricity generated at the facilities TVA operates. Today, TVA operates the nation’s largest public power system and supplies power to a population of nearly 10 million people.
TVA manages the Tennessee River, its tributaries, and certain shorelines to provide, among other things, year-round navigation, flood damage reduction, and affordable and reliable electricity. Consistent with these primary purposes, TVA also manages the river system to provide recreational opportunities, adequate water supply, improved water quality, natural resource protection, and economic development. TVA performs these management duties in cooperation with other federal and state agencies that have jurisdiction and authority over certain aspects of the river system. In addition, the
TVA Board of Directors (the "TVA Board")
has established two councils — the Regional Resource Stewardship Council and the
Regional Energy Resource Council ("RERC")
— to advise TVA on its stewardship activities in the Tennessee Valley and its energy resource activities.
Initially, all TVA operations were funded by federal appropriations. Direct appropriations for the TVA power program ended in 1959, and appropriations for TVA’s stewardship, economic development, and multipurpose activities ended in 1999. Since 1999, TVA has funded all of its operations almost entirely from the sale of electricity and power system financings. TVA’s power system financings consist primarily of the sale of debt securities and secondarily of alternative forms of financing, such as lease arrangements. As a wholly-owned government corporation, TVA is not authorized to issue equity securities.
8
Service Area
TVA's service area, the area in which it sells power, is defined by the TVA Act. TVA supplies power in most of Tennessee, northern Alabama, northeastern Mississippi, and southwestern Kentucky and in portions of northern Georgia, western North Carolina, and southwestern Virginia. Under the TVA Act, subject to certain minor exceptions, TVA may not, without the enactment of authorizing federal legislation, enter into contracts that would have the effect of making it, or the wholesale customers that distribute TVA power ("local power company customers" or "LPCs"), a source of power supply outside the area for which TVA or its LPCs were the primary source of power supply on July 1, 1957. This provision is referred to as the “fence” because it bounds TVA’s sales activities, essentially limiting TVA to power sales within a defined service area.
Note
See
Power Supply and Load Management Resources.
In addition, the
Federal Power Act ("FPA")
includes a provision that helps protect TVA’s ability to sell power within its service area. This provision, called the "anti-cherrypicking" provision, prevents the
Federal Energy Regulatory Commission ("FERC")
from ordering TVA to provide access to its transmission lines to others to deliver power to customers within TVA’s defined service area. As a result, the anti-cherrypicking provision reduces TVA’s exposure to loss of its customers.
9
In
2018
, the revenues generated from TVA’s electricity sales were
$11.1 billion
and accounted for virtually all of TVA’s revenues. TVA’s revenues by state for each of the last three years are detailed in the table below.
|
Operating Revenues By State
For the years ended September 30
(in millions)
|
|||||||||||
|
|
2018
|
2017
|
2016
|
||||||||
|
Alabama
|
$
|
1,600
|
|
$
|
1,524
|
|
$
|
1,504
|
|
||
|
Georgia
|
267
|
|
252
|
|
255
|
|
|||||
|
Kentucky
|
696
|
|
665
|
|
640
|
|
|||||
|
Mississippi
|
1,052
|
|
1,016
|
|
999
|
|
|||||
|
North Carolina
|
66
|
|
57
|
|
58
|
|
|||||
|
Tennessee
|
7,350
|
|
7,041
|
|
6,968
|
|
|||||
|
Virginia
|
48
|
|
47
|
|
48
|
|
|||||
|
Subtotal
|
11,079
|
|
10,602
|
|
10,472
|
|
|||||
|
Off-system sales
|
7
|
|
6
|
|
7
|
|
|||||
|
Revenue capitalized during pre-commercial plant operations
(1)
|
(11
|
)
|
|
(22
|
)
|
(18
|
)
|
||||
|
Revenue from sales of electricity
|
11,075
|
|
10,586
|
|
10,461
|
|
|||||
|
Other revenues
|
158
|
|
153
|
|
155
|
|
|||||
|
Total operating revenues
|
$
|
11,233
|
|
$
|
10,739
|
|
$
|
10,616
|
|
||
Note
(1) Represents revenue capitalized during pre-commercial operations of
$11 million
at
Allen Combined Cycle Plant ("Allen CC")
in 2018, $22 million at
Watts Bar Nuclear Plant ("Watts Bar")
Unit 2, Paradise Combined Cycle Plant, and Allen CC in 2017, and $18 million at Watts Bar Unit 2 in 2016. See
Note 1
—
Pre-Commercial Plant Operations
.
Customers
TVA is primarily a wholesaler of power, selling power to LPCs that then resell power to their customers at retail rates. TVA’s LPCs consist of (1)
municipalities and other local government entities ("municipalities")
and (2)
customer-owned entities ("cooperatives")
. These municipalities and cooperatives operate public power electric systems whose primary purpose is not to make a profit but to supply electricity to the general public or the cooperatives' members. TVA also sells power directly to certain end-use customers, primarily large commercial and industrial loads and federal agencies with loads larger than 5,000
kilowatts ("kW")
.
Whether TVA or an LPC serves a new power customer is determined by the applicable TVA-LPC wholesale power contract. Each contract contains a formula that balances the size of the LPC and the amount of any TVA infrastructure investment to determine which party is entitled to serve the new customer.
In addition, power in excess of the needs of the TVA system may, where consistent with the provisions of the
Tennessee Valley Authority Act of 1933 (the "TVA Act")
, be sold under exchange power arrangements with other specific electric systems. See Item 7, Management's Discussion and Analysis of Financial Condition and Results of Operations —
Results of Operations
—
Financial Results
—
Operating Revenues
.
|
Operating Revenues by Customer Type
For the years ended September 30
(in millions)
|
|||||||||||
|
|
2018
|
2017
|
2016
|
||||||||
|
Revenue from sales of electricity
|
|
|
|
||||||||
|
Local power companies
|
$
|
10,262
|
|
$
|
9,741
|
|
$
|
9,696
|
|
||
|
Industries directly served
|
695
|
|
735
|
|
649
|
|
|||||
|
Federal agencies and other
|
129
|
|
132
|
|
134
|
|
|||||
|
Revenue capitalized during pre-commercial plant operations
(1)
|
(11
|
)
|
(22
|
)
|
(18
|
)
|
|||||
|
Revenue from sales of electricity
|
11,075
|
|
10,586
|
|
10,461
|
|
|||||
|
Other revenues
|
158
|
|
153
|
|
155
|
|
|||||
|
Total operating revenues
|
$
|
11,233
|
|
$
|
10,739
|
|
$
|
10,616
|
|
||
Note
(1) Represents revenue capitalized during pre-commercial operations of
$11 million
at Allen CC in 2018, $22 million at Watts Bar Unit 2, Paradise Combined Cycle Plant, and Allen CC in 2017, and $18 million at Watts Bar Unit 2 in 2016. See
Note 1
—
Pre-Commercial Plant Operations
.
10
Local Power Companies
Revenues from LPCs accounted for approximately
91
percent of TVA’s total operating revenues in
2018
. At
September 30, 2018
, TVA had wholesale power contracts with
154
LPCs. Each of these contracts requires the LPC to purchase from TVA all of the electric power required for service to the LPC’s customers. LPCs purchase power under contracts that range from five to 20 years to terminate.
See table below for LPC information by contract arrangement term.
|
TVA Local Power Company Contracts
At September 30, 2018
|
|||||||||
|
Contract Arrangements
(1)
|
Number of LPCs
|
Sales to LPCs
in 2018 (in millions) |
Percentage of Total Operating Revenues in 2018
|
||||||
|
20-year termination notice
|
3
|
|
$
|
133
|
|
1.2
|
%
|
||
|
15-year termination notice
|
11
|
|
498
|
|
4.5
|
%
|
|||
|
12-year termination notice
|
1
|
|
26
|
|
0.2
|
%
|
|||
|
10-year termination notice
|
51
|
|
3,507
|
|
31.2
|
%
|
|||
|
6-year termination notice
|
1
|
|
49
|
|
0.4
|
%
|
|||
|
5-year termination notice
|
87
|
|
6,049
|
|
53.9
|
%
|
|||
|
Total
|
154
|
|
$
|
10,262
|
|
91.4
|
%
|
||
Note
(1) Ordinarily, the LPCs and TVA have the same termination notice period; however, in contracts with five of the LPCs with five-year termination notices, TVA has a 10-year termination notice (which becomes a five-year termination notice if TVA loses its discretionary wholesale rate-setting authority). Two of the LPCs have five-year termination notices or a shorter period if any act of Congress, court decision, or regulatory change requires or permits that election.
TVA’s two largest LPCs —
Memphis Light, Gas and Water Division ("MLGW")
and
Nashville Electric Service ("NES")
— have contracts with a five-year and a 10-year termination notice period, respectively. Sales to MLGW and NES accounted for nine percent and eight percent, respectively, of TVA’s total operating revenues in
2018
.
The power contracts between TVA and LPCs provide for the purchase of power by LPCs at the wholesale rates established by the TVA Board. Under the TVA Act, the TVA Board is authorized to regulate LPCs to carry out the purposes of the TVA Act through contract terms and conditions as well as through rules and regulations. TVA regulates LPCs primarily through the provisions of TVA’s wholesale power contracts. All of the power contracts between TVA and the LPCs require that power purchased from TVA be sold and distributed to the ultimate consumer without discrimination among consumers of the same class and prohibit direct or indirect discriminatory rates, rebates, or other special concessions. In addition, there are a number of wholesale power contract provisions through which TVA seeks to ensure that the electric system revenues of the LPCs are used only for electric system purposes. Furthermore, almost all of these contracts specify the resale rates and charges at which the LPC must resell TVA power to its customers. These rates are revised from time to time, subject to TVA approval, to reflect changes in costs, including changes in the wholesale cost of power.
TVA also regulates LPC policies for customer deposits, termination of service for non-payment, information to consumers, and billing through a service practice policy framework. TVA’s regulatory framework provides for consistent regulatory policy for ratepayers across the Tennessee Valley, while recognizing local considerations. The regulatory provisions in TVA’s wholesale power contracts are designed to carry out the objectives of the TVA Act, including the objective of providing for adequate supply of power at the lowest feasible rates. See
Rates — Rate Methodology
below.
Other Customers
Revenues from directly served industrial customers accounted for approximately
six
percent of TVA’s total operating revenues in
2018
. Contracts with these customers are subject to termination by the customer or TVA upon a minimum notice period that varies according to a number of factors, including the customer’s contract demand and the period of time service has been provided. TVA also serves
seven
federal customers, including U.S.
Department of Energy ("DOE")
facilities and military installations, which accounted for approximately one percent of TVA’s total operating revenues in
2018
.
Other Revenue
Other revenue consists primarily of wheeling and network transmission charges, sales of excess steam that is a by-product of power production, delivery point charges for interconnection points between TVA and the customer, and certain other minor items. Other revenue accounted for $158 million, or approximately one percent, of TVA’s total operating revenues in
2018
.
11
Rates
Rate Authority
The TVA Act gives the TVA Board sole responsibility for establishing the rates TVA charges for power. These rates are not subject to judicial review or to review or approval by any state or federal regulatory body. Under the TVA Act, TVA is required to charge rates for power that will produce gross revenues sufficient to provide funds for:
|
•
|
Operation, maintenance, and administration of its power system;
|
|
•
|
Payments to states and counties in lieu of taxes ("tax equivalents")
;
|
|
•
|
Debt service on outstanding indebtedness;
|
|
•
|
Payments to the U.S. Treasury in repayment of and as a return on the government's appropriation investment in TVA's power facilities (the "Power Program Appropriation Investment")
; and
|
|
•
|
Such additional margin as the TVA Board may consider desirable for investment in power system assets, retirement of outstanding
bonds, notes, or other evidences of indebtedness ("collectively, Bonds")
in advance of their maturity, additional reduction of the Power Program Appropriation Investment, and other purposes connected with TVA’s power business, having due regard for the primary objectives of the TVA Act, including the objective that power shall be sold at rates as low as are feasible. See
Note 17
—
Appropriation Investment
.
|
TVA fulfilled its requirement to repay $1.0 billion of the Power Program Appropriation Investment in 2014; therefore, the repayment of this amount is no longer a component of rate setting.
Rate Methodology
TVA uses a wholesale rate structure comprised of a base rate and a fuel rate that is automatically determined each month by the operation of the fuel cost adjustment formula. In setting the base rates, TVA uses a
debt-service coverage ("DSC")
methodology to derive annual revenue requirements in a manner similar to that used by other public power entities that also use the DSC rate methodology. Under the DSC methodology, rates are calculated so that an entity will be able to cover its operating costs and to satisfy its obligations to pay principal and interest on debt. This ratemaking approach is particularly suitable for use by entities financed primarily, if not entirely, by debt, such as TVA, and helps ensure that TVA produces gross revenues sufficient to fund requirements specified in the TVA Act listed under
Rate Authority
above.
TVA recovers fuel costs and tax equivalents payments associated with fuel cost adjustments through a monthly rate adjustment reflecting the costs paid by TVA for fuel. Beginning on October 1, 2018, fuel costs are allocated to three groups of customers: Standard Service (residential and small commercial customers), Large Manufacturing customers with contract demands greater than 5 MW, and Large General Service customers with contract demands greater than 5 MW. Fuel costs are allocated to these three classes of customers in relation to their average hourly loads and TVA's hourly incremental dispatch costs. Total monthly fuel costs include costs for natural gas, fuel oil, coal, purchased power, emission allowances, nuclear fuel, and other fuel-related commodities as well as realized gains and losses on derivatives purchased to hedge the costs of such commodities.
Since the fall of 2013, TVA, LPCs, and directly served industries have worked collaboratively to develop changes to TVA's rates that focus on TVA’s long-term pricing efforts. A comprehensive rate restructuring was implemented in October 2015 to improve pricing by better aligning rates with underlying cost drivers and to send improved pricing signals, while maintaining competitive industrial rates and keeping residential rates affordable.
Consistent with the pricing goals and changes implemented in the 2015 rate restructuring, TVA staff recommended, and the TVA Board approved, the proposed 2018 rate change on May 10, 2018. This change will reduce wholesale energy rates for Standard Service and introduce a
Grid Access Charge ("GAC")
at an offsetting rate to better recover fixed costs. Recognizing the need for flexibility, TVA presented all LPCs with the option to implement the wholesale changes in October 2018 or defer the implementation of the GAC until October 2019. The 2018 rate change better reflects the wholesale cost of energy and recognizes the value of the grid’s reliability and associated fixed costs. This modernized approach to pricing provides bill stability while maintaining reliability and fairness for all TVA's customers.
Power Supply and Load Management Resources
General
TVA seeks to balance production capabilities with power supply requirements by promoting the conservation and efficient use of electricity and, when necessary, buying, building, or leasing assets or entering into power purchase agreements. TVA also seeks to employ a diverse mix of energy generating sources and works toward obtaining greater amounts of its power supply from clean (low or zero carbon emitting) resources.
12
Power generating facilities operated by TVA at
September 30, 2018
, included
29
conventional hydroelectric sites, one pumped-storage hydroelectric site, six coal-fired sites, three nuclear sites, 17 natural gas and/or oil-fired sites, one diesel generator site,
14 solar
energy sites, digester gas co-firing capacity at one coal-fired site, and biomass co-firing potential (located at coal-fired sites), although certain of these facilities were out of service as of
September 30, 2018
. See Item 2, Properties —
Generating Properties
—
Net Capability
for a discussion of these facilities. TVA also acquires power under power purchase agreements of varying durations, including short-term contracts of less than 24-hours in duration. See Item 7, Management's Discussion and Analysis of Financial Condition and Results of Operations —
Results of Operations
—
Financial Results
—
Operating Expenses
.
The following table shows TVA's generation and purchased power by generating source as a percentage of all
electric power generated and purchased (based on
kilowatt hours ("kWh")
) for the periods indicated:
|
Power Supply by Generating Source
For the years ended September 30
|
||||||
|
Generation Resource
|
2018
|
2017
|
2016
|
|||
|
Nuclear
|
39%
|
|
38%
|
|
33%
|
|
|
Natural gas and/or oil-fired
|
20%
|
|
16%
|
|
16%
|
|
|
Coal-fired
|
19%
|
25%
|
|
29%
|
||
|
Hydroelectric
|
9%
|
|
7%
|
|
8%
|
|
|
Purchased power (non-renewable)
|
9%
|
|
9%
|
|
9%
|
|
|
Purchased power (renewable)
|
4%
|
|
5%
|
|
5%
|
|
Note
TVA's non-hydro renewable resources from TVA facilities are less than one percent for all periods shown, and therefore are not represented on the table above. Purchased power (renewable) contains the majority of non-hydro renewable energy supply.
Nuclear
At
September 30, 2018
, TVA had three nuclear sites consisting of seven units in operation. The units at
Browns Ferry Nuclear Plant ("Browns Ferry")
are boiling water reactor units, and the units at
Sequoyah Nuclear Plant ("Sequoyah")
and Watts Bar are pressurized water reactor units. Operating information for each of these units is included in the table below.
|
TVA Nuclear Power
At September 30, 2018
|
||||||
|
Nuclear Unit
|
Summer Net Capability (MW)
|
Net Capacity
Factor for
2018 (%)
|
Date of Expiration
of Operating
License
|
|||
|
Browns Ferry Unit 1
|
1,101
|
|
94.5
|
|
2033
|
|
|
Browns Ferry Unit 2
|
1,103
|
|
96.3
|
|
2034
|
|
|
Browns Ferry Unit 3
|
1,105
|
|
83.9
|
|
2036
|
|
|
Sequoyah Unit 1
|
1,152
|
85.7
|
2040
|
|||
|
Sequoyah Unit 2
|
1,140
|
97.9
|
2041
|
|||
|
Watts Bar Unit 1
|
987
|
95.5
|
2035
|
|||
|
Watts Bar Unit 2
|
1,135
|
78.3
|
2055
|
|||
Note
The summer net capability for Browns Ferry excludes the impact of the Extended Power Uprate project. The generating capability is expected to increase by an estimated 465 MW after completion of the project and sufficient run time to validate the new capacity.
Extended Power Uprate
. On August 14, 2017, the
Nuclear Regulatory Commission ("NRC")
approved TVA’s request for a 465 MW
extended power uprate ("EPU")
project at Browns Ferry. TVA is implementing the EPU project during plant refueling outages. Physical work on Unit 3 was completed, and the unit was synced to the grid in April 2018. On July 13, 2018, Unit 3 reached the new EPU 100 percent power. Work is underway for Unit 1 and will commence in the spring of 2019 for Unit 2.
Full EPU power is expected to be achieved following the noted outages
and extensive power ascension testing
for each unit.
See Item 7, Management’s Discussion and Analysis of Financial Condition and Results of Operations —
Key Initiatives and Challenges
—
Generation Resources
—
Extended Power Uprate.
Other Nuclear Initiatives
. TVA has submitted an Early Site Permit Application to the NRC to license
small modular reactors ("SMRs")
at TVA’s Clinch River Site in Oak Ridge, Tennessee. See Item 7, Management’s Discussion and Analysis of Financial Condition and Results of Operations —
Key Initiatives and Challenges
—
Generation Resources
—
Small Modular Reactors
.
Other Nuclear Matters.
Operating nuclear facilities subjects TVA to waste disposal, decommissioning, and insurance requirements, as well as litigation risks. See
Fuel Supply
—
Nuclear Fuel
below for a discussion of spent nuclear fuel and
low-
13
level radioactive waste ("radwaste")
,
Note 21
— Contingencies
for a discussion of TVA's nuclear decommissioning liabilities and the related trust and nuclear insurance, and
Note 21
— Legal Proceedings
for a discussion of legal and administrative proceedings related to TVA's nuclear program, which discussions are incorporated herein by reference.
Coal-Fired
As of
September 30, 2018
, TVA had six coal-fired plants consisting of
26
active units, accounting for
7,886
MW of summer net capability. Coal-fired units are either active or retired. TVA considers units to be in an active state when the unit is generating, available for service, or temporarily unavailable due to equipment failures, inspections, or repairs. All other coal-fired units are considered retired.
Coal-fired plants have been subject to increasingly stringent regulatory requirements over the last few decades, including those under the
Clean Air Act ("CAA")
and the regulations promulgated thereunder. Increasing regulatory costs have caused TVA to consider whether or not to make the required capital investments to continue operating these coal-fired facilities. In April 2011, TVA entered into two agreements (collectively, the "Environmental Agreements") to address a dispute under the CAA. The first agreement is a Federal Facilities Compliance Agreement with the
Environmental Protection Agency ("EPA")
. The second agreement is with Alabama, Kentucky, North Carolina, Tennessee, and three environmental advocacy groups: the Sierra Club, National Parks Conservation Association, and Our Children’s Earth Foundation. Under the Environmental Agreements, TVA agreed to retire 18 of its 59 coal-fired units by the end of 2017 and was generally absolved from any liability, subject to certain limitations and exceptions, under the
New Source Review ("NSR")
requirements of the CAA for maintenance, repair, and component replacement projects that were commenced at TVA's coal-fired units prior to the execution of the agreements. TVA also agreed to retire, repower, or install air pollution controls on 16 of the remaining coal-fired units. As of
September 30, 2018
, TVA has completed the requirements in the Environmental Agreements related to retiring coal-fired units or installing controls on such units. See
Natural Gas
and/or Oil-Fired
below
.
TVA is moving toward a more balanced generation plan with greater reliance on lower-cost and cleaner energy generation technologies. Since September 30, 2010, TVA has reduced its summer net capability of coal-fired units by 6,682 MW. TVA’s long-range plans will continue to consider the costs and benefits of significant environmental investments at its remaining coal-fired plants.
Natural Gas and/or Oil-Fired
As of
September 30, 2018
, TVA’s natural gas and oil-fired fleet consisted of
101
combustion turbine power blocks (
87
simple-cycle units and
14
combined-cycle power units). Sixty of the simple-cycle units are currently capable of quick-start response allowing full generation capability in approximately 10 minutes. The economic dispatch of natural gas-fired plants depends on both the day-to-day price of natural gas and the price of other available intermediate resources such as coal-fired plants. TVA uses simple-cycle units to meet peaking or backup power needs. TVA also uses cogeneration at one simple-cycle unit.
TVA’s strategy of portfolio diversification and air emissions reductions includes the addition of natural gas-fired plants to its generation fleet. In April 2018, TVA completed a natural gas-fired facility at the former
Allen Fossil Plant ("Allen")
with a generation capacity of approximately
1,106
MW. As of
September 30, 2018
, TVA had no natural gas-fired facilities under construction. See Item 7, Management's Discussion and Analysis of Financial Condition and Results of Operations —
Key Initiatives and Challenges
—
Generation Resources
—
Coal and Natural Gas-Fired Units
.
See Item 2, Properties
— Generating Properties,
Note 9
,
Note 10
, and
Note 13
for a discussion of lease arrangements into which TVA has entered in connection with certain combustion turbine units. Because of TVA's strategy of portfolio diversification and reduction of air emissions, TVA may decide to make further strategic investments in natural gas-fired facilities in the future by purchase, construction, or lease.
Hydroelectric
Conventional Hydroelectric Dams
. TVA maintains
29
conventional hydroelectric dams with 109 generating units throughout the Tennessee River system for the production of electricity. As of
September 30, 2018
, these units accounted for 3,782 MW of summer net capability. The amount of electricity that TVA is able to generate from its hydroelectric plants depends on a number of factors, including the amount of precipitation and runoff, initial water levels, generating unit availability, and the need for water for competing water management objectives. When these factors are unfavorable, TVA must increase its reliance on higher cost generation plants and purchased power. In addition, a portion of energy generated by nine
U.S. Army Corps of Engineers ("USACE")
dams on the Cumberland River system contributes to the TVA power system. See
Weather and Seasonality
below and
Item 7,
Management's Discussion and Analysis of Financial Condition and Results of Operations
— Key Initiatives and Challenges — Dam Safety and Remediation Initiatives.
Raccoon Mountain Pumped-Storage Plant
. As of
September 30, 2018
, TVA has
four
units at
Raccoon Mountain Pumped-Storage Plant ("Raccoon Mountain")
with a total net summer capability of
1,616
MW. These units are utilized to balance the transmission system as well as generate power. TVA uses electricity generated by its fleet during periods of low
14
demand to operate pumps that fill the reservoir at Raccoon Mountain. Then, during periods of high or peak demand, the water is released and the pumps reverse to work as power generating turbines.
Hiwassee Hydro Unit 2.
Hiwassee Hydro Unit 2 has a unique reversible turbine/generator that acts as a pump and a turbine enhancing TVA’s ability to balance baseload generation. Hiwassee Hydro Unit 2 has a summer net capability of 86 MW.
Hydro Modernization Program
. TVA is scheduled to complete the Hydro Modernization Program in 2019 with the completion of South Holston Unit 1 and
Pickwick Landing Dam ("Pickwick")
Unit 2. The Hydro Modernization program began in 1992 and focuses on units with potential to increase peaking capacity and improve reliability. As of
September 30, 2018
, modernization had been completed on 60 conventional hydroelectric units, including Pickwick Unit 3 in 2018. The modernization projects resulted in 444 MW of increased capacity from the conventional hydroelectric units, with an average efficiency gain of approximately five percent. In 2019, TVA will transition to a new program, the Hydro Major Maintenance Program, intended to focus on life extension and addressing reliability risks that will support the preservation of TVA’s hydro fleet capacity. Hydroelectric generation will continue to be an important part of TVA's energy mix.
Other Renewable Energy Resources
TVA's renewable energy portfolio includes both TVA-owned assets and renewable energy purchases. TVA owns
14 solar
sites with a total net summer capability of approximately 1 MW. Certain coal-fired units have the capability for digester gas and biomass co-firing, which is accounted for as coal-fired generation summer net capability.
TVA tracks its renewable energy commitments and claims through the management of
renewable energy certificates ("RECs")
. The RECs, which each represent 1 MWh of renewable energy generation, are principally associated with wind, solar, biomass, and low-impact hydroelectric. TVA also acquires RECs from renewable purchased power.
Diesel Generators
As of
September 30, 2018
, TVA had one diesel generator plant consisting of five units, and this facility accounted for 9
MW of summer net capability.
Distributed Energy Resources
Consumer desire for energy choice is, among other things, driving the expectation for flexible options in the electric industry. TVA and LPCs are working together to leverage the strengths of the Tennessee Valley public power model to provide distributed energy solutions that are economic, sustainable, and flexible. TVA will focus on the safety and reliability impacts of these resources as they are interconnected to the grid and will ensure that the pricing of electricity remains as low as feasible. Additional regulatory considerations and analysis may be required as the
distributed energy resources ("DER")
market, technologies, and programs evolve. TVA will work to develop pricing and regulatory structures with a deliberate and thoughtful analysis of each current and future program offering. This will require strong partnerships with LPCs to reinforce local control, provide customers choices, and provide end-use consumers the flexibility they desire. In May 2017, the TVA Board authorized up to $300 million to be spent over the next 10 years, subject to annual budget availability and necessary environmental reviews, to build an enhanced fiber network that will better connect its operational assets. Fiber is a vital part of TVA’s modern communication infrastructure. The new fiber optic lines will improve the reliability and resiliency of the generation and transmission system while enabling the system to better accommodate DER as they enter the market.
TVA has encouraged the development of solar, wind, biomass, and low-impact hydroelectric generation systems across the Tennessee Valley through various current and former offerings. As of
September 30, 2018
, the combined participation for all such renewable solutions is approximately 450 MW of installed operating capacity with nearly 134 MW of additional approved capacity. Additionally, TVA contracts for approximately 1,215 MW of operating wind capacity from outside the Tennessee Valley via power purchase agreements.
New energy management systems and energy storage technologies present opportunities for more sophisticated and integrated operation of the entire grid. The advent of electric vehicles and small-scale renewable generation has hastened the development of battery technologies that have the potential to mitigate the intermittent supply issues associated with many renewable generation options. Implementation of these technologies in conjunction with two-way communication to the site creates the potential for more efficient usage of other DER on the grid.
Onsite energy management technologies and the proliferation of companies interested in providing services to support and aggregate the impacts of such systems provide another DER opportunity. Such systems can afford the consumer benefits through reduced consumption, increased comfort, detailed energy use data, and savings from time-sensitive rate structures. TVA and LPCs must consider the integration of the impacts from changes in energy usage patterns resulting from the operation of such systems.
Demand response systems that take advantage of the increasing sophistication in communication to homes, businesses, and distribution system assets also afford the opportunity for more granular control of system demand.
15
Technologies can manage individual customer systems to shift usage from peak to off-peak periods and create significant reductions in the need for peak generation output. More sophisticated distribution control systems can also lower peak demand through control of excess voltage on the grid on either a dispatchable or continuous basis.
TVA is leading an initiative to determine the value of DER for its system. Initial efforts are focused on small-scale distributed (rooftop) solar, but the efforts are general enough to allow for other distributed options. These efforts are ongoing, led by a team that includes technical support from the
Electric Power Research Institute ("EPRI")
, to develop a methodology to identify site preferences on the distribution systems of the LPCs. This work, along with locational analysis already completed by TVA, will help in placing utility-scale solar in furtherance of the Integrated Resource Plan recommendations as well as distributed solar to meet the needs of LPCs. See
Research and Development
below
.
Purchased Power and Other Agreements
TVA acquires power from a variety of power producers through long-term and short-term power purchase agreements as well as through spot market purchases. During
2018
, TVA acquired approximately 11 percent of the power that it purchased on the spot market, approximately one percent through short-term power purchase agreements, and approximately 88 percent through the long-term power purchase agreements described below, including agreements for long-term renewable generation resources.
A portion of TVA’s capability provided by power purchase agreements is provided under contracts that expire between 2023 and
2038
, and the most significant of these contracts are described in the table below.
|
Power Purchase Contracts
At September 30, 2018
|
||||||
|
Type of Facility
|
Location
|
Summer Net Capability
(MW)
|
Contract Termination Date
|
|||
|
Lignite
|
Mississippi
|
440
|
2032
|
|||
|
Natural gas
|
Alabama
|
720
|
2023
|
|||
|
Natural gas
|
Alabama
|
615
|
2026
|
|||
|
Solar
|
Alabama
|
75
|
2037
|
|||
|
Solar
(1)
|
Tennessee
|
53
|
2038
|
|||
|
Solar
|
Tennessee
|
4.8
|
2031
|
|||
|
Solar
|
Tennessee
|
4.5
|
2032
|
|||
|
Hydroelectric
(2)
|
Tennessee and Kentucky
|
347
|
Upon three years' notice
|
|||
|
Wind
|
Iowa
|
198
|
2031
|
|||
|
Wind
|
Iowa
|
101
|
2030
|
|||
|
Wind
|
Kansas
|
201
|
2032
|
|||
|
Wind
|
Kansas
|
165
|
2033
|
|||
|
Wind
|
Illinois
|
150
|
2032
|
|||
|
Wind
|
Illinois
|
200
|
2032
|
|||
|
Wind
|
Illinois
|
200
|
2033
|
|||
|
Wind
|
Tennessee
|
27
|
2025
|
|||
Notes
(1) Power delivery is expected to commence in the second quarter of 2019.
(2) TVA’s contract with Southeastern Power Administration ("SEPA") is for 405 MW of capacity; however, at September 30, 2018, TVA’s capacity under the contract was 347 MW because of repairs being completed by the USACE. TVA expects this period of reduced capacity to be in effect until July 2019.
Under federal law, TVA is required to purchase energy from qualifying facilities (cogenerators and small power producers) at TVA's avoided cost of either generating this energy itself or purchasing this energy from another source. TVA fulfills this requirement through the Dispersed Power Production Program. As of
September 30, 2018
, there were 36 generation sources, with a combined qualifying capacity of
259
MW, whose power TVA purchases under this program.
Fuel Supply
General
TVA’s consumption of various types of fuel depends largely on the demand for electricity by TVA’s customers, the availability of various generating units, and the availability and cost of fuel. See Item 7, Management’s Discussion and Analysis of Financial Condition and Results of Operations —
Results of Operations
—
Financial Results
—
Operating Expenses.
16
Nuclear Fuel
Current Fuel Supply
. Converting uranium to nuclear fuel generally involves four stages: the mining and milling of uranium ore to produce uranium concentrates; the conversion of uranium concentrates to uranium hexafluoride gas; the enrichment of uranium hexafluoride; and the fabrication of the enriched uranium hexafluoride into fuel assemblies. For its forward four-year (2019-2022) requirements, TVA currently has 100 percent of its uranium mining and milling, conversion services, enrichment services, and fabrication services requirements either in inventory or under contract with various suppliers. TVA anticipates being able to fill its needs beyond this period by normal contracting processes as market forecasts indicate that the fuel cycle components will be readily available. The net book value of TVA's nuclear fuel inventory was $1.5 billion and $1.4 billion at
September 30, 2018
and
2017
, respectively. See
Note 15
—
Counterparty Risk
.
TVA, the DOE, and certain nuclear fuel contractors have entered into agreements providing for surplus DOE highly enriched uranium (uranium that is too highly enriched for use in a nuclear power plant) to be blended with other uranium. The enriched uranium that results from this blending process, which is called
blended low-enriched uranium ("BLEU")
, is fabricated into fuel that can be used in a nuclear power plant. This blended nuclear fuel was first loaded in a Browns Ferry reactor in 2005 and the last reload of BLEU material is currently underway at Browns Ferry. BLEU fuel was loaded into Sequoyah Unit 2 three times but is not expected to be used in the Sequoyah reactors in the future. There is a potential to receive additional BLEU fuel beginning in 2020, and it would be used in future Browns Ferry reloads. Under the terms of the interagency agreement between the DOE and TVA, the DOE participates in the savings generated by TVA's use of the BLEU. See
Note 1
—
Blended Low-Enriched Uranium Program
for a more detailed discussion of the BLEU project.
TVA, the DOE, and certain nuclear fuel contractors have entered into agreements providing for the production, processing, and storage of low-enriched uranium that is to be made using surplus DOE highly enriched uranium and other uranium. Low-enriched uranium can be fabricated into fuel for use in a nuclear power plant. Production of the low-enriched uranium is expected to begin in spring or summer of 2019. Under the terms of the interagency agreement between the DOE and TVA, the DOE will reimburse TVA for a portion of the costs of converting the highly enriched uranium to low-enriched uranium.
Low-Level Radioactive Waste.
Radwaste
results from certain materials and supplies used in the normal operation of nuclear electrical generation units. TVA sends shipments of radwaste to burial facilities in Clive, Utah and Andrews, Texas. TVA is capable of storing some radwaste at its own facilities for an extended period of time, if necessary.
Spent Nuclear Fuel.
All three nuclear sites have dry cask storage facilities. Sequoyah will need additional capacity by 2028. Watts Bar will need additional capacity by 2041. Browns Ferry will need additional storage capacity by the end of 2020. A project is underway at Browns Ferry to build another independent spent fuel storage installation pad and is scheduled for completion by January 2020. To recover the cost of providing long-term, onsite storage for spent nuclear fuel, TVA filed a breach of contract suit against the U.S. in the Court of Federal Claims in 2001. As a result of this lawsuit and related agreements, TVA has collected approximately $273 million through
2018
.
Tritium-Related Services.
TVA and the DOE are engaged in a long-term interagency agreement under which TVA will, at the DOE’s request, irradiate
tritium-producing burnable absorber rods ("TPBARs")
to assist the DOE in producing tritium for the
Department of Defense ("DOD")
. This agreement, which ends in 2035, requires the DOE to reimburse TVA for the costs that TVA incurs in connection with providing irradiation services and to pay TVA an irradiation services fee at a specified rate per TPBAR over the period when irradiation occurs.
In general, TPBARs are irradiated for one operating cycle, which lasts about 18 months. At the end of the cycle, TVA removes the irradiated rods and loads them into a shipping cask. The DOE then ships them to its tritium-extraction facility. TVA loads a fresh set of TPBARs into the reactor during each refueling outage. Irradiating the TPBARs does not affect TVA’s ability to safely operate the reactors to produce electricity.
TVA has provided irradiation services using only Watts Bar Unit 1 since 2003. Although the interagency agreement provides for irradiation services to be performed at Watts Bar and Sequoyah, TVA expects the Watts Bar site to provide sufficient capacity to fulfill this agreement in the near term. The DOE notified TVA of future increased needs for tritium requiring the use of a second reactor. TVA submitted a license amendment to the NRC in December 2017 to authorize the irradiation of TPBARs in Watts Bar Unit 2. The NRC is expected to issue a decision by May 2019.
Coal
Coal consumption at TVA’s coal-fired generating facilities during
2018
and
2017
was approximately 17 million tons and 21 million tons, respectively. At
September 30, 2018
and
September 30, 2017
, TVA had 30 days and 36 days of system-wide coal supply at full burn rate, respectively, with net book values of $164 million and $253 million, respectively.
17
TVA utilizes both short-term and long-term coal contracts. During
2018
, long-term contracts made up 97 percent of coal purchases and short-term contracts accounted for the remaining three percent. TVA plans to continue using contracts of various lengths, terms, and coal quality to meet its expected consumption and inventory requirements. During
2018
and
2017
, TVA purchased coal by basin as follows:
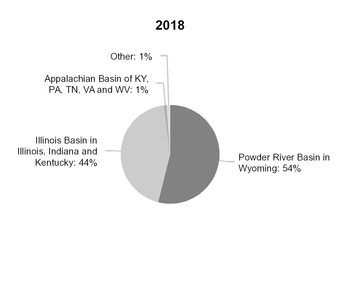
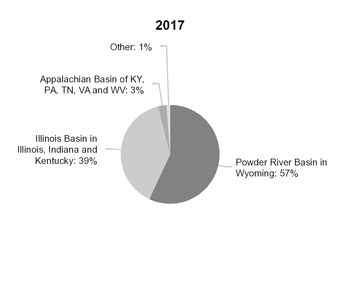
The following charts present the proportion of each delivery method TVA utilizes for its coal supply for the periods indicated:
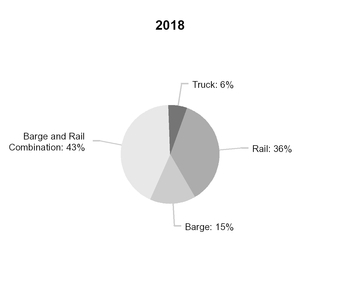
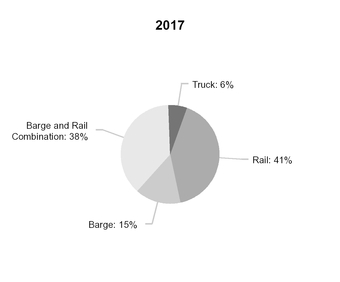
Generally, total system coal inventories were at or below target levels for 2018 as inventory levels were adjusted for unit retirements and unit generation mix changes.
Natural Gas and Fuel Oil
During
2018
, TVA purchased a significant amount of its natural gas requirements from a variety of suppliers under contracts with terms of up to three years and purchased substantially all of its fuel oil requirements on the spot market. The net book value of TVA’s natural gas inventory was $18 million and $15 million at
September 30, 2018
and
2017
, respectively. The net book value of TVA’s fuel oil inventory was $84 million and $87 million at
September 30, 2018
and
2017
, respectively. At
September 30, 2018
, 80 of the combustion turbines that TVA operates were dual-fuel capable, and TVA has fuel oil stored on each of these sites as a backup to natural gas.
TVA purchases natural gas from multiple suppliers on a daily, monthly, seasonal, and term basis. During
2018
, daily, monthly, seasonal, and term contracts accounted for 35 percent, 11 percent, 16 percent and 38 percent of purchases, respectively. TVA plans to continue using contracts of various lengths and terms to meet the projected natural gas needs of its natural gas fleet. During
2018
, TVA transported natural gas on eight separate pipelines, with approximately 33 percent being transported on a single pipeline. During
2018
, TVA maintained a total of approximately 1,409,500
million British thermal unit(s) ("mmBtu")
per day of firm transportation capacity on seven major pipelines, with approximately 31 percent of total firm transportation capacity being maintained on a single pipeline.
18
TVA utilizes natural gas storage services at seven facilities with a total capacity of 8.25
billion per cubic feet ("Bcf")
of firm service and 2.30 Bcf of interruptible service to manage the daily balancing requirements of the eight pipelines used by TVA, with approximately 43 percent of the total storage capacity being maintained at a single facility. During
2018
, storage levels were generally maintained at between 40 and 80 percent of the maximum contracted capacity at each facility. As TVA’s natural gas requirements grow, it is anticipated that additional storage capacity may need to be acquired to meet the needs of the generating assets as well as their operating requirements. In 2019, TVA does not expect to add a significant amount of firm capacity to its storage portfolio.
Transmission
The TVA transmission system is one of the largest in North America. TVA’s transmission system has 69 interconnections with 13 neighboring electric systems, and delivered nearly
163
billion kWh of electricity to TVA customers in
2018
. In carrying out its responsibility for transmission grid reliability in the TVA service area, TVA has operated with 99.999 percent reliability since 2000 in delivering electricity to customers. See Item 2, Properties —
Transmission Properties
.
Pursuant to its Transmission Service Guidelines, TVA offers transmission services to eligible customers to transmit wholesale power in a manner that is comparable to TVA's own use of the transmission system. TVA has also adopted and operates in accordance with its published Transmission Standards of Conduct and separates its transmission function from its power marketing function.
TVA is subject to federal reliability standards that are set forth by the
North American Electric Reliability Corporation ("NERC")
and approved by FERC. These standards are designed to maintain the reliability of the bulk electric system, including TVA’s generation and transmission system, and include areas such as maintenance, training, operations, planning, modeling, critical infrastructure, physical and cyber security, vegetation management, and facility ratings. TVA recognizes that reliability standards and expectations continue to become more complex and stringent for transmission systems.
Additional transmission upgrades may be required to maintain reliability. TVA invested $419 million between 2011 and 2018 to maintain reliability as a result of retired coal-fired units, and estimates future expenditures to be approximately $10 million for 2019 to 2020. Upgrades may include enhancements to existing lines and substations or new installations as necessary to provide adequate power transmission capacity, maintain voltage support, and ensure generating plant and transmission system stability. In May 2017, the TVA Board approved a $300 million multi-year, strategic fiber initiative that will expand TVA’s fiber capacity and improve the reliability and resiliency of the transmission system. The network expansion is designed to help meet the power system’s growing need for bandwidth as well as accommodate the integration of new DER.
The TVA Board approved $245 million for the construction of a new
system operations center (“SOC”)
. The new secured facility is being built to accommodate a new energy management system and to adapt to new regulatory requirements. The facility is expected to be constructed by 2021 and fully operational by 2023.
Weather and Seasonality
Weather affects both the demand for and the market prices of electricity. TVA’s power system is generally a dual-peaking system in which the demand for electricity peaks during the summer and winter months to meet cooling and heating needs. TVA uses degree days to measure the impact of weather on its power operations. Degree days measure the extent to which average temperatures in the five largest cities in TVA's service area vary from 65 degrees Fahrenheit. See Item 7, Management’s Discussion and Analysis of Financial Condition and Results of Operations —
Results of Operations
—
Sales of Electricity.
Competition
TVA provides electricity in a service area that is largely free of competition from other electric power providers based on the provisions of the TVA Act. This service area is defined primarily by provisions of law and long-term contracts. The fence limits the region in which TVA or LPCs that distribute TVA power may provide power. The anti-cherrypicking provision limits the ability of others to use the TVA transmission system for the purpose of serving customers within TVA’s service area. State service territory laws limit unregulated third parties' ability to sell electricity to consumers. All TVA wholesale power contracts are all requirements contracts. However, other utilities may use their own transmission lines to serve customers within TVA's service area, and third parties are able to avoid the restrictions on serving end-use customers by selling or leasing generating assets to a customer rather than selling electricity. These threats underscore the need for TVA to strategically price its products and services and design rates to be competitive. There have also been some efforts in the past to erode the anti-cherrypicking provision, and the protection of the anti-cherrypicking provision could be limited and perhaps eliminated by federal legislation at some time in the future.
TVA also faces competition in the form of emerging technologies. Improvements in energy efficiency technologies, smart technologies, and energy storage technologies may reduce the demand for centrally provided power. The growing interest by customers in generating their own power through DER has the potential to lead to a reduction in the load served by TVA as well as cause TVA to re-evaluate how it operates the overall grid system to continue to provide highly reliable power at
19
affordable rates. See Item 7, Management’s Discussion and Analysis of Financial Condition and Results of Operations —
Key Initiatives and Challenges
—
Distributed Energy Resources.
Finally, TVA and other utility companies are facing an evolving marketplace of increased competition driven by customer choice and behavior. As technology develops, consumers' demands for access to diverse products and services may increase, creating opportunities for growth with new products and services resulting from emerging technologies.
Research and Development
Investments in TVA’s research portfolio are supported through partnership and collaboration with LPCs, EPRI and other research consortiums, the DOE and other federal agencies, national labs, peer utilities, universities, and industry vendors and participation in professional societies.
TVA makes annual investments in science and technological innovation to help meet future business and operational challenges. Each year, TVA’s annual research portfolio is updated based on a broad range of operational and industry drivers that help assess key technology gaps, performance issues, or other significant issues that should be addressed through research and development. Core research activities directly support optimization of TVA's generation and transmission assets, air and water quality, energy utilization, and distributed/clean energy integration. TVA has recently launched a research program focused on evaluating the potential to deploy grid-scale battery energy storage technology to optimize utilization of existing TVA generation assets and improve the resiliency of the transmission system. This research will guide future application of battery storage as part of the evolving bulk power system in the region.
In the area of energy utilization, TVA evaluates emerging energy efficiency and load management technologies for market and program readiness. TVA's efforts are directed towards demonstrating and validating the performance, reliability, and consumer acceptance of new efficiency technologies as well as the value of energy efficiency and load management technologies for the consumer, LPCs, and TVA.
TVA is also beginning the assessment of potential electrification programs that may improve resource utilization and reduce environmental impacts (especially in the transportation sector). This assessment includes a multi-stakeholder vision and roadmap effort aimed at identifying the path forward for electric vehicles in Tennessee. This approach provides for broad engagement from industry, government and utilities and could be applied in other states in the TVA service territory. In addition, TVA is continuing its evaluation of potential electric vehicle adoption strategies through coordination of activities with EPRI and industry stakeholders related to operational fleet requirements. The needs of LPCs to provide guidance on matters of plug-in electric vehicle grid integration and readiness for various transportation electrification technologies are also areas of focus.
Research in this area of electrification applications includes compatibility of charging stations to work efficiently with various types of electric vehicles, impact of charging stations on the power grid, refinement of power-system control processes to maximize energy efficiency, and development of smart charging strategies to maximize the potential of electricity to replace petroleum as the transportation fuel of choice.
TVA and its LPCs are engaged in several initiatives related to grid modernization, including research into technologies and applications with the potential to advance an intelligent transmission and distribution system. Smart meter technology has the potential to shift usage patterns away from peak demand times which could change costs significantly. Additionally, an intelligent transmission system would give TVA the ability to nearly instantaneously diagnose problems, make corrections, and engage transmission and generation resources quickly so that power would keep flowing. This could promote reduced emissions, lower energy costs, and add greater flexibility to accommodate the new consumer-generated sources under TVA’s renewable energy programs.
See
Power Supply and Load Management Resources
—
Distributed Energy Resources.
Finally, TVA is evaluating smaller, clean power sources that can be aggregated to provide power necessary to meet regular demand. Research efforts into clean DER seek to understand the scope and impact of DER on operations and business economics and to develop strategies for adapting to the evolving electricity landscape in the Tennessee Valley. Of particular interest are investigations into the potential applications of battery storage and modeling existing and expected solar power deployments in the Tennessee Valley to evaluate the full extent of system impacts of those renewable resources. Initial economic analyses have been conducted to identify the value of DER (particularly photovoltaic solar generation) to both TVA and the LPC system. See Item 7, Management’s Discussion and Analysis of Financial Condition and Results of Operations —
Key Initiatives and Challenges
—
Distributed Energy Resources.
Flood Control Activities
The Tennessee River watershed has one of the highest annual rainfall totals of any watershed in the U.S., averaging 51 inches per year. During
2018
, approximately 60 inches of rain fell in the Tennessee Valley. TVA manages the Tennessee River system in an integrated manner, balancing hydroelectric generation with navigation, flood damage reduction, water quality and supply, and recreation. TVA spills or releases excess water through its dams in order to reduce flood damage to the Tennessee Valley. TVA typically spills only when all available hydroelectric generating turbines are operating at full capacity and additional water still needs to be moved downstream.
20
Environmental Stewardship Activities
TVA’s mission includes managing the Tennessee River, its tributaries, and federal lands along the shoreline to provide, among other things, year-round navigation, flood damage reduction, affordable and reliable electricity, and, consistent with these primary purposes, recreational opportunities, adequate water supply, improved water quality, and natural resource protection. There are 49 dams that comprise TVA’s integrated reservoir system. Each dam may also have ancillary structures used to support or assist the main dam's function. The reservoir system provides approximately 800 miles of commercially navigable waterways and also provides significant flood reduction benefits both within the Tennessee River system and downstream on the lower Ohio and Mississippi Rivers. The reservoir system also provides a water supply for residential and industrial customers, as well as cooling water for TVA’s coal-fired plants, combined cycle plants, and nuclear power plants. TVA’s Environmental Policy provides objectives for an integrated approach related to providing cleaner, reliable, and low-cost energy, supporting sustainable economic growth, and engaging in proactive environmental stewardship in a balanced and ecologically sound manner. The Environmental Policy provides additional direction in several environmental stewardship areas, including water resource protection and improvements, sustainable land use, and natural resource management.
TVA serves the people of the TVA region through the integrated management of the Tennessee River system and public lands, which includes approximately 11,000 miles of shoreline, 650,000 surface acres of reservoir water, and 293,000 acres of reservoir lands. TVA accomplishes this mission and supports the objectives of the TVA Environmental Policy through implementation of its natural resources stewardship strategy. Within this strategy, TVA confirms a desire to remain agile, balance competing demands, and be a catalyst for collaboration in order to protect and enhance biological, cultural, and water resources as well as create and sustain destinations for recreation and opportunities for learning and research. As part of the strategy, TVA will also assist water-based community development with technical support, land agreements, and permitting using planning, clear regulations, meaningful guidelines, and consistent enforcement. Additional guidance for carrying out many of TVA's essential stewardship responsibilities is provided in TVA's
Natural Resource Plan ("NRP")
. TVA is currently updating its Natural Resource Plan. See Item 7, Management’s Discussion and Analysis of Financial Condition and Results of Operations —
Key Initiatives and Challenges — Natural Resource Plan
.
Economic Development Activities
Economic development, along with energy production and environmental stewardship, is one of the primary statutory purposes of TVA. TVA works with its LPCs, regional, state, and local agencies, and communities to showcase the advantages available to businesses locating or expanding in TVA's service area. TVA's primary economic development goals are to recruit companies to locate in the Tennessee Valley, encourage expansion of existing business and industry that provide quality jobs, and assist communities in the Tennessee Valley with economic growth opportunities. TVA seeks to meet these goals through a combination of initiatives and partnerships designed to provide financial assistance, technical services, industry expertise, and site-selection assistance to new and existing businesses.
Economic development programs developed by TVA include those which focus on supporting all communities including rural and economically distressed communities across the Tennessee Valley by working in close partnership with other federal and state organizations. TVA also
jointly offers incentive programs with participating LPCs. These programs offer competitive incentives to existing and potential power customers in certain business sectors that make multi-year commitments to invest in the Tennessee Valley.
In addition to financial support for these programs, TVA offers resources to communities and economic developers in the areas of recruitment, leadership development, industrial product preparedness (sites and buildings), planning, and project assistance.
TVA's economic development efforts helped recruit or expand over 211 companies into the TVA service area during
2018
. These companies announced capital investments of over $11.3 billion and the expected creation and/or retention of over 65,400 jobs.
Regulation
Congress
TVA exists pursuant to the TVA Act as enacted by Congress and carries on its operations in accordance with this legislation. Congress can enact legislation expanding or reducing TVA’s activities, change TVA’s structure, and even eliminate TVA. Congress can also enact legislation requiring the sale of some or all of the assets TVA operates or reduce the U.S.’s ownership in TVA. To allow TVA to operate more flexibly than a traditional government agency, Congress exempted TVA from all or parts of certain general federal laws that govern other agencies, such as federal labor relations laws and the laws related to the hiring of federal employees, the procurement of supplies and services, and the acquisition of land. Other federal laws enacted since the creation of TVA that are applicable to other agencies have been made applicable to TVA, including those related to paying employees overtime and protecting the environment, cultural resources, and civil rights.
21
Securities and Exchange Commission
Section 37 of the Securities Exchange Act of 1934 (the "Exchange Act")
requires TVA to file with the SEC such periodic, current, and supplementary information, documents, and reports as would be required pursuant to Section 13 of the Exchange Act if TVA were an issuer of a security registered pursuant to Section 12 of the Exchange Act. Section 37 of the Exchange Act exempts TVA from complying with Section 10A(m)(3) of the Exchange Act, which requires each member of a listed issuer’s audit committee to be an independent member of the board of directors of the issuer. Since TVA is an agency and instrumentality of the U.S., securities issued or guaranteed by TVA are “exempted securities” under the Securities Act of 1933, as amended (the “Securities Act”), and may be offered and sold without registration under the Securities Act. In addition, securities issued or guaranteed by TVA are “exempted securities” and “government securities” under the Exchange Act. TVA is also exempt from Sections 14(a)-(d) and 14(f)-(h) of the Exchange Act (which address proxy solicitations) insofar as those sections relate to securities issued by TVA, and transactions in TVA securities are exempt from rules governing tender offers under Regulation 14E of the Exchange Act. Also, since TVA securities are exempted securities under the Securities Act, TVA is exempt from the Trust Indenture Act of 1939 insofar as it relates to securities issued by TVA, and no independent trustee is required for these securities.
Federal Energy Regulatory Commission
Under the FPA, TVA is not a “public utility,” a term which primarily refers to investor-owned utilities. Therefore, TVA is not subject to the full jurisdiction that FERC exercises over public utilities under the FPA. TVA is, however, an “electric utility” and a “transmitting utility” as defined in the FPA and, thus, is directly subject to certain aspects of FERC’s jurisdiction. Under the FPA, for example, TVA (1) must comply with certain standards designed to maintain transmission system reliability, (2) can be ordered to interconnect its transmission facilities with the electrical facilities of independent generators and of other electric utilities that meet certain requirements, (3) can be ordered to transmit wholesale power provided that the order (a) does not impair the reliability of the TVA or surrounding systems and (b) meets the applicable requirements concerning terms, conditions, and rates for service, as well as the anti-cherrypicking provision, (4) is subject to FERC review of the transmission rates and the terms and conditions of service that TVA provides, and (5) is prohibited from (a) reporting false information on the price of electricity sold at wholesale or the availability of transmission capacity to a federal agency with intent to fraudulently affect the data being compiled by the agency and (b) using manipulative or deceptive devices or contrivances in connection with the purchase or sale of power or transmission services subject to FERC’s jurisdiction.
In addition, the FPA provides FERC with authority (1) to order refunds of excessive prices on short-term sales (transactions lasting 31 days or less) by all market participants, including TVA, in price gouging situations if such sales are through an independent system operator or regional transmission organization under a FERC-approved tariff, (2) to issue regulations requiring the reporting, on a timely basis, of information about the availability and prices of wholesale power and transmission service by all market participants, including TVA, (3) to investigate electric industry practices, including TVA’s operations that are subject to FERC’s jurisdiction, and (4) to impose civil penalties of up to $1 million per day for each violation of the provisions of the FPA discussed in the prior paragraph that are applicable to TVA. Criminal penalties may also result from such violations.
Finally, while not required to do so, TVA has elected to implement various FERC orders and regulations pertaining to public utilities on a voluntary basis to the extent that they are consistent with TVA’s obligations under the TVA Act.
Nuclear Regulatory Commission
TVA operates its nuclear facilities in a highly regulated environment and is subject to the oversight of the NRC, an independent federal agency that sets the rules that users of radioactive materials must follow. The NRC has broad authority to impose requirements relating to the licensing, operation, and decommissioning of nuclear generating facilities. In addition, if TVA fails to comply with requirements promulgated by the NRC, the NRC has the authority to impose fines, shut down units, or modify, suspend, or revoke TVA’s operating licenses.
Environmental Protection Agency
TVA is subject to regulation by the EPA in a variety of areas, including air quality control, water quality control, and management and disposal of solid and hazardous wastes. See
Environmental Matters
below
.
States
The Supremacy Clause of the U.S. Constitution prohibits states, without federal legislative consent, from regulating the manner in which the federal government conducts its activities. As a federal agency, TVA is exempt from regulation, control, and taxation by states except in certain areas where Congress has clearly made TVA subject to state regulation. See
Environmental Matters
below.
22
Other Federal Entities
TVA’s activities and records are also subject to review to varying degrees by other federal entities, including the Government Accountability Office and the
Office of Management and Budget ("OMB")
. There is also an Office of the Inspector General which reviews TVA’s activities and records.
Taxation and Tax Equivalents
TVA is not subject to federal income taxation. In addition, neither TVA nor its property, franchises, or income is subject to taxation by states or their subdivisions. The TVA Act, however, does require TVA to make tax equivalent payments to states and counties in which TVA conducts power operations or in which TVA has acquired properties previously subject to state and local taxation. The total amount of these payments is five percent of gross revenues from the sale of power during the preceding year excluding sales or deliveries to other federal agencies and off-system sales with other utilities, with a provision for minimum payments under certain circumstances. Except for certain direct payments TVA is required to make to counties, distribution of tax equivalent payments within a state is determined by individual state legislation.
Environmental Matters
TVA's activities, particularly its power generation activities, are subject to comprehensive regulation under environmental laws and regulations relating to air pollution, water pollution, and management and disposal of solid and hazardous wastes, among other issues. Emissions from all TVA-owned and operated units (including small combustion turbine units of less than 25 MWs) have been reduced from historic peaks. Emissions of
nitrogen oxide
("NO
x
") have been reduced by 94 percent below peak CY 1995 levels and emissions of
sulfur dioxide
("SO
2
") have been reduced by 98 percent below CY 1977 levels through CY 2017. For CY 2017, TVA’s emission of carbon dioxide ("CO
2
") from its sources was 56 million tons, a 47 percent reduction from CY 2005 levels. This includes 3,049 tons from units rated at less than 25 MWs. TVA intends to continue reporting CO
2
emissions on a calendar year basis to align with the EPA's reporting requirements and remain consistent with TVA's prior disclosures.
Clean Air Act
The CAA establishes a comprehensive program to protect and improve the nation’s air quality and control sources of air pollution. The major CAA programs that affect TVA’s power generation activities are described below.
National Ambient Air Quality Standards.
The CAA requires the EPA to set
National Ambient Air Quality Standards ("NAAQS")
for certain air pollutants. The EPA has done this for ozone,
particulate matter ("PM")
, SO
2
,
nitrogen dioxide
("NO
2
"), carbon monoxide, and lead. Over the years, the EPA has made the NAAQS more stringent. Each state must develop a plan to be approved by the EPA for achieving and maintaining NAAQS within its borders. These plans impose limits on emissions from pollution sources, including TVA fossil fuel-fired plants. Areas meeting a NAAQS are designated as attainment areas. Areas not meeting a NAAQS are designated as non-attainment areas, and more stringent requirements apply in those areas, including stricter controls on industrial facilities and more complicated permitting processes. TVA fossil fuel-fired plants can be impacted by these requirements. All TVA generating units are located in areas designated as in attainment with NAAQS.
Cross-State Air Pollution Rule.
The EPA issued the
Cross-State Air Pollution Rule ("CSAPR")
in July 2011, requiring several states in the eastern U.S. to improve air quality relative to the CY 1997 ozone NAAQS and the CY 1997 and CY 2006 fine particle NAAQS by reducing power plant emissions that contribute to pollution in other states. CSAPR replaced the
Clean Air Interstate Rule ("CAIR")
, a similar but less stringent rule.
The U.S. Court of Appeals for the District of Columbia Circuit ("D.C. Circuit")
vacated CSAPR before implementation began, but in April 2014,
the U.S. Supreme Court ("Supreme Court")
reversed the D.C. Circuit's decision and remanded CSAPR back to the D.C. Circuit. In October 2014, the D.C. Circuit granted the EPA's motion to restore CSAPR but delayed the compliance deadlines by three years. Under the revised compliance deadlines, Phase I emission reductions in SO
2
and NO
x
became effective on January 1, 2015, and were followed by Phase II reductions on May 1, 2017. TVA complies with CSAPR aided by significant prior reductions in SO
2
and NO
x
emissions and planned future reductions.
On September 7, 2016, the EPA issued
an update to CSAPR ("CSAPR Update Rule")
to address cross-state pollution relative to the CY 2008 ozone NAAQS, and also to respond to a July 2015 remand of the CSAPR emission budgets for certain states by the D.C. Circuit. In this update, the EPA implemented more stringent Phase II reductions for NO
x
that become effective on May 1, 2017. TVA has not had and does not currently anticipate significant changes to its operations based on the CSAPR Update Rule.
Mercury and Air Toxics Standards for Electric Utility Units
. The D.C. Circuit upheld the
Mercury and Air Toxics Standards ("MATS")
rule on April 15, 2014. In June 2015, however, the U.S. Supreme Court left the rule in place but remanded it back to the D.C. Circuit, finding that the EPA was required to consider cost before deciding whether the regulation of hazardous air pollutants emitted from steam electric utilities was appropriate and necessary. In response to the Supreme Court's remand, the EPA published the final
Supplemental Finding That It is Appropriate and Necessary to Regulate Hazardous Air Pollutants from Coal- and Oil-Fired Electric Utility Steam Generating Units
in April 2016. Several groups have filed petitions with the D.C. Circuit challenging the EPA’s determination. The MATS rule remains in effect while these challenges are pending,
23
and TVA’s MATS compliance strategy will not be affected by these challenges. On October 5, 2018, the EPA submitted a pre-publication proposal to reconsider the MATS rule to the OMB for interagency review. Until the proposed reconsideration is published and finalized, specific impacts to TVA cannot be determined.
Environmental Agreements.
See
Note 21
—
Legal Proceedings
—
Environmental Agreements
for a discussion of the Environmental Agreements, which discussion is incorporated herein by reference.
Acid Rain Program.
Congress established the Acid Rain Program to achieve reductions in emissions of SO
2
and NO
x
, the primary pollutants implicated in the formation of acid rain. The program includes a cap-and-trade emission reduction program for SO
2
emissions from power plants. TVA continues to reduce SO
2
and NO
x
emissions from its coal-fired plants, and the SO
2
allowances allocated to TVA under the Acid Rain Program are sufficient to cover the operation of its coal-fired plants. In the TVA service area, the limitations imposed on SO
2
and NO
x
emissions by the CSAPR program are more stringent than the Acid Rain Program. Therefore, TVA forecasts that the Acid Rain Program will have no impact on TVA other than administrative reporting.
Regional Haze Program
. In June 2005, the EPA issued the Clean Air Visibility Rule, amending its CY 1999 regional haze rule, which had established timelines for states to improve visibility in national parks and wilderness areas throughout the U.S. with a target of reaching no anthropogenic impacts on visibility in these areas by CY 2064. One requirement under the amended rule is that certain types of older existing sources are required to install best available retrofit technology. No additional controls or lower operating limits are required for any TVA units to meet best available retrofit technology requirements. On January 10, 2017, the EPA published the final rule "Protection of Visibility: Amendments to Requirements for State Plans." The rule changed some of the requirements for
Regional Haze State Implementation Plans ("Regional Haze SIPs")
. TVA does not expect significant impacts to its operations from these changes, but specific impacts cannot be determined until future Regional Haze SIPs are developed.
Opacity.
Opacity, or visible emissions, measures the denseness (or color) of power plant plumes and has traditionally been used by states as a means of monitoring good maintenance and operation of particulate control equipment. Under some conditions, retrofitting a unit with additional equipment to better control SO
2
and NO
x
emissions can adversely affect opacity performance, and TVA and other utilities have addressed this issue. The evaluation of utilities' compliance with opacity requirements is coming under increased scrutiny, especially during periods of startup, shutdown, and malfunction. Historically, state implementation plans developed under the CAA typically excluded periods of startup, shutdowns, and malfunctions, but on June 12, 2015, the EPA finalized a rule to eliminate such exclusions. The EPA rule required states to modify their implementation plans by November 12, 2016. Kentucky, Tennessee, and Mississippi submitted implementation plans, but Alabama has not. Environmental petitioners and several states filed petitions for judicial review of the EPA final rule before the D.C. Circuit. On April 24, 2017, the D.C. Circuit, at the request of the new EPA Administrator, ordered this litigation to be held in abeyance pending the EPA's review to determine whether to reconsider all or part of the rule. TVA does not expect significant impacts from these rule changes.
Petition to Expand the Ozone Transport Region
.
On December 9, 2013, eight of the twelve states that make up the Ozone Transport Region ("OTR") submitted a petition, pursuant to section 176A(a) of the CAA, requesting the EPA to add nine states, including Kentucky and Tennessee, to the OTR. The EPA failed to act on the petition within the 180-day period provided under the CAA. On October 6, 2016, six of the eight states filing the petition sued the EPA in the U.S. District Court for the Southern District of New York, asking the court to require the EPA to act on the petition by a date certain. In response to this lawsuit, the EPA published, on January 19, 2017, a notice in the Federal Register proposing to deny the petition on the basis that the CAA provides other options, such as the use of the “good neighbor provision” in Section 110 and the authority granted states under Section 126 to petition the EPA Administrator to set emission limits, to address the impact of interstate air pollution. The EPA also states that its CSAPR Update Rule is a significant step to control states’ emission reduction obligations under Section 110 to meet the CY 2008 ozone NAAQS. The comment period on this proposal closed on May 15, 2017. On October 27, 2017, the EPA denied the petition. On December 22, 2017, the eight petitioning states filed in the D.C. Circuit a petition for judicial review of the EPA’s denial of the petition to add states to the OTR. Until the court issues its ruling, it is not possible to determine potential impacts to TVA.
Kentucky Startup/Shutdown Regulations
. On April 1, 2018, the Kentucky Division for Air Quality published final revised startup/shutdown regulations for new and existing indirect heat exchangers.
Shawnee Fossil Plant ("Shawnee")
and
Paradise Fossil Plant ("Paradise")
have boilers which will be subject to these rules when incorporated into their air permits. The revised rules do not significantly impact operations at Shawnee or Paradise.
Kentucky State Implementation Plan to Address Downwind Ozone Impacts
. Emissions from utility units in Kentucky that contribute to ozone are already limited by the CSAPR Update Rule and are declining. On February 28, 2018, Kentucky submitted a proposed revision to its state implementation plan (“SIP”) to address downwind state ozone impacts. The proposed SIP did not require emission reductions beyond current requirements, and on July 13, 2018, the EPA approved Kentucky's revised SIP. No additional emission reductions are required by the SIP for TVA's Kentucky generating units.
New York Petition to Address Impacts from Upwind High Emitting Sources
. On March 12, 2018, the State of New York filed a petition with the EPA under Section 126(b) of the CAA to address ozone impacts on New York from the NO
x
emissions
24
from sources emitting at least 400 tons of NO
x
in CY 2017 from nine states including Kentucky. The New York petition requests that the EPA require daily NO
x
limits for utility units with SCRs such as Paradise Unit 3 and emission reductions from utility units without SCRs such as Shawnee Units 2, 3 and 5-9. Kentucky utility unit NO
x
emissions are already limited by the CSAPR Update Rule and are declining, and current EPA modeling projects no additional requirements to reduce Kentucky NO
x
emissions are necessary. Until the EPA responds to New York’s Section 126(b) petition, it is not possible to determine potential impacts on TVA’s Paradise and Shawnee units.
Proposed Affordable Clean Energy Rule
. On December 28, 2017, the EPA published an advanced notice of proposed rulemaking (“ANPR”) to solicit information for a possible future rule: "State Guidelines for Greenhouse Gas Emissions from Existing Electric Utility Generating Units." This possible future rule would be a replacement rule for the Clean Power Plan ("CPP") should it be repealed or overturned. The ANPR solicited input on a broad range of issues. On August 21, 2018, the EPA proposed the Affordable Clean Energy ("ACE") rule to replace the CPP. The proposed rule sets guidelines requiring states to determine
greenhouse gas ("GHG")
emission standards for TVA's existing coal-fired units based on efficiency improvements that can be achieved at reasonable cost. TVA operates coal-fired units in Tennessee and Kentucky. Impacts to these units cannot be determined until the EPA finalizes the ACE rule, states submit to the EPA their SIPs implementing guidelines in the ACE rule, and the EPA approves these SIPs. The proposed rule allows states three years to submit their SIPs, and allows the EPA one year for approval.
New Source Performance Standards.
On October 23, 2015, the EPA finalized New Source Performance Standards for carbon emissions from new, modified, and reconstructed power plants. These standards apply to two types of fossil fuel-fired sources: (1) stationary combustion turbines, generally firing natural gas, and (2) electric utility steam generating units, generally firing coal. These standards reflect the degree of emission limitation achievable through the application of the
best system of emission reduction ("BSER")
that the EPA has determined to be adequately demonstrated for each type of source. These standards apply to the new TVA combined-cycle plants at the Paradise and Allen sites. The design of these plants enables them to comply with the new standards.
Petitions were filed for judicial review of the New Source Performance Standards for carbon emissions. On August 10, 2017, the D.C. Circuit issued an order, at the request of the EPA Administrator, holding the case in abeyance pending the EPA's review of the New Source Performance Standards.
Maryland Petition to Address Impacts from Upwind Electric Generating Units
. On September 27, 2017, the State of Maryland filed a lawsuit against the EPA for failing to act within 60 days on Maryland’s petition under Section 126 of the CAA to address ozone impacts on Maryland from the NO
x
emissions of 36 electric generating units, including TVA’s Paradise coal-fired Unit 3. On October 4, 2017, a group of seven environmental advocacy groups filed a similar complaint against the EPA. At issue in Maryland’s petition are alleged excessive NO
x
emissions from the 36 electric generating units as a result of SCR units not being operated continuously. Paradise coal-fired Unit 3 is equipped with a SCR that TVA continuously operates to the greatest extent technically practicable in order to minimize NO
x
emissions. On October 5, 2018, the EPA denied Maryland's petition in light of the existing regulations already addressing emissions from the generating units identified in the petition. On October 15, 2018, the State of Maryland filed a petition for judicial review with the D.C. Circuit asking the court to review the EPA's decision.
Climate Change
Executive Actions.
On March 28, 2017, President Trump issued
Executive Order ("EO")
13783, “Promoting Energy Independence and Economic Growth.” The EO reversed or altered many actions taken by the federal government in the last four years of the Obama Administration to address climate change and mandates that federal agencies review existing regulations and actions that potentially burden energy development and use. Several EOs, policy statements, and reports that established climate change objectives were rescinded or revoked. EO 13783 did not mandate that the EPA reconsider its finding under the CAA that GHG emissions cause climate change and therefore endanger public health and the environment.
While EO 13783 requires review of all agency actions that potentially burden the safe, efficient development of domestic energy resources, the final specific requirements and impacts from implementation of this EO are not possible to predict at this time. It is likely that there will be some delay in the development of future GHG reduction requirements.
On May 17, 2018, EO 13834, "Efficient Federal Operations", was signed. EO 13834 emphasizes meeting statutory requirements and gives agencies greater flexibility and discretion to decide how best to improve operations in order to “optimize energy and environmental performance, reduce waste, and cut costs.” It also calls on the White House Council of Environmental Quality to streamline pre-existing environmental orders by “refocusing agencies on cost-effectively meeting mandates and goals” established by law. The order seeks to consolidate requirements related to energy and water efficiency, high performance buildings, renewable energy consumption, and federal vehicle fleet management. TVA consistently seeks to improve its operations in order to optimize energy and environmental performance and does not anticipate significant changes in its planning or operations as a result of the new EO.
International Accords
. On September 3, 2016, the U.S. formally accepted the Paris Agreement. The agreement met the threshold of at least 55 countries that account for at least 55 percent of global GHG emissions and formally entered into
25
force on November 4, 2016. The durability of the Paris Agreement commitments is uncertain after the President’s announcement on June 1, 2017, that the U.S. would withdraw from the agreement. Under the terms of the agreement, the earliest possible effective date for withdrawal by the U.S. is November 4, 2020, four years after the agreement came into effect. Future U.S. GHG regulation designed to meet the Paris Agreement goals could impact TVA in ways that cannot be determined at this time.
In response to President Trump’s Paris withdrawal announcement, 17 states have formed the U.S. Climate Alliance, a bipartisan coalition of governors committed to reducing GHG emissions consistent with the goals of the Paris Agreement. North Carolina is the only state in the TVA region that is a U.S. Climate Alliance member. Among other commitments, each state commits to implement policies that advance the goals of the Paris Agreement, aiming to reduce GHG emissions by at least 26-28 percent below CY 2005 levels by CY 2025 and to accelerate new and existing policies to reduce carbon pollution and promote clean energy deployment at the state and federal level. In June 2017, America's Pledge was announced as a collaborative opportunity for these states to work with U.S. cities and businesses representing more than half of the U.S. economy. In September 2018, America's Pledge released its economy-wide policy analysis with recommendations of how states, cities, businesses, and other stakeholders can influence U.S. decarbonization. It is premature to determine potential impacts to TVA.
Litigation
. In addition to legislative activity, climate change issues have been the subject of a number of lawsuits, including lawsuits against TVA. See
Note 21
for additional information.
Indirect Consequences of Regulation or Business Trends
. Legal, technological, political, and scientific developments regarding climate change may create new opportunities and risks. The potential indirect consequences could include an increase or decrease in electricity demand, increased demand for generation from alternative energy sources, and subsequent impacts to business reputation and public opinion. See
Power Supply and Load Management Resources
above
.
Physical Impacts of Climate Change.
TVA manages the potential effects of climate change on its mission, programs, and operations within its environmental management processes. The goal of the adaptation planning process is to ensure TVA continues to achieve its mission and program goals and to operate in a secure, effective, and efficient manner in a changing climate by integrating climate change adaptation efforts in coordination with state and local partners, tribal governments, and private stakeholders. TVA's Climate Change Adaptation Plan was last updated in June 2018.
Actions Taken by TVA to Reduce GHG Emissions
. TVA has reduced GHG emissions from both its generation stations and its operations. As discussed earlier in this Item 1, Business, recent TVA Board actions have focused on TVA’s plan to balance its coal-fired generation by increasing its nuclear capacity, modernizing its hydroelectric generation system, increasing natural gas-fired generation, installing emission control equipment on certain of its coal-fired units, increasing its purchases of renewable energy, and investing in energy efficiency initiatives to reduce energy use in the Tennessee Valley. Additionally, TVA has invested to reduce energy use in its operations. The combination of more stringent environmental regulations, lower natural gas prices, and lower demand for energy across the Tennessee Valley has reduced the utilization of coal-fired generation. These factors have resulted in lower CO
2
emissions from the TVA system.
Renewable/Clean Energy Standards
Twenty-nine states and the District of Columbia have established enforceable or mandatory requirements for electric utilities to generate a certain amount of electricity from renewable sources. One state within the TVA service area, North Carolina, has a mandatory renewable standard that, while not applying directly to TVA, does apply to TVA’s LPCs serving retail customers in that state. TVA's policy is to provide compliance assistance to any distributor of TVA power, and TVA is providing assistance to the covered LPCs that sell TVA power in North Carolina. Likewise, the Mississippi Public Service Commission adopted an energy efficiency rule applying to electric and natural gas providers in the state, and TVA is supplying information on participation in TVA's energy efficiency programs to support the covered Mississippi LPCs.
Water Quality Control Developments
Cooling Water Intake Structures.
On May 19, 2014, the EPA released a final rule under Section 316(b) of the Clean Water Act relating to
cooling water intake structures ("CWIS")
for existing power generating facilities. The rule requires changes in CWIS used to cool the vast majority of coal, gas, and nuclear steam-electric generating plants and a wide range of manufacturing and industrial facilities in the U.S. The final rule requires CWIS to reflect the best technology available for minimizing adverse environmental impacts, primarily by reducing the amount of fish and shellfish that are impinged or entrained at a cooling water intake structure. These new requirements will potentially affect a number of TVA’s fossil- and nuclear-fueled facilities and will likely require capital upgrades to ensure compliance. Most TVA facilities are projected to require retrofit of CWIS with “fish-friendly” screens and fish return systems to achieve compliance with the new rule. The rule is being implemented through permits issued under the
National Pollutant Discharge Elimination System ("NPDES")
in Section 402 of the Clean Water Act. State agencies administer the NPDES permit program in most states including those in which TVA’s facilities are located. In addition, the responsible state agencies must provide all permit applications to the U.S. Fish & Wildlife Service for a 60-day review prior to public notice and an opportunity to comment during the public notice. As a result, the permit may include requirements for additional studies of threatened and endangered species arising from U.S. Fish & Wildlife Service
26
comments and may require additional measures be taken to protect threatened and endangered species and critical habitats directly or indirectly related to the plant cooling water intake. TVA’s review of the final rule indicates that the rule offers adequate flexibility for cost-effective compliance. The required compliance timeframe is linked to plant specific NPDES permit renewal cycles (i.e., technology retrofits), and compliance is expected to be required in the CYs 2022-2024 timeframe.
Hydrothermal Discharges.
The EPA and many states continue to focus regulatory attention on potential effects of hydrothermal discharges. Many TVA plants have variances from thermal standards under Section 316(a) of the Clean Water Act that are subject to review as NPDES permits are renewed. Specific data requirements in the future will be determined based on negotiations between TVA and regulators. If plant thermal limits are made more stringent, TVA may have to install cooling towers at some of its plants and operate installed cooling towers more often. This could result in a substantial cost to TVA.
Steam-Electric Effluent Guidelines
. On November 3, 2015, the EPA published a final rule to revise the existing steam- electric
effluent limitation guidelines ("ELGs")
that updates the technology-based water discharge limitations for power plants nationwide. The CY 2015 ELGs establish more stringent performance standards for existing and new sources that will require power plants that generate more than 50 MW to regulate discharges of toxic pollutants from seven primary wastewater streams. The primary impact for TVA is on the operation of existing and any potential new coal-fired generation facilities. The rule has the potential to impact long-term investment decisions being made relative to the long-term compliance and operability of TVA coal-fired units. Compliance with new requirements is required in the CYs 2018-2023 timeframe and will necessitate major upgrades to wastewater treatment systems at all coal-fired plants. Dry fly ash handling is mandated by the rule. The rule also requires either dry bottom ash handling systems or “no discharge” recycle of bottom ash transport waters. In addition, new technology-based limits on
flue gas desulfurization ("FGD")
wastewater require primary physical or chemical treatment and secondary biological treatment to meet extremely low limits for arsenic, mercury, and selenium. On April 12, 2017, in response to Petitions for Reconsideration by the Utility Water Act Group and the Small Business Administration, the EPA Administrator announced his decision to reconsider the ELG rule. The EPA also proposed a rule to postpone the rule’s compliance deadlines pending the EPA’s reconsideration of the rule.
On August 11, 2017, the EPA Administrator announced his decision to conduct a rulemaking to potentially revise the new, more stringent effluent limitations that apply to bottom ash transport water and FGD wastewater in the CY 2015 rule. A legal challenge of the rule is currently pending before the U.S. Court of Appeals for the Fifth Circuit. At the EPA’s request, the court on August 22, 2017, entered an order severing and holding in abeyance the litigation related to the portions of the CY 2015 rule concerning bottom ash transport water, FGD wastewater, and gasification wastewater (which is not applicable to TVA) pending further agency action. Thus, the litigation is indefinitely on hold as to the bottom ash transport water and FGD wastewater claims until the EPA’s further rulemaking has concluded. The litigation will continue as to the other claims.
On September 18, 2017, the EPA published a final rule postponing certain compliance/applicability dates to provide the EPA time to review and revise, as necessary, the new and stringent ELGs previously established for FGD wastewater and bottom ash transport water. The EPA pushed back the compliance dates for these two wastestreams from the CYs 2018-2023 timeframe to CYs 2020-2023. Other requirements and applicability dates of the rule for fly ash transport water, flue gas mercury control wastewater, and gasification wastewater remain in effect. As a result of these developments, it is not possible to predict the changes in the rule and TVA’s associated expenditures to attain compliance.
With regard to its
Cumberland Fossil Plant ("Cumberland")
, TVA contends the ELG rulemaking did not appropriately consider available data that could affect these national limits as they applied at Cumberland given its unique “once-through” scrubber design. TVA has been working with the State of Tennessee and the EPA in an effort to address this issue. Compliance with the rule at Cumberland without modification to address the unique design could cause TVA to incur disproportionately high costs at Cumberland or experience other operational outcomes that TVA cannot predict at this time. The EPA’s reconsideration of the CY 2015 rule is likely to impact this issue at Cumberland and could result in TVA’s request needing revision or being unnecessary.
Other Clean Water Act Requirements
. As is the case in other industrial sectors, TVA and other utilities are also facing more stringent requirements related to the protection of wetlands, reductions in storm water impacts from construction activities, new water quality criteria for nutrients and other pollutants, new wastewater analytical methods, and regulation of pesticide discharges.
Cleanup of Solid and Hazardous Wastes
Liability for releases and cleanup of hazardous substances is imposed under the federal
Comprehensive Environmental Response, Compensation, and Liability Act ("CERCLA")
, and other federal and parallel state statutes. In a manner similar to many other industries and power systems, TVA has generated or used hazardous substances over the years.
TVA Sites.
TVA operations at some of its facilities have resulted in contamination that TVA is addressing including at TVA's Environmental Research Center ("ERC") at Muscle Shoals, Alabama. At
September 30, 2018
, TVA’s estimated liability for cleanup and similar environmental work for those sites for which sufficient information was available to develop a cost estimate is approximately
$12 million
and was included in Accounts payable and accrued liabilities and Other long-term liabilities on the
27
consolidated balance sheet. In addition, the ERC has an active groundwater monitoring program as part of a
Resource Conservation and Recovery Act ("RCRA")
Corrective Action Permit.
Non-TVA Sites.
TVA is aware of alleged hazardous-substance releases at certain non-TVA areas for which it may have some liability. See
Note 21
— Contingencies — Environmental Matters
.
Coal Combustion Residuals.
The EPA published its final rule governing
coal combustion residuals ("CCR")
on April 17, 2015. The rule regulates CCRs as nonhazardous waste under Subtitle D of the RCRA. While states may adopt the rule's requirements into their regulatory programs, the rule does not require states to adopt the requirements, nor does it enable states to seek to directly enforce the rule through delegated permitting programs. The rule provides for self-implementation by utilities and allows enforcement through citizen suits in federal court. Although the rule became effective October 19, 2015, certain provisions have later effective dates. TVA’s review of the final rule indicates that the rule offers adequate flexibility for compliance. See Item 7, Management's Discussion and Analysis of Financial Condition and Results of Operations —
Key Initiatives and Challenges
—
Generation Resources
—
Coal Combustion Residual Facilities
for a discussion of the impact on TVA’s operations, including the cost and timing estimates of related projects.
On December 16, 2016, President Obama signed the
Water Infrastructure Improvements for the Nation Act ("WIIN Act")
, which provides a path to CCR regulation implementation through state or federal-based permitting as an alternative to self-implementation and enforcement through citizen suits in federal courts. Pending adoption of state permitting programs in states in TVA’s service area, TVA does not anticipate any impact on the design or implementation timeframe for TVA’s ongoing CCR activities at this time.
In May 2017, industry petitioners asked the EPA to reconsider the CCR rule and to incorporate new flexibility provided by the WIIN Act – specifically, authority to make site-specific, risk-based decisions on implementing the federal criteria and to postpone upcoming regulatory deadlines during the new rulemaking. The EPA had previously agreed through settlement to revisit several elements of the CCR rule, so it will already be re-opening the rule. On September 14, 2017, the EPA announced plans to address the request to revisit key parts of its CY 2015 CCR rule. Subsequently, the EPA issued a proposed rule on March 15, 2018, to amend portions of the CCR rule. The EPA also noted that the March 15 action was the first of two phases of amendments planned for the CCR rule. On July 17, 2018, the EPA issued a final rule which included a subset of the previously proposed changes which provided additional flexibility and an extension of certain deadlines to align the rule with the previously issued Steam-Electric Effluent Guidelines rule. In addition, on September 18, 2017, the EPA filed a motion to hold the CCR litigation in abeyance and to postpone oral argument in the case while it reconsiders the CCR rule. The D.C. Circuit denied the EPA's motion. In an August 21, 2018, opinion, the court vacated and remanded to the EPA for additional consideration sections of the CY 2015 CCR rule that allow for continued operation of unlined impoundments in certain situations and that exempt inactive impoundments at inactive facilities from regulation. As a result of these developments, it is not possible to predict changes to the CCR rule and potential impacts on TVA.
In August 2015, the
Tennessee Department of Environment and Conservation ("TDEC")
issued an order that (1) allowed TDEC to oversee TVA’s implementation of the EPA’s CCR rule and (2) required TVA to assess CCR contamination risks at seven of TVA’s eight coal-fired plants in Tennessee and to remediate any unacceptable risks. The TDEC order does not allege that TVA is violating any CCR regulatory requirements nor does it assess TVA penalties. The TDEC order sets out an iterative process through which TVA and TDEC will identify and evaluate any CCR contamination risks and, if necessary, respond to such risks.
On August 4, 2017, the U.S. District Court for the Middle District of Tennessee ordered TVA to excavate the CCR materials from its CCR facilities at Gallatin and move them to a lined facility. A panel of the Sixth Circuit reversed the decision on September 24, 2018. The plaintiffs have petitioned for a rehearing. See
Note 8
—
Background
—
Lawsuit Brought by TDEC
and
Lawsuit Brought by TSRA and TCWN
and
Note 21
—
Legal Proceedings — Cases Involving Gallatin Fossil Plant CCR Facilities
.
Groundwater Contamination
. Environmental groups and state regulatory agencies are increasing their attention on alleged groundwater contamination associated with CCR management activities. Seven of TVA’s coal-fired plants are in some level of state regulatory groundwater assessment. Four of those plants (
Colbert Fossil Plant ("Colbert")
, Gallatin, Cumberland, and Shawnee) have investigations beyond monitoring and reporting. Five of those (Gallatin, Shawnee, Paradise,
Johnsonville Fossil Plant ("Johnsonville")
, and
Widows Creek Fossil Plant ("Widows Creek")
) have groundwater remediation monitoring with state regulatory involvement. As a result of these assessments and increased attention, TVA may have to change how it manages CCRs at some of its plants, potentially resulting in higher costs. See Item 7, Management’s Discussion and Analysis of Financial Condition and Results of Operations —
Key Initiatives and Challenges
—
Generation Resources
—
Coal Combustion Residual Facilities,
Note 8
—
Background
—
Lawsuit Brought by TDEC
and
Lawsuit Brought by TSRA and
TCWN
and
Note 21
—
Legal Proceedings
—
Cases Involving Gallatin Fossil Plant CCR Facilities
.
28
Environmental Investments
From 1970 to
2018
, TVA spent approximately
$6.7 billion
on controls to reduce emissions from its coal-fired power plants. In addition, TVA has reduced emissions by idling or retiring coal-fired units and relying more on cleaner energy resources including natural gas and nuclear generation.
SO
2
Emissions and NOx Emissions.
To reduce SO
2
emissions, TVA operates scrubbers on 19 of its coal-fired units and switched to lower-sulfur coal at 13 coal-fired units. To reduce NOx emissions, TVA operates SCRs on 19 coal-fired units, operates low-NOx burners or low-NOx combustion systems on 19 units, operates over-fire air on one cyclone unit, optimized combustion on six units, and operates NO
x
control equipment year round when units are operating (except during start-up, shutdown, and maintenance periods). TVA has also retired 33 of 59 coal-fired units. Except for seven units at Shawnee, the remaining coal-fired units will have scrubbers and SCRs. See
Power Supply and Load Management Resources
—
Coal-Fired
above.
Particulate Emissions.
To reduce particulate emissions of air pollutants, TVA has equipped all of its coal-fired units with scrubbers, mechanical collectors, electrostatic precipitators, and/or bag houses.
There could be additional material costs if further reductions of GHGs, including CO
2
, are mandated by legislative, regulatory, or judicial actions and if more stringent emission reduction requirements for conventional pollutants are established. These costs cannot reasonably be predicted at this time because of the uncertainty of these actions. A number of emerging EPA regulations establishing more stringent air, water, and waste requirements could result in significant changes in the structure of the U.S. power industry, especially in the eastern half of the country.
TVA currently anticipates spending significant amounts on environmental projects through 2025, including investments in new clean energy generation including nuclear and renewables to reduce TVA's overall environmental footprint. TVA environmental project expenditures also result from coal-fired plant decommissioning and from effective ash management modernization. Based on TVA's decisions regarding certain coal-fired units under the Environmental Agreements, the amount and timing of expenditures could change. See
Power Supply
and Load Management Resources — Coal-Fired
above and
Estimated Required Environmental Expenditures
below.
Estimated Required Environmental Expenditures
The following table contains information about TVA’s current estimates on projects related to environmental laws and regulations.
|
Estimated Potential Environmental Expenditures
(1)(2)
At September 30, 2018
(in millions)
|
|||||||||||||||
|
|
2019
|
2020
|
Thereafter
(3)
|
|
Total
|
||||||||||
|
Coal combustion residual conversion program
(4)
|
$
|
355
|
|
$
|
318
|
|
$
|
505
|
|
|
$
|
1,178
|
|
||
|
Clean air control projects
(5)
|
27
|
|
26
|
|
110
|
|
|
163
|
|
||||||
|
Clean Water Act requirements
(6)
|
46
|
|
33
|
|
387
|
|
|
466
|
|
||||||
Notes
(1) These estimates are subject to change as additional information becomes available and as regulations change.
(2) These estimates include $316 million, $237 million, and $583 million for the remainder of 2019, 2020, and thereafter, respectively, in capital expenditures.
(3) See
Note 21
—
Commitments and Contingencies
.
(4) Includes costs associated with pond closures, conversion of wet to dry handling, and landfill activities. TVA is continuing to evaluate the rules and their impact on its operations, including the cost and timing estimates of related projects. Includes approximately $159 million for Gallatin projects that are part of the original activities scheduled in TVA's CCR Conversion Program and excludes costs resulting from any new requirements related to the Gallatin lawsuits. See Item 7 Management's Discussion and Analysis of Financial Condition and Results of Operations —
Key Initiatives and Challenges
—
Generation Resources
—
Coal Combustion Residual Facilities
and
Note 8
.
(5) Includes air quality projects that TVA is currently performing to comply with existing air quality regulations, but does not include any projects that may be required to comply with potential GHG regulations or transmission upgrades.
(6) Includes projects that TVA is currently planning to comply with revised rules under the Clean Water Act regarding CWIS and ELGs for steam electric power plants.
Employees
On
September 30, 2018
, TVA had 10,023 employees, of whom 3,402 were trades and labor employees. Neither the federal labor relations laws covering most private sector employers nor those covering most federal agencies apply to TVA. However, the TVA Board has a long-standing policy of acknowledging and dealing with recognized representatives of its employees, and that policy is reflected in long-term agreements to recognize the unions (or their successors) that represent TVA employees. Federal law prohibits TVA employees from engaging in strikes against TVA.
29
The risk factors described below, as well as the other information included in this Annual Report, should be carefully considered. Risks and uncertainties described in these risk factors could cause future results to differ materially from historical results as well as from the results anticipated in forward-looking statements. Although the risk factors described below are the ones that TVA considers significant, additional risk factors that are not presently known to TVA or that TVA presently does not consider significant may also impact TVA's business operations. See
Forward Looking Information
above for a description of some matters that could affect the below risks or generate new risks. Although the TVA Board has the authority to set TVA's own rates and may mitigate some risks by increasing rates, there may be instances in which TVA would be unable to partially or completely eliminate one or more of these risks through rate increases over a reasonable period of time or at all. Accordingly, the occurrence of any of the following could have a material adverse effect on TVA's cash flows, results of operations, and financial condition.
For ease of reference, the risk factors are presented in four categories: (1) regulatory, legislative, and legal risks, (2) operational risks, (3) financial, economic, and market risks, and (4) general business risks.
REGULATORY, LEGISLATIVE, AND LEGAL RISKS
New laws, regulations, or administrative orders, or congressional action or inaction, may negatively affect TVA's cash flows, results of operations, and financial condition, as well as the way TVA conducts its business.
Because TVA is a corporate agency and instrumentality established by federal law, it may be affected by a variety of laws, regulations, and administrative orders that do not affect other electric utilities. For example, federal legislation may expand or reduce TVA's activities, change its governance structure, require TVA to sell some or all of the assets that it operates, require TVA to take certain other operational or regulatory actions, reduce or eliminate the U.S.'s ownership of TVA, or even liquidate TVA. Additionally, Congress could act, or fail to take action, on various issues that may result in impacts to TVA, including but not limited to action or inaction related to the national debt ceiling or automatic spending cuts in government programs.
Although it is difficult to predict exactly how new laws, regulations, or administrative orders or congressional action or inaction may impact TVA, some of the possible effects are described below.
TVA may become subject to additional environmental regulation.
New environmental laws, regulations, or orders may become applicable to TVA or the facilities it operates, and existing environmental laws or regulations may be revised or reinterpreted in a way that adversely affects TVA, including substantially increasing TVA's cost of operations or requiring significant capital expenditures. Possible areas of future laws or regulations include, but are not limited to, GHGs, CCRs, water quality, renewable energy portfolio standards, and natural gas production and transmission.
TVA's ability to control or allocate funds could be restricted.
Other federal entities may attempt to restrict TVA's ability to access or control its funds that are on deposit in TVA’s account in the U.S. Treasury. For example, should the U.S. Treasury approach its debt ceiling, the U.S. Treasury might, as part of an effort to control cash disbursements, attempt to require TVA to receive approval before disbursement of funds from TVA’s U.S. Treasury account. Additionally, the OMB might, in the event that automatic spending cuts go into effect, attempt to require TVA to reduce its budget by a specified percentage (although the legal applicability of such a situation to TVA would depend upon the wording of the legislation making the automatic spending cuts). Such attempts to restrict TVA's ability to control or allocate funds in those specific types of situations could adversely affect its cash flows, results of operations, and financial condition, its relationships with creditors, vendors, and counterparties, the way it conducts its business, and its reputation.
TVA may lose its protected service territory.
TVA's service area is defined primarily by provisions of law and long-term contracts. The fence limits the region in which TVA or LPCs which distribute TVA power may provide power. The anti-cherrypicking provision limits the ability of others to use the TVA transmission system for the purpose of serving customers within TVA's service area. State service territory laws limit unregulated third parties' ability to sell electricity to consumers. All wholesale power contracts between TVA and LPCs are all requirements contracts. However, other utilities may use their own transmission lines to serve customers within TVA's service area, and third parties are able to avoid the restrictions on serving end-use customers by selling or leasing generating assets to a customer rather than selling electricity.
From time to time, there have been efforts to erode the protection of the anti-cherrypicking provision, and the protection of the anti-cherrypicking provision could be limited and perhaps eliminated by federal legislation at some time in the
30
future. If federal legislation were to eliminate or reduce the coverage of the anti-cherrypicking provision but retain the fence, TVA could more easily lose customers that it could not replace within its specified service area. The loss of these customers could adversely affect TVA's cash flows, results of operations, and financial condition.
The TVA Board may lose its sole authority to set rates for electricity.
Under the TVA Act, the TVA Board has the sole authority to set the rates that TVA charges for electricity, and these rates are not subject to further review. If the TVA Board loses this authority or if the rates become subject to external review, there could be material adverse effects on TVA including, but not limited to, being unable to set rates at a level sufficient to generate adequate revenues to service TVA's financial obligations, properly operate and maintain its assets, and provide for reinvestment in its power program and becoming subject to additional regulatory oversight that could impede its ability to adapt its business to changing circumstances.
TVA may lose responsibility for managing the Tennessee River system.
TVA's management of the Tennessee River system is important to effectively operate its power system. TVA's ability to integrate management of the Tennessee River system with power system operations increases power system reliability and reduces costs. Restrictions on how TVA manages the Tennessee River system could negatively affect its operations, change the way it conducts such operations, or increase costs.
TVA may lose responsibility for managing real property currently under its control.
TVA's management of real property containing power generation and transmission structures as well as certain reservoir shorelines is important for navigation, flood control, and the effective operation of the power system. Restrictions on or the loss of the authority to manage these properties could negatively affect TVA's operations, change the way it conducts such operations, or increase costs.
Existing laws, regulations, and orders may negatively affect TVA's cash flows, results of operations, and financial condition, as well as the way TVA conducts its business.
TVA is required to comply with comprehensive and complex laws, regulations, and orders. The costs of complying with these laws, regulations, and orders are expected to be substantial, and costs could be significantly more than TVA anticipates, especially in the environmental and nuclear areas. In addition, TVA is required to obtain numerous permits and approvals from governmental agencies that regulate its business, and TVA may be unable to obtain or maintain all required regulatory approvals. If there is a delay in obtaining required regulatory approvals or if TVA fails to obtain or maintain any approvals or to comply with any law, regulation, or order, TVA may have to change how it operates certain assets, may be unable to operate certain assets, or may have to pay fines or penalties if it continues to operate the assets.
Additional NRC requirements may negatively affect TVA's cash flows, results of operations, and financial condition or impact TVA's ability to operate its nuclear facilities.
Supplementary NRC rulemaking is under development to mitigate beyond-design basis flooding events and seismic events. Complying with these or other requirements adopted by the NRC may require significant capital expenditures and may negatively affect TVA's cash flows, results of operations, and financial condition. Should TVA be unable to comply with the requirements, TVA may not be able to operate its nuclear facilities as currently contemplated by TVA's generation plans.
TVA is involved in various legal and administrative proceedings whose outcomes may affect TVA's finances and operations.
TVA is involved in various legal and administrative proceedings, including actions arising from citizen enforcement of environmental requirements, and is likely to become involved in additional proceedings in the future in the ordinary course of business, as a result of catastrophic events, as a result of environmental conditions at TVA property or areas where TVA has disposed of materials or property, or otherwise. The additional proceedings could involve, among other things, challenges to TVA's CCR facilities and nuisance suits involving TVA's coal-fired plants. Although TVA cannot predict the outcome of the individual matters in which TVA is involved or will become involved, the resolution of these matters could require TVA to make expenditures in excess of established reserves and in amounts that could have a material adverse effect on TVA's cash flows, results of operations, and financial condition. Similarly, resolution of any such proceedings may require TVA to change its business practices or procedures, change how it operates its coal-fired units, reduce emissions to a greater extent than TVA had planned, close existing CCR facilities sooner than planned, build new CCR facilities sooner than planned, build new CCR facilities that were not planned, or even cease operation of some coal-fired units. These events also could have a material adverse effect on TVA's cash flows, results of operations, and financial condition.
31
TVA is largely restricted to a defined service area.
TVA's ability to expand its customer base is constrained by its inability to pursue new customers outside its service area. Accordingly, reductions in demand have to be offset by such actions as reducing TVA's internal costs or increasing rates. Any failure of such measures to fully offset the reduced demand for power may negatively affect TVA's cash flows, results of operations, and financial condition.
TVA may become subject to additional NERC requirements.
TVA is subject to federal reliability standards that are set forth by NERC and approved by FERC. TVA recognizes that reliability standards and expectations continue to become more complex and stringent for transmission systems. At present there are approximately 90 mandatory standards subject to enforcement containing approximately 1,300 requirements and sub-requirements that must be met. Complying with these or additional requirements set forth by NERC may require significant capital expenditures and may negatively affect TVA's cash flows, results of operations, and financial condition.
TVA could be divested by the federal government or be required to sell some or all of its assets.
From time to time, presidential administrations have suggested that the federal government should either divest TVA or require TVA to sell some or all of its assets, including its transmission system. Either event could trigger change of control provisions in certain material contracts or covenants in TVA’s bond documents that concern the sale or disposal of a substantial portion of TVA’s power properties. TVA may, among other things, be required to pay off debt more quickly than anticipated and be unable to access credit facilities. Additionally, the loss of the transmission system could interfere with TVA’s operations and require TVA to contract for the transmission of electricity to TVA customers. These factors could negatively affect TVA's operations, change the way it conducts such operations, and increase costs.
OPERATIONAL RISKS
TVA may incur delays and additional costs in its major projects and may be unable to obtain necessary regulatory approval.
Among other projects, TVA is conducting the EPU project at Browns Ferry, undertaking repairs at certain hydroelectric facilities, and closing some coal-fired plants and their supporting infrastructure. These activities involve risks of overruns in the cost of labor and materials as well as risks of schedule delays, which may result from, among other things, changes in laws or regulations, lack of productivity, human error, and the failure to schedule activities properly. In addition, if TVA does not or cannot obtain the necessary regulatory approvals or licenses, is otherwise unable to complete the development or construction of a facility, decides to cancel construction of a facility, incurs delays or cost overruns in connection with constructing a facility, or is required to change how it will conduct construction, repair, or closure activities, TVA's cash flows, financial condition, and results of operations could be negatively affected. Further, if projects are not completed according to specifications, TVA may suffer, among other things, delays in receiving licenses, reduced plant efficiency, reduced transmission system integrity and reliability, and higher operating costs.
TVA may not be able to operate one or more of its nuclear power units.
Should issues develop with TVA’s nuclear power units that TVA is unable to correct, TVA might voluntarily shut down one or more units or be ordered to do so by the NRC. Returning the unit(s) into operation could be a lengthy and expensive process, or might not be possible depending on circumstances. In either case, TVA's cash flows, results of operations, financial condition, and reputation may be negatively affected.
Operating nuclear units subjects TVA to nuclear risks and may result in significant costs that adversely affect its cash flows, results of operations, and financial condition.
TVA has
seven
operating nuclear units. Risks associated with these units include the following:
Nuclear Risks
. A nuclear incident at one of TVA's facilities could have significant consequences including loss of life, damage to the environment, damage to or loss of the facility, and damage to non-TVA property. Although TVA carries certain types of nuclear insurance, the amount that TVA is required to pay in connection with a nuclear incident could significantly exceed the amount of coverage provided by insurance. Any nuclear incident in the U.S., even at a facility that is not operated by or licensed to TVA, has the potential to impact TVA adversely by obligating TVA to pay up to
$133 million
per year and a total of
$891 million
per nuclear incident under the Price-Anderson Act. Any such nuclear incident could also negatively affect TVA by, among other things, obligating TVA to pay retrospective insurance premiums, reducing the availability and affordability of insurance, increasing the costs of operating nuclear units, or leading to increased regulation or restriction on the construction, operation, and
32
decommissioning of nuclear facilities. Moreover, federal legislation could impose revenue-raising measures on the nuclear industry to pay claims exceeding the limit for a single incident under the Price-Anderson Act. Further, the availability or price of insurance may be impacted by TVA's acts or omissions, such as a failure to properly maintain a facility, or events outside of TVA's control, such as an equipment manufacturer's inability to meet a guideline, specification, or requirement.
Decommissioning Costs
. TVA maintains a
Nuclear Decommissioning Trust ("NDT")
for the purpose of providing funds to decommission its nuclear facilities. The NDT is invested in securities generally designed to achieve a return in line with overall equity and debt market performance. TVA might have to make unplanned contributions to the NDT if, among other things:
|
•
|
The value of the investments in the NDT declines significantly or the investments fail to achieve the assumed real rate of return;
|
|
•
|
The decommissioning funding requirements are changed by law or regulation;
|
|
•
|
The assumed real rate of return on plan assets, which is currently five percent, is lowered by the TVA Board or is overly optimistic;
|
|
•
|
The actual costs of decommissioning are more than planned;
|
|
•
|
Changes in technology and experience related to decommissioning cause decommissioning cost estimates to increase significantly;
|
|
•
|
TVA is required to decommission a nuclear plant sooner than it anticipates; or
|
|
•
|
The NRC guidelines for calculating the minimum amount of funds necessary for decommissioning activities are significantly changed.
|
If TVA makes additional contributions to the NDT, the contributions may negatively affect TVA's cash flows, results of operations, and financial condition.
Increased Regulation
. The NRC has broad authority to adopt requirements related to the licensing, operating, and decommissioning of nuclear generation facilities that can result in significant restrictions or requirements on TVA. If the NRC modifies existing requirements or adopts new requirements, TVA may be required to make substantial capital expenditures at its nuclear plants or make substantial contributions to the NDT. In addition, if TVA fails to comply with requirements promulgated by the NRC, the NRC has the authority to impose fines, shut down units, or modify, suspend, or revoke TVA's operating licenses.
Waste Disposal.
TVA’s nuclear operations produce various types of nuclear waste materials, including spent fuel. TVA has been storing the spent fuel in accordance with NRC regulations in anticipation that a final storage site for all such waste will be developed and put in operation by the U.S. government. If no such site is forthcoming or if no alternative disposal or reuse plan is developed, then TVA might be required to arrange for the safe and permanent disposal of the spent fuel itself. Such a requirement would cause TVA to incur substantial expense, including substantial capital expenditures, and could cause TVA to change how it operates its nuclear plants.
Availability of Components.
Nuclear facilities require specialized components and access to intellectual property for operation. As the number of reliable suppliers of such components and access to intellectual property is reduced, the availability of the components and access to the intellectual property will also likely decrease. If TVA is unable to secure either the original components, intellectual property, or replacements approved for use by the NRC, TVA might have to change how it conducts its operations.
TVA’s operation of coal combustion residual facilities exposes it to additional costs and risks.
TVA operates coal-fired units which produce CCR as byproducts of the power production process. The CCR is contained within dedicated facilities operated by TVA. TVA has closed some of these facilities in compliance with state and federal laws and is in the process of closing others. Some facilities are intended to remain open during the life of the associated generation unit. Many of these facilities were constructed prior to the requirement that such facilities be built with liners and thus do not contain such liners. TVA has been involved in litigation with regard to certain of these facilities, and has been ordered to move all CCR material from unlined facilities at Gallatin Fossil Plant to a lined facility that will have to be constructed for that purpose. (Although a panel of the Sixth Circuit reversed this decision, the plaintiffs have petitioned for a rehearing.) TVA could be subject to similar litigation and orders at other TVA facilities. TVA has also been ordered by TDEC to undertake investigations for all facilities in Tennessee. TVA could be required to restrict or stop the use of any or all CCR facilities or relocate CCR material to other lined facilities which do not currently
33
exist. These measures would impact how TVA operates its facilities, cause TVA to incur greater expenses than currently anticipated for operating, closing, or decommissioning existing CCR facilities, and negatively impact TVA’s cash flow, results of operations, and financial condition. Actual decommissioning costs may also vary from estimates because of changes in current assumptions, such as the assumed dates of decommissioning, changes in regulatory requirements, changes in technology, and changes in the cost of labor, materials, and equipment. Additionally, the relocation of materials would result in a lengthy process with the potential for environmental and safety impacts, which could cause extensive adverse financial and reputational impacts to TVA.
TVA’s facilities and operations may be damaged or interfered with by physical attacks, threats, or other interference.
TVA has an extensive generation and transmission system and supporting infrastructure that includes, among other things, TVA’s generation facilities and transmission infrastructure such as substations, towers, and control centers. Some of TVA’s hydroelectric facilities include navigation locks which are necessary for commerce along the Tennessee River system. TVA also operates flood control dams and supporting infrastructure. Because of TVA’s status as a governmental corporation and TVA’s role as predominately the sole power provider for its service territory, TVA may be targeted by individuals, groups, or nation states for physical attacks or threats of such attacks. Although TVA’s operations are protected by automated monitoring systems, TVA employees, local law enforcement, or a combination thereof, it may not be possible to effectively deter or prevent attacks. Such attacks could pose health and safety risks, significantly disable or destroy TVA assets, interfere with TVA’s operations, result in additional regulatory or security requirements, and negatively affect TVA’s cash flows, results of operations, and financial condition.
TVA’s facilities and information infrastructure may not operate as planned due to cyber threats to TVA’s assets and operations.
TVA’s operations are heavily computerized and include assets such as information technology and networking systems. As with all industries, the reliance on computerization and networking makes TVA a target for cyber attacks, and the risk of such attacks may increase as individual devices and equipment become accessible via the internet. TVA has been targeted by cyber attacks in the past and anticipates that it will be targeted in the future. These attacks may have been carried out, or in the future could be carried out, by individuals, groups, or nation states. Although TVA has extensive cyber safeguards and works with industry specialists and relevant governmental authorities to deter, stop or mitigate cyber attacks, it is possible that these measures might not prevent all attacks. In such a case, a cyber attack could compromise sensitive data, significantly disrupt operations, require additional expenditures for cyber security, negatively affect TVA's cash flows, results of operations, financial condition, and reputation, and pose health and safety risks. Additionally, the theft, damage, or improper disclosure of sensitive data may also subject TVA to penalties and claims from third parties.
Cyber attacks on third parties could interfere with or harm TVA.
TVA relies on third parties for various services, including transferring funds to non-TVA entities in the ordinary course of business. As with TVA, these third parties are heavily computerized and include assets such as information technology and networking systems. If these third parties undergo cyber attacks, the services they provide TVA could be disrupted. This disruption could interfere with TVA’s abilities to perform its obligations to others or transfer funds or make payments, which in turn could negatively affect TVA’s financial condition and reputation. Additionally, the theft, damage, or improper disclosure of sensitive data held by these third parties may also subject TVA to additional harm.
TVA's assets or their supporting infrastructure may not operate as planned.
Many of TVA's assets, including generation, transmission, navigation, and flood control assets, have been operating for several decades and have been in nearly constant service since they were completed. Additionally, certain of TVA's newer assets utilize advanced technology which could experience technical or operating issues. The failure of TVA's assets or supporting infrastructure, including information technology systems, to perform as planned may cause health, safety, or environmental problems and may even result in events such as the failure of a dam, the inability to maintain a reservoir at the normal or expected level, or an incident at a coal-fired, gas-fired, or nuclear plant or a CCR facility. If these assets or their supporting infrastructure fail to operate as planned, if necessary repairs or upgrades are delayed or cannot be completed as quickly as anticipated, or if necessary spare parts are unavailable, TVA, among other things:
|
•
|
May have to invest a significant amount of resources to repair or replace the assets or the supporting infrastructure;
|
|
•
|
May have to remediate collateral damage caused by a failure of the assets or the supporting infrastructure;
|
|
•
|
May not be able to maintain the integrity or reliability of the transmission system at normal levels;
|
|
•
|
May have to operate less economical sources of power;
|
34
|
•
|
May have to purchase replacement power on the open market at prices greater than its generation costs;
|
|
•
|
May be required to invest substantially to meet more stringent reliability standards;
|
|
•
|
May be unable to maintain insurance on affected facilities, or be required to pay higher premiums for coverage, unless necessary repairs or upgrades are made;
|
|
•
|
May be unable to operate the assets for a significant period of time; or
|
|
•
|
May not be able to meet its contractual obligations to deliver power.
|
Any of these potential outcomes may negatively affect TVA's cash flows, results of operations, financial condition, and reputation.
TVA’s safety programs may not prevent accidents that could, among other things, impact TVA’s operations or financial condition.
TVA’s safety program, no matter how well designed and operated, may not completely prevent accidents. In addition to the potential human cost of accidents, which could include injury to employees or members of the public, significant accidents could impact TVA’s ability to carry out operations, cause it to shut down facilities, subject it to additional regulatory scrutiny, expose it to litigation, damage its reputation, interfere with its ability to attract or retain a skilled workforce, or harm its financial condition.
Weather conditions may influence TVA's ability to supply power and its customers' demands for power.
Extreme temperatures may increase the demand for power and require TVA to purchase power at high prices to meet the demand from customers, while unusually mild weather may result in decreased demand for power and lead to reduced electricity sales. Also, in periods of below normal rainfall or drought, TVA's low-cost hydroelectric generation may be reduced, requiring TVA to purchase power or use more costly means of producing power. Additionally, periods of either high or low levels of rainfall may impede river traffic, impacting barge deliveries of critical items such as coal and equipment for power facilities. Furthermore, high river water temperatures in the summer may limit TVA's ability to use water from the Tennessee or Cumberland River systems for cooling at certain of TVA's generating facilities, thereby limiting its ability to operate these generating facilities. This situation would be aggravated during periods of reduced rainfall or drought. If changes in the climate make such shifts in weather more common or extreme, TVA may be required to, among other things, change its generation mix or change how it conducts its operations, which could have a material adverse effect on TVA's cash flows, results of operations, and financial condition.
Catastrophic events may negatively affect TVA's cash flows, results of operations, and financial condition.
TVA's cash flows, results of operations, and financial condition may be adversely affected, either directly or indirectly, by catastrophic events such as fires, earthquakes, explosions, solar events,
electromagnetic pulses ("EMP")
, droughts, floods, tornadoes, wars or other casualty events or national emergencies, terrorist activities, pandemics, or other similar destructive or disruptive events. These events, the frequency and severity of which are unpredictable, may, among other things, lead to legislative or regulatory changes that affect the construction, operation, and decommissioning of nuclear units and the storage of spent fuel; limit or disrupt TVA's ability to generate and transmit power; limit or disrupt TVA's ability to provide flood control and river management; reduce the demand for power; disrupt fuel or other supplies; require TVA to produce additional tritium; lead to an economic downturn; require TVA to make substantial capital investments for repairs, improvements, or modifications; and create instability in the financial markets. If public opposition to nuclear power makes operating nuclear plants less feasible as a result of any of these events, TVA may be forced to shut down its nuclear plants. This would make it substantially more difficult for TVA to obtain greater amounts of its power supply from low or zero carbon emitting resources and to replace its generation capacity when faced with retiring or idling certain coal-fired units. Additionally, some studies have predicted that climate change may cause catastrophic events, such as droughts and floods, to occur more frequently in the Tennessee Valley region, which could adversely impact TVA.
TVA's service reliability could be affected by problems at other utilities or at TVA facilities, or by the increase in intermittent sources of power.
TVA's transmission facilities are directly interconnected with the transmission facilities of neighboring utilities and are thus part of the larger interstate power transmission grid. Certain of TVA's generation and transmission assets are critical to maintaining reliability of the transmission system. Additionally, TVA uses certain assets that belong to third parties to transmit power and maintain reliability. Accordingly, problems at other utilities as well as at TVA's facilities may cause interruptions in TVA's service to TVA's customers, increase congestion on the transmission grid, or reduce service reliability. In addition, the increasing contribution of intermittent sources of power, such as wind and solar, may
35
place additional strain on TVA's system as well as on surrounding systems. If TVA suffers a service interruption, increased congestion, or reduced service reliability, TVA's cash flows, results of operations, financial condition, and reputation may be negatively affected.
TVA's supplies of fuel, purchased power, or other critical items may be disrupted.
TVA purchases coal, uranium, natural gas, fuel oil, and electricity from a number of suppliers. Additionally, TVA contracts for conversion of uranium into nuclear fuel and purchases other items, such as anhydrous ammonia, liquid oxygen, or replacement parts that are critical to the operation of certain generation assets. TVA also purchases power from other power producers when the purchase of such power is appropriate due to economic opportunities or operational concerns. Disruption in the acquisition or delivery of fuel, purchased power, contracted services, or other critical supplies may result from a variety of physical and commercial events, political developments, international trade restrictions or tariffs, legal actions, or environmental regulations affecting TVA's suppliers as well as from transportation or transmission constraints. If one of TVA's suppliers fails to perform under the terms of its contract with TVA, TVA might have to purchase replacement fuel, power, or other critical supplies, perhaps at a significantly higher price than TVA is entitled to pay under the contract. In some circumstances, TVA may not be able to recover this difference from the supplier. In addition, any disruption of
TVA's supplies could require TVA to operate higher cost generation assets, thereby negatively affecting TVA's cash flows, results of operations, and financial condition. Moreover, if TVA is unable to acquire enough replacement fuel, power, or supplies, or does not have sufficient reserves to offset the loss, TVA may not be able to operate certain assets or provide enough power to meet demand, resulting in power curtailments, brownouts, or even blackouts.
Events that affect the supply or quality of water in the Tennessee River system and Cumberland River system or elsewhere may interfere with TVA's ability to generate power.
An inadequate supply of water in the Tennessee River system and Cumberland River system could negatively impact TVA's cash flows, results of operations, and financial condition by reducing generation not only at TVA's hydroelectric plants but also at its coal-fired and nuclear plants, which depend on water from the river systems near which they are located for cooling and for use in boilers where water is converted into steam to drive turbines. Certain of TVA’s gas-fired facilities not located near a river require alternative sources of water, such as from wells or local utility companies. Further, the water must be of a particular quality for use in TVA’s equipment. If the available water is not of sufficient quality for TVA’s use, then TVA must either treat the water or obtain alternate sources. An inadequate supply of quality water could result, among other things, from periods of low rainfall or drought, the withdrawal of water from the river systems by governmental entities or others, incidents affecting bodies of water not managed by TVA, or supply issues which affect water providers. While TVA manages the Tennessee River and a large portion of its tributary system to provide much of the water necessary for the operation of its power plants, the USACE operates and manages other bodies of water upon which some of TVA's facilities rely. Events at these bodies of water or their associated hydroelectric facilities may interfere with the flow of water and may result in TVA's having insufficient quality water to meet the needs of its plants. If TVA has insufficient water of the necessary quality to meet the needs of its plants, TVA may be required to treat the water, reduce generation at its affected facilities to levels compatible with the available supply of water, or take additional steps that change how TVA conducts its operations or cause TVA to incur additional expense.
TVA's determination of the appropriate mix of generation assets may change.
TVA has determined that its power generation assets should consist of a mix of nuclear, coal-fired, natural gas-fired, and renewable power sources, including hydroelectric. In making this determination, TVA took various factors into consideration, including the anticipated availability of its nuclear units, the availability of non-nuclear facilities, the forecasted cost of natural gas and coal, the forecasted demand for electricity, and environmental compliance including the expense of adding air pollution controls to its coal-fired units. If any of these assumptions materially change or are impacted by subsequent events, then TVA's generation mix may not address its operational needs in the most efficient manner. Resolving such a situation may require capital expenditures or additional power purchases, and TVA's cash flows, results of operations, financial condition, and reputation may be negatively affected.
FINANCIAL, ECONOMIC, AND MARKET RISKS
TVA’s cost reduction efforts may not be successful.
TVA is continuing to work to reduce operating expenses and to offset reductions in power demand. The failure to achieve or maintain cost reductions could adversely affect TVA's rates, reputation, cash flows, results of operations, and financial condition.
36
TVA may have to make significant contributions in the future to fund its qualified pension plan.
At
September 30, 2018
, TVA's qualified pension plan had assets of approximately $
8.0 billion
compared to liabilities of approximately $
11.7 billion
. The plan is mature with approximately 24,000 retirees and beneficiaries receiving benefits of over $700 million per year. The costs of providing benefits depend upon a number of factors, including, but not limited to, provisions of the plan; changing experience and assumptions related to terminations, retirements, and mortality; rates of increase in compensation levels; rates of return on plan assets; discount rates used in determining future benefit obligations and required funding levels; optional forms of benefit payments selected; future government regulation; and levels of contributions made to the plan.
Although the plan is frozen to new participants, any of these factors or any number of these factors could keep at high levels, or even increase, the costs of providing benefits and require TVA to make contributions to the plan in amounts that significantly exceed TVA's planned contributions. Unfavorable financial market conditions may result in lower expected rates of return on plan assets, loss in value of the investments, and lower discount rates used in determining future benefit obligations. These changes would negatively impact the funded status of the plan. Additional contributions to the plan and absorption of additional costs would negatively affect TVA's cash flows, results of operations, and financial condition.
TVA's debt ceiling could be made more restrictive. Additionally, approaching or reaching TVA's debt ceiling could limit TVA's ability to carry out its business.
The TVA Act provides that TVA can issue Bonds in an amount not to exceed $30.0 billion outstanding at any time. At
September 30, 2018
, TVA had
$22.7 billion
of Bonds outstanding (not including non-cash items of foreign currency exchange gain of
$147 million
, unamortized debt issue costs of
$56 million
and net discount on sale of Bonds of
$88 million
).
Approaching or reaching the debt ceiling may negatively affect TVA's business by limiting TVA's ability to access capital markets and increasing the amount of debt TVA must service. Also, federal legislation may lower TVA's debt ceiling or broaden the types of financial instruments that are covered by the ceiling. Either of these scenarios may also restrict TVA's ability to raise capital to acquire new power program assets or maintain existing ones, to carry out upgrades or improvements to existing assets or build new ones, to purchase power under long-term power purchase agreements, or to meet regulatory requirements. In addition, approaching or reaching the debt ceiling may lead to increased legislative or regulatory oversight of TVA's activities and could lead to negative rating actions by credit rating agencies.
TVA may be unable to meet its current cash requirements if TVA's access to the debt markets is limited.
TVA uses cash provided by operations together with proceeds from power program financings and other financing arrangements to fund its current cash requirements. It is critical that TVA continues to have access to the debt markets in order to meet its cash requirements. The importance of having access to the debt markets is underscored by the fact that TVA, unlike most utilities, relies almost entirely on debt capital since, as a governmental instrumentality, TVA cannot issue equity securities.
TVA's credit ratings may be impacted by congressional actions or by a downgrade of the U.S.'s sovereign credit ratings.
TVA's current credit ratings are not based solely on its underlying business or financial condition but are based to a large extent on the legislation that defines TVA's business structure. Key characteristics of TVA's business defined by legislation include (1) the TVA Board's ratemaking authority, (2) the current competitive environment, which is defined by the fence and the anti-cherrypicking provision, and (3) TVA's status as a corporate agency and instrumentality of the U.S. If Congress takes any action that effectively alters any of these characteristics, TVA's credit ratings could be downgraded.
Although TVA Bonds are not obligations of the U.S., TVA, as a corporate agency and instrumentality of the U.S., may be impacted if the sovereign credit ratings of the U.S. are downgraded. Such a downgrade of the U.S.'s sovereign credit ratings could, among other things, result in a downgrade of TVA's credit rating. Additionally, the economy could be negatively impacted resulting in reduced demand for electricity, an increase in borrowing costs, and an increase in the cost of fuels, supplies, and other materials required for TVA's operations.
TVA, together with owners of TVA securities, may be impacted by downgrades of TVA's credit ratings.
Downgrades of TVA's credit ratings may have material adverse effects on TVA's cash flows, results of operations, and financial condition as well as on investors in TVA securities. Among other things, a downgrade could increase TVA's interest expense by increasing the interest rates that TVA pays on new securities that it issues. Such an increase may reduce the amount of cash available for other purposes, which may result in the need to increase borrowings, to reduce
37
other expenses or capital investments, or to increase power rates. A downgrade may also result in TVA's having to post collateral under certain physical and financial contracts that contain ratings triggers. A downgrade below a contractual threshold may prevent TVA from borrowing under
four
credit facilities totaling
$2.7 billion
or posting letters of credit as collateral under these facilities. At
September 30, 2018
, there were
$921 million
of letters of credit outstanding under these facilities. If TVA were no longer able to post letters of credit as collateral, TVA would likely have to post cash as collateral, which would negatively affect TVA’s liquidity. Further, a downgrade may lower the price of TVA securities in the secondary market, thereby negatively impacting investors who sell TVA securities after the downgrade and diminishing the attractiveness and marketability of TVA securities.
TVA's assumptions about the future may be inaccurate.
TVA uses certain assumptions in order to develop its plans for the future. Such assumptions include economic forecasts, anticipated energy and commodity prices, cost estimates, construction schedules, power demand forecasts, the appropriate generation mix to meet demand, and potential regulatory environments. Should these assumptions be inaccurate, or be superseded by subsequent events, TVA's plans may not be effective in achieving the intended results, which could negatively affect cash flows, results of operations, and financial condition, as well as TVA's ability to meet electricity demand and the way TVA conducts its business.
Demand for electricity may significantly decline or change, negatively affecting TVA's cash flows, results of operations, and financial condition.
Some of the factors that could reduce or change the demand for electricity include, but are not limited to, the following:
Economic downturns
. Renewed economic downturns in TVA's service area or other parts of the U.S. could reduce overall demand for power and thus reduce TVA's power sales and cash flows, especially if TVA's industrial customers, which constitute a material portion of TVA’s demand, reduce their operations and thus their consumption of power.
Loss of customers
. TVA could lose customers, particularly LPCs, if customers choose another utility to meet some or all of their power needs where available, pursue self-generation to meet some or all of their power needs, or move their operations outside of TVA’s service territory. At
September 30, 2018
, TVA had wholesale power contracts with
154
LPCs. A significant portion of TVA’s total operating revenues are concentrated in a small number of these LPCs. The loss of customers could have a material adverse effect on TVA's cash flows, results of operations, or financial condition, and could result in higher rates, especially because of the difficulty in replacing customers on account of the fence.
Change in demands for electricity generated from renewable sources.
TVA has been adapting its generation mix to account for the growing preference for electricity generated by renewable sources, such as solar or wind. If demand by customers for power that is largely or exclusively generated from renewable sources exceeds TVA’s ability to produce such power, TVA might have to change how it operates and may incur additional expense in meeting this demand.
Increased utilization of DER.
As the amount of DER grows on the TVA system, the need for TVA’s traditional generation resources may be reduced, and the ability of the system to reliably and economically operate in conjunction with these DER may become more challenging. If TVA is unable to compensate for the resulting decrease in demand for TVA electricity,TVA’s cash flows, results of operations, and financial condition could be negatively impacted, resulting in higher rates and changes to TVA’s operations.
Increased energy efficiency and conservation
. Increasingly efficient use of energy as well as conservation efforts have reduced the demand for power. Further reductions, if TVA is unable to compensate for them, could negatively affect TVA's cash flows, results of operations, and financial condition and could result in higher rates and changes to TVA’s operations, especially if the reductions occur during an economic downturn or a period of slow economic growth.
Change in technology could require TVA to change how it conducts its operations, affect relationships with customers, or impact its financial condition.
TVA’s primary business is to sell power it produces, for the most part, from large facilities such as nuclear power plants, hydroelectric facilities, natural gas-fired facilities, and coal-fired units. TVA sells power to LPCs and directly served customers. Research and development activities are ongoing to improve existing and alternative technologies to produce or store electricity, including large-scale energy storage, gas or wind turbines, fuel cells, microturbines, solar cells, and distributed energy or storage resources. It is possible that advances in these or other alternative technologies could reduce the costs of such production methods to a level that will enable these technologies to compete effectively with traditional power plants such as TVA's. These technologies could be more appealing to
38
customers and could lead them to bring pressure on TVA to modify the power contracts to allow customers to generate some of their own power requirements or purchase power from other suppliers. Other customers might also cease purchasing power from TVA altogether. To the extent that sales to such customers are reduced or eliminated, TVA's cash flows, results of operations, and financial condition could be negatively affected. TVA could also be required to modify how it operates its traditional plants or further modify its generation mix to reduce reliance on these facilities.
Additionally, demand could change in terms of amount or timing as devices and equipment become more connected to the internet and it becomes possible to adjust real-time consumption of power. Such increased control over power consumption could, among other things, affect how TVA operates its facilities or dispatches power, or require TVA to change its pricing structure or rates.
TVA is subject to a variety of market risks that may negatively affect TVA's cash flows, results of operations, and financial condition.
TVA is subject to a variety of market risks, including, but not limited to, commodity price risk, investment price risk, interest rate risk, counterparty credit and performance risk, and currency exchange rate risk.
Commodity Price Risk
. TVA's rates may increase if prices of commodities critical to operations, including coal, uranium, natural gas, fuel oil, crude oil, construction materials, or emission allowances, increase.
Investment Price Risk
. TVA is exposed to investment price risk in its NDT, its
Asset Retirement Trust ("ART")
, its
Supplemental Executive Retirement Plan ("SERP")
, its
Deferred Compensation Plan ("DCP")
, and its pension plan. If the value of the investments held in the NDT or the pension fund either decreases or fails to increase in accordance with assumed rates of return, TVA may be required to make substantial contributions to these funds. In addition, although TVA is not required to make contributions to the ART, it may choose to do so, particularly if TVA's estimates of its non-nuclear asset retirement obligation liabilities increase. TVA may also choose to make contributions to the SERP and DCP from time to time.
Interest Rate Risk
. Changes in interest rates may increase the amount of interest that TVA pays on new Bonds that it issues, decrease the return that TVA receives on short-term investments, decrease the value of the investments in the NDT, the ART, TVA's pension fund, the SERP and the DCP, increase the amount of collateral that TVA is required to post in connection with certain of its derivative transactions, and increase the losses on the mark-to-market valuation of certain derivative transactions into which TVA has entered.
Counterparty Credit and Performance Risk
. TVA is exposed to the risk that its counterparties will not be able to perform their contractual obligations. If TVA's counterparties fail to perform their obligations, TVA's cash flows, results of operations, and financial condition may be adversely affected. In addition, the failure of a counterparty to perform may make it difficult for TVA to perform its obligations, particularly if the counterparty is a supplier of electricity or fuel.
Currency Exchange Rate Risk
. Over the next several years, TVA plans to spend a significant amount of capital on various projects. A portion of this amount may be spent on contracts that are denominated in one or more foreign currencies. Additionally, TVA’s three issues of Bonds denominated in British pounds sterling are hedged by currency swap agreements. The value of the U.S. dollar compared with other currencies has fluctuated widely in recent years, including fluctuations in the U.S. dollar to British pound sterling exchange rate primarily driven by the “BREXIT” vote for the United Kingdom to leave the European Union. If not effectively managed, foreign currency exposure could negatively impact TVA's counterparty risk, cash flows, results of operations, and financial condition.
TVA's ability to use derivatives to hedge certain risks may be limited.
Under the Dodd-Frank Wall Street Reform and Consumer Protection Act and its implementing regulations, TVA is subject to recordkeeping, reporting, and reconciliation requirements related to its derivative transactions. In addition, depending on how regulatory agencies interpret and implement the provisions of this act, TVA's hedging costs may increase, and TVA may have to post additional collateral and margin in connection with its derivative transactions. These occurrences may, among other things, negatively affect TVA's cash flows and cause TVA to reduce or modify its hedging activities, which could increase the risks to which TVA is exposed.
The market for TVA Bonds might be limited.
Although many TVA Bonds are listed on stock exchanges, there can be no assurances that any market will develop or continue to exist for any Bonds. Additionally, no assurances can be made as to the ability of the holders to sell their Bonds or as to the price at which holders will be able to sell their Bonds. Future trading prices of Bonds will depend on many factors, including prevailing interest rates, the then-current ratings assigned to the Bonds, the amount of Bonds outstanding, the time remaining until the maturity of the Bonds, the redemption features of the Bonds, the market for
39
similar securities, and the level, direction, and volatility of interest rates generally, as well as the liquidity of the markets for those securities.
If a particular series of Bonds is offered through underwriters, those underwriters may attempt to make a market in the Bonds. Dealers other than underwriters may also make a market in TVA Bonds. However, the underwriters and dealers are not obligated to make a market in any TVA Bonds and may terminate any market-making activities at any time without notice.
Further, certain investors use the environmental impact or sustainability of an industry as a criteria for deciding whether to invest in that industry. TVA’s use of fossil fuels or nuclear power could lead such investors to not purchase TVA Bonds.
In addition, legal limitations may affect the ability of banks and others to invest in Bonds. For example, national banks may purchase TVA Bonds for their own accounts in an amount not to exceed 10 percent of unimpaired capital and surplus. Also, TVA Bonds are “obligations of a corporation which is an instrumentality of the United States” within the meaning of Section 7701(a)(19)(C)(ii) of the Internal Revenue Code for purposes of the 60 percent of assets limitation applicable to U.S. building and loan associations.
TVA may be unable to use regulatory accounting for some or all costs.
TVA uses regulatory accounting to defer certain costs. To qualify for regulatory accounting, costs must meet certain accounting criteria and be approved for regulatory accounting treatment by the TVA Board in its capacity as TVA’s regulator. If costs do not meet, or cease to meet, these criteria, or if the TVA Board disallows the treatment or ceases to be TVA’s sole regulator in such areas, TVA may not be able to defer those costs. Such an inability to defer costs would likely have a substantial impact on TVA’s financial condition and results of operations and could impact the timing and amounts of TVA's rate recovery. For a discussion of regulatory accounting, see Item 7, Management's Discussion and Analysis of Financial Condition and Results of Operations
- Critical Accounting Policies and Estimates
.
TVA's financial control system cannot guarantee that all control issues and instances of fraud or errors will be detected.
No financial control system, no matter how well designed and operated, can provide absolute assurance that the objectives of the control system are met, and no evaluation of financial controls can provide absolute assurance that all control issues and instances of fraud or errors can be detected. The design of any system of financial controls is based in part upon certain assumptions about the likelihood of future events, and there can be no assurance that any design will succeed in achieving its stated goals under all potential future conditions, regardless of how remote.
Payment of principal and interest on TVA securities is not guaranteed by the U.S.
Although TVA is a corporate agency and instrumentality of the U.S. government, TVA securities are not backed by the full faith and credit of the U.S. Principal and interest on TVA securities are payable solely from TVA's net power proceeds. Net power proceeds are the remainder of TVA's gross power revenues after deducting the costs of operating, maintaining, and administering its power properties and payments to states and counties in lieu of taxes, but before deducting depreciation accruals or other charges representing the amortization of capital expenditures, plus the net proceeds from the sale or other disposition of any power facility or interest therein. If TVA were to experience extreme financial difficulty and were unable to make payments of principal or interest on its Bonds, the federal government would not be legally obligated to prevent TVA from defaulting on its obligations. An inability to pay some or all of the principal or interest owed on a TVA security would likely have a negative impact on TVA's financial condition, reputation, and relationship with the investment community, and could result in cross-defaults in other financial arrangements.
GENERAL BUSINESS RISKS
TVA may not be able to implement its business strategy successfully.
TVA’s financial condition and results of operations are largely dependent on the extent to which it can implement its business strategy successfully. TVA’s strategy includes maintaining low rates, aligning operations and maintenance spending with revenues, effectively maintaining low rates, being responsible stewards, living with its means, meeting reliability expectations and providing a balanced portfolio, and continuously improving, empowering, and engaging its employees. This strategy is subject to business, economic and competitive uncertainties and contingencies, many of which are beyond its control. If TVA is unable to successfully implement its business strategy, TVA’s financial condition and results of operations could be negatively affected.
40
TVA's organizational structure may not adequately support TVA's anticipated business needs or enable it to meet the needs of its current or potential customers.
TVA has been modifying its organizational structure to better adapt to the forecasted economic environment. If TVA’s assumptions about either its forecasts or the proper internal structure of the company to meet the expected environment are inaccurate or if this structure does not adequately support TVA’s needs, TVA could face operational or financial challenges that could adversely affect TVA's cash flows, results of operations, and financial condition as well as TVA’s ability to attract or retain a skilled workforce and to meet the needs of its current or potential customers.
TVA may have difficulty in adapting its business model to changes in the utility industry and customer preferences.
The traditional business model for power production, selling power from centrally located plants, is facing pressure from a variety of sources, including the potential for self-generation by current or potential customers, new technologies such as energy storage, and increased energy efficiency. These pressures may reduce the demand for TVA power. If TVA does not or cannot adapt to this pressure by adequately changing its business model, TVA’s financial condition and results of operations could be negatively affected.
TVA's quasi-governmental status may interfere in its ability to quickly respond to the needs of its current or potential customers or to act solely in the interest of its ratepayers.
As a quasi-governmental entity, TVA has certain legal requirements that prevent it from responding as quickly to potential changes in the market or requests from current or potential customers as might be desired or in comparison to other utilities. For example, TVA is required to comply with the
National Environmental Policy Act ("NEPA")
, which requires environmental reviews to be performed in connection with certain projects. The delay in responding to requests could damage relationships with current customers, deter potential customers from moving into TVA’s service territory, or damage TVA’s reputation.
In addition, TVA’s nature as a quasi-governmental entity imposes additional pressures that most companies do not face, such as the requirement to support economic development and promote recreational opportunities. TVA must balance these obligations with the requirement to provide power at the least system cost. If TVA does not adequately communicate how it fulfills its various missions and the value it provides, its reputation may be harmed, which may result in political pressure to change its nature or operations as well as in the loss of public support.
TVA's reputation may be negatively impacted.
As with any company, TVA's reputation is a vital element of its ability to effectively conduct its business. TVA's reputation could be harmed by a variety of factors, including the failure of a generating asset or supporting infrastructure, failure to effectively manage land and other natural resources entrusted to TVA, real or perceived violations of environmental regulations, real or perceived issues with TVA’s safety culture or work environment, significant delays in construction projects, acts or omissions of TVA management, the perception of such acts or omissions, measures taken to offset reductions in demand, or a significant dispute with one of TVA's customers. Any deterioration in TVA's reputation may harm TVA's relationships with its customers and stakeholders, may increase TVA's cost of doing business, may interfere with its ability to attract and retain a skilled workforce, and may potentially lead to the enactment of new laws and regulations, or the modification of existing laws and regulations, that negatively affect the way TVA conducts its business.
Failure to attract and retain an appropriately qualified workforce may negatively affect TVA's results of operations.
TVA's business depends on its ability to recruit and retain key executive officers as well as skilled professional and technical employees. The inability to attract and retain an appropriately qualified workforce could adversely affect TVA's ability to, among other things, operate and maintain generation and transmission facilities, complete large construction projects, and successfully implement its continuous improvement initiatives.
Loss of a quorum of the TVA Board could limit TVA's ability to adapt to meet changing business conditions.
Under the TVA Act, a quorum of the TVA Board is five members. Becoming a member of the TVA Board requires confirmation by the U.S. Senate following appointment by the President. Further, the TVA Board members may not continue in office indefinitely until a successor is appointed. As a result, a delay in the appointment or confirmation of directors can threaten the TVA Board's quorum. The TVA Board is responsible for, among other things, establishing the rates TVA charges for power as well as TVA's long-term objectives, policies, and plans. Accordingly, loss of a quorum for an extended period of time would impair TVA's ability to change rates and to modify these objectives, policies, and plans. Such an impairment would likely have a negative impact on TVA's ability to respond to significant changes in technology, the regulatory environment, or the industry overall and, in turn, negatively affect TVA's cash flows, results of operations, and financial condition.
41
Changes in the membership of the TVA Board and TVA senior management could impact how TVA operates.
The TVA Board is comprised of up to nine part-time members serving staggered, five-year terms. One to two Board members’ terms typically expire each year. In addition, there is always the possibility that one or more members of TVA’s senior management may retire or otherwise leave TVA. The individuals filling either the TVA Board or senior management positions may wish to change how TVA operates in whole or in part. If the changes are not successful or TVA is not able to adapt properly to such changes, TVA’s financial condition, results of operations, reputation, and relationship with customers could be negatively affected.
Not applicable.
TVA holds personal property in its own name but holds real property as agent for the U.S. TVA may acquire real property as an agent of the U.S. by negotiated purchase or by eminent domain.
Generating Properties
At
September 30, 2018
, TVA-operated generating assets consisted of
26
active coal-fired units, seven nuclear units,
109
conventional hydroelectric units, four pumped-storage units,
14
combined-cycle power blocks,
87
simple-cycle units, five diesel generator units, and
14 solar
sites. In addition, TVA has digester gas co-firing potential at one coal-fired site as well as biomass co-firing potential at its coal-fired sites. As of
September 30, 2018
, 24 of the simple-cycle combustion turbine units and four of the combined-cycle power blocks were leased to
special purpose entities ("SPEs")
and leased back to TVA under long-term leases. See
Note 13
— Lease/Leasebacks
. In addition, TVA is leasing the three Caledonia combined-cycle power blocks under a long-term lease. For a discussion of these assets, see Item 1, Business
—
Power Supply and Load Management Resources
.
42
Net Capability
The following table summarizes TVA's summer net capability in
megawatts ("MW")
at
September 30, 2018
:
|
SUMMER NET CAPABILITY
(1)
At September 30, 2018
|
|||||||||||||
|
Source of Capability
|
Location
|
Number
of Units
|
Summer Net Capability (MW)
|
Date First Unit Placed in Service (CY)
|
Date Last Unit Placed in Service (CY)
|
||||||||
|
TVA-Operated Generating Facilities
|
|
|
|
|
|
|
|||||||
|
Nuclear
|
|
|
|
|
|
|
|
|
|
||||
|
Browns Ferry
(2)
|
Alabama
|
3
|
|
3,309
|
|
1974
|
|
1977
|
|
||||
|
Sequoyah
|
Tennessee
|
2
|
|
2,292
|
|
1981
|
|
1982
|
|
||||
|
Watts Bar
|
Tennessee
|
2
|
|
2,122
|
|
1996
|
|
2016
|
|
||||
|
Total Nuclear
|
|
7
|
|
7,723
|
|
|
|
|
|
||||
|
Coal-Fired
|
|
|
|
|
|
|
|
||||||
|
Bull Run
|
Tennessee
|
1
|
|
865
|
|
1967
|
|
1967
|
|
||||
|
Cumberland
|
Tennessee
|
2
|
|
2,470
|
|
1973
|
|
1973
|
|
||||
|
Gallatin
|
Tennessee
|
4
|
|
976
|
|
1956
|
|
1959
|
|
||||
|
Kingston
|
Tennessee
|
9
|
|
1,398
|
|
1954
|
|
1955
|
|
||||
|
Paradise
|
Kentucky
|
1
|
|
971
|
|
1963
|
|
1970
|
|
||||
|
Shawnee
|
Kentucky
|
9
|
|
1,206
|
|
1953
|
|
1955
|
|
||||
|
Total Coal-Fired
|
|
26
|
7,886
|
|
|
|
|
|
|||||
|
Natural Gas and/or Oil-Fired
(3)(4)
|
|
|
|
|
|
|
|
|
|
||||
|
Simple-Cycle Combustion Turbine
|
|||||||||||||
|
Allen
|
Tennessee
|
20
|
|
456
|
|
1971
|
|
1972
|
|
||||
|
Brownsville
|
Tennessee
|
4
|
|
468
|
|
1999
|
|
1999
|
|
||||
|
Colbert
|
Alabama
|
8
|
|
392
|
|
1972
|
|
1972
|
|
||||
|
Gallatin
|
Tennessee
|
8
|
|
642
|
|
1975
|
|
2000
|
|
||||
|
Gleason
|
Tennessee
|
3
|
|
500
|
|
2000
|
|
2000
|
|
||||
|
Johnsonville
|
Tennessee
|
20
|
|
1,269
|
|
1975
|
|
2000
|
|
||||
|
Kemper
|
Mississippi
|
4
|
|
348
|
|
2002
|
|
2002
|
|
||||
|
Lagoon Creek
|
Tennessee
|
12
|
|
1,048
|
|
2001
|
|
2002
|
|
||||
|
Marshall County
|
Kentucky
|
8
|
|
608
|
|
2002
|
|
2002
|
|
||||
|
Subtotal Simple-Cycle Combustion Turbine
|
|
87
|
|
5,731
|
|
|
|
|
|
||||
|
Combined-Cycle Combustion Turbine
|
|||||||||||||
|
Ackerman
(5)
|
Mississippi
|
1
|
|
713
|
|
2007
|
|
2007
|
|
||||
|
Allen
(6)
|
Tennessee
|
1
|
|
1,106
|
|
2018
|
|
2018
|
|
||||
|
Caledonia
(7)
|
Mississippi
|
3
|
|
765
|
|
2003
|
|
2003
|
|
||||
|
John Sevier
(8)
|
Tennessee
|
1
|
|
871
|
|
2012
|
|
2012
|
|
||||
|
Lagoon Creek
(9)
|
Tennessee
|
1
|
|
525
|
|
2010
|
|
2010
|
|
||||
|
Magnolia
|
Mississippi
|
3
|
|
918
|
|
2003
|
|
2003
|
|
||||
|
Paradise
(10)
|
Kentucky
|
1
|
|
1,100
|
|
2017
|
|
2017
|
|
||||
|
Southaven
|
Mississippi
|
3
|
|
780
|
|
2003
|
|
2003
|
|
||||
|
Subtotal Combined-Cycle Combustion Turbine
|
14
|
|
6,778
|
|
|||||||||
|
Total Natural Gas and/or Oil-Fired
|
101
|
|
12,509
|
|
|||||||||
|
Hydroelectric
|
|
|
|
|
|
|
|
|
|
||||
|
Conventional Plants
|
Alabama
|
36
|
|
1,176
|
|
1925
|
|
1962
|
|
||||
|
|
Georgia
|
2
|
|
35
|
|
1931
|
|
1956
|
|
||||
|
|
Kentucky
|
5
|
|
223
|
|
1944
|
|
1948
|
|
||||
|
|
North Carolina
|
6
|
|
492
|
|
1940
|
|
1956
|
|
||||
|
|
Tennessee
|
60
|
|
1,856
|
|
1912
|
|
1972
|
|
||||
|
Pumped-Storage
(11)
|
Tennessee
|
4
|
|
1,616
|
|
1978
|
|
1979
|
|
||||
|
Total Hydroelectric
|
|
113
|
|
5,398
|
|
|
|
|
|
||||
|
Diesel Generator
|
|
|
|
|
|
|
|
|
|
||||
|
Meridian
|
Mississippi
|
5
|
|
9
|
|
1998
|
|
1998
|
|
||||
|
TVA Non-hydro Renewable Resources
(12)
|
|
|
|
1
|
|
|
|
|
|
||||
|
Total TVA-Operated Generating Facilities
|
|
|
33,526
|
|
|
|
|
|
|||||
|
Contract Renewable Resources
(13)
|
|
|
|
314
|
|
|
|
|
|
||||
|
Power Purchase and Other Agreements
(14)
|
|
|
|
3,674
|
|
|
|
|
|
||||
|
Total Summer Net Capability
|
|
|
|
37,514
|
|
|
|
||||||
43
Notes
(1) Net capability is defined as the ability of an electric system, generating unit, or other system component to carry or generate power for a specified time period
and does not include operational limitations such as derates.
(2) The summer net capability for Browns Ferry excludes the impact of the EPU project. The generating capability is expected to increase by
an estimated 465 MW after completion of the project and sufficient run time to validate the new capacity.
(3) See
Generating Properties
above for a discussion of TVA-operated natural gas and/or oil-fired facilities subject to leaseback and long-term lease arrangements.
(4) Peak firing of simple-cycle combustion turbine units accounts for
326
MW of short-term capability.
(5) Ackerman Combined Cycle Facility is a single steam cycle unit driven by two gas turbines (2x1 configuration).
(6) Allen Combined Cycle Facility is a single steam cycle unit driven by two gas turbines (2x1 configuration).
(7) Caledonia Combined Cycle Plant is currently a leased facility operated by TVA.
(8) John Sevier Combined Cycle Facility is a single steam cycle unit driven by three gas turbines (3x1 configuration).
(9) Lagoon Creek Combined Cycle Facility is a single steam cycle unit driven by two gas turbines (2x1 configuration).
(10) Paradise Combined Cycle Facility is a single steam cycle unit driven by three gas turbines (3x1 configuration).
(11) See Item 1, Business
—
Power Supply and Load Management Resources
—
Hiwassee Hydro Unit 2
for a discussion of Hiwassee Hydro Unit 2.
(12) TVA owns 1 MW of solar installations at 14 sites.
(13) Contract Renewable Resources include capability from various renewable energy programs established by TVA to encourage the development of solar, wind, biomass, and low-impact hydroelectric generation systems across the Tennessee Valley.
(14) Power Purchase and Other Agreements includes renewable resources. See Item 1, Business
— Power Supply and Load Management Resources — Purchased Power and Other Agreements
for information on renewable energy power purchase contracts.
Transmission Properties
TVA’s transmission system interconnects with systems of surrounding utilities and consisted primarily of the following assets at
September 30, 2018
:
|
•
|
Approximately 2,500 circuit miles of 500 kilovolt, 11,700 circuit miles of 161 kilovolt, 2,000 circuit miles of other voltage transmission lines, and 3,600 miles of fiber;
|
|
•
|
508 transmission substations, power switchyards, and switching stations; and
|
|
•
|
1,321 customer connection points (customer, generation, and interconnection).
|
At
September 30, 2018
, certain qualified technological equipment and other software related to TVA’s transmission system were leased to private entities and leased back to TVA under long-term leases. See
Note 13
— Lease/Leasebacks
.
Natural Resource Stewardship Properties
TVA operates and maintains 49 dams and manages the following natural resource stewardship properties:
|
•
|
Approximately 11,000 miles of reservoir shoreline;
|
|
•
|
Approximately 293,000 acres of reservoir land;
|
|
•
|
Approximately 650,000 surface acres of reservoir water; and
|
|
•
|
Approximately 80 public recreation areas throughout the Tennessee Valley, including campgrounds, day-use areas, and boat launching ramps.
|
Additionally, TVA manages over 170 agreements for commercial recreation (such as campgrounds and marinas).
As part of its stewardship responsibilities, TVA approval is required to be obtained before any obstruction affecting navigation, flood control, or public lands can be constructed in or along the Tennessee River and its tributaries.
Buildings
TVA has a variety of buildings and structures located throughout its service area including generation and transmission facilities, corporate offices, customer service centers, power service centers, warehouses, visitor centers, and crew quarters. The most significant of these buildings are its
Knoxville Office Complex ("KOC")
and the Chattanooga Office Complex in Tennessee, as well as a significant number of buildings in Muscle Shoals, Alabama. In 2013, TVA initiated a study of its real estate portfolio for the purpose of reducing cost, right-sizing the portfolio, and aligning its real estate with TVA’s strategic direction over the next 10 to 20 years. As part of this effort, TVA completed a comprehensive assessment of its real estate holdings in the Knoxville region in 2016. For a discussion of these real estate holdings, see
Disposal of Property
— Knoxville Property
.
Disposal of Property
TVA has broad authority to dispose of personal property but only limited authority to dispose of real property. TVA's primary, but not exclusive, authority to dispose of real property is briefly described below:
|
•
|
TVA has authority to dispose of surplus real property at a public auction;
|
|
•
|
TVA may dispose of real property for certain specified purposes, including providing replacement lands for certain entities whose lands were flooded or destroyed by dam or reservoir construction, providing real property for recreational use, and granting easements and rights-of-way upon which are located transmission or distribution lines;
|
44
|
•
|
TVA can dispose of real property in connection with the construction of generating plants or other facilities under certain circumstances; and
|
|
•
|
TVA has authority to grant easements for rights-of-way and other purposes.
|
the Basic Tennessee Valley Authority Power Bond Resolution adopted by the TVA Board on October 6, 1960, as amended on September 28, 1976, October 17, 1989, and March 25, 1992 (the "Basic Resolution")
, prohibits TVA from mortgaging any part of its power properties and from disposing of all or any substantial portion of these properties unless TVA provides for a continuance of the interest, principal, and sinking fund payments due and to become due on all outstanding Bonds, or for the retirement of such Bonds.
Bellefonte Nuclear Plant
. On November 14, 2016, following a public auction, TVA entered into a contract to sell substantially all of the Bellefonte site to Nuclear Development, LLC for $111 million. Nuclear Development, LLC, paid TVA $22 million on November 14, 2016, with the remaining $89 million due at closing. Nuclear Development, LLC, had up to two years from November 14, 2016, to close on the property, and TVA agreed to maintain the site until closing. Nuclear Development, LLC, requested and was granted an extension of the initial closing date. Nuclear Development, LLC now has until November 30, 2018 to close on the property, and TVA will continue to maintain the site until then. See
Note 7
—
Deferred Nuclear Generation Units
.
Muscle Shoals Property
. In alignment with its strategic direction of right-sizing its real estate portfolio, TVA drafted a strategy to further reduce a significant number of buildings and property in Muscle Shoals, Alabama, including the disposition of 900 acres of the 1000 acres approved by the TVA Board in 2012. On April 20, 2018, following a public auction, TVA entered into a contract to sell the property to Muscle Shoals Holdings, LLC for $5 million. The Alabama Department of Environmental Management granted the release of an existing environmental permit, and the transaction closed on July 23, 2018.
Knoxville Property.
In 2016, TVA completed a comprehensive assessment of its real estate holdings in the Knoxville, Tennessee region including the KOC and adjacent
Summer Place Complex ("SPC")
. As a result of this study and a subsequent environmental assessment in 2017, TVA is planning to consolidate most of its Knoxville area employees into one location in the KOC West Tower and plans to convey the East Tower and the SPC.
From time to time,
TVA is party to or otherwise involved in lawsuits, claims, proceedings, investigations, and other legal matters ("Legal Proceedings")
that have arisen in the ordinary course of conducting TVA’s activities, as a result of catastrophic events or otherwise. While the outcome of the Legal Proceedings to which TVA is a party cannot be predicted with certainty, any adverse outcome to a Legal Proceeding involving TVA may have a material adverse effect on TVA’s cash flows, results of operations, and financial condition. For a discussion of Legal Proceedings involving TVA, see
Note 8
and
Note 21
—
Legal Proceedings,
which discussions are incorporated by reference into this Item 3.
Not applicable.
45
Not applicable.
The following selected financial data for the years 2014 through 2018 should be read in conjunction with the audited financial statements and notes thereto (collectively, the "Consolidated Financial Statements")
presented in Item 8, Financial Statements and Supplementary Data. Certain reclassifications have been made to the
2014
,
2015
, and
2016
financial statement presentations to conform to the
2017
and
2018
presentations.
|
Selected Financial Data
(1)(2)
For the years ended, or at, September 30
(dollars in millions)
|
|||||||||||||||||||
|
|
2018
|
2017
|
2016
|
2015
|
2014
|
||||||||||||||
|
Sales (millions of kWh)
|
160,338
|
|
152,362
|
|
155,855
|
|
158,163
|
|
158,057
|
|
|||||||||
|
Peak load (MW)
(3)
|
32,509
|
|
29,899
|
|
29,824
|
|
32,751
|
|
33,352
|
|
|||||||||
|
Operating revenues
|
$
|
11,233
|
|
$
|
10,739
|
|
$
|
10,616
|
|
$
|
11,003
|
|
$
|
11,137
|
|
||||
|
Net income
|
$
|
1,119
|
|
$
|
685
|
|
$
|
1,233
|
|
$
|
1,111
|
|
$
|
469
|
|
||||
|
Total assets
|
$
|
48,667
|
|
$
|
50,017
|
|
$
|
50,494
|
|
$
|
48,745
|
|
$
|
45,514
|
|
||||
|
Financial obligations
|
|
|
|
|
|
|
|
|
|
|
|||||||||
|
Long-term debt, net
(4)
|
|||||||||||||||||||
|
Long-term power bonds, net
|
$
|
20,157
|
|
$
|
20,205
|
|
$
|
20,901
|
|
$
|
22,617
|
|
$
|
21,880
|
|
||||
|
Long-term debt of variable interest entities, net
|
1,127
|
|
1,164
|
|
1,199
|
|
1,233
|
|
1,265
|
|
|||||||||
|
Long-term notes payable
|
23
|
|
69
|
|
48
|
|
—
|
|
—
|
|
|||||||||
|
Total long-term debt, net
|
$
|
21,307
|
|
$
|
21,438
|
|
$
|
22,148
|
|
$
|
23,850
|
|
$
|
23,145
|
|
||||
|
Current debt, net
(4)
|
|||||||||||||||||||
|
Short-term debt, net
|
$
|
1,216
|
|
$
|
1,998
|
|
$
|
1,407
|
|
$
|
1,034
|
|
$
|
596
|
|
||||
|
Current maturities of power bonds
|
1,032
|
|
1,728
|
|
1,555
|
|
32
|
|
1,032
|
|
|||||||||
|
Current maturities of long-term debt of variable interest entities
|
38
|
|
36
|
|
35
|
|
33
|
|
32
|
|
|||||||||
|
Current maturities of notes payable
|
46
|
|
53
|
|
27
|
|
—
|
|
—
|
|
|||||||||
|
Total current debt, net
|
$
|
2,332
|
|
$
|
3,815
|
|
$
|
3,024
|
|
$
|
1,099
|
|
$
|
1,660
|
|
||||
|
Total debt
(4)
|
$
|
23,639
|
|
$
|
25,253
|
|
$
|
25,172
|
|
$
|
24,949
|
|
$
|
24,805
|
|
||||
|
Capital leases
(5)
|
$
|
182
|
|
$
|
187
|
|
$
|
181
|
|
$
|
105
|
|
$
|
109
|
|
||||
|
Leaseback obligations
|
$
|
301
|
|
$
|
339
|
|
$
|
467
|
|
$
|
616
|
|
$
|
691
|
|
||||
Notes
(1) See Item 7, Management's Discussion and Analysis of Financial Condition and Results of Operations for a description of certain items in 2018, 2017, and 2016 affecting results in those years.
(2) See Item 1A, Risk Factors and Note 21 for a discussion of risks and contingencies that could affect TVA's future financial results.
(3) TVA met an all-time summer peak demand of 33,482 MW on August 16, 2007, at 102 degrees Fahrenheit and an all-time winter peak demand of 33,352 MW on January 24, 2014, at 7.3 degrees Fahrenheit.
(4) See
Note 10
and
Note 13
—
Debt Outstanding
.
(5) Included in Accounts payable and accrued liabilities and Other long-term liabilities on the consolidated balance sheets.
46
(Dollars in millions except where noted)
The following
Management’s Discussion and Analysis of Financial Condition and Results of Operations ("MD&A")
is intended to help the reader understand
Tennessee Valley Authority ("TVA")
, its operations, and its present business environment. The MD&A is provided as a supplement to, and should be read in conjunction with, TVA's consolidated financial statements and the accompanying notes thereto contained in Item 8, Financial Statements and Supplementary Data of this Annual Report on Form 10-K for the fiscal year ended
September 30, 2018
(the "Annual Report"). The MD&A includes the following sections:
|
•
|
Business and Mission - a general description of TVA's business, objectives, strategic priorities, and core capabilities;
|
|
•
|
Executive Overview - a general overview of TVA's activities and results of operations for
2018
;
|
|
•
|
Results of Operations - an analysis of TVA's consolidated results of operations for the three years presented in its consolidated financial statements;
|
|
•
|
Liquidity and Capital Resources - an analysis of cash flows, a description of aggregate contractual obligations, and an overview of financial position;
|
|
•
|
Key Initiatives and Challenges - an overview of current and future initiatives and challenges facing TVA;
|
|
•
|
Critical Accounting Policies and Estimates - a summary of accounting policies that require critical judgments and estimates;
|
|
•
|
Fair Value Measurements - a description of TVA's investments and derivative instruments and valuation considerations;
|
|
•
|
Legislative and Regulatory Matters - a summary of laws and regulations that may impact TVA; and
|
|
•
|
Risk Management Activities - a description of TVA's risk governance and exposure to various market risks.
|
Business and Mission
Business
TVA operates the nation's largest public power system. At
September 30, 2018
, TVA provided electricity to approximately
49
large industrial customers,
seven
federal agency customers, and
154
local power company customers of TVA ("LPCs")
that serve nearly 10 million people in parts of seven southeastern states. TVA generates nearly all of its revenues from the sale of electricity, and in
2018
revenues from the sale of electricity totaled $
11.1 billion
. As a wholly-owned agency and instrumentality of the
United States ("U.S.")
, however, TVA differs from other electric utilities in a number of ways:
|
•
|
TVA is a government corporation.
|
|
•
|
The area in which TVA sells power is limited by the
Tennessee Valley Authority Act of 1933 (the "TVA Act")
under a provision known as the “fence”; however, another provision of federal law known as the “anti-cherrypicking” provision generally protects TVA from being forced to provide access to its transmission lines to others for the purpose of delivering power to customers within substantially all of TVA's defined service area.
|
|
•
|
The rates TVA charges for power are set solely by the
TVA Board of Directors (the "TVA Board")
and are not set or reviewed by another entity, such as a public utility commission. In setting rates, however, the TVA Board is charged by the TVA Act to have due regard for the primary objectives of the TVA Act, including the objective that power be sold at rates as low as feasible.
|
|
•
|
TVA is not authorized to raise capital by issuing equity securities. TVA relies primarily on cash from operations and proceeds from power program borrowings to fund its operations and is authorized by the TVA Act to issue
bonds, notes, or other evidences of indebtedness ("collectively, Bonds")
in an amount not to exceed $30.0 billion outstanding at any given time. Although TVA's operations were originally funded primarily with appropriations from Congress, TVA has not received any appropriations from Congress for any activities since 1999 and, as directed by Congress, has funded essential stewardship activities primarily with power revenues.
|
47
TVA's Mission of Service
TVA was built for the people, created by federal legislation, and charged with a unique mission - to improve the quality of life in a seven-state region through the integrated management of the region’s resources. TVA's mission focuses on three key areas:

|
ENERGY
|
ENVIRONMENT
|
ECONOMIC DEVELOPMENT
|
|
•
|
Energy - Delivering affordable, reliable power;
|
|
•
|
Environment - Caring for the region's natural resources; and
|
|
•
|
Economic Development - Creating sustainable economic growth.
|
While TVA's mission has not changed since it was established in 1933, the climate in which TVA operates continues to evolve. The business and economic environment has become more challenging due to economic conditions, tougher environmental standards, and the need to diversify its power supply and adapt to changing customer usage behaviors, new technologies, and emerging, non-traditional competition. To continue TVA’s mission of service, it must realize four strategic imperatives through people performance excellence:
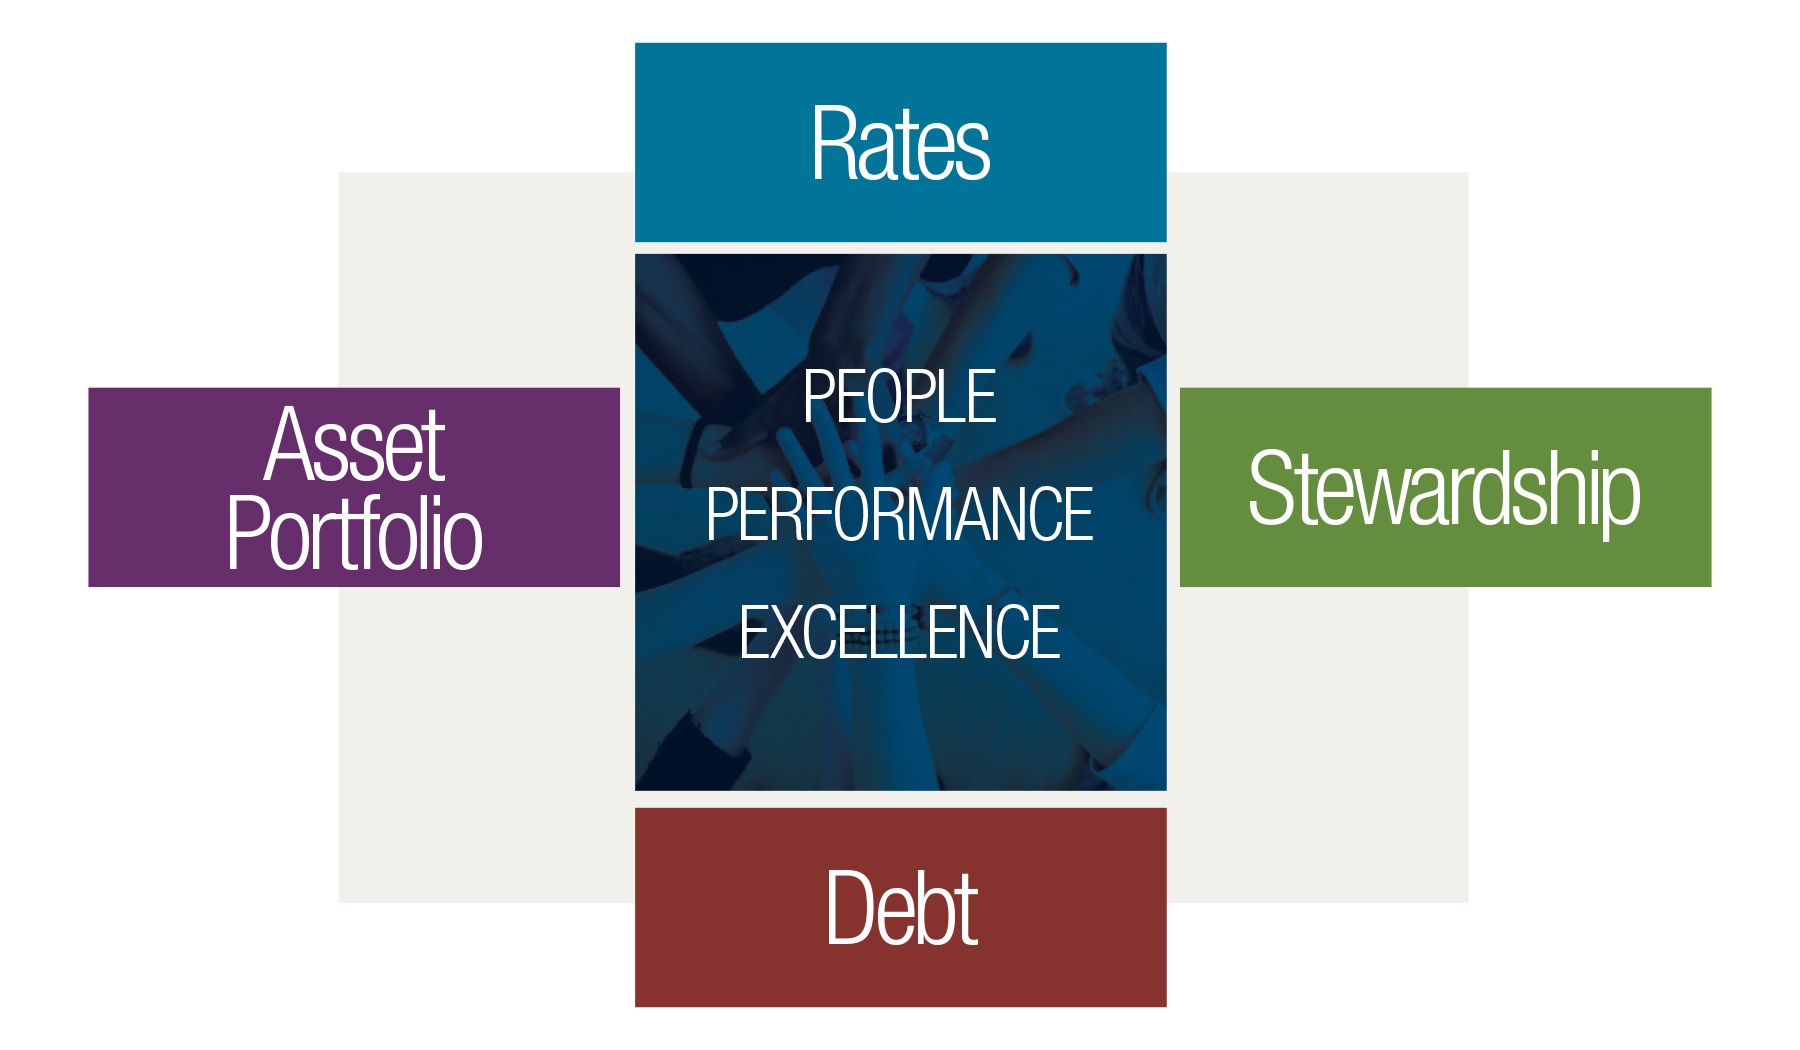
|
•
|
Rates - Maintain low rates;
|
|
•
|
Stewardship - Be responsible stewards;
|
|
•
|
Debt - Live within its means;
|
|
•
|
Asset Portfolio - Meet reliability expectations and provide a balanced portfolio; and
|
|
•
|
People Performance Excellence - Continuously improve, empower, and engage employees.
|
TVA’s mission sets the stage for its strategic planning process that includes strategic objectives, initiatives, and scorecards for performance designed to provide clear direction for improving TVA's core business.
48
Linking the Mission to Performance
TVA has formulated key performance measures to support its strategic imperatives. The intent of these measures is to align employees to TVA’s mission by focusing its collective efforts on operational excellence, fiscal responsibility, and economic development and environmental stewardship. The measures are designed to promote teamwork, encourage high performance behaviors, and motivate TVA employees to achieve goals aligned with TVA’s mission and values. The
2018
corporate results compared with targets for these key measures are reflected in the chart below. See Item 11, Executive Compensation —
Compensation Discussion and Analysis
for information regarding how the measures are calculated.
|
Corporate Measure
|
Weight
|
Actual
|
Threshold
|
Target
|
Stretch
|
|
Load not served (system minutes)
|
30%
|
3.3
|
4.8
|
4.0
|
3.6
|
|
TVA total spending ($ millions)
|
30%
|
$4,353
|
$4,920
|
$4,781
|
$4,643
|
|
Nuclear unit capability factor (UCF) (%)
|
20%
|
91.3%
|
89.3%
|
90.1%
|
90.9%
|
|
Coal seasonal equivalent forced outage rate (%)
|
10%
|
12.5%
|
7.3%
|
6.1%
|
4.9%
|
|
Combined cycle seasonal equivalent forced outage rate (%)
|
10%
|
1.6%
|
2.4%
|
1.7%
|
0.9%
|
Executive Overview
TVA’s net income for the years ended
September 30, 2018
and
2017
, was
$1.1 billion
and
$685 million
, respectively. As is often the case for electric utilities, weather is a primary driver of TVA's sales. TVA's service territory experienced overall warmer than normal weather for much of 2018 and record-setting low temperatures during the month of January 2018, compared to the milder weather experienced for much of 2017. Revenue from the sales of electricity increased
$489 million
for the year ended
September 30, 2018
, as compared to the prior year, primarily due to higher sales volume to LPCs, who are more weather sensitive, and the base rate adjustment that became effective October 1, 2017. In addition, operating and maintenance expense decreased $508 million for the year ended September 30, 2018, as compared to the prior year, primarily driven by a one-time discretionary pension contribution in 2017, and a decrease in nuclear planned outage days. Depreciation and amortization expense increased $810 million for the year ended September 30, 2018, as compared to the prior year driven by $857 million of accelerated amortization of the Deferred nuclear generating units and Nuclear training costs regulatory assets due to excess revenues collected in 2018 in accordance with the TVA Board's ratemaking authority.
In 2011, TVA entered into two substantively similar agreements, one with the
Environmental Protection Agency ("EPA")
and the other with several states and environmental groups. During 2018, consistent with these agreements, TVA installed two
selective catalytic reduction systems ("SCRs")
at the
Gallatin Fossil Plant ("Gallatin")
and installed scrubbers and SCRs for Units 1 and 4 at the
Shawnee Fossil Plant ("Shawnee")
. TVA also retired Units 1-4 of the
Johnsonville Fossil Plant ("Johnsonville")
, Units 1-3 of the
Allen Fossil Plant ("Allen")
after completion of the natural gas-fired
Allen Combined Cycle Plant ("Allen CC")
, and Unit 20 of the Johnsonville Combustion Turbine Plant (“Johnsonville CT”), which allows for cogeneration capability. With these actions, TVA has completed the requirements in the environmental agreements related to retiring or installing controls on coal-fired units.
TVA also completed the first phase of the
extended power uprate ("EPU")
project at
Browns Ferry Nuclear Plant ("Browns Ferry")
and plans to complete the next two phases by the end of 2019. With the completion of the construction projects at Allen CC, Johnsonville CT, and Browns Ferry, TVA will have replaced approximately 1,200 MW of coal-fired generation capability with over 1,600 MW of clean energy capacity. TVA does not foresee needing additional large, base-load generation units for at least the next decade.
In May 2017, the TVA Board authorized up to $300 million to build an enhanced fiber network that will better connect its operational assets. The new fiber optic lines will improve the reliability and resiliency of the generation and transmission system, while enabling the system to better accommodate
distributed energy resources ("DER")
. The TVA Board also approved up to $245 million for the construction of a new
system operations center (“SOC”)
. The secured facility is being built to accommodate a new energy management system and to adapt to new regulatory requirements. Both of these initiatives will position TVA to continue providing competitive and reliable power to its customers.
During 2018, TVA continued to achieve 99.999 percent reliability in delivering energy to its customers. TVA's reliability and economic development efforts continued to attract and encourage the expansion of business and industries in the Tennessee Valley, with over $11.3 billion in investments and approximately 65,400 jobs created or retained during the year.
Consistent with national trends, energy demand in the areas served by TVA and the LPCs has been essentially flat over the past five years. TVA anticipates this trend to continue as technological advances, consumer demand for generation, energy management technologies, and distributed energy increase. To accommodate this trend, TVA began working with its LPCs on its long-term pricing and product development strategies in the fall of 2013. Since that time, TVA has collaborated with its LPCs to
49
refine some of these details. At its May 10, 2018 meeting, the TVA Board approved a change to the structure of its wholesale electric power rates through pricing that better aligns wholesale rates with the underlying cost to serve customers. TVA is continuing to work with LPCs to implement these changes, which became effective on October 1, 2018. With this proactive rate structure change, TVA expects to provide a stable foundation that gives the flexibility to embrace new trends and to continue delivering more innovative energy options.
Additionally, TVA remains committed to planning its system in a way that ensures evolving resource portfolios remain reliable and provide the most value to all customers. TVA utilizes an
Integrated Resource Plan ("IRP")
to provide direction on how to best meet future electricity demand. TVA has begun working on an updated IRP that will consider many views of the future to determine how TVA can continue to provide low-cost, reliable electricity, support environmental stewardship, and spur economic development in the Tennessee Valley over the next 20 years.
Results of Operations
Sales of Electricity
Sales of electricity accounted for nearly all of TVA's operating revenues in
2018
,
2017
, and
2016
. TVA sells power at wholesale rates to LPCs that resell the power to their customers at retail rates. TVA also sells power to directly served customers, consisting primarily of federal agencies and customers with large or nonstandard loads. In addition, power that exceeds the needs of the TVA system is sold under exchange power arrangements with certain other power systems.
The following chart compares TVA’s sales of electricity for the years ended
September 30, 2018
,
2017
, and
2016
:
|
Sales of Electricity
|
||
|
For the years ended September 30
|
||
|
(millions of kWh)
|
||
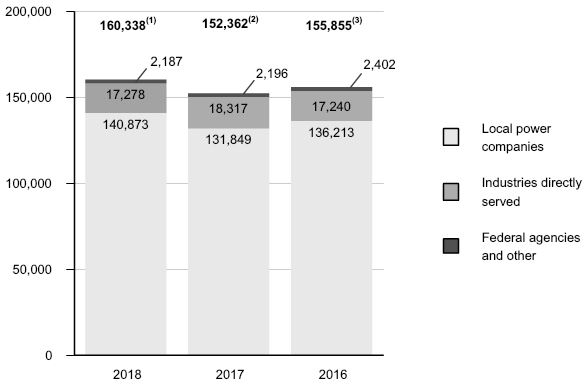
Notes
(1) Includes approximately 429 million
kilowatt hours ("kWh")
of pre-commercial generation at Allen CC. See
Note 1
—
Pre-Commercial Plant Operations
.
(2) Includes approximately 857 million kWh of pre-commercial generation at
Watts Bar Nuclear Plant ("Watts Bar")
Unit 2, Paradise Combined Cycle Plant, and Allen CC. See
Note 1
—
Pre-Commercial Plant Operations
.
(3) Includes approximately 579 million kWh of pre-commercial generation at Watts Bar Unit 2. See
Note 1
—
Pre-Commercial Plant Operations
.
50
Weather affects both the demand for TVA power and the price for that power. TVA uses degree days to measure the impact of weather on its power operations. Degree days measure the extent to which average temperatures in the five largest cities in TVA's service area vary from 65 degrees Fahrenheit.
2018
Compared to
2017
|
Degree Days
|
||||||||||||||||||||||||||
|
|
2018
|
Normal
|
Percent Variation
|
2017
|
Normal
|
Percent Variation
|
2018
|
2017
|
Percent Change
|
|||||||||||||||||
|
Heating Degree Days
|
3,287
|
|
3,360
|
|
(2.2
|
)%
|
2,378
|
|
3,360
|
|
(29.2
|
)%
|
3,287
|
|
2,378
|
|
38.2
|
%
|
||||||||
|
Cooling Degree Days
|
2,314
|
|
1,863
|
|
24.2
|
%
|
2,007
|
|
1,863
|
|
7.7
|
%
|
2,314
|
|
2,007
|
|
15.3
|
%
|
||||||||
|
|
||||||||||||||||||||||||||
|
Total Degree Days
|
5,601
|
|
5,223
|
|
7.2
|
%
|
4,385
|
|
5,223
|
|
(16.0
|
)%
|
5,601
|
|
4,385
|
|
27.7
|
%
|
||||||||
Sales of electricity increased approximately
five percent
for the year ended
September 30, 2018
, as compared to the prior year, primarily due to increased sales volume for LPCs driven predominantly by a
28 percent
increase in total degree days. Colder than normal weather during January 2018 led to TVA setting an all-time record for energy demand in a 24-hour period, as TVA delivered 706 million kWh of energy to the Tennessee Valley. Also in January 2018, TVA set three of its top-12 winter peak demand records. In addition, TVA's service territory experienced overall warmer than normal weather during the third and fourth quarters of 2018. Partially offsetting the increased sales volume for LPCs was a slight decrease in sales to industries directly served, particularly in the pulp and paper and polysilicon sectors.
2017
Compared to
2016
|
Degree Days
|
||||||||||||||||||||||||||
|
|
2017
|
Normal
|
Percent Variation
|
2016
|
Normal
|
Percent Variation
|
2017
|
2016
|
Percent Change
|
|||||||||||||||||
|
Heating Degree Days
|
2,378
|
|
3,360
|
|
(29.2
|
)%
|
2,634
|
|
3,381
|
|
(22.1
|
)%
|
2,378
|
|
2,634
|
|
(9.7
|
)%
|
||||||||
|
Cooling Degree Days
|
2,007
|
|
1,863
|
|
7.7
|
%
|
2,360
|
|
1,863
|
|
26.7
|
%
|
2,007
|
|
2,360
|
|
(15.0
|
)%
|
||||||||
|
|
||||||||||||||||||||||||||
|
Total Degree Days
|
4,385
|
|
5,223
|
|
(16.0
|
)%
|
4,994
|
|
5,244
|
|
(4.8
|
)%
|
4,385
|
|
4,994
|
|
(12.2
|
)%
|
||||||||
Sales of electricity decreased approximately two percent for the year ended September 30, 2017, as compared to the prior year, primarily due to decreased sales volume for LPCs driven primarily by a 12 percent decrease in total degree days. Additionally, a decrease in sales to federal agencies and other occurred primarily as a result of a decrease in off-system sales, as TVA had less excess generation available for sale to the market as compared to the prior year. Partially offsetting these decreases was an increase in sales to industries directly served as a result of increased production of customers in the polysilicon, metal, and chemical sectors.
Financial Results
The following table compares operating results for
2018
,
2017
, and
2016
:
|
Summary Consolidated Statements of Operations
|
|||||||||||
|
|
2018
|
2017
|
2016
|
||||||||
|
Operating revenues
|
$
|
11,233
|
|
$
|
10,739
|
|
$
|
10,616
|
|
||
|
Operating expenses
(1)
|
8,921
|
|
8,764
|
|
8,290
|
|
|||||
|
Operating income
|
2,312
|
|
1,975
|
|
2,326
|
|
|||||
|
Other income, net
|
50
|
|
56
|
|
43
|
|
|||||
|
Net interest expense
|
1,243
|
|
1,346
|
|
1,136
|
|
|||||
|
Net income
|
$
|
1,119
|
|
$
|
685
|
|
$
|
1,233
|
|
||
Note
(1) For the year ended September 30, 2018, TVA recorded
$857 million
of accelerated amortization of the Deferred nuclear generating units and Nuclear training costs regulatory assets. See
Note 7
. For the year ended September 30, 2017, TVA made to a one-time additional discretionary $500 million contribution to TVA's pension plan.
51
Operating Revenues.
Operating revenues for the years ended September 30,
2018
,
2017
, and
2016
consisted of the following:
|
Operating Revenues
|
||
|
For the years ended September 30
|
||
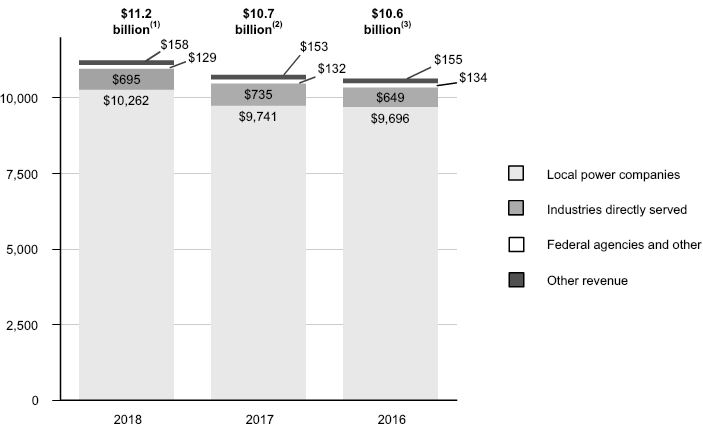
Notes
(1) Excludes a contra-revenue amount of approximately
$11 million
representing revenue capitalized during pre-commercial operations at Allen CC. See
Note 1
—
Pre-Commercial Plant Operations.
(2) Excludes a contra-revenue amount of approximately $22 million representing revenue capitalized during pre-commercial operations at Watts Bar Unit 2, Paradise Combined Cycle Plant, and Allen CC. See
Note 1
—
Pre-Commercial Plant Operations.
(3) Excludes a contra-revenue amount of approximately $18 million representing revenue capitalized during pre-commercial operations at Watts Bar Unit 2. See
Note 1
—
Pre-Commercial Plant Operations.
The rate structure in effect provides price signals intended to reflect higher cost periods to serve LPCs and their end-use customers. Under this structure, weather can positively or negatively impact both volume and effective rates. This is because the wholesale structure includes two components: a demand charge and an energy charge. The demand charge is based on the customer's peak monthly usage and increases as the peak increases. The energy charge is based on the kWh used by the customer. The rate structure also includes a separate fuel rate that includes the costs of natural gas, fuel oil, purchased power, coal, emission allowances, nuclear fuel, and other fuel-related commodities; realized gains and losses on derivatives purchased to hedge the costs of such commodities; and
payments to states and counties in lieu of taxes ("tax equivalents")
associated with the fuel cost adjustments. Beginning in October 2018 (and more fully in October 2019 when all LPCs will be priced under the new wholesale structure), the rate structure will include a third component to capture a portion of fixed charges. This third component is known as the
Grid Access Charge ("GAC")
and will be offset by a reduction to the energy charge. The GAC will reduce the variability in revenues caused by weather. See Item 1, Business
—
Rates
—
Rate Methodology
.
52
The changes in revenue components are summarized below:
|
|
2018
|
Variance 2018 vs 2017
|
2017
|
Variance 2017 vs 2016
|
2016
|
|||||||||||||||
|
Base revenue
|
$
|
8,129
|
|
(1)
|
$
|
630
|
|
$
|
7,499
|
|
(2)
|
$
|
31
|
|
$
|
7,468
|
|
(3)
|
||
|
Fuel cost recovery
|
2,939
|
|
(142
|
)
|
3,081
|
|
95
|
|
2,986
|
|
||||||||||
|
Off-system sales
|
7
|
|
1
|
|
6
|
|
(1
|
)
|
7
|
|
||||||||||
|
Revenue from sales of electricity
|
11,075
|
|
489
|
|
10,586
|
|
125
|
|
10,461
|
|
||||||||||
|
Other revenue
|
158
|
|
5
|
|
153
|
|
(2
|
)
|
155
|
|
||||||||||
|
Total operating revenues
|
$
|
11,233
|
|
$
|
494
|
|
$
|
10,739
|
|
$
|
123
|
|
$
|
10,616
|
|
|||||
Notes
(1) Includes the impact of revenue capitalized during pre-commercial operations of approximately $11 million for the year ended September 30, 2018, at Allen CC. See
Note 1
—
Pre-Commercial Plant Operations.
(2) Includes the impact of revenue capitalized during pre-commercial operations of approximately $22 million for the year ended September 30, 2017, at Watts Bar Unit 2, Paradise Combined Cycle Plant, and Allen CC. See
Note 1
—
Pre-Commercial Plant Operations.
(3) Includes the impact of revenue capitalized during pre-commercial operations of approximately $18 million for the year ended September 30, 2016, at Watts Bar Unit 2. See
Note 1
—
Pre-Commercial Plant Operations.
2018
Compared to
2017
Operating revenues increased
$494 million
for the year ended September 30, 2018, as compared to the prior year, primarily due to a
$630 million
increase in base revenue. The
$630 million
increase in base revenue was driven by an increase of $460 million resulting from higher sales volume during the year ended September 30, 2018, as compared to the prior year. Colder than normal weather during January 2018 led to TVA setting an all-time record for energy demand in a 24-hour period. Also in January 2018, TVA set three of its top-12 winter peak demand records. In addition, TVA's service territory experienced overall warmer than normal weather during the third and fourth quarters of 2018. Further, approximately $159 million of the increase in base revenue was attributable to higher effective rates during the year ended September 30, 2018, as compared to the prior year, resulting from the base rate adjustment that became effective October 1, 2017. The base revenue increase was also due in part to an approximately $11 million decrease in capitalization of revenue resulting from pre-commercial generation during the year ended September 30, 2018, as compared to the prior year. See
Note 1
—
Pre-Commercial Plant Operations
. Partially offsetting these increases was a
$142 million
decrease in fuel cost recovery revenues, driven by a $305 million decrease attributable to lower fuel rates partially offset by a $163 million increase attributable to higher energy sales. The lower fuel rates experienced were primarily driven by lower market prices for natural gas and a change in the mix of generation resources, including more nuclear, natural gas, and hydroelectric generation and less coal-fired generation.
2017
Compared to
2016
Operating revenues increased $123 million for the year ended September 30, 2017, as compared to the prior year, primarily due to a $95 million increase in fuel cost recovery revenues and a $31 million increase in base revenue. The $95 million increase in fuel cost recovery revenues reflects a $160 million increase attributable to higher fuel rates partially offset by a $65 million decrease attributable to lower energy sales. The higher fuel rates experienced were primarily driven by higher market prices for natural gas and a change in the mix of generation resources, including significantly less hydroelectric generation. The $31 million increase in base revenue was predominantly driven by an increase of $280 million attributable to higher effective rates during the year ended September 30, 2017, as compared to the prior year, due to the base rate adjustment that became effective October 1, 2016, partially offset by a decrease of $246 million resulting from lower sales volume. In addition, this increase in base revenue was partially offset by the capitalization of approximately $22 million of revenue resulting from pre-commercial generation at Watts Bar Unit 2 and
Paradise Fossil Plant ("Paradise")
and Allen CC. See
Note 1
—
Pre-Commercial Plant Operations
.
See
Sales of Electricity
above for further discussion of the change in the volume of sales of electricity and
Operating Expenses
below for further discussion of the change in fuel expense.
53
Operating Expenses.
Operating expense components as a percentage of total operating expenses for
2018
,
2017
, and
2016
consisted of the following:
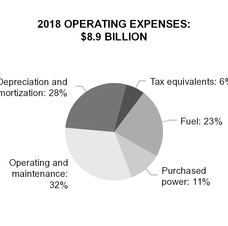
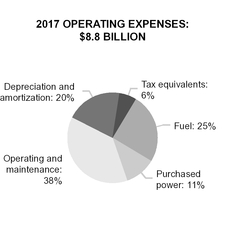
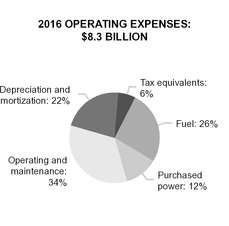
The following table summarizes TVA’s expenses for various fuels for the years indicated:
|
Fuel Expense for TVA-Owned Facilities
(1)
For the years ended September 30
|
||||||||||||||||||||
|
Fuel Expense By Source
|
Cost per kWh
(4)
|
|||||||||||||||||||
|
|
2018
|
2017
|
2016
|
2018
|
2017
|
2016
|
||||||||||||||
|
Coal
(2)
|
$
|
847
|
|
$
|
1,060
|
|
$
|
1,275
|
|
2.68
|
|
2.71
|
|
2.77
|
|
|||||
|
Natural gas and/or oil-fired
(3)
|
846
|
|
706
|
|
632
|
|
2.64
|
|
2.78
|
|
2.51
|
|
||||||||
|
Nuclear fuel
|
374
|
|
334
|
|
277
|
|
0.58
|
|
0.57
|
|
0.52
|
|
||||||||
|
Total fuel
|
$
|
2,067
|
|
$
|
2,100
|
|
$
|
2,184
|
|
1.62
|
|
1.70
|
|
1.76
|
|
|||||
Notes
(1) Excludes effects of the fuel cost adjustment deferrals and amortization on fuel expense in the amounts of $
(18) million
, $
69 million
, and $
(58) million
for the years ended
September 30, 2018
,
2017
, and
2016
, respectively.
(2) Fuel expense related to oil consumed for startup at coal-fired facilities was $
21 million
, $
18 million
, and $
21 million
for the years ended
September 30, 2018
,
2017
, and
2016
, respectively.
(3) Fuel expense related to oil consumed for generation at natural gas and/or oil-fired facilities was $
8 million
, $
2 million
, and $
2 million
for the years ended
September 30, 2018
,
2017
, and
2016
, respectively.
(4) Total cost per kWh is based on a weighted average.
The following table shows TVA's generation and purchased power by generating source as a percentage of all electrical power generated and purchased (based on kWh) for the periods indicated:
|
Power Supply from TVA-Operated Generation Facilities and Purchased Power
For the years ended September 30
(millions of kWh)
|
||||||||||||||||||
|
|
2018
|
2017
|
2016
|
|||||||||||||||
|
Coal-fired
|
31,471
|
|
19
|
%
|
39,019
|
|
|
25
|
%
|
46,028
|
|
29
|
%
|
|||||
|
Nuclear
(1)
|
64,194
|
|
39
|
%
|
58,742
|
|
|
38
|
%
|
52,897
|
|
33
|
%
|
|||||
|
Hydroelectric
|
13,736
|
|
9
|
%
|
10,967
|
|
|
7
|
%
|
12,618
|
|
8
|
%
|
|||||
|
Natural gas and/or oil-fired
(2)
|
32,104
|
|
20
|
%
|
25,485
|
|
|
16
|
%
|
25,221
|
|
16
|
%
|
|||||
|
Total TVA-operated generation facilities
(3)
|
141,505
|
|
87
|
%
|
134,213
|
|
|
86
|
%
|
136,764
|
|
86
|
%
|
|||||
|
Purchased power (non-renewable)
(4)
|
14,183
|
|
9
|
%
|
13,586
|
|
9
|
%
|
13,807
|
|
9
|
%
|
||||||
|
Purchased power (renewable)
(5)
|
7,245
|
|
4
|
%
|
7,127
|
|
5
|
%
|
8,300
|
|
5
|
%
|
||||||
|
Total purchased power
|
21,428
|
|
13
|
%
|
20,713
|
|
14
|
%
|
22,107
|
|
14
|
%
|
||||||
|
Total power supply
|
162,933
|
|
100
|
%
|
154,926
|
|
100
|
%
|
158,871
|
|
100
|
%
|
||||||
Notes
(1) The nuclear generation amount for the years ended September 30, 2017 and 2016 includes approximately 495 million kWh and 579 million kWh, respectively, of pre-commercial generation at Watts Bar Unit 2. See
Note 1
—
Pre-Commercial Plant Operations
.
(2) The natural gas and/or oil-fired generation amount for the years ended September 30, 2018 and 2017, includes approximately 429 million kWh and 362 million kWh, respectively, of pre-commercial generation at Allen and Paradise Combined Cycle Plants. See
Note 1
—
Pre-Commercial Plant Operations
.
(3) Generation from TVA-owned non-hydro renewable resources is less than one percent for all periods shown and therefore is not represented in the table above.
(4) Purchased power (non-renewable) includes generation from Caledonia Combined Cycle Plant, which is currently a leased facility operated by TVA. Generation from Caledonia Combined Cycle Plant was 4,125 million kWh, 4,276 million kWh, and 4,532 million kWh for the years ended September 30, 2018,
2017
, and
2016
, respectively.
(5) Purchased power (renewable) includes power purchased from the following renewable sources: hydroelectric, solar, wind, and cogeneration.
54
2018
Compared to
2017
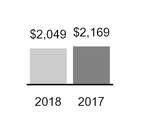
|
Fuel
|
|
Fuel expense decreased $120 million for the year ended September 30, 2018, as compared to the prior year. The impact of lower effective fuel rates, driven by lower market prices for natural gas and changes in the mix of generation resources, including more nuclear, natural gas, and hydroelectric generation and less coal-fired generation, contributed $234 million to the decrease. As an indication of the general market direction, the average Henry Hub natural gas spot price for the year ended September 30, 2018, was approximately three percent lower than the price for the prior year. Partially offsetting this decrease was a $114 million increase in fuel expense driven by a five percent increase in generation from TVA-operated resources to meet increased sales during the period.
|
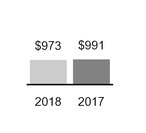
|
Purchased Power
|
|
Purchased power expense decreased $18 million for the year ended September 30, 2018, as compared to the prior year. This was primarily due to a decrease of $42 million in the price of the purchased power and variances in fuel rate recovery. Partially offsetting these decreases was an increase of $24 million driven by a three percent increase in power purchased to meet increased sales during the period.
|
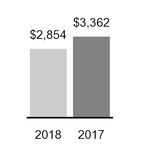
|
Operating and Maintenance
|
|
Operating and maintenance expense decreased $508 million for the year ended September 30, 2018, as compared to the prior year. This decrease was primarily due to a $494 million decrease in pension expense for 2018 which is attributable to a one-time additional discretionary $500 million contribution to TVA's pension plan in 2017, which was recognized as pension expense. See Note 20. Additionally, there was a decrease in refueling outage days which reduced outage expense by $35 million, primarily from planned outages. These decreases in operating and maintenance expense were partially offset by an increase of $28 million in inventory write-off expense, as compared to the prior year, primarily related to transitioning from a site-specific inventory management policy to a fleet-wide strategy for each generation type.
|
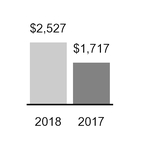
|
Depreciation and Amortization
|
|
Depreciation and amortization expense increased by $810 million primarily driven by $857 million of accelerated amortization of the Deferred nuclear generating units and Nuclear training costs regulatory assets due to excess revenues collected in 2018 in accordance with the TVA Board's ratemaking authority. See Note 7. These items were partially offset by a decrease of $100 million in depreciation expense related to the retirement of certain units at Allen Fossil Plant, Paradise Fossil Plant, and Johnsonville Fossil Plant. In addition, there was an increase of approximately $53 million for net additions to completed plant including the completion of Allen Combined Cycle Plant, which commenced commercial operations in April 2018, and Paradise Combined Cycle Plant, which commenced commercial operations in April 2017.
|
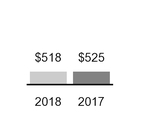
|
Tax Equivalents
|
|
Tax equivalents expense decreased $7 million for the year ended September 30, 2018, as compared to the prior year. This change is primarily driven by a decrease in the tax equivalents collected in the fuel rate recovery. The tax equivalents collected in the fuel rate recovery equal five percent of the fuel revenues.
|
55
2017
Compared to
2016
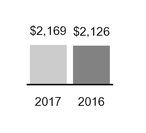
|
Fuel
|
|
Fuel expense increased $43 million for the year ended September 30, 2017, as compared to the prior year. The impact of higher effective fuel rates, driven by changes in the mix of generation resources, including less hydroelectric generation, and higher market prices for natural gas, contributed approximately $84 million to the increase. As an indication of the general market direction, the average Henry Hub natural gas spot price for the year ended September 30, 2017, was approximately 33 percent higher than the price for the prior year. Partially offsetting this increase was a $41 million decrease in fuel expense driven by a two percent decrease in generation from TVA-owned resources.
|
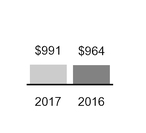
|
Purchased Power
|
|
Purchased power expense increased $27 million for the year ended September 30, 2017, as compared to the same period of the prior year. This was primarily due to an increase of $80 million driven by changes in the mix of generation resources purchased, including solar and natural gas, and higher market prices for natural gas. Partially offsetting this increase was a decrease of $54 million primarily due to overall lower demand and therefore a decrease in the volume of purchased power.
|
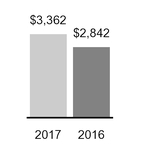
|
Operating and Maintenance
|
|
Operating and maintenance expense increased $520 million for the year ended September 30, 2017, as compared to the prior year. This increase was primarily due to an additional discretionary $500 million contribution to TVA's pension plan in 2017, which was recognized as additional pension expense. See Note 20. Additionally, nuclear refueling outage expense increased $89 million, primarily from a significant increase in planned outage days, as compared to the prior year. These increases were partially offset by a $26 million decrease in coal outage expense primarily from planned outages and a $43 million decrease due to a reduction in workforce related to identified efficiencies and staffing changes needed to support TVA's generating fleet.
|
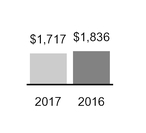
|
Depreciation and Amortization
|
|
Depreciation and amortization expense decreased $119 million for the year ended September 30, 2017, as compared to the prior year. Implementation of a new depreciation study during the first quarter of 2017 resulted in approximately $224 million less depreciation expense. The decrease in depreciation expense as a result of the new depreciation rates is primarily attributable to changes in retirement date assumptions for coal-fired plants and changes in the estimated service lives for transmission assets. See Note 1 —
Property, Plant, and Equipment, and Depreciation — Depreciation
. In addition, the retirement of Colbert Fossil Plant ("Colbert") Units 1-4 in March 2016 and Paradise Fossil Plant Units 1 and 2 in April 2017 contributed $29 million and $50 million, respectively, to the decrease. Partially offsetting these decreases was an increase of approximately $184 million primarily from net additions to Completed plant, including $133 million associated with Watts Bar Unit 2 commencing commercial operations in October 2016 and $12 million associated with Paradise Combined Cycle Plant commencing commercial operations in April 2017.
|
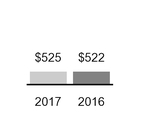
|
Tax Equivalents
|
|
Tax equivalents expense increased $3 million for the year ended September 30, 2017, as compared to the same period of the prior year. This change primarily reflects an increase in the accrued tax equivalent expense related to the fuel cost adjustment mechanism. The accrued tax equivalent expense is equal to five percent of the fuel cost adjustment mechanism revenues and increased for the year ended September 30, 2017, as compared to the same period of the prior year.
|
56
Interest Expense
.
Interest expense and interest rates for
2018
,
2017
, and
2016
were as follows:
|
Interest Expense and Rates
For the years ended September 30
|
|||||||||||||||||
|
|
2018
|
Percent Change
|
2017
|
Percent Change
|
2016
|
||||||||||||
|
Interest expense
(1)
|
$
|
1,243
|
|
(7.7
|
)%
|
$
|
1,346
|
|
(1.8
|
)%
|
$
|
1,371
|
|
||||
|
Allowance for funds used during construction
|
—
|
|
—
|
%
|
—
|
|
(100.0
|
)%
|
(235
|
)
|
|||||||
|
Net interest expense
|
$
|
1,243
|
|
(7.7
|
)%
|
$
|
1,346
|
|
18.5
|
%
|
$
|
1,136
|
|
||||
|
|
|
|
|
||||||||||||||
|
Average blended debt balance
(2)
|
$
|
24,832
|
|
(1.8
|
)%
|
$
|
25,281
|
|
(0.7
|
)%
|
$
|
25,450
|
|
||||
|
Average blended interest rate
(3)
|
4.81
|
%
|
(5.9
|
)%
|
5.11
|
%
|
(0.8
|
)%
|
5.15
|
%
|
|||||||
Notes
(1) Interest expense includes amortization of debt discounts, issuance, and reacquisition costs, net.
(2) Includes average balances of long-term power bonds, debt of
variable interest entities ("VIE")
, and discount notes.
(3) Includes interest on long-term power bonds, debt of VIE, and discount notes.
2018
Compared to
2017
Total interest expense decreased $103 million for the year ended September 30, 2018, as compared to the prior year. This was primarily driven by a decrease of $97 million due to lower average balances and rates on long-term debt, partially offset by an increase of $20 million due to higher average balances and rates on short-term debt. The total interest expense decrease was also attributable to $8 million of lower interest on alternative financing debt and $18 million of lower interest on debt discount and reacquisition.
2017
Compared to
2016
Net interest expense increased $210 million for the year ended September 30, 2017, as compared to the prior year. During the year ended September 30, 2016, TVA capitalized $235 million in
allowance for funds used during construction ("AFUDC")
related to the Watts Bar Unit 2 construction project. TVA did not capitalize any AFUDC in 2017. Interest expense excluding AFUDC was $25 million lower for the year ended September 30, 2017, as compared to the prior year, primarily due to lower interest rates on long-term debt.
Liquidity and Capital Resources
Sources of Liquidity
To meet cash needs and contingencies, TVA depends on various sources of liquidity. TVA’s primary sources of liquidity are cash from operations and proceeds from the issuance of short-term and long-term debt. Current liabilities may exceed current assets from time to time in part because TVA uses short-term debt to fund short-term cash needs, as well as to pay scheduled maturities and other redemptions of long-term debt. The daily balance of cash and cash equivalents maintained is based on near-term expectations for cash expenditures and funding needs.
In addition to cash from operations and proceeds from the issuance of short-term and long-term debt, TVA's sources of liquidity include a
$150 million
credit facility with the
United States Department of the Treasury ("U.S. Treasury")
,
four
long-term revolving credit facilities totaling
$2.7 billion
, and proceeds from other financings. See
Note 13
—
Credit Facility Agreements.
Other financing arrangements may include sales of receivables, loans, and other assets.
The TVA Act authorizes TVA to issue Bonds in an amount not to exceed
$30.0 billion
outstanding at any time. In March 2018, TVA issued
$1.0 billion
of power bonds maturing in March 2020. See
Note 13
—
Debt Securities Activity.
Power bonds outstanding, excluding unamortized discounts and premiums and net exchange losses from foreign currency transactions, at
September 30, 2018
and
2017
, were
$22.7 billion
(including current maturities) and $24.2 billion (including current maturities), respectively. The balance of Bonds outstanding directly affects TVA’s capacity to meet operational liquidity needs and to strategically use Bonds to fund certain capital investments as management and the TVA Board may deem desirable. Other options for financing not subject to the limit on Bonds, including lease financings (see
Lease Financings
below and
Note 10
), could provide supplementary funding if needed. Currently, TVA believes that it has adequate capability to fund its ongoing operational liquidity needs and make planned capital investments over the next decade through a combination of Bonds, additional power revenues through power rate increases, cost reductions, or other ways. See
Lease Financings
below,
Note 10
, and
Note 13
for additional information.
Debt Securities
. TVA’s Bonds are not obligations of the U.S., and the U.S. does not guarantee the payments of principal or interest on Bonds. TVA’s Bonds consist of power bonds and discount notes. Power bonds have maturities of between one and 50 years. At
September 30, 2018
, the average maturity of long-term power bonds was
16.3
years, and the
57
average interest rate was
4.52 percent
. Discount notes have maturities of less than one year. Power bonds and discount notes have a first priority and equal claim of payment out of net power proceeds. Net power proceeds are defined as the remainder of TVA's gross power revenues after deducting the costs of operating, maintaining, and administering its power properties and payments to states and counties in lieu of taxes, but before deducting depreciation accruals or other charges representing the amortization of capital expenditures, plus the net proceeds from the sale or other disposition of any power facility or interest therein. In addition to power bonds and discount notes, TVA had long-term debt associated with certain VIEs outstanding at
September 30, 2018
. TVA also had secured notes outstanding at
September 30, 2018
, that were assumed in asset acquisitions and business combinations in prior years. See
Lease Financing
below,
Note 10
, and
Note 13
for additional information.
Power bonds and discount notes are both issued pursuant to Section 15d of the TVA Act and pursuant to
the Basic Tennessee Valley Authority Power Bond Resolution adopted by the TVA Board on October 6, 1960, as amended on September 28, 1976, October 17, 1989, and March 25, 1992 (the "Basic Resolution")
. The TVA Act and the Basic Resolution each contain two bond tests: the rate test
and the bondholder protection test.
Under the rate test, TVA must charge rates for power which will produce gross revenues sufficient to provide funds for:
|
•
|
Operation, maintenance, and administration of its power system;
|
|
•
|
Tax equivalents;
|
|
•
|
Debt service on outstanding Bonds;
|
|
•
|
Payments to the U.S. Treasury in repayment of and as a return on the Power Program Appropriation Investment; and
|
|
•
|
Such additional margin as the TVA Board may consider desirable for investment in power system assets, retirement of outstanding Bonds in advance of maturity, additional reduction of the Power Program Appropriation Investment, and other purposes connected wit
h TVA’s pow
er business, having due regard for the primary objectives of the TVA Act, including the objective that power shall be sold at rates as low as are feasible. See
Note 17
—
Appropriation Investment
.
|
TVA fulfilled its requirement to repay $1.0 billion of the Power Program Appropriation Investment in 2014; therefore, the repayment of this amount is no longer a component of rate setting.
The rate test for the one-year period ended
September 30, 2018
, was calculated after the end of
2018
, and TVA met the test’s requirements.
Under the bondholder protection test, TVA must, in successive five-year periods, use an amount of net power proceeds at least equal to the sum of the depreciation accruals and other charges representing the amortization of capital expenditures and the net proceeds from any disposition of power facilities, for either the reduction of its capital obligations (including Bonds and the Power Program Appropriation Investment) or investment in power assets.
The bondholder protection test for the five-year period ended September 30, 2015, was calculated after the end of 2015, and TVA met the test’s requirements. TVA must next meet the bondholder protection test for the five-year period ending September 30, 2020.
TVA uses proceeds from the issuance of discount notes, in addition to other sources of liquidity, to fund short-term cash needs and scheduled maturities of long-term debt.
The following table provides additional information regarding TVA's short-term borrowings.
|
Short-Term Borrowing Table
|
|||||||||||||||||||||||
|
|
At
September 30 2018 |
For the year ended September 30 2018
|
At
September 30 2017 |
For the year ended September 30 2017
|
At
September 30 2016 |
For the year ended September 30 2016
|
|||||||||||||||||
|
Gross Amount Outstanding (at End of Period) or Average Gross Amount Outstanding (During Period)
|
|||||||||||||||||||||||
|
Discount notes
|
$
|
1,217
|
|
$
|
1,910
|
|
$
|
1,999
|
|
$
|
1,280
|
|
$
|
1,407
|
|
$
|
1,323
|
|
|||||
|
Weighted Average Interest Rate
|
|||||||||||||||||||||||
|
Discount notes
|
2.045
|
%
|
1.500
|
%
|
1.000
|
%
|
0.668
|
%
|
0.203
|
%
|
0.240
|
%
|
|||||||||||
|
Maximum Month-End Gross Amount Outstanding (During Period)
|
|||||||||||||||||||||||
|
Discount notes
|
N/A
|
|
$
|
2,722
|
|
N/A
|
|
$
|
2,062
|
|
N/A
|
|
$
|
1,561
|
|
||||||||
58
TVA ended the year at
September 30, 2018
, with a lower balance of short-term debt than at
September 30, 2017
, due primarily to higher operating cash flows. The average balance of short-term debt was higher in
2018
than
2017
due primarily to the timing of cash flows.
TVA generally uses proceeds from the issuance of power bonds to refinance maturing power bonds or other financing obligations, as necessary, or for other power system purposes. The total balance of power bonds may decline in periods where redemptions of power bonds exceed issuance due to net positive cash flow from operating and investing activities. TVA projects that it will reduce the balance of Bonds and other financing obligations to less than $22.0 billion by 2023.
TVA issued
$1.0 billion
of power bonds during both
2018
and
2017
. TVA redeemed
$1.8 million
and $1.6 billion of power bonds during
2018
and
2017
, respectively. For additional information about TVA debt issuance activity and debt instruments issued and outstanding at
September 30, 2018
and
2017
, including rates, maturities, outstanding principal amounts, and redemption features, see
Note 13
—
Debt
Securities Activity
and
Debt Outstanding
.
TVA Bonds are traded in the public bond markets and are listed on the
New York Stock Exchange ("NYSE")
except for TVA's discount notes, the 2009 Series B power bonds, and the power bonds issued under TVA's electronotes
®
program. TVA's Putable Automatic Rate Reset Securities are traded on the NYSE under the exchange symbols “TVC” and “TVE.” Other bonds listed on the NYSE are assigned various symbols by the exchange, which are noted on the NYSE's website. TVA has also listed certain bonds on foreign exchanges from time to time, including the Luxembourg, Hong Kong, and Singapore Stock Exchanges. See Item 1A, Risk Factors for additional information regarding the market for TVA's Bonds.
Although TVA Bonds are not obligations of the U.S., TVA, as a corporate agency and instrumentality of the U.S. government, may be impacted if the sovereign credit ratings of the U.S. are downgraded. Additionally, TVA may be impacted by how the U.S. government addresses situations of approaching its statutory debt limit. According to statements made by nationally recognized credit rating agencies, downward pressure on the ratings of the U.S. could eventually develop if there are no changes in current policies and budget deficits and the trajectory of debt begins to increase; additionally, current ratings factor in the prospect that debates over raising the debt ceiling of the U.S. government could continue to be protracted and difficult. The outlook on the ratings of the U.S. government and TVA is currently stable with all three agencies that provide ratings on TVA Bonds. TVA’s rated senior unsecured Bonds are currently rated Aaa, AAA, and AA+. TVA's short-term discount notes are not rated.
Lease Financings
. TVA has entered into certain leasing transactions with
special purpose entities ("SPEs")
to obtain third-party financing for certain of its facilities. These SPEs are sometimes identified as VIEs of which TVA is determined to be the primary beneficiary. TVA is required to account for these VIEs on a consolidated basis. See
Note 10
and
Note 13
for information about TVA’s lease financing activities, and see
Note 9
for information regarding TVA’s recent acquisition of equity interests in certain SPEs created for the purpose of facilitating lease financing. During 2017 and 2016, TVA acquired 100 percent of the equity interests in certain SPEs created for the purpose of facilitating lease financing. TVA may seek to enter into similar lease transactions in the future.
Summary Cash Flows
A major source of TVA's liquidity is operating cash flows resulting from the generation and sale of electricity. Cash and cash equivalents were $299 million at September 30,
2018
, and $300 million at both September 30,
2017
and
2016
. A summary of cash flow components for years ended September 30 follows:
Cash provided by (used in):
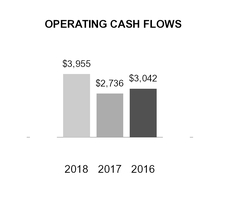
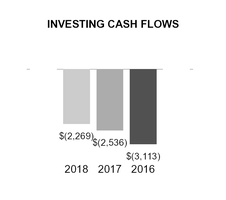
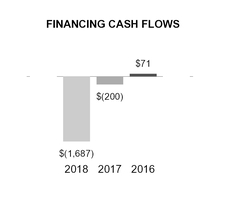
Operating Activities
. TVA’s cash flows from operations are primarily driven by sales of electricity, fuel expense, and operating and maintenance expense. The timing and level of cash flows from operations can be affected by the weather, changes in working capital, commodity price fluctuations, outages, and other project expenses.
59
2018
Compared to
2017
Net cash flows provided by operating activities increased $1.2 billion for 2018 compared to 2017, as a result of increases in base revenues, lower operating and maintenance expenses, and lower interest paid. Increases in base revenue were attributable to increases in electricity sales primarily due to overall warmer than normal weather for much of 2018 and record-setting low temperatures during the month of January 2018 and the base rate adjustment that became effective October 1, 2017.
Lower operating expenses were driven by a one-time discretionary pension contribution in 2017 and decreases in nuclear planned outage days. Additionally, interest paid decreased in 2018 due to lower average balances and rates on long-term debt.
2017
Compared to
2016
Net cash flows provided by operating activities decreased by $306 million for 2017 compared to 2016 primarily due to increases in cash used for pension contributions, fuel costs, and outage costs. These changes were partially offset by increases in revenue collections due to timing, the increase to the effective base rate, and additional fuel cost recovery.
Investing Activities
. The majority of TVA’s investing cash flows are due to investments to acquire, upgrade, or maintain generating and transmission assets, including environmental projects and the purchase of nuclear fuel.
2018
Compared to
2017
Net cash flows used in investing activities decreased by $267 million for 2018 compared to 2017, driven by the completion of Paradise Combined Cycle Plant, Allen CC, and the clean air controls at Gallatin and Shawnee. With the completion of these projects, TVA does not foresee needing additional large, base-load generation units for at least the next decade. These decreases were partially offset by increases in nuclear fuel expenditures. Nuclear fuel expenditures vary depending on the number of outages and the prices and timing of purchases of uranium and enrichment services.
2017
Compared to
2016
Net cash flows used in investing activities decreased by $577 million for 2017 compared to 2016, primarily driven by the completion of Watts Bar Unit 2 in October 2016 and Paradise Combined Cycle Plant in April 2017.
Financing Activities
.
TVA’s cash flows provided by or used in financing activities are primarily driven by the timing and level of cash flows provided by operating activities, cash flows used in investing activities, and net issuance and redemption of debt instruments to maintain a strategic balance of cash on hand.
2018
Compared to
2017
Net cash flows used in financing activities increased $1.5 billion for 2018 compared to 2017. TVA had $1.6 billion in net debt redemptions in 2018 compared to $38 million net debt redemptions in 2017. The increase in redemptions is primarily due to the $1.2 billion increase in operating cash flows, which resulted in additional debt reduction. These increases in redemptions were partially offset by decreases in payments on lease and leasebacks due to the 2017 acquisition of the residual interests in a lease/leaseback arrangement. See
Note 9
.
2017
Compared to
2016
Net cash flows used in financing activities were $200 million for 2017 as compared to $71 million of net cash provided by financing activities in 2016. Increased cash flows from operations and decreased investing expenditures reduced TVA’s borrowing needs. During 2017, TVA also realized proceeds from the issuance of a $1.0 billion power bond carrying an interest rate of 2.88 percent and a term of ten years. The proceeds from the bond issuance were used in part to redeem a portion of $1.6 billion of other long-term debt, primarily power bonds. In addition, TVA had $583 million of short-term debt net issuances for 2017 as compared to $370 million in 2016. TVA generally uses short-term debt to meet working capital needs and other cash requirements while maintaining minimal cash balances.
60
Cash Requirements and Contractual Obligations
The future planned capital expenditures for property, plant, and equipment additions, including clean air projects and new generation, and nuclear fuel are estimated to be as follows:
|
Estimated Capital Expenditures
(1)
For the year ended September 30
|
|||||||||||
|
|
2019
|
2020
|
2021
|
||||||||
|
Capacity expansion expenditures
|
$
|
318
|
|
$
|
233
|
|
$
|
234
|
|
||
|
Environmental expenditures
(2)
|
298
|
|
220
|
|
190
|
|
|||||
|
Nuclear fuel
|
432
|
|
358
|
|
377
|
|
|||||
|
Transmission expenditures
|
428
|
|
504
|
|
486
|
|
|||||
|
Other capital expenditures
(3)
|
863
|
|
915
|
|
874
|
|
|||||
|
Total capital expenditures
|
$
|
2,339
|
|
$
|
2,230
|
|
$
|
2,161
|
|
||
Notes
(1) TVA plans to fund these expenditures with cash from operations and proceeds from power program financings. This table shows only expenditures that are currently planned. Additional expenditures may be required, among other things, for TVA to meet growth in demand for power in its service area or to comply with new environmental laws, regulations, or orders.
(2) Estimated capital expenditures include costs for Gallatin projects that are part of the original activities scheduled in TVA’s
coal combustion residuals ("CCR")
Conversion Program of approximately $96 million, $24 million, and $3 million for 2019, 2020, and 2021, respectively. These amounts exclude costs related to any new requirements related to the Gallatin lawsuits. See Item 7, Management's Discussion and Analysis of Financial Condition and Results of Operations —
Key Initiatives and Challenges
—
Coal Combustion Residual Facilities
and
Note 8
.
(3) Other capital expenditures are primarily associated with short lead time construction projects aimed at the continued safe and reliable operation of generating assets.
TVA continually reviews its capital expenditures and financing programs. The amounts shown in the table above are forward-looking amounts based on a number of assumptions and are subject to various uncertainties. Amounts may differ materially based upon a number of factors, including, but not limited to, changes in assumptions about system load growth, environmental regulation, rates of inflation, total cost of major projects, and availability and cost of external sources of capital. See
Forward-Looking Information
and Item 1A, Risk Factors
.
TVA has certain obligations and commitments to make future payments under contracts, including contracts executed in connection with certain of the planned construction expenditures. The following table sets forth TVA’s estimates of future payments at
September 30, 2018
. See
Note 10
,
Note 11
,
Note 13
,
Note 20
, and
Note 21
for a further description of these obligations and commitments.
61
|
Commitments and Contingencies
Payments due in the year ending September 30
|
|||||||||||||||||||||||||||
|
|
2019
|
2020
|
2021
|
2022
|
2023
|
Thereafter
|
Total
|
||||||||||||||||||||
|
Debt
(1)
|
$
|
2,249
|
|
$
|
1,030
|
|
$
|
1,860
|
|
$
|
1,028
|
|
$
|
29
|
|
$
|
16,500
|
|
$
|
22,696
|
|
||||||
|
Interest payments relating to debt
(2)
|
1,079
|
|
1,058
|
|
1,017
|
|
966
|
|
945
|
|
15,200
|
|
20,265
|
|
|||||||||||||
|
Debt of VIEs
(3)
|
38
|
|
40
|
|
41
|
|
43
|
|
40
|
|
973
|
|
1,175
|
|
|||||||||||||
|
Interest payments relating to debt of VIEs
|
54
|
|
52
|
|
50
|
|
49
|
|
47
|
|
496
|
|
748
|
|
|||||||||||||
|
Notes payable
|
46
|
|
23
|
|
—
|
|
—
|
|
—
|
|
—
|
|
69
|
|
|||||||||||||
|
Interest payments relating to notes payable
|
1
|
|
—
|
|
—
|
|
—
|
|
—
|
|
—
|
|
1
|
|
|||||||||||||
|
Lease obligations
|
|
|
|||||||||||||||||||||||||
|
Capital
(4)
|
51
|
|
51
|
|
51
|
|
51
|
|
51
|
|
468
|
|
723
|
|
|||||||||||||
|
Non-cancelable operating
(5)
|
34
|
|
28
|
|
26
|
|
12
|
|
2
|
|
1
|
|
103
|
|
|||||||||||||
|
Purchase obligations
|
|
|
|||||||||||||||||||||||||
|
Power
(6)
|
312
|
|
304
|
|
302
|
|
268
|
|
180
|
|
1,178
|
|
2,544
|
|
|||||||||||||
|
Fuel
(7)
|
1,538
|
|
1,001
|
|
687
|
|
383
|
|
334
|
|
1,577
|
|
5,520
|
|
|||||||||||||
|
Other
(8)
|
145
|
|
47
|
|
40
|
|
55
|
|
41
|
|
242
|
|
570
|
|
|||||||||||||
|
Gallatin coal combustion residual facilities
(9)
|
44
|
|
40
|
|
15
|
|
12
|
|
9
|
|
825
|
|
945
|
|
|||||||||||||
|
Environmental Agreements
|
3
|
|
2
|
|
2
|
|
1
|
|
1
|
|
5
|
|
14
|
|
|||||||||||||
|
Membership interests of variable interest entity subject to mandatory redemption
|
2
|
|
3
|
|
3
|
|
3
|
|
2
|
|
18
|
|
31
|
|
|||||||||||||
|
Interest payments related to membership interests of variable interest entity subject to mandatory redemption
|
2
|
|
2
|
|
2
|
|
2
|
|
1
|
|
8
|
|
17
|
|
|||||||||||||
|
Flood response commitment to NRC
|
13
|
|
9
|
|
—
|
|
—
|
|
—
|
|
—
|
|
22
|
|
|||||||||||||
|
Unfunded loan commitments
|
3
|
|
—
|
|
—
|
|
—
|
|
—
|
|
—
|
|
3
|
|
|||||||||||||
|
Long-term monitoring costs - Kingston ash spill
|
1
|
|
1
|
|
1
|
|
1
|
|
2
|
|
12
|
|
18
|
|
|||||||||||||
|
Payments on other financings
|
59
|
|
60
|
|
217
|
|
36
|
|
10
|
|
233
|
|
615
|
|
|||||||||||||
|
Retirement Plan
(10)
|
300
|
|
300
|
|
300
|
|
300
|
|
300
|
|
3,900
|
|
5,400
|
|
|||||||||||||
|
Total
|
$
|
5,974
|
|
$
|
4,051
|
|
$
|
4,614
|
|
$
|
3,210
|
|
$
|
1,994
|
|
$
|
41,636
|
|
$
|
61,479
|
|
||||||
Notes
(1) Does not include non-cash items of foreign currency exchange gain of $
147 million
, unamortized debt issue costs of $56 million, and net discount on sale of Bonds of $
88 million
.
(2) Includes the effects of interest rate derivatives employed to manage interest rate risk.
(3) Debt of VIEs does not include the non-cash item of unamortized debt issue costs of $10 million.
(4) Includes the interest component of capital leases based on the interest rates stated in the lease agreements and excludes certain related executory costs. Minimum commitments related to executory costs are included in purchase obligations.
(5) Does not include purchased power agreements of $147 million that are accounted for as operating leases and included in power purchase obligations.
(6) Includes commitments for energy and/or capacity under power purchase agreements from coal-fired, hydroelectric, diesel, and gas-fired facilities, as well as transmission service agreements to support purchases of power from the market.
(7) Includes commitments to purchase nuclear fuel, coal, and natural gas, as well as related transportation and storage services.
(8) Primarily includes long-term service contracts, contracts that contain minimum purchase levels for the purchase of limestone along with related storage and transportation, and contractual obligations related to load control programs.
(9) Includes $861 million long-term liability for costs of constructing a lined facility onsite and excavating and moving the ash and $47 million of estimated costs related to construction of a permanent bottom ash dewatering facility and wastewater process ponds. The estimated capital expenditures represent costs for Gallatin projects that are part of the original activities scheduled in TVA’s CCR Conversion Program. See
Note 8
.
(10) Pursuant to amendments to the
TVA Retirement System ("TVARS")
Rules and Regulations that became effective October 1, 2016, TVA will contribute to TVARS for a period of 20 years (2017-2036) or, if earlier, through the fiscal year in which it is determined by actuarial valuation that TVARS has reached and remained at a 100 percent funded status, an amount not less than the greater of (a) the minimum required TVARS actuarial valuation contribution or (b) $300 million.
In addition to the obligations above, TVA has energy prepayment obligations in the form of revenue discounts. As of
September 30, 2018
, the remaining balances of TVA's energy prepayment obligations and related interest payments were $10 million and $4 million, respectively. These remaining balances will be recognized in revenue during 2019. See
Note 1
—
Energy Prepayment Obligations
.
EnergyRight
®
Solutions Program.
TVA purchases certain loans receivable from its LPCs in association with the EnergyRight
®
Solutions program. Depending on the nature of the energy-efficiency project, loans may have a maximum term of
five years
or
ten years
. The loans receivable are then transferred to a third-party bank with which TVA has agreed to repay in full any loan receivable that has been in default for
180 days
or more or that TVA has determined is uncollectible. As of
September 30, 2018
, the total carrying amount of the loans receivable, net of discount, was approximately $
112 million
. Such
62
amounts are not reflected in the Commitments and Contingencies table above. The total carrying amount of the financing obligation was approximately $
127 million
at
September 30, 2018
. See
Note 6
and
Note 11
for additional information.
Off-Balance Sheet Arrangements
At
September 30, 2018
, TVA had no off-balance sheet arrangements.
Key Initiatives and Challenges
Distributed Energy Resources
Consumer desire for energy choice is, among other things, driving the expectation for flexible options in the electric industry. TVA and LPCs are working together to leverage the strengths of the Tennessee Valley public power model to provide distributed energy solutions that are economic, sustainable, and flexible. TVA will focus on the safety and reliability impacts of these resources as they are interconnected to the grid and will ensure that the pricing of electricity remains as low as feasible. Additional regulatory considerations and analysis may be required as the DER market, technologies, and programs evolve. TVA will work to develop pricing and regulatory structures with a deliberate and thoughtful analysis of each current and future program offering. This will require strong partnerships with LPCs to reinforce local control, give customers choices, and provide end-use consumers the flexibility they desire.
In May 2017, the TVA Board authorized up to $300 million to be spent over the next 10 years, subject to annual budget availability and necessary environmental reviews, to build an enhanced fiber network that will better connect its operational assets. Fiber is a vital part of TVA’s modern communication infrastructure. The new fiber optic lines will improve the reliability and resiliency of the generation and transmission system while enabling the system to better accommodate DER as they enter the market. As of
September 30, 2018
, TVA had spent $25 million on installation of the fiber optic lines and expects to spend an additional $275 million to complete the project.
Changing Customer Preferences
As more consumers and businesses are demanding cleaner and greener energy, the utility industry is evolving to meet those needs. As TVA also evolves, it will see impacts to the way it does business from the pricing of products, transmission of energy, and development of new products and services for its customers in support of changing customer preferences and its economic development efforts. End-use customers are becoming more technologically sophisticated and want greater control over their energy usage. Larger companies are focusing more on sustainability and requiring more energy efficiency as well as cleaner, greener, renewable energy options.
The continuing challenge for TVA and others is finding ways to meet the needs and preferences of customers while successfully developing flexible pricing models to accommodate the evolving markets.
Integrated Resource Planning
TVA has begun the process of updating its IRP, a comprehensive study that provides direction on how to best meet future
power demand by identifying the need for generating capacity, determining the best mix of resources, and evaluating the evolving role of
DER
.
The IRP will consider many views of the future to determine how TVA can continue to provide low-cost, reliable electricity, support environmental stewardship, and spur economic development in the Tennessee Valley over the next 20 years. To inform TVA's next long-term financial plan and proactively address the changing utility marketplace, TVA began this work sooner than originally planned.
To ensure TVA best meets projected future needs, TVA will continue its tradition of innovation in each IRP. The 2011 IRP focused on diversifying and modernizing its generation portfolio, part of which included adding cost-effective renewables. The 2015 IRP identified DER as a growing trend in the utility industry and designed a mechanism where energy efficiency could be chosen as a resource. The 2019 IRP will explore various DER scenarios, considering the speed and amount of DER penetration, improve TVA's understanding of the impact and benefit of system flexibility with increasing renewable and distributed resources, and determine the implications to TVA's diverse portfolio mix for the next 20 years.
TVA is primarily a wholesale power provider, and the LPCs are the service provider for most end-use customers. Due to this public power business model, collaboration with customers and stakeholders is a vital part of the IRP. Opportunities for customer and stakeholder engagement and for public comment include public meetings, webinars, the IRP working group, and the
Regional Energy Resource Council ("RERC")
. The IRP working group and RERC consist of representatives from LPCs, direct-served customers, non-governmental organizations, state and local governments, and academia. As part of the IRP decision-making process, and in alignment with the
National Environmental Policy Act ("NEPA")
, TVA will also analyze potential environmental implications associated with an updated IRP by issuing an
environmental impact statement ("EIS")
.
During the scoping period which ended in April 2018, TVA received over 80 comments which will help identify issues that are important to the public and will help lay the foundation for development of the IRP and the EIS. TVA published the IRP Scoping Report on its website in August 2018. This report captures comments received during public scoping meetings, submitted online or by mail, as well as information on how the IRP and EIS are being developed. Additionally, TVA hosted
63
quarterly webinars and seven IRP Working Group meetings and provided several updates on the 2019 IRP to the RERC throughout 2018. TVA anticipates issuing the draft IRP and EIS for public review and comment in February 2019.
Natural Resource Plan
TVA has begun the process of updating its
Natural Resource Plan ("NRP")
, which was completed in 2011 to guide TVA’s management of the public lands and waters within its seven-state service area. TVA remains committed to a balanced management approach and is considering changes to the NRP that include defined strategies, objectives, and programs for each of the proposed 10 focus areas. The NRP would provide a flexible approach for long-term planning, which would help TVA prioritize funding and support its mission. During 2018, TVA hosted four public open houses and a webinar to obtain public input on the scope of the project, answer questions, and receive comments. The public scoping period closed in August 2018. TVA anticipates that the draft
Supplemental Environmental Impact Statement ("SEIS")
to analyze the potential effects of proposed changes will be published in May 2019. The final SEIS and updated NRP are scheduled to be published in early 2020.
Generation Resources
Nuclear Response Capability
. Since the events that occurred in 2011 at the
Fukushima Daiichi Nuclear Power Plant ("Fukushima Events")
, the
Nuclear Regulatory Commission ("NRC")
adopted additional detailed guidance on the expected response capability to be developed by each nuclear plant site. The NRC issued orders that modified each plant’s license to require implementation of additional external event mitigation capabilities. TVA has implemented these strategies and physical plant modifications to address the actions outlined in this guidance at
Sequoyah Nuclear Plant ("Sequoyah")
and Watts Bar. Implementation is in progress at Browns Ferry and is scheduled to be completed in 2019. As of
September 30, 2018
, TVA had spent $272 million on modifications related to these actions at all of its nuclear plants and expects to spend an additional $7 million to complete the remaining modifications intended to address this guidance.
Extreme Flooding Preparedness
.
Updates to the TVA analytical hydrology model completed in 2009 indicated that under "probable maximum flood" conditions, some of TVA's dams might not have been capable of regulating the higher flood waters. A "probable maximum flood" is an extremely unlikely event; however, TVA is obligated to provide protection for its nuclear plants against such events. As a result, TVA installed a series of modifications at three dams, and work on the fourth, Fort Loudoun Dam, was completed during the third quarter of 2018.
Since 2009, TVA has performed further hydrology modeling of portions of the TVA watershed using updated modeling tools. The revised hydrology models were reviewed and approved by the NRC for Watts Bar Units 1 and 2. However, TVA identified an error in the modeling that will require the models for Watts Bar Units 1 and 2 to be resubmitted. TVA plans to resubmit models for Watts Bar Units 1 and 2 during 2019. In addition, TVA plans to submit models for Sequoyah Units 1 and 2 in 2019. TVA will subsequently address conditions at Browns Ferry as needed. TVA has deferred some modifications until the updated Watts Bar and Sequoyah models are completed.
As of
September 30, 2018
, TVA had spent $152 million on the modifications and improvements related to extreme flooding preparedness and expects to spend up to an additional $28 million to complete the modifications.
NRC Seismic Assessments
. On May 9, 2014, the NRC notified licensees of nuclear power reactors in the central and eastern U.S. of the results of seismic hazard screening and prioritization evaluations performed by unit owners and reviewed by the NRC staff. Because the seismic hazards for Browns Ferry, Sequoyah, and Watts Bar had increases in seismic parameters beyond the technical information available when the plants were designed and licensed, TVA must conduct seismic risk evaluations for these plants. TVA completed the risk evaluation for Watts Bar and submitted it to the NRC on June 30, 2017; the evaluation concluded that no additional actions were required. The evaluations for Browns Ferry and Sequoyah are due by December 31, 2019.
Mitigation of Beyond-Design-Basis Events
. NRC rulemaking has been developed to codify the requirements promulgated by orders related to beyond-design-basis flooding and seismic events discussed above. The NRC staff submitted the draft final rule — Mitigation of Beyond-Design-Basis Events — to the NRC Commission on December 15, 2016, requesting approval to publish the final rule. The final rule is expected to be issued in 2019. Minimal changes between the orders and final rule requirements are expected. Once issued, TVA will review the final rule to identify any gaps to compliance. Gaps could result in TVA having to make modifications to one or more of its nuclear plants. Cost estimates for any required modifications cannot be developed until after the rule is finalized, but costs for modifications could be substantial. See
Extreme Flooding Preparedness
.
and
NRC Seismic Assessments
above.
Baffle-Former Bolt Degradation
. In July 2016, Westinghouse Electric Co., LLC ("Westinghouse") issued a
Nuclear Safety Advisory Letter ("NSAL")
16-01 that addresses recently identified degradation of baffle-former bolts in some U.S.
pressurized water reactors ("PWRs")
. Baffle-former bolts help hold together a structure inside certain reactor vessels. Sequoyah Units 1 and 2, both PWRs, are referenced in the NSAL. Visual inspections of baffle-former bolts in Sequoyah Units 1 and 2 during 2017 refueling outages showed no degradation of baffle-former bolts. TVA performed ultrasonic testing on Unit 1 and results were within acceptable standards, with no bolts requiring replacement. Retesting will not be required until 2028. TVA plans to complete inspections for Unit 2 during the refueling outage in the first quarter of 2019.
64
Work Environment at Nuclear Plants.
In March 2016, the NRC issued a
Chilling Effect Letter ("CEL")
to TVA regarding work environment concerns identified at Watts Bar. As a result of alternative dispute resolution, the NRC issued a Confirmatory Order in July 2017 documenting numerous commitments TVA made related to monitoring nuclear safety culture across the fleet. TVA has implemented the actions as required to date including conducting a nuclear safety culture survey across the fleet. In June 2018, the NRC conducted a follow-up inspection at Watts Bar, and while improvements were noted, the inspection identified issues in an additional department at the site. In the mid-cycle assessment letter issued in June 2018, the NRC issued a
Cross Cutting Issue ("CCI")
in safety conscious work environment and outlined the closure criteria for both the CEL and the CCI. TVA is working to implement actions to address the issues in the additional department and closure criteria for the CEL and CCI.
Tritium-Producing Burnable Absorber Rods.
TVA was a cooperating agency in the February 2016
Department of Energy ("DOE")
Final SEIS for the Production of Tritium in a Commercial Light Water Reactor. On April 5, 2017, due to an anticipated need for more
tritium-producing burnable absorber rods ("TPBARs")
, the DOE announced its preferred alternative for irradiation services, which included use of an additional reactor. As a result of TVA's assessment and concurrence with the DOE's alternative, TVA submitted a license amendment to the NRC in December 2017 to authorize the irradiation of TPBARs in Watts Bar Unit 2. The NRC is expected to issue a decision by May 2019. Subject to approval of the license amendment, tritium production in Watts Bar Unit 2 is projected to start in the fall of 2020. The DOE's decision also allows for irradiation of TPBARs at the Sequoyah site in the future; however, TVA does not have plans to employ Sequoyah units for tritium production in the near term.
Extended Power Uprate
. TVA is undertaking an EPU project at Browns Ferry that is expected to increase the amount of electrical generation capacity of its reactors. The license for each reactor was amended to allow reactor operation at the higher power level. The Browns Ferry EPU license amendments were approved by the NRC on August 14, 2017, following a nearly two-year review.
TVA is implementing the EPU project during plant refueling outages. Physical work on Unit 3 was completed, and the unit was synced to the grid in April 2018. On July 13, 2018, Unit 3 reached the new EPU 100 percent power. Work is underway for Unit 1 and will begin in the spring of 2019 for Unit 2.
Full EPU power is expected to be achieved following the noted outages and extensive power ascension testing for each unit.
The project has involved and continues to involve extensive engineering analyses and modification and replacement of certain existing plant components to enable the units to produce the additional power requested by the license amendments.
The project is estimated to cost approximately $475 million and add approximately 465 MW of generating capacity.
Performance of Suppliers
. On March 29, 2017, Westinghouse, a subsidiary of Toshiba Corporation ("Toshiba"), filed for protection under Chapter 11 of the U.S. Bankruptcy Code. On January 4, 2018, Brookfield Business Partners L.P. ("Brookfield Business Partners"), together with institutional partners, announced that they have entered into an agreement to acquire 100 percent of Westinghouse. Westinghouse has emerged from bankruptcy and the sale was closed and became effective on August 1, 2018.
Clean Air Projects.
During 2011, the TVA Board approved the addition of emission control equipment on four units at Gallatin. TVA completed the addition of scrubbers during 2016 and SCRs during 2017 and 2018. In addition, the TVA Board authorized the installation of SCRs and scrubbers on Shawnee Units 1 and 4 during 2015. These systems were placed in service during 2018. All of the above actions were in compliance with the Environmental Agreements.
Coal Combustion Residual Facilities.
TVA has committed to a programmatic approach to the elimination of wet storage of CCRs within the TVA service area. Under this program (the “CCR Conversion Program”), TVA has committed to (1) convert all operational coal-fired plants to dry CCR storage, (2) close all wet storage facilities, and (3) meet all applicable state and federal regulations. To carry out its CCR Conversion Program, TVA is undertaking the following actions:
Dry generation and dewatering projects
. Conversion of coal plant CCR wet processes to dry generation or dewatering is complete at
Bull Run Fossil Plant ("Bull Run")
and
Kingston Fossil Plant ("Kingston")
. Construction is underway at Gallatin, Paradise, and Shawnee. Construction will begin at
Cumberland Fossil Plant ("Cumberland")
in 2019.
Landfills
.
Lined and permitted dry storage facilities have been constructed and are operational at Bull Run, Kingston, and Gallatin. Construction of new lined and permitted dry storage facilities are scheduled to begin at Cumberland, Paradise, and Shawnee in 2019. Construction of additional lined facilities may occur to support future business requirements.
Wet CCR impoundment closures
.
TVA is planning to close wet CCR impoundments in accordance with federal and state requirements when (1) coal-fired plants are converted to dry CCR processes and dry storage landfills become operational or (2) the related plant operations cease. Closure project schedules and costs are driven by the selected closure methodology (such as cap and close in place or closure by removal). TVA issued an EIS in June 2016 that addresses the closure of CCR impoundments at TVA's coal-fired plants. TVA issued its associated Record of Decision in July 2016. Although the EIS was designed to be programmatic in order to address the mode of impoundment closures, it specifically addressed closure methods at 10 impoundments. TVA subsequently decided to close those impoundments. The method of final closure for each of these
65
facilities will depend on various factors, including the results of studies conducted pursuant to NEPA and approval by appropriate state regulators. Additional NEPA studies will be conducted as other facilities are designated for closure.
Groundwater monitoring
.
Compliance with the EPA's CCR rule as well as other requirements will require additional engineering and analysis as well as implementation of a comprehensive groundwater monitoring program. As further analyses are performed, including evaluation of monitoring results, there is the potential for additional costs for investigation and/or remediation. TVA expects to continue to evaluate and update these cost estimates.
On March 2, 2018, in accordance with the EPA’s CCR rule, TVA published the results of groundwater testing at TVA’s active CCR facilities. The initial results showed statistically significant increases above background in the levels of certain constituents at some facilities. The increases do not necessarily indicate a regulatory or permit violation; rather, they trigger further testing to determine if the increases are attributable only to the CCR facility and, if so, what steps need to be taken. TVA will work in compliance with the CCR Rule and, as appropriate, with its regulators to carry out the required investigations. TVA’s permits remain in effect and operations have not been impacted.
In compliance with the EPA’s CCR Rule, TVA will publish the results of additional groundwater testing at TVA’s active CCR facilities in the second quarter of 2019. If the results show statistically significant increases over the established groundwater protection standards for certain constituents, there will be further testing to determine whether the increases are attributable only to the CCR facility. In addition, there could be additional costs for investigation and/or remediation. TVA may also have to cease use of any impacted unlined CCR surface impoundments no later than October 31, 2020 (and potentially earlier based on other factors). As required by the EPA’s CCR Rule, TVA will continue to publish reports in the second quarter of each year on annual groundwater monitoring and corrective actions at its active CCR facilities.
In addition, on November 16, 2018, TVA will publish on its CCR website the results of location demonstrations performed at various CCR facilities in accordance with the CCR Rule. These results and the additional groundwater testing results will help determine whether any impacted unlined CCR facility can remain open or if it must be closed. If a facility must be closed, the results specific to each facility will dictate whether it must be closed by April 2019 or October 2020. TVA has already been working to convert its CCR disposal to dry systems and has plans to close all unlined CCR surface impoundments.
The CCR Conversion Program is scheduled to be completed by 2023 with the exception of the impoundments at Gallatin. The impoundments at Gallatin are pending additional studies to determine the final closure methodology and schedule. While plans are currently being formulated for the CCR closure methodology for Gallatin, TVA is involved in two lawsuits relating to alleged releases of waste materials from the CCR facilities at Gallatin. On August 4, 2017, the court in one case ordered TVA to move all materials from the existing impoundments to a lined facility. Although a panel of the Sixth Circuit reversed this decision, the plaintiffs have petitioned for a rehearing. The costs of constructing a lined facility onsite and excavating and moving the ash is approximately $900 million. If TVA is required to use a facility offsite, then the costs could be approximately $2.0 billion, plus an amount of additional costs reflecting the expected impacts of inflation given the extended duration of an offsite relocation project. These amounts do not include costs or penalties associated with any order in the other case. These amounts cannot be estimated at this time, but could be material. See
Note 8
.
As of
September 30, 2018
, TVA had spent approximately $1.5 billion on its CCR Conversion Program. TVA expects to spend approximately an additional $1.2 billion on the CCR Conversion Program through 2023, excluding new requirements related to the Gallatin CCR facilities lawsuits. These estimates may change depending on the final closure method selected for each facility. Once the CCR Conversion Program is completed, TVA will continue to undertake certain CCR projects, including building new landfill sections under existing permits and closing existing sections once they reach capacity. See Item 1, Business —
Environmental Matters
—
Cleanup of Solid and Hazardous Wastes
—
Coal Combustion Residuals
.
Potential Liability Associated with Workers’ Exposure to CCR Materials.
In response to the 2008 ash spill at the Kingston, TVA hired
Jacobs Engineering Group, Inc. (“Jacobs”)
to oversee certain aspects of the cleanup. After the cleanup was completed, Jacobs was sued in the U.S. District Court for the Eastern District of Tennessee (“Eastern District”) by a group of workers who alleged that Jacobs had failed to take or provide proper health precautions and misled workers about the health risks associated with exposure to coal fly ash, which is a CCR material. The plaintiffs alleged that exposure to the fly ash caused a variety of significant health issues and illnesses, including in some cases death. The case was split into two phases, with the first phase considering general causation and the second determining specific causation. On November 7, 2018, a jury hearing the first phase returned a verdict in favor of the plaintiffs, including determinations that Jacobs failed to adhere to its contract with TVA or the Site Wide Safety and Health Plan in place; Jacobs failed to provide reasonable care to the plaintiffs; and Jacobs’s failures were capable of causing a specific list of medical conditions, ranging from hypertension to cancer. The case will now proceed on the question of whether Jacobs’s failures did in fact cause the plaintiffs’ alleged injuries. While TVA is not a party to this litigation, TVA could be obligated to reimburse Jacobs for some amounts that Jacobs is required to pay as a result of this litigation, but TVA cannot estimate at this time the amount of any such reimbursement obligations. Further, TVA will continue monitoring this litigation to determine whether this or similar cases could have broader implications for the utility industry.
Coal and Natural Gas-Fired Units
. Pre-commercial operations on Units 1 and 2 of the Allen CC began in September 2017, and the plant began commercial operations April 30, 2018. The plant has a generation capacity of approximately 1,100 MW with a cost under $900 million. Units 1 and 2 of the Allen CC replaced Units 1-3 of the Allen
,
which were retired in March
66
2018. See
Regulatory Compliance
—
Allen Groundwater Investigation
.
below. The retirements of these units were in compliance with the Environmental Agreements.
Pre-commercial operations on Unit 20 of the Johnsonville Combustion Turbine Plant, which allows for cogeneration capability, began in September 2017, and the unit was placed in service during the first quarter of 2018. Unit 20 replaced Johnsonville's cogeneration capability formerly provided by Units 1-4, which were retired in December 2017. These units had a summer net capability of 428 megawatts. The retirements of these units were in compliance with the Environmental Agreements.
River Management
. While the first half of 2018 saw near normal rainfall and runoff, the second half of 2018 saw above normal rainfall and runoff in the Tennessee Valley. Rainfall during the second half of 2018 was 131 percent of normal while runoff was 124 percent of normal. Above normal runoff has persisted since February 2018 and has helped TVA meet its river system commitments, including managing minimum river flows for navigation; generating low-cost hydroelectric power; maintaining water quality, water supply, and recreation for the Tennessee Valley; having cool water available to meet thermal compliance and enabling normal operation of TVA's nuclear and fossil-fueled plants; and oxygenating water to help fish species remain healthy. Rainfall and runoff in the Tennessee Valley in 2018 were 118 percent and 116 percent of normal, respectively, which resulted in conventional hydroelectric generation being 22 percent higher during 2018 as compared to 2017.
Small Modular Reactors
. TVA submitted an
Early Site Permit Application ("ESPA")
for review by the NRC in May 2016. The progress of NRC’s review of the ESPA is consistent with the NRC’s published schedule. The ESPA is based on the potential future construction and operation of two or more
small modular reactors ("SMRs")
units at TVA’s Clinch River site in Oak Ridge, Tennessee. TVA’s ESPA is based upon information regarding the various SMR designs under development in the U.S. TVA and the DOE are working under an interagency agreement to jointly fund licensing activities for the Clinch River site with DOE reimbursement of up to 50 percent of TVA's eligible costs through 2020.
TVA is developing the Clinch River site at a pace consistent with progress being made by developers on the engineering and licensing of SMR designs. The project has a great deal of flexibility at this early stage and by working to reduce licensing risk, TVA will be in a position to build an SMR if and when additional power sources are needed. Any decision to construct an SMR would require approval by the TVA Board.
Dam Safety and Remediation Initiatives
Assurance Initiatives.
TVA has an established dam safety program, which includes procedures based on the Federal Guidelines for Dam Safety, with the objective of reducing the risk of a dam safety event. The program is comprised of various engineering activities for all of TVA’s dams including safety reassessments using modern industry criteria and the new probable maximum flood and site-specific seismic load cases. One aspect of the guidelines is that dam structures will be periodically assessed to assure that TVA's dams meet current design criteria. These assessments include material sampling of the dam and foundational structures and detailed engineering analysis. TVA will continue its preventative and ongoing maintenance as a part of this safety program. As of
September 30, 2018
, TVA had spent $103 million on dam safety assurance initiatives and expects to spend up to an additional $153 million through 2021.
Boone Dam Remediation
. In October 2014, a sinkhole was discovered near the base of the earthen embankment at Boone Dam, and a small amount of water and sediment was found seeping from the river bank below the dam. TVA identified underground pathways contributing to the seepage and prepared a plan to repair the dam, which consists of the construction of a composite seepage barrier wall in the dam's earthen embankment. TVA has completed low mobility grouting, the upstream line of high mobility grouting, and construction of an upstream and downstream buttress. In addition, a contractor for construction of the concrete cut-off wall has been selected.
As design and construction plans are finalized, the estimated cost and duration continue to be refined. As of
September 30, 2018
, TVA had spent $126 million related to this project and expects to spend an additional $331 million through 2022. TVA is continuing to work with the community to help mitigate local impacts of the extended drawdown.
Pickwick South Embankment Remediation.
Reassessments of
Pickwick Landing Dam ("Pickwick")
found low safety factors for post-earthquake stability indicating that the dam is at significant risk for slope stability failure following a seismic event in portions of the south embankment. Slope stability failure could lead to a breach of the south embankment and loss of the reservoir, resulting in loss of life and damage to property downstream, disruption to navigation, and loss of generation and recreation.
TVA is planning to upgrade the south embankment by constructing berms on the upstream and downstream slopes. The design phase of the project began during the first quarter of 2017, and the project is expected to be in full construction during 2019. The project is currently estimated to be completed in two years. However, the project may take longer than two years depending on successful construction sequencing. As of
September 30, 2018
, TVA had spent $11 million related to this project and expects to spend an additional $92 million.
67
Surplus Property
TVA continues to study its real estate portfolio for the purpose of aligning its real estate holdings with TVA's strategic direction. A comprehensive assessment of its real estate holdings has been completed, and TVA is implementing a strategy aimed at reducing cost and right-sizing its portfolio as part of the effort.
Bellefonte Nuclear Plant
. On November 14, 2016, following a public auction, TVA entered into a contract to sell substantially all of the Bellefonte site to Nuclear Development, LLC for $111 million. Nuclear Development, LLC, paid TVA $22 million on November 14, 2016, with the remaining $89 million due at closing. Nuclear Development, LLC, had up to two years from November 14, 2016, to close on the property, and TVA agreed to maintain the site until closing. Nuclear Development, LLC, requested and was granted an extension of the initial closing date. Nuclear Development, LLC now has until November 30, 2018 to close on the property, and TVA will continue to maintain the site until then. See
Note 7
—
Deferred Nuclear Generation Units
.
Muscle Shoals Property
. In alignment with its strategic direction of right-sizing its real estate portfolio, TVA has drafted a strategy to further reduce a significant number of buildings and property in Muscle Shoals, Alabama, including the disposition of 900 acres of the 1,000 acres approved by the TVA Board in 2012. On April 20, 2018, following a public auction, TVA entered into a contract to sell the property to Muscle Shoals Holdings, LLC for $5 million. The Alabama Department of Environmental
Management granted the release of an existing environmental permit. The transaction closed on July 23, 2018.
Knoxville Property
. In 2016, TVA completed a comprehensive assessment of its real estate holdings in the Knoxville, Tennessee region including the
Knoxville Office Complex ("KOC")
and adjacent
Summer Place Complex ("SPC")
. As a result of this study and a subsequent environmental assessment in 2017, TVA is planning to consolidate most of its Knoxville area employees into one location in the West Tower of the KOC and plans to convey the SPC and the East Tower of the KOC.
Regulatory Compliance
Steam-Electric Effluent Guidelines
. On November 3, 2015, the EPA published a final rule revising the existing
steam-electric
effluent limitation guidelines ("ELGs")
. The ELGs update the existing technology-based water discharge limitations for power plants. Compliance with new requirements is required in the 2018-2023 timeframe and will necessitate major upgrades to wastewater treatment systems at all coal-fired plants. Dry fly ash handling is mandated by the rule. The rule also requires either dry bottom ash handling systems or “no discharge” recycle of bottom ash transport waters, and new technology-based limits on
flue gas desulfurization ("FGD")
(scrubber) wastewater require primary physical/chemical treatment and secondary biological treatment to meet extremely low limits for arsenic, mercury, and selenium.
The EPA published a rule on September 18, 2017, postponing certain compliance/applicability dates to provide the EPA time to review and revise, as necessary, the 2015 ELGs for FGD wastewater and bottom ash transport water. The EPA pushed back the compliance dates for these two wastestreams from the 2018-2023 timeframe to 2020-2023. However, requirements and 2018-2023 applicability dates for fly ash transport water, flue gas mercury control wastewater, and gasification wastewater remain in effect. See Item 1, Business
—
Environmental Matters — Water Quality Control Developments — Steam-Electric Effluent Guidelines.
TVA currently has four plants with wet scrubbers that will have to comply with the scrubber-related limits, the largest being Cumberland. TVA is working to address future compliance with the ELGs at Cumberland given its unique "once-through" scrubber design. Compliance with the current rule at Cumberland without modification to address the unique design could cause TVA to incur disproportionately high costs at Cumberland or experience other operational outcomes which TVA cannot predict at this time.
Allen Groundwater Investigation
. The 2015 EPA CCR rule required TVA to conduct additional engineering and analysis, as well as implement a comprehensive groundwater monitoring program. As a result of this groundwater monitoring program, TVA reported to the
Tennessee Department of Environment and Conservation ("TDEC")
in May 2017 elevated levels of arsenic, lead, and fluoride in water samples taken at a few shallow-aquifer groundwater monitoring wells around the east coal ash impoundment at Allen. TVA, under the oversight of TDEC, has been conducting a remedial investigation into the nature and extent of the contamination. In July 2017, TVA received a Remedial Site Investigation request from TDEC, outlining the objectives of the investigation and requiring TVA to provide a work plan.
The plan, which was submitted to TDEC in September 2017, included more extensive groundwater monitoring sampling to identify the source and extent of the contamination. The plan also included groundwater modeling to determine the current groundwater flow conditions and likely future conditions that may develop as a result of pumping cooling water from the deeper aquifer to the Allen CC, including a pump test involving the cooling water withdrawal wells. While evaluation continues, TVA has suspended plans to obtain cooling water from the deeper aquifer. TVA is constructing water tanks on site and is purchasing cooling water from its LPC,
Memphis Light, Gas and Water Division ("MLGW")
. The use of water tanks rather than the wells may impose some operational restrictions on the Allen CC due to the lower availability of cooling water.
68
A Remedial Investigation Report summarizing the results of the investigation was submitted to TDEC in March 2018, and TDEC provided subsequent comments on the report to be addressed by TVA. On July 20, 2018, TVA submitted responses to the comments on the Remedial Investigation Report, an initial Remedial Design Report, and a Groundwater Pre-design Work Plan to TDEC. In the aforementioned responses submitted to TDEC, it was stated that TVA is required to complete a NEPA review that analyzes various alternatives prior to making a final decision on closure. TVA further stated that, as part of the NEPA review process, TVA would identify closure by removal as the preferred alternative for the Allen east impoundment. TVA is expected to begin its public NEPA review process at Allen in November 2018 to analyze closure alternatives to support a final decision on the appropriate closure methodology. For additional discussion on the impact to TVA’s
asset retirement obligations ("AROs")
, see
Note 12
.
Pension Fund
As of
September 30, 2018
, TVA's qualified pension plan had assets of $
8.0 billion
compared with liabilities of $
11.7 billion
. The funded status of the plan may not improve significantly in the near term because of the significant amount of benefits paid each year to plan beneficiaries and the historically low discount rates used to measure the plan's benefit obligation. The plan currently has approximately 34,000 participants, of which approximately 24,000 are retirees and beneficiaries currently receiving benefits. Benefits of over $700 million are expected to be paid in
2019
. TVA made a contribution of $300 million to the plan in
2018
. See
Note 20
.
Ratemaking
At its August 22, 2018, meeting, the TVA Board approved a base rate adjustment which became effective on October 1, 2018. The base rate adjustment is expected to contribute approximately $200 million to 2019 revenues.
Since the fall of 2013, TVA, LPCs and directly served industries have worked collaboratively to develop changes to TVA's rates that focus on TVA’s long-term pricing efforts. A comprehensive rate restructuring was implemented in October 2015 to improve pricing by better aligning rates with underlying cost drivers and sending improved pricing signals, while maintaining competitive industrial rates and keeping residential rates affordable.
Consistent with the pricing direction and changes implemented in the 2015 rate restructuring, TVA staff recommended, and the TVA Board approved, the proposed 2018 rate change on May 10, 2018. This change will reduce wholesale energy rates for Standard Service and introduce a GAC at an offsetting rate to better recover fixed costs. Recognizing the need for flexibility, all LPCs were presented with the option to implement the wholesale changes in October 2018 or defer the implementation of the GAC until October 2019. Seventy-nine LPCs elected to implement the wholesale changes in October of 2018, while the remaining 75 have elected to implement the wholesale changes in October of 2019.
The 2018 rate change better reflects the wholesale cost of energy and recognizes the value of the grid’s reliability and associated fixed costs. This modernized approach to pricing provides bill stability while maintaining reliability and fairness for all TVA's customers. Concurrent with this process, an Environmental Assessment was completed on May 4, 2018, resulting in a finding of no significant impact. See
Distributed Energy Resources
and
Item 1, Business —
Rates
—
Rate Methodology
.
Safeguarding Assets
Physical Security
—
Non-Nuclear Asset Protection.
TVA utilizes a variety of security technologies, security awareness activities, and security personnel to prevent sabotage, vandalism, and thefts. Any of these activities could negatively impact the ability of TVA to generate, transmit, and deliver power to its customers. TVA's Police and Emergency Management personnel are active participants with numerous professional and peer physical security organizations in both the electric industry and law enforcement communities.
Physical attacks on transmission facilities across the country have heightened awareness of the need to physically protect facilities. TVA continues to work with the
North American Electric Reliability Corporation ("NERC")
, the SERC Reliability Corporation, the North American Transmission Forum, and other utilities to implement industry approved recommendations and standards.
Nuclear Security
. Nuclear security is carried out in accordance with federal regulations as set forth by the NRC. These regulations are designed for the protection of TVA's nuclear power plants, the public, and employees from the threat of radiological sabotage and other nuclear-related terrorist threats. TVA has security forces to guard against such threats.
Cybersecurity.
TVA operates in a highly regulated environment with respect to cybersecurity. TVA's cybersecurity program aligns or complies with the Federal Information Security Management Act, the NERC Critical Infrastructure Protection requirements, and the NRC requirements for cybersecurity, as well as industry best practices. As part of the U.S. government, TVA coordinates with and works closely with the Department of Homeland Security and the
United States Computer Emergency Readiness Team ("US-CERT")
. US-CERT functions as a liaison between the Department of Homeland Security and the public and private sectors to coordinate responses to security threats from the internet.
69
The risk of these cybersecurity events continues to intensify. While TVA has been, and will likely continue to be, subjected to such attacks, to date the attacks have not impacted TVA's ability to operate as planned or compromised data which could involve TVA in
lawsuits, claims, proceedings, investigations, and other legal matters ("Legal Proceedings")
. See Item 1A, Risk Factors —
Operational Risks
—
TVA's facilities and information infrastructure may not operate as planned due to cyber threats to TVA's assets and operations
.
Over the last few years, there has been an increase of malicious cyber activity across all industries, including the energy sector. This activity has caused the need for heightened awareness and preparedness. Although TVA has not been compromised during these recent incidents, it is leveraging its federal intelligence partners to better predict, detect, and respond to these potential attacks.
Transmission Assets
. In addition to physical and cybersecurity attacks, TVA's transmission assets are vulnerable to various types of electrically charged energy disruptions such as those from
geomagnetic disturbances ("GMDs")
and
electromagnetic pulses ("EMP")
. Because the effects of GMD and EMP are similar, they are often considered together. In September 2016, the
Federal Energy Regulatory Commission ("FERC")
approved a new standard to address GMD events, and in May 2018, FERC proposed a revised standard. TVA has already met the requirements of the original standard and most of the requirements of the revised standard, and has evaluated the effects of solar storms ranging from NERC's reference case to possible extreme levels. TVA continues as an active participant with NERC in this field. The most serious threats from EMP are those caused by high-altitude nuclear explosions. Like others in the industry, TVA is coordinating with federal and state authorities, NERC,
Electric Power Research Institute ("EPRI")
, and other grid owners and operators to address this concern.
Critical Accounting Policies and Estimates
TVA's consolidated financial statements are prepared in accordance with
accounting principles generally accepted in the United States of America ("GAAP")
, which require management to make estimates, judgments, and assumptions that affect the amounts reported in the consolidated financial statements and accompanying notes. Each of these estimates varies in regard to the level of judgment involved and its potential impact on TVA's financial results. Estimates are deemed critical either when a different estimate could have reasonably been used, or where changes in the estimate are reasonably likely to occur from period to period, and such use or change also would materially impact TVA's financial condition, results of operations, or cash flows. TVA's critical accounting policies are also discussed in
Note 1
of the Notes to Consolidated Financial Statements.
TVA believes that its most critical accounting policies and estimates relate to the following:
|
•
|
Regulatory Accounting;
|
|
•
|
Gallatin Coal Combustion Residuals;
|
|
•
|
AROs; and
|
|
•
|
Pension and Other Post-Retirement Benefits.
|
Management has discussed the development, selection, and disclosure of critical accounting policies and estimates with the Audit, Risk, and Regulation Committee of the TVA Board. While TVA's estimates and assumptions are based on its knowledge of current events and actions it may undertake in the future, actual results may ultimately differ from these estimates and assumptions.
Regulatory Accounting
The TVA Board is authorized by the TVA Act to set rates for power sold to customers; thus, TVA is "self-regulated." Additionally, TVA's regulated rates are designed to recover its costs of providing electricity. In view of demand for electricity and the level of competition, TVA has assumed that rates, set at levels that will recover TVA's costs, can be charged and collected. As a result of these factors, TVA records certain assets and liabilities that result from the regulated ratemaking process that would not be recorded under GAAP for non-regulated entities. Regulatory assets generally represent incurred costs that have been deferred because such costs are probable of future recovery in customer rates. Regulatory liabilities generally represent obligations to make refunds to customers for previous collections of costs that are not likely to be incurred or deferral of gains that will be credited to customers in future periods. The timeframe over which the regulatory assets are recovered from customers or regulatory liabilities are credited to customers is subject to annual TVA Board approval. At
September 30, 2018
, TVA had
$7.0 billion
of Regulatory assets and
$291 million
of Regulatory liabilities.
TVA assesses whether the regulatory assets are probable of future recovery by considering factors such as applicable regulatory changes, potential legislation, and changes in technology. Based on these assessments, TVA believes the existing regulatory assets are probable of recovery. This determination reflects the current regulatory and political environment and is subject to change in the future.
In 2017, the TVA Board authorized management to accelerate amortization of certain regulatory assets to the extent actual net income in 2018 exceeds the budgeted amount, up to the aggregate amount of those certain regulatory assets. Assets included in this Board action include: deferred nuclear generating units, environmental cleanup costs related to the Kingston ash spill, and nuclear training costs related to the refurbishing and restarting of Browns Ferry Unit 1 and the construction of Watts
70
Bar Unit 2. TVA recorded $857 million of accelerated amortization of the Deferred nuclear generating units and Nuclear training costs regulatory assets in 2018. The TVA Board is authorizing TVA to use the amount included in the 2019 rate action for these two regulatory assets, to the extent needed, to accelerate amortization of the Environmental cleanup costs - Kingston ash spill regulatory asset in 2019.
TVA does not believe there is a reasonable likelihood that there will be a material change in the estimates or assumptions used to record regulatory assets and liabilities. If future recovery of regulatory assets ceases to be probable, or any of the other factors described herein cease to be applicable, TVA would be required to write off these costs and recognize them in net income or other comprehensive income.
Gallatin Coal Combustion Residuals
In 2017, TVA recorded the liability related to the Gallatin CCR facilities as a regulatory asset to be collected as amounts are paid out, starting October 1, 2018.
TVA may incur significant environmental clean-up costs related to its CCR facilities at Gallatin. See
Note 8
. These costs are based upon estimates of the incremental direct costs of the remediation effort, including costs of compensation and benefits for those employees who are expected to devote a significant amount of time directly to the remediation effort. Such amounts are included in the estimate when it is probable that a liability has been incurred as of the financial statement date and the amount of loss can be reasonably estimated. When both of those recognition criteria are met and the estimated loss is a range, TVA accrues the amount that appears to be a better estimate than any other estimate within the range, or accrues the minimum amount in the range if no amount within the range is a better estimate than any other amount. If the actual costs materially differ from the estimate, TVA’s results of operations, financial condition, and cash flows could be affected materially.
At
September 30, 2018
, the costs include, among other things, environmental studies concerning the existing and new facilities, the licensing activities for the new facility, design and construction of the new facility, relocating the material from the existing facilities to the new facility, closing the existing facilities, monitoring activities, and the expected impacts of inflation given the anticipated duration of the project. At
September 30, 2018
, TVA has estimated these costs to be approximately $900 million. The TVA Board approved regulatory accounting treatment for certain costs associated with compliance with orders or settlements related to lawsuits involving CCR facilities. See
Note 8
—
Financial Impact.
The following categories could have a significant effect on estimates related to environmental clean-up costs of Gallatin coal combustion residuals:
|
•
|
Final Removal Method - It is reasonably possible that TVA will not be able to obtain the necessary permits to build the facility on the Gallatin site and will be required to move the CCR materials offsite. Offsite relocation for this or any other reason would materially increase TVA’s project cost estimate. If TVA is required to use a facility offsite, then the costs could be approximately $2.0 billion, plus an amount of additional costs reflecting the expected impacts of inflation given the extended duration of an offsite relocation project.
|
|
•
|
Uncertainty Inherent in Project Cost Estimates - The ultimate cost of the removal project will depend on actual timing and results of ongoing litigation, environmental studies, licensing, site subsurface conditions, contractor availability, weather, equipment, available material resources, and other contingency factors. These contingency factors could cause the project cost estimate to change materially in the near term. TVA updates its estimate for project costs as changes in these factors are determined to be probable of occurring.
|
|
•
|
Excluded Costs - The costs do not include such items as any additional order or penalty arising from the TDEC lawsuit, which cannot be reasonably estimated at this time. In the event that these costs become probable and reasonably estimable, they could materially increase TVA’s project cost estimate.
|
Asset Retirement Obligations
TVA recognizes legal obligations associated with the future retirement of certain tangible long-lived assets. These obligations relate to TVA’s generating facilities, including coal-fired, nuclear, hydroelectric, and natural gas and/or oil-fired. They also pertain to coal ash impoundments, transmission facilities, and other property-related assets. Activities involved with the retirement of these assets could include decontamination and demolition of structures, removal and disposal of wastes, and site restoration. TVA periodically reviews its estimated asset retirement obligation ("ARO") liabilities. Revisions to the ARO estimates are made whenever factors indicate that the timing or amounts of estimated cash flows have changed. Any change to an ARO liability is recognized prospectively as an equivalent increase or decrease in the carrying value of the capitalized asset. Any accretion or depreciation expense related to these liabilities and assets is charged to a regulatory asset. See
Note 7
—
Nuclear Decommissioning Costs
and
Non-Nuclear Decommissioning Costs
and
Note 12
.
Nuclear Decommissioning
. Utilities that own and operate nuclear plants are required to recognize a liability for legal
obligations related to nuclear decommissioning. An equivalent amount is recorded as an increase in the carrying value of the capitalized asset and allocated to a regulatory asset over the useful life of the capitalized asset. The initial obligation is
71
measured at its estimated fair value using various judgments and assumptions. Fair value is developed using an expected present value technique that is based on assumptions of market participants and that considers estimated retirement costs in current period dollars that are inflated to the anticipated decommissioning date and then discounted back to the date the ARO was incurred. Decommissioning cost studies are updated for each of TVA's nuclear units at least every five years. Changes in assumptions and estimates included within the calculations of the value of the AROs could result in significantly different results than those identified and recorded in the financial statements.
At
September 30, 2018
, the estimated future nuclear decommissioning cost recognized in the financial statements was
$3.0 billion
and was included in AROs, and the unamortized regulatory asset related to nuclear decommissioning ARO costs of $703 million was included in Regulatory assets.
The following key assumptions can have a significant effect on estimates related to the nuclear decommissioning costs reported in TVA's nuclear ARO liability:
Timing and Method
– In projecting decommissioning costs, two assumptions must be made to estimate the timing of plant decommissioning. First, the date of the plant's retirement must be estimated. At Browns Ferry and Sequoyah, the estimated retirement date is based on the unit with the longest license period remaining. At Watts Bar, the estimated retirement date is based on each unit's license period. Second, an assumption must be made on the timing of the decommissioning. TVA has ascribed probabilities to two different decommissioning methods related to its nuclear decommissioning obligation estimate: the DECON method and the SAFSTOR method. The DECON method requires that radioactive contamination be removed from a site and safely disposed of or decontaminated to a level that permits the site to be released for unrestricted use shortly after it ceases operation. The SAFSTOR method allows nuclear facilities to be placed and maintained in a condition that allows the facilities to be safely stored and subsequently decontaminated to levels that permit release for unrestricted use. TVA bases its nuclear decommissioning estimates on site-specific cost studies, which are updated for each of TVA’s nuclear units at least every five years. Changes in probabilities ascribed to the assumptions or the timing of decommissioning can significantly change the present value of TVA's obligations.
Cost Estimates
– There is limited experience with actual decommissioning of large nuclear facilities. Changes in technology and experience as well as changes in regulations regarding nuclear decommissioning could cause cost estimates to change significantly. TVA's cost studies assume current technology and regulations.
Cost Escalation Rate
– TVA uses expected inflation rates over the remaining timeframe until the costs are expected to be incurred to estimate the amount of future cash flows required to satisfy TVA’s decommissioning obligations.
Discount Rate
– TVA uses its incremental borrowing rate over a period consistent with the remaining timeframe until the costs are expected to be incurred to calculate the present value of the weighted estimated cash flows required to satisfy TVA’s decommissioning obligations.
The actual decommissioning costs may vary from the derived estimates because of changes in current assumptions, such as the assumed dates of decommissioning, changes in regulatory requirements, changes in technology, and changes in the cost of labor, materials, and equipment. A 10 percent change in TVA's ARO for nuclear decommissioning cost at
September 30, 2018
, would have affected the liability by approximately $300 million.
Non-Nuclear Decommissioning.
At
September 30, 2018
, the estimated future non-nuclear decommissioning cost recognized in the financial statements was
$1.8 billion
and was included in AROs, and the unamortized regulatory asset related to non-nuclear decommissioning ARO costs of $
1.0 billion
was included in Regulatory assets. This decommissioning cost estimate involves estimating the amount and timing of future expenditures and making judgments concerning whether or not such costs are considered a legal obligation. Estimating the amount and timing of future expenditures includes, among other things, making projections of the timing and duration of the asset retirement process and predicting how costs will escalate with inflation. The following key assumptions can have a significant effect on estimates related to the non-nuclear decommissioning costs:
Timing and Method
– In projecting non-nuclear decommissioning costs, the date of the asset’s retirement must be estimated. In instances where the retirement of a specific asset will precede the retirement of the generating plant, the anticipated retirement date of the specific asset is used. Additionally, TVA expects to incur certain ongoing costs subsequent to the initial asset retirement. TVA develops its cost estimates based on likelihood of decommissioning method where options exist in fulfilling legal obligations (e.g., cap and close in place or clean closure for coal ash impoundments). The decommissioning method is determined based on several factors including available technologies, environmental studies, cost factors, resource availability, and timing requirements. As these factors are considered and decommissioning methods are determined, the
detailed project schedules and estimates are adjusted. During 2016, TVA management updated its non-nuclear plant closure method assumption from a maintain-in-place method to a plant demolition method. See
Note 8
.
Technology and Regulation
– Changes in technology and experience as well as changes in regulations regarding non-nuclear decommissioning could cause cost estimates to change significantly. TVA’s cost estimates generally assume current technology and regulations. In April 2015, the EPA published its final rule governing CCRs, which regulates landfill and
72
impoundment location, design, and operations; dictates certain pond-closure conditions; and establishes groundwater monitoring and closure and post-closure standards. As a result of this ruling, in 2015 TVA made revisions to the assumptions and estimates used to calculate its CCR AROs. TVA continues to evaluate the impact of the rule on its operations, including cost and timing estimates of related projects. As a result, further adjustments to its ARO liabilities may be required as estimates are refined.
Cost Escalation Rate
– TVA uses expected inflation rates over the remaining timeframe until the costs are expected to be incurred to estimate the amount of future cash flows required to satisfy TVA’s decommissioning obligations.
Discount Rate
– TVA uses its incremental borrowing rate over a period consistent with the remaining timeframe until the costs are expected to be incurred to calculate the present value of the weighted estimated cash flows required to satisfy TVA’s decommissioning obligations.
The actual decommissioning costs may vary from the derived estimates because of changes in current assumptions, such as the assumed dates of decommissioning, changes in the discount or escalation rates, changes in regulatory requirements, changes in technology, and changes in the cost of labor, materials, and equipment. A 10 percent change in TVA's ARO for non-nuclear decommissioning costs at
September 30, 2018
, would have affected the liability by approximately $179 million.
Pension and Other Post-Retirement Benefits
TVA sponsors a defined benefit pension plan that is qualified under section 401(a) of the Internal Revenue Code and covers substantially all of its full-time annual employees hired prior to July 1, 2014. TVARS, a separate legal entity governed by its own board of directors, administers the qualified defined benefit pension plan. TVA also provides a
Supplemental Executive Retirement Plan ("SERP")
to certain executives in critical positions, which provides supplemental pension benefits tied to compensation levels that exceed limits imposed by IRS rules applicable to the qualified defined benefit pension plan. Additionally, TVA provides post-retirement health care benefits for most of its full-time employees who reach retirement age while still working for TVA.
TVA's pension and other post-retirement benefits contain uncertainties because they require management to make certain assumptions related to TVA's cost to provide these benefits. Numerous factors are considered including the provisions of the plans, changing employee demographics, various actuarial calculations, assumptions, and accounting mechanisms. The most significant of these factors are discussed below.
Expected Return on Plan Assets
.
The qualified defined benefit pension plan is the only plan that is funded with qualified plan assets. In determining the expected long-term rate of return on pension plan assets, TVA uses a process that incorporates actual historical asset class returns and an assessment of expected future performance and takes into consideration external actuarial advice, the current outlook on capital markets, the asset allocation policy, and the anticipated impact of active management.
` In 2017, TVA adopted a 6.75 percent expected long-term rate of return on plan assets to measure the 2018 net periodic benefit pension cost. In 2018, based upon review of the current plan’s asset target allocation mix, capital market outlooks, and the most recent studies, TVA management maintained the
6.75 percent
expected long-term rate of return on plan assets assumptions, which will be used to calculate the 2019 net periodic pension cost.
TVA recognizes the impact of asset performance on pension expense over a three-year phase-in period through a "market-related" value of assets calculation. The "market-related" value of assets recognizes investment gains and losses over a three-year period and is used in calculating expected return on plan assets and net gain or loss for pension cost determination.
A higher expected rate of return assumption decreases the net periodic pension benefit costs, whereas a lower expected rate of return assumption increases the net periodic pension benefit cost. The plan's actual rate of return for 2018 was 5.84 percent compared to the assumption of
6.75 percent
. The difference between the expected and actual return on plan assets resulted in an actuarial loss of $24 million that is recognized as an increase in the related regulatory asset and an increase in the pension benefit obligation at
September 30, 2018
.
Discount Rate
.
TVA’s discount rates are derived by identifying a theoretical settlement portfolio of high quality corporate bonds of Aa quality or higher sufficient to provide for the projected benefit payments. The model matches the present value of the projected benefit payments to the market value of the theoretical settlement bond portfolio with any resulting excess funds presumed to be reinvested and used to meet successive year benefit payments. A single equivalent discount rate is
determined to align the present value of the required cash flow with the value of the bond portfolio. The resulting discount rates are reflective of both the current interest rate and the distinct liability of the pension and post-retirement benefit plans.
The discount rate is somewhat volatile because it is determined based upon the prevailing rate as of the measurement date. A higher discount rate decreases the plan obligations and correspondingly decreases the net periodic pension and net post-retirement benefit costs for those plans where actuarial losses are being amortized. Alternatively, a lower discount rate increases net periodic pension and net periodic post-retirement benefit costs. The discount rates used to determine the pension and post-retirement benefit obligations were
4.35 percent
and
4.40 percent
, respectively, at
September 30, 2018
.
73
Health Care Cost Trends
.
TVA reviews actual recent cost trends and projected future trends in establishing health care cost trend rates. There were no changes for 2018 in the cost trend assumptions that were adopted in 2017 for pre-Medicare participants. The current trend rate assumption used to determine the pre-Medicare eligible postretirement obligation is
6.25 percent
with the rate assumed to gradually decrease each successive year until it reaches a
5.00 percent
annual increase in health care costs in 2024 and beyond. TVA maintained the post-Medicare eligible health care cost trend assumption at zero percent through 2020 at which time it increases to 4.00 percent in 2021 and beyond as a result of the move of Medicare eligible retirees to a private exchange beginning January 2017.
Cost of Living Adjustments
.
Cost of living adjustments (“COLAs”) are an increase in the benefits for eligible retirees to help maintain the purchasing power of benefits as consumer prices increase. This assumption is based on the long-term expected future rate of inflation based on the capital market outlooks, economic forecasts, and the Federal Reserve policy. See
Note 20
for further discussion on the calculation of the COLA. The actual COLA for CY 2018 was 1.84 percent, and the COLA assumption for CY 2019 and thereafter is 2.00 percent. A higher COLA increases the pension benefit obligation whereas a lower assumption decreases the obligation. The actual calendar year COLA and the long-term COLA assumption are used to determine the benefit obligation at September 30 and the net periodic benefit costs for the following fiscal year.
Sensitivity to Changes in Key Assumptions
The following tables illustrate the estimated effects of changing certain of the critical actuarial assumptions discussed above, while holding all other assumptions constant and excluding any impact for unamortized actuarial gains and losses:
|
Sensitivity to Certain Changes in Pension Assumptions
At September 30, 2018
|
||||||||||
|
Actuarial Assumption
|
Current Assumption
|
Change in Assumption
|
Impact
|
|||||||
|
Effect on 2018 pension expense:
|
||||||||||
|
Discount rate
|
3.85
|
%
|
(0.25
|
)%
|
$
|
16
|
|
|||
|
Expected return on assets
|
6.75
|
%
|
(0.25
|
)%
|
18
|
|
||||
|
COLA
|
2.00
|
%
|
0.25
|
%
|
28
|
|
||||
|
Effect on benefit obligation
|
||||||||||
|
Discount rate
|
4.35
|
%
|
(0.25
|
)%
|
330
|
|
||||
|
COLA
|
2.00
|
%
|
0.25
|
%
|
217
|
|
||||
|
Sensitivity to Changes in Assumed Health Care Cost Trend Rates
At September 30, 2018
|
|||||||
|
|
1% Increase
|
1% Decrease
|
|||||
|
Effect on total of service and interest cost components for the year
|
$
|
4
|
|
$
|
(4
|
)
|
|
|
Effect on end-of-year accumulated post-retirement benefit obligation
|
62
|
|
(59
|
)
|
|||
Mortality and Other Experience Assumptions
.
TVA’s mortality assumptions are based upon actuarial projections in combination with actuarial studies of the actual mortality experience of TVARS’s pension and post-retirement benefit plan participants taking into consideration the Society of Actuaries ("SOA") mortality table and projection scales as of
September 30, 2018
. TVA continues to monitor the availability of updates to mortality tables, longevity improvement scales, and mortality reviews and experience studies to consider whether these updates should be reflected in the current year mortality assumption.
Based on the results obtained from the experience study performed during 2018, TVA adjusted its version of the SOA RP-2014 mortality table to reflect increases in female mortality and adopted a modified version of the SOA MP-2017 improvement scale to measure the pension and post-retirement benefit obligations at September 30, 2018. The change in TVA’s mortality assumptions resulted in a decrease in the pension and other post-retirement benefit obligations of $138 million and $6 million, respectively.
The results from the experience study also included revisions to certain assumptions, such as timing and rates of retirement and withdrawals, rate of compensation increases, and other experience related assumptions. These changes resulted in an increase in the pension retirement benefit obligation of $46 million and a $23 million decrease in the accumulated post-retirement benefit obligation.
Contributions.
The minimum pension contribution for 2018 was $
300 million
and was paid in twelve monthly installments. TVA made contributions of $
4 million
to the SERP and
$25 million
, net of rebates and subsidies received, to the unfunded other post-retirement benefit plans. TVA expects to contribute $
300 million
to TVARS, $
6 million
to the SERP, and
$29 million
to the other post-retirement benefit plans in 2019.
74
Accounting Mechanisms.
In accordance with current accounting guidance, TVA utilizes a number of accounting mechanisms that reduce the volatility of reported pension expense. Differences between actuarial assumptions and actual plan results are deferred and amortized into period expense only when the accumulated differences exceed 10 percent of the greater of the projected benefit obligation or the market-relative value of plan assets. If necessary, the excess is amortized over the
average future expected working lifetime of participants expected to receive benefits, which is approximately 10 years for the pension plan and 12 years for the post-retirement plan. Additionally, TVA recognizes pension costs as regulatory assets or regulatory liabilities to the extent that the amount calculated under U.S. GAAP as pension expense differs from the amount TVA contributes to the pension plan as pension plan contributions. As a result of recent plan design changes, future contributions are expected to exceed the expense calculated under U.S. GAAP. Accordingly, TVA will discontinue this regulatory accounting practice once all such deferred costs have been recovered, at which time it will recognize pension costs in accordance with U.S. GAAP. Furthermore, amortization of net prior service cost/(credit) resulting from a plan change is included as a component of period expense in the year first recognized and every year thereafter until it is fully amortized. The increase or decrease in the benefit obligation due to a plan change is amortized over the average remaining service period of participating employees expected to receive benefits under the plans. The pension and post-retirement plans currently have prior service credits from plan changes made in 2009, 2010, 2016, and 2018 with remaining amortization periods of two to 11 years.
Fair Value Measurements
Investments
Investment Funds.
Investments classified as trading consist of amounts held in the
Nuclear Decommissioning Trust ("NDT")
,
Asset Retirement Trust ("ART")
, SERP, and
Deferred Compensation Plan ("DCP")
. These assets are generally measured at fair value based on quoted market prices or other observable market data such as interest rate indices. These investments are primarily U.S. and international equities, real estate investment trusts, fixed income investments, high-yield fixed income investments, U.S. Treasury Inflation-Protected Securities, commodities, currencies, derivative instruments, and other investments. TVA has classified all of these trading securities as either Level 1, Level 2, or Investments measured at net asset value. See
Note 16
—
Valuation Techniques
for a discussion of valuation levels of the investments.
Plan Investments.
TVA’s qualified benefit pension plan is funded with qualified plan assets. These investments are primarily global public equities, private equities, fixed income securities, public real assets, and private real assets. See
Note 20
—
Fair Value Measurements
for disclosure of fair value measurements for investments held by TVARS that support TVA’s qualified defined benefit pension plan.
Pricing.
Prices provided by third-parties for the assets in investment funds and plan investments are subjected to automated tolerance checks by the investment portfolio trustee to identify and avoid, where possible, the use of inaccurate prices. Any such prices identified as outside the tolerance thresholds are reported to the vendor that provided the price. If the prices are validated, the primary pricing source is used. If not, a secondary source price that has passed the applicable tolerance check is used (or queried with the vendor if it is out of tolerance), resulting in either the use of a secondary price, where validated, or the last reported default price, as in the case of a missing price. For monthly valued accounts, where secondary price sources are available, an automated inter-source tolerance report identifies prices with an inter-vendor pricing variance of over two percent at an asset class level. For daily valued accounts, each security is assigned, where possible, an indicative major market index, against which daily price movements are automatically compared. Tolerance thresholds are established by asset class. Prices found to be outside of the applicable tolerance threshold are reported and queried with vendors as described above.
For investment funds, TVA additionally performs its own analytical testing on the change in fair value measurements each period to ensure the valuations are reasonable based on changes in general market assumptions. TVA also performs pricing tests on various portfolios comprised of securities classified in Levels 1 and 2 on a quarterly basis to confirm accuracy of the values received from the investment portfolio trustee. For plan investments, TVARS reviews the trustee's Service Organization Controls report and the pricing policies of the trustee's largest pricing vendor.
Derivatives
TVA has historically entered into various derivative transactions, including commodity option contracts, forward contracts, swaps, swaptions, futures, and options on futures, to manage various market risks. Other than certain derivative instruments included in investment funds, it is TVA's policy to enter into these derivative transactions solely for hedging purposes and not for speculative purposes.
Currency and Interest Rate Derivatives.
TVA has three currency swaps and four “fixed for floating” interest rate swaps. The currency swaps protect against changes in cash flows caused by volatility in exchange rates related to outstanding Bonds denominated in British pounds sterling. The currency and interest rate swaps are classified as Level 2 valuations as the rate curves and interest rates affecting the fair value of the contracts are based on observable data. The application of
credit valuation adjustments ("CVAs")
did not materially affect the fair value of these assets and liabilities at
September 30, 2018
.
75
Commodity Contracts
. TVA enters into commodity derivatives for coal and natural gas that require physical delivery of the contracted quantity of the commodity. The fair values of these derivative contracts are determined using internal models based on income approaches. TVA develops an overall coal forecast based on widely-used short-term and mid-range market data from an external pricing specialist in addition to long-term internal estimates. To value the volume option component of applicable coal contracts, TVA uses a Black-Scholes pricing model which includes inputs from the overall coal price forecast, contract-specific terms, and other market inputs. Based on the use of certain significant unobservable inputs, these valuations are classified as Level 3 valuations. Additionally, any settlement fees related to early termination of coal supply contracts are included at the contractual amount. The application of CVAs did not materially affect the fair value of these assets and liabilities at
September 30, 2018
.
TVA maintains policies and procedures to value commodity contracts using what is believed to be the best and most relevant data available. In addition, TVA’s risk management group reviews valuations and pricing data. TVA retains independent pricing vendors to assist in valuing certain instruments without market liquidity.
Commodity Derivatives under the Financial Trading Program.
TVA established a
Financial Trading Program ("FTP")
under which it could purchase and sell futures, swaps, options, and similar derivative instruments to hedge its exposure to changes in prices of natural gas, fuel oil, coal, and other commodities. TVA has suspended its FTP and no longer uses financial instruments to hedge risks related to commodity prices; however, TVA plans to continue to manage fuel price volatility through other methods and to periodically reevaluate its suspended FTP program for future use of financial instruments.
Fair Value Considerations
In determining the fair value of its financial instruments, TVA considers the source of observable market data inputs, liquidity of the instrument, credit risk, and risk of nonperformance of itself or the counterparty to the contract. The conditions and criteria used to assess these factors are described below.
Sources of Market Assumptions.
TVA derives its financial instrument market assumptions from market data sources (
e.g.
, CME and
Moody's Investors Service, Inc. ("Moody's")
). In some cases, where market data is not readily available, TVA uses comparable market sources and empirical evidence to derive market assumptions and determine a financial instrument's fair value.
Market Liquidity.
Market liquidity is assessed by TVA based on criteria as to whether the financial instrument trades in an active or inactive market. A financial instrument is considered to be in an active market if the prices are fully transparent to the market participants, the prices can be measured by market bid and ask quotes, the market has a relatively high trading volume, and the market has a significant number of market participants that will allow the market to rapidly absorb the quantity of the assets traded without significantly affecting the market price. Other factors TVA considers when determining whether a market is active or inactive include the presence of government or regulatory control over pricing that could make it difficult to establish a market-based price upon entering into a transaction.
Nonperformance Risk.
In determining the potential impact of nonperformance risk, which includes credit risk, TVA considers changes in current market conditions, readily available information on nonperformance risk, letters of credit, collateral, other arrangements available, and the nature of master netting arrangements. TVA is a counterparty to derivative instruments that subject TVA to nonperformance risk. Nonperformance risk on the majority of investments and certain exchange-traded instruments held by TVA is incorporated into the exit price that is derived from quoted market data that is used to value the investment.
Nonperformance risk for most of TVA’s derivative instruments is an adjustment to the initial asset/liability fair value. TVA adjusts for nonperformance risk, both of TVA (for liabilities) and the counterparty (for assets), by applying a CVA. TVA determines an appropriate CVA for each applicable financial instrument based on the term of the instrument and TVA’s or the counterparty’s credit rating as obtained from Moody’s. For companies that do not have an observable credit rating, TVA uses internal analysis to assign a comparable rating to the company. TVA discounts each financial instrument using the historical default rate
(as reported by Moody’s for CY 1983 to CY 2017)
for companies with a similar credit rating over a time period consistent with the remaining term of the contract.
All derivative instruments are analyzed individually and are subject to unique risk exposures. The application of CVAs resulted in a less than
$1 million
decrease in the fair value of assets and a $
1 million
decrease in the fair value of liabilities at
September 30, 2018
.
Collateral
.
TVA’s interest rate swaps and currency swaps contain contract provisions that require a party to post collateral (in a form such as cash or a letter of credit) when the party’s liability balance under the agreement exceeds a certain threshold. See
Note 15
—
Other Derivative Instruments
—
Collateral
for a discussion of collateral related to TVA’s derivative liabilities.
76
New Accounting Standards and Interpretations
See
Note 2
for a discussion of recent accounting standards and pronouncements which were issued by the
Financial Accounting Standards Board ("FASB")
, became effective for TVA, or were adopted by TVA during the presented periods.
Legislative and Regulatory Matters
TVA continues to monitor how regulatory agencies are interpreting and implementing the provisions of the Dodd-Frank Wall Street Reform and Consumer Protection Act, which was enacted in July 2010. As a result, TVA has become subject to recordkeeping, reporting, and reconciliation requirements related to its derivative transactions. In addition, depending on how regulatory agencies interpret and implement the provisions, TVA’s hedging costs may increase, and TVA may have to post additional collateral and margin in connection with its derivative transactions.
For a discussion of environmental legislation and regulation, see Item 1, Business —
Environmental Matters.
TVA does not engage, and does not control any entity that is engaged, in any activity listed under Section 13(r) of
the Securities Exchange Act of 1934 (the "Exchange Act")
, which requires certain issuers to disclose certain activities relating to Iran involving the issuer and its affiliates. Based on information supplied by each such person, none of TVA's directors and executive officers are involved in any such activities. While TVA is an agency and instrumentality of the U.S., TVA does not believe its disclosure obligations, if any, under Section 13(r) extend to the activities of any other departments, divisions, or agencies of the U.S.
Environmental Matters
See Item 1, Business —
Environmental Matters,
which discussion is incorporated by reference into this Item 7, Management’s Discussion and Analysis of Financial Condition and Results of Operations.
Legal Proceedings
From time to time, TVA is a party to or otherwise involved in Legal Proceedings that have arisen in the ordinary course of conducting its activities, as a result of catastrophic events or otherwise. As of
September 30, 2018
, TVA had accrued approximately $
18 million
with respect to Legal Proceedings. No assurance can be given that TVA will not be subject to significant additional claims and liabilities. If actual liabilities significantly exceed the estimates made, TVA's results of operations, liquidity, and financial condition could be materially adversely affected.
For a discussion of certain current material Legal Proceedings, see
Note 8
and
Note 21
—
Legal Proceedings
, which discussions are incorporated into this Item 7, Management's Discussion and Analysis of Financial Condition and Results of Operations
.
Risk Management Activities
TVA is exposed to various market risks. These market risks include risks related to commodity prices, investment prices, interest rates, currency exchange rates, inflation, and counterparty credit and performance risk. To help manage certain of these risks, TVA has entered into various derivative transactions, including commodity option contracts, forward contracts, swaps, swaptions, futures, and options on futures. Other than certain derivative instruments in its trust investment funds, it is TVA’s policy to enter into these derivative transactions solely for hedging purposes and not for speculative purposes. See
Note 15
.
Risk Governance
The Enterprise Risk Council ("ERC") is responsible for the highest level of risk oversight at TVA and is also responsible for communicating enterprise-wide risks with policy implications to the TVA Board or a designated TVA Board committee. The ERC is comprised of the Executive Management Committee ("EMC") and the Chief Risk Officer ("CRO") who acts as Chair. ERC members may invite additional attendees to meetings as non-voting participants. The ERC has also established subordinate committees, consisting of business unit leaders to assist in the oversight of fuel and power procurement, DER programs and products, and general risk management.
TVA has a designated
Enterprise Risk Management ("ERM")
organization within its Financial Services organization responsible for (1) establishing enterprise risk management policies and guidelines, (2) developing an enterprise risk profile aligned with TVA's strategic objectives, (3) performing annual risk assessments across all TVA business units, (4) monitoring and reporting on identified enterprise risks and emerging risks, (5) facilitating enterprise risk discussions with the risk subject matter experts across the organization and at the ERC and TVA Board levels, and (6) developing and improving TVA's risk awareness culture. TVA has cataloged major short-term and long-term enterprise level risks across the organization. A discussion of significant risks is presented in Item 1A, Risk Factors.
77
Commodity Price Risk
TVA is exposed to effects of market fluctuations in the price of commodities that are critical to its operations, including electricity, coal, and natural gas. The magnitude of exposure to these risks is influenced by many factors including contract terms and market liquidity. TVA’s commodity price risk is substantially mitigated by its cost-based rates, including its total fuel cost adjustment, and long-term fixed price commodity contracts.
TVA manages risk with commodity contract derivatives for both coal and natural gas that require physical delivery of the contracted quantity. A hypothetical 10 percent decline in the market price of coal on
September 30, 2018
and
2017
, would have resulted in decreases of approximately $63 million and $36 million, respectively, in the fair value of TVA’s coal derivative instruments at these dates. A hypothetical 10 percent decline in the market price of natural gas on
September 30, 2018
and
2017
, would have resulted in decreases of approximately $102 million and $84 million, respectively, in the fair value of TVA’s natural gas derivative instruments at these dates.
Investment Price Risk
TVA’s investment price risk relates primarily to investments in TVA’s NDT, ART, pension fund, SERP, and DCP.
Nuclear Decommissioning Trust.
The NDT is generally designed to achieve a return in line with overall equity and debt market performance. The assets of the trust are invested in debt and equity securities, private partnerships, and certain derivative instruments including forwards, futures, options, and swaps, and through these investments the trust has exposure to U.S. equities, international equities, real estate investment trusts, high-yield debt, domestic debt, U.S.
Treasury Inflation-Protected Securities ("TIPS")
, commodities, and private real estate, private equity, and absolute return strategies. At
September 30, 2018
and
2017
, an immediate 10 percent decrease in the price of the investments in the trust would have reduced the value of the trust by $205 million and $188 million, respectively.
Asset Retirement Trust.
The ART is presently invested to achieve a return in line with equity and debt market performance. The assets of the trust are invested in debt and equity securities and private partnerships, and through these investments the trust has exposure to domestic debt and equities, international equities, and private real estate. At
September 30, 2018
and
2017
, an immediate 10 percent decrease in the price of the investments in the trust would have reduced the value of the trust by $71 million and $63 million, respectively.
Qualified Pension Plan
. The TVARS asset allocation policy for qualified pension plan assets has targets of
43 percent
equity including global public and private equity investments,
32 percent
fixed income securities, and
25 percent
real assets including public and private real asset investments. TVARS has a long-term investment plan that contains a dynamic de-risking strategy which will allocate investments to assets that better match the liability, such as long duration fixed income securities, over time as improved funding status targets are met. Pursuant to the TVARS Rules and Regulations, any proposed changes in asset allocation that would change the system’s assumed rate of investment return are subject to TVA’s review and veto.
As set forth above, the qualified pension plan assets are invested across global public equity, private equity, safety oriented fixed income, opportunistic fixed income, public real assets, and private real assets. The TVARS asset allocation policy includes permissible deviations from these target allocations, and action can be taken, as appropriate, to rebalance the plan’s assets consistent with the asset allocation policy. At
September 30, 2018
and
2017
, an immediate 10 percent decrease in the value of the net assets of the fund would have reduced the value of the fund by approximately $800 million and $799 million, respectively.
Supplemental Executive Retirement Plan
. The SERP is a non-qualified defined benefit pension plan similar to those typically found in other companies in TVA's peer group and is provided to selected employees of TVA. TVA's SERP was created to recruit and retain key executives. The plan is designed to provide a competitive level of retirement benefits in excess of the limitations on contributions and benefits imposed by TVA's qualified defined benefit plan and Internal Revenue Code Section 415 limits on qualified retirement plans. The SERP currently targets an asset allocation policy for its plan assets of 65 percent equity securities, which includes U.S. and non-U.S. equities, and 35 percent fixed income securities. The SERP plan assets are presently invested to achieve a return in line with overall equity and debt market performance. At
September 30, 2018
and
2017
, an immediate 10 percent decrease in the value of the SERP investments would have reduced the value of the investments by $7 million and $6 million, respectively.
Deferred Compensation Plan.
The DCP is designed to provide participants with the ability to defer compensation until employment with TVA ends. The plan assists in the recruitment of top executive talent for TVA. As in other corporations, deferred compensation can be an integral part of a total compensation package. Assets currently include deferral balances. The default return on investment of the accounts is interest calculated based on the composite rate of all marketable U.S. Treasury issues. Executives may alternatively choose to have their balances adjusted based on the return of certain mutual funds. At both
September 30, 2018
and
2017
, an immediate 10 percent decrease in the value of the deferred compensation accounts would have reduced the value of the accounts by $3 million.
78
Interest Rate Risk
TVA’s interest rate risk is related primarily to its short-term investments, short-term debt, long-term debt, and interest rate derivatives.
Investments.
At
September 30, 2018
, TVA had
$299 million
of cash and cash equivalents, and the average balance of cash and cash equivalents for
2018
was $348 million. The average interest rate that TVA received on its short-term investments during
2018
was 1.60 percent. If the rates of interest that TVA received on its short-term investments during
2018
were 0.60 percent, TVA would have received approximately $3 million less in interest from its short-term investments. At
September 30, 2017
, TVA had $300 million of cash and cash equivalents, and the average balance of cash and cash equivalents for
2017
was $336 million. The average interest rate that TVA received on its short-term investments during
2017
was less than one percent. If the rates that TVA received on its short-term investments during
2017
were zero percent, TVA would have received approximately $2 million less in interest from its short-term investments. In addition to affecting the amount of interest that TVA receives from its short-term investments, changes in interest rates could affect the value of the investments in its pension plan, ART, NDT, SERP, and DCP. See
Risk Management Activities — Investment Price Risk
above.
Short-Term Debt
. At
September 30, 2018
, TVA’s short-term borrowings were $
1.2 billion
, and the current maturities of long-term debt were
$1.1 billion
. Based on TVA’s interest rate exposure at
September 30, 2018
, an immediate one percentage point increase in interest rates would have resulted in an increase of $23 million in TVA’s short-term interest expense. At
September 30, 2017
, TVA’s short-term borrowings were $2.0 billion, and the current maturities of long-term debt were $1.8 billion. Based on TVA’s interest rate exposure at
September 30, 2017
, an immediate one percentage point increase in interest rates would have resulted in an increase of $38 million in TVA’s short-term interest expense.
Long-Term Debt.
At
September 30, 2018
and
2017
, the interest rates on all of TVA’s outstanding long-term debt were fixed (or subject only to downward adjustment under certain conditions). Accordingly, an immediate one percentage point increase in interest rates would not have affected TVA’s interest expense associated with its long-term debt. When TVA’s long-term debt matures or is redeemed, however, TVA typically refinances debt in whole or in part by issuing additional debt. Accordingly, if interest rates are high when TVA issues this additional debt, TVA’s cash flows, results of operations, and financial condition may be adversely affected. This risk is somewhat mitigated by the fact that TVA’s debt portfolio is diversified in terms of maturities and has a long average life. At
September 30, 2018
and
2017
, the average life of TVA’s debt portfolio was
16.3
years and 16.6 years, respectively. A schedule of TVA’s debt maturities is contained in
Note 13
—
Debt Outstanding
.
Interest Rate Derivatives.
Changes in interest rates also affect the mark-to-market valuation of TVA’s interest rate derivatives. See
Note 15
—
Derivatives Not Receiving Hedge Accounting Treatment
—
Interest Rate Derivatives
. TVA had four interest rate swaps outstanding at
September 30, 2018
and
September 30, 2017
. Net unrealized gains and losses on these instruments are reflected on TVA’s consolidated balance sheets in a regulatory asset account, and realized gains and losses are reflected in earnings. Based on TVA’s interest rate exposure at
September 30, 2018
and 2017, an immediate one-half percentage point decrease in interest rates would have increased the interest rate swap liabilities by $196 million and $233 million, respectively.
Currency Exchange Rate Risk
Over the next several years, TVA plans to spend a significant amount of capital on clean air projects, capacity expansion, and other projects. A portion of this amount may be spent on contracts that are denominated in one or more foreign currencies. Additionally, TVA’s three issues of Bonds denominated in British pounds sterling are hedged by currency swap agreements. The value of the U.S. dollar compared with other currencies has fluctuated widely in recent years, including fluctuations in the U.S. dollar to British pound sterling exchange rate primarily driven by the “BREXIT” vote for the United Kingdom to leave the European Union. If not effectively managed, foreign currency exposure could negatively impact TVA's counterparty risk, cash flows, results of operations, and financial condition.
Quantitative and qualitative disclosures about market risk are reported in Item 7, Management's Discussion and Analysis of Financial Condition and Results of Operations
— Risk Management Activities
, which discussion is incorporated by reference into this Item 7A, Quantitative and Qualitative Disclosures About Market Risk.
79
TENNESSEE VALLEY AUTHORITY
At September 30
(in millions)
|
ASSETS
|
|||||||
|
|
2018
|
|
2017
|
||||
|
Current assets
|
|
|
|||||
|
Cash and cash equivalents
|
$
|
299
|
|
$
|
300
|
|
|
|
Restricted cash and cash equivalents
|
13
|
|
—
|
|
|||
|
Accounts receivable, net
|
1,657
|
|
1,569
|
|
|||
|
Inventories, net
|
961
|
|
1,065
|
|
|||
|
Regulatory assets
|
414
|
|
447
|
|
|||
|
Other current assets
|
86
|
|
65
|
|
|||
|
Total current assets
|
3,430
|
|
3,446
|
|
|||
|
Property, plant, and equipment
|
|
|
|
|
|||
|
Completed plant
|
61,114
|
|
58,947
|
|
|||
|
Less accumulated depreciation
|
(29,335
|
)
|
(28,404
|
)
|
|||
|
Net completed plant
|
31,779
|
|
30,543
|
|
|||
|
Construction in progress
|
1,999
|
|
2,842
|
|
|||
|
Nuclear fuel
|
1,487
|
|
1,401
|
|
|||
|
Capital leases
|
149
|
|
161
|
|
|||
|
Total property, plant, and equipment, net
|
35,414
|
|
34,947
|
|
|||
|
Investment funds
|
2,862
|
|
2,603
|
|
|||
|
Regulatory and other long-term assets
|
|
|
|
|
|||
|
Regulatory assets
|
6,612
|
|
8,698
|
|
|||
|
Other long-term assets
|
349
|
|
323
|
|
|||
|
Total regulatory and other long-term assets
|
6,961
|
|
9,021
|
|
|||
|
Total assets
|
$
|
48,667
|
|
$
|
50,017
|
|
|
|
The accompanying notes are an integral part of these consolidated financial statements.
|
|||||||
80
TENNESSEE VALLEY AUTHORITY
CONSOLIDATED BALANCE SHEETS
At September 30
(in millions)
|
LIABILITIES AND PROPRIETARY CAPITAL
|
|||||||
|
2018
|
2017
|
||||||
|
Current liabilities
|
|
||||||
|
Accounts payable and accrued liabilities
|
$
|
1,982
|
|
$
|
1,940
|
|
|
|
Accrued interest
|
305
|
|
346
|
|
|||
|
Current portion of leaseback obligations
|
38
|
|
37
|
|
|||
|
Current portion of energy prepayment obligations
|
10
|
|
100
|
|
|||
|
Regulatory liabilities
|
187
|
|
163
|
|
|||
|
Short-term debt, net
|
1,216
|
|
1,998
|
|
|||
|
Current maturities of power bonds
|
1,032
|
|
1,728
|
|
|||
|
Current maturities of long-term debt of variable interest entities
|
38
|
|
36
|
|
|||
|
Current maturities of notes payable
|
46
|
|
53
|
|
|||
|
Total current liabilities
|
4,854
|
|
6,401
|
|
|||
|
Other liabilities
|
|
|
|||||
|
Post-retirement and post-employment benefit obligations
|
4,476
|
|
5,477
|
|
|||
|
Asset retirement obligations
|
4,665
|
|
4,176
|
|
|||
|
Other long-term liabilities
|
2,715
|
|
3,055
|
|
|||
|
Leaseback obligations
|
263
|
|
302
|
|
|||
|
Energy prepayment obligations
|
—
|
|
10
|
|
|||
|
Regulatory liabilities
|
104
|
|
25
|
|
|||
|
Total other liabilities
|
12,223
|
|
13,045
|
|
|||
|
Long-term debt, net
|
|||||||
|
Long-term power bonds, net
|
20,157
|
|
20,205
|
|
|||
|
Long-term debt of variable interest entities, net
|
1,127
|
|
1,164
|
|
|||
|
Long-term notes payable
|
23
|
|
69
|
|
|||
|
Total long-term debt, net
|
21,307
|
|
21,438
|
|
|||
|
Total liabilities
|
38,384
|
|
40,884
|
|
|||
|
Commitments and contingencies (Note 21)
|
|
|
|||||
|
Proprietary capital
|
|
|
|||||
|
Power program appropriation investment
|
258
|
|
258
|
|
|||
|
Power program retained earnings
|
9,404
|
|
8,282
|
|
|||
|
Total power program proprietary capital
|
9,662
|
|
8,540
|
|
|||
|
Nonpower programs appropriation investment, net
|
564
|
|
572
|
|
|||
|
Accumulated other comprehensive income (loss)
|
57
|
|
21
|
|
|||
|
Total proprietary capital
|
10,283
|
|
9,133
|
|
|||
|
Total liabilities and proprietary capital
|
$
|
48,667
|
|
$
|
50,017
|
|
|
|
The accompanying notes are an integral part of these consolidated financial statements.
|
|||||||
81
TENNESSEE VALLEY AUTHORITY
For the years ended September 30
(in millions)
|
|
2018
|
2017
|
2016
|
||||||||
|
Operating revenues
|
|
|
|||||||||
|
Revenue from sales of electricity
|
$
|
11,075
|
|
$
|
10,586
|
|
$
|
10,461
|
|
||
|
Other revenue
|
158
|
|
153
|
|
155
|
|
|||||
|
Total operating revenues
|
11,233
|
|
10,739
|
|
10,616
|
|
|||||
|
Operating expenses
|
|
|
|
|
|||||||
|
Fuel
|
2,049
|
|
2,169
|
|
2,126
|
|
|||||
|
Purchased power
|
973
|
|
991
|
|
964
|
|
|||||
|
Operating and maintenance
|
2,854
|
|
3,362
|
|
2,842
|
|
|||||
|
Depreciation and amortization
|
2,527
|
|
1,717
|
|
1,836
|
|
|||||
|
Tax equivalents
|
518
|
|
525
|
|
522
|
|
|||||
|
Total operating expenses
|
8,921
|
|
8,764
|
|
8,290
|
|
|||||
|
Operating income
|
2,312
|
|
1,975
|
|
2,326
|
|
|||||
|
Other income (expense), net
|
50
|
|
56
|
|
43
|
|
|||||
|
Interest expense
|
|
|
|
|
|||||||
|
Interest expense
|
1,243
|
|
1,346
|
|
1,371
|
|
|||||
|
Allowance for funds used during construction
|
—
|
|
—
|
|
(235
|
)
|
|||||
|
Net interest expense
|
1,243
|
|
1,346
|
|
1,136
|
|
|||||
|
Net income (loss)
|
$
|
1,119
|
|
$
|
685
|
|
$
|
1,233
|
|
||
|
|
|||||||||||
TENNESSEE VALLEY AUTHORITY
CONSOLIDATED STATEMENTS OF COMPREHENSIVE INCOME (LOSS)
For the years ended September 30
(in millions)
|
|
2018
|
2017
|
2016
|
||||||||
|
Net income (loss)
|
$
|
1,119
|
|
$
|
685
|
|
$
|
1,233
|
|
||
|
Other comprehensive income (loss)
|
|||||||||||
|
Net unrealized gain (loss) on cash flow hedges
|
10
|
|
59
|
|
(139
|
)
|
|||||
|
Reclassification to earnings from cash flow hedges
|
26
|
|
(26
|
)
|
129
|
|
|||||
|
Total other comprehensive income (loss)
|
$
|
36
|
|
$
|
33
|
|
$
|
(10
|
)
|
||
|
Total comprehensive income (loss)
|
$
|
1,155
|
|
$
|
718
|
|
$
|
1,223
|
|
||
|
The accompanying notes are an integral part of these consolidated financial statements.
|
|||||||||||
82
TENNESSEE VALLEY AUTHORITY
For the years ended
September 30
(in millions)
|
|
2018
|
2017
|
2016
|
||||||||
|
Cash flows from operating activities
|
|
|
|
||||||||
|
Net income (loss)
|
$
|
1,119
|
|
$
|
685
|
|
$
|
1,233
|
|
||
|
Adjustments to reconcile net income (loss) to net cash provided by operating activities
|
|
|
|
|
|
|
|||||
|
Depreciation and amortization (including amortization of debt issuance costs and premiums/discounts)
|
2,554
|
|
1,763
|
|
1,882
|
|
|||||
|
Amortization of nuclear fuel cost
|
382
|
|
341
|
|
287
|
|
|||||
|
Non-cash retirement benefit expense
|
324
|
|
837
|
|
327
|
|
|||||
|
Prepayment credits applied to revenue
|
(100
|
)
|
(100
|
)
|
(100
|
)
|
|||||
|
Fuel cost adjustment deferral
|
(30
|
)
|
98
|
|
(83
|
)
|
|||||
|
Fuel cost tax equivalents
|
(7
|
)
|
5
|
|
(16
|
)
|
|||||
|
Changes in current assets and liabilities
|
|
|
|
|
|||||||
|
Accounts receivable, net
|
(68
|
)
|
230
|
|
(83
|
)
|
|||||
|
Inventories and other current assets, net
|
65
|
|
1
|
|
50
|
|
|||||
|
Accounts payable and accrued liabilities
|
134
|
|
(119
|
)
|
(4
|
)
|
|||||
|
Accrued interest
|
(36
|
)
|
(17
|
)
|
(3
|
)
|
|||||
|
Regulatory asset costs
|
(13
|
)
|
(50
|
)
|
(31
|
)
|
|||||
|
Pension contributions
|
(304
|
)
|
(805
|
)
|
(281
|
)
|
|||||
|
Settlements of asset retirement obligations
|
(106
|
)
|
(123
|
)
|
(139
|
)
|
|||||
|
Other, net
|
41
|
|
(10
|
)
|
3
|
|
|||||
|
Net cash provided by operating activities
|
3,955
|
|
2,736
|
|
3,042
|
|
|||||
|
Cash flows from investing activities
|
|
|
|
|
|
|
|||||
|
Construction expenditures
|
(1,759
|
)
|
(2,153
|
)
|
(2,710
|
)
|
|||||
|
Nuclear fuel expenditures
|
(457
|
)
|
(305
|
)
|
(300
|
)
|
|||||
|
Purchases of investments
|
(49
|
)
|
(49
|
)
|
(50
|
)
|
|||||
|
Loans and other receivables
|
|
|
|
|
|||||||
|
Advances
|
(12
|
)
|
(11
|
)
|
(10
|
)
|
|||||
|
Repayments
|
4
|
|
8
|
|
7
|
|
|||||
|
Other, net
|
4
|
|
(26
|
)
|
(50
|
)
|
|||||
|
Net cash used in investing activities
|
(2,269
|
)
|
(2,536
|
)
|
(3,113
|
)
|
|||||
|
Cash flows from financing activities
|
|
|
|
|
|
|
|||||
|
Long-term debt
|
|
|
|
|
|
|
|||||
|
Issues of power bonds
|
998
|
|
999
|
|
—
|
|
|||||
|
Redemptions and repurchases of power bonds
|
(1,731
|
)
|
(1,558
|
)
|
(76
|
)
|
|||||
|
Payments on debt of variable interest entities
|
(36
|
)
|
(35
|
)
|
(33
|
)
|
|||||
|
Redemptions of notes payable
|
(53
|
)
|
(27
|
)
|
—
|
|
|||||
|
Short-term debt issues (redemptions), net
|
(811
|
)
|
583
|
|
370
|
|
|||||
|
Payments on leases and leasebacks
|
(42
|
)
|
(136
|
)
|
(159
|
)
|
|||||
|
Financing costs, net
|
(3
|
)
|
(4
|
)
|
—
|
|
|||||
|
Payments to U.S. Treasury
|
(5
|
)
|
(5
|
)
|
(6
|
)
|
|||||
|
Other, net
|
(4
|
)
|
(17
|
)
|
(25
|
)
|
|||||
|
Net cash (used in) provided by financing activities
|
(1,687
|
)
|
(200
|
)
|
71
|
|
|||||
|
Net change in cash and cash equivalents
|
(1
|
)
|
—
|
|
—
|
|
|||||
|
Cash and cash equivalents at beginning of year
|
300
|
|
300
|
|
300
|
|
|||||
|
Cash and cash equivalents at end of year
|
$
|
299
|
|
$
|
300
|
|
$
|
300
|
|
||
|
The accompanying notes are an integral part of these consolidated financial statements.
|
|||||||||||
83
TENNESSEE VALLEY AUTHORITY
CONSOLIDATED STATEMENTS OF CHANGES IN PROPRIETARY CAPITAL
For the years ended September 30
(in millions)
|
|
Power Program Appropriation Investment
|
Power Program Retained Earnings
|
Nonpower Programs Appropriation Investment, Net
|
Accumulated Other Comprehensive Income (Loss) from Net Gains (Losses) on Cash Flow Hedges
|
Total
|
||||||||||||||
|
Balance at September 30, 2015
|
$
|
258
|
|
$
|
6,357
|
|
$
|
590
|
|
$
|
(2
|
)
|
$
|
7,203
|
|
||||
|
Net income (loss)
|
—
|
|
1,243
|
|
(10
|
)
|
—
|
|
1,233
|
|
|||||||||
|
Total other comprehensive income (loss)
|
—
|
|
—
|
|
—
|
|
(10
|
)
|
(10
|
)
|
|||||||||
|
Return on power program appropriation investment
|
—
|
|
(6
|
)
|
—
|
|
—
|
|
(6
|
)
|
|||||||||
|
Balance at September 30, 2016
|
$
|
258
|
|
$
|
7,594
|
|
$
|
580
|
|
$
|
(12
|
)
|
$
|
8,420
|
|
||||
|
Net income (loss)
|
—
|
|
693
|
|
(8
|
)
|
—
|
|
685
|
|
|||||||||
|
Total other comprehensive income (loss)
|
—
|
|
—
|
|
—
|
|
33
|
|
33
|
|
|||||||||
|
Return on power program appropriation investment
|
—
|
|
(5
|
)
|
—
|
|
—
|
|
(5
|
)
|
|||||||||
|
Balance at September 30, 2017
|
$
|
258
|
|
$
|
8,282
|
|
$
|
572
|
|
$
|
21
|
|
$
|
9,133
|
|
||||
|
Net income (loss)
|
—
|
|
1,127
|
|
(8
|
)
|
—
|
|
1,119
|
|
|||||||||
|
Total other comprehensive income (loss)
|
—
|
|
—
|
|
—
|
|
36
|
|
36
|
|
|||||||||
|
Return on power program appropriation investment
|
—
|
|
(5
|
)
|
—
|
|
—
|
|
(5
|
)
|
|||||||||
|
Balance at September 30, 2018
|
$
|
258
|
|
$
|
9,404
|
|
$
|
564
|
|
$
|
57
|
|
$
|
10,283
|
|
||||
|
The accompanying notes are an integral part of these consolidated financial statements.
|
|||||||||||||||||||
84
NOTES TO CONSOLIDATED FINANCIAL STATEMENTS
(Dollars in millions except where noted)
|
Note
|
Page No.
|
||
|
1
|
Summary of Significant Accounting Policies
|
||
|
2
|
Impact of New Accounting Standards and Interpretations
|
||
|
3
|
Accounts Receivable, Net
|
||
|
4
|
Inventories, Net
|
||
|
5
|
Net Completed Plant
|
||
|
6
|
Other Long-Term Assets
|
||
|
7
|
Regulatory Assets and Liabilities
|
||
|
8
|
Gallatin Coal Combustion Residual Facilities
|
||
|
9
|
Asset Acquisitions
|
||
|
10
|
Variable Interest Entities
|
||
|
11
|
Other Long-Term Liabilities
|
||
|
12
|
Asset Retirement Obligations
|
||
|
13
|
Debt
and Other Obligations
|
||
|
14
|
Accumulated Other Comprehensive Income (Loss)
|
||
|
15
|
Risk Management Activities and Derivative Transactions
|
||
|
16
|
Fair Value Measurements
|
||
|
17
|
Proprietary Capital
|
||
|
18
|
Other Income (Expense), Net
|
||
|
19
|
Supplemental Cash Flow Information
|
||
|
20
|
Benefit Plans
|
||
|
21
|
Commitments and Contingencies
|
||
|
22
|
Related Parties
|
||
|
23
|
Unaudited Quarterly Financial Information
|
||
1
.
Summary of Significant Accounting Policies
General
The
Tennessee Valley Authority ("TVA")
is a corporate agency and instrumentality of the
United States ("U.S.")
that was created in 1933 by federal legislation in response to a proposal by President Franklin D. Roosevelt. TVA was created to, among other things, improve navigation on the Tennessee River, reduce the damage from destructive flood waters within the Tennessee River system and downstream on the lower Ohio and Mississippi Rivers, further the economic development of TVA's service area in the southeastern U.S., and sell the electricity generated at the facilities TVA operates.
Today, TVA operates the nation's largest public power system and supplies power in most of Tennessee, northern Alabama, northeastern Mississippi, and southwestern Kentucky and in portions of northern Georgia, western North Carolina, and southwestern Virginia to a population of nearly
10
million people.
TVA also manages the Tennessee River, its tributaries, and certain shorelines to provide, among other things, year-round navigation, flood damage reduction, and affordable and reliable electricity. Consistent with these primary purposes, TVA also manages the river system and public lands to provide recreational opportunities, adequate water supply, improved water quality, cultural and natural resource protection, and economic development.
The power program has historically been separate and distinct from the stewardship programs. It is required to be self-supporting from power revenues and proceeds from power financings, such as proceeds from the issuance of
bonds, notes, or other evidences of indebtedness ("collectively, Bonds")
. Although TVA does not currently receive congressional appropriations, it is required to make annual
payments to the United States Department of the Treasury ("U.S. Treasury") as a return on the government's appropriation investment in TVA's power facilities (the "Power Program Appropriation Investment")
. In the 1998 Energy and Water Development Appropriations Act, Congress directed TVA to fund essential stewardship activities related to its management of the Tennessee River system and nonpower or stewardship properties with power revenues in the event that there were insufficient appropriations or other available funds to pay for such activities in any fiscal year. Congress has not provided any appropriations to TVA to fund such activities since 1999. Consequently, during 2000, TVA began paying for essential stewardship activities primarily with power revenues, with the remainder funded with user fees and other forms of
85
revenues derived in connection with those activities. The activities related to stewardship properties do not meet the criteria of an operating segment under
accounting principles generally accepted in the United States of America ("GAAP")
. Accordingly, these assets and properties are included as part of the power program, TVA's only operating segment.
Power rates are established by the
TVA Board of Directors (the "TVA Board")
as authorized by the
Tennessee Valley Authority Act of 1933 (the "TVA Act")
. The TVA Act requires TVA to charge rates for power that will produce gross revenues sufficient to provide funds for operation, maintenance, and administration of its power system;
payments to states and counties in lieu of taxes ("tax equivalents")
; debt service on outstanding indebtedness; payments to the U.S. Treasury in repayment of and as a return on the Power Program Appropriation Investment; and such additional margin as the TVA Board may consider desirable for investment in system assets, retirement of outstanding Bonds in advance of maturity, additional reduction of the Power Program Appropriation Investment, and other purposes connected with TVA's business. TVA fulfilled its requirement to repay $1.0 billion of the Power Program Appropriation Investment with the 2014 payment and so this item is no longer a component of rate setting. In setting TVA's rates, the TVA Board is charged by the TVA Act to have due regard for the primary objectives of the TVA Act, including the objective that power shall be sold at rates as low as are feasible. Rates set by the TVA Board are not subject to review or approval by any state or other federal regulatory body.
Fiscal Year
TVA's fiscal year ends September 30. Years (
2018
,
2017
, etc.) refer to TVA's fiscal years unless they are preceded by “CY,” in which case the references are to calendar years.
Cost-Based Regulation
Since the TVA Board is authorized by the TVA Act to set rates for power sold to its customers, TVA is self-regulated. Additionally, TVA's regulated rates are designed to recover its costs. Based on current projections, TVA believes that rates, set at levels that will recover TVA's costs, can be charged and collected. As a result of these factors, TVA records certain assets and liabilities that result from the regulated ratemaking process that would not be recorded under GAAP for non-regulated entities. Regulatory assets generally represent incurred costs that have been deferred because such costs are probable of future recovery in customer rates. Regulatory liabilities generally represent obligations to make refunds to customers for previous collections for costs that are not likely to be incurred or deferral of gains that will be credited to customers in future periods. TVA assesses whether the regulatory assets are probable of future recovery by considering factors such as applicable regulatory changes, potential legislation, and changes in technology. Based on these assessments, TVA believes the existing regulatory assets are probable of recovery. This determination reflects the current regulatory and political environment and is subject to change in the future. If future recovery of regulatory assets ceases to be probable, or any of the other factors described above cease to be applicable, TVA would no longer be considered to be a regulated entity and would be required to write off these costs. All regulatory asset write offs would be required to be recognized in earnings in the period in which future recovery ceases to be probable.
Basis of Presentation
The accompanying consolidated financial statements, which have been prepared in accordance with GAAP, include the accounts of TVA, wholly-owned direct subsidiaries, and
variable interest entities ("VIE")
of which TVA is the primary beneficiary. See
Note 9
and
Note 10
. Intercompany balances and transactions have been eliminated in consolidation.
Use of Estimates
The preparation of financial statements requires TVA to estimate the effects of various matters that are inherently uncertain as of the date of the consolidated financial statements. Although the consolidated financial statements are prepared in conformity with GAAP, TVA is required to make estimates and assumptions that affect the reported amounts of assets and liabilities, the disclosure of contingent assets and liabilities, and the amounts of revenues and expenses reported during the reporting period. Each of these estimates varies in regard to the level of judgment involved and its potential impact on TVA's financial results. Estimates are considered critical either when a different estimate could have reasonably been used, or where changes in the estimate are reasonably likely to occur from period to period, and such use or change would materially impact TVA's financial condition, results of operations, or cash flows.
Cash and Cash Equivalents
Cash includes cash on hand and non-interest bearing cash and deposit accounts. All highly liquid investments with original maturities of
three months
or less are considered cash equivalents.
Restricted Cash and Cash Equivalents
Cash and cash equivalents that are restricted as to withdrawal or use under the terms of certain contractual agreements are recorded in Restricted cash and cash equivalents and Other long-term assets in the Consolidated Balance Sheet. Restricted cash and cash equivalents includes cash held in trusts that are currently restricted for TVA economic
86
development projects and for certain TVA environmental programs in accordance with agreements related to compliance with certain environmental regulations. See
Note 21
—
Commitments and Contingencies.
Allowance for Uncollectible Accounts
The allowance for uncollectible accounts reflects TVA's estimate of probable losses inherent in its accounts and loans receivable balances. TVA determines the allowance based on known accounts, historical experience, and other currently available information including events such as customer bankruptcy and/or a customer failing to fulfill payment arrangements after
90 days
. It also reflects TVA's corporate credit department's assessment of the financial condition of customers and the credit quality of the receivables.
The allowance for uncollectible accounts was less than
$1 million
at both
September 30, 2018
and
2017
, for accounts receivable. Additionally, loans receivable of
$138 million
and $
118 million
at
September 30, 2018
and
2017
, respectively, are included in Accounts receivable, net and Other long-term assets, for the current and long-term portions, respectively, and are reported net of allowances for uncollectible accounts of less than $
1 million
at both
September 30, 2018
and
2017
, respectively.
Revenues
Revenues from power sales are recorded as electricity is delivered to customers. In addition to power sales invoiced and recorded during the month, TVA accrues estimated unbilled revenues for power sales provided to
five
customers whose billing date occurs prior to the end of the month. Exchange power sales are presented in the accompanying consolidated statements of operations as a component of Sales of electricity. Exchange power sales are sales of excess power after meeting TVA native load and directly served requirements. Native load refers to the customers on whose behalf a company, by statute, franchise, regulatory requirement, or contract, has undertaken an obligation to serve.
From time to time TVA transfers fiber optic capacity on TVA’s network to telecommunications service carriers and
local power company customers of TVA ("LPCs")
. These transactions are structured as
indefeasible rights of use ("IRUs")
, which are the exclusive right to use a specified amount of fiber optic capacity for a specified term. TVA accounts for the consideration received on transfers of fiber optic capacity for cash and on all of the other elements deliverable under an IRU as revenue ratably over the term of the agreement. TVA does not recognize revenue on any contemporaneous exchanges of its fiber optic capacity for an IRU of fiber optic capacity of the counterparty to the exchange.
TVA engages in a wide array of arrangements in addition to power sales. TVA records revenue when it is realized or realizable and earned when all of the following criteria are met: persuasive evidence of an arrangement exists; delivery has occurred or services have been rendered; the price or fee is fixed or determinable; and collectability is reasonably assured. Revenues from activities related to TVA’s overall mission are recorded as other operating revenue versus those that are not related to the overall mission, which are recorded in Other income (expense), net.
Pre-Commercial Plant Operations
As part of the process of completing the construction of a generating unit, the electricity produced is used to serve the
demands of the electric system. TVA estimates revenue from such pre-commercial generation based on the guidance provided by
Federal Energy Regulatory Commission ("FERC")
regulations.
Watts Bar Nuclear Plant ("Watts Bar")
Unit 2 commenced pre-commercial plant operations in June 2016, and commercial operations began in October 2016. In addition, the Paradise Combined Cycle Plant commenced pre-commercial plant operations in October 2016, and commercial operations began in April 2017. The
Allen Combined Cycle Plant ("Allen CC")
began pre-commercial plant operations in September 2017, and began commercial operations in April 2018. Cogeneration capability at Johnsonville Combustion Turbine Unit 20 commenced pre-commercial plant operations in September 2017, and was placed in service during December 2017. Estimated revenue of
$11 million
and $
22 million
related to these projects was capitalized to offset project costs for the years ended
September 30, 2018
and
2017
, respectively. TVA also capitalized related fuel costs for these construction projects of approximately $
19 million
and $
14 million
during the years ended
September 30, 2018
and
2017
, respectively.
Inventories
Certain
Fuel, Materials, and Supplies
. Materials and supplies inventories are valued using an average unit cost method. A new average cost is computed after each inventory purchase transaction, and inventory issuances are priced at the latest moving weighted average unit cost. Coal, fuel oil, and natural gas inventories are valued using an average cost method. A new weighted average cost is computed monthly, and monthly issues are priced accordingly.
Allowance for Inventory Obsolescence
. TVA reviews material and supplies inventories by category and usage on a periodic basis. Each category is assigned a probability of becoming obsolete based on the type of material and historical usage data. In 2018, TVA started moving from a site-specific inventory management policy to a fleet-wide strategy for each generation type. Based on the estimated value of the inventory, TVA adjusts its allowance for inventory obsolescence.
87
Emission Allowances
. TVA has emission allowances for
sulfur dioxide
("SO
2
")
and
nitrogen oxide
("NO
x
") which are accounted for as inventory. The cost of specific allowances used each month is charged to operating expense based on tons of SO
2
and NO
x
emitted during the respective compliance periods. Allowances granted to TVA by the
Environmental Protection Agency ("EPA")
are recorded at
zero
cost.
Renewable Energy Credits.
TVA accounts for Renewable Energy Certificates ("RECs") using the specific identification cost method. RECs that are acquired through power purchases are recorded as inventory and charged to purchased power expense when the RECs are subsequently used or sold. TVA assigns a value to the RECs at the inception of the power purchase arrangement using a relative fair value approach. RECs created through TVA-owned asset generation are recorded at zero cost.
Property, Plant, and Equipment, and Depreciation
Property, Plant, and Equipment.
Additions to plant are recorded at cost, which includes direct and indirect costs and may include
allowance for funds used during construction ("AFUDC")
, if eligible. The cost of current repairs and minor replacements is charged to operating expense. Nuclear fuel inventories, which are included in Property, plant, and equipment, are valued using the average cost method for raw materials and the specific identification method for nuclear fuel in a reactor. Amortization of nuclear fuel in a reactor is calculated on a units-of-production basis and is included in fuel expense. When property, plant, and equipment is retired, accumulated depreciation is charged for the original cost of the assets. Gains or losses are only recognized upon the sale of land or an entire operating unit.
Depreciation.
TVA accounts for depreciation of its properties using the composite depreciation convention of accounting. Under the composite method, assets with similar economic characteristics are grouped and depreciated as one asset. Depreciation is generally computed on a straight-line basis over the estimated service lives of the various classes of assets. The estimation of asset useful lives requires management judgment, supported by external depreciation studies of historical asset retirement experience. Depreciation rates are determined based on the external depreciation studies. This study will be updated at least every five years. Depreciation expense for the years ended September 30,
2018
,
2017
, and
2016
was $
1.3 billion
, $
1.3 billion
, and $
1.4 billion
, respectively. Depreciation expense expressed as a percentage of the average annual depreciable completed plant was
2.45 percent
for
2018
,
2.49 percent
for
2017
, and
2.97 percent
for
2016
. Average depreciation rates by asset class are as follows:
|
Property, Plant, and Equipment Depreciation Rates
At September 30
(percent)
|
||||||||
|
2018
|
2017
|
2016
|
||||||
|
Asset Class
|
||||||||
|
Nuclear
|
2.64
|
|
2.66
|
|
2.37
|
|
||
|
Coal-fired
|
2.32
|
|
2.33
|
|
3.50
|
|
||
|
Hydroelectric
|
1.57
|
|
1.58
|
|
1.29
|
|
||
|
Gas and oil-fired
|
2.93
|
|
3.27
|
|
3.09
|
|
||
|
Transmission
|
1.32
|
|
1.34
|
|
2.80
|
|
||
|
Other
|
5.90
|
|
6.12
|
|
8.97
|
|
||
Coal-Fired
. In April 2011, TVA entered into two substantively similar agreements, one with the EPA and the other with Alabama, Kentucky, North Carolina, Tennessee, and three environmental advocacy groups (collectively, the "Environmental Agreements”). See
Note 21
—
Legal Proceedings
—
Environmental Agreements
. Under the Environmental Agreements, TVA committed to retire
18
coal-fired units on a phased schedule, among other things.
Since its November 2013 meeting, the TVA Board has approved the retirement of certain coal-fired units. Units subsequently retired include:
Widows Creek Fossil Plant ("Widows Creek")
Units 7 and 8 on September 30, 2015;
Colbert Fossil Plant ("Colbert")
Units 1-5 on April 16, 2016;
Paradise Fossil Plant ("Paradise")
Units 1 and 2 on April 15, 2017;
Johnsonville Fossil Plant ("Johnsonville")
Units 1-4 on December 31, 2017; and
Allen Fossil Plant ("Allen")
Units 1-3 on March 31, 2018.
As a result of TVA's decision to idle or retire units, TVA recognized
$48 million
, $
104 million
and $
139 million
in accelerated depreciation expense related to the units during the years ended
September 30, 2018
,
2017
, and
2016
, respectively. Accelerated depreciation is based on the rate in effect at the time the decision is made to idle or retire a unit.
Capital Lease Agreements.
Assets recorded under capital lease agreements are included in property, plant, and equipment. These primarily consist of a natural gas lateral pipeline, power production facilities, water treatment assets, and land of $
149 million
and $
161 million
at
September 30, 2018
and
2017
, respectively. Amortization expense related to capital leases is included in Depreciation and amortization in TVA’s statement of operations, excluding leases and other financing obligations
88
where regulatory accounting is applied. See
Note 7
—
Other Non-Current Regulatory Assets
—
Deferred Capital Leases and Other Financing Obligations.
On April 4, 2016, TVA entered into a letter agreement with Choctaw Generation Limited Partnership, LLLP (“CGLP”) for the reimbursement of certain capital costs and ongoing operating and maintenance costs related to assets recently constructed at the Red Hills lignite-fired power facility. These capital additions were required to comply with new
Mercury and Air Toxics Standards ("MATS")
. As a result of the new agreement, TVA was required to reassess a related 1997 power purchase and operating agreement (“PPOA”) with CGLP that was previously classified as an executory contract. This reassessment determined that the PPOA contained a capital lease and resulted in TVA recording a capital lease asset at the estimated fair value of $
76 million
with an offsetting capital lease liability included in Accounts payable and accrued liabilities and Other long-term liabilities.
Allowance for Funds Used During Construction.
TVA may capitalize interest on eligible projects as AFUDC, based on the average interest rate of TVA’s outstanding debt. The allowance is applicable to construction in progress related to eligible projects with (1) an expected total project cost of $
1.0 billion
or more, and (2) an estimated construction period of at least
three years
in duration. No AFUDC was capitalized for the years ended
September 30, 2018
and
2017
. TVA capitalized $
235 million
of AFUDC for the year ended September 30, 2016, related to the Watts Bar Unit 2 project, which went into service in October 2016.
Reacquired Rights
. Property, plant, and equipment includes intangible reacquired rights, net of amortization, of
$208 million
and
$215 million
as of
September 30, 2018
and
2017
, respectively, related to the purchase of residual interests from lease/leaseback agreements of certain combustion turbine units. Amortization expense was
$8 million
,
$4 million
, and
$1 million
for 2018, 2017, and 2016, respectively. See
Note 9
.
Software Costs.
TVA capitalizes certain costs incurred in connection with developing or obtaining internal-use software. Capitalized software costs are included in Property, plant, and equipment on the consolidated balance sheets and are generally amortized over
seven years
. At
September 30, 2018
and
2017
, unamortized computer software costs totaled $
53 million
and $
42 million
, respectively. Amortization expense related to capitalized computer software costs was $
32 million
,
$26 million
, and
$43 million
for
2018
,
2017
, and
2016
, respectively. Software costs that do not meet capitalization criteria are expensed as incurred.
Impairment of Assets.
TVA evaluates long-lived assets for impairment when events or changes in circumstances indicate that the carrying value of such assets may not be recoverable. For long-lived assets, TVA bases its evaluation on impairment indicators such as the nature of the assets, the future economic benefit of the assets, any historical or future profitability measurements, regulatory approval and ability to set rates at levels that allow for recoverability of the assets, and other external market conditions or factors that may be present. If such impairment indicators are present or other factors exist that indicate that the carrying amount of an asset may not be recoverable, TVA determines whether an impairment has occurred based on an estimate of undiscounted cash flows attributable to the asset as compared with the carrying value of the asset. If an impairment has occurred, the amount of the impairment recognized is measured as the excess of the asset’s carrying value over its fair value. Additionally, TVA regularly evaluates construction projects. If the project is canceled or deemed to have no future economic benefit, the project is written off as an asset impairment or, upon TVA Board approval, reclassified as a regulatory asset.
Decommissioning Costs
TVA recognizes legal obligations associated with the future retirement of certain tangible long-lived assets. These obligations relate to fossil fuel-fired generating plants, nuclear generating plants, hydroelectric generating plants/dams, transmission structures, and other property-related assets. These other property-related assets include, but are not limited to, easements and coal rights. Activities involved with retiring these assets could include decontamination and demolition of structures, removal and disposal of wastes, and site restoration. Revisions to the estimates of
asset retirement obligations ("AROs")
are made whenever factors indicate that the timing or amounts of estimated cash flows have changed materially. Any accretion or depreciation expense related to these liabilities and assets is charged to a regulatory asset. See
Note 7
—
Nuclear Decommissioning Costs
and
Non-Nuclear Decommissioning Costs
and
Note 12
.
Blended Low-Enriched Uranium Program
Under the
blended low-enriched uranium ("BLEU")
program, TVA, the U.S.
Department of Energy ("DOE")
, and certain nuclear fuel contractors have entered into agreements providing for the DOE's surplus of enriched uranium to be blended with other uranium down to a level that allows the blended uranium to be fabricated into fuel that can be used in nuclear power plants. Under the terms of an interagency agreement between TVA and the DOE, in exchange for supplying highly enriched uranium materials to the appropriate third-party fuel processors for processing into usable BLEU fuel for TVA, the DOE participates to a degree in the savings generated by TVA’s use of this blended nuclear fuel. TVA accrues an obligation with each BLEU reload batch related to the portion of the ultimate future payments estimated to be attributable to the BLEU fuel currently in use. TVA estimated DOE's portion of the cost savings from the program to be $
166 million
. The last reload of BLEU material is currently underway at
Browns Ferry Nuclear Plant ("Browns Ferry")
. There is a potential to receive additional BLEU fuel
89
beginning in 2020, and it would be used in future Browns Ferry reloads. At
September 30, 2018
, TVA had paid out approximately $
165 million
for this program, and the obligation recorded was $
1 million
.
Investment Funds
Investment funds consist primarily of trust funds designated to fund decommissioning requirements (see
Note 21
—
Contingencies
—
Decommissioning Costs
), the
Supplemental Executive Retirement Plan ("SERP")
(see
Note 20
—
Overview of Plans and Benefits
—
Supplemental Executive Retirement Plan
), and the
Deferred Compensation Plan ("DCP")
. The
Nuclear Decommissioning Trust ("NDT")
holds funds primarily for the ultimate decommissioning of TVA's nuclear power plants. The
Asset Retirement Trust ("ART")
holds funds primarily for the costs related to the future closure and retirement of TVA's other long-lived assets. The NDT, ART, SERP, and DCP funds are invested in portfolios of securities generally designed to achieve a return in line with overall equity and debt market performance. The NDT, ART, SERP, and DCP funds are all classified as trading.
Energy Prepayment Obligations
In 2004, TVA and its largest customer,
Memphis Light, Gas and Water Division ("MLGW")
, entered into an energy prepayment agreement under which MLGW prepaid TVA $
1.5 billion
for the future costs of electricity to be delivered by TVA to MLGW over a period of
180 months
. TVA accounted for the prepayment as unearned revenue and is reporting the obligation to deliver power under this arrangement as Energy prepayment obligations and Current portion of energy prepayment obligations on the
September 30, 2018
and
2017
Consolidated Balance Sheets. Revenue is recognized in each year of the arrangement, as electricity is delivered to MLGW, based on the ratio of units of
kilowatt hours ("kWh")
delivered to total units of kWh under contract. At
September 30, 2018
, approximately $
1.49 billion
had been recognized as non-cash revenue on a cumulative basis during the life of the agreement,
$100 million
of which was recognized as non-cash revenue during each of
2018
and
2017
. The remaining $
10 million
is expected to be recognized as non-cash revenue in 2019.
Discounts to account for the time value of money, which are recorded as a reduction to electricity sales, amounted to $
46 million
for both of the years ended
September 30, 2018
and
2017
.
Insurance
Although TVA uses private companies to administer its healthcare plans for eligible active and retired employees not covered by Medicare, TVA does not purchase health insurance. Third-party actuarial specialists assist TVA in determining certain liabilities for self-insured claims. TVA recovers the costs of claims through power rates and through adjustments to the participants’ contributions to their benefit plans. These liabilities are included in Other liabilities on the balance sheets.
TVA sponsors an Owner Controlled Insurance Program which provides workers' compensation and liability insurance for a select group of contractors performing maintenance, modifications, outage, and new construction activities at TVA facilities.
The
Federal Employees' Compensation Act ("FECA")
governs liability to employees for service-connected injuries. TVA purchases excess workers' compensation insurance above a self-insured retention.
In addition to excess workers' compensation insurance, TVA purchases the following types of insurance:
|
•
|
Nuclear liability insurance; nuclear property, decommissioning, and decontamination insurance; and nuclear accidental outage insurance. See
Note 21
—
Contingencies
—
Nuclear Insurance
.
|
|
•
|
Excess liability insurance for aviation, auto, marine, and general liability exposures.
|
|
•
|
Property insurance for certain conventional (non-nuclear) assets.
|
The insurance policies are subject to the terms and conditions of the specific policy, including deductibles or self-insured retentions. To the extent insurance would not provide either a partial or total recovery of the costs associated with a loss, TVA would have to recover any such costs through other means, including through power rates.
Research and Development Costs
Research and development costs are expensed when incurred. TVA’s research programs include those related to power delivery technologies, emerging technologies (clean energy, renewables, distributed resources, and energy efficiency), technologies related to generation (fossil fuel, nuclear, and hydroelectric), and environmental technologies.
Tax Equivalents
TVA is not subject to federal income taxation. In addition, neither TVA nor its property, franchises, or income is subject to taxation by states or their subdivisions. The TVA Act requires TVA to make payments to states and counties in which TVA
90
conducts its power operations and in which TVA has acquired power properties previously subject to state and local taxation. The total amount of these payments is five percent of gross revenues from sales of power during the preceding year, excluding sales or deliveries to other federal agencies and off-system sales with other utilities, with a provision for minimum payments under certain circumstances. TVA calculates tax equivalent expense by subtracting the prior year fuel cost-related tax equivalent regulatory asset or liability from the payments made to the states and counties during the current year and adding back the current year fuel cost-related tax equivalent regulatory asset or liability. Fuel cost-related tax equivalent expense is recognized in the same accounting period in which the fuel cost-related revenue is recognized.
Maintenance Costs
TVA records maintenance costs and repairs related to its property, plant, and equipment in the consolidated statements of operations as they are incurred except for the recording of certain regulatory assets for retirement and removal costs.
2
.
Impact of New Accounting Standards and Interpretations
The following are accounting standard updates issued by the
Financial Accounting Standards Board ("FASB")
that TVA adopted during
2018
.
|
Derivatives and Hedging - Contingent Put and Call Options in Debt Instruments
|
|
|
Description
|
This guidance clarifies the requirements for assessing whether contingent call or put options that can accelerate the payment of principal on debt instruments are clearly and closely related to their debt hosts. An entity performing the assessment under the amendments in this update is required to assess the embedded call or put options solely in accordance with a four-step decision sequence. The standard includes interim periods within the fiscal year of adoption and requires a modified retrospective transition.
|
|
Effective Date for TVA
|
October 1, 2017
|
|
Effect on the Financial Statements or Other Significant Matters
|
TVA has two issues of Putable Automatic Rate Reset Securities ("PARRS") outstanding. After a fixed-rate period of five years, the coupon rate on the PARRS may automatically be reset downward under certain market conditions on an annual basis. The coupon rate reset on the PARRS is based on a calculation. If the coupon rate is going to be reset, holders may request, for a limited period of time, redemption of the PARRS at par value, with repayment of principal on the reset date. This put option is otherwise not available. For both series of PARRS, the coupon rate will reset downward on the reset date if the rate calculated is below the then-current coupon rate on the PARRS. TVA has determined under the new guidance that contingent put options that can accelerate the payment of principal on the PARRS are clearly and closely related to their debt hosts. The adoption of this standard did not have a material impact on TVA's financial condition, results of operations, or cash flows.
|
|
Inventory Valuation
|
|
|
Description
|
This guidance changes the model used for the subsequent measurement of inventory from the previous lower of cost or market model to the lower of cost or net realizable value. The guidance applies only to inventory valued using methods other than last-in, first-out or the retail inventory method (for example, first-in, first-out or average cost). This amendment is intended to simplify the subsequent measurement of inventory. The standard includes interim periods within the fiscal year of adoption and requires a prospective transition.
|
|
Effective Date for TVA
|
October 1, 2017
|
|
Effect on the Financial Statements or Other Significant Matters
|
The adoption of this standard did not have a material impact on TVA's financial condition, results of operations, or cash flows.
|
The following accounting standards have been issued but as of
September 30, 2018
, were not effective and had not yet been adopted by TVA.
|
Defined Benefit Costs
|
|
|
Description
|
This guidance changes how information about defined benefit costs for pension plans and other post-retirement benefit plans is presented in employer financial statements. The guidance requires employers that present a measure of operating income in their statement of income to include only the service cost component of net periodic pension cost and net periodic postretirement benefit cost in operating expenses (together with other employee compensation costs). The other components of net benefit cost, including amortization of prior service cost/credit and settlement and curtailment effects, are to be included in nonoperating expenses. Additionally, the guidance stipulates that only the service cost component of net benefit cost is eligible for capitalization in assets.
|
|
Effective Date for TVA
|
The new standard is effective for TVA's interim and annual reporting periods beginning October 1, 2018. While early adoption is permitted, TVA did not adopt the standard early.
|
|
Effect on the Financial Statements or Other Significant Matters
|
TVA has evaluated the impact of adopting this guidance, and if the guidance had been effective for TVA for the years ended 2018, 2017, and 2016, TVA would have reclassified $256 million, $758 million, and $178 million, respectively, of net periodic benefit costs from Operating and maintenance expense to Other income (expense), net on the consolidated statements of operations. There will be no impact on the consolidated balance sheets because TVA has historically capitalized only the service cost component, which is consistent with the new guidance.
|
91
|
Financial Instruments
|
|
|
Description
|
This guidance applies to the recognition and measurement of financial assets and liabilities. The standard requires all equity investments to be measured at fair value with changes in the fair value recognized through net income (other than those accounted for under the equity method of accounting or those that result in consolidation of the investee). The standard also amends presentation requirements related to certain changes in the fair value of a liability and eliminates certain disclosure requirements of significant assumptions for financial instruments measured at amortized cost on the balance sheet. Public entities must apply the amendments by means of a cumulative-effect adjustment to the balance sheet as of the beginning of the fiscal year of adoption.
|
|
Effective Date for TVA
|
The new standard is effective for TVA's interim and annual reporting periods beginning October 1, 2018. Early adoption is not permitted unless specific early adoption guidance is applied. TVA did not adopt the standard early.
|
|
Effect on the Financial Statements or Other Significant Matters
|
TVA currently measures all of its equity investments (other than those that result in the consolidation of the investee) at fair value, with changes in the fair value recognized through net income, unless regulatory accounting is applied. The TVA Board has authorized the use of regulatory accounting for changes in fair value of certain equity investments, and as a result, those changes in fair value are deferred as regulatory assets or liabilities. TVA currently discloses significant assumptions around its estimates of fair value for financial instruments carried at amortized cost on its consolidated balance sheet. The adoption of this standard is not expected to have a material impact on TVA's financial condition, results of operations, or cash flows because TVA holds no available-for-sale securities.
|
|
Revenue Recognition
|
|
|
Description
|
This guidance is related to revenue from contracts with customers, including subsequent amendments, and replaces the existing accounting standard and industry specific guidance for revenue recognition with a five-step model for recognizing and measuring revenue from contracts with customers. The underlying principle of the guidance is to recognize revenue related to the transfer of goods or services to customers at the amount expected to be collected. The objective of the new standard is to provide a single, comprehensive revenue recognition model for all contracts with customers to improve comparability within and across industries. The new standard also requires enhanced disclosures regarding the nature, amount, timing, and uncertainty of revenue and the related cash flows arising from contracts with customers.
|
|
Effective Date for TVA
|
The new standard is effective for TVA's interim and annual reporting periods beginning October 1, 2018. While early adoption is permitted, TVA did not adopt the standard early.
|
|
Effect on the Financial Statements or Other Significant Matters
|
TVA has completed its evaluation of its revenue and adoption of this guidance will not have a material impact on results of operations, financial position, or cash flows, other than changes in required financial statement disclosures. Consistent with current industry practice, revenues recognized from sales of bundled energy commodities (i.e., contracts involving the delivery of multiple energy commodities such as electricity, capacity, ancillary services, etc.) are generally expected to be recognized upon delivery to the customer in an amount based on the invoice price given that it corresponds directly with the value of the commodities transferred to the customer. TVA has also concluded contributions in aid of construction are not in scope for the guidance and will continue to be accounted for as a reduction of property, plant, and equipment.
TVA will utilize certain practical expedients including applying the guidance to open contracts at the date of adoption and to portfolios of contracts with similar characteristics and recognizing revenue for certain contracts under the invoice practical expedient which allows revenue recognition to be consistent with invoiced amounts.
TVA will apply the modified retrospective method of adoption effective October 1, 2018. Under the modified retrospective method of adoption, prior year reported results are not restated; however, any cumulative-effect adjustment to retained earnings at October 1, 2018 would be recorded. The adoption did not result in a cumulative-effect adjustment.
The disclosure requirements included in the guidance will result in increased information being provided in the financial statements. TVA will include disaggregation of revenue including information already provided outside of the financial statement footnotes.
|
|
Statement of Cash Flows - Classification of Certain Cash Receipts and Cash Payments
|
|
|
Description
|
This standard adds or clarifies guidance on the classification of certain cash receipts and payments on the statement of cash flows as follows: debt prepayment or extinguishment costs, settlement of zero-coupon bonds, contingent consideration payments made after a business combination, proceeds from the settlement of insurance claims, proceeds from the settlement of corporate-owned life insurance policies and bank-owned life insurance policies, distributions received from equity method investees, beneficial interest in securitization transactions, and the application of the predominance principle to separately identifiable cash flows.
|
|
Effective Date for TVA
|
This standard is effective for TVA's interim and annual reporting periods beginning October 1, 2018. While early adoption is permitted, TVA did not adopt the standard early.
|
|
Effect on the Financial Statements or Other Significant Matters
|
TVA's previous treatment of the classification of certain cash receipts and cash payments is consistent
with the new standard and there will be no impact on TVA's financial condition, results of operations, or presentation or disclosure of cash flows. |
92
|
Statement of Cash Flows - Restricted Cash
|
|
|
Description
|
This guidance requires that a statement of cash flows explain the change during the period in the total of cash, cash equivalents, and amounts generally described as restricted cash or restricted cash equivalents. Therefore, amounts generally described as restricted cash and restricted cash equivalents should be included with cash and cash equivalents when reconciling the beginning-of-period and end-of-period total amounts shown on the statement of cash flows. This guidance does not provide a definition of restricted cash or restricted cash equivalents.
|
|
Effective Date for TVA
|
The new standard is effective for TVA's interim and annual reporting periods beginning October 1, 2018. While early adoption is permitted, TVA did not adopt the standard early.
|
|
Effect on the Financial Statements or Other Significant Matters
|
Adoption of this standard will result in a change to the amount of cash and cash equivalents and restricted cash presented when reconciling the beginning-of-period and end-of-period total amounts shown on the consolidated statement of cash flows. For the years ended September 30, 2018, 2017, and 2016, TVA would reflect $13 million, $0 million, and $15 million in transfers of cash and cash equivalents to restricted cash within cash flow from operating activities in the consolidated statement of cash flows. TVA will apply the standard using a retrospective transition method to each period presented.
|
|
Derivatives and Hedging - Improvements to Accounting for Hedging Activities
|
|
|
Description
|
This guidance better aligns an entity's risk management activities and financial reporting for hedging relationships through changes to both the designation and measurement guidance for qualifying hedging relationships and the presentation of hedge results. To meet that objective, the amendments expand and refine hedge accounting for both nonfinancial and financial risk components and align the recognition and presentation of the effects of the hedging instrument and the hedged item in the financial statements.
|
|
Effective Date for TVA
|
The new standard is effective for TVA's interim and annual reporting periods beginning October 1, 2019. While early adoption is permitted, TVA did not adopt the standard early.
|
|
Effect on the Financial Statements or Other Significant Matters
|
TVA does not expect the adoption of this standard to have a material impact on TVA's financial condition, results of operations, or cash flows.
|
|
Lease Accounting
|
|
|
Description
|
This guidance changes the provisions of recognition in both the lessee and lessor accounting models. The standard requires entities that lease assets ("lessees") to recognize on the balance sheet the assets and liabilities for the rights and obligations created by leases with terms of more than 12 months. The recognition, measurement, and presentation of expenses and cash flows arising from a lease by a lessee primarily will depend on its classification as a finance (similar to current capital leases) or operating lease. However, unlike current lease accounting rules, which require only capital leases to be recognized on the balance sheet, the new standard will require both types of leases to be recognized on the balance sheet. Operating leases will result in straight-line expense, while finance leases will result in recognition of interest on the lease liability separate from amortization expense. The accounting for the owner of the assets leased by the lessee ("lessor accounting") will remain largely unchanged from current lease accounting rules. The standard allows for certain practical expedients to be elected related to lease term determination, separation of lease and non-lease elements, reassessment of existing leases, and short-term leases. When the standard becomes effective, it will include interim periods within the fiscal year of adoption and will be required to be applied using a modified retrospective transition.
|
|
Effective Date for TVA
|
The new standard is effective for TVA's interim and annual reporting periods beginning October 1, 2019. While early adoption is permitted, TVA does not currently plan to adopt the standard early.
|
|
Effect on the Financial Statements or Other Significant Matters
|
TVA is currently evaluating the potential impact of these changes on its consolidated financial statements and related disclosures. The standard is expected to impact financial position as adoption will increase the amount of assets and liabilities recognized on TVA’s consolidated balance sheets. The standard is not expected to have a material impact on results of operations or cash flows as expense recognition is intended to be substantially the same as under the existing standard. TVA plans to elect certain of the practical expedients included in the new standard. Efforts to date have consisted of evaluating the completeness of the lease population, the effectiveness of internal control related to leases, and appropriate financial statement disclosure and selecting a lease system solution. TVA is also continuing to monitor unresolved industry implementation issues and will analyze the related impacts to lease accounting.
|
|
Defined Benefit Plans - Disclosure Requirements
|
|
|
Description
|
This guidance applies to all employers that sponsor defined benefit pension or other postretirement plans and modifies or clarifies the disclosure requirements for those plans. The amendments in this update remove disclosures that no longer are considered cost-beneficial, clarify the specific requirements of disclosures, and add disclosure requirements identified as relevant. Entities are required to apply the amendments retrospectively.
|
|
Effective Date for TVA
|
The new standard is effective for TVA's annual reporting periods beginning October 1, 2021. While early adoption is permitted, TVA does not currently plan to adopt the standard early.
|
|
Effect on the Financial Statements or Other Significant Matters
|
TVA is currently evaluating the potential impact of these changes on its consolidated financial statements and related disclosures.
|
93
|
Customer's Accounting for Implementation Costs in a Cloud Arrangement That is a Service Contract
|
|
|
Description
|
This guidance relates to the accounting for a customer’s implementation costs in a hosting arrangement that is a service contract. The amendments align the requirements for capitalizing those implementation costs with the requirements for capitalizing implementation costs incurred to develop or obtain internal-use software and hosting arrangements that include an internal-use software license. The amendments also provide requirements for the classification of the capitalized costs and related expense and cash flows in the financial statements, the application of impairment guidance to the capitalized costs, and the application of abandonment guidance to the capitalized costs. Entities are required to apply the amendments either retrospectively or prospectively to all implementation costs incurred after the adoption date.
|
|
Effective Date for TVA
|
The new standard is effective for TVA's interim and annual reporting periods beginning October 1, 2020. While early adoption is permitted, TVA does not currently plan to adopt the standard early.
|
|
Effect on the Financial Statements or Other Significant Matters
|
TVA is currently evaluating the potential impact of these changes on its consolidated financial statements and related disclosures.
|
3
.
Accounts Receivable, Net
Accounts receivable primarily consist of amounts due from customers for power sales. The table below summarizes the types and amounts of TVA’s accounts receivable:
|
Accounts Receivable, Net
At September 30
|
|||||||
|
|
2018
|
2017
|
|||||
|
Power receivables
|
$
|
1,570
|
|
$
|
1,441
|
|
|
|
Other receivables
|
87
|
|
129
|
|
|||
|
Allowance for uncollectible accounts
|
—
|
|
(1)
|
(1
|
)
|
||
|
Accounts receivable, net
|
$
|
1,657
|
|
$
|
1,569
|
|
|
Note
(1) Allowance for uncollectible accounts was less than $
1 million
at September 30, 2018, and therefore is not represented in the table above.
4
.
Inventories, Net
The table below summarizes the types and amounts of TVA’s inventories:
|
Inventories, Net
At September 30
|
|||||||
|
|
2018
|
2017
|
|||||
|
Materials and supplies inventory
|
$
|
725
|
|
$
|
734
|
|
|
|
Fuel inventory
|
266
|
|
355
|
|
|||
|
RECs/Emission allowance inventory, net
|
14
|
|
15
|
|
|||
|
Allowance for inventory obsolescence
|
(44
|
)
|
(39
|
)
|
|||
|
Inventories, net
|
$
|
961
|
|
$
|
1,065
|
|
|
5
.
Net Completed Plant
Net completed plant consisted of the following:
|
Net Completed Plant
At September 30
|
|||||||||||||||||||||||
|
|
2018
|
2017
|
|||||||||||||||||||||
|
|
Cost
|
Accumulated Depreciation
|
Net
|
Cost
|
Accumulated Depreciation
|
Net
|
|||||||||||||||||
|
Coal-fired
|
$
|
16,482
|
|
$
|
11,033
|
|
$
|
5,449
|
|
$
|
15,937
|
|
$
|
10,791
|
|
$
|
5,146
|
|
|||||
|
Gas and oil-fired
|
5,990
|
|
1,459
|
|
4,531
|
|
4,995
|
|
1,359
|
|
3,636
|
|
|||||||||||
|
Nuclear
|
25,227
|
|
11,310
|
|
13,917
|
|
25,010
|
|
10,834
|
|
14,176
|
|
|||||||||||
|
Transmission
|
7,515
|
|
3,038
|
|
4,477
|
|
7,264
|
|
3,039
|
|
4,225
|
|
|||||||||||
|
Hydroelectric
|
3,087
|
|
1,012
|
|
2,075
|
|
3,015
|
|
967
|
|
2,048
|
|
|||||||||||
|
Other electrical plant
|
1,881
|
|
1,107
|
|
774
|
|
1,756
|
|
1,008
|
|
748
|
|
|||||||||||
|
Intangible software
|
3
|
|
|
—
|
|
|
3
|
|
—
|
|
—
|
|
—
|
|
|||||||||
|
Multipurpose dams
|
900
|
|
367
|
|
533
|
|
928
|
|
387
|
|
541
|
|
|||||||||||
|
Other stewardship
|
29
|
|
9
|
|
20
|
|
42
|
|
19
|
|
23
|
|
|||||||||||
|
Total
|
$
|
61,114
|
|
|
$
|
29,335
|
|
|
$
|
31,779
|
|
$
|
58,947
|
|
|
$
|
28,404
|
|
|
$
|
30,543
|
|
|
94
6
.
Other Long-Term Assets
The table below summarizes the types and amounts of TVA’s other long-term assets:
|
Other Long-Term Assets
At September 30
|
|||||||
|
|
2018
|
2017
|
|||||
|
EnergyRight
®
receivables
|
$
|
90
|
|
$
|
100
|
|
|
|
Loans and other long-term receivables, net
|
135
|
|
115
|
|
|||
|
Commodity contract derivative assets
|
31
|
|
2
|
|
|||
|
Prepaid capacity payments
|
27
|
|
34
|
|
|||
|
Other
|
66
|
|
72
|
|
|||
|
Total other long-term assets
|
$
|
349
|
|
$
|
323
|
|
|
In association with the EnergyRight
®
Solutions program, LPCs offer financing to end-use customers for the purchase of energy-efficient equipment. Depending on the nature of the energy-efficiency project, loans may have a maximum term of
five years
or
10 years
. TVA purchases the resulting loans receivable from its LPCs. The loans receivable are then transferred to a third-party bank with which TVA has agreed to repay in full any loan receivable that has been in default for
180 days
or more or that TVA has determined is uncollectible. Given this continuing involvement, TVA accounts for the transfer of the receivables as secured borrowings. The current and long-term portions of the receivables are reported in Accounts receivable, net and Other long-term assets, respectively, on TVA's consolidated balance sheets. As of
September 30, 2018
and
2017
, the carrying amount of the receivables, net of discount, reported in Accounts receivable, net was approximately
$22 million
and $
25 million
, respectively. See
Note 11
for information regarding the associated financing obligation.
95
7
.
Regulatory Assets and Liabilities
Regulatory assets generally represent incurred costs that have been deferred because such costs are probable of future recovery in customer rates. Regulatory liabilities generally represent obligations to make refunds to customers for previous collections for costs that are not likely to be incurred or deferral of gains that will be credited to customers in future periods. Components of regulatory assets and regulatory liabilities are summarized in the table below.
|
Regulatory Assets and Liabilities
At September 30
|
|||||||
|
|
2018
|
2017
|
|||||
|
Current regulatory assets
|
|
|
|||||
|
Gallatin coal combustion residual facilities
|
$
|
38
|
|
$
|
—
|
|
|
|
Unrealized losses on interest rate derivatives
|
73
|
|
93
|
|
|||
|
Environmental agreements
|
3
|
|
2
|
|
|||
|
Unrealized losses on commodity contracts
|
4
|
|
68
|
|
|||
|
Deferred nuclear generating units
|
—
|
|
237
|
|
|||
|
Environmental cleanup costs – Kingston ash spill
|
266
|
|
44
|
|
|||
|
Fuel cost adjustment receivable
|
30
|
|
1
|
|
|||
|
Other current regulatory assets
|
—
|
|
2
|
|
|||
|
Total current regulatory assets
|
414
|
|
447
|
|
|||
|
Non-current regulatory assets
|
|
|
|
|
|||
|
Deferred pension costs and other post-retirement benefits costs
|
3,119
|
|
4,009
|
|
|||
|
Non-nuclear decommissioning costs
|
1,019
|
|
703
|
|
|||
|
Gallatin CCR facilities
|
861
|
|
899
|
|
|||
|
Nuclear decommissioning costs
|
784
|
|
823
|
|
|||
|
Unrealized losses on interest rate derivatives
|
692
|
|
982
|
|
|||
|
Environmental agreements
|
11
|
|
13
|
|
|||
|
Unrealized losses on commodity contracts
|
8
|
|
9
|
|
|||
|
Deferred nuclear generating units
|
—
|
|
759
|
|
|||
|
Environmental cleanup costs - Kingston ash spill
|
—
|
|
263
|
|
|||
|
Other non-current regulatory assets
|
118
|
|
238
|
|
|||
|
Total non-current regulatory assets
|
6,612
|
|
8,698
|
|
|||
|
Total regulatory assets
|
$
|
7,026
|
|
$
|
9,145
|
|
|
|
Current regulatory liabilities
|
|
|
|
|
|||
|
Fuel cost adjustment tax equivalents
|
$
|
146
|
|
$
|
153
|
|
|
|
Fuel cost adjustment
|
—
|
|
2
|
|
|||
|
Unrealized gains on commodity derivatives
|
41
|
|
8
|
|
|||
|
Total current regulatory liabilities
|
187
|
|
163
|
|
|||
|
Non-current regulatory liabilities
|
|
|
|
|
|||
|
Deferred other post-retirement benefits cost
|
73
|
|
23
|
|
|||
|
Unrealized gains on commodity derivatives
|
31
|
|
2
|
|
|||
|
Total non-current regulatory liabilities
|
104
|
|
25
|
|
|||
|
Total regulatory liabilities
|
$
|
291
|
|
$
|
188
|
|
|
In 2017, the TVA Board authorized management to accelerate amortization of certain regulatory assets to the extent actual net income in 2018 exceeds the budgeted amount, up to the aggregate amount of those certain regulatory assets. Assets included in this Board action include: deferred nuclear generating units, environmental cleanup costs related to the Kingston ash spill, and nuclear training costs related to the refurbishing and restarting of Browns Ferry Unit 1 and the construction of Watts Bar Unit 2. TVA recorded $
857 million
of accelerated amortization of the Deferred nuclear generating units and Nuclear training costs regulatory assets in 2018. The TVA Board is authorizing TVA to use the amount included in the 2019 rate action for these
96
two regulatory assets, to the extent needed, to accelerate amortization of the Environmental cleanup costs - Kingston ash spill regulatory asset in 2019.
Deferred Pension Costs
and Other Post-retirement Benefit Costs
. TVA measures the funded status of its pension and post-retirement (“OPEB”) benefit plans at each year-end balance sheet date. The funded status is measured as the difference between the fair value of plan assets and the benefit obligations at the measurement date for each plan. The changes in funded status are actuarial gains and losses that are recognized in TVA’s consolidated balance sheets by adjusting the recognized pension and OPEB liabilities, with the offset deferred as a regulatory asset or a regulatory liability. In an unregulated environment, these deferred costs would be recognized as an increase or decrease to accumulated other comprehensive income (loss) ("AOCI").
“Incurred cost” is a cost arising from cash paid out or an obligation to pay for an acquired asset or service, and a loss from any cause that has been sustained and for which payment has been or must be made. In the cases of pension and OPEB costs, the unfunded obligation represents a projected liability to the employee for services rendered, and thus it meets the definition of an incurred cost. Therefore, amounts that otherwise would be charged to AOCI for these costs are recorded as a regulatory asset or liability since TVA has historically recovered pension and OPEB expense in rates. Through historical and current year expense included in ratemaking, the TVA Board has demonstrated the ability and intent to include pension and OPEB costs in allowable costs and in rates for ratemaking purposes. As a result, it is probable that future revenue will result from inclusion of the pension and OPEB regulatory assets or regulatory liability in allowable costs for ratemaking purposes.
The regulatory asset and liability are classified as long-term, which is consistent with the pension and OPEB liabilities, and are not amortized to the consolidated statements of operations over a specified recovery period. They are adjusted either upward or downward each year in conjunction with the adjustments to the unfunded pension liability and OPEB liability, as calculated by the actuaries. Ultimately the regulatory asset and liability will be recognized in the consolidated statements of operations in the form of pension and OBEB expense as the actuarial liabilities are eliminated in future periods. See
Note 20
—
Obligations and Funded Status
.
Additionally on October 1, 2014, TVA began recognizing pension costs as a regulatory asset to the extent that the amount calculated under GAAP as pension expense differs from the amount TVA contributes to the pension plan. As a result of recent plan design changes, future contributions are expected to exceed the expense calculated under U.S. GAAP. Accordingly, TVA will discontinue this regulatory accounting practice once all such deferred costs have been recovered, at which time it will recognize pension costs in accordance with U.S. GAAP.
Non-Nuclear Decommissioning Costs.
Non-nuclear decommissioning costs include: (1) certain deferred charges related to the future closure and decommissioning of TVA’s non-nuclear long-lived assets, (2) recognition of changes in the liability, (3) recognition of changes in the value of TVA’s ART, and (4) certain other deferred charges under the accounting rules for AROs. TVA has established the ART to more effectively segregate, manage, and invest funds to help meet future non-nuclear AROs. The funds from the ART may be used, among other things, to pay the costs related to the future closure and retirement of non-nuclear long-lived assets under various legal requirements. These future costs can be funded through a combination of investment funds already set aside in the ART, future earnings on those investment funds, and future cash contributions to the ART and future earnings thereon. For 2018, TVA recovered in rates a portion of its estimated current year non-nuclear decommissioning costs and contributions to the ART. Deferred charges will be recovered in rates based on an analysis of the expected expenditures, contributions, and investment earnings required to recover the decommissioning costs. There is not a specified recovery period; therefore, the regulatory asset is classified as long-term consistent with the ART investments and ARO liability.
Gallatin Coal Combustion Residual Facilities.
In August 2017, TVA began using regulatory accounting treatment to defer expected future costs related to
Gallatin Fossil Plant ("Gallatin")
coal combustion residuals ("CCR")
. The TVA Board approved a plan to amortize these costs over the anticipated duration of the Gallatin CCR project (excluding post-closure care), beginning October 1, 2018 as project costs are incurred. See
Note 8
.
Nuclear Decommissioning Costs.
Nuclear decommissioning costs include: (1) certain deferred charges related to the future closure and decommissioning of TVA’s nuclear generating units under the
Nuclear Regulatory Commission ("NRC")
requirements, (2) recognition of changes in the liability, (3) recognition of changes in the value of TVA's NDT, and (4) certain other deferred charges under the accounting rules for AROs. These future costs will be funded through a combination of the NDT, future earnings on the NDT, and, if necessary, additional TVA cash contributions to the NDT and future earnings thereon. See
Note 1
— Investment Funds.
There is not a specified recovery period; therefore, the regulatory asset is classified as long-term consistent with the NDT investments and ARO liability.
Unrealized Losses on Interest Rate Derivatives
. TVA uses regulatory accounting treatment to defer the unrealized gains and losses on certain interest rate derivative contracts. When amounts in these contracts are realized, the resulting gains or losses are included in the ratemaking formula. The unrealized losses on these interest rate derivatives are recorded on TVA’s consolidated balance sheets as current and non-current regulatory assets, and the related realized gains or losses, if any, are recorded in TVA’s consolidated statements of operations. Gains and losses on interest rate derivatives that are expected to be realized within the next year are included as a current regulatory asset or liability on TVA’s consolidated balance sheet.
97
Environmental Agreements.
In conjunction with the Environmental Agreements (see
Note 21
—
Legal Proceedings
—
Environmental Agreements
), TVA recorded certain liabilities totaling $
360 million
($
290 million
investment in energy efficiency projects, demand response projects, renewable energy projects, and other TVA projects; $
60 million
to be provided to Alabama, Kentucky, North Carolina, and Tennessee to fund environmental projects with preference for projects in the Tennessee River watershed; and $
10 million
in civil penalties). The TVA Board determined that these costs would be collected in customer rates in the future, and, accordingly, the amounts were deferred as a regulatory asset. Through the end of
2018
, $
276 million
has been paid with respect to environmental projects, $
60 million
has been paid to Alabama, Kentucky, North Carolina, and Tennessee, and $
10 million
has been paid with respect to civil penalties. The remaining deferred amounts will be charged to expense and recovered in rates over future periods as payments are made through 2027. Amounts included as a current regulatory asset on TVA’s consolidated balance sheets represent the costs expected to be incurred in the next 12 months.
Unrealized Gains (Losses) on Commodity Derivatives.
Unrealized gains (losses) on coal and natural gas purchase contracts, included as part of unrealized gains (losses) on commodity derivatives, relate to the
mark-to-market ("MtM")
valuation of coal and natural gas purchase contracts. These contracts qualify as derivative contracts but do not qualify for cash flow hedge accounting treatment. As a result, TVA recognizes the changes in the market value of these derivative contracts as a regulatory liability or asset. This treatment reflects TVA’s ability and intent to recover the cost of these commodity contracts on a settlement basis for ratemaking purposes through the fuel cost adjustment. TVA recognizes the actual cost of fuel received under these contracts in fuel expense at the time the fuel is used to generate electricity. These contracts expire at various times through 2020. Unrealized gains and losses on contracts with a maturity of less than one year are included as a current regulatory asset or liability on TVA's consolidated balance sheets. See
Note 15
.
Deferred Nuclear Generating Units
. All accumulated costs related to Bellefonte Nuclear Plant ("Bellefonte") are recorded as a regulatory asset. Additionally, in August 2016 the TVA Board approved the recognition of a regulatory asset for (1) all costs attributable to (a) the expected disposition of Bellefonte assets, including preparing or preserving the Bellefonte site, and (b) associated liabilities directly related to those assets, (2) any related future operating and project costs until the assets are sold, (3) the amount by which the book value of Bellefonte exceeds its fair market value less cost to sell, if any, (4) any subsequent gains and losses resulting from the disposition or impairment of Bellefonte, and (5) any costs attributable to the steam generators for Bellefonte until TVA disposes of the generators.
The TVA Board approved recovery of this asset in future rates at an amount of $
237 million
per year until fully recovered. In addition to this annual recovery, in 2017, the TVA Board authorized management to accelerate additional amortization of this asset in 2018 to the extent actual net income in 2018 exceeded budgeted net income. TVA fully amortized the remaining balance of $
764 million
during 2018.
On November 14, 2016, following a public auction, TVA entered into a contract to sell substantially all of the
Bellefonte Nuclear Plant ("Bellefonte")
site to Nuclear Development, LLC for $
111 million
. Nuclear Development, LLC, paid $
22 million
on November 14, 2016, which is recorded as a short-term liability on TVA’s Consolidated Balance Sheet at
September 30, 2018
, with the remaining $
89 million
due at closing. Nuclear Development, LLC, had up to
two years
from November 14, 2016, to close on the property, and TVA agreed to maintain the site until closing. Nuclear Development, LLC, requested and was granted an extension of the initial closing date. Nuclear Development, LLC now has until November 30, 2018 to close on the property, and TVA will continue to maintain the site until then. Proceeds from the sale in excess of carrying costs will be recorded as a gain and reflected in earnings.
Environmental Cleanup Costs – Kingston Ash Spill
. TVA used regulatory accounting treatment to defer all actual costs incurred and expected future costs related to the
Kingston Fossil Plant ("Kingston")
Ash Spill. The TVA Board approved a plan to amortize these costs over
15
years beginning on October 1, 2009. Insurance proceeds have been recorded as reductions to the regulatory asset and have reduced amounts collected in future rates. Amounts included as a current regulatory asset on TVA’s consolidated balance sheets represent the amount to be amortized in the next
12 months
. The TVA Board is authorizing TVA to use the amount included in the 2019 rate action for the Deferred nuclear generating units and Nuclear training costs regulatory assets, to the extent needed, to accelerate amortization of the Environmental cleanup costs - Kingston ash spill regulatory asset in 2019. Therefore, the remaining balance at September 30, 2018 is recorded as a current asset.
Fuel Cost Adjustment Receivable.
The fuel cost adjustment provides a mechanism to alter rates monthly to reflect changing fuel and purchased power costs, including realized gains and losses relating to transactions under TVA’s
Financial Trading Program ("FTP")
. There is typically a lag between the occurrence of a change in fuel and purchased power costs and the reflection of the change in fuel rates. Balances in the fuel cost adjustment regulatory accounts represent over-collected or under-collected revenues that offset fuel and purchased power costs, and the fuel rate is designed to recover or refund the balance in less than one year.
Other Non-Current Regulatory Assets.
Other non-current regulatory assets consist of the following:
Deferred Capital Leases and Other Financing Obligations
. Deferred capital lease and other financing asset costs represent the difference between the FERC's Uniform System of Accounts Prescribed for Public Utilities and Licensees Subject to the Provisions of the Federal Power Act ("Uniform System of Accounts") model balances and the balances under GAAP guidance. Under the Uniform System of Accounts, TVA recognizes the initial capital lease and other financing asset and liability
98
at inception of the lease or other obligation; however, the annual expense under the Uniform System of Accounts is equal to the annual lease or other financing obligation payments, which differs from GAAP treatment. This practice results in TVA’s asset balances being higher than they otherwise would have been under GAAP, with the difference representing a regulatory asset related to each capital lease or other financing obligation. These costs will be amortized over the respective lease or other financing obligation terms as lease or other financing obligation payments are made. As the costs associated with this regulatory asset are not currently being considered in rates and the asset is expected to increase over the next year, the regulatory asset has been classified as long-term.
Debt Reacquisition Costs
. Reacquisition expenses, call premiums, and other related costs, such as unamortized debt issue costs associated with redeemed Bond issues, are deferred and amortized (accreted) on a straight-line basis over the weighted average life of TVA’s debt portfolio. Because timing of additional reacquisition expenses and changes to the weighted average life of the debt are uncertain, the regulatory asset is classified as long-term.
Nuclear Training Costs
.
As a result of refurbishing and restarting Browns Ferry Unit 1 in 2007 and the construction and startup of Watts Bar Unit 2 in 2017, nuclear training costs associated with these units have been deferred as a regulatory asset and amortized over a cost recovery period equivalent to the expected useful life of the operating nuclear units. In addition to this annual recovery, in 2017, the TVA Board authorized management to accelerate additional amortization of this asset in 2018 to the extent actual net income in 2018 exceeded budgeted net income. TVA fully amortized the remaining balance of $
93 million
during 2018.
Retirement Removal Costs
.
Retirement removal costs, net of salvage, that are not legally required are recognized as a regulatory asset. Prior to 2017, net removal costs were amortized over a recovery period consistent with the depreciable lives of related assets under the most recent depreciation study. In 2017 and thereafter, net removal costs are amortized over a one-year period subsequent to completion of the removal activities. TVA treats this regulatory asset as long-term in its entirety primarily because it relates to assets that are long-term in nature.
Fuel Cost Adjustment Tax Equivalents.
The fuel cost adjustment includes a provision related to the current funding of the future payments TVA will make. As TVA records the fuel cost adjustment, five percent of the calculation that relates to a future asset or liability for tax equivalent payments is recorded as a current regulatory asset or liability and paid or refunded in the following year.
8
.
Gallatin Coal Combustion Residual Facilities
Background
TVA is planning to close wet CCR impoundments in accordance with federal and applicable state requirements when (1) coal-fired plants are converted to dry CCR processes and dry storage landfills become operational or (2) plant operations cease. Closure project schedules and costs are driven by the selected closure technology. The impoundments at Gallatin are pending additional studies to determine the final closure methodology and schedule. While plans are currently being formulated for the CCR closure methodology for Gallatin, TVA is involved in two lawsuits relating to alleged discharges of pollutants from the CCR facilities at Gallatin.
Lawsuit Brought by TDEC
. In January 2015, the
Tennessee Department of Environment and Conservation ("TDEC")
filed a lawsuit against TVA in the Chancery Court for Davidson County, Tennessee. The lawsuit alleges that pollutants have been discharged into waters of the State from CCR facilities at Gallatin in violation of the Tennessee Water Quality Control Act and the Tennessee Solid Waste Disposal Act. TDEC seeks injunctive relief, which could include an order requiring TVA to relocate the CCR facilities. TDEC also requested civil penalties of up to $
17,000
per day for each day TVA is found to have violated the statutes. Tennessee Scenic Rivers Association ("TSRA") and Tennessee Clean Water Network ("TCWN") have been allowed to intervene in the case as plaintiffs. Trial in this action is anticipated to take place in the fall of 2019. On August 10, 2017, TVA removed the case from state court to the U.S. District Court for the Middle District of Tennessee. On May 14, 2018, the federal court granted plaintiffs’ motions to remand the case back to state court and TVA subsequently appealed this decision. On November 1, 2018, TVA filed a motion to withdraw its appeal.
Lawsuit Brought by TSRA and TCWN
. In April 2015, TSRA and TCWN filed a lawsuit against TVA in the U.S. District Court for the Middle District of Tennessee alleging that pollutants have been discharged into the Cumberland River from CCR facilities at Gallatin in violation of the Clean Water Act (“CWA”). The plaintiffs are seeking injunctive relief, including an order requiring TVA to relocate the CCR facilities, civil penalties of up to $
37,500
per violation per day, and attorneys’ fees.
On August 4, 2017, the court issued a decision largely in favor of the plaintiffs (the "August 2017 Order"), finding that TVA had discharged pollutants into the Cumberland River in the past and that the discharge was likely ongoing. The court ordered TVA to excavate the CCR materials and move them to a lined facility. The court further required TVA to file within 30 days a timetable for excavating and removing the materials. The court did not assess any monetary penalties against TVA for the CWA violations, citing the fact that its order to relocate the CCR materials would cause TVA to incur significant costs.
99
On September 5, 2017, TVA submitted the required timetable, which assumes that a new lined facility can be permitted and built on the Gallatin site. The process of obtaining the necessary permits, constructing the facility, and moving all of the CCR materials is estimated to take approximately 24 years. Under current regulations, TVA would be required to monitor the existing facilities and the new facility for 30 years after closure. The estimated cost of the potential Gallatin CCR project is approximately $
900 million
.
On October 2, 2017, TVA appealed the court's decision to the United States Court of Appeals for the Sixth Circuit ("Sixth Circuit"). On January 30, 2018, TVA filed its appellate brief, and on February 7, 2018, 18 states and numerous other entities who were not parties to the case, including the Tennessee Valley Public Power Association and the U.S. Chamber of Commerce, filed “friends of the court” briefs in support of TVA's appeal. On March 15, 2018, the plaintiffs filed their brief urging that the district court's decision be affirmed, and on March 22, 2018, several other entities (including the State of Tennessee and four other states) filed “friends of the court” briefs in support of the plaintiffs. Oral argument was held on August 2, 2018. On September 24, 2018, a panel of the Sixth Circuit reversed the district court decision and held that the district court erred by imposing CWA liability against TVA and that, therefore, the imposition of injunctive relief was an abuse of discretion. The Sixth Circuit’s decision will not be final until the Sixth Circuit issues its order relinquishing jurisdiction over the case. In addition, on October 22, 2018, the plaintiffs filed a motion requesting that the full Sixth Circuit rehear the case.
At September 30, 2018, related liabilities of $
862 million
and $
30 million
were recorded in Other long-term liabilities and Accounts payable and accrued liabilities, respectively. Prior to the court's decision, TVA had anticipated spending approximately $
200 million
to cap and close the existing CCR facilities.
Financial Impact
In August 2017, TVA began using regulatory accounting treatment to defer expected future costs of compliance with orders or settlements related to lawsuits involving the Gallatin CCR facilities. The TVA Board approved a plan to amortize these costs over the anticipated duration of the Gallatin CCR facilities project (excluding post-closure care), beginning October 1, 2018, as project costs are incurred. TVA has estimated these costs to be approximately $
900 million
. These costs include, among other things, environmental studies concerning the existing and new facilities, the licensing activities for the new facility, design and construction of the new facility, relocating the material from the existing facilities to the new facility, closing the existing facilities, monitoring activities, and an amount of additional costs reflecting the expected impacts of inflation given the anticipated duration of the project. The costs do not include such items as any additional order or penalty arising from the TDEC lawsuit, which cannot be reasonably estimated at this time. TVA has not discounted this environmental obligation to a present value amount. TVA also committed in its timetable to complete capital projects related to construction of a permanent bottom ash dewatering facility and wastewater process ponds. These capital projects, which are not included in the estimate for cleanup costs above, are estimated to cost approximately $
91 million
and be completed by 2020.
It is reasonably possible that TVA will not be able to obtain the necessary permits to build the facility on the Gallatin site and will be required to move the CCR materials offsite. Offsite relocation would materially increase both the cost and the time to comply with the August 2017 Order. TVA has estimated that if it is required to relocate the materials to a facility off the Gallatin site, TVA may incur up to $
2.0 billion
in expenses, plus an amount of additional costs reflecting the expected impacts of inflation given the extended duration of an offsite relocation project. These costs include, among other things, environmental studies concerning the existing and new facilities, the licensing activities for the new facility, design and construction of the new facility, relocating the material from the existing facilities to the new facility, closing the existing facilities, and monitoring activities. The process of obtaining the necessary permits for offsite disposal, locating or constructing an offsite facility, and moving all of the CCR materials offsite is estimated to take approximately 40 years. TVA would also be required to monitor the existing facilities, and possibly the offsite facility, for 30 years after the facilities are closed, based on current regulations.
The ultimate cost of the removal project will depend on actual timing and results of ongoing litigation, environmental studies, licensing, permitting, site subsurface conditions, contractor availability, weather, equipment, available material resources, and other contingency factors. These contingency factors could cause the project cost estimate to change materially in the near term. TVA updates its estimate for project costs as changes in these factors are determined to be probable of occurring.
9
.
Asset Acquisitions
On September 20, 2017, TVA acquired
100 percent
of the equity interests in
two
special purpose entities ("SPEs")
designed to administer rent payments TVA makes under certain of its lease/leaseback arrangements. Each entity holds residual interests in four of TVA's peaking
combustion turbine units ("CTs")
. TVA acquired these entities in order to reacquire the residual interests in eight CTs it had previously granted in the lease/leaseback arrangements.
TVA acquired the entities for total cash consideration of
$36 million
. The fair value of the assets acquired consisted of
$110 million
of reacquired rights, and the fair value of liabilities assumed consisted of
$74 million
in notes payable. Reacquired rights are an intangible asset included in TVA's Completed plant balance and are amortized over the estimated useful life of the underlying CTs. Notes payable assumed in the transaction are included in TVA's Long-term debt and require TVA to make semi-annual payments through May 2020. TVA recognized less than
$1 million
of amortization expense, related to reacquired rights,
100
within TVA’s consolidated statements of operations. Transaction costs were not material.
TVA determined that its lease/leaseback obligations were preexisting relationships that were effectively settled in the asset acquisitions. TVA settled the preexisting relationships separately from the asset acquisitions, resulting in a loss on extinguishment of the obligations of
$3 million
. The carrying value of lease/leaseback obligations effectively settled was
$71 million
, including accrued interest, and the reacquisition price was
$74 million
, paid in cash, at the acquisition date.
10
.
Variable Interest Entities
A VIE is an entity that either (i) has insufficient equity to permit the entity to finance its activities without additional subordinated financial support or (ii) has equity investors who lack the characteristics of owning a controlling financial interest. When TVA determines that it has a variable interest in a VIE, a qualitative evaluation is performed to assess which interest holders have the power to direct the activities that most significantly impact the economic performance of the entity and have the obligation to absorb losses or receive benefits that could be significant to the entity. The evaluation considers the purpose and design of the business, the risks that the business was designed to create and pass along to other entities, the activities of the business that can be directed and which party can direct them, and the expected relative impact of those activities on the economic performance of the business through its life. TVA has the power to direct the activities of an entity when it has the ability to make key operating and financing decisions, including, but not limited to, capital investment and the issuance of debt. Based on the evaluation of these criteria, TVA has determined it is the primary beneficiary of certain entities and as such is required to account for the VIEs on a consolidated basis.
John Sevier VIEs
In 2012, TVA entered into a $
1.0 billion
construction management agreement and lease financing arrangement with
John Sevier Combined Cycle Generation LLC ("JSCCG")
for the completion and lease by TVA of the
John Sevier Combined Cycle Facility ("John Sevier CCF")
. JSCCG is a special single-purpose limited liability company formed in January 2012 to finance the John Sevier CCF through a $
900 million
secured note issuance
(the “JSCCG notes”) and the issuance of $
100 million
of membership interests subject to mandatory redemption. The membership interests were purchased by
John Sevier Holdco LLC ("Holdco")
. Holdco is a special single-purpose entity, also formed in January 2012, established to acquire and hold the membership interests in JSCCG. A non-controlling interest in Holdco is held by a third party through nominal membership interests, to which none of the income, expenses, and cash flows are allocated.
The membership interests held by Holdco in JSCCG were purchased with proceeds from the issuance of $
100 million
of secured notes
(the “Holdco notes") and are subject to mandatory redemption pursuant to a schedule of amortizing, semi-annual payments due each January 15 and July 15, with a final payment due in January 2042. The payment dates for the mandatorily redeemable membership interests are the same as those of the Holdco notes. The sale of the JSCCG notes, the membership interests in JSCCG, and the Holdco notes closed in January 2012. The JSCCG notes are secured by TVA’s lease payments, and the Holdco notes are secured by Holdco's investment in, and amounts receivable from, JSCCG. TVA’s lease payments to JSCCG are equal to and payable on the same dates as JSCCG’s and Holdco’s semi-annual debt service payments. In addition to the lease payments, TVA pays administrative and miscellaneous expenses incurred by JSCCG and Holdco. Certain agreements related to this transaction contain default and acceleration provisions.
Due to its participation in the design, business conduct, and credit and financial support of JSCCG and Holdco, TVA
has determined that it has a variable interest in each of these entities. Based on its analysis, TVA has concluded that it is the
primary beneficiary of JSCCG and Holdco and, as such, is required to account for the VIEs on a consolidated basis. Holdco's
membership interests in JSCCG are eliminated in consolidation.
Southaven VIE
In 2013, TVA entered into a $
400 million
lease financing arrangement with
Southaven Combined Cycle Generation LLC ("SCCG")
for the lease by TVA of the
Southaven Combined Cycle Facility ("Southaven CCF")
. SCCG is a special single-purpose limited liability company formed in June 2013 to finance the Southaven CCF through a $
360 million
secured notes issuance (the “SCCG notes”) and the issuance of $
40 million
of membership interests subject to mandatory redemption. The membership interests were purchased by
Southaven Holdco LLC ("SHLLC")
. SHLLC is a special single-purpose entity, also formed in June 2013, established to acquire and hold the membership interests in SCCG. A non-controlling interest in SHLLC is held by a third party through nominal membership interests, to which none of the income, expenses, and cash flows of SHLLC are allocated.
The membership interests held by SHLLC were purchased with proceeds from the issuance of $
40 million
of secured notes (the "SHLLC notes") and are subject to mandatory redemption pursuant to a schedule of amortizing, semi-annual payments due each February 15 and August 15, with a final payment due on August 15, 2033. The payment dates for the mandatorily redeemable membership interests are the same as those of the SHLLC notes, and the payment amounts are sufficient to provide returns on, as well as returns of, capital until the investment has been repaid to SHLLC in full. The rate of return on investment to SHLLC is
7.0 percent
, which is reflected as interest expense in the consolidated statements of operations. SHLLC is required to pay a pre-determined portion of the return on investment to
Seven States Southaven, LLC ("SSSL")
on each lease payment date as agreed in SHLLC's formation documents (the "Seven States Return"). The current and
101
long-term portions of the Membership interests of VIE subject to mandatory redemption are included in Accounts payable and accrued liabilities and Other long-term liabilities, respectively.
The payment dates for the mandatorily redeemable membership interests are the same as those of the SHLLC notes. The SCCG notes are secured by TVA’s lease payments, and the SHLLC notes are secured by SHLLC’s investment in, and amounts receivable from, SCCG. TVA’s lease payments to SCCG are payable on the same dates as SCCG’s and SHLLC’s semi-annual debt service payments and are equal to the sum of (i) the amount of SCCG’s semi-annual debt service payments, (ii) the amount of SHLLC’s semi-annual debt service payments, and (iii) the amount of the Seven States Return. In addition to the lease payments, TVA pays administrative and miscellaneous expenses incurred by SCCG and SHLLC. Certain agreements related to this transaction contain default and acceleration provisions.
In the event that TVA were to choose to exercise an early buy out feature of the Southaven facility lease, in part or in whole, TVA must pay to SCCG amounts sufficient for SCCG to repay or partially repay on a pro rata basis the membership interests held by SHLLC, including any outstanding investment amount plus accrued but unpaid return. TVA also has the right, at any time and without any early redemption of the other portions of the Southaven facility lease payments due to SCCG, to fully repay SHLLC's investment, upon which repayment SHLLC will transfer the membership interests to a designee of TVA.
TVA participated in the design, business conduct, and financial support of SCCG and has determined that it has a direct variable interest in SCCG resulting from risk associated with the value of the Southaven CCF at the end of the lease term. Based on its analysis, TVA has determined that it is the primary beneficiary of SCCG and, as such, is required to account for the VIE on a consolidated basis.
Impact on Consolidated Financial Statements
The financial statement items attributable to carrying amounts and classifications of JSCCG, Holdco, and SCCG as of
September 30, 2018
and
2017
, as reflected in the consolidated balance sheets, are as follows:
|
Summary of Impact of VIEs on Consolidated Balance Sheets
At September 30
|
|||||||
|
|
2018
|
2017
|
|||||
|
Current liabilities
|
|
|
|||||
|
Accrued interest
|
$
|
11
|
|
$
|
11
|
|
|
|
Accounts payable and accrued liabilities
|
2
|
|
2
|
|
|||
|
Current maturities of long-term debt of variable interest entities
|
38
|
|
36
|
|
|||
|
Total current liabilities
|
51
|
|
49
|
|
|||
|
Other liabilities
|
|||||||
|
Other long-term liabilities
|
28
|
|
30
|
|
|||
|
Long-term debt, net
|
|||||||
|
Long-term debt of variable interest entities, net
|
1,127
|
|
1,164
|
|
|||
|
Total liabilities
|
$
|
1,206
|
|
$
|
1,243
|
|
|
Interest expense of $
58 million
, $
59 million
, and $
61 million
related to debt of VIEs and membership interests of variable interest entity subject to mandatory redemption is included in the consolidated statements of operations for the years ended
September 30, 2018
,
2017
, and
2016
, respectively.
Creditors of the VIEs do not have any recourse to the general credit of TVA. TVA does not have any obligations to provide financial support to the VIEs other than as prescribed in the terms of the agreements related to these transactions.
11
.
Other Long-Term Liabilities
Other long-term liabilities consist primarily of liabilities related to certain derivative agreements as well as for environmental remediation liabilities and liabilities under agreements related to compliance with certain environmental regulations. See
Note 8
,
Note 15
—
Derivatives Not Receiving Hedge Accounting Treatment — Interest Rate Derivatives
, and
Note 21
—
Legal Proceedings — Environmental Agreements
. The table below summarizes the types and amounts of Other long-term liabilities:
102
|
Other Long-Term Liabilities
At September 30
|
|||||||
|
|
2018
|
2017
|
|||||
|
Interest rate swap liabilities
|
$
|
1,122
|
|
$
|
1,418
|
|
|
|
Gallatin coal combustion residual facilities liability
|
862
|
|
880
|
|
|||
|
Capital lease obligations
|
178
|
|
182
|
|
|||
|
Currency swap liabilities
|
81
|
|
92
|
|
|||
|
EnergyRight® financing obligation
|
102
|
|
115
|
|
|||
|
Environmental agreements liability
|
11
|
|
13
|
|
|||
|
Membership interests of VIE subject to mandatory redemption
|
28
|
|
30
|
|
|||
|
Commodity contract derivative liabilities
|
8
|
|
9
|
|
|||
|
Other
|
323
|
|
316
|
|
|||
|
Total other long-term liabilities
|
$
|
2,715
|
|
$
|
3,055
|
|
|
Interest Rate Swap Liabilities
. TVA uses interest rate swaps to fix variable short-term debt to a fixed rate. The values of these derivatives are included in Accounts payable and accrued liabilities and Other long-term liabilities on the consolidated balance sheets. As of
September 30, 2018
and
2017
, the carrying amount of the interest rate swap liabilities reported in Accounts payable and accrued liabilities was approximately $
77 million
and $
93 million
, respectively. See
Note 15
—
Derivatives Not Receiving Hedge Accounting Treatment
—
Interest Rate Derivative
s for information regarding the interest rate swap liabilities.
EnergyRight
®
Financing Obligation
. TVA purchases certain loans receivable from its LPCs in association with the EnergyRight
®
Solutions program. The current and long-term portions of the resulting financing obligation are reported in Accounts payable and accrued liabilities and Other long-term liabilities, respectively, on TVA’s consolidated balance sheets. As of
September 30, 2018
and
2017
, the carrying amount of the financing obligation reported in Accounts payable and accrued liabilities was approximately $
25 million
and $
29 million
, respectively. See
Note 6
for information regarding the associated loans receivable.
12
.
Asset Retirement Obligations
During the year ended
September 30, 2018
, TVA's total ARO liability
increased
$
475 million
.
To estimate its decommissioning obligation related to its nuclear generating stations, TVA uses a probability-weighted, discounted cash flow model which, on a unit-by-unit basis, considers multiple outcome scenarios that include significant estimations and assumptions. Those assumptions include (1) estimates of the cost of decommissioning, (2) the method of decommissioning and the timing of the related cash flows, (3) the license period of the nuclear plant, considering the probability of license extensions, (4) cost escalation factors, and (5) the credit adjusted risk free rate to measure the obligation at the present value of the future estimated costs. TVA has ascribed probabilities to two different decommissioning methods related to its nuclear decommissioning obligation estimate: the DECON method and the SAFSTOR method. The DECON method requires radioactive contamination to be removed from a site and safely disposed of or decontaminated to a level that permits the site to be released for unrestricted use shortly after it ceases operation. The SAFSTOR method allows nuclear facilities to be placed and maintained in a condition that allows the facilities to be safely stored and subsequently decontaminated to levels that permit release for unrestricted use.
TVA bases its nuclear decommissioning estimates on site-specific cost studies. The most recent study was approved and implemented in September 2017. An increase of $
250 million
was recorded to the nuclear AROs as a result of the updates. Site-specific cost studies are updated for each of TVA’s nuclear units at least every
five years
.
TVA also has decommissioning obligations related to its non-nuclear generating sites, ash impoundments, transmission substation and distribution assets, and certain general facilities. To estimate its decommissioning obligation related to these assets, TVA uses estimations and assumptions for the amounts and timing of future expenditures and makes judgments concerning whether or not such costs are considered a legal obligation. Those assumptions include (1) estimates of the costs of decommissioning, (2) the method of decommissioning and the timing of the related cash flows, (3) the expected retirement date of each asset, (4) cost escalation factors, and (5) the credit adjusted risk free rate to measure the obligation at the present value of the future estimated costs. TVA bases its decommissioning estimates for each asset on its identified preferred closure method.
During 2018, TVA recorded adjustments to non-nuclear ARO liabilities as a result of projects maturing and estimates being refined. This resulted in an increase of $
430 million
to the non-nuclear AROs. A majority of this increase was due to a change in closure method at Allen for the East Ash Pond and Coal Yard Runoff Pond, which changed from closure in place to
103
closure by removal and resulted in an increase of $
338 million
.
During 2017, TVA recorded adjustments to non-nuclear ARO liabilities as a result of projects maturing and estimates being refined. This resulted in an increase of
$161 million
to the non-nuclear AROs. This amount was offset by a decrease of
$188 million
to non-nuclear AROs due to the reversal of certain Gallatin AROs given that the retirement obligations for the Gallatin ash ponds are now recorded as part of environmental remediation obligations. See
Note 8
.
Additionally, during the years ended
September 30, 2018
and
2017
, both the nuclear and non-nuclear liabilities were increased by periodic accretion, partially offset by settlement projects that were conducted during these periods. The nuclear and non-nuclear accretion amounts were deferred as regulatory assets. During
2018
,
2017
, and
2016
,
$144 million
per year of the related regulatory assets were amortized into expense as these amounts were collected in rates. See
Note 7
. TVA maintains investment trusts to help fund its decommissioning obligations. See
Note 16
and
Note 21
—
Contingencies
—
Decommissioning Costs
for a discussion of the trusts' objectives and the current balances of the trusts.
|
Asset Retirement Obligation Activity
|
||||||||||||
|
|
Nuclear
|
Non-Nuclear
|
Total
|
|||||||||
|
Balance at September 30, 2016
|
$
|
2,492
|
|
$
|
1,560
|
|
$
|
4,052
|
|
|||
|
Settlements
|
—
|
|
(123
|
)
|
(123
|
)
|
||||||
|
Change in estimate
|
250
|
|
161
|
|
411
|
|
||||||
|
Additional obligations
|
—
|
|
1
|
|
1
|
|
||||||
|
Reclassification of Gallatin projects
(2)
|
—
|
|
(188
|
)
|
(188
|
)
|
||||||
|
Accretion (recorded to regulatory asset)
|
117
|
|
34
|
|
151
|
|
||||||
|
Balance at September 30, 2017
|
2,859
|
|
1,445
|
|
4,304
|
|
(1)
|
|||||
|
Settlements
|
—
|
|
(106
|
)
|
(106
|
)
|
||||||
|
Change in estimate
|
—
|
|
430
|
|
430
|
|
||||||
|
Additional obligations
|
—
|
|
1
|
|
1
|
|
||||||
|
Accretion (recorded to regulatory asset)
|
130
|
|
35
|
|
165
|
|
||||||
|
Asset Disposition
|
—
|
|
|
(15
|
)
|
(15
|
)
|
|||||
|
Balance at September 30, 2018
|
$
|
2,989
|
|
$
|
1,790
|
|
$
|
4,779
|
|
(1)
|
||
Notes
(1) The current portions of the ARO liability in the amounts
of $
115 million
a
nd $
128 million
as of
September 30, 2018
and
2017
, respectively, are included in Accounts payable and accrued liabilities.
(2) See
Note 8
for additional information.
13
.
Debt
and Other Obligations
General
The TVA Act authorizes TVA to issue Bonds in an amount not to exceed $
30.0 billion
at any time. At
September 30, 2018
, TVA had only
two
types of Bonds outstanding: power bonds and discount notes. Power bonds have maturities between
one
and
50 years
, and discount notes have maturities of less than
one year
. Power bonds and discount notes are both issued pursuant to Section 15d of the TVA Act and pursuant to
the Basic Tennessee Valley Authority Power Bond Resolution adopted by the TVA Board on October 6, 1960, as amended on September 28, 1976, October 17, 1989, and March 25, 1992 (the "Basic Resolution")
. Bonds are not obligations of the U.S., and the U.S. does not guarantee the payments of principal or interest on Bonds.
Power bonds and discount notes rank on parity and have first priority of payment from net power proceeds, which are defined as the remainder of TVA’s gross power revenues after deducting the costs of operating, maintaining, and administering its power properties and tax equivalent payments, but before deducting depreciation accruals or other charges representing the amortization of capital expenditures, plus the net proceeds from the sale or other disposition of any power facility or interest therein.
TVA considers its scheduled rent payments under its leaseback transactions, as well as its scheduled payments under its lease financing arrangements involving John Sevier CCF and Southaven CCF, as costs of operating, maintaining, and administering its power properties. Costs of operating, maintaining, and administering TVA's power properties have priority over TVA’s payments on the Bonds. Once net power proceeds have been applied to payments on power bonds and discount notes as well as any other Bonds that TVA may issue in the future that rank on parity with or subordinate to power bonds and discount notes, Section 2.3 of the Basic Resolution provides that the remaining net power proceeds shall be used only for (1) minimum payments into the U.S. Treasury required by the TVA Act as repayment of, and as a return on, the Power Program Appropriation
104
Investment, (2) investment in power assets, (3) additional reductions of TVA’s capital obligations, and (4) other lawful purposes related to TVA’s power program.
The TVA Act and the Basic Resolution each contain
two
bond tests: the rate test
and the bondholder protection test. Under the rate test, TVA must charge rates for power which will produce gross revenues sufficient to provide funds for, among other things, debt service on outstanding Bonds. As of
September 30, 2018
, TVA was in compliance with the rate test. See
Note 1
—
General.
Under the bondholder protection test, TVA must, in successive
five
-year periods, use an amount of net power proceeds at least equal to the sum of (1) the depreciation accruals and other charges representing the amortization of capital expenditures and (2) the net proceeds from any disposition of power facilities for either the reduction of its capital obligations (including Bonds and the Power Program Appropriation Investment) or investment in power assets. TVA met the bondholder protection test for the
five
-year period ended September 30, 2015, and must next meet the bondholder protection test for the
five
-year period ending September 30, 2020
.
Secured Debt of VIEs
On August 9, 2013, SCCG issued secured notes totaling $
360 million
that bear interest at a rate of
3.846 percent
. The SCCG notes require amortizing semi-annual payments on each February 15 and August 15, and mature on August 15, 2033. Also on August 9, 2013, SCCG issued $
40 million
of membership interests subject to mandatory redemption. The proceeds from the secured notes issuance and the issuance of the membership interests were paid to TVA in accordance with the terms of the Southaven head lease. See
Note 10
—
Southaven VIE
. TVA used the proceeds from the transaction primarily to fund the acquisition of the Southaven CCF from SSSL.
On January 17, 2012, JSCCG issued secured notes totaling $
900 million
in aggregate principal amount that bear interest at a rate of
4.626 percent
. Also on January 17, 2012, Holdco issued secured notes totaling $
100 million
that bear interest at a rate of
7.1 percent
. The JSCCG notes and the Holdco notes require amortizing semi-annual payments on each January 15 and July 15, and mature on January 15, 2042. The Holdco notes require a $
10 million
balloon payment upon maturity. See
Note 10
—
John Sevier VIEs
. TVA used the proceeds from the transaction to meet its requirements under the TVA Act. Secured debt of VIEs, including current maturities, outstanding at
September 30, 2018
and
2017
totaled approximately $
1.2 billion
each year.
Secured Notes
On July 20, 2016, TVA acquired two entities, in a business combination, designed to administer rent payments TVA makes under certain of its lease/leaseback arrangements. On September 27, 2000, the entities issued secured notes totaling
$255 million
that had an interest rate of
7.299 percent
and required amortizing semi-annual payments on each March 15 and September 15 with a maturity date of March 15, 2019. In 2016, TVA assumed these secured notes in the acquisition at a fair value of
$78 million
. The secured notes of the entities, including current maturities, outstanding at
September 30, 2018
and
2017
, totaled approximately $
20 million
and
$48 million
, respectively, and are included in Notes payable in TVA’s consolidated balance sheets.
On September 20, 2017, TVA acquired two entities, in an asset acquisition, designed to administer rent payments TVA makes under certain of its lease/leaseback arrangements. On November 14, 2001, the entities issued secured notes totaling
$272 million
that had an interest rate of
5.572 percent
and required amortizing semi-annual payments on each May 1 and November 1 with a maturity date of May 1, 2020. In 2017, TVA assumed these secured notes in the acquisition at a fair value of
$74 million
. The secured notes of the entities, including current maturities, outstanding at
September 30, 2018
, totaled approximately
$48 million
, and are included in Notes payable in TVA’s consolidated balance sheets. See
Note 9
.
Short-Term Debt
The following table provides information regarding TVA's short-term borrowings:
|
Short-term Borrowings
At September 30
|
|||||||||||
|
|
2018
|
2017
|
2016
|
||||||||
|
Gross amount outstanding - discount notes
|
$
|
1,217
|
|
$
|
1,999
|
|
$
|
1,407
|
|
||
|
Weighted average interest rate - discount notes
|
2.045
|
%
|
1.000
|
%
|
0.203
|
%
|
|||||
105
Put and Call Options
Bond issues of $
359 million
held by the public are redeemable in whole or in part, at TVA’s option, on call dates ranging from the present to
2020
and at call prices of
100 percent
the principal amount.
Nine
Bond issues totaling $
219 million
, with maturity dates ranging from
2025
to
2043
, include a “survivor’s option,” which allows for right of redemption upon the death of a beneficial owner in certain specified circumstances. These Bonds were classified as long-term as of
September 30, 2018
.
Additionally, TVA has
two
issues of PARRS outstanding. After a fixed-rate period of
five years
, the coupon rate on the PARRS may automatically be reset downward under certain market conditions on an annual basis. The coupon rate reset on the PARRS is based on a calculation. For both series of PARRS, the coupon rate will reset downward on the reset date if the rate calculated is below the then-current coupon rate on the Bond. The calculation dates, potential reset dates, and terms of the calculation are different for each series. The coupon rate on the 1998 Series D PARRS may be reset on June 1 (annually) if the sum of the
five
-day average of the 30-Year
Constant Maturity Treasury ("CMT")
rate for the week ending the last Friday in April, plus
94
basis points, is below the then-current coupon rate. The coupon rate on the 1999 Series A PARRS may be reset on May 1 (annually) if the sum of the
five
-day average of the 30-Year CMT rate for the week ending the last Friday in March, plus
84
basis points, is below the then-current coupon rate. The coupon rates may only be reset downward, but investors may request to redeem their Bonds at par value in conjunction with a coupon rate reset for a limited period of time prior to the reset dates under certain circumstances.
The coupon rate for the 1998 Series D PARRS, which mature in June 2028, has been reset
seven
times, from an initial rate of
6.750 percent
to the current rate of
3.550
percent. In connection with these resets, $
301 million
of the Bonds have been redeemed; therefore, $
274 million
of the Bonds were outstanding at
September 30, 2018
. The coupon rate for the 1999 Series A PARRS, which mature in May 2029, has been reset
six
times, from an initial rate of
6.50 percent
to the current rate of
3.360
percent. In connection with these resets, $
293 million
of the Bonds have been redeemed; therefore, $
232 million
of the Bonds were outstanding at
September 30, 2018
.
Due to the contingent nature of the put option on the PARRS, TVA determines whether the PARRS should be classified as long-term debt or current maturities of long-term debt by calculating the expected reset rate for the Bonds on the calculation dates, described above. If the expected reset rate is less than the then-current coupon rate on the PARRS, the PARRS are included in current maturities. Otherwise, the PARRS are included in long-term debt.
Debt Securities Activity
The table below summarizes the long-term debt securities activity for the period from October 1, 2017, to
September 30, 2018
.
|
Debt Securities Activity
For the years ended September 30
|
||||||||
|
|
2018
|
2017
|
||||||
|
Issues
|
|
|||||||
|
2017 Series A
|
$
|
—
|
|
$
|
1,000
|
|
||
|
2018 Series A
(1)
|
$
|
1,000
|
|
—
|
|
|||
|
Discount on debt issues
|
(2
|
)
|
(1
|
)
|
||||
|
Total
|
$
|
998
|
|
$
|
999
|
|
||
|
|
|
|||||||
|
Acquisitions
|
|
|||||||
|
Notes payable
(2)
|
$
|
—
|
|
$
|
74
|
|
||
|
|
|
|||||||
|
Redemptions/Maturities
(3)
|
|
|
||||||
|
Variable interest entities
|
$
|
36
|
|
$
|
35
|
|
||
|
Notes payable
|
53
|
|
27
|
|
||||
|
electronotes
®
|
52
|
|
5
|
|
||||
|
2009 Series B
|
29
|
|
28
|
|
||||
|
2001 Series D
|
—
|
|
525
|
|
||||
|
2007 Series A
|
—
|
|
1,000
|
|
||||
|
1997 Series E
|
650
|
|
—
|
|
||||
|
2008 Series B
|
1,000
|
|
—
|
|
||||
|
Total
|
$
|
1,820
|
|
$
|
1,620
|
|
||
Notes
(1) The 2018 Series A bonds were issued at
99.8 percent
of par.
(2) The related leaseback obligation of
$70 million
previously reported in Other liabilities in TVA's consolidated balance sheets was extinguished in the fourth quarter of 2017 as a result of TVA's acquisition of the equity interests in two SPEs. See
Note 9
for additional information.
(3) All redemptions were at
100 percent
of par.
106
Debt Outstanding
Total debt outstanding at
September 30, 2018
and
2017
, consisted of the following:
|
Short-Term Debt
At September 30
|
||||||||||||||
|
CUSIP or Other Identifier
|
Maturity
|
Call/(Put) Date
|
Coupon Rate
|
2018
|
2017
|
|||||||||
|
Short-term debt, net of discounts
|
|
|
|
$
|
1,216
|
|
$
|
1,998
|
|
|||||
|
Current maturities of long-term debt of variable interest entities issued at par
|
|
|
|
38
|
|
36
|
|
|||||||
|
Current maturities of notes payable
|
|
|
|
46
|
|
53
|
|
|||||||
|
Current maturities of power bonds issued at par
|
|
|||||||||||||
|
880591EQ1
|
10/15/2018
|
1.750%
|
1,000
|
|
—
|
|
||||||||
|
880591EF5
|
12/15/2018
|
3.770%
|
1
|
|
1
|
|
||||||||
|
880591EF5
|
6/15/2019
|
3.770%
|
29
|
|
28
|
|
||||||||
|
88059TEL1
|
11/15/2018
|
2.650%
|
1
|
|
1
|
|
||||||||
|
88059TEL1
|
5/15/2019
|
2.650%
|
1
|
|
2
|
|
||||||||
|
880591CU4
|
12/15/2017
|
6.250%
|
—
|
|
650
|
|
||||||||
|
880591EC2
|
4/1/2018
|
4.500%
|
—
|
|
1,000
|
|
||||||||
|
88059TFS5
|
10/15/2017
|
4.125%
|
—
|
|
46
|
|
||||||||
|
Total current maturities of power bonds issued at par
|
|
|
|
1,032
|
|
1,728
|
|
|||||||
|
Total current debt outstanding, net
|
|
|
|
$
|
2,332
|
|
$
|
3,815
|
|
|||||
107
TVA redeemed
$1.0 billion
of power bonds on October 15, 2018.
|
Long-Term Debt
At September 30
|
||||||||||||||||
|
CUSIP or Other Identifier
|
Maturity
|
Coupon
Rate
|
Effective Call Date
|
2018 Par
|
2017 Par
|
Stock Exchange Listings
|
||||||||||
|
electronotes
®(2)
|
5/15/2020 - 2/15/2043
|
2.375% - 3.625%
|
2/15/2015 - 2/15/2018(5)
|
$
|
221
|
|
$
|
226
|
|
None
|
||||||
|
880591EQ1
|
10/15/2018
|
1.750%
|
—
|
|
1,000
|
|
New York
|
|||||||||
|
880591EV0
|
3/15/2020
|
2.250%
|
1,000
|
|
—
|
|
New York
|
|||||||||
|
880591EL2
|
2/15/2021
|
3.875%
|
1,500
|
|
1,500
|
|
New York
|
|||||||||
|
880591DC3
|
6/7/2021
|
5.805%
|
(3)
|
261
|
|
(1)
|
268
|
|
New York, Luxembourg
|
|||||||
|
880591EN8
|
8/15/2022
|
1.875%
|
1,000
|
|
1,000
|
|
New York
|
|||||||||
|
880591ER9
|
9/15/2024
|
2.875%
|
1,000
|
|
1,000
|
|
New York
|
|||||||||
|
880591CJ9
|
11/1/2025
|
6.750%
|
1,350
|
|
1,350
|
|
New York, Hong Kong, Luxembourg, Singapore
|
|||||||||
|
880591EU2
|
2/1/2027
|
2.875%
|
1,000
|
|
1,000
|
|
New York
|
|||||||||
|
880591300
(4)
|
6/1/2028
|
3.550%
|
273
|
|
273
|
|
New York
|
|||||||||
|
880591409
(4)
|
5/1/2029
|
3.360%
|
232
|
|
232
|
|
New York
|
|||||||||
|
880591DM1
|
5/1/2030
|
7.125%
|
1,000
|
|
1,000
|
|
New York, Luxembourg
|
|||||||||
|
880591DP4
|
6/7/2032
|
6.587%
|
(3)
|
326
|
|
(1)
|
335
|
|
New York, Luxembourg
|
|||||||
|
880591DV1
|
7/15/2033
|
4.700%
|
472
|
|
472
|
|
New York, Luxembourg
|
|||||||||
|
880591EF5
|
6/15/2034
|
3.770%
|
273
|
|
303
|
|
None
|
|||||||||
|
880591DX7
|
6/15/2035
|
4.650%
|
436
|
|
436
|
|
New York
|
|||||||||
|
880591CK6
|
4/1/2036
|
5.980%
|
121
|
|
121
|
|
New York
|
|||||||||
|
880591CS9
|
4/1/2036
|
5.880%
|
1,500
|
|
1,500
|
|
New York
|
|||||||||
|
880591CP5
|
1/15/2038
|
6.150%
|
1,000
|
|
1,000
|
|
New York
|
|||||||||
|
880591ED0
|
6/15/2038
|
5.500%
|
500
|
|
500
|
|
New York
|
|||||||||
|
880591EH1
|
9/15/2039
|
5.250%
|
2,000
|
|
2,000
|
|
New York
|
|||||||||
|
880591EP3
|
12/15/2042
|
3.500%
|
1,000
|
|
1,000
|
|
New York
|
|||||||||
|
880591DU3
|
6/7/2043
|
4.962%
|
(3)
|
195
|
|
(1)
|
201
|
|
New York, Luxembourg
|
|||||||
|
880591CF7
|
7/15/2045
|
6.235%
|
7/15/2020
|
140
|
|
140
|
|
New York
|
||||||||
|
880591EB4
|
1/15/2048
|
4.875%
|
500
|
|
500
|
|
New York, Luxembourg
|
|||||||||
|
880591DZ2
|
4/1/2056
|
5.375%
|
1,000
|
|
1,000
|
|
New York
|
|||||||||
|
880591EJ7
|
9/15/2060
|
4.625%
|
1,000
|
|
1,000
|
|
New York
|
|||||||||
|
880591ES7
|
9/15/2065
|
4.250%
|
1,000
|
|
1,000
|
|
New York
|
|||||||||
|
Subtotal
|
|
20,300
|
|
20,357
|
|
|
||||||||||
|
Unamortized discounts, premiums, issue costs, and other
|
|
|
(143
|
)
|
(152
|
)
|
|
|||||||||
|
Total long-term outstanding power bonds, net
|
|
|
20,157
|
|
20,205
|
|
|
|||||||||
|
Long-term debt of variable interest entities, net
|
1,127
|
|
1,164
|
|
||||||||||||
|
Long-term notes payable
|
23
|
|
69
|
|
||||||||||||
|
Total long-term debt, net
|
$
|
21,307
|
|
$
|
21,438
|
|
||||||||||
Notes
(1) Includes net exchange gain from currency transactions of $
147 million
and $
125 million
at
September 30, 2018
and
2017
, respectively.
(2) Includes
one
electronotes
®
issue with partial maturities of principal for each required annual payment.
(3) The coupon rate represents TVA’s effective interest rate.
(4) TVA PARRS, CUSIP numbers 880591300 and 880591409, may be redeemed under certain conditions. See Put and Call Options above.
(5) The bonds are callable on or after the dates shown.
108
|
Maturities Due in the Year Ending September 30
|
|||||||||||||||||||||||||||
|
|
2019
|
2020
|
2021
|
2022
|
2023
|
Thereafter
|
Total
|
||||||||||||||||||||
|
Long-term power bonds, long-term debt of variable interest entities, and notes payable including current maturities
(1)
|
$
|
1,116
|
|
$
|
1,092
|
|
$
|
1,901
|
|
$
|
1,072
|
|
$
|
69
|
|
$
|
17,474
|
|
$
|
22,724
|
|
||||||
|
Short-term debt, net of discounts
|
1,216
|
|
—
|
|
—
|
|
—
|
|
—
|
|
—
|
|
1,216
|
|
|||||||||||||
Note
(1) Long-term power bonds does not include non-cash items of foreign currency exchange gain of $
147 million
, unamortized debt issue costs of
$56 million
, and net discount on sale of Bonds of $
88 million
. Long-term debt of VIE does not include non-cash item of unamortized debt issue costs of $
10 million
.
Credit Facility Agreements
TVA and the U.S. Treasury, pursuant to the TVA Act, have entered into a memorandum of understanding under which the U.S. Treasury provides TVA with a $
150 million
credit facility. This credit facility was renewed in 2018 with a maturity date of September 30, 2019. Access to this credit facility or other similar financing arrangements with the U.S. Treasury has been available to TVA since the 1960s. TVA can borrow under the U.S. Treasury credit facility only if it cannot issue Bonds in the market on reasonable terms, and TVA considers the U.S. Treasury credit facility a secondary source of liquidity. The interest rate on any borrowing under this facility is based on the average rate on outstanding marketable obligations of the U.S. with maturities from date of issue of one year or less. There were
no
outstanding borrowings under the facility at
September 30, 2018
. The availability of this credit facility may be impacted by how the U.S. government addresses the possibility of approaching its debt limit.
TVA also has funding available under the
four
long-term revolving credit facilities totaling
$2.7 billion
: a
$150 million
credit facility that matures on December 12, 2019, a
$500 million
credit facility that matures on February 1, 2022, a
$1.0 billion
credit facility that matures on June 13, 2023, and a
$1.0 billion
credit facility that matures on September 28, 2023. The interest rate on any borrowing under these facilities varies based on market factors and the rating of TVA's senior unsecured, long-term, non-credit-enhanced debt. TVA is required to pay an unused facility fee on the portion of the total
$2.7 billion
that TVA has not borrowed or committed under letters of credit. This fee, along with letter of credit fees, may fluctuate depending on the rating of TVA's senior unsecured, long-term, non-credit-enhanced debt. At
September 30, 2018
and 2017, there were
$921 million
and
$1.2 billion
, respectively, of letters of credit outstanding under the facilities, and there were
no
borrowings outstanding. See
Note 15
—
Other Derivative Instruments
—
Collateral
.
The following table provides additional information regarding TVA's funding available under the
four
long-term revolving credit facilities:
|
Summary of Long-Term Credit Facilities
At September 30, 2018
|
|||||||||||||||
|
Maturity Date
|
Facility Limit
|
Letters of Credit Outstanding
|
Cash Borrowings
|
Availability
|
|||||||||||
|
December 2019
|
$
|
150
|
|
$
|
38
|
|
$
|
—
|
|
$
|
112
|
|
|||
|
February 2022
|
500
|
|
500
|
|
—
|
|
—
|
|
|||||||
|
June 2023
|
1,000
|
|
383
|
|
—
|
|
617
|
|
|||||||
|
September 2023
|
1,000
|
|
—
|
|
—
|
|
1,000
|
|
|||||||
|
Total
|
$
|
2,650
|
|
$
|
921
|
|
$
|
—
|
|
$
|
1,729
|
|
|||
Lease/Leasebacks
Prior to 2004, TVA received approximately
$945 million
in proceeds by entering into lease/leaseback transactions for
24
new peaking
CTs. TVA also received approximately
$389 million
in proceeds by entering into lease/leaseback transactions for
qualified technological equipment and software ("QTE")
in 2003.
Due to TVA's continuing involvement in the operation and maintenance of the leased units and equipment and its control over the distribution of power produced by the combustion turbine facilities during the leaseback term, TVA accounted for the lease proceeds as financing obligations. On September 20, 2017, TVA acquired
100
percent of the equity interests in
two
SPEs
created for the purpose of facilitating a portion
of the leaseback arrangements. See
Note 9
. As a result of the acquisition, TVA effectively settled $
70 million
of its leaseback obligations related to
eight
CTs. On July 20, 2016, TVA acquired
100 percent
of the equity interests in two SPEs created for the purpose of facilitating lease/leaseback arrangements. As a result of the acquisition, TVA effectively settled $
70 million
of its leaseback obligations related to eight CTs. At
September 30, 2018
and
2017
, the outstanding le
aseback obligations related to the remaining CTs and QTE were
$301 million
and
$338 million
, respectively.
109
14
.
Accumulated Other Comprehensive Income (Loss)
AOCI represents market valuation adjustments related to TVA’s currency swaps. The currency swaps are cash flow hedges and are the only derivatives in TVA’s portfolio that have been designated and qualify for hedge accounting treatment. TVA records exchange rate gains and losses on its foreign currency-denominated debt, and any related accrued interest in net income and marks its currency swap assets and liabilities to market through
other comprehensive income (loss) ("OCI")
. TVA then reclassifies an amount out of AOCI into net income, offsetting the exchange gain/loss recorded on the debt. For the years ended
September 30, 2018
and
2017
, TVA reclassified
$26 million
of losses and $
26 million
of gains, respectively, related to its cash flow hedges from AOCI to Interest expense. See
Note 15
.
TVA records certain assets and liabilities that result from the regulated ratemaking process that would not be recorded under GAAP for non-regulated entities. As such, certain items that would generally be reported in AOCI or that would impact the statements of operations are recorded as regulatory assets or regulatory liabilities. See
Note 7
for a schedule of regulatory assets and liabilities. See
Note 15
for a discussion of the recognition in AOCI of gains and losses associated with certain derivative contracts. See
Note 16
for a discussion of the recognition of certain investment fund gains and losses as regulatory assets and liabilities. See
Note 20
for a discussion of the regulatory accounting related to components of TVA’s benefit plans.
15
.
Risk Management Activities and Derivative Transactions
TVA is exposed to various risks. These include risks related to commodity prices, investment prices, interest rates, currency exchange rates, and inflation as well as counterparty credit and performance risks. To help manage certain of these risks, TVA has historically entered into various derivative transactions, principally commodity option contracts, forward contracts, swaps, swaptions, futures, and options on futures. Other than certain derivative instruments in its trust investment funds, it is TVA’s policy to enter into these derivative transactions solely for hedging purposes and not for speculative purposes. TVA has suspended its FTP and no longer uses financial instruments to hedge risks related to commodity prices; however, TVA plans to continue to manage fuel price volatility through other methods and to periodically reevaluate its suspended FTP program for future use of financial instruments.
Overview of Accounting Treatment
TVA recognizes certain of its derivative instruments as either assets or liabilities on its consolidated balance sheets at fair value. The accounting for changes in the fair value of these instruments depends on (1) whether TVA uses regulatory accounting to defer the derivative gains and losses, (2) whether the derivative instrument has been designated and qualifies for hedge accounting treatment, and (3) if so, the type of hedge relationship (for example, cash flow hedge).
The following tables summarize the accounting treatment that certain of TVA's financial derivative transactions receive:
|
Summary of Derivative Instruments That Receive Hedge Accounting Treatment (part 1)
Amount of Mark-to-Market Gain (Loss) Recognized in Accumulated Other Comprehensive Income (Loss)
For the years ended September 30
|
||||||||||||
|
Derivatives in Cash Flow Hedging Relationship
|
Objective of Hedge Transaction
|
Accounting for Derivative
Hedging Instrument
|
2018
|
2017
|
||||||||
|
Currency swaps
|
To protect against changes in cash flows caused by changes in foreign currency exchange rates (exchange rate risk)
|
Unrealized gains and losses are recorded in AOCI and reclassified to interest expense to the extent they are offset by gains and losses on the hedged transaction
|
$
|
10
|
|
$
|
59
|
|
||||
|
Summary of Derivative Instruments That Receive Hedge Accounting Treatment (part 2)
(1)
Amount of Gain (Loss) Reclassified from Accumulated Other Comprehensive Income to Interest Expense
For the years ended September 30
|
||||||||
|
Derivatives in Cash Flow Hedging Relationship
|
2018
|
2017
|
||||||
|
Currency swaps
|
$
|
(26
|
)
|
$
|
26
|
|
||
Note
(1) There were
no
ineffective portions or amounts excluded from effectiveness testing for any of the periods presented. Based on forecasted foreign currency exchange rates, TVA expects to reclassify approximately
$28 million
of gains from AOCI to interest expense within the next 12 months to offset amounts anticipated to be recorded in interest expense related to exchange gain on the debt.
110
|
Summary of Derivative Instruments That Do Not Receive Hedge Accounting Treatment
Amount of Gain (Loss) Recognized in Income on Derivatives
(1)
For the years ended September 30
|
||||||||||||
|
|
|
|
|
|
|
|||||||
|
Derivative Type
|
Objective of Derivative
|
Accounting for Derivative Instrument
|
2018
|
2017
|
||||||||
|
Interest rate swaps
|
To fix short-term debt variable rate to a fixed rate (interest rate risk)
|
Mark-to-Market gains and losses are recorded as regulatory assets or liabilities
Realized gains and losses are recognized in interest expense when incurred during the settlement period
|
$
|
(89
|
)
|
$
|
(101
|
)
|
||||
|
Commodity derivatives
under FTP
|
To protect against fluctuations in market prices of purchased commodities (price risk)
|
Mark-to-Market gains and losses are recorded as regulatory assets or liabilities
Realized gains and losses are recognized in fuel expense or purchased power expense when the related commodity is used in production
|
(8
|
)
|
(36
|
)
|
||||||
Note
(1) All of TVA's derivative instruments that do not receive hedge accounting treatment have unrealized gains (losses) that would otherwise be recognized in income but instead are deferred as regulatory assets and liabilities. As such, there was
no
related gain (loss) recognized in income for these unrealized gains (losses) for the years ended
September 30, 2018
and
2017
.
|
Fair Values of TVA Derivatives
At September 30
|
|||||||||||
|
|
2018
|
2017
|
|||||||||
|
Derivatives That Receive Hedge Accounting Treatment:
|
|||||||||||
|
|
Balance
|
Balance Sheet Presentation
|
Balance
|
Balance Sheet Presentation
|
|||||||
|
Currency swaps
|
|
|
|
|
|||||||
|
£200 million Sterling
|
$
|
(67
|
)
|
Accounts payable and accrued liabilities $(5); Other long-term liabilities $(62)
|
$
|
(67
|
)
|
Accounts payable and accrued liabilities $(5); Other long-term liabilities $(62)
|
|||
|
£250 million Sterling
|
(12
|
)
|
Accounts payable and accrued liabilities $(5); Other long-term liabilities $(7)
|
(15
|
)
|
Accounts payable and accrued liabilities $(4); Other long-term liabilities $(11)
|
|||||
|
£150 million Sterling
|
(15
|
)
|
Accounts payable and accrued liabilities $(3); Other long-term liabilities $(12)
|
(21
|
)
|
Accounts payable and accrued liabilities $(2); Other long-term liabilities $(19)
|
|||||
|
Derivatives That Do Not Receive Hedge Accounting Treatment:
|
|||||||||||
|
|
Balance
|
Balance Sheet Presentation
|
Balance
|
Balance Sheet Presentation
|
|||||||
|
Interest rate swaps
|
|
|
|
|
|||||||
|
$1.0 billion notional
|
$
|
(878
|
)
|
Accounts payable and
accrued liabilities $(56); Other long-term liabilities $(822) |
$
|
(1,093
|
)
|
Accounts payable and
accrued liabilities $(66); Other long-term liabilities $(1,027) |
|||
|
$476 million notional
|
(317
|
)
|
Accounts payable and
accrued liabilities $(20); Other long-term liabilities $(297) |
(410
|
)
|
Accounts payable and
accrued liabilities $(25); Other long-term liabilities $(385) |
|||||
|
$42 million notional
|
(4
|
)
|
Accounts payable and
accrued liabilities $(1); Other long-term liabilities $(3) |
(8
|
)
|
Accounts payable and
accrued liabilities $(2); Other long-term liabilities $(6) |
|||||
|
Commodity contract derivatives
|
60
|
|
Other current assets $41; Other long-term assets $31; Other long-term liabilities $(8); Accounts payable and accrued liabilities $(4)
|
(60
|
)
|
Other current assets $8; Other long-term assets $2; Other long-term liabilities $(9); Accounts payable and accrued liabilities $(61)
|
|||||
|
FTP
|
|
||||||||||
|
Derivatives under FTP
(1)
|
—
|
|
N/A
|
(5
|
)
|
Other current assets $(4); Accounts payable and accrued liabilities $(1)
|
|||||
Note
(1)
Fair values of certain derivatives under the FTP that were in net liability positions totaling $
4 million
at September 30,
2017
, were recorded in TVA's margin cash accounts in Other current assets. These derivatives were transacted with futures commission merchants, and cash deposits were posted to the margin cash accounts held with each futures commission merchant to offset the net liability positions in full. At September 30, 2018, TVA had
no
derivatives under the FTP in net liability positions.
111
Cash Flow Hedging Strategy for Currency Swaps
To protect against exchange rate risk related to
three
British pound sterling denominated Bond transactions, TVA entered into foreign currency hedges at the time the Bond transactions occurred. TVA had the following currency swaps outstanding at
September 30, 2018
:
|
Currency Swaps Outstanding
At September 30, 2018
|
||||||
|
Effective Date of Currency Swap Contract
|
Associated TVA Bond Issues Currency Exposure
|
Expiration Date of Swap
|
Overall Effective
Cost to TVA
|
|||
|
1999
|
£200 million
|
2021
|
5.81%
|
|||
|
2001
|
£250 million
|
2032
|
6.59%
|
|||
|
2003
|
£150 million
|
2043
|
4.96%
|
|||
When the dollar strengthens against the British pound sterling, the exchange gain on the Bond liability and related accrued interest is offset by an equal amount of loss on the swap contract that is reclassified out of AOCI. Conversely, the exchange loss on the Bond liability and related accrued interest is offset by an equal amount of gain on the swap contract that is reclassified out of AOCI. All such exchange gains or losses on the Bond liability and related accrued interest are included in Long-term debt, net and Accounts payable and accrued liabilities, respectively. The offsetting exchange losses or gains on the swap contracts are recognized in AOCI. If any gain (loss) were to be incurred as a result of the early termination of the foreign currency swap contract, the resulting income (expense) would be amortized over the remaining life of the associated Bond as a component of Interest expense. The values of the currency swap liabilities are included in Accounts payable and accrued liabilities and Other long-term liabilities on the consolidated balance sheets.
Derivatives Not Receiving Hedge Accounting Treatment
Interest Rate Derivatives
. Generally TVA uses interest rate swaps to fix variable short-term debt to a fixed rate, and TVA uses regulatory accounting treatment to defer the MtM gains and losses on its interest rate swaps. The net deferred unrealized gains and losses are classified as regulatory assets or liabilities on TVA's consolidated balance sheets and are included in the ratemaking formula when gains or losses are realized. The values of these derivatives are included in Accounts payable and accrued liabilities and Other long-term liabilities on the consolidated balance sheets, and realized gains and losses, if any, are included in TVA's consolidated statements of operations. For the years ended
September 30, 2018
and
2017
, the changes in market value of the interest rate derivatives resulted in deferred unrealized gains of $
310 million
and $
472 million
, respectively.
Commodity Derivatives
. TVA enters into certain derivative contracts for coal and natural gas that require physical delivery of the contracted quantity of the commodity. TVA marks to market all such contracts and defers the fair values as regulatory assets or liabilities on a gross basis. At
September 30, 2018
, TVA's coal contract derivatives had terms of up to
three
years and TVA's natural gas contract derivatives had terms of up to
four
years.
|
Commodity Contract Derivatives
At September 30
|
|||||||||||||||
|
|
2018
|
2017
|
|||||||||||||
|
|
Number of
Contracts
|
Notional Amount
|
Fair Value (MtM)
|
Number of Contracts
|
Notional Amount
|
Fair Value
(
MtM
)
|
|||||||||
|
Coal contract derivatives
|
13
|
20 million tons
|
$
|
58
|
|
20
|
17 million tons
|
$
|
(67
|
)
|
|||||
|
Natural gas contract derivatives
|
61
|
359 million mmBtu
|
$
|
2
|
|
53
|
271 million mmBtu
|
$
|
7
|
|
|||||
Derivatives Under FTP.
TVA has suspended its FTP and no longer uses financial instruments to he
dge risks
related to commodity prices. At
September 30, 2018
, TVA had
no
open commodity derivatives under the FTP.
Under the FTP, TVA was authorized to purchase and sell futures, swaps, options, and combinations of these instruments (as long as they were standard in the industry) to hedge TVA’s exposure to (1) the price of natural gas, fuel oil, electricity, coal, emission allowances, nuclear fuel, and other commodities included in TVA’s fuel cost adjustment calculation, (2) the price of construction materials, and (3) contracts for goods priced in or indexed to foreign currencies. The combined transaction limit for the fuel cost adjustment and construction material transactions was $
130 million
(based on one-day value at risk). In addition, the maximum hedge volume for the construction material transactions was
75 percent
of the underlying net notional volume of the material that TVA anticipated using in approved TVA projects, and the market value of all outstanding hedging transactions involving construction materials was limited to $
100 million
at the execution of any new transaction. The portfolio value at risk limit for the foreign currency transactions was $
5 million
and was separate and distinct from the $
130 million
transaction limit discussed above. TVA's policy prohibits trading financial instruments under the FTP for speculative purposes.
112
|
Derivatives under Financial Trading Program
(1)
At September 30
|
|||||||||||||
|
|
2018
|
2017
|
|||||||||||
|
|
Notional Amount
(in mmBtu)
|
Fair Value (MtM)
(in millions)
|
Notional Amount
(in mmBtu)
|
Fair Value (MtM)
(in millions)
|
|||||||||
|
Natural gas
|
|
|
|
|
|||||||||
|
Swap contracts
|
—
|
|
$
|
—
|
|
2,800,000
|
|
$
|
(5
|
)
|
|||
Note
(1) Fair value amounts presented are based on the net commodity position with the counterparty. Notional amounts disclosed represent the net value of contractual amounts.
Prior to the suspension of the FTP, TVA deferred all FTP unrealized gains (losses) as regulatory liabilities (assets) and recorded only realized gains or losses to match the delivery period of the underlying commodity. In addition to the open commodity derivatives disclosed above, TVA had closed derivative contracts with a market value of $
(3) million
at September 30,
2017
. TVA experienced the following unrealized and realized gains and losses related to the FTP at the dates and during the periods, as applicable, set forth in the tables below:
|
Financial Trading Program Unrealized Gains (Losses)
At September 30
|
||||||||
|
FTP unrealized gains (losses) deferred as regulatory liabilities (assets)
|
2018
|
2017
|
||||||
|
Natural gas
|
$
|
—
|
|
$
|
(5
|
)
|
||
|
Financial Trading Program Realized Gains (Losses)
At September 30
|
||||||||
|
Decrease (increase) in fuel expense
|
2018
|
2017
|
||||||
|
Natural gas
|
$
|
(6
|
)
|
$
|
(29
|
)
|
||
|
Decrease (increase) in purchased power expense
|
||||||||
|
Natural gas
|
$
|
(2
|
)
|
$
|
(7
|
)
|
||
113
Offsetting of Derivative Assets and Liabilities
The amounts of TVA's derivative instruments as reported in the consolidated balance sheets as of
September 30, 2018
and 2017, are shown in the table below.
|
Derivative Assets and Liabilities
|
|||||||||||
|
|
At September 30, 2018
|
||||||||||
|
Gross Amounts of Recognized Assets/Liabilities
|
Gross Amounts Offset in the Balance Sheet
(1)
|
Net Amounts of Assets/Liabilities Presented in the Balance Sheet
(2)
|
|||||||||
|
Assets
|
|||||||||||
|
Commodity derivatives not subject to master netting or similar arrangement
|
$
|
72
|
|
$
|
—
|
|
$
|
72
|
|
||
|
Liabilities
|
|||||||||||
|
Currency swaps
(3)
|
$
|
94
|
|
$
|
—
|
|
$
|
94
|
|
||
|
Interest rate swaps
(3)
|
1,199
|
|
—
|
|
1,199
|
|
|||||
|
Total derivatives subject to master netting or similar arrangement
|
1,293
|
|
—
|
|
1,293
|
|
|||||
|
Commodity derivatives not subject to master netting or similar arrangement
|
12
|
|
—
|
|
12
|
|
|||||
|
Total liabilities
|
$
|
1,305
|
|
$
|
—
|
|
$
|
1,305
|
|
||
|
|
At September 30, 2017
|
||||||||||
|
Gross Amounts of Recognized Assets/Liabilities
|
Gross Amounts Offset in the Balance Sheet
(1)
|
Net Amounts of Assets/Liabilities Presented in the Balance Sheet
(2)
|
|||||||||
|
Assets
|
|||||||||||
|
Commodity derivatives not subject to master netting or similar arrangement
|
10
|
|
—
|
|
10
|
|
|||||
|
Liabilities
|
|||||||||||
|
Currency swaps
(3)
|
$
|
103
|
|
$
|
—
|
|
$
|
103
|
|
||
|
Interest rate swaps
(3)
|
1,511
|
|
—
|
|
1,511
|
|
|||||
|
Commodity derivatives under FTP
|
5
|
|
(4
|
)
|
1
|
|
|||||
|
Total derivatives subject to master netting or similar arrangement
|
1,619
|
|
(4
|
)
|
1,615
|
|
|||||
|
Commodity derivatives not subject to master netting or similar arrangement
|
70
|
|
—
|
|
70
|
|
|||||
|
Total liabilities
|
$
|
1,689
|
|
$
|
(4
|
)
|
$
|
1,685
|
|
||
Notes
(1) Amounts primarily include counterparty netting of derivative contracts, margin account deposits for futures commission merchants transactions, and cash collateral received or paid in accordance with the accounting guidance for derivatives and hedging transactions.
(2) There are no derivative contracts subject to a master netting arrangement or similar agreement which are not offset in the consolidated balance sheets.
(3) Letters of credit of approximately
$921 million
and $
1.2 billion
were posted as collateral at
September 30, 2018
and
2017
, respectively, to partially secure the liability positions of one of the currency swaps and one of the interest rate swaps in accordance with the collateral requirements for these derivatives.
Other Derivative Instruments
Investment Fund Derivatives
. Investment funds consist primarily of funds held in the NDT, ART, SERP, and DCP. All securities in the trusts are classified as trading. See
Note 16
—
Investments Funds
for a discussion of the trusts' objectives and the types of investments that they hold. The NDT and ART may invest in derivative instruments which may include swaps, futures, options, forwards, and other instruments. At
September 30, 2018
and
2017
, the NDT held investments in forward contracts to purchase debt securities. The fair values of these derivatives were in
asset
positions totaling
$45 million
and
$19 million
at
September 30, 2018
and
2017
, respectively.
Collateral
. TVA's interest rate swaps and currency swaps contain contract provisions that require a party to post collateral (in a form such as cash or a letter of credit) when the party's liability balance under the agreement exceeds a certain threshold. At
September 30, 2018
, the aggregate fair value of all derivative instruments with credit-risk related contingent features that were in a liability position was
$1.3 billion
. TVA's collateral obligations at
September 30, 2018
, under these arrangements, were approximately
$875 million
, for which TVA had posted approximately
$921 million
in letters of credit. These letters of credit reduce the available balance under the related credit facilities. TVA's assessment of the risk of its nonperformance includes a reduction in its exposure under the contract as a result of this posted collateral.
114
For all of its derivative instruments with credit-risk related contingent features:
|
•
|
If TVA remains a majority-owned U.S. government entity but
Standard & Poor's Financial Services, LLC ("S&P")
or
Moody's Investors Service, Inc. ("Moody's")
downgrades TVA's credit rating to AA or Aa2, respectively, TVA's collateral obligations would likely increase by
$22 million
; and
|
|
•
|
If TVA ceases to be majority-owned by the U.S. government, TVA's credit rating would likely be downgraded and TVA would be required to post additional collateral.
|
Counterparty Risk
TVA may be exposed to certain risks when a counterparty has the potential to fail to meet its obligations in accordance with agreed terms. These risks may be related to credit, operational, or nonperformance matters. To mitigate certain counterparty risk, TVA analyzes the counterparty’s financial condition prior to entering into an agreement, establishes credit limits, monitors the appropriateness of those limits, as well as any changes in the creditworthiness of the counterparty, on an ongoing basis, and when required, employs credit mitigation measures, such as collateral or prepayment arrangements and master purchase and sale agreements, to mitigate credit risk.
Customers
. TVA is exposed to counterparty credit risk associated with trade accounts receivable from delivered power sales to LPCs, and from industries and federal agencies directly served, all located in the Tennessee Valley region. Of the
$1.6 billion
and
$1.4 billion
of receivables from power sales outstanding at
September 30, 2018
and
2017
, respectively, nearly all counterparties were rated investment grade. TVA is also exposed to risk from exchange power arrangements with a small number of investor-owned regional utilities related to either delivered power or the replacement of open positions of longer-term purchased power or fuel agreements. TVA believes its policies and procedures for counterparty performance risk reviews have generally protected TVA against significant exposure related to market and economic conditions. See
Note 1
—
Allowance for Uncollectible Accounts
and
Note 3
.
TVA had revenue from
two
LPCs that accounted for
17
percent of total operating revenue for the years ended both
September 30, 2018
and
September 30, 2017
.
Suppliers
. If one of TVA's fuel or purchased power suppliers fails to perform under the terms of its contract with TVA, TVA might lose the mone
y that it paid to the supplier under the contract and have to purchase replacement fuel or power on the spot market, perhaps at a significantly higher price than TVA was entitled to pay under the contract. In addition, TVA might not be able to acquire replacement fuel or power in a timely manner and thus might be unable to satisfy its own obligations to deliver power. Nuclear fuel requirements, including uranium mining and milling, conversion services, enrichment services, and fabrication services, are met from various suppliers, depending on the type of service. TVA purchases the majority of its natural gas requirements from a variety of suppliers under short-term contracts.
To help ensure a reliable supply of coal, TVA had coal contracts with multiple suppliers at
September 30, 2018
.
The contracted su
pply of coal is sourced from multiple geographic regions of the U.S. and is to be delivered via various transportation methods (i.e., barge, rail, and truck). Emerging technologies, environmental regulations, and low natural gas prices have contributed to weak demand for coal. As a result, coal suppliers are facing increased financial pressure, which has led to relatively poor credit ratings and bankruptcies. Continued difficulties by coal suppliers could result in consolidations, additional bankruptcies, restructurings, contract renegotiations, or other scenarios. Under these scenarios and TVA’s potential available responses, TVA does not anticipate a significant financial impact in obtaining continued fuel supply for its coal-fired generation.
On March 29, 2017, Westinghouse, a subsidiary of Toshiba Corporation ("Toshiba"), filed for protection under Chapter 11 of the U.S. Bankruptcy Code. On January 4, 2018, Brookfield Business Partners L.P. ("Brookfield Business Partners"), together with institutional partners, announced that they have entered into an agreement to acquire 100 percent of Westinghouse. Westinghouse has emerged from bankruptcy and the sale was closed and became effective on August 1, 2018.
TVA has a power purchase agreement that expires on March 31, 2032, with a supplier of electricity for
440
megawatts ("MW")
of summer net capability from a lignite-fired generating plant. TVA has determined that the supplier has the equivalent of a non-investment grade credit rating; therefore, the supplier has provided credit assurance to TVA under the terms of the agreement.
Derivative Counterparties
.
TVA has entered into physical and financial contracts that qualify as derivatives for hedging purposes, and TVA's NDT fund and qualified defined benefit pension plan have entered into derivative contracts for investment purposes. If a counterparty to one of TVA's hedging transactions defaults, TVA might incur substantial costs in connection with entering into a replacement hedging transaction. If a counterparty to the derivative contracts into which the NDT fund and the qualified pension plan have entered for investment purposes defaults, the value of the investment could decline significantly or perhaps become worthless. TVA has concentrations of credit risk from the banking and coal industries because multiple companies in these industries serve as counterparties to TVA in various derivative transactions.
At
September 30, 2018
, all of
115
TVA's currency swaps and interest rate swaps as well as all of the derivatives in the NDT were with banking counterparties whose Moody's credit ratings were
A3
or higher.
TVA classifies qualified forward coal and natural gas contracts as derivatives. See
Derivatives Not Receiving Hedge Accounting Treatment
above. At
September 30, 2018
, the coal contracts were with counterparties whose Moody's credit rating, or TVA’s internal analysis when such information was unavailable, ranged from
Caa3
to
Ba3
. At
September 30, 2018
, the natural gas contracts were with counterparties whose ratings ranged from
B1
to
A2
. See
Suppliers
above for discussion of challenges facing the coal industry. TVA's total value for derivative contracts with coal and natural gas counterparties in an asset position as of
September 30, 2018
, was approximately
$72 million
.
TVA previously utilized two futures commission merchants ("FCMs") to clear commodity contracts, including futures, options, and similar financial derivatives. These transactions were executed under the FTP on exchanges by the FCMs on behalf of TVA. TVA maintained margin cash accounts with the F
CMs. TVA made deposits to the margin cash accounts to adequately cover any net liability positions on its derivatives transacted with the FC
Ms. At
September 30, 2018
, TVA had
no
positions under the FTP. See the note to the
Fair Values of TVA Derivatives
table above.
16
.
Fair Value Measurements
Fair value is determined based on the exchange price that would be received for an asset or paid to transfer a liability (an exit price) in the asset or liability's principal market, or in the absence of a principal market, the most advantageous market for the asset or liability in an orderly transaction between market participants. TVA uses market or observable inputs as the preferred source of values, followed by assumptions based on hypothetical transactions in the absence of market inputs.
Valuation Techniques
The measurement of fair value results in classification into a hierarchy by the inputs used to determine the fair value as follows:
|
Level 1
|
—
|
Unadjusted quoted prices in active markets accessible by the reporting entity for identical assets or liabilities. Active markets are those in which transactions for the asset or liability occur with sufficient frequency and volume to provide pricing.
|
|
|
Level 2
|
—
|
Pricing inputs other than quoted market prices included in Level 1 that are based on observable market data and that are directly or indirectly observable for substantially the full term of the asset or liability. These include quoted market prices for similar assets or liabilities, quoted market prices for identical or similar assets in markets that are not active, adjusted quoted market prices, inputs from observable data such as interest rate and yield curves, volatilities and default rates observable at commonly quoted intervals, and inputs derived from observable market data by correlation or other means.
|
|
|
Level 3
|
—
|
Pricing inputs that are unobservable, or less observable, from objective sources. Unobservable inputs are only to be used to the extent observable inputs are not available. These inputs maintain the concept of an exit price from the perspective of a market participant and should reflect assumptions of other market participants. An entity should consider all market participant assumptions that are available without unreasonable cost and effort. These are given the lowest priority and are generally used in internally developed methodologies to generate management's best estimate of the fair value when no observable market data is available.
|
|
A financial instrument's level within the fair value hierarchy (where Level 1 is the highest and Level 3 is the lowest) is based on the lowest level of input significant to the fair value measurement.
The following sections describe the valuation methodologies TVA uses to measure different financial instruments at fair value. Except for gains and losses on SERP and DCP assets, all changes in fair value of these assets and liabilities have been recorded as changes in regulatory assets, regulatory liabilities, or AOCI on TVA's consolidated balance sheets and consolidated statements of comprehensive income (loss). Except for gains and losses on SERP and DCP assets, there has been no impact to the consolidated statements of operations or the consolidated statements of cash flows related to these fair value measurements.
Investment Funds
At
September 30, 2018
, Investment funds were composed of
$2.9 billion
of securities classified as trading and measured at fair value. Trading securities are held in the NDT, ART, SERP, and DCP. The NDT holds funds for the ultimate decommissioning of TVA's nuclear power plants. The ART holds funds primarily for the costs related to the future closure and retirement of TVA's other long-lived assets. The balances in the NDT and ART were
$2.1 billion
and
$714 million
, respectively, at
September 30, 2018
.
116
TVA established a SERP to provide benefits to selected employees of TVA which are comparable to those provided by competing organizations. The DCP is designed to provide participants with the ability to defer compensation until employment with TVA ends. The NDT, ART, SERP, and DCP funds are invested in portfolios of securities generally designed to achieve a return in line with overall equity and debt market performance.
The NDT, ART, SERP, and DCP are composed of multiple types of investments and are managed by external institutional investment managers. Most U.S. and international equities, U.S. Treasury inflation-protected securities, real estate investment trust securities, and cash securities and certain derivative instruments are measured based on quoted exchange prices in active markets and are classified as Level 1 valuations. Fixed-income investments, high-yield fixed-income investments, currencies, and most derivative instruments are non-exchange traded and are classified as Level 2 valuations. These measurements are based on market and income approaches with observable market inputs.
Private equity limited partnerships and private real estate investments may include holdings of investments in private real estate, venture capital, buyout, mezzanine or subordinated debt, restructuring or distressed debt, and special situations through funds managed by third-party investment managers. These investments generally involve a
three
to
four
year period where the investor contributes capital, followed by a period of distribution, typically over several years. The investment period is generally, at a minimum,
10 years
or longer. The NDT had unfunded commitments related to private equity limited partnerships of
$119 million
and unfunded commitments related to private real estate of
$28 million
at
September 30, 2018
. The ART had unfunded commitments related to private equity limited partnerships of
$38 million
and unfunded commitments related to private real estate of
$12 million
at
September 30, 2018
. These investments have no redemption or limited redemption options and may also impose restrictions on the NDT’s and ART's ability to liquidate its investments. There are
no
readily available quoted exchange prices for these investments. The fair value of the investments is based on TVA’s ownership percentage of the fair value of the underlying investments as provided by the investment managers. These investments are typically valued on a quarterly basis. TVA’s private equity limited partnerships and private real estate investments are valued at
net asset values ("NAV")
as a practical expedient for fair value. TVA classifies its interest in these types of investments as investments measured at net asset value in the fair value hierarchy.
Commingled funds represent investment funds comprising multiple individual financial instruments. The commingled funds held by the NDT, ART, SERP, and DCP consist of either a single class of securities, such as equity, debt, or foreign currency securities, or multiple classes of securities. All underlying positions in these commingled funds are either exchange traded or measured using observable inputs for similar instruments. The fair value of commingled funds is based on NAV per fund share (the unit of account), derived from the prices of the underlying securities in the funds. These commingled funds can be redeemed at the measurement date NAV and are classified as Commingled funds measured at net asset value in the fair value hierarchy.
Realized and unrealized gains and losses on trading securities are recognized in current earnings and are based on average cost. The gains and losses of the NDT and ART are subsequently reclassified to a regulatory asset or liability account in accordance with TVA's regulatory accounting policy. See
Note 1
—
Cost-Based Regulation
. TVA recorded unrealized gains and losses related to its trading securities held during each period as follows:
|
Unrealized Investment Gains (Losses)
At September 30
|
|||||||||
|
Fund
|
Financial Statement Presentation
|
2018
|
2017
|
||||||
|
SERP
|
Other income (expense)
|
$
|
1
|
|
$
|
4
|
|
||
|
DCP
|
Other income (expense)
|
1
|
|
2
|
|
||||
|
NDT
|
Regulatory asset
|
18
|
|
92
|
|
||||
|
ART
|
Regulatory asset
|
15
|
|
43
|
|
||||
Currency and Interest Rate Derivatives
See
Note 15
—
Cash Flow Hedging Strategy for Currency Swaps
and
Derivatives Not Receiving Hedge Accounting Treatment
for a discussion of the nature, purpose, and contingent features of TVA's currency swaps and interest rate swaps. These swaps are classified as Level 2 valuations and are valued based on income approaches using observable market inputs for similar instruments.
Commodity Contract Derivatives
Most of these contracts are valued based on market approaches which utilize short- and mid-term market-quoted prices from an external industry brokerage service. A small number of these contracts are valued based on a pricing model using long-term price estimates from TVA's coal price forecast. To value the volume option component of applicable coal contracts, TVA uses a Black-Scholes pricing model which includes inputs from the forecast, contract-specific terms, and other market inputs. These contracts are classified as Level 3 valuations.
117
Nonperformance Risk
The assessment of nonperformance risk, which includes credit risk, considers changes in current market conditions, readily available information on nonperformance risk, letters of credit, collateral, other arrangements available, and the nature of master netting arrangements. TVA is a counterparty to currency swaps, interest rate swaps, commodity contracts, and other derivatives which subject TVA to nonperformance risk. Nonperformance risk on the majority of investments and certain exchange-traded instruments held by TVA is incorporated into the exit price that is derived from quoted market data that is used to mark the investment to market.
Nonperformance risk for most of TVA's derivative instruments is an adjustment to the initial asset/liability fair value. TVA adjusts for nonperformance risk, both of TVA (for liabilities) and the counterparty (for assets), by applying
credit valuation adjustments ("CVAs")
. TVA determines an appropriate CVA for each applicable financial instrument based on the term of the instrument and TVA's or the counterparty's credit rating as obtained from Moody's. For companies that do not have an observable credit rating, TVA uses internal analysis to assign a comparable rating to the counterparty. TVA discounts each financial instrument using the historical default rate
(as reported by Moody’s for CY 1983 to CY 2017)
for companies with a similar credit rating over a time period consistent with the remaining term of the contract. The application of CVAs resulted in a less than
$1 million
decrease in the fair value of assets and a $
1 million
decrease in the fair value of liabilities at
September 30, 2018
.
Fair Value Measurements
The following tables set forth by level, within the fair value hierarchy, TVA's financial assets and liabilities that were measured at fair value on a recurring basis at
September 30, 2018
and
2017
. Financial assets and liabilities have been classified in their entirety based on the lowest level of input that is significant to the fair value measurement. TVA's assessment of the significance of a particular input to the fair value measurement requires judgment and may affect the determination of the fair value of the assets and liabilities and their classification in the fair value hierarchy levels.
|
Fair Value Measurements
At September 30, 2018
|
|||||||||||||||
|
Quoted Prices in Active
Markets for
Identical Assets
(Level 1)
|
Significant Other
Observable Inputs
(Level 2)
|
Significant
Unobservable
Inputs
(Level 3)
|
Total
|
||||||||||||
|
Assets
|
|||||||||||||||
|
Investments
|
|
|
|
|
|||||||||||
|
Equity securities
|
$
|
220
|
|
$
|
—
|
|
$
|
—
|
|
$
|
220
|
|
|||
|
Government debt securities
|
199
|
|
37
|
|
—
|
|
236
|
|
|||||||
|
Corporate debt securities
|
—
|
|
499
|
|
—
|
|
499
|
|
|||||||
|
Mortgage and asset-backed securities
|
—
|
|
50
|
|
—
|
|
50
|
|
|||||||
|
Institutional mutual funds
|
126
|
|
—
|
|
—
|
|
126
|
|
|||||||
|
Forward debt securities contracts
|
—
|
|
45
|
|
—
|
|
45
|
|
|||||||
|
Private equity funds measured at net asset value
(1)
|
—
|
|
—
|
|
—
|
|
132
|
|
|||||||
|
Private real estate funds measured at net asset value
(1)
|
—
|
|
—
|
|
—
|
|
124
|
|
|||||||
|
Commingled funds measured at net asset value
(1)
|
—
|
|
—
|
|
—
|
|
1,430
|
|
|||||||
|
Total investments
|
545
|
|
631
|
|
—
|
|
2,862
|
|
|||||||
|
Commodity contract derivatives
|
—
|
|
13
|
|
59
|
|
72
|
|
|||||||
|
Total
|
$
|
545
|
|
$
|
644
|
|
$
|
59
|
|
$
|
2,934
|
|
|||
|
Quoted Prices in Active Markets for Identical Liabilities
(Level 1)
|
Significant Other
Observable Inputs
(Level 2)
|
Significant
Unobservable
Inputs
(Level 3)
|
Total
|
||||||||||||
|
Liabilities
|
|||||||||||||||
|
Currency swaps
(2)
|
$
|
—
|
|
$
|
94
|
|
$
|
—
|
|
$
|
94
|
|
|||
|
Interest rate swaps
|
—
|
|
1,199
|
|
—
|
|
1,199
|
|
|||||||
|
Commodity contract derivatives
|
—
|
|
11
|
|
1
|
|
12
|
|
|||||||
|
Total
|
$
|
—
|
|
$
|
1,304
|
|
$
|
1
|
|
$
|
1,305
|
|
|||
Notes
(1)
Certain investments that are measured at fair value using the net asset value per share (or its equivalent) practical expedient have not been categorized in the fair value hierarchy. The fair value amounts presented in this table are intended to permit reconciliation of the fair value hierarchy to the amounts presented in the consolidated balance sheets.
(2) TVA records currency swaps net of cash collateral received from or paid to the counterparty, to the extent such amount is not recorded in Accounts payable and accrued liabilities. See
Note 15
—
Offsetting of Derivative Assets and Liabilities
.
118
|
Fair Value Measurements
At September 30, 2017
|
|||||||||||||||
|
Quoted Prices in Active
Markets for
Identical Assets
(Level 1)
|
Significant Other
Observable Inputs
(Level 2)
|
Significant
Unobservable
Inputs
(Level 3)
|
Total
|
||||||||||||
|
Assets
|
|||||||||||||||
|
Investments
|
|
|
|
|
|||||||||||
|
Equity securities
|
$
|
226
|
|
$
|
—
|
|
$
|
—
|
|
$
|
226
|
|
|||
|
Government debt securities
|
100
|
|
42
|
|
—
|
|
142
|
|
|||||||
|
Corporate debt securities
|
—
|
|
373
|
|
—
|
|
373
|
|
|||||||
|
Mortgage and asset-backed securities
|
—
|
|
49
|
|
—
|
|
49
|
|
|||||||
|
Institutional mutual funds
|
94
|
|
—
|
|
—
|
|
94
|
|
|||||||
|
Forward debt securities contracts
|
—
|
|
19
|
|
—
|
|
19
|
|
|||||||
|
Private equity funds measured at net asset value
(1)
|
—
|
|
—
|
|
—
|
|
136
|
|
|||||||
|
Private real estate funds measured at net asset value
(1)
|
—
|
|
—
|
|
—
|
|
113
|
|
|||||||
|
Commingled funds measured at net asset value
(1)
|
—
|
|
—
|
|
—
|
|
1,451
|
|
|||||||
|
Total investments
|
420
|
|
483
|
|
—
|
|
2,603
|
|
|||||||
|
Commodity contract derivatives
|
—
|
|
8
|
|
2
|
|
10
|
|
|||||||
|
Total
|
$
|
420
|
|
$
|
491
|
|
$
|
2
|
|
$
|
2,613
|
|
|||
|
Quoted Prices in Active Markets for Identical Liabilities
(Level 1)
|
Significant Other
Observable Inputs
(Level 2)
|
Significant
Unobservable
Inputs
(Level 3)
|
Total
|
||||||||||||
|
Liabilities
|
|||||||||||||||
|
Currency swaps
(2)
|
$
|
—
|
|
$
|
103
|
|
$
|
—
|
|
$
|
103
|
|
|||
|
Interest rate swaps
|
—
|
|
1,511
|
|
—
|
|
1,511
|
|
|||||||
|
Commodity contract derivatives
|
—
|
|
1
|
|
69
|
|
70
|
|
|||||||
|
Commodity derivatives under FTP
(2)
|
|
|
|
|
|
|
|
|
|||||||
|
Swap contracts
|
—
|
|
1
|
|
—
|
|
1
|
|
|||||||
|
Total
|
$
|
—
|
|
$
|
1,616
|
|
$
|
69
|
|
$
|
1,685
|
|
|||
Notes
(1)
Certain investments that are measured at fair value using the net asset value per share (or its equivalent) practical expedient have not been categorized in the fair value hierarchy. The fair value amounts presented in this table are intended to permit reconciliation of the fair value hierarchy to the amounts presented in the consolidated balance sheets.
(2) Due to the right of setoff and method of settlement, TVA elects to record commodity derivatives under the FTP based on its net commodity position with the counterparty or FCM. Deposits are made to TVA's margin cash accounts held with each FCM to offset any net liability positions in full for derivatives that are transacted with FCMs. TVA records currency swaps net of any cash collateral received from or paid to the counterparty, to the extent such amount is not recorded in Accounts payable and accrued liabilities. See
Note 15
—
Offsetting of Derivative Assets and Liabilities
.
TVA uses internal valuation specialists for the calculation of its commodity contract derivatives fair value measurements classified as Level 3. Analytical testing is performed on the change in fair value measurements each period to ensure the valuation is reasonable based on changes in general market assumptions. Significant changes to the estimated data used for unobservable inputs, in isolation or combination, may result in significant variations to the fair value measurement reported.
119
The following table presents a reconciliation of all commodity contract derivatives measured at fair value on a recurring basis using significant unobservable inputs (Level 3):
|
Fair Value Measurements Using Significant Unobservable Inputs
|
|||
|
|
Commodity Contract Derivatives
|
||
|
Balance at October 1, 2016
|
$
|
(127
|
)
|
|
Purchases
|
—
|
|
|
|
Issuances
|
—
|
|
|
|
Sales
|
—
|
|
|
|
Settlements
|
—
|
|
|
|
Change in net unrealized gains (losses) deferred as regulatory assets and liabilities
|
60
|
|
|
|
Balance at September 30, 2017
|
(67
|
)
|
|
|
Purchases
|
—
|
|
|
|
Issuances
|
—
|
|
|
|
Sales
|
—
|
|
|
|
Settlements
|
—
|
|
|
|
Change in net unrealized gains (losses) deferred as regulatory assets and liabilities
|
125
|
|
|
|
Balance at September 30, 2018
|
$
|
58
|
|
The following table presents quantitative information related to the significant unobservable inputs used in the measurement of fair value of TVA's assets and liabilities classified as Level 3 in the fair value hierarchy:
|
Quantitative Information about Level 3 Fair Value Measurements
|
|||||||||
|
|
Fair Value at September 30, 2018
|
Valuation Technique(s)
|
Unobservable Inputs
|
Range
|
|||||
|
Assets
|
|||||||||
|
Commodity contract derivatives
|
$
|
59
|
|
Pricing model
|
Coal supply and demand
|
0.7 - 0.8 billion tons/year
|
|||
|
Long-term market prices
|
$12.25 - $112.24/ton
|
||||||||
|
Liabilities
|
|||||||||
|
Commodity contract derivatives
|
$
|
1
|
|
Pricing model
|
Coal supply and demand
|
0.7 - 0.8 billion tons/year
|
|||
|
Long-term market prices
|
$12.25 - $112.24/ton
|
||||||||
|
Quantitative Information about Level 3 Fair Value Measurements
|
|||||||||
|
|
Fair Value at September 30, 2017
|
Valuation Technique(s)
|
Unobservable Inputs
|
Range
|
|||||
|
Assets
|
|||||||||
|
Commodity contract derivatives
|
$
|
2
|
|
Pricing model
|
Coal supply and demand
|
0.6 - 0.7 billion tons/year
|
|||
|
Long-term market prices
|
$11.40 - $112.23/ton
|
||||||||
|
Liabilities
|
|||||||||
|
Commodity contract derivatives
|
$
|
69
|
|
Pricing model
|
Coal supply and demand
|
0.6 - 0.7 billion tons/year
|
|||
|
Long-term market prices
|
$11.40 - $112.23/ton
|
||||||||
Other Financial Instruments Not Recorded at Fair Value
TVA uses the methods and assumptions described below to estimate the fair values of each significant class of financial instrument. The fair value of the financial instruments held at
September 30, 2018
and
2017
, may not be representative of the actual gains or losses that will be recorded when these instruments mature or are called or presented for early redemption. The estimated values of TVA's financial instruments not recorded at fair value at
September 30, 2018
and
2017
, were as follows:
120
|
Estimated Values of Financial Instruments Not Recorded at Fair Value
|
|||||||||||||||||
|
|
At September 30, 2018
|
At September 30, 2017
|
|||||||||||||||
|
|
Valuation Classification
|
Carrying
Amount
|
Fair
Value
|
Carrying
Amount
|
Fair
Value
|
||||||||||||
|
EnergyRight
®
receivables (including current portion)
|
Level 2
|
$
|
112
|
|
$
|
112
|
|
$
|
125
|
|
$
|
127
|
|
||||
|
Loans and other long-term receivables, net (including current portion)
|
Level 2
|
$
|
138
|
|
$
|
123
|
|
$
|
118
|
|
$
|
107
|
|
||||
|
EnergyRight
®
financing obligation (including current portion)
|
Level 2
|
$
|
127
|
|
$
|
143
|
|
$
|
144
|
|
$
|
161
|
|
||||
|
Unfunded loan commitments
|
Level 2
|
$
|
—
|
|
$
|
3
|
|
$
|
—
|
|
$
|
18
|
|
||||
|
Membership interests of variable interest entity subject to mandatory redemption (including current portion)
|
Level 2
|
$
|
30
|
|
$
|
37
|
|
$
|
32
|
|
$
|
41
|
|
||||
|
Long-term outstanding power bonds (including current maturities), net
|
Level 2
|
$
|
21,189
|
|
$
|
23,896
|
|
$
|
21,933
|
|
$
|
26,857
|
|
||||
|
Long-term debt of variable interest entities (including current maturities), net
|
Level 2
|
$
|
1,165
|
|
$
|
1,256
|
|
$
|
1,200
|
|
$
|
1,356
|
|
||||
|
Long-term notes payable (including current maturities)
|
Level 2
|
$
|
69
|
|
$
|
68
|
|
$
|
122
|
|
$
|
121
|
|
||||
Due to the short-term maturity of Cash and cash equivalents, Restricted cash and cash equivalents, and Short-term debt, net (each considered a Level 1 valuation classification), the carrying amounts of these instruments approximate their fair values.
The fair value for loans and other long-term receivables is estimated by determining the present value of future cash flows using a discount rate equal to lending rates for similar loans made to borrowers with similar credit ratings and for similar remaining maturities, where applicable. The fair value of long-term debt and membership interests of VIE subject to mandatory redemption is estimated by determining the present value of future cash flows using current market rates for similar obligations, giving effect to credit ratings and remaining maturities.
17
.
Proprietary Capital
Appropriation Investment
TVA’s power program and stewardship (nonpower) programs were originally funded primarily by appropriations from Congress. In 1959, Congress passed an amendment to the TVA Act that required TVA’s power program to be self-financing from power revenues and proceeds from power program financings. While TVA’s power program did not directly receive appropriated funds after it became self-financing, TVA continued to receive appropriations for certain multipurpose and other nonpower mission-related activities as well as for its stewardship activities. TVA has not received any appropriations from Congress for any activities since 1999, and since that time, TVA has funded stewardship program activities primarily with power revenues.
The 1959 amendment to the TVA Act also required TVA, beginning in 1961, to make annual payments to the U.S. Treasury from net power proceeds as a repayment of and as a return on the Power Program Appropriation Investment until a total of $
1.0 billion
of the Power Program Appropriation Investment has been repaid in accordance with the 1959 amendment. TVA fulfilled its requirement to repay $
1.0 billion
of the Power Program Appropriation Investment in 2014. The TVA Act requires TVA to continue making payments to the U.S. Treasury as a return on the remaining $
258 million
of the Power Program Appropriation Investment.
121
The table below summarizes TVA's activities related to appropriated funds and retained earnings.
|
Summary of Proprietary Capital Activity
At or for the years ended September 30
|
|||||||||||||||
|
|
2018
|
2017
|
|||||||||||||
|
Power Program
|
Nonpower
Programs
|
Power Program
|
Nonpower
Programs
|
||||||||||||
|
Appropriation Investment
|
$
|
258
|
|
$
|
4,351
|
|
$
|
258
|
|
$
|
4,351
|
|
|||
|
Retained Earnings
|
|
|
|
|
|
|
|
|
|||||||
|
Balance at beginning of year
|
8,282
|
|
(3,779
|
)
|
7,594
|
|
(3,771
|
)
|
|||||||
|
Net income (expense) for year
|
1,127
|
|
(8
|
)
|
693
|
|
(8
|
)
|
|||||||
|
Return on power program appropriation investment
|
(5
|
)
|
—
|
|
(5
|
)
|
—
|
|
|||||||
|
Balance at end of year
|
9,404
|
|
(3,787
|
)
|
8,282
|
|
(3,779
|
)
|
|||||||
|
Net proprietary capital at September 30
|
$
|
9,662
|
|
$
|
564
|
|
$
|
8,540
|
|
$
|
572
|
|
|||
Payments to the U.S. Treasury
TVA paid the U.S. Treasury $
5 million
, $
5 million
, and $
6 million
in
2018
,
2017
, and
2016
, respectively, as a return on the Power Program Appropriation Investment. The amount of the return on the Power Program Appropriation Investment is based on the Power Program Appropriation Investment balance at the beginning of that year and the computed average interest rate payable by the U.S. Treasury on its total marketable public obligations at the same date. The interest rates payable by TVA on the Power Program Appropriation Investment were
2.09 percent
,
2.00 percent
, and
2.04 percent
for
2018
,
2017
, and
2016
, respectively.
Accumulated Other Comprehensive Income (Loss)
The items included in AOCI consist of market valuation adjustments for certain derivative instruments. See
Note 15
.
TVA records exchange rate gains and losses on debt and related accrued interest in net income and marks its currency swap assets and liabilities to market through OCI. TVA had unrealized gains (losses) of $
10 million
and $
59 million
in
2018
and
2017
, respectively, on the mark-to-market of currency swaps. TVA then reclassifies an amount out of AOCI into net income, offsetting the gain/loss from recording the exchange gain/loss on the debt and related accrued interest. The amounts reclassified from OCI into net income resulted in increases (decreases) to net income of $
(26) million
, $
26 million
, and $
(129) million
in
2018
,
2017
, and
2016
, respectively. These reclassifications, coupled with the recording of the exchange gain/loss on the debt and related accrued interest, did not have an impact on net income in
2018
,
2017
, and
2016
. Based on forecasted foreign currency exchange rates, TVA expects to reclassify approximately
$28 million
of gains from AOCI to interest expense within the next 12 months to offset amounts anticipated to be recorded in interest expense related to exchange gain on the debt and related accrued interest.
18
.
Other Income (Expense), Net
Income and expenses not related to TVA’s operating activities are summarized in the following table:
|
Other Income (Expense), Net
For the years ended September 30
|
|||||||||||
|
|
2018
|
2017
|
2016
|
||||||||
|
Interest income
|
$
|
23
|
|
$
|
23
|
|
$
|
24
|
|
||
|
External services
|
14
|
|
14
|
|
12
|
|
|||||
|
Gains (losses) on investments
|
6
|
|
9
|
|
7
|
|
|||||
|
Miscellaneous
|
7
|
|
10
|
|
—
|
|
|||||
|
Total other income (expense), net
|
$
|
50
|
|
$
|
56
|
|
$
|
43
|
|
||
19
.
Supplemental Cash Flow Information
Interest paid was $
1.2 billion
for 2018 and
$1.3 billion
for both
2017
and
2016
. These amounts differ from interest expense in certain years due to the timing of payments and interest capitalized for major capital expenditures. There was no interest capitalized in
2018
or
2017
and
$235 million
capitalized in
2016
as part of the Watts Bar Unit 2 construction.
Construction in progress and Nuclear fuel expenditures included in Accounts payable and accrued liabilities at
September 30, 2018
,
2017
, and
2016
were
$372 million
,
$425 million
, and
$526 million
, respectively, and are excluded from the
122
Statements of Consolidated Cash Flows for the years ended
September 30, 2018
,
2017
and
2016
as non-cash investing activities.
Excluded from the Statement of Consolidated Cash Flows for the years ended September 30,
2017
and
2016
as non-cash financing activities were capital lease obligations incurred related to purchase power assets of
$10 million
and
$81 million
, respectively. There were no capital leases incurred during
2018
. Also excluded from the Statement of Consolidated Cash Flows for the years ended
September 30, 2017
and
2016
were
$74 million
and
$78 million
, respectively, of notes payable related to TVA's acquisition of equity interests in certain SPEs. See
Note 9
.
Cash flows from futures contracts, forward contracts, option contracts, and swap contracts that are accounted for as hedges are classified in the same category as the item being hedged or on a basis consistent with the nature of the instrument.
20
.
Benefit Plans
TVA sponsors a qualified defined benefit plan (“pension plan”) that covers most of its full-time employees hired prior to July 1, 2014, a qualified defined contribution plan (“401(k) plan”) that covers most of its full-time employees, two unfunded post-retirement health care plans that provide for non-vested contributions toward the cost of eligible retirees' medical coverage, other postemployment benefits such as workers' compensation, and the SERP. The pension plan and the 401(k) plan are administered by a separate legal entity, the
TVA Retirement System ("TVARS")
, which is governed by its own board of directors (the "TVARS Board").
Overview of Plans and Benefits
Retirement Plans.
The participants in the pension plan receive either a traditional final average pay pension or a cash balance pension. The traditional pension benefit is based on the participant’s creditable service, average monthly salary for their highest three consecutive years of eligible compensation, and a pension factor based on the participant’s age and years of service, less a Social Security offset. The cash balance pension benefit is based on pay and interest credits accumulated in the participant’s account and the participant’s age.
Participants in the pension plan are also eligible to receive 401(k) plan matching contributions, may be eligible to receive 401(k) plan non-elective contributions and may be eligible to make after-tax contributions of up to $
10,000
per year to the pension plan, which at the election of the participant are invested in either the fixed fund, which receives a fixed interest rate set forth in the plan, or the variable fund, which receives a rate of return based on an S&P 500 index fund. Participants in the pension plan may also become eligible for a supplemental pension benefit based on age and years of service at retirement, which is provided to help offset the cost of retiree medical insurance. Employees first hired on or after July 1, 2014, are participants in the 401(k) plan only and receive both non-elective and matching contributions to their accounts in the 401(k) plan.
On August 8, 2016, the TVARS Board approved amendments to the pension plan and the 401(k) plan, and these amendments were also approved by the TVA Board on August 25, 2016. The amendments, which became effective on October 1, 2016, changed future retirement benefits for employees and retirees and made certain other changes regarding TVA's minimum funding requirements to the pension plan and plan governance. These amendments shift future benefit accruals from the cash balance pension to the 401(k) plan based on hire date and years of service as of Octobe
r 1, 2016. For cash balance participants first hired on or after January 1, 1996, and having 10 or more years of service as of October 1, 2016, participants will begin receiving non-elective contributions to their accounts in the 401(k) plan and reduced pay credits to their cash balance accounts in the pension plan. For cash balance participants first hired on or after January 1, 1996, and having less than 10 years of service as of October 1, 2016, participants will begin receiving non-elective contributions and higher matching contributions to their accounts in the 401(k) plan and will no longer receive pay credits to their cash balance accounts; however, their cash balance accounts will continue to receive interest credits.
Current cash balance participants in the pension plan who were first hired before January 1, 1996, and elected to switch pension structures from traditional to cash balance did not experience a shift in future benefit accruals from the cash balance plan to the 401(k) plan.
The amendments also made the following additional benefit changes: reducing the future cash balance interest crediting rate and the fixed fund interest rate with a floor and ceiling based on the assumed rate of investment return on TVARS assets; closing the fixed and variable funds to new contributions from pension plan participants first hired on or after January 1, 1996; reducing the rate of future cost-of-living-adjustments (“COLAs”) while increasing the maximum eligible COLA; vesting COLAs; increasing the eligibility age for COLAs for pension plan participants under age
50
; restricting COLAs to pension amounts based on compensation up to Executive Level IV; eliminating future COLAs to SERP participants with less than 10 years of service; and capping the maximum supplemental benefit amounts.
The amendments also changed the annual minimum contribution required by TVA to the pension plan to the greater of (a) the minimum contribution calculated by TVARS’s actuary according to the TVARS Rules and Regulations, or (b)
$300 million
, for a period of 20 years (from 2017 through 2036) or, if earlier, through the fiscal year in which the plan reaches and remains at a
100 percent
funded status under the actuarial rules applicable to TVARS.
123
On May 23, 2018, the TVARS Board approved amendments to the pension plan and 401(k) plan. These amendments allow employees who are continuing to accrue cash balance benefits in the pension plan to voluntarily elect to switch future participation to the 401(k) plan only, and employees with cash balance accounts in the pension plan who have a 401(k) only benefit the additional option to waive their rights to benefits under the pension plan and transfer their cash balance accounts (and fixed and variable accounts, if any) to the 401(k) plan. TVARS presented these amendments to TVA for its review and consideration, and the amendments became effective July 8, 2018.
Under the plan amendments, the voluntary election options were offered to eligible TVA employees during a two-month window from July 1, 2018, to August 31, 2018, with changes and transfers becoming effective on October 1, 2018. As a result, there were
$23 million
of one-time transfers to the 401(k) plan based upon employee elections. These amendments did not trigger curtailment or settlement accounting.
401(k) Plan
. Under the 401(k) plan, the non-elective and matching contributions TVA makes to participant accounts are based on the participant’s employment hire date and years of service. Non-elective employer contributions for eligible participants range from three percent to six percent and matching employer contributions range from 1.5 percent to six percent. TVA recognized approximately $
80 million
in 401(k) plan contribution costs in both
2018
and
2017
. TVA recognized $
38 million
in 401(k) plan contribution costs in
2016
. The increase in costs in
2017
to
2018
, was primarily a result of the
2016
plan amendments. The
2018
plan amendments are expected to have a de minimis impact on the 401(k) plan costs of less than
$1 million
. The 2019 plan contribution costs are estimated to be approximately
$83 million
.
Supplemental Executive Retirement Plan.
TVA has established a SERP for certain executives in critical positions to provide supplemental pension benefits tied to compensation that exceeds limits imposed by IRS rules applicable to the qualified defined benefit pension plan.
Other Post-Retirement Benefits.
TVA sponsors two unfunded post-retirement benefit plans that provide for non-vested contributions toward the cost of certain eligible retirees’ medical coverage. The first plan covers only certain retirees and surviving dependents who do not qualify for TVARS benefits, including the supplemental pension benefit. The second plan is designed to place a limit on the out-of-pocket amount certain eligible retirees pay for medical coverage and provides a credit based on years of TVA service and monthly base pension amount, reduced by any TVARS supplemental pension benefits or any TVA contribution from the first plan, described above. Effective January 2017, all Medicare-eligible retirees and spouses were provided Medicare coverage through a private exchange. Transition to the exchange does not affect any TVARS supplemental benefits for eligible retirees, and the credit will continue to be calculated in the same manner as before.
Other Post-Employment Benefits.
TVA employees injured in work-related incidents are covered by the workers’ compensation program for federal employees administered through the Department of Labor by the Office of Workers’ Compensation Programs in accordance with the provisions of the
Federal Employees' Compensation Act ("FECA")
. FECA provides compensation and medical benefits to federal employees for permanent and temporary disability due to employment-related injury or disease.
Accounting Mechanisms
Regulatory Accounting.
TVA has classified all amounts related to unrecognized prior service costs, net actuarial gains or losses, and the funded status as regulatory assets or liabilities as such amounts are probable of collection in future rates. Additionally, TVA recognizes pension costs as regulatory assets or regulatory liabilities to the extent that the amount calculated under U.S. GAAP as pension expense differs from the amount TVA contributes to the pension plan as pension plan contributions. As a result of recent plan design changes, future contributions are expected to exceed the expense calculated under U.S. GAAP. Accordingly, TVA will discontinue this regulatory accounting practice once all such deferred costs have been recovered, at which time it will recognize pension costs in accordance with U.S. GAAP.
Cost Method.
TVA uses the projected unit credit cost method to determine the service cost and the projected benefit obligation for retirement, termination, and ancillary benefits. Under this method, a “projected accrued benefit” is calculated at the beginning of the year and at the end of the year for each benefit that may be payable in the future. The “projected accrued benefit” is based on the plan’s accrual formula and upon service at the beginning or end of the year, but it uses final average compensation, social security benefits, and other relevant factors projected to the age at which the employee is assumed to leave active service. The projected benefit obligation is the actuarial present value of the “projected accrued benefits” at the beginning of the year for employed participants and is the actuarial present value of all benefits for other participants. The
service cost is the actuarial present value of the difference between the “projected accrued benefits” at the beginning and end of the year.
Amortization of Net Gain or Loss.
TVA utilizes the corridor approach for gain/loss amortization. Differences between actuarial assumptions and actual plan results are deferred and amortized into periodic cost only when the accumulated differences exceed
10 percent
of the greater of the projected benefit obligation or the market-related value of plan assets. If necessary, the excess is amortized over the average remaining service period of participating employees expected to receive benefits. The current projected amortization periods of unrecognized net gain or loss is approximately 10 years for the pension plan and 12 years for the post-retirement plan.
124
Amortization of Prior Service Cost/(Credit).
Amortization of net prior service cost/(credit) resulting from a plan change is included as a component of period expense in the year first recognized and every year thereafter until it is fully amortized. The increase or decrease in the benefit obligation due to the plan change is amortized over the average remaining service period of participating employees expected to receive benefits under the plan. The pension and post-retirement plans have prior service credits related to plan changes made in 2009, 2010, 2016 and 2018 with remaining amortization periods ranging from over two to 11 years. However, when a plan change reduces the benefit obligation, existing positive prior service costs are reduced or eliminated starting with the earliest established before a new prior service credit base is established.
Asset Method
. TVA’s asset method calculates a market-related value of assets (“MRVA”) that recognizes realized and unrealized investment gains and losses over a three-year smoothing period to decrease the volatility of annual net periodic pension benefit costs. The MRVA is used to determine the expected return on plan assets, a component of net periodic pension benefit cost. The difference in the expected return on the MRVA and the actual return on the fair value on plan assets is recognized as an actuarial (gain)/loss in the pension benefit obligation at September 30. However, the MRVA has no impact on the fair value of plan assets measured at September 30.
Obligations and Funded Status
The changes in plan obligations, assets, and funded status for the years ended
September 30, 2018
and
2017
, were as follows:
|
Obligations and Funded Status
For the years ended September 30 |
|||||||||||||||
|
|
Pension Benefits
|
Other Post-Retirement Benefits
|
|||||||||||||
|
|
2018
|
2017
|
2018
|
2017
|
|||||||||||
|
Change in benefit obligation
|
|
|
|
|
|||||||||||
|
Benefit obligation at beginning of year
|
$
|
12,601
|
|
$
|
13,083
|
|
$
|
494
|
|
$
|
571
|
|
|||
|
Service cost
|
53
|
|
60
|
|
14
|
|
18
|
|
|||||||
|
Interest cost
|
473
|
|
464
|
|
19
|
|
21
|
|
|||||||
|
Plan participants’ contributions
|
7
|
|
9
|
|
—
|
|
—
|
|
|||||||
|
Collections
(1)
|
—
|
|
—
|
|
25
|
|
47
|
|
|||||||
|
Actuarial (gain) loss
|
(658
|
)
|
(286
|
)
|
(46
|
)
|
(80
|
)
|
|||||||
|
Plan change
|
—
|
|
—
|
|
(17
|
)
|
—
|
|
|||||||
|
Net transfers (to) from variable fund/401(k) plan
(2)
|
(26
|
)
|
(12
|
)
|
—
|
|
—
|
|
|||||||
|
Expenses paid
|
(6
|
)
|
(5
|
)
|
—
|
|
—
|
|
|||||||
|
Benefits paid
|
(719
|
)
|
(712
|
)
|
(61
|
)
|
(83
|
)
|
|||||||
|
Benefit obligation at end of year
|
11,725
|
|
12,601
|
|
428
|
|
494
|
|
|||||||
|
Change in plan assets
|
|
|
|
|
|
|
|
|
|||||||
|
Fair value of net plan assets at beginning of year
|
7,989
|
|
7,145
|
|
—
|
|
—
|
|
|||||||
|
Actual return on plan assets
|
454
|
|
759
|
|
—
|
|
—
|
|
|||||||
|
Plan participants’ contributions
|
7
|
|
9
|
|
—
|
|
—
|
|
|||||||
|
Collections
(1)
|
—
|
|
—
|
|
25
|
|
47
|
|
|||||||
|
Net transfers (to) from variable fund/401(k) plan
(2)
|
(26
|
)
|
(12
|
)
|
—
|
|
—
|
|
|||||||
|
Employer contributions
(3)
|
304
|
|
805
|
|
36
|
|
36
|
|
|||||||
|
Expenses paid
|
(6
|
)
|
(5
|
)
|
—
|
|
—
|
|
|||||||
|
Benefits paid
|
(719
|
)
|
(712
|
)
|
(61
|
)
|
(83
|
)
|
|||||||
|
Fair value of net plan assets at end of year
|
8,003
|
|
7,989
|
|
—
|
|
—
|
|
|||||||
|
Funded status
|
$
|
(3,722
|
)
|
$
|
(4,612
|
)
|
$
|
(428
|
)
|
$
|
(494
|
)
|
|||
Notes
(1) Collections include retiree contributions as well as provider discounts and rebates.
(2) Includes one-time transfers to the 401(k) of $23 million related to the 2018 plan amendment.
(3) Other Post-Retirement Benefits Employer contributions are reduced by provider discounts and rebates.
The pension actuarial gain for
2018
primarily reflects the impact of the increase in the discount rate from
3.85 percent
to
4.35 percent
, which decreased the liability by
$676 million
. Based on the results obtained from the most recent experience study
125
performed in 2018, TVA had gains of
$138 million
due to mortality assumption changes offset by losses of
$46 million
due to the revision of other demographic and experience based assumptions. In addition, TVA recognized losses related to the change in the assumptions on lump sum elections and annuity benefits as a result of the 2016 plan amendments, which increased the liability by
$110 million
.
The pension actuarial gain for 2017 primarily reflects the impact of the increase in the discount rate from
3.65
percent to
3.85
percent, which decreased the liability by
$292 million
. In addition, gains of
$117 million
were due to mortality assumption changes. These gains were partially offset by a
$119 million
loss related to a change in the assumption of participant benefit payment elections, based on recent plan experience.
The other post-retirement actuarial gain for 2018 was primarily due to the increase in the discount rate from
3.95
percent to
4.40
percent, which decreased the liability by
$28 million
. Based on the results obtained from the recent experience study performed during 2018, TVA recognized gains of
$6 million
due to mortality assumption changes and
$23 million
of additional gains in other experience related assumptions. These gains were partially offset by losses of
$8 million
related to per capita claim costs and retiree contributions assumptions and
$3 million
in actuarial losses related to actual experience different from assumed.
For CY 2019, TVA made plan changes to the other post-retirement benefit plan resulting in a decrease in the liability of
$17 million
. This decrease is primarily related to the use of a new national preferred formulary and utilization manager program.
The other post-retirement benefit actuarial gain for 2017 was primarily due to lower per capita costs, which decreased the liability by $
66 million
. In addition, gains of $
18 million
were due to an increase in the discount rate from
3.70 percent
to
3.95 percent
, and gains of $
6 million
resulted from the updated mortality assumption. These gains were slightly offset by a change in the pre-Medicare trend rate, primarily driven by recent increases in prescription drug costs.
Amounts related to these benefit plans recognized on TVA's consolidated balance sheets consist of regulatory assets that have not been recognized as components of net periodic benefit cost at
September 30, 2018
and
2017
, and the funded status of TVA’s benefit plans, which are included in Accounts payable and accrued liabilities and Post-retirement and post-employment benefit obligations:
|
Amounts Recognized on TVA's Consolidated Balance Sheets
At September 30
|
|||||||||||||||
|
|
Pension Benefits
|
Other Post-Retirement Benefits
|
|||||||||||||
|
|
2018
|
2017
|
2018
|
2017
|
|||||||||||
|
Regulatory assets (liabilities)
|
$
|
3,119
|
|
$
|
4,009
|
|
$
|
(73
|
)
|
$
|
(23
|
)
|
|||
|
Accounts payable and accrued liabilities
|
(6
|
)
|
(4
|
)
|
(28
|
)
|
(33
|
)
|
|||||||
|
Pension and post-retirement benefit obligations
(1)
|
(3,716
|
)
|
(4,608
|
)
|
(400
|
)
|
(461
|
)
|
|||||||
Note
(1) The table above excludes
$360 million
and
$408 million
of post-employment benefit costs that are recorded in Post-retirement and post-employment benefit obligations on the Consolidated Balance Sheets at
September 30, 2018
and
2017
, respectively.
Unrecognized amounts included in regulatory assets or liabilities yet to be recognized as components of accrued benefit cost at September 30,
2018
and
2017
, consisted of the following:
|
Post-Retirement Benefit Costs Deferred as Regulatory Assets
At September 30
|
|||||||||||||||
|
|
Pension Benefits
|
Other Post-Retirement Benefits
|
|||||||||||||
|
|
2018
|
2017
|
2018
|
2017
|
|||||||||||
|
Unrecognized prior service credit
|
$
|
(819
|
)
|
$
|
(918
|
)
|
$
|
(159
|
)
|
$
|
(163
|
)
|
|||
|
Unrecognized net loss
|
3,842
|
|
4,885
|
|
86
|
|
140
|
|
|||||||
|
Amount capitalized due to actions of regulator
|
96
|
|
42
|
|
—
|
|
—
|
|
|||||||
|
Total regulatory assets
|
$
|
3,119
|
|
$
|
4,009
|
|
$
|
(73
|
)
|
$
|
(23
|
)
|
|||
126
The projected benefit obligation, accumulated benefit obligation, and fair value of plan assets for the pension plan at
September 30, 2018
and
2017
, were as follows:
|
Projected Benefit Obligations and Accumulated Benefit Obligations in Excess of Plan Assets
At September 30
|
|||||||
|
|
2018
|
2017
|
|||||
|
Projected benefit obligation
|
$
|
11,725
|
|
$
|
12,601
|
|
|
|
Accumulated benefit obligation
|
11,659
|
|
12,461
|
|
|||
|
Fair value of net plan assets
|
8,003
|
|
7,989
|
|
|||
The components of net periodic benefit cost and other amounts recognized as changes in regulatory assets for the years ended
September 30, 2018
and
2017
, were as follows:
|
Components of Net Periodic Benefit Cost
For the years ended September 30
|
|||||||||||||||||||||||
|
|
Pension Benefits
|
Other Post-Retirement Benefits
|
|||||||||||||||||||||
|
|
2018
|
2017
|
2016
|
2018
|
2017
|
2016
|
|||||||||||||||||
|
Service cost
|
$
|
53
|
|
$
|
60
|
|
$
|
133
|
|
$
|
14
|
|
$
|
18
|
|
$
|
16
|
|
|||||
|
Interest cost
|
473
|
|
464
|
|
564
|
|
19
|
|
21
|
|
29
|
|
|||||||||||
|
Expected return on plan assets
|
(478
|
)
|
(457
|
)
|
(446
|
)
|
—
|
|
—
|
|
—
|
|
|||||||||||
|
Amortization of prior service credit
|
(99
|
)
|
(99
|
)
|
(23
|
)
|
(22
|
)
|
(22
|
)
|
(6
|
)
|
|||||||||||
|
Recognized net actuarial loss
|
409
|
|
472
|
|
310
|
|
8
|
|
14
|
|
7
|
|
|||||||||||
|
Curtailment
|
—
|
|
—
|
|
(78
|
)
|
—
|
|
—
|
|
—
|
|
|||||||||||
|
Total net periodic benefit cost as actuarially determined
|
358
|
|
440
|
|
460
|
|
19
|
|
31
|
|
46
|
|
|||||||||||
|
Amount expensed (capitalized) due to actions of regulator
|
(54
|
)
|
365
|
|
(179
|
)
|
—
|
|
—
|
|
—
|
|
|||||||||||
|
Change in net periodic benefit cost
|
$
|
304
|
|
$
|
805
|
|
$
|
281
|
|
$
|
19
|
|
$
|
31
|
|
$
|
46
|
|
|||||
The amounts in the regulatory asset that are expected to be recognized as components of net periodic benefit cost during the next fiscal year are as follows:
|
Expected Amortization of Regulatory Assets in 2019
At September 30, 2018
|
|||||||||||
|
|
Pension Benefits
|
Other Post-Retirement
Benefits
|
Total
|
||||||||
|
Prior service credit
|
$
|
(99
|
)
|
$
|
(24
|
)
|
$
|
(123
|
)
|
||
|
Net actuarial loss
|
327
|
|
4
|
|
331
|
|
|||||
The amount in the components of net periodic benefit cost expected to be expensed due to actions of the regulator in the next fiscal year is $
10 million
.
Plan Assumptions
TVA’s reported costs of providing the plan benefits are impacted by numerous factors including the provisions of the plans, changing employee demographics, and various assumptions, the most significant of which are noted below.
127
|
Actuarial Assumptions Utilized to Determine Benefit Obligations at September 30
|
|||||||||||
|
|
Pension Benefits
|
Other Post-Retirement Benefits
|
|||||||||
|
|
2018
|
2017
|
2018
|
2017
|
|||||||
|
Discount rate
|
4.35
|
%
|
3.85
|
%
|
4.40
|
%
|
3.95
|
%
|
|||
|
Rate of compensation increase
|
3.60
|
%
|
5.43
|
%
|
N/A
|
|
N/A
|
|
|||
|
Cost of living adjustment (COLA)
(1)
|
2.00
|
%
|
2.00
|
%
|
2.00
|
%
|
2.00
|
%
|
|||
|
Pre-Medicare eligible
|
|||||||||||
|
Initial health care cost trend rate
|
N/A
|
|
N/A
|
|
6.25
|
%
|
6.50
|
%
|
|||
|
Ultimate health care cost trend rate
|
N/A
|
|
N/A
|
|
5.00
|
%
|
5.00
|
%
|
|||
|
Year ultimate trend rate is reached
|
N/A
|
|
N/A
|
|
2024
|
|
2024
|
|
|||
|
Post-Medicare eligible
|
|||||||||||
|
Initial health care cost trend rate
|
N/A
|
|
N/A
|
|
—
|
%
|
—
|
%
|
|||
|
Ultimate health care cost trend rate
|
N/A
|
|
N/A
|
|
4.00
|
%
|
4.00
|
%
|
|||
|
Year ultimate trend rate is reached
|
N/A
|
|
N/A
|
|
2021
|
|
2021
|
|
|||
Note
(1) The COLA rate is the ultimate long-term rate.
|
Actuarial Assumptions Utilized to Determine Net Periodic Benefit Cost for the Years Ended September 30
(1)
|
|||||||||||||||||
|
|
Pension Benefits
|
Other Post-Retirement Benefits
|
|||||||||||||||
|
|
2018
|
2017
|
2016
|
2018
|
2017
|
2016
|
|||||||||||
|
Discount rate
|
3.85
|
%
|
3.65
|
%
|
4.50
|
%
|
3.95
|
%
|
3.70
|
%
|
4.65
|
%
|
|||||
|
Expected return on plan assets
|
6.75
|
%
|
7.00
|
%
|
7.00
|
%
|
N/A
|
|
N/A
|
|
N/A
|
|
|||||
|
Cost of living adjustment (COLA)
(2)
|
2.00
|
%
|
2.00
|
%
|
2.40
|
%
|
2.00
|
%
|
2.00
|
%
|
2.40
|
%
|
|||||
|
Rate of compensation increase
|
5.34
|
%
|
5.43
|
%
|
5.55
|
%
|
N/A
|
|
N/A
|
|
N/A
|
|
|||||
|
Pre-Medicare eligible
|
|||||||||||||||||
|
Initial health care cost trend rate
|
N/A
|
|
N/A
|
|
N/A
|
|
6.50
|
%
|
6.50
|
%
|
7.00
|
%
|
|||||
|
Ultimate health care cost trend rate
|
N/A
|
|
N/A
|
|
N/A
|
|
5.00
|
%
|
5.00
|
%
|
5.00
|
%
|
|||||
|
Year ultimate trend rate is reached
|
N/A
|
|
N/A
|
|
N/A
|
|
2024
|
|
2019
|
|
2019
|
|
|||||
|
Post-Medicare eligible
|
|||||||||||||||||
|
Initial health care cost trend rate
|
N/A
|
|
N/A
|
|
N/A
|
|
—
|
%
|
—
|
%
|
7.00
|
%
|
|||||
|
Ultimate health care cost trend rate
|
N/A
|
|
N/A
|
|
N/A
|
|
4.00
|
%
|
4.00
|
%
|
5.00
|
%
|
|||||
|
Year ultimate trend rate is reached
|
N/A
|
|
N/A
|
|
N/A
|
|
2021
|
|
2021
|
|
2019
|
|
|||||
Notes
(1) The actuarial assumptions used to determine the benefit obligations at September 30 of each year are subsequently used to determine net periodic benefit cost for the following year except the rate of compensation increase assumption.
(2) The COLA assumption is the ultimate rate. The actual calendar year rate is used in determining the expense, and for years thereafter the ultimate rate is used.
Discount Rate.
In selecting the assumed discount rate, TVA reviews market yields on high-quality corporate debt and long-term obligations of the U.S. Treasury and endeavors to match, through the use of a hypothetical bond portfolio, instrument maturities with the maturities of its pension obligations in accordance with the prevailing accounting standards. The selected bond portfolio is derived from a universe of high quality corporate bonds of Aa-rated quality or higher. After the bond portfolio is selected, a single interest rate is determined that equates the present value of the plan's projected benefit payments discounted at this rate with the market value of the bonds selected. Based on recent market trends and economic conditions, TVA increased its discount rate used to determine the pension benefit obligation and other post-retirement benefit obligation.
Rate of Return
. The qualified defined benefit pension plan is the only plan that is funded with qualified plan assets. In determining the expected long-term rate of return on pension plan assets, TVA uses a process that incorporates actual historical asset class returns and an assessment of expected future performance and takes into consideration external actuarial advice, the current outlook on capital markets, the asset allocation policy, and the anticipated impact of active management. Asset allocations are periodically updated using the pension plan asset/liability studies and are part of the determination of the estimates of long-term rates of return. The TVARS asset allocation policy diversifies plan assets across multiple asset classes so as to minimize the risk of large losses. The asset allocation policy is designed to be dynamic in nature and responsive to changes in the funded status of TVARS. Changes in the expected return rates are based on annual studies performed by third party professional investment consultants. Taking into account changes in the plan’s asset target allocation mix, capital market outlooks, and the most recent studies, TVA management adopted a
6.75 percent
expected long-term rate of return on plan
128
assets in 2017 to calculate the 2018 net periodic pension cost, and had no changes to the assumption in 2018. The
6.75
percent expected long-term return on plan assets will be used to calculate the 2019 net periodic pension cost.
Compensation Increases
. Assumptions related to compensation increases are based on the results obtained from an actual company experience study performed during the most recent
five years
for plan participants. TVA obtained an updated study in 2018 and determined that future compensation would likely increase at rates between
2.50 percent
and
14.00 percent
per year, depending upon the employee's age. The average assumed compensation increase used to determine benefit obligations is based upon the current active participants.
Mortality.
The mortality assumption is comprised of a base table that represents the current future life expectancy adjusted by an improvement scale to project future improvements in life expectancy. TVA's mortality assumptions are based upon actuarial projections in combination with studies of the actual mortality experience of TVA's pension and post-retirement benefit plan participants while taking into consideration the published Society of Actuaries ("SOA") mortality table and projection scale at September 30. Based upon the recent 2018 experience study, TVA adjusted its version of the SOA RP-2014 mortality table to reflect increases in female mortality and adopted a modified version of the SOA MP-2017 improvement scale to measure the pension and other post-retirement benefit obligations at
September 30, 2018
.
The following mortality assumptions were used to determine the benefit obligations for the pension and other post-retirement benefit plans at
September 30, 2018
,
2017
, and
2016
. Assumptions used to determine year-end benefit obligations are the assumptions used to determine the subsequent year’s net periodic benefit costs.
|
Mortality Assumptions
At September 30
|
|||||
|
|
2018
|
2017
|
2016
|
||
|
Mortality table
|
RP-2014 table (adjusted)
|
RP-2014 table (adjusted)
|
RP-2014 table (adjusted)
|
||
|
Improvement scale
|
MP-2017 (modified)
|
MP-2016 (modified)
|
RP-2015 scale (modified)
|
||
Health Care Cost Trends.
TVA reviews actual recent cost trends and projected future trends in establishing health care cost trend rates. There were no changes for 2018 in the cost trend assumptions that were adopted in 2017 for pre-Medicare participants. The current trend rate assumption used to determine the pre-Medicare eligible postretirement obligation is
6.25 percent
with the rate assumed to gradually decrease each successive year until it reaches a
5.00 percent
annual increase in health care costs in 2024 and beyond. TVA maintained the post-Medicare eligible health care cost trend assumption at
zero percent
through 2020 at which point it increases to
4.00 percent
in 2021 and beyond as a result of the move of Medicare eligible retirees to a private exchange beginning January 2017.
Cost of Living Adjustment.
COLAs are an increase in the benefits for eligible retirees to help maintain the purchasing power of benefits as consumer prices increase. Eligible retirees receive a COLA on pension and supplemental benefits equal to the percentage change in the Consumer Price Index for All Urban Consumers (“CPI-U”) in January following any year in which the 12-month average CPI-U exceeded by as much as one percent the 12-month average of the CPI-U for the preceding year in which a COLA was given. Increases in the COLA will be the percent increase in CPI-U over the preceding year less
0.25
percent, with a
6.00
percent cap for any one year.
TVA's COLA assumption is derived from long-term expectations of the expected future rate of inflation, based upon capital market assumptions, economic forecasts, and the Federal Reserve policy. The actual calendar year COLA and the long- term COLA assumption are used to determine the benefit obligation at September 30 and the net periodic benefit costs for the following fiscal year. The actual calendar year COLAs for 2018 and 2017 were
1.84
percent and
0.99
percent, respectively. For 2016 there was no COLA.
Sensitivity of Costs to Changes in Assumptions.
The following chart reflects the sensitivity of pension cost to changes in certain actuarial assumptions:
|
Sensitivity to Certain Changes in Pension Assumptions
At September 30, 2018
|
|||||||||||
|
Actuarial Assumption
|
Change in Assumption
|
Impact on 2018 Pension Cost
|
Impact on 2018 Projected Benefit Obligation
|
||||||||
|
Discount rate
|
(0.25
|
)%
|
$
|
16
|
|
$
|
330
|
|
|||
|
Rate of return on plan assets
|
(0.25
|
)%
|
18
|
|
N/A
|
|
|||||
|
Cost of living adjustments
|
0.25
|
%
|
28
|
|
217
|
|
|||||
Each fluctuation above assumes that the other components of the calculation are held constant and excludes any impact for unamortized actuarial gains or losses.
129
The following chart reflects the sensitivity of post-retirement benefit cost to changes in the health care trend rate:
|
Sensitivity to Changes in Assumed Health Care Cost Trend Rates
At September 30, 2018
|
|||||||
|
|
1% Increase
|
1% Decrease
|
|||||
|
Effect on total of service and interest cost components for the year
|
$
|
4
|
|
$
|
(4
|
)
|
|
|
Effect on end-of-year accumulated post-retirement benefit obligation
|
62
|
|
(59
|
)
|
|||
Each fluctuation above assumes that the other components of the calculation are held constant and excludes any impact for unamortized actuarial gains or losses.
Plan Investments
The TVARS asset allocation policy for qualified pension plan assets has targets of
43 percent
equity including global public and private equity investments,
32 percent
fixed income securities, and
25 percent
real assets including public and private real assets. TVARS has a long-term investment plan that contains a dynamic de-risking strategy which will allocate investments to assets that better match the liability, such as long duration fixed income securities, over time as improved funding status targets are met. Pursuant to the TVARS Rules and Regulations, any proposed changes in asset allocation that would change TVARS’s assumed rate of investment return are subject to TVA’s review and veto.
As set forth above, the qualified pension plan assets are invested across global public equity, private equity, safety oriented fixed income, opportunistic fixed income, public real assets, and private real assets. The TVARS asset allocation policy includes permissible deviations from target allocations, and action can be taken, as appropriate, to rebalance the plan’s assets consistent with the asset allocation policy. At
September 30, 2018
and
2017
, the asset holdings of TVARS included the following:
|
Asset Holdings of TVARS
At September 30
|
|||||||||
|
|
|
Plan Assets at September 30
|
|||||||
|
Asset Category
|
Target Allocation
|
2018
|
2017
|
||||||
|
Global public equity
|
35
|
%
|
44
|
%
|
44
|
%
|
|||
|
Private equity
|
8
|
%
|
7
|
%
|
5
|
%
|
|||
|
Safety oriented fixed income
|
17
|
%
|
16
|
%
|
21
|
%
|
|||
|
Opportunistic fixed income
|
15
|
%
|
10
|
%
|
10
|
%
|
|||
|
Public real assets
|
15
|
%
|
15
|
%
|
13
|
%
|
|||
|
Private real assets
|
10
|
%
|
8
|
%
|
7
|
%
|
|||
|
Total
|
100
|
%
|
100
|
%
|
100
|
%
|
|||
130
Fair Value Measurements
The following table provides the fair value measurement amounts for assets held by TVARS at
September 30, 2018
:
|
TVA Retirement System
At September 30, 2018
|
|||||||||||||||
|
|
Total
(1)(2)
|
Quoted Prices in Active Markets for Identical
Assets/Liabilities
(Level 1)
|
Significant Other
Observable Inputs
(Level 2)
|
Significant
Unobservable
Inputs
(Level 3)
|
|||||||||||
|
Assets
|
|
|
|
|
|||||||||||
|
Equity securities
|
$
|
1,787
|
|
$
|
1,786
|
|
$
|
—
|
|
$
|
1
|
|
|||
|
|
|
||||||||||||||
|
Preferred securities
|
10
|
|
4
|
|
6
|
|
—
|
|
|||||||
|
Debt securities
|
|
|
|
|
|
|
|||||||||
|
Corporate debt securities
|
1,151
|
|
—
|
|
1,148
|
|
3
|
|
|||||||
|
Residential mortgage-backed securities
|
377
|
|
—
|
|
371
|
|
6
|
|
|||||||
|
Debt securities issued by U.S. Treasury
|
696
|
|
696
|
|
—
|
|
—
|
|
|||||||
|
Debt securities issued by foreign governments
|
322
|
|
—
|
|
304
|
|
18
|
|
|||||||
|
Asset-backed securities
|
129
|
|
—
|
|
103
|
|
26
|
|
|||||||
|
Debt securities issued by state/local governments
|
17
|
|
—
|
|
17
|
|
—
|
|
|||||||
|
Commercial mortgage-backed securities
|
74
|
|
—
|
|
70
|
|
4
|
|
|||||||
|
Commingled funds measured at net asset value
(3)
|
|
|
|||||||||||||
|
Equity
|
1,175
|
|
—
|
|
—
|
|
—
|
|
|||||||
|
Debt
|
317
|
|
—
|
|
—
|
|
—
|
|
|||||||
|
Commodities
|
232
|
|
—
|
|
—
|
|
—
|
|
|||||||
|
Blended
|
109
|
|
—
|
|
—
|
|
—
|
|
|||||||
|
Institutional mutual funds
|
109
|
|
109
|
|
—
|
|
—
|
|
|||||||
|
Cash equivalents and other short-term investments
|
358
|
|
42
|
|
316
|
|
—
|
|
|||||||
|
Certificates of deposit
|
2
|
|
—
|
|
2
|
|
—
|
|
|||||||
|
Private credit measured at net asset value
(3)
|
8
|
|
—
|
|
—
|
|
—
|
|
|||||||
|
Private equity measured at net asset value
(3)
|
631
|
|
—
|
|
—
|
|
—
|
|
|||||||
|
Private real estate measured at net asset value
(3)
|
583
|
|
—
|
|
—
|
|
—
|
|
|||||||
|
Securities lending collateral
|
318
|
|
—
|
|
318
|
|
—
|
|
|||||||
|
Derivatives
|
|
|
|
|
|
|
|
|
|||||||
|
Futures
|
7
|
|
7
|
|
—
|
|
—
|
|
|||||||
|
Swaps
|
8
|
|
—
|
|
8
|
|
—
|
|
|||||||
|
Foreign currency forward receivable
|
3
|
|
—
|
|
3
|
|
—
|
|
|||||||
|
Total assets
|
$
|
8,423
|
|
$
|
2,644
|
|
$
|
2,666
|
|
$
|
58
|
|
|||
|
Liabilities
|
|
|
|
|
|
|
|
|
|||||||
|
Futures
|
$
|
3
|
|
$
|
3
|
|
$
|
—
|
|
$
|
—
|
|
|||
|
Foreign currency forward payable
|
3
|
|
—
|
|
3
|
|
—
|
|
|||||||
|
Written options
|
1
|
|
—
|
|
1
|
|
—
|
|
|||||||
|
Total liabilities
|
$
|
7
|
|
$
|
3
|
|
$
|
4
|
|
$
|
—
|
|
|||
Notes
(1) Excludes approximately $
95 million
in net payables associated with security purchases and sales and various other payables.
(2) Excludes a $
318 million
payable for collateral on loaned securities in connection with TVARS’s participation in securities lending programs.
(3) In accordance with Subtopic 820-10, certain investments that are measured at fair value using the net asset value per share (or its equivalent) practical expedient have not been classified in the fair value hierarchy.
131
The following table provides the fair value measurement amounts for assets held by TVARS at
September 30, 2017
:
|
TVA Retirement System
At September 30, 2017
|
|||||||||||||||
|
|
Total
(1)(2)
|
Quoted Prices in Active Markets for Identical
Assets/Liabilities
(Level 1)
|
Significant Other
Observable Inputs
(Level 2)
|
Significant
Unobservable
Inputs
(Level 3)
|
|||||||||||
|
Assets
|
|
|
|
|
|||||||||||
|
Equity securities
|
$
|
1,771
|
|
$
|
1,770
|
|
$
|
—
|
|
$
|
1
|
|
|||
|
|
|||||||||||||||
|
Preferred securities
|
14
|
|
3
|
|
11
|
|
—
|
|
|||||||
|
Debt securities
|
|
|
|
|
|
|
|||||||||
|
Corporate debt securities
|
1,100
|
|
—
|
|
1,088
|
|
12
|
|
|||||||
|
Residential mortgage-backed securities
|
325
|
|
—
|
|
317
|
|
8
|
|
|||||||
|
Debt securities issued by U.S. Treasury
|
193
|
|
193
|
|
—
|
|
—
|
|
|||||||
|
Debt securities issued by foreign governments
|
331
|
|
—
|
|
307
|
|
24
|
|
|||||||
|
Asset-backed securities
|
146
|
|
—
|
|
109
|
|
37
|
|
|||||||
|
Debt securities issued by state/local governments
|
19
|
|
—
|
|
17
|
|
2
|
|
|||||||
|
Commercial mortgage-backed securities
|
68
|
|
—
|
|
62
|
|
6
|
|
|||||||
|
Commingled funds measured at net asset value
(3)
|
|
|
|||||||||||||
|
Equity
|
1,134
|
|
—
|
|
—
|
|
—
|
|
|||||||
|
Debt
|
709
|
|
—
|
|
—
|
|
—
|
|
|||||||
|
Commodities
|
224
|
|
—
|
|
—
|
|
—
|
|
|||||||
|
|
|
|
|
|
|
|
|
||||||||
|
Institutional mutual funds
|
155
|
|
155
|
|
—
|
|
—
|
|
|||||||
|
Cash equivalents and other short-term investments
|
916
|
|
—
|
|
916
|
|
—
|
|
|||||||
|
Certificates of deposit
|
6
|
|
—
|
|
6
|
|
—
|
|
|||||||
|
Private equity measured at net asset value
(3)
|
500
|
|
—
|
|
—
|
|
—
|
|
|||||||
|
Private real estate measured at net asset value
(3)
|
533
|
|
—
|
|
—
|
|
—
|
|
|||||||
|
|
|
|
|
|
|
|
|
||||||||
|
Securities lending collateral
|
369
|
|
—
|
|
369
|
|
—
|
|
|||||||
|
Derivatives
|
|||||||||||||||
|
Futures
|
18
|
|
18
|
|
—
|
|
—
|
|
|||||||
|
Swaps
|
1
|
|
—
|
|
1
|
|
—
|
|
|||||||
|
Foreign currency forward receivable
|
4
|
|
—
|
|
4
|
|
—
|
|
|||||||
|
Total assets
|
$
|
8,536
|
|
$
|
2,139
|
|
$
|
3,207
|
|
$
|
90
|
|
|||
|
Liabilities
|
|
|
|
|
|
|
|
|
|||||||
|
Futures
|
$
|
3
|
|
$
|
2
|
|
$
|
—
|
|
$
|
1
|
|
|||
|
Foreign currency forward payable
|
6
|
|
—
|
|
6
|
|
—
|
|
|||||||
|
Swaps
|
1
|
|
—
|
|
—
|
|
1
|
|
|||||||
|
Total liabilities
|
$
|
10
|
|
$
|
2
|
|
$
|
6
|
|
$
|
2
|
|
|||
Notes
(1) Excludes approximately $
168 million
in net payables associated with security purchases and sales and various other payables.
(2) Excludes a $
369 million
payable for collateral on loaned securities in connection with TVARS’s participation in securities lending programs.
(3) Certain investments that are measured at fair value using the net asset value per share (or its equivalent) practical expedient have not been classified in the fair value hierarchy.
132
The following table provides a reconciliation of beginning and ending balances of pension plan assets measured at fair value on a recurring basis where the determination of fair value includes significant unobservable inputs (Level 3):
|
Fair Value Measurements Using Significant Unobservable Inputs
|
|||
|
|
Fair Value Measurements Using Significant Unobservable Inputs (Level 3)
|
||
|
Balance at October 1, 2016
|
$
|
97
|
|
|
Net realized/unrealized gains (losses)
|
2
|
|
|
|
Purchases, sales, issuances, and settlements (net)
|
(6
|
)
|
|
|
Transfers in and/or out of Level 3
|
(5
|
)
|
|
|
Balance at September 30, 2017
|
88
|
|
|
|
Net realized/unrealized gains (losses)
|
(4
|
)
|
|
|
Purchases, sales, issuances, and settlements (net)
|
(23
|
)
|
|
|
Transfers in and/or out of Level 3
|
(3
|
)
|
|
|
Balance at September 30, 2018
|
$
|
58
|
|
The following descriptions of the valuation methods and assumptions used by the pension plan to estimate the fair value of investments apply to investments held directly by the pension plan. Third-party pricing vendors provide valuations for investments held by the pension plan in most instances, except for commingled, private credit, private equity, and private real estate funds which are priced at net asset values established by the investment managers. In instances where pricing is determined to be based on unobservable inputs, a Level 3 classification has been assigned. Certain securities priced by the investment manager using a proprietary fair value model with unobservable inputs have been classified as Level 3.
Equity and Preferred Securities.
Investments listed on either a national or foreign securities exchange or traded in the over-the-counter National Market System are generally valued each business day at the official closing price (typically the last reported sale price) on the exchange on which the security is primarily traded and are classified as Level 1. Equity securities, including common stocks and preferred securities, classified as Level 2 may have been priced by dealer quote or using assumptions based on observable market data, such as yields on bonds from the same issuer or industry. Certain securities priced by the investment manager using unobservable inputs have been classified as Level 3.
Corporate Debt Securities.
Corporate bonds are valued based upon recent bid prices or the average of recent bid and asked prices when available (Level 2 inputs) and, if not available, they are valued through matrix pricing models. Matrix pricing, which is a mathematical technique commonly used to price debt securities that are not actively traded, values debt securities without relying exclusively on quoted prices for the specific securities but rather by relying on the securities’ relationship to other benchmark quoted securities (Level 2 inputs). Certain securities priced by the investment manager using broker pricing or unobservable inputs have been classified as Level 3.
Mortgage and Asset-Backed Securities.
Residential mortgage-backed securities consist of
collateralized mortgage obligations ("CMOs")
and U.S. pass-through security pools related to government-sponsored enterprises. CMO pricing is typically based on either a volatility-driven, multidimensional, single-cash-flow stream model or an option-adjusted spread model. These models incorporate available market data such as trade information, dealer quotes, market color, spreads, bids, and offers. Pricing for government-sponsored enterprise securities, including the Federal Home Loan Mortgage Corporation, the Federal National Mortgage Association, and the Government National Mortgage Association, is typically based on quotes from the
To Be Announced ("TBA")
market, which is highly liquid with multiple electronic platforms that facilitate the execution of trading between investors and broker/dealers. Prices from the TBA market are then compared against other live data feeds as well as input obtained directly from the dealer community. Most residential mortgage-backed securities are considered to be priced using Level 2 inputs because of the nature of their market-data-based pricing models. Certain securities priced by vendor using a single broker quote or unobservable inputs have been classified as Level 3.
Debt Securities Issued by U.S. Treasury.
For U.S. Treasury securities, fair values reflect the closing price reported in the active market in which the security is traded (Level 1 inputs).
Debt Securities Issued by Foreign Governments.
Foreign government bonds and foreign government inflation-linked securities are typically priced based on proprietary discounted cash flow models, incorporating option-adjusted spread features as appropriate. Debt securities issued by foreign governments are classified as Level 2 because of the nature of their market-data-based pricing models. Certain securities priced by the investment manager using broker quotes or unobservable input have been classified as Level 3.
133
Debt Securities Issued by State and Local Governments
. Debt securities issued by state and local governments are typically priced using market-data-based pricing models, and are therefore classified as Level 2. These pricing models incorporate market data such as quotes, trading levels, spread relationships, and yield curves, as applicable. Certain securities priced using an unobservable input have been classified as Level 3.
Commercial Mortgage-Backed and Asset-Backed Securities
. Commercial mortgage-backed and asset-backed securities are typically priced based on a single-cash-flow stream model, which incorporates available market data such as trade information, dealer quotes, market color, spreads, bids, and offers. Because of the market-data-based nature of such pricing models, these securities are typically classified as Level 2. Certain securities priced by investment managers using broker pricing or unobservable inputs have been classified as Level 3.
Commingled Funds
. The pension plan invests in commingled funds, which include collective trusts, unit investment trusts, and similar investment funds that predominantly hold debt and/or equity securities as underlying assets. The pension plan’s ownership consists of a pro rata share and not a direct ownership of an underlying investment. These commingled funds are valued at their closing net asset values (or unit value) per share as reported by the managers of the commingled funds and as supported by the unit prices of actual purchases and sale transactions occurring as of or close to the financial statement date. These funds have not been classified in the fair value hierarchy in accordance with FASB guidance issued in May 2015.
The pension plan is invested in equity commingled funds, which can be categorized as either passively managed index funds or actively managed funds. The equity index funds seek to track the performance of a particular index by replicating its capitalization and characteristics. Passive fund benchmark indices include the Russell 1000 index, the S&P 500 index, the MSCI ACWI ex-U.S. index, the MSCI ACWI ex-U.S. Small-Cap index, and the Dow Jones U.S. Select REIT Index. The actively managed equity funds seek to outperform certain equity benchmarks through a combination of fundamental and technical analysis.
Active funds select portfolio positions based upon their research.
The pension plan is invested in debt commingled funds, which can be categorized as either passively managed index funds or actively managed funds. The pension plan’s debt index fund invests in a diversified portfolio of fixed-income securities and derivatives of varying maturities to replicate the characteristics of the Bloomberg Barclays Capital U.S.
Treasury Inflation-Protected Securities ("TIPS")
index. The fund seeks to track the total return of the Bloomberg Barclays Capital U.S. TIPS index. The actively managed debt funds seek to outperform certain fixed-income benchmarks through fundamental research and analysis. The funds invest in a diversified portfolio of fixed income securities and derivatives of varying maturities. Varying by strategy, fund objectives include achieving a positive relative total return through active credit selection and providing risk management through desired strategic exposures.
The pension plan is invested in commodity commingled funds, which can be categorized as actively managed funds. The funds seek to outperform certain commodity benchmarks through fundamental research and analysis. The funds invest in a diversified portfolio of commodity securities and derivatives of varying maturities. The objective is to achieve a positive relative return through active security selection.
The pension plan is invested in commingled funds, which invest across multiple asset classes that can be categorized as blended. These funds seek to outperform a passive benchmark through active security selection. The funds invest in securities across equity, fixed income, currency, and commodities. The portfolios employ fundamental, quantitative, and technical analysis.
The pension plan’s investments in equity, debt, blended, and commodity commingled funds can generally be redeemed upon notification of the investment managers, with required notice periods varying from same-day to monthly. These investments do not have unfunded commitments.
Institutional Mutual Funds
. Investments in institutional mutual funds are valued at prices based on their net asset value. Institutional mutual funds have daily published market prices that represent their net asset value (or unit value) per share and are classified as Level 1.
Cash Equivalents and Other Short-Term Investments and Certificates of Deposit
. Cash equivalents and other short-term investments are highly liquid securities with maturities of less than three months and 12 months, respectively. These consist primarily of discount securities such as commercial paper, repurchase agreements, U.S. Treasury bills, and certain agency securities. These securities, as well as certificates of deposit, may be priced at cost, which approximates fair value due to the short-term nature of the instruments. Model based pricing which incorporates observable inputs may also be utilized. These securities are classified as Level 2. Active market pricing may be utilized for U.S. Treasury bills, which are classified as Level 1.
Private Credit Funds
. Private credit limited partnerships are reported at net asset values provided by the fund managers. These funds have not been classified in the fair value hierarchy in accordance with FASB guidance issued in May 2015.
134
The private credit limited partnerships generally focus on direct lending investments of senior secured first-lien loans to lower-middle market companies and seek to obtain financial returns through high income potential and occasional equity upside. The limited partnerships generally have a term life of seven years and are diversified by sector and industry.
Private Equity Funds.
Private equity limited partnerships are reported at net asset values provided by the fund managers. These funds have not been classified in the fair value hierarchy in accordance with FASB guidance issued in May 2015.
The private equity limited partnerships typically make longer-term investments in private companies and seek to obtain financial returns through long-term appreciation based on corporate stewardship, improved operating processes, and financial restructuring which may involve a merger or acquisition. Significant investment strategies include venture capital; buyout; mezzanine or subordinated debt; restructuring or distressed debt; and special situations. Venture capital partnerships consist of two main groupings. Early-stage venture capital partnerships invest in businesses still in the conceptual stage where products may not be fully developed and where revenues and/or profits may be several years away. Later-stage venture capital partnerships invest in more mature companies in need of growth or expansion capital. Buyout partnerships provide the equity capital for acquisition transactions either from a private seller or the public, which may represent the purchase of the entire company or a refinancing or recapitalization transaction where equity is invested. Mezzanine or subordinated debt partnerships provide the intermediate capital between equity and senior debt in a buyout or refinancing transaction and typically own a security in the company that carries current interest payments as well as a potential equity interest in the company. Restructuring or distressed debt partnerships purchase opportunities generated by overleveraged or poorly managed companies. Special situation partnerships include organizations with a specific industry focus not covered by the other private equity subclasses or unique opportunities that fall outside the regular subclasses.
The private equity funds have no investment withdrawal provisions prior to the termination of the partnership. Partnerships generally continue
10
to
12
years after the inception of the fund. The partnerships are subject to
two
to
three
one-year extensions at the discretion of the General Partner. Partnerships can generally be dissolved by an
80 percent
vote in interest by all limited partners, with some funds requiring the occurrence of a specific event.
Private Real Estate Investments.
The pension plan’s ownership in private real estate investments consists of a pro rata share and not a direct ownership of the underlying investments. The fair values of the pension plan’s private real estate investments are estimated utilizing net asset values provided by the investment managers. These investments have not been classified in the fair value hierarchy in accordance with FASB guidance issued in May 2015. The investment strategies and methodologies utilized by the investment managers to calculate their net asset values are summarized as follows:
The pension plan is invested in limited partnerships that invest in real estate securities, real estate partnerships, and direct real estate properties. This includes investments in office, multifamily, industrial, and retail investment properties in the U.S. and international markets. The investment strategy focuses on distressed, opportunistic, and value-added opportunities. Partnership investments also include mortgage and/or real estate-related fixed-income instruments and related securities. Investments are diversified by property type and geographic location.
The pension plan is invested in a commingled fund which invests across multiple asset classes that can be categorized as blended. The fund seeks to achieve capital appreciation while targeting a specific risk profile. The fund invests in securities across equity, fixed income, currency, and commodities. The portfolio employs fundamental, quantitative, and technical analysis.
Fair value estimates of the underlying investments in these limited partnerships and commingled fund investments are primarily based upon property appraisal reports prepared by independent real estate appraisers within a reasonable amount of time following acquisition of the real estate and no less frequently than annually thereafter. The appraisals are based on one or a combination of three methodologies: cost of reproduction analysis, discounted cash flow analysis, and sales comparison analysis. Pricing for certain investments in mortgage-backed and asset-backed securities is typically based on models that incorporate observable inputs.
The pension plan is invested in a private real estate investment trust formed to make direct or indirect investments in commercial timberland properties. Pricing for these types of investments is based on comprehensive appraisals that are conducted shortly after initial purchase of properties and at three-year intervals thereafter. All appraisals are conducted by third-party timberland appraisal firms. Appraisals are based on either a sales comparison analysis or a discounted cash flow analysis.
Securities Lending Collateral
. Collateral held under securities lending arrangements are invested in highly liquid short-term securities, primarily repurchase agreements. The securities are often priced at cost, which approximates fair value due to the short-term nature of the instruments. These securities are classified as Level 2.
Derivatives.
The pension plan invests in a variety of derivative instruments. The valuation methodologies for these instruments are as follows:
Futures
. The pension plan enters into futures. The futures contracts are listed on either a national or foreign securities exchange and are generally valued each business day at the official closing price (typically the last reported sales price) on the
135
exchange on which the security is primarily traded. The pricing is performed by third-party vendors. Since futures are priced by an exchange in an active market, they are classified as Level 1.
Options
. The pension plan enters into purchased and written options. Options that are listed on either a national or foreign securities exchange are generally valued each business day at the official closing price (typically the last reported sales price) on the exchange on which the security is primarily traded. These options are classified as Level 1. Options traded over the counter and not on exchanges are priced by third-party vendors and are classified as Level 2.
Swaps
. The pension plan enters into various types of swaps. Credit default swaps are priced at market using models that consider cash flows, credit curves, recovery rates, and other factors. The pricing is performed by third-party vendors, and in some cases by clearing exchanges. Interest rate swap contracts are priced at market using forward rates derived from the swap curve, and the pricing is also performed by third-party vendors, and in some cases by clearing exchanges. Other swaps such as equity index swaps and variance swaps are priced by third-party vendors using market inputs such as spot rates, yield curves, and volatility. The pension plan's swaps are generally classified as Level 2 based on the observable nature of their pricing inputs.
Foreign currency forwards
. The pension plan enters into foreign currency forwards. All commitments are marked to market daily at the applicable translation rates, and any resulting unrealized gains or losses are recorded. Foreign currency forwards are priced by third-party vendors and are classified as Level 2.
The valuation methods described above may produce a fair value calculation that may not be indicative of net realizable value or reflective of future fair values. Furthermore, while the pension plan believes its valuation methods are appropriate and consistent with other market participants, the use of different methodologies or assumptions to determine the fair value of certain financial instruments could result in a different fair value measurement at the reporting date.
Cash Flows
Estimated Future Benefit Payments.
The following table sets forth the estimated future benefit payments under the benefit plans.
|
Estimated Future Benefits Payments
At September 30, 2018
|
|||||||
|
|
Pension
Benefits
(1)
|
Other Post-Retirement Benefits
|
|||||
|
2019
|
$
|
779
|
|
$
|
29
|
|
|
|
2020
|
776
|
|
27
|
|
|||
|
2021
|
772
|
|
25
|
|
|||
|
2022
|
771
|
|
24
|
|
|||
|
2023
|
768
|
|
23
|
|
|||
|
2024 - 2028
|
3,771
|
|
109
|
|
|||
Note
(1) Participants are assumed to receive the Fixed Fund in a lump sum in lieu of available annuity options allowed for certain grandfathered participants resulting in higher estimated pension benefits payments.
Contributions
. The minimum contribution to the pension plan for
2018
and
2017
was $
300 million
; however in
2017
, TVA made an
$800 million
contribution to TVARS, including a one-time additional discretionary
$500 million
contribution to TVA's pension plan, which was recognized as pension expense. Additional contributions at any time to TVARS in excess of the minimum contribution determined are maintained and credited with interest and may be used toward the required contributions in future years at the direction of TVA. TVA has committed to make a minimum contribution of
$300 million
per year through 2036 or until the plan has reached and remained at 100 percent funded status under the actuarial rules applicable to TVARS. TVA made SERP contributions of
$4 million
and
$5 million
for 2018 and 2017, respectively. TVA made cash contributions to the other post-retirement benefit plans of
$25 million
(net of
$15 million
in rebates) and
$30 million
(net of
$20 million
in rebates) for 2018 and 2017, respectively. TVA expects to contribute
$300 million
to TVARS,
$6 million
to the SERP, and
$29 million
to the other post-retirement benefit plans in 2019.
Other Post-Employment Benefits
Post-employment benefit cost estimates are revised to properly reflect changes in actuarial assumptions made at the end of each year. TVA utilizes a discount rate determined by reference to the U.S. Treasury Constant Maturities corresponding to calculated average durations of TVA’s future estimated post-employment claims payments. The use of a
3.05 percent
discount rate resulted in the recognition of approximately $
(6) million
in expenses in
2018
and an unpaid benefit obligation of
$399 million
at
September 30, 2018
. The use of a
2.33 percent
discount rate resulted in the recognition of approximately
$(12) million
in expenses in
2017
and an unpaid benefit obligation of
$447 million
at
September 30, 2017
. The use of a
1.60 percent
136
discount rate resulted in the recognition of approximately
$35 million
in expenses in
2016
and an unpaid benefit obligation of
$501 million
at September 30,
2016
.
The decrease in the unpaid benefit obligation when comparing
2018
to
2017
was due primarily to the increase of the discount rate from
2.33 percent
in
2017
to
3.05 percent
in 2018. Additional reduction in the obligation was due to a decrease in loss experience and fewer claims. The decrease in the unpaid benefit obligation when comparing
2017
to
2016
was due primarily to the increase in the discount rate from
1.60 percent
in
2016
to
2.33 percent
in
2017
.
Amounts related to other post-employment benefit obligations are recognized on TVA's consolidated balance sheets. The current portion which represents unpaid losses and administrative fees due are in Accounts payable and accrued liabilities. The long-term portion is recognized in Post-retirement and post-employment benefit obligations.
|
Amounts Recognized on TVA's Consolidated Balance Sheets
At September 30
|
|||||||
|
|
2018
|
2017
|
|||||
|
Accounts payable and accrued liabilities
|
$
|
39
|
|
$
|
39
|
|
|
|
Post-retirement and post-employment benefit obligations
|
360
|
|
408
|
|
|||
21
.
Commitments and Contingencies
Commitments
Power Purchase Obligations.
TVA has contracted with various independent power producers and LPCs for additional capacity to be made available to TVA. Several of these agreements have contractual minimum payments and are accounted for as either capital or operating leases. In total, these agreements provide
2,230
MW of summer net capability. The remaining terms of the agreements range up to
14 years
. Additionally, TVA has contracted with regional transmission organizations to reserve
1,450
MW of transmission service to support purchases from the market and wind power purchase agreements. The remaining terms of these agreements range up to
four
years. TVA incurred $
188 million
, $
178 million
, and $
218 million
of expense under these power purchase and transmission service agreements during
2018
,
2017
, and
2016
, respectively. Lease-related costs under TVA’s power purchase agreements not accounted for as capital leases, as well as certain leases that are accounted for as capital leases, are included in TVA's consolidated statements of operations as purchased power expense and are expensed as incurred.
Under federal law, TVA is obligated to purchase power from qualifying facilities (cogenerators and small power producers). As of
September 30, 2018
, there was a combined qualifying facility capacity of
259
MW from
36
different generation sources, from which TVA purchased power under this law.
Membership Interests of VIE Subject to Mandatory Redemption
. At
September 30, 2018
, TVA had outstanding membership interests subject to mandatory redemption (including current portion) of $
30 million
issued by one of its VIEs of which it is the primary beneficiary. See
Note 10
for additional information. At
September 30, 2018
, the mandatory redemptions for each of the next five years are shown below:
|
|
2019
|
2020
|
2021
|
2022
|
2023
|
|||||||||||||||
|
Membership interests of variable interest entity subject to mandatory redemption
|
$
|
2
|
|
$
|
3
|
|
$
|
3
|
|
$
|
3
|
|
$
|
2
|
|
|||||
Leases
. TVA leases certain property, plant, and equipment under agreements with terms ranging from
one
to
38
years. TVA’s rental expense for operating leases, including power purchase agreement operating leases, was $
92 million
, $
90 million
, and $
86 million
in
2018
,
2017
, and
2016
, respectively. At
September 30, 2018
, the future minimum lease payments under operating leases, including purchased power agreements that are accounted for as operating leases, are shown below.
|
Operating Leases
Minimum payments due in years ending September 30 |
||||
|
2019
|
$
|
69
|
|
|
|
2020
|
64
|
|
||
|
2021
|
62
|
|
||
|
2022
|
47
|
|
||
|
2023
|
7
|
|
||
|
Thereafter
|
1
|
|
||
|
Total
|
$
|
250
|
|
|
137
At
September 30, 2018
, the future minimum lease payments under capital leases shown below were included as Capital leases and Other long-term liabilities on TVA's consolidated balance sheet.
|
Capital Leases
Minimum payments due in years ending September 30
|
||||
|
2019
|
$
|
51
|
|
|
|
2020
|
51
|
|
||
|
2021
|
51
|
|
||
|
2022
|
51
|
|
||
|
2023
|
51
|
|
||
|
Thereafter
|
468
|
|
||
|
Minimum annual payments
|
723
|
|
||
|
Less: amount representing interest
|
(541
|
)
|
||
|
Total
|
$
|
182
|
|
|
Leasebacks
. At
September 30, 2018
and
2017
, the outstanding leaseback obligations related to CTs and QTE were
$301 million
and
$338 million
, respectively. See
Note 13
—
Lease/Leasebacks
. At
September 30, 2018
, the future minimum payments under leaseback obligations are shown below.
|
Lease/Leasebacks
Minimum payments due in years ending September 30
|
||||
|
2019
|
$
|
49
|
|
|
|
2020
|
50
|
|
||
|
2021
|
207
|
|
||
|
2022
|
25
|
|
||
|
2023
|
—
|
|
||
|
Thereafter
|
—
|
|
||
|
Total
|
$
|
331
|
|
|
Unfunded Loan Commitments
. At
September 30, 2018
, TVA's commitments under unfunded loan commitments is
$3 million
for 2019. TVA has no commitments under unfunded loan commitments for 2020 through 2023.
In addition to the commitments above, TVA has contractual obligations in the form of revenue discounts related to energy prepayments. TVA will recognize $
10 million
of prepayment obligations and related interest payments of $
4 million
in revenue during 2019. No prepayment obligations or related interest payments will be recognized in revenue from 2020 through 2023. See
Note 1
—
Energy Prepayment Obligations
.
Contingencies
Nuclear Insurance
. Section 170 of the Atomic Energy Act, commonly known as the Price-Anderson Act, provides a layered framework of protection to compensate for liability claims of members of the public for personal injury and property damages arising from a nuclear event in the U.S. This protection consists of
two
layers of coverage:
|
•
|
The primary level is private insurance underwritten by American Nuclear Insurers (“ANI”) and provides public liability insurance coverage of
$450 million
for each operating reactor. If this amount is not sufficient to cover claims arising from an accident, the second level, Secondary Financial Protection, applies.
|
|
•
|
Within the Secondary Financial Protection level, the owner of each nuclear reactor has a contingent obligation to pay a retrospective premium, equal to its proportionate share of the loss in excess of the primary level, regardless of proximity to the incident of fault, up to a maximum of approximately
$127 million
per reactor per incident. With TVA’s
seven
reactors, the maximum total contingent obligation per incident is
$891 million
. This retrospective premium is payable at a rate currently set at approximately
$19 million
per year per incident per reactor. Currently,
99
reactors are participating in the Secondary Financial Protection program.
|
In the event that a nuclear power plant event results in third-party damages, the primary level provided by ANI combined with the Secondary Financial Protection would provide approximately
$13.0 billion
in coverage.
Federal law requires that each NRC power reactor licensee obtain property insurance from private sources to cover the cost of stabilizing or shutting down a reactor after an accident. TVA carries property, decommissioning, and decontamination insurance from
Nuclear Electric Insurance Limited ("NEIL")
, totaling
$5.1 billion
for its licensed nuclear plants with up to
$2.1
138
billion
available for a loss at any one site. Some of this insurance may require the payment of retrospective premiums up to a maximum of approximately
$128 million
.
TVA purchases accidental outage (business interruption) insurance for TVA’s nuclear sites from NEIL. In the event that an accident covered by this policy takes a nuclear unit offline or keeps a nuclear unit offline, NEIL will pay TVA, after a waiting period, an indemnity (a set dollar amount per week) up to a maximum indemnity of $
490 million
per unit. This insurance policy may require the payment of retrospective premiums up to a maximum of approximately $
44 million
.
Decommissioning Costs.
TVA recognizes legal obligations associated with the future retirement of certain tangible long-lived assets related primarily to nuclear generating plants, coal-fired generating plants, hydroelectric generating plants/dams, transmission structures, and other property-related assets. See
Note 12
.
Nuclear Decommissioning
. Provision for decommissioning costs of nuclear generating units is based on options prescribed by the NRC procedures to dismantle and decontaminate the facilities to meet the NRC criteria for license termination. At
September 30, 2018
, the estimated future decommissioning cost of
$3.0 billion
was included in AROs. The actual decommissioning costs may vary from the derived estimates because of, among other things, changes in current assumptions, such as the assumed dates of decommissioning, changes in regulatory requirements, changes in technology, and changes in the cost of labor, materials, and equipment. Utilities that own and operate nuclear plants are required to use different procedures in calculating nuclear decommissioning costs under GAAP than those that are used in calculating nuclear decommissioning costs when reporting to the NRC. The
two
sets of procedures produce different estimates for the costs of decommissioning primarily because of differences in the underlying assumptions.
TVA maintains a NDT to provide funding for the ultimate decommissioning of its nuclear power plants. See
Note 16
. TVA monitors the value of its NDT and believes that, over the long term and before cessation of nuclear plant operations and commencement of decommissioning activities, adequate funds from investments and additional contributions, if necessary, will be available to support decommissioning. TVA’s operating nuclear power units are licensed through 2033 - 2055, depending on the unit. It may be possible to extend the operating life of some of the units with approval from the NRC. See
Note 7
—
Nuclear Decommissioning Costs
and
Note 12
.
Non-Nuclear Decommissioning
. The estimated future non-nuclear decommissioning ARO was
$1.8 billion
at
September 30, 2018
. This decommissioning cost estimate involves estimating the amount and timing of future expenditures and making judgments concerning whether or not such costs are considered a legal obligation. Estimating the amount and timing of future expenditures includes, among other things, making projections of the timing and duration of the asset retirement process and how costs will escalate with inflation. The actual decommissioning costs may vary from the derived estimates because of changes in current assumptions, such as the assumed dates of decommissioning, changes in regulatory requirements, changes in technology, and changes in the cost of labor, materials, and equipment.
TVA maintains an ART to help fund the ultimate decommissioning of its non-nuclear power assets. See
Note 16
. Estimates involved in determining if additional funding will be made to the ART include inflation rate, rate of return projections on the fund investments, and the planned use of other sources to fund decommissioning costs. See
Note 7
—
Non-Nuclear Decommissioning Costs
and
Note 12
.
Environmental Matters.
TVA’s power generation activities, like those across the utility industry and in other industrial sectors, are subject to federal, state, and local environmental laws and regulations. Major areas of regulation affecting TVA’s activities include air quality control, water quality control, and management and disposal of solid and hazardous wastes. In the future, regulations in all of these areas are expected to become more stringent. Regulations are also expected to apply to new emissions and sources, with a particular emphasis on climate change, renewable generation, and energy efficiency.
TVA has incurred, and expects to continue to incur, substantial capital and operating and maintenance costs to comply with evolving environmental requirements primarily associated with, but not limited to, the operation of TVA’s coal-fired generating units. Environmental requirements placed on the operation of TVA’s coal-fired and other generating units will likely continue to become more restrictive over time. Litigation over emissions or discharges from coal-fired generating units is also occurring, including litigation against TVA. Failure to comply with environmental and safety laws can result in TVA being subject to enforcement actions, which can lead to the imposition of significant civil liability, including fines and penalties, criminal sanctions, and/or the shutting down of non-compliant facilities
.
From 1970 to
2018
, TVA spent approximately $
6.7 billion
to reduce emissions from its power plants, including $
62 million
, $
206 million
, and $
259 million
in
2018
,
2017
, and
2016
, respectively, on clean air controls. TVA estimates that compliance with existing and future
Clean Air Act ("CAA")
requirements (excluding
greenhouse gas ("GHG")
requirements) could lead to costs of $
163 million
from 2019 to 2023, which include existing controls capital projects and air operations and maintenance projects. TVA also estimates additional expenditures of approximately
$1.2 billion
from 2019 to 2023 relating to TVA’s CCR conversion program, not including costs related to any new requirements related to the Gallatin lawsuits, as well as expenditures of approximately $
466 million
from 2019 to 2024 relating to compliance with Clean Water Act requirements. Future costs could differ from these estimates if new environmental laws or regulations become applicable to TVA or the facilities it
139
operates, or if existing environmental laws or regulations are revised or reinterpreted. There could also be costs that cannot reasonably be predicted at this time, due to uncertainty of actions, that could increase these estimates.
Liability for releases and cleanup of hazardous substances is primarily regulated by the federal
Comprehensive Environmental Response, Compensation, and Liability Act ("CERCLA")
, and other federal and parallel state statutes. In a manner similar to many other industries and power systems, TVA has generated or used hazardous substances over the years. TVA operations at some facilities have resulted in contamination that TVA is addressing. At
September 30, 2018
and
2017
, TVA’s estimated liability for cleanup and similar environmental work for those sites for which sufficient information is available to develop a cost estimate was approximately
$12 million
and
$7 million
, respectively, on a non-discounted basis, and was included in Accounts payable and accrued liabilities and Other long-term liabilities on the Consolidated Balance Sheets.
Potential Liability Associated with Workers’ Exposure to CCR Materials.
In response to the 2008 ash spill at the Kingston, TVA hired
Jacobs Engineering Group, Inc. (“Jacobs”)
to oversee certain aspects of the cleanup. After the cleanup was completed, Jacobs was sued in the United States District Court for the Eastern District of Tennessee (“Eastern District”) by a group of workers who alleged that Jacobs had failed to take or provide proper health precautions and misled workers about the health risks associated with exposure to coal fly ash, which is a CCR material. The plaintiffs alleged that exposure to the fly ash caused a variety of significant health issues and illnesses, including in some cases death. The case was split into two phases, with the first phase considering general causation and the second determining specific causation. On November 7, 2018, a jury hearing the first phase returned a verdict in favor of the plaintiffs, including determinations that Jacobs failed to adhere to its contract with TVA or the Site Wide Safety and Health Plan in place; Jacobs failed to provide reasonable care to the plaintiffs; and Jacobs’s failures were capable of causing a specific list of medical conditions, ranging from hypertension to cancer. The case will now proceed on the question of whether Jacobs’s failures did in fact cause the plaintiffs’ alleged injuries. While TVA is not a party to this litigation, TVA could be obligated to reimburse Jacobs for some amounts that Jacobs is required to pay as a result of this litigation, but TVA cannot estimate at this time the amount of any such reimbursement obligations. Further, TVA will continue monitoring this litigation to determine whether this or similar cases could have broader implications for the utility industry.
Legal Proceedings
From time to time,
TVA is party to or otherwise involved in lawsuits, claims, proceedings, investigations, and other legal matters ("Legal Proceedings")
that have arisen in the ordinary course of conducting TVA's activities, as a result of a catastrophic event or otherwise.
General.
At
September 30, 2018
, TVA had accrued $
18 million
with respect to Legal Proceedings. Of the accrued amount, $
11 million
is included in Other long-term liabilities and $
7 million
is included in Accounts payable and accrued liabilities. No assurance can be given that TVA will not be subject to significant additional claims and liabilities. If actual liabilities significantly exceed the estimates made, TVA's results of operations, liquidity, and financial condition could be materially adversely affected.
Environmental Agreements
. In April 2011, TVA entered into
two
substantively similar agreements,
one
with the EPA and the other with Alabama, Kentucky, North Carolina, Tennessee, and
three
environmental advocacy groups: the Sierra Club, the National Parks Conservation Association, and Our Children's Earth Foundation (collectively, the "Environmental Agreements”). They became effective in June 2011. Under the Environmental Agreements, TVA committed to (1) retire on a phased schedule
18
coal-fired units with a combined summer net dependable capability of
2,200
MW, (2) control, convert, or retire additional coal-fired units with a combined summer net dependable capability of
3,500
MW, (3) comply with annual, declining emission caps for SO
2
and NO
x
, (4) invest $
290 million
in certain TVA environmental projects (of which TVA had spent approximately $
276 million
as of
September 30, 2018
), (5) provide $
60 million
to Alabama, Kentucky, North Carolina, and Tennessee to fund environmental projects, and (6) pay civil penalties of $
10 million
. In exchange for these commitments, most past claims against TVA based on alleged
New Source Review ("NSR")
and associated violations were waived and cannot be brought against TVA. Future claims, including those for sulfuric acid mist and GHG emissions, can still be brought against TVA, and claims for increases in particulates can also be pursued at many of TVA’s coal-fired units. Additionally, the Environmental Agreements do not address compliance with new laws and regulations or the cost associated with such compliance.
The liabilities related to the Environmental Agreements are included in Accounts payable and accrued liabilities and Other long-term liabilities on the
September 30, 2018
Consolidated Balance Sheet. In conjunction with the approval of the Environmental Agreements, the TVA Board determined that it was appropriate to record TVA's obligations under the Environmental Agreements as regulatory assets, and they are included as such on the
September 30, 2018
Consolidated Balance Sheet and will be recovered in rates in future periods. TVA has substantially completed the requirements in the Environmental Agreements related to retiring coal-fired units or installing controls on such units.
Case Involving Tennessee Valley Authority Retirement System
. In March 2010,
eight
current and former participants in and beneficiaries of TVARS filed suit in the U.S. District Court for the Middle District of Tennessee challenging the TVARS Board's 2009 decision to amend the TVARS Rules and Regulations (“Rules”) in exchange for a
$1.0 billion
contribution from TVA. In August 2015, the court granted TVA’s motion for summary judgment and dismissed the case with prejudice. In September 2015, the plaintiffs appealed this decision to the Sixth Circuit. On August 12, 2016, the Sixth Circuit held that the plaintiffs’ rights were not violated because COLAs are not vested benefits. A few other issues were remanded to the district
140
court for further proceedings. On March 2, 2017, the district court granted TVA's motion for a judgment on the administrative record and dismissed all the remaining claims in this case. The plaintiffs appealed this order to the Sixth Circuit which, on March 16, 2018, ruled in TVA's favor. The case is now concluded.
Cases Involving Gallatin Fossil Plant CCR Facilities.
TVA is a party in two lawsuits relating to alleged releases of waste materials from the CCR facilities at Gallatin. See
Note 8
—
Background
—
Lawsuit Brought by TDEC
and —
Lawsuit Brought by TSRA and TCWN
.
Consent Decree Involving Colbert Fossil Plant.
In May 2013, the Alabama Department of Environmental Management ("ADEM") and TVA entered into a consent decree concerning alleged violations of the Alabama Water Pollution Control Act. The consent decree required, among other things, that TVA continue remediation efforts TVA had begun prior to the suit being filed and stop using an unlined landfill after a lined landfill is approved and constructed. In August 2018, the parties agreed to amend the consent order to deal with groundwater issues identified after TVA published groundwater monitoring reports in accordance with the CCR rule. The amended consent decree requires TVA to investigate the nature and extent of any groundwater contamination, develop and implement a remedy, provide semiannual status reports to ADEM, and remedy any seeps identified during inspections. TVA also paid
$100,000
to Alabama under the consent decree.
Petitions to Intervene in the Proceeding Involving the Early Site Permit Application for Small Modular Reactors at TVA's Clinch River Site
. Three environmental groups — the Southern Alliance for Clean Energy ("SACE"), Tennessee Environmental Council ("TEC"), and Blue Ridge Environmental Defense League ("BREDL") — filed petitions to intervene in the proceeding regarding the
Early Site Permit Application ("ESPA")
that TVA submitted for review by the NRC in May 2016 relating to the potential future construction and operation of two or more small modular reactor units at TVA’s Clinch River site in Oak Ridge, Tennessee. On October 10, 2017, the Atomic Safety and Licensing Board ("ASLB") issued a decision admitting two contentions proffered jointly by SACE and TEC and dismissing a third. The two admitted contentions challenge the application's environmental report. One of the contentions alleges that the environmental report fails to consider the possibility of a spent fuel pool fire, and the other objects to language in the environmental report regarding the technical advantages of
small modular reactors ("SMRs")
. The decision also denied admission of BREDL's one proffered contention. On November 6, 2017, TVA appealed the admission of the two contentions to the NRC. One of the contentions was subsequently dismissed. The NRC released a draft
environmental impact statement ("EIS")
concerning the application in April 2018. SACE and TEC submitted two additional contentions based on the draft EIS in May 2018. TVA and the NRC filed separate briefs opposing the admission of these contentions in June 2018. On July 31, 2018, the ASLB dismissed the remaining and proposed contentions and terminated the contested hearing.
Gallatin Fossil Plant Clean Air Act Permit
. In August 2016, the Sierra Club filed a petition with the EPA requesting that the EPA object to the CAA renewal permit issued by TDEC to TVA for operations at Gallatin. The petition alleges that the permit (1) contains compliance evaluation requirements for opacity,
particulate matter ("PM")
, and fugitive dust that are not as stringent as required, (2) includes allowances for startup, shutdown, and malfunctions that are inconsistent with the CAA, (3) fails to include reporting requirements to ensure compliance with the Environmental Agreements, and (4) contains impermissibly high SO
2
emission limits. On May 15, 2017, the Sierra Club filed a lawsuit in the United States District Court for the District of Columbia seeking to compel the EPA to act on the petition. On November 17, 2017, the District Court ordered the EPA to respond to the petition by January 31, 2018. While proceedings on this petition were ongoing, TDEC modified the CAA renewal permit on November 6, 2017, to address compliance with the 1-hour SO
2
National Ambient Air Quality Standards ("NAAQS")
. On November 20, 2017, the Sierra Club filed a second petition requesting the EPA to object to the modified permit. On January 31, 2018, the EPA denied both petitions.
Case Involving Tennessee River Boat Accident
. On July 23, 2015, plaintiffs filed suit in the United States District Court for the Northern District of Alabama, seeking recovery for personal injuries sustained when the plaintiffs’ boat struck a TVA transmission line which was being raised from the Tennessee River during a repair operation. The district court dismissed the case, finding that TVA’s exercise of its discretion as a governmental entity in deciding how to carry out the operation barred any liability for negligence. In August 2017, the United States Court of Appeals for the Eleventh Circuit affirmed the decision. The plaintiffs petitioned
the U.S. Supreme Court ("Supreme Court")
for review of the decision, arguing that the provision of the TVA Act which allows suit to be brought against TVA does not allow TVA to claim immunity for discretionary actions. On September 27, 2018, the Supreme Court granted the plaintiffs’ petition to review the case.
22
.
Related Parties
TVA is a wholly-owned corporate agency of the federal government, and because of this relationship, TVA’s revenues and expenses are included as part of the federal budget as a revolving fund. TVA’s purpose and responsibilities as an agency are described under the “Other Agencies” section of the federal budget.
TVA currently receives no appropriations from Congress and funds its business using power system revenues, power financings, and other revenues. TVA is a source of cash to the federal government. TVA will indefinitely continue to pay a return on the outstanding $
258 million
payments to the U.S. Treasury in repayment of and as a return on the government's appropriation investment in TVA's power facilities (the "Power Program Appropriation Investment")
. See
Note 17
—
Appropriation Investment.
141
TVA also has access to a financing arrangement with the U.S. Treasury pursuant to the TVA Act. TVA and the U.S. Treasury entered into a memorandum of understanding under which the U.S. Treasury provides TVA with a $
150 million
credit facility. This credit facility has a maturity date of September 30, 2019, and is typically renewed annually. Access to this credit facility or other similar financing arrangements has been available to TVA since the 1960s. See
Note 13
—
Credit Facility Agreements.
In the normal course of business, TVA contracts with other federal agencies for sales of electricity and other services. Transactions with agencies of the federal government were as follows:
|
Related Party Transactions
For the years ended, or at, September 30
|
|||||||||||
|
|
2018
|
2017
|
2016
|
||||||||
|
Revenue from sales of electricity
|
$
|
122
|
|
$
|
126
|
|
$
|
126
|
|
||
|
Other income
|
240
|
|
136
|
|
161
|
|
|||||
|
Expenditures
|
|
|
|
|
|
|
|||||
|
Operating expenses
|
220
|
|
216
|
|
216
|
|
|||||
|
Additions to property, plant, and equipment
|
8
|
|
16
|
|
32
|
|
|||||
|
Cash and cash equivalents
|
46
|
|
46
|
|
54
|
|
|||||
|
Accounts receivable, net
|
60
|
|
84
|
|
68
|
|
|||||
|
Long-term accounts receivable
|
46
|
|
|
35
|
|
|
61
|
|
|||
|
Accounts payable and accrued liabilities
|
69
|
|
71
|
|
77
|
|
|||||
|
Long-term power bonds, net
|
—
|
|
1
|
|
4
|
|
|||||
|
Return on Power Program Appropriation Investment
|
5
|
|
5
|
|
6
|
|
|||||
23
.
Unaudited Quarterly Financial Information
A summary of the unaudited quarterly results of operations for the years
2018
and
2017
follows. This summary should be read in conjunction with the audited consolidated financial statements appearing herein. Results for interim periods may fluctuate as a result of seasonal weather conditions, changes in rates, and other factors.
|
Unaudited Quarterly Financial Information
|
|||||||||||||||||||
|
2018
|
|||||||||||||||||||
|
|
First
|
Second
|
Third
|
Fourth
|
Total
|
||||||||||||||
|
Operating revenues
|
$
|
2,549
|
|
$
|
2,792
|
|
$
|
2,707
|
|
$
|
3,185
|
|
$
|
11,233
|
|
||||
|
Operating expenses
|
1,951
|
|
2,027
|
|
1,942
|
|
3,001
|
|
8,921
|
|
|||||||||
|
Operating income
|
598
|
|
765
|
|
765
|
|
184
|
|
2,312
|
|
|||||||||
|
Net income (loss)
|
288
|
|
462
|
|
470
|
|
(101
|
)
|
1,119
|
|
|||||||||
|
Unaudited Quarterly Financial Information
|
|||||||||||||||||||
|
2017
|
|||||||||||||||||||
|
|
First
|
Second
|
Third
|
Fourth
|
Total
|
||||||||||||||
|
Operating revenues
|
$
|
2,546
|
|
$
|
2,547
|
|
$
|
2,571
|
|
$
|
3,075
|
|
$
|
10,739
|
|
||||
|
Operating expenses
|
2,117
|
|
2,013
|
|
2,010
|
|
2,624
|
|
8,764
|
|
|||||||||
|
Operating income
|
429
|
|
534
|
|
561
|
|
451
|
|
1,975
|
|
|||||||||
|
Net income (loss)
|
102
|
|
211
|
|
233
|
|
139
|
|
685
|
|
|||||||||
142
Report of Independent Registered Public Accounting Firm
To the Board of Directors of Tennessee Valley Authority
Opinion on the Financial Statements
We have audited the accompanying consolidated balance sheets of Tennessee Valley Authority (the Company) as of September 30, 2018 and 2017, the related consolidated statements of operations, comprehensive income (loss), changes in proprietary capital and cash flows for each of the three years in the period ended September 30, 2018, and the related notes (collectively referred to as the consolidated financial statements).
In our opinion, the consolidated financial statements present fairly, in all material respects, the financial position of the Company at September 30, 2018 and 2017, and the results of its operations and its cash flows for each of the three years in the period ended September 30, 2018, in conformity with U.S. generally accepted accounting principles.
We also have audited, in accordance with the standards of the Public Company Accounting Oversight Board (United States) (PCAOB), the Company's internal control over financial reporting as of September 30, 2018, based on criteria established in Internal Control-Integrated Framework issued by the Committee of Sponsoring Organizations of the Treadway Commission (2013 framework), and our report dated November 14, 2018 expressed an unqualified opinion thereon.
Basis for Opinion
These financial statements are the responsibility of the Company's management. Our responsibility is to express an opinion on the Company’s financial statements based on our audits. We are a public accounting firm registered with the PCAOB and are required to be independent with respect to the Company in accordance with the U.S. federal securities laws and the applicable rules and regulations of the Securities and Exchange Commission and the PCAOB.
We conducted our audits in accordance with the standards of the PCAOB. Those standards require that we plan and perform the audit to obtain reasonable assurance about whether the financial statements are free of material misstatement, whether due to error or fraud. Our audits included performing procedures to assess the risks of material misstatement of the financial statements, whether due to error or fraud, and performing procedures that respond to those risks. Such procedures included examining, on a test basis, evidence regarding the amounts and disclosures in the financial statements. Our audits also included evaluating the accounting principles used and significant estimates made by management, as well as evaluating the overall presentation of the financial statements. We believe that our audits provide a reasonable basis for our opinion.
/s/ Ernst & Young LLP
We have served as the Company’s auditor since 2007
Chattanooga, Tennessee
November 14, 2018
143
Not applicable.
Disclosure Controls and Procedures
TVA’s management, including the President and Chief Executive Officer, the Executive Vice President and Chief Financial Officer, and members of the Disclosure Control Committee, including the Vice President and Controller (Principal Accounting Officer), evaluated the effectiveness of TVA’s disclosure controls and procedures (as defined in Rule 13a-15(e) under the Exchange Act) as of
September 30, 2018
. Based on this evaluation, TVA’s management, including the President and Chief Executive Officer, the Executive Vice President and Chief Financial Officer, and members of the Disclosure Control Committee, including the Vice President and Controller (Principal Accounting Officer), concluded that TVA’s disclosure controls and procedures were effective as of
September 30, 2018
, to ensure that information required to be disclosed by TVA in reports that it files or submits under the Exchange Act, is recorded, processed, summarized, and reported, within the time periods specified in the Securities and Exchange Commission’s rules and forms, and include controls and procedures designed to ensure that information required to be disclosed by TVA in such reports is accumulated and communicated to TVA’s management, including the President and Chief Executive Officer, the Executive Vice President and Chief Financial Officer, and members of the Disclosure Control Committee, including the Vice President and Controller (Principal Accounting Officer), as appropriate, to allow timely decisions regarding required disclosure.
Internal Control over Financial Reporting
(a)
Management’s Annual Report on Internal Control over Financial Reporting
TVA’s management is responsible for establishing and maintaining adequate internal control over financial reporting as defined in Exchange Act Rule 13a-15(f) and required by Section 404 of the Sarbanes-Oxley Act. TVA’s internal control over financial reporting is designed to provide reasonable, but not absolute, assurance regarding the reliability of financial reporting and the preparation of financial statements in accordance with generally accepted accounting principles. Because of the inherent limitations in all control systems, internal control over financial reporting and systems may not prevent or detect misstatements.
TVA’s management, including the President and Chief Executive Officer, the Executive Vice President and Chief Financial Officer, and members of the Disclosure Control Committee, including the Vice President and Controller (Principal Accounting Officer), evaluated the design and effectiveness of TVA’s internal control over financial reporting as of
September 30, 2018
, based on the framework in
Internal Control
—
Integrated Framework (2013)
issued by the Committee of Sponsoring Organizations of the Treadway Commission. Based on this evaluation, TVA’s management concluded that TVA’s internal control over financial reporting was effective as of
September 30, 2018
.
Although the effectiveness of internal control over financial reporting was not required to be subject to attestation by TVA’s independent registered public accounting firm, TVA has chosen to obtain such a report. Ernst & Young LLP, the independent registered public accounting firm that audited the financial statements included in this Annual Report, has issued an attestation report on TVA’s internal control over financial reporting.
(b)
Changes in Internal Control over Financial Reporting
During the period ended
September 30, 2018
, there were no changes in TVA’s internal control over financial reporting that materially affected, or are reasonably likely to materially affect, TVA’s internal control over financial reporting.
144
Report of Independent Registered Public Accounting Firm
To the Board of Directors of Tennessee Valley Authority
Opinion on Internal Control over Financial Reporting
We have audited Tennessee Valley Authority’s internal control over financial reporting as of September 30, 2018, based on criteria established in Internal Control-Integrated Framework issued by the Committee of Sponsoring Organizations of the Treadway Commission (2013 framework) (the COSO Criteria). In our opinion, Tennessee Valley Authority (the Company) maintained, in all material respects, effective internal control over financial reporting as of September 30, 2018, based on
the COSO criteria
.
We also have audited, in accordance with the standards of the Public Company Accounting Oversight Board (United States) (PCAOB), the consolidated balance sheets of the Company
as of September 30, 2018 and 2017, the related consolidated statements of operations, comprehensive income (loss), changes in proprietary capital and cash flows for each of the three years in the period ended September 30, 2018, and the related notes and our report dated November 14, 2018 expressed an unqualified opinion thereon.
Basis for Opinion
The Company’s management is responsible for maintaining effective internal control over financial reporting and for its assessment of the effectiveness of internal control over financial reporting included in the accompanying Management’s Annual Report on Internal Control over Financial Reporting. Our responsibility is to express an opinion on the Company’s internal control over financial reporting based on our audit. We are a public accounting firm registered with the PCAOB and are required to be independent with respect to the Company in accordance with the U.S. federal securities laws and the applicable rules and regulations of the Securities and Exchange Commission and the PCAOB.
We conducted our audit in accordance with the standards of the PCAOB. Those standards require that we plan and perform the audit to obtain reasonable assurance about whether effective internal control over financial reporting was maintained in all material respects. Our audit included obtaining an understanding of internal control over financial reporting, assessing the risk that a material weakness exists, testing and evaluating the design and operating effectiveness of internal control based on the assessed risk, and performing such other procedures as we considered necessary in the circumstances. We believe that our audit provides a reasonable basis for our opinion.
Definition and Limitations of Internal Control Over Financial Reporting
A company’s internal control over financial reporting is a process designed to provide reasonable assurance regarding the reliability of financial reporting and the preparation of financial statements for external purposes in accordance with generally accepted accounting principles. A company’s internal control over financial reporting includes those policies and procedures that (1) pertain to the maintenance of records that, in reasonable detail, accurately and fairly reflect the transactions and dispositions of the assets of the company; (2) provide reasonable assurance that transactions are recorded as necessary to permit preparation of financial statements in accordance with generally accepted accounting principles, and that receipts and expenditures of the company are being made only in accordance with authorizations of management and directors of the company; and (3) provide reasonable assurance regarding prevention or timely detection of unauthorized acquisition, use, or disposition of the company’s assets that could have a material effect on the financial statements.
Because of its inherent limitations, internal control over financial reporting may not prevent or detect misstatements. Also, projections of any evaluation of effectiveness to future periods are subject to the risk that controls may become inadequate because of changes in conditions, or that the degree of compliance with the policies or procedures may deteriorate.
/s/ Ernst & Young LLP
Chattanooga, Tennessee
November 14, 2018
145
On November 14, 2018, the TVA Board approved adjustments to the compensation of Chief Executive Officer William D. Johnson for 2019. Mr. Johnson’s base salary will increase from $1,050,000 to $1,150,000. Mr. Johnson was awarded a performance grant ("LTP") of $2,537,500 under TVA’s Long-Term Incentive Plan ("LTIP") effective October 1,
2018
, which will vest on September 30, 2021. Mr. Johnson was also awarded a retention grant ("LTR") of $1,087,500 under TVA’s LTIP effective October 1, 2018, which will vest in three equal increments on
September 30, 2019, September 30, 2020, and September 30, 2021
.
On November 14, 2018, Mr. Johnson approved compensation adjustments for the following Named Executive Officers for 2019:
|
•
|
The salary for Mr. Thomas will increase from $628,319 to $647,169. Additionally, Mr. Thomas was awarded a LTP grant of $880,000 effective October 1,
2018
, which will vest on September 30, 2021. Mr. Thomas also received a LTR grant of $380,000 effective October 1,
2018
, which will vest in three equal increments on
September 30, 2019, September 30, 2020, and September 30, 2021
.
|
|
•
|
The salary for Mr. Skaggs will increase from $520,000 to $620,000. Additionally, Mr. Skaggs was awarded a LTP grant of $980,000 effective October 1,
2018
, which will vest on September 30, 2021. Mr. Skaggs also received a LTR grant of $420,000 effective October 1,
2018
, which will vest in three equal increments on
September 30, 2019, September 30, 2020, and September 30, 2021
.
|
|
•
|
The salary for Ms. Quirk will increase from $510,000 to $541,059. Additionally, Ms. Quirk was awarded a LTP grant of $685,000 effective October 1,
2018
, which will vest on September 30, 2021. Ms. Quirk also received a LTR grant of $290,000 effective October 1,
2018
, which will vest in three equal increments on
September 30, 2019, September 30, 2020, and September 30, 2021
.
|
The salary adjustments described above became effective as of October 1,
2018
. No adjustments were made to any other existing elements of compensation for these Named Executive Officers for 2019.
146
Directors
The
Tennessee Valley Authority Act of 1933 (the "TVA Act")
provides that
Tennessee Valley Authority ("TVA")
will be administered by a board of nine part-time members appointed by the President of the
United States ("U.S.")
with the advice and consent of the United States Senate. The Chair of the
TVA Board of Directors (the "TVA Board")
is selected by the members of the TVA Board. Under the TVA Act, to be eligible to be appointed as a member of the TVA Board, an individual (i) must be a U.S. citizen; (ii) must have management expertise relative to a large for-profit or nonprofit corporate, government, or academic structure; (iii) cannot be a TVA employee; (iv) must make a full disclosure to Congress of any investment or other financial interest that the individual holds in the energy industry; and (v) must affirm support for the objectives and missions of TVA, including being a national leader in technological innovation, low-cost power, and environmental stewardship. In addition, the President of the U.S., in appointing members of the TVA Board, must (i) consider recommendations from other public officials such as the Governors of the states in TVA’s service area; individual citizens; business, industrial, labor, electric power distribution, environmental, civic, and service organizations; and the congressional delegations of the states in TVA’s service area; and (ii) seek qualified members from among persons who reflect the diversity, including geographical diversity, and needs of TVA’s service area. At least seven of the nine TVA Board members must be legal residents of the TVA service area. Currently, TVA has eight active TVA Board members. A nomination for the ninth member has been made, but the nominee has not been confirmed.
TVA Board members serve five-year terms, and at least one member’s term ends each year. After a member's term ends, the member is permitted under the TVA Act to remain in office until the earlier of the end of the then-current session of Congress or the date a successor takes office. The TVA Board, among other things, establishes broad goals, objectives, and policies for TVA; develops long-range plans to guide TVA in achieving these goals, objectives, and policies; approves annual budgets; and establishes a compensation plan for employees.
The TVA Board as of
November 14, 2018
, consisted of the following eight individuals with their ages and terms of office provided:
|
Directors
|
Age
|
Year Current Term Began
|
Year Term Expires
|
|
Richard C. Howorth, Chair
|
67
|
2015
|
2020
|
|
Kenneth E. Allen
|
72
|
2018
|
2021
|
|
A.D. Frazier
|
74
|
2018
|
2022
|
|
Virginia T. Lodge
|
68
|
2014
|
2019
|
|
Eric M. Satz
|
49
|
2015
|
2018
(1)
|
|
Jeff W. Smith
|
59
|
2018
|
2022
|
|
James R. Thompson, III
|
59
|
2018
|
2021
|
|
Ronald A. Walter
|
69
|
2014
|
2019
|
Note
(1) Although the term of Director Satz expired in May 2018, he is permitted under the TVA Act to remain in office until the earlier of the end of the current session of Congress or the date a successor takes office.
Mr. Howorth of Oxford, Mississippi, joined the TVA Board in July 2011 and began a second term on the TVA Board in December 2015. He is the owner of Square Books, an Oxford independent bookstore he founded in 1979. Mr. Howorth served two terms as the mayor of Oxford, from 2001 to 2009, during which time he was chair of the authority overseeing the Oxford Electric Department. From 2001 to 2009, he also served as a director and officer of the North Mississippi Industrial Development Association, an economic development consortium made up of power association directors and mayors of cities in 29 Mississippi counties in the TVA service area.
Mr. Allen of White Plains, Kentucky, joined the TVA Board in January 2018. He spent more than 50 years in the coal industry and held a number of executive management positions prior to his retirement in June 2017. Most recently, he served as Executive Vice President and Chief Operating Officer ("COO") of Armstrong Energy, Inc. from July 2014 to June 2017, as Executive Vice President of Operations for Armstrong Energy, Inc. from 2011 to July 2014, and as COO of Armstrong Coal Company, Inc. from December 2013 until June 2017. He is currently a member of the Board of Directors for the First United Bank in Madisonville, Kentucky.
Mr. Frazier of Mineral Bluff, Georgia, joined the TVA Board in January 2018. Since July 2012, he has served as President Emeritus of Georgia Oak Partners, LLC, a private equity company. Mr. Frazier previously held a number of other executive management positions, including chair and Chief Financial Officer ("CFO") of the Chicago Stock Exchange, chair and
147
Chief Executive Officer ("CEO") of Danka Business Systems, a reseller of high-end photocopying equipment, president of Caremark, a pharmacy benefit management company, and COO of the Atlanta Committee for the 1996 Olympic Games.
Ms. Lodge of Nashville, Tennessee, joined the TVA Board in December 2014. She has served as the CEO of FSI Inc., a fulfillment and supply chain company based in Nashville, Tennessee, since March 2012. She served as Commissioner of the Tennessee Department of Human Services from 2003 to 2011. From 2002 to 2003, she worked on Tennessee Governor Phil Bredesen’s campaign and transition team. Ms. Lodge was National Director of GoreCorps for the Gore for President Campaign in 2000 and served as Executive Director for Kids Voting of Middle Tennessee from 1994 to 1999.
Mr. Satz of Nashville, Tennessee, joined the TVA Board in August 2015. He is the founder and CEO of AltoIRA.com and a Managing Member of the Tennessee Community Ventures Fund, LLC, an early stage investment fund he co-founded in 2009. From 2010 to 2014, he served as Investor, Advisor, and Vice President of Business Development for Panopto, Inc., a software company based in Seattle, Washington. Mr. Satz co-founded and was CEO of Plumgood Food, LLC from 2004 to 2008. Earlier in his career, Mr. Satz served in various investment banking roles, including as Vice President in the Technology Investment Banking Groups at Credit Suisse First Boston and Donaldson, Lufkin & Jenrette. In 1999, Mr. Satz co-founded Currenex, an online global foreign currency exchange company.
Mr. Smith of Knoxville, Tennessee, joined the TVA Board in January 2018. Since April 2000, Mr. Smith has served as the deputy for operations at Oak Ridge National Laboratory (“ORNL”). Since April 2001, he has also served as the President of UT-Battelle Development Corporation, an entity established to develop privately constructed facilities at ORNL. During a six-month special assignment in 2002, he assisted with the creation of the U.S. Department of Homeland Security.
Mr. Thompson of Decatur, Alabama, joined the TVA Board in January 2018. Since 2009, he has served as president, CEO, and chair of Corporate Billing, LLC, a commercial finance company. Mr. Thompson previously served as the CEO of First American Bank, Alabama National Bancorporation’s largest subsidiary bank, from 1999 until 2008. From 2011 until January 2018, he was also a member of the Board of Directors of Decatur Utilities, one of TVA’s
local power company customers of TVA ("LPCs")
.
Mr. Walter of Memphis, Tennessee, joined the TVA Board in December 2014. He is currently the President and General Manager of WREG-TV, a Memphis-based television station. Mr. Walter has been employed by WREG-TV since 1987, and assumed his current position in 2004. Mr. Walter was Vice President of Customer Relations for the
Memphis Light, Gas and Water Division ("MLGW")
from 1982 to 1987. His prior roles at MLGW from 1980 to 1982 included Assistant to the President and Director of Personnel.
Executive Officers
TVA’s executive officers as of
November 14, 2018
, their titles, their ages, and the date their employment with TVA commenced are as follows:
|
Executive Officers
|
Title
|
Age
|
Employment Commenced
|
|
William D. Johnson
|
President and Chief Executive Officer
|
64
|
2013
|
|
Michael D. Skaggs
|
Executive Vice President and Chief Operating Officer
|
58
|
1994
|
|
Sherry A. Quirk
|
Executive Vice President and General Counsel
|
64
|
2015
|
|
John M. Thomas, III
|
Executive Vice President and Chief Financial Officer
|
54
|
2005
|
|
Van M. Wardlaw
|
Executive Vice President and Chief External Relations Officer
|
58
|
1982
|
|
Timothy S. Rausch
|
Senior Vice President and Chief Nuclear Officer
|
54
|
2018
|
|
Janet J. Brewer
|
Senior Vice President and Chief Communications and Marketing Officer
|
59
|
2012
|
|
Susan E. Collins
|
Senior Vice President and Chief Human Resource Officer
|
52
|
2014
|
|
Joseph Jay Stowe, III
|
Senior Vice President, Resources and Operations Support
|
50
|
2016
|
|
Diane T. Wear
|
Vice President and Controller (Principal Accounting Officer)
|
50
|
2008
|
Mr. Johnson has served as TVA's President and CEO since January 2013. Mr. Johnson served as Chair of the Board, President and CEO of
Progress Energy, Inc. ("Progress Energy")
, an electric utility based in Raleigh, North Carolina, from October 2007 to July 2012. During this time, Mr. Johnson also served as the Chair of Progress Energy Carolinas, Inc., and Progress Energy Florida, Inc., both of which are subsidiaries of Progress Energy. Mr. Johnson held a number of other positions before he became Chair and CEO of Progress Energy, including President and COO of Progress Energy; Group President for Energy Delivery; President and CEO for Progress Energy Service Company, LLC; and General Counsel and Corporate Secretary for Progress Energy. Mr. Johnson joined
Carolina Power & Light Company ("CP&L")
, a predecessor to Progress Energy, in 1992. Before joining CP&L, Mr. Johnson was a partner with the Raleigh, North Carolina, law office of Hunton & Williams LLP, where he specialized in the representation of utilities.
148
Mr. Skaggs was named TVA's Executive Vice President and COO effective October 2018. Since joining TVA in 1994 as Manager of Projects at
Watts Bar Nuclear Plant ("Watts Bar")
, Mr. Skaggs has held several management positions, including Executive Vice President, Operations from October 2016 to September 2018, Senior Vice President, Watts Bar Operations and Construction from September 2013 to October 2016, Senior Vice President, Nuclear Construction from February 2012 to September 2013, Senior Vice President of Nuclear Generation Development and Construction from October 2011 to February 2012, Site Vice President of
Sequoyah Nuclear Plant ("Sequoyah")
from November 2010 to October 2011, Vice President of Nuclear Operations Support from December 2009 to November 2010, Site Vice President at Watts Bar from July 2005 to December 2009, and Site Vice President at
Browns Ferry Nuclear Plant ("Browns Ferry")
from July 2004 to July 2005.
Ms. Quirk has served as TVA’s Executive Vice President and General Counsel since February 2015. From October 2010 to February 2015, Ms. Quirk was an equity partner in the law firm of Schiff Hardin LLP, which specializes in federal energy regulation, legislation, and power supply transactions. Prior to joining Schiff Hardin, Ms. Quirk was a partner in the Energy Group of Sullivan & Worcester LLP, and a partner in the Energy Group of Verner, Liipfert, Bernhard, McPherson and Hand, specializing in federal energy regulation, legislation, power supply transactions, and state proceedings.
Mr. Thomas has served as TVA's CFO since June 2010 and was also named Executive Vice President in February 2012. He served as Executive Vice President of People and Performance from January 2010 to June 2010, as Senior Vice President, Corporate Governance and Compliance from July 2009 to January 2010, as Controller and Chief Accounting Officer from January 2008 to September 2009, and as the General Manager, Operations Business Services from November 2005 to January 2008. Prior to joining TVA, Mr. Thomas was CFO during 2005 for Benson Security Systems. He was also the Controller of Progress Fuels Corporation from 2003 to 2005 and Controller of Progress Ventures, Inc. from 2001 to 2002, both subsidiaries of Progress Energy.
Mr. Wardlaw was named TVA's Executive Vice President and Chief External Relations Officer in July 2014. Mr. Wardlaw served as Senior Vice President, Customer Relations, from September 2013 to July 2014, as Executive Vice President, Customer Relations, from June 2011 to September 2013, as Executive Vice President, Enterprise Relations, from October 2010 to June 2011, as Acting Executive Vice President of Strategy and Planning from January 2010 until September 2010, as Executive Vice President of Power Supply and Fuels from July 2008 to August 2010, as Senior Vice President, Commercial Operations and Fuels from January 2007 to June 2008, as Vice President, Bulk Power Trading from September 2006 to December 2006, and as Vice President of Transmission and Reliability from December 2000 to September 2006. Mr. Wardlaw began his career with TVA in January 1982 as an electrical engineer, and has also worked in customer service, marketing, and field services.
Mr. Rausch joined TVA in October 2018 as Senior Vice President and Chief Nuclear Officer ("CNO"). Before joining TVA, Mr. Rausch served as the Senior Vice President and Chief Nuclear Officer of Talen Energy Corporation from June 2015 until September 2018 and as the Senior Vice President and Chief Nuclear Officer of PPL Generation, LLC from July 2009 to June 2015. Mr. Rausch has 25 years of experience in virtually all the disciplines of the nuclear power industry, including roles as Site Vice President, Plant General Manager, and Director of Engineering.
Ms. Brewer joined TVA in 2012 as Vice President of Communications, and she was named Senior Vice President and Chief Communications and Marketing Officer in May 2016. Before joining TVA, Ms. Brewer worked at NCR Corporation, a global technology company based in Duluth, Georgia, and held a number of positions there, including Vice President of Corporate Communications from 2010 to 2012 and from 2006 to 2008, Vice President of Change Management and Communications for Continuous Improvement from 2008 to 2010, and Director of Community Relations from 2005 to 2006.
Ms. Collins joined TVA in May 2014 as Vice President of Human Resources, and she was named Senior Vice President and Chief Human Resources Officer in February 2016. Before joining TVA, Ms. Collins served as Senior Vice President of Human Resources for Constellation Energy Nuclear Group, LLC from 2009 to 2014 and as Vice President of Human Resources for Constellation Energy from 2008 to 2009.
Mr. Stowe was named TVA's Senior Vice President of Resources and Operations Support in October 2018. Mr. Stowe was previously TVA’s Senior Vice President for Distributed Energy Services, a position he held since joining TVA in October 2016. Prior to coming to TVA, Mr. Stowe was President and CEO of Huntsville Utilities, an LPC, a position he had held from April 2014 to September 2016. Mr. Stowe joined Huntsville Utilities in November 2005 as Vice President of Operations and was promoted to COO in November 2009.
Ms. Wear has served as TVA's Vice President and Controller since March 2012. Ms. Wear was the Assistant Controller from February 2010 to March 2012. Between April 2008, when she joined TVA, and February 2010, Ms. Wear was the General Manager, External Reporting/Accounting Policy and Research. Prior to joining TVA, Ms. Wear was a Managing Director at PricewaterhouseCoopers LLP. Ms. Wear joined a predecessor firm to PricewaterhouseCoopers LLP in January 1992.
Mr. Grimes joined TVA in July 2013 as Executive Vice President and CNO. He was named Executive Vice President, Generation, and CNO effective October 2016, and Executive Vice President, Generation effective January 2017. Before joining TVA, Mr. Grimes worked at Exelon Nuclear and held a variety of positions there, including Senior Vice President, Engineering and Technical Services, Exelon Nuclear Fleet from 2011 to 2013, Senior Vice President, Mid-Atlantic Operations from 2009 to
149
2011, and Site Vice President at Peach Bottom Nuclear Station from 2007 to 2008. Mr. Grimes joined Exelon Nuclear in 1979. On September 13, 2018, Executive Vice President of Generation Joe Grimes informed TVA’s CEO of his decision to retire from TVA effective November 1, 2018.
Disclosure and Financial Code of Ethics
TVA has a
Disclosure and Financial Ethics Code ("Financial Ethics Code")
that applies to all executive officers (including the CEO, CFO, and Controller) and directors of TVA as well as to all employees who certify information contained in quarterly reports or annual reports or who have responsibility for internal control self-assessments. The Financial Ethics Code includes provisions covering conflicts of interest, ethical conduct, compliance with applicable laws, rules, and regulations, responsibility for full, fair, accurate, timely, and understandable disclosures, and accountability for adherence to the Financial Ethics Code. TVA will provide a current copy of the Financial Ethics Code to any person, without charge, upon request. Requests may be made by calling 888-882-4975 or by sending an e-mail to: investor@tva.com. Any waivers of or changes to provisions of the Financial Ethics Code that require disclosure pursuant to applicable Securities and Exchange Commission requirements will be promptly disclosed to the public, subject to limitations imposed by law, on TVA’s website at: www.tva.gov. Information contained on TVA’s website shall not be deemed to be incorporated into, or to be a part of, this Annual Report.
Committees of the TVA Board
The TVA Board has an Audit, Risk, and Regulation Committee established in accordance with the TVA Act. TVA’s Audit, Risk, and Regulation Committee consists of James R. Thompson, III, Kenneth E. Allen, and Virginia T. Lodge. Director Thompson is an "audit committee financial expert" as defined in Item 407(d)(5) of Regulation S-K
under the Securities Exchange Act of 1934 (the "Exchange Act")
.
TVA is exempted by Section 37 of the Exchange Act from complying with Section 10A(m)(3) of the Exchange Act, which requires each member of a listed issuer’s audit committee to be an independent member of the board of directors of the issuer. The TVA Act contains certain provisions that are similar to the considerations for independence under Section 10A(m)(3) of the Exchange Act, including that to be eligible for appointment to the TVA Board, an individual shall not be an employee of TVA and shall make full disclosure to Congress of any investment or other financial interest that the individual holds in the energy industry.
Under Section 10A(m)(2) of the Exchange Act, which applies to TVA, the audit committee is directly responsible for the appointment, compensation, and oversight of the external auditor; however, the TVA Act assigns the responsibility for engaging the services of the external auditor to the TVA Board.
The TVA Board has also established the following committees in addition to the Audit, Risk, and Regulation Committee:
|
•
|
Finance, Rates, and Portfolio Committee,
|
|
•
|
External Relations Committee,
|
|
•
|
People and Performance Committee, and
|
|
•
|
Nuclear Oversight Committee.
|
Compensation Discussion and Analysis
The purpose of the Compensation Discussion and Analysis is to describe TVA's compensation philosophy and the policies and decisions that guided compensation for TVA’s Named Executive Officers in
2018
. The
2018
Named Executive Officers ("NEOs") are as follows:
•
William D. Johnson, President and CEO;
•
John M. Thomas, III, Executive Vice President and
Chief Financial Officer ("CFO")
;
•
Joseph P. Grimes, Jr., Executive Vice President, Generation;
•
Michael D. Skaggs, Executive Vice President and COO; and
•
Sherry A. Quirk, Executive Vice President and General Counsel.
Mr. Grimes retired on November 1, 2018.
Executive Summary
TVA is a corporate agency and instrumentality of the U.S. that was created in 1933 by federal legislation in response to a request by President Franklin D. Roosevelt. TVA was created to, among other things, improve navigation on the Tennessee River, reduce the damage from destructive flood waters within the Tennessee River system and downstream on the lower Ohio
150
and Mississippi Rivers, further the economic development of TVA’s service area in the southeastern U.S., and sell the electricity generated at the facilities TVA operates. Today, TVA operates the nation’s largest public power system and supplies power to a population of nearly 10 million people.
2018
Compensation Highlights
2018
At-Risk Compensation.
Based on its annual performance and productivity, TVA rewards employees through its
Winning Performance Team Incentive Plan ("WPTIP")
and
Executive Annual Incentive Plan ("EAIP")
. In addition, certain executives in critical positions, including the NEOs, participate in the Long-Term Incentive Plan (“LTIP”). The LTIP provides for long-term performance (“LTP”) grants and long-term retention (“LTR”) grants. Similar to incentive programs at other utilities, awards under the WPTIP, EAIP, and the performance-based component of the LTIP are not part of base pay but are “at risk” and require employees to reach or exceed specific performance targets in order for payments to be earned.
For
2018
, the scorecard results for the EAIP were 130 percent of the target opportunity. The following factors contributed to overall performance:
|
•
|
Sustained $800 million in operating and maintenance cost reductions;
|
|
•
|
Achieved lowest recordable injury rate since tracking began in 1985;
|
|
•
|
Improved overall operational performance of TVA’s nuclear fleet; and
|
|
•
|
Helped to attract and retain over 65,000 jobs and over $11.3 billion in capital investment to the TVA service area.
|
In addition, for the three-year period ended September 30, 2018, the TVA Board-approved LTP awards to NEOs under the LTIP were 108 percent of the target opportunity primarily because of overall strong performance and financial discipline. Throughout the 2016 - 2018 performance period, TVA accomplished the following objectives:
|
•
|
Reduced debt and other financing obligations;
|
|
•
|
Maintained excellent reliability; and
|
|
•
|
Maintained favorable stakeholder perception and improved customer satisfaction and loyalty.
|
Change to LTP Measure.
On August 22, 2018, the TVA Board approved replacing the Wholesale Rate Excluding Fuel measure with Non-Fuel Delivered Cost of Power for the 2017 - 2019 and 2018 - 2020 performance cycles. The Wholesale Rate Excluding Fuel measure has not historically reflected TVA’s financial performance, as it is largely impacted by weather and customer behavior. As a result, the TVA Board has used its discretion to adjust payouts to better reflect goal achievement, overall strong performance and financial discipline. The TVA Board and management believe that replacing the measure with Non-Fuel Delivered Cost of Power will drive performance through activities that management can control.
Amendments to LTIP
. On August 22, 2018, the TVA Board approved adding a new provision to the LTIP. This addition was identified by the TVA Board’s independent compensation consultant as an appropriate amendment to make the plan competitive with TVA’s peer group. The new provision allows participants who terminate employment due to retirement to receive a prorated award in connection with both performance-based grants and retention-based grants. This new provision will go into effect for retirements occurring after October 1, 2018, and will apply to both existing and future grants. In addition, the TVA Board approved clarifications of existing provisions in the LTIP related to proration of awards for participants who terminate employment due to death or disability, as well as other clarifications.
2018
Compensation Adjustments.
On November 9, 2017, the TVA Board approved the compensation of CEO William Johnson for 2018. Mr. Johnson’s salary increased from $995,000 to $1,050,000, and he was awarded a LTP grant of
$2,315,250
under the LTIP effective October 1, 2017, which will fully vest on September 30, 2020. Mr. Johnson also received a LTR grant under the LTIP of $992,250 effective October 1, 2017, which will vest in three equal increments on September 30, 2018, 2019, and 2020.
On November 9, 2017, Mr. Johnson approved compensation adjustments and grants for the following NEOs for 2018:
|
•
|
The salary for Mr. Thomas increased from $610,018 to $628,319. Additionally, Mr. Thomas was awarded a LTP grant of $
850,000
effective October 1, 2017, which will fully vest on September 30, 2020. Mr. Thomas also received a LTR grant of $350,000 effective October 1, 2017, which will vest in three equal increments on September 30, 2018, 2019, and 2020.
|
|
•
|
The salary for Mr. Grimes increased from $650,000 to $669,500. Additionally, Mr. Grimes was awarded a LTP grant of $
825,000
effective October 1, 2017, which will fully vest on September 30, 2020. Mr. Grimes also received a LTR grant of $325,000 effective October 1, 2017, which will vest in three equal increments on September 30, 2018, 2019, and 2020.
|
|
•
|
The salary for Mr. Skaggs increased from $495,285 to $520,000. Additionally, Mr. Skaggs was awarded a LTP grant of $
750,000
effective October 1, 2017, which will fully vest on September 30, 2020. Mr. Skaggs also
|
151
received a LTR grant of $300,000 effective October 1, 2017, which will vest in three equal increments on September 30, 2018, 2019, and 2020.
|
•
|
The salary for Ms. Quirk increased from $477,405 to $510,000. Additionally, Ms. Quirk was awarded a LTP grant of $
675,000
effective October 1, 2017, which will fully vest on September 30, 2020. Ms. Quirk also received a LTR grant of $285,000 effective October 1, 2017, which will vest in three equal increments on September 30, 2018, 2019, and 2020.
|
Termination of Long-Term Compensation Plans.
On October 1, 2015, TVA adopted the LTIP, which, among other things, provides retention incentives that are similar in nature to the incentives provided under the Long-Term Deferred Compensation Plan (“LTDCP”) and Long-Term Retention Incentive Plan (“LTRIP”) and performance incentives that are similar in nature to the incentives provided under the Executive Long-Term Incentive Plan (“ELTIP”). This was done to ensure TVA compensation programs remain competitive by creating a single, comprehensive Long-Term Incentive Plan with performance and retention components that are similar to those offered by TVA's peers. Award granting and vesting provisions were revised for consistency and alignment. Furthermore, plan eligibility was extended beyond the executive level to include key manager and specialist positions that have the ability to significantly impact the long-term financial and/or operational objectives critical to TVA's overall success. All previous credits issued under the LTDCP have vested, all awards granted under the LTRIP vested by December 31, 2017, and the last performance cycle for the ELTIP ended on September 30, 2017. Accordingly, TVA terminated the LTDCP, LTRIP, and ELTIP in 2018.
Philosophy
TVA is committed to achieving its mission to serve the people of the Tennessee Valley to make life better. It does this through a focus on three core areas: Energy, Environment, and Economic Development. The compensation structure of TVA is developed to reinforce TVA’s mission and strategic imperatives.
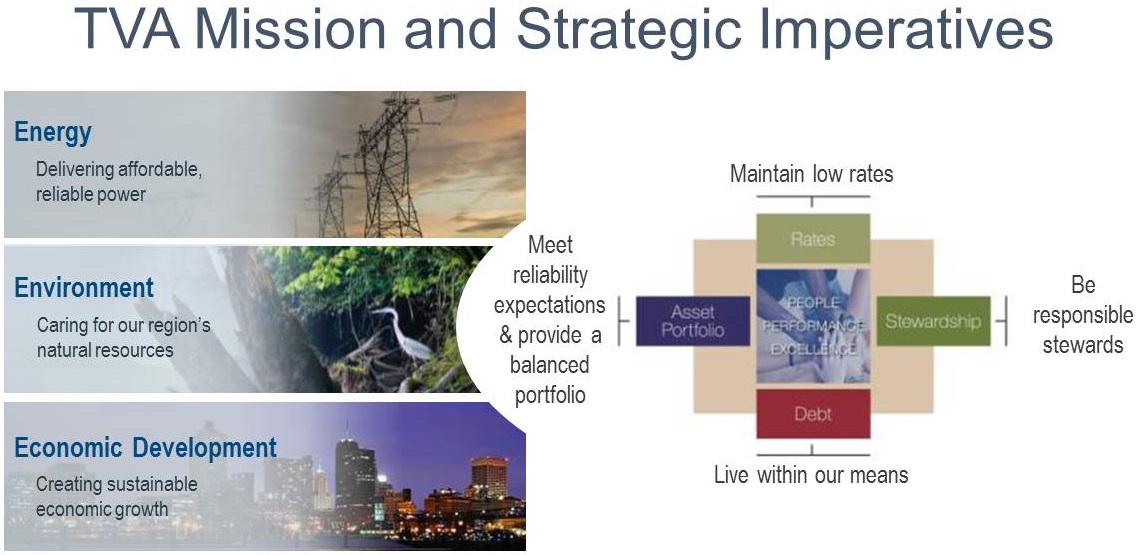
TVA aims to achieve its mission by attracting, retaining, and motivating highly qualified and committed executives to guide the organization’s strategy and performance. TVA follows a compensation plan ("Compensation Plan") as adopted by the TVA Board in accordance with the guidance of the TVA Act. The Compensation Plan is designed to:
|
•
|
Provide market-based, competitive compensation levels so TVA can attract, retain, and motivate highly competent employees. Total direct compensation generally is determined by reference to the 50th percentile of the relevant labor market, although some positions are determined by reference to up to the 75th percentile based on labor market scarcity and other issues.
|
|
•
|
Reward employees for performance. A substantial portion of executive pay, including pay for the NEOs, is tied to performance improvement. As illustrated in the charts below, at least half of each NEO’s target total direct compensation opportunity is delivered through performance-based incentive programs.
|
152
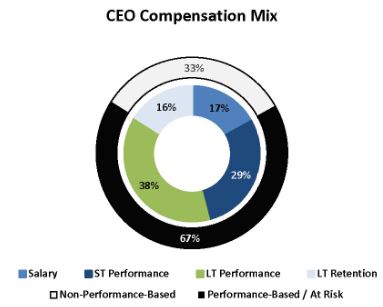
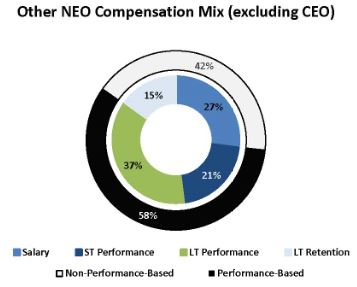
|
•
|
Align the organization’s short-term and long-term goals and objectives with compensation opportunity by providing a mix of salary and performance-based short-term and long-term incentives.
|
|
•
|
Align performance and productivity improvement at all levels by setting consistent performance goals and objectives for all levels of the organization.
|
The TVA Board follows these requirements of the TVA Act in designing and implementing its Compensation Plan:
|
•
|
Compensation will be based on an annual survey of benchmark compensation for similar positions in private industry, including engineering and electric utility companies, publicly-owned electric utilities, and federal, state, and local governments; and
|
|
•
|
Compensation will take into account education, experience, level of responsibility, geographic differences, and retention and recruitment needs.
|
Authority for the Executive Compensation Program
The TVA Board, under the authority of the TVA Act, has responsibility for establishing compensation for TVA employees, including the NEOs. The TVA Board is directed under Section 2 of the TVA Act to establish a plan that specifies all compensation (such as salary and any other pay, benefits, incentives, or other form of remuneration) for the CEO and TVA employees.
The TVA Act also provides that:
|
•
|
The TVA Board will annually approve all compensation (such as salary and any other pay, benefits, incentives, or other form of remuneration) for all managers and technical personnel who report directly to the CEO (including any adjustment(s) to compensation);
|
|
•
|
On the recommendation of the CEO, the TVA Board will approve the salaries of employees whose salaries would be in excess of Level IV of the Executive Schedule of the U.S. Government ($164,200 in 2018); and
|
|
•
|
The CEO will determine the salary and benefits of employees whose annual salary is not greater than Level IV of the Executive Schedule ($164,200 in 2018).
|
Under the authority of the TVA Act, the TVA Board, its People and Performance Committee (the “Committee”), and individual TVA Board members are involved in compensation matters. The TVA Board has delegated to the CEO the authority to approve, or delegate to others the authority to approve, all personnel and compensation actions for which the TVA Board is responsible but has not reserved for itself. In addition, the TVA Board has taken the following actions to delegate authority with respect to executive compensation:
|
•
|
The TVA Board has delegated to the TVA Board Chair, in consultation with the Committee and with input from individual members of the TVA Board, the authority to evaluate and rate the CEO’s performance during the year, and the authority to approve any payout to the CEO under the EAIP, based on, among other things, the CEO's evaluated performance during the year.
|
|
•
|
The TVA Board has authorized the CEO to set or adjust compensation for present or future direct reports within compensation ranges of 80 percent to 110 percent of the targeted total direct compensation for comparable positions, as well as to approve the parameters under which such executives may participate in certain
|
153
supplemental benefit plans such as TVA’s
Supplemental Executive Retirement Plan ("SERP")
, provided that the CEO may not finally set or adjust such compensation until the TVA Board members have been notified of the proposed compensation and given the opportunity to ask the Committee, or the full TVA Board, to review the proposed compensation before it becomes effective.
|
•
|
The TVA Board has delegated to the CEO, in consultation with the Committee and with input from individual members of the TVA Board, the authority to approve the individual performance goals for the CEO's direct reports and the authority to evaluate and rate the performance of the CEO's direct reports during the year.
|
TVA Board Committee Oversight
The Committee was responsible for oversight of executive compensation pursuant to the Compensation Plan, review of this Compensation Discussion and Analysis, and review of performance goal achievement for 2018. As delegated by the TVA Board, the Committee also (1) reviewed proposed CEO actions to set or adjust compensation for his direct reports, (2) consulted with the TVA Board Chair about the Chair's proposed evaluation and rating of the CEO’s performance during the year and about the proposed payout to the CEO under the EAIP, and (3) consulted with the CEO on the proposed individual performance goals and evaluation and performance ratings for the CEO's direct reports for the year. The Committee used the independent consulting firm Frederic W. Cook & Co., Inc. (“FW Cook”) in 2018 to help evaluate competitive compensation. The Committee assessed certain independence factors and determined the firm’s work raised no potential conflict of interest.
Assessment of Risk
TVA’s Enterprise Risk Management Organization, in coordination with other members of TVA’s management, including Human Resources and Compensation and Benefits, conducts an annual assessment of enterprise level risks which includes considering risks arising from TVA's compensation policies and practices, in order to identify any risks that are reasonably likely to have a material adverse effect on the organization and its achievement of its strategic goals and objectives.
Based on the results of this assessment, no risks were identified with the compensation policies and practices that are reasonably likely to have a material adverse effect on TVA’s achievement of its strategic goals and objectives.
Use of Market Data and Benchmarking
TVA generally determines total direct compensation for executives based on the relevant labor market. After compiling market compensation for the positions at the beginning of 2018, the Committee, with assistance from FW Cook, used the information to:
|
•
|
Assess target compensation level and incentive opportunity competitiveness; and
|
|
•
|
Determine appropriate target compensation levels and incentive opportunities to maintain the desired degree of market competitiveness.
|
The relevant labor market for most of TVA's executives, including the NEOs, consisted of both private and publicly-owned companies in the energy services industry of similar revenue and scope to TVA. TVA's peer group is reviewed on an annual basis. For the survey-based analysis, TVA used the 2017 Willis Towers Watson Energy Services Executive Compensation Database and targeted 29 investor owned utilities with revenues greater than or equal to $3 billion. This positions TVA near the middle of the revenue-based peer group of multiple large utilities. Six additional government entities participated in the 2017 Willis Towers Watson Energy Services Executive Compensation Survey and were considered by the Committee on the basis of industry similarity.
Survey data is supplemented with proxy data to provide additional market reference points for NEO roles. When conducting the market benchmarking analysis, competitive comparisons are made relative to a "market composite" or an average of the survey and proxy data as recommended by FW Cook. Several companies were considered in the proxy analysis because they are energy services firms with annual revenue between approximately one-half and two times TVA's revenue.
154
The following chart outlines the companies that constitute the 2017 Willis Towers Watson Energy Services survey sample and the proxy peer group, which together formed the competitive market reference for benchmarking NEO compensation for
2018
:
|
Company
|
Investor Owned Utilities with Revenue Greater than or Equal to $3 Billion Which Participated in 2017 Willis Towers Watson Energy Services Survey
|
Government Entities Which Participated in 2017 Willis Towers Watson Energy Services Survey
|
Proxy Peer Group of Investor Owned Utilities
|
|
AES Corp.
|
þ
|
þ
|
|
|
Alliant Energy
|
þ
|
||
|
Ameren
|
þ
|
þ
|
|
|
American Electric Power Co., Inc.
|
þ
|
þ
|
|
|
Calpine Corp.
|
þ
|
þ
|
|
|
CenterPoint Energy, Inc.
|
þ
|
þ
|
|
|
CMS Energy Corp.
|
þ
|
þ
|
|
|
Colorado Springs Utility
|
þ
|
||
|
Consolidated Edison
|
þ
|
||
|
Dominion Resources, Inc.
|
þ
|
þ
|
|
|
DTE Energy Co.
|
þ
|
||
|
Duke Energy Corp.
|
þ
|
þ
|
|
|
Dynegy
|
þ
|
||
|
Edison International
|
þ
|
þ
|
|
|
Energy Northwest
|
þ
|
||
|
Entergy Corp.
|
þ
|
þ
|
|
|
Eversource Energy
|
þ
|
þ
|
|
|
Exelon Corp.
|
þ
|
þ
|
|
|
FirstEnergy Corp.
|
þ
|
þ
|
|
|
JEA
|
þ
|
||
|
MDU Resources
|
þ
|
||
|
New York Power Authority
|
þ
|
||
|
NextEra Energy, Inc.
|
þ
|
þ
|
|
|
NiSource
|
þ
|
þ
|
|
|
NRG Energy
|
þ
|
þ
|
|
|
Omaha Public Power
|
þ
|
||
|
Pacific Gas and Electric Co.
|
þ
|
þ
|
|
|
Pinnacle West Capital
|
þ
|
||
|
PPL Corp.
|
þ
|
þ
|
|
|
Public Service Enterprise Group Inc.
|
þ
|
þ
|
|
|
Salt River Project
|
þ
|
||
|
SCANA
|
þ
|
||
|
Sempra Energy
|
þ
|
þ
|
|
|
Southern Company
|
þ
|
þ
|
|
|
Talen Energy
|
þ
|
||
|
Wisconsin Energy
|
þ
|
||
|
Xcel Energy
|
þ
|
þ
|
|
155
Executive Compensation Program Components
The primary compensation program components for
2018
for the NEOs are summarized in the diagram below and are briefly described in the table and the narrative that follow the diagram.
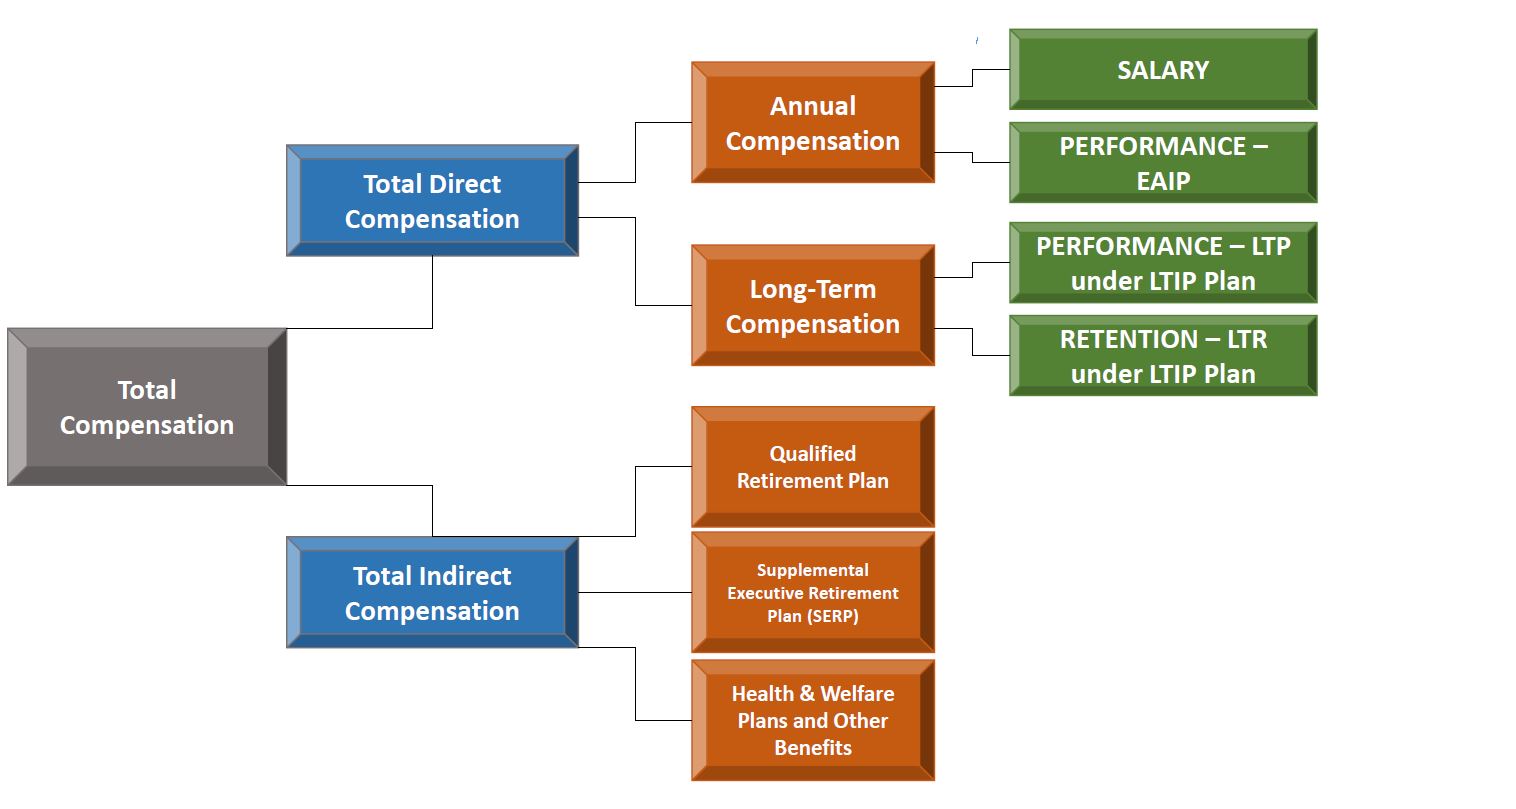
|
Primary Compensation Program Components for Named Executive Officers in 2018
|
||||
|
Compensation Component
|
Objective
|
Key Features
|
||
|
Annual Salary
|
Provides fixed base level of compensation to executives to encourage hiring and retention of qualified individuals
|
- Annual salary is determined by reference to median (50th percentile) for similar positions at other companies in TVA’s peer group or above the median (50th to 75th percentile) for positions affected by market scarcity, recruitment and retention issues, and other business reasons.
- Typically reviewed annually to consider changes in benchmark salaries and/or exceptional individual merit performances. |
||
|
Executive Annual Incentive Plan ("EAIP")
|
Incentivizes performance by providing at-risk compensation tied to attainment of pre-established performance goals for the fiscal year
|
- Annual incentive payouts are based on the results of established goals of an enterprise scorecard, as determined from year to year by the TVA Board or the CEO, as applicable. Annual incentive payouts may be impacted by a corporate multiplier or adjusted by the TVA Board or CEO, as applicable, based on the evaluation of performance during the year.
- Target annual incentive opportunities increase with position and responsibility and are based in part on the opportunities other companies in TVA’s peer group provide to those in similar positions. - Typically reviewed annually to consider changes in benchmark annual incentives. |
||
|
Long-Term Incentive Plan (“LTIP”)
|
Incentivizes performance and retention by providing performance-based and retention-based grants that are tied to a vesting schedule
|
- Participation is limited to key positions that have the ability to significantly impact the long-term financial and/or operational objectives critical to TVA's overall success.
- LTP awards are granted annually with a three-year vesting cycle. Awards are variable at-risk opportunities based on achieved level of performance (i.e., scorecard results for the three-year performance period). - LTR awards may be granted annually and will vest and pay out in three equal increments annually over three years, subject to the participant being employed through such dates. |
||
|
Pension Plans
(Qualified Plans and SERP) |
Provides compensation beginning with retirement or termination of employment (if vesting requirements are satisfied) with enhanced compensation for certain executives to provide an additional incentive for hiring and retention of qualified individuals
|
- Broad-based plans available to full-time employees of TVA that are qualified under Internal Revenue Service ("IRS") rules and are similar to the qualified plans provided by other companies in TVA's peer group.
- Certain executives in critical positions also participate in a non-qualified pension plan that provides supplemental pension benefits at compensation levels that are higher than the limits specified by IRS regulations for qualified pension plans. These supplemental benefits are comparable to those provided by other companies in TVA's peer group. |
||
156
Salary.
Annual salary is determined by reference to the median (50th percentile) for similar positions at other companies in TVA's peer group or above the median (50th to 75th percentile) for positions affected by market scarcity, recruitment and retention issues, and other business reasons. In general, salary is reviewed annually with increases awarded based on prior year performance and the executive's role and responsibilities and to bring salaries into alignment with the market.
The salaries of the NEOs for
2018
and
2017
were as follows:
|
Executive
|
2018
|
2017
|
Percent Change
|
|
Mr. Johnson
|
$1,050,000
|
$995,000
|
5.5%
|
|
Mr. Thomas
|
628,319
|
610,018
|
3.0%
|
|
Mr. Grimes
|
669,500
|
650,000
|
3.0%
|
|
Mr. Skaggs
|
520,000
|
495,285
|
5.0%
|
|
Ms. Quirk
|
510,000
|
477,405
|
6.8%
|
Note
All 2018 salary changes were effective on October 1, 2017.
Annual Incentive Compensation.
All executives, including the NEOs, participate in the EAIP. The EAIP is designed to encourage and reward executives for successfully achieving annual financial and operational goals. For
2018
, an executive's annual incentive payment under the EAIP was calculated as follows:
|
EAIP
Amount
|
=
|
Annual
Salary
|
X
|
Annual Target
Incentive
Opportunity
|
X
|
Percent of
Opportunity
Achieved
(0% to 150%)
|
X
|
Corporate
Multiplier
(0 to 1.00)
|
X
|
Individual Performance Multiplier
(0% to 125%)
|
Each component of this calculation is discussed below (except for annual salary, which is discussed above).
Annual Target Incentive Opportunity
. Annual incentive opportunities for participants in the EAIP generally increase with position and responsibility. For
2018
, Mr. Johnson's target EAIP award opportunity was approved at 150 percent of salary. In October 2017, Mr. Johnson evaluated the appropriateness of the EAIP award opportunities for the other NEOs and made no changes. Accordingly, target EAIP award opportunities of the NEOs for
2018
were as follows:
|
Named Executive Officers
|
2018 Target Annual Incentive Opportunity
(1)
|
|
Mr. Johnson
|
150%
|
|
Mr. Thomas
|
80%
|
|
Mr. Grimes
|
80%
|
|
Mr. Skaggs
|
80%
|
|
Ms. Quirk
|
70%
|
Note
(1) Represents a percent of each NEO’s salary.
Percent of Opportunity Achieved
. TVA had one organizational scorecard for the 2018 EAIP (TVA Enterprise Scorecard). This scorecard was also used to determine annual incentive payouts for all non-executive TVA employees who participated in TVA's
2018
Winning Performance Team Incentive Plan ("WPTIP").
Once scorecard results were calculated, the CEO, after consulting with the TVA Board, approved the scorecard result at 130 percent. The Chair of the TVA Board, in consultation with the Committee and with input from the individual members of the TVA Board, then recommended and approved a payout of 130 percent for the CEO.
157
The goals and associated weightings for the scorecard and the adjusted results achieved follow:
|
TVA 2018 Enterprise Scorecard
|
|||||||||
|
Enterprise Measures
|
Weight
|
Threshold
|
Target
|
Stretch
|
Actual
|
||||
|
Load Not Served (System Minutes)
(1)
|
30%
|
4.8
|
|
4.0
|
|
3.6
|
|
3.3
|
|
|
TVA Total Spending ($ Million)
(2)
|
30%
|
$ 4,920
|
|
$ 4,781
|
|
$ 4,643
|
|
$ 4,353
|
|
|
Nuclear Unit Capability Factor (UCF) (%)
(3)
|
20%
|
89.3
|
%
|
90.1
|
%
|
90.9
|
%
|
91.3
|
%
|
|
Coal Seasonal Equivalent Forced Outage Rate (%)
(4)
|
10%
|
7.3
|
%
|
6.1
|
%
|
4.9
|
%
|
12.5
|
%
|
|
Combined Cycle Seasonal Equivalent Forced Outage Rate (%)
(5)
|
10%
|
2.4
|
%
|
1.7
|
%
|
0.9
|
%
|
1.6
|
%
|
|
Scorecard Result
|
130%
|
||||||||
Notes
(1) Load Not Served ("LNS") is equal to the product of (i) the percentage of total load not served (the amount of load that would have been delivered had the interruption not occurred estimated in MWhs) and (ii) the number of minutes in the period during which load was not served (excluding interruptions because of declared major events). Value is expressed in system minutes. One system minute is equivalent to the total amount of load that TVA serves during an average minute during the fiscal year.
(2) TVA Total Spending is defined as non-fuel operating and maintenance ("O&M") expense plus capital expense plus non-fuel inventory expense for corporate and operational organizations.
(3) Nuclear Unit Capability Factor ("UCF") is the ratio of available energy generation during 2018 to the reference energy generation over the same time period.
(4) Coal Seasonal Equivalent Forced Outage Rate measures the generation lost because of forced events as a percentage of time a unit would have been scheduled to run. This indicator is for the months of December to March and June to September for 2018 and includes all coal-fired plants.
(5) Combined Cycle Seasonal Equivalent Forced Outage Rate measures the generation lost because of forced events as a percentage of time a unit would have been scheduled to run. This indicator is for the months of December to March and June to September for 2018 and includes Ackerman, Caledonia, John Sevier, Lagoon Creek, Magnolia, and Southaven Combined Cycle Plants.
Corporate Multiplier
. The TVA Board approved the use of a corporate multiplier for the WPTIP and EAIP. The corporate multiplier ranges between 0 and 1.0 and can be used only for purposes of
reducing
the amount of the award. For
2018
, the TVA
Board determined that the corporate multiplier should be 1.0 based on the following:
|
•
|
Safety better than top decile and best since tracking began in 1985;
|
|
•
|
Strong financial performance, including funding $1.8 billion in capital spending without increasing debt;
|
|
•
|
Solid economic development and capital investment; and
|
|
•
|
Zero Board level significant events.
|
|
Corporate Multiplier
|
Plan
|
Actual
|
||||
|
Safety - Recordable Incident Rate (RIR)
(1)
|
0.00
|
|
0.34
|
|
||
|
Financial Health
|
||||||
|
Total Financing Obligations (TFO) and Liabilities ($ Billion)
(2)
|
$
|
25.7
|
|
$
|
24.0
|
|
|
Operating Cash Flow ($ Million)
(3)
|
$
|
2,774
|
|
$
|
3,955
|
|
|
Net Income ($ Million)
(4)
|
$
|
1,040
|
|
$
|
1,119
|
|
|
Jobs Created and Retained
(5)
|
65,000
|
|
65,423
|
|
||
|
Board Level Significant Events
(6)
|
0
|
|
0
|
|
||
Notes
(1) Recordable Incident Rate is defined as the number of recordable injuries (as defined by TVA’s safety program) per 200,000 employee-hours worked by TVA employees and staff augmentation contractors (excluding hearing events).
(2) Total Financing Obligations and Liabilities is calculated by subtracting contributions to unfunded liabilities from the sum of (1) long-term debt, net (including unamortized premiums/discounts), (2) short-term debt, net, (3) leaseback obligations, (4) energy prepayment obligations, and (5)
variable interest entities ("VIE")
.
(3) Operating Cash Flow is the amount of cash generated from power production and other mission-related activities. It is generally defined as operating revenues received less cash payments made for operating expenses. See Item 8, Financial Statements and Supplementary Data -
Consolidated Statements of Cash Flows
for additional information.
(4) Net Income consists of the organization’s net earnings derived by adjusting revenues for the cost of doing business, including the cost of sales, depreciation, interest, taxes, and other expenses. See Item 8, Financial Statements and Supplementary Data -
Consolidated Statements of Operations
for additional information.
(5) Jobs Created and Retained measures the number of new or retained jobs in the Tennessee Valley for which TVA has played a role in the recruitment or retention of the economic development project.
(6) Board Level Significant Events include items deemed materially significant to the TVA Board and that affect TVA’s reputation with its customers and its stakeholders, the organizational health of the workforce, or TVA’s impact on the public at large.
Individual Performance Multiplier
. The
2018
EAIP maintained the CEO's discretion to adjust individual incentive awards based on subjective assessments of individual performance during
2018
. Once all other preliminary
2018
EAIP payouts were calculated and the corporate multiplier was applied, Mr. Johnson, as CEO, and in consultation with the Committee, evaluated
158
each NEO’s performance (except his own) to determine whether any upward or downward adjustment should be made to the final annual incentive award of the participants. No adjustments were made to these awards.
In addition, the TVA Board Chair, in consultation with the Committee and with input from individual members of the TVA Board, evaluated Mr. Johnson’s performance as CEO during
2018
to determine whether any adjustment should be made to his incentive award under the EAIP. Based on this review, the TVA Board Chair decided that Mr. Johnson’s final annual incentive award should be adjusted by 115 percent based on TVA’s
2018
performance, including strong financial results, improvement in broad-based worker safety performance, progress on rates and O&M spending, improvement in customer loyalty and stakeholder relationships, economic development, and investment in the Tennessee Valley. Additionally, there was improved overall operational performance of TVA's nuclear fleet.
EAIP Payouts
. As a result of the above process, the NEOs were awarded the following EAIP payouts for
2018
in comparison to the
2018
target payouts:
|
2018 EAIP Payouts
|
||||||||||||||||||
|
Named Executive Officers
|
Salary
|
Target EAIP
Incentive
Opportunity
(% of Salary)
|
Target
EAIP Payout
|
Scorecard Results After Application of Corporate Multiplier
|
Individual Performance Multiplier
|
Actual EAIP Payment
|
||||||||||||
|
William D. Johnson
|
$
|
1,050,000
|
|
150%
|
$
|
1,575,000
|
|
130%
|
115%
|
|
$
|
2,354,625
|
|
|||||
|
John M. Thomas, III
|
628,319
|
|
80%
|
502,655
|
|
130%
|
100%
|
|
653,452
|
|
||||||||
|
Joseph P. Grimes, Jr.
|
669,500
|
|
80%
|
535,600
|
|
130%
|
100%
|
696,280
|
|
|||||||||
|
Michael D. Skaggs
|
520,000
|
|
80%
|
416,000
|
|
130%
|
100%
|
540,800
|
|
|||||||||
|
Sherry A. Quirk
|
510,000
|
|
70%
|
357,000
|
|
130%
|
100%
|
|
464,100
|
|
||||||||
Awards to the NEOs under the EAIP for
2018
are reported in the “Non-Equity Incentive Plan Compensation” column in the Summary Compensation Table.
Long-Term Incentive Compensation.
In addition to the EAIP, certain executives in critical positions, including the Named Executive Officers, participate in the company's long-term compensation plans. These individuals make decisions that significantly influence the development and execution of TVA's long-term strategic objectives. As such, the long-term compensation plans are designed to reward executives for helping TVA improve in areas directly related to TVA's long-term success by:
|
•
|
Using enterprise-wide performance criteria that are directly aligned with TVA's mission;
|
|
•
|
Using a “cumulative” performance approach to measure performance achieved over a three-year period with a new three-year performance cycle beginning each year;
|
|
•
|
Using a potential payment range of 50 percent to 150 percent of target incentive opportunity to enable awards that are commensurate with performance achievements; and
|
|
•
|
Establishing award opportunities for each performance cycle at levels that approximate median levels of competitiveness with TVA's peer group and adhering to the Committee's policy that (i) approximately 70 to 80 percent of each executive's total long-term incentive opportunity be performance-based (under the performance-based awards under the LTIP) and (ii) approximately 20 to 30 percent of each executive's total long-term incentive opportunity be retention-oriented under the LTIP as described below under the heading "Long-Term Retention Arrangements."
|
LTIP
. Effective October 1, 2015, TVA adopted the LTIP. The LTIP combines and replaces both the ELTIP, which provided for performance-based awards, and the LTRIP, which provided for time-based retention awards. The purpose of the LTIP is to provide a cohesive total long-term compensation opportunity through the granting of (1) variable, at-risk long-term performance-based awards and (2) long-term retention awards. Participants may receive both types of awards. For participants who have been granted both types of awards, the retention awards will typically be targeted at 20 percent to 30 percent of each participant’s total targeted long-term compensation. The remaining 70 percent to 80 percent of long-term compensation will be in the form of performance-based awards.
159
Effective October 1, 2017, TVA granted the following LTP awards:
|
Named Executive Officers
|
LTP/Long-Term Performance Grant
(1)
|
|||
|
Mr. Johnson
|
$
|
2,315,250
|
|
|
|
Mr. Thomas
|
850,000
|
|
||
|
Mr. Grimes
|
825,000
|
|
||
|
Mr. Skaggs
|
750,000
|
|
||
|
Ms. Quirk
|
675,000
|
|
||
Note
(1) All awards vest September 30, 2020, and the actual amount the executives receive upon payout may vary based
on organizational performance under the LTIP.
2016 - 2018 Completed Performance Cycle
For the three-year cycle ended September 30,
2018
, the TVA Board approved three overall long-term incentive measures of TVA performance to be applied to all participants in the LTIP:
|
•
|
Wholesale Rate Excluding Fuel;
|
|
•
|
Load Not Served (the product of the percentage of total load-not-served multiplied by the number of minutes in the measurement period); and
|
|
•
|
External Measures (including external nuclear performance indicators, stakeholder survey, media tone, customer loyalty, and Board level significant events).
|
The Wholesale Rate Excluding Fuel performance measure reflects TVA's annual non-fuel electric revenues divided by TVA's annual power sales. These targets are based upon TVA's revenue requirements and sales projections with the ultimate goal of keeping customer rates as low as feasible, with a threshold goal of 4.91, a target goal of 4.82, and a stretch goal of 4.72.
The Load Not Served performance measure reflects the percentage of total load not served multiplied by the number of minutes in the period (with the value expressed in system minutes and excluding events during declared major storms) during the three-year cycle ended September 30,
2018
, with a threshold goal of 5.0, a target goal of 4.2, and a stretch goal of 3.7. Load Not Served events caused by TVA on a distributor system will also count as a TVA event even if TVA’s system remains energized.
The External Measures represent TVA's performance in areas including external nuclear performance indicators, stakeholder survey, media tone, customer loyalty, and Board level significant events. Targets for the External Measures are based on making incremental improvements in external perceptions of TVA's performance and brand. The nuclear performance measure was based on
2018
results, with a threshold goal of 89.0 (third quartile), a target goal of 92.0 (between median and top quartile), and a stretch goal of 95.0 (better than top quartile). The media tone, stakeholder survey, customer survey, and Board level significant events measures were calculated using an average of the 2016, 2017, and 2018 results. The media tone measure had a threshold goal of 83.7, a target goal of 87.7, and a stretch goal of 89.7. The stakeholder survey measure had a threshold goal of 81.3, a target goal of 82.5, and a stretch goal of 83.7. The customer survey measure had a threshold goal of 57.3, a target goal of 58.7, and a stretch goal of 60.0. The TVA Board level significant events measure had a threshold goal of two unfavorable events, a target goal of zero events, and a stretch goal of two favorable events.
160
The following table shows the performance goals and weighting and percent of opportunity achieved for the performance-based awards (LTP) under the LTIP for the three-year cycle ended September 30,
2018
:
|
TVA 2018 Long-Term Incentive Plan Scorecard
|
||||||
|
Long-Term Incentive Measure
|
Weight
|
Threshold
|
Target
|
Stretch
|
Actual
|
Adjusted
|
|
Wholesale Rate Excluding Fuel (2016-2018)
|
40%
|
4.91
|
4.82
|
4.72
|
4.93
|
4.82
|
|
Load Not Served (2016-2018)
|
30%
|
5.0
|
4.2
|
3.7
|
4.1
|
4.1
|
|
External Measures (2016-2018)
|
30%
|
81.0
|
89.0
|
96.5
|
91.9
|
91.9
|
|
External Nuclear Performance Indicators (2018) %
(1)
|
25%
|
89.0
|
92.0
|
95.0
|
95.7
|
95.7
|
|
Media Tone %
|
25%
|
83.7
|
87.7
|
89.7
|
90.3
|
90.3
|
|
Stakeholder Survey %
|
10%
|
81.3
|
82.5
|
83.7
|
81.4
|
81.4
|
|
Customer Survey %
|
10%
|
57.3
|
58.7
|
60.0
|
72.0
|
72.0
|
|
Board Level Significant Events
|
30%
|
-2.0
|
0.0
|
2.0
|
0.0
|
0.0
|
|
|
Calculated Payout
|
68%
|
||||
|
Approved Adjusted Payout
|
108%
|
|||||
Note
(1) On August 23, 2017, the TVA Board revised the goals related to the external nuclear performance indicators to exclude the impact of Watts Bar Unit 2. The changes were adopted because the external party that rates the performance of TVA’s nuclear fleet provided additional guidance that the performance data for Watts Bar Unit 2 would not be included in its rating of the performance of the nuclear fleet until TVA’s fiscal year 2019.
As part of the LTIP, the TVA Board reserves discretion to review results and peer group comparisons and to approve adjustments in payouts, as appropriate. Over the past few performance cycles, the Wholesale Rate Excluding Fuel measure has not been indicative of TVA's overall performance as it is affected significantly by weather and consumer behavior. Therefore, the TVA Board adjusted the payout for the 2016 - 2018 performance cycle from 68 percent to 108 percent, which represents the result if the Wholesale Rate Excluding Fuel measure was fixed at target.
In August 2018, the TVA Board approved replacing the LTP financial measure Wholesale Rate Excluding Fuel with
Non-Fuel Delivered Cost of Power. Wholesale Rate Excluding Fuel had not historically reflected TVA's financial performance as
it is largely impacted by weather and customer behavior. As a result, the TVA Board had used its discretion and adjusted payouts to better reflect goal achievement, overall strong performance and financial discipline. The TVA Board and management believe that replacing the measure with Non-Fuel Delivered Cost of Power will drive performance through activities that management can control.
Additional highlights of the 2016 - 2018 performance period include:
|
•
|
Strong financial performance (lowest debt level since 1992)
|
|
•
|
Best reliability performance
|
|
•
|
Favorable external measures (reputation and perception of TVA).
|
As a result, the NEOs were awarded the following LTP payouts for the 2016 - 2018 performance cycle:
|
Named Executive Officers
|
LTP Grant Vesting 9/30/2018
|
Percent of Opportunity Achieved
|
LTP Payout
|
||||||
|
William D. Johnson
|
$
|
2,268,600
|
|
108%
|
$
|
2,450,088
|
|
||
|
John M. Thomas, III
|
715,000
|
|
108%
|
772,200
|
|
||||
|
Joseph P. Grimes, Jr.
|
750,000
|
|
108%
|
810,000
|
|
||||
|
Michael D. Skaggs
|
600,000
|
|
108%
|
648,000
|
|
||||
|
Sherry A. Quirk
|
560,000
|
|
108%
|
604,800
|
|
||||
Awards to the NEOs for the LTP performance cycle that ended September
30, 2018, are reported in the Non-Equity Incentive Plan Compensation column of the Summary Compensation Table.
161
2017 - 2019 Outstanding Performance Cycle
The TVA Board approved the following overall LTP measures of TVA performance for all participants for the three-year cycle ending September 30, 2019 (awards to be paid in November 2019):
|
Performance Measure
|
Weight
|
Threshold
(50%)
|
Target
(100%)
|
Stretch
(150%)
|
|
Non-Fuel Delivered Cost of Power
(1)
|
40%
|
3.65
|
3.51
|
3.37
|
|
Load Not Served
(2)
|
30%
|
4.8
Between top quartile and top decile
|
4.0
2017 - 2019 average rate based on business plans
|
3.5
Better than top decile
|
|
External Measures
(3)
|
30%
|
80.6
|
88.4
|
96.1
|
Notes
(1) On August 22, 2018, the TVA Board approved replacing the Wholesale Rate Excluding Fuel measure with Non-Fuel Delivered Cost of Power for the 2017 - 2019 performance cycle because the Wholesale Rate Excluding Fuel measure has not historically reflected TVA’s financial performance. The Non-Fuel Delivered Cost of Power measure is equal to the sum of (i) non-fuel operating and maintenance expense, (ii) base capital expense, (iii) interest expense, and (iv) other expense divided by budgeted electric power sales. For the 2017 - 2019 LTIP performance cycle, the Non-Fuel Delivered Cost of Power measure will be calculated using 2019 results.
(2) Load Not Served is equal to the product of (i) the percentage of total load not served and (ii) the number of minutes in the period (excluding interruptions due to declared major events). Value is expressed in system minutes and is the average of the three years within the LTIP performance cycle. Load Not Served events caused by TVA on a distributor system will also count as a TVA event even if TVA’s system remains energized. For the 2017-2019 LTIP performance cycle, the Load Not Served measure will be calculated using an average of the 2017, 2018, and 2019 results. The target Load Not Served measure is the average of the rates for 2017, 2018, and 2019 that were set forth in the approved business plans for 2015, 2016, and 2017, respectively.
(3) For the 2017 - 2019 LTIP performance cycle, the External Measures metric will be calculated using an average of the 2017, 2018, and 2019 results (except for the External Nuclear Performance Indicators measure, which will be based on 2019 results). On August 25, 2016, the TVA Board revised (1) the method for calculating the External Nuclear Performance Indicators measure and (2) the goals related to this measure. The changes were adopted because the external party that rates the performance of TVA’s nuclear fleet revised the industry standard metric for its rating index and provided new guidance on reporting requirements related to the addition of Watts Bar Unit 2 into TVA’s nuclear fleet.
2018 - 2020 Outstanding Performance Cycle
The TVA Board approved the following overall LTP measures of TVA performance for all participants for the three-year cycle ending September 30, 2020 (awards to be paid in November 2020):
|
Performance Measure
|
Weight
|
Threshold
(50%)
|
Target
(100%)
|
Stretch
(150%)
|
|
Non-Fuel Delivered Cost of Power
(1)
|
40%
|
3.57
|
3.43
|
3.29
|
|
Load Not Served
(2)
|
30%
|
4.8
|
4.0
|
3.6
|
|
External Measures
(3)
|
30%
|
81.6
|
89.4
|
97.1
|
Notes
(1) On August 22, 2018, the TVA Board approved replacing the Wholesale Rate Excluding Fuel measure with Non-Fuel Delivered Cost of Power for the 2018 - 2020 performance cycle because the Wholesale Rate Excluding Fuel measure has not historically reflected TVA’s financial performance. The Non-Fuel Delivered Cost of Power measure is equal to the sum of (i) non-fuel operating and maintenance expense, (ii) base capital expense, (iii) interest expense, and (iv) other expense divided by budgeted electric power sales. For the 2018-2020 LTIP performance cycle, the Non-Fuel Delivered Cost of Power measure will be calculated using an average of the 2019 and 2020 results.
(2) Load Not Served is equal to the product of (i) the percentage of total load not served and (ii) the number of minutes in the period (excluding interruptions due to declared major events). Value is expressed in system minutes and is the average of the three years within the LTIP performance cycle. Load Not Served events caused by TVA on a distributor system will also count as a TVA event even if TVA’s system remains energized. For the 2018 - 2020 LTIP performance cycle, the Load Not Served measure will be calculated using an average of the 2018, 2019, and 2020 results.
(3) For the 2018 - 2020 LTIP performance cycle, the External Measures metric will be calculated using an average of the 2018, 2019, and 2020 results (except for the External Nuclear Performance Indicators measure, which will be based on 2020 results).
Long-Term Retention.
As a corporate agency of the U.S., TVA does not have equity securities that it can use to provide stock awards, options, or other equity-based awards as compensation for its employees. To help retain leaders, TVA uses long-term retention grants. Effective October 1, 2015, TVA adopted the LTIP, which provides for retention awards in addition to performance-based awards. The purpose of the retention awards under the LTIP is to provide a retention incentive similar to restricted stock or restricted stock units. These grants are intended to encourage executives to remain with TVA and to provide, in combination with salary, EAIP, and LTP grants, a competitive level of total direct compensation. Awards are designed to constitute approximately 20 to 30 percent of each NEO's total long-term compensation.
LTR
. The LTIP is designed to provide officers and other participants with time-based incentive opportunities designed to encourage them to remain with TVA over an extended period of time. Retention grants provided under the LTIP have a vesting period covering three years. Grants are generally provided on October 1 and will become one-third vested on each subsequent September 30. Each award will be paid in a lump sum within two months of vesting.
Following the market assessment conducted by FW Cook, effective October 1, 2017, TVA granted the following retention-based awards under the LTIP in order to provide a competitive long-term compensation/opportunity:
162
|
Named Executive Officers
|
LTR/Long-Term Retention Grant
(1)
|
|||
|
Mr. Johnson
|
$
|
992,250
|
|
|
|
Mr. Thomas
|
350,000
|
|
||
|
Mr. Grimes
|
325,000
|
|
||
|
Mr. Skaggs
|
300,000
|
|
||
|
Ms. Quirk
|
285,000
|
|
||
Note
(1) All awards vested 1/3 September 30, 2018 and will vest 1/3 September 30, 2019 and 1/3 September 30, 2020.
Retirement Benefits.
TVA sponsors a qualified defined benefit plan (“pension plan”) and a qualified defined contribution plan (“401(k) plan”), which are administered by the
TVA Retirement System ("TVARS")
. The availability of, and level of benefits provided by, these qualified plans are comparable to similar qualified plans provided by companies in TVA's peer group.
In addition to its qualified retirement plans, TVA has a SERP for selected executives who are critical to the ongoing success of the enterprise. TVA's SERP is a non-qualified plan similar to those used by most other companies in its peer group. The purpose of the SERP is to:
|
•
|
Provide a competitive retirement benefit level that cannot be delivered solely through TVA's qualified retirement plans due to IRS limitations.
|
|
•
|
Provide a benefit level (as a percentage replacement of pre-retirement pay) that is more comparable to that of employees who are not subject to the IRS limitations.
|
More information regarding these retirement benefits is found following the Pension Benefits Table.
Health and Other Benefits.
TVA offers a group of health and other benefits (medical, dental, vision, life and accidental death and disability insurance, and long-term disability insurance) that are available to a broad group of employees. The NEOs are eligible to participate in TVA's health benefit plans and other non-retirement benefit plans on the same terms and at the same contribution rates as other TVA employees.
Considerations Specific to Mr. Johnson.
At the beginning of 2018, the Committee, in consultation with its independent executive compensation consultant, FW Cook, evaluated Mr. Johnson’s overall performance and compensation opportunity relative to TVA’s peer group to determine whether to recommend adjustments to Mr. Johnson’s compensation to the TVA Board for 2018. After a thorough review, including the consideration of CEO median compensation data, the Committee recommended that the TVA Board approve compensation and incentive opportunity changes for Mr. Johnson for 2018. The 2018 compensation package for Mr. Johnson consisted of the following components: annual salary of $1,050,000, a target EAIP incentive opportunity of 150 percent of salary, an LTP grant of $2,315,250, and an LTR grant of $992,250. The LTP grant was effective October 1, 2017, and vests September 30, 2020, provided certain performance targets are achieved. The LTR grant was effective October 1, 2017, and vests in three equal increments on September 30, 2018, 2019, and 2020. The Committee made its recommendation based on the mission of TVA and the belief that the structure of Mr. Johnson's compensation opportunity should have a larger component of “at risk” compensation than any other TVA executive (approximately 67 percent of overall target total direct compensation).
Additionally, the TVA Board approved a performance incentive arrangement ("PIA") under which Mr. Johnson is entitled to receive a cash award of up to $200,000 per year based on the evaluation of his performance. The TVA Board decided to award Mr. Johnson the full $200,000 for 2018 based on his strong performance.
The chart below compares (i) the total direct compensation earned by Mr. Johnson for 2018; (ii) the 2018 compensation opportunity approved by the TVA Board for Mr. Johnson; and (iii) the CEO median compensation data provided to the Committee by FW Cook, based on TVA's peer group as discussed above.
163
|
CEO Peer Group Compensation Comparison
|
|||||||||||
|
Compensation Component
|
TVA CEO Johnson
Actual Compensation
for 2018
|
TVA CEO Johnson
Target Compensation Opportunity for 2018
|
Willis Towers Watson Chief Executive Officer Median Market Data
(TVA Peer Group) (1) |
||||||||
|
Base Salary
|
$
|
1,052,115
|
|
$
|
1,050,000
|
|
$
|
1,234,000
|
|
||
|
Total Annual Incentive
|
243
|
%
|
(2)
|
169
|
%
|
(2)
|
125
|
%
|
|||
|
Total Cash Compensation ("TCC")
|
$
|
3,606,740
|
|
$
|
2,825,000
|
|
$
|
2,813,000
|
|
||
|
Total Long-Term Incentive Compensation
|
302
|
%
|
(3)
|
285
|
%
|
(3)
|
505
|
%
|
|||
|
Total Direct Compensation ("TDC")
|
$
|
6,778,945
|
|
$
|
5,815,717
|
|
$
|
9,030,000
|
|
||
Notes
(1) Target market assessment effective October 2017 and included market composite of Willis Towers Watson database and proxy peer group.
(2) Mr. Johnson's target EAIP award for 2018 was 150 percent of $1,050,000, and he was eligible for an additional $200,000 under a PIA. TVA's Enterprise Scorecard result was 130 percent, and Mr. Johnson had an Individual Performance Multiplier of 115 percent of his award. Additionally, Mr. Johnson was awarded $200,000 under the PIA.
(3) For the 2016 - 2018 LTP performance cycle, Mr. Johnson's target LTP award was $2,268,600, and his actual award was 108 percent of this amount, for a payment of $2,450,088. Mr. Johnson also had three tranches of LTR grants vest ($189,050, $202,317, and $330,750) on September 30, 2018, for a total of $722,117.
Executive Compensation Tables and Narrative Disclosures
Summary Compensation and Grants of Plan-Based Awards
The following table provides information on compensation earned by each of the Named Executive Officers in
2018
(and
2017
and
2016
, as applicable).
|
Summary Compensation Table
|
||||||||||||||||||||||||||
|
Name and Principal Position
|
Year
|
Salary
|
Bonus
|
Stock
Awards
|
Option
Awards
|
Non-Equity Incentive Plan Compensation
(1)
|
Change in Pension Value and
Nonqualified Deferred Compensation Earnings (2) |
All Other Compensation
(3)
|
Total
|
|||||||||||||||||
|
William D. Johnson
|
2018
|
$
|
1,052,115
|
|
—
|
|
—
|
|
—
|
|
$
|
5,726,830
|
|
$
|
1,303,293
|
|
$
|
32,400
|
|
$
|
8,114,638
|
|
||||
|
President and Chief
|
2017
|
995,000
|
|
—
|
|
—
|
|
—
|
|
4,075,857
|
|
(4)
|
1,556,084
|
|
(5)
|
31,800
|
|
6,658,741
|
|
|||||||
|
Executive Officer
|
2016
|
1,002,654
|
|
—
|
|
—
|
|
—
|
|
3,906,619
|
|
(6)
|
1,529,186
|
|
(7)
|
11,925
|
|
6,450,384
|
|
|||||||
|
John M. Thomas, III
|
2018
|
$
|
629,023
|
|
—
|
|
—
|
|
—
|
|
$
|
1,692,318
|
|
$
|
173,723
|
|
$
|
20,250
|
|
$
|
2,515,314
|
|
||||
|
Executive Vice President
|
2017
|
610,018
|
|
—
|
|
—
|
|
—
|
|
1,406,637
|
|
(8)
|
294,108
|
|
(9)
|
19,875
|
|
2,330,638
|
|
|||||||
|
and Chief Financial Officer
|
2016
|
596,806
|
|
—
|
|
—
|
|
—
|
|
1,645,425
|
|
(10)
|
631,252
|
|
(11)
|
11,925
|
|
2,885,408
|
|
|||||||
|
Joseph P. Grimes, Jr.
|
2018
|
$
|
670,250
|
|
—
|
|
—
|
|
—
|
|
$
|
1,787,946
|
|
$
|
401,299
|
|
$
|
32,400
|
|
$
|
2,891,895
|
|
||||
|
Executive Vice President
|
2017
|
650,000
|
|
—
|
|
—
|
|
—
|
|
1,445,383
|
|
(12)
|
311,406
|
|
(13)
|
31,800
|
|
2,438,589
|
|
|||||||
|
Generation
|
2016
|
604,615
|
|
—
|
|
—
|
|
—
|
|
1,254,987
|
|
(14)
|
320,593
|
|
(15)
|
11,925
|
|
2,192,120
|
|
|||||||
|
Michael D. Skaggs
|
2018
|
$
|
520,951
|
|
—
|
|
—
|
|
—
|
|
$
|
1,422,133
|
|
$
|
320,678
|
|
$
|
12,150
|
|
$
|
2,275,912
|
|
||||
|
Executive Vice President
|
2017
|
495,285
|
|
—
|
|
—
|
|
—
|
|
1,000,578
|
|
(16)
|
352,167
|
|
(17)
|
11,925
|
|
1,859,955
|
|
|||||||
|
and Chief Operating Officer
|
2016
|
475,328
|
|
—
|
|
—
|
|
—
|
|
853,282
|
|
(18)
|
864,973
|
|
(19)
|
161,925
|
|
2,355,508
|
|
|||||||
|
Sherry A. Quirk
|
2018
|
$
|
511,254
|
|
—
|
|
—
|
|
—
|
|
$
|
1,288,900
|
|
$
|
207,166
|
|
$
|
24,300
|
|
$
|
2,031,620
|
|
||||
|
Executive Vice President and
|
2017
|
477,405
|
|
—
|
|
—
|
|
—
|
|
993,725
|
|
(20)
|
138,629
|
|
(21)
|
23,850
|
|
1,633,609
|
|
|||||||
|
General Counsel
|
2016
|
—
|
|
—
|
|
—
|
|
—
|
|
—
|
|
—
|
|
—
|
|
—
|
|
|||||||||
Note
(1) The
2018
data is outlined in the table below.
164
|
Non-Equity Incentive Plan Compensation
|
|||||||||||||||||||
|
William D. Johnson
|
John M. Thomas, III
|
Joseph P. Grimes, Jr.
|
Michael D. Skaggs
|
Sherry A. Quirk
|
|||||||||||||||
|
EAIP
|
$
|
2,354,625
|
|
$
|
653,452
|
|
$
|
696,280
|
|
$
|
540,800
|
|
$
|
464,100
|
|
||||
|
LTP
|
2,450,088
|
|
772,200
|
|
810,000
|
|
648,000
|
|
604,800
|
|
|||||||||
|
LTR 2015-03
(A)
|
189,050
|
|
66,667
|
|
86,666
|
|
50,000
|
|
50,000
|
|
|||||||||
|
LTR 2016-02
(B)
|
202,317
|
|
83,333
|
|
86,667
|
|
83,333
|
|
75,000
|
|
|||||||||
|
LTR 2017-01
(C)
|
330,750
|
|
116,666
|
|
108,333
|
|
100,000
|
|
95,000
|
|
|||||||||
|
PIA
|
200,000
|
|
—
|
|
—
|
|
—
|
|
—
|
|
|||||||||
|
Total
|
$
|
5,726,830
|
|
$
|
1,692,318
|
|
$
|
1,787,946
|
|
$
|
1,422,133
|
|
$
|
1,288,900
|
|
||||
(A) LTR grant representing the third tranche of the LTR award effective October 1, 2015.
(B) LTR grant representing the second tranche of the LTR award effective October 1, 2016.
(C) LTR grant representing the first tranche of the LTR award effective October 1, 2017.
(2) The
2018
data is outlined in the table below.
|
Change in Pension Value and Nonqualified Deferred Compensation Earnings
|
|||||||||||||||||||
|
William D. Johnson
|
John M. Thomas, III
|
Joseph P. Grimes, Jr.
|
Michael D. Skaggs
|
Sherry A. Quirk
|
|||||||||||||||
|
Increase under Cash Balance Pension
|
$
|
2,969
|
|
$
|
27,604
|
|
$
|
2,404
|
|
$
|
49,607
|
|
$
|
—
|
|
||||
|
Increase under SERP
|
1,300,324
|
|
146,119
|
|
398,895
|
|
271,071
|
|
207,166
|
|
|||||||||
|
Total
|
$
|
1,303,293
|
|
$
|
173,723
|
|
$
|
401,299
|
|
$
|
320,678
|
|
$
|
207,166
|
|
||||
(3) The
2018
data is outlined in the table below.
|
All Other Compensation
|
|||||||||||||||||||
|
William D. Johnson
|
John M. Thomas, III
|
Joseph P. Grimes, Jr.
|
Michael D. Skaggs
|
Sherry A. Quirk
|
|||||||||||||||
|
401(k) Matching Contribution
|
$
|
16,200
|
|
$
|
12,150
|
|
$
|
16,200
|
|
$
|
12,150
|
|
$
|
12,150
|
|
||||
|
Non-Elective 401(k) Contribution
|
16,200
|
|
8,100
|
|
16,200
|
|
—
|
|
12,150
|
|
|||||||||
|
Total
|
$
|
32,400
|
|
$
|
20,250
|
|
$
|
32,400
|
|
$
|
12,150
|
|
$
|
24,300
|
|
||||
(4) Represents $1,691,003 awarded under the EAIP, $1,793,488 awarded under the ELTIP, $391,366 awarded under LTR, and $200,000 awarded as a PIA.
(5) Reflects increases of $3,588 under the Cash Balance Pension and $1,552,496 under the SERP.
(6) Represents $1,802,194 awarded under the EAIP, $1,915,375 awarded under the ELTIP, and $189,050 awarded under the LTR.
(7) Reflects increases of $19,235 under the Cash Balance Pension and $1,509,951 under the SERP.
(8) Represents $502,654 awarded under the EAIP, $753,983 awarded under the ELTIP, and $150,000 awarded under the LTR.
(9) Reflects increases of $15,312 under the Cash Balance Pension and $278,796 under the SERP.
(10) Represents $596,988 awarded under the EAIP, $781,770 awarded under the ELTIP, $66,667 awarded under the LTR, and $200,000 awarded under a retention incentive arrangement ("RIA"). TVA entered into the RIA with Mr. Thomas as of January 1, 2015. Under the RIA, Mr. Thomas was eligible to receive $200,000 as long as he remained employed with TVA on December 31, 2015, performed all duties in a highly effective manner, and maintained satisfactory performance through the end of the retention period. These conditions were satisfied, and the retention incentive award was paid to Mr. Thomas within 30 days following the end of the retention period.
(11) Reflects increases of $35,189 under the Cash Balance Pension and $596,063 under the SERP.
(12) Represents $535,600 awarded under the EAIP, $736,450 awarded under the ELTIP, and $173,333 awarded under the LTR.
(13) Reflects increases of $2,105 under the Cash Balance Pension and $309,301 under the SERP.
(14) Represents $442,320 awarded under the EAIP, $726,000 awarded under the ELTIP, and $86,667 awarded under the LTR.
(15) Reflects increases of $18,646 under the Cash Balance Pension and $301,947 under the SERP.
(16) Represents $408,115 awarded under the EAIP, $459,130 awarded under the ELTIP, and $133,333 awarded under the LTR.
(17) Reflects increases of $37,091 under the Cash Balance Pension and $315,076 under the SERP.
(18) Represents $336,299 awarded under the EAIP, $466,983 awarded under the ELTIP, and $50,000 awarded under the LTR.
(19) Reflects increases of $48,505 under the Cash Balance Pension and $816,468 under the SERP.
(20) Represents $344,210 awarded under the EAIP, $524,515 awarded under the ELTIP, and $125,000 awarded under the LTR.
(21) Reflects an increase of $138,629 under the SERP.
The following table provides information on non-equity incentive plan opportunities and grants provided to NEOs during 2018 and the possible range of payouts associated with the opportunities and grants. Awards under the EAIP, LTP, LTR, and PIA that vested as of September 30, 2018, will be paid in cash during the first quarter of 2019.
165
|
Grants of Plan-Based Awards Table
as of September 30, 2018
|
||||||||||||||||||||
|
|
|
Estimated Possible Payouts Under
Non-Equity Incentive Plan Awards
(1)
|
Estimated Future Payouts Under
Non-Equity Incentive Plan Awards (1) |
|||||||||||||||||
|
Performance-Based
|
Retention
|
|||||||||||||||||||
|
Name
|
Plan
|
Grant/Effective Date
|
Threshold
(2)
|
Target
(2)
|
Maximum
(2)
|
|
Grant Date Value
|
|
Performance Period Ending/Vesting Date
|
|||||||||||
|
William D. Johnson
|
EAIP
(3)
|
10/01/2017
|
$
|
787,500
|
|
$
|
1,575,000
|
|
$
|
2,362,500
|
|
09/30/2018
|
||||||||
|
LTP
(4)
|
10/01/2017
|
1,157,625
|
|
2,315,250
|
|
3,472,875
|
|
09/30/2020
|
||||||||||||
|
LTR
5)
|
10/01/2017
|
|
|
$
|
992,250
|
|
09/30/2020
|
(5)
|
||||||||||||
|
PIA
(6)
|
10/01/2017
|
200,000
|
|
09/30/2018
|
||||||||||||||||
|
|
|
|
|
|
|
|
|
|||||||||||||
|
John M. Thomas, III
|
EAIP
(3)
|
10/01/2017
|
$
|
251,328
|
|
$
|
502,655
|
|
$
|
753,983
|
|
09/30/2018
|
||||||||
|
LTP
(4)
|
10/01/2017
|
425,000
|
|
850,000
|
|
1,275,000
|
|
|
09/30/2020
|
|||||||||||
|
LTR
(5)
|
10/01/2017
|
$
|
350,000
|
|
|
09/30/2020
|
(5)
|
|||||||||||||
|
Joseph P. Grimes, Jr.
|
EAIP
(3)
|
10/01/2017
|
$
|
267,800
|
|
$
|
535,600
|
|
$
|
803,400
|
|
09/30/2018
|
||||||||
|
LTP
(4)
|
10/01/2017
|
412,500
|
|
825,000
|
|
$
|
1,237,500
|
|
|
09/30/2020
|
||||||||||
|
LTR
(5)
|
10/01/2017
|
$
|
325,000
|
|
|
09/30/2020
|
(5)
|
|||||||||||||
|
|
|
|
|
|
|
|
|
|||||||||||||
|
Michael D. Skaggs
|
EAIP
(3)
|
10/01/2017
|
$
|
208,000
|
|
$
|
416,000
|
|
$
|
624,000
|
|
09/30/2018
|
||||||||
|
LTP
(4)
|
10/01/2017
|
375,000
|
|
750,000
|
|
$
|
1,125,000
|
|
|
09/30/2020
|
||||||||||
|
LTR
(5)
|
10/01/2017
|
$
|
300,000
|
|
|
09/30/2020
|
(5)
|
|||||||||||||
|
|
|
|
|
|
|
|
|
|||||||||||||
|
Sherry A. Quirk
|
EAIP
(3)
|
10/01/2017
|
$
|
178,500
|
|
$
|
357,000
|
|
$
|
535,500
|
|
09/30/2018
|
||||||||
|
LTP
(4)
|
10/01/2017
|
337,500
|
|
675,000
|
|
$
|
1,012,500
|
|
|
09/30/2020
|
||||||||||
|
LTR
(5)
|
10/01/2017
|
$
|
285,000
|
|
|
09/30/2020
|
(5)
|
|||||||||||||
Notes
(1) TVA does not have any equity securities and therefore has no equity-based awards.
(2) Threshold, Target, and Maximum represent amounts that could be earned by a Named Executive Officer based on performance during the applicable performance cycle. Threshold, Target, and Maximum targets for EAIP and LTIP are 50 percent, 100 percent, and 150 percent.
(3) A corporate multiplier ranging between 0.00 and 1.00 may be applied which can reduce the award to $0. An individual performance multiplier of up to 125 percent may also be applied which may increase the award to 187.5 percent of target. Actual EAIP awards earned for performance in 2018 are reported for each of the Named Executive Officers under the “Non-Equity Incentive Plan Compensation” column in the Summary Compensation Table. See
Compensation Discussion and Analysis
for a discussion of how each award was determined.
(4) At the end of each three-year LTP performance cycle, TVA's Long-Term Incentive Plan Scorecard will be applied to the grants in order to determine award payouts. The final award may be adjusted by the TVA Board based on the evaluation of peer group comparisons and performance results over the three-year performance cycle. All LTP awards will be paid in a lump sum within two months of the September 30th vesting date. The awards will be paid in cash after deducting applicable federal, state, and local withholding taxes. In the case of death, the beneficiary will be paid as soon as administratively practicable but in no event later than the last day of the second full calendar month following the participant's death. In the case of disability, awards will be paid as soon as administratively practicable but in no event later than the last day of the second full calendar month following the participant's separation from service due to disability. Actual LTP awards earned in 2018 are reported for each of the Named Executive Officers under the "Non-Equity Incentive Plan Compensation" column in the Summary Compensation Table.
(5) LTR grants will become one-third vested on each subsequent September 30. All LTR awards will be paid in a lump sum within two months of the September 30th vesting date. The awards will be paid in cash after deducting applicable federal, state, and local withholding taxes. In the case of death, the beneficiary will be paid as soon as administratively practicable but in no event later than the last day of the second full calendar month following the participant’s death. In the case of disability, awards will be paid as soon as administratively practicable but in no event later than the last day of the second full calendar month following the participant’s separation from service due to disability. Actual LTR awards earned in 2018 are reported for each of the Named Executive Officers under the "Non-Equity Incentive Plan Compensation" column in the Summary Compensation Table.
(6) Reflects the maximum award amount Mr. Johnson was eligible to receive under a performance incentive arrangement ("PIA") described in
Compensation Discussion and Analysis
—
Executive Compensation Program Components
—
Considerations Specific to Mr. Johnson
. The actual award to be paid to Mr. Johnson is reported under the "Non-Equity Incentive Plan Compensation" column in the Summary Compensation Table.
Retirement and Pension Plans
The table below provides the actuarial present value of the Named Executive Officers' accumulated benefits, including the number of years of credited service, under TVA's retirement and pension plans as of
September 30, 2018
, determined using a methodology and interest rate and mortality rate assumptions consistent with those used in the financial statements in this Annual Report, set forth in
Note 20
.
166
|
Pension Benefits Table
|
|||||||||||
|
Name
|
Plan Name
|
Number of
Years of Credited Service
(1)
|
Present Value of Accumulated Benefit
|
Payments During Last Year
|
|||||||
|
William D. Johnson
|
Qualified Plan – Cash Balance Pension
|
5.750
|
(2)
|
$
|
77,921
|
|
$
|
—
|
|
||
|
Non-Qualified – SERP Tier 1
|
11.750
|
(2)
|
7,878,131
|
|
—
|
|
|||||
|
John M. Thomas, III
|
Qualified Plan – Cash Balance Pension
|
12.833
|
317,244
|
|
—
|
|
|||||
|
Non-Qualified – SERP Tier 1
|
12.833
|
|
2,672,592
|
|
—
|
|
|||||
|
Joseph P. Grimes, Jr.
|
Qualified Plan – Cash Balance Pension
|
5.083
|
61,202
|
|
—
|
|
|||||
|
Non-Qualified – SERP Tier 1
|
5.083
|
|
1,280,299
|
|
—
|
|
|||||
|
Michael D. Skaggs
|
Qualified Plan – Cash Balance Pension
|
24.583
|
625,949
|
|
—
|
|
|||||
|
Non-Qualified – SERP Tier 1
|
24.000
|
(3
|
)
|
4,413,597
|
|
—
|
|
||||
|
Sherry A. Quirk
|
Qualified Plan – 401(k)
|
3.583
|
—
|
|
(4)
|
—
|
|
||||
|
Non-Qualified – SERP Tier 1
|
3.583
|
348,058
|
|
—
|
|
||||||
Notes
(1) Limited to 24 years when determining supplemental benefits available under SERP Tier 1, described below.
(2) Mr. Johnson was granted five additional years of credited service for pre-TVA employment because he was employed with TVA for at least five years and satisfied the minimum five-year vesting requirement; therefore, the offset for prior employer pension benefits associated with the additional five years of credited service was waived. In addition, the offset for benefits provided under TVA's defined benefit plan will be calculated based on the benefit he would be eligible to receive as a participant in the Cash Balance Pension taking into account the additional years of credited service being used for SERP benefit calculation purposes. In December 2016, the TVA Board approved amendments to Mr. Johnson's compensation arrangements that provide, among other things, that if Mr. Johnson remains with TVA through calendar year 2018, his SERP benefit will be based on 12 years of credited service (six credited years and six actual years). As of September 30, 2018, the present value of the SERP benefit was $7,237,293 based on 10.75 years of service. Mr. Johnson's actual tenure of service is 5.75 years. The SERP benefit based on this tenure is $3,737,378.
(3) Mr. Skaggs has reached the 24 year service cap allowed under the Plan.
(4) Ms. Quirk is not eligible to participate in TVARS since she was hired by TVA after June 30, 2014.
Qualified Retirement Plans
The retirement benefits for which employees are eligible and receive under the pension plan and 401(k) plan depend on the employee’s hire date, years of service, and individual elections, as follows:
|
•
|
Employees who were first hired prior to January 1, 1996, receive (i) a traditional pension benefit calculated based on the employee’s creditable service, the employee’s average monthly salary for the highest three consecutive years of eligible compensation, and a pension factor based on the employee’s age and years of service, less a Social Security offset, and (ii) 401(k) plan matching contributions from TVA. The 401(k) plan matching contribution is $0.25 on every dollar contributed by the employee up to 1.5 percent of eligible compensation. None of the Named Executive Officers are in this group.
|
|
•
|
Employees who were first hired prior to January 1, 1996, and who elected to switch pension structures from traditional to cash balance, receive (i) a cash balance pension benefit calculated based on (a) pay-based credits and interest that accrue over time in the employee’s account and (b) the employee’s age at the time of retirement, and (ii) 401(k) plan matching contributions from TVA. The monthly pay credits are equal to six percent of eligible compensation, and monthly interest is credited at an annual interest rate equal to the change in the CPI-U plus three percent (with a minimum of six percent and maximum of 10 percent). The interest rate during 2018 was six percent. The 401(k) plan matching contribution is $0.75 on every dollar contributed by the employee up to 4.5 percent of eligible compensation.
|
Mr. Skaggs is in this group.
|
•
|
Employees who were first hired on or after January 1, 1996, and who had 10 or more years of service as of October 1, 2016, receive (i) a cash balance pension benefit calculated based on (a) pay-based credits and interest that accrue over time in the employee’s account and (b) the employee’s age at the time of retirement, and (ii) 401(k) plan non-elective and matching contributions from TVA. The monthly pay credits are equal to three percent of eligible compensation, and monthly interest is credited at an annual interest rate equal to the change in the CPI-U plus two percent (with a minimum of 4.75 percent and a maximum of 6.25 percent). The interest rate during 2018 was 4.75 percent. The 401(k) plan automatic, non-elective contribution is equal to three percent of eligible compensation, and the matching contribution is $0.75 on every dollar contributed by the employee up to 4.5 percent of eligible compensation. Mr. Thomas is in this group.
|
|
•
|
Employees who were first hired on or after January 1, 1996, and who had less than 10 years of service as of October 1, 2016, receive (i) a cash balance pension benefit calculated based on pay-based credits and interest that accrue over
|
167
time in the employee’s account and the employee’s age at the time of retirement, and (ii) 401(k) plan non-elective and matching contributions from TVA. As of October 1, 2016, the cash balance accounts of these employees receive no additional pay-based credits; however, the accounts continue to receive monthly interest credits at an annual interest rate equal to the change in the CPI-U plus two percent (with a minimum of 4.75 percent and a maximum of 6.25 percent). The interest rate during 2018 was 4.75 percent. The 401(k) plan automatic, non-elective contribution is equal to six percent of eligible compensation, and the matching contribution is dollar-for-dollar on employee contributions up to six percent of eligible compensation. Mr. Johnson and Mr. Grimes are in this group.
|
•
|
Employees who are first hired on or after July 1, 2014 (or who are rehired and were either previously not vested in the pension plan or cashed out their pension benefit) receive a retirement benefit in the 401(k) plan only. The 401(k) plan automatic, non-elective contribution is equal to 4.5 percent of eligible compensation, and the matching contribution is $0.75 on every dollar contributed by the employee up to 4.5 percent of eligible compensation. Ms. Quirk is in this group.
|
Cash Balance Pension
. For Named Executive Officers who are eligible for retirement benefits under the pension plan, which includes Mr. Johnson, Mr. Thomas, Mr. Skaggs, and Mr. Grimes, eligible compensation is defined as annual salary only for benefit calculation purposes and is shown under the column titled “Salary” in the Summary Compensation Table. The eligible compensation in 2018 could not exceed $270,000 pursuant to the IRS annual compensation limit applicable to qualified plans. Employees with cash balance benefits who have at least five years of cash balance service are eligible at retirement or termination of employment to receive an immediate benefit in the form of a monthly pension with survivor benefit options or in a lump-sum payment with cash out or rollover options. The pension plan does not provide for early retirement benefits to any Named Executive Officer or any other employee eligible for cash balance benefits.
401(k) Plan
. All employees eligible to participate in the 401(k) plan, including the Named Executive Officers, may elect to contribute to the 401(k) plan on a before-tax, Roth, and/or after-tax basis. For purposes of matching and non-elective contributions from TVA to the 401(k) accounts of the Named Executive Officers, eligible compensation is defined as annual salary only for benefit calculation purposes and is shown under the column titled “Salary” in the Summary Compensation Table. The eligible compensation in 2018 could not exceed $270,000 pursuant to the IRS annual compensation limit applicable to qualified plans. Any participant in the 401(k) plan must have three years of TVA service to be vested in matching and non-elective contributions from TVA.
Supplemental Executive Retirement Plan
The SERP is a non-qualified defined benefit pension plan similar to those typically found in other companies in TVA's peer group and is provided to a limited number of executives, including the Named Executive Officers. TVA's SERP was created to recruit and retain key executives. The plan is designed to provide a competitive level of retirement benefits in excess of the limitations on contributions and benefits imposed by TVA's qualified defined benefit plan and Internal Revenue Code Section 415 limits on qualified retirement plans.
The SERP provides two distinct levels of participation, Tier 1 and Tier 2. Each participant is assigned to one of the two tiers at the time he or she is approved to participate in the SERP. The level of participation ("Tier") defines the level of retirement benefits under the SERP at the time of retirement.
Under the SERP, normal retirement eligibility is age 62 with five years of vesting service. No vested and accrued benefits are payable prior to age 55, and benefits are reduced for retirements prior to age 62. The level of reduction in benefits for retirements prior to age 62 depends on whether a participant's termination is “approved” or “unapproved.” In the event of an approved termination of TVA employment, any vested and accrued benefits are reduced by 5/12 percent for each month that the date of benefit commencement precedes the participant's 62nd birthday, up to a maximum reduction of 35 percent. In the event of an unapproved termination of TVA employment, the participant's accrued benefits are first subject to a reduced percentage of vesting if the participant's years of service are between five and 10. At five years of vesting service, the vested percentage of retirement benefits is 50 percent and increases thereafter by 10 percent for each full additional year of service, reaching 100 percent vesting for 10 or more years of vesting service. Thereafter, any vested and accrued benefits are reduced by 10/12 percent for each month that the date of benefit commencement precedes the participant's 62nd birthday up to a maximum reduction of 70 percent.
For purposes of the SERP, an “approved” termination means termination of employment with TVA due to (i) retirement on or after the participant's 62nd birthday, (ii) retirement on or after attainment of actual age 55, if such retirement has the approval of the TVA Board or its delegate, (iii) death in service as an employee, (iv) disability (as defined under the Rules and Regulations of the TVARS) as determined by the Retirement Committee, or (v) any other circumstance approved by the TVA Board or its delegate. For purposes of the SERP, an “unapproved” termination means a termination of employment with TVA when such termination does not constitute an “approved” termination as defined in the preceding sentence.
SERP Tier 1
. All of the Named Executive Officers are participants in Tier 1. The Tier 1 structure is designed to replace 60 percent of the amount of a participant's compensation at the time the participant reaches age 62 and has accrued 24 years of TVA service.
168
Tier 1 benefits are based on a participant's highest average compensation during three consecutive SERP years and a pension multiple of 2.5 percent for each year of credited service up to a maximum of 24 years. Compensation is defined as salary and EAIP for benefit calculation purposes. Tier 1 benefits are offset by Social Security benefits, benefits provided under TVA's qualified defined benefit pension plan, and prior employer pension benefits when applicable.
Nonqualified Deferred Compensation
The following table provides information regarding deferred contributions, earnings, and balances for each of the Named Executive Officers. The amounts reported under this table do not represent compensation in addition to the compensation that was earned in
2018
and already reported in the Summary Compensation Table, but rather the amounts of compensation earned by the Named Executive Officers in
2018
or prior years that were or have been deferred.
|
Nonqualified Deferred Compensation Table
|
|||||||||||||||||
|
Name
|
Executive
Contributions in
2018
|
Registrant
Contributions in
2018
|
Aggregate
Earnings in
2018
(1)
|
Aggregate
Withdrawals/
Distributions
|
Aggregate
Balance at
September 30 2018
(2)
|
||||||||||||
|
William D. Johnson
|
$
|
—
|
|
$
|
—
|
|
$
|
—
|
|
$
|
—
|
|
$
|
—
|
|
||
|
John M. Thomas, III
|
—
|
|
—
|
|
—
|
|
—
|
|
—
|
|
|||||||
|
Joseph P. Grimes, Jr.
|
—
|
|
—
|
|
43,951
|
|
—
|
|
669,392
|
|
|||||||
|
Michael D. Skaggs
|
—
|
|
—
|
|
272,688
|
|
—
|
|
4,774,993
|
|
|||||||
|
Sherry A. Quirk
|
—
|
|
—
|
|
—
|
|
—
|
|
—
|
|
|||||||
Notes
(1) Includes vested earnings. Because none of the amounts are above market or preferential earnings under SEC rules, none of these amounts are included in the Summary Compensation Table.
(2) Includes vested contributions and earnings. The following amounts included in this column also have been reported in the Summary Compensation Table as compensation for a prior fiscal year: Mr. Grimes, $300,000 and Mr. Skaggs, $600,000.
TVA plans allow participants in the EAIP and the performance-based component of the LTIP to defer all or a portion of the compensation earned under those plans and eligible for deferral under plan terms and IRS regulations. All deferrals are credited to each participant in a deferred compensation account, and the deferral amounts are then funded into a rabbi trust. Each participant may elect one or more investment options made available by TVA or allow some or all funds to accrue interest at the rate established by the beginning of each fiscal year equal to the composite rate of all Treasury issues. Participants may elect to change from either one notional investment option or the TVA interest bearing option to another at any time. Upon termination of employment, funds are distributed pursuant to elections made in accordance with applicable IRS regulations.
Participants in the EAIP and LTIP, including the Named Executive Officers, were not allowed to elect to defer any portion of their awards received under the plans for
2018
.
169
Potential Payments on Account of Retirement/Resignation, Termination without Cause, Termination with Cause, Death, or Disability
The tables below show certain potential payments that would have been made to each Named Executive Officer if his or her employment had been terminated on
September 30, 2018
, under various scenarios. All of the Named Executive Officers would also be entitled to payments from plans generally available to TVA employees under the specific circumstances of termination of employment, including the health and welfare and pension plans and amounts in the 401(k) plan.
|
William D. Johnson
|
Retirement/Resignation
|
Termination without Cause
|
Termination with Cause
|
Death
|
Disability
|
|||||||||||||||
|
Severance Agreement
(1)
|
$
|
—
|
|
$
|
2,625,000
|
|
$
|
—
|
|
$
|
—
|
|
$
|
—
|
|
|||||
|
SERP
|
7,237,293
|
|
(2)
|
7,878,131
|
|
(3)
|
7,237,293
|
|
(2)
|
7,237,293
|
|
(3)
(4)
|
7,237,293
|
|
(3)
|
|||||
|
EAIP
|
2,354,625
|
|
2,354,625
|
|
2,354,625
|
|
2,354,625
|
|
2,354,625
|
|
||||||||||
|
LTR
|
722,117
|
|
722,117
|
|
722,117
|
|
1,098,901
|
|
(5)
|
1,098,901
|
|
(6)
|
||||||||
|
LTP
|
2,450,088
|
|
2,450,088
|
|
2,450,088
|
|
4,840,371
|
|
(7)
|
4,840,371
|
|
(8)
|
||||||||
|
Deferred Compensation
|
—
|
|
—
|
|
—
|
|
—
|
|
—
|
|
||||||||||
|
Total Value of Potential Payments
|
12,764,123
|
|
16,029,961
|
|
12,764,123
|
|
15,531,190
|
|
15,531,190
|
|
||||||||||
Notes
(1) In October 2012, TVA entered into an arrangement with Mr. Johnson that provides a lump-sum payment equal to one year's annual salary and one year's executive annual incentive based on 100 percent target payout in the event TVA terminates his employment without cause. For purposes of this provision, termination without cause includes constructive termination which will be deemed to occur if Mr. Johnson terminates his employment because he is asked to take a new position with TVA with a material reduction in level of authority, duties, compensation, and benefits. This provision will not apply, and no lump-sum payment will be made, in the event Mr. Johnson voluntarily terminates his employment or voluntarily retires, or his employment is terminated “for cause” as defined in the agreement.
(2) In December 2016, the TVA Board approved amendments to Mr. Johnson’s compensation arrangements that, among other things, provide that in the event of termination for cause or voluntary termination for any reason after five years of actual service but prior to six years of actual service, Mr. Johnson’s SERP benefit will be calculated based on his actual years of service plus five credited years.
(3) In December 2016, the TVA Board approved amendments to Mr. Johnson’s compensation arrangements that, among other things, provide that in the event of involuntary termination without cause after five years of actual service but prior to six years of actual service, Mr. Johnson’s SERP benefit will be calculated based on the number of actual years of service plus six credited years.
(4) In the event of death while employed by TVA, the beneficiary will receive a lump sum payment equal to the actuarial equivalent of the benefit that would have been paid had the participant terminated employment on the date of death and elected a joint and 50 percent survivor benefit. Survivor will receive 50 percent of the reported value.
(5) The LTIP provides that in the event of the death of a participant, the participant’s beneficiary is entitled to any portion of a LTR award that had vested at the time of the participant’s death but not been paid as well as a prorated portion of any LTR grant that had not vested at the time of the participant’s separation from service, provided that the LTR award for each vesting period will be prorated based on the number of whole months the participant was employed by TVA during the vesting period in which the participant separated from service as compared to (a) 12 months for the vesting period that includes the day that the participant separated from service, (b) 24 months for the vesting period that immediately follows the vesting period during which the participant separated from service, and (c) 36 months for the second vesting period that follows the vesting period during which the participant separated from service.
(6) The LTIP provides that if a participant separates from service due to a disability, the participant is entitled to any portion of a LTR award that had vested at the time of the separation from service but not been paid as well as a prorated portion of any LTR grant that had not vested at the time of the participant’s separation from service, provided that the LTR award will be prorated based on the number of whole months the participant was employed by TVA during the vesting period in which the participant separated from service as compared to (a) 12 months for the vesting period that includes the day that the participant separated from service, (b) 24 months for the vesting period that immediately follows the vesting period during which the participant separated from service, and (c) 36 months for the second vesting period that follows the vesting period during which the participant separated from service.
(7) The LTIP provides that in the event of the death of a participant, the participant’s beneficiary is entitled to (1) any LTP award that had vested at the time of the participant’s death but not been paid and (2) any LTP awards that had not vested at the time of the participant’s death and that covered a performance cycle for which the participant had received a LTP grant, provided that the amount of any such LTP award (a) will be calculated assuming that the percent of opportunity achieved is 100 percent of target and (b) will be prorated based on the number of whole months the participant was participating in the plan during the applicable performance cycle.
(8) The LTIP provides that if a participant separates from service due to a disability, the participant is entitled to (1) any LTP award that had vested at the time of the participant’s separation from service but not been paid and (2) any LTP awards that had not vested at the time of the participant’s separation from service and that covered a performance cycle for which the participant had received a LTP grant, provided that the amount of any such LTP award (a) will be calculated assuming that the percent of opportunity achieved is 100 percent of target and (b) will be prorated based on the number of whole months the participant was employed by TVA during the applicable performance cycle.
170
|
John M. Thomas, III
|
Retirement/Resignation
|
Termination without Cause
|
Termination with Cause
|
Death
|
Disability
|
|||||||||||||||
|
Severance Agreement
(1)
|
$
|
—
|
|
$
|
—
|
|
$
|
—
|
|
$
|
—
|
|
$
|
—
|
|
|||||
|
SERP
|
2,672,592
|
|
(2)
(3) (4) |
2,672,592
|
|
(2)
(3)
(4)
|
2,672,592
|
|
(2)
(3)
(4)
|
2,672,592
|
|
(2)
(5)
|
2,672,592
|
|
(2)(3)
|
|||||
|
EAIP
|
653,452
|
|
653,452
|
|
653,452
|
|
653,452
|
|
653,452
|
|
||||||||||
|
LTR
|
266,666
|
|
266,666
|
|
266,666
|
|
405,556
|
|
(6)
|
405,556
|
|
(7)
|
||||||||
|
LTP
|
772,200
|
|
772,200
|
|
772,200
|
|
1,555,533
|
|
(8)
|
1,555,533
|
|
(9)
|
||||||||
|
Deferred Compensation
|
—
|
|
—
|
|
—
|
|
—
|
|
—
|
|
||||||||||
|
Total Value of Potential Payments
|
4,364,910
|
|
4,364,910
|
|
4,364,910
|
|
5,287,133
|
|
5,287,133
|
|
||||||||||
Notes
(1) Mr. Thomas does not have a severance agreement with TVA.
(2) Represents the present value of the accumulated benefit.
(3) Actual benefit would be paid in five annual installments beginning at age 55.
(4) Assumes that the TVA Board or its delegate determines that the termination is an approved termination under SERP. See
Retirement and Pension Plans
—
Supplemental Executive Retirement Plan
above for a discussion of approved and unapproved terminations under SERP.
(5) In the event of death while employed by TVA, the beneficiary would receive a lump sum payment equal to the actuarial equivalent of the benefit that would have been paid had the participant terminated employment on the date of death and elected a joint and 50 percent survivor benefit. Survivor will receive 50 percent of the reported value.
(6) The LTIP provides that in the event of the death of a participant, the participant’s beneficiary is entitled to any portion of a LTR award that had vested at the time of the participant’s death but not been paid as well as a prorated portion of any LTR grant that had not vested at the time of the participant’s separation from service, provided that the LTR award for each vesting period will be prorated based on the number of whole months the participant was employed by TVA during the vesting period in which the participant separated from service as compared to (a) 12 months for the vesting period that includes the day that the participant separated from service, (b) 24 months for the vesting period that immediately follows the vesting period during which the participant separated from service, and (c) 36 months for the second vesting period that follows the vesting period during which the participant separated from service.
(7) The LTIP provides that if a participant separates from service due to a disability, the participant is entitled to any portion of a LTR award that had vested at the time of the separation from service but not been paid as well as a prorated portion of any LTR grant that had not vested at the time of the participant’s separation from service, provided that the LTR award will be prorated based on the number of whole months the participant was employed by TVA during the vesting period in which the participant separated from service as compared to (a) 12 months for the vesting period that includes the day that the participant separated from service, (b) 24 months for the vesting period that immediately follows the vesting period during which the participant separated from service, and (c) 36 months for the second vesting period that follows the vesting period during which the participant separated from service.
(8) The LTIP provides that in the event of the death of a participant, the participant’s beneficiary is entitled to (1) any LTP award that had vested at the time of the participant’s death but not been paid and (2) any LTP awards that had not vested at the time of the participant’s death and that covered a performance cycle for which the participant had received a LTP grant, provided that the amount of any such LTP award (a) will be calculated assuming that the percent of opportunity achieved is 100 percent of target and (b) will be prorated based on the number of whole months the participant was participating in the plan during the applicable performance cycle.
(9) The LTIP provides that if a participant separates from service due to a disability, the participant is entitled to (1) any LTP award that had vested at the time of the participant’s separation from service but not been paid and (2) any LTP awards that had not vested at the time of the participant’s separation from service and that covered a performance cycle for which the participant had received a LTP grant, provided that the amount of any such LTP award (a) will be calculated assuming that the percent of opportunity achieved is 100 percent of target and (b) will be prorated based on the number of whole months the participant was employed by TVA during the applicable performance cycle.
171
|
Joseph P. Grimes, Jr.
|
Retirement/Resignation
|
Termination without Cause
|
Termination with Cause
|
Death
|
Disability
|
|||||||||||||||
|
Severance Agreement
(1)
|
$
|
—
|
|
$
|
669,500
|
|
$
|
—
|
|
$
|
—
|
|
$
|
—
|
|
|||||
|
SERP
|
1,280,299
|
|
(2)
(3)
|
1,280,299
|
|
(2)
(3)
|
1,280,299
|
|
(2)
(3)
|
1,280,299
|
|
(2)
(4)
|
1,280,299
|
|
(2)
|
|||||
|
EAIP
|
696,280
|
|
696,280
|
|
696,280
|
|
696,280
|
|
696,280
|
|
||||||||||
|
LTR
|
281,666
|
|
281,666
|
|
281,666
|
|
415,277
|
|
(5)
|
415,277
|
|
(6)
|
||||||||
|
LTP
|
810,000
|
|
810,000
|
|
810,000
|
|
1,585,000
|
|
(7)
|
1,585,000
|
|
(8)
|
||||||||
|
Deferred Compensation
(9)
|
669,392
|
|
669,392
|
|
669,392
|
|
669,392
|
|
669,392
|
|
||||||||||
|
Total Value of Potential Payments
|
3,737,637
|
|
4,407,137
|
|
3,737,637
|
|
4,646,248
|
|
4,646,248
|
|
||||||||||
Notes
(1) In June 2013, TVA entered into an arrangement with Mr. Grimes that provides a lump sum payment equal to one year's annual salary in the event TVA terminates Mr. Grimes' employment without cause.
(2) Represents the present value of the accumulated benefit.
(3) Assumes that the TVA Board or its delegate determines that the termination is an approved termination under SERP. See
Retirement and Pension Plans
—
Supplemental Executive Retirement Plan
above for a discussion of approved and unapproved terminations under SERP.
(4) In the event of death while employed by TVA, the beneficiary would receive a lump sum payment equal to the actuarial equivalent of the benefit that would have been paid had the participant terminated employment on the date of death and elected a joint and 50 percent survivor benefit. Survivor will receive 50 percent of the reported value.
(5) The LTIP provides that in the event of the death of a participant, the participant’s beneficiary is entitled to any portion of a LTR award that had vested at the time of the participant’s death but not been paid as well as a prorated portion of any LTR grant that had not vested at the time of the participant’s separation from service, provided that the LTR award for each vesting period will be prorated based on the number of whole months the participant was employed by TVA during the vesting period in which the participant separated from service as compared to (a) 12 months for the vesting period that includes the day that the participant separated from service, (b) 24 months for the vesting period that immediately follows the vesting period during which the participant separated from service, and (c) 36 months for the second vesting period that follows the vesting period during which the participant separated from service.
(6) The LTIP provides that if a participant separates from service due to a disability, the participant is entitled to any portion of a LTR award that had vested at the time of the separation from service but not been paid as well as a prorated portion of any LTR grant that had not vested at the time of the participant’s separation from service, provided that the LTR award will be prorated based on the number of whole months the participant was employed by TVA during the vesting period in which the participant separated from service as compared to (a) 12 months for the vesting period that includes the day that the participant separated from service, (b) 24 months for the vesting period that immediately follows the vesting period during which the participant separated from service, and (c) 36 months for the second vesting period that follows the vesting period during which the participant separated from service.
(7) The LTIP provides that in the event of the death of a participant, the participant’s beneficiary is entitled to (1) any LTP award that had vested at the time of the participant’s death but not been paid and (2) any LTP awards that had not vested at the time of the participant’s death and that covered a performance cycle for which the participant had received a LTP grant, provided that the amount of any such LTP award (a) will be calculated assuming that the percent of opportunity achieved is 100 percent of target and (b) will be prorated based on the number of whole months the participant was participating in the plan during the applicable performance cycle.
(8) The LTIP provides that if a participant separates from service due to a disability, the participant is entitled to (1) any LTP award that had vested at the time of the participant’s separation from service but not been paid and (2) any LTP awards that had not vested at the time of the participant’s separation from service and that covered a performance cycle for which the participant had received a LTP grant, provided that the amount of any such LTP award (a) will be calculated assuming that the percent of opportunity achieved is 100 percent of target and (b) will be prorated based on the number of whole months the participant was employed by TVA during the applicable performance cycle.
(9) Amounts that Mr. Grimes earned in past years but elected to defer, which are payable pursuant to elections he made and applicable IRS rules.
172
|
Michael D. Skaggs
|
Retirement/Resignation
|
Termination without Cause
|
Termination with Cause
|
Death
|
Disability
|
|||||||||||||||
|
Severance Agreement
(1)
|
$
|
—
|
|
$
|
—
|
|
$
|
—
|
|
$
|
—
|
|
$
|
—
|
|
|||||
|
SERP
|
4,413,597
|
|
(2)
(3)
(4)
|
4,413,597
|
|
(2)
(3)
(4)
|
4,413,597
|
|
(2)
(3) (4) |
4,413,597
|
|
(2)
(5)
|
4,413,597
|
|
(2)
(3)
|
|||||
|
EAIP
|
540,800
|
|
540,800
|
|
540,800
|
|
540,800
|
|
540,800
|
|
||||||||||
|
LTR
|
233,333
|
|
233,333
|
|
233,333
|
|
358,333
|
|
(6)
|
358,333
|
|
(7)
|
||||||||
|
LTP
|
648,000
|
|
648,000
|
|
648,000
|
|
1,398,000
|
|
(8)
|
1,398,000
|
|
(9)
|
||||||||
|
Deferred Compensation
(10)
|
4,774,993
|
|
4,774,993
|
|
4,774,993
|
|
4,774,993
|
|
4,774,993
|
|
||||||||||
|
Total Value of Potential Payments
|
10,610,723
|
|
10,610,723
|
|
10,610,723
|
|
11,485,723
|
|
11,485,723
|
|
||||||||||
Notes
(1) Mr. Skaggs does not have a severance agreement with TVA.
(2) Represents the present value of the accumulated benefit.
(3) Actual benefit would be paid in ten annual installments beginning on the date of Mr. Skaggs' separation from service.
(4) Assumes that the TVA Board or its delegate determines that the termination is an approved termination under SERP. See
Retirement and Pension Plans
—
Supplemental Executive Retirement Plan
above for a discussion of approved and unapproved terminations under SERP.
(5) In the event of death while employed by TVA, the beneficiary would receive a lump sum payment equal to the actuarial equivalent of the benefit that would have been paid had the participant terminated employment on the date of death and elected a joint and 50 percent survivor benefit. Survivor will receive 50 percent of the reported value.
(6) The LTIP provides that in the event of the death of a participant, the participant’s beneficiary is entitled to any portion of a LTR award that had vested at the time of the participant’s death but not been paid as well as a prorated portion of any LTR grant that had not vested at the time of the participant’s separation from service, provided that the LTR award for each vesting period will be prorated based on the number of whole months the participant was employed by TVA during the vesting period in which the participant separated from service as compared to (a) 12 months for the vesting period that includes the day that the participant separated from service, (b) 24 months for the vesting period that immediately follows the vesting period during which the participant separated from service, and (c) 36 months for the second vesting period that follows the vesting period during which the participant separated from service.
(7) The LTIP provides that if a participant separates from service due to a disability, the participant is entitled to any portion of a LTR award that had vested at the time of the separation from service but not been paid as well as a prorated portion of any LTR grant that had not vested at the time of the participant’s separation from service, provided that the LTR award will be prorated based on the number of whole months the participant was employed by TVA during the vesting period in which the participant separated from service as compared to (a) 12 months for the vesting period that includes the day that the participant separated from service, (b) 24 months for the vesting period that immediately follows the vesting period during which the participant separated from service, and (c) 36 months for the second vesting period that follows the vesting period during which the participant separated from service.
(8) The LTIP provides that in the event of the death of a participant, the participant’s beneficiary is entitled to (1) any LTP award that had vested at the time of the participant’s death but not been paid and (2) any LTP awards that had not vested at the time of the participant’s death and that covered a performance cycle for which the participant had received a LTP grant, provided that the amount of any such LTP award (a) will be calculated assuming that the percent of opportunity achieved is 100 percent of target and (b) will be prorated based on the number of whole months the participant was participating in the plan during the applicable performance cycle.
(9) The LTIP provides that if a participant separates from service due to a disability, the participant is entitled to (1) any LTP award that had vested at the time of the participant’s separation from service but not been paid and (2) any LTP awards that had not vested at the time of the participant’s separation from service and that covered a performance cycle for which the participant had received a LTP grant, provided that the amount of any such LTP award (a) will be calculated assuming that the percent of opportunity achieved is 100 percent of target and (b) will be prorated based on the number of whole months the participant was employed by TVA during the applicable performance cycle.
(10) Amounts that Mr. Skaggs earned in past years but elected to defer, which are payable pursuant to elections he made and applicable IRS rules.
173
|
Sherry A. Quirk
|
Retirement/Resignation
|
Termination without Cause
|
Termination with Cause
|
Death
|
Disability
|
|||||||||||||||
|
Severance Agreement
(1)
|
$
|
—
|
|
$
|
510,000
|
|
$
|
—
|
|
$
|
—
|
|
$
|
—
|
|
|||||
|
SERP
|
—
|
|
(2)
|
—
|
|
(2)
|
—
|
|
(2)
|
348,058
|
|
(3)
(4) |
348,058
|
|
(3)
|
|||||
|
EAIP
|
464,100
|
|
464,100
|
|
464,100
|
|
464,100
|
|
464,100
|
|
||||||||||
|
LTR
|
220,000
|
|
220,000
|
|
220,000
|
|
336,667
|
|
(5)
|
336,667
|
|
(6)
|
||||||||
|
LTP
|
604,800
|
|
604,800
|
|
604,800
|
|
1,279,800
|
|
(7)
|
1,279,800
|
|
(8)
|
||||||||
|
Deferred Compensation
|
—
|
|
—
|
|
—
|
|
—
|
|
—
|
|
||||||||||
|
Total Value of Potential Payments
|
1,288,900
|
|
1,798,900
|
|
1,288,900
|
|
2,428,625
|
|
2,428,625
|
|
||||||||||
Notes
(1) In December 2014, TVA entered into an arrangement with Ms. Quirk that provides a lump-sum payment equal to one year's annual salary in the event TVA terminates her employment without cause.
(2) The five-year vesting requirement has not been met.
(3) Represents the present value of the accumulated benefit.
(4) In the event of death while employed by TVA, the beneficiary would receive a lump sum payment equal to the actuarial equivalent of the benefit that would have been paid had the participant terminated employment on the date of death and elected a joint and 50 percent survivor benefit. Survivor will receive 50 percent of the reported value.
(5) The LTIP provides that in the event of the death of a participant, the participant’s beneficiary is entitled to any portion of a LTR award that had vested at the time of the participant’s death but not been paid as well as a prorated portion of any LTR grant that had not vested at the time of the participant’s separation from service, provided that the LTR award for each vesting period will be prorated based on the number of whole months the participant was employed by TVA during the vesting period in which the participant separated from service as compared to (a) 12 months for the vesting period that includes the day that the participant separated from service, (b) 24 months for the vesting period that immediately follows the vesting period during which the participant separated from service, and (c) 36 months for the second vesting period that follows the vesting period during which the participant separated from service.
(6) The LTIP provides that if a participant separates from service due to a disability, the participant is entitled to any portion of a LTR award that had vested at the time of the separation from service but not been paid as well as a prorated portion of any LTR grant that had not vested at the time of the participant’s separation from service, provided that the LTR award will be prorated based on the number of whole months the participant was employed by TVA during the vesting period in which the participant separated from service as compared to (a) 12 months for the vesting period that includes the day that the participant separated from service, (b) 24 months for the vesting period that immediately follows the vesting period during which the participant separated from service, and (c) 36 months for the second vesting period that follows the vesting period during which the participant separated from service.
(7) The LTIP provides that in the event of the death of a participant, the participant’s beneficiary is entitled to (1) any LTP award that had vested at the time of the participant’s death but not been paid and (2) any LTP awards that had not vested at the time of the participant’s death and that covered a performance cycle for which the participant had received a LTP grant, provided that the amount of any such LTP award (a) will be calculated assuming that the percent of opportunity achieved is 100 percent of target and (b) will be prorated based on the number of whole months the participant was participating in the plan during the applicable performance cycle.
(8) The LTIP provides that if a participant separates from service due to a disability, the participant is entitled to (1) any LTP award that had vested at the time of the participant’s separation from service but not been paid and (2) any LTP awards that had not vested at the time of the participant’s separation from service and that covered a performance cycle for which the participant had received a LTP grant, provided that the amount of any such LTP award (a) will be calculated assuming that the percent of opportunity achieved is 100 percent of target and (b) will be prorated based on the number of whole months the participant was employed by TVA during the applicable performance cycle.
Other Agreements
Except as described above and in the Compensation Discussion and Analysis, there are no other agreements between TVA and any of the Named Executive Officers.
CEO Pay Ratio Disclosure
As required by Section 953(b) of the Dodd-Frank Wall Street Reform and Consumer Protection Act of 2010 and Item 402(u) of Regulation S-K, TVA is providing the following information regarding the annual total compensation of TVA’s CEO, Mr. Johnson, and the annual total compensation of the median employee of the company:
|
•
|
For 2018, Mr. Johnson’s annual total compensation was $8,114,638.
|
|
•
|
For 2018, the median employee's annual total compensation was $129,786.
|
Based on this information, the pay ratio of the annual total compensation of Mr. Johnson to the median employee was approximately 63 to 1.
174
To identify the median employee and to determine the annual total compensation of the median employee and Mr. Johnson, TVA took the following steps:
|
•
|
TVA selected September 30, 2018 as the date on which to identify its median employee. On September 30, 2018, TVA’s employee population (including full-time, part-time, and temporary employees) consisted of 9,980 individuals located in the U.S.
|
|
•
|
In order to identify the median employee from its employee population, TVA compared the compensation that would be included in Box 5 (Medicare Wages and Tips) of Form W-2, which includes salary, overtime, and incentive compensation, for the period from October 1, 2017 to September 30, 2018. Box 5 compensation was used as it is representative of the compensation received by all employees and is readily available and objective.
|
|
•
|
After identifying its median employee, TVA calculated that employee’s compensation for 2018 as though that compensation were being calculated for purposes of the Summary Compensation Table, resulting in annual total compensation of $129,786.
|
|
•
|
With respect to the annual total compensation for Mr. Johnson, TVA used the amount reported in the “Total” column of the Summary Compensation Table for 2018.
|
The above pay ratio is a reasonable estimate calculated in a manner consistent with Item 402(u) of Regulation S-K. Because Item 402(u) provides companies with flexibility to select the methodology and assumptions used to identify the median employee and to calculate the pay ratio, the pay ratio reported by TVA may not be comparable to the pay ratios reported by other companies.
Director Compensation
The TVA Act provides for up to nine directors on the TVA Board. As of November 14, 2018, the TVA Board consisted of eight members. A nomination for the ninth member has been made, but the nominee has not been confirmed. Under the TVA Act, each director receives certain stipends that are increased annually by the same percentage increase applicable to adjustments under 5 U.S.C. § 5318, which adjusts the annual rates of pay of employees on the Executive Schedule of the U.S. Government. On January 1, 2018, the annual stipend for TVA directors was increased to $51,974 per year unless (1) the director chairs a TVA Board committee, in which case the stipend was increased to $53,003 per year, or (2) the director is the Chair of the TVA Board, in which case the stipend was increased to $57,840 per year. Directors are also reimbursed under federal law for travel, lodging, and related expenses while attending meetings and for other official TVA business.
The annual stipends provided by the TVA Act for each director and for the Chair of the TVA Board as of November 14, 2018, are listed below:
|
TVA Board Annual Stipends
|
||||
|
Name
|
Annual Stipend
|
|||
|
Kenneth E. Allen
|
$
|
51,974
|
|
|
|
A. D. Frazier
|
51,974
|
|
||
|
Richard C. Howorth
|
57,840
|
|
||
|
Virginia T. Lodge
|
53,003
|
|
||
|
Eric M. Satz
|
53,003
|
|
||
|
Jeff W. Smith
|
53,003
|
|
||
|
James R. Thompson, III
|
53,003
|
|
||
|
Ronald A. Walter
|
53,003
|
|
||
175
The following table provides information on the compensation received by TVA’s directors during
2018
:
|
Director Compensation
|
|||||||||||||
|
Name
|
Fees Earned or Paid in Cash
|
Stock
Awards
|
Option
Awards
|
Non-Equity
Incentive Plan
Compensation
|
Change in
Pension Value
and
Nonqualified
Deferred
Compensation
Earnings
(1)
|
All Other Compensation
(2)
|
Total
|
||||||
|
Kenneth E. Allen
|
$
|
37,381
|
|
—
|
—
|
—
|
—
|
$
|
374
|
|
$
|
37,755
|
|
|
A. D. Frazier
|
37,742
|
|
—
|
—
|
—
|
—
|
1,808
|
|
39,550
|
|
|||
|
Richard C. Howorth
|
57,612
|
|
—
|
—
|
—
|
—
|
2,988
|
|
60,600
|
|
|||
|
Virginia T. Lodge
|
52,814
|
|
—
|
—
|
—
|
—
|
2,738
|
|
55,552
|
|
|||
|
Eric M. Satz
|
52,794
|
|
—
|
—
|
—
|
—
|
2,738
|
|
55,532
|
|
|||
|
Jeff W. Smith
|
38,102
|
|
—
|
—
|
—
|
—
|
1,715
|
|
39,817
|
|
|||
|
James R. Thompson, III
|
37,902
|
|
—
|
—
|
—
|
—
|
379
|
|
38,281
|
|
|||
|
Ronald A. Walter
|
52,794
|
|
—
|
—
|
—
|
—
|
548
|
|
53,342
|
|
|||
Notes
(1) TVA directors do not participate in the TVARS, TVA's SERP, or any non-qualified deferred compensation plan available to TVA employees. However, as appointed officers of the U.S. government, the directors are members of FERS. FERS is administered by the federal Office of Personnel Management, and information regarding the value of FERS pension benefits is not available to TVA.
(2) These amounts include TVA's non-elective and matching contributions to the TSP.
The directors are not eligible to participate in any incentive programs available to TVA employees. The directors do not participate in the TVARS and do not participate in TVA's SERP. However, as appointed officers of the U.S. government, the directors are members of the
Federal Employees Retirement System ("FERS")
. FERS is a tiered retirement plan that includes three components: (1) Social Security benefits, (2) the Basic Benefit Plan, and (3) the
Thrift Savings Plan ("TSP")
. As members of FERS, each director is required to make a mandatory small percentage contribution of his or her stipend to the Basic Benefit Plan in the amount of 0.8 percent for those directors appointed prior to January 1, 2013, 3.1 percent for those directors appointed between January 1, 2013, and December 31, 2013, and 4.4 percent for those directors appointed on or after January 1, 2014.
The FERS Basic Benefit Plan is a qualified defined benefit plan that provides a retirement benefit based on a final average pay formula that includes age, highest average salary during any three consecutive years of service, and years of creditable service. A director must have at least five years of creditable service to be eligible to receive retirement benefits. Directors are eligible for immediate, unreduced retirement benefits once (1) they reach age 62 and have five years of FERS creditable service, (2) they reach age 60 and have 20 years of FERS creditable service, or (3) they attain the minimum retirement age and accumulate the specified years of service as set forth in the FERS regulations. Generally, benefits are calculated by multiplying 1.0 percent of the highest average salary during any three consecutive years of service by the number of years of creditable service. Directors who retire at age 62 or later with at least 20 years of FERS creditable service receive an enhanced benefit (a factor of 1.1 percent is used rather than 1.0 percent).
Directors may also retire with an immediate benefit under FERS if they reach their minimum retirement age based on type of retirement and years of service and have accumulated at least 10 years of FERS creditable service. For directors who reach the minimum retirement age and have at least 10 years of FERS creditable service, the annuity will be reduced by five percent for each year the director is under age 62.
Each director is also eligible to participate in the TSP. The TSP is a tax-deferred retirement savings and investment plan that offers the same type of savings and tax benefits offered under 401(k) plans. Once a director becomes eligible, TVA contributes an amount equal to one percent of the director's stipend into a TSP account for the director. These contributions are made automatically every two weeks regardless of whether the director makes a contribution of his or her own money. Directors are eligible to contribute up to the IRS elective deferral limit. Directors receive matching contributions of 100 percent of each dollar for the first three percent of the director's stipend and 50 percent of each dollar for the next two percent of the director's stipend.
TVA offers a group of health and other benefits (medical, dental, vision, life and accidental death and disability insurance, and long-term disability insurance) that are available to a broad group of employees. Directors are eligible to participate in TVA's health benefit plans and other non-retirement benefit plans on the same terms and at the same contribution rates as other TVA employees.
176
Compensation Committee Interlocks and Insider Participation
The People and Performance Committee of the TVA Board currently consists of the following three directors: Virginia T. Lodge, Ronald A. Walter, and James R. Thompson, III.
No executive officer of TVA serves on the board of an entity that has an executive officer serving as a director of TVA.
Compensation Committee Report
The People and Performance Committee has reviewed and discussed the Compensation Discussion and Analysis with management, and based on the review and discussions, the Committee recommended to the TVA Board that the Compensation Discussion and Analysis be included in this Annual Report.
PEOPLE AND PERFORMANCE COMMITTEE
Virginia T. Lodge, Chair
Ronald A. Walter
James R. Thompson, III
Not applicable.
Director Independence
The composition of the TVA Board is governed by the TVA Act. The TVA Act contains certain provisions that are similar to the considerations for independence under section 10A(m)(3) of the Exchange Act, including that to be eligible for appointment to the TVA Board, an individual shall not be an employee of TVA and shall make full disclosure to Congress of any investment or other financial interest that the individual holds in the energy industry.
Related Party Transactions
Conflict of Interest Provisions
All TVA employees, including directors and executive officers, are subject to the conflict of interest laws and regulations applicable to employees of the federal government. Accordingly, the general federal conflict of interest statute (18 U.S.C. § 208) and the
Standards of Ethical Conduct for Employees of the Executive Branch (5 C.F.R. part 2635) ("Standards of Ethical Conduct")
form the basis of TVA’s policies and procedures for the review, approval, or ratification of related party transactions. The general federal conflict of interest statute, subject to certain exceptions, prohibits each government employee, including TVA’s directors and executive officers, from participating personally and substantially (by advice, decision, or otherwise) as a government employee in any contract, controversy, proceeding, request for determination, or other particular matter in which, to his or her knowledge, he or she (or his or her spouse, minor child, general partner, organization with which he or she serves as officer, director, employee, trustee, or general partner, or any person or organization with which he or she is negotiating, or has an arrangement, for future employment) has a financial interest. Exceptions to the statutory prohibition relevant to TVA employees are (1) financial interests which have been deemed by the U.S. Office of Government Ethics, in published regulations, to be too remote or inconsequential to affect the integrity of the employee’s services, or (2) interests which are determined in writing, after full disclosure and on a case-by-case basis, to be not so substantial as to be deemed likely to affect the integrity of the employee’s services for TVA. In accordance with the statute, individual waiver determinations are made by the official responsible for the employee’s appointment. In the case of TVA directors, the determination may be made by the Chair of the TVA Board, and in the case of the Chair of the TVA Board, the determination may be made by the Counsel to the President of the U.S.
More broadly, Subpart E of the Standards of Ethical Conduct provides that where an employee (1) knows that a particular matter involving specific parties is likely to have a direct and predictable effect on the financial interests of a member of his or her household, or that a person with whom the employee has a “covered relationship” (which includes, but is not limited to, persons with whom the employee has a close family relationship and organizations in which the employee is an active participant) is or represents a party to the matter, and (2) determines that the circumstances would cause a reasonable person with knowledge of relevant facts to question his or her impartiality in the matter, the employee should not participate in the matter absent agency authorization. This authorization may be given by the employee’s supervising officer, as agency designee, in consultation with the TVA Designated Agency Ethics Official, upon the determination that TVA’s interest in the employee’s participation in the matter outweighs the concern that a reasonable person may question the integrity of TVA’s programs and operations.
177
The previously described restrictions are reflected in TVA’s policies which require employees, including directors and executive officers, to comply with the guidelines outlined in the Standards of Ethical Conduct and which restate the standard of the conflict of interest statute.
Additionally, the TVA Board approved a written conflict of interest policy that applies to all TVA employees, including TVA’s directors and executive officers. The conflict of interest policy reaffirms the requirement that all TVA employees must comply with applicable federal conflict of interest laws, regulations, and policies. It also establishes an additional policy that is applicable to TVA's directors and CEO. This additional policy provides that TVA's directors and CEO shall not hold a financial interest in (1) any distributor of TVA power, (2) any entity engaged primarily in the wholesale or retail generation, transmission, or sale of electricity, except where substantially all such business is conducted outside of North America, or (3) any entity that may reasonably be perceived as likely to be adversely affected by the success of TVA as a producer or transmitter of electric power. Any waiver of this additional policy may be made only by the TVA Board and will be disclosed promptly to the public, subject to the limitations on disclosure imposed by law.
TVA also has a protocol titled the
"Obtaining Things of Value from TVA Protocol"
(the “Protocol”). The Protocol describes what a TVA employee should do if a person covered by the Protocol asks for assistance in obtaining a specified thing of value from TVA. Similarly, the TVA Board Practice on External Inquiries describes what a member of the TVA Board should do if a person covered by the practice asks for assistance in obtaining a specified thing of value from TVA.
TVA relies on the policies, practices, laws, and regulations discussed above to regulate conflicts of interest involving employees, including directors and executive officers. TVA has no other written or unwritten policy for the approval or ratification of any transactions in which TVA was or is to be a participant and in which any director or executive officer of TVA (or any child, stepchild, parent, stepparent, spouse, sibling, mother-in-law, father-in-law, son-in-law, daughter-in-law, brother-in-law, or sister-in-law of any director or executive officer of TVA) had or will have a direct or indirect material interest.
Other Relationships
TVA is engaged in a number of transactions with other agencies of the U.S. government, although such agencies do not fall within the definition of “related parties” for purposes of Item 404(a) of Regulation S-K. These include, among other things, supplying electricity to other federal agencies, purchasing electricity from the Southeastern Power Administration, and engaging in various arrangements involving nuclear materials with the
Department of Energy ("DOE")
. See Item 1, Business and
Note 22
.
TVA also has access to a financing arrangement with the U.S. Treasury. TVA and the U.S. Treasury have a memorandum of understanding under which the U.S. Treasury provides TVA with a $150 million credit facility. There were no outstanding borrowings under the facility at
September 30, 2018
. This credit facility matures on September 30, 2019, and is expected to be renewed. This arrangement is pursuant to the TVA Act. Access to this credit facility or other similar financing arrangements with the U.S. Treasury has been available to TVA since the 1960s. See
Note 13
—
Credit Facility Agreements
.
In addition, TVA is required by the 1959 amendment to the TVA Act to make annual payments to the U.S. Treasury from net power proceeds as a repayment of and as a return on the
payments to the U.S. Treasury in repayment of and as a return on the government's appropriation investment in TVA's power facilities (the "Power Program Appropriation Investment")
until $
1.0 billion
of the Power Program Appropriation Investment has been repaid. With the 2014 payment, TVA fulfilled its requirement to repay $
1.0 billion
of the Power Program Appropriation Investment. The TVA Act requires TVA to continue to make payments to the U.S. Treasury indefinitely as a return on the remaining $
258 million
of the Power Program Appropriation Investment. See
Note 17
—
Appropriation Investment
.
The TVA Act requires the proceeds for each fiscal year derived from the sale of power or any other activities to be paid into the U.S. Treasury on March 31 of each year, except for the portion of such proceeds as in the opinion of the TVA Board shall be necessary for TVA in the operation of dams and reservoirs and in conducting its business in generating, transmitting, and distributing electric energy. For each fiscal year, the TVA Board adopts a resolution retaining for use in the operation of the TVA power system the entire margin of net power proceeds remaining at the conclusion of such fiscal year.
178
The following table shows the fees of Ernst & Young LLP for audit, audit-related, and other services for the years ended
September 30, 2018
and
2017
.
|
Principal Accountant Fees and Services
(in actual dollars)
|
|||||||||||||||||
|
Year
|
Principal Accountant
|
Audit Fees
(1)
|
Audit-Related Fees
|
All Other Fees
|
Total
|
||||||||||||
|
2018
|
Ernst & Young LLP
|
$
|
2,798,575
|
|
$
|
—
|
|
—
|
|
$
|
2,798,575
|
|
|||||
|
2017
|
Ernst & Young LLP
|
2,688,826
|
|
—
|
|
—
|
|
2,688,826
|
|
||||||||
Note
(1) Audit fees consist of payments for professional services rendered in connection with the audit of TVA's annual financial statements, including the annual attestation on internal control over financial reporting and the review of interim financial statements included in TVA's quarterly reports; audit of TVA's fuel cost adjustment; audit of TVA's federal closing package for the preparation and audit of the 2018 and 2017 federal consolidated financial statements of which TVA is a component; Bond offering and other financing comfort letters; and accounting consultations related to TVA's adoption of the new revenue recognition and lease accounting standards.
The TVA Board has an Audit, Risk, and Regulation Committee ("Audit Committee"). Under the TVA Act, the Audit Committee, in consultation with the Inspector General, recommends to the TVA Board the selection of an external auditor. TVA’s Audit Committee, in consultation with the Inspector General, recommended that the TVA Board select Ernst & Young LLP as TVA’s external auditor for the
2018
and 2017 audits and other related services, and the TVA Board approved these recommendations.
TVA has a
policy
(the “Policy”) that requires all auditing services and permissible non-audit services provided by the external auditor to be pre-approved by the Audit Committee. The Policy also lists the following services as ones the external auditor is not permitted to perform:
|
•
|
Bookkeeping or other services related to the accounting records or financial statements of TVA;
|
|
•
|
Financial information system design and implementation;
|
|
•
|
Appraisal or valuation services, fairness opinions, and contribution-in-kind reports;
|
|
•
|
Actuarial services;
|
|
•
|
Internal audit outsourcing services;
|
|
•
|
Management functions or human resources;
|
|
•
|
Broker or dealer, investment adviser, or investment banking services;
|
|
•
|
Legal services and expert services unrelated to the audit; and
|
|
•
|
Any other services that the Public Company Accounting Oversight Board determines, by regulation, are impermissible.
|
The Policy also delegates to the Chair of the Audit Committee the authority to pre-approve a permissible service so long as the amount of the service does not exceed $100,000 and the total amount of services pre-approved during the year by the Chair does not exceed $200,000. The Chair must report for informational purposes the services pre-approved under this provision at the Audit Committee’s next meeting.
The Audit Committee pre-approved all audit services for
2018
and 2017.
179
(a) The following documents have been filed as part of this Annual Report:
|
(1)
|
Consolidated Financial Statements. The following documents are provided in Item 8, Financial Statements and
|
Supplementary Data herein:
Consolidated Statements of Operations
Consolidated Statements of Comprehensive Income (Loss)
Consolidated Balance Sheets
Consolidated Statements of Cash Flows
Consolidated Statements of Changes in Proprietary Capital
Notes to Consolidated Financial Statements
Report of Independent Registered Public Accounting Firm (Ernst & Young LLP)
(2) Consolidated Financial Statement Schedules.
Schedules not included are omitted because they are not required or because the required information is provided in the consolidated financial statements, including the notes thereto.
(3) List of Exhibits
|
Exhibit No.
|
Description
|
|
3.1
|
|
|
|
|
|
3.2
|
|
|
|
|
|
4.1
|
|
|
|
|
|
10.1
|
|
|
|
|
|
10.2
|
|
|
|
|
|
10.3
|
|
|
10.4
|
|
|
10.5
|
|
|
|
|
180
|
10.6
|
|
|
|
|
|
10.7
|
|
|
|
|
|
10.8
|
|
|
|
|
|
10.9
|
|
|
|
|
|
10.10
|
|
|
|
|
|
10.11
|
|
|
|
|
|
10.12
|
|
|
|
|
|
10.13
|
|
|
|
|
|
10.14
|
|
|
|
|
|
10.15
|
|
|
|
|
|
10.16
|
|
|
10.17
|
|
|
|
|
|
10.18*
|
|
|
10.19*
|
|
181
|
10.20*
|
|
|
|
|
|
10.21
|
|
|
10.22
|
|
|
10.23*
|
|
|
10.24
|
|
|
10.25
|
|
|
10.26*
|
|
|
|
|
|
10.27*
|
|
|
|
|
|
10.28†
|
|
|
|
|
|
10.29†
|
|
|
10.30†
|
|
|
10.31†
|
|
|
|
|
|
10.32†
|
|
|
|
|
|
10.33†
|
|
|
|
|
|
10.34†
|
|
|
10.35†
|
|
|
10.36†
|
|
|
10.37†
|
|
|
|
|
182
|
10.38†
|
|
|
|
|
|
10.39†
|
|
|
10.40†
|
|
|
10.41†
|
|
|
10.42†
|
|
|
10.43†
|
|
|
10.44†
|
|
|
10.45†
|
|
|
10.46†
|
|
|
10.47†
|
|
|
10.48†
|
|
|
14.1
|
|
|
|
|
|
14.2
|
|
|
31.1
|
|
|
|
|
|
31.2
|
|
|
|
|
|
32.1
|
|
|
|
|
|
32.2
|
|
|
|
|
|
101.INS
|
TVA XBRL Instance Document
|
|
|
|
|
101.SCH
|
TVA XBRL Taxonomy Extension Schema
|
|
101.CAL
|
TVA XBRL Taxonomy Extension Calculation Linkbase
|
183
|
101.DEF
|
TVA XBRL Taxonomy Extension Definition Linkbase
|
|
101.LAB
|
TVA XBRL Taxonomy Extension Label Linkbase
|
|
101.PRE
|
TVA XBRL Taxonomy Extension Presentation Linkbase
|
|
† Management contract or compensatory arrangement.
* Certain schedule(s) and/or exhibit(s) have been omitted. TVA hereby undertakes to furnish supplementally copies of any of the omitted schedules and/or exhibits upon request by the Securities and Exchange Commission.
|
|
Not applicable.
184
SIGNATURES
Pursuant to the requirements of Section 13, 15(d), or 37 of the Securities Exchange Act of 1934, the registrant has duly caused this report to be signed on its behalf by the undersigned, thereunto duly authorized.
|
Date:
|
November 14, 2018
|
|
TENNESSEE VALLEY AUTHORITY
|
|
|
|
(Registrant)
|
|
|
|
By:
|
/s/ William D. Johnson
|
|
|
|
|
William D. Johnson
|
|
|
|
|
President and Chief Executive Officer
|
|
SIGNATURES
Pursuant to the requirements of the Securities Exchange Act of 1934, this report has been signed below by the following persons on behalf of the registrant and in the capacities and on the dates indicated.
185
|
Signature
|
Title
|
Date
|
|
|
|
|
|
|
|
|
|
|
|
|
|
/s/ William D. Johnson
|
President and Chief Executive Officer
|
November 14, 2018
|
|
William D. Johnson
|
(Principal Executive Officer)
|
|
|
|
|
|
|
/s/ John M. Thomas, III
|
Executive Vice President and
|
November 14, 2018
|
|
John M. Thomas, III
|
Chief Financial Officer
|
|
|
|
(Principal Financial Officer)
|
|
|
|
|
|
|
/s/ Diane Wear
|
Vice President and Controller
|
November 14, 2018
|
|
Diane Wear
|
(Principal Accounting Officer)
|
|
|
|
|
|
|
/s/ Kenneth E. Allen
|
Director
|
November 14, 2018
|
|
Kenneth E. Allen
|
|
|
|
/s/ A.D. Frazier
|
Director
|
November 14, 2018
|
|
A. D. Frazier
|
|
|
|
|
|
|
|
|
|
|
|
/s/ Richard C. Howorth
|
Director
|
November 14, 2018
|
|
Richard C. Howorth
|
|
|
|
|
|
|
|
|
|
|
|
/s/ Virginia T. Lodge
|
Director
|
November 14, 2018
|
|
Virginia T. Lodge
|
|
|
|
|
|
|
|
|
|
|
|
/s/ Eric M. Satz
|
Director
|
November 14, 2018
|
|
Eric M. Satz
|
|
|
|
/s/ Jeff W. Smith
|
Director
|
November 14, 2018
|
|
Jeff W. Smith
|
|
|
|
/s/ James R. Thompson, III
|
Director
|
November 14, 2018
|
|
James R. Thompson, III
|
|
|
|
/s/ Ronald A. Walter
|
Director
|
November 14, 2018
|
|
Ronald A. Walter
|
|
|
186
TABLE OF CONTENTS
Part IItem 1. BusinessItem 1A. Risk FactorsItem 1B. Unresolved Staff CommentsItem 2. PropertiesItem 3. Legal ProceedingsItem 4. Mine Safety DisclosuresPart IIItem 5. Market For Registrant S Common Equity, Related Stockholder Matters and Issuer Purchases Of Equity SecuritiesItem 6. Selected Financial DataItem 7. Management S Discussion and Analysis Of Financial Condition and Results Of OperationsItem 1, BusinessItem 7A. Quantitative and Qualitative Disclosures About Market RiskItem 8. Financial Statements and Supplementary DataItem 9. Changes in and Disagreements with Accountants on Accounting and Financial DisclosureItem 9A. Controls and ProceduresItem 9B. Other InformationPart IIIItem 10. Directors, Executive Officers and Corporate GovernanceItem 11. Executive CompensationItem 12. Security Ownership Of Certain Beneficial Owners and Management and Related Stockholder MattersItem 13. Certain Relationships and Related Transactions, and Director IndependenceItem 14. Principal Accountant Fees and ServicesPart IVItem 15. Exhibits, Financial Statement SchedulesItem 16. Form 10-k Summary