UNDER ARMOUR, INC.
10-Ks and 10-Qs
|
|
|
|
|
|
|
|
|
|
|
|
|
|
|
|
|
|
|
|
|
|
|
|
|
|
|
|
|
|
|
|
|
|
|
|
|
|
|
|
|
|
|
|
|
|
|
|
|
|
|
|
|
|
|
|
|
|
|
|
|
|
UNITED STATES
SECURITIES AND EXCHANGE COMMISSION
Washington, D.C. 20549
______________________________________________
Form 10-K
______________________________________________
(Mark One)
|
þ
|
ANNUAL REPORT PURSUANT TO SECTION 13 OR 15(d) OF THE SECURITIES EXCHANGE ACT OF 1934
|
For the fiscal year ended
December 31, 2014
or
|
¨
|
TRANSITION REPORT PURSUANT TO SECTION 13 OR 15(d) OF THE SECURITIES EXCHANGE ACT OF 1934
|
For the transition period from to
Commission File No. 001-33202
_____________________________________________

UNDER ARMOUR, INC.
(Exact name of registrant as specified in its charter)
_____________________________________________
|
Maryland
|
52-1990078
|
|
|
(State or other jurisdiction of
incorporation or organization)
|
(I.R.S. Employer
Identification No.)
|
|
|
1020 Hull Street
Baltimore, Maryland 21230
|
(410) 454-6428
|
|
|
(Address of principal executive offices) (Zip Code)
|
(Registrant’s Telephone Number, Including Area Code)
|
|
Securities registered pursuant to Section 12(b) of the Act:
|
Class A Common Stock
|
|
New York Stock Exchange
|
|
(Title of each class)
|
|
(Name of each exchange on which registered)
|
Securities registered pursuant to Section 12(g) of the Act:
None
Indicate by check mark if the registrant is a well-known seasoned issuer, as defined in Rule 405 of the Securities Act. Yes
þ
No
¨
Indicate by check mark if the registrant is not required to file reports pursuant to Section 13 or Section 15(d) of the Act. Yes
¨
No
þ
Indicate by check mark whether the registrant (1) has filed all reports required to be filed by Section 13 or 15(d) of the Securities Exchange Act of 1934 during the preceding 12 months (or for such shorter period that the registrant was required to file such reports), and (2) has been subject to such filing requirements for the past 90 days. Yes
þ
No
¨
Indicate by check mark whether the registrant has submitted electronically and posted on its corporate Web site, if any, every Interactive Data File required to be submitted and posted pursuant to Rule 405 of Regulation S-T (§229.405 of this chapter) during the preceding 12 months (or for such shorter period that the registrant was required to submit and post such files. Yes
þ
No
¨
Indicate by check mark if the disclosure of delinquent filers pursuant to Item 405 or Regulation S-K (§229.405 of this chapter) is not contained herein, and will not be contained, to the best of registrant’s knowledge, in definitive proxy or information statements incorporated by reference in Part III of this Form 10-K or any amendment to this Form 10-K.
¨
Indicate by check mark whether the registrant is a large accelerated filer, an accelerated filer, a non-accelerated filer, or a smaller reporting company. See definitions of “large accelerated filer,” “accelerated filer,” and “smaller reporting company” in Rule 12b-2 of the Exchange Act.
|
Large accelerated filer
þ
|
Accelerated filer
¨
|
|
|
Non-accelerated filer
¨
(Do not check if a smaller reporting company)
|
Smaller reporting company
¨
|
|
Indicate by check mark whether the registrant is a shell company (as defined in Rule 12b-2 of the Act). Yes
¨
No
þ
As of
June 30, 2014
, the last business day of our most recently completed second fiscal quarter, the aggregate market value of the registrant’s Class A Common Stock held by non-affiliates was $
10,314,358,804
.
As of
January 31, 2015
, there were
177,312,580
shares of Class A Common Stock and
36,600,000
shares of Class B Convertible Common Stock outstanding.
DOCUMENTS INCORPORATED BY REFERENCE
Portions of Under Armour, Inc.’s Proxy Statement for the Annual Meeting of Stockholders to be held on
April 29, 2015
are incorporated by reference in Part III of this Form 10-K.
UNDER ARMOUR, INC.
ANNUAL REPORT ON FORM 10-K
TABLE OF CONTENTS
|
Item 1.
|
|||
|
Item 1A.
|
|||
|
Item 1B.
|
|||
|
Item 2.
|
|||
|
Item 3.
|
|||
|
Item 4.
|
|||
|
Item 5.
|
|||
|
Item 6.
|
|||
|
Item 7.
|
|||
|
Item 7A.
|
|||
|
Item 8.
|
|||
|
Item 9.
|
|||
|
Item 9A.
|
|||
|
Item 9B.
|
|||
|
Item 10.
|
|||
|
Item 11.
|
|||
|
Item 12.
|
|||
|
Item 13.
|
|||
|
Item 14.
|
|||
|
Item 15.
|
|||
|
ITEM 1.
|
BUSINESS
|
General
Our principal business activities are the development, marketing and distribution of branded performance apparel, footwear and accessories for men, women and youth. The brand’s moisture-wicking fabrications are engineered in many designs and styles for wear in nearly every climate to provide a performance alternative to traditional products. Our products are sold worldwide and are worn by athletes at all levels, from youth to professional, on playing fields around the globe, as well as by consumers with active lifestyles.
Our net revenues are generated primarily from the wholesale sales of our products to national, regional, independent and specialty retailers. We also generate net revenue from the sale of our products through our direct to consumer sales channel, which includes our brand and factory house stores and websites, and from product licensing. A large majority of our products are sold in North America; however we believe that our products appeal to athletes and consumers with active lifestyles around the globe. Internationally, our net revenues are generated from a mix of wholesale sales to retailers and distributors and sales through our direct to consumer sales channels, and license revenue from sales by our third party licensee. We plan to continue to grow our business over the long term through increased sales of our apparel, footwear and accessories, expansion of our wholesale distribution, growth in our direct to consumer sales channel and expansion in international markets. Virtually all of our products are manufactured by our unaffiliated primary manufacturers operating in 13 countries outside of the United States.
In December 2013, we acquired MapMyFitness, Inc. (“MapMyFitness”), a digital connected fitness company with users primarily in the U.S., and in January 2015, we acquired Endomondo, ApS. ("Endomondo") a digital connected fitness company with over 20 million registered users primarily in Europe and other regions outside the U.S. In February 2015, we entered into an agreement to acquire MyFitnessPal, Inc. ("MyFitnessPal"), a digital nutrition and connected fitness company with over 80 million registered users. Combined with the growth of MapMyFitness, these acquisitions will expand our Connected Fitness Community to include more than 120 million registered users. The acquisition is expected to close in the first quarter of 2015, subject to regulatory approval. These businesses will form the core of our Connected Fitness business and strategy.
Our Connected Fitness strategy is focused on connecting with our consumers and increasing awareness and sales of our existing product offerings through our global wholesale and direct to consumer channels. We plan to engage and grow this community by developing innovative applications, services and other digital solutions to impact how athletes and fitness-minded individuals train, perform and live.
We were incorporated as a Maryland corporation in 1996. As used in this report, the terms “we,” “our,” “us,” “Under Armour” and the “Company” refer to Under Armour, Inc. and its subsidiaries unless the context indicates otherwise. We have registered trademarks around the globe, including UNDER ARMOUR
®
, HEATGEAR
®
, COLDGEAR
®
, ALLSEASONGEAR
®
and the Under Armour UA Logo, and we have applied to register many other trademarks. This Annual Report on Form 10-K also contains additional trademarks and tradenames of our Company and our subsidiaries. All trademarks and tradenames appearing in this Annual Report on Form 10-K are the property of their respective holders.
Products
Our product offerings consist of apparel, footwear and accessories for men, women and youth. We market our products at multiple price levels and provide consumers with products that we believe are a superior alternative to traditional athletic products. In
2014
, sales of apparel, footwear and accessories represented
74%
,
14%
and
9%
of net revenues, respectively. Licensing arrangements, primarily for the sale of our products, and other revenue represented the remaining
3%
of net revenues. Refer to Note
16
to the Consolidated Financial Statements for net revenues by product.
Apparel
Our apparel is offered in a variety of styles and fits intended to enhance comfort and mobility, regulate body temperature and improve performance regardless of weather conditions. Our apparel is engineered to replace traditional non-performance fabrics in the world of athletics and fitness with performance alternatives designed and merchandised along gearlines. Our three gearlines are marketed to tell a very simple story about our highly technical products and extend across the sporting goods, outdoor and active lifestyle markets. We market our apparel for consumers to choose HEATGEAR
®
when it is hot, COLDGEAR
®
when it is cold and ALLSEASONGEAR
®
between the extremes. Within each gearline our apparel comes in three primary fit types: compression (tight fit), fitted (athletic fit) and loose (relaxed).
1
HEATGEAR
®
is designed to be worn in warm to hot temperatures under equipment or as a single layer. While a sweat-soaked traditional non-performance T-shirt can weigh two to three pounds, HEATGEAR
®
is engineered with a microfiber blend designed to wick moisture from the body which helps the body stay cool, dry and light. We offer HEATGEAR
®
in a variety of tops and bottoms in a broad array of colors and styles for wear in the gym or outside in warm weather.
COLDGEAR
®
is designed to wick moisture from the body while circulating body heat from hot spots to help maintain core body temperature. Our COLDGEAR
®
apparel provides both dryness and warmth in a single light layer that can be worn beneath a jersey, uniform, protective gear or ski-vest, and our COLDGEAR
®
outerwear products protect the athlete, as well as the coach and the fan from the outside in. Our COLDGEAR
®
products generally sell at higher prices than our other gearlines.
ALLSEASONGEAR
®
is designed to be worn in between extreme temperatures and uses technical fabrics to keep the wearer cool and dry in warmer temperatures while preventing a chill in cooler temperatures.
Footwear
Our footwear offerings include football, baseball, lacrosse, softball and soccer cleats, slides and performance training, running, basketball and outdoor footwear. Our footwear is light, breathable and built with performance attributes for athletes. Our footwear is designed with innovative technologies which provide stabilization, directional cushioning and moisture management engineered to maximize the athlete’s comfort and control.
Accessories
Accessories primarily includes the sale of headwear, bags and gloves. Our accessories include HEATGEAR® and COLDGEAR® technologies and are designed with advanced fabrications to provide the same level of performance as our other products.
License and Other
We have agreements with our licensees to develop Under Armour apparel and accessories. Our product, marketing and sales teams are actively involved in all steps of the design process in order to maintain brand standards and consistency. During
2014
, our licensees offered socks, team uniforms, baby and kids’ apparel, eyewear and inflatable footballs and basketballs that feature performance advantages and functionality similar to our other product offerings.
We also offer digital fitness platform licenses and subscriptions, along with digital advertising through our MapMyFitness business. License and other revenues generated from the sale of apparel and accessories and the use of our MapMyFitness platforms are included in our net revenues.
Marketing and Promotion
We currently focus on marketing and selling our products to consumers primarily for use in athletics, fitness, training and outdoor activities. We seek to drive consumer demand by building brand equity and awareness that our products deliver advantages that help athletes perform better.
Sports Marketing
Our marketing and promotion strategy begins with providing and selling our products to high-performing athletes and teams on the high school, collegiate and professional levels. We execute this strategy through outfitting agreements, professional and collegiate sponsorships, individual athlete agreements and by providing and selling our products directly to team equipment managers and to individual athletes. As a result, our products are seen on the field, giving them exposure to various consumer audiences through the internet, television, magazines and live at sporting events. This exposure to consumers helps us establish on-field authenticity as consumers can see our products being worn by high-performing athletes.
We are the official outfitter of athletic teams in several high-profile collegiate conferences. We are an official supplier of footwear and gloves to the National Football League (“NFL”) and we are the official combine scouting partner to the NFL with the right to sell combine training apparel. We are the Official Performance Footwear Supplier of Major League Baseball and a partner with the National Basketball Association (“NBA”) which allows us to market our NBA athletes in game uniforms in connection with our basketball footwear.
Internationally, we sponsor and sell our products to European and Latin America soccer and rugby teams. We provide the Tottenham Hotspur Football Club with performance apparel, including training wear and playing kit for the Club’s First and Academy teams, together with replica product for the Club’s supporters around the world. We are the official technical kit supplier to the Welsh Rugby Union and have exclusive retail rights on the replica products. Beginning in 2014, we became the
2
official kit supplier of the Chilean football club, Corporación Club Social y Deportivo Colo-Colo, along with Cruz Azul Futbol Club, A.C. and Deportivo Toluca F.C. in Mexico.
We also seek to sponsor events to drive awareness and brand authenticity from a grassroots level. We host combines, camps and clinics for athletes in many sports at regional sites across the country. These events, along with the products we make, are designed to help young athletes improve their training methods and their overall performance. We are also the title sponsor of a collection of high school All-America Games that create significant on-field product and brand exposure that contributes to our on-field authenticity.
Media
We feature our products in a variety of national digital, broadcast, and print media outlets. We also utilize social and mobile media to engage consumers and promote conversation around our brand and our products.
Retail Presentation
The primary component of our retail marketing strategy is to increase and brand floor space dedicated to our products within our major retail accounts. The design and funding of Under Armour concept shops within our major retail accounts has been a key initiative for securing prime floor space, educating the consumer and creating an exciting environment for the consumer to experience our brand. Under Armour concept shops enhance our brand’s presentation within our major retail accounts with a shop-in-shop approach, using dedicated floor space exclusively for our products, including flooring, lighting, walls, displays and images.
Sales and Distribution
The majority of our sales are generated through wholesale channels, which include national and regional sporting goods chains, independent and specialty retailers, department store chains, institutional athletic departments and leagues and teams. In addition, we sell our products to independent distributors in various countries where we generally do not have direct sales operations and through licensees.
We also sell our products directly to consumers through our own network of brand and factory house stores in our North America, Latin America and Asia-Pacific operating segments, and through websites globally. These factory house stores serve an important role in our overall inventory management by allowing us to sell a significant portion of excess, discontinued and out-of-season products while maintaining the pricing integrity of our brand in our other distribution channels. Through our brand house stores, consumers experience our brand first-hand and have broader access to our performance products. In
2014
, sales through our wholesale, direct to consumer and licensing channels represented
67%
,
30%
and
3%
of net revenues, respectively.
We believe the trend toward performance products is global and plan to continue to introduce our products and simple merchandising story to athletes throughout the world. We are introducing our performance apparel, footwear and accessories outside of North America in a manner consistent with our past brand-building strategy, including selling our products directly to teams and individual athletes in these markets, thereby providing us with product exposure to broad audiences of potential consumers.
Our primary business operates in four geographic segments: (1) North America, comprising the United States and Canada, (2) Europe, the Middle East and Africa (“EMEA”), (3) Asia-Pacific, and (4) Latin America. Each of these geographic segments operate predominantly in one industry: the design, development, marketing and distribution of performance apparel, footwear and accessories. We also operate our MapMyFitness business as a separate segment. As our international and MapMyFitness operating segments are currently not material, we combine them into other foreign countries and businesses for reporting purposes. The following table presents net revenues by segment for each of the years ending
December 31, 2014
,
2013
and
2012
:
|
|
Year ended December 31,
|
|||||||||||||||||||
|
|
2014
|
2013
|
2012
|
|||||||||||||||||
|
(In thousands)
|
Net Revenues
|
% of
Net Revenues
|
Net Revenues
|
% of
Net Revenues
|
Net Revenues
|
% of
Net Revenues
|
||||||||||||||
|
North America
|
$
|
2,796,390
|
|
90.7
|
%
|
$
|
2,193,739
|
|
94.1
|
%
|
$
|
1,726,733
|
|
94.1
|
%
|
|||||
|
Other foreign countries and businesses
|
287,980
|
|
9.3
|
|
138,312
|
|
5.9
|
|
108,188
|
|
5.9
|
|
||||||||
|
Total net revenues
|
$
|
3,084,370
|
|
100.0
|
%
|
$
|
2,332,051
|
|
100.0
|
%
|
$
|
1,834,921
|
|
100.0
|
%
|
|||||
3
North America
North America accounted for approximately
91%
of our net revenues for
2014
. We sell our branded apparel, footwear and accessories in North America through our wholesale and direct to consumer channels. Net revenues generated from the sales of our products in the United States were $
2,651.1 million
, $
2,082.5 million
and $
1,650.4 million
for the years ended
December 31, 2014
,
2013
and
2012
, respectively, and the majority of our long-lived assets were located in the United States. Our largest customer, Dick’s Sporting Goods, accounted for
14.4%
of our net revenues in
2014
. No other customers accounted for more than 10% of our net revenues.
Our direct to consumer sales are generated through our brand and factory house stores, along with internet websites. As of
December 31, 2014
, we had 125 factory house stores in North America, of which the majority are located in outlet centers throughout the United States. As of
December 31, 2014
, we had 5 brand house stores in North America. Consumers can purchase our products directly from our e-commerce website, www.underarmour.com.
In addition, we earn licensing revenue in North America based on our licensees’ sale of socks, team uniforms, baby and kids’ apparel, eyewear and inflatable footballs and basketballs. In order to maintain consistent quality and performance, we pre-approve all products manufactured and sold by our licensees, and our quality assurance team strives to ensure that the products meet the same quality and compliance standards as the products that we sell directly.
We distribute the majority of our products sold to our North American wholesale customers and our brand and factory house stores from distribution facilities we lease and operate in California and Maryland. In addition, we distribute our products in North America through third-party logistics providers with primary locations in Canada, New Jersey and Florida. In some instances, we arrange to have products shipped from the independent factories that manufacture our products directly to customer-designated facilities.
Other Foreign Countries and Businesses
Approximately
9%
of our net revenues were generated outside of North America and through our MapMyFitness business in
2014
. We plan to continue to grow our business over the long term in part through expansion in international markets. We also plan to expand our MapMyFitness business to reach more users and continue to develop new services and solutions.
EMEA
We sell our apparel, footwear and accessories through retailers and websites and independent distributors in certain European countries. We sell our branded products to various sports clubs and teams in Europe. We continue to sell the United Kingdom's Tottenham Hotspur Football Club replica product for the club’s supporters around the world.
We generally distribute our products to our retail customers and e-commerce consumers in Europe through a third-party logistics provider based out of Venlo, The Netherlands. This agreement continues through April 2017.
Asia-Pacific
We sell our apparel, footwear and accessories products in China through seven brand and two factory house stores we operate, along with stores operated by our distribution partners. We also sell our products to independent distributors in Australia, New Zealand, Taiwan and Hong Kong where we do not have direct sales operations. We distribute our products in Asia-Pacific primarily through a third-party logistics provider based out of Hong Kong.
We have a license agreement with Dome Corporation, which produces, markets and sells our branded apparel, footwear and accessories in Japan and Korea. We are actively involved with this licensee to develop variations of our products for the different sizes, sports interests and preferences of Japanese and Korean consumers. Our branded products are sold in Japan and Korea to large sporting goods retailers, independent specialty stores and professional sports teams, and through Dome-owned retail stores. We hold a cost-based minority investment in Dome Corporation.
Latin America
We sell our products in Chile, Mexico and Brazil through wholesale distributors, website operations and two brand and six factory house stores. In these countries we operate through third-party distribution facilities. In other Latin American countries we sell our products through independent distributors which are sourced through our international distribution hubs in Hong Kong, Jordan and the United States. Prior to 2014, we primarily sold our products in Latin America through an independent distributor in Mexico.
4
MapMyFitness
In 2013, we began offering digital fitness subscriptions and licenses, along with digital advertising through our MapMyFitness platform. Our MapMyFitness strategy is focused on connecting with our consumers and increasing awareness and sales of our existing product offerings through our global wholesale and direct to consumer channels. We plan to engage and grow this community by developing innovative applications, services and other digital solutions to impact how athletes and fitness-minded individuals train, perform and live.
Seasonality
Historically, we have recognized a majority of our net revenues and a significant portion of our income from operations in the last two quarters of the year, driven primarily by increased sales volume of our products during the fall selling season, including our higher priced cold weather products, along with a larger proportion of higher margin direct to consumer sales. The level of our working capital generally reflects the seasonality and growth in our business.
We generally expect inventory, accounts payable and certain accrued expenses to be higher in the second and third quarters in preparation for the fall selling season.
Product Design and Development
Our products are manufactured with technical fabrications produced by third parties and developed in collaboration with our product development teams. This approach enables us to select and create superior, technically advanced fabrics, produced to our specifications, while focusing our product development efforts on design, fit, climate and product end use.
We seek to regularly upgrade and improve our products with the latest in innovative technology while broadening our product offerings. Our goal, to deliver superior performance in all our products, provides our developers and licensees with a clear, overarching direction for the brand and helps them identify new opportunities to create performance products that meet the changing needs of athletes. We design products with “visible technology,” utilizing color, texture and fabrication to enhance our customers’ perception and understanding of product use and benefits.
Our product development team works closely with our sports marketing and sales teams as well as professional and collegiate athletes to identify product trends and determine market needs. For example, these teams worked closely to identify the opportunity and market for our CHARGED COTTON
®
products, which are made from natural cotton but perform like our synthetic products, drying faster and wicking away moisture from the body, and our Storm Fleece products with a unique, water-resistant finish that repels water, without stifling airflow. In 2013, we introduced ColdGear® Infrared, a ceramic print technology on the inside of our garments that provides athletes with lightweight warmth.
Sourcing, Manufacturing and Quality Assurance
Many of the specialty fabrics and other raw materials used in our products are technically advanced products developed by third parties and may be available, in the short term, from a limited number of sources. The fabric and other raw materials used to manufacture our products are sourced by our manufacturers from a limited number of suppliers pre-approved by us. In 2014, approximately 65% of the fabric used in our products came from
five
suppliers. These fabric suppliers have primary locations in Taiwan, Singapore, Mexico and El Salvador. The fabrics used by our suppliers and manufacturers are primarily synthetic fabrics and involve raw materials, including petroleum based products that may be subject to price fluctuations and shortages. We also use cotton in our products, as blended fabric and also in our CHARGED COTTON
®
line. Cotton is a commodity that is subject to price fluctuations and supply shortages.
Substantially all of our products are manufactured by unaffiliated manufacturers. In 2014, our products were manufactured by 29 primary manufacturers, operating in 14 countries, with approximately 65% of our products manufactured in China, Jordan, Vietnam and Indonesia. Of our 29 primary manufacturing partners, ten produced approximately 52% of our products. All manufacturers are evaluated for quality systems, social compliance and financial strength by our quality assurance team prior to being selected and on an ongoing basis. Where appropriate, we strive to qualify multiple manufacturers for particular product types and fabrications. We also seek out vendors that can perform multiple manufacturing stages, such as procuring raw materials and providing finished products, which helps us to control our cost of goods sold. We enter into a variety of agreements with our manufacturers, including non-disclosure and confidentiality agreements, and we require that all of our manufacturers adhere to a code of conduct regarding quality of manufacturing and working conditions and other social concerns. We do not, however, have any long term agreements requiring us to utilize any manufacturer, and no manufacturer is required to produce our products in the long term. We have subsidiaries in Hong Kong, Panama, Vietnam and China to support our manufacturing, quality assurance and sourcing efforts for our products. We also manufacture a limited number of apparel products, primarily for high-profile athletes and teams, on-premises in our quick turn, Special Make-Up Shop located at one of our distribution facilities in Maryland.
5
Inventory Management
Inventory management is important to the financial condition and operating results of our business. We manage our inventory levels based on existing orders, anticipated sales and the rapid-delivery requirements of our customers.
Our inventory strategy is focused on continuing to meet consumer demand while improving our inventory efficiency over the long term by putting systems and processes in place to improve our inventory management. These systems and processes are designed to improve our forecasting and supply planning capabilities. In addition to systems and processes, key areas of focus that we believe will enhance inventory performance are added discipline around the purchasing of product, production lead time reduction, and better planning and execution in selling of excess inventory through our factory house stores and other liquidation channels.
Our practice, and the general practice in the apparel, footwear and accessory industries, is to offer retail customers the right to return defective or improperly shipped merchandise. As it relates to new product introductions, which can often require large initial launch shipments, we commence production before receiving orders for those products from time to time. This can affect our inventory levels as we build pre-launch quantities.
Intellectual Property
We believe we own the material trademarks used in connection with the marketing, distribution and sale of our products, both domestically and internationally, where our products are currently sold or manufactured. Our major trademarks include the UA Logo and UNDER ARMOUR
®
, both of which are registered in the United States, Canada, Mexico, the European Union, Japan, China and numerous other countries. We also own trademark registrations for other trademarks including, among others, UA
®
, ARMOUR
®
, HEATGEAR
®
, COLDGEAR
®
, ALLSEASONGEAR
®
, PROTECT THIS HOUSE
®
, I WILL
®
, and many trademarks that incorporate the term ARMOUR such as ARMOUR39
®
, ARMOURBITE
®
, ARMOURSTORM
®
, ARMOUR
®
FLEECE, and ARMOUR BRA
®
. We also own domain names for our primary trademarks (most notably underarmour.com and ua.com) and hold copyright registrations for several commercials, as well as for certain artwork. We intend to continue to strategically register, both domestically and internationally, trademarks and copyrights we utilize today and those we develop in the future. We will continue to aggressively police our trademarks and pursue those who infringe, both domestically and internationally.
We believe the distinctive trademarks we use in connection with our products are important in building our brand image and distinguishing our products from those of others. These trademarks are among our most valuable assets. In addition to our distinctive trademarks, we also place significant value on our trade dress, which is the overall image and appearance of our products, and we believe our trade dress helps to distinguish our products in the marketplace.
We traditionally have had limited patent protection on much of the technology, materials and processes used in the manufacture of our products. In addition, patents are increasingly important with respect to our innovative products and new businesses and investments, particularly in our Connected Fitness business. As we continue to expand and drive innovation in our products, we expect to seek patent protection on products, features and concepts we believe to be strategic and important to our business. We will continue to file patent applications where we deem appropriate to protect our new products, innovations and designs, and we expect the number of applications to increase as our business grows and as we continue to expand our products and innovate.
Competition
The market for performance apparel, footwear and accessories is highly competitive and includes many new competitors as well as increased competition from established companies expanding their production and marketing of performance products. Many of the fabrics and technology used in manufacturing our products are not unique to us, and we own a limited number of fabric or process patents. Many of our competitors are large apparel and footwear companies with strong worldwide brand recognition and significantly greater resources than us, such as Nike and adidas. We also compete with other manufacturers, including those specializing in outdoor apparel, and private label offerings of certain retailers, including some of our retail customers.
In addition, we must compete with others for purchasing decisions, as well as limited floor space at retailers. We believe we have been successful in this area because of the relationships we have developed and as a result of the strong sales of our products. However, if retailers earn higher margins from our competitors’ products, they may favor the display and sale of those products.
We believe we have been able to compete successfully because of our brand image and recognition, the performance and quality of our products and our selective distribution policies. We also believe our focused gearline merchandising story differentiates us from our competition. In the future we expect to compete for consumer preferences and expect that we may
6
face greater competition on pricing. This may favor larger competitors with lower production costs per unit that can spread the effect of price discounts across a larger array of products and across a larger customer base than ours. The purchasing decisions of consumers for our products often reflect highly subjective preferences that can be influenced by many factors, including advertising, media, product sponsorships, product improvements and changing styles.
Employees
As of
December 31, 2014
, we had approximately 10,700 employees, including approximately 7,000 in our brand and factory house stores and 1,260 at our distribution facilities. Approximately 4,300 of our employees were full-time. Most of our employees are located in the United States. None of our employees in the United States are currently covered by a collective bargaining agreement and there are no material collective bargaining agreements in effect in any of our international locations. We have had no labor-related work stoppages, and we believe our relations with our employees are good.
Available Information
We will make available free of charge on or through our website at www.underarmour.com our annual reports on Form 10-K, quarterly reports on Form 10-Q, current reports on Form 8-K and amendments to these reports filed or furnished pursuant to Section 13(a) or 15(d) of the Exchange Act as soon as reasonably practicable after we file these materials with the Securities and Exchange Commission. We also post on this website our key corporate governance documents, including our board committee charters, our corporate governance guidelines and our code of conduct and ethics.
7
|
ITEM 1A.
|
RISK FACTORS
|
Forward-Looking Statements
Some of the statements contained in this Form 10-K and the documents incorporated herein by reference constitute forward-looking statements. Forward-looking statements relate to expectations, beliefs, projections, future plans and strategies, anticipated events or trends and similar expressions concerning matters that are not historical facts, such as statements regarding our future financial condition or results of operations, our prospects and strategies for future growth, the development and introduction of new products, and the implementation of our marketing and branding strategies. In many cases, you can identify forward-looking statements by terms such as “may,” “will,” “should,” “expects,” “plans,” “anticipates,” “believes,” “estimates,” “predicts,” “outlook,” “potential” or the negative of these terms or other comparable terminology.
The forward-looking statements contained in this Form 10-K and the documents incorporated herein by reference reflect our current views about future events and are subject to risks, uncertainties, assumptions and changes in circumstances that may cause events or our actual activities or results to differ significantly from those expressed in any forward-looking statement. Although we believe that the expectations reflected in the forward-looking statements are reasonable, we cannot guarantee future events, results, actions, levels of activity, performance or achievements. Readers are cautioned not to place undue reliance on these forward-looking statements. A number of important factors could cause actual results to differ materially from those indicated by these forward-looking statements, including, but not limited to, those factors described in “Risk Factors” and “Management’s Discussion and Analysis of Financial Condition and Results of Operations.” These factors include without limitation:
|
•
|
changes in general economic or market conditions that could affect consumer spending and the financial health of our retail customers;
|
|
•
|
our ability to effectively manage our growth and a more complex global business;
|
|
•
|
our ability to successfully manage or realize expected results from acquisitions and other significant investments;
|
|
•
|
our ability to effectively develop and launch new, innovative and updated products;
|
|
•
|
our ability to accurately forecast consumer demand for our products and manage our inventory in response to changing demands;
|
|
•
|
increased competition causing us to lose market share or reduce the prices of our products or to increase significantly our marketing efforts;
|
|
•
|
fluctuations in the costs of our products;
|
|
•
|
loss of key suppliers or manufacturers or failure of our suppliers or manufacturers to produce or deliver our products in a timely or cost-effective manner, including due to port disruptions;
|
|
•
|
our ability to further expand our business globally and to drive brand awareness and consumer acceptance of our products in other countries;
|
|
•
|
our ability to accurately anticipate and respond to seasonal or quarterly fluctuations in our operating results;
|
|
•
|
risks related to foreign currency exchange rate fluctuations;
|
|
•
|
our ability to effectively market and maintain a positive brand image;
|
|
•
|
our ability to comply with trade and other regulations;
|
|
•
|
the availability, integration and effective operation of information systems and other technology, as well as any potential interruption in such systems or technology;
|
|
•
|
risks related to data security or privacy breaches;
|
|
•
|
our potential exposure to litigation and other proceedings; and
|
|
•
|
our ability to attract and retain the services of our senior management and key employees.
|
The forward-looking statements contained in this Form 10-K reflect our views and assumptions only as of the date of this Form 10-K. We undertake no obligation to update any forward-looking statement to reflect events or circumstances after the date on which the statement is made or to reflect the occurrence of unanticipated events.
8
Our results of operations and financial condition could be adversely affected by numerous risks. You should carefully consider the risk factors detailed below in conjunction with the other information contained in this Form 10-K. Should any of these risks actually materialize, our business, financial condition and future prospects could be negatively impacted.
During a downturn in the economy, consumer purchases of discretionary items are affected, which could materially harm our sales, profitability and financial condition.
Many of our products may be considered discretionary items for consumers. Factors affecting the level of consumer spending for such discretionary items include general economic conditions, the availability of consumer credit and consumer confidence in future economic conditions. Uncertainty in global economic conditions continues, and trends in consumer discretionary spending remain unpredictable. However, consumer purchases of discretionary items tend to decline during recessionary periods when disposable income is lower or during other periods of economic instability or uncertainty. A downturn in the economy in markets in which we sell our products may materially harm our sales, profitability and financial condition.
If the financial condition of our retail customers declines, our financial condition and results of operations could be adversely impacted.
We extend credit to our customers based on an assessment of a customer’s financial condition, generally without requiring collateral. We face increased risk of order reduction or cancellation when dealing with financially ailing customers or customers struggling with economic uncertainty. During weak economic conditions, retail customers may be more cautious with orders. In addition, a slowing economy in our key markets or a continued decline in consumer purchases of sporting goods generally could have an adverse effect on the financial health of our retail customers, which could in turn have an adverse effect on our sales, our ability to collect on receivables and our financial condition.
A decline in sales to, or the loss of, one or more of our key customers could result in a material loss of net revenues and negatively impact our prospects for growth.
In
2014
, approximately
14.4%
of our net revenues were generated from sales to our largest customer. We currently do not enter into long term sales contracts with this customer or our other key customers, relying instead on our relationships with these customers and on our position in the marketplace. As a result, we face the risk that these key customers may not increase their business with us as we expect, or may significantly decrease their business with us or terminate their relationship with us. The failure to increase our sales to these customers as much as we anticipate would have a negative impact on our growth prospects and any decrease or loss of these key customers' business could result in a material decrease in our net revenues and net income.
If we continue to grow at a rapid pace, we may not be able to effectively manage our growth and the increased complexity of a global business and as a result our brand image, net revenues and profitability may decline.
We have expanded our operations rapidly since our inception and our net revenues have increased to
$3,084.4 million
in
2014
from
$1,063.9 million
in
2010
. If our operations continue to grow at a rapid pace, we may experience difficulties in obtaining sufficient raw materials and manufacturing capacity to produce our products, as well as delays in production and shipments, as our products are subject to risks associated with overseas sourcing and manufacturing. We could be required to continue to expand our sales and marketing, product development and distribution functions, to upgrade our management information systems and other processes and technology, and to obtain more space to support our expanding workforce. This expansion could increase the strain on these and other resources, and we could experience serious operating difficulties, including difficulties in hiring, training and managing an increasing number of employees. In addition, as our business becomes more complex through the introduction of more new products and the expansion of our distribution channels, including additional brand and factory house stores and expanded distribution in malls and department stores, and expanded international distribution, these operational strains and other difficulties could increase. These difficulties could result in the erosion of our brand image and a decrease in net revenues and net income.
If we fail to successfully manage or realize expected results from acquisitions and other significant investments, it may have a material adverse effect on our results of operations and financial position, as well as negatively impact the price of our Class A Common Stock.
From time to time we may engage in acquisition opportunities we believe are complementary to our business and brand. For example, as part of our ongoing business strategy we have engaged in acquisitions to grow and enhance our Connected Fitness business. In order to successfully execute this strategy, we must manage the integration of acquired companies and employees successfully. Because our Connected Fitness business is a relatively new line of business for us, these challenges
9
may be more pronounced. Integrating acquisitions can also require significant efforts and resources, which could divert management attention from more profitable business operations.
Failing to successfully integrate acquired entities and businesses or to produce results consistent with financial models used in the analysis of our acquisitions could potentially result in an impairment of goodwill and intangible assets, which could have a material adverse effect on our results of operations and financial position. In addition, we may not be successful in our efforts to continue to grow the number of users, maintain or increase user engagement or ultimately realize expected revenues from our Connected Fitness community. For example, we may not successfully increase sales of our apparel, footwear and accessory products to these users. Any of these developments could have a material adverse effect on our results of operations and financial position, as well as negatively impact the price of our Class A Common Stock.
If we are unable to anticipate consumer preferences and successfully develop and introduce new, innovative and updated products, we may not be able to maintain or increase our net revenues and profitability.
Our success depends on our ability to identify and originate product trends as well as to anticipate and react to changing consumer demands in a timely manner. All of our products are subject to changing consumer preferences that cannot be predicted with certainty. In addition, long lead times for certain of our products may make it hard for us to quickly respond to changes in consumer demands. Our new products may not receive consumer acceptance as consumer preferences could shift rapidly to different types of performance or other sports products or away from these types of products altogether, and our future success depends in part on our ability to anticipate and respond to these changes. Failure to anticipate and respond in a timely manner to changing consumer preferences could lead to, among other things, lower sales and excess inventory levels, which could have a material adverse effect on our financial condition.
Even if we are successful in anticipating consumer preferences, our ability to adequately react to and address those preferences will in part depend upon our continued ability to develop and introduce innovative, high-quality products. In addition, if we fail to introduce technical innovation in our products, consumer demand for our products could decline, and if we experience problems with the quality of our products, we may incur substantial expense to remedy the problems. The failure to effectively introduce new products and enter into new product categories that are accepted by consumers could result in a decrease in net revenues and excess inventory levels, which could have a material adverse effect on our financial condition.
Our results of operations could be materially harmed if we are unable to accurately forecast demand for our products.
To ensure adequate inventory supply, we must forecast inventory needs and place orders with our manufacturers before firm orders are placed by our customers. In addition, a significant portion of our net revenues are generated by at-once orders for immediate delivery to customers, particularly during our historical peak season, during the last two quarters of the year. If we fail to accurately forecast customer demand we may experience excess inventory levels or a shortage of product to deliver to our customers.
Factors that could affect our ability to accurately forecast demand for our products include:
|
•
|
an increase or decrease in consumer demand for our products;
|
|
•
|
our failure to accurately forecast consumer acceptance for our new products;
|
|
•
|
product introductions by competitors;
|
|
•
|
unanticipated changes in general market conditions or other factors, which may result in cancellations of advance orders or a reduction or increase in the rate of reorders placed by retailers;
|
|
•
|
the impact on consumer demand due to unseasonable weather conditions;
|
|
•
|
weakening of economic conditions or consumer confidence in future economic conditions, which could reduce demand for discretionary items, such as our products; and
|
|
•
|
terrorism or acts of war, or the threat thereof, or political or labor instability or unrest which could adversely affect consumer confidence and spending or interrupt production and distribution of product and raw materials.
|
Inventory levels in excess of customer demand may result in inventory write-downs or write-offs and the sale of excess inventory at discounted prices, which could impair our brand image and have an adverse effect on gross margin. In addition, if we underestimate the demand for our products, our manufacturers may not be able to produce products to meet our customer requirements, and this could result in delays in the shipment of our products and our ability to recognize revenue, as well as damage to our reputation and retailer and distributor relationships.
10
The difficulty in forecasting demand also makes it difficult to estimate our future results of operations and financial condition from period to period. A failure to accurately predict the level of demand for our products could adversely impact our profitability.
Sales of performance products may not continue to grow and this could adversely impact our ability to grow our business.
We believe continued growth in industry-wide sales of performance apparel, footwear and accessories will be largely dependent on consumers continuing to transition from traditional alternatives to performance products. If consumers are not convinced these products are a better choice than traditional alternatives, growth in the industry and our business could be adversely affected. In addition, because performance products are often more expensive than traditional alternatives, consumers who are convinced these products provide a better alternative may still not be convinced they are worth the extra cost. If industry-wide sales of performance products do not grow, our ability to continue to grow our business and our financial condition and results of operations could be materially adversely impacted.
We operate in a highly competitive market and the size and resources of some of our competitors may allow them to compete more effectively than we can, resulting in a loss of our market share and a decrease in our net revenues and gross profit.
The market for performance apparel, footwear and accessories is highly competitive and includes many new competitors as well as increased competition from established companies expanding their production and marketing of performance products. Because we own a limited number of fabric or process patents, our current and future competitors are able to manufacture and sell products with performance characteristics and fabrications similar to certain of our products. Many of our competitors are large apparel and footwear companies with strong worldwide brand recognition. Due to the fragmented nature of the industry, we also compete with other manufacturers, including those specializing in outdoor apparel and private label offerings of certain retailers, including some of our retail customers. Many of our competitors have significant competitive advantages, including greater financial, distribution, marketing and other resources, longer operating histories, better brand recognition among consumers, more experience in global markets and greater economies of scale. In addition, our competitors have long term relationships with our key retail customers that are potentially more important to those customers because of the significantly larger volume and product mix that our competitors sell to them. As a result, these competitors may be better equipped than we are to influence consumer preferences or otherwise increase their market share by:
|
•
|
quickly adapting to changes in customer requirements;
|
|
•
|
readily taking advantage of acquisition and other opportunities;
|
|
•
|
discounting excess inventory that has been written down or written off;
|
|
•
|
devoting resources to the marketing and sale of their products, including significant advertising, media placement, partnerships and product endorsement;
|
|
•
|
adopting aggressive pricing policies; and
|
|
•
|
engaging in lengthy and costly intellectual property and other disputes.
|
In addition, while one of our growth strategies is to increase floor space for our products in retail stores and generally expand our distribution to other retailers, retailers have limited resources and floor space, and we must compete with others to develop relationships with them. Increased competition by existing and future competitors could result in reductions in floor space in retail locations, reductions in sales or reductions in the prices of our products, and if retailers earn greater margins from our competitors’ products, they may favor the display and sale of those products. Our inability to compete successfully against our competitors and maintain our gross margin could have a material adverse effect on our business, financial condition and results of operations.
Our profitability may decline as a result of increasing pressure on margins.
Our industry is subject to significant pricing pressure caused by many factors, including intense competition, consolidation in the retail industry, pressure from retailers to reduce the costs of products and changes in consumer demand. These factors may cause us to reduce our prices to retailers and consumers, which could cause our profitability to decline if we are unable to offset price reductions with comparable reductions in our operating costs. This could have a material adverse effect on our results of operations and financial condition.
11
Fluctuations in the cost of products could negatively affect our operating results.
The fabrics used by our suppliers and manufacturers are made of raw materials including petroleum-based products and cotton. Significant price fluctuations or shortages in petroleum or other raw materials can materially adversely affect our cost of goods sold. In addition, certain of our manufacturers are subject to government regulations related to wage rates, and therefore the labor costs to produce our products may fluctuate. The cost of transporting our products for distribution and sale is also subject to fluctuation due in large part to the price of oil. Because most of our products are manufactured abroad, our products must be transported by third parties over large geographical distances and an increase in the price of oil can significantly increase costs. Manufacturing delays or unexpected transportation delays can also cause us to rely more heavily on airfreight to achieve timely delivery to our customers, which significantly increases freight costs. Any of these fluctuations may increase our cost of products and have an adverse effect on our profit margins, results of operations and financial condition.
We rely on third-party suppliers and manufacturers to provide fabrics for and to produce our products, and we have limited control over these suppliers and manufacturers and may not be able to obtain quality products on a timely basis or in sufficient quantity.
Many of the specialty fabrics used in our products are technically advanced textile products developed by third parties and may be available, in the short-term, from a very limited number of sources. Substantially all of our products are manufactured by unaffiliated manufacturers, and, in
2014
,
10
manufacturers produced approximately
52%
of our products. We have no long term contracts with our suppliers or manufacturing sources, and we compete with other companies for fabrics, raw materials, production and import quota capacity.
We may experience a significant disruption in the supply of fabrics or raw materials from current sources or, in the event of a disruption, we may be unable to locate alternative materials suppliers of comparable quality at an acceptable price, or at all. In addition, our unaffiliated manufacturers may not be able to fill our orders in a timely manner. If we experience significant increased demand, or we lose or need to replace an existing manufacturer or supplier as a result of adverse economic conditions or other reasons, additional supplies of fabrics or raw materials or additional manufacturing capacity may not be available when required on terms that are acceptable to us, or at all, or suppliers or manufacturers may not be able to allocate sufficient capacity to us in order to meet our requirements. In addition, even if we are able to expand existing or find new manufacturing or fabric sources, we may encounter delays in production and added costs as a result of the time it takes to train our suppliers and manufacturers on our methods, products and quality control standards. Any delays, interruption or increased costs in the supply of fabric or manufacture of our products could have an adverse effect on our ability to meet retail customer and consumer demand for our products and result in lower net revenues and net income both in the short and long term.
We have occasionally received, and may in the future continue to receive, shipments of product that fail to conform to our quality control standards. In that event, unless we are able to obtain replacement products in a timely manner, we risk the loss of net revenues resulting from the inability to sell those products and related increased administrative and shipping costs. In addition, because we do not control our manufacturers, products that fail to meet our standards or other unauthorized products could end up in the marketplace without our knowledge, which could harm our brand and our reputation in the marketplace.
Labor disruptions at ports or our suppliers or manufacturers may adversely affect our business.
Our business depends on our ability to source and distribute products in a timely manner. As a result, we rely on the free flow of goods through open and operational ports worldwide and on a consistent basis from our suppliers and manufacturers. Labor disputes at various ports or at our suppliers or manufacturers create significant risks for our business, particularly if these disputes result in work slowdowns, lockouts, strikes or other disruptions during our peak importing or manufacturing seasons, and could have an adverse effect on our business, potentially resulting in canceled orders by customers, unanticipated inventory accumulation or shortages and reduced net revenues and net income.
Our limited operating experience and limited brand recognition in new markets may limit our expansion strategy and cause our business and growth to suffer.
Our future growth depends in part on our expansion efforts outside of the North America. During the year ended
December 31, 2014
,
91%
of our net revenues were earned in our North America segment. We have limited experience with regulatory environments and market practices outside of North America, and may face difficulties in expanding to and successfully operating in markets outside of North America. International expansion may place increased demands on our operational, managerial and administrative resources. In addition, in connection with expansion efforts outside of North America, we may face cultural and linguistic differences, differences in regulatory environments, labor practices and market practices and difficulties in keeping abreast of market, business and technical developments and customers’ tastes and preferences. We may also encounter difficulty expanding into new markets because of limited brand recognition leading to
12
delayed acceptance of our products. Failure to develop new markets outside of North America will limit our opportunities for growth.
The operations of many of our manufacturers are subject to additional risks that are beyond our control and that could harm our business.
In
2014
, our products were manufactured by
29
primary manufacturers, operating in
14
countries, with
10
manufacturers accounting for approximately
52%
of our products. Approximately 65% of our products were manufactured in China, Jordan, Vietnam and Indonesia. As a result of our international manufacturing, we are subject to risks associated with doing business abroad, including:
|
•
|
political or labor unrest, terrorism and economic instability resulting in the disruption of trade from foreign countries in which our products are manufactured;
|
|
•
|
currency exchange fluctuations;
|
|
•
|
the imposition of new laws and regulations, including those relating to labor conditions, quality and safety standards, imports, trade restrictions and restrictions on the transfer of funds, as well as rules and regulations regarding climate change;
|
|
•
|
reduced protection for intellectual property rights in some countries;
|
|
•
|
disruptions or delays in shipments; and
|
|
•
|
changes in local economic conditions in countries where our manufacturers and suppliers are located.
|
These risks could negatively affect the ability of our manufacturers to produce or deliver our products or procure materials, hamper our ability to sell products in international markets and increase our cost of doing business generally. In the event that one or more of these factors make it undesirable or impractical for us to conduct business in a particular country, our business could be adversely affected.
In addition, many of our imported products are subject to duties, tariffs or other import limitations that affect the cost and quantity of various types of goods imported into the United States and other markets. Any country in which our products are produced or sold may eliminate, adjust or impose new import limitations, duties, anti-dumping penalties or other charges or restrictions, any of which could have an adverse effect on our results of operations, cash flows and financial condition.
Our credit facility contains financial covenants and other restrictions on our actions, and it could therefore limit our operational flexibility or otherwise adversely affect our financial condition.
We have, from time to time, financed our liquidity needs in part from borrowings made under our credit facility. The credit agreement contains negative covenants that, subject to significant exceptions limit our ability, among other things to incur additional indebtedness, make restricted payments, pledge assets as security, make investments, loans, advances, guarantees and acquisitions, undergo fundamental changes and enter into transactions with affiliates. In addition, we must maintain a certain leverage ratio and interest coverage ratio as defined in the credit agreement. Failure to comply with these operating or financial covenants could result from, among other things, changes in our results of operations or general economic conditions. These covenants may restrict our ability to engage in transactions that would otherwise be in our best interests. Failure to comply with any of the covenants under the credit agreement could result in a default. In addition, the credit agreement includes a cross default provision whereby an event of default under certain other debt obligations will be considered an event of default under the credit agreement. If an event of default occurs, the commitments of the lenders under the credit agreement may be terminated and the maturity of amounts owed may be accelerated.
We may need to raise additional capital required to grow our business, and we may not be able to raise capital on terms acceptable to us or at all.
Growing and operating our business will require significant cash outlays and capital expenditures and commitments. If cash on hand and cash generated from operations are not sufficient to meet our cash requirements, we will need to seek additional capital, potentially through debt or equity financing, to fund our growth. We may not be able to raise needed cash on terms acceptable to us or at all. Financing may be on terms that are dilutive or potentially dilutive to our stockholders, and the prices at which new investors would be willing to purchase our securities may be lower than the current price per share of our common stock. The holders of new securities may also have rights, preferences or privileges which are senior to those of existing holders of common stock. If new sources of financing are required, but are insufficient or unavailable, we will be required to modify our growth and operating plans based on available funding, if any, which would harm our ability to grow our business.
13
Our operating results are subject to seasonal and quarterly variations in our net revenues and income from operations, which could adversely affect the price of our Class A Common Stock.
We have experienced, and expect to continue to experience, seasonal and quarterly variations in our net revenues and income from operations. These variations are primarily related to increased sales volume of our products during the fall selling season, including our higher price cold weather products, along with a larger proportion of higher margin direct to consumer sales. The majority of our net revenues were generated during the last two quarters in each of
2014
,
2013
and
2012
, respectively.
Our quarterly results of operations may also fluctuate significantly as a result of a variety of other factors, including, among other things, the timing of marketing expenses and changes in our product mix. Variations in weather conditions may also have an adverse effect on our quarterly results of operations. For example, warmer than normal weather conditions throughout the fall or winter may reduce sales of our COLDGEAR
®
line, leaving us with excess inventory and operating results below our expectations.
As a result of these seasonal and quarterly fluctuations, we believe that comparisons of our operating results between different quarters within a single year are not necessarily meaningful and that these comparisons cannot be relied upon as indicators of our future performance. Any seasonal or quarterly fluctuations that we report in the future may not match the expectations of market analysts and investors. This could cause the price of our Class A Common Stock to fluctuate significantly.
Our financial results could be adversely impacted by currency exchange rate fluctuations.
Although we currently generate
86.6%
of our consolidated net revenues in the United States, as our international business grows, our results of operations could be adversely impacted by changes in foreign currency exchange rates. Revenues and certain expenses in markets outside of the United States are recognized in local foreign currencies, and we are exposed to potential gains or losses from the translation of those amounts into U.S. dollars for consolidation into our financial statements. Similarly, we are exposed to gains and losses resulting from currency exchange rate fluctuations on transactions generated by our foreign subsidiaries in currencies other than their local currencies. In addition, the business of our independent manufacturers may also be disrupted by currency exchange rate fluctuations by making their purchases of raw materials more expensive and more difficult to finance. As a result, foreign currency exchange rate fluctuations may adversely impact our results of operations.
The value of our brand and sales of our products could be diminished if we are associated with negative publicity.
We require our suppliers, manufacturers and licensees of our products to operate their businesses in compliance with the laws and regulations that apply to them as well as the social and other standards and policies we impose on them, including our code of conduct. We do not control these suppliers, manufacturers or licensees or their labor practices. A violation or reported (or alleged) violation of our policies, labor laws or other laws by our suppliers, manufacturers or licensees could interrupt or otherwise disrupt our sourcing or damage our brand image. Negative publicity regarding production methods, alleged practices or workplace or related conditions of any of our suppliers, manufacturers or licensees could adversely affect our reputation and sales and force us to locate alternative suppliers, manufacturers or licensees.
In addition, we have sponsorship contracts with a variety of athletes and feature those athletes in our advertising and marketing efforts, and many athletes and teams use our products, including those teams or leagues for which we are an official supplier. Actions taken by athletes, teams or leagues associated with our products could harm the reputations of those athletes, teams or leagues. As a result, our brand image, net revenues and profitability could be adversely affected.
Sponsorships and designations as an official supplier may become more expensive and this could impact the value of our brand image.
A key element of our marketing strategy has been to create a link in the consumer market between our products and professional and collegiate athletes. We have developed licensing agreements to be the official supplier of performance apparel and footwear to a variety of sports teams and leagues at the collegiate and professional level and sponsorship agreements with athletes. However, as competition in the performance apparel and footwear industry has increased, the costs associated with athlete sponsorships and official supplier licensing agreements have increased, including the costs associated with obtaining and retaining these sponsorships and agreements. If we are unable to maintain our current association with professional and collegiate athletes, teams and leagues, or to do so at a reasonable cost, we could lose the on-field authenticity associated with our products, and we may be required to modify and substantially increase our marketing investments. As a result, our brand image, net revenues, expenses and profitability could be materially adversely affected.
14
Our failure to comply with trade and other regulations could lead to investigations or actions by government regulators and negative publicity.
The labeling, distribution, importation, marketing and sale of our products are subject to extensive regulation by various federal agencies, including the Federal Trade Commission, Consumer Product Safety Commission and state attorneys general in the U.S., as well as by various other federal, state, provincial, local and international regulatory authorities in the locations in which our products are distributed or sold. If we fail to comply with those regulations, we could become subject to significant penalties or claims or be required to recall products, which could harm our brand as well as our results of operations or our ability to conduct our business. In addition, the adoption of new regulations or changes in the interpretation of existing regulations may result in significant compliance costs or discontinuation of product sales and may impair the marketing of our products, resulting in significant loss of net revenues.
Our international operations are also subject to compliance with the U.S. Foreign Corrupt Practices Act, or FCPA, and other anti-bribery laws applicable to our operations. Although we have policies and procedures to address compliance with the FCPA and similar laws, there can be no assurance that all of our employees, agents and other partners will not take actions in violations of our policies. Any such violation could subject us to sanctions or other penalties that could negatively affect our reputation, business and operating results.
If we encounter problems with our distribution system, our ability to deliver our products to the market could be adversely affected.
We rely on a limited number of distribution facilities for our product distribution. Our distribution facilities utilize computer controlled and automated equipment, which means the operations are complicated and may be subject to a number of risks related to security or computer viruses, the proper operation of software and hardware, power interruptions or other system failures. In addition, because many of our products are distributed from a limited number of locations , our operations could also be interrupted by floods, fires or other natural disasters in these locations, as well as labor or other operational difficulties or interruptions. We maintain business interruption insurance, but it may not adequately protect us from the adverse effects that could be caused by significant disruptions in our distribution facilities, such as the long term loss of customers or an erosion of our brand image. In addition, our distribution capacity is dependent on the timely performance of services by third parties, including the shipping of product to and from our distribution facilities. If we encounter problems with our distribution facilities, our ability to meet customer expectations, manage inventory, complete sales and achieve objectives for operating efficiencies could be materially adversely affected.
We rely significantly on information technology and any failure, inadequacy or interruption of that technology could harm our ability to effectively operate our business.
Our business increasingly relies on information technology. Our ability to effectively manage and maintain our inventory and internal reports, and to ship products to customers and invoice them on a timely basis depends significantly on our enterprise resource planning, warehouse management, and other information systems. We also heavily rely on information systems to process financial and accounting information for financial reporting purposes. Any of these information systems could fail or experience a service interruption for a number of reasons, including computer viruses, programming errors, hacking or other unlawful activities, disasters or our failure to properly maintain system redundancy or protect, repair, maintain or upgrade our systems. The failure of our information systems to operate effectively or to integrate with other systems, or a breach in security of these systems could cause delays in product fulfillment and reduced efficiency of our operations, which could negatively impact our financial results. If we experienced any significant disruption to our financial information systems that we are unable to mitigate, our ability to timely report our financial results could be impacted, which could negatively impact our stock price. We also communicate electronically throughout the world with our employees and with third parties, such as customers, suppliers, vendors and consumers. A service interruption or shutdown could negatively impact our operating activities. Remediation and repair of any failure, problem or breach of our key information systems could require significant capital investments.
In addition, the performance of our Connected Fitness business is dependent on reliable performance of its products, applications and services and the underlying technical infrastructure, which incorporate complex software. If this software contains errors, bugs or other vulnerabilities which impede or halt service, this could result in damage to our reputation and brand, loss of users or loss of revenue.
15
Data security or privacy breaches could damage our reputation, cause us to incur additional expense, expose us to litigation and adversely affect our business.
We collect sensitive and proprietary business information as well as personally identifiable information in connection with digital marketing, digital commerce, our in-store payment processing systems and our Connected Fitness business. In particular, in our Connected Fitness business we collect and store a variety of information regarding our users, and allow users to share their personal information with each other and with third parties. Hackers and data thieves are increasingly sophisticated and operate large scale and complex automated attacks. Any breach of our data security could result in an unauthorized release or transfer of customer, consumer, user or employee information, or the loss of valuable business data or cause a disruption in our business. These events could give rise to unwanted media attention, damage our reputation, damage our customer, consumer or user relationships and result in lost sales, fines or lawsuits. We may also be required to expend significant capital and other resources to protect against or respond to or alleviate problems caused by a security breach.
We must also comply with increasingly complex regulatory standards throughout the world enacted to protect personal information and other data, particularly with respect to our Connected Fitness business. Compliance with existing and proposed laws and regulations can be costly. In addition, an inability to maintain compliance with these regulatory standards could subject us to litigation or other regulatory proceedings.
Changes in tax laws and unanticipated tax liabilities could adversely affect our effective income tax rate and profitability.
We are subject to income taxes in the United States and numerous foreign jurisdictions. Our effective income tax rate could be adversely affected in the future by a number of factors, including changes in the mix of earnings in countries with differing statutory tax rates, changes in the valuation of deferred tax assets and liabilities, changes in tax laws, the outcome of income tax audits in various jurisdictions around the world, and any repatriation of non-US earnings for which we have not previously provided for U.S. taxes. We regularly assess all of these matters to determine the adequacy of our tax provision, which is subject to significant judgment.
Our financial results may be adversely affected if substantial investments in businesses and operations fail to produce expected returns.
From time to time, we may invest in business infrastructure, new businesses, and expansion of existing businesses, such as the ongoing expansion of our network of brand and factory house stores and our distribution facilities, the expansion of our corporate headquarters or investments in our Connected Fitness business. These investments require substantial cash investments and management attention. We believe cost effective investments are essential to business growth and profitability. The failure of any significant investment to provide the returns or synergies we expect could adversely affect our financial results. Infrastructure investments may also divert funds from other potential business opportunities.
Our future success is substantially dependent on the continued service of our senior management and other key employees.
Our future success is substantially dependent on the continued service of our senior management and other key employees, particularly Kevin A. Plank, our founder, Chairman and Chief Executive Officer. The loss of the services of our senior management or other key employees could make it more difficult to successfully operate our business and achieve our business goals.
We also may be unable to retain existing management, product creation, sales, marketing, operational and other support personnel that are critical to our success, which could result in harm to key customer relationships, loss of key information, expertise or know-how and unanticipated recruitment and training costs.
If we are unable to attract and retain new team members, including senior management, we may not be able to achieve our business objectives.
Our growth has largely been the result of significant contributions by our current senior management, product design teams and other key employees. However, to be successful in continuing to grow our business, we will need to continue to attract, retain and motivate highly talented management and other employees with a range of skills and experience. Competition for employees in our industry is intense and we have experienced difficulty from time to time in attracting the personnel necessary to support the growth of our business, and we may experience similar difficulties in the future. If we are unable to attract, assimilate and retain management and other employees with the necessary skills, we may not be able to grow or successfully operate our business.
16
Kevin Plank, our Chairman and Chief Executive Officer controls the majority of the voting power of our common stock.
Our Class A Common Stock, or Class A Stock, has one vote per share and our Class B Convertible Common Stock, or Class B Stock, has 10 votes per share. Our Chairman and Chief Executive Officer, Kevin A. Plank, beneficially owns all outstanding shares of Class B Stock. As a result, Mr. Plank has the majority voting control and is able to direct the election of all of the members of our Board of Directors and other matters we submit to a vote of our stockholders. This concentration of voting control may have various effects including, but not limited to, delaying or preventing a change of control. The Class B Stock automatically converts to Class A Stock when Mr. Plank beneficially owns less than 15.0% of the total number of shares of Class A and Class B Stock outstanding. Otherwise the Class B Stock does not convert to Class A Stock until Mr. Plank's death or disability. As a result, Mr. Plank can retain his voting control even after he is no longer affiliated with the Company.
A number of our fabrics and manufacturing technology are not patented and can be imitated by our competitors.
The intellectual property rights in the technology, fabrics and processes used to manufacture our products are generally owned or controlled by our suppliers and are generally not unique to us. Our ability to obtain patent protection for our products is limited and we currently own a limited number of fabric or process patents. As a result, our current and future competitors are able to manufacture and sell products with performance characteristics and fabrications similar to certain of our products. Because many of our competitors have significantly greater financial, distribution, marketing and other resources than we do, they may be able to manufacture and sell products based on certain of our fabrics and manufacturing technology at lower prices than we can. If our competitors do sell similar products to ours at lower prices, our net revenues and profitability could be materially adversely affected.
Our intellectual property rights could potentially conflict with the rights of others and we may be prevented from selling or providing some of our products.
Our success depends in large part on our brand image. We believe our registered and common law trademarks have significant value and are important to identifying and differentiating our products from those of our competitors and creating and sustaining demand for our products. In addition, patents are increasingly important with respect to our innovative products and new businesses and investments, particularly in our Connected Fitness business. From time to time, we have received or brought claims relating to intellectual property rights of others, and we expect such claims will continue or increase, particularly as we expand our business and the number of products we offer. Any such claim, regardless of its merit, could be expensive and time consuming to defend or prosecute. Successful infringement claims against us could result in significant monetary liability or prevent us from selling or providing some of our products. In addition, resolution of claims may require us to redesign our products, license rights belonging to third parties or cease using those rights altogether. Any of these events could harm our business and have a material adverse effect on our results of operations and financial condition.
Our failure to protect our intellectual property rights could diminish the value of our brand, weaken our competitive position and reduce our net revenues.
We currently rely on a combination of copyright, trademark and trade dress laws, patent laws, unfair competition laws, confidentiality procedures and licensing arrangements to establish and protect our intellectual property rights. The steps taken by us to protect our proprietary rights may not be adequate to prevent infringement of our trademarks and proprietary rights by others, including imitation of our products and misappropriation of our brand. In addition, intellectual property protection may be unavailable or limited in some foreign countries where laws or law enforcement practices may not protect our proprietary rights as fully as in the United States, and it may be more difficult for us to successfully challenge the use of our proprietary rights by other parties in these countries. If we fail to protect and maintain our intellectual property rights, the value of our brand could be diminished and our competitive position may suffer.
From time to time, we discover unauthorized products in the marketplace that are either counterfeit reproductions of our products or unauthorized irregulars that do not meet our quality control standards. If we are unsuccessful in challenging a third party’s products on the basis of trademark infringement, continued sales of their products could adversely impact our brand, result in the shift of consumer preferences away from our products and adversely affect our business.
We have licensed in the past, and expect to license in the future, certain of our proprietary rights, such as trademarks or copyrighted material, to third parties. These licensees may take actions that diminish the value of our proprietary rights or harm our reputation.
17
We are subject to periodic claims and litigation that could result in unexpected expenses and could ultimately be resolved against us
.
From time to time, we are involved in litigation and other proceedings, including matters related to commercial disputes and intellectual property, as well as trade, regulatory and other claims related to our business. Any of these proceedings could result in damages, fines or other penalties, divert financial and management resources and result in significant legal fees. Although we cannot predict the outcome of any particular proceeding, an unfavorable outcome may have an adverse impact on our business, financial condition and results of operations. In addition, any proceeding could negatively impact our reputation among our customers and our brand image.
|
ITEM 1B.
|
UNRESOLVED STAFF COMMENTS
|
Not applicable.
18
|
ITEM 2.
|
PROPERTIES
|
The following includes a summary of the principal properties that we own or lease as of December 31, 2014.
Our principal executive and administrative offices are located at an office complex in Baltimore, Maryland, which includes 400 thousand square feet of office space that we own and 126 thousand square feet that we are leasing with an option to renew in December 2015. In 2014 we entered into a lease for an additional 130 thousand square feet of office space located near our principal offices in Baltimore in order to expand our corporate headquarters. The lease has a ten year term beginning in 2016. For our European headquarters, we lease an office in Amsterdam, the Netherlands, and we maintain an international management office in Panama as well.
We lease our primary distribution facilities, which are located in Glen Burnie, Maryland and Rialto, California. Our Glen Burnie facilities include a total of 830 thousand square feet, with options to renew various portions of the facilities on dates ranging from December 2016 to September 2021. Our Rialto facility is a 1,200 thousand square foot facility with a lease term through May 2023. We believe our distribution facilities and space available through our third-party logistics providers will be adequate to meet our short term needs. In late 2015, we expect to begin operations in a new 1,000 thousand square foot leased distribution facility being developed for us in the Nashville, Tennessee area. We may expand to additional distribution facilities in the future.
In addition, as of December 31, 2014, we leased 147 brand and factory house stores located in the United States, Canada, China, Chile and Mexico with lease end dates in 2015 through 2028. We also lease additional office space for sales, quality assurance and sourcing, marketing, and administrative functions. We anticipate that we will be able to extend these leases that expire in the near future on satisfactory terms or relocate to other locations.
|
ITEM 3.
|
LEGAL PROCEEDINGS
|
From time to time, we have been involved in litigation and other proceedings, including matters related to commercial disputes and intellectual property, as well as trade, regulatory and other claims related to our business. We believe all current proceedings are routine in nature and incidental to the conduct of our business, and we believe no such proceedings will have a material adverse effect on our financial condition, results of operations or cash flows.
19
EXECUTIVE OFFICERS OF THE REGISTRANT
Our executive officers are:
|
Name
|
Age
|
Position
|
||
|
Kevin A. Plank
|
42
|
Chairman and Chief Executive Officer
|
||
|
Kerry D. Chandler
|
50
|
Chief Human Resources Officer
|
||
|
Brad Dickerson
|
50
|
Chief Financial Officer
|
||
|
Kip J. Fulks
|
42
|
Chief Operating Officer
|
||
|
James H. Hardy, Jr.
|
55
|
Chief Supply Chain Officer
|
||
|
Karl-Heinz Maurath
|
53
|
President, International
|
||
|
Matthew C. Mirchin
|
55
|
President, North America
|
||
|
Adam Peake
|
46
|
Executive Vice President, Global Marketing
|
||
|
Henry B. Stafford
|
40
|
Chief Merchandising Officer
|
||
Kevin A. Plank
has served as our Chief Executive Officer and Chairman of the Board of Directors since 1996. Mr. Plank also serves on the Board of Directors of the National Football Foundation and College Hall of Fame, Inc. and is a member of the Board of Trustees of the University of Maryland College Park Foundation.
Kerry D. Chandler
has been Chief Human Resources Officer since January 2015. Prior to joining our Company, she served as Global Head of Human Resources for Christie’s International from February 2014 to November 2014. Prior thereto, Ms. Chandler served as the Executive Vice President of Human Resources for the National Basketball Association from January 2011 to January 2014 and Senior Vice President of Human Resources from October 2007 to December 2010. Ms. Chandler also held executive positions in human resources for the Walt Disney Company, including Senior Vice President of Human Resources for ESPN. Prior to that, Ms. Chandler also held various senior management positions in Human Resources for IBM, and Motorola, Inc. and she began her career at the McDonnell Douglas Corporation.
Brad Dickerson
has been our Chief Financial Officer since March 2008. Prior to that, he served as Vice President of Accounting and Finance from February 2006 to February 2008 and Corporate Controller from July 2004 to February 2006. Prior to joining our Company, Mr. Dickerson served as Chief Financial Officer of Macquarie Aviation North America from January 2003 to July 2004 and in various capacities for Network Building & Consulting from 1994 to 2003, including Chief Financial Officer from 1998 to 2003.
Kip J. Fulks
has been Chief Operating Officer since September 2011. He currently oversees the Company’s supply chain operations, information technology, security, product innovation and global footwear. He previously served as President of Product from October 2013 to November 2014, as Executive Vice President of Product from January 2011 to August 2011 and Senior Vice President of Outdoor and Innovation from March 2008 to December 2010. He also held various senior management positions in Outdoor, Sourcing, Quality Assurance and Product Development from 1997 to February 2008.
James H. Hardy, Jr.
has been Chief Supply Chain Officer since April 2012. Prior to joining our Company, he served as Senior Vice President of Operations for Hospira, a leading manufacturer of pharmaceutical products, from January 2011 to April 2012 and as Corporate Vice President of Supply Chain from October 2009 to December 2010. Prior thereto, Mr. Hardy served as Senior Vice President of Supply Chain for Dial Corporation from October 2007 to October 2009, as Executive Vice President of Product Supply for ConAgra Foods, Inc. from 2005 to 2007 and held various supply chain management leadership positions at The Clorox Company and The Procter & Gamble Company.
Karl-Heinz Maurath
has been President of International since September 2012. Prior to joining our Company, he served for 22 years in various leadership positions with adidas, including Senior Vice President, adidas Group Latin America, from 2003 to 2012 with overall responsibility for Latin America including the Reebok and Taylor Made businesses and Vice President, adidas Nordic, from 2000 to 2003 responsible for its business in the Nordic region and the Baltic states. Prior thereto, Mr. Maurath served in other management positions for adidas, including Managing Director of its business in Sweden and Thailand and Area Manger of sales and marketing for its distributor and licensee businesses in Scandinavia and Latin America. Mr. Maurath, in his capacity as a former director of a subsidiary of adidas, is currently named as a defendant in a criminal tax investigation by regulatory authorities in Argentina related to certain tax matters of the adidas subsidiary in 2006. In November 2013, the court ruled that there were currently no grounds upon which to indict Mr. Maurath. Although the case remains open pending a final determination, the Company believes that the matter will ultimately be dismissed. The Company believes this case in no way impacts Mr. Maurath’s integrity or ability to serve as an executive officer.
Matthew C. Mirchin
has been President of North America since December 2014. Prior to that, he served as Executive Vice President, Global Marketing from October 2013 to November 2014, Senior Vice President, Global Brand and Sports
20
Marketing from March 2012 to September 2013 and Senior Vice President of Sports Marketing from January 2010 to February 2012. He also held various senior management positions in Sales from May 2005 to December 2009. Prior to joining our Company, Mr. Mirchin served as President of Retail and Team Sports from 2002 to 2005 and President of Team Sports from 2001 to 2002 for Russell Athletic. Prior to joining Russell Athletic, Mr. Mirchin served in various capacities at the Champion Division of Sara Lee Corporation from 1994 to 2001 and started his career with the NBA.
Adam Peake
has been the Executive Vice President of Global Marketing since December 2014. Prior to that he served as Senior Vice President of Sales, North America and was the principal executive in charge of North American Sales from January 2010 to November 2014. He also served as interim Vice President of Footwear from May 2009 to December 2009 and held various senior management positions in Sales for the Company from 2002 to 2009.
Henry B. Stafford
has been Chief Merchandising Officer since December 2014. He is responsible for the integration of the Company’s apparel, accessories and merchandizing globally and oversees the Company’s direct to consumer sales channels. Prior to that, he served as President of North America from October 2013 to November 2014, Senior Vice President of Apparel, Outdoor & Accessories from September 2011 to September 2013 and as Senior Vice President of Apparel from June 2010 to August 2011. Prior to joining our company, he worked with American Eagle Outfitters as Senior Vice President and Chief Merchandising Officer of The AE Brand from April 2007 to May 2010, General Merchandise Manager and Senior Vice President of Men’s and AE Canadian Division from April 2005 to March 2007 and General Merchandise Manager and Vice President of Men’s from September 2003 to March 2005. Prior thereto, Mr. Stafford served in a variety of capacities for Old Navy from 1998 to 2003, including Divisional Merchandising Manager for Men’s Tops from 2001 to 2003, and served as a buyer for Abercrombie and Fitch from 1996-1998.
|
ITEM 4.
|
MINE SAFETY DISCLOSURES
|
Not applicable.
21
|
ITEM 5.
|
MARKET FOR REGISTRANT’S COMMON EQUITY, RELATED STOCKHOLDER MATTERS AND ISSUER PURCHASES OF EQUITY SECURITIES
|
Under Armour’s Class A Common Stock is traded on the New York Stock Exchange (“NYSE”) under the symbol “UA”. As of
January 31, 2015
, there were
1,151
record holders of our Class A Common Stock and
5
record holders of Class B Convertible Common Stock which are beneficially owned by our Chief Executive Officer and Chairman of the Board Kevin A. Plank. The following table sets forth by quarter the high and low sale prices of our Class A Common Stock on the NYSE during
2014
and
2013
.
|
High
|
Low
|
|||||||
|
2014
|
|
|
||||||
|
First Quarter (January 1 – March 31)
|
$
|
62.40
|
|
$
|
40.98
|
|
||
|
Second Quarter (April 1 – June 30)
|
$
|
60.17
|
|
$
|
45.05
|
|
||
|
Third Quarter (July 1 – September 30)
|
$
|
73.42
|
|
$
|
56.79
|
|
||
|
Fourth Quarter (October 1 – December 31)
|
$
|
72.98
|
|
$
|
60.00
|
|
||
|
2013
|
|
|
||||||
|
First Quarter (January 1 – March 31)
|
$
|
25.97
|
|
$
|
22.16
|
|
||
|
Second Quarter (April 1 – June 30)
|
$
|
32.78
|
|
$
|
25.15
|
|
||
|
Third Quarter (July 1 – September 30)
|
$
|
40.82
|
|
$
|
29.73
|
|
||
|
Fourth Quarter (October 1 – December 31)
|
$
|
43.96
|
|
$
|
37.72
|
|
||
Stock Split
On June 11, 2012 and March 17, 2014 the Board of Directors declared two-for-one stock splits of the Company's Class A and Class B common stock, which were effected in the form of a 100% common stock dividend distributed on July 9, 2012 and April 14, 2014, respectively. Stockholders' equity and all references to share and per share amounts herein and in the accompanying consolidated financial statements have been retroactively adjusted to reflect each of the two-for-one stock splits for all periods presented.
Dividends
No cash dividends were declared or paid during
2014
or
2013
on any class of our common stock. We currently anticipate we will retain any future earnings for use in our business. As a result, we do not anticipate paying any cash dividends in the foreseeable future. In addition, we may be limited in our ability to pay dividends to our stockholders under our credit facility. Refer to “Financial Position, Capital Resources and Liquidity” within Management’s Discussion and Analysis and Note 6 to the Consolidated Financial Statements for further discussion of our credit facility.
Stock Compensation Plans
The following table contains certain information regarding our equity compensation plans.
|
Plan Category
|
Number of
securities to be
issued upon exercise of
outstanding options,
warrants and rights
(a)
|
Weighted-average
exercise price of
outstanding options,
warrants and rights
(b)
|
Number of securities
remaining
available for future
issuance under equity
compensation plans
(excluding securities
reflected in column (a))
(c)
|
|||||||
|
Equity compensation plans approved by security holders
|
7,840,362
|
|
$
|
8.28
|
|
22,118,204
|
|
|||
|
Equity compensation plans not approved by security holders
|
2,017,578
|
|
$
|
9.25
|
|
—
|
|
|||
The number of securities to be issued upon exercise of outstanding options, warrants and rights issued under equity compensation plans approved by security holders includes
5.0 million
restricted stock units and deferred stock units issued to employees, non-employees and directors of Under Armour; these restricted stock units and deferred stock units are not included in the weighted average exercise price calculation above. The number of securities remaining available for future issuance includes
19.3 million
shares of our Class A Common Stock under our Amended and Restated 2005 Omnibus Long-Term Incentive Plan (“2005 Stock Plan”) and
2.8 million
shares of our Class A Common Stock under our Employee Stock Purchase Plan. In addition to securities issued upon the exercise of stock options, warrants and rights, the 2005 Stock Plan authorizes the
22
issuance of restricted and unrestricted shares of our Class A Common Stock and other equity awards. Refer to Note 12 to the Consolidated Financial Statements for information required by this Item regarding the material features of each plan.
The number of securities issued upon exercise of outstanding options, warrants and rights issued under equity compensation plans not approved by security holders includes
1,920.0 thousand
fully vested and non-forfeitable warrants granted in 2006 to NFL Properties LLC as partial consideration for footwear promotional rights, and
97.6 thousand
shares of our Class A Common Stock issued in connection with the delivery of shares pursuant to deferred stock units granted to certain of our marketing partners. These deferred stock units are not included in the weighted average exercise price calculation above.
Refer to Note 12 to the Consolidated Financial Statements for a further discussion on the warrants. The deferred stock units are issued to certain of our marketing partners in connection with their entering into endorsement and other marketing services agreements with us. The terms of each agreement set forth the number of deferred stock units to be granted and the delivery dates for the shares, which range from a 1 to 10 year period, depending on the contract. The deferred stock units are non-forfeitable.
Stock Performance Graph
The stock performance graph below compares cumulative total return on Under Armour, Inc. Class A Common Stock to the cumulative total return of the S&P 500 Index and S&P 500 Apparel, Accessories and Luxury Goods Index from December 31, 2009 through December 31, 2014. The graph assumes an initial investment of $100 in Under Armour and each index as of December 31, 2009 and reinvestment of any dividends. The performance shown on the graph below is not intended to forecast or be indicative of possible future performance of our common stock.
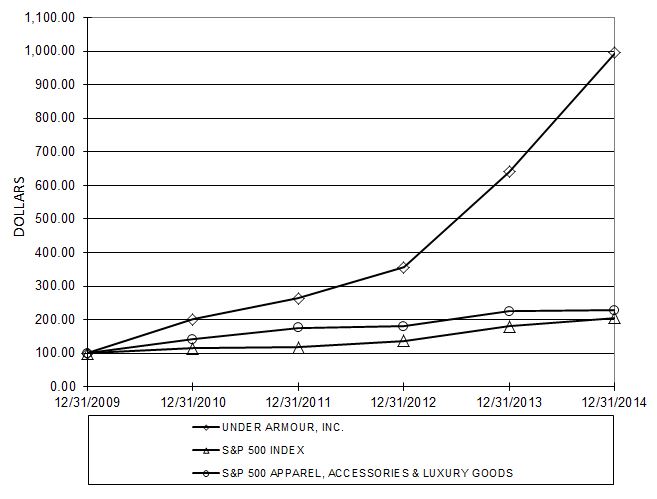
|
12/31/2009
|
12/31/2010
|
12/31/2011
|
12/31/2012
|
12/31/2013
|
12/31/2014
|
||||||||||||||||||
|
Under Armour, Inc.
|
$
|
100.00
|
|
$
|
201.03
|
|
$
|
263.20
|
|
$
|
355.87
|
|
$
|
640.03
|
|
$
|
995.60
|
|
|||||
|
S&P 500
|
$
|
100.00
|
|
$
|
115.06
|
|
$
|
117.49
|
|
$
|
136.30
|
|
$
|
180.44
|
|
$
|
205.14
|
|
|||||
|
S&P 500 Apparel, Accessories & Luxury Goods
|
$
|
100.00
|
|
$
|
141.20
|
|
$
|
175.60
|
|
$
|
180.13
|
|
$
|
225.03
|
|
$
|
227.25
|
|
|||||
23
|
ITEM 6.
|
SELECTED FINANCIAL DATA
|
The following selected financial data is qualified by reference to, and should be read in conjunction with, the Consolidated Financial Statements, including the notes thereto, and “Management’s Discussion and Analysis of Financial Condition and Results of Operations” included elsewhere in this Form 10-K.
|
|
Year Ended December 31,
|
|||||||||||||||||||
|
(In thousands, except per share amounts)
|
2014
|
2013
|
2012
|
2011
|
2010
|
|||||||||||||||
|
Net revenues
|
$
|
3,084,370
|
|
$
|
2,332,051
|
|
$
|
1,834,921
|
|
$
|
1,472,684
|
|
$
|
1,063,927
|
|
|||||
|
Cost of goods sold
|
1,572,164
|
|
1,195,381
|
|
955,624
|
|
759,848
|
|
533,420
|
|
||||||||||
|
Gross profit
|
1,512,206
|
|
1,136,670
|
|
879,297
|
|
712,836
|
|
530,507
|
|
||||||||||
|
Selling, general and administrative expenses
|
1,158,251
|
|
871,572
|
|
670,602
|
|
550,069
|
|
418,152
|
|
||||||||||
|
Income from operations
|
353,955
|
|
265,098
|
|
208,695
|
|
162,767
|
|
112,355
|
|
||||||||||
|
Interest expense, net
|
(5,335
|
)
|
(2,933
|
)
|
(5,183
|
)
|
(3,841
|
)
|
(2,258
|
)
|
||||||||||
|
Other expense, net
|
(6,410
|
)
|
(1,172
|
)
|
(73
|
)
|
(2,064
|
)
|
(1,178
|
)
|
||||||||||
|
Income before income taxes
|
342,210
|
|
260,993
|
|
203,439
|
|
156,862
|
|
108,919
|
|
||||||||||
|
Provision for income taxes
|
134,168
|
|
98,663
|
|
74,661
|
|
59,943
|
|
40,442
|
|
||||||||||
|
Net income
|
$
|
208,042
|
|
$
|
162,330
|
|
$
|
128,778
|
|
$
|
96,919
|
|
$
|
68,477
|
|
|||||
|
Net income available per common share
|
||||||||||||||||||||
|
Basic
|
$
|
0.98
|
|
$
|
0.77
|
|
$
|
0.62
|
|
$
|
0.47
|
|
$
|
0.34
|
|
|||||
|
Diluted
|
$
|
0.95
|
|
$
|
0.75
|
|
$
|
0.61
|
|
$
|
0.46
|
|
$
|
0.33
|
|
|||||
|
Weighted average common shares outstanding
|
||||||||||||||||||||
|
Basic
|
213,227
|
|
210,696
|
|
208,686
|
|
206,280
|
|
203,190
|
|
||||||||||
|
Diluted
|
219,380
|
|
215,958
|
|
212,760
|
|
210,104
|
|
205,126
|
|
||||||||||
|
Dividends declared
|
$
|
—
|
|
$
|
—
|
|
$
|
—
|
|
$
|
—
|
|
$
|
—
|
|
|||||
|
|
At December 31,
|
|||||||||||||||||||
|
(In thousands)
|
2014
|
2013
|
2012
|
2011
|
2010
|
|||||||||||||||
|
Cash and cash equivalents
|
$
|
593,175
|
|
$
|
347,489
|
|
$
|
341,841
|
|
$
|
175,384
|
|
$
|
203,870
|
|
|||||
|
Working capital (1)
|
1,127,772
|
|
702,181
|
|
651,370
|
|
506,056
|
|
406,703
|
|
||||||||||
|
Inventories
|
536,714
|
|
469,006
|
|
319,286
|
|
324,409
|
|
215,355
|
|
||||||||||
|
Total assets
|
2,095,083
|
|
1,577,741
|
|
1,157,083
|
|
919,210
|
|
675,378
|
|
||||||||||
|
Total debt, including current maturities
|
284,201
|
|
152,923
|
|
61,889
|
|
77,724
|
|
15,942
|
|
||||||||||
|
Total stockholders’ equity
|
$
|
1,350,300
|
|
$
|
1,053,354
|
|
$
|
816,922
|
|
$
|
636,432
|
|
$
|
496,966
|
|
|||||
|
(1)
|
Working capital is defined as current assets minus current liabilities.
|
24
|
ITEM 7.
|
MANAGEMENT’S DISCUSSION AND ANALYSIS OF FINANCIAL CONDITION AND RESULTS OF OPERATIONS
|
The information contained in this section should be read in conjunction with our Consolidated Financial Statements and related notes and the information contained elsewhere in this Form 10-K under the captions “Risk Factors,” “Selected Financial Data,” and “Business.”
Overview
We are a leading developer, marketer and distributor of branded performance apparel, footwear and accessories. The brand’s moisture-wicking fabrications are engineered in many different designs and styles for wear in nearly every climate to provide a performance alternative to traditional products. Our products are sold worldwide and worn by athletes at all levels, from youth to professional, on playing fields around the globe, as well as by consumers with active lifestyles.
Our net revenues grew to $
3,084.4 million
in
2014
from
$1,063.9 million
in
2010
. We believe that our growth in net revenues has been driven by a growing interest in performance products and the strength of the Under Armour brand in the marketplace. We plan to continue to increase our net revenues over the long term by increased sales of our apparel, footwear and accessories, expansion of our wholesale distribution sales channel, growth in our direct to consumer sales channel and expansion in international markets. Our direct to consumer sales channel includes our brand and factory house stores and websites. New offerings for
2014
include MagZip
TM
, ArmourVent
®
apparel, the UA SpeedForm
TM
Apollo running shoe, and UA ClutchFit
TM
Drive basketball shoe.
A large majority of our products are sold in North America; however, we believe our products appeal to athletes and consumers with active lifestyles around the globe. Internationally, our net revenues are generated from a mix of wholesale sales to retailers, sales to distributors and sales through our direct to consumer sales channels in Europe, Latin America, and Asia-Pacific. In addition, a third party licensee sells our products in Japan and Korea.
Our operating segments include North America; Latin America; Europe, the Middle East and Africa (“EMEA”); Asia-Pacific; and MapMyFitness. Due to the insignificance of the EMEA, Latin America, Asia and MapMyFitness operating segments, they have been combined into other foreign countries and businesses for disclosure purposes.
We believe there is an increasing recognition of the health benefits of an active lifestyle. We believe this trend provides us with an expanding consumer base for our products. We also believe there is a continuing shift in consumer demand from traditional non-performance products to performance products, which are intended to provide better performance by wicking perspiration away from the skin, helping to regulate body temperature and enhancing comfort. We believe that these shifts in consumer preferences and lifestyles are not unique to the United States, but are occurring in a number of markets globally, thereby increasing our opportunities to introduce our performance products to new consumers. We plan to continue to grow our business over the long term through increased sales of our apparel, footwear and accessories, expansion of our wholesale distribution, growth in our direct to consumer sales channel and expansion in international markets.
Although we believe these trends will facilitate our growth, we also face potential challenges that could limit our ability to take advantage of these opportunities, including, among others, the risk of general economic or market conditions that could affect consumer spending and the financial health of our retail customers. In addition, we may not be able to effectively manage our growth and a more complex global business. We may not consistently be able to anticipate consumer preferences and develop new and innovative products that meet changing preferences in a timely manner. Furthermore, our industry is very competitive, and competition pressures could cause us to reduce the prices of our products or otherwise affect our profitability. We also rely on third-party suppliers and manufacturers outside the U.S. to provide fabrics and to produce our products, and disruptions to our supply chain could harm our business. For a more complete discussion of the risks facing our business, refer to the “Risk Factors” section included in Item 1A.
General
Net revenues comprise both net sales and license and other revenues. Net sales comprise sales from our primary product categories, which are apparel, footwear and accessories. Our license and other revenues primarily consist of fees paid to us by our licensees in exchange for the use of our trademarks on core products of socks, team uniforms, baby and kids’ apparel, eyewear, inflatable footballs and basketballs, the distribution of our products in Japan, and revenues associated with our MapMyFitness business.
Cost of goods sold consists primarily of product costs, inbound freight and duty costs, outbound freight costs, handling costs to make products floor-ready to customer specifications, royalty payments to endorsers based on a predetermined
25
percentage of sales of selected products and write downs for inventory obsolescence. The fabrics in many of our products are made primarily of petroleum-based synthetic materials. Therefore our product costs, as well as our inbound and outbound freight costs, could be affected by long term pricing trends of oil. In general, as a percentage of net revenues, we expect cost of goods sold associated with our apparel and accessories to be lower than that of our footwear. A limited portion of cost of goods sold is associated with license and other revenues, primarily website hosting and other costs related to our MapMyFitness business.
We include outbound freight costs associated with shipping goods to customers as cost of goods sold; however, we include the majority of outbound handling costs as a component of selling, general and administrative expenses. As a result, our gross profit may not be comparable to that of other companies that include outbound handling costs in their cost of goods sold. Outbound handling costs include costs associated with preparing goods to ship to customers and certain costs to operate our distribution facilities. These costs were $
55.3 million
, $
46.1 million
and $
34.8 million
for the years ended
December 31, 2014
,
2013
and
2012
, respectively.
Our selling, general and administrative expenses consist of costs related to marketing, selling, product innovation and supply chain and corporate services. Personnel costs are included in these categories based on the employees’ function. Personnel costs include salaries, benefits, incentives and stock-based compensation related to our employees. Our marketing costs are an important driver of our growth. Marketing costs consist primarily of commercials, print ads, league, team, player and event sponsorships and depreciation expense specific to our in-store fixture program for our concept shops. Selling costs consist primarily of costs relating to sales through our wholesale channel, commissions paid to third parties and the majority of our direct to consumer sales channel costs, including the cost of brand and factory house store leases. Product innovation and supply chain costs include development and innovation costs associated with our apparel, footwear and accessories products and our MapMyFitness business, along with our sourcing and distribution facility operating costs, and costs relating to our Hong Kong and Guangzhou, China offices which help support product development, manufacturing, quality assurance and sourcing efforts. Corporate services primarily consist of corporate facility operating costs and company-wide administrative expenses.
Other expense, net consists of unrealized and realized gains and losses on our foreign currency derivative financial instruments and unrealized and realized gains and losses on adjustments that arise from fluctuations in foreign currency exchange rates relating to transactions generated by our international subsidiaries.
Results of Operations
The following table sets forth key components of our results of operations for the periods indicated, both in dollars and as a percentage of net revenues:
|
|
Year Ended December 31,
|
|||||||||||
|
(In thousands)
|
2014
|
2013
|
2012
|
|||||||||
|
Net revenues
|
$
|
3,084,370
|
|
$
|
2,332,051
|
|
$
|
1,834,921
|
|
|||
|
Cost of goods sold
|
1,572,164
|
|
1,195,381
|
|
955,624
|
|
||||||
|
Gross profit
|
1,512,206
|
|
1,136,670
|
|
879,297
|
|
||||||
|
Selling, general and administrative expenses
|
1,158,251
|
|
871,572
|
|
670,602
|
|
||||||
|
Income from operations
|
353,955
|
|
265,098
|
|
208,695
|
|
||||||
|
Interest expense, net
|
(5,335
|
)
|
(2,933
|
)
|
(5,183
|
)
|
||||||
|
Other expense, net
|
(6,410
|
)
|
(1,172
|
)
|
(73
|
)
|
||||||
|
Income before income taxes
|
342,210
|
|
260,993
|
|
203,439
|
|
||||||
|
Provision for income taxes
|
134,168
|
|
98,663
|
|
74,661
|
|
||||||
|
Net income
|
$
|
208,042
|
|
$
|
162,330
|
|
$
|
128,778
|
|
|||
26
|
|
Year Ended December 31,
|
||||||||
|
(As a percentage of net revenues)
|
2014
|
2013
|
2012
|
||||||
|
Net revenues
|
100.0
|
%
|
100.0
|
%
|
100.0
|
%
|
|||
|
Cost of goods sold
|
51.0
|
|
51.3
|
|
52.1
|
|
|||
|
Gross profit
|
49.0
|
|
48.7
|
|
47.9
|
|
|||
|
Selling, general and administrative expenses
|
37.5
|
|
37.3
|
|
36.5
|
|
|||
|
Income from operations
|
11.5
|
|
11.4
|
|
11.4
|
|
|||
|
Interest expense, net
|
(0.2
|
)
|
(0.1
|
)
|
(0.3
|
)
|
|||
|
Other expense, net
|
(0.2
|
)
|
(0.1
|
)
|
—
|
|
|||
|
Income before income taxes
|
11.1
|
|
11.2
|
|
11.1
|
|
|||
|
Provision for income taxes
|
4.4
|
|
4.2
|
|
4.1
|
|
|||
|
Net income
|
6.7
|
%
|
7.0
|
%
|
7.0
|
%
|
|||
Consolidated Results of Operations
Year Ended
December 31, 2014
Compared to Year Ended
December 31, 2013
Net revenues
increase
d
$752.3 million
, or
32.3%
, to $
3,084.4 million
in
2014
from $
2,332.1 million
in
2013
. Net revenues by product category are summarized below:
|
|
Year Ended December 31,
|
||||||||||||||
|
(In thousands)
|
2014
|
2013
|
$ Change
|
% Change
|
|||||||||||
|
Apparel
|
$
|
2,291,520
|
|
$
|
1,762,150
|
|
$
|
529,370
|
|
30.0
|
%
|
||||
|
Footwear
|
430,987
|
|
298,825
|
|
132,162
|
|
44.2
|
|
|||||||
|
Accessories
|
275,425
|
|
216,098
|
|
59,327
|
|
27.5
|
|
|||||||
|
Total net sales
|
2,997,932
|
|
2,277,073
|
|
720,859
|
|
31.7
|
|
|||||||
|
License and other revenues
|
86,438
|
|
54,978
|
|
31,460
|
|
57.2
|
|
|||||||
|
Total net revenues
|
$
|
3,084,370
|
|
$
|
2,332,051
|
|
$
|
752,319
|
|
32.3
|
%
|
||||
Net sales
increased
$720.8 million
, or
31.7%
, to
$2,997.9 million
in
2014
from
$2,277.1 million
in
2013
. The increase in net sales primarily reflects:
|
•
|
$220.5 million, or 31.5%, increase in North America direct to consumer sales driven by a 17% increase in square footage in our factory house stores, including an 7% increase in new stores, since December 2013, along with continued growth in our e-commerce business;
|
|
•
|
$128.5 million, or 108.4% increase in net sales in other foreign countries, primarily due to increased distribution and unit volume growth in our EMEA and Latin America operating segments;
and
|
|
•
|
unit growth driven by increased distribution and new offerings in multiple product categories, including continued growth of our training, outdoor and golf apparel product lines, along with
growth in footwear due to a broader assortment of running and basketball shoes, including our new
UA SpeedForm
TM
footwear.
|
License and other revenues
increase
d $
31.4 million
, or
57.2%
, to $
86.4 million
in
2014
from $
55.0 million
in
2013
. This
increase
in license and other revenues was primarily due to an increase of $18.1 million in revenues in our MapMyFitness operating segment, along with increased distribution and unit volume growth of our licensed products.
Gross profit
increase
d $
375.5 million
to $
1,512.2 million
in
2014
from $
1,136.7 million
in
2013
. Gross profit as a percentage of net revenues, or gross margin,
increase
d
30
basis points to
49.0%
in
2014
compared to
48.7%
in
2013
. The
increase
in gross margin percentage was primarily driven by the following:
|
•
|
approximate 20 basis point increase driven primarily by decreased sales mix of excess inventory through our factory house outlet stores. We expect the favorable factory house outlet store sales mix impact will continue into 2015;
|
|
•
|
approximate 20 basis point increase as a result of higher duty costs recorded during the prior year on certain products imported in previous years. We do not expect this favorable impact to continue during 2015;
|
The above increases were partially offset by:
|
•
|
approximate 10 basis point decrease driven by unfavorable foreign currency exchange rate fluctuations. We expect the unfavorable impact of foreign exchange rate fluctuations to continue in 2015.
|
27
Selling, general and administrative expenses
increased
$286.7 million
to
$1,158.3 million
in
2014
from
$871.6 million
in
2013
. As a percentage of net revenues, selling, general and administrative expenses increased to
37.5%
in
2014
from
37.3%
in
2013
. These changes were primarily attributable to the following:
|
•
|
Marketing costs
increased
$86.5 million
to
$333.0 million
in
2014
from
$246.5 million
in
2013
primarily due to increased global sponsorship of professional teams and athletes. As a percentage of net revenues, marketing costs
increased
to
10.8%
in
2014
from
10.5%
in
2013
primarily due to the items noted above.
|
|
•
|
Selling costs
increased
$81.0 million
to
$320.9 million
in
2014
from
$239.9 million
in
2013
. This increase was primarily due to higher personnel and other costs incurred for the continued expansion of our direct to consumer distribution channel, including increased investment in our factory house and brand house store strategies.
As a percentage of net revenues, selling costs
increased
to
10.4%
in
2014
from
10.3%
in
2013
.
|
|
•
|
Product innovation and supply chain costs
increased
$82.4 million
to
$291.6 million
in
2014
from
$209.2 million
in
2013
primarily due to higher personnel costs to support our growth in net revenues, along with increased investment in our MapMyFitness business. As a percentage of net revenues, product innovation and supply chain costs
increased
to
9.4%
in
2014
from
9.0%
in
2013
primarily due to the items noted above.
|
|
•
|
Corporate services costs
increased
$36.8 million
to
$212.8 million
in
2014
from
$176.0 million
in
2013
primarily due to higher personnel and other administrative costs necessary to support our growth. As a percentage of net revenues, corporate services costs
decreased
to
6.9%
in
2014
from
7.5%
in
2013
primarily due to higher incentive compensation in the prior year.
|
Income from operations
increase
d $
88.9 million
, or
33.5%
, to $
354.0 million
in
2014
from $
265.1 million
in
2013
. Income from operations as a percentage of net revenues increased to
11.5%
in
2014
from
11.4%
in
2013
.
Interest expense, net
increased $
2.4 million
to $
5.3 million
in
2014
from $
2.9 million
in
2013
. This increase was primarily due to the $150.0 million and $100.0 million term loans we entered into during 2014.
Other expense, net
increased $
5.2 million
to $
6.4 million
in
2014
from $
1.2 million
in
2013
. This increase was due to higher net losses in
2014
on the combined foreign currency exchange rate changes on transactions denominated in foreign currencies and our foreign currency derivative financial instruments as compared to
2013
.
Provision for income taxes
increase
d $35.5 million to $
134.2 million
in
2014
from $
98.7 million
in
2013
.
Our effective tax rate was
39.2%
in
2014
compared to
37.8%
in
2013
. Our effective tax rate for 2014 was higher than the effective tax rate for 2013 primarily due to increased foreign investments driving a lower proportion of foreign taxable income in 2014 and state tax credits received in 2013.
Year Ended December 31, 2013 Compared to Year Ended December 31, 2012
Net revenues
increased $497.2 million, or 27.1%, to $2,332.1 million in 2013 from $1,834.9 million in 2012. Net revenues by product category are summarized below:
|
|
Year Ended December 31,
|
||||||||||||||
|
(In thousands)
|
2013
|
2012
|
$ Change
|
% Change
|
|||||||||||
|
Apparel
|
$
|
1,762,150
|
|
$
|
1,385,350
|
|
$
|
376,800
|
|
27.2
|
%
|
||||
|
Footwear
|
298,825
|
|
238,955
|
|
59,870
|
|
25.1
|
|
|||||||
|
Accessories
|
216,098
|
|
165,835
|
|
50,263
|
|
30.3
|
|
|||||||
|
Total net sales
|
2,277,073
|
|
1,790,140
|
|
486,933
|
|
27.2
|
|
|||||||
|
License and other revenues
|
54,978
|
|
44,781
|
|
10,197
|
|
22.8
|
|
|||||||
|
Total net revenues
|
$
|
2,332,051
|
|
$
|
1,834,921
|
|
$
|
497,130
|
|
27.1
|
%
|
||||
Net sales
increased $487.0 million, or 27.2%, to $2,277.1 million in 2013 from $1,790.1 million in 2012 as noted in the table above. The increase in net sales primarily reflects:
|
•
|
$176.8 million, or 33.2%, increase in direct to consumer sales, which includes 18 additional retail stores, or a 16.5% growth, since December 31, 2012, and continued growth in our e-commerce business;
|
|
•
|
unit growth driven by increased distribution and new offerings in multiple product categories, most significantly in our training and hunting apparel product categories, including our new UA HEATGEAR® Sonic and UA COLDGEAR® Infrared product lines along with continued growth in our UA Storm and Charged Cotton® platforms, and running apparel and footwear, including UA Spine; and
|
28
|
•
|
increased average selling prices driven primarily from our higher priced apparel products, including our mountain category and women's UA Studio line.
|
License and other revenues
increased $10.2 million, or 22.8%, to $55.0 million in 2013 from $44.8 million in 2012. This increase in license and other revenues was primarily a result of increased distribution and continued unit volume growth by our licensees.
Gross profit
increased $257.4 million to $1,136.7 million in 2013 from $879.3 million in 2012. Gross profit as a percentage of net revenues, or gross margin, increased 80 basis points to 48.7% in 2013 compared to 47.9% in 2012. The increase in gross margin percentage was primarily driven by the following:
|
•
|
approximate 60 basis point increase driven by sales mix. The sales mix impact was primarily driven by decreased sales mix of excess inventory through our factory house outlet stores at lower prices, along with a lower proportion of North American wholesale footwear sales.
|
|
•
|
approximate 50 basis point increase driven by lower North American apparel and accessories product input costs.
|
The above increases were partially offset by the below decrease:
|
•
|
approximate 20 basis point decrease as a result of higher duty costs on certain products previously imported, which were identified and reserved for during the third quarter of 2013.
|
Selling, general and administrative expenses
increased $201.0 million to $871.6 million in 2013 from $670.6 million in 2012. As a percentage of net revenues, selling, general and administrative expenses increased to 37.3% in 2013 from 36.5% in 2012. These changes were primarily attributable to the following:
|
•
|
Marketing costs increased $41.1 million to $246.5 million in 2013 from $205.4 million in 2012 primarily due to increased sponsorship of collegiate and professional teams and athletes and marketing to support our international expansion. As a percentage of net revenues, marketing costs decreased to 10.5% in 2013 from 11.2% in 2012.
|
|
•
|
Selling costs increased $63.9 million to $239.9 million in 2013 from $176.0 million in 2012. This increase was primarily due to higher personnel and other costs incurred primarily for the continued expansion of our direct to consumer distribution channel. As a percentage of net revenues, selling costs increased to 10.3% in 2013 from 9.6% in 2012.
|
|
•
|
Product innovation and supply chain costs increased $50.7 million to $209.2 million in 2013 from $158.5 million in 2012 primarily due to higher incentive compensation as well as higher personnel costs to support our growth in net revenues. As a percentage of net revenues, product innovation and supply chain costs increased to 9.0% in 2013 from 8.6% in 2012.
|
|
•
|
Corporate services costs increased $45.3 million to $176.0 million in 2013 from $130.7 million in 2012. This increase was primarily attributable to higher incentive compensation as well as higher corporate personnel costs necessary to support our growth. As a percentage of net revenues, corporate services costs increased to 7.5% in 2013 from 7.1% in 2012.
|
Income from operations
increased $56.4 million, or 27.0%, to $265.1 million in 2013 from $208.7 million in 2012. Income from operations as a percentage of net revenues was unchanged at 11.4% in 2013 and 2012.
Interest expense, net
decreased $2.3 million to $2.9 million in 2013 from $5.2 million in 2012. This decrease was primarily due to the refinancing in December 2012 of the debt assumed in connection with the acquisition of our corporate headquarters.
Other expense, net
increased $1.1 million to $1.2 million in 2013 from $0.1 million in 2012. This increase was due to higher net losses in 2013 on the combined foreign currency exchange rate changes on transactions denominated in foreign currencies and our foreign currency derivative financial instruments as compared to 2012.
Provision for income taxes
increased $24.0 million to $98.7 million in 2013 from $74.7 million in 2012. Our effective tax rate was 37.8% in 2013 compared to 36.7% in 2012. Our effective tax rate for 2013 was higher than the effective tax rate for 2012 primarily due to increased foreign investments driving a lower proportion of foreign taxable income, along with increased non-deductible expenses, including acquisition related expenses, in 2013.
29
Segment Results of Operations
The net revenues and operating income (loss) associated with our segments are summarized in the following tables. The majority of corporate expenses within North America have not been allocated to other foreign countries and businesses.
Year Ended
December 31, 2014
Compared to Year Ended
December 31, 2013
Net revenues
by segment are summarized below:
|
|
Year Ended December 31,
|
||||||||||||||
|
(In thousands)
|
2014
|
2013
|
$ Change
|
% Change
|
|||||||||||
|
North America
|
$
|
2,796,390
|
|
$
|
2,193,739
|
|
$
|
602,651
|
|
27.5
|
%
|
||||
|
Other foreign countries and businesses
|
287,980
|
|
138,312
|
|
149,668
|
|
108.2
|
|
|||||||
|
Total net revenues
|
$
|
3,084,370
|
|
$
|
2,332,051
|
|
$
|
752,319
|
|
32.3
|
%
|
||||
Net revenues in our North American operating segment
increase
d
$602.7 million
to $
2,796.4 million
in
2014
from
$2,193.7 million
in
2013
primarily due to the items discussed above in the Consolidated Results of Operations. Net revenues in other foreign countries and businesses
increase
d by
$149.7 million
to
$288.0 million
in
2014
from
$138.3 million
in
2013
primarily due to continued international expansion and increased unit sales growth in our EMEA and Latin America operating segments, along with an increase of $18.1 million in revenues from our MapMyFitness operating segment.
Operating income (loss)
by segment is summarized below:
|
|
Year Ended December 31,
|
||||||||||||||
|
(In thousands)
|
2014
|
2013
|
$ Change
|
% Change
|
|||||||||||
|
North America
|
$
|
372,347
|
|
$
|
271,338
|
|
$
|
101,009
|
|
37.2
|
%
|
||||
|
Other foreign countries and businesses
|
(18,392
|
)
|
(6,240
|
)
|
(12,152
|
)
|
194.7
|
|
|||||||
|
Total operating income
|
$
|
353,955
|
|
$
|
265,098
|
|
$
|
88,857
|
|
33.5
|
%
|
||||
Operating income in our North American operating segment increased
$101.0 million
to $
372.3 million
in
2014
from
$271.3 million
in
2013
primarily due to the items discussed above in the Consolidated Results of Operations. Operating loss in other foreign countries and businesses increased by
$12.2 million
to $
18.4 million
in
2014
from
$6.2 million
in
2013
. This increase is primarily due to an operating loss in our MapMyFitness operating segment of $13.1 million.
Year Ended December 31, 2013 Compared to Year Ended December 31, 2012
Net revenues
by segment are summarized below:
|
|
Year Ended December 31,
|
||||||||||||||
|
(In thousands)
|
2013
|
2012
|
$ Change
|
% Change
|
|||||||||||
|
North America
|
$
|
2,193,739
|
|
$
|
1,726,733
|
|
$
|
467,006
|
|
27.0
|
%
|
||||
|
Other foreign countries and businesses
|
138,312
|
|
108,188
|
|
30,124
|
|
27.8
|
|
|||||||
|
Total net revenues
|
$
|
2,332,051
|
|
$
|
1,834,921
|
|
$
|
497,130
|
|
27.1
|
%
|
||||
Net revenues in our North American operating segment increased $467.0 million to $2,193.7 million in 2013 from $1,726.7 million in 2012 primarily due to the items discussed above in the Consolidated Results of Operations. Net revenues in other foreign countries and businesses increased by $30.1 million to $138.3 million in 2013 from $108.2 million in 2012 primarily due to unit sales growth in our EMEA and Asia operating segments and to distributors in our Latin American operating segment.
Operating income (loss)
by segment is summarized below:
|
|
Year Ended December 31,
|
||||||||||||||
|
(In thousands)
|
2013
|
2012
|
$ Change
|
% Change
|
|||||||||||
|
North America
|
$
|
271,338
|
|
$
|
200,084
|
|
$
|
71,254
|
|
35.6
|
%
|
||||
|
Other foreign countries and businesses
|
(6,240
|
)
|
8,611
|
|
(14,851
|
)
|
(172.5
|
)
|
|||||||
|
Total operating income
|
$
|
265,098
|
|
$
|
208,695
|
|
$
|
56,403
|
|
27.0
|
%
|
||||
30
Operating income in our North American operating segment increased $71.2 million to $271.3 million in 2013 from $200.1 million in 2012 primarily due to the items discussed above in the Consolidated Results of Operations. Operating income (loss) in other foreign countries and businesses decreased by $14.8 million to $(6.2) million in 2013 from $8.6 million in 2012 primarily due to our continued investment to support our international expansion in our EMEA, Asia and Latin American operating segments. Investments in 2013 primarily include the opening of brand and factory house stores in China and offices and distribution facilities in Brazil and Chile, along with higher personnel costs and incentive compensation.
Seasonality
Historically, we have recognized a majority of our net revenues and a significant portion of our income from operations in the last two quarters of the year, driven primarily by increased sales volume of our products during the fall selling season, including our higher priced cold weather products, along with a larger proportion of higher margin direct to consumer sales. The level of our working capital generally reflects the seasonality and growth in our business.
We generally expect inventory, accounts payable and certain accrued expenses to be higher in the second and third quarters in preparation for the fall selling season.
The following table sets forth certain financial information for the periods indicated. The data is prepared on the same basis as the audited consolidated financial statements included elsewhere in this Form 10-K. All recurring, necessary adjustments are reflected in the data below.
|
|
Quarter Ended (unaudited)
|
|||||||||||||||||||||||
|
(In thousands)
|
Mar 31, 2013
|
Jun 30, 2013
|
Sep 30, 2013
|
Dec 31, 2013
|
Mar 31, 2014
|
Jun 30, 2014
|
Sep 30, 2014
|
Dec 31, 2014
|
||||||||||||||||
|
Net revenues
|
$471,608
|
$454,541
|
$723,146
|
$682,756
|
$641,607
|
|
$609,654
|
|
$937,908
|
|
$895,201
|
|||||||||||||
|
Gross profit
|
216,551
|
|
219,631
|
|
350,135
|
|
350,353
|
|
300,690
|
|
|
299,952
|
|
|
465,300
|
|
|
446,264
|
|
|||||
|
Marketing SG&A expenses
|
62,841
|
|
48,952
|
|
74,175
|
|
60,521
|
|
87,977
|
|
|
70,854
|
|
|
99,756
|
|
|
74,462
|
|
|||||
|
Other SG&A expenses
|
140,218
|
|
138,369
|
|
155,131
|
|
191,365
|
|
185,857
|
|
|
194,404
|
|
|
219,438
|
|
|
225,503
|
|
|||||
|
Income from operations
|
13,492
|
|
32,310
|
|
120,829
|
|
98,467
|
|
26,856
|
|
|
34,694
|
|
|
146,106
|
|
|
146,299
|
|
|||||
|
(As a percentage of annual totals)
|
|
|
|
|
|
|
|
|
|
|
|
|||||||||||||
|
Net revenues
|
20.2
|
%
|
19.5
|
%
|
31.0
|
%
|
29.3
|
%
|
20.8
|
%
|
|
19.8
|
%
|
|
30.4
|
%
|
|
29.0
|
%
|
|||||
|
Gross profit
|
19.1
|
%
|
19.3
|
%
|
30.8
|
%
|
30.8
|
%
|
19.9
|
%
|
|
19.8
|
%
|
|
30.8
|
%
|
|
29.5
|
%
|
|||||
|
Marketing SG&A expenses
|
25.4
|
%
|
19.9
|
%
|
30.1
|
%
|
24.6
|
%
|
26.4
|
%
|
|
21.3
|
%
|
|
29.9
|
%
|
|
22.4
|
%
|
|||||
|
Other SG&A expenses
|
22.4
|
%
|
22.2
|
%
|
24.8
|
%
|
30.6
|
%
|
22.5
|
%
|
|
23.6
|
%
|
|
26.6
|
%
|
|
27.3
|
%
|
|||||
|
Income from operations
|
5.1
|
%
|
12.2
|
%
|
45.6
|
%
|
37.1
|
%
|
7.6
|
%
|
|
9.8
|
%
|
|
41.3
|
%
|
|
41.3
|
%
|
|||||
Financial Position, Capital Resources and Liquidity
Our cash requirements have principally been for working capital and capital expenditures. We fund our working capital, primarily inventory, and capital investments from cash flows from operating activities, cash and cash equivalents on hand and borrowings available under our credit and long term debt facilities. Our working capital requirements generally reflect the seasonality and growth in our business as we recognize the majority of our net revenues in the back half of the year. Our capital investments have included expanding our in-store fixture and branded concept shop program, improvements and expansion of our distribution and corporate facilities to support our growth, leasehold improvements to our new brand and factory house stores, and investment and improvements in information technology systems.
Our inventory strategy is focused on continuing to meet consumer demand while improving our inventory efficiency over the long term by putting systems and processes in place to improve our inventory management. These systems and processes are designed to improve our forecasting and supply planning capabilities. In addition to systems and processes, key areas of focus that we believe will enhance inventory performance are added discipline around the purchasing of product, production lead time reduction, and better planning and execution in selling of excess inventory through our factory house stores and other liquidation channels.
In December 2013, we completed our acquisition of MapMyFitness. The purchase price was initially funded through $50.0 million cash on hand and $100.0 million in debt under our revolving credit facility. In May 2014, we repaid the $100.0 million with a portion of the $150.0 million proceeds from a term loan under our credit facility. In January 2015, we completed our acquisition of Endomondo. The purchase price was funded with the proceeds from our $100.0 million delayed draw term loan, which we drew in November 2014, for general corporate purposes.
31
We believe our cash and cash equivalents on hand, cash from operations and borrowings available to us under our credit and long term debt facilities and other sources of liquidity are adequate to meet our liquidity needs and capital expenditure requirements for at least the next twelve months. In connection with our pending acquisition of MyFitnessPal, Inc., we are pursuing an amendment to increase the borrowings available under our existing $650.0 million credit agreement. We currently anticipate increasing both term loan borrowings and revolving credit facility commitments under the credit agreement. The acquisition is expected to be funded through a combination of the increased term loan borrowings, a draw on the increased revolving credit facility and cash on hand. See "Credit Facility" below. Although we believe we have adequate sources of liquidity over the long term, an economic recession or a slow recovery could adversely affect our business and liquidity (refer to the “Risk Factors” section included in Item 1A). In addition, instability in or tightening of the capital markets could adversely affect our ability to obtain additional capital to grow our business and will affect the cost and terms of such capital.
At
December 31, 2014
, approximately 21.8% of our cash was held by our foreign subsidiaries where a repatriation of those funds to the United States would likely result in an additional tax expense. However, based on the capital and liquidity needs of our foreign operations, as well as the status of current tax law, we intend to indefinitely reinvest these funds outside the United States. In addition, our United States operations do not require the repatriation of these funds to meet our currently projected liquidity needs. Should we require additional capital in the United States, we may elect to repatriate indefinitely reinvested foreign funds or raise capital in the United States. If we were to repatriate indefinitely reinvested foreign funds, we would be required to accrue and pay additional U.S. taxes less applicable foreign tax credits. Determining the tax liability that would arise if these earnings were repatriated is not practical.
Cash Flows
The following table presents the major components of net cash flows used in and provided by operating, investing and financing activities for the periods presented:
|
|
Year Ended December 31,
|
|||||||||||
|
(In thousands)
|
2014
|
2013
|
2012
|
|||||||||
|
Net cash provided by (used in):
|
||||||||||||
|
Operating activities
|
$
|
219,033
|
|
$
|
120,070
|
|
$
|
199,761
|
|
|||
|
Investing activities
|
(152,312
|
)
|
(238,102
|
)
|
(46,931
|
)
|
||||||
|
Financing activities
|
182,306
|
|
126,795
|
|
12,297
|
|
||||||
|
Effect of exchange rate changes on cash and cash equivalents
|
(3,341
|
)
|
(3,115
|
)
|
1,330
|
|
||||||
|
Net increase in cash and cash equivalents
|
$
|
245,686
|
|
$
|
5,648
|
|
$
|
166,457
|
|
|||
Operating Activities
Operating activities consist primarily of net income adjusted for certain non-cash items. Adjustments to net income for non-cash items include depreciation and amortization, unrealized foreign currency exchange rate gains and losses, losses on disposals of property and equipment, stock-based compensation, deferred income taxes and changes in reserves and allowances. In addition, operating cash flows include the effect of changes in operating assets and liabilities, principally inventories, accounts receivable, income taxes payable and receivable, prepaid expenses and other assets, accounts payable and accrued expenses.
Cash provided by operating activities increased $
98.9 million
to $
219.0 million
in
2014
from $
120.1 million
in
2013
. The increase in cash provided by operating activities was due to adjustments to net income for non-cash items, which increased
$57.5 million
and an increase in net income of
$45.7 million
, partially offset by decreased net cash flows from operating assets and liabilities of
$4.3 million
year over year.
Adjustments to net income for non-cash items increased in
2014
as compared to
2013
primarily due to higher depreciation and amortization related to acquired intangible assets and increased capital expenditure, along with a higher net increase in reserves and allowances in
2014
as compared to
2013
.
The decrease in net cash flows related to changes in operating assets and liabilities period over period was primarily driven by the following:
|
•
|
a decrease in inventory investments of
$72.2 million
due to early deliveries of product and incremental inventory investments in the prior year.
|
32
This decrease was partially offset by:
|
•
|
a larger increase in accounts receivable of
$65.1 million
in
2014
as compared to
2013
, primarily due to a higher proportion of sales to our international customers with longer payment terms compared to the prior year.
|
Cash provided by operating activities decreased $79.7 million to $120.1 million in 2013 from $199.8 million in 2012. The decrease in cash provided by operating activities was due to decreased net cash flows from operating assets and liabilities of $142.4 million, partially offset by an increase in net income of $33.6 million and adjustments to net income for non-cash items, which increased $29.1 million year over year. The increase in net cash flows related to changes in operating assets and liabilities period over period was primarily driven by the following:
|
•
|
an increase in inventory investments of $161.6 million. Inventory grew in 2013 at a rate higher than revenue growth primarily due to supplier delivery challenges experienced in 2012, early deliveries of product in 2013 to manage supplier capacity and improve fill rates, along with incremental inventory investments to support our growing international and direct to consumer businesses.
|
This increase was partially offset by:
|
•
|
a larger increase in accrued expenses and other liabilities of $34.5 million in 2013 as compared to 2012, primarily due to higher accruals for our performance incentive plan as compared to 2012.
|
Adjustments to net income for non-cash items increased in 2013 as compared to 2012 primarily due to an increase in stock-based compensation and higher depreciation and amortization in 2013 as compared to 2012.
Investing Activities
Cash used in investing activities decreased $
85.8 million
to
$152.3 million
in
2014
from $
238.1 million
in
2013
. This decrease in cash used in investing activities was primarily related to the purchase of MapMyFitness in the prior year, partially offset by increased capital expenditures to support international expansion and our brand and factory house strategies in the current year.
Cash used in investing activities increased $191.2 million to $238.1 million in 2013 from $46.9 million in 2012. This increase in cash used in investing activities was primarily related to the purchase of MapMyFitness in December 2013 and increased capital expenditures to improve and expand our offices and distribution facilities and support our brand and factory house strategies in 2013.
Total capital expenditures were $145.4 million, $91.6 million and $62.8 million in
2014
,
2013
and
2012
, respectively. Capital expenditures for
2015
are expected to be in the range of $280 million to $290 million, comprised primarily of investments in a new distribution facility in North America, expansion of our corporate headquarters, retail store buildouts and fixtures.
Financing Activities
Cash provided by financing activities increased $
55.5 million
to $
182.3 million
in
2014
from $
126.8 million
in
2013
. This increase was primarily due to $150.0 million of net borrowings under our credit facility in 2014, as compared to $100.0 million of borrowings under our revolving credit facility in 2013.
Cash provided by financing activities increased $114.5 million to $126.8 million in 2013 from $12.3 million in 2012. This increase was primarily due to $100.0 million borrowed under our revolving credit facility to partially fund the acquisition of MapMyFitness.
Credit Facility
In May 2014 we entered into a new unsecured
$650.0 million
credit agreement and terminated our prior
$325.0 million
revolving credit facility. The credit agreement has a term of
five years
through May 2019, with permitted extensions under certain circumstances. The credit agreement provides for a committed revolving credit facility of
$400.0 million
, in addition to an aggregate term loan commitment of
$250.0 million
, consisting of a
$150.0 million
term loan, drawn at the closing of the credit agreement, and
$100.0 million
delayed draw term loan drawn in November 2014 for general corporate purposes. At our request and the lenders’ consent, the revolving credit facility or term loans may be increased by up to an additional
$150.0 million
. Borrowings under the revolving credit facility may be made in U.S. Dollars, Euros, Pounds Sterling, Japanese Yen and Canadian Dollars. Up to
$50.0 million
of the facility may be used to support letters of credit and up to
$50.0 million
of the facility may be used to support swingline loans. There were no significant letters of credit and no swingline loans outstanding as of
December 31, 2014
. In connection with our pending acquisition of MyFitnessPal, Inc., we are pursuing an amendment to
33
increase the borrowings available under the credit agreement. We currently anticipate increasing both term loan borrowings and revolving credit facility commitments under the credit agreement.
The credit agreement contains negative covenants that, subject to significant exceptions, limit our ability to, among other things, incur additional indebtedness, make restricted payments, pledge our assets as security, make investments, loans, advances, guarantees and acquisitions, undergo fundamental changes and enter into transactions with affiliates. We are also required to maintain a ratio of consolidated EBITDA, as defined in the credit agreement, to consolidated interest expense of not less than
3.50
to
1.00
and we are not permitted to allow the ratio of consolidated total indebtedness to consolidated EBITDA to be greater than
3.25
to
1.00
. As of
December 31, 2014
, we were in compliance with these ratios. In addition, the credit agreement contains events of default that are customary for a facility of this nature, and includes a cross default provision whereby an event of default under other material indebtedness, as defined in the credit agreement, will be considered an event of default under the credit agreement.
Borrowings under the credit agreement bear interest at a rate per annum equal to, at our option, either (a) an alternate base rate, or (b) the adjusted LIBOR rate, plus in each case an applicable margin. The applicable margin for loans will be adjusted by reference to the Pricing Grid based on the consolidated leverage ratio and ranges between
1.00%
to
1.25%
for adjusted LIBOR rate loans and
0.00%
to
0.25%
for alternate base rate loans. The interest rate under both term loans was
1.2%
during the
year ended December 31, 2014
. No balance was outstanding under our revolving credit facility as of
December 31, 2014
. Additionally, we pay a commitment fee on the average daily unused amount of the revolving credit facility, a ticking fee on the undrawn amounts under the delayed draw term loan and certain fees with respect to letters of credit. As of
December 31, 2014
, the commitment fee was
12.5
basis points.
We used
$100.0
million of the proceeds from the $150.0 million term loan to repay the
$100.0
million outstanding under our revolving credit facility. We incurred and capitalized
$1.7
million in deferred financing costs in connection with the credit facility.
We have long term debt agreements with various lenders to finance the acquisition or lease of qualifying capital investments. Loans under these agreements are collateralized by a first lien on the related assets acquired. At
December 31, 2014
,
2013
and
2012
, the outstanding principal balance under these agreements was
$2.0 million
,
$4.9 million
and
$11.9 million
, respectively. Currently, advances under these agreements bear interest rates which are fixed at the time of each advance. The weighted average interest rates on outstanding borrowings were
3.1%
,
3.3%
and
3.7%
for the years ended
December 31, 2014
,
2013
and
2012
, respectively.
In December 2012, we entered into a
$50.0 million
recourse loan collateralized by the land, buildings and tenant improvements comprising our corporate headquarters. The loan has a
seven
year term and maturity date of
December 2019
. The loan bears interest at one month LIBOR plus a margin of
1.50%
, and allows for prepayment without penalty. The loan includes covenants and events of default substantially consistent with the new credit agreement discussed above. The loan also requires prior approval of the lender for certain matters related to the property, including transfers of any interest in the property. As of
December 31, 2014
,
2013
and
2012
, the outstanding balance on the loan was
$46.0 million
,
$48.0 million
and
$50.0 million
, respectively. The weighted average interest rate on the loan was
1.7%
for the years ended
December 31, 2014
,
2013
and
2012
.
Interest expense, net was $
5.3 million
, $
2.9 million
and $
5.2 million
for the years ended
December 31, 2014
,
2013
and
2012
, respectively. Interest expense includes the amortization of deferred financing costs and interest expense under the credit and long term debt facilities.
We monitor the financial health and stability of our lenders under the credit and other long term debt facilities, however during any period of significant instability in the credit markets lenders could be negatively impacted in their ability to perform under these facilities.
Acquisitions
MapMyFitness
On December 6, 2013,
we acquired 100% of the outstanding equity of MapMyFitness, Inc., a digital connected fitness platform, for
$150.0 million
in cash. The purchase price was initially financed through $100.0 million in debt under our revolving credit facility and cash on hand.
34
On January 5, 2015, we acquired
100%
of the outstanding equity of Endomondo ApS, a Denmark-based connected fitness company for $85 in cash million, subject to adjustment for working capital. In connection with this acquisition, we incurred acquisition related expenses of approximately $0.8 million during the year ended December 31, 2014. These expenses were included in selling, general and administrative expenses on the consolidated statements of income. The operating results for this acquisition will be included in our consolidated statements of income from the date of acquisition. We are currently in the process of assessing the fair value of the assets acquired and liabilities assumed, which is expected to be final during the first quarter of 2015.
On February 3, 2015, we entered into an agreement to acquire MyFitnessPal, Inc ("MyFitnessPal"). The purchase price for the acquisition will be $475 million in cash, which will be adjusted to reflect our acquisition of MyFitnessPal at the closing on a debt free basis with MyFitnessPal's transaction expenses borne by the sellers. In addition, the aggregate purchase price payable at the closing is subject to an upward adjustment to reflect the amount of net cash held by MyFitnessPal at closing. The acquisition is currently expected to close during the first quarter of 2015, subject to the satisfaction of customary closing conditions, including among others, regulatory approvals, the continuing accuracy of representations and warranties and the execution of noncompetition agreements by certain key employee stockholders. The acquisition is expected to be funded through a combination of increased term loan borrowings, a draw on the increased revolving credit facility and cash on hand.
Contractual Commitments and Contingencies
We lease warehouse space, office facilities, space for our brand and factory house stores and certain equipment under non-cancelable operating and capital leases. The leases expire at various dates through 2028, excluding extensions at our option, and contain various provisions for rental adjustments. In addition, this table includes executed lease agreements for brand and factory house stores that we did not yet occupy as of
December 31, 2014
. The operating leases generally contain renewal provisions for varying periods of time. Our significant contractual obligations and commitments as of
December 31, 2014
as well as significant agreements entered into during the period after
December 31, 2014
through the date of this report are summarized in the following table:
|
|
Payments Due by Period
|
|||||||||||||||||||
|
(in thousands)
|
Total
|
Less Than
1 Year
|
1 to 3 Years
|
3 to 5 Years
|
More Than
5 Years
|
|||||||||||||||
|
Contractual obligations
|
||||||||||||||||||||
|
Long term debt obligations (1)
|
$
|
316,099
|
|
$
|
35,202
|
|
$
|
66,122
|
|
$
|
173,176
|
|
$
|
41,599
|
|
|||||
|
Operating lease obligations (2)
|
472,575
|
|
56,452
|
|
109,251
|
|
92,658
|
|
214,214
|
|
||||||||||
|
Product purchase obligations (3)
|
884,101
|
|
884,101
|
|
—
|
|
—
|
|
—
|
|
||||||||||
|
Sponsorships and other (4)
|
392,926
|
|
90,056
|
|
128,388
|
|
78,137
|
|
96,345
|
|
||||||||||
|
Total
|
$
|
2,065,701
|
|
$
|
1,065,811
|
|
$
|
303,761
|
|
$
|
343,971
|
|
$
|
352,158
|
|
|||||
|
(1)
|
Includes estimated interest payments based on applicable fixed and currently effective floating interest rates as of
December 31, 2014
, timing of scheduled payments, and the term of the debt obligations.
|
|
(2)
|
Includes the minimum payments for operating lease obligations. The operating lease obligations do not include any contingent rent expense we may incur at our brand and factory house stores based on future sales above a specified minimum or payments made for maintenance, insurance and real estate taxes. Contingent rent expense was
$11.0 million
for the year ended
December 31, 2014
.
|
|
(3)
|
We generally place orders with our manufacturers at least three to four months in advance of expected future sales. The amounts listed for product purchase obligations primarily represent our open production purchase orders with our manufacturers for our apparel, footwear and accessories, including expected inbound freight, duties and other costs. These open purchase orders specify fixed or minimum quantities of products at determinable prices. The product purchase obligations also includes fabric commitments with our suppliers, which secure a portion of our material needs for future seasons. The reported amounts exclude product purchase liabilities included in accounts payable as of
December 31, 2014
.
|
|
(4)
|
Includes sponsorships with professional teams, professional leagues, colleges and universities, individual athletes, athletic events and other marketing commitments in order to promote our brand. Some of these sponsorship agreements provide for additional performance incentives and product supply obligations. It is not possible to determine how much we will spend on product supply obligations on an annual basis as contracts generally do not stipulate specific cash amounts to be spent on products. The amount of product provided to these sponsorships depends on many factors including general playing conditions, the number of sporting events in which they participate and our decisions regarding product and marketing initiatives. In addition, it is not possible to
|
35
determine the performance incentive amounts we may be required to pay under these agreements as they are primarily subject to certain performance based and other variables. The amounts listed above are the fixed minimum amounts required to be paid under these agreements.
The table above excludes a liability of
$31.3 million
for uncertain tax positions, including the related interest and penalties, recorded in accordance with applicable accounting guidance, as we are unable to reasonably estimate the timing of settlement. Refer to Note
10
to the Consolidated Financial Statements for a further discussion of our uncertain tax positions.
Off-Balance Sheet Arrangements
In connection with various contracts and agreements, we have agreed to indemnify counterparties against certain third party claims relating to the infringement of intellectual property rights and other items. Generally, such indemnification obligations do not apply in situations in which our counterparties are grossly negligent, engage in willful misconduct, or act in bad faith. Based on our historical experience and the estimated probability of future loss, we have determined the fair value of such indemnifications is not material to our financial position or results of operations.
Critical Accounting Policies and Estimates
Our consolidated financial statements have been prepared in accordance with accounting principles generally accepted in the United States of America. To prepare these financial statements, we must make estimates and assumptions that affect the reported amounts of assets, liabilities, revenues and expenses, as well as the disclosures of contingent assets and liabilities. Actual results could be significantly different from these estimates. We believe the following discussion addresses the critical accounting policies that are necessary to understand and evaluate our reported financial results.
Revenue Recognition
Net revenues consist of both net sales and license and other revenues. Net sales are recognized upon transfer of ownership, including passage of title to the customer and transfer of risk of loss related to those goods. Transfer of title and risk of loss are based upon shipment under free on board shipping point for most goods or upon receipt by the customer depending on the country of the sale and the agreement with the customer. In some instances, transfer of title and risk of loss take place at the point of sale, for example at our brand and factory house stores. We may also ship product directly from our supplier to the customer and recognize revenue when the product is delivered to and accepted by the customer. License and other revenues are primarily recognized based upon shipment of licensed products sold by our licensees. Sales taxes imposed on our revenues from product sales are presented on a net basis on the consolidated statements of income and therefore do not impact net revenues or costs of goods sold.
We record reductions to revenue for estimated customer returns, allowances, markdowns and discounts. We base our estimates on historical rates of customer returns and allowances as well as the specific identification of outstanding returns, markdowns and allowances that have not yet been received by us. The actual amount of customer returns and allowances, which is inherently uncertain, may differ from our estimates. If we determine that actual or expected returns or allowances are significantly higher or lower than the reserves we established, we would record a reduction or increase, as appropriate, to net sales in the period in which we make such a determination. Provisions for customer specific discounts are based on contractual obligations with certain major customers. Reserves for returns, allowances, markdowns and discounts are recorded as an offset to accounts receivable as settlements are made through offsets to outstanding customer invoices. As of
December 31, 2014
and
2013
, there were $
68.9 million
and $
43.8 million
, respectively, in reserves for customer returns, allowances, markdowns and discounts.
Allowance for Doubtful Accounts
We
make
ongoing estimates relating to the collectability of accounts receivable and maintain
an allowance for estimated losses resulting from the inability of
our
customers to make required payments. In determining the amount of the reserve,
we
consider
historical levels of credit losses and significant economic developments within the retail environment that could impact the ability of
our customers to pay outstanding balances and make judgments about the creditworthiness of significant customers based on ongoing credit evaluations. Because we
cannot predict future changes in the financial stability of
our
customers, actual future losses from uncollectible accounts may differ from estimates. If the financial condition of customers were to deteriorate, resulting in their inability to make payments, a larger reserve might be required. In the event
we
determine
a smaller or larger reserve is appropriate,
we
would record a benefit or charge to selling, general and administrative expense in the period in which such a determination was made.
As of December 31, 2014
and
2013
, the allowance for doubtful accounts was $
3.7 million
and $
2.9 million
, respectively.
36
Inventory Valuation and Reserves
We
value
our
inventory at standard cost which approximates landed cost, using the first-in, first-out method of cost determination. Market value is estimated based upon assumptions made about future demand and retail market conditions. If
we
determine
that the estimated market value of
our
inventory is less than the carrying value of such inventory,
we
record
a charge to cost of goods sold to reflect the lower of cost or market. If actual market conditions are less favorable than those
we
projected
, further adjustments may be required that would increase the cost of goods sold in the period in which such a determination was made.
Goodwill, Intangible Assets and Long-Lived Assets
Goodwill and intangible assets are recorded at their estimated fair values at the date of acquisition and are allocated to the reporting units that are expected to receive the related benefits. Goodwill and indefinite lived intangible assets are not amortized and are required to be tested for impairment at least annually or sooner whenever events or changes in circumstances indicate that the assets may be impaired. In conducting an annual impairment test,
we first review
qualitative factors to determine whether it is more likely than not that the fair value of the reporting unit is less than its carrying amount. If factors indicate that is the case,
we perform
a quantitative assessment over relevant reporting units, analyzing the expected present value of future cash flows and quantify the amount of impairment, if any.
We perform our
annual impairment tests in the fourth quarter of each fiscal year.
We
continually evaluate
whether events and circumstances have occurred that indicate the remaining estimated useful life of long-lived assets may warrant revision or that the remaining balance may not be recoverable. These factors may include a significant deterioration of operating results, changes in business plans, or changes in anticipated cash flows. When factors indicate that an asset should be evaluated for possible impairment,
we
review
long-lived assets to assess recoverability from future operations using undiscounted cash flows. If future undiscounted cash flows are less than the carrying value, an impairment is recognized in earnings to the extent that the carrying value exceeds fair value.
Income Taxes
Income taxes are accounted for under the asset and liability method. Deferred income tax assets and liabilities are established for temporary differences between the financial reporting basis and the tax basis of
our
assets and liabilities at tax rates expected to be in effect when such assets or liabilities are realized or settled. Deferred income tax assets are reduced by valuation allowances when necessary.
Assessing whether deferred tax assets are realizable requires significant judgment.
We
consider
all available positive and negative evidence, including historical operating performance and expectations of future operating performance. The ultimate realization of deferred tax assets is often dependent upon future taxable income and therefore can be uncertain. To the extent
we
believe
it is more likely than not that all or some portion of the asset will not be realized, valuation allowances are established against
our
deferred tax assets, which increase income tax expense in the period when such a determination is made.
Income taxes include the largest amount of tax benefit for an uncertain tax position that is more likely than not to be sustained upon audit based on the technical merits of the tax position. Settlements with tax authorities, the expiration of statutes of limitations for particular tax positions, or obtaining new information on particular tax positions may cause a change to the effective tax rate.
We
recognize
accrued interest and penalties related to unrecognized tax benefits in the provision for income taxes on the consolidated statements of income.
Stock-Based Compensation
We account for stock-based compensation in accordance with accounting guidance that requires all stock-based compensation awards granted to employees and directors to be measured at fair value and recognized as an expense in the financial statements. As of
December 31, 2014
, we had
$28.6 million
of unrecognized compensation expense expected to be recognized over a weighted average period of
1.0
year. This unrecognized compensation expense does not include any expense related to performance-based restricted stock units for which the performance targets have not been achieved as of
December 31, 2014
.
The assumptions used in calculating the fair value of stock-based compensation awards represent management’s best estimates, but the estimates involve inherent uncertainties and the application of management judgment. In addition, compensation expense for performance-based awards is recorded over the related service period when achievement of the performance targets are deemed probable, which requires management judgment. For example, the achievement of certain operating income targets related to the performance-based restricted stock units granted in 2014 were not deemed probable as of
December 31, 2014
. Additional stock-based compensation of up to
$2.7 million
would have been recorded in 2014 for these performance-based restricted stock units had the full achievement of all operating targets been deemed probable. As a result, if
37
factors change and we use different assumptions, our stock-based compensation expense could be materially different in the future. Refer to Note
2
and Note
12
to the Consolidated Financial Statements for a further discussion on stock-based compensation.
Recently Issued Accounting Standards
In May 2014, the Financial Accounting Standards Board (“FASB”) issued an Accounting Standards Update which supersedes the most current revenue recognition requirements. The new revenue recognition standard requires entities to recognize revenue in a way that depicts the transfer of goods or services to customers in an amount that reflects the consideration which the entity expects to be entitled to in exchange for those goods or services. This guidance is effective for annual and interim reporting periods beginning after December 15, 2016, with early adoption not permitted.
We are
currently evaluating the standard to determine the impact of its adoption on
our
consolidated financial statements.
In January 2015, the FASB issued an Accounting Standards Update which eliminates from GAAP the concept of extraordinary items and the need to separately classify, present, and disclose extraordinary events and transactions. This guidance is effective for annual and interim reporting periods beginning after December 15, 2015, with early adoption permitted provided that the guidance is applied from the beginning of the fiscal year of adoption. The adoption of this pronouncement is not expected to impact
our
consolidated financial statements.
Recently Adopted Accounting Standards
In July 2013, the FASB issued an Accounting Standards Update which requires that an unrecognized tax benefit, or a portion of an unrecognized tax benefit, should be presented in the financial statements as a reduction to a deferred tax asset for a net operating loss carryforward, a similar tax loss, or a tax credit carryforward, with certain exceptions. This guidance is effective for annual and interim reporting periods beginning after December 15, 2013. The adoption of this pronouncement did not have a material impact on
our
consolidated financial statements.
In February 2013, the FASB issued an Accounting Standards Update which requires companies to present either in a single note or parenthetically on the face of the financial statements, the effect of significant amounts reclassified from each component of accumulated other comprehensive income based on its source and the income statement line items affected by the reclassification. This guidance is effective for annual and interim reporting periods beginning after December 15, 2012.
The adoption of this pronouncement did not have a material impact on
our
consolidated financial statements.
|
ITEM 7A.
|
QUANTITATIVE AND QUALITATIVE DISCLOSURE ABOUT MARKET RISK
|
Foreign Currency Risk
We currently generate a majority of our consolidated net revenues in the United States, and the reporting currency for our consolidated financial statements is the U.S. dollar. As our net revenues and expenses generated outside of the United States increase, our results of operations could be adversely impacted by changes in foreign currency exchange rates. For example, as we recognize foreign revenues in local foreign currencies and if the U.S. dollar strengthens, it could have a negative impact on our foreign revenues upon translation of those results into the U.S. dollar upon consolidation of our financial statements. In addition, we are exposed to gains and losses resulting from fluctuations in foreign currency exchange rates on transactions generated by our foreign subsidiaries in currencies other than their local currencies. These gains and losses are primarily driven by intercompany transactions and inventory purchases denominated in currencies other than the functional currency of the purchasing entity. These exposures are included in other expense, net on the consolidated statements of income.
From time to time, we may elect to use foreign currency forward contracts to reduce the risk from exchange rate fluctuations primarily on intercompany transactions and projected inventory purchases for our international subsidiaries. As we expand our international business, we anticipate expanding our current hedging program to include additional currency pairs and instruments. We do not enter into derivative financial instruments for speculative or trading purposes.
As of
December 31, 2014
, the aggregate notional value of our outstanding foreign currency forward contracts was
$123.3 million
, which was comprised of Canadian Dollar/U.S. Dollar, Euro/U.S. Dollar, Yen/Euro, Mexican Peso/Euro and Pound Sterling/Euro currency pairs with contract maturities of
one
to
eleven
months. The foreign currency forward contracts outstanding as of
December 31, 2014
have weighted average contractual forward foreign currency exchange rates of
1.13
CAD per $1.00, €
0.83
per $1.00, 145.16 JPY per €1.00, 17.85 MXN per €1.00 and £
0.78
per €1.00. The majority of our foreign currency forward contracts are not designated as cash flow hedges, and accordingly, changes in their fair value are recorded in earnings. During 2014, we began entering into foreign currency forward contracts designated as cash flow hedges. For foreign currency forward contracts designated as cash flow hedges, changes in fair value, excluding any ineffective portion, is recorded in other comprehensive income until net income is affected by the variability in cash flows of the hedged transaction. The
38
effective portion is generally released to net income after the maturity of the related derivative and is classified in the same manner as the underlying exposure. During the year ended
December 31, 2014
, we reclassified
$0.4 million
from other comprehensive income to cost of goods sold related to foreign currency forward contracts designated as cash flow hedges. The fair values of the Company’s foreign currency forward contracts were assets of $
806.0 thousand
and
$12.1 thousand
as of
December 31, 2014
and
2013
, respectively, and were included in prepaid expenses and other current assets on the consolidated balance sheet. Refer to Note
9
to the Consolidated Financial Statements for a discussion of the fair value measurements. Included in other expense, net were the following amounts related to changes in foreign currency exchange rates and derivative foreign currency forward contracts:
|
(In thousands)
|
Year Ended December 31,
|
|||||||||||
|
2014
|
2013
|
2012
|
||||||||||
|
Unrealized foreign currency exchange rate gains (losses)
|
$
|
(11,739
|
)
|
$
|
(1,905
|
)
|
$
|
2,464
|
|
|||
|
Realized foreign currency exchange rate gains (losses)
|
2,247
|
|
477
|
|
(182
|
)
|
||||||
|
Unrealized derivative gains (losses)
|
1
|
|
13
|
|
675
|
|
||||||
|
Realized derivative gains (losses)
|
3,081
|
|
243
|
|
(3,030
|
)
|
||||||
We enter into foreign currency forward contracts with major financial institutions with investment grade credit ratings and are exposed to credit losses in the event of non-performance by these financial institutions. This credit risk is generally limited to the unrealized gains in the foreign currency forward contracts. However, we monitor the credit quality of these financial institutions and consider the risk of counterparty default to be minimal. Although we have entered into foreign currency forward contracts to minimize some of the impact of foreign currency exchange rate fluctuations on future cash flows, we cannot be assured that foreign currency exchange rate fluctuations will not have a material adverse impact on our financial condition and results of operations.
Interest Rate Risk
I
n order to maintain liquidity and fund business operations, we enter into long term debt arrangements with various lenders which bear a range of fixed and variable rates of interest. The nature and amount of our long-term debt can be expected to vary as a result of future business requirements, market conditions and other factors. We may elect to enter into interest rate swap contracts to reduce the impact associated with interest rate fluctuations. We utilize interest rate swap contracts to convert a portion of variable rate debt to fixed rate debt. The contracts pay fixed and receive variable rates of interest. The interest rate swap contracts are accounted for as cash flow hedges and accordingly, the effective portion of the changes in fair value are recorded in other comprehensive income and reclassified into interest expense over the life of the underlying debt obligation
.
As of
December 31, 2014
, the aggregate notional value of our outstanding interest rate swap contracts was
$188.1 million
. During the years ended
December 31, 2014
and
2013
, we recorded a
$1.7 million
and
$0.3 million
increase in interest expense, respectively, representing the effective portion of the contracts reclassified from accumulated other comprehensive income. The fair value of the interest rate swap contracts was a liability of
$0.6 million
as of
December 31, 2014
, and was included in other long term liabilities on the consolidated balance sheet. The fair value of the interest rate swap contract was an asset of
$1.1 million
as of
December 31, 2013
and was included in other long term assets on the consolidated balance sheet.
Credit Risk
W
e are exposed to credit risk primarily on our accounts receivable. We provide credit to customers in the ordinary course of business and perform ongoing credit evaluations. We believe that our exposure to concentrations of credit risk with respect to trade receivables is largely mitigated by our customer base. We believe that our allowance for doubtful accounts is sufficient to cover customer credit risks as of
December 31, 2014
.
Inflation
Inflationary factors such as increases in the cost of our product and overhead costs may adversely affect our operating results. Although we do not believe that inflation has had a material impact on our financial position or results of operations in recent periods, a high rate of inflation in the future may have an adverse effect on our ability to maintain current levels of gross margin and selling, general and administrative expenses as a percentage of net revenues if the selling prices of our products do not increase with these increased costs.
39
|
ITEM 8.
|
FINANCIAL STATEMENTS AND SUPPLEMENTARY DATA
|
Report of Management on Internal Control Over Financial Reporting
Management is responsible for establishing and maintaining adequate internal control over financial reporting for the Company. We conducted an evaluation of the effectiveness of our internal control over financial reporting based on the framework in
Internal Control—Integrated Framework
issued by the Committee of Sponsoring Organizations of the Treadway Commission (COSO) in 2013. This evaluation included review of the documentation of controls, evaluation of the design effectiveness of controls, testing of the operating effectiveness of controls and a conclusion on this evaluation. Based on our evaluation, we have concluded that our internal control over financial reporting was effective as of
December 31, 2014
.
The effectiveness of our internal control over financial reporting as of
December 31, 2014
, has been audited by PricewaterhouseCoopers LLP, an independent registered public accounting firm, as stated in their report which appears herein.
|
/s/ K
EVIN
A. P
LANK
|
Chairman of the Board of Directors and
Chief Executive Officer
|
|
|
Kevin A. Plank
|
|
|
|
/s/ B
RAD
D
ICKERSON
|
|
Chief Financial Officer
|
|
Brad Dickerson
|
||
Dated:
February 20, 2015
40
Report of Independent Registered Public Accounting Firm
To the Board of Directors and Stockholders of Under Armour, Inc.
In our opinion, the consolidated financial statements listed in the index appearing under Item 15(a)(1) present fairly, in all material respects, the financial position of Under Armour, Inc.
and its subsidiaries
(the “Company”)
at
December 31, 2014 and December 31, 2013, and the results of their operations and their cash flows for each of the three years in the period ended
December 31, 2014 in conformity with accounting principles generally accepted in the United States of America. In addition, in our opinion, the financial statement schedule listed in the index appearing under Item 15(a)(2) presents fairly, in all material respects, the information set forth therein when read in conjunction with the related consolidated financial statements. Also in our opinion, the Company maintained, in all material respects, effective internal control over financial reporting as of December 31, 2014, based on criteria established in
Internal Control - Integrated Framework
issued by the Committee of Sponsoring Organizations of the Treadway Commission (COSO) in 2013. The Company's management is responsible for these financial statements and financial statement schedule, for maintaining effective internal control over financial reporting and for its assessment of the effectiveness of internal control over financial reporting, included in the accompanying Report of Management on Internal Control Over Financial Reporting. Our responsibility is to express opinions on these financial statements, on the financial statement schedule, and on the Company's internal control over financial reporting based on our integrated audits. We conducted our audits in accordance with the standards of the Public Company Accounting Oversight Board (United States). Those standards require that we plan and perform the audits to obtain reasonable assurance about whether the financial statements are free of material misstatement and whether effective internal control over financial reporting was maintained in all material respects. Our audits of the financial statements included examining, on a test basis, evidence supporting the amounts and disclosures in the financial statements, assessing the accounting principles used and significant estimates made by management, and evaluating the overall financial statement presentation. Our audit of internal control over financial reporting included obtaining an understanding of internal control over financial reporting, assessing the risk that a material weakness exists, and testing and evaluating the design and operating effectiveness of internal control based on the assessed risk. Our audits also included performing such other procedures as we considered necessary in the circumstances. We believe that our audits provide a reasonable basis for our opinions.
A company’s internal control over financial reporting is a process designed to provide reasonable assurance regarding the reliability of financial reporting and the preparation of financial statements for external purposes in accordance with generally accepted accounting principles. A company’s internal control over financial reporting includes those policies and procedures that (i) pertain to the maintenance of records that, in reasonable detail, accurately and fairly reflect the transactions and dispositions of the assets of the company; (ii) provide reasonable assurance that transactions are recorded as necessary to permit preparation of financial statements in accordance with generally accepted accounting principles, and that receipts and expenditures of the company are being made only in accordance with authorizations of management and directors of the company; and (iii) provide reasonable assurance regarding prevention or timely detection of unauthorized acquisition, use, or disposition of the company’s assets that could have a material effect on the financial statements.
Because of its inherent limitations, internal control over financial reporting may not prevent or detect misstatements. Also, projections of any evaluation of effectiveness to future periods are subject to the risk that controls may become inadequate because of changes in conditions, or that the degree of compliance with the policies or procedures may deteriorate.
/s/ PricewaterhouseCoopers LLP
Baltimore, Maryland
February 20, 2015
41
Under Armour, Inc. and Subsidiaries
(In thousands, except share data)
|
December 31, 2014
|
December 31, 2013
|
||||||
|
Assets
|
|||||||
|
Current assets
|
|||||||
|
Cash and cash equivalents
|
$
|
593,175
|
|
$
|
347,489
|
|
|
|
Accounts receivable, net
|
279,835
|
|
209,952
|
|
|||
|
Inventories
|
536,714
|
|
469,006
|
|
|||
|
Prepaid expenses and other current assets
|
87,177
|
|
63,987
|
|
|||
|
Deferred income taxes
|
52,498
|
|
38,377
|
|
|||
|
Total current assets
|
1,549,399
|
|
1,128,811
|
|
|||
|
Property and equipment, net
|
305,564
|
|
223,952
|
|
|||
|
Goodwill
|
123,256
|
|
122,244
|
|
|||
|
Intangible assets, net
|
26,230
|
|
24,097
|
|
|||
|
Deferred income taxes
|
33,570
|
|
31,094
|
|
|||
|
Other long term assets
|
57,064
|
|
47,543
|
|
|||
|
Total assets
|
$
|
2,095,083
|
|
$
|
1,577,741
|
|
|
|
Liabilities and Stockholders’ Equity
|
|||||||
|
Current liabilities
|
|||||||
|
Revolving credit facility
|
$
|
—
|
|
$
|
100,000
|
|
|
|
Accounts payable
|
210,432
|
|
165,456
|
|
|||
|
Accrued expenses
|
147,681
|
|
133,729
|
|
|||
|
Current maturities of long term debt
|
28,951
|
|
4,972
|
|
|||
|
Other current liabilities
|
34,563
|
|
22,473
|
|
|||
|
Total current liabilities
|
421,627
|
|
426,630
|
|
|||
|
Long term debt, net of current maturities
|
255,250
|
|
47,951
|
|
|||
|
Other long term liabilities
|
67,906
|
|
49,806
|
|
|||
|
Total liabilities
|
744,783
|
|
524,387
|
|
|||
|
Commitments and contingencies (see Note 7)
|
|
|
|
|
|||
|
Stockholders’ equity
|
|||||||
|
Class A Common Stock, $0.0003 1/3 par value; 400,000,000 shares authorized as of December 31, 2014 and 2013; 177,295,988 shares issued and outstanding as of December 31, 2014 and 171,628,708 shares issued and outstanding as of December 31, 2013.
|
59
|
|
57
|
|
|||
|
Class B Convertible Common Stock, $0.0003 1/3 par value; 36,600,000 shares authorized, issued and outstanding as of December 31, 2014 and 40,000,000 shares authorized, issued and outstanding as of December 31, 2013.
|
12
|
|
13
|
|
|||
|
Additional paid-in capital
|
508,350
|
|
397,248
|
|
|||
|
Retained earnings
|
856,687
|
|
653,842
|
|
|||
|
Accumulated other comprehensive income (loss)
|
(14,808
|
)
|
2,194
|
|
|||
|
Total stockholders’ equity
|
1,350,300
|
|
1,053,354
|
|
|||
|
Total liabilities and stockholders’ equity
|
$
|
2,095,083
|
|
$
|
1,577,741
|
|
|
See accompanying notes.
42
Under Armour, Inc. and Subsidiaries
(In thousands, except per share amounts)
|
|
Year Ended December 31,
|
||||||||||
|
|
2014
|
2013
|
2012
|
||||||||
|
Net revenues
|
$
|
3,084,370
|
|
$
|
2,332,051
|
|
$
|
1,834,921
|
|
||
|
Cost of goods sold
|
1,572,164
|
|
1,195,381
|
|
955,624
|
|
|||||
|
Gross profit
|
1,512,206
|
|
1,136,670
|
|
879,297
|
|
|||||
|
Selling, general and administrative expenses
|
1,158,251
|
|
871,572
|
|
670,602
|
|
|||||
|
Income from operations
|
353,955
|
|
265,098
|
|
208,695
|
|
|||||
|
Interest expense, net
|
(5,335
|
)
|
(2,933
|
)
|
(5,183
|
)
|
|||||
|
Other expense, net
|
(6,410
|
)
|
(1,172
|
)
|
(73
|
)
|
|||||
|
Income before income taxes
|
342,210
|
|
260,993
|
|
203,439
|
|
|||||
|
Provision for income taxes
|
134,168
|
|
98,663
|
|
74,661
|
|
|||||
|
Net income
|
$
|
208,042
|
|
$
|
162,330
|
|
$
|
128,778
|
|
||
|
Net income available per common share
|
|||||||||||
|
Basic
|
$
|
0.98
|
|
$
|
0.77
|
|
$
|
0.62
|
|
||
|
Diluted
|
$
|
0.95
|
|
$
|
0.75
|
|
$
|
0.61
|
|
||
|
Weighted average common shares outstanding
|
|||||||||||
|
Basic
|
213,227
|
|
210,696
|
|
208,686
|
|
|||||
|
Diluted
|
219,380
|
|
215,958
|
|
212,760
|
|
|||||
See accompanying notes.
43
Under Armour, Inc. and Subsidiaries
Consolidated Statements of Comprehensive Income
(In thousands)
|
|
Year Ended December 31,
|
||||||||||
|
|
2014
|
2013
|
2012
|
||||||||
|
Net income
|
$
|
208,042
|
|
$
|
162,330
|
|
$
|
128,778
|
|
||
|
Other comprehensive income (loss):
|
|||||||||||
|
Foreign currency translation adjustment
|
(16,743
|
)
|
(897
|
)
|
423
|
|
|||||
|
Unrealized gain (loss) on cash flow hedge, net of tax of ($408), $505 and $58 for the years ended December 31, 2014, 2013 and 2012.
|
(259
|
)
|
723
|
|
(83
|
)
|
|||||
|
Total other comprehensive income (loss)
|
(17,002
|
)
|
(174
|
)
|
340
|
|
|||||
|
Comprehensive income
|
$
|
191,040
|
|
$
|
162,156
|
|
$
|
129,118
|
|
||
See accompanying notes.
44
Under Armour, Inc. and Subsidiaries
Consolidated Statements of Stockholders’ Equity
(In thousands)
|
|
Class A
Common Stock
|
Class B
Convertible
Common Stock
|
Additional
Paid-In
Capital
|
Retained
Earnings
|
Accumulated
Other
Comprehensive
Income (Loss)
|
Total
Stockholders’
Equity
|
|||||||||||||||||||||||
|
|
Shares
|
Amount
|
Shares
|
Amount
|
|||||||||||||||||||||||||
|
Balance as of December 31, 2011
|
161,984
|
|
$
|
54
|
|
45,000
|
|
$
|
14
|
|
$
|
268,172
|
|
$
|
366,164
|
|
$
|
2,028
|
|
$
|
636,432
|
|
|||||||
|
Exercise of stock options
|
2,436
|
|
2
|
|
—
|
|
—
|
|
12,370
|
|
—
|
|
—
|
|
12,372
|
|
|||||||||||||
|
Shares withheld in consideration of employee tax obligations relative to stock-based compensation arrangements
|
(76
|
)
|
—
|
|
—
|
|
—
|
|
—
|
|
(1,761
|
)
|
—
|
|
(1,761
|
)
|
|||||||||||||
|
Issuance of Class A Common Stock, net of forfeitures
|
178
|
|
—
|
|
—
|
|
—
|
|
3,246
|
|
—
|
|
—
|
|
3,246
|
|
|||||||||||||
|
Class B Convertible Common Stock converted to Class A Common Stock
|
2,400
|
|
—
|
|
(2,400
|
)
|
—
|
|
—
|
|
—
|
|
—
|
|
—
|
|
|||||||||||||
|
Stock-based compensation expense
|
—
|
|
—
|
|
—
|
|
—
|
|
19,845
|
|
—
|
|
—
|
|
19,845
|
|
|||||||||||||
|
Net excess tax benefits from stock-based compensation arrangements
|
—
|
|
—
|
|
—
|
|
—
|
|
17,670
|
|
—
|
|
—
|
|
17,670
|
|
|||||||||||||
|
Comprehensive income
|
—
|
|
—
|
|
—
|
|
—
|
|
—
|
|
128,778
|
|
340
|
|
129,118
|
|
|||||||||||||
|
Balance as of December 31, 2012
|
166,922
|
|
56
|
|
42,600
|
|
14
|
|
321,303
|
|
493,181
|
|
2,368
|
|
816,922
|
|
|||||||||||||
|
Exercise of stock options
|
1,822
|
|
—
|
|
—
|
|
—
|
|
12,159
|
|
—
|
|
—
|
|
12,159
|
|
|||||||||||||
|
Shares withheld in consideration of employee tax obligations relative to stock-based compensation arrangements
|
(47
|
)
|
—
|
|
—
|
|
—
|
|
—
|
|
(1,669
|
)
|
—
|
|
(1,669
|
)
|
|||||||||||||
|
Issuance of Class A Common Stock, net of forfeitures
|
332
|
|
—
|
|
—
|
|
—
|
|
3,439
|
|
—
|
|
—
|
|
3,439
|
|
|||||||||||||
|
Class B Convertible Common Stock converted to Class A Common Stock
|
2,600
|
|
1
|
|
(2,600
|
)
|
(1
|
)
|
—
|
|
—
|
|
—
|
|
—
|
|
|||||||||||||
|
Stock-based compensation expense
|
—
|
|
—
|
|
—
|
|
—
|
|
43,184
|
|
—
|
|
—
|
|
43,184
|
|
|||||||||||||
|
Net excess tax benefits from stock-based compensation arrangements
|
—
|
|
—
|
|
—
|
|
—
|
|
17,163
|
|
—
|
|
—
|
|
17,163
|
|
|||||||||||||
|
Comprehensive income
|
—
|
|
—
|
|
—
|
|
—
|
|
—
|
|
162,330
|
|
(174
|
)
|
162,156
|
|
|||||||||||||
|
Balance as of December 31, 2013
|
171,629
|
|
57
|
|
40,000
|
|
13
|
|
397,248
|
|
653,842
|
|
2,194
|
|
1,053,354
|
|
|||||||||||||
|
Exercise of stock options
|
1,454
|
|
1
|
|
—
|
|
—
|
|
11,258
|
|
—
|
|
—
|
|
11,259
|
|
|||||||||||||
|
Shares withheld in consideration of employee tax obligations relative to stock-based compensation arrangements
|
(95
|
)
|
—
|
|
—
|
|
—
|
|
—
|
|
(5,197
|
)
|
—
|
|
(5,197
|
)
|
|||||||||||||
|
Issuance of Class A Common Stock, net of forfeitures
|
908
|
|
—
|
|
—
|
|
—
|
|
12,067
|
|
—
|
|
—
|
|
12,067
|
|
|||||||||||||
|
Class B Convertible Common Stock converted to Class A Common Stock
|
3,400
|
|
1
|
|
(3,400
|
)
|
(1
|
)
|
—
|
|
—
|
|
—
|
|
—
|
|
|||||||||||||
|
Stock-based compensation expense
|
—
|
|
—
|
|
—
|
|
—
|
|
50,812
|
|
—
|
|
—
|
|
50,812
|
|
|||||||||||||
|
Net excess tax benefits from stock-based compensation arrangements
|
—
|
|
—
|
|
—
|
|
—
|
|
36,965
|
|
—
|
|
—
|
|
36,965
|
|
|||||||||||||
|
Comprehensive income (loss)
|
—
|
|
—
|
|
—
|
|
—
|
|
—
|
|
208,042
|
|
(17,002
|
)
|
191,040
|
|
|||||||||||||
|
Balance as of December 31, 2014
|
177,296
|
|
$
|
59
|
|
36,600
|
|
$
|
12
|
|
$
|
508,350
|
|
$
|
856,687
|
|
$
|
(14,808
|
)
|
$
|
1,350,300
|
|
|||||||
See accompanying notes.
45
Under Armour, Inc. and Subsidiaries
(In thousands)
|
|
Year Ended December 31,
|
||||||||||
|
|
2014
|
2013
|
2012
|
||||||||
|
Cash flows from operating activities
|
|||||||||||
|
Net income
|
$
|
208,042
|
|
$
|
162,330
|
|
$
|
128,778
|
|
||
|
Adjustments to reconcile net income to net cash used in operating activities
|
|
|
|
||||||||
|
Depreciation and amortization
|
72,093
|
|
50,549
|
|
43,082
|
|
|||||
|
Unrealized foreign currency exchange rate losses (gains)
|
11,739
|
|
1,905
|
|
(2,464
|
)
|
|||||
|
Loss on disposal of property and equipment
|
261
|
|
332
|
|
524
|
|
|||||
|
Stock-based compensation
|
50,812
|
|
43,184
|
|
19,845
|
|
|||||
|
Deferred income taxes
|
(17,584
|
)
|
(18,832
|
)
|
(12,973
|
)
|
|||||
|
Changes in reserves and allowances
|
31,350
|
|
13,945
|
|
13,916
|
|
|||||
|
Changes in operating assets and liabilities, net of effects of acquisitions:
|
|
|
|
||||||||
|
Accounts receivable
|
(101,057
|
)
|
(35,960
|
)
|
(53,433
|
)
|
|||||
|
Inventories
|
(84,658
|
)
|
(156,900
|
)
|
4,699
|
|
|||||
|
Prepaid expenses and other assets
|
(33,345
|
)
|
(19,049
|
)
|
(4,060
|
)
|
|||||
|
Accounts payable
|
49,137
|
|
14,642
|
|
35,370
|
|
|||||
|
Accrued expenses and other liabilities
|
28,856
|
|
56,481
|
|
21,966
|
|
|||||
|
Income taxes payable and receivable
|
3,387
|
|
7,443
|
|
4,511
|
|
|||||
|
Net cash provided by operating activities
|
219,033
|
|
120,070
|
|
199,761
|
|
|||||
|
Cash flows from investing activities
|
|
|
|
||||||||
|
Purchases of property and equipment
|
(140,528
|
)
|
(87,830
|
)
|
(50,650
|
)
|
|||||
|
Purchase of business
|
(10,924
|
)
|
|
(148,097
|
)
|
—
|
|
||||
|
Purchases of other assets
|
(860
|
)
|
(475
|
)
|
(1,310
|
)
|
|||||
|
Change in loans receivable
|
—
|
|
(1,700
|
)
|
—
|
|
|||||
|
Change in restricted cash
|
—
|
|
—
|
|
5,029
|
|
|||||
|
Net cash used in investing activities
|
(152,312
|
)
|
(238,102
|
)
|
(46,931
|
)
|
|||||
|
Cash flows from financing activities
|
|
|
|
||||||||
|
Proceeds from revolving credit facility
|
—
|
|
100,000
|
|
—
|
|
|||||
|
Payments on revolving credit facility
|
(100,000
|
)
|
—
|
|
—
|
|
|||||
|
Proceeds from term loan
|
250,000
|
|
—
|
|
—
|
|
|||||
|
Payments on term loan
|
(13,750
|
)
|
—
|
|
(25,000
|
)
|
|||||
|
Proceeds from long term debt
|
—
|
|
—
|
|
50,000
|
|
|||||
|
Payments on long term debt
|
(4,972
|
)
|
(5,471
|
)
|
(44,330
|
)
|
|||||
|
Excess tax benefits from stock-based compensation arrangements
|
36,965
|
|
17,167
|
|
17,868
|
|
|||||
|
Proceeds from exercise of stock options and other stock issuances
|
15,776
|
|
15,099
|
|
14,776
|
|
|||||
|
Payments of debt financing costs
|
(1,713
|
)
|
|
—
|
|
(1,017
|
)
|
||||
|
Net cash provided by financing activities
|
182,306
|
|
126,795
|
|
12,297
|
|
|||||
|
Effect of exchange rate changes on cash and cash equivalents
|
(3,341
|
)
|
(3,115
|
)
|
1,330
|
|
|||||
|
Net increase in cash and cash equivalents
|
245,686
|
|
5,648
|
|
166,457
|
|
|||||
|
Cash and cash equivalents
|
|
|
|
||||||||
|
Beginning of period
|
347,489
|
|
341,841
|
|
175,384
|
|
|||||
|
End of period
|
$
|
593,175
|
|
$
|
347,489
|
|
$
|
341,841
|
|
||
|
|
|
|
|
||||||||
|
Non-cash investing and financing activities
|
|
|
|
||||||||
|
Increase in accrual for property and equipment
|
$
|
4,922
|
|
$
|
3,786
|
|
$
|
12,137
|
|
||
|
Non-cash acquisition of business
|
11,233
|
|
—
|
|
—
|
|
|||||
|
Other supplemental information
|
|
|
|
|
|||||||
|
Cash paid for income taxes
|
103,284
|
|
85,570
|
|
57,739
|
|
|||||
|
Cash paid for interest, net of capitalized interest
|
4,146
|
|
1,505
|
|
3,306
|
|
|||||
See accompanying notes.
46
Under Armour, Inc. and Subsidiaries
Notes to the Audited Consolidated Financial Statements
1. Description of the Business
Under Armour, Inc. is a developer, marketer and distributor of branded performance apparel, footwear and accessories. These products are sold worldwide and worn by athletes at all levels, from youth to professional on playing fields around the globe, as well as by consumers with active lifestyles.
2
. Summary of Significant Accounting Policies
Basis of Presentation
The accompanying consolidated financial statements include the accounts of Under Armour, Inc. and its wholly owned subsidiaries (the “Company”). All intercompany balances and transactions have been eliminated. The accompanying consolidated financial statements were prepared in accordance with accounting principles generally accepted in the United States of America.
On June 11, 2012 and March 17, 2014 the Board of Directors declared two-for-one stock splits of the Company's Class A and Class B common stock, which were effected in the form of a
100%
common stock dividend distributed on July 9, 2012 and April 14, 2014, respectively. Stockholders' equity and all references to share and per share amounts in the accompanying consolidated financial statements have been retroactively adjusted to reflect these two-for-one stock splits for all periods presented.
Cash and Cash Equivalents
The Company considers all highly liquid investments with an original maturity of three months or less at date of inception to be cash and cash equivalents. Included in interest expense, net for the years ended
December 31, 2014
,
2013
and
2012
was interest income of $
192.0 thousand
, $
23.7 thousand
and $
25.2 thousand
, respectively, related to cash and cash equivalents.
Concentration of Credit Risk
Financial instruments that subject the Company to significant concentration of credit risk consist primarily of accounts receivable. The majority of the Company’s accounts receivable is due from large sporting goods retailers. Credit is extended based on an evaluation of the customer’s financial condition and collateral is not required. The Company had two customers in North America that individually accounted for
23.4%
and
11.1%
of accounts receivable as of December 31, 2014. The Company's largest customer accounted for
14.4%
,
16.6%
and
16.6%
of net revenues for the years ended
December 31, 2014
,
2013
and
2012
, respectively.
Allowance for Doubtful Accounts
The Company
make
s
ongoing estimates relating to the collectability of accounts receivable and maintain
s
an allowance for estimated losses resulting from the inability of
its
customers to make required payments. In determining the amount of the reserve,
the Company
consider
s
historical levels of credit losses and significant economic developments within the retail environment that could impact the ability of
its
customers to pay outstanding balances and makes judgments about the creditworthiness of significant customers based on ongoing credit evaluations. Because
the Company
cannot predict future changes in the financial stability of
its
customers, actual future losses from uncollectible accounts may differ from estimates. If the financial condition of customers were to deteriorate, resulting in their inability to make payments, a larger reserve might be required. In the event
the Company
determine
s
a smaller or larger reserve is appropriate,
it
would record a benefit or charge to selling, general and administrative expense in the period in which such a determination was made.
As of December 31, 2014
and
2013
, the allowance for doubtful accounts was $
3.7 million
and $
2.9 million
, respectively.
Inventories
Inventories consist primarily of finished goods. Costs of finished goods inventories include all costs incurred to bring inventory to its current condition, including inbound freight, duties and other costs. The Company
value
s its
inventory at standard cost which approximates landed cost, using the first-in, first-out method of cost determination. Market value is estimated based upon assumptions made about future demand and retail market conditions. If
the Company
determine
s
that the estimated market value of
its
inventory is less than the carrying value of such inventory,
it
record
s
a charge to cost of goods sold to reflect the lower of cost or market. If actual market conditions are less favorable than those
projected
by the Company
, further adjustments may be required that would increase the cost of goods sold in the period in which such a determination was made.
47
Income Taxes
Income taxes are accounted for under the asset and liability method. Deferred income tax assets and liabilities are established for temporary differences between the financial reporting basis and the tax basis of
the Company’s
assets and liabilities at tax rates expected to be in effect when such assets or liabilities are realized or settled. Deferred income tax assets are reduced by valuation allowances when necessary.
Assessing whether deferred tax assets are realizable requires significant judgment.
The Company
consider
s
all available positive and negative evidence, including historical operating performance and expectations of future operating performance. The ultimate realization of deferred tax assets is often dependent upon future taxable income and therefore can be uncertain. To the extent
the Company
believe
s
it is more likely than not that all or some portion of the asset will not be realized, valuation allowances are established against
the Company’s
deferred tax assets, which increase income tax expense in the period when such a determination is made.
Income taxes include the largest amount of tax benefit for an uncertain tax position that is more likely than not to be sustained upon audit based on the technical merits of the tax position. Settlements with tax authorities, the expiration of statutes of limitations for particular tax positions, or obtaining new information on particular tax positions may cause a change to the effective tax rate.
The Company
recognize
s
accrued interest and penalties related to unrecognized tax benefits in the provision for income taxes on the consolidated statements of income.
Property and Equipment
Property and equipment are stated at cost, including the cost of internal labor for software customized for internal use, less accumulated depreciation and amortization. Property and equipment is depreciated using the straight-line method over the estimated useful lives of the assets:
3
to
10
years for furniture, office equipment, software and plant equipment and
10
to
35
years for site improvements, buildings and building equipment. Leasehold and tenant improvements are amortized over the shorter of the lease term or the estimated useful lives of the assets. The cost of in-store apparel and footwear fixtures and displays are capitalized, included in furniture, fixtures and displays, and depreciated over
3
years. The Company periodically reviews assets’ estimated useful lives based upon actual experience and expected future utilization. A change in useful life is treated as a change in accounting estimate and is applied prospectively.
The Company capitalizes the cost of interest for long term property and equipment projects based on the Company’s weighted average borrowing rates in place while the projects are in progress. Capitalized interest was $
0.4 million
and $
0.4 million
as of
December 31, 2014
and
2013
, respectively.
Upon retirement or disposition of property and equipment, the cost and accumulated depreciation are removed from the accounts and any resulting gain or loss is reflected in selling, general and administrative expenses for that period. Major additions and betterments are capitalized to the asset accounts while maintenance and repairs, which do not improve or extend the lives of assets, are expensed as incurred.
Goodwill, Intangible Assets and Long-Lived Assets
Goodwill and intangible assets are recorded at their estimated fair values at the date of acquisition and are allocated to the reporting units that are expected to receive the related benefits. Goodwill and indefinite lived intangible assets are not amortized and are required to be tested for impairment at least annually or sooner whenever events or changes in circumstances indicate that the assets may be impaired. In conducting an annual impairment test,
the Company first reviews
qualitative factors to determine whether it is more likely than not that the fair value of the reporting unit is less than its carrying amount. If factors indicate that is the case,
the Company performs
a quantitative assessment over relevant reporting units, analyzing the expected present value of future cash flows and quantify the amount of impairment, if any.
The Company
performs
its
annual impairment tests in the fourth quarter of each fiscal year.
The Company
continually evaluate
s
whether events and circumstances have occurred that indicate the remaining estimated useful life of long-lived assets may warrant revision or that the remaining balance may not be recoverable. These factors may include a significant deterioration of operating results, changes in business plans, or changes in anticipated cash flows. When factors indicate that an asset should be evaluated for possible impairment,
the Company
review
s
long-lived assets to assess recoverability from future operations using undiscounted cash flows. If future undiscounted cash flows are less than the carrying value, an impairment is recognized in earnings to the extent that the carrying value exceeds fair value.
48
Accrued Expenses
At
December 31, 2014
, accrued expenses primarily included $
61.4 million
and $
14.0 million
of accrued compensation and benefits and marketing expenses, respectively. At
December 31, 2013
, accrued expenses primarily included $
56.7 million
and $
11.9 million
of accrued compensation and benefits and marketing expenses, respectively.
Foreign Currency Translation and Transactions
The functional currency for each of the Company’s wholly owned foreign subsidiaries is generally the applicable local currency. The translation of foreign currencies into U.S. dollars is performed for assets and liabilities using current foreign currency exchange rates in effect at the balance sheet date and for revenue and expense accounts using average foreign currency exchange rates during the period. Capital accounts are translated at historical foreign currency exchange rates. Translation gains and losses are included in stockholders’ equity as a component of accumulated other comprehensive income. Adjustments that arise from foreign currency exchange rate changes on transactions, primarily driven by intercompany transactions, denominated in a currency other than the functional currency are included in other expense, net on the consolidated statements of income.
Derivatives and Hedging Activities
The Company uses derivative financial instruments in the form of foreign currency forward and interest rate swap contracts to minimize the risk associated with foreign currency exchange rate and interest rate fluctuations. The Company accounts for derivative financial instruments pursuant to applicable accounting guidance. This guidance establishes accounting and reporting standards for derivative financial instruments and requires all derivatives to be recognized as either assets or liabilities on the balance sheet and to be measured at fair value. Unrealized derivative gain positions are recorded as other current assets or other long term assets, and unrealized derivative loss positions are recorded as accrued expenses or other long term liabilities, depending on the derivative financial instrument’s maturity date.
Currently, the majority of the Company’s foreign currency forward contracts are not designated as cash flow hedges, and accordingly, changes in their fair value are included in other expense, net on the consolidated statements of income. During 2014, the Company began entering into foreign currency forward contracts designated as cash flow hedges, and consequently, changes in fair value, excluding any ineffective portion, are recorded in other comprehensive income until net income is affected by the variability in cash flows of the hedged transaction. The effective portion is generally released to net income after the maturity of the related derivative and is classified in the same manner as the underlying exposure. Additionally, the Company has designated its interest rate swap contract as a cash flow hedge and accordingly, the effective portion of changes in fair value are recorded in other comprehensive income and reclassified into interest expense over the life of the underlying debt obligation. The ineffective portion, if any, is recognized in current period earnings. The Company does not enter into derivative financial instruments for speculative or trading purposes.
Revenue Recognition
The Company recognizes revenue pursuant to applicable accounting standards. Net revenues consist of both net sales and license and other revenues. Net sales are recognized upon transfer of ownership, including passage of title to the customer and transfer of risk of loss related to those goods. Transfer of title and risk of loss is based upon shipment under free on board shipping point for most goods or upon receipt by the customer depending on the country of the sale and the agreement with the customer. In some instances, transfer of title and risk of loss takes place at the point of sale, for example, at the Company’s brand and factory house stores. The Company may also ship product directly from its supplier to the customer and recognize revenue when the product is delivered to and accepted by the customer. License and other revenues are primarily recognized based upon shipment of licensed products sold by the Company’s licensees. Sales taxes imposed on the Company’s revenues from product sales are presented on a net basis on the consolidated statements of income and therefore do not impact net revenues or costs of goods sold.
The Company records reductions to revenue for estimated customer returns, allowances, markdowns and discounts. The Company bases its estimates on historical rates of customer returns and allowances as well as the specific identification of outstanding returns, markdowns and allowances that have not yet been received by the Company. The actual amount of customer returns and allowances, which is inherently uncertain, may differ from the Company’s estimates. If the Company determines that actual or expected returns or allowances are significantly higher or lower than the reserves it established, it would record a reduction or increase, as appropriate, to net sales in the period in which it makes such a determination. Provisions for customer specific discounts are based on contractual obligations with certain major customers. Reserves for returns, allowances, markdowns and discounts are recorded as an offset to accounts receivable as settlements are made through offsets to outstanding customer invoices. As of
December 31, 2014
and
2013
, there were $
68.9 million
and $
43.8 million
, respectively, in reserves for customer returns, allowances, markdowns and discounts.
49
Advertising Costs
Advertising costs are charged to selling, general and administrative expenses. Advertising production costs are expensed the first time an advertisement related to such production costs is run. Media (television, print and radio) placement costs are expensed in the month during which the advertisement appears, and costs related to event sponsorships are expensed when the event occurs. In addition, advertising costs include sponsorship expenses. Accounting for sponsorship payments is based upon specific contract provisions and the payments are generally expensed uniformly over the term of the contract after recording expense related to specific performance incentives once they are deemed probable. Advertising expense, including amortization of in-store marketing fixtures and displays, was $
333.0 million
, $
246.5 million
and $
205.4 million
for the years ended
December 31, 2014
,
2013
and
2012
, respectively. At
December 31, 2014
and
2013
, prepaid advertising costs were $
31.1 million
and $
22.0 million
, respectively.
Shipping and Handling Costs
The Company charges certain customers shipping and handling fees. These fees are recorded in net revenues. The Company includes the majority of outbound handling costs as a component of selling, general and administrative expenses. Outbound handling costs include costs associated with preparing goods to ship to customers and certain costs to operate the Company’s distribution facilities. These costs, included within selling, general and administrative expenses, were $
55.3 million
, $
46.1 million
and $
34.8 million
for the years ended
December 31, 2014
,
2013
and
2012
, respectively. The Company includes outbound freight costs associated with shipping goods to customers as a component of cost of goods sold.
Minority Investment
The Company holds a minority investment in Dome Corporation (“Dome”), the Company’s Japanese licensee. The Company invested ¥
1,140.0 million
, or $
15.5 million
, in exchange for
19.5%
common stock ownership in Dome. As of
December 31, 2014
and
2013
, the carrying value of the Company’s investment was $
13.4 million
and $
15.2 million
, respectively, and was included in other long term assets on the consolidated balance sheet. The investment is subject to foreign currency translation rate fluctuations as it is held by the Company’s European subsidiary.
The Company accounts for its investment in Dome under the cost method given that it does not have the ability to exercise significant influence. Additionally, the Company concluded that no event or change in circumstances occurred during the year ended
December 31, 2014
that may have a significant adverse effect on the fair value of the investment.
Earnings per Share
Basic earnings per common share is computed by dividing net income available to common stockholders for the period by the weighted average number of common shares outstanding during the period. Any stock-based compensation awards that are determined to be participating securities, which are stock-based compensation awards that entitle the holders to receive dividends prior to vesting, are included in the calculation of basic earnings per share using the two class method. Diluted earnings per common share is computed by dividing net income available to common stockholders for the period by the diluted weighted average common shares outstanding during the period. Diluted earnings per share reflects the potential dilution from common shares issuable through stock options, warrants, restricted stock units and other equity awards. Refer to Note 11 for further discussion of earnings per share.
Stock-Based Compensation
The Company accounts for stock-based compensation in accordance with accounting guidance that requires all stock-based compensation awards granted to employees and directors to be measured at fair value and recognized as an expense in the financial statements. In addition, this guidance requires that excess tax benefits related to stock-based compensation awards be reflected as financing cash flows.
The Company uses the Black-Scholes option-pricing model to estimate the fair market value of stock-based compensation awards. The Company uses the “simplified method” to estimate the expected life of options, as permitted by accounting guidance. The “simplified method” calculates the expected life of a stock option equal to the time from grant to the midpoint between the vesting date and contractual term, taking into account all vesting tranches. The risk free interest rate is based on the yield for the U.S. Treasury bill with a maturity equal to the expected life of the stock option. Expected volatility is based on the Company's historical average. Compensation expense is recognized net of forfeitures on a straight-line basis over the total vesting period, which is the implied requisite service period. Compensation expense for performance-based awards is recorded over the implied requisite service period when achievement of the performance target is deemed probable. The forfeiture rate is estimated at the date of grant based on historical rates.
50
The Company issues new shares of Class A Common Stock upon exercise of stock options, grant of restricted stock or share unit conversion. Refer to Note 12 for further details on stock-based compensation.
Management Estimates
The preparation of financial statements in conformity with accounting principles generally accepted in the United States of America requires management to make estimates and assumptions that affect the reported amounts of assets and liabilities and disclosure of contingent assets and liabilities at the date of the consolidated financial statements and the reported amounts of revenues and expenses during the reporting period. Actual results could differ from these estimates.
Fair Value of Financial Instruments
The carrying amounts shown for the Company’s cash and cash equivalents, accounts receivable and accounts payable approximate fair value because of the short term maturity of those instruments. The fair value of the long term debt approximates its carrying value based on the variable nature of interest rates and current market rates available to the Company. The fair value of foreign currency forward contracts is based on the net difference between the U.S. dollars to be received or paid at the contracts’ settlement date and the U.S. dollar value of the foreign currency to be sold or purchased at the current forward exchange rate. The fair value of the interest rate swap contract is based on the net difference between the fixed interest to be paid and variable interest to be received over the term of the contract based on current market rates.
Recently Issued Accounting Standards
In May 2014, the Financial Accounting Standards Board (“FASB”) issued an Accounting Standards Update which supersedes the most current revenue recognition requirements. The new revenue recognition standard requires entities to recognize revenue in a way that depicts the transfer of goods or services to customers in an amount that reflects the consideration which the entity expects to be entitled to in exchange for those goods or services. This guidance is effective for annual and interim reporting periods beginning after December 15, 2016, with early adoption not permitted.
The Company is
currently evaluating the standard to determine the impact of its adoption on
the Company's
consolidated financial statements.
In January 2015, the FASB issued an Accounting Standards Update which eliminates from GAAP the concept of extraordinary items and the need to separately classify, present, and disclose extraordinary events and transactions. This guidance is effective for annual and interim reporting periods beginning after December 15, 2015, with early adoption permitted provided that the guidance is applied from the beginning of the fiscal year of adoption. The adoption of this pronouncement is not expected to impact
the Company's
consolidated financial statements.
Recently Adopted Accounting Standards
In July 2013, the FASB issued an Accounting Standards Update which requires that an unrecognized tax benefit, or a portion of an unrecognized tax benefit, should be presented in the financial statements as a reduction to a deferred tax asset for a net operating loss carryforward, a similar tax loss, or a tax credit carryforward, with certain exceptions. This guidance is effective for annual and interim reporting periods beginning after December 15, 2013. The adoption of this pronouncement did not have a material impact on
the Company's
consolidated financial statements.
In February 2013, the FASB issued an Accounting Standards Update which requires companies to present either in a single note or parenthetically on the face of the financial statements, the effect of significant amounts reclassified from each component of accumulated other comprehensive income based on its source and the income statement line items affected by the reclassification. This guidance is effective for annual and interim reporting periods beginning after December 15, 2012.
The adoption of this pronouncement did not have a material impact on
the Company's
consolidated financial statements.
3. Acquisitions
MapMyFitness
On December 6, 2013,
the Company acquired
100%
of the outstanding equity of MapMyFitness, Inc., a digital connected fitness platform, for
$150.0 million
in cash. The purchase price was financed through
$100.0 million
in debt under the Company's
existing revolving credit facility and cash on hand.
The acquisition was accounted for as a business combination. The Company allocated the total purchase price to the tangible and intangible assets acquired and liabilities assumed based on their estimated fair values on the acquisition date, with the remaining unallocated purchase price recorded as goodwill. As a result of the initial purchase price allocation, the Company recorded intangible assets of
$20.6 million
, goodwill of
$122.2 million
, and other net assets of
$6.6 million
, primarily consisting of
$4.7 million
of net deferred tax assets.
51
Intangible assets consist of
$12.0 million
of technology,
$5.0 million
of trade name, and
$3.6 million
of customer relationships. The Company estimated the acquisition date fair values of the intangible assets based on income based discounted cash flow models using estimates and assumptions regarding future operations. The Company will amortize the intangible assets on a straight-line basis over their estimated useful lives of
two
to
seven
years.
The goodwill recorded as a result of the acquisition primarily reflects unidentified intangible assets acquired, including the value of integrating and innovating acquired technologies and engaging and growing the digital community. The acquired goodwill has been allocated primarily within the Company's North America operating segment as well as the MapMyFitness operating segment. The goodwill associated with this acquisition is not deductible for tax purposes.
In connection with this acquisition, the Company incurred acquisition related expenses of approximately
$2.5 million
. These expenses were included in selling, general and administrative expenses on the consolidated statements of income during the year ended December 31, 2013. This acquisition did not have a material impact to the Company’s consolidated statements of income during the year ended December 31, 2013.
During the three months ended March 31, 2014, the Company finalized its valuation of the assets acquired and liabilities assumed as of the acquisition date and no adjustments were made to the preliminary purchase price allocation recorded as of December 31, 2013.
4. Property and Equipment, Net
Property and equipment consisted of the following:
|
|
December 31,
|
|||||||
|
(In thousands)
|
2014
|
2013
|
||||||
|
Leasehold and tenant improvements
|
$
|
128,088
|
|
$
|
97,776
|
|
||
|
Furniture, fixtures and displays
|
80,035
|
|
68,045
|
|
||||
|
Buildings
|
46,419
|
|
45,903
|
|
||||
|
Software
|
67,506
|
|
51,984
|
|
||||
|
Office equipment
|
51,531
|
|
39,551
|
|
||||
|
Plant equipment
|
70,317
|
|
45,509
|
|
||||
|
Land
|
17,628
|
|
17,628
|
|
||||
|
Construction in progress
|
57,677
|
|
28,471
|
|
||||
|
Other
|
3,175
|
|
1,219
|
|
||||
|
Subtotal property and equipment
|
522,376
|
|
396,086
|
|
||||
|
Accumulated depreciation
|
(216,812
|
)
|
(172,134
|
)
|
||||
|
Property and equipment, net
|
$
|
305,564
|
|
$
|
223,952
|
|
||
Construction in progress primarily includes costs incurred for software systems, leasehold improvements and in-store fixtures and displays not yet placed in use.
Depreciation expense related to property and equipment was
$63.6 million
,
$48.3 million
and
$39.8 million
for the years ended
December 31, 2014
,
2013
and
2012
, respectively.
5. Goodwill and Intangible Assets, Net
The following table summarizes changes in the carrying amount of the Company’s goodwill by reportable segment as of the periods indicated:
|
(In thousands)
|
North America
|
Other foreign countries and businesses
|
Total
|
|||||||||
|
Balance as of December 31, 2013
|
$
|
119,799
|
|
$
|
2,445
|
|
$
|
122,244
|
|
|||
|
Goodwill acquired
|
—
|
|
1,012
|
|
1,012
|
|
||||||
|
Balance as of December 31, 2014
|
$
|
119,799
|
|
$
|
3,457
|
|
$
|
123,256
|
|
|||
During 2014, the Company acquired
$1.0 million
of goodwill in connection with the acquisition of certain assets of its former distributor in Mexico, which was accounted for as a business combination.
52
The following table summarizes the Company’s intangible assets as of the periods indicated:
|
|
December 31, 2014
|
December 31, 2013
|
||||||||||||||||||||||
|
(In thousands)
|
Gross
Carrying Amount |
Accumulated
Amortization |
Net Carrying
Amount |
Gross
Carrying Amount |
Accumulated
Amortization |
Net Carrying
Amount |
||||||||||||||||||
|
Intangible assets subject to amortization:
|
||||||||||||||||||||||||
|
Technology
|
$
|
12,000
|
|
$
|
(1,907
|
)
|
$
|
10,093
|
|
$
|
12,000
|
|
$
|
(126
|
)
|
$
|
11,874
|
|
||||||
|
Trade name
|
5,000
|
|
(1,353
|
)
|
3,647
|
|
5,000
|
|
(53
|
)
|
4,947
|
|
||||||||||||
|
Customer relationships
|
11,927
|
|
(4,692
|
)
|
7,235
|
|
3,600
|
|
(38
|
)
|
3,562
|
|
||||||||||||
|
Lease-related intangible assets
|
3,896
|
|
(2,762
|
)
|
1,134
|
|
3,896
|
|
(2,605
|
)
|
1,291
|
|
||||||||||||
|
Other
|
2,196
|
|
(893
|
)
|
1,303
|
|
1,266
|
|
(532
|
)
|
734
|
|
||||||||||||
|
Total
|
$
|
35,019
|
|
$
|
(11,607
|
)
|
$
|
23,412
|
|
$
|
25,762
|
|
$
|
(3,354
|
)
|
$
|
22,408
|
|
||||||
|
Indefinite-lived intangible assets
|
2,818
|
|
1,689
|
|
||||||||||||||||||||
|
Intangible assets, net
|
$
|
26,230
|
|
$
|
24,097
|
|
||||||||||||||||||
Technology, trade-name and customer relationship intangible assets were acquired with the purchase of MapMyFitness and are amortized on a straight-line basis over
84 months
,
48 months
and
24 months
, respectively. Customer relationship intangible assets were also acquired with the acquisition of certain assets of the Company's former distributor in Mexico and are amortized on a straight-line basis over
36 months
. Lease-related intangible assets were acquired with the purchase of the Company’s corporate headquarters and are amortized over the remaining third party lease terms, which ranged from
9 months
to
15 years
on the date of purchase. Other intangible assets are amortized using estimated useful lives of
55 months
to
120 months
with no residual value. Amortization expense, which is included in selling, general and administrative expenses, was
$8.5 million
,
$1.6 million
and
$2.2 million
for the years ended
December 31, 2014
,
2013
and
2012
, respectively. The following is the estimated amortization expense for the Company’s intangible assets as of
December 31, 2014
:
|
(In thousands)
|
|
||
|
2015
|
$
|
7,862
|
|
|
2016
|
6,118
|
|
|
|
2017
|
3,236
|
|
|
|
2018
|
2,074
|
|
|
|
2019
|
1,966
|
|
|
|
2020 and thereafter
|
2,156
|
|
|
|
Amortization expense of intangible assets
|
$
|
23,412
|
|
At December 31, 2014, 2013 and 2012, the Company determined that its goodwill and indefinite-lived intangible assets were not impaired.
6. Credit Facility and Long Term Debt
Credit Facility
In May 2014, the Company entered into a new unsecured
$650.0 million
credit facility and terminated its prior
$325.0 million
secured revolving credit facility. The credit agreement has a term of
five years
through
May 2019
, with permitted extensions under certain circumstances. The credit agreement provides for a committed revolving credit facility of
$400.0 million
, in addition to an aggregate term loan commitment of
$250.0 million
, consisting of a
$150.0 million
term loan, drawn at the closing of the credit agreement, and
$100.0 million
delayed draw term loan drawn in November 2014 for general corporate purposes. At the Company's request and the lenders' consent, the revolving credit facility or term loans may be increased by up to an additional
$150.0 million
. Borrowings under the revolving credit facility may be made in U.S. Dollars, Euros, Pounds Sterling, Japanese Yen and Canadian Dollars. Up to
$50.0 million
of the facility may be used for the issuance of letters of credit and up to
$50.0 million
of the facility may be used for the issuance of swingline loans. There were no significant letters of credit and no swingline loans outstanding as of
December 31, 2014
.
The credit agreement contains negative covenants that, subject to significant exceptions, limit the ability of the Company and its subsidiaries to, among other things, incur additional indebtedness, make restricted payments, pledge their assets as security, make investments, loans, advances, guarantees and acquisitions, undergo fundamental changes and enter into transactions with affiliates. The Company is also required to maintain a ratio of consolidated EBITDA, as defined in the credit agreement, to consolidated interest expense of not less than
3.50
to
1.00
and is not permitted to allow the ratio of consolidated total indebtedness to consolidated EBITDA to be greater than
3.25
to
1.00
("consolidated leverage ratio"). As of
December 31, 2014
, the Company was in compliance with these ratios. In addition, the credit agreement contains events of default that are
53
customary for a facility of this nature, and includes a cross default provision whereby an event of default under other material indebtedness, as defined in the credit agreement, will be considered an event of default under the credit agreement.
Borrowings under the credit agreement bear interest at a rate per annum equal to, at the Company’s option, either (a) an alternate base rate, or (b) a rate based on the rates applicable for deposits in the interbank market for U.S. Dollars or the applicable currency in which the loans are made (“adjusted LIBOR”), plus in each case an applicable margin. The applicable margin for loans will be adjusted by reference to a grid (the “Pricing Grid”) based on the consolidated leverage ratio and ranges between
1.00%
to
1.25%
for adjusted LIBOR loans and
0.00%
to
0.25%
for alternate base rate loans. The interest rate under both term loans was
1.2%
during the
year ended December 31, 2014
. No balance was outstanding under the Company’s revolving credit facility as of
December 31, 2014
. Additionally, the Company pays a commitment fee on the average daily unused amount of the revolving credit facility, a ticking fee on the undrawn amounts under the delayed draw term loan and certain fees with respect to letters of credit. As of
December 31, 2014
, the commitment fee was
12.5
basis points.
The Company used
$100.0
million of the proceeds from the $150.0 million loan to repay the
$100.0
million outstanding under the Company's prior revolving credit facility. The Company incurred and capitalized
$1.7
million in deferred financing costs in connection with the credit facility.
Other Long Term Debt
The Company has long term debt agreements with various lenders to finance the acquisition or lease of qualifying capital investments. Loans under these agreements are collateralized by a first lien on the related assets acquired. At
December 31, 2014
,
2013
and
2012
, the outstanding principal balance under these agreements was
$2.0 million
,
$4.9 million
and
$11.9 million
, respectively. Currently, advances under these agreements bear interest rates which are fixed at the time of each advance. The weighted average interest rates on outstanding borrowings were
3.1%
,
3.3%
and
3.7%
for the years ended
December 31, 2014
,
2013
and
2012
, respectively.
In December 2012, the Company entered into a
$50.0 million
recourse loan collateralized by the land, buildings and tenant improvements comprising the Company's corporate headquarters. The loan has a
seven
year term and maturity date of
December 2019
. The loan bears interest at one month LIBOR plus a margin of
1.50%
, and allows for prepayment without penalty. The loan includes covenants and events of default substantially consistent with the new credit agreement discussed above. The loan also requires prior approval of the lender for certain matters related to the property, including transfers of any interest in the property. As of
December 31, 2014
,
2013
and
2012
, the outstanding balance on the loan was
$46.0 million
,
$48.0 million
and
$50.0 million
, respectively. The weighted average interest rate on the loan was
1.7%
for the years ended
December 31, 2014
,
2013
and
2012
.
The following are the scheduled maturities of long term debt as of
December 31, 2014
:
|
(In thousands)
|
|
||
|
2015
|
$
|
28,951
|
|
|
2016
|
27,000
|
|
|
|
2017
|
27,000
|
|
|
|
2018
|
27,000
|
|
|
|
2019
|
138,250
|
|
|
|
2020 and thereafter
|
36,000
|
|
|
|
Total scheduled maturities of long term debt
|
284,201
|
|
|
|
Less current maturities of long term debt
|
(28,951
|
)
|
|
|
Long term debt obligations
|
$
|
255,250
|
|
Interest expense, net was $
5.3 million
, $
2.9 million
and $
5.2 million
for the years ended
December 31, 2014
,
2013
and
2012
, respectively. Interest expense includes the amortization of deferred financing costs and interest expense under the credit and long term debt facilities.
The Company monitors the financial health and stability of its lenders under the credit and other long term debt facilities, however during any period of significant instability in the credit markets lenders could be negatively impacted in their ability to perform under these facilities.
54
7. Commitments and Contingencies
Obligations Under Operating Leases
The Company leases warehouse space, office facilities, space for its brand and factory house stores and certain equipment under non-cancelable operating leases. The leases expire at various dates through
2028
, excluding extensions at the Company’s option, and include provisions for rental adjustments. The table below includes executed lease agreements for brand and factory house stores that the Company did not yet occupy as of
December 31, 2014
and does not include contingent rent the Company may incur at its stores based on future sales above a specified minimum or payments made for maintenance, insurance and real estate taxes. The following is a schedule of future minimum lease payments for non-cancelable real property operating leases as of
December 31, 2014
as well as significant operating lease agreements entered into during the period after
December 31, 2014
through the date of this report:
|
(In thousands)
|
||||
|
2015
|
$
|
56,452
|
|
|
|
2016
|
57,079
|
|
||
|
2017
|
52,172
|
|
||
|
2018
|
48,345
|
|
||
|
2019
|
44,313
|
|
||
|
2020 and thereafter
|
214,214
|
|
||
|
Total future minimum lease payments
|
$
|
472,575
|
|
|
Included in selling, general and administrative expense was rent expense of
$59.0 million
,
$41.8 million
and
$31.1 million
for the years ended
December 31, 2014
,
2013
and
2012
, respectively, under non-cancelable operating lease agreements. Included in these amounts was contingent rent expense of
$11.0 million
,
$7.8 million
and
$6.2 million
for the years ended
December 31, 2014
,
2013
and
2012
, respectively.
Sponsorships and Other Marketing Commitments
Within the normal course of business, the Company enters into contractual commitments in order to promote the Company’s brand and products. These commitments include sponsorship agreements with teams and athletes on the collegiate and professional levels, official supplier agreements, athletic event sponsorships and other marketing commitments. The following is a schedule of the Company’s future minimum payments under its sponsorship and other marketing agreements as of
December 31, 2014
, as well as significant sponsorship and other marketing agreements entered into during the period after
December 31, 2014
through the date of this report:
|
(In thousands)
|
|
||
|
2015
|
$
|
90,056
|
|
|
2016
|
71,654
|
|
|
|
2017
|
56,734
|
|
|
|
2018
|
44,982
|
|
|
|
2019
|
33,155
|
|
|
|
2020 and thereafter
|
96,345
|
|
|
|
Total future minimum sponsorship and other marketing payments
|
$
|
392,926
|
|
The amounts listed above are the minimum obligations required to be paid under the Company’s sponsorship and other marketing agreements. The amounts listed above do not include additional performance incentives and product supply obligations provided under certain agreements. It is not possible to determine how much the Company will spend on product supply obligations on an annual basis as contracts generally do not stipulate specific cash amounts to be spent on products. The amount of product provided to the sponsorships depends on many factors including general playing conditions, the number of sporting events in which they participate and the Company’s decisions regarding product and marketing initiatives. In addition, the costs to design, develop, source and purchase the products furnished to the endorsers are incurred over a period of time and are not necessarily tracked separately from similar costs incurred for products sold to customers.
Other
From time to time, the Company is involved in litigation and other proceedings, including matters related to commercial and intellectual property disputes, as well as trade, regulatory and other claims related to its business. The Company believes that all current proceedings are routine in nature and incidental to the conduct of its business, and that the ultimate resolution of any such proceedings will not have a material adverse effect on its consolidated financial position, results of operations or cash flows.
55
In connection with various contracts and agreements, the Company has agreed to indemnify counterparties against certain third party claims relating to the infringement of intellectual property rights and other items. Generally, such indemnification obligations do not apply in situations in which the counterparties are grossly negligent, engage in willful misconduct, or act in bad faith. Based on the Company’s historical experience and the estimated probability of future loss, the Company has determined that the fair value of such indemnifications is not material to its consolidated financial position or results of operations.
8. Stockholders’ Equity
The Company’s Class A Common Stock and Class B Convertible Common Stock have an authorized number of shares at
December 31, 2014
of
400.0 million
shares and
36.6 million
shares, respectively, and each have a par value of $0.0003 1/3 per share. Holders of Class A Common Stock and Class B Convertible Common Stock have identical rights, including liquidation preferences, except that the holders of Class A Common Stock are entitled to
one
vote per share and holders of Class B Convertible Common Stock are entitled to
10
votes per share on all matters submitted to a stockholder vote. Class B Convertible Common Stock may only be held by Kevin Plank, the Company’s founder and Chief Executive Officer, or a related party of Mr. Plank, as defined in the Company’s charter. As a result, Mr. Plank has a majority voting control over the Company. Upon the transfer of shares of Class B Convertible Stock to a person other than Mr. Plank or a related party of Mr. Plank, the shares automatically convert into shares of Class A Common Stock on a
one-for-one
basis. In addition, all of the outstanding shares of Class B Convertible Common Stock will automatically convert into shares of Class A Common Stock on a
one-for-one
basis upon the death or disability of Mr. Plank or on the record date for any stockholders’ meeting upon which the shares of Class A Common Stock and Class B Convertible Common Stock beneficially owned by Mr. Plank is less than
15%
of the total shares of Class A Common Stock and Class B Convertible Common Stock outstanding. Holders of the Company’s common stock are entitled to receive dividends when and if authorized and declared out of assets legally available for the payment of dividends.
During the year ended
December 31, 2014
,
3.4 million
shares of Class B Convertible Common Stock were converted into shares of Class A Common Stock on a
one-for-one
basis in connection with stock sales.
9
. Fair Value Measurements
Fair value is defined as the price that would be received to sell an asset or paid to transfer a liability in an orderly transaction between market participants at the measurement date (an exit price). The fair value accounting guidance outlines a valuation framework, creates a fair value hierarchy in order to increase the consistency and comparability of fair value measurements and the related disclosures, and prioritizes the inputs used in measuring fair value as follows:
|
Level 1:
|
Observable inputs such as quoted prices in active markets;
|
|
Level 2:
|
Inputs, other than quoted prices in active markets, that are observable either directly or indirectly; and
|
|
Level 3:
|
Unobservable inputs for which there is little or no market data, which require the reporting entity to develop its own assumptions.
|
Financial assets and (liabilities) measured at fair value are set forth in the table below:
|
December 31, 2014
|
December 31, 2013
|
|||||||||||||||||||||||
|
(In thousands)
|
Level 1
|
Level 2
|
Level 3
|
Level 1
|
Level 2
|
Level 3
|
||||||||||||||||||
|
Derivative foreign currency forward contracts (see Note 14)
|
$
|
—
|
|
$
|
806
|
|
$
|
—
|
|
$
|
—
|
|
$
|
12
|
|
$
|
—
|
|
||||||
|
Interest rate swap contracts (see Note 14)
|
—
|
|
(607
|
)
|
—
|
|
—
|
|
1,087
|
|
—
|
|
||||||||||||
|
TOLI policies held by the Rabbi Trust (see Note 13)
|
—
|
|
4,734
|
|
—
|
|
—
|
|
4,625
|
|
—
|
|
||||||||||||
|
Deferred Compensation Plan obligations (see Note 13)
|
—
|
|
(4,525
|
)
|
—
|
|
—
|
|
(3,338
|
)
|
—
|
|
||||||||||||
Fair values of the financial assets and liabilities listed above are determined using inputs that use as their basis readily observable market data that are actively quoted and are validated through external sources, including third-party pricing services and brokers. The foreign currency forward contracts represent gains and losses on derivative contracts, which is the net difference between the U.S. dollar value to be received or paid at the contracts’ settlement date and the U.S. dollar value of the foreign currency to be sold or purchased at the current forward exchange rate. The interest rate swap contract represents gains and losses on the derivative contract, which is the net difference between the fixed interest to be paid and variable interest to be received over the term of the contract based on current market rates. The fair value of the trust owned life insurance (“TOLI”) policies held by the Rabbi Trust is based on the cash-surrender value of the life insurance policies, which are invested primarily
56
in mutual funds and a separately managed fixed income fund. These investments are initially made in the same funds and purchased in substantially the same amounts as the selected investments of participants in the Under Armour, Inc. Deferred Compensation Plan (the “Deferred Compensation Plan”), which represent the underlying liabilities to participants in the Deferred Compensation Plan. Liabilities under the Deferred Compensation Plan are recorded at amounts due to participants, based on the fair value of participants’ selected investments.
The carrying value of the Company's long term debt approximated its fair value as of
December 31, 2014
and
2013
. The fair value of the Company's long term debt was estimated based upon quoted prices for similar instruments (Level 2 input).
10
. Provision for Income Taxes
Income before income taxes is as follows:
|
|
Year Ended December 31,
|
||||||||||
|
(In thousands)
|
2014
|
2013
|
2012
|
||||||||
|
Income before income taxes:
|
|||||||||||
|
United States
|
$
|
269,503
|
|
$
|
196,558
|
|
$
|
155,514
|
|
||
|
Foreign
|
72,707
|
|
64,435
|
|
47,925
|
|
|||||
|
Total
|
$
|
342,210
|
|
$
|
260,993
|
|
$
|
203,439
|
|
||
The components of the provision for income taxes consisted of the following:
|
|
Year Ended December 31,
|
||||||||||
|
(In thousands)
|
2014
|
2013
|
2012
|
||||||||
|
Current
|
|||||||||||
|
Federal
|
$
|
110,439
|
|
$
|
85,542
|
|
$
|
66,533
|
|
||
|
State
|
24,419
|
|
19,130
|
|
12,962
|
|
|||||
|
Other foreign countries
|
16,489
|
|
13,295
|
|
8,139
|
|
|||||
|
151,347
|
|
117,967
|
|
87,634
|
|
||||||
|
Deferred
|
|||||||||||
|
Federal
|
(15,368
|
)
|
(14,722
|
)
|
(9,606
|
)
|
|||||
|
State
|
(4,073
|
)
|
(5,541
|
)
|
(3,563
|
)
|
|||||
|
Other foreign countries
|
2,262
|
|
959
|
|
196
|
|
|||||
|
(17,179
|
)
|
(19,304
|
)
|
(12,973
|
)
|
||||||
|
Provision for income taxes
|
$
|
134,168
|
|
$
|
98,663
|
|
$
|
74,661
|
|
||
A reconciliation from the U.S. statutory federal income tax rate to the effective income tax rate is as follows:
|
|
Year Ended December 31,
|
|||||||
|
|
2014
|
2013
|
2012
|
|||||
|
U.S. federal statutory income tax rate
|
35.0
|
%
|
35.0
|
%
|
35.0
|
%
|
||
|
State taxes, net of federal tax impact
|
3.8
|
|
2.4
|
|
2.1
|
|
||
|
Unrecognized tax benefits
|
1.9
|
|
2.5
|
|
2.7
|
|
||
|
Nondeductible expenses
|
1.0
|
|
1.1
|
|
0.6
|
|
||
|
Foreign rate differential
|
(4.5
|
)
|
(4.8
|
)
|
(4.9
|
)
|
||
|
Foreign valuation allowance
|
2.5
|
|
1.5
|
|
0.8
|
|
||
|
Other
|
(0.5
|
)
|
0.1
|
|
0.4
|
|
||
|
Effective income tax rate
|
39.2
|
%
|
37.8
|
%
|
36.7
|
%
|
||
The increase in the
2014
full year effective income tax rate, as compared to
2013
, is primarily due to increased foreign investments driving a lower proportion of foreign taxable income in 2014 and state tax credits received in 2013.
57
Deferred tax assets and liabilities consisted of the following:
|
|
December 31,
|
|||||||
|
(In thousands)
|
2014
|
2013
|
||||||
|
Deferred tax asset
|
||||||||
|
Stock-based compensation
|
$
|
35,161
|
|
$
|
25,472
|
|
||
|
Allowance for doubtful accounts and other reserves
|
24,774
|
|
16,262
|
|
||||
|
Foreign net operating loss carryforward
|
16,302
|
|
13,829
|
|
||||
|
Accrued expenses
|
11,398
|
|
3,403
|
|
||||
|
Deferred rent
|
11,005
|
|
8,980
|
|
||||
|
Inventory obsolescence reserves
|
8,198
|
|
6,269
|
|
||||
|
Tax basis inventory adjustment
|
5,845
|
|
5,633
|
|
||||
|
Foreign tax credits
|
5,131
|
|
3,807
|
|
||||
|
U. S. net operating loss carryforward
|
4,733
|
|
10,119
|
|
||||
|
State tax credits, net of federal tax impact
|
4,245
|
|
5,342
|
|
||||
|
Deferred compensation
|
1,858
|
|
1,372
|
|
||||
|
Other
|
4,592
|
|
5,889
|
|
||||
|
Total deferred tax assets
|
133,242
|
|
106,377
|
|
||||
|
Less: valuation allowance
|
(15,550
|
)
|
(8,091
|
)
|
||||
|
Total net deferred tax assets
|
117,692
|
|
98,286
|
|
||||
|
Deferred tax liability
|
||||||||
|
Property, plant and equipment
|
(17,638
|
)
|
(13,375
|
)
|
||||
|
Intangible assets
|
(7,010
|
)
|
(8,627
|
)
|
||||
|
Prepaid expenses
|
(6,424
|
)
|
(6,380
|
)
|
||||
|
Other
|
(612
|
)
|
(447
|
)
|
||||
|
Total deferred tax liabilities
|
(31,684
|
)
|
(28,829
|
)
|
||||
|
Total deferred tax assets, net
|
$
|
86,008
|
|
$
|
69,457
|
|
||
In connection with the Company's acquisition of MapMyFitness (see Note 3), the Company acquired
$10.5
million in deferred tax assets associated with approximately
$42.5
million in federal and state net operating loss (“NOLs”) carryforwards. The acquisition resulted in a “change of ownership” within the meaning of Section 382 of the Internal Revenue Code, and, as a result, such NOLs are subject to an annual limitation.
As of
December 31, 2014
, the Company had
$4.7
million in deferred tax assets associated with approximately
$23.1
million in federal and state net operating losses from the acquisition of MapMyFitness remaining, which will expire beginning
2029
through
2033
. Based upon the historical taxable income and projections of future taxable income over periods in which these NOLs will be deductible, the Company believes that it is more likely than not that the Company will be able to fully utilize these NOLs before the carry-forward periods expire beginning
2029
through
2033
, and therefore a valuation allowance is not required.
As of
December 31, 2014
, the Company had
$16.3
million in deferred tax assets associated with approximately
$62.0
million in foreign net operating loss carryforwards, which will expire beginning
2016
through
2020
. As of
December 31, 2014
, the Company believes certain deferred tax assets associated with foreign net operating loss carryforwards will expire unused based on the Company's projections. Therefore, a valuation allowance of
$6.1 million
was recorded against the Company's net deferred tax assets in
2014
.
As of
December 31, 2014
, the Company had
$5.1 million
in deferred tax assets associated with foreign tax credits. As of
December 31, 2014
the Company believes that a portion of the foreign taxes paid would not be creditable against its future income taxes. Therefore, a valuation allowance of
$1.3 million
was recorded against the Company's net deferred tax assets in
2014
.
As of
December 31, 2014
, approximately
$129.2 million
of cash and cash equivalents was held by the Company's non-U.S. subsidiaries whose cumulative undistributed earnings total
$176.8 million
. Withholding and U.S. taxes have not been provided on the undistributed earnings as the earnings are being permanently reinvested in its non-U.S. subsidiaries. Determining the tax liability that would arise if these earnings were repatriated is not practical.
We utilize the “with and without” method for intraperiod allocation of income tax provisions. Certain tax benefits associated with the Company’s stock-based compensation arrangements are recorded directly to Stockholders’ equity including benefit from excess tax deductions.
58
As of
December 31, 2014
and
2013
, the total liability for unrecognized tax benefits, including related interest and penalties, was approximately
$31.3 million
and
$24.1 million
, respectively. The following table represents a reconciliation of the Company's total unrecognized tax benefits balances, excluding interest and penalties, for the years ended
December 31, 2014
,
2013
and
2012
:
|
|
Year Ended December 31,
|
|||||||||||
|
(In thousands)
|
2014
|
2013
|
2012
|
|||||||||
|
Beginning of year
|
$
|
21,712
|
|
$
|
15,297
|
|
$
|
9,783
|
|
|||
|
Increases as a result of tax positions taken in a prior period
|
250
|
|
—
|
|
—
|
|
||||||
|
Decreases as a result of tax positions taken in a prior period
|
—
|
|
—
|
|
—
|
|
||||||
|
Increases as a result of tax positions taken during the current period
|
8,947
|
|
7,526
|
|
5,702
|
|
||||||
|
Decreases as a result of tax positions taken during the current period
|
—
|
|
—
|
|
—
|
|
||||||
|
Decreases as a result of settlements during the current period
|
—
|
|
—
|
|
—
|
|
||||||
|
Reductions as a result of a lapse of statute of limitations during the current period
|
(2,556
|
)
|
(1,111
|
)
|
(188
|
)
|
||||||
|
End of year
|
$
|
28,353
|
|
$
|
21,712
|
|
$
|
15,297
|
|
|||
As of
December 31, 2014
,
$26.3 million
of unrecognized tax benefits, excluding interest and penalties, would impact the Company's effective tax rate if recognized.
As of
December 31, 2014
,
2013
and
2012
, the liability for unrecognized tax benefits included
$3.0 million
,
$2.4 million
and
$1.8 million
, respectively, for the accrual of interest and penalties. For each of the years ended
December 31, 2014
,
2013
and
2012
, the Company recorded
$1.2 million
,
$1.0 million
and
$0.7 million
, respectively, for the accrual of interest and penalties in its consolidated statements of income. The Company recognizes accrued interest and penalties related to unrecognized tax benefits in the provision for income taxes on the consolidated statements of income.
The Company files income tax returns in the U.S. federal jurisdiction and various state and foreign jurisdictions. The Company is currently under audit by the Internal Revenue Service for the 2011 tax year and by the Canada Revenue Authority for the 2011 through 2012 tax years. The majority of the Company's returns for years before 2011 are no longer subject to U.S. federal, state and local or foreign income tax examinations by tax authorities
The total amount of unrecognized tax benefits relating to the Company's tax positions is subject to change based on future events including, but not limited to, the settlements of ongoing tax audits and assessments and the expiration of applicable statutes of limitations. Although the outcomes and timing of such events are highly uncertain, the Company does not anticipate that the balance of gross unrecognized tax benefits, excluding interest and penalties, will change significantly during the next twelve months. However, changes in the occurrence, expected outcomes, and timing of such events could cause the Company's current estimates to change materially in the future.
11. Earnings per Share
The calculation of earnings per share for common stock shown below excludes the income attributable to outstanding restricted stock awards from the numerator and excludes the impact of these awards from the denominator. The following is a reconciliation of basic earnings per share to diluted earnings per share:
|
|
Year Ended December 31,
|
|||||||||||
|
(In thousands, except per share amounts)
|
2014
|
2013
|
2012
|
|||||||||
|
Numerator
|
||||||||||||
|
Net income
|
$
|
208,042
|
|
$
|
162,330
|
|
$
|
128,778
|
|
|||
|
Denominator
|
||||||||||||
|
Weighted average common shares outstanding
|
213,227
|
|
210,696
|
|
208,686
|
|
||||||
|
Effect of dilutive securities
|
6,153
|
|
5,262
|
|
4,074
|
|
||||||
|
Weighted average common shares and dilutive securities outstanding
|
219,380
|
|
215,958
|
|
212,760
|
|
||||||
|
Earnings per share—basic
|
$
|
0.98
|
|
$
|
0.77
|
|
$
|
0.62
|
|
|||
|
Earnings per share—diluted
|
$
|
0.95
|
|
$
|
0.75
|
|
$
|
0.61
|
|
|||
Effects of potentially dilutive securities are presented only in periods in which they are dilutive. Stock options, restricted stock units and warrants representing
22.6 thousand
,
116.9 thousand
and
208.9 thousand
shares of common stock were outstanding for the years ended
December 31, 2014
,
2013
and
2012
, respectively, but were excluded from the computation of diluted earnings per share because their effect would be anti-dilutive.
59
12
. Stock-Based Compensation
Stock Compensation Plans
The Under Armour, Inc. Amended and Restated 2005 Omnibus Long-Term Incentive Plan (the “2005 Plan”) provides for the issuance of stock options, restricted stock, restricted stock units and other equity awards to officers, directors, key employees and other persons. Stock options and restricted stock and restricted stock unit awards under the 2005 Plan generally vest ratably over a two to four year period. The contractual term for stock options is generally ten years from the date of grant. The Company generally receives a tax deduction for any ordinary income recognized by a participant in respect to an award under the 2005 Plan. The 2005 Plan terminates in 2015. As of
December 31, 2014
,
19.3 million
shares are available for future grants of awards under the 2005 Plan.
Total stock-based compensation expense for the years ended
December 31, 2014
,
2013
and
2012
was $
50.8 million
, $
43.2 million
and $
19.8 million
, respectively. As of
December 31, 2014
, the Company had $
28.6 million
of unrecognized compensation expense expected to be recognized over a weighted average period of
1.0
year. This unrecognized compensation expense does not include any expense related to performance-based restricted stock units for which the performance targets have not been achieved as of December 31, 2014. Refer to “Restricted Stock and Restricted Stock Units” below for further information on these awards.
Employee Stock Purchase Plan
The Company’s Employee Stock Purchase Plan (the “ESPP”) allows for the purchase of Class A Common Stock by all eligible employees at a
15%
discount from fair market value subject to certain limits as defined in the ESPP. As of
December 31, 2014
,
2.8 million
shares are available for future purchases under the ESPP. During the years ended
December 31, 2014
,
2013
and
2012
,
87.6 thousand
,
108.4 thousand
and
113.8 thousand
shares were purchased under the ESPP, respectively
.
Non-Employee Director Compensation Plan and Deferred Stock Unit Plan
The Company’s Non-Employee Director Compensation Plan (the “Director Compensation Plan”) provides for cash compensation and equity awards to non-employee directors of the Company under the 2005 Plan. Non-employee directors have the option to defer the value of their annual cash retainers as deferred stock units in accordance with the Under Armour, Inc. Non-Employee Deferred Stock Unit Plan (the “DSU Plan”). Each new non-employee director receives an award of restricted stock units upon the initial election to the Board of Directors, with the units covering stock valued at
$100.0 thousand
on the grant date and vesting in three equal annual installments. In addition, each non-employee director receives, following each annual stockholders’ meeting, a grant under the 2005 Plan of restricted stock units covering stock valued at
$75.0 thousand
on the grant date. Beginning in 2015, this annual grant is increasing from
$75.0 thousand
to
$125.0 thousand
. Each award vests
100%
on the date of the next annual stockholders’ meeting following the grant date.
The receipt of the shares otherwise deliverable upon vesting of the restricted stock units automatically defers into deferred stock units under the DSU Plan. Under the DSU Plan each deferred stock unit represents the Company’s obligation to issue one share of the Company’s Class A Common Stock with the shares delivered six months following the termination of the director’s service.
Stock Options
The weighted average fair value of a stock option granted for the year ended
December 31, 2013
was $
12.91
. The fair value of each stock option granted is estimated on the date of grant using the Black-Scholes option-pricing model with the following weighted average assumptions:
|
|
Year Ended December 31,
|
|||
|
|
2013
|
|||
|
Risk-free interest rate
|
1.2
|
%
|
||
|
Average expected life in years
|
6.25
|
|
||
|
Expected volatility
|
55.4
|
%
|
||
|
Expected dividend yield
|
—
|
%
|
||
There were no stock options granted during the years ended
December 31, 2014
and December 31, 2012.
60
A summary of the Company’s stock options as of
December 31, 2014
,
2013
and
2012
, and changes during the years then ended is presented below:
|
(In thousands, except per share amounts)
|
Year Ended December 31,
|
||||||||||||||||||||
|
2014
|
2013
|
2012
|
|||||||||||||||||||
|
|
Number
of Stock
Options
|
Weighted
Average
Exercise
Price
|
Number
of Stock
Options
|
Weighted
Average
Exercise
Price
|
Number
of Stock
Options
|
Weighted
Average
Exercise
Price
|
|||||||||||||||
|
Outstanding, beginning of year
|
4,272
|
|
$
|
8.11
|
|
6,298
|
|
$
|
7.66
|
|
9,616
|
|
$
|
7.00
|
|
||||||
|
Granted, at fair market value
|
—
|
|
—
|
|
20
|
|
24.35
|
|
—
|
|
—
|
|
|||||||||
|
Exercised
|
(1,454
|
)
|
7.74
|
|
(1,822
|
)
|
6.68
|
|
(2,436
|
)
|
5.09
|
|
|||||||||
|
Expired
|
—
|
|
—
|
|
—
|
|
—
|
|
—
|
|
—
|
|
|||||||||
|
Forfeited
|
(7
|
)
|
16.46
|
|
(224
|
)
|
8.41
|
|
(882
|
)
|
7.60
|
|
|||||||||
|
Outstanding, end of year
|
2,811
|
|
$
|
8.28
|
|
4,272
|
|
$
|
8.11
|
|
6,298
|
|
$
|
7.66
|
|
||||||
|
Options exercisable, end of year
|
2,707
|
|
$
|
7.87
|
|
2,346
|
|
$
|
7.80
|
|
1,936
|
|
$
|
6.55
|
|
||||||
The intrinsic value of stock options exercised during the years ended
December 31, 2014
,
2013
and
2012
was
$73.0
million,
$44.1 million
and
$44.5 million
, respectively.
The following table summarizes information about stock options outstanding and exercisable as of
December 31, 2014
:
(In thousands, except per share amounts)
|
Options Outstanding
|
Options Exercisable
|
|||||||||||||||||||||
|
Number of
Underlying
Shares
|
Weighted
Average
Exercise
Price Per
Share
|
Weighted
Average
Remaining
Contractual
Life (Years)
|
Total
Intrinsic
Value
|
Number of
Underlying
Shares
|
Weighted
Average
Exercise
Price Per
Share
|
Weighted
Average
Remaining
Contractual
Life (Years)
|
Total
Intrinsic
Value
|
|||||||||||||||
|
2,811
|
$
|
8.28
|
|
5.01
|
$
|
167,623
|
|
2,707
|
$
|
7.87
|
|
4.94
|
$
|
162,518
|
|
|||||||
Restricted Stock and Restricted Stock Units
A summary of the Company’s restricted stock and restricted stock units as of
December 31, 2014
,
2013
and
2012
, and changes during the years then ended is presented below:
|
|
Year Ended December 31,
|
||||||||||||||||||||
|
(In thousands, except per share amounts)
|
2014
|
2013
|
2012
|
||||||||||||||||||
|
|
Number
of
Restricted
Shares
|
Weighted
Average
Fair Value
|
Number
of
Restricted
Shares
|
Weighted
Average
Fair Value
|
Number
of
Restricted
Shares
|
Weighted
Average
Fair Value
|
|||||||||||||||
|
Outstanding, beginning of year
|
5,244
|
|
$
|
22.19
|
|
4,514
|
|
$
|
19.51
|
|
3,292
|
|
$
|
14.56
|
|
||||||
|
Granted
|
1,061
|
|
54.17
|
|
1,682
|
|
26.35
|
|
2,658
|
|
22.92
|
|
|||||||||
|
Forfeited
|
(958
|
)
|
20.98
|
|
(410
|
)
|
17.37
|
|
(758
|
)
|
16.73
|
|
|||||||||
|
Vested
|
(837
|
)
|
19.49
|
|
(542
|
)
|
16.76
|
|
(678
|
)
|
11.66
|
|
|||||||||
|
Outstanding, end of year
|
4,510
|
|
$
|
30.42
|
|
5,244
|
|
$
|
22.19
|
|
4,514
|
|
$
|
19.51
|
|
||||||
Included in the table above are
1.0 million
,
1.4 million
and
2.0 million
performance-based restricted stock units awarded to certain executives and key employees under the 2005 Plan during the years ended December 31, 2014, 2013 and 2012, respectively. These performance-based restricted stock units have a weighted average fair value of $
30.30
and have vesting that is tied to the achievement of certain combined annual operating income targets.
During the year ended
December 31, 2014
, the Company deemed the achievement of certain operating income targets probable for the awards granted in 2014, 2013 and 2012, and recorded $
38.4 million
for a portion of these awards, including cumulative adjustments of
$6.6 million
during the three months ended March 31, 2014 and
$3.8 million
during the three months ended September 30, 2014. During the year ended December 31, 2013, the Company deemed the achievement of certain operating targets probable for the awards granted in 2013, 2012 and 2011, and recorded
$30.8 million
for a portion of these awards, including cumulative adjustments of
$9.0 million
during the three months ended March 31, 2013 and
$11.3 million
during the three months ended December 31, 2013. During the year ended December 31, 2012, the Company deemed the achievement of certain operating income targets probable for the awards granted in 2011, and recorded
$4.1 million
for a
61
portion of these awards, including a cumulative adjustment of
$2.4 million
during the three months ended March 31, 2012. The Company will assess the probability of the achievement of the operating income targets at the end of each reporting period. If it becomes probable that the remaining performance targets related to these performance-based restricted stock units will be achieved, a cumulative adjustment will be recorded as if ratable stock-based compensation expense had been recorded since the grant date. Additional stock based compensation of up to $
2.7 million
would have been recorded through
December 31, 2014
for all performance-based restricted stock units had the full achievement of these operating income targets been deemed probable.
Warrants
In 2006, the Company issued fully vested and non-forfeitable warrants to purchase
1.9 million
shares of the Company’s Class A Common Stock to NFL Properties as partial consideration for footwear promotional rights which were recorded as an intangible asset. With the assistance of an independent third party valuation firm, the Company assessed the fair value of the warrants using various fair value models. Using these measures, the Company concluded that the fair value of the warrants was
$8.5 million
. The warrants have a term of
12 years
from the date of issuance and an exercise price of
$9.25
per share, which is the adjusted closing price of the Company’s Class A Common Stock on the date of issuance. As of
December 31, 2014
, all outstanding warrants were exercisable, and no warrants were exercised.
13
. Other Employee Benefits
The Company offers a 401(k) Deferred Compensation Plan for the benefit of eligible employees. Employee contributions are voluntary and subject to Internal Revenue Service limitations. The Company matches a portion of the participant’s contribution and recorded expense of $
4.9 million
, $
2.7 million
and $
2.3 million
for the years ended
December 31, 2014
,
2013
and
2012
, respectively. Shares of the Company’s Class A Common Stock are not an investment option in this plan.
In addition, the Company offers the Under Armour, Inc. Deferred Compensation Plan which allows a select group of management or highly compensated employees, as approved by the Compensation Committee, to make an annual base salary and/or bonus deferral for each year. As of
December 31, 2014
and
2013
, the Deferred Compensation Plan obligations were $
4.5 million
and $
3.3 million
, respectively, and were included in other long term liabilities on the consolidated balance sheets.
The Company established the Rabbi Trust to fund obligations to participants in the Deferred Compensation Plan. As of
December 31, 2014
and
2013
, the assets held in the Rabbi Trust were TOLI policies with cash-surrender values of $
4.7 million
and $
4.6 million
, respectively. These assets are consolidated and are included in other long term assets on the consolidated balance sheet. Refer to Note
9
for a discussion of the fair value measurements of the assets held in the Rabbi Trust and the Deferred Compensation Plan obligations.
14
. Risk Management and Derivatives
Foreign Currency Risk Management
The Company is exposed to gains and losses resulting from fluctuations in foreign currency exchange rates relating to transactions generated by its international subsidiaries in currencies other than their local currencies. These gains and losses are primarily driven by intercompany transactions and inventory purchases denominated in currencies other than the functional currency of the purchasing entity. From time to time, the Company may elect to enter into foreign currency forward contracts to reduce the risk associated with foreign currency exchange rate fluctuations on intercompany transactions and projected inventory purchases for its international subsidiaries. As the Company expands its international business, it may expand the current hedging program to include additional currency pairs and instruments.
As of
December 31, 2014
, the aggregate notional value of our outstanding foreign currency forward contracts was $
123.3 million
, which was comprised of Canadian Dollar/U.S. Dollar, Euro/U.S. Dollar, Yen/Euro, Mexican Peso/Euro and Pound Sterling/Euro currency pairs with contract maturities ranging from
one
to
eleven
months. The majority of the Company's foreign currency forward contracts are not designated as cash flow hedges, and accordingly, changes in their fair value are recorded in earnings. During 2014, the Company began entering into foreign currency forward contracts designated as cash flow hedges. For foreign currency forward contracts designated as cash flow hedges, changes in fair value, excluding any ineffective portion, are recorded in other comprehensive income until net income is affected by the variability in cash flows of the hedged transaction. The effective portion is generally released to net income after the maturity of the related derivative and is classified in the same manner as the underlying exposure. During the year ended
December 31, 2014
, the Company reclassified
$0.4 million
from other comprehensive income to cost of goods sold related to foreign currency forward contracts designated as cash flow hedges. The fair values of the Company’s foreign currency forward contracts were assets of $
806.0 thousand
and
$12.1 thousand
as of
December 31, 2014
and
2013
, respectively, and were included in prepaid expenses and other current assets on the consolidated balance sheet. Refer to Note
9
for a discussion of the fair value measurements. Included in
62
other expense, net were the following amounts related to changes in foreign currency exchange rates and derivative foreign currency forward contracts:
|
(In thousands)
|
Year Ended December 31,
|
|||||||||||
|
2014
|
2013
|
2012
|
||||||||||
|
Unrealized foreign currency exchange rate gains (losses)
|
$
|
(11,739
|
)
|
$
|
(1,905
|
)
|
$
|
2,464
|
|
|||
|
Realized foreign currency exchange rate gains (losses)
|
2,247
|
|
477
|
|
(182
|
)
|
||||||
|
Unrealized derivative gains (losses)
|
1
|
|
13
|
|
675
|
|
||||||
|
Realized derivative gains (losses)
|
3,081
|
|
243
|
|
(3,030
|
)
|
||||||
Interest Rate Risk Management
In order to maintain liquidity and fund business operations, the Company enters into long term debt arrangements with various lenders which bear a range of fixed and variable rates of interest. The nature and amount of the Company's long-term debt can be expected to vary as a result of future business requirements, market conditions and other factors. The Company may elect to enter into interest rate swap contracts to reduce the impact associated with interest rate fluctuations. The Company utilizes interest rate swap contracts to convert a portion of variable rate debt to fixed rate debt. The contracts pay fixed and receive variable rates of interest. The interest rate swap contracts are accounted for as cash flow hedges and accordingly, the effective portion of the changes in their fair value are recorded in other comprehensive income and reclassified into interest expense over the life of the underlying debt obligation.
As of
December 31, 2014
, the aggregate notional value of our outstanding interest rate swap contracts was $
188.1 million
. During the years ended
December 31, 2014
and
2013
, the Company recorded a
$1.7 million
and
$0.3 million
increase in interest expense, respectively, representing the effective portion of the contracts reclassified from accumulated other comprehensive income. The fair value of the interest rate swap contracts was a liability of
$0.6 million
as of
December 31, 2014
, and was included in other long term liabilities on the consolidated balance sheet. The fair value of the interest rate swap contract was an asset of
$1.1 million
as of
December 31, 2013
and was included in other long term assets on the consolidated balance sheet.
The Company enters into derivative contracts with major financial institutions with investment grade credit ratings and is exposed to credit losses in the event of non-performance by these financial institutions. This credit risk is generally limited to the unrealized gains in the foreign currency forward contracts. However, the Company monitors the credit quality of these financial institutions and considers the risk of counterparty default to be minimal.
15. Related Party Transactions
The Company has agreements to license software systems with a software company whose CEO is a director of the Company. During the years ended
December 31, 2014
,
2013
and
2012
, the Company paid
$5.2 million
,
$3.7 million
and
$1.9 million
, respectively, in licensing fees and related support services to this company. There were no amounts payable to this related party as of
December 31, 2014
and
2013
.
The Company has an operating lease agreement with an entity controlled by the Company’s CEO to lease an aircraft for business purposes. The Company paid $
1.8 million
, $
1.0 million
and $
0.8 million
in lease payments to the entity for its use of the aircraft during the years ended
December 31, 2014
,
2013
and
2012
, respectively. No amounts were payable to this related party as of
December 31, 2014
and
2013
. The Company determined the lease payments were at or below fair market lease rates.
During 2014, the Company entered into a lease agreement with an entity controlled by the Company’s CEO to lease office space for business purposes. The lease has a
10
year term beginning in 2016 and lease payments are expected to begin at
$1.1 million
annually with an annual escalation of
2.0%
thereafter. The Company determined the lease payments were at or below fair market lease rates.
16
. Segment Data and Related Information
The Company’s operating segments are based on how the Chief Operating Decision Maker (“CODM”) makes decisions about allocating resources and assessing performance. As such, the CODM receives discrete financial information for the Company's principal business by geographic region based on the Company’s strategy to become a global brand. These geographic regions include North America; Latin America; Europe, the Middle East and Africa (“EMEA”); and Asia-Pacific. Each geographic segment operates exclusively in one industry: the development, marketing and distribution of branded performance apparel, footwear and accessories. The CODM also receives discrete financial information for the Company's
63
MapMyFitness business. Due to the insignificance of the EMEA, Latin America, Asia-Pacific and MapMyFitness operating segments, they have been combined into other foreign countries and businesses for disclosure purposes.
The net revenues and operating income (loss) associated with the Company's segments are summarized in the following tables. Net revenues represent sales to external customers for each segment. In addition to net revenues, operating income (loss) is a primary financial measure used by the Company to evaluate performance of each segment. Intercompany balances were eliminated for separate disclosure and the majority of corporate expenses within North America have not been allocated to other foreign countries and businesses.
|
(In thousands)
|
Year Ended December 31,
|
|||||||||||
|
2014
|
2013
|
2012
|
||||||||||
|
Net revenues
|
||||||||||||
|
North America
|
$
|
2,796,390
|
|
$
|
2,193,739
|
|
$
|
1,726,733
|
|
|||
|
Other foreign countries and businesses
|
287,980
|
|
138,312
|
|
108,188
|
|
||||||
|
Total net revenues
|
$
|
3,084,370
|
|
$
|
2,332,051
|
|
$
|
1,834,921
|
|
|||
|
(In thousands)
|
Year Ended December 31,
|
|||||||||||
|
2014
|
2013
|
2012
|
||||||||||
|
Operating income (loss)
|
||||||||||||
|
North America
|
$
|
372,347
|
|
$
|
271,338
|
|
$
|
200,084
|
|
|||
|
Other foreign countries and businesses
|
(18,392
|
)
|
(6,240
|
)
|
8,611
|
|
||||||
|
Total operating income
|
353,955
|
|
265,098
|
|
208,695
|
|
||||||
|
Interest expense, net
|
(5,335
|
)
|
(2,933
|
)
|
(5,183
|
)
|
||||||
|
Other expense, net
|
(6,410
|
)
|
(1,172
|
)
|
(73
|
)
|
||||||
|
Income before income taxes
|
$
|
342,210
|
|
$
|
260,993
|
|
$
|
203,439
|
|
|||
Net revenues by product category are as follows:
|
(In thousands)
|
Year Ended December 31,
|
|||||||||||
|
2014
|
2013
|
2012
|
||||||||||
|
Apparel
|
$
|
2,291,520
|
|
$
|
1,762,150
|
|
$
|
1,385,350
|
|
|||
|
Footwear
|
430,987
|
|
298,825
|
|
238,955
|
|
||||||
|
Accessories
|
275,425
|
|
216,098
|
|
165,835
|
|
||||||
|
Total net sales
|
2,997,932
|
|
2,277,073
|
|
1,790,140
|
|
||||||
|
Licensing and other revenues
|
86,438
|
|
54,978
|
|
44,781
|
|
||||||
|
Total net revenues
|
$
|
3,084,370
|
|
$
|
2,332,051
|
|
$
|
1,834,921
|
|
|||
As of
December 31, 2014
and
2013
, the majority of the Company’s long-lived assets were located in the United States. Net revenues in the United States were
$2,670.4 million
, $
2,082.5 million
and $
1,650.4 million
for the years ended
December 31, 2014
,
2013
and
2012
, respectively.
64
17. Unaudited Quarterly Financial Data
|
(In thousands)
|
Quarter Ended (unaudited)
|
Year Ended
December 31,
|
||||||||||||||||||
|
March 31,
|
June 30,
|
September 30,
|
December 31,
|
|||||||||||||||||
|
2014
|
|
|
|
|
|
|||||||||||||||
|
Net revenues
|
$
|
641,607
|
|
$
|
609,654
|
|
$
|
937,908
|
|
$
|
895,201
|
|
$
|
3,084,370
|
|
|||||
|
Gross profit
|
300,690
|
|
299,952
|
|
465,300
|
|
446,264
|
|
1,512,206
|
|
||||||||||
|
Income from operations
|
26,856
|
|
34,694
|
|
146,106
|
|
146,299
|
|
353,955
|
|
||||||||||
|
Net income
|
13,538
|
|
17,690
|
|
89,105
|
|
87,709
|
|
208,042
|
|
||||||||||
|
Earnings per share-basic
|
$
|
0.06
|
|
$
|
0.08
|
|
$
|
0.42
|
|
$
|
0.41
|
|
$
|
0.98
|
|
|||||
|
Earnings per share-diluted
|
$
|
0.06
|
|
$
|
0.08
|
|
$
|
0.41
|
|
$
|
0.40
|
|
$
|
0.95
|
|
|||||
|
2013
|
|
|
|
|
|
|||||||||||||||
|
Net revenues
|
$
|
471,608
|
|
$
|
454,541
|
|
$
|
723,146
|
|
$
|
682,756
|
|
$
|
2,332,051
|
|
|||||
|
Gross profit
|
216,551
|
|
219,631
|
|
350,135
|
|
350,353
|
|
1,136,670
|
|
||||||||||
|
Income from operations
|
13,492
|
|
32,310
|
|
120,829
|
|
98,467
|
|
265,098
|
|
||||||||||
|
Net income
|
7,814
|
|
17,566
|
|
72,784
|
|
64,166
|
|
162,330
|
|
||||||||||
|
Earnings per share-basic
|
$
|
0.04
|
|
$
|
0.08
|
|
$
|
0.34
|
|
$
|
0.30
|
|
$
|
0.77
|
|
|||||
|
Earnings per share-diluted
|
$
|
0.04
|
|
$
|
0.08
|
|
$
|
0.34
|
|
$
|
0.30
|
|
$
|
0.75
|
|
|||||
18. Subsequent Events
Acquisitions
On January 5, 2015, the Company acquired
100%
of the outstanding equity of Endomondo ApS, a Denmark-based connected fitness company for
$85 million
, subject to adjustment for working capital. In connection with this acquisition, the Company incurred acquisition related expenses of approximately
$0.8 million
during the year ended December 31, 2014. These expenses were included in selling, general and administrative expenses on the consolidated statements of income. The operating results for this acquisition will be included in the Company’s consolidated statements of income from the date of acquisition. The Company is currently in the process of assessing the fair value of the assets acquired and liabilities assumed, which is expected to be final during the first quarter of 2015.
On February 3, 2015, the Company entered into an agreement to acquire MyFitnessPal, Inc. ("MyFitnessPal"). The purchase price for the acquisition will be
$475 million
in cash, which will be adjusted to reflect that the acquisition of MyFitnessPal by the Company at the closing on a debt free basis with MyFitnessPal's transaction expenses borne by the sellers. In addition, the aggregate purchase price payable at the closing is subject to an upward adjustment to reflect the amount of net cash held by MyFitnessPal at closing. The acquisition is currently expected to close during the first quarter of 2015, subject to the satisfaction of customary closing conditions, including among others, regulatory approvals, the continuing accuracy of representations and warranties and the execution of noncompetition agreements by certain key employee stockholders. The acquisition is expected to be funded through a combination of increased term loan borrowings, a draw on the increased revolving credit facility and cash on hand.
65
|
ITEM 9.
|
CHANGES IN AND DISAGREEMENTS WITH ACCOUNTANTS ON ACCOUNTING AND FINANCIAL DISCLOSURE
|
None
|
ITEM 9A.
|
CONTROLS AND PROCEDURES
|
Our management has evaluated, under the supervision and with the participation of our Chief Executive Officer and Chief Financial Officer, the effectiveness of our disclosure controls and procedures as of
December 31, 2014
pursuant to Rule 13a-15(b) under the Securities Exchange Act of 1934 (the “Exchange Act”). Based on that evaluation, our Chief Executive Officer and Chief Financial Officer have concluded that, as of
December 31, 2014
, our disclosure controls and procedures are effective in ensuring that information required to be disclosed in our Exchange Act reports is (1) recorded, processed, summarized and reported in a timely manner and (2) accumulated and communicated to our management, including our Chief Executive Officer and Chief Financial Officer, as appropriate to allow timely decisions regarding required disclosure. Refer to Item 8 of this report for the “Report of Management on Internal Control over Financial Reporting.”
There has been no change in our internal control over financial reporting during the most recent fiscal quarter that has materially affected, or that is reasonably likely to materially affect our internal control over financial reporting.
|
ITEM 9B.
|
OTHER INFORMATION
|
None
66
|
ITEM 10.
|
DIRECTORS, EXECUTIVE OFFICERS AND CORPORATE GOVERNANCE
|
The information required by this Item regarding directors is incorporated herein by reference from the 2015 Proxy Statement, under the headings “NOMINEES FOR ELECTION AT THE ANNUAL MEETING,” “CORPORATE GOVERNANCE AND RELATED MATTERS: Audit Committee” and “SECTION 16(a) BENEFICIAL OWNERSHIP REPORTING COMPLIANCE.” Information required by this Item regarding executive officers is included under “Executive Officers of the Registrant” in Part 1 of this Form 10-K.
Code of Ethics
We have a written code of ethics in place that applies to all our employees, including our principal executive officer, principal financial officer, and principal accounting officer and controller. A copy of our code of ethics policy is available on our website: www.underarmour.com. We are required to disclose any change to, or waiver from, our code of ethics for our senior financial officers. We intend to use our website as a method of disseminating this disclosure as permitted by applicable SEC rules.
|
ITEM 11.
|
EXECUTIVE COMPENSATION
|
The information required by this Item is incorporated by reference herein from the 2015 Proxy Statement under the headings “CORPORATE GOVERNANCE AND RELATED MATTERS: Compensation of Directors,” and “EXECUTIVE COMPENSATION.”
|
ITEM 12.
|
SECURITY OWNERSHIP OF CERTAIN BENEFICIAL OWNERS AND MANAGEMENT AND RELATED STOCKHOLDER MATTERS
|
The information required by this Item is incorporated by reference herein from the 2015 Proxy Statement under the heading “SECURITY OWNERSHIP OF MANAGEMENT AND CERTAIN BENEFICIAL OWNERS OF SHARES.” Also refer to Item 5 “Market for Registrant’s Common Equity, Related Stockholder Matters and Issuer Purchases of Equity Securities.”
|
ITEM 13.
|
CERTAIN RELATIONSHIPS AND RELATED TRANSACTIONS, AND DIRECTOR INDEPENDENCE
|
The information required by this Item is incorporated by reference herein from the 2015 Proxy Statement under the heading “TRANSACTIONS WITH RELATED PERSONS” and “CORPORATE GOVERNANCE AND RELATED MATTERS—Independence of Directors.”
|
ITEM 14.
|
PRINCIPAL ACCOUNTANT FEES AND SERVICES
|
The information required by this Item is incorporated by reference herein from the 2015 Proxy Statement under the heading “INDEPENDENT AUDITORS.”
67
|
ITEM 15.
|
EXHIBITS AND FINANCIAL STATEMENT SCHEDULES
|
a. The following documents are filed as part of this Form 10-K:
|
1. Financial Statements:
|
|
|
2. Financial Statement Schedule
|
|
All other schedules are omitted because they are not applicable or the required information is shown in the consolidated financial statements or notes thereto.
68
3. Exhibits
The following exhibits are incorporated by reference or filed herewith. References to the Company’s 2007 Form 10-K are to the Registrant’s Annual Report on Form 10-K for the year ended December 31, 2007. References to the Company’s 2010 Form 10-K are to the Registrant’s Annual Report on Form 10-K for the year ended December 31, 2010. References to the Company’s 2011 Form 10-K are to the Registrant’s Annual Report on Form 10-K for the year ended December 31, 2011. References to the Company’s 2012 Form 10-K are to the Registrant’s Annual Report on Form 10-K for the year ended December 31, 2012. References to the Company’s 2013 Form 10-K are to the Registrant’s Annual Report on Form 10-K for the year ended December 31, 2013.
|
Exhibit
No.
|
|
|
|
2.01
|
Agreement and Plan of Merger, dated as of November 8, 2013, among Under Armour, Inc., MMF Merger Sub, Inc., MapMyFitness, Inc. and Fortis Advisors LLC (incorporated by reference to Exhibit 2.1 of the Company's Current Report on Form 8-K filed November 14, 2013).
|
|
|
2.02
|
|
Agreement and Plan of Merger, dated as of February 3, 2015, among Under Armour, Inc., Marathon Merger Sub, Inc., MyFitnessPal, Inc. and Fortis Advisors LLC.
|
|
3.01
|
|
Articles of Amendment (incorporated by reference to Exhibit 3.1 of the Company's Form 8-K filed March 17, 2014).
|
|
3.02
|
|
Second Amended and Restated By-Laws (incorporated by reference to Exhibit 3.02 of the Company’s Form 8-K filed February 21, 2013).
|
|
4.01
|
|
Warrant Agreement between the Company and NFL Properties LLC dated as of August 3, 2006 (incorporated by reference to Exhibit 4.1 of the Current Report on Form 8-K filed August 7, 2006).
|
|
10.01
|
Credit Agreement, dated May 29, 2014, by and among the Company, as borrower, JPMorgan Chase Bank, N.A., as administrative agent, PNC Bank, National Association, as Syndication Agent, Bank of America, N.A. SunTrust Bank and Wells Fargo Bank, National Association as Co-Documentation Agents and the other lenders and arrangers party thereto (incorporated by reference to Exhibit 10.01 of the Current Report on Form 8-K filed June 2, 2014).
|
|
|
10.02
|
Under Armour, Inc. Executive Incentive Plan (incorporated by reference to Exhibit 10.01 of the Company’s Current Report on Form 8-K filed on May 6, 2013).*
|
|
|
10.03
|
|
Under Armour, Inc. Deferred Compensation Plan (incorporated by reference to Exhibit 10.15 of the Company’s 2007 Form 10-K) and Amendment One to this plan (incorporated by reference to Exhibit 10.14 of the Company’s 2010 Form 10-K).*
|
|
10.04
|
|
Form of Change in Control Severance Agreement (incorporated by reference to Exhibit 10.05 of the Company’s 2013 Form 10-K).*
|
|
10.05
|
|
Under Armour, Inc. Amended and Restated 2005 Omnibus Long-Term Incentive Plan (incorporated by reference to Exhibit 10.01 of the Company’s Form 10-Q for the quarterly period ending March 31, 2014).*
|
|
10.06
|
|
Restricted Stock Grant Agreement under the Amended and Restated 2005 Omnibus Long-Term Incentive Plan between Henry Stafford and the Company (incorporated by reference to Exhibit 10.07a of the Company's 2011 Form 10-K).*
|
|
10.07
|
|
Forms of Non-Qualified Stock Option Grant Agreement under the Amended and Restated 2005 Omnibus Long-Term Incentive Plan (incorporated by reference to Exhibit 10.23 of the Company’s 2007 Form 10-K and Exhibit 10.08 of the Company’s 2011 Form 10-K).*
|
|
10.08
|
|
Form of Restricted Stock Unit Grant Agreement under the Amended and Restated 2005 Omnibus Long-Term Incentive Plan (filed herewith and incorporated by reference to Exhibit 10.09 of the Company’s 2011 Form 10-K).*
|
|
10.09
|
|
Forms of Performance-Based Stock Option Grant Agreement under the Amended and Restated 2005 Omnibus Long-Term Incentive Plan (filed herewith and incorporated by reference to Exhibits 10.02 of the Company’s Form 10-Q for the quarterly period ended March 31, 2009 and Exhibit 10.03 of the Company’s Form 10-Q for the quarterly period ended March 31, 2010).*
|
|
10.10
|
|
Amendment to Stock Option Awards Effective August 3, 2011 (incorporated by reference to Exhibit 10.11 of the Company's 2011 Form 10-K).*
|
69
|
Exhibit
No.
|
|
|
|
10.11
|
|
Forms of Performance-Based Restricted Stock Unit Grant Agreement for U.S. Employees under the Amended and Restated 2005 Omnibus Long-Term Incentive Plan (filed herewith and incorporated by reference to Exhibit 10.12 of the Company’s 2013 Form 10-K, Exhibit 10.12 of the Company's 2012 Form 10-K and Exhibit 10.12 of the Company's 2011 Form 10-K) and Supplement to Restricted Stock Unit Grant Agreement (incorporated by reference to Exhibit 10.01 of the Company’s Form 10-Q for the quarterly period ended September 30, 2014).*
|
|
10.12
|
|
Form of Performance-Based Restricted Stock Unit Grant Agreement for International Employees under the Amended and Restated 2005 Omnibus Long-Term Incentive Plan (filed herewith and incorporated by reference to Exhibit 10.13 of the Company's 2013 Form 10-K).*
|
|
10.13
|
|
Form of Employee Confidentiality, Non-Competition and Non-Solicitation Agreement by and between certain executives and the Company (incorporated by reference to Exhibit 10.14 of the Company’s 2013 Form 10-K).*
|
|
10.14
|
Employment Agreement by and between Karl-Heinz Maurath and the Company (portions of this exhibit have been omitted pursuant to a request for confidential treatment) (incorporated by reference to Exhibit 10.15 of the Company's 2012 Form 10-K).*
|
|
|
10.15
|
|
Under Armour, Inc. 2015 Non-Employee Director Compensation Plan (filed herewith), Form of Initial Restricted Stock Unit Grant (incorporated by reference to Exhibit 10.1 of the Current Report on Form 8-K filed June 6, 2006), Form of Annual Stock Option Award (incorporated by reference to Exhibit 10.3 of the Current Report on Form 8-K filed June 6, 2006) and Form of Annual Restricted Stock Unit Grant (incorporated by reference to Exhibit 10.6 of the Company’s Form 10-Q for the quarterly period ended June 30, 2011).*
|
|
10.16
|
|
Under Armour, Inc. 2006 Non-Employee Director Deferred Stock Unit Plan (incorporated by reference to Exhibit 10.02 of the Company’s Form 10-Q for the quarterly period ended March 31, 2010) and Amendment One to this plan (incorporated by reference to Exhibit 10.23 of the Company’s 2010 Form 10-K).*
|
|
10.17
|
Change in Control Severance Agreement between Karl-Heinz Maurath and the Company (incorporated by reference to Exhibit 10.18 of the Company’s 2013 Form 10-K).*
|
|
|
21.01
|
|
List of Subsidiaries.
|
|
23.01
|
|
Consent of PricewaterhouseCoopers LLP.
|
|
31.01
|
|
Section 302 Chief Executive Officer Certification.
|
|
31.02
|
|
Section 302 Chief Financial Officer Certification.
|
|
32.01
|
|
Section 906 Chief Executive Officer Certification.
|
|
32.02
|
|
Section 906 Chief Financial Officer Certification.
|
|
Exhibit
No.
|
||
|
101.INS
|
|
XBRL Instance Document
|
|
101.SCH
|
|
XBRL Taxonomy Extension Schema Document
|
|
101.CAL
|
|
XBRL Taxonomy Extension Calculation Linkbase Document
|
|
101.DEF
|
|
XBRL Taxonomy Extension Definition Linkbase Document
|
|
101.LAB
|
|
XBRL Taxonomy Extension Label Linkbase Document
|
|
101.PRE
|
|
XBRL Taxonomy Extension Presentation Linkbase Document
|
___________
|
*
|
Management contract or a compensatory plan or arrangement required to be filed as an Exhibit pursuant to Item 15(b) of Form 10-K.
|
70
SIGNATURES
Pursuant to the requirements of Section 13 or 15(d) of the Securities Exchange Act of 1934, the registrant has duly caused this report to be signed on its behalf by the undersigned, thereunto duly authorized.
|
UNDER ARMOUR, INC.
|
|||
|
By:
|
|
/s/ K
EVIN
A. P
LANK
|
|
|
|
Kevin A. Plank
|
||
|
|
Chairman of the Board of Directors and Chief Executive Officer
|
||
Dated:
February 20, 2015
Pursuant to the requirements of the Securities Act of 1934, this report has been signed below by the following persons on behalf of the registrant and in the capacities and on the date indicated.
|
/
S
/ K
EVIN
A. P
LANK
|
|
Chairman of the Board of Directors and Chief Executive Officer (principal executive officer)
|
|
Kevin A. Plank
|
||
|
/
S
/ B
RAD
D
ICKERSON
|
|
Chief Financial Officer (principal accounting and financial officer)
|
|
Brad Dickerson
|
||
|
/
S
/ B
YRON
K. A
DAMS
, J
R
.
|
|
Director
|
|
Byron K. Adams, Jr.
|
||
|
/
S
/ G
EORGE
W. B
ODENHEIMER
|
Director
|
|
|
George W. Bodenheimer
|
||
|
/
S
/ D
OUGLAS
E. C
OLTHARP
|
|
Director
|
|
Douglas E. Coltharp
|
||
|
/
S
/ A
NTHONY
W. D
EERING
|
|
Director
|
|
Anthony W. Deering
|
||
|
/
S
/ K
AREN
W. K
ATZ
|
Director
|
|
|
Karen Katz
|
||
|
/
S
/ A.B. K
RONGARD
|
|
Director
|
|
A.B. Krongard
|
||
|
/
S
/ W
ILLIAM
R. M
C
D
ERMOTT
|
|
Director
|
|
William R. McDermott
|
||
|
/
S
/ E
RIC
T. O
LSON
|
|
Director
|
|
Eric T. Olson
|
||
|
/
S
/ H
ARVEY
L. S
ANDERS
|
|
Director
|
|
Harvey L. Sanders
|
||
|
/
S
/ T
HOMAS
J. S
IPPEL
|
|
Director
|
|
Thomas J. Sippel
|
||
Dated:
February 20, 2015
71
Schedule II
Valuation and Qualifying Accounts
(In thousands)
|
Description
|
Balance at
Beginning
of Year
|
Charged to
Costs and
Expenses
|
Write-Offs
Net of
Recoveries
|
Balance at
End of
Year
|
||||||||||||
|
Allowance for doubtful accounts
|
||||||||||||||||
|
For the year ended December 31, 2014
|
$
|
2,938
|
|
$
|
1,028
|
|
$
|
(273
|
)
|
$
|
3,693
|
|
||||
|
For the year ended December 31, 2013
|
3,286
|
|
210
|
|
(558
|
)
|
2,938
|
|
||||||||
|
For the year ended December 31, 2012
|
4,070
|
|
(108
|
)
|
(676
|
)
|
3,286
|
|
||||||||
|
Sales returns and allowances
|
||||||||||||||||
|
For the year ended December 31, 2014
|
$
|
34,102
|
|
$
|
156,791
|
|
$
|
(137,920
|
)
|
$
|
52,973
|
|
||||
|
For the year ended December 31, 2013
|
32,919
|
|
135,739
|
|
(134,556
|
)
|
34,102
|
|
||||||||
|
For the year ended December 31, 2012
|
20,600
|
|
107,536
|
|
(95,217
|
)
|
32,919
|
|
||||||||
|
Deferred tax asset valuation allowance
|
||||||||||||||||
|
For the year ended December 31, 2014
|
$
|
8,091
|
|
$
|
7,581
|
|
$
|
(122
|
)
|
$
|
15,550
|
|
||||
|
For the year ended December 31, 2013
|
3,996
|
|
4,095
|
|
—
|
|
8,091
|
|
||||||||
|
For the year ended December 31, 2012
|
1,784
|
|
2,855
|
|
(643
|
)
|
3,996
|
|
||||||||
72
TABLE OF CONTENTS
Part IItem 1. BusinessItem 1A. Risk FactorsItem 1B. Unresolved Staff CommentsItem 2. PropertiesItem 3. Legal ProceedingsItem 4. Mine Safety DisclosuresPart IIItem 5. Market For Registrant S Common Equity, Related Stockholder Matters and Issuer Purchases Of Equity SecuritiesItem 6. Selected Financial DataItem 7. Management S Discussion and Analysis Of Financial Condition and Results Of OperationsItem 7A. Quantitative and Qualitative Disclosure About Market RiskItem 8. Financial Statements and Supplementary DataItem 9. Changes in and Disagreements with Accountants on Accounting and Financial DisclosureItem 9A. Controls and ProceduresItem 9B. Other InformationPart IIIItem 10. Directors, Executive Officers and Corporate GovernanceItem 11. Executive CompensationItem 12. Security Ownership Of Certain Beneficial Owners and Management and Related Stockholder MattersItem 13. Certain Relationships and Related Transactions, and Director IndependenceItem 14. Principal Accountant Fees and ServicesPart IVItem 15. Exhibits and Financial Statement Schedules