UNITED AIRLINES HOLDINGS, INC.
10-Ks and 10-Qs
|
|
|
|
|
|
|
|
|
|
|
|
|
|
|
|
|
|
|
|
|
|
|
|
|
|
|
|
|
|
|
|
|
|
|
|
|
|
|
|
|
|
|
|
|
|
|
|
|
|
|
|
|
|
|
|
|
|
|
UNITED STATES
SECURITIES AND EXCHANGE COMMISSION
Washington, DC 20549
FORM 10-K
|
x
|
ANNUAL REPORT PURSUANT TO SECTION 13 OR 15(d) OF THE SECURITIES EXCHANGE ACT OF 1934
|
For the fiscal year ended
December 31, 2018
OR
|
o
|
TRANSITION REPORT PURSUANT TO SECTION 13 OR 15(d) OF THE SECURITIES EXCHANGE ACT OF 1934
|
For the transition period from to

|
Commission
File Number
|
Exact Name of Registrant as
Specified in its Charter, Principal Executive
Office Address, Zip Code and
Telephone Number, Including Area Code
|
State of
Incorporation
|
I.R.S. Employer
Identification No.
|
|||
|
001-06033
|
United Continental Holdings, Inc. 233 South Wacker Drive Chicago, Illinois 60606 (872) 825-4000
|
Delaware
|
36-2675207
|
|||
|
001-10323
|
United Airlines, Inc. 233 South Wacker Drive Chicago, Illinois 60606 (872) 825-4000
|
Delaware
|
74-2099724
|
|||
Securities registered pursuant to Section 12(b) of the Act:
|
|
Title of Each Class
|
Name of Each Exchange on Which Registered
|
||
|
United Continental Holdings, Inc.
|
Common Stock, $0.01 par value
|
The Nasdaq Stock Market LLC
|
||
|
United Airlines, Inc.
|
None
|
None
|
||
Securities registered pursuant to Section 12(g) of the Act:
|
United Continental Holdings, Inc.
|
None
|
||||||
|
United Airlines, Inc.
|
None
|
||||||
|
Indicate by check mark if the registrant is a well-known seasoned issuer, as defined in Rule 405 of the Securities Act.
|
||||||||||
|
United Continental Holdings, Inc.
|
Yes
x
No
o
|
|||||||||
|
United Airlines, Inc.
|
Yes
x
No
o
|
|||||||||
|
Indicate by check mark if the registrant is not required to file reports pursuant to Section 13 or Section 15(d) of the Act
|
||||||||||
|
United Continental Holdings, Inc.
|
Yes
o
No
x
|
|||||||||
|
United Airlines, Inc.
|
Yes
o
No
x
|
|||||||||
|
Indicate by check mark whether the Registrant (1) has filed all reports required to be filed by Section 13 or 15(d) of the Securities Exchange Act of 1934 during the preceding 12 months (or for such shorter period that the Registrant was required to file such reports), and (2) has been subject to such filing requirements for the past 90 days.
|
||||||||||
|
United Continental Holdings, Inc.
|
Yes
x
No
o
|
|||||||||
|
United Airlines, Inc.
|
Yes
x
No
o
|
|||||||||
|
Indicate by check mark whether the registrant has submitted electronically every Interactive Data File required to be submitted pursuant to Rule 405 of Regulation S-T (§232.405 of this chapter) during the preceding 12 months (or for such shorter period that the registrant was required to submit such files).
|
||||||||||
|
United Continental Holdings, Inc.
|
Yes
x
No
o
|
|||||||||
|
United Airlines, Inc.
|
Yes
x
No
o
|
|||||||||
|
Indicate by check mark if disclosure of delinquent filers pursuant to Item 405 of Regulation S-K (§229.405 of this chapter) is not contained herein, and will not be contained, to the best of Registrant's knowledge, in definitive proxy or information statements incorporated by reference in Part III of this Form 10-K or any amendment to this Form 10-K
.
|
||||||||||
|
United Continental Holdings, Inc.
|
x
|
|||||||||
|
United Airlines, Inc.
|
x
|
|||||||||
|
Indicate by check mark whether the registrant is a large accelerated filer, an accelerated filer, a non-accelerated filer, a smaller reporting company, or an emerging growth company. See the definitions of "large accelerated filer," "accelerated filer," "smaller reporting company," and "emerging growth company" in Rule 12b-2 of the Exchange Act.
|
||||||||||
|
United Continental Holdings, Inc.
|
Large accelerated filer
x
|
Accelerated filer
o
|
Non-accelerated filer
o
|
Smaller reporting company
o
|
Emerging growth company
o
|
|||||
|
United Airlines, Inc.
|
Large accelerated filer
o
|
Accelerated filer
o
|
Non-accelerated filer
x
|
Smaller reporting company
o
|
Emerging growth company
o
|
|||||
|
If an emerging growth company, indicate by check mark if the registrant has elected not to use the extended transition period for complying with any new or revised financial accounting standards provided pursuant to Section 13(a) of the Exchange Act.
|
||||||||||
|
United Continental Holdings, Inc.
|
o
|
|||||||||
|
United Airlines, Inc.
|
o
|
|||||||||
|
Indicate by check mark whether the registrant is a shell company (as defined in Rule 12b-2 of the Act).
|
||||||||||
|
United Continental Holdings, Inc.
|
Yes
o
No
x
|
|||||||||
|
United Airlines, Inc.
|
Yes
o
No
x
|
|||||||||
The aggregate market value of common stock held by non-affiliates of United Continental Holdings, Inc. was
$17,844,650,113
as of June 29,
2018
, based on the closing sale price of $69.73 on that date. There is no market for United Airlines, Inc. common stock.
Indicate the number of shares outstanding of each of the registrant's classes of common stock, as of
February 22, 2019
.
|
United Continental Holdings, Inc.
|
266,727,577 shares of common stock ($0.01 par value)
|
|
|
United Airlines, Inc.
|
1,000 shares of common stock ($0.01 par value) (100% owned by United Continental Holdings, Inc.)
|
|
This combined Form 10-K is separately filed by United Continental Holdings, Inc. and United Airlines, Inc.
OMISSION OF CERTAIN INFORMATION
United Airlines, Inc. meets the conditions set forth in General Instruction I(1)(a) and (b) of Form 10-K and is therefore filing this form with the reduced disclosure format allowed under that General Instruction.
DOCUMENTS INCORPORATED BY REFERENCE
Certain information required by Items 10, 11, 12 and 13 of Part III of this Form 10-K is incorporated by reference for United Continental Holdings, Inc. from its definitive proxy statement for its
2019
Annual Meeting of Stockholders.
United Continental Holdings, Inc. and Subsidiary Companies
United Airlines, Inc. and Subsidiary Companies
Annual Report on Form 10-K
For the Year Ended
December 31, 2018
|
|
|
Page
|
|
|
PART I
|
|||
|
Item 1.
|
|||
|
Item 1A.
|
|||
|
Item 1B.
|
|||
|
Item 2.
|
|||
|
Item 3.
|
|||
|
Item 4.
|
|||
|
PART II
|
|||
|
Item 5.
|
|||
|
Item 6.
|
|||
|
Item 7.
|
|||
|
Item 7A.
|
|||
|
Item 8.
|
|||
|
Item 9.
|
|||
|
Item 9A.
|
|||
|
Item 9B.
|
|||
|
PART III
|
|||
|
Item 10.
|
|||
|
Item 11.
|
|||
|
Item 12.
|
|||
|
Item 13.
|
|||
|
Item 14.
|
|||
|
PART IV
|
|||
|
Item 15.
|
|||
|
Item 16.
|
|||
This Annual Report on Form 10-K ("Form 10-K") contains various "forward-looking statements" within the meaning of Section 27A of the Securities Act of 1933, as amended (the "Securities Act"), and Section 21E of the Securities Exchange Act of 1934, as amended (the "Exchange Act"). Forward-looking statements represent our expectations and beliefs concerning future events, based on information available to us on the date of the filing of this Form 10-K, and are subject to various risks and uncertainties. Factors that could cause actual results to differ materially from those referenced in the forward-looking statements are listed in Part I, Item 1A, Risk Factors and in Part II, Item 7, Management's Discussion and Analysis of Financial Condition and Results of Operations. We disclaim any intent or obligation to update or revise any of the forward-looking statements, whether in response to new information, unforeseen events, changed circumstances or otherwise, except as required by applicable law.
PART I
ITEM 1. BUSINESS.
Overview
United Continental Holdings, Inc. (together with its consolidated subsidiaries, "UAL" or the "Company") is a holding company and its principal, wholly-owned subsidiary is United Airlines, Inc. (together with its consolidated subsidiaries, "United"). As UAL consolidates United for financial statement purposes, disclosures that relate to activities of United also apply to UAL, unless otherwise noted. United's operating revenues and operating expenses comprise nearly 100% of UAL's revenues and operating expenses. In addition, United comprises approximately the entire balance of UAL's assets, liabilities and operating cash flows. When appropriate, UAL and United are named specifically for their individual contractual obligations and related disclosures and any significant differences between the operations and results of UAL and United are separately disclosed and explained. We sometimes use the words "we," "our," "us," and the "Company" in this report for disclosures that relate to all of UAL and United.
UAL was incorporated under the laws of the State of Delaware on December 30, 1968. Our principal executive office is located at 233 South Wacker Drive, Chicago, Illinois 60606 (telephone number (872) 825-4000).
The Company's website is located at www.united.com and its investor relations website is located at ir.united.com. The information contained on or connected to the Company's websites is not incorporated by reference into this Annual Report on Form 10-K and should not be considered part of this or any other report filed with the U.S. Securities and Exchange Commission ("SEC"). The Company's filings with the SEC, including annual reports on Form 10-K, quarterly reports on Form 10-Q, current reports on Form 8-K, and all amendments to those reports, as well as UAL's proxy statement for its annual meeting of stockholders, are accessible without charge on the Company's investor relations website, as soon as reasonably practicable, after such material is electronically filed with, or furnished to, the SEC. Such filings are also available on the SEC's website at www.sec.gov.
Operations
The Company transports people and cargo throughout North America and to destinations in Asia, Europe, the Middle East and Latin America. UAL, through United and its regional carriers, operates more than 4,800 flights a day to 353 airports across five continents, with hubs at Newark Liberty International Airport ("Newark"), Chicago O'Hare International Airport ("Chicago O'Hare"), Denver International Airport ("Denver"), George Bush Intercontinental Airport ("Houston Bush"), Los Angeles International Airport ("LAX"), A.B. Won Pat International Airport ("Guam"), San Francisco International Airport ("SFO") and Washington Dulles International Airport ("Washington Dulles").
All of the Company's domestic hubs are located in large business and population centers, contributing to a large amount of "origin and destination" traffic. The hub and spoke system allows us to transport passengers between a large number of destinations with substantially more frequent service than if each route were served directly. The hub system also allows us to add service to a new destination from a large number of cities using only one or a limited number of aircraft. As discussed under
Alliances
below, United is a member of Star Alliance, the world's largest alliance network.
Regional.
The Company
has contractual relationships with various regional carriers to provide regional aircraft service branded as United Express.
This regional service complements our operations by carrying traffic that connects to our hubs and allows flights to smaller cities that cannot be provided economically with mainline aircraft. Republic Airlines ("Republic"), Champlain Enterprises, LLC d/b/a CommutAir ("CommutAir"), ExpressJet Airlines ("ExpressJet"), GoJet Airlines ("GoJet"), Mesa Airlines ("Mesa"), SkyWest Airlines ("SkyWest"), Air Wisconsin Airlines ("Air Wisconsin"), and Trans States Airlines ("Trans States") are all regional carriers that operate with capacity contracted to United under capacity purchase agreements ("CPAs").
Under these CPAs, the Company pays the regional carriers contractually agreed fees (carrier costs) for operating these flights plus a variable reimbursement (incentive payment for operational performance) based on agreed performance metrics, subject
3
to annual adjustments. The fees for carrier costs are based on specific rates for various operating expenses of the regional carriers, such as crew expenses, maintenance and aircraft ownership, some of which are multiplied by specific operating statistics (e.g., block hours, departures), while others are fixed monthly amounts. Under these CPAs, the Company is responsible for all fuel costs incurred, as well as landing fees and other costs, which are either passed through by the regional carrier to the Company without any markup or directly incurred by the Company, and, in some cases, the Company owns or leases some or all of the aircraft subject to the CPA, and leases or subleases, as applicable, such aircraft to the regional carrier.
In return, the regional carriers operate the capacity of the aircraft included within the scope of such CPA exclusively for United, on schedules determined by the Company. The Company also determines pricing and revenue management, assumes the inventory and distribution risk for the available seats and permits mileage accrual and redemption for regional flights through its MileagePlus
®
loyalty program.
Alliances.
United is a member of Star Alliance, a global integrated airline network and the largest and most comprehensive airline alliance in the world. As of January 1,
2019
, Star Alliance carriers served over 1,300 airports in 193 countries with 18,800 daily departures. Star Alliance members, in addition to United, are Adria Airways, Aegean Airlines, Air Canada, Air China, Air India, Air New Zealand, All Nippon Airways ("ANA"), Asiana Airlines, Austrian Airlines, Aerovías del Continente Americano S.A. ("Avianca"), Avianca Brasil, Brussels Airlines, Copa Airlines, Croatia Airlines, EGYPTAIR, Ethiopian Airlines, EVA Air, LOT Polish Airlines, Lufthansa, SAS Scandinavian Airlines, Shenzhen Airlines, Singapore Airlines, South African Airways, SWISS, TAP Air Portugal, THAI Airways International and Turkish Airlines. In addition to its members, Star Alliance includes Shanghai-based Juneyao Airlines as a connecting partner.
United has a variety of bilateral commercial alliance agreements and obligations with Star Alliance members, addressing, among other things, reciprocal earning and redemption of frequent flyer miles, access to airport lounges and, with certain Star Alliance
members, codesharing of flight operations (whereby one carrier's selected flights can be marketed under the brand name of another carrier). In addition to the alliance agreements with Star Alliance members, United currently maintains independent marketing alliance agreements with other air carriers, including Aeromar, Aer Lingus, Air Dolomiti, Azul Linhas Aéreas Brasileiras S.A. ("Azul"), Boutique Air, Cape Air, Eurowings, Hawaiian Airlines, and Silver Airways. In addition to the marketing alliance agreements with air partners, United also offers a train-to-plane codeshare and frequent flyer alliance with Amtrak from Newark on select city pairs in the northeastern United States.
United also participates in four passenger joint business arrangements ("JBAs"): one with Air Canada and the Lufthansa Group (which includes Lufthansa and its affiliates Austrian Airlines, Brussels Airlines, Eurowings and SWISS) covering transatlantic routes, one with ANA covering certain transpacific routes, one with Air New Zealand covering certain routes between the United States and New Zealand and one with Avianca and Copa Airlines, which, upon receipt of regulatory approvals will cover routes between the United States and Central and South America, excluding Brazil. These passenger JBAs enable the participating carriers to integrate the services they provide in the respective regions, capturing revenue synergies and delivering enhanced customer benefits, such as highly competitive flight schedules, fares and services. United also participates in cargo JBAs with ANA for transpacific cargo services and with Lufthansa for transatlantic cargo services. These cargo JBAs offer expanded and more seamless access to cargo space across the carriers' respective combined networks.
Loyalty Program.
United's MileagePlus loyalty program builds customer loyalty by offering awards, benefits and services to program participants. Members in this program earn miles for flights on United, United Express, Star Alliance members and certain other airlines that participate in the program. Members can also earn miles by purchasing the goods and services of our network of non-airline partners, such as domestic and international credit card issuers, retail merchants, hotels and car rental companies. Members can redeem miles for free (other than taxes and government imposed fees), discounted or upgraded travel and non-travel awards.
United has an agreement with Chase Bank USA, N.A. ("Chase"), pursuant to which members of United's MileagePlus loyalty program who are residents of the United States can earn miles for making purchases using a MileagePlus credit card issued by Chase (the "Co-Brand Agreement"). The Co-Brand Agreement also provides for joint marketing and other support for the MileagePlus credit card and provides Chase with other benefits such as permission to market to the Company's customer database.
Approximately 5.6 million and 5.4 million MileagePlus flight awards were used on United in
2018
and
2017
, respectively. These awards represented 7.1% and 7.5% of United's total revenue passenger miles in
2018
and
2017
, respectively. Total miles redeemed for flights on United in
2018
, including class-of-service upgrades, represented approximately 86% of the total miles redeemed. In addition, excluding miles redeemed for flights on United, MileagePlus members redeemed miles for approximately 2.4 million other awards in
2018
as compared to 2.3 million other awards in
2017
. These awards include United Club memberships, car and hotel awards, merchandise and flights on other air carriers.
4
Aircraft Fuel.
The table below summarizes UAL's aircraft fuel consumption and expense during the last three years.
|
Year
|
Gallons Consumed
(in millions)
|
Fuel Expense
(in millions)
|
Average Price Per Gallon
|
Percentage of Total Operating Expense
|
Available Seat Miles per Fuel Gallon
|
|||||||||||
|
2018
|
4,137
|
|
$
|
9,307
|
|
$
|
2.25
|
|
24
|
%
|
67
|
|||||
|
2017
|
3,978
|
|
$
|
6,913
|
|
$
|
1.74
|
|
20
|
%
|
66
|
|||||
|
2016
|
3,904
|
|
$
|
5,813
|
|
$
|
1.49
|
|
18
|
%
|
65
|
|||||
Our operational and financial results can be significantly impacted by changes in the price and availability of aircraft fuel. To provide adequate supplies of fuel, the Company routinely enters into purchase contracts that are customarily indexed to market prices for aircraft fuel, and the Company generally has some ability to cover short-term fuel supply and infrastructure disruptions at certain major demand locations. The price of aircraft fuel has fluctuated substantially in the past several years. The Company's current strategy is to not enter into transactions to hedge its fuel consumption, although the Company regularly reviews its strategy based on market conditions and other factors.
Third-Party Business.
United generates third-party business revenue that includes frequent flyer award non-air redemptions, maintenance services, catering and ground handling. Third-party business revenue is recorded in Other operating revenue. Expenses associated with third-party business, except non-air redemptions, are recorded in Other operating expenses. Non-air redemptions expenses are recorded to Other operating revenue.
Distribution Channels.
The Company's airline seat inventory and fares are distributed through the Company's direct channels, traditional travel agencies and on-line travel agencies. The use of the Company's direct sales website, www.united.com, the Company's mobile applications and alternative distribution systems provides the Company with an opportunity to de-commoditize its services, better present its content, make more targeted offerings, better retain its customers, enhance its brand and lower its ticket distribution costs. Agency sales are primarily sold using global distribution systems ("GDS"). United has developed and expects to continue to develop capabilities to sell certain ancillary products through the GDS channel to provide an enhanced buying experience for customers who purchase in that channel.
Industry Conditions
Domestic Competition.
The domestic airline industry is highly competitive and dynamic. The Company's competitors consist primarily of other airlines and, to a certain extent, other forms of transportation. Currently, any U.S. carrier deemed fit by the U.S. Department of Transportation (the "DOT") is largely free to operate scheduled passenger service between any two points within the United States. Competition can be direct, in the form of another carrier flying the exact non-stop route, or indirect, where a carrier serves the same two cities non-stop from an alternative airport in that city or via an itinerary requiring a connection at another airport. Air carriers' cost structures are not uniform and there are numerous factors influencing cost structure. Carriers with lower costs may offer lower fares to passengers, which could have a potential negative impact on the Company's revenues. Decisions on domestic pricing are based on intense competitive pressure exerted on the Company by other U.S. airlines. In order to remain competitive and maintain passenger traffic levels, we often find it necessary to match competitors' discounted fares. Since we compete in a dynamic marketplace, attempts to generate additional revenue through increased fares oftentimes fail.
International Competition.
Internationally, the Company competes not only with U.S. airlines, but also with foreign carriers. International competition has increased and may continue to increase in the future as a result of airline mergers and acquisitions, JBAs, alliances, restructurings, liberalization of aviation bilateral agreements and new or increased service by competitors, including government subsidized competitors from certain Middle East countries. Competition on international routes is subject to varying degrees of governmental regulation. The Company's ability to compete successfully with non-U.S. carriers on international routes depends in part on its ability to generate traffic to and from the entire United States via its integrated domestic route network and its ability to overcome business and operational challenges across its network worldwide. Foreign carriers currently are prohibited by U.S. law from carrying local passengers between two points in the United States and the Company generally experiences comparable restrictions in foreign countries. Separately, "fifth freedom rights" allow the Company to operate between points in two different foreign countries and foreign carriers may also have fifth freedom rights between the U.S. and another foreign country. In the absence of fifth freedom rights, or some other extra-bilateral right to conduct operations between two foreign countries, U.S. carriers are constrained from carrying passengers to points beyond designated international gateway cities. To compensate partially for these structural limitations, U.S. and foreign carriers have entered into alliances, immunized JBAs and marketing arrangements that enable these carriers to exchange traffic between each other's flights and route networks. See
Alliances,
above, for additional information.
5
Seasonality.
The air travel business is subject to seasonal fluctuations. Historically, demand for air travel is higher in the second and third quarters, driving higher revenues, than in the first and fourth quarters, which are periods of lower travel demand.
Industry Regulation
Domestic Regulation
All carriers engaged in air transportation in the United States are subject to regulation by the DOT. Absent an exemption, no air carrier may provide air transportation of passengers or property without first being issued a DOT certificate of public convenience and necessity. The DOT also grants international route authority, approves international codeshare arrangements and regulates methods of competition. The DOT regulates consumer protection and maintains jurisdiction over advertising, denied boarding compensation, tarmac delays, baggage liability and other areas and may add additional expensive regulatory burdens in the future. The DOT has launched investigations or claimed rulemaking authority to regulate commercial agreements among carriers or between carriers and third parties in a wide variety of contexts.
Airlines are also regulated by the Federal Aviation Administration (the "FAA"), an agency within the DOT, primarily in the areas of flight safety, air carrier operations and aircraft maintenance and airworthiness. The FAA issues air carrier operating certificates and aircraft airworthiness certificates, prescribes maintenance procedures, oversees airport operations, and regulates pilot and other employee training. From time to time, the FAA issues directives that require air carriers to inspect or modify aircraft and other equipment, potentially causing the Company to incur substantial, unplanned expenses. The airline industry is also subject to numerous other federal laws and regulations. The U.S. Department of Homeland Security ("DHS") has jurisdiction over virtually every aspect of civil aviation security. The Antitrust Division of the U.S. Department of Justice ("DOJ") has jurisdiction over certain airline competition matters. The U.S. Postal Service has authority over certain aspects of the transportation of mail by airlines. Labor relations in the airline industry are generally governed by the Railway Labor Act ("RLA"), a federal statute. The Company is also subject to investigation inquiries by the DOT, FAA, DOJ, DHS, the U.S. Food and Drug Administration ("FDA"), the U.S. Department of Agriculture ("USDA") and other U.S. and international regulatory bodies.
Airport Access.
Access to landing and take-off rights, or "slots," at several major U.S. airports served by the Company are subject to government regulation. Federally-mandated domestic slot restrictions that limit operations and regulate capacity currently apply at three airports: Reagan National Airport in Washington, D.C. ("Reagan National"), John F. Kennedy International Airport and LaGuardia Airport in the New York City metropolitan region ("LaGuardia"). Of these three airports, United currently operates at two: Reagan National and LaGuardia. Additional restrictions on takeoff and landing slots at these and other airports may be implemented in the future and could affect the Company's rights of ownership and transfer as well as its operations.
Legislation
. The airline industry is subject to legislative actions (or inactions) that may have an impact on operations and costs.
In 2018, the U.S. Congress approved a five-year reauthorization for the FAA, which encompasses significant aviation tax and policy-related issues. The law includes a range of policy changes related to airline customer service and aviation safety which, depending on how they are implemented, could impact our operations and costs. Additionally, the U.S. Congress may fail to continue to fund the operations of one or more federal government agencies which could negatively impact the Company and the airline industry.
Catering Operations
. The Company owns and operates catering kitchens at airports in Denver, Cleveland, Newark, Houston, and Honolulu, which prepare ready-to-eat food for United flights. Some of the Company's kitchens also prepare ready-to-eat food for other domestic and international airlines. These operations are subject to regulation by the FDA and the USDA, as well as other federal, state, and local regulatory agencies. The FDA has begun enforcing the Federal Food Safety Modernization Act which requires all food manufacturers to implement stringent risk-based preventive controls. As a result, ready-to-eat catering operations are a focus of enhanced scrutiny by the FDA with inspections and greater enforcement.
International Regulation
International air transportation is subject to extensive government regulation. In connection with the Company's international services, the Company is regulated by both the U.S. government and the governments of the foreign countries the Company serves. In addition, the availability of international routes to U.S. carriers is regulated by aviation agreements between the U.S. and foreign governments, and in some cases, fares and schedules require the approval of the DOT and/or the relevant foreign governments.
Legislation.
Foreign countries are increasingly enacting passenger protection laws, rules and regulations that meet or exceed U.S. requirements. In cases where this activity exceeds U.S. requirements, additional burden and liability may be placed on the Company. Certain countries have regulations requiring passenger compensation and/or enforcement penalties from the Company in addition to changes in operating procedures due to canceled and delayed flights.
6
Airport Access.
Historically, access to foreign markets has been tightly controlled through bilateral agreements between the U.S. and each foreign country involved. These agreements regulate the markets served, the number of carriers allowed to serve each market and the frequency of carriers' flights. Since the early 1990s, the U.S. has pursued a policy of "Open Skies" (meaning all U.S.-flag carriers have access to the destination), under which the U.S. government has negotiated a number of bilateral agreements allowing unrestricted access between U.S. and foreign markets. Currently, there are more than 100 Open Skies agreements in effect. However, even with Open Skies, many of the airports that the Company serves in Europe, Asia and Latin America maintain slot controls. A large number of these slot controls exist due to congestion, environmental and noise protection and reduced capacity due to runway and air traffic control ("ATC") construction work, among other reasons. London Heathrow International Airport, Frankfurt Rhein-Main Airport, Shanghai Pudong International Airport, Beijing Capital International Airport, Sao Paulo Guarulhos International Airport and Tokyo Haneda International Airport are among the most restrictive foreign airports due to slot and capacity limitations.
The Company's ability to serve some foreign markets and expand into certain others is limited by the absence of aviation agreements between the U.S. government and the relevant foreign governments. Shifts in U.S. or foreign government aviation policies may lead to the alteration or termination of air service agreements. Depending on the nature of any such change, the value of the Company's international route authorities and slot rights may be materially enhanced or diminished. Similarly, foreign governments control their airspace and can restrict our ability to overfly their territory, enhancing or diminishing the value of the Company's existing international route authorities and slot rights.
Environmental Regulation
The airline industry is subject to increasingly stringent federal, state, local and international environmental requirements, including those regulating emissions to air, water discharges, safe drinking water and the use and management of hazardous substances and wastes.
Climate Change
. There is an increasing global regulatory focus on greenhouse gas ("GHG") emissions and their potential impacts relating to climate change. Initiatives to regulate GHG emissions from aviation had previously been adopted by the European Union ("EU") in 2009, but applicability to flights arriving or departing from airports outside the EU have been postponed several times. In December 2017, the European Parliament voted to extend exemptions for extra-EU flights until December 2023 in order to align the extension date with the completion of the pilot phase of the International Civil Aviation Organization's ("ICAO") Carbon Offsetting and Reduction Scheme for International Aviation ("CORSIA"). CORSIA, which was adopted in October 2016, is intended to create a single global market-based measure to achieve carbon-neutral growth for international aviation after 2020, which can be achieved through airline purchases of carbon offset credits. Certain CORSIA program details remain to be developed and could potentially be affected by political developments in participating countries or the results of the pilot phase of the program, and thus the impact of CORSIA cannot be fully predicted. However, CORSIA is expected to increase operating costs for airlines that operate internationally. In 2016, ICAO also adopted a carbon dioxide ("CO2") emission standard for aircraft. In 2016, the U.S. Environmental Protection Agency ("EPA") commenced procedural steps necessary to adopt its own standard, but the timing of further action by the EPA is unknown. While the precise timing and final form of these various programs and requirements continue to evolve, in 2018, the Company announced a pledge to reduce its greenhouse gas emissions by 50 percent relative to 2005 levels by the year 2050 and is taking various actions that are expected to help reduce its CO2 emissions over time such as improving fuel efficiency, fleet renewal, aircraft retrofits and the commercialization of aviation alternative fuels.
Other Regulations
. Our operations are subject to a variety of other environmental laws and regulations both in the United States and internationally. These include noise-related restrictions on aircraft types and operating times and state and local air quality initiatives which have, or could in the future, result in curtailments in services, increased operating costs, limits on expansion, or further emission reduction requirements. Certain airports and/or governments, both domestically and internationally, either have or are seeking to establish environmental fees and other requirements applicable to carbon emissions, local air quality pollutants and/or noise. The implementation of state plans to achieve national standards for ozone is expected to result in restrictions on mobile sources such as cars, trucks and airport ground support equipment in some locations. Certain states may also elect to impose restrictions apart from the revised national standards. Finally, environmental cleanup laws could require the Company to undertake or subject the Company to liability for investigation and remediation costs at certain owned or leased locations or third-party disposal locations.
Until applicability of new regulations to our specific operations is better defined and/or until pending regulations are finalized, future costs to comply with such regulations will remain uncertain but are likely to increase our operating costs over time. While we continue to monitor these developments, the precise nature of future requirements and their applicability to the Company are difficult to predict, but the financial impact to the Company and the aviation industry could be significant.
7
Employees
As of
December 31, 2018
, UAL, including its subsidiaries, had approximately
92,000
employees. Approximately
83%
of the Company's employees were represented by various U.S. labor organizations.
Collective bargaining agreements between the Company and its represented employee groups are negotiated under the RLA. Such agreements typically do not contain an expiration date and instead specify an amendable date, upon which the agreement is considered "open for amendment."
The following table reflects the Company's represented employee groups, the number of employees per represented group, union representation for each of United's employee groups, and the amendable date for each employee group's collective bargaining agreement as of
December 31, 2018
:
|
Employee
Group
|
Number of
Employees
|
Union
|
Agreement Open for
Amendment
|
|
|
Flight Attendants
|
23,193
|
|
Association of Flight Attendants (the "AFA")
|
August 2021
|
|
Fleet Service
|
13,077
|
|
International Association of Machinists and Aerospace Workers (the "IAM")
|
December 2021
|
|
Passenger Service
|
11,932
|
|
IAM
|
December 2021
|
|
Pilots
|
11,742
|
|
Air Line Pilots Association, International
|
January 2019
|
|
Technicians and Related & Flight Simulator Technicians
|
9,236
|
|
International Brotherhood of Teamsters (the "IBT")
|
December 2022
|
|
Passenger Service - United Ground Express, Inc.
|
2,923
|
|
IAM
|
March 2025
|
|
Catering Operations
|
2,668
|
|
UNITE HERE
|
(a)
|
|
Storekeeper Employees
|
1,012
|
|
IAM
|
December 2021
|
|
Dispatchers
|
399
|
|
Professional Airline Flight Control Association
|
December 2021
|
|
Fleet Tech Instructors
|
131
|
|
IAM
|
December 2021
|
|
Load Planners
|
64
|
|
IAM
|
December 2021
|
|
Security Officers
|
48
|
|
IAM
|
December 2021
|
|
Maintenance Instructors
|
41
|
|
IAM
|
December 2021
|
(a) On October 23, 2018, United's Catering Operations employees voted to unionize under the RLA.
In an election overseen by the National Mediation Board, UNITE HERE received the majority of the votes and was officially certified to represent United's frontline Catering Operations employees. The Company expects contract negotiations to begin in 2019.
|
ITEM 1A.
|
RISK FACTORS.
|
The following risk factors should be read carefully when evaluating the Company's business and the forward-looking statements contained in this report and other statements the Company or its representatives make from time to time. Any of the following risks could materially and adversely affect the Company's business, operating results, financial condition and the actual outcome of matters as to which forward-looking statements are made in this report.
If we do not successfully execute our strategic operating plan, or if our strategic operating plan is unsuccessful, our business, operating results and financial condition could be materially and adversely affected.
We have announced several strategic plans in recent years, including several revenue-generating initiatives and plans to optimize our revenue, such as our plans to add capacity, including international expansion and new or increased service to mid-size airports, and initiatives and plans to optimize and control our costs. We also continue to explore opportunities to enhance our segmentation, including the introduction of Polaris, Basic Economy and United Premium Plus, and are implementing many programs and policies to improve the customer experience at all points in air travel. In developing our strategic operating plan, we make certain assumptions including, but not limited to, those related to customer demand, competition, market consolidation and the global economy. Actual economic, market and other conditions may be different from our assumptions and we may not be able to successfully execute our strategic operating plan. If we do not successfully execute our strategic operating plan, or if actual results vary significantly from our assumptions, our business, operating results and financial condition could be materially and adversely impacted.
8
Unfavorable economic and political conditions, in the United States and globally, may have a material adverse effect on our business, operating results and financial condition.
The Company's business and operating results are significantly impacted by U.S. and global economic and political conditions. The airline industry is highly cyclical, and the level of demand for air travel is correlated to the strength of the U.S. and global economies. Robust demand for the Company's air transportation services depends largely on favorable economic conditions, including the strength of the domestic and foreign economies, low unemployment levels, strong consumer confidence levels and the availability of consumer and business credit. Air transportation is often a discretionary purchase that leisure travelers may limit or eliminate during difficult economic times. Short-haul travelers, in particular, have the option to replace air travel with surface travel. In addition, during periods of unfavorable economic conditions, business travelers historically have reduced the volume of their travel, either due to cost-saving initiatives, the replacement of travel with alternatives such as videoconferencing, or as a result of decreased business activity requiring travel. During such periods, the Company's business and operating results may be adversely affected due to significant declines in industry passenger demand, particularly with respect to the Company's business and premium cabin travelers, and a reduction in fare levels.
As a global business with operations outside of the United States from which it derives significant operating revenues, volatile conditions in certain international regions may have a negative impact on the Company's operating results and its ability to achieve its business objectives. The Company's international operations are a vital part of its worldwide airline network. Political disruptions and instability in certain regions can negatively impact the demand and network availability for air travel.
Stagnant or weakening global economic conditions either in the United States or in other geographic regions may have a material adverse effect on the Company's revenues, operating results and liquidity.
The global airline industry is highly competitive and susceptible to price discounting and changes in capacity, which could have a material adverse effect on our business, operating results and financial condition.
The airline industry is highly competitive, marked by significant competition with respect to routes, fares, schedules (both timing and frequency), services, products, customer service and frequent flyer programs. Consolidation in the airline industry, the rise of well-funded government sponsored international carriers, changes in international alliances and the creation of immunized JBAs have altered and are expected to continue to alter the competitive landscape in the industry, resulting in the formation of airlines and alliances with increased financial resources, more extensive global networks and services and competitive cost structures.
Airlines also compete by increasing or decreasing their capacity, including route systems and the number of destinations served. Several of the Company's domestic and international competitors have increased their international capacity by including service to some destinations that the Company currently serves, causing overlap in destinations served and therefore increasing competition for those destinations. This increased competition in both domestic and international markets may have a material adverse effect on the Company's business, operating results and financial condition.
The Company's U.S. operations are subject to competition from traditional network carriers, national point-to-point carriers, and discount carriers, including low-cost carriers and ultra-low-cost carriers. Such carriers may have lower costs and provide service at lower fares to destinations also served by the Company. The significant presence of low-cost carriers, which engage in substantial price discounting, may diminish our ability to achieve sustained profitability on domestic and international routes. Our ability to compete in the domestic market effectively depends, in part, on our ability to maintain a competitive cost structure. If we cannot maintain our costs at a competitive level, then our business, financial condition and operating results could be materially and adversely affected.
Our international operations are subject to competition from both foreign and domestic carriers. Competition is significant from government subsidized competitors from certain Middle East countries. These carriers have large numbers of international widebody aircraft on order and are increasing service to the U.S. from their hubs in the Middle East. The government support provided to these carriers has allowed them to grow quickly, reinvest in their product, invest in other airlines and expand their global presence.
Through alliance and other marketing and codesharing agreements with foreign carriers, U.S. carriers have increased their ability to sell international transportation, such as services to and beyond traditional European and Asian gateway cities. Similarly, foreign carriers have obtained increased access to interior U.S. passenger traffic beyond traditional U.S. gateway cities through these relationships. In addition, several JBAs among U.S. and foreign carriers have received grants of antitrust immunity allowing the participating carriers to coordinate schedules, pricing, sales and inventory. If we are not able to continue participating in these types of alliance and other marketing and codesharing agreements in the future, our business, financial condition and operating results could be materially and adversely affected.
9
High and/or volatile fuel prices or significant disruptions in the supply of aircraft fuel could have a material adverse impact on the Company's strategic plans, operating results, financial condition and liquidity.
Aircraft fuel is critical to the Company's operations and is our single largest operating expense. During the year ended December 31, 2018, the Company's fuel expense was
$9.3 billion
. The timely and adequate supply of fuel to meet operational demand depends on the continued availability of reliable fuel supply sources, as well as related service and delivery infrastructure. Although the Company has some ability to cover short-term fuel supply and infrastructure disruptions at some major demand locations, it depends significantly on the continued performance of its vendors and service providers to maintain supply integrity. Consequently, the Company can neither predict nor guarantee the continued timely availability of aircraft fuel throughout the Company's system.
Aircraft fuel has historically been the Company's most volatile operating expense due to the highly unpredictable nature of market prices for fuel. The Company generally sources fuel at prevailing market prices. Market prices for aircraft fuel have historically fluctuated substantially in short periods of time and continue to be highly volatile due to a dependence on a multitude of unpredictable factors beyond the Company's control. These factors include changes in global crude oil prices, the balance between aircraft fuel supply and demand, natural disasters, prevailing inventory levels and fuel production and transportation infrastructure. Prices of fuel are also impacted by indirect factors, such as geopolitical events, economic growth indicators, fiscal/monetary policies, fuel tax policies, changes in regulations, environmental concerns and financial investments in energy markets. Both actual changes in these factors, as well as changes in market expectations of these factors, can potentially drive rapid changes in fuel price levels in short periods of time.
Given the highly competitive nature of the airline industry, the Company may not be able to increase its fares and fees sufficiently to offset the full impact of increases in fuel prices, especially if these increases are significant, rapid and sustained. Further, any such fare or fee increase may not be sustainable, may reduce the general demand for air travel and may also eventually impact the Company's strategic growth and investment plans for the future. In addition, decreases in fuel prices for an extended period of time may result in increased industry capacity, increased competitive actions for market share and lower fares or surcharges in general. If fuel prices were to then subsequently rise quickly, there may be a lag between the rise in fuel prices and any improvement of the revenue environment.
To protect against increases in the market prices of fuel, the Company may hedge a portion of its future fuel requirements. The Company does not currently hedge its future fuel requirements. However, to the extent the Company decides to start a hedging program, such hedging program may not be successful in mitigating higher fuel costs, and any price protection provided may be limited due to choice of hedging instruments and market conditions, including breakdown of correlation between hedging instrument and market price of aircraft fuel and failure of hedge counterparties. To the extent that the Company decides to hedge a portion of its future fuel requirements and uses hedge contracts that have the potential to create an obligation to pay upon settlement if fuel prices decline significantly, such hedge contracts may limit the Company's ability to benefit fully from lower fuel costs in the future. If fuel prices decline significantly from the levels existing at the time the Company enters into a hedge contract, the Company may be required to post collateral (margin) beyond certain thresholds. There can be no assurance that the Company's hedging arrangements, if any, will provide any particular level of protection against rises in fuel prices or that its counterparties will be able to perform under the Company's hedging arrangements. Additionally, deterioration in the Company's financial condition could negatively affect its ability to enter into new hedge contracts in the future.
The Company relies heavily on technology and automated systems to operate its business and any significant failure or disruption of the technology or these systems could materially harm its business.
The Company depends on automated systems and technology to operate its business, including, but not limited to, computerized airline reservation systems, demand prediction software, flight operations systems, revenue management systems, accounting systems, technical and business operations systems, telecommunication systems and commercial websites and applications, including www.united.com and the United Airlines app. United's website and other automated systems must be able to accommodate a high volume of traffic, maintain secure information and deliver important flight and schedule information, as well as process critical financial transactions. These systems could suffer substantial or repeated disruptions due to various events, some of which are beyond the Company's control, including natural disasters, power failures, terrorist attacks, equipment or software failures, computer viruses or cyber security attacks. Substantial or repeated systems failures or disruptions, including failures or disruptions related to the Company's complex integration of systems, could reduce the attractiveness of the Company's services versus those of its competitors, materially impair its ability to market its services and operate its flights, result in the unauthorized release of confidential or otherwise protected information, result in increased costs, lost revenue and the loss or compromise of important data, and may adversely affect the Company's business, operating results and financial condition.
10
The Company's business relies extensively on third-party service providers, including certain technology providers. Failure of these parties to perform as expected, or interruptions in the Company's relationships with these providers or their provision of services to the Company, could have an adverse effect on the Company's business, operating results and financial condition.
The Company has engaged third-party service providers to perform a large number of functions that are integral to its business, including regional operations, operation of customer service call centers, distribution and sale of airline seat inventory, provision of information technology infrastructure and services, transmitting or uploading of data, provision of aircraft maintenance and repairs, provision of various utilities, performance of aircraft fueling operations and catering services, among other vital functions and services. The Company does not directly control these third-party service providers, although it does enter into agreements that define expected service performance.
Any of these third-party service providers, however, may materially fail to meet its service performance commitments to the Company or may suffer disruptions to its systems that could impact its services. For example, failures in certain third-party technology or communications systems may cause flight delays or cancellations. The failure of any of the Company's third-party service providers to perform its service obligations adequately, or other interruptions of services, may reduce the Company's revenues and increase its expenses, prevent the Company from operating its flights and providing other services to its customers or result in adverse publicity or harm to its brand. In addition, the Company's business and financial performance could be materially harmed if its customers believe that its services are unreliable or unsatisfactory.
The Company may also have disagreements with such providers or such contracts may be terminated or may not be extended or renewed. For example, the number of flight reservations booked through third-party GDSs or online travel agents ("OTAs") may be adversely affected by disruptions in the business relationships between the Company and these suppliers. Such disruptions, including a failure to agree upon acceptable contract terms when contracts expire or otherwise become subject to renegotiation, may cause the Company's flight information to be limited or unavailable for display by the affected GDS or OTA operator, significantly increase fees for both the Company and GDS/OTA users and impair the Company's relationships with its customers and travel agencies. Any such disruptions or contract terminations may adversely impact our operations and financial results.
If we are not able to negotiate or renew agreements with third-party service providers, or if we renew existing agreements on less favorable terms, our operations and financial results may be adversely affected.
The Company could experience adverse publicity, harm to its brand, reduced travel demand and potential tort liability as a result of an accident, catastrophe or incident involving its aircraft or its operations, the aircraft or operations of its regional carriers, the aircraft or operations of its codeshare partners, or the aircraft or operations of another airline, which may result in a material adverse effect on the Company's business, operating results and financial condition.
An accident, catastrophe or incident involving an aircraft that the Company operates, or an aircraft that is operated by a codeshare partner, one of the Company's regional carriers or another airline, or an incident involving the Company's operations, or the operations of a codeshare partner, one of the Company's regional carriers or of another airline, could have a material adverse effect on the Company if such accident, catastrophe or incident created a public perception that the Company's operations, or the operations of its codeshare partners or regional carriers, are not safe or reliable, or are less safe or reliable than other airlines. Such public perception could, in turn, result in adverse publicity for the Company, cause harm to the Company's brand and reduce travel demand on the Company's flights, or the flights of its codeshare partners or regional carriers.
In addition, any such accident, catastrophe or incident involving the Company, its regional carriers or its codeshare partners could expose the Company to significant tort liability. Although the Company currently maintains liability insurance in amounts and of the type the Company believes to be consistent with industry practice to cover damages arising from any such accident, catastrophe or incident, and the Company's codeshare partners and regional carriers carry similar insurance and generally indemnify the Company for their operations, if the Company's liability exceeds the applicable policy limits or the ability of another carrier to indemnify it, the Company could incur substantial losses from an accident, catastrophe or incident which may result in a material adverse effect on the Company's operating results and financial condition.
Terrorist attacks, international hostilities or other security events, or the fear of terrorist attacks or hostilities, even if not made directly on the airline industry, could negatively affect the Company and the airline industry.
Terrorist attacks or international hostilities, even if not made on or targeted directly at the airline industry, or the fear of or the precautions taken in anticipation of such attacks (including elevated national threat warnings, travel restrictions, selective cancellation or redirection of flights and new security regulations) could materially and adversely affect the Company and the airline industry. Security events pose a significant risk to our passenger and cargo operations. These events could include acts of violence in public areas that we cannot control. The Company's financial resources may not be sufficient to absorb the
11
adverse effects of any future terrorist attacks, international hostilities or other security events. Any such events could have a material adverse impact on the Company's financial condition, liquidity and operating results.
Increasing privacy and data security obligations or a significant data breach may adversely affect the Company's business.
The Company is subject to increasing legislative, regulatory and customer focus on privacy issues and data security. Also, a number of the Company's commercial partners, including credit card companies, have imposed data security standards that the Company must meet. These standards continue to evolve. The Company will continue its efforts to meet its privacy and data security obligations; however, it is possible that certain new obligations may be difficult to meet and could increase the Company's costs.
Additionally, the Company must manage evolving cybersecurity risks. Our network systems and storage applications, and those systems and storage and other business applications maintained by our third-party providers, may be subject to attempts to gain unauthorized access, breach, malfeasance or other system disruptions. In some cases, it is difficult to anticipate or to detect immediately such incidents and the damage caused thereby. While we continually work to safeguard our internal network systems and validate the security of our third-party providers, including through information security policies and employee awareness and training, there is no assurance that such actions will be sufficient to prevent cyber-attacks or security breaches. The loss, disclosure, misappropriation of or access to customers', employees' or business partners' information or the Company's failure to meet its obligations could result in legal claims or proceedings, penalties and remediation costs. A significant data breach or the Company's failure to meet its obligations may adversely affect the Company's reputation, business, operating results and financial condition.
Disruptions to our regional network and United Express flights provided by third-party regional carriers could adversely affect our business, operating results and financial condition.
The Company has contractual relationships with various regional carriers to provide regional aircraft service branded as United Express. These regional operations are an extension of the Company's mainline network and complement the Company's operations by carrying traffic that connects to mainline service and allows flights to smaller cities that cannot be provided economically with mainline aircraft. The Company's business and operations are dependent on its regional flight network, with regional capacity accounting for approximately
11%
of the Company's total capacity for the year ended
December 31, 2018
.
Although the Company has agreements with its regional carriers that include contractually agreed performance metrics, each regional carrier is a separately certificated commercial air carrier and the Company does not control the operations of these carriers. A number of factors may impact the Company's regional network, including weather-related effects and seasonality. In addition, the decrease in qualified pilots driven by changes to federal regulations has adversely impacted and could continue to affect the Company's regional flying. For example, the FAA's expansion of minimum pilot qualification standards, including a requirement that a pilot have at least 1,500 total flight hours, as well as the FAA's revised pilot flight and duty time requirements under Part 117 of the Federal Aviation Regulations, have contributed to a smaller supply of pilots available to regional carriers. The decrease in qualified pilots resulting from the regulations as well as factors including a decreased student pilot population and a shrinking U.S. military from which to hire qualified pilots, could adversely impact the Company's operations and financial condition, and could also require the Company to reduce regional carrier flying.
If a significant disruption occurs to the Company's regional network or flights or if one or more of the regional carriers with which the Company has relationships is unable to perform their obligations over an extended period of time, there could be a material adverse effect on the Company's business, financial condition and operating results.
Current or future litigation and regulatory actions, or failure to comply with the terms of any settlement, order or arrangement relating to these actions, could have a material adverse impact on the Company.
From time to time, we are subject to litigation and other legal and regulatory proceedings relating to our business or investigations or other actions by governmental agencies, including as described in Part I, Item 3, Legal Proceedings, of this report. No assurances can be given that the results of these or new matters will be favorable to us. An adverse resolution of lawsuits, arbitrations, investigations or other proceedings or actions could have a material adverse effect on our financial condition and operating results, including as a result of non-monetary remedies, and could also result in adverse publicity. Defending ourselves in these matters may be time-consuming, expensive and disruptive to normal business operations and may result in significant expense and a diversion of management's time and attention from the operation of our business, which could impede our ability to achieve our business objectives. Additionally, any amount that we may be required to pay to satisfy a judgment, settlement, fine or penalty may not be covered by insurance. If we fail to comply with the terms contained in any settlement, order or agreement with a governmental authority relating to these matters, we could be subject to criminal or civil penalties, which could have a material adverse impact on the Company. Under our charter and certain indemnification agreements that we have entered into (and may in the future enter into) with our officers, directors and certain third parties, we
12
could be required to indemnify and advance expenses to them in connection with their involvement in certain actions, suits, investigations and other proceedings. There can be no assurance that any of these payments will not be material.
Our significant investments in other airlines, including in other parts of the world, and the commercial relationships that we have with those carriers may not produce the returns or results we expect.
An important part of our strategy to expand our global network includes making significant investments in airlines in other parts of the world and expanding our commercial relationships with these carriers. For example, in November 2018, United entered into a revenue-sharing joint business agreement with Avianca, Copa and several of their respective affiliates, subject to regulatory approval. Concurrently with this transaction, United advanced a loan of $456 million to affiliates of Synergy Aerospace Corporation ("Synergy"), the majority shareholder of Avianca Holdings S.A. ("AVH"), the parent company of Avianca, and entered into certain other related agreements, including a put arrangement with Avianca's significant minority shareholder, Kingsland Holdings Limited ("Kingsland"). The loan is secured by a pledge of Synergy's equity and Synergy's shares of AVH stock, and the loan and other agreements contain several provisions whereby the Company may acquire AVH stock. We also have an equity investment in Azul. See Note 9 to the financial statements included in Part II, Item 8 of this report for additional information regarding our investments in Avianca and Azul.
We also have investments in several domestic regional airlines. In January 2019, we completed the acquisition of a 49.9% interest in ManaAir LLC, which, as of immediately following the closing of that investment, owns 100% of the equity interests in ExpressJet Airlines, Inc., a domestic regional airline. We also have minority equity interests in CommutAir and Republic Airways Holdings, Inc. See Note 9 to the financial statements included in Part II, Item 8 of this report for additional information regarding our investments in regional airlines.
We expect to continue exploring similar non-controlling investments in, and entering into JBAs, commercial agreements, loan transactions and strategic alliances with, other carriers as part of our regional and global business strategy. These transactions and relationships involve significant challenges and risks. We are dependent on these other carriers for significant aspects of our network in the regions in which they operate. While we work closely with these carriers, each is a separately certificated commercial air carrier and we do not have control over their operations, strategy, management or business methods. These airlines also are subject to a number of the same risks as our business, which are described in this Item 1A., Risk Factors, including competitive pressures on pricing, demand and capacity; changes in aircraft fuel pricing; and the impact of global and local political and economic conditions on operations and customer travel patterns, among others.
As a result of these and other factors, we may not realize a satisfactory return on our investment, and we may not receive repayment of any invested or loaned funds. Further, these investments may not generate the revenue or operational synergies we expect, and they may distract management focus from our operations or other strategic options. Finally, our reliance on these other carriers in the regions in which they operate may negatively impact our regional and global operations and results if those carriers are impacted by general business risks or perform below our expectations or needs. Any one or more of these events could have a material adverse effect on our operating results or financial condition.
We may also be subject to consequences from any improper behavior of JBA partners, including for failure to comply with anti-corruption laws such as the U.S. Foreign Corrupt Practices Act. Furthermore, our relationships with these carriers may be subject to the laws and regulations of non-U.S. jurisdictions in which these carriers are located or conduct business. Any political or regulatory change in these jurisdictions that negatively impact or prohibit our arrangements with these carriers could have an adverse effect on our operating results or financial condition. To the extent that the operations of any of these carriers are disrupted over an extended period of time or their actions subject us to the consequences of failure to comply with laws and regulations, our operating results may be adversely affected.
The airline industry may undergo further change with respect to alliances and JBAs or due to consolidations, any of which could have a material adverse effect on the Company.
The Company faces and may continue to face strong competition from other carriers due to the modification of alliances and formation of new JBAs. Carriers may improve their competitive positions through airline alliances, slot swaps and/or JBAs. Certain types of airline JBAs further competition by allowing multiple airlines to coordinate routes, pool revenues and costs, and enjoy other mutual benefits, achieving many of the benefits of consolidation. Open Skies agreements, including the longstanding agreements between the United States and each of the EU, Canada, Japan, Korea, New Zealand, Australia, Colombia and Panama, as well as the more recent agreements between the United States and each of Mexico and Brazil, may also give rise to better integration opportunities among international carriers. Movement of airlines between current global airline alliances could reduce joint network coverage for members of such alliances while also creating opportunities for JBAs and bilateral alliances that did not exist before such realignment. Further airline and airline alliance consolidations or reorganizations could occur in the future. The Company routinely engages in analyses and discussions regarding its own strategic position, including current and potential alliances, asset acquisitions and divestitures and may have future discussions
13
with other airlines regarding strategic activities. If other airlines participate in such activities, those airlines may significantly improve their cost structures or revenue generation capabilities, thereby potentially making them stronger competitors of the Company and potentially impairing the Company's ability to realize expected benefits from its own strategic relationships.
Orders for new aircraft typically must be placed years in advance of scheduled deliveries, and changes in the Company's network strategy over time may make aircraft on order less economic for the Company, result in costs related to modification or termination of aircraft orders or cause the Company to enter into orders for new aircraft on less favorable terms.
The Company's orders for new aircraft are typically made years in advance of actual delivery of such aircraft, and the financial commitment required for purchases of new aircraft is substantial. At
December 31, 2018
, the Company had firm commitments to purchase
273
new aircraft from The Boeing Company ("Boeing"), Airbus S.A.S ("Airbus") and Embraer S.A. ("Embraer"), as well as related agreements with engine manufacturers, maintenance providers and others. As of
December 31, 2018
, the Company's commitments relating to the acquisition of aircraft and related spare engines, aircraft improvements and other related obligations aggregated to a total of
$24.7 billion
.
Subsequent to the Company placing an order for new aircraft, the Company's network strategy may change. As a result, the Company's preference for a particular aircraft that it has ordered, often years in advance, may be decreased or eliminated. If the Company were to modify or terminate any of its existing aircraft order commitments, it may be responsible for material liabilities to its counterparties arising from any such change. Additionally, the Company may have a need for additional aircraft that are not available under its existing orders. In such cases, the Company may seek to acquire aircraft from other sources, such as through lease arrangements, which may result in higher costs or less favorable terms, or through the purchase or lease of used aircraft. The Company may not be able to acquire such aircraft when needed on favorable terms or at all.
A majority of the Company's aircraft and certain parts are sourced from single suppliers; therefore, the Company would be materially and adversely affected if it were unable to obtain additional equipment or support from any of these suppliers.
The Company currently sources the majority of its aircraft and many related aircraft parts from Boeing. In addition, our aircraft suppliers are dependent on other suppliers for certain other aircraft parts. Therefore, if the Company was unable to acquire additional aircraft from Boeing, or if Boeing was unable or unwilling to make timely deliveries of aircraft or to provide adequate support for its products, the Company's operations could be materially and adversely affected. The Company is also dependent on a limited number of suppliers for aircraft engines and certain other aircraft parts and could therefore also be materially and adversely affected in the event of the unavailability of these engines and other parts.
Union disputes, employee strikes or slowdowns, and other labor-related disruptions could adversely affect the Company's operations and could result in increased costs that impair its financial performance.
United is a highly unionized company. As of
December 31, 2018
, the Company and its subsidiaries had approximately
92,000
active employees, of whom approximately
83%
were represented by various U.S. labor organizations.
There is a risk that unions or individual employees might pursue judicial or arbitral claims arising out of changes implemented as a result of the Company entering into collective bargaining agreements with its represented employee groups. There is also a possibility that employees or unions could engage in job actions such as slowdowns, work-to-rule campaigns, sick-outs or other actions designed to disrupt the Company's normal operations, in an attempt to pressure the Company in collective bargaining negotiations. Although the RLA makes such actions unlawful until the parties have been lawfully released to self-help, and the Company can seek injunctive relief against premature self-help, such actions can cause significant harm even if ultimately enjoined. In addition, collective bargaining agreements with the Company's represented employee groups increase the Company's labor costs, which increase could be material for any applicable reporting period.
An outbreak of a disease or similar public health threat could have a material adverse impact on the Company's business, operating results and financial condition.
An outbreak of a disease or similar public health threat that affects travel demand, travel behavior, or travel restrictions could have a material adverse impact on the Company's business, financial condition and operating results.
If we experience changes in, or are unable to retain, our senior management team or other key employees, our operating results could be adversely affected.
Much of our future success depends on the continued availability of skilled personnel with industry experience and knowledge, including our senior management team and other key employees. If we are unable to attract and retain talented, highly qualified senior management and other key employees, or if we are unable to effectively provide for the succession of senior management, our business may be adversely affected.
14
Extended interruptions or disruptions in service at major airports where we operate could have a material adverse impact on our operations.
The airline industry is heavily dependent on business models that concentrate operations in major airports in the United States and throughout the world. An extended interruption or disruption at an airport where we have significant operations could have a material impact on our business, financial condition and results of operation.
We operate principally through our domestic hubs in at Newark, Chicago O'Hare, Denver, Houston Bush, LAX, Guam, SFO and Washington Dulles. Substantially all of our flights either originate in or fly into one of these locations. A significant interruption or disruption in service at one of our hubs or other airports where we have a significant presence resulting from ATC delays, weather conditions, natural disasters, growth constraints, relations with third-party service providers, failure of computer systems, disruptions to government agencies or personnel, disruptions at airport facilities or other key facilities used by us to manage our operations, labor relations, power supplies, fuel supplies, terrorist activities, international hostilities or otherwise could result in the cancellation or delay of a significant portion of our flights and, as a result, could have a material impact on our business, operating results and financial condition. We have minimal control over the operation, quality or maintenance of these services or whether vendors will improve or continue to provide services that are essential to our business.
The airline industry is subject to extensive government regulation, which imposes significant costs and may adversely impact our business, operating results and financial condition.
Airlines are subject to extensive regulatory and legal oversight. Compliance with U.S. and international regulations imposes significant costs and may have adverse effects on the Company. Laws, regulations, taxes and airport rates and charges, both domestically and internationally, have been proposed from time to time that could significantly increase the cost of airline operations or reduce airline revenue.
United provides air transportation under certificates of public convenience and necessity issued by the DOT. If the DOT altered, amended, modified, suspended or revoked these certificates, it could have a material adverse effect on the Company's business. The FAA regulates the safety of United's operations. United operates pursuant to an air carrier operating certificate issued by the FAA. The FAA's regulations include stringent pilot flight and duty time requirements under Part 117 of the Federal Aviation Regulations, as well as minimum qualifications for air carrier first officers. These regulations have caused mainline airlines to hire regional pilots, while simultaneously significantly reducing the pool of new pilots from which regional carriers themselves can hire. Although this is an industry issue, it directly affects the Company and has required it to reduce regional partner flying, as several regional partners have experienced difficulty flying their schedules due to reduced pilot availability. From time to time, the FAA also issues orders, airworthiness directives and other regulations relating to the maintenance and operation of aircraft that require material expenditures or operational restrictions by the Company. These FAA orders and directives could include the temporary grounding of an entire aircraft type if the FAA identifies design, manufacturing, maintenance or other issues requiring immediate corrective action. These FAA directives or requirements could have a material adverse effect on the Company.
In 2018, the U.S. Congress approved a five-year reauthorization for the FAA, which encompasses significant aviation tax and policy-related issues. The law includes a range of policy changes related to airline customer service and aviation safety which, depending on how they are implemented, could impact our operations and costs. Additionally, the U.S. Congress may fail to continue to fund the operations of one or more federal government agencies which could negatively impact the Company and the airline industry.
The Company's operations may also be adversely impacted due to the existing antiquated ATC system utilized by the U.S. government and regulated by the FAA. During peak travel periods in certain markets, the current ATC system's inability to handle demand has led to short-term capacity constraints imposed by government agencies and resulted in delays and disruptions of air traffic. In addition, the current system will not be able to effectively handle projected future air traffic growth. The outdated technologies also cause the ATC to be less resilient in the event of a failure, causing flight cancellations and delays. Imposition of these ATC constraints on a long-term basis may have a material adverse effect on the Company's operations. Failure to update the ATC system in a timely manner, and the substantial funding requirements of a modernized ATC system that may be imposed on air carriers may have an adverse impact on the Company's financial condition or operating results.
Access to landing and take-off rights, or "slots," at several major U.S. airports and many foreign airports served by the Company are, or recently have been, subject to government regulation. Certain of the Company's major hubs are among the most congested airports in the United States and have been or could be the subject of regulatory action that might limit the number of flights and/or increase costs of operations at certain times or throughout the day. The FAA may limit the Company's
15
airport access by limiting the number of departure and arrival slots at high density traffic airports, which could affect the Company's ownership and transfer rights, and local airport authorities may have the ability to control access to certain facilities or the cost of access to their facilities, which could have an adverse effect on the Company's business. The FAA historically has taken actions with respect to airlines' slot holdings that airlines have challenged; if the FAA were to take actions that adversely affect the Company's slot holdings, the Company could incur substantial costs to preserve its slots or may lose slots. If slots are eliminated at an airport, or if the number of hours of operation governed by slots is reduced at an airport, the lack of controls on takeoffs and landings could result in greater congestion both at the affected airport or in the regional airspace (e.g., the New York City metropolitan region airspace) and could significantly impact the Company's operations. Further, the Company's operating costs at airports, including the Company's major hubs, may increase significantly because of capital improvements at such airports that the Company may be required to fund, directly or indirectly. Such costs could be imposed by the relevant airport authority without the Company's approval and may have a material adverse effect on the Company's financial condition.
The ability of carriers to operate flights on international routes between the United States and other countries is highly regulated. Applicable arrangements between the United States and foreign governments may be amended from time to time, government policies with respect to airport operations may be revised, and the availability of appropriate slots or facilities may change. The Company currently operates a number of flights on international routes under government arrangements, regulations or policies that designate the number of carriers permitted to operate on such routes, the capacity of the carriers providing services on such routes, the airports at which carriers may operate international flights, or the number of carriers allowed access to particular airports. Any limitations, additions or modifications to such arrangements, regulations or policies could have a material adverse effect on the Company's financial condition and operating results. Additionally, a change in law, regulation or policy for any of the Company's international routes, such as Open Skies, could have a material adverse impact on the Company's financial condition and operating results and could result in the impairment of material amounts of related tangible and intangible assets. In addition, competition from revenue-sharing JBAs and other alliance arrangements by and among other airlines could impair the value of the Company's business and assets on the Open Skies routes. The Company's plans to enter into or expand U.S. antitrust immunized alliances and JBAs on various international routes are subject to receipt of approvals from applicable U.S. federal authorities and obtaining other applicable foreign government clearances or satisfying the necessary applicable regulatory requirements. There can be no assurance that such approvals and clearances will be granted or will continue in effect upon further regulatory review or that changes in regulatory requirements or standards can be satisfied.
See Part I, Item 1, Business—Industry Regulation, of this report for additional information on government regulation impacting the Company.
We are subject to many forms of environmental regulation and liability and risks associated with climate change, and may incur substantial costs as a result.
Many aspects of the Company's operations are subject to increasingly stringent federal, state, local and international laws protecting the environment, including those relating to emissions to the air, water discharges, safe drinking water and the use and management of hazardous materials and wastes. Compliance with existing and future environmental laws and regulations can require significant expenditures and violations can lead to significant fines and penalties. In addition, from time to time we are identified as a responsible party for environmental investigation and remediation costs under applicable environmental laws due to the disposal of hazardous substances generated by our operations. We could also be subject to environmental liability claims from various parties, including airport authorities, related to our operations at our leased premises or the off-site disposal of waste generated at our facilities.
We may incur substantial costs as a result of changes in weather patterns due to climate change. Increases in the frequency, severity or duration of severe weather events such as thunderstorms, hurricanes, flooding, typhoons, tornados and other severe weather events could result in increases in delays and cancellations, turbulence-related injuries and fuel consumption to avoid such weather, any of which could result in significant loss of revenue and higher costs.
To address climate change risks, CORSIA has been developed by ICAO, a UN specialized agency. CORSIA is intended to create a single global market-based measure to achieve carbon-neutral growth for international aviation after 2020 through airline purchases of carbon offset credits. Certain CORSIA program details remain to be developed and could potentially be affected by political developments in participating countries or the results of the pilot phase of the program, and thus the impact of CORSIA cannot be fully predicted. However, CORSIA is expected to increase operating costs for airlines that operate internationally.
In addition to CORSIA, the EPA had begun preliminary work to adopt its own aircraft engine GHG emission standards which were expected to be aligned with recent ICAO carbon dioxide emission standards. The timing of any U.S. EPA aircraft engine GHG emission standards is currently unknown, but some jurisdictions in which United operates have adopted or are considering GHG emission reduction initiatives, which could impact various aspects of the Company's business. The precise
16
nature of future requirements and their applicability to the Company are difficult to predict, but the financial impact to the Company and the aviation industry would likely be adverse and could be significant.
See Part I, Item 1, Business-Industry Regulation-Environmental Regulation, of this report for additional information on environmental regulation impacting the Company.
The United Kingdom's withdrawal from the EU may adversely impact our operations in the United Kingdom and elsewhere.
In June 2016, United Kingdom ("UK") voters approved an advisory referendum for the UK to exit the EU. The UK parliament voted in favor of allowing the government to commence negotiations to determine the future terms of the UK's relationship with the EU, including the terms of trade between the UK and the EU and other nations. The timing of the proposed exit is currently scheduled for March 29, 2019, with a transition period potentially running through December 2020. A withdrawal plan was presented to the UK parliament in January 2019 and rejected, creating further uncertainty in negotiations and the process of withdrawal.
Depending on the outcome of these negotiations, we could face new challenges in our operations, such as instability in global financial and foreign exchange markets. This instability could include volatility in the value of the British pound and European euro, additional travel restrictions on passengers traveling between the UK and other EU countries, changes to the legal status of EU-resident employees, legal uncertainty and potentially divergent national laws and regulations. At this time, we cannot predict the impact that an actual exit from the EU will have on our business generally and our UK and European operations more specifically, and no assurance can be given that our operating results, financial condition and prospects would not be adversely impacted by the result.
The Company's operating results fluctuate due to seasonality and other factors associated with the airline industry, many of which are beyond the Company's control.
Due to greater demand for air travel during the spring and summer months, revenues in the airline industry in the second and third quarters of the year are generally stronger than revenues in the first and fourth quarters of the year, which are periods of lower travel demand. The Company's operating results generally reflect this seasonality, but have also been impacted by numerous other factors that are not necessarily seasonal, including, among others, extreme or severe weather, outbreaks of disease or pandemics, ATC congestion, geological events, political instability, terrorism, natural disasters, changes in the competitive environment due to industry consolidation, tax obligations, general economic conditions and other factors. As a result, the Company's quarterly operating results are not necessarily indicative of operating results for an entire year and historical operating results in a quarterly or annual period are not necessarily indicative of future operating results.
Increases in insurance costs or inadequate insurance coverage may materially and adversely impact our business, operating results and financial condition.
The Company could be exposed to significant liability or loss if its property or operations were to be affected by a natural catastrophe or other event, including aircraft accidents. The Company maintains insurance policies, including, but not limited to, terrorism, aviation hull and liability, workers' compensation and property and business interruption insurance, but we are not fully insured against all potential hazards and risks incident to our business. If the Company is unable to obtain sufficient insurance with acceptable terms, the costs of such insurance increase materially, or if the coverage obtained is insufficient relative to actual liability or losses that the Company experiences, whether due to insurance market conditions, policy limitations and exclusions or otherwise, its operating results and financial condition could be materially and adversely affected.
The Company has a significant amount of financial leverage from fixed obligations, and insufficient liquidity may have a material adverse effect on the Company's financial condition and business.
The Company has a significant amount of financial leverage from fixed obligations, including aircraft lease and debt financings, leases of airport property and other facilities, and other material cash obligations. In addition, the Company has substantial noncancelable commitments for capital expenditures, including for the acquisition of new aircraft and related spare engines.
Although the Company's cash flows from operations and its available capital, including the proceeds from financing transactions, have been sufficient to meet these obligations and commitments to date, the Company's future liquidity could be negatively affected by the risk factors discussed in this report. If the Company's liquidity is materially diminished, the Company might not be able to timely pay its leases and debts or comply with certain operating and financial covenants under its financing and credit card processing agreements or with other material provisions of its contractual obligations.
The Company's substantial level of indebtedness and non-investment grade credit rating, as well as market conditions and the availability of assets as collateral for loans or other indebtedness, may make it difficult for the Company to raise additional capital if needed to meet its liquidity needs on acceptable terms, or at all. In addition, our variable rate indebtedness may use
17
London interbank offered rates ("LIBOR") as a benchmark for establishing the rate. As announced in July 2017, LIBOR is expected to be phased out by the end of 2021. Uncertainty as to the nature of alternative reference rates and as to potential changes or other reforms to LIBOR may adversely impact the availability and cost of borrowings.
See Part II, Item 7, Management's Discussion and Analysis of Financial Condition and Results of Operations, of this report for additional information regarding the Company's liquidity.
Agreements governing our debt include financial and other covenants. Failure to comply with these covenants could result in events of default.
Our financing agreements include various financial and other covenants. Certain of these covenants require UAL or United, as applicable, to maintain minimum liquidity and/or minimum collateral coverage ratios. UAL's or United's ability to comply with these covenants may be affected by events beyond its control, including the overall industry revenue environment, the level of fuel costs and the appraised value of the collateral. In addition, our financing agreements contain other negative covenants customary for such financings. These covenants are subject to important exceptions and qualifications. If we fail to comply with these covenants and are unable to remedy or obtain a waiver or amendment, an event of default would result.
If an event of default were to occur, the lenders could, among other things, declare outstanding amounts due and payable. In addition, an event of default or declaration of acceleration under one financing agreement could also result in an event of default under other of our financing agreements due to cross-default and cross-acceleration provisions. The acceleration of significant amounts of debt could require us to renegotiate, repay or refinance the obligations under our financing arrangements.
The Company may never realize the full value of its intangible assets or its long-lived assets causing it to record impairments that may negatively affect its financial condition and operating results.
In accordance with applicable accounting standards, the Company is required to test its indefinite-lived intangible assets for impairment on an annual basis, or more frequently where there is an indication of impairment. In addition, the Company is required to test certain of its other assets for impairment where there is any indication that an asset may be impaired.
The Company may be required to recognize losses in the future due to, among other factors, extreme fuel price volatility, tight credit markets, government regulatory changes, decline in the fair values of certain tangible or intangible assets, such as aircraft, route authorities, airport slots and frequent flyer database, unfavorable trends in historical or forecasted results of operations and cash flows and an uncertain economic environment, as well as other uncertainties. The Company can provide no assurance that a material impairment loss of tangible or intangible assets will not occur in a future period. The value of the Company's aircraft could be impacted in future periods by changes in supply and demand for these aircraft. Such changes in supply and demand for certain aircraft types could result from grounding of aircraft by the Company or other carriers. An impairment loss could have a material adverse effect on the Company's financial condition and operating results.
|
ITEM 1B.
|
UNRESOLVED STAFF COMMENTS.
|
None.
18
|
ITEM 2.
|
PROPERTIES.
|
Fleet
Including aircraft operated by United's regional carriers, United's fleet consisted of
1,329
aircraft as of
December 31, 2018
, the details of which are presented in the tables below:
|
Aircraft Type
|
Total
|
Owned
|
Leased
|
Seats in Standard Configuration
|
Average Age (In Years)
|
||||||||||||||
|
Mainline:
|
|
||||||||||||||||||
|
777-300ER
|
18
|
|
18
|
|
—
|
|
350-366
|
1.5
|
|
||||||||||
|
777-200ER
|
55
|
|
|
46
|
|
9
|
|
269-274
|
|
18.8
|
|
||||||||
|
777-200
|
19
|
|
19
|
|
—
|
|
364
|
|
21.5
|
|
|||||||||
|
787-10
|
3
|
|
3
|
|
—
|
|
318
|
0.1
|
|
||||||||||
|
787-9
|
25
|
|
25
|
|
—
|
|
252
|
2.8
|
|
||||||||||
|
787-8
|
12
|
|
|
12
|
|
—
|
|
219
|
|
5.5
|
|
||||||||
|
767-400ER
|
16
|
|
14
|
|
2
|
|
242
|
|
17.3
|
|
|||||||||
|
767-300ER
|
38
|
|
|
25
|
|
13
|
|
167-214
|
22.9
|
|
|||||||||
|
757-300
|
21
|
|
9
|
|
12
|
|
213-234
|
16.3
|
|
||||||||||
|
757-200
|
56
|
|
50
|
|
6
|
|
142-169
|
22.8
|
|
||||||||||
|
737 MAX 9
|
9
|
|
9
|
|
—
|
|
179
|
0.4
|
|
||||||||||
|
737-900ER
|
136
|
|
136
|
|
—
|
|
179
|
|
6.0
|
|
|||||||||
|
737-900
|
12
|
|
|
8
|
|
4
|
|
179
|
|
17.3
|
|
||||||||
|
737-800
|
141
|
|
|
90
|
|
51
|
|
166
|
|
14.8
|
|
||||||||
|
737-700
|
40
|
|
|
25
|
|
15
|
|
126
|
|
19.8
|
|
||||||||
|
A320-200
|
99
|
|
|
70
|
|
29
|
|
150
|
|
20.3
|
|
||||||||
|
A319-100
|
70
|
|
|
55
|
|
15
|
|
128
|
|
17.6
|
|
||||||||
|
Total mainline
|
770
|
|
614
|
|
156
|
|
|
15.1
|
|
||||||||||
|
Aircraft Type
|
Capacity Purchase Agreement Total
|
Owned
|
Leased
|
Owned or Leased by Regional Carrier
|
Regional Carrier Operator and Number of Aircraft
|
Seats in Standard Configuration
|
|||||||||||||
|
Regional:
|
|
|
|
|
|
|
|
||||||||||||
|
Embraer E175
|
153
|
|
54
|
|
—
|
|
99
|
|
SkyWest:
Mesa:
Republic:
|
65
60
28
|
|
76
|
|
||||||
|
Embraer 170
|
38
|
|
—
|
|
—
|
|
38
|
|
Republic:
|
38
|
|
|
70
|
|
|||||
|
CRJ700
|
64
|
|
—
|
|
—
|
|
64
|
|
SkyWest:
GoJet:
Mesa:
|
19
25
20
|
|
70
|
|
||||||
|
CRJ200
|
128
|
|
—
|
|
—
|
|
128
|
|
SkyWest:
Air Wisconsin:
ExpressJet:
|
60
56
12
|
|
50
|
|
||||||
|
Embraer ERJ 145 (XR/LR/ER)
|
176
|
|
82
|
|
90
|
|
4
|
|
ExpressJet:
Trans States:
CommutAir:
|
105
40
31
|
|
|
50
|
|
|||||
|
Total regional
|
559
|
|
136
|
|
90
|
|
333
|
|
|
||||||||||
|
Total
|
1,329
|
|
750
|
|
246
|
|
333
|
|
|
||||||||||
In addition to the aircraft presented in the tables above, United owned the following aircraft listed below as of
December 31, 2018
:
|
•
|
One Boeing 737 MAX 9 and one Airbus 319-100, which were delivered in December 2018 but were awaiting operating certificates as of December 31, 2018;
|
|
•
|
One Boeing 767-200, which is being subleased to another airline;
|
|
•
|
Nine Boeing 747s, which are permanently grounded; and
|
|
•
|
Three Embraer ERJ 145s, which are temporarily grounded.
|
19
Firm Order and Option Aircraft
As of
December 31, 2018
, United had firm commitments and options to purchase new aircraft from Boeing, Airbus and Embraer as presented in the table below:
|
Aircraft Type
|
Number of Firm
Commitments (a) |
|
|
Airbus A350
|
45
|
|
|
Boeing 737 MAX
|
175
|
|
|
Boeing 777-300ER
|
4
|
|
|
Boeing 787
|
24
|
|
|
Embraer E175
|
25
|
|
|
(a) United also has options and purchase rights for additional aircraft.
|
||
The aircraft listed in the table above are scheduled for delivery from
2019
through
2027
. To the extent the Company and the aircraft manufacturers with whom the Company has existing orders for new aircraft agree to modify the contracts governing those orders, the amount and timing of the Company's future capital commitments could change. In 2019, United expects to take delivery of
25
Embraer E175 aircraft,
20
Boeing 737 MAX aircraft,
8
Boeing 787 aircraft and
2
Boeing 777-300ER aircraft.
United also has agreements to purchase
20
used Airbus A319 aircraft with expected delivery dates through
2022
. See Notes 10 and 13 to the financial statements included in Part II, Item 8 of this report for additional information.
Facilities
United's principal facilities relate to leases of airport facilities, gates, hangar sites, terminal buildings and other facilities in the municipalities it serves. United has major terminal facility leases at SFO, Washington Dulles, Chicago O'Hare, LAX, Denver, Newark, Houston Bush and Guam with expiration dates ranging from
2019
through
2055
. Substantially all of these facilities are leased on a net-rental basis, resulting in the Company's responsibility for maintenance, insurance and other facility-related expenses and services.
United also maintains administrative offices, catering, cargo, training facilities, maintenance facilities and other facilities to support operations in the cities served. In addition, United has multiple leases, which expire from
2019
through 2029, for its principal executive office and operations center in downtown Chicago and administrative offices in downtown Houston.
|
ITEM 3.
|
LEGAL PROCEEDINGS.
|
On June 30, 2015, UAL received a Civil Investigative Demand ("CID") from the Antitrust Division of the DOJ seeking documents and information from the Company in connection with a DOJ investigation related to statements and decisions about airline capacity. The Company is working with the DOJ and has completed its response to the CID. The Company is not able to predict what action, if any, might be taken in the future by the DOJ or other governmental authorities as a result of the investigation. Beginning on July 1, 2015, subsequent to the announcement of the CID, UAL and United were named as defendants in multiple class action lawsuits that asserted claims under the Sherman Antitrust Act, which have been consolidated in the United States District Court for the District of Columbia. The complaints generally allege collusion among U.S. airlines on capacity impacting airfares and seek treble damages. The Company intends to vigorously defend against the class action lawsuits.
On October 13, 2015, United received a CID from the Civil Division of the DOJ. The CID requested documents and oral testimony from United in connection with an industry-wide DOJ investigation related to delivery scan and other data purportedly required for payment for the carriage of mail under United's International Commercial Air Contracts with the U.S. Postal Service. The Company has been responding to the DOJ's request and cooperating in the investigation since that time. On November 8, 2016, the DOJ Criminal Division met with representatives from the Company and advised they are conducting an industry-wide investigation into the same matter. The Company is also cooperating with the government in this aspect of their investigation and, on December 21, 2016, representatives from the Company met with both the Civil and Criminal Divisions to provide additional information. The Company cannot predict what action, if any, might be taken in the future by the DOJ or other governmental authorities as a result of these investigations.
20
Other Legal Proceedings
The Company is involved in various other claims and legal actions involving passengers, customers, suppliers, employees and government agencies arising in the ordinary course of business. Additionally, from time to time, the Company becomes aware of potential non-compliance with applicable environmental regulations, which have either been identified by the Company (through internal compliance programs such as its environmental compliance audits) or through notice from a governmental entity. In some instances, these matters could potentially become the subject of an administrative or judicial proceeding and could potentially involve monetary sanctions. After considering a number of factors, including (but not limited to) the views of legal counsel, the nature of contingencies to which the Company is subject and prior experience, management believes that the ultimate disposition of these other claims and legal actions will not materially affect its consolidated financial position or results of operations. However, the ultimate resolutions of these matters are inherently unpredictable. As such, the Company's financial condition and results of operations could be adversely affected in any particular period by the unfavorable resolution of one or more of these matters.
|
ITEM 4.
|
MINE SAFETY DISCLOSURES.
|
Not applicable.
PART II
|
ITEM 5.
|
MARKET FOR REGISTRANT'S COMMON EQUITY, RELATED STOCKHOLDER MATTERS AND ISSUER PURCHASES OF EQUITY SECURITIES.
|
Since September 7, 2018, UAL's common stock has traded on the Nasdaq Global Select Market ("Nasdaq") under the symbol "UAL." Previously, UAL's common stock was traded on the New York Stock Exchange ("NYSE"). As of
February 22, 2019
, there were 5,615 holders of record of UAL common stock.
The following graph shows the cumulative total stockholder return for UAL's common stock during the period from December 31, 2013 to
December 31, 2018
. The graph also shows the cumulative returns of the Standard and Poor's 500 Index ("SPX") and the NYSE Arca Airline Index ("XAL") of 15 investor-owned airlines over the same five-year period. The comparison assumes $100 was invested on
December 31, 2013
in each of UAL common stock, the SPX and the XAL.
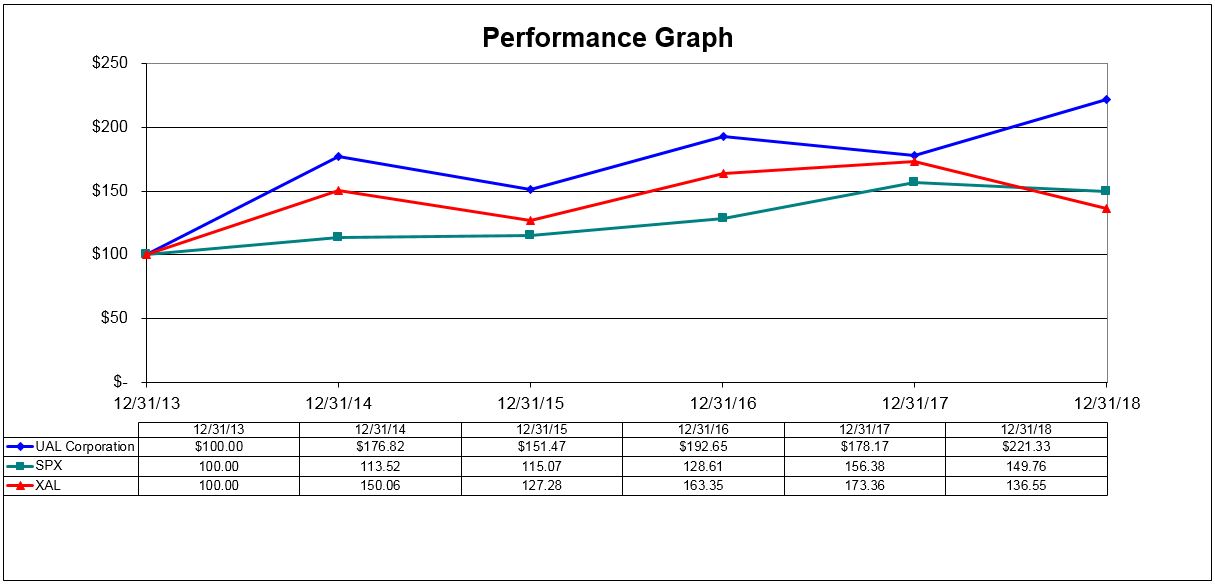
Note:
The stock price performance shown in the graph above should not be considered indicative of potential future stock price performance. The foregoing performance graph is being furnished as part of this report solely in accordance with the requirement under Rule 14a-3(b)(9) to furnish our stockholders with such information, and therefore, shall not be deemed to be filed or incorporated by reference into any filings by the Company under the Securities Act or the Exchange Act.
21
The following table presents repurchases of UAL common stock made in the fourth quarter of
2018
:
|
Period
|
Total number of shares purchased (a) (b)
|
Average price paid per share (b)(c)
|
Total number of shares purchased as part of publicly announced plans or programs (a)
|
Approximate dollar value of shares that may yet be purchased under the plans or programs (in millions) (a)
|
||||||||||
|
October 2018
|
572,349
|
|
$
|
85.76
|
|
572,349
|
|
$
|
1,941
|
|
||||
|
November 2018
|
927,969
|
|
91.76
|
|
927,969
|
|
1,856
|
|
||||||
|
December 2018
|
1,228,339
|
|
85.87
|
|
1,228,339
|
|
1,750
|
|
||||||
|
Total
|
2,728,657
|
|
2,728,657
|
|
||||||||||
(a) In
2018
, UAL repurchased approximately 17.5 million shares of UAL common stock for $1.2 billion.
In December 2017, UAL's Board of Directors authorized a $3.0 billion share repurchase program to acquire UAL's common stock.
As of
December 31, 2018
, the Company had approximately
$1.8 billion
remaining to purchase shares under its share repurchase program. UAL may repurchase shares through the open market, privately negotiated transactions, block trades or accelerated share repurchase transactions from time to time in accordance with applicable securities laws.
(b) The table does not include shares withheld from employees to satisfy certain tax obligations due upon the vesting of restricted stock. The United Continental Holdings, Inc. 2017 Incentive Compensation Plan and the United Continental Holdings, Inc. 2008 Incentive Compensation Plan, each provide for the withholding of shares to satisfy tax obligations due upon the vesting of restricted stock. However, these plans do not specify a maximum number of shares that may be withheld for this purpose. A total of 1,368 shares were withheld under the plans in the fourth quarter of
2018
at an average price of $91.79 per share. These shares of common stock withheld to satisfy tax withholding obligations may be deemed to be "issuer purchases" of shares that are required to be disclosed pursuant to this Item.
(c) Average price paid per share is calculated on a settlement basis and excludes commission.
|
ITEM 6.
|
SELECTED FINANCIAL DATA.
|
UAL's consolidated financial statements and statistical data are provided in the tables below:
|
Year Ended December 31,
|
||||||||||||||||||||
|
2018
|
2017 (a)
|
2016 (a)
|
2015
|
2014
|
||||||||||||||||
|
Income Statement Data (in millions, except per share amounts):
|
||||||||||||||||||||
|
Operating revenue
|
$
|
41,303
|
|
$
|
37,784
|
|
$
|
36,558
|
|
$
|
37,864
|
|
$
|
38,901
|
|
|||||
|
Operating expense
|
38,011
|
|
34,113
|
|
32,214
|
|
32,698
|
|
36,528
|
|
||||||||||
|
Operating income
|
3,292
|
|
3,671
|
|
4,344
|
|
5,166
|
|
2,373
|
|
||||||||||
|
Net income
|
2,129
|
|
2,144
|
|
2,234
|
|
7,340
|
|
1,132
|
|
||||||||||
|
Basic earnings per share
|
7.73
|
|
7.08
|
|
6.77
|
|
19.52
|
|
3.05
|
|
||||||||||
|
Diluted earnings per share
|
7.70
|
|
7.06
|
|
6.76
|
|
19.47
|
|
2.93
|
|
||||||||||
|
Balance Sheet Data at December 31 (in millions):
|
||||||||||||||||||||
|
Unrestricted cash, cash equivalents and short-term investments
|
$
|
3,950
|
|
$
|
3,798
|
|
$
|
4,428
|
|
$
|
5,196
|
|
$
|
4,384
|
|
|||||
|
Total assets
|
44,792
|
|
42,346
|
|
40,208
|
|
40,861
|
|
36,595
|
|
||||||||||
|
Debt and capital lease obligations
|
14,728
|
|
14,392
|
|
11,705
|
|
11,759
|
|
11,947
|
|
||||||||||
(a) Amounts adjusted due to the adoption of Accounting Standards Update No. 2014-09,
Revenue from Contracts with Customers (Topic 606)
and
Accounting Standards Update No. 2017-07,
Improving the Presentation of Net Periodic Pension Cost and Net Periodic Postretirement Benefit Cost.
See Note 1 to the financial statements contained in Part II, Item 8 of this report for additional information.
22
|
|
Year Ended December 31,
|
||||||||||||||||||
|
2018
|
2017 (a)
|
2016 (a)
|
2015
|
2014
|
|||||||||||||||
|
Consolidated (b)
|
|||||||||||||||||||
|
Passengers (thousands) (c)
|
158,330
|
|
148,067
|
|
143,177
|
|
140,369
|
|
138,029
|
|
|||||||||
|
Revenue passenger miles ("RPMs") (millions) (d)
|
230,155
|
|
216,261
|
|
210,309
|
|
208,611
|
|
205,559
|
|
|||||||||
|
Available seat miles ("ASMs") (millions) (e)
|
275,262
|
|
262,386
|
|
253,590
|
|
250,003
|
|
246,021
|
|
|||||||||
|
Cargo revenue ton miles (millions) (f)
|
3,425
|
|
3,316
|
|
2,805
|
|
2,614
|
|
2,487
|
|
|||||||||
|
Passenger load factor (g)
|
83.6
|
%
|
82.4
|
%
|
82.9
|
%
|
83.4
|
%
|
83.6
|
%
|
|||||||||
|
Passenger revenue per available seat mile ("PRASM") (cents)
|
13.70
|
|
13.13
|
|
13.18
|
|
13.11
|
|
13.72
|
|
|||||||||
|
Total revenue per available seat mile ("TRASM") (cents)
|
15.00
|
|
14.40
|
|
14.42
|
|
15.15
|
|
15.81
|
|
|||||||||
|
Average yield per revenue passenger mile ("Yield") (cents) (h)
|
16.38
|
|
15.93
|
|
15.90
|
|
15.72
|
|
16.42
|
|
|||||||||
|
Cost per available seat mile ("CASM") (cents)
|
13.81
|
|
13.00
|
|
12.70
|
|
13.08
|
|
14.85
|
|
|||||||||
|
Average price per gallon of fuel, including fuel taxes
|
$
|
2.25
|
|
$
|
1.74
|
|
$
|
1.49
|
|
$
|
1.94
|
|
$
|
2.99
|
|
||||
|
Fuel gallons consumed (millions)
|
4,137
|
|
3,978
|
|
3,904
|
|
3,886
|
|
3,905
|
|
|||||||||
|
Average stage length (miles) (i)
|
1,446
|
|
1,460
|
|
1,473
|
|
1,487
|
|
1,480
|
|
|||||||||
|
Average daily utilization of each mainline aircraft (hours:minutes) (j)
|
10:45
|
|
10:27
|
|
10:06
|
|
10:24
|
|
10:26
|
|
|||||||||
(a) PRASM, TRASM, Yield, and CASM are adjusted due to the adoption of Accounting Standards Update No. 2014-09,
Revenue from Contracts with Customers (Topic 606)
and
Accounting Standards Update No. 2017-07,
Improving the Presentation of Net Periodic Pension Cost and Net Periodic Postretirement Benefit Cost.
See Note 1 to the financial statements contained in Part II, Item 8 of this report for additional information.
(b) Includes data from our regional carriers operating under CPAs.
(c) The number of revenue passengers measured by each flight segment flown.
(d) The number of scheduled miles flown by revenue passengers.
(e) The number of seats available for passengers multiplied by the number of scheduled miles those seats are flown.
(f) The number of cargo revenue tons transported multiplied by the number of miles flown.
(g) RPM divided by ASM.
(h) The average passenger revenue received for each revenue passenger mile flown.
(i) Average stage length equals the average distance a flight travels weighted for size of aircraft.
(j) The average number of hours per day that an aircraft flown in revenue service is operated (from gate departure to gate arrival).
23
|
ITEM 7.
|
MANAGEMENT'S DISCUSSION AND ANALYSIS OF FINANCIAL CONDITION AND RESULTS OF OPERATIONS.
|
Overview
United Continental Holdings, Inc. (together with its consolidated subsidiaries, "UAL" or the "Company") is a holding company and its principal, wholly-owned subsidiary is United Airlines, Inc. (together with its consolidated subsidiaries, "United"). As UAL consolidates United for financial statement purposes, disclosures that relate to activities of United also apply to UAL, unless otherwise noted. United's operating revenues and operating expenses comprise nearly 100% of UAL's revenues and operating expenses. In addition, United comprises approximately the entire balance of UAL's assets, liabilities and operating cash flows. When appropriate, UAL and United are named specifically for their individual contractual obligations and related disclosures and any significant differences between the operations and results of UAL and United are separately disclosed and explained. We sometimes use the words "we," "our," "us," and the "Company" in this report for disclosures that relate to all of UAL and United.
2018
Financial Highlights
|
•
|
2018
net income was
$2.1 billion
, or
$7.70
diluted earnings per share, as compared to
$2.1 billion
, or
$7.06
diluted earnings per share, in 2017.
|
|
•
|
Revenue for 2018 increased $3.5 billion over 2017 due to a
4.9%
growth in ASMs and a PRASM increase of
4.3%
in
2018
compared to
2017
.
|
|
•
|
Aircraft fuel cost for
2018
increased
34.6%
over
2017
mainly due to higher fuel prices.
|
|
•
|
In
2018
, UAL repurchased approximately 17.5 million shares of its common stock for $1.2 billion. As of
December 31, 2018
, the Company had approximately
$1.8 billion
remaining to purchase shares under its share repurchase program.
|
|
•
|
UAL ended
2018
with
$6.0 billion
in unrestricted liquidity, which consisted of unrestricted cash, cash equivalents, short-term investments and available capacity under the revolving credit facility of its Amended and Restated Credit and Guaranty Agreement (as amended, the "Credit Agreement").
|
2018
Operational Highlights
|
•
|
RPMs for
2018
increased
6.4%
as compared to
2017
, and ASMs increased
4.9%
from the prior year, resulting in a load factor of
83.6%
in
2018
versus 82.4% in 2017.
|
|
•
|
For
2018
and
2017
, the Company recorded U.S. Department of Transportation on-time arrival rates of 79.8% and 81.9%, respectively, and mainline completion factors of 99.2% and 99.0%, respectively.
|
Outlook
Set forth below is a discussion of matters that we believe could impact our financial and operating performance and cause our results of operations in future periods to differ materially from our historical operating results and/or from our anticipated results of operations described in the forward-looking statements in this report. See Part I, Item 1A., Risk Factors, of this report and the factors described under "Forward-Looking Information" below for additional discussion of these and other factors that could affect us.
Growth Strategy.
In
2018
, the Company completed the first year of its multi-year growth strategy, increasing ASMs 4.9% compared to 2017. Our priorities for 2019 are delivering top-tier operational reliability and customer service while continuing to execute on our growth plan by strengthening our domestic network through strategic and efficient growth and investing in our people and product.
Fuel.
The Company's average aircraft fuel price per gallon including related taxes was
$2.25
in
2018
as compared to
$1.74
in
2017
. Based on the Company's projected fuel consumption in
2019
, a one-dollar change in the price of a barrel of crude oil would change the Company's projected fuel expense by approximately
$104 million
.
24
Results of Operations
2018
Compared to
2017
Operating Revenue
The table below illustrates the year-over-year percentage change in the Company's operating revenues for the years ended December 31 (in millions, except percentage changes):
|
2018
|
2017
|
Increase (Decrease)
|
% Change
|
||||||||||
|
Passenger revenue
|
$
|
37,706
|
|
$
|
34,460
|
|
$
|
3,246
|
|
9.4
|
|||
|
Cargo
|
1,237
|
|
1,114
|
|
123
|
|
11.0
|
||||||
|
Other operating revenue
|
2,360
|
|
2,210
|
|
150
|
|
6.8
|
||||||
|
Total operating revenue
|
$
|
41,303
|
|
$
|
37,784
|
|
$
|
3,519
|
|
9.3
|
|||
The table below presents selected passenger revenue and operating data of the Company, broken out by geographic region, expressed as year-over-year changes:
|
Increase (decrease) from 2017 (a):
|
||||||||||||||||||||
|
|
Domestic
|
Atlantic
|
Pacific
|
Latin
|
Total
|
|||||||||||||||
|
Passenger revenue (in millions)
|
$
|
2,340
|
|
$
|
688
|
|
$
|
185
|
|
$
|
33
|
|
$
|
3,246
|
|
|||||
|
Passenger revenue
|
11.1
|
%
|
11.7
|
%
|
4.3
|
%
|
1.0
|
%
|
9.4
|
%
|
||||||||||
|
Average fare per passenger
|
2.8
|
%
|
0.2
|
%
|
8.5
|
%
|
2.5
|
%
|
2.3
|
%
|
||||||||||
|
Yield
|
3.8
|
%
|
(0.4
|
)%
|
2.7
|
%
|
(0.3
|
)%
|
2.8
|
%
|
||||||||||
|
PRASM
|
4.1
|
%
|
6.3
|
%
|
3.0
|
%
|
0.8
|
%
|
4.3
|
%
|
||||||||||
|
Passengers
|
8.1
|
%
|
11.5
|
%
|
(3.9
|
)%
|
(1.4
|
)%
|
6.9
|
%
|
||||||||||
|
RPMs (traffic)
|
7.0
|
%
|
12.1
|
%
|
1.5
|
%
|
1.3
|
%
|
6.4
|
%
|
||||||||||
|
ASMs (capacity)
|
6.7
|
%
|
5.1
|
%
|
1.3
|
%
|
0.3
|
%
|
4.9
|
%
|
||||||||||
|
Passenger load factor (points)
|
0.2
|
|
5.1
|
|
0.2
|
|
0.8
|
|
1.2
|
|
||||||||||
|
(a) See Part II, Item 6, Selected Financial Data, of this report for the definition of these statistics.
|
||||||||||||||||||||
Passenger revenue increased
$3.2 billion
, or
9.4%
, in
2018
as compared to
2017
, primarily due to a
6.4%
increase in traffic. PRASM increased
4.3%
in
2018
as compared to
2017
. The increase in PRASM was driven by improvements in scheduling, higher corporate demand, increases in close-in bookings in the domestic markets and premium cabin demand improvements in the Atlantic and Pacific markets.
Cargo revenue increased
$123 million
, or
11.0%
, in
2018
as compared to
2017
, primarily due to freight volume and higher yield in the Atlantic and Pacific markets.
Other operating revenue increased
$150 million
, or
6.8%
, in
2018
as compared to
2017
, primarily due to increased revenue related to MileagePlus miles sales.
25
Operating Expense
The table below includes data related to the Company's operating expense for the years ended December 31 (in millions, except percentage changes):
|
2018
|
2017
|
Increase (Decrease)
|
% Change
|
|||||||||||
|
Salaries and related costs
|
$
|
11,458
|
|
$
|
10,941
|
|
$
|
517
|
|
4.7
|
|
|||
|
Aircraft fuel
|
9,307
|
|
6,913
|
|
2,394
|
|
34.6
|
|
||||||
|
Regional capacity purchase
|
2,601
|
|
2,232
|
|
369
|
|
16.5
|
|
||||||
|
Landing fees and other rent
|
2,359
|
|
2,240
|
|
119
|
|
5.3
|
|
||||||
|
Depreciation and amortization
|
2,240
|
|
2,149
|
|
91
|
|
4.2
|
|
||||||
|
Aircraft maintenance materials and outside repairs
|
1,767
|
|
1,856
|
|
(89
|
)
|
(4.8
|
)
|
||||||
|
Distribution expenses
|
1,558
|
|
1,435
|
|
123
|
|
8.6
|
|
||||||
|
Aircraft rent
|
433
|
|
621
|
|
(188
|
)
|
(30.3
|
)
|
||||||
|
Special charges
|
487
|
|
176
|
|
311
|
|
NM
|
|
||||||
|
Other operating expenses
|
5,801
|
|
5,550
|
|
251
|
|
4.5
|
|
||||||
|
Total operating expenses
|
$
|
38,011
|
|
$
|
34,113
|
|
$
|
3,898
|
|
11.4
|
|
|||
Salaries and related costs increased
$517 million
, or
4.7%
, in
2018
as compared to
2017
, primarily due to higher pay rates, higher benefit expenses (primarily health and pension costs), and a 0.7% increase in average full-time employees.
Aircraft fuel expense increased
$2.4 billion
, or
34.6%
, in
2018
as compared to
2017
, primarily due to increased fuel prices and a
4.9%
increase in capacity. The table below presents the significant changes in aircraft fuel cost per gallon for the years ended December 31 (in millions, except percentage changes and per gallon data):
|
2018
|
2017
|
|
%
Change
|
|||||||
|
Fuel expense
|
$
|
9,307
|
|
$
|
6,913
|
|
|
34.6
|
||
|
Total fuel consumption (gallons)
|
4,137
|
|
|
3,978
|
|
|
4.0
|
|||
|
Average price per gallon
|
$
|
2.25
|
|
$
|
1.74
|
|
29.3
|
|||
Regional capacity purchase costs increased
$369 million
, or
16.5%
, in
2018
as compared to
2017
, primarily due to increased flying related to the Company's initiative to improve connectivity at its domestic hubs, as well as rate increases under various capacity purchase agreements ("CPAs") with regional carriers.
Landing fees and other rent increased
$119 million
, or
5.3%
, in
2018
as compared to
2017
, primarily due to increased rates and our capacity growth.
Depreciation and amortization increased
$91 million
, or
4.2%
, in
2018
as compared to
2017
, primarily due to additions of new and used aircraft, aircraft improvements and increases in information technology infrastructure and application development projects.
Aircraft maintenance materials and outside repairs decreased
$89 million
, or
4.8%
, in
2018
as compared to
2017
, primarily due to optimization of fleet retirement schedules and related maintenance costs for those aircraft and timing of certain maintenance events.
Distribution expenses increased
$123 million
, or
8.6%
, in
2018
as compared to
2017
, primarily due to higher credit card and travel agency booking fees as a result of the overall increase in passenger revenue.
Aircraft rent decreased
$188 million
, or
30.3%
, in
2018
as compared to
2017
, primarily due to the purchase of leased aircraft, conversion of certain operating leases to capital leases and lease term expirations.
The table below presents special charges incurred by the Company during the years ended December 31 (in millions):
26
|
2018
|
2017
|
||||||
|
Impairment of assets
|
$
|
377
|
|
$
|
25
|
|
|
|
Termination of an engine maintenance service agreement
|
64
|
|
—
|
|
|||
|
Severance and benefit costs
|
41
|
|
116
|
|
|||
|
(Gains) losses on sale of assets and other special charges
|
5
|
|
35
|
|
|||
|
Total special charges
|
$
|
487
|
|
$
|
176
|
|
|
See Note 14 to the financial statements included in Part II, Item 8 of this report for additional information.
Other operating expenses increased
$251 million
, or
4.5%
, in
2018
as compared to
2017
, primarily due to an increase in purchased services related to our airport operations resulting from capacity growth, technology initiatives, facility projects, crew-related lodging and trucking and handling of cargo shipments.
Nonoperating Income (Expense)
The following table illustrates the year-over-year dollar and percentage changes in the Company's nonoperating income (expense) for the years ended December 31 (in millions, except percentage changes):
|
2018
|
2017
|
Increase (Decrease)
|
% Change
|
|||||||||||
|
Interest expense
|
$
|
(729
|
)
|
$
|
(671
|
)
|
$
|
58
|
|
8.6
|
|
|||
|
Interest capitalized
|
70
|
|
84
|
|
(14
|
)
|
(16.7
|
)
|
||||||
|
Interest income
|
101
|
|
57
|
|
44
|
|
77.2
|
|
||||||
|
Miscellaneous, net
|
(76
|
)
|
(101
|
)
|
(25
|
)
|
(24.8
|
)
|
||||||
|
Total nonoperating expense, net
|
$
|
(634
|
)
|
$
|
(631
|
)
|
$
|
3
|
|
0.5
|
|
|||
Interest expense increased
$58 million
, or
8.6%
, in
2018
as compared to
2017
, primarily due to debt issued for the acquisition of new aircraft and the conversion of certain operating leases to capital leases.
Interest income increased
$44 million
, or
77.2%
, in
2018
as compared to
2017
, primarily due to increased interest rates.
Miscellaneous, net decreased
$25 million
, or
24.8%
, in
2018
as compared to
2017
, primarily due to a decrease in pension benefit costs that was partially offset by an increase in foreign exchange losses and an increase in equity earnings from affiliates.
2017
Compared to
2016
Operating Revenue
The table below illustrates the year-over-year percentage change in the Company's operating revenues for the years ended December 31 (in millions, except percentage changes):
|
2017
|
2016
|
Increase (Decrease)
|
% Change
|
|||||||||||
|
Passenger revenue
|
$
|
34,460
|
|
$
|
33,429
|
|
$
|
1,031
|
|
3.1
|
|
|||
|
Cargo
|
1,114
|
|
934
|
|
180
|
|
19.3
|
|
||||||
|
Other operating revenue
|
2,210
|
|
2,195
|
|
15
|
|
0.7
|
|
||||||
|
Total operating revenue
|
$
|
37,784
|
|
$
|
36,558
|
|
$
|
1,226
|
|
3.4
|
|
|||
The table below presents selected passenger revenue and operating data of the Company, broken out by geographic region, expressed as year-over-year changes:
27
|
Increase (decrease) in 2017 from 2016 (a):
|
|||||||||||||||||||
|
|
Domestic
|
Atlantic
|
Pacific
|
Latin
|
Total
|
||||||||||||||
|
Passenger revenue (in millions)
|
$
|
885
|
|
$
|
117
|
|
$
|
(144
|
)
|
$
|
173
|
|
$
|
1,031
|
|
||||
|
Passenger revenue
|
4.4
|
%
|
2.0
|
%
|
(3.2
|
)%
|
5.8
|
%
|
3.1
|
%
|
|||||||||
|
Average fare per passenger
|
0.2
|
%
|
1.5
|
%
|
(0.1
|
)%
|
4.0
|
%
|
(0.3
|
)%
|
|||||||||
|
Yield
|
(0.3
|
)%
|
1.1
|
%
|
(2.4
|
)%
|
4.1
|
%
|
0.2
|
%
|
|||||||||
|
PRASM
|
(0.5
|
)%
|
1.6
|
%
|
(6.0
|
)%
|
3.3
|
%
|
(0.4
|
)%
|
|||||||||
|
Passengers
|
4.2
|
%
|
0.5
|
%
|
(3.1
|
)%
|
1.7
|
%
|
3.4
|
%
|
|||||||||
|
RPMs (traffic)
|
4.7
|
%
|
0.9
|
%
|
(0.9
|
)%
|
1.6
|
%
|
2.8
|
%
|
|||||||||
|
ASMs (capacity)
|
4.9
|
%
|
0.4
|
%
|
2.9
|
%
|
2.4
|
%
|
3.5
|
%
|
|||||||||
|
Passenger load factor (points)
|
(0.2
|
)
|
0.4
|
|
(3.0
|
)
|
(0.7
|
)
|
(0.5
|
)
|
|||||||||
|
(a) See Part II, Item 6, Selected Financial Data, of this report for the definition of these statistics.
|
|||||||||||||||||||
Passenger revenue increased
$1.0 billion
, or
3.1%
, in
2017
as compared to
2016
, primarily due to a
2.8%
increase in traffic. PRASM decreased
0.4%
in
2017
as compared to
2016
. The decline in PRASM was driven by factors including more aggressive low-cost carrier pricing in our hub markets, temporary share loss during roll-out of our Basic Economy pricing, and softer demand in China and Guam. Our revenue in
2017
was negatively impacted by severe storms during the third quarter.
Cargo revenue increased
$180 million
, or
19.3%
, in
2017
as compared to
2016
due to higher year-over-year international freight volume and yield.
Operating Expense
The table below includes data related to the Company's operating expense for the years ended December 31 (in millions, except percentage changes):
|
2017
|
2016
|
Increase (Decrease)
|
% Change
|
|||||||||||
|
Salaries and related costs
|
$
|
10,941
|
|
$
|
10,176
|
|
$
|
765
|
|
7.5
|
|
|||
|
Aircraft fuel
|
6,913
|
|
5,813
|
|
1,100
|
|
18.9
|
|
||||||
|
Landing fees and other rent
|
2,240
|
|
2,165
|
|
75
|
|
3.5
|
|
||||||
|
Regional capacity purchase
|
2,232
|
|
2,197
|
|
35
|
|
1.6
|
|
||||||
|
Depreciation and amortization
|
2,149
|
|
1,977
|
|
172
|
|
8.7
|
|
||||||
|
Aircraft maintenance materials and outside repairs
|
1,856
|
|
1,749
|
|
107
|
|
6.1
|
|
||||||
|
Distribution expenses
|
1,435
|
|
1,395
|
|
40
|
|
2.9
|
|
||||||
|
Aircraft rent
|
621
|
|
680
|
|
(59
|
)
|
(8.7
|
)
|
||||||
|
Special charges
|
176
|
|
745
|
|
(569
|
)
|
NM
|
|
||||||
|
Other operating expenses
|
5,550
|
|
5,317
|
|
233
|
|
4.4
|
|
||||||
|
Total operating expenses
|
$
|
34,113
|
|
$
|
32,214
|
|
$
|
1,899
|
|
5.9
|
|
|||
Salaries and related costs increased
$765 million
, or
7.5%
, in
2017
as compared to
2016
, primarily due to higher pay rates and benefit expenses driven by collective bargaining agreements finalized in 2016, and a 2.5% increase in average full-time equivalent employees, partially offset by a decrease in profit sharing and other employee incentives.
Aircraft fuel expense increased
$1.1 billion
, or
18.9%
, in
2017
as compared to
2016
, primarily due to increased fuel prices and a 3.5% increase in capacity. The table below presents the significant changes in aircraft fuel cost per gallon for the years ended December 31 (in millions, except percentage changes and per gallon data):
|
(In millions)
|
|
|
|
Average price per gallon
|
|||||||||||||||
|
2017
|
2016
|
|
%
Change
|
|
2017
|
2016
|
%
Change
|
||||||||||||
|
Total aircraft fuel purchase cost excluding fuel hedge impacts
|
$
|
6,911
|
|
|
$
|
5,596
|
|
|
23.5
|
|
$
|
1.74
|
|
$
|
1.43
|
|
21.7
|
||
|
Hedge losses reported in fuel expense
|
2
|
|
217
|
|
|
NM
|
|
—
|
|
0.06
|
|
NM
|
|||||||
|
Fuel expense
|
$
|
6,913
|
|
|
$
|
5,813
|
|
|
18.9
|
|
$
|
1.74
|
|
$
|
1.49
|
|
16.8
|
||
|
Total fuel consumption (gallons)
|
3,978
|
|
|
3,904
|
|
|
1.9
|
|
|||||||||||
28
Landing fees and other rent increased $75 million, or 3.5%, in 2017 as compared to the year-ago period due to higher rental and landing fee rates.
Regional capacity purchase costs increased $35 million, or 1.6%, in 2017 as compared to the year-ago period despite regional capacity being down 3.8% in 2017 as compared to 2016 due to increases in annual rates, maintenance cycle-related costs and lease return costs.
Depreciation and amortization increased $172 million, or 8.7%, in 2017 as compared to 2016, primarily due to additions of new and used aircraft, aircraft improvements and increases in information technology infrastructure and application development projects.
Aircraft maintenance materials and outside repairs increased $107 million, or 6.1%, in 2017 as compared to 2016, primarily due to an increase in airframe and engine maintenance visits and additional repairs to wireless and inflight entertainment equipment.
Aircraft rent decreased $59 million, or 8.7%, in 2017 as compared to 2016, primarily due to the purchase of leased aircraft and lower lease renewal rates.
The table below presents special charges incurred by the Company during the years ended December 31 (in millions):
|
2017
|
2016
|
||||||
|
Severance and benefit costs
|
$
|
116
|
|
$
|
37
|
|
|
|
Impairment of assets
|
25
|
|
412
|
|
|||
|
Cleveland airport lease restructuring
|
—
|
|
74
|
|
|||
|
Labor agreement costs
|
—
|
|
171
|
|
|||
|
(Gains) losses on sale of assets and other special charges
|
35
|
|
51
|
|
|||
|
Total special charges
|
$
|
176
|
|
$
|
745
|
|
|
See Note 14 to the financial statements included in Part II, Item 8 of this report for additional information.
Other operating expenses increased $233 million, or 4.4%, in 2017 as compared to 2016, primarily due to increased costs in food, marketing and technology associated with the Company's enhanced customer experience initiatives, and due to volume-driven increases in cargo trucking and handling costs.
Nonoperating Income (Expense)
The following table illustrates the year-over-year dollar and percentage changes in the Company's nonoperating income (expense) for the years ended December 31 (in millions, except percentage changes):
|
2017
|
2016
|
Increase (Decrease)
|
% Change
|
|||||||||||
|
Interest expense
|
$
|
(671
|
)
|
$
|
(674
|
)
|
$
|
(3
|
)
|
(0.4
|
)
|
|||
|
Interest capitalized
|
84
|
|
72
|
|
12
|
|
16.7
|
|
||||||
|
Interest income
|
57
|
|
42
|
|
15
|
|
35.7
|
|
||||||
|
Miscellaneous, net
|
(101
|
)
|
(11
|
)
|
90
|
|
NM
|
|
||||||
|
Total nonoperating expense, net
|
$
|
(631
|
)
|
$
|
(571
|
)
|
$
|
60
|
|
10.5
|
|
|||
Miscellaneous, net increased
$90 million
in 2017 as compared to 2016 primarily due to 2016 curtailments gains related to changes in the new labor agreements. See Note 14 to the financial statements included in Part II, Item 8 of this report for additional information.
Liquidity and Capital Resources
As of
December 31, 2018
, the Company had
$4.0 billion
in unrestricted cash, cash equivalents and short-term investments, an increase of $0.2 billion from
December 31, 2017
. The Company had its entire commitment capacity of
$2.0 billion
under the revolving credit facility of the Credit Agreement available for borrowings as of
December 31, 2018
.
We have a significant amount of fixed obligations, including debt, aircraft leases and financings, leases of airport property and other facilities and pension funding obligations. At
December 31, 2018
, the Company had approximately
$14.7 billion
of debt and capital lease obligations, including
$1.4 billion
that are due within the next 12 months. In addition, we have substantial noncancelable commitments for capital expenditures, including the acquisition of new aircraft and related spare engines. As of
29
December 31, 2018
, our current liabilities exceeded our current assets by approximately
$6.0 billion
. However, approximately
$6.7 billion
of our current liabilities are related to our advance ticket sales and frequent flyer deferred revenue, both of which largely represent revenue to be recognized for travel in the near future and not cash outlays. The deficit in working capital does not have an adverse impact to our cash flows, liquidity or operations.
For
2019
, the Company expects approximately $4.7 billion of gross capital expenditures. See Note 13 to the financial statements included in Part II, Item 8 of this report for additional information on commitments.
As of
December 31, 2018
, a substantial portion of the Company's assets, principally aircraft, route authorities and airport slots, was pledged under various loan and other agreements. Collateral pledged under these loans continues to be sufficient to satisfy the loan covenants. We must sustain our profitability and/or access the capital markets to meet our significant long-term debt and capital lease obligations and future commitments for capital expenditures, including the acquisition of aircraft and related spare engines. See Note 10 to the financial statements included in Part II, Item 8 of this report for additional information on assets provided as collateral by the Company.
The following is a discussion of the Company's sources and uses of cash from
2016
through
2018
.
Operating Activities
2018
Compared to
2017
Cash flow provided by operations for the year ended December 31, 2018 was $6.2 billion compared to $3.4 billion in the same period in 2017. The following were significant working capital items in 2018:
|
•
|
MileagePlus sales.
In 2018, we received $1.3 billion more for MileagePlus miles sales to our partners as compared to
2017
, mainly due to our domestic co-branded credit card partner fully utilizing the $0.9 billion remaining balance in its pre-purchased miles in 2017.
|
|
•
|
Advance ticket sales and deferred revenue.
Our 2018 traffic growth and yield improvements contributed to a $0.7 billion increase in advance ticket sales and frequent flyer deferred revenue.
|
2017 Compared to 2016
Cash flow provided by operations for the year ended December 31, 2017 was $3.4 billion compared to $5.5 billion in the same period in 2016, the decrease resulting from lower operating income and reduced cash flows from certain changes in working capital items. Excluding the non-cash impairment of the Newark slots, operating income for 2017 was approximately $1.2 billion lower than 2016. Working capital changes reduced cash flow from operations by an additional $1.2 billion year-over-year in 2017 as compared to 2016. The following were significant working capital items in 2017:
|
•
|
$0.9 billion decrease in advanced purchase of miles due to increased utilization of pre-purchased miles.
|
|
•
|
$0.4 billion increase in prepayments for maintenance contracts.
|
Investing Activities
2018
Compared to
2017
The Company's capital expenditures were
$4.2 billion
and
$4.0 billion
in
2018
and
2017
, respectively. The Company's capital expenditures for both years were primarily attributable to the purchase of aircraft, aircraft improvements, facility and fleet-related costs and the purchase of information technology assets.
On November 29, 2018, United, as lender, entered into a Term Loan Agreement (the "Synergy Loan Agreement") with affiliates of Synergy Aerospace Corporation ("Synergy"), as borrower and guarantor, respectively, and on November 30, 2018, pursuant to the Synergy Loan Agreement, United provided a secured $456 million term loan to Synergy. Synergy is the majority shareholder of Avianca Holdings S.A. ("AVH"), the parent company of Avianca. The loan was made in conjunction with a revenue-sharing joint business agreement among United, Avianca and Copa Airlines as described in Part 1, Item 1 of this report. For additional information regarding the Synergy Loan Agreement and related agreements, see Notes 9 and 13 to the financial statements included in Part II, Item 8 of this report.
In April 2018, through a wholly-owned subsidiary, the Company invested $138 million in Azul Linhas Aéreas Brasileiras S.A. ("Azul") thus increasing its preferred equity stake in Azul to approximately 8% (representing approximately 2% of the total capital stock of Azul).
30
2017
Compared to
2016
The Company's capital expenditures were
$4.0 billion
and
$3.2 billion
in
2017
and
2016
, respectively. The Company's capital expenditures for both years were primarily attributable to the purchase of aircraft, aircraft improvements, facility and fleet-related costs and the purchase of information technology assets.
Financing Activities
Significant financing events in
2018
were as follows:
Share Repurchases
The Company used
$1.2 billion
of cash to purchase approximately
17.5 million
shares of its common stock during
2018
. As of
December 31, 2018
, the Company had approximately
$1.8 billion
remaining to purchase shares under its share repurchase program.
Debt Issuances
During 2018, United received and recorded $1.2 billion of proceeds as debt related to enhanced equipment trust certificate ("EETC") offerings created in 2018 to finance the purchase of aircraft.
During
2018
, United borrowed approximately
$424 million
aggregate principal amount from various financial institutions to finance the purchase of several aircraft delivered in
2018
.
Debt and Capital Lease Principal Payments
During the year ended
December 31, 2018
, the Company made debt and capital lease principal payments of
$1.9 billion
.
Significant financing events in 2017 were as follows:
Share Repurchases
The Company used $1.8 billion of cash to purchase approximately
27.8 million
shares of its common stock during 2017, completing its July 2016 repurchase authorization. In December 2017, UAL's Board of Directors authorized a new $3.0 billion share repurchase program to acquire UAL's common stock. As of December 31, 2017, the Company had approximately $3.0 billion remaining to purchase shares under its share repurchase program.
Debt Issuances
During 2017, United received and recorded $1.8 billion of proceeds as debt related to enhanced equipment trust certificate ("EETC") offerings created in 2016 and 2017 to finance the purchase of aircraft.
In 2017, UAL issued, and United guaranteed, (i) $400 million aggregate principal amount of unsecured 4.25% Senior Notes due October 1, 2022, and (ii) $300 million aggregate principal amount of unsecured 5% Senior Notes due February 1, 2024.
In 2017, United and UAL, as borrower and guarantor, respectively, increased the term loan under the Credit Agreement by approximately $440 million.
During 2017, United borrowed approximately $497 million aggregate principal amount from various financial institutions to finance the purchase of several aircraft delivered in 2017.
Debt and Capital Lease Principal Payments
During the year ended December 31, 2017, the Company made debt and capital lease principal payments of $1.0 billion.
Significant financing events in 2016 were as follows:
Share Repurchases
The Company used $2.6 billion of cash to purchase
50.3 million
shares of its common stock during 2016 under its share repurchase programs.
31
Debt Issuances
In 2016, United completed two EETC offerings for a total principal amount of $2.0 billion. Of the $2.0 billion, United received and recorded $708 million of proceeds as debt as of December 31, 2016 to finance the purchase of 17 aircraft. In 2016, United borrowed approximately $369 million aggregate principal amount from various financial institutions to finance the purchase of several aircraft delivered in 2016.
Debt and Capital Lease Principal Payments
During the year ended December 31, 2016, the Company made debt and capital lease principal payments of $1.4 billion.
For additional information regarding these Liquidity and Capital Resource matters, see Notes 3, 10, 11 and 12
to the financial statements included in Part II, Item 8 of this report. For information regarding non-cash investing and financing activities, see the Company's statements of consolidated cash flows.
Credit Ratings.
As of the filing date of this report, UAL and United had the following corporate credit ratings:
|
S&P
|
Moody's
|
Fitch
|
|||
|
UAL
|
BB
|
Ba2
|
BB
|
||
|
United
|
BB
|
*
|
BB
|
||
|
*The credit agency does not issue corporate credit ratings for subsidiary entities.
|
|||||
These credit ratings are below investment grade levels. Downgrades from these rating levels, among other things, could restrict the availability, or increase the cost, of future financing for the Company.
Other Liquidity Matters
Below is a summary of additional liquidity matters. See the indicated notes to our consolidated financial statements included in Part II, Item 8 of this report for additional details related to these and other matters affecting our liquidity and commitments.
|
Pension and other postretirement plans
|
Note 8
|
|
Long-term debt and debt covenants
|
Note 10
|
|
Leases and capacity purchase agreements
|
Note 11
|
|
Commitments and contingencies
|
Note 13
|
Contractual Obligations.
The Company's business is capital intensive, requiring significant amounts of capital to fund the acquisition of assets, particularly aircraft. In the past, the Company has funded the acquisition of aircraft with cash, by using EETC financing, by entering into capital or operating leases, or through other financings. The Company also often enters into long-term lease commitments with airports to ensure access to terminal, cargo, maintenance and other required facilities.
The table below provides a summary of the Company's material contractual obligations as of
December 31, 2018
(in billions):
|
2019
|
2020
|
2021
|
2022
|
2023
|
After 2023
|
Total
|
||||||||||||||||||||||
|
Long-term debt (a)
|
$
|
1.2
|
|
$
|
1.3
|
|
$
|
1.3
|
|
$
|
1.7
|
|
$
|
0.7
|
|
$
|
7.4
|
|
$
|
13.6
|
|
|||||||
|
Capital lease obligations—principal portion
|
0.2
|
|
0.1
|
|
0.1
|
|
0.1
|
|
—
|
|
0.9
|
|
1.3
|
|
||||||||||||||
|
Total debt and capital lease obligations
|
1.4
|
|
1.4
|
|
1.4
|
|
1.8
|
|
0.7
|
|
8.3
|
|
14.9
|
|
||||||||||||||
|
Interest on debt and capital lease obligations (b)
|
0.7
|
|
0.6
|
|
0.5
|
|
0.4
|
|
0.4
|
|
1.1
|
|
3.6
|
|
||||||||||||||
|
Aircraft operating lease obligations
|
0.8
|
|
0.7
|
|
0.6
|
|
0.4
|
|
0.4
|
|
1.2
|
|
4.1
|
|
||||||||||||||
|
Regional CPAs (c)
|
2.2
|
|
2.0
|
|
1.8
|
|
1.4
|
|
0.8
|
|
3.1
|
|
11.3
|
|
||||||||||||||
|
Other operating lease obligations
|
1.3
|
|
1.4
|
|
1.1
|
|
1.0
|
|
1.0
|
|
7.0
|
|
12.8
|
|
||||||||||||||
|
Postretirement obligations (d)
|
0.1
|
|
0.1
|
|
0.1
|
|
0.1
|
|
0.1
|
|
0.5
|
|
1.0
|
|
||||||||||||||
|
Pension obligations (e)
|
—
|
|
—
|
|
—
|
|
0.3
|
|
0.2
|
|
0.5
|
|
1.0
|
|
||||||||||||||
|
Capital purchase obligations (f)
|
4.2
|
|
5.3
|
|
3.5
|
|
2.8
|
|
1.9
|
|
7.0
|
|
24.7
|
|
||||||||||||||
|
Total contractual obligations
|
$
|
10.7
|
|
$
|
11.5
|
|
$
|
9.0
|
|
$
|
8.2
|
|
$
|
5.5
|
|
$
|
28.7
|
|
$
|
73.4
|
|
|||||||
32
(a) Long-term debt presented in the Company's financial statements is net of
$191 million
of debt discount, premiums and debt issuance costs which are being amortized over the debt terms. Contractual payments do not include the debt discount, premiums and debt issuance costs.
(b) Includes interest portion of capital lease obligations of $124 million in
2019
, $104 million in
2020
, $80 million in
2021
, $63 million in
2022
, $57 million in
2023
and $410 million thereafter. Interest payments on variable interest rate debt were calculated using London interbank offered rates ("LIBOR") applicable at December 31, 2018.
(c) Represents our estimates of future minimum noncancelable commitments under our CPAs and does not include the portion of the underlying obligations for aircraft and facility rent that is disclosed as part of aircraft and nonaircraft operating leases. Amounts also exclude a portion of United's capital lease obligation recorded for certain of its CPAs. See Note 11 to the financial statements included in Part II, Item 8 of this report for the significant assumptions used to estimate the payments.
(d) Amounts represent postretirement benefit payments, net of subsidy receipts, through 2028. Benefit payments approximate plan contributions as plans are substantially unfunded.
(e) Represents an estimate of the minimum funding requirements as determined by government regulations for United's U.S. pension plans. Amounts are subject to change based on numerous assumptions, including the performance of assets in the plans and bond rates. See
Critical Accounting Policies
, below, for a discussion of our current year assumptions regarding United's pension plans.
(f) Represents contractual commitments for firm order aircraft, spare engines and other capital purchase commitments. See Note 13 to the financial statements included in Part II, Item 8 of this report for a discussion of our purchase commitments.
Off-Balance Sheet Arrangements.
An off-balance sheet arrangement is any transaction, agreement or other contractual arrangement involving an unconsolidated entity under which a company has (1) made guarantees, (2) a retained or a contingent interest in transferred assets, (3) an obligation under derivative instruments classified as equity, or (4) any obligation arising out of a material variable interest in an unconsolidated entity that provides financing, liquidity, market risk or credit risk support, or that engages in leasing, hedging or research and development arrangements. The Company's primary off-balance sheet arrangements include operating leases, which are summarized in the contractual obligations table under
Contractual Obligations,
above,
and certain municipal bond obligations, as discussed below.
As of December 31, 2018, United had cash collateralized
$73 million
of letters of credit, which generally have evergreen clauses and are expected to be renewed on an annual basis. As of December 31, 2018, United also had
$418 million
of surety bonds securing various obligations with expiration dates through
2022
.
As of
December 31, 2018
, United is the guarantor of approximately
$1.9 billion
in aggregate principal amount of tax-exempt special facilities revenue bonds and interest thereon. These bonds, issued by various airport municipalities, are payable solely from rentals paid under long-term agreements with the respective governing bodies. The leasing arrangements associated with a majority of these obligations are accounted for as operating leases. The leasing arrangements associated with a portion of these obligations are accounted for as capital leases. The annual lease payments for those obligations are included in the contractual obligations table under
Contractual Obligations,
above.
In connection with funding the Synergy Loan Agreement, the Company entered into an agreement with AVH's significant minority shareholder, Kingsland Holdings Limited ("Kingsland"), pursuant to which, in return for Kingsland's pledge of its 144.8 million shares of AVH common stock (equivalent to 18.1 million American Depositary Receipts ("ADRs")) and its consent to Synergy's pledge of its AVH common stock to United under the Synergy Loan Agreement, United (1) granted to Kingsland the right to put its shares of AVH common stock to United at market price on the fifth anniversary of the Synergy Loan Agreement, and (2) guaranteed Synergy's obligation to pay Kingsland (which amount, if paid by United, will increase United's secured loan to Synergy by such amount) if the market price of AVH common stock on the fifth anniversary is less than $12 per ADR on the NYSE, for an aggregate maximum possible combined put payment and guarantee amount on the fifth anniversary of $217.2 million. Accordingly, the Company recorded a liability of $31 million for the fair value of its guarantee to loan additional funds to Synergy if required. Any additional loans to Synergy would be collateralized by Synergy's shares of AVH stock and other collateral.
As of
December 31, 2018
, United is the guarantor of
$145 million
of aircraft mortgage debt issued by one of United's regional carriers. The aircraft mortgage debt is subject to increased cost provisions and the Company would potentially be responsible for those costs under the guarantees. The increased cost provisions in the
$145 million
of aircraft mortgage debt are similar to those in certain of the Company's debt agreements. See discussion under
Increased Cost Provisions,
below, for additional information on increased cost provisions related to the Company's debt.
EETCs.
As of
December 31, 2018
, United had
$8.8 billion
principal amount of equipment notes outstanding issued under EETC financings. Generally, the structure of these EETC financings consists of pass-through trusts created by United to issue pass-through certificates, which represent fractional undivided interests in the respective pass-through trusts and are not obligations of United. The proceeds of the issuance of the pass-through certificates are used to purchase equipment notes which
33
are issued by United and secured by its aircraft. The payment obligations under the equipment notes are those of United. Proceeds received from the sale of pass-through certificates are initially held by a depositary in escrow for the benefit of the certificate holders until United issues equipment notes to the trust, which purchases such notes with a portion of the escrowed funds. These escrowed funds are not guaranteed by United and are not reported as debt on United's consolidated balance sheet because the proceeds held by the depositary are not United's assets. In February 2019, United completed a $1.0 billion EETC offering to finance certain 2018 and 2019 aircraft deliveries. See Note 10 to the financial statements included in Part II, Item 8 of this report for additional information.
Increased Cost Provisions.
In United's financing transactions that include loans, United typically agrees to reimburse lenders for any reduced returns with respect to the loans due to any change in capital requirements and, in the case of loans in which the interest rate is based on LIBOR, for certain other increased costs that the lenders incur in carrying these loans as a result of any change in law, subject, in most cases, to obligations of the lenders to take certain limited steps to mitigate the requirement for, or the amount of, such increased costs. At December 31, 2018, the Company had
$3.5 billion
of floating rate debt and
$27 million
of fixed rate debt, with remaining terms of up to 12 years, that are subject to these increased cost provisions. In several financing transactions involving loans or leases from non-U.S. entities, with remaining terms of up to
12 years
and an aggregate balance of
$3.2 billion
, the Company bears the risk of any change in tax laws that would subject loan or lease payments thereunder to non-U.S. entities to withholding taxes, subject to customary exclusions.
Fuel Consortia.
United participates in numerous fuel consortia with other air carriers at major airports to reduce the costs of fuel distribution and storage. Interline agreements govern the rights and responsibilities of the consortia members and provide for the allocation of the overall costs to operate the consortia based on usage. The consortia (and in limited cases, the participating carriers) have entered into long-term agreements to lease certain airport fuel storage and distribution facilities that are typically financed through tax-exempt bonds, either special facilities lease revenue bonds or general airport revenue bonds, issued by various local municipalities. In general, each consortium lease agreement requires the consortium to make lease payments in amounts sufficient to pay the maturing principal and interest payments on the bonds. As of December 31, 2018, approximately
$1.7 billion
principal amount of such bonds were secured by significant fuel facility leases in which United participates, as to which United and each of the signatory airlines has provided indirect guarantees of the debt. As of December 31, 2018, the Company's contingent exposure was approximately
$164 million
principal amount of such bonds based on its recent consortia participation. The Company's contingent exposure could increase if the participation of other air carriers decreases. The guarantees will expire when the tax-exempt bonds are paid in full, which ranges from
2022
to
2051
. The Company did not record a liability at the time these indirect guarantees were made.
Critical Accounting Policies
Critical accounting policies are defined as those that are affected by significant judgments and uncertainties which potentially could result in materially different accounting under different assumptions and conditions. The Company has prepared the financial statements in conformity with accounting principles generally accepted in the United States of America ("GAAP"), which requires management to make estimates and assumptions that affect the reported amounts in the financial statements. Actual results could differ from those estimates under different assumptions or conditions. The Company has identified the following critical accounting policies that impact the preparation of the financial statements.
Frequent Flyer Accounting.
United's MileagePlus loyalty program builds customer loyalty by offering awards, benefits and services to program participants. Members in this program earn miles for travel on United, United Express, Star Alliance members and certain other airlines that participate in the program. Members can also earn miles by purchasing the goods and services of our network of non-airline partners. We have contracts to sell miles to these partners with the terms extending from one to eight years. These partners include domestic and international credit card issuers, retail merchants, hotels, car rental companies and our participating airline partners. Miles can be redeemed for free (other than taxes and government imposed fees), discounted or upgraded air travel and non-travel awards. Miles expire after 18 months of member account inactivity.
Miles Earned in Conjunction with Travel.
When frequent flyers earn miles for flights, the Company recognizes a portion of the ticket sales as revenue when the travel occurs and defers a portion of the ticket sale representing the value of the related miles as a separate performance obligation. The Company determines the estimated selling price of travel and miles as if each element is sold on a separate basis. The total consideration from each ticket sale is then allocated to each of these elements, individually, on a pro-rata basis. At the time of travel, the Company records the portion allocated to the miles to Frequent flyer deferred revenue on the Company's consolidated balance sheet and subsequently recognizes it into revenue when miles are redeemed for air travel and non-air travel awards.
The Company's estimated selling price of miles is based on an equivalent ticket value less breakage, which incorporates the expected redemption of miles, as the best estimate of selling price for these miles. The equivalent ticket value is based on the prior 12 months' weighted average equivalent ticket value of similar fares as those used to settle award redemptions while
34
taking into consideration such factors as redemption pattern, cabin class, loyalty status and geographic region. The estimated selling price of miles is adjusted by breakage that considers a number of factors, including redemption patterns of various customer groups. The Company reviews its breakage estimates annually based upon the latest available information regarding redemption and expiration patterns. The Company's estimate of the expected expiration of miles requires significant management judgment. Current and future changes to expiration assumptions or to the expiration policy, or to program rules and program redemption opportunities, may result in material changes to the deferred revenue balance as well as recognized revenues from the program. For the portion of the outstanding miles that we estimate will not be redeemed, we recognize the associated value proportionally as the remaining miles are redeemed.
Co-Brand Agreement
. United has a significant contract (the "Co-Brand Agreement") to sell MileagePlus miles to its co-branded credit card partner Chase Bank USA, N.A. ("Chase"). Chase awards miles to MileagePlus members based on their credit card activity. United identified the following significant separately identifiable performance obligations in the Co-Brand Agreement:
|
•
|
MileagePlus miles awarded – United has a performance obligation to provide MileagePlus cardholders with miles to be used for air travel and non-travel award redemptions. The Company records Passenger revenue related to the travel awards when the transportation is provided and records Other revenue related to the non-travel awards when the goods or services are delivered. The Company records the cost associated with non-travel awards in Other operating revenue.
|
|
•
|
Marketing – United has a performance obligation to provide Chase access to its customer list and the use of its brand. Marketing revenue is recorded to Other operating revenue as miles are delivered to Chase.
|
|
•
|
Advertising – United has a performance obligation to provide advertising in support of the MileagePlus card in various customer contact points such as United's website, email promotions, direct mail campaigns, airport advertising and in-flight advertising. Advertising revenue is recorded to Other operating revenue as miles are delivered to Chase.
|
|
•
|
Other travel-related benefits – United's performance obligations are comprised of various items such as waived bag fees, seat upgrades and lounge passes. Lounge passes are recorded to Other operating revenue as customers use the lounge passes. Bag fees and seat upgrades are recorded to Passenger revenue at the time of the associated travel.
|
We account for all the payments received (including monthly and one-time payments) under the Co-Brand Agreement by allocating them to the separately identifiable performance obligations. The fair value of the separately identifiable performance obligations is determined using management's estimated selling price of each component. The objective of using the estimated selling price based methodology is to determine the price at which we would transact a sale if the product or service were sold on a stand-alone basis. Accordingly, we determine our best estimate of selling price by considering multiple inputs and methods including, but not limited to, discounted cash flows, brand value, volume discounts, published selling prices, number of miles awarded and number of miles redeemed. The Company estimated the selling prices and volumes over the term of the Co-Brand Agreement in order to determine the allocation of proceeds to each of the components to be delivered. We also evaluate volumes on an annual basis, which may result in a change in the allocation of the estimated consideration from the Co-Brand Agreement on a prospective basis.
Frequent flyer deferred revenue.
Miles in MileagePlus members' accounts are combined into one homogeneous pool and are thus not separately identifiable, for award redemption purposes, between miles earned in the current period and those in their beginning balance. Of the miles expected to be redeemed, the Company expects the majority of these miles to be redeemed within two years.
The following table summarizes information related to the Company's Frequent flyer deferred revenue liability:
|
Frequent flyer deferred revenue at December 31, 2018 (in millions)
|
$
|
5,005
|
|
|
|
Percentage of miles earned expected to expire
|
14.5
|
%
|
||
|
Impact of 1% change in outstanding miles expected to be redeemed or weighted average ticket value on deferred revenue (in millions)
|
$
|
50
|
|
|
Revenue Recognition.
The Company presents Passenger revenue, Cargo revenue and Other operating revenue on its income statement. Passenger revenue is recognized when transportation is provided and Cargo revenue is recognized when shipments arrive at their destination. Other operating revenue is recognized as the related performance obligations are satisfied.
Passenger tickets and related ancillary services sold by the Company for mainline and regional flights are purchased primarily via credit card transactions, with payments collected by the Company in advance of the performance of related services. The Company initially records ticket sales in its Advance ticket sales liability, deferring revenue recognition until the travel occurs. For travel that has more than one flight segment, the Company deems each segment as a separate performance obligation and recognizes revenue for each segment as travel occurs. Tickets sold by other airlines where the Company provides the
35
transportation are recognized as passenger revenue at the estimated value to be billed to the other airline when travel is provided. Differences between amounts billed and the actual amounts may be rejected and rebilled or written off if the amount recorded was different from the original estimate. When necessary, the Company records a reserve against its billings and payables with other airlines based on historical experience.
The Company sells certain tickets with connecting flights with one or more segments operated by its other airline partners. For segments operated by its other airline partners, the Company has determined that it is acting as an agent on behalf of the other airlines as they are responsible for their portion of the contract (i.e. transportation of the passenger). The Company, as the agent, recognizes revenue within Other operating revenue at the time of the travel for the net amount representing commission to be retained by the Company for any segments flown by other airlines.
Refundable tickets expire after one year from the date of issuance. Non-refundable tickets generally expire on the date of the intended travel, unless the date is extended by notification from the customer on or before the intended travel date.
The Company records breakage revenue on the travel date for its estimate of tickets that will expire unused. To determine breakage, the Company uses its historical experience with refundable and nonrefundable expired tickets and other facts, such as recent aging trends, program changes and modifications that could affect the ultimate expiration patterns of tickets. Fees charged in association with changes or extensions to non-refundable tickets are considered part of the Company's passenger travel obligation. As such, those fees are deferred at the time of collection and recognized at the time the travel is provided.
United initially capitalizes the costs of selling airline travel tickets and then recognizes those costs as Distribution expense at the time of travel. Passenger ticket costs include credit card fees, travel agency and other commissions paid, as well as global distribution systems booking fees.
Long-Lived Assets.
The net book value of operating property and equipment for the Company was
$28 billion
and
$26 billion
at
December 31, 2018
and
2017
, respectively. The assets' recorded value is impacted by a number of accounting policy elections, including the estimation of useful lives and residual values and, when necessary, the recognition of asset impairment charges.
The Company records assets acquired, including aircraft, at acquisition cost. Depreciable life is determined through economic analysis, such as reviewing existing fleet plans, obtaining appraisals and comparing estimated lives to other airlines that operate similar fleets. The Company has generally estimated the lives of those aircraft to be between 25 and 30 years. Residual values are estimated based on historical experience with regard to the sale of both aircraft and spare parts and are established in conjunction with the estimated useful lives of the related fleets. Residual values are based on when the aircraft are acquired and typically reflect asset values that have not reached the end of their physical life. Both depreciable lives and residual values are revised periodically as facts and circumstances arise to recognize changes in the Company's fleet plan and other relevant information. A one-year increase in the average depreciable life of the Company's flight equipment would reduce annual depreciation expense on flight equipment by approximately $85 million.
The Company evaluates the carrying value of long-lived assets and intangible assets subject to amortization whenever events or changes in circumstances indicate that an impairment may exist. For purposes of this testing, the Company has generally identified the aircraft fleet type as the lowest level of identifiable cash flows for purposes of testing aircraft for impairment.
An impairment charge is recognized when the asset's carrying value exceeds its net undiscounted future cash flows and its fair market value. The amount of the charge is the difference between the asset's carrying value and fair market value.
See Note 14 to the financial statements included in Part II, Item 8 of this report for additional information.
Indefinite-lived intangible assets.
The Company has indefinite-lived intangible assets, including goodwill. Goodwill and indefinite-lived intangible assets are not amortized but are reviewed for impairment on an annual basis as of October 1, or on an interim basis whenever a triggering event occurs. An impairment occurs when the fair value of an intangible asset is less than its carrying value.
See Note 2 to the financial statements included in Part II, Item 8 of this report for additional information.
Defined Benefit Plan Accounting.
We sponsor defined benefit pension plans for eligible employees and retirees. The most critical assumptions impacting our defined benefit pension plan obligations and expenses are the weighted average discount rate and the expected long-term rate of return on the plan assets.
United's pension plans' under-funded status was
$1.6 billion
at
December 31, 2018
. Funding requirements for tax-qualified defined benefit pension plans are determined by government regulations. In
2019
, we anticipate contributing at least $318 million to our pension plans. The fair value of the plans' assets was
$3.8 billion
at
December 31, 2018
.
36
When calculating pension expense for
2019
, the Company assumed that its plans' assets would generate a long-term rate of return of approximately
7.4%
. The expected long-term rate of return assumption was developed based on historical experience and input from the trustee managing the plans' assets.
The expected long-term rate of return on plan assets is based on a target allocation of assets, which is based on a goal of earning the highest rate of return while maintaining risk at acceptable levels. Our projected long-term rate of return reflects the active management of our plans' assets. The plans strive to have assets sufficiently diversified so that adverse or unexpected results from one security class will not have an unduly detrimental impact on the entire portfolio. Plan fiduciaries regularly review actual asset allocation and the pension plans' investments are periodically rebalanced to the targeted allocation when considered appropriate.
The defined benefit pension plans' assets consist of return generating investments and risk mitigating investments which are held through direct ownership or through interests in common collective trusts. Return generating investments include primarily equity securities, fixed-income securities and alternative investments (e.g. private equity and hedge funds). Risk mitigating investments include primarily U.S. government and investment grade corporate fixed-income securities. The allocation of assets was as follows at
December 31, 2018
:
|
|
Percent of Total
|
Expected Long-Term
Rate of Return
|
|||
|
Equity securities
|
36
|
%
|
9.5
|
%
|
|
|
Fixed-income securities
|
37
|
|
5.8
|
|
|
|
Alternatives
|
16
|
|
7.3
|
|
|
|
Other
|
11
|
|
7.8
|
|
|
Pension expense increases as the expected rate of return on plan assets decreases. Lowering the expected long-term rate of return on plan assets by 50 basis points (from
7.4%
to
6.9%
) would increase estimated
2019
pension expense by approximately
$20 million
. Future pension obligations for United's plans were discounted using a weighted average rate of
4.2%
at
December 31, 2018
. The Company selected the discount rate for substantially all of its plans by using a hypothetical portfolio of high quality bonds at
December 31, 2018
that would provide the necessary cash flows to match the projected benefit payments. The pension liability and future pension expense both increase as the discount rate is reduced. Lowering the discount rate by 50 basis points (from
4.2%
to
3.7%
) would increase the pension liability at
December 31, 2018
by approximately $585
million and increase the estimated
2019
pension expense by approximately $69 million. Future changes in plan asset returns, plan provisions, assumed discount rates, pension funding law and various other factors related to the participants in our pension plans will impact our future pension expense and liabilities. We cannot predict with certainty what these factors will be in the future.
Actuarial gains or losses are triggered by changes in assumptions or experience that differ from the original assumptions. Under the applicable accounting standards for defined benefit pension plans, those gains and losses are not required to be recognized currently as pension benefit expense, but instead may be deferred as part of accumulated other comprehensive income and amortized into expense over the average remaining service life of the covered active employees. All gains and losses in accumulated other comprehensive income are amortized to expense over the remaining years of service of the covered active employees. At
December 31, 2018
and
2017
, the Company had unrecognized actuarial losses for pension benefit plans of
$1.4 billion
and
$1.6 billion
, respectively, recorded in accumulated other comprehensive income.
Other Postretirement Benefit Plan Accounting.
United's postretirement plan provides certain health care benefits, primarily in the United States, to retirees and eligible dependents, as well as certain life insurance benefits to certain retirees reflected as "Other Benefits." United also has retiree medical programs that permit retirees who meet certain age and service requirements to continue medical coverage between retirement and Medicare eligibility. Eligible employees are required to pay a portion of the costs of their retiree medical benefits, which in some cases may be offset by accumulated unused sick time at the time of their retirement. Plan benefits are subject to co-payments, deductibles and other limits as described in the plans.
The Company accounts for other postretirement benefits by recognizing the difference between plan assets and obligations, or the plan's funded status, in its financial statements. Other postretirement benefit expense is recognized on an accrual basis over employees' approximate service periods and is generally calculated independently of funding decisions or requirements. United has not been required to pre-fund its plan obligations, which has resulted in a significant net obligation, as discussed below. The Company's benefit obligation was
$1.4 billion
and
$1.7 billion
for the other postretirement benefit plans at
December 31, 2018
and
2017
, respectively.
The calculation of other postretirement benefit expense and obligations requires the use of a number of assumptions, including the assumed discount rate for measuring future payment obligations and the health care cost trend rate. The Company determines the appropriate discount rate for each of the plans based on current rates on high quality corporate bonds that would generate the cash flow necessary to pay plan benefits when due. The Company's weighted average discount rate to determine its
37
benefit obligations as of
December 31, 2018
was
4.30%
, as compared to
3.63%
for
December 31, 2017
. The health care cost trend rate assumed for
2018
was
6.25%
, declining to
5.0%
in 2023, as compared to assumed trend rate for
2019
of
6.0%
, declining to
5.0%
in 2023. A 1% increase in assumed health care trend rates would increase the Company's total service and interest cost for the year ended
December 31, 2018
by $9 million; whereas, a 1% decrease in assumed health care trend rates would decrease the Company's total service and interest cost for the year ended
December 31, 2018
by $7 million. A one percentage point decrease in the weighted average discount rate would increase the Company's postretirement benefit liability by approximately
$139 million
and increase the estimated 2018 benefits expense by approximately
$10 million
.
Actuarial gains or losses are triggered by changes in assumptions or experience that differ from the original assumptions and prior service credits result from a retroactive reduction in benefits due under the plans. Under the applicable accounting standards for postretirement welfare benefit plans, actuarial gains and losses and prior service credits are not required to be recognized currently, but instead may be deferred as part of accumulated other comprehensive income and amortized into expense over the average remaining service life of the covered active employees or the average life expectancy of inactive participants. At
December 31, 2018
and
2017
, the Company had unrecognized actuarial gains for postretirement welfare benefit plans of
$554 million
and
$301 million
, respectively, recorded in accumulated other comprehensive income.
Forward-Looking Information
Certain statements throughout Part II, Item 7, Management's Discussion and Analysis of Financial Condition and Results of Operations, and elsewhere in this report are forward-looking and thus reflect the Company's current expectations and beliefs with respect to certain current and future events and anticipated financial and operating performance. Such forward-looking statements are and will be subject to many risks and uncertainties relating to the Company's operations and business environment that may cause actual results to differ materially from any future results expressed or implied in such forward-looking statements. Words such as "expects," "will," "plans," "anticipates," "indicates," "believes," "estimates," "forecast," "guidance," "outlook," "goals" and similar expressions are intended to identify forward-looking statements.
Additionally, forward-looking statements include statements that do not relate solely to historical facts, such as statements which identify uncertainties or trends, discuss the possible future effects of current known trends or uncertainties, or which indicate that the future effects of known trends or uncertainties cannot be predicted, guaranteed or assured. All forward-looking statements in this report are based upon information available to us on the date of this report. We undertake no obligation to publicly update or revise any forward-looking statement, whether as a result of new information, future events, changed circumstances or otherwise, except as required by applicable law.
Our actual results could differ materially from these forward-looking statements due to numerous factors including, without limitation, the following: our ability to execute our strategic operating plan, including our growth, revenue-generating and cost-control initiatives; general economic conditions (including interest rates, foreign currency exchange rates, investment or credit market conditions, crude oil prices, costs of aircraft fuel and energy refining capacity in relevant markets); risks of doing business globally, including instability and political developments that may impact our operations in certain countries; demand for travel and the impact that global economic and political conditions have on customer travel patterns; our capacity decisions and the capacity decisions of our competitors; competitive pressures on pricing and on demand; changes in aircraft fuel prices; disruptions in our supply of aircraft fuel; our ability to cost-effectively hedge against increases in the price of aircraft fuel, if we decide to do so; the effects of any technology failures or cybersecurity breaches; disruptions to services provided by third-party service providers; potential reputational or other impact from adverse events involving our aircraft or operations, the aircraft or operations of our regional carriers or our code share partners or the aircraft or operations of another airline; our ability to attract and retain customers; the effects of any terrorist attacks, international hostilities or other security events, or the fear of such events; disruptions to our regional network; the impact of regulatory, investigative and legal proceedings and legal compliance risks; the success of our investments in other airlines, including in other parts of the world; industry consolidation or changes in airline alliances; the ability of other air carriers with whom we have alliances or partnerships to provide the services contemplated by the respective arrangements with such carriers; costs associated with any modification or termination of our aircraft orders; disruptions in the availability of aircraft, parts or support from our suppliers; our ability to maintain satisfactory labor relations and the results of any collective bargaining agreement process with our union groups; any disruptions to operations due to any potential actions by our labor groups; labor costs; an outbreak of a disease that affects travel demand or travel behavior; the impact of any management changes; extended interruptions or disruptions in service at major airports where we operate; U.S. or foreign governmental legislation, regulation and other actions (including Open Skies agreements, environmental regulations and the United Kingdom's withdrawal from the European Union); the seasonality of the airline industry; weather conditions; the costs and availability of aviation and other insurance; the costs and availability of financing; our ability to maintain adequate liquidity; our ability to comply with the terms of our various financing arrangements; our ability to realize the full value of our intangible assets and long-lived assets; and other risks and uncertainties set forth under Part I, Item 1A., Risk Factors, of this report, as well as other risks and uncertainties set forth from time to time in the reports we file with the SEC.
38
|
ITEM 7A.
|
QUANTITATIVE AND QUALITATIVE DISCLOSURES ABOUT MARKET RISK.
|
Interest Rates.
Our net income is affected by fluctuations in interest rates (e.g. interest expense on variable rate debt and interest income earned on short-term investments). The Company's policy is to manage interest rate risk through a combination of fixed and variable rate debt. The following table summarizes information related to the Company's interest rate market risk at December 31 (in millions):
|
2018
|
2017
|
||||||
|
Variable rate debt
|
|||||||
|
Carrying value of variable rate debt at December 31
|
$
|
3,500
|
|
$
|
3,342
|
|
|
|
Impact of 100 basis point increase on projected interest expense for the following year
|
35
|
|
33
|
|
|||
|
Fixed rate debt
|
|||||||
|
Carrying value of fixed rate debt at December 31
|
9,945
|
|
9,926
|
|
|||
|
Fair value of fixed rate debt at December 31
|
9,901
|
|
10,349
|
|
|||
|
Impact of 100 basis point increase in market rates on fair value
|
(378
|
)
|
(403
|
)
|
|||
A change in market interest rates would also impact interest income earned on our cash, cash equivalents and short-term investments. Assuming our cash, cash equivalents and short-term investments remain at their average
2018
levels, a 100 basis point increase in interest rates would result in a corresponding increase in the Company's interest income of approximately $45 million during 2019.
Commodity Price Risk (Aircraft Fuel).
The price level of aircraft fuel can significantly affect the Company's operations, results of operations, financial position and liquidity.
Our operational and financial results can be significantly impacted by changes in the price and availability of aircraft fuel. To provide adequate supplies of fuel, the Company routinely enters into purchase contracts that are customarily indexed to market prices for aircraft fuel, and the Company generally has some ability to cover short-term fuel supply and infrastructure disruptions at some major demand locations. The Company's current strategy is to not enter into transactions to hedge fuel price volatility, although the Company regularly reviews its policy based on market conditions and other factors. The Company's
2019
forecasted fuel consumption is presently approximately 4.3 billion gallons, and based on this forecast, a one-dollar change in the price of a barrel of crude oil would change the Company's annual fuel expense by approximately $
104 million
.
Foreign Currency.
The Company generates revenues and incurs expenses in numerous foreign currencies. Changes in foreign currency exchange rates impact the Company's results of operations through changes in the dollar value of foreign currency-denominated operating revenues and expenses. Some of the Company's more significant foreign currency exposures include the Canadian dollar, Chinese renminbi, European euro, British pound and Japanese yen. The Company's current strategy is to not enter into transactions to hedge its foreign currency sales, although the Company regularly reviews its policy based on market conditions and other factors.
The result of a uniform 1% strengthening in the value of the U.S. dollar from
December 31, 2018
levels relative to each of the currencies in which the Company has foreign currency exposure would result in a decrease in pre-tax income of approximately $24 million for the year ending December 31,
2019
. This sensitivity analysis was prepared based upon projected
2019
foreign currency-denominated revenues and expenses as of
December 31, 2018
.
39
ITEM 8. FINANCIAL STATEMENTS AND SUPPLEMENTARY DATA.
REPORT OF INDEPENDENT REGISTERED PUBLIC ACCOUNTING FIRM
To the Stockholders and the Board of Directors of United Continental Holdings, Inc.
Opinion on the Financial Statements
We have audited the accompanying consolidated balance sheets of United Continental Holdings, Inc. (the "Company") as of
December 31, 2018
and
2017
, the related statements of consolidated operations, comprehensive income (loss), cash flows, and stockholders' equity for each of the three years in the period ended
December 31, 2018
, and the related notes and financial statement schedule listed in the Index at Item 15(a) (collectively referred to as the "consolidated financial statements"). In our opinion, the consolidated financial statements present fairly, in all material respects, the financial position of the Company at
December 31, 2018
and
2017
, and the results of its operations and its cash flows for each of the three years in the period ended
December 31, 2018
, in conformity with U.S. generally accepted accounting principles.
We also have audited, in accordance with the standards of the Public Company Accounting Oversight Board (United States) (PCAOB), the Company's internal control over financial reporting as of
December 31, 2018
, based on criteria established in Internal Control-Integrated Framework issued by the Committee of Sponsoring Organizations of the Treadway Commission (2013 framework) and our report dated
February 28, 2019
, expressed an unqualified opinion thereon.
Adoption of ASU No. 2014-09
As discussed in Note 1 to the consolidated financial statements, the Company changed its method of accounting for revenue in 2018, 2017 and 2016 due to the adoption of ASU No. 2014-09,
Revenue from Contracts with Customers (Topic 606).
Basis for Opinion
These financial statements are the responsibility of the Company's management. Our responsibility is to express an opinion on the Company's financial statements based on our audits. We are a public accounting firm registered with the PCAOB and are required to be independent with respect to the Company in accordance with the U.S. federal securities laws and the applicable rules and regulations of the Securities and Exchange Commission and the PCAOB.
We conducted our audits in accordance with the standards of the PCAOB. Those standards require that we plan and perform the audit to obtain reasonable assurance about whether the financial statements are free of material misstatement, whether due to error or fraud. Our audits included performing procedures to assess the risks of material misstatement of the financial statements, whether due to error or fraud, and performing procedures that respond to those risks. Such procedures included examining, on a test basis, evidence regarding the amounts and disclosures in the financial statements. Our audits also included evaluating the accounting principles used and significant estimates made by management, as well as evaluating the overall presentation of the financial statements. We believe that our audits provide a reasonable basis for our opinion.
/s/ Ernst & Young LLP
We have served as the Company's auditor since 2009.
Chicago, Illinois
February 28, 2019
40
REPORT OF INDEPENDENT REGISTERED PUBLIC ACCOUNTING FIRM
To the Stockholder and the Board of Directors of United Airlines, Inc.
Opinion on the Financial Statements
We have audited the accompanying consolidated balance sheets of United Airlines, Inc. (the "Company") as of
December 31, 2018
and
2017
, and the related statements of consolidated operations, comprehensive income (loss), cash flows, and stockholder's equity, for each of the three years in the period ended
December 31, 2018
, and the related notes and financial statement schedule listed in the Index at Item 15(a) (collectively referred to as the "consolidated financial statements"). In our opinion, the consolidated financial statements present fairly, in all material respects, the financial position of the Company at
December 31, 2018
and
2017
, and the results of its operations and its cash flows for each of the three years in the period ended
December 31, 2018
, in conformity with U.S. generally accepted accounting principles.
Adoption of ASU No. 2014-09
As discussed in Note 1 to the consolidated financial statements, the Company changed its method of accounting for revenue in 2018, 2017 and 2016 due to the adoption of ASU No. 2014-09,
Revenue from Contracts with Customers (Topic 606).
Basis for Opinion
These financial statements are the responsibility of the Company's management. Our responsibility is to express an opinion on the Company's financial statements based on our audits. We are a public accounting firm registered with the Public Company Accounting Oversight Board (United States) (PCAOB) and are required to be independent with respect to the Company in accordance with the U.S. federal securities laws and the applicable rules and regulations of the Securities and Exchange Commission and the PCAOB.
We conducted our audits in accordance with the standards of the PCAOB. Those standards require that we plan and perform the audit to obtain reasonable assurance about whether the financial statements are free of material misstatement, whether due to error or fraud. The Company is not required to have, nor were we engaged to perform an audit of the Company's internal control over financial reporting. As part of our audits we are required to obtain an understanding of internal control over financial reporting but not for the purpose of expressing an opinion on the effectiveness of the Company's internal control over financial reporting. Accordingly, we express no such opinion.
Our audits included performing procedures to assess the risks of material misstatement of the financial statements, whether due to error or fraud, and performing procedures that respond to those risks. Such procedures included examining, on a test basis, evidence regarding the amounts and disclosures in the financial statements. Our audits also included evaluating the accounting principles used and significant estimates made by management, as well as evaluating the overall presentation of the financial statements. We believe that our audits provide a reasonable basis for our opinion.
/s/ Ernst & Young LLP
We have served as the Company's auditor since 2009.
Chicago, Illinois
February 28, 2019
41
UNITED CONTINENTAL HOLDINGS, INC.
STATEMENTS OF CONSOLIDATED OPERATIONS
(In millions, except per share amounts)
|
|
Year Ended December 31,
|
||||||||||
|
|
2018
|
2017 (a)
|
2016 (a)
|
||||||||
|
Operating revenue:
|
|||||||||||
|
Passenger revenue
|
$
|
37,706
|
|
$
|
34,460
|
|
$
|
33,429
|
|
||
|
Cargo
|
1,237
|
|
1,114
|
|
934
|
|
|||||
|
Other operating revenue
|
2,360
|
|
2,210
|
|
2,195
|
|
|||||
|
Total operating revenue
|
41,303
|
|
37,784
|
|
36,558
|
|
|||||
|
Operating expense:
|
|||||||||||
|
Salaries and related costs
|
11,458
|
|
10,941
|
|
10,176
|
|
|||||
|
Aircraft fuel
|
9,307
|
|
6,913
|
|
5,813
|
|
|||||
|
Regional capacity purchase
|
2,601
|
|
2,232
|
|
2,197
|
|
|||||
|
Landing fees and other rent
|
2,359
|
|
2,240
|
|
2,165
|
|
|||||
|
Depreciation and amortization
|
2,240
|
|
2,149
|
|
1,977
|
|
|||||
|
Aircraft maintenance materials and outside repairs
|
1,767
|
|
1,856
|
|
1,749
|
|
|||||
|
Distribution expenses
|
1,558
|
|
1,435
|
|
1,395
|
|
|||||
|
Aircraft rent
|
433
|
|
621
|
|
680
|
|
|||||
|
Special charges
|
487
|
|
176
|
|
745
|
|
|||||
|
Other operating expenses
|
5,801
|
|
5,550
|
|
5,317
|
|
|||||
|
Total operating expense
|
38,011
|
|
34,113
|
|
32,214
|
|
|||||
|
Operating income
|
3,292
|
|
3,671
|
|
4,344
|
|
|||||
|
Nonoperating income (expense):
|
|||||||||||
|
Interest expense
|
(729
|
)
|
(671
|
)
|
(674
|
)
|
|||||
|
Interest capitalized
|
70
|
|
84
|
|
72
|
|
|||||
|
Interest income
|
101
|
|
57
|
|
42
|
|
|||||
|
Miscellaneous, net
|
(76
|
)
|
(101
|
)
|
(11
|
)
|
|||||
|
Total nonoperating expense, net
|
(634
|
)
|
(631
|
)
|
(571
|
)
|
|||||
|
Income before income taxes
|
2,658
|
|
3,040
|
|
3,773
|
|
|||||
|
Income tax expense
|
529
|
|
896
|
|
1,539
|
|
|||||
|
Net income
|
$
|
2,129
|
|
$
|
2,144
|
|
$
|
2,234
|
|
||
|
Earnings per share, basic
|
$
|
7.73
|
|
$
|
7.08
|
|
$
|
6.77
|
|
||
|
Earnings per share, diluted
|
$
|
7.70
|
|
$
|
7.06
|
|
$
|
6.76
|
|
||
(a) Amounts adjusted due to the adoption of Accounting Standards Update No. 2014-09,
Revenue from Contracts with Customers (Topic 606)
and
Accounting Standards Update No. 2017-07,
Improving the Presentation of Net Periodic Pension Cost and Net Periodic Postretirement Benefit Cost.
See Note 1 to the financial statements contained in Part II, Item 8 of this report for additional information.
The accompanying Combined Notes to Consolidated Financial Statements are an integral part of these statements.
42
UNITED CONTINENTAL HOLDINGS, INC.
STATEMENTS OF CONSOLIDATED COMPREHENSIVE INCOME (LOSS)
(In millions)
|
|
Year Ended December 31,
|
||||||||||
|
|
2018
|
2017 (a)
|
2016 (a)
|
||||||||
|
Net income
|
$
|
2,129
|
|
$
|
2,144
|
|
$
|
2,234
|
|
||
|
Other comprehensive income (loss), net change related to:
|
|||||||||||
|
Employee benefit plans, net of taxes
|
342
|
|
(195
|
)
|
(313
|
)
|
|||||
|
Fuel derivative financial instruments, net of taxes
|
—
|
|
1
|
|
316
|
|
|||||
|
Investments and other, net of taxes
|
(4
|
)
|
(6
|
)
|
(1
|
)
|
|||||
|
Total other comprehensive income (loss), net
|
338
|
|
(200
|
)
|
2
|
|
|||||
|
Total comprehensive income, net
|
$
|
2,467
|
|
$
|
1,944
|
|
$
|
2,236
|
|
||
(a) Amounts adjusted due to the adoption of Accounting Standards Update No. 2014-09,
Revenue from Contracts with Customers (Topic 606).
See Note 1 to the financial statements contained in Part II, Item 8 of this report for additional information.
The accompanying Combined Notes to Consolidated Financial Statements are an integral part of these statements.
43
UNITED CONTINENTAL HOLDINGS, INC.
CONSOLIDATED BALANCE SHEETS
(In millions, except shares)
|
|
At December 31,
|
||||||
|
ASSETS
|
2018
|
2017 (a)
|
|||||
|
Current assets:
|
|||||||
|
Cash and cash equivalents
|
$
|
1,694
|
|
$
|
1,482
|
|
|
|
Short-term investments
|
2,256
|
|
2,316
|
|
|||
|
Receivables, less allowance for doubtful accounts (2018—$8; 2017—$7)
|
1,346
|
|
1,340
|
|
|||
|
Aircraft fuel, spare parts and supplies, less obsolescence allowance (2018—$412; 2017—$354)
|
985
|
|
924
|
|
|||
|
Prepaid expenses and other
|
913
|
|
1,071
|
|
|||
|
Total current assets
|
7,194
|
|
7,133
|
|
|||
|
Operating property and equipment:
|
|||||||
|
Owned—
|
|||||||
|
Flight equipment
|
31,607
|
|
28,692
|
|
|||
|
Other property and equipment
|
7,919
|
|
6,946
|
|
|||
|
Total owned property and equipment
|
39,526
|
|
35,638
|
|
|||
|
Less—Accumulated depreciation and amortization
|
(12,760
|
)
|
(11,159
|
)
|
|||
|
Total owned property and equipment, net
|
26,766
|
|
24,479
|
|
|||
|
Purchase deposits for flight equipment
|
1,177
|
|
1,344
|
|
|||
|
Capital leases—
|
|||||||
|
Flight equipment
|
1,029
|
|
1,151
|
|
|||
|
Other property and equipment
|
11
|
|
11
|
|
|||
|
Total capital leases
|
1,040
|
|
1,162
|
|
|||
|
Less—Accumulated amortization
|
(654
|
)
|
(777
|
)
|
|||
|
Total capital leases, net
|
386
|
|
385
|
|
|||
|
Total operating property and equipment, net
|
28,329
|
|
26,208
|
|
|||
|
Other assets:
|
|||||||
|
Goodwill
|
4,523
|
|
4,523
|
|
|||
|
Intangibles, less accumulated amortization (2018—$1,380; 2017—$1,313)
|
3,159
|
|
3,539
|
|
|||
|
Restricted cash
|
105
|
|
91
|
|
|||
|
Notes receivable, net
|
516
|
|
46
|
|
|||
|
Investments in affiliates and other, net
|
966
|
|
806
|
|
|||
|
Total other assets
|
9,269
|
|
9,005
|
|
|||
|
Total assets
|
$
|
44,792
|
|
$
|
42,346
|
|
|
(continued on next page)
44
UNITED CONTINENTAL HOLDINGS, INC.
CONSOLIDATED BALANCE SHEETS
(In millions, except shares)
|
|
At December 31,
|
||||||
|
LIABILITIES AND STOCKHOLDERS' EQUITY
|
2018
|
2017 (a)
|
|||||
|
Current liabilities:
|
|||||||
|
Advance ticket sales
|
$
|
4,381
|
|
$
|
3,940
|
|
|
|
Frequent flyer deferred revenue
|
2,286
|
|
2,192
|
|
|||
|
Accounts payable
|
2,363
|
|
2,196
|
|
|||
|
Accrued salaries and benefits
|
2,184
|
|
2,166
|
|
|||
|
Current maturities of long-term debt
|
1,230
|
|
1,565
|
|
|||
|
Current maturities of capital leases
|
149
|
|
128
|
|
|||
|
Other
|
619
|
|
576
|
|
|||
|
Total current liabilities
|
13,212
|
|
12,763
|
|
|||
|
Long-term debt
|
12,215
|
|
11,703
|
|
|||
|
Long-term obligations under capital leases
|
1,134
|
|
996
|
|
|||
|
Other liabilities and deferred credits:
|
|||||||
|
Frequent flyer deferred revenue
|
2,719
|
|
2,591
|
|
|||
|
Postretirement benefit liability
|
1,295
|
|
1,602
|
|
|||
|
Pension liability
|
1,576
|
|
1,921
|
|
|||
|
Deferred income taxes
|
814
|
|
204
|
|
|||
|
Other
|
1,832
|
|
1,832
|
|
|||
|
Total other liabilities and deferred credits
|
8,236
|
|
8,150
|
|
|||
|
Commitments and contingencies
|
|
|
|||||
|
Stockholders' equity:
|
|||||||
|
Preferred stock
|
—
|
|
—
|
|
|||
|
Common stock at par, $0.01 par value; authorized 1,000,000,000 shares; outstanding 269,914,769 and 286,973,195 shares at December 31, 2018 and 2017, respectively
|
3
|
|
3
|
|
|||
|
Additional capital invested
|
6,120
|
|
6,098
|
|
|||
|
Retained earnings
|
6,668
|
|
4,549
|
|
|||
|
Stock held in treasury, at cost
|
(1,993
|
)
|
(769
|
)
|
|||
|
Accumulated other comprehensive loss
|
(803
|
)
|
(1,147
|
)
|
|||
|
Total stockholders' equity
|
9,995
|
|
8,734
|
|
|||
|
Total liabilities and stockholders' equity
|
$
|
44,792
|
|
$
|
42,346
|
|
|
(a) Amounts adjusted due to the adoption of Accounting Standards Update No. 2014-09,
Revenue from Contracts with Customers (Topic 606).
See Note 1 to the financial statements contained in Part II, Item 8 of this report for additional information.
The accompanying Combined Notes to Consolidated Financial Statements are an integral part of these statements.
45
UNITED CONTINENTAL HOLDINGS, INC.
STATEMENTS OF CONSOLIDATED CASH FLOWS
(In millions)
|
|
Year Ended December 31,
|
||||||||||
|
|
2018
|
2017 (a)
|
2016 (a)
|
||||||||
|
Operating Activities:
|
|||||||||||
|
Net income
|
$
|
2,129
|
|
$
|
2,144
|
|
$
|
2,234
|
|
||
|
Adjustments to reconcile net income to net cash provided by operating activities -
|
|||||||||||
|
Deferred income taxes
|
515
|
|
973
|
|
1,631
|
|
|||||
|
Depreciation and amortization
|
2,240
|
|
2,149
|
|
1,977
|
|
|||||
|
Special charges, non-cash portion
|
416
|
|
35
|
|
391
|
|
|||||
|
Other operating activities
|
170
|
|
141
|
|
109
|
|
|||||
|
Changes in operating assets and liabilities -
|
|||||||||||
|
Increase in receivables
|
(29
|
)
|
(183
|
)
|
(16
|
)
|
|||||
|
(Increase) decrease in other assets
|
29
|
|
(533
|
)
|
(296
|
)
|
|||||
|
Increase (decrease) in advance ticket sales
|
441
|
|
145
|
|
(28
|
)
|
|||||
|
Increase (decrease) in frequent flyer deferred revenue
|
222
|
|
(107
|
)
|
(55
|
)
|
|||||
|
Increase in accounts payable
|
130
|
|
66
|
|
239
|
|
|||||
|
Decrease in advanced purchase of miles
|
—
|
|
(942
|
)
|
(206
|
)
|
|||||
|
Decrease in other liabilities
|
(82
|
)
|
(475
|
)
|
(438
|
)
|
|||||
|
Net cash provided by operating activities
|
6,181
|
|
3,413
|
|
5,542
|
|
|||||
|
Investing Activities:
|
|||||||||||
|
Capital expenditures
|
(4,177
|
)
|
(3,998
|
)
|
(3,223
|
)
|
|||||
|
Purchases of short-term and other investments
|
(2,552
|
)
|
(3,241
|
)
|
(2,768
|
)
|
|||||
|
Proceeds from sale of short-term and other investments
|
2,616
|
|
3,177
|
|
2,712
|
|
|||||
|
Loans made to others
|
(466
|
)
|
(30
|
)
|
(56
|
)
|
|||||
|
Investment in affiliates
|
(139
|
)
|
(2
|
)
|
(14
|
)
|
|||||
|
Other, net
|
155
|
|
164
|
|
111
|
|
|||||
|
Net cash used in investing activities
|
(4,563
|
)
|
(3,930
|
)
|
(3,238
|
)
|
|||||
|
Financing Activities:
|
|||||||||||
|
Proceeds from issuance of long-term debt and airport construction financing
|
1,740
|
|
2,765
|
|
808
|
|
|||||
|
Payments of long-term debt
|
(1,727
|
)
|
(901
|
)
|
(1,215
|
)
|
|||||
|
Repurchases of common stock
|
(1,235
|
)
|
(1,844
|
)
|
(2,614
|
)
|
|||||
|
Principal payments under capital leases
|
(134
|
)
|
(124
|
)
|
(136
|
)
|
|||||
|
Capitalized financing costs
|
(37
|
)
|
(80
|
)
|
(64
|
)
|
|||||
|
Other, net
|
(17
|
)
|
(11
|
)
|
8
|
|
|||||
|
Net cash used in financing activities
|
(1,410
|
)
|
(195
|
)
|
(3,213
|
)
|
|||||
|
Net increase (decrease) in cash, cash equivalents and restricted cash
|
208
|
|
(712
|
)
|
(909
|
)
|
|||||
|
Cash, cash equivalents and restricted cash at beginning of year
|
1,591
|
|
2,303
|
|
3,212
|
|
|||||
|
Cash, cash equivalents and restricted cash at end of year
|
$
|
1,799
|
|
$
|
1,591
|
|
$
|
2,303
|
|
||
|
Investing and Financing Activities Not Affecting Cash:
|
|||||||||||
|
Property and equipment acquired through the issuance of debt and capital leases
|
$
|
174
|
|
$
|
935
|
|
$
|
386
|
|
||
|
Debt associated with termination of a maintenance service agreement
|
163
|
|
—
|
|
—
|
|
|||||
|
Investment in Republic Airways Holdings, Inc. received from bankruptcy claims
|
—
|
|
92
|
|
—
|
|
|||||
|
Airport construction financing
|
12
|
|
42
|
|
91
|
|
|||||
|
Operating lease conversions to capital lease
|
52
|
|
—
|
|
12
|
|
|||||
|
Cash Paid During the Period for:
|
|||||||||||
|
Interest
|
$
|
651
|
|
$
|
571
|
|
$
|
584
|
|
||
|
Income taxes
|
19
|
|
20
|
|
14
|
|
|||||
(a) Amounts adjusted due to the adoption of Accounting Standards Update No. 2014-09,
Revenue from Contracts with Customers (Topic 606).
See Note 1 to the financial statements contained in Part II, Item 8 of this report for additional information.
The accompanying Combined Notes to Consolidated Financial Statements are an integral part of these statements.
46
UNITED CONTINENTAL HOLDINGS, INC.
STATEMENTS OF CONSOLIDATED STOCKHOLDERS' EQUITY
(In millions)
|
|
Common
Stock
|
Additional
Capital Invested
|
Treasury Stock
|
Retained Earnings (Accumulated Deficit)
|
Accumulated
Other Comprehensive Income (Loss)
|
Total
|
||||||||||||||||||||
|
Shares
|
Amount
|
|||||||||||||||||||||||||
|
Balance at December 31, 2015
|
364.6
|
|
$
|
4
|
|
$
|
7,946
|
|
$
|
(1,610
|
)
|
$
|
3,457
|
|
$
|
(831
|
)
|
$
|
8,966
|
|
||||||
|
Net income (a)
|
—
|
|
—
|
|
—
|
|
—
|
|
2,234
|
|
—
|
|
2,234
|
|
||||||||||||
|
Other comprehensive income
|
—
|
|
—
|
|
—
|
|
—
|
|
—
|
|
2
|
|
2
|
|
||||||||||||
|
Stock-settled share-based compensation
|
—
|
|
—
|
|
32
|
|
—
|
|
—
|
|
—
|
|
32
|
|
||||||||||||
|
Proceeds from exercise of stock options
|
0.3
|
|
—
|
|
6
|
|
—
|
|
—
|
|
—
|
|
6
|
|
||||||||||||
|
Repurchases of common stock
|
(50.3
|
)
|
—
|
|
—
|
|
(2,607
|
)
|
—
|
|
—
|
|
(2,607
|
)
|
||||||||||||
|
Treasury stock retired
|
—
|
|
(1
|
)
|
(1,415
|
)
|
3,709
|
|
(2,293
|
)
|
—
|
|
—
|
|
||||||||||||
|
Other (a)
|
—
|
|
—
|
|
—
|
|
(3
|
)
|
(56
|
)
|
—
|
|
(59
|
)
|
||||||||||||
|
Balance at December 31, 2016
|
314.6
|
|
3
|
|
6,569
|
|
(511
|
)
|
3,342
|
|
(829
|
)
|
8,574
|
|
||||||||||||
|
Net income (a)
|
—
|
|
—
|
|
—
|
|
—
|
|
2,144
|
|
—
|
|
2,144
|
|
||||||||||||
|
Other comprehensive loss
|
—
|
|
—
|
|
—
|
|
—
|
|
—
|
|
(200
|
)
|
(200
|
)
|
||||||||||||
|
Stock-settled share-based compensation
|
—
|
|
—
|
|
56
|
|
—
|
|
—
|
|
—
|
|
56
|
|
||||||||||||
|
Proceeds from exercise of stock options
|
—
|
|
—
|
|
2
|
|
—
|
|
—
|
|
—
|
|
2
|
|
||||||||||||
|
Repurchases of common stock
|
(27.8
|
)
|
—
|
|
—
|
|
(1,844
|
)
|
—
|
|
—
|
|
(1,844
|
)
|
||||||||||||
|
Treasury stock retired
|
—
|
|
—
|
|
(508
|
)
|
1,576
|
|
(1,068
|
)
|
—
|
|
—
|
|
||||||||||||
|
Net treasury stock issued for share-based awards
|
0.2
|
|
—
|
|
(21
|
)
|
10
|
|
(1
|
)
|
—
|
|
(12
|
)
|
||||||||||||
|
Excess tax benefits from share-based awards
|
—
|
|
—
|
|
—
|
|
—
|
|
14
|
|
—
|
|
14
|
|
||||||||||||
|
Reclassification of stranded tax effects
|
—
|
|
—
|
|
—
|
|
—
|
|
118
|
|
(118
|
)
|
—
|
|
||||||||||||
|
Balance at December 31, 2017
|
287.0
|
|
3
|
|
6,098
|
|
(769
|
)
|
4,549
|
|
(1,147
|
)
|
8,734
|
|
||||||||||||
|
Net income
|
—
|
|
—
|
|
—
|
|
—
|
|
2,129
|
|
—
|
|
2,129
|
|
||||||||||||
|
Other comprehensive loss
|
—
|
|
—
|
|
—
|
|
—
|
|
—
|
|
338
|
|
338
|
|
||||||||||||
|
Stock-settled share-based compensation
|
—
|
|
—
|
|
60
|
|
—
|
|
—
|
|
—
|
|
60
|
|
||||||||||||
|
Repurchases of common stock
|
(17.5
|
)
|
—
|
|
—
|
|
(1,250
|
)
|
—
|
|
—
|
|
(1,250
|
)
|
||||||||||||
|
Net treasury stock issued for share-based awards
|
0.4
|
|
—
|
|
(38
|
)
|
26
|
|
(4
|
)
|
—
|
|
(16
|
)
|
||||||||||||
|
Adoption of accounting standard related to equity investments
|
—
|
|
—
|
|
—
|
|
—
|
|
(6
|
)
|
6
|
|
—
|
|
||||||||||||
|
Balance at December 31, 2018
|
269.9
|
|
$
|
3
|
|
$
|
6,120
|
|
$
|
(1,993
|
)
|
$
|
6,668
|
|
$
|
(803
|
)
|
$
|
9,995
|
|
||||||
(a) Amounts adjusted due to the adoption of Accounting Standards Update No. 2014-09,
Revenue from Contracts with Customers (Topic 606).
See Note 1 to the financial statements contained in Part II, Item 8 of this report for additional information.
The accompanying Combined Notes to Consolidated Financial Statements are an integral part of these statements.
47
UNITED AIRLINES, INC.
STATEMENTS OF CONSOLIDATED OPERATIONS
(In millions)
|
Year Ended December 31,
|
|||||||||||
|
|
2018
|
2017 (a)
|
2016 (a)
|
||||||||
|
Operating revenue:
|
|||||||||||
|
Passenger revenue
|
$
|
37,706
|
|
$
|
34,460
|
|
$
|
33,429
|
|
||
|
Cargo
|
1,237
|
|
1,114
|
|
934
|
|
|||||
|
Other operating revenue
|
2,360
|
|
2,210
|
|
2,195
|
|
|||||
|
Total operating revenue
|
41,303
|
|
37,784
|
|
36,558
|
|
|||||
|
Operating expense:
|
|||||||||||
|
Salaries and related costs
|
11,458
|
|
10,941
|
|
10,176
|
|
|||||
|
Aircraft fuel
|
9,307
|
|
6,913
|
|
5,813
|
|
|||||
|
Regional capacity purchase
|
2,601
|
|
2,232
|
|
2,197
|
|
|||||
|
Landing fees and other rent
|
2,359
|
|
2,240
|
|
2,165
|
|
|||||
|
Depreciation and amortization
|
2,240
|
|
2,149
|
|
1,977
|
|
|||||
|
Aircraft maintenance materials and outside repairs
|
1,767
|
|
1,856
|
|
1,749
|
|
|||||
|
Distribution expenses
|
1,558
|
|
1,435
|
|
1,395
|
|
|||||
|
Aircraft rent
|
433
|
|
621
|
|
680
|
|
|||||
|
Special charges
|
487
|
|
176
|
|
745
|
|
|||||
|
Other operating expenses
|
5,799
|
|
5,548
|
|
5,315
|
|
|||||
|
Total operating expense
|
38,009
|
|
34,111
|
|
32,212
|
|
|||||
|
Operating income
|
3,294
|
|
3,673
|
|
4,346
|
|
|||||
|
Nonoperating income (expense):
|
|||||||||||
|
Interest expense
|
(729
|
)
|
(671
|
)
|
(674
|
)
|
|||||
|
Interest capitalized
|
70
|
|
84
|
|
72
|
|
|||||
|
Interest income
|
101
|
|
57
|
|
42
|
|
|||||
|
Miscellaneous, net
|
(76
|
)
|
(101
|
)
|
(11
|
)
|
|||||
|
Total nonoperating expense, net
|
(634
|
)
|
(631
|
)
|
(571
|
)
|
|||||
|
Income before income taxes
|
2,660
|
|
3,042
|
|
3,775
|
|
|||||
|
Income tax expense
|
529
|
|
879
|
|
1,541
|
|
|||||
|
Net income
|
$
|
2,131
|
|
$
|
2,163
|
|
$
|
2,234
|
|
||
(a) Amounts adjusted due to the adoption of Accounting Standards Update No. 2014-09,
Revenue from Contracts with Customers (Topic 606)
and
Accounting Standards Update No. 2017-07,
Improving the Presentation of Net Periodic Pension Cost and Net Periodic Postretirement Benefit Cost.
See Note 1 to the financial statements contained in Part II, Item 8 of this report for additional information.
The accompanying Combined Notes to Consolidated Financial Statements are an integral part of these statements.
48
UNITED AIRLINES, INC.
STATEMENTS OF CONSOLIDATED COMPREHENSIVE INCOME (LOSS)
(In millions)
|
|
Year Ended December 31,
|
||||||||||
|
|
2018
|
2017 (a)
|
2016 (a)
|
||||||||
|
Net income
|
$
|
2,131
|
|
$
|
2,163
|
|
$
|
2,234
|
|
||
|
Other comprehensive income (loss), net change related to:
|
|||||||||||
|
Employee benefit plans, net of taxes
|
342
|
|
(195
|
)
|
(313
|
)
|
|||||
|
Fuel derivative financial instruments, net of taxes
|
—
|
|
1
|
|
316
|
|
|||||
|
Investments and other, net of taxes
|
(4
|
)
|
(6
|
)
|
(1
|
)
|
|||||
|
Total other comprehensive income (loss), net
|
338
|
|
(200
|
)
|
2
|
|
|||||
|
Total comprehensive income, net
|
$
|
2,469
|
|
$
|
1,963
|
|
$
|
2,236
|
|
||
(a) Amounts adjusted due to the adoption of Accounting Standards Update No. 2014-09,
Revenue from Contracts with Customers (Topic 606).
See Note 1 to the financial statements contained in Part II, Item 8 of this report for additional information.
The accompanying Combined Notes to Consolidated Financial Statements are an integral part of these statements.
49
UNITED AIRLINES, INC.
CONSOLIDATED BALANCE SHEETS
(In millions, except shares)
|
|
At December 31,
|
||||||
|
ASSETS
|
2018
|
2017 (a)
|
|||||
|
Current assets:
|
|||||||
|
Cash and cash equivalents
|
$
|
1,688
|
|
$
|
1,476
|
|
|
|
Short-term investments
|
2,256
|
|
2,316
|
|
|||
|
Receivables, less allowance for doubtful accounts (2018—$8; 2017—$7)
|
1,346
|
|
1,340
|
|
|||
|
Aircraft fuel, spare parts and supplies, less obsolescence allowance (2018—$412; 2017—$354)
|
985
|
|
924
|
|
|||
|
Prepaid expenses and other
|
913
|
|
1,071
|
|
|||
|
Total current assets
|
7,188
|
|
7,127
|
|
|||
|
Operating property and equipment:
|
|||||||
|
Owned—
|
|||||||
|
Flight equipment
|
31,607
|
|
28,692
|
|
|||
|
Other property and equipment
|
7,919
|
|
6,946
|
|
|||
|
Total owned property and equipment
|
39,526
|
|
35,638
|
|
|||
|
Less—Accumulated depreciation and amortization
|
(12,760
|
)
|
(11,159
|
)
|
|||
|
Total owned property and equipment, net
|
26,766
|
|
24,479
|
|
|||
|
Purchase deposits for flight equipment
|
1,177
|
|
1,344
|
|
|||
|
Capital leases—
|
|||||||
|
Flight equipment
|
1,029
|
|
1,151
|
|
|||
|
Other property and equipment
|
11
|
|
11
|
|
|||
|
Total capital leases
|
1,040
|
|
1,162
|
|
|||
|
Less—Accumulated amortization
|
(654
|
)
|
(777
|
)
|
|||
|
Total capital leases, net
|
386
|
|
385
|
|
|||
|
Total operating property and equipment, net
|
28,329
|
|
26,208
|
|
|||
|
Other assets:
|
|||||||
|
Goodwill
|
4,523
|
|
4,523
|
|
|||
|
Intangibles, less accumulated amortization (2018—$1,380; 2017—$1,313)
|
3,159
|
|
3,539
|
|
|||
|
Restricted cash
|
105
|
|
91
|
|
|||
|
Notes receivable, net
|
516
|
|
46
|
|
|||
|
Investments in affiliates and other, net
|
966
|
|
806
|
|
|||
|
Total other assets
|
9,269
|
|
9,005
|
|
|||
|
Total assets
|
$
|
44,786
|
|
$
|
42,340
|
|
|
(continued on next page)
50
UNITED AIRLINES, INC.
CONSOLIDATED BALANCE SHEETS
(In millions, except shares)
|
|
At December 31,
|
||||||
|
LIABILITIES AND STOCKHOLDER'S EQUITY
|
2018
|
2017 (a)
|
|||||
|
Current liabilities:
|
|||||||
|
Advance ticket sales
|
$
|
4,381
|
|
$
|
3,940
|
|
|
|
Frequent flyer deferred revenue
|
2,286
|
|
2,192
|
|
|||
|
Accounts payable
|
2,363
|
|
2,196
|
|
|||
|
Accrued salaries and benefits
|
2,184
|
|
2,166
|
|
|||
|
Current maturities of long-term debt
|
1,230
|
|
1,565
|
|
|||
|
Current maturities of capital leases
|
149
|
|
128
|
|
|||
|
Other
|
624
|
|
581
|
|
|||
|
Total current liabilities
|
13,217
|
|
12,768
|
|
|||
|
Long-term debt
|
12,215
|
|
11,703
|
|
|||
|
Long-term obligations under capital leases
|
1,134
|
|
996
|
|
|||
|
Other liabilities and deferred credits:
|
|||||||
|
Frequent flyer deferred revenue
|
2,719
|
|
2,591
|
|
|||
|
Postretirement benefit liability
|
1,295
|
|
1,602
|
|
|||
|
Pension liability
|
1,576
|
|
1,921
|
|
|||
|
Deferred income taxes
|
842
|
|
231
|
|
|||
|
Other
|
1,831
|
|
1,832
|
|
|||
|
Total other liabilities and deferred credits
|
8,263
|
|
8,177
|
|
|||
|
Commitments and contingencies
|
|
|
|||||
|
Stockholder's equity:
|
|||||||
|
Common stock at par, $0.01 par value; authorized 1,000 shares; issued and outstanding 1,000 shares at December 31, 2018 and 2017
|
—
|
|
—
|
|
|||
|
Additional capital invested
|
598
|
|
1,787
|
|
|||
|
Retained earnings
|
10,272
|
|
8,146
|
|
|||
|
Accumulated other comprehensive loss
|
(803
|
)
|
(1,147
|
)
|
|||
|
Receivable from related parties
|
(110
|
)
|
(90
|
)
|
|||
|
Total stockholder's equity
|
9,957
|
|
8,696
|
|
|||
|
Total liabilities and stockholder's equity
|
$
|
44,786
|
|
$
|
42,340
|
|
|
(a) Amounts adjusted due to the adoption of Accounting Standards Update No. 2014-09,
Revenue from Contracts with Customers (Topic 606).
See Note 1 to the financial statements contained in Part II, Item 8 of this report for additional information.
The accompanying Combined Notes to Consolidated Financial Statements are an integral part of these statements.
51
UNITED AIRLINES, INC.
STATEMENTS OF CONSOLIDATED CASH FLOWS
(In millions)
|
Year Ended December 31,
|
|||||||||||
|
2018
|
2017 (a)
|
2016 (a)
|
|||||||||
|
Operating Activities:
|
|||||||||||
|
Net income
|
$
|
2,131
|
|
$
|
2,163
|
|
$
|
2,234
|
|
||
|
Adjustments to reconcile net income to net cash provided by operating activities -
|
|||||||||||
|
Deferred income taxes
|
515
|
|
956
|
|
1,633
|
|
|||||
|
Depreciation and amortization
|
2,240
|
|
2,149
|
|
1,977
|
|
|||||
|
Special charges, non-cash portion
|
416
|
|
35
|
|
391
|
|
|||||
|
Other operating activities
|
170
|
|
140
|
|
109
|
|
|||||
|
Changes in operating assets and liabilities -
|
|||||||||||
|
Increase in receivables
|
(29
|
)
|
(183
|
)
|
(16
|
)
|
|||||
|
Increase in intercompany receivables
|
(20
|
)
|
(15
|
)
|
(57
|
)
|
|||||
|
(Increase) decrease in other assets
|
29
|
|
(533
|
)
|
(250
|
)
|
|||||
|
Increase (decrease) in advance ticket sales
|
441
|
|
145
|
|
(28
|
)
|
|||||
|
Increase (decrease) in frequent flyer deferred revenue
|
222
|
|
(107
|
)
|
(55
|
)
|
|||||
|
Increase in accounts payable
|
130
|
|
66
|
|
239
|
|
|||||
|
Decrease in advanced purchase of miles
|
—
|
|
(942
|
)
|
(206
|
)
|
|||||
|
Decrease in other liabilities
|
(82
|
)
|
(475
|
)
|
(436
|
)
|
|||||
|
Net cash provided by operating activities
|
6,163
|
|
3,399
|
|
5,535
|
|
|||||
|
Investing Activities:
|
|||||||||||
|
Capital expenditures
|
(4,177
|
)
|
(3,998
|
)
|
(3,223
|
)
|
|||||
|
Purchases of short-term and other investments
|
(2,552
|
)
|
(3,241
|
)
|
(2,768
|
)
|
|||||
|
Proceeds from sale of short-term and other investments
|
2,616
|
|
3,177
|
|
2,712
|
|
|||||
|
Loans made to others
|
(466
|
)
|
(30
|
)
|
(56
|
)
|
|||||
|
Investment in affiliates
|
(139
|
)
|
(2
|
)
|
(14
|
)
|
|||||
|
Other, net
|
155
|
|
164
|
|
111
|
|
|||||
|
Net cash used in investing activities
|
(4,563
|
)
|
(3,930
|
)
|
(3,238
|
)
|
|||||
|
Financing Activities:
|
|||||||||||
|
Proceeds from issuance of long-term debt and airport construction financing
|
1,740
|
|
2,765
|
|
808
|
|
|||||
|
Payments of long-term debt
|
(1,727
|
)
|
(901
|
)
|
(1,215
|
)
|
|||||
|
Dividend to UAL
|
(1,235
|
)
|
(1,844
|
)
|
(2,614
|
)
|
|||||
|
Principal payments under capital leases
|
(134
|
)
|
(124
|
)
|
(136
|
)
|
|||||
|
Capitalized financing costs
|
(37
|
)
|
(80
|
)
|
(64
|
)
|
|||||
|
Other, net
|
1
|
|
3
|
|
15
|
|
|||||
|
Net cash used in financing activities
|
(1,392
|
)
|
(181
|
)
|
(3,206
|
)
|
|||||
|
Net increase (decrease) in cash, cash equivalents and restricted cash
|
208
|
|
(712
|
)
|
(909
|
)
|
|||||
|
Cash, cash equivalents and restricted cash at beginning of year
|
1,585
|
|
2,297
|
|
3,206
|
|
|||||
|
Cash, cash equivalents and restricted cash at end of year
|
$
|
1,793
|
|
$
|
1,585
|
|
$
|
2,297
|
|
||
|
Investing and Financing Activities Not Affecting Cash:
|
|||||||||||
|
Property and equipment acquired through the issuance of debt and capital leases
|
$
|
174
|
|
$
|
935
|
|
$
|
386
|
|
||
|
Debt associated with termination of a maintenance service agreement
|
163
|
|
—
|
|
—
|
|
|||||
|
Investment in Republic Airways Holdings, Inc. received from bankruptcy claims
|
—
|
|
92
|
|
—
|
|
|||||
|
Airport construction financing
|
12
|
|
42
|
|
91
|
|
|||||
|
Operating lease conversions to capital lease
|
52
|
|
—
|
|
12
|
|
|||||
|
Cash Paid During the Period for:
|
|||||||||||
|
Interest
|
$
|
651
|
|
$
|
571
|
|
$
|
584
|
|
||
|
Income taxes
|
19
|
|
20
|
|
14
|
|
|||||
(a) Amounts adjusted due to the adoption of Accounting Standards Update No. 2014-09,
Revenue from Contracts with Customers (Topic 606).
See Note 1 to the financial statements contained in Part II, Item 8 of this report for additional information.
The accompanying Combined Notes to Consolidated Financial Statements are an integral part of these statements.
52
UNITED AIRLINES, INC.
STATEMENTS OF CONSOLIDATED STOCKHOLDER'S EQUITY
(In millions)
|
|
Additional
Capital
Invested
|
Retained Earnings (Accumulated
Deficit)
|
Accumulated
Other
Comprehensive
Income (Loss)
|
Receivable from Related Parties, Net
|
Total
|
||||||||||||||
|
Balance at December 31, 2015
|
$
|
6,138
|
|
$
|
3,673
|
|
$
|
(831
|
)
|
$
|
(17
|
)
|
$
|
8,963
|
|
||||
|
Net income (a)
|
—
|
|
2,234
|
|
—
|
|
—
|
|
2,234
|
|
|||||||||
|
Other comprehensive income
|
—
|
|
—
|
|
2
|
|
—
|
|
2
|
|
|||||||||
|
Dividend to UAL
|
(2,603
|
)
|
—
|
|
—
|
|
—
|
|
(2,603
|
)
|
|||||||||
|
Stock-settled share-based compensation
|
32
|
|
—
|
|
—
|
|
—
|
|
32
|
|
|||||||||
|
UAL contribution related to stock plans
|
6
|
|
—
|
|
—
|
|
—
|
|
6
|
|
|||||||||
|
Other (a)
|
—
|
|
(56
|
)
|
—
|
|
(58
|
)
|
(114
|
)
|
|||||||||
|
Balance at December 31, 2016
|
3,573
|
|
5,851
|
|
(829
|
)
|
(75
|
)
|
8,520
|
|
|||||||||
|
Net income (a)
|
—
|
|
2,163
|
|
—
|
|
—
|
|
2,163
|
|
|||||||||
|
Other comprehensive loss
|
—
|
|
—
|
|
(200
|
)
|
—
|
|
(200
|
)
|
|||||||||
|
Dividend to UAL
|
(1,844
|
)
|
—
|
|
—
|
|
—
|
|
(1,844
|
)
|
|||||||||
|
Stock-settled share-based compensation
|
56
|
|
—
|
|
—
|
|
—
|
|
56
|
|
|||||||||
|
UAL contribution related to stock plans
|
2
|
|
—
|
|
—
|
|
—
|
|
2
|
|
|||||||||
|
Excess tax benefits from share-based awards
|
—
|
|
14
|
|
—
|
|
—
|
|
14
|
|
|||||||||
|
Reclassification of stranded tax effects
|
—
|
|
118
|
|
(118
|
)
|
—
|
|
—
|
|
|||||||||
|
Other
|
—
|
|
—
|
|
—
|
|
(15
|
)
|
(15
|
)
|
|||||||||
|
Balance at December 31, 2017
|
1,787
|
|
8,146
|
|
(1,147
|
)
|
(90
|
)
|
8,696
|
|
|||||||||
|
Net income
|
—
|
|
2,131
|
|
—
|
|
—
|
|
2,131
|
|
|||||||||
|
Other comprehensive loss
|
—
|
|
—
|
|
338
|
|
—
|
|
338
|
|
|||||||||
|
Dividend to UAL
|
(1,249
|
)
|
—
|
|
—
|
|
—
|
|
(1,249
|
)
|
|||||||||
|
Stock-settled share-based compensation
|
60
|
|
—
|
|
—
|
|
—
|
|
60
|
|
|||||||||
|
Other
|
—
|
|
(5
|
)
|
6
|
|
(20
|
)
|
(19
|
)
|
|||||||||
|
Balance at December 31, 2018
|
$
|
598
|
|
$
|
10,272
|
|
$
|
(803
|
)
|
$
|
(110
|
)
|
$
|
9,957
|
|
||||
(a) Amounts adjusted due to the adoption of Accounting Standards Update No. 2014-09,
Revenue from Contracts with Customers (Topic 606).
See Note 1 to the financial statements contained in Part II, Item 8 of this report for additional information.
The accompanying Combined Notes to Consolidated Financial Statements are an integral part of these statements.
53
UNITED CONTINENTAL HOLDINGS, INC.
UNITED AIRLINES, INC.
COMBINED NOTES TO CONSOLIDATED FINANCIAL STATEMENTS
Overview
United Continental Holdings, Inc. (together with its consolidated subsidiaries, "UAL" or the "Company") is a holding company and its principal, wholly-owned subsidiary is United Airlines, Inc. (together with its consolidated subsidiaries, "United"). As UAL consolidates United for financial statement purposes, disclosures that relate to activities of United also apply to UAL, unless otherwise noted. United's operating revenues and operating expenses comprise nearly 100% of UAL's revenues and operating expenses. In addition, United comprises approximately the entire balance of UAL's assets, liabilities and operating cash flows. When appropriate, UAL and United are named specifically for their individual contractual obligations and related disclosures and any significant differences between the operations and results of UAL and United are separately disclosed and explained. We sometimes use the words "we," "our," "us," and the "Company" in this report for disclosures that relate to all of UAL and United.
NOTE 1 - SIGNIFICANT ACCOUNTING POLICIES
|
(a)
|
Use of Estimates—
The preparation of financial statements in conformity with accounting principles generally accepted in the United States of America ("GAAP") requires management to make estimates and assumptions that affect the amounts reported in these financial statements and accompanying notes. Actual results could differ from those estimates.
|
|
(b)
|
Revenue Recognition—
The Company presents Passenger revenue, Cargo revenue and Other operating revenue on its income statement. Passenger revenue is recognized when transportation is provided and Cargo revenue is recognized when shipments arrive at their destination. Other operating revenue is recognized as the related performance obligations are satisfied.
|
Passenger tickets and related ancillary services sold by the Company for mainline and regional flights are purchased primarily via credit card transactions, with payments collected by the Company in advance of the performance of related services. The Company initially records ticket sales in its Advance ticket sales liability, deferring revenue recognition until the travel occurs. For travel that has more than one flight segment, the Company deems each segment as a separate performance obligation and recognizes revenue for each segment as travel occurs. Tickets sold by other airlines where the Company provides the transportation are recognized as passenger revenue at the estimated value to be billed to the other airline when travel is provided. Differences between amounts billed and the actual amounts may be rejected and rebilled or written off if the amount recorded was different from the original estimate. When necessary, the Company records a reserve against its billings and payables with other airlines based on historical experience.
The Company sells certain tickets with connecting flights with one or more segments operated by its other airline partners. For segments operated by its other airline partners, the Company has determined that it is acting as an agent on behalf of the other airlines as they are responsible for their portion of the contract (i.e. transportation of the passenger). The Company, as the agent, recognizes revenue within Other operating revenue at the time of the travel for the net amount representing commission to be retained by the Company for any segments flown by other airlines.
Refundable tickets expire after one year from the date of issuance. Non-refundable tickets generally expire on the date of the intended travel, unless the date is extended by notification from the customer on or before the intended travel date.
The Company records breakage revenue on the travel date for its estimate of tickets that will expire unused. To determine breakage, the Company uses its historical experience with refundable and nonrefundable expired tickets and other facts, such as recent aging trends, program changes and modifications that could affect the ultimate expiration patterns of tickets. Fees charged in association with changes or extensions to non-refundable tickets are considered part of the Company's passenger travel obligation. As such, those fees are deferred at the time of collection and recognized at the time the travel is provided.
United initially capitalizes the costs of selling airline travel tickets and then recognizes those costs as Distribution expense at the time of travel. Passenger ticket costs include credit card fees, travel agency and other commissions paid, as well as global distribution systems booking fees.
54
Advance Ticket Sales.
Advance ticket sales represent the Company's liability to provide air transportation in the future. In the years ended December 31,
2018
and
2017
, the Company recognized approximately
$3.1 billion
and
$2.9 billion
, respectively, of passenger revenue for tickets that were included in Advance ticket sales at the beginning of those periods. All tickets sold at any given point of time have travel dates extending up to twelve months. As a result, the balance of the Company's Advance ticket sales liability represents activity that will be recognized in the next twelve months.
|
|
Revenue by Geography.
The Company further disaggregates revenue by geographic regions. Operating segments are defined as components of an enterprise with separate financial information, which are evaluated regularly by the chief operating decision maker and are used in resource allocation and performance assessments.
|
The Company deploys its aircraft across its route network through a single route scheduling system to maximize its value. When making resource allocation decisions, the Company's chief operating decision maker evaluates flight profitability data, which considers aircraft type and route economics. The Company's chief operating decision maker makes resource allocation decisions to maximize the Company's consolidated financial results. Managing the Company as one segment allows management the opportunity to maximize the value of its route network.
The Company's operating revenue by principal geographic region (as defined by the U.S. Department of Transportation) for the years ended December 31 is presented in the table below (in millions):
|
2018
|
2017¹
|
2016¹
|
||||||||||
|
Domestic (U.S. and Canada)
|
$
|
25,552
|
|
$
|
23,114
|
|
$
|
22,151
|
|
|||
|
Atlantic
|
7,103
|
|
6,340
|
|
6,194
|
|
||||||
|
Pacific
|
5,188
|
|
4,914
|
|
4,984
|
|
||||||
|
Latin America
|
3,460
|
|
3,416
|
|
3,229
|
|
||||||
|
Total
|
$
|
41,303
|
|
$
|
37,784
|
|
$
|
36,558
|
|
|||
(1) Amounts adjusted due to the adoption of Accounting Standards Update No. 2014-09,
Revenue from Contracts with Customers (Topic 606).
See (u) below for additional information.
The Company attributes revenue among the geographic areas based upon the origin and destination of each flight segment. The Company's operations involve an insignificant level of dedicated revenue-producing assets in geographic regions as the overwhelming majority of the Company's revenue-producing assets (primarily U.S. registered aircraft) can be deployed in any of its geographic regions.
Ancillary Fees.
The Company charges fees, separately from ticket sales, for certain ancillary services that are directly related to passengers' travel, such as ticket change fees, baggage fees, inflight amenities fees, and other ticket-related fees. These ancillary fees are part of the travel performance obligation and, as such, are recognized as passenger revenue when the travel occurs. The Company recorded
$2.2 billion
,
$2.0 billion
, and
$1.9 billion
of ancillary fees within passenger revenue in the years ended December 31,
2018
,
2017
and
2016
respectively.
|
(c)
|
Frequent Flyer Accounting—
United's MileagePlus loyalty program builds customer loyalty by offering awards, benefits and services to program participants. Members in this program earn miles for travel on United, United Express, Star Alliance members and certain other airlines that participate in the program. Members can also earn miles by purchasing the goods and services of our network of non-airline partners. We have contracts to sell miles to these partners with the terms extending from one to eight years. These partners include domestic and international credit card issuers, retail merchants, hotels, car rental companies and our participating airline partners. Miles can be redeemed for free (other than taxes and government imposed fees), discounted or upgraded air travel and non-travel awards. Miles expire after 18 months of member account inactivity.
|
Miles Earned in Conjunction with Travel.
When frequent flyers earn miles for flights, the Company recognizes a portion of the ticket sales as revenue when the travel occurs and defers a portion of the ticket sale representing the value of the related miles as a separate performance obligation. The Company determines the estimated selling price of travel and miles as if each element is sold on a separate basis. The total consideration from each ticket sale is then allocated to each of these elements, individually, on a pro-rata basis. At the time of travel, the Company records the portion allocated to the miles to Frequent flyer deferred revenue on the Company's consolidated balance sheet and subsequently recognizes it into revenue when miles are redeemed for air travel and non-air travel awards.
The Company's estimated selling price of miles is based on an equivalent ticket value less breakage, which incorporates the expected redemption of miles, as the best estimate of selling price for these miles. The equivalent ticket value is based on the prior 12 months' weighted average equivalent ticket value of similar fares as those used to
55
settle award redemptions while taking into consideration such factors as redemption pattern, cabin class, loyalty status and geographic region. The estimated selling price of miles is adjusted by breakage that considers a number of factors, including redemption patterns of various customer groups. The Company reviews its breakage estimates annually based upon the latest available information regarding redemption and expiration patterns. The Company's estimate of the expected expiration of miles requires significant management judgment. Current and future changes to expiration assumptions or to the expiration policy, or to program rules and program redemption opportunities, may result in material changes to the deferred revenue balance as well as recognized revenues from the program. For the portion of the outstanding miles that we estimate will not be redeemed, we recognize the associated value proportionally as the remaining miles are redeemed.
Co-Brand Agreement
. United has a significant contract (the "Co-Brand Agreement") to sell MileagePlus miles to its co-branded credit card partner Chase Bank USA, N.A. ("Chase"). Chase awards miles to MileagePlus members based on their credit card activity. United identified the following significant separately identifiable performance obligations in the Co-Brand Agreement:
|
•
|
MileagePlus miles awarded – United has a performance obligation to provide MileagePlus cardholders with miles to be used for air travel and non-travel award redemptions. The Company records Passenger revenue related to the travel awards when the transportation is provided and records Other revenue related to the non-travel awards when the goods or services are delivered. The Company records the cost associated with non-travel awards in Other operating revenue.
|
|
•
|
Marketing – United has a performance obligation to provide Chase access to its customer list and the use of its brand. Marketing revenue is recorded to Other operating revenue as miles are delivered to Chase.
|
|
•
|
Advertising – United has a performance obligation to provide advertising in support of the MileagePlus card in various customer contact points such as United's website, email promotions, direct mail campaigns, airport advertising and in-flight advertising. Advertising revenue is recorded to Other operating revenue as miles are delivered to Chase.
|
|
•
|
Other travel-related benefits – United's performance obligations are comprised of various items such as waived bag fees, seat upgrades and lounge passes. Lounge passes are recorded to Other operating revenue as customers use the lounge passes. Bag fees and seat upgrades are recorded to Passenger revenue at the time of the associated travel.
|
We account for all the payments received (including monthly and one-time payments) under the Co-Brand Agreement by allocating them to the separately identifiable performance obligations. The fair value of the separately identifiable performance obligations is determined using management's estimated selling price of each component. The objective of using the estimated selling price based methodology is to determine the price at which we would transact a sale if the product or service were sold on a stand-alone basis. Accordingly, we determine our best estimate of selling price by considering multiple inputs and methods including, but not limited to, discounted cash flows, brand value, volume discounts, published selling prices, number of miles awarded and number of miles redeemed. The Company estimated the selling prices and volumes over the term of the Co-Brand Agreement in order to determine the allocation of proceeds to each of the components to be delivered. We also evaluate volumes on an annual basis, which may result in a change in the allocation of the estimated consideration from the Co-Brand Agreement on a prospective basis.
Frequent flyer deferred revenue.
Miles in MileagePlus members' accounts are combined into one homogeneous pool and are thus not separately identifiable, for award redemption purposes, between miles earned in the current period and those in their beginning balance. Of the miles expected to be redeemed, the Company expects the majority of these miles to be redeemed within two years.
The table below presents a roll forward of Frequent flyer deferred revenue (in millions):
|
Twelve Months Ended
December 31, |
|||||||
|
2018
|
2017
|
||||||
|
Total Frequent flyer deferred revenue - beginning balance
|
$
|
4,783
|
|
$
|
4,889
|
|
|
|
Total miles awarded
|
2,451
|
|
2,077
|
|
|||
|
Travel miles redeemed (Passenger revenue)
|
(2,068
|
)
|
(2,004
|
)
|
|||
|
Non-travel miles redeemed (Other operating revenue)
|
(161
|
)
|
(179
|
)
|
|||
|
Total Frequent flyer deferred revenue - ending balance
|
$
|
5,005
|
|
$
|
4,783
|
|
|
56
In the year ended December 31,
2018
,
2017
and
2016
, the Company recognized, in Other operating revenue,
$2.0 billion
,
$1.8 billion
and
$1.7 billion
, respectively, related to the marketing, advertising, non-travel miles redeemed (net of related costs) and other travel-related benefits of the mileage revenue associated with our various partner agreements including, but not limited to, our Chase co-brand agreement. The portion related to the MileagePlus miles awarded of the total amounts received is deferred and presented in the table above as an increase to the frequent flyer liability.
|
(d)
|
Cash and Cash Equivalents and Restricted Cash—
Highly liquid investments with a maturity of three months or less on their acquisition date are classified as cash and cash equivalents.
|
Restricted cash primarily includes cash collateral for letters of credit and collateral associated with obligations for facility leases and other insurance-related obligations.
Restricted cash is classified as short-term or long-term in the consolidated balance sheets based on the expected timing of return of the assets to the Company.
The following table provides a reconciliation of cash, cash equivalents and restricted cash reported within the consolidated balance sheets that sum to the total of the same such amounts shown in the statements of consolidated cash flows (in millions):
|
UAL
|
United
|
||||||||||||||||||||||||
|
At December 31,
|
At December 31,
|
||||||||||||||||||||||||
|
2018
|
2017
|
2016
|
2018
|
2017
|
2016
|
||||||||||||||||||||
|
Current assets:
|
|||||||||||||||||||||||||
|
Cash and cash equivalents
|
$
|
1,694
|
|
$
|
1,482
|
|
$
|
2,179
|
|
$
|
1,688
|
|
$
|
1,476
|
|
$
|
2,173
|
|
|||||||
|
Restricted cash included in Prepaid expenses and other
|
—
|
|
18
|
|
—
|
|
—
|
|
18
|
|
—
|
|
|||||||||||||
|
Other assets:
|
|||||||||||||||||||||||||
|
Restricted cash
|
105
|
|
91
|
|
124
|
|
105
|
|
91
|
|
124
|
|
|||||||||||||
|
Total cash, cash equivalents and restricted cash shown in the statement of consolidated cash flows
|
$
|
1,799
|
|
$
|
1,591
|
|
$
|
2,303
|
|
$
|
1,793
|
|
$
|
1,585
|
|
$
|
2,297
|
|
|||||||
|
(e)
|
Short-term Investments—
Debt investments are classified as available-for-sale and are stated at fair value. Realized gains and losses on sales of these investments are reflected in Miscellaneous, net in the consolidated statements of operations. Unrealized gains and losses on available-for-sale securities are reflected as a component of accumulated other comprehensive income (loss). Equity investments with readily determinable fair values are measured at fair value. Equity investments without readily determinable fair values are measured using the equity method, or measured at cost with adjustments for observable changes in price or impairments (referred to as the measurement alternative). Changes in fair value are recorded in Miscellaneous, net in the consolidated statements of operations.
|
|
(f)
|
Accounts Receivable.
Accounts receivable primarily consist of amounts due from credit card companies, non-airline partners, and cargo transportation customers. We provide an allowance for uncollectible accounts equal to the estimated losses expected to be incurred based on historical write-offs and other specific analyses. Bad debt expense and write-offs were not material for the year ended December 31,
2018
and
2017
.
|
|
(g)
|
Aircraft Fuel, Spare Parts and Supplies—
The Company accounts for aircraft fuel, spare parts and supplies at average cost and provides an obsolescence allowance for aircraft spare parts with an assumed residual value of
10%
of original cost.
|
|
(h)
|
Property and Equipment—
The Company records additions to owned operating property and equipment at cost when acquired. Property under capital leases and the related obligation for future lease payments are recorded at an amount equal to the initial present value of those lease payments. Modifications that enhance the operating performance or extend the useful lives of airframes or engines are capitalized as property and equipment. It is the Company's policy to record compensation from delays in delivery of aircraft as a reduction of the cost of the related aircraft.
|
Depreciation and amortization of owned depreciable assets is based on the straight-line method over the assets' estimated useful lives. Leasehold improvements are amortized over the remaining term of the lease, including estimated facility renewal options when renewal is reasonably assured at key airports, or the estimated useful life of the related asset, whichever is less. Properties under capital leases are amortized on the straight-line method over the life of the lease or, in the case of certain aircraft, over their estimated useful lives, whichever is shorter. Amortization
57
of capital lease assets is included in depreciation and amortization expense. The estimated useful lives of property and equipment are as follows:
|
|
Estimated Useful Life (in years)
|
|
|
Aircraft and related rotable parts
|
25 to 30
|
|
|
Aircraft seats
|
10 to 15
|
|
|
Buildings
|
25 to 45
|
|
|
Other property and equipment
|
3 to 15
|
|
|
Computer software
|
5 to 15
|
|
|
Building improvements
|
1 to 40
|
|
As of December 31,
2018
and
2017
, the Company had a carrying value of computer software of
$359 million
and
$345 million
, respectively. For the years ended December 31,
2018
,
2017
and
2016
, the Company's depreciation expense related to computer software was
$122 million
,
$117 million
and
$108 million
, respectively. Aircraft and aircraft spare parts were assumed to have residual values of approximately
10%
of original cost, and other categories of property and equipment were assumed to have no residual value.
|
(i)
|
Maintenance and Repairs—
The cost of maintenance and repairs, including the cost of minor replacements, is charged to expense as incurred, except for costs incurred under our power-by-the-hour ("PBTH") engine maintenance agreements. PBTH contracts transfer certain risk to third-party service providers and fix the amount we pay per flight hour or per cycle to the service provider in exchange for maintenance and repairs under a predefined maintenance program. Under PBTH agreements, the Company recognizes expense at a level rate per engine hour, unless the level of service effort and the related payments during the period are substantially consistent, in which case the Company recognizes expense based on the amounts paid.
|
|
(j)
|
Lease Fair Value Adjustments—
Lease fair value adjustments, which arose from recording operating leases at fair value under fresh start or business combination accounting, are amortized on a straight-line basis over the related lease term.
|
|
(k)
|
Regional Capacity Purchase—
Payments made to regional carriers under capacity purchase agreements ("CPAs") are reported in Regional capacity purchase in our consolidated statements of operations.
|
|
(l)
|
Advertising—
Advertising costs, which are included in Other operating expenses, are expensed as incurred. Advertising expenses were
$211 million
,
$217 million
and
$220 million
for the years ended December 31,
2018
,
2017
and
2016
respectively.
|
|
(m)
|
Intangibles—
The Company has finite-lived and indefinite-lived intangible assets, including goodwill. Finite-lived intangible assets are amortized over their estimated useful lives. Goodwill and indefinite-lived intangible assets are not amortized but are reviewed for impairment annually or more frequently if events or circumstances indicate that the asset may be impaired. Goodwill and indefinite-lived assets are reviewed for impairment on an annual basis as of October 1, or on an interim basis whenever a triggering event occurs. See Note 2 of this report for additional information related to intangibles.
|
|
(n)
|
Long-Lived Asset Impairments—
The Company evaluates the carrying value of long-lived assets subject to amortization whenever events or changes in circumstances indicate that an impairment may exist. For purposes of this testing, the Company has generally identified the aircraft fleet type as the lowest level of identifiable cash flows.
An impairment charge is recognized when the asset's carrying value exceeds its net undiscounted future cash flows and its fair market value. The amount of the charge is the difference between the asset's carrying value and fair market value.
See Note 14 of this report for additional information related to asset impairments.
|
|
(o)
|
Share-Based Compensation—
The Company measures the cost of employee services received in exchange for an award of equity instruments based on the grant date fair value of the award. The resulting cost is recognized over the period during which an employee is required to provide service in exchange for the award, usually the vesting period. Obligations for cash-settled restricted stock units ("RSUs") are remeasured at fair value throughout the requisite service period at the close of the reporting period based upon UAL's stock price. In addition to the service requirement, certain RSUs have performance metrics that must be achieved prior to vesting. These awards are accrued based on the expected level of achievement at each reporting period. An adjustment is recorded each reporting period to adjust compensation expense based on both UAL's stock price and the then current level of
|
58
expected performance achievement for the performance-based awards. See Note 5 of this report for additional information on UAL's share-based compensation plans.
|
(p)
|
Ticket Taxes—
Certain governmental taxes are imposed on the Company's ticket sales through a fee included in ticket prices. The Company collects these fees and remits them to the appropriate government agency. These fees are recorded on a net basis and, as a result, are excluded from revenue.
|
|
(q)
|
Retirement of Leased Aircraft—
The Company accrues for estimated lease costs over the remaining term of the lease at the present value of future minimum lease payments, net of estimated sublease rentals (if any), in the period that aircraft are permanently removed from service. When reasonably estimable and probable, the Company estimates maintenance lease return condition obligations for items such as minimum aircraft and engine conditions specified in leases and accrues these amounts over the lease term while the aircraft are operating, and any remaining unrecognized estimated obligations are accrued in the period that an aircraft is removed from service.
|
|
(r)
|
Uncertain Income Tax Positions—
The Company has recorded reserves for income taxes and associated interest that may become payable in future years. Although management believes that its positions taken on income tax matters are reasonable, the Company nevertheless has established tax and interest reserves in recognition that various taxing authorities may challenge certain of the positions taken by the Company, potentially resulting in additional liabilities for taxes and interest. The Company's uncertain tax position reserves are reviewed periodically and are adjusted as events occur that affect its estimates, such as the availability of new information, the lapsing of applicable statutes of limitation, the conclusion of tax audits, the measurement of additional estimated liability, the identification of new tax matters, the release of administrative tax guidance affecting its estimates of tax liabilities, or the rendering of relevant court decisions. The Company records penalties and interest relating to uncertain tax positions as part of income tax expense in its consolidated statements of operations. See Note 7 of this report for additional information on UAL's uncertain tax positions.
|
|
(s)
|
Labor Costs—
The Company records expenses associated with amendable labor agreements when the amounts are probable and estimable. These include costs associated with lump sum cash payments that would be made in conjunction with the ratification of labor agreements. To the extent these upfront costs are in lieu of future pay increases, they would be capitalized and amortized over the term of the labor agreements. If not, these amounts would be expensed.
|
|
(t)
|
Third-Party Business—
The Company has third-party business revenue that includes fuel sales, catering, ground handling, maintenance services and frequent flyer award non-air redemptions. Third-party business revenue is recorded in Other operating revenue. The Company also incurs third-party business expenses, such as maintenance, ground handling and catering services for third parties, fuel sales and non-air mileage redemptions. The third-party business expenses are recorded in Other operating expenses, except for non-air mileage redemption. Non-air mileage redemption expenses are recorded to Other operating revenue.
|
|
(u)
|
Recently Issued Accounting Standards—
The Company adopted Financial Accounting Standards Board ("FASB") Accounting Standards Codification Topic 606,
Revenue from Contracts with Customers
(the "New Revenue Standard"), effective January 1, 2018 using the full-retrospective method. Topic 606 prescribes that an entity should recognize revenue to depict the transfer of promised goods or services to customers in an amount that reflects the consideration to which the entity expects to be entitled in exchange for those goods or services. For the Company, the most significant impact of the standard was the reclassification of certain ancillary fees from other operating revenue into passenger revenue on the statement of consolidated operations. These ancillary fees are directly related to passenger travel, such as ticket change fees and baggage fees, and are no longer considered distinct performance obligations separate from the passenger travel component. In addition, the ticket change fees, which were previously recognized when received, are now recognized when transportation is provided. Adoption of the standard had no impact on the Company's consolidated cash flows statements.
|
The Company adopted Accounting Standards Update No. 2017-07,
Improving the Presentation of Net Periodic Pension Cost and Net Periodic Postretirement Benefit Cost
(the "New Retirement Standard"), effective January 1, 2018 using the full-retrospective method. The New Retirement Standard requires employers to present the service cost component of the net periodic benefit cost in the same income statement line item as other employee compensation costs arising from services rendered during the period. The other components of net benefit cost, including interest cost, expected return on plan assets, amortization of prior service cost/credit and actuarial gain/loss, and settlement and curtailment effects, are to be presented outside of any subtotal of operating income. The Company elected to apply the practical expedient and use the amounts disclosed in Note 8 to the financial statements included in Part II, Item 8 of the Company's Annual Report on Form 10-K for the fiscal year ended December 31, 2017 as the estimation basis for applying the retrospective presentation requirements of the standard.
59
The New Revenue Standard and the New Retirement Standard had the same impact on the financial statements of United as they had on the financial statements of UAL. The tables below present the impact of the adoption of the New Revenue Standard and the New Retirement Standard on select accounts and captions of UAL's statements of consolidated operations for the twelve months ended December 31, 2017 and 2016 (in millions, except per share amounts) and the impact on UAL's balance sheet accounts and captions as of December 31, 2017 (in millions):
|
Statements of Consolidated Operations for the Years Ended December 31,
|
|||||||||||||||||||||||||||||||
|
|
As Previously Reported
|
New Revenue Standard Adjustments
|
New Retirement Standard Adjustments
|
As Adjusted
|
|||||||||||||||||||||||||||
|
2017
|
2016
|
2017
|
2016
|
2017
|
2016
|
2017
|
2016
|
||||||||||||||||||||||||
|
Operating revenue:
|
|||||||||||||||||||||||||||||||
|
Passenger revenue
|
$
|
32,404
|
|
$
|
31,457
|
|
$
|
2,056
|
|
$
|
1,972
|
|
$
|
—
|
|
$
|
—
|
|
$
|
34,460
|
|
$
|
33,429
|
|
|||||||
|
Cargo
|
1,035
|
|
876
|
|
79
|
|
58
|
|
—
|
|
—
|
|
1,114
|
|
934
|
|
|||||||||||||||
|
Other operating revenue
|
4,297
|
|
4,223
|
|
(2,087
|
)
|
(2,028
|
)
|
—
|
|
—
|
|
2,210
|
|
2,195
|
|
|||||||||||||||
|
Total operating revenue
|
37,736
|
|
36,556
|
|
48
|
|
2
|
|
—
|
|
—
|
|
37,784
|
|
36,558
|
|
|||||||||||||||
|
Operating expenses
|
34,238
|
|
32,218
|
|
(21
|
)
|
(12
|
)
|
(104
|
)
|
8
|
|
34,113
|
|
32,214
|
|
|||||||||||||||
|
Operating income
|
3,498
|
|
4,338
|
|
69
|
|
14
|
|
104
|
|
(8
|
)
|
3,671
|
|
4,344
|
|
|||||||||||||||
|
Nonoperating expense, net
|
(499
|
)
|
(519
|
)
|
(28
|
)
|
(60
|
)
|
(104
|
)
|
8
|
|
(631
|
)
|
(571
|
)
|
|||||||||||||||
|
Income before income taxes
|
2,999
|
|
3,819
|
|
41
|
|
(46
|
)
|
—
|
|
—
|
|
3,040
|
|
3,773
|
|
|||||||||||||||
|
Income tax expense
|
868
|
|
1,556
|
|
28
|
|
(17
|
)
|
—
|
|
—
|
|
896
|
|
1,539
|
|
|||||||||||||||
|
Net income
|
$
|
2,131
|
|
$
|
2,263
|
|
$
|
13
|
|
$
|
(29
|
)
|
$
|
—
|
|
$
|
—
|
|
$
|
2,144
|
|
$
|
2,234
|
|
|||||||
|
Earnings per share, basic
|
$
|
7.04
|
|
$
|
6.86
|
|
$
|
0.04
|
|
$
|
(0.09
|
)
|
$
|
—
|
|
$
|
—
|
|
$
|
7.08
|
|
$
|
6.77
|
|
|||||||
|
Earnings per share, diluted
|
$
|
7.02
|
|
$
|
6.85
|
|
$
|
0.04
|
|
$
|
(0.09
|
)
|
$
|
—
|
|
$
|
—
|
|
$
|
7.06
|
|
$
|
6.76
|
|
|||||||
|
Consolidated Balance Sheet as of December 31, 2017
|
|||||||||||
|
As Previously Reported
|
New Revenue Standard Adjustments
|
As Adjusted
|
|||||||||
|
Current assets:
|
|||||||||||
|
Prepaid expenses and other
|
$
|
1,051
|
|
$
|
20
|
|
$
|
1,071
|
|
||
|
Current liabilities:
|
|||||||||||
|
Advance ticket sales
|
3,876
|
|
64
|
|
3,940
|
|
|||||
|
Frequent flyer deferred revenue
|
2,176
|
|
16
|
|
2,192
|
|
|||||
|
Other
|
569
|
|
7
|
|
576
|
|
|||||
|
Other liabilities and deferred credits:
|
|||||||||||
|
Frequent flyer deferred revenue
|
2,565
|
|
26
|
|
2,591
|
|
|||||
|
Deferred income taxes
|
225
|
|
(21
|
)
|
204
|
|
|||||
|
Stockholders' equity:
|
|||||||||||
|
Retained earnings
|
$
|
4,621
|
|
$
|
(72
|
)
|
$
|
4,549
|
|
||
The Company adopted Accounting Standards Update No. 2016-01,
Financial Instruments—Overall
(Subtopic 825-10) effective January 1, 2018. This standard made several changes, including the elimination of the available-for-sale classification of equity investments, and requires equity investments with readily determinable fair values to be measured at fair value with changes in fair value recognized in earnings. The Company reclassified to retained earnings
$6 million
of unrealized loss, net of tax, on the Company's investment in Azul, S.A. ("Azul") which was previously classified as an available-for-sale security. See Notes 6 and 9 to the financial statements included in this Part II, Item 8 for additional information.
60
In June 2016, the FASB issued Accounting Standards Update No. 2016-13,
Financial Instruments—Credit Losses
("ASU 2016-13"). The main objective is to provide financial statement users with more decision-useful information about the expected credit losses on financial instruments and other commitments to extend credit held by a reporting entity at each reporting date. The amendments in this update replace the incurred loss methodology with a methodology that reflects expected credit losses and requires consideration of a broader range of reasonable and supportable information to calculate credit loss estimates. For trade receivables, loans and held-to-maturity debt securities, entities will be required to estimate lifetime expected credit losses. For available-for-sale debt securities, entities will be required to recognize an allowance for credit losses rather than a reduction to the carrying value of the asset. The amendments are effective for public business entities for fiscal years and interim periods beginning after December 15, 2019. The Company is evaluating the impact the adoption of ASU 2016-13 will have on its consolidated financial statements and believes that it will not have a material impact on its consolidated financial statements.
In 2016, the FASB amended the FASB Accounting Standards Codification and created a new Topic 842,
Leases
(the "New Lease Standard"). The guidance requires lessees to recognize a right-of-use asset and a lease liability for all leases (with the exception of short-term leases) at the commencement date and recognize expenses on their income statements similar to the current Topic 840,
Leases
("Topic 840"). The New Lease Standard is effective for fiscal years and interim periods beginning after December 15, 2018. The Company adopted this standard on January 1, 2019 using a modified retrospective approach for all leases existing at or commencing after the date of initial application and utilizing certain practical expedients.
The adoption of the New Lease Standard is expected to impact our reported results as shown in the tables below (in millions, except per share amounts):
61
|
Consolidated Balance Sheets as of December 31,
|
|||||||||||||||||||||||
|
As Reported
|
New Lease Standard Adjustments
|
As Adjusted
|
|||||||||||||||||||||
|
|
2018
|
2017
|
2018
|
2017
|
2018
|
2017
|
|||||||||||||||||
|
Current assets:
|
|||||||||||||||||||||||
|
Receivables, less allowance for doubtful accounts
|
$
|
1,346
|
|
$
|
1,340
|
|
$
|
80
|
|
$
|
126
|
|
$
|
1,426
|
|
$
|
1,466
|
|
|||||
|
Prepaid expenses and other
|
913
|
|
1,071
|
|
(180
|
)
|
(208
|
)
|
733
|
|
863
|
|
|||||||||||
|
|
|
||||||||||||||||||||||
|
Operating property and equipment:
|
|
|
|
|
|
|
|||||||||||||||||
|
Other property and equipment (owned)
|
7,919
|
|
6,946
|
|
(1,041
|
)
|
(922
|
)
|
6,878
|
|
6,024
|
|
|||||||||||
|
Less-Accumulated depreciation and amortization (owned)
|
(12,760
|
)
|
(11,159
|
)
|
140
|
|
92
|
|
(12,620
|
)
|
(11,067
|
)
|
|||||||||||
|
Flight equipment (finance leases) (a)
|
1,029
|
|
1,151
|
|
(37
|
)
|
(211
|
)
|
992
|
|
940
|
|
|||||||||||
|
Less-Accumulated amortization
|
(654
|
)
|
(777
|
)
|
8
|
|
169
|
|
(646
|
)
|
(608
|
)
|
|||||||||||
|
Operating lease assets
|
|
|
|||||||||||||||||||||
|
Flight equipment
|
—
|
|
—
|
|
2,380
|
|
3,102
|
|
2,380
|
|
3,102
|
|
|||||||||||
|
Other property and equipment
|
—
|
|
—
|
|
2,882
|
|
2,975
|
|
2,882
|
|
2,975
|
|
|||||||||||
|
|
|
|
|||||||||||||||||||||
|
Current liabilities:
|
|
|
|
|
|
|
|||||||||||||||||
|
Current maturities of finance leases (a)
|
149
|
|
128
|
|
(26
|
)
|
(50
|
)
|
123
|
|
78
|
|
|||||||||||
|
Current maturities of operating leases
|
—
|
|
—
|
|
719
|
|
949
|
|
719
|
|
949
|
|
|||||||||||
|
Other
|
619
|
|
576
|
|
(66
|
)
|
(58
|
)
|
553
|
|
518
|
|
|||||||||||
|
Long-term obligations under finance leases (a)
|
1,134
|
|
996
|
|
(910
|
)
|
(766
|
)
|
224
|
|
230
|
|
|||||||||||
|
Long-term obligations under operating leases
|
—
|
|
—
|
|
5,276
|
|
5,789
|
|
5,276
|
|
5,789
|
|
|||||||||||
|
Other liabilities and deferred credits:
|
|
|
|||||||||||||||||||||
|
Deferred income taxes
|
814
|
|
204
|
|
14
|
|
16
|
|
828
|
|
220
|
|
|||||||||||
|
Other
|
1,832
|
|
1,832
|
|
(822
|
)
|
(811
|
)
|
1,010
|
|
1,021
|
|
|||||||||||
|
Stockholders' equity:
|
|
|
|
|
|
|
|||||||||||||||||
|
Retained earnings
|
6,668
|
|
4,549
|
|
47
|
|
54
|
|
6,715
|
|
4,603
|
|
|||||||||||
(a) Finance leases, under the New Lease Standard, are the equivalent of capital leases under Topic 840.
The adoption of the New Lease Standard primarily resulted in the recording of assets and obligations of our operating leases on our consolidated balance sheets. Certain amounts recorded for prepaid and accrued rent associated with historical operating leases were reclassified to the newly captioned Operating lease assets in the consolidated balance sheets. Also, certain leases designated under Topic 840 as owned assets and capitalized finance leases will not be considered assets under the New Lease Standard and will be removed from the consolidated balance sheets, along with the related capital lease liability.
62
|
Statements of Consolidated Operations for the Years Ended December 31,
|
|||||||||||||||||||||||
|
|
As Reported
|
New Lease Standard Adjustments
|
As Adjusted
|
||||||||||||||||||||
|
2018
|
2017
|
2018
|
2017
|
2018
|
2017
|
||||||||||||||||||
|
Operating expense:
|
|||||||||||||||||||||||
|
Regional capacity purchase
|
$
|
2,601
|
|
$
|
2,232
|
|
$
|
48
|
|
$
|
36
|
|
$
|
2,649
|
|
$
|
2,268
|
|
|||||
|
Landing fees and other rent
|
2,359
|
|
2,240
|
|
90
|
|
70
|
|
2,449
|
|
2,310
|
|
|||||||||||
|
Depreciation and amortization
|
2,240
|
|
2,149
|
|
(75
|
)
|
(53
|
)
|
2,165
|
|
2,096
|
|
|||||||||||
|
Total operating expenses
|
38,011
|
|
34,113
|
|
63
|
|
53
|
|
38,074
|
|
34,166
|
|
|||||||||||
|
Operating income
|
3,292
|
|
3,671
|
|
(63
|
)
|
(53
|
)
|
3,229
|
|
3,618
|
|
|||||||||||
|
Nonoperating income (expense):
|
|||||||||||||||||||||||
|
Interest expense
|
(729
|
)
|
(671
|
)
|
59
|
|
45
|
|
(670
|
)
|
(626
|
)
|
|||||||||||
|
Interest capitalized
|
70
|
|
84
|
|
(5
|
)
|
(10
|
)
|
65
|
|
74
|
|
|||||||||||
|
Total nonoperating expense, net
|
(634
|
)
|
(631
|
)
|
53
|
|
36
|
|
(581
|
)
|
(595
|
)
|
|||||||||||
|
Income before income taxes
|
2,658
|
|
3,040
|
|
(10
|
)
|
(17
|
)
|
2,648
|
|
3,023
|
|
|||||||||||
|
Income tax expense
|
529
|
|
896
|
|
(3
|
)
|
(16
|
)
|
526
|
|
880
|
|
|||||||||||
|
Net income
|
$
|
2,129
|
|
$
|
2,144
|
|
$
|
(7
|
)
|
$
|
(1
|
)
|
$
|
2,122
|
|
$
|
2,143
|
|
|||||
|
Earnings per share, basic
|
$
|
7.73
|
|
$
|
7.08
|
|
$
|
(0.03
|
)
|
$
|
—
|
|
$
|
7.70
|
|
$
|
7.08
|
|
|||||
|
Earnings per share, diluted
|
$
|
7.70
|
|
$
|
7.06
|
|
$
|
(0.03
|
)
|
$
|
—
|
|
$
|
7.67
|
|
$
|
7.06
|
|
|||||
The expense for leases under the New Lease Standard will continue to be classified in their historical income statement captions (primarily in Aircraft rent, Landing fees and other rent and Regional capacity purchase in our statements of consolidated operations). The adoption of the New Lease Standard also resulted in the recharacterization of certain leases from capital leases under Topic 840 to operating leases under the New Lease Standard. This change will result in less depreciation and amortization and interest expense associated with capital leases offset by higher lease expense associated with operating leases. The change is associated with leases of aircraft under certain CPAs and certain airport facilities. The reduction in capitalized interest is also associated with the same airport facilities.
63
NOTE 2 - GOODWILL AND OTHER INTANGIBLE ASSETS
The following table presents information about the Company's goodwill and other intangible assets at December 31 (in millions):
|
2018
|
2017
|
|||||||||||||||
|
Item
|
Gross
Carrying
Amount
|
Accumulated
Amortization
|
Gross
Carrying
Amount
|
Accumulated
Amortization
|
||||||||||||
|
Goodwill
|
$
|
4,523
|
|
$
|
4,523
|
|
||||||||||
|
Finite-lived intangible assets
|
||||||||||||||||
|
Frequent flyer database
|
$
|
1,177
|
|
$
|
884
|
|
$
|
1,177
|
|
$
|
832
|
|
||||
|
Hubs
|
145
|
|
97
|
|
145
|
|
89
|
|
||||||||
|
Contracts
|
120
|
|
106
|
|
121
|
|
103
|
|
||||||||
|
Patents and tradenames
|
108
|
|
108
|
|
108
|
|
108
|
|
||||||||
|
Airport slots and gates
|
97
|
|
97
|
|
97
|
|
97
|
|
||||||||
|
Other
|
109
|
|
88
|
|
109
|
|
84
|
|
||||||||
|
Total
|
$
|
1,756
|
|
$
|
1,380
|
|
$
|
1,757
|
|
$
|
1,313
|
|
||||
|
Indefinite-lived intangible assets
|
||||||||||||||||
|
Route authorities
|
$
|
1,240
|
|
$
|
1,562
|
|
||||||||||
|
Airport slots and gates
|
546
|
|
536
|
|
||||||||||||
|
Tradenames and logos
|
593
|
|
593
|
|
||||||||||||
|
Alliances
|
404
|
|
404
|
|
||||||||||||
|
Total
|
$
|
2,783
|
|
$
|
3,095
|
|
||||||||||
Amortization expense in
2018
,
2017
and
2016
was
$67 million
,
$79 million
and
$90 million
, respectively. Projected amortization expense in
2019
,
2020
,
2021
,
2022
and
2023
is
$61 million
,
$55 million
,
$50 million
,
$40 million
and
$37 million
, respectively.
See Note 14 of this report for additional information related to impairment of intangible assets.
NOTE 3 - COMMON STOCKHOLDERS' EQUITY AND PREFERRED SECURITIES
In
2018
, UAL repurchased approximately
17.5 million
shares of UAL common stock for
$1.2 billion
. In December 2017, UAL's Board of Directors authorized a
$3.0 billion
share repurchase program to acquire UAL's common stock. As of
December 31, 2018
, the Company had approximately
$1.8 billion
remaining to purchase shares under its share repurchase program. UAL may repurchase shares through the open market, privately negotiated transactions, block trades or accelerated share repurchase transactions from time to time in accordance with applicable securities laws. UAL may repurchase shares of UAL common stock subject to prevailing market conditions, and may discontinue such repurchases at any time. See Part II, Item 5, Market for registrant's common equity, related stockholder matters and issuer purchases of equity securities, of this report for additional information.
At
December 31, 2018
, approximately
10 million
shares of UAL's common stock were reserved for future issuance related to the issuance of equity-based awards under the Company's incentive compensation plans.
As of
December 31, 2018
, UAL had
two
shares of junior preferred stock (par value
$0.01
per share) outstanding. In addition, UAL is authorized to issue
250 million
shares of preferred stock (without par value) under UAL's amended and restated certificate of incorporation.
64
NOTE 4 - EARNINGS PER SHARE
The computations of UAL's basic and diluted earnings per share are set forth below for the years ended December 31 (in millions, except per share amounts):
|
2018
|
2017 (a)
|
2016 (a)
|
||||||||||
|
Earnings available to common stockholders
|
$
|
2,129
|
|
$
|
2,144
|
|
$
|
2,234
|
|
|||
|
Basic weighted-average shares outstanding
|
275.5
|
|
302.7
|
|
329.9
|
|
||||||
|
Effect of employee stock awards
|
1.2
|
|
0.9
|
|
0.4
|
|
||||||
|
Diluted weighted-average shares outstanding
|
276.7
|
|
303.6
|
|
330.3
|
|
||||||
|
Earnings per share, basic
|
$
|
7.73
|
|
$
|
7.08
|
|
$
|
6.77
|
|
|||
|
Earnings per share, diluted
|
$
|
7.70
|
|
$
|
7.06
|
|
$
|
6.76
|
|
|||
(a) Amounts adjusted due to the adoption of Accounting Standards Update No. 2014-09,
Revenue from Contracts with Customers (Topic 606).
See Note 1 to the financial statements contained in Part II, Item 8 of this report for additional information.
The number of antidilutive securities excluded from the computation of diluted earnings per share amounts was not material.
NOTE 5 - SHARE-BASED COMPENSATION PLANS
UAL maintains several share-based compensation plans. These plans provide for grants of non-qualified stock options, incentive stock options (within the meaning of Section 422 of the Internal Revenue Code of 1986), stock appreciation rights, restricted shares, RSUs, performance compensation awards, performance units, cash incentive awards, other equity-based and equity-related awards, and dividends and dividend equivalents.
All awards are recorded as either equity or a liability in the Company's consolidated balance sheets. The share-based compensation expense is recorded in salaries and related costs.
During
2018
, UAL granted share-based compensation awards pursuant to the United Continental Holdings, Inc. 2017 Incentive Compensation Plan. These share-based compensation awards included approximately
1.8 million
RSUs consisting of
1.1 million
time-vested RSUs and
0.7 million
performance-based RSUs. The time-vested RSUs vest pro-rata, a majority of which vest on February 28th of each year over a
three
-year period from the date of grant. These RSUs are generally equity awards settled in stock for domestic employees and liability awards settled in cash for international employees. The cash payments are based on the
20
-day average closing price of UAL common stock immediately prior to the vesting date. The performance-based RSUs vest based on the Company's relative improvement in pre-tax margin compared to a group of airline industry peers for the
three
years ending
December 31
, 2020. If the performance condition is achieved, cash payments will be made after the end of the performance period based on the
20
-day average closing price of UAL common stock immediately prior to the vesting date and based on the level, if any, of the performance goal achieved. The Company accounts for the performance-based RSUs as liability awards.
The following table provides information related to UAL's share-based compensation plan cost for the years ended December 31 (in millions):
|
2018
|
2017
|
2016
|
||||||||||
|
Compensation cost:
|
||||||||||||
|
RSUs
|
$
|
98
|
|
$
|
63
|
|
$
|
58
|
|
|||
|
Restricted stock
|
2
|
|
8
|
|
11
|
|
||||||
|
Stock options
|
1
|
|
2
|
|
1
|
|
||||||
|
Total
|
$
|
101
|
|
$
|
73
|
|
$
|
70
|
|
|||
65
The table below summarizes UAL's unearned compensation and weighted-average remaining period to recognize costs for all outstanding share-based awards that are probable of being achieved as of December 31,
2018
(in millions, except as noted):
|
Unearned Compensation
|
Weighted-
Average
Remaining Period
(in years)
|
|||||
|
RSUs
|
$
|
66
|
|
1.6
|
||
|
Stock options
|
2
|
|
2.6
|
|||
|
Total
|
$
|
68
|
|
|||
RSUs and Restricted Stock
. All performance-based RSUs, as well as a portion of the outstanding time-vested RSUs, will be settled in cash. As of
December 31, 2018
, UAL had recorded a liability of
$51 million
related to its RSUs. UAL paid
$28 million
,
$50 million
and
$69 million
related to its RSUs during
2018
,
2017
and
2016
, respectively.
The table below summarizes UAL's RSUs and restricted stock activity for the years ended December 31 (shares in millions):
|
Liability Awards
|
Equity Awards
|
||||||||||||||||
|
RSUs
|
RSUs
|
Weighted-
Average
Grant Price
|
Restricted
Stock
|
Weighted-
Average
Grant Price
|
|||||||||||||
|
Outstanding at December 31, 2015
|
2.6
|
|
—
|
|
$
|
—
|
|
0.3
|
|
$
|
48.68
|
|
|||||
|
Granted
|
1.0
|
|
0.9
|
|
51.60
|
|
0.4
|
|
50.63
|
|
|||||||
|
Vested
|
(1.4
|
)
|
—
|
|
—
|
|
(0.1
|
)
|
41.47
|
|
|||||||
|
Forfeited
|
(0.1
|
)
|
(0.1
|
)
|
50.57
|
|
(0.1
|
)
|
53.42
|
|
|||||||
|
Outstanding at December 31, 2016
|
2.1
|
|
0.8
|
|
51.67
|
|
0.5
|
|
52.00
|
|
|||||||
|
Granted
|
0.6
|
|
1.0
|
|
71.68
|
|
—
|
|
—
|
|
|||||||
|
Vested
|
(0.7
|
)
|
(0.3
|
)
|
51.81
|
|
(0.2
|
)
|
51.60
|
|
|||||||
|
Forfeited
|
(0.2
|
)
|
(0.1
|
)
|
57.49
|
|
—
|
|
—
|
|
|||||||
|
Outstanding at December 31, 2017
|
1.8
|
|
1.4
|
|
63.99
|
|
0.3
|
|
52.30
|
|
|||||||
|
Granted
|
0.7
|
|
1.1
|
|
67.74
|
|
—
|
|
—
|
|
|||||||
|
Vested
|
(0.5
|
)
|
(0.5
|
)
|
63.02
|
|
(0.2
|
)
|
53.24
|
|
|||||||
|
Forfeited
|
(0.1
|
)
|
(0.2
|
)
|
67.34
|
|
—
|
|
—
|
|
|||||||
|
Outstanding at December 31, 2018
|
1.9
|
|
1.8
|
|
66.29
|
|
0.1
|
|
51.17
|
|
|||||||
The fair value of RSUs and restricted stock that vested in
2018
,
2017
and
2016
was
$70 million
,
$76 million
and
$80 million
, respectively. The fair value of the restricted stock and the stock-settled RSUs was based upon the UAL common stock price on the date of grant. These awards are accounted for as equity awards. The fair value of the cash-settled RSUs was based on the UAL common stock price as of the last day preceding the settlement date. These awards are accounted for as liability awards. Restricted stock vesting and the recognition of the expense is similar to the stock option vesting described below.
Stock Options
. During
2018
, UAL did not grant any stock option awards. In
2017
, UAL granted approximately
36,000
stock options with exercise prices equal to the fair market value of UAL's common stock on the date of grant with a weighted-average exercise price of
$77.56
and a weighted-average grant date fair value of approximately
$0.7 million
. In 2016, UAL granted approximately
0.1 million
stock options with exercise prices equal to the fair market value of UAL's common stock on the date of grant and an additional approximately
0.3 million
stock options with exercise prices at a
25%
premium of the grant date fair market value resulting in a weighted-average exercise price of
$56.19
and a weighted-average grant date fair value of approximately
$2.3 million
. Expense related to each portion of an option grant is recognized on a straight-line basis over the specific vesting period for those options.
The Company determined the grant date fair value of stock options using a Black-Scholes option pricing model, which requires the use of several assumptions. The risk-free interest rate is based on the U.S. treasury yield curve in effect for the expected term of the option at the time of grant. The dividend yield on UAL's common stock was assumed to be zero since UAL did not have any plans to pay dividends at the time of the option grants. The volatility assumptions were based upon historical volatilities of UAL using daily stock price returns equivalent to the expected term of the option. The expected term of the
66
options was determined based upon a simplified assumption that the option will be exercised evenly from vesting to expiration due to the Company's lack of relevant historical data related to stock options.
As of
December 31, 2018
, there were approximately
0.4 million
outstanding stock option awards,
0.2 million
of which were exercisable, with weighted-average exercise prices of
$55.62
and
$47.07
, respectively, intrinsic values of
$12 million
and
$6 million
, respectively, and weighted-average remaining contractual lives (in years) of
5.8
and
3.8
, respectively.
NOTE 6 - ACCUMULATED OTHER COMPREHENSIVE INCOME (LOSS)
The tables below present the components of the Company's AOCI, net of tax (in millions):
|
Pension and
Other
Postretirement
Liabilities
|
Fuel Derivatives Contracts
|
Investments and Other
|
Deferred Taxes
|
Total
|
|||||||||||||||
|
Balance at December 31, 2015
|
$
|
(363
|
)
|
$
|
(215
|
)
|
$
|
3
|
|
$
|
(256
|
)
|
$
|
(831
|
)
|
||||
|
Other comprehensive income (loss) before reclassifications
|
(517
|
)
|
(a)
|
(4
|
)
|
—
|
|
187
|
|
(334
|
)
|
||||||||
|
Amounts reclassified from accumulated other comprehensive income
|
26
|
|
217
|
|
(2
|
)
|
95
|
|
336
|
|
|||||||||
|
Balance at December 31, 2016
|
(854
|
)
|
(2
|
)
|
1
|
|
26
|
|
(829
|
)
|
|||||||||
|
Other comprehensive income (loss) before reclassifications
|
(306
|
)
|
(a)
|
—
|
|
(7
|
)
|
74
|
|
(239
|
)
|
||||||||
|
Amounts reclassified from accumulated other comprehensive income
|
58
|
|
2
|
|
—
|
|
(21
|
)
|
39
|
|
|||||||||
|
Reclassification of stranded tax effects
|
—
|
|
—
|
|
—
|
|
(118
|
)
|
(b)
|
(118
|
)
|
||||||||
|
Balance at December 31, 2017
|
(1,102
|
)
|
—
|
|
(6
|
)
|
(39
|
)
|
(1,147
|
)
|
|||||||||
|
Other comprehensive income (loss) before reclassifications
|
377
|
|
(a)
|
—
|
|
(5
|
)
|
(83
|
)
|
289
|
|
||||||||
|
Amounts reclassified from accumulated other comprehensive income
|
62
|
|
—
|
|
—
|
|
(13
|
)
|
49
|
|
|||||||||
|
Amounts reclassified to retained earnings
|
—
|
|
—
|
|
7
|
|
(1
|
)
|
6
|
|
|||||||||
|
Balance at December 31, 2018
|
$
|
(663
|
)
|
$
|
—
|
|
$
|
(4
|
)
|
$
|
(136
|
)
|
|
$
|
(803
|
)
|
|||
|
Details about AOCI Components
|
Amount Reclassified from AOCI to Income
|
Affected Line Item in the Statement Where Net Income is Presented
|
||||||||||||
|
Year Ended December 31,
|
||||||||||||||
|
2018
|
2017
|
2016
|
||||||||||||
|
Fuel derivative contracts
|
||||||||||||||
|
Fuel contracts-reclassifications of losses into earnings
|
$
|
—
|
|
$
|
2
|
|
$
|
217
|
|
Aircraft fuel
|
||||
|
Pension and Postretirement liabilities and other
|
|
|||||||||||||
|
Amortization of unrecognized (gains) losses and prior service cost (c)
|
62
|
|
58
|
|
26
|
|
Miscellaneous, net
|
|||||||
|
Investments and other
|
||||||||||||||
|
Available-for-sale securities - reclassifications of gains into earnings
|
—
|
|
—
|
|
(2
|
)
|
Miscellaneous, net
|
|||||||
(a) Prior service credits decreased by
$3 million
,
$0 million
and increased by
$30 million
and actuarial losses decreased by approximately
$380 million
, and increased
$306 million
and
$560 million
for
2018
,
2017
and
2016
, respectively.
(b) This amount represents the reclassification from AOCI to RE of the stranded tax effects resulting from the enactment of the Tax Cuts and Jobs Act (the "Tax Act").
(c) This AOCI component is included in the computation of net periodic pension and other postretirement costs (see Note 8 of this report for additional information).
NOTE 7 - INCOME TAXES
The income tax provision (benefit) differed from amounts computed at the statutory federal income tax rate and consisted of the following significant components, as follows (in millions):
67
|
UAL
|
2018
|
2017 (a)
|
2016 (a)
|
|||||||||
|
Income tax provision at statutory rate
|
$
|
558
|
|
$
|
1,064
|
|
$
|
1,320
|
|
|||
|
State income taxes, net of federal income tax benefit
|
29
|
|
30
|
|
38
|
|
||||||
|
Foreign tax rate differential
|
(84
|
)
|
(43
|
)
|
—
|
|
||||||
|
Global intangible low-taxed income
|
4
|
|
—
|
|
—
|
|
||||||
|
Foreign income taxes
|
2
|
|
3
|
|
3
|
|
||||||
|
Nondeductible employee meals
|
12
|
|
17
|
|
16
|
|
||||||
|
Impact of Tax Act
|
(5
|
)
|
(179
|
)
|
—
|
|
||||||
|
Income tax adjustment from AOCI (b)
|
—
|
|
—
|
|
180
|
|
||||||
|
State rate change
|
3
|
|
12
|
|
(12
|
)
|
||||||
|
Valuation allowance
|
(3
|
)
|
(16
|
)
|
20
|
|
||||||
|
Other, net
|
13
|
|
8
|
|
(26
|
)
|
||||||
|
$
|
529
|
|
$
|
896
|
|
$
|
1,539
|
|
||||
|
Current
|
$
|
14
|
|
$
|
(77
|
)
|
$
|
(92
|
)
|
|||
|
Deferred
|
515
|
|
973
|
|
1,631
|
|
||||||
|
$
|
529
|
|
$
|
896
|
|
$
|
1,539
|
|
||||
|
United
|
2018
|
2017 (a)
|
2016 (a)
|
|||||||||
|
Income tax provision at statutory rate
|
$
|
559
|
|
$
|
1,065
|
|
$
|
1,321
|
|
|||
|
State income taxes, net of federal income tax
|
29
|
|
30
|
|
38
|
|
||||||
|
Foreign tax rate differential
|
(84
|
)
|
(43
|
)
|
—
|
|
||||||
|
Global intangible low-taxed income
|
4
|
|
—
|
|
—
|
|
||||||
|
Foreign income taxes
|
2
|
|
3
|
|
3
|
|
||||||
|
Nondeductible employee meals
|
12
|
|
17
|
|
16
|
|
||||||
|
Impact of Tax Act
|
(5
|
)
|
(196
|
)
|
—
|
|
||||||
|
Income tax adjustment from AOCI (b)
|
—
|
|
—
|
|
180
|
|
||||||
|
State rate change
|
3
|
|
12
|
|
(12
|
)
|
||||||
|
Valuation allowance
|
(3
|
)
|
(16
|
)
|
20
|
|
||||||
|
Other, net
|
12
|
|
7
|
|
(25
|
)
|
||||||
|
$
|
529
|
|
$
|
879
|
|
$
|
1,541
|
|
||||
|
Current
|
$
|
14
|
|
$
|
(77
|
)
|
$
|
(92
|
)
|
|||
|
Deferred
|
515
|
|
956
|
|
1,633
|
|
||||||
|
$
|
529
|
|
$
|
879
|
|
$
|
1,541
|
|
||||
(a) Amounts adjusted due to the adoption of Accounting Standards Update No. 2014-09,
Revenue from Contracts with Customers (Topic 606).
See Note 1 to the financial statements contained in Part II, Item 8 of this report for additional information.
(b) Prior to the release of the deferred income tax valuation allowance in the third quarter of 2015, the Company recorded approximately
$465 million
of valuation allowance adjustments in AOCI. Subsequent to the release of the deferred income tax valuation allowance in 2015, the
$465 million
debit remained within AOCI, of which
$180 million
related to losses on fuel hedges designated for hedge accounting and
$285 million
related to pension and other postretirement liabilities. Accounting rules required the adjustments to remain in AOCI as long as the Company had fuel derivatives designated for cash flow hedge accounting and the Company continues to provide pension and postretirement benefits. In 2016, the Company settled all of its fuel hedges and has not entered into any new fuel derivative contracts for hedge accounting. Accordingly, the Company reclassified the
$180 million
to income tax expense in 2016.
The Company's effective tax rate for the year ended December 31, 2018 differed from the federal statutory rate of
21%
due to a blend of federal, state and foreign taxes as well as the impact of certain nondeductible items.
On December 22, 2017, Congress enacted the Tax Act, which made significant changes to U.S. federal income tax laws, including reducing the corporate rate from 35% to 21% effective January 1, 2018. In December 2017, the SEC issued Staff Accounting Bulletin No. 118 ("SAB 118"), which allowed the Company to record provisional amounts related to the impact of
68
the Tax Act and to adjust those amounts during a measurement period not to extend more than one year from the date of enactment. Based on our current interpretation of the Tax Act and published Treasury and Internal Revenue Service ("IRS") guidance as of December 31, 2018, the Company's accounting for the impacts of the Tax Act is complete and the Company has not recorded any material adjustments to the provisional amounts under SAB 118. In 2018, we recorded an income tax benefit for the one-time transition tax of
$4 million
and have completed the re-measurement of our net deferred tax balances. The Tax Act included a Global Intangible Low-Taxed Income ("GILTI") provision which introduced a new tax on foreign income in excess of a deemed return on tangible business property of foreign subsidiaries. The GILTI provisions of the Tax Act became effective for the Company during 2018 and we elected to account for it in the period incurred (the "period cost method").
Temporary differences and carryforwards that give rise to deferred tax assets and liabilities at
December 31, 2018
and
2017
were as follows (in millions):
|
|
UAL
|
United
|
||||||||||||||
|
2018
|
2017
|
2018
|
2017
|
|||||||||||||
|
Deferred income tax asset (liability):
|
||||||||||||||||
|
Federal and state net operating loss ("NOL") carryforwards
|
$
|
398
|
|
$
|
601
|
|
$
|
372
|
|
$
|
574
|
|
||||
|
Deferred revenue
|
1,232
|
|
1,090
|
|
1,232
|
|
1,090
|
|
||||||||
|
Employee benefits, including pension, postretirement and medical
|
885
|
|
1,051
|
|
885
|
|
1,051
|
|
||||||||
|
Other
|
408
|
|
351
|
|
406
|
|
351
|
|
||||||||
|
Less: Valuation allowance
|
(59
|
)
|
(63
|
)
|
(59
|
)
|
(63
|
)
|
||||||||
|
Total deferred tax assets
|
$
|
2,864
|
|
$
|
3,030
|
|
$
|
2,836
|
|
$
|
3,003
|
|
||||
|
Depreciation
|
$
|
(2,929
|
)
|
$
|
(2,431
|
)
|
$
|
(2,929
|
)
|
$
|
(2,431
|
)
|
||||
|
Intangibles
|
(749
|
)
|
(803
|
)
|
(749
|
)
|
(803
|
)
|
||||||||
|
Total deferred tax liabilities
|
$
|
(3,678
|
)
|
$
|
(3,234
|
)
|
$
|
(3,678
|
)
|
$
|
(3,234
|
)
|
||||
|
Net deferred tax liability
|
$
|
(814
|
)
|
$
|
(204
|
)
|
$
|
(842
|
)
|
$
|
(231
|
)
|
||||
United and its domestic consolidated subsidiaries file a consolidated federal income tax return with UAL. Under an intercompany tax allocation policy, United and its subsidiaries compute, record and pay UAL for their own tax liability as if they were separate companies filing separate returns. In determining their own tax liabilities, United and each of its subsidiaries take into account all tax credits or benefits generated and utilized as separate companies and they are each compensated for the aforementioned tax benefits only if they would be able to use those benefits on a separate company basis.
The Company's federal and state NOL carryforwards relate to prior years' NOLs, which may be used to reduce tax liabilities in future years. These tax benefits are mostly attributable to federal pre-tax NOL carryforwards of
$1.6 billion
for UAL. If not utilized these federal pre-tax NOLs will expire as follows (in billions):
$0.6
in 2030,
$1.0
thereafter. In addition, for UAL the majority of tax benefits of the state NOLs of
$83
million will expire over a five to twenty year period. We have recorded a
$48 million
valuation allowance against these state NOLs.
The Company's unrecognized tax benefits related to uncertain tax positions were
$39 million
,
$21 million
and
$74 million
at December 31,
2018
,
2017
and
2016
, respectively. Included in the ending balance at
December 31, 2018
is
$39 million
that would affect the Company's effective tax rate if recognized. The changes in unrecognized tax benefits relating to settlements with taxing authorities, unrecognized tax benefits as a result of tax positions taken during a prior period and unrecognized tax benefits relating from a lapse of the statute of limitations were immaterial during
2018
,
2017
and
2016
. The Company does not expect significant increases or decreases in their unrecognized tax benefits within the next
12 months
. There are no material amounts included in the balance at
December 31, 2018
for tax positions for which the ultimate deductibility is highly certain but for which there is uncertainty about the timing of such deductibility.
The Company's federal income tax returns for tax years after 2002 remain subject to examination by the IRS and state taxing jurisdictions. Currently, there are no ongoing examinations of the Company's prior year tax returns being conducted by the IRS.
NOTE 8 - PENSION AND OTHER POSTRETIREMENT PLANS
The following summarizes the significant pension and other postretirement plans of United:
Pension Plans.
United maintains two primary defined benefit pension plans, one covering certain pilot employees and another covering certain U.S. non-pilot employees. Each of these plans provide benefits based on a combination of years of benefit
69
accruals service and an employee's final average compensation. Additional benefit accruals are frozen under the plan covering certain pilot employees and management and administrative employees. Benefit accruals for certain non-pilot employees continue. United maintains additional defined benefit pension plans, which cover certain international employees.
Other Postretirement Plans.
United maintains postretirement medical programs which provide medical benefits to certain retirees and eligible dependents, as well as life insurance benefits to certain retirees participating in the plan. Benefits provided are subject to applicable contributions, co-payments, deductibles and other limits as described in the specific plan documentation.
Actuarial assumption changes are reflected as a component of the net actuarial loss/(gain) during
2018
and
2017
. The 2018 actuarial gains were mainly related to an increase in the discount rate applied in
2018
compared to
2017
. These amounts will be amortized over the average remaining service life of the covered active employees or the average life expectancy of inactive participants. The impacts on
2018
and
2017
pension and retiree medical expense are presented below.
The following tables set forth the reconciliation of the beginning and ending balances of the benefit obligation and plan assets, the funded status and the amounts recognized in these financial statements for the defined benefit and other postretirement plans (in millions):
|
Pension Benefits
|
|||||||
|
Year Ended December 31, 2018
|
Year Ended December 31, 2017
|
||||||
|
Accumulated benefit obligation:
|
$
|
4,448
|
|
$
|
4,739
|
|
|
|
Change in projected benefit obligation:
|
|||||||
|
Projected benefit obligation at beginning of year
|
$
|
5,852
|
|
$
|
5,253
|
|
|
|
Service cost
|
228
|
|
195
|
|
|||
|
Interest cost
|
217
|
|
220
|
|
|||
|
Actuarial (gain) loss
|
(601
|
)
|
525
|
|
|||
|
Gross benefits paid and settlements
|
(292
|
)
|
(366
|
)
|
|||
|
Other
|
(8
|
)
|
25
|
|
|||
|
Projected benefit obligation at end of year
|
$
|
5,396
|
|
$
|
5,852
|
|
|
|
Change in plan assets:
|
|||||||
|
Fair value of plan assets at beginning of year
|
$
|
3,932
|
|
$
|
3,355
|
|
|
|
Actual (loss) return on plan assets
|
(215
|
)
|
510
|
|
|||
|
Employer contributions
|
413
|
|
419
|
|
|||
|
Gross benefits paid and settlements
|
(292
|
)
|
(366
|
)
|
|||
|
Other
|
(11
|
)
|
14
|
|
|||
|
Fair value of plan assets at end of year
|
$
|
3,827
|
|
$
|
3,932
|
|
|
|
Funded status—Net amount recognized
|
$
|
(1,569
|
)
|
$
|
(1,920
|
)
|
|
70
|
Pension Benefits
|
|||||||
|
December 31, 2018
|
December 31, 2017
|
||||||
|
Amounts recognized in the consolidated balance sheets consist of:
|
|||||||
|
Noncurrent asset
|
$
|
13
|
|
$
|
9
|
|
|
|
Current liability
|
(6
|
)
|
(8
|
)
|
|||
|
Noncurrent liability
|
(1,576
|
)
|
(1,921
|
)
|
|||
|
Total liability
|
$
|
(1,569
|
)
|
$
|
(1,920
|
)
|
|
|
Amounts recognized in accumulated other comprehensive loss consist of:
|
|||||||
|
Net actuarial loss
|
$
|
(1,382
|
)
|
$
|
(1,610
|
)
|
|
|
Prior service cost
|
(5
|
)
|
(1
|
)
|
|||
|
Total accumulated other comprehensive loss
|
$
|
(1,387
|
)
|
$
|
(1,611
|
)
|
|
|
Other Postretirement Benefits
|
|||||||
|
Year Ended December 31, 2018
|
Year Ended December 31, 2017
|
||||||
|
Change in benefit obligation:
|
|||||||
|
Benefit obligation at beginning of year
|
$
|
1,710
|
|
$
|
1,687
|
|
|
|
Service cost
|
12
|
|
13
|
|
|||
|
Interest cost
|
61
|
|
66
|
|
|||
|
Plan participants' contributions
|
68
|
|
68
|
|
|||
|
Benefits paid
|
(181
|
)
|
(178
|
)
|
|||
|
Actuarial loss (gain)
|
(285
|
)
|
40
|
|
|||
|
Other
|
6
|
|
14
|
|
|||
|
Benefit obligation at end of year
|
$
|
1,391
|
|
$
|
1,710
|
|
|
|
Change in plan assets:
|
|||||||
|
Fair value of plan assets at beginning of year
|
$
|
54
|
|
$
|
55
|
|
|
|
Actual return on plan assets
|
1
|
|
1
|
|
|||
|
Employer contributions
|
111
|
|
108
|
|
|||
|
Plan participants' contributions
|
68
|
|
68
|
|
|||
|
Benefits paid
|
(181
|
)
|
(178
|
)
|
|||
|
Fair value of plan assets at end of year
|
53
|
|
54
|
|
|||
|
Funded status—Net amount recognized
|
$
|
(1,338
|
)
|
$
|
(1,656
|
)
|
|
|
Other Postretirement Benefits
|
|||||||
|
December 31, 2018
|
December 31, 2017
|
||||||
|
Amounts recognized in the consolidated balance sheets consist of:
|
|||||||
|
Current liability
|
$
|
(43
|
)
|
$
|
(54
|
)
|
|
|
Noncurrent liability
|
(1,295
|
)
|
(1,602
|
)
|
|||
|
Total liability
|
$
|
(1,338
|
)
|
$
|
(1,656
|
)
|
|
|
Amounts recognized in accumulated other comprehensive income consist of:
|
|||||||
|
Net actuarial gain
|
$
|
554
|
|
$
|
301
|
|
|
|
Prior service credit
|
170
|
|
208
|
|
|||
|
Total accumulated other comprehensive income
|
$
|
724
|
|
$
|
509
|
|
|
71
The following information relates to all pension plans with an accumulated benefit obligation and a projected benefit obligation in excess of plan assets at December 31 (in millions):
|
2018
|
2017
|
||||||
|
Projected benefit obligation
|
$
|
5,196
|
|
$
|
5,637
|
|
|
|
Accumulated benefit obligation
|
4,286
|
|
4,567
|
|
|||
|
Fair value of plan assets
|
3,614
|
|
3,709
|
|
|||
Net periodic benefit cost for the years ended December 31 included the following components (in millions):
|
2018
|
2017
|
2016
|
|||||||||||||||||||||
|
Pension Benefits
|
Other Postretirement Benefits
|
Pension Benefits
|
Other Postretirement Benefits
|
Pension Benefits
|
Other Postretirement Benefits
|
||||||||||||||||||
|
Service cost
|
$
|
228
|
|
$
|
12
|
|
$
|
195
|
|
$
|
13
|
|
$
|
112
|
|
$
|
19
|
|
|||||
|
Interest cost
|
217
|
|
61
|
|
220
|
|
66
|
|
200
|
|
86
|
|
|||||||||||
|
Expected return on plan assets
|
(292
|
)
|
(2
|
)
|
(243
|
)
|
(2
|
)
|
(216
|
)
|
(2
|
)
|
|||||||||||
|
Curtailment gain
|
—
|
|
—
|
|
—
|
|
—
|
|
—
|
|
(107
|
)
|
|||||||||||
|
Amortization of unrecognized actuarial (gain) loss
|
130
|
|
(32
|
)
|
128
|
|
(33
|
)
|
76
|
|
(19
|
)
|
|||||||||||
|
Amortization of prior service credits
|
—
|
|
(37
|
)
|
—
|
|
(37
|
)
|
—
|
|
(31
|
)
|
|||||||||||
|
Other
|
1
|
|
—
|
|
5
|
|
—
|
|
5
|
|
—
|
|
|||||||||||
|
Net periodic benefit cost (credit)
|
$
|
284
|
|
$
|
2
|
|
$
|
305
|
|
$
|
7
|
|
$
|
177
|
|
$
|
(54
|
)
|
|||||
Service cost is recorded in Salaries and related costs on the statement of consolidated operations. All other components of net periodic benefit costs are recorded in Miscellaneous, net on the statement of consolidated operations.
See Note 14 of this report for additional information related to the curtailment gain recorded in 2016.
The assumptions used for the benefit plans were as follows:
|
Pension Benefits
|
||||||
|
Assumptions used to determine benefit obligations
|
2018
|
2017
|
||||
|
Discount rate
|
4.20
|
%
|
3.65
|
%
|
||
|
Rate of compensation increase
|
3.89
|
%
|
3.89
|
%
|
||
|
Assumptions used to determine net expense
|
||||||
|
Discount rate
|
3.65
|
%
|
4.19
|
%
|
||
|
Expected return on plan assets
|
7.31
|
%
|
7.02
|
%
|
||
|
Rate of compensation increase
|
3.89
|
%
|
3.54
|
%
|
||
|
Other Postretirement Benefits
|
||||||
|
Assumptions used to determine benefit obligations
|
2018
|
2017
|
||||
|
Discount rate
|
4.30
|
%
|
3.63
|
%
|
||
|
Assumptions used to determine net expense
|
||||||
|
Discount rate
|
3.63
|
%
|
4.07
|
%
|
||
|
Expected return on plan assets
|
3.00
|
%
|
3.00
|
%
|
||
|
Health care cost trend rate assumed for next year
|
6.00
|
%
|
6.25
|
%
|
||
|
Rate to which the cost trend rate is assumed to decline (ultimate trend rate in 2023)
|
5.00
|
%
|
5.00
|
%
|
||
The Company used the Society of Actuaries' 2014 mortality tables, modified to reflect the Social Security Administration
Trustee's Report on current projections regarding expected longevity improvements.
The Company selected the
2018
discount rate for substantially all of its plans by using a hypothetical portfolio of high quality bonds at
December 31, 2018
, that would provide the necessary cash flows to match projected benefit payments.
72
We develop our expected long-term rate of return assumption for our defined benefit plans based on historical experience and by evaluating input from the trustee managing the plans' assets.
Our expected long-term rate of return on plan assets for these plans is based on a target allocation of assets, which is based on our goal of earning the highest rate of return while maintaining risk at acceptable levels. The plans strive to have assets sufficiently diversified so that adverse or unexpected results from one security class will not have an unduly detrimental impact on the entire portfolio. Plan fiduciaries regularly review our actual asset allocation and the pension plans' investments are periodically rebalanced to our targeted allocation when considered appropriate. United's plan assets are allocated within the following guidelines:
|
|
Percent of Total
|
Expected Long-Term
Rate of Return
|
|||
|
Equity securities
|
30-45
|
%
|
9.5
|
%
|
|
|
Fixed-income securities
|
30-40
|
|
5.8
|
|
|
|
Alternatives
|
10-25
|
|
7.3
|
|
|
|
Other
|
0-10
|
|
7.8
|
|
|
One-hundred percent of other postretirement plan assets are invested in a deposit administration fund.
A one percentage point decrease in the weighted average discount rate would increase the Company's postretirement benefit liability by approximately
$139 million
and increase the estimated
2018
benefits expense by approximately
$10 million
.
Fair Value Information.
Accounting standards require us to use valuation techniques to measure fair value that maximize the use of observable inputs and minimize the use of unobservable inputs. These inputs are prioritized as follows:
|
Level 1
|
Unadjusted quoted prices in active markets for assets or liabilities identical to those to be reported at fair value
|
||||||
|
Level 2
|
Other inputs that are observable directly or indirectly, such as quoted prices for similar assets or liabilities or market-corroborated inputs
|
||||||
|
Level 3
|
Unobservable inputs for which there is little or no market data and which require us to develop our own assumptions about how market participants would price the assets or liabilities
|
||||||
Assets and liabilities measured at fair value are based on the valuation techniques identified in the tables below. The valuation techniques are as follows:
(a)
Market approach.
Prices and other relevant information generated by market transactions involving identical or comparable assets and liabilities; and
(b)
Income approach.
Techniques to convert future amounts to a single current value based on market expectations (including present value techniques, option-pricing and excess earnings models).
The following tables present information about United's pension and other postretirement plan assets at
December 31,
(in millions):
|
2018
|
2017
|
||||||||||||||||||||||||||||||||||||||||
|
Pension Plan Assets:
|
Total
|
Level 1
|
Level 2
|
Level 3
|
Assets Measured at NAV(a)
|
Total
|
Level 1
|
Level 2
|
Level 3
|
Assets Measured at NAV(a)
|
|||||||||||||||||||||||||||||||
|
Equity securities funds
|
$
|
1,394
|
|
$
|
254
|
|
$
|
106
|
|
$
|
—
|
|
$
|
1,034
|
|
$
|
1,406
|
|
$
|
269
|
|
$
|
133
|
|
$
|
—
|
|
$
|
1,004
|
|
|||||||||||
|
Fixed-income securities
|
1,431
|
|
—
|
|
605
|
|
21
|
|
805
|
|
1,470
|
|
—
|
|
834
|
|
18
|
|
618
|
|
|||||||||||||||||||||
|
Alternatives
|
596
|
|
—
|
|
—
|
|
134
|
|
462
|
|
637
|
|
—
|
|
—
|
|
139
|
|
498
|
|
|||||||||||||||||||||
|
Other investments
|
406
|
|
224
|
|
40
|
|
142
|
|
—
|
|
419
|
|
32
|
|
124
|
|
172
|
|
91
|
|
|||||||||||||||||||||
|
Total
|
$
|
3,827
|
|
$
|
478
|
|
$
|
751
|
|
$
|
297
|
|
$
|
2,301
|
|
$
|
3,932
|
|
$
|
301
|
|
$
|
1,091
|
|
$
|
329
|
|
$
|
2,211
|
|
|||||||||||
|
Other Postretirement Benefit Plan Assets:
|
|||||||||||||||||||||||||||||||||||||||||
|
Deposit administration fund
|
$
|
53
|
|
$
|
—
|
|
$
|
—
|
|
$
|
53
|
|
$
|
—
|
|
$
|
54
|
|
$
|
—
|
|
$
|
—
|
|
$
|
54
|
|
$
|
—
|
|
|||||||||||
(a) In accordance with the relevant accounting standards, certain investments that are measured at fair value using the net asset value ("NAV") per share (or its equivalent) have not been classified in the fair value hierarchy. These investments are commingled funds that invest in fixed-income instruments including bonds, debt securities, and other similar instruments issued by various U.S. and non-U.S. public- or private-sector entities. Redemption periods for these investments range from daily to semiannually.
73
Equity and Fixed-Income.
Equities include investments in both developed market and emerging market equity securities. Fixed-income includes primarily U.S. and non-U.S. government fixed-income securities and U.S. and non-U.S. corporate fixed-income securities.
Deposit Administration Fund.
This investment is a stable value investment product structured to provide investment income.
Alternatives.
Alternative investments consist primarily of investments in hedge funds, real estate and private equity interests.
Other investments.
Other investments consist of cash, insurance contracts and other funds.
The reconciliation of United's defined benefit plan assets measured at fair value using unobservable inputs (Level 3) for the years ended
December 31, 2018
and
2017
is as follows (in millions):
|
2018
|
2017
|
||||||
|
Balance at beginning of year
|
$
|
383
|
|
$
|
287
|
|
|
|
Actual return (loss) on plan assets:
|
|||||||
|
Sold during the year
|
10
|
|
7
|
|
|||
|
Held at year end
|
(21
|
)
|
16
|
|
|||
|
Purchases, sales, issuances and settlements (net)
|
(22
|
)
|
73
|
|
|||
|
Balance at end of year
|
$
|
350
|
|
$
|
383
|
|
|
Funding requirements for tax-qualified defined benefit pension plans are determined by government regulations. United's contributions reflected above have satisfied its required contributions through the
2018
calendar year. In
2019
, employer anticipated contributions to all of United's pension and postretirement plans are at least
$318 million
and approximately
$95 million
, respectively.
The estimated future benefit payments, net of expected participant contributions, in United's pension plans and other postretirement benefit plans as of
December 31, 2018
are as follows (in millions):
|
Pension
|
Other
Postretirement |
Other Postretirement—
subsidy receipts |
|||||||||
|
2019
|
$
|
329
|
|
$
|
100
|
|
$
|
5
|
|
||
|
2020
|
327
|
|
104
|
|
6
|
|
|||||
|
2021
|
353
|
|
108
|
|
6
|
|
|||||
|
2022
|
367
|
|
111
|
|
6
|
|
|||||
|
2023
|
379
|
|
113
|
|
7
|
|
|||||
|
Years 2024 – 2028
|
2,022
|
|
575
|
|
38
|
|
|||||
Defined Contribution Plans
Depending upon the employee group, employer contributions consist of matching contributions and/or non-elective employer contributions. United's employer contribution percentages vary from
1%
to
16%
of eligible earnings depending on the terms of each plan. United recorded expenses for its defined contribution plans of
$693 million
,
$656 million
and
$592 million
in the years ended
December 31, 2018
,
2017
and
2016
, respectively.
Multi-Employer Plans
United's participation in the IAM National Pension Plan ("IAM Plan") for the annual period ended
December 31, 2018
is outlined in the table below. There have been no significant changes that affect the comparability of
2018
and
2017
contributions. The risks of participating in these multi-employer plans are different from single-employer plans, as United may be subject to additional risks that others do not meet their obligations, which in certain circumstances could revert to United. The IAM Plan reported
$435 million
in employers' contributions for the year ended December 31,
2017
. For
2017
, the Company's contributions to the IAM Plan represented more than
5%
of total contributions to the IAM Plan. The 2018
74
information is not available as Form 5500 is not final for the plan year.
|
Pension Fund
|
IAM National Pension Fund
|
|
EIN/ Pension Plan Number
|
51-6031295 - 002
|
|
Pension Protection Act Zone Status (2018 and 2017)
|
Green Zone. Plans in the green zone are at least 80 percent funded.
|
|
FIP/RP Status Pending/Implemented
|
No
|
|
United's Contributions
|
$52 million, $50 million and $41 million in the years ended December 31, 2018, 2017 and 2016, respectively
|
|
Surcharge Imposed
|
No
|
|
Expiration Date of Collective Bargaining Agreement
|
N/A
|
Profit Sharing
Substantially all employees participate in profit sharing based on a percentage of pre-tax earnings, excluding special charges, profit sharing expense and share-based compensation. Profit sharing percentages range from
5%
to
20%
depending on the work group, and in some cases profit sharing percentages vary above and below certain pre-tax margin thresholds. Eligible U.S. co-workers in each participating work group receive a profit sharing payout using a formula based on the ratio of each qualified co-worker's annual eligible earnings to the eligible earnings of all qualified co-workers in all domestic work groups. Eligible non-U.S. co-workers receive profit sharing based on the calculation under the U.S. profit sharing plan for management and administrative employees. The Company recorded profit sharing and related payroll tax expense of
$334 million
,
$349 million
and
$628 million
in
2018
,
2017
and
2016
, respectively. Profit sharing expense is recorded as a component of Salaries and related costs in the Company's statements of consolidated operations.
NOTE 9 - INVESTMENTS AND FAIR VALUE MEASUREMENTS
Fair Value Information.
Accounting standards require us to use valuation techniques to measure fair value that maximize the use of observable inputs and minimize the use of unobservable inputs. These inputs are described in Note 8 of this report. The table below presents disclosures about the fair value of financial assets and liabilities measured at fair value on a recurring basis in the Company's financial statements as of December 31 (in millions):
|
2018
|
2017
|
||||||||||||||||||||||||||||||
|
Total
|
Level 1
|
|
Level 2
|
|
Level 3
|
|
Total
|
Level 1
|
|
Level 2
|
|
Level 3
|
|
||||||||||||||||||
|
Cash and cash equivalents
|
$
|
1,694
|
|
$
|
1,694
|
|
$
|
—
|
|
$
|
—
|
|
$
|
1,482
|
|
$
|
1,482
|
|
$
|
—
|
|
$
|
—
|
|
|||||||
|
Short-term investments:
|
|||||||||||||||||||||||||||||||
|
Corporate debt
|
1,023
|
|
—
|
|
1,023
|
|
—
|
|
958
|
|
—
|
|
958
|
|
—
|
|
|||||||||||||||
|
Asset-backed securities
|
746
|
|
—
|
|
746
|
|
—
|
|
753
|
|
—
|
|
753
|
|
—
|
|
|||||||||||||||
|
U.S. government and agency notes
|
108
|
|
—
|
|
108
|
|
—
|
|
113
|
|
—
|
|
113
|
|
—
|
|
|||||||||||||||
|
Certificates of deposit placed through an account registry service ("CDARS")
|
75
|
|
—
|
|
75
|
|
—
|
|
120
|
|
—
|
|
120
|
|
—
|
|
|||||||||||||||
|
Other fixed-income securities
|
116
|
|
—
|
|
116
|
|
—
|
|
188
|
|
—
|
|
188
|
|
—
|
|
|||||||||||||||
|
Other investments measured at NAV
|
188
|
|
—
|
|
—
|
|
—
|
|
184
|
|
—
|
|
—
|
|
—
|
|
|||||||||||||||
|
Restricted cash
|
105
|
|
105
|
|
—
|
|
—
|
|
109
|
|
109
|
|
—
|
|
—
|
|
|||||||||||||||
|
Long-term investments:
|
|
||||||||||||||||||||||||||||||
|
Equity securities
|
249
|
|
249
|
|
—
|
|
—
|
|
99
|
|
99
|
|
—
|
|
—
|
|
|||||||||||||||
|
Enhanced equipment trust certificates ("EETC")
|
18
|
|
—
|
|
—
|
|
18
|
|
22
|
|
—
|
|
—
|
|
22
|
|
|||||||||||||||
|
Avianca Holdings S.A. ("AVH") Derivative Assets
|
11
|
|
—
|
|
—
|
|
11
|
|
—
|
|
—
|
|
—
|
|
—
|
|
|||||||||||||||
Available-for-sale investment maturities
-
T
he short-term investments shown in the table above are classified as available-for-sale, with the exception of investments measured at NAV. As of
December 31, 2018
, asset-backed securities have remaining maturities of less than
one
year to approximately
16 years
, corporate debt securities have remaining maturities of less than
one
year to approximately
three
years and CDARS have maturities of less than
one
year. U.S. government and other securities have maturities of less than
one
year to approximately two years. The EETC securities mature in
2019
.
Restricted cash
-
Restricted cash primarily includes cash collateral for letters of credit and collateral associated with obligations for facility leases and other insurance-related obligations.
Equity securities
- Equity securities represent United's investment in Azul. In 2018, the Company invested
$138 million
in Azul thus increasing its preferred equity stake in Azul to approximately
8%
(representing approximately
2%
of the total capital
75
stock of Azul). The Company recognizes changes to the fair value of its equity investment in Azul in Miscellaneous, net in its statements of consolidated operations.
Synergy Term Loan
- On November 29, 2018, United, as lender, entered into a Term Loan Agreement (the "Synergy Loan Agreement") with affiliates of Synergy Aerospace Corporation ("Synergy"), as borrower and guarantor, respectively, and, pursuant to the Synergy Loan Agreement, on November 30, 2018, United provided a
$456 million
term loan to Synergy (the "Synergy Term Loan"), secured by a pledge of borrower's equity, as well as Synergy's
516 million
shares of common stock of AVH, the parent company of Avianca (equivalent to
64.5 million
American Depositary Receipts ("ADRs"), the class of AVH securities that trades on the New York Stock Exchange ("NYSE")). Pursuant to the Synergy Loan Agreement, the Synergy Term Loan is due and payable in five annual installments beginning on November 30, 2021, to be repaid in full on November 30, 2025 (a portion of which is subject to extension in limited circumstances). Subject to the satisfaction of collateral coverage thresholds, minimum share price levels and certain other conditions, Synergy may repay United in shares of AVH common stock, at market value, in an amount up to
25 percent
of any principal installment, or with cash from the sale of Synergy's shares of AVH stock. The Synergy Term Loan bears interest at an annual rate of
3 percent
per annum, payable quarterly in arrears. United also obtained an option to acquire, on a gross or net basis and at a fixed price, up to
77.4 million
shares of AVH common stock from Synergy (the "AVH Call Options"), and agreed with Synergy to share in any increase in value of the remaining
438.6 million
shares of Synergy's AVH common stock within certain price ranges (the "AVH Share Appreciation Rights"). Until the third anniversary of funding, Synergy has the option to capitalize interest that would have been due, adding it to the outstanding principal balance of the Synergy Term Loan. Pursuant to the Synergy Loan Agreement, Synergy has agreed to certain financial and non-financial covenants, as well as customary events of default.
In connection with funding the Synergy Loan Agreement, on November 29, 2018, United also entered into an agreement with AVH's significant minority shareholder, Kingsland Holdings Limited ("Kingsland"), pursuant to which, in return for Kingsland's pledge of its
144.8 million
shares of AVH common stock (equivalent to
18.1 million
ADRs) and its consent to Synergy's pledge of its AVH common stock to United under the Synergy Loan Agreement, United (1) granted to Kingsland the right to put its shares of AVH common stock to United at market price on the fifth anniversary of the Synergy Loan Agreement, and (2) guaranteed Synergy's obligation to pay Kingsland (which amount, if paid by United, will increase United's secured loan to Synergy by such amount) if the market price of AVH common stock on the fifth anniversary is less than
$12
per ADR on the NYSE, for an aggregate maximum possible combined put payment and guarantee amount on the fifth anniversary of
$217.2 million
. United also agreed with Kingsland to share in any increase in value of AVH common stock within certain price ranges (the "Upside Sharing Agreement").
AVH Derivative Assets -
The AVH Call Options, AVH Share Appreciation Rights and the Upside Sharing Agreement (collectively, the "AVH Derivative Assets") are recorded at fair value as Other assets on the Company's balance sheet and are included in the table above. Changes in the fair value of the AVH Derivative Assets are recorded as part of Nonoperating income (expense): Miscellaneous, net on the Company's statements of consolidated operations.
Investments presented in the table above have the same fair value as their carrying value. The table below presents the carrying values and estimated fair values of financial instruments not presented in the tables above as of December 31 (in millions). Carrying amounts include any related discounts, premiums, issuance costs and origination costs:
|
2018
|
2017
|
||||||||||||||||||||||||||||||||||||||
|
Carrying Amount
|
Fair Value
|
Carrying Amount
|
Fair Value
|
||||||||||||||||||||||||||||||||||||
|
Total
|
Level 1
|
Level 2
|
Level 3
|
Total
|
Level 1
|
Level 2
|
Level 3
|
||||||||||||||||||||||||||||||||
|
Long-term debt
|
$
|
13,445
|
|
$
|
13,450
|
|
$
|
—
|
|
$
|
9,525
|
|
$
|
3,925
|
|
$
|
13,268
|
|
$
|
13,787
|
|
$
|
—
|
|
$
|
10,115
|
|
$
|
3,672
|
|
|||||||||
|
Synergy Term Loan
|
478
|
|
422
|
|
—
|
|
—
|
|
422
|
|
—
|
|
—
|
|
—
|
|
—
|
|
—
|
|
|||||||||||||||||||
Fair value of the financial instruments included in the tables above was determined as follows:
76
|
Description
|
Fair Value Methodology
|
|
Cash and cash equivalents
|
The carrying amounts approximate fair value because of the short-term maturity of these assets.
|
|
Short-term investments,
Equity securities, EETC and
Restricted cash
|
Fair value is based on (a) the trading prices of the investment or similar instruments, (b) an income approach, which uses valuation techniques to convert future amounts into a single present amount based on current market expectations about those future amounts when observable trading prices are not available, or (c) broker quotes obtained by third-party valuation services.
|
|
Other investments measured at NAV
|
In accordance with the relevant accounting standards, certain investments that are measured at fair value using the NAV per share (or its equivalent) practical expedient have not been classified in the fair value hierarchy. The fair value amounts presented in the table above are intended to permit reconciliation of the fair value hierarchy to the amounts presented in the statement of financial position. The investments measured using NAV are shares of mutual funds that invest in fixed-income instruments including bonds, debt securities, and other similar instruments issued by various U.S. and non-U.S. public- or private-sector entities. The Company can redeem its shares at any time at NAV subject to a three-day settlement period.
|
|
Long-term debt
|
Fair values were based on either market prices or the discounted amount of future cash flows using our current incremental rate of borrowing for similar liabilities or assets.
|
|
Synergy Term Loan and AVH Derivative Assets
|
Fair values are calculated using a Monte Carlo simulation approach. Unobservable inputs include expected volatility, expected dividend yield and control and acquisition premiums.
|
Investments in Regional Carriers
. United holds investments in several regional carriers that fly for the Company as United Express under CPAs. The combined carrying value of the investments was approximately
$144 million
as of the date of this report. United accounts for each investment using the equity method. Each investment and United's ownership stake is listed below.
|
•
|
Republic Airways Holdings Inc. ("Republic"). United holds a
19%
minority interest in Republic which the Company received in 2017 in consideration for its unsecured claim in Republic's bankruptcy case. Republic does business as Republic Airways.
|
|
•
|
ManaAir, LLC ("ManaAir"). In a series of transactions completed in January 2019, United obtained a
49.9%
minority ownership stake in ManaAir, LLC ("ManaAir") and ManaAir purchased
100%
of the equity of ExpressJet Airlines, Inc.
|
|
•
|
Champlain Enterprises LLC ("Champlain"). United owns a
40%
minority ownership stake in Champlain. Champlain does business as CommutAir.
|
Other Investments.
United owns approximately
9%
of the preferred shares of Fulcrum BioEnergy, Inc. ("Fulcrum"), a company that is developing a process for transforming municipal solid waste into transportation fuels, including jet fuel and diesel. United records its investment in Fulcrum at cost less impairment, adjusted for observable price changes in orderly transactions for an identical or similar investment of the same issuer. As of December 31, 2018, the carrying value of United's investment was
$48 million
.
77
NOTE 10 - DEBT
|
(In millions)
|
At December 31,
|
|||||||
|
2018
|
2017
|
|||||||
|
Secured
|
||||||||
|
Notes payable, fixed interest rates of 0.0% to 9.52% (weighted average rate of 4.18% as of December 31, 2018), payable through 2030
|
$
|
8,811
|
|
$
|
8,661
|
|
||
|
Notes payable, floating interest rates of the London interbank offered rate ("LIBOR") plus 1.05% to 1.75%, payable through 2030
|
2,051
|
|
1,880
|
|
||||
|
Term loan, LIBOR plus 1.75%, or alternative rate based on certain market rates plus 0.75%, due 2024
|
1,474
|
|
1,489
|
|
||||
|
Unsecured
|
||||||||
|
6.375% Senior Notes due 2018 (a)
|
—
|
|
300
|
|
||||
|
6% Senior Notes due 2020 (a)
|
300
|
|
300
|
|
||||
|
4.25% Senior Notes due 2022 (a)
|
400
|
|
400
|
|
||||
|
5% Senior Notes due 2024 (a)
|
300
|
|
300
|
|
||||
|
Other
|
300
|
|
101
|
|
||||
|
13,636
|
|
13,431
|
|
|||||
|
Less: unamortized debt discount, premiums and debt issuance costs
|
(191
|
)
|
(163
|
)
|
||||
|
Less: current portion of long-term debt
|
(1,230
|
)
|
(1,565
|
)
|
||||
|
Long-term debt, net
|
$
|
12,215
|
|
$
|
11,703
|
|
||
(a) UAL is the issuer of this debt. United is a guarantor.
The table below presents the Company's contractual principal payments (not including debt discount or debt issuance costs) at
December 31, 2018
under then-outstanding long-term debt agreements in each of the next five calendar years (in millions):
|
2019
|
$
|
1,230
|
|
|
|
2020
|
1,310
|
|
||
|
2021
|
1,300
|
|
||
|
2022
|
1,653
|
|
||
|
2023
|
703
|
|
||
|
After 2023
|
7,440
|
|
||
|
$
|
13,636
|
|
||
Secured debt
Credit and Guaranty Agreement.
On March 29, 2017, United and UAL, as borrower and guarantor, respectively, entered into an Amended and Restated Credit and Guaranty Agreement (as amended, the "Credit Agreement"). The Credit Agreement consists of a
$1.5 billion
term loan due
April 1, 2024
and a
$2.0 billion
revolving credit facility available for drawing until
April 1, 2022
. The obligations of United under the amended Credit Agreement are secured by liens on certain international route authorities, certain take-off and landing rights and related assets of United.
Term loan borrowings under the Credit Agreement bear interest at a variable rate equal to LIBOR plus a margin of
1.75%
per annum, or another rate based on certain market interest rates, plus a margin of
0.75%
per annum. The principal amount of the term loan must be repaid in consecutive quarterly installments of
0.25%
of the original principal amount thereof, commencing on June 30, 2017, with any unpaid balance due on
April 1, 2024
. United may prepay all or a portion of the loan from time to time, at par plus accrued and unpaid interest.
As of
December 31, 2018
, United had its entire capacity of
$2.0 billion
available under the revolving credit facility of the Company's Credit Agreement. United pays a commitment fee equal to
0.75%
per annum on the undrawn amount available under the revolving credit facility. If drawn, revolving loans under the Credit Agreement bear interest at a variable rate equal to LIBOR plus a margin of
2.25%
per annum, or another rate based on certain market interest rates, plus a margin of
1.25%
per annum.
As of December 31, 2018, United had cash collateralized
$73 million
of letters of credit, which generally have evergreen clauses and are expected to be renewed on an annual basis. As of December 31, 2018, United also had
$418 million
of surety bonds securing various obligations with expiration dates through
2022
.
78
EETCs.
As of December 31, 2018, United had
$8.8 billion
principal amount of equipment notes outstanding issued under EETC financings included in notes payable in the table of outstanding debt above.
Generally, the structure of these EETC financings consists of pass-through trusts created by United to issue pass-through certificates, which represent fractional undivided interests in the respective pass-through trusts and are not obligations of United. The proceeds of the issuance of the pass-through certificates are used to purchase equipment notes which are issued by United and secured by its aircraft. The payment obligations under the equipment notes are those of United. Proceeds received from the sale of pass-through certificates are initially held by a depositary in escrow for the benefit of the certificate holders until United issues equipment notes to the trust, which purchases such notes with a portion of the escrowed funds. These escrowed funds are not guaranteed by United and are not reported as debt on United's consolidated balance sheet because the proceeds held by the depositary are not United's assets.
In February 2018, May 2018 and February 2019, United created separate EETC pass-through trusts, each of which issued pass-through certificates. The proceeds of the issuance of the pass-through certificates are used to purchase equipment notes issued by United and secured by its aircraft. The Company records the debt obligation upon issuance of the equipment notes rather than upon the initial issuance of the pass-through certificates. Certain details of the pass-through trusts with proceeds received from issuance of debt in
2018
are as follows (in millions, except stated interest rate):
|
EETC Date
|
Class
|
Principal
|
Final expected distribution date
|
Stated interest rate
|
Total debt recorded
as of December 31, 2018 |
Proceeds received from issuance of debt during 2018
|
Remaining proceeds from issuance of debt to be received in future periods
|
||||||||||||||||
|
February 2019
|
AA
|
$
|
717
|
|
August 2031
|
4.15
|
%
|
$
|
—
|
|
$
|
—
|
|
$
|
717
|
|
|||||||
|
February 2019
|
A
|
296
|
|
August 2031
|
4.55
|
%
|
—
|
|
—
|
|
296
|
|
|||||||||||
|
May 2018
|
B
|
226
|
|
March 2026
|
4.60
|
%
|
226
|
|
226
|
|
—
|
|
|||||||||||
|
February 2018
|
AA
|
677
|
|
March 2030
|
3.50
|
%
|
677
|
|
677
|
|
—
|
|
|||||||||||
|
February 2018
|
A
|
258
|
|
March 2030
|
3.70
|
%
|
258
|
|
258
|
|
—
|
|
|||||||||||
|
$
|
2,174
|
|
$
|
1,161
|
|
$
|
1,161
|
|
$
|
1,013
|
|
||||||||||||
In
2018
, United borrowed approximately
$424 million
aggregate principal amount from various financial institutions to finance the purchase of several aircraft delivered in
2018
. The notes evidencing these borrowings, which are secured by the related aircraft, mature in 2030 and have interest rates comprised of LIBOR plus a specified margin.
Unsecured debt
4.25% Senior Notes due 2022.
In September 2017, UAL issued
$400 million
aggregate principal amount of
4.25%
Senior Notes due
October 1, 2022
(the "
4.25%
Senior Notes due 2022"). These notes are fully and unconditionally guaranteed and recorded by United on its balance sheet as debt. The indenture for the
4.25%
Senior Notes due 2022 requires UAL to offer to repurchase the notes for cash if certain changes of control of UAL occur at a purchase price equal to
101%
of the principal amount of notes repurchased plus accrued and unpaid interest.
5% Senior Notes due 2024.
In January 2017, UAL issued
$300 million
aggregate principal amount of
5%
Senior Notes due
February 1, 2024
(the "
5%
Senior Notes due 2024"). These notes are fully and unconditionally guaranteed and recorded by United on its balance sheet as debt. The indenture for the
5%
Senior Notes due 2024 requires UAL to offer to repurchase the notes for cash if certain changes of control of UAL occur at a purchase price equal to
101%
of the principal amount of notes repurchased plus accrued and unpaid interest.
79
As of
December 31, 2018
, UAL and United were in compliance with their respective debt covenants. The collateral, covenants and cross default provisions of the Company's principal debt instruments that contain such provisions are summarized in the table below:
|
Debt Instrument
|
Collateral, Covenants and Cross Default Provisions
|
|
Various equipment notes and other notes payable
|
Secured by certain aircraft. The indentures contain events of default that are customary for aircraft financing, including in certain cases cross default to other related aircraft.
|
|
Credit Agreement
|
Secured by certain of United's international route authorities, specified take-off and landing slots at certain airports and certain other assets.
The Credit Agreement requires the Company to maintain at least $2.0 billion of unrestricted liquidity at all times, which includes unrestricted cash, short-term investments and any undrawn amounts under any revolving credit facility, and to maintain a minimum ratio of appraised value of collateral to the outstanding obligations under the Credit Agreement of 1.6 to 1.0 at all times. The Credit Agreement contains covenants that, among other things, restrict the ability of UAL and its restricted subsidiaries (as defined in the Credit Agreement) to incur additional indebtedness and to pay dividends on or repurchase stock, although, as of December 31, 2018, the Company had ample ability under these restrictions to repurchase stock under the Company's share repurchase program. The Credit Agreement contains events of default customary for this type of financing, including a cross default and cross acceleration provision to certain other material indebtedness of the Company. |
|
6% Senior Notes due 2020
4.25% Senior Notes due 2022
5% Senior Notes due 2024
|
The indentures for these notes contain covenants that, among other things, restrict the ability of the Company and its restricted subsidiaries (as defined in the indentures) to incur additional indebtedness and pay dividends on or repurchase stock, although the Company currently has ample ability under these restrictions to repurchase stock under the Company's share repurchase program.
|
NOTE 11 - LEASES AND CAPACITY PURCHASE AGREEMENTS
United leases aircraft, airport passenger terminal space, aircraft hangars and related maintenance facilities, cargo terminals, other airport facilities, other commercial real estate, office and computer equipment and vehicles.
In 2018, United entered into a new Airline Use and Lease Agreement at Chicago O'Hare International Airport ("Chicago O'Hare") with the City of Chicago with a lease term of approximately
15
years, effective May 12, 2018 through December 31, 2033. United also entered into several new ground and facility leases at Chicago O'Hare, effective May 12, 2018, for hangars, a ground equipment maintenance building, and employee parking with lease terms ranging from
15
years to
30
years.
At
December 31, 2018
, United's scheduled future minimum lease payments under operating leases having initial or remaining noncancelable lease terms of more than one year, aircraft leases, including aircraft rent under CPAs and capital leases
80
(substantially all of which are for aircraft) were as follows (in millions):
|
Capital Leases (b)
|
Facility and Other Operating Leases
|
Aircraft Operating Leases
|
||||||||||
|
2019
|
$
|
308
|
|
$
|
1,330
|
|
$
|
845
|
|
|||
|
2020
|
170
|
|
1,351
|
|
682
|
|
||||||
|
2021
|
147
|
|
1,107
|
|
583
|
|
||||||
|
2022
|
123
|
|
970
|
|
407
|
|
||||||
|
2023
|
104
|
|
953
|
|
379
|
|
||||||
|
After 2023
|
1,268
|
|
7,029
|
|
1,160
|
|
||||||
|
Minimum lease payments (a)
|
$
|
2,120
|
|
$
|
12,740
|
|
$
|
4,056
|
|
|||
|
Imputed interest
|
(837
|
)
|
||||||||||
|
Present value of minimum lease payments
|
1,283
|
|
||||||||||
|
Current portion
|
(149
|
)
|
||||||||||
|
Long-term obligations under capital leases
|
$
|
1,134
|
|
|||||||||
(a) Includes fair value lease and deferred financing fee balances, which are being amortized over the terms of their respective leases.
(b) Includes airport construction projects managed by United in which United has construction risk, including project cost overruns. The Company recorded an asset for project costs and a related liability equal to project costs funded by parties other than United. As of December 31, 2018, United had an asset balance of
$886 million
recorded in operating property and equipment and
$920 million
recorded in current and long-term obligations under capital leases for these airport construction projects.
As of
December 31, 2018
, United's aircraft capital lease minimum payments relate to leases of
28
mainline and
90
regional aircraft as well as to leases of nonaircraft assets. Imputed interest rate ranges are
3.5%
to
115.1%
.
Aircraft operating leases have initial terms of
five
to
26
years, with expiration dates ranging from
2019
through
2029
. Under the terms of most leases, United has the right to purchase the aircraft at the end of the lease term, in some cases, at fair market value, and in others, at fair market value or a percentage of cost.
United is the lessee of real property under long-term operating leases at a number of airports where we are also the guarantor of approximately
$1.3 billion
of underlying debt and interest thereon as of
December 31, 2018
. These leases are typically with municipalities or other governmental entities, which are excluded from the consolidation requirements concerning a variable interest entity ("VIE"). To the extent United's leases and related guarantees are with a separate legal entity other than a governmental entity, United is not the primary beneficiary because the lease terms are consistent with market terms at the inception of the lease and the lease does not include a residual value guarantee, fixed-price purchase option, or similar feature. United has facility operating leases that extend to
2055
.
United's nonaircraft rent expense was approximately
$1.3 billion
,
$1.3 billion
and
$1.2 billion
for the years ended
December 31, 2018
,
2017
and
2016
, respectively.
In addition to nonaircraft rent and aircraft rent, which is separately presented in the consolidated statements of operations, United had aircraft rent related to regional aircraft operating leases, which is included as part of Regional capacity purchase expense in United's consolidated statement of operations, of
$505 million
,
$458 million
and
$439 million
for the years ended
December 31, 2018
,
2017
and
2016
, respectively.
In connection with UAL Corporation's and United Air Lines, Inc.'s (predecessors to UAL and United) fresh-start reporting requirements upon their exit from Chapter 11 bankruptcy protection in 2006 and the Company's acquisition accounting adjustments related to the Company's merger transaction in 2010, lease valuation adjustments for operating leases were initially recorded in the consolidated balance sheet, representing the net present value of the differences between contractual lease rates and the fair market lease rates for similar leased assets at the time. An asset (liability) results when the contractual lease rates are more (less) favorable than market lease terms at the valuation date. The lease valuation adjustment is amortized on a straight-line basis as an increase (decrease) to rent expense over the individual applicable remaining lease terms, resulting in recognition of rent expense as if United had entered into the leases at market rates. The related remaining lease terms, primarily related to aircraft which make up the majority of the fair value lease adjustment balance, are
one
to
six
years for United. The lease valuation adjustments are classified within other noncurrent liabilities and the net accretion amounts are
$60 million
,
$79 million
and
$82 million
for the years ended
December 31, 2018
,
2017
and
2016
, respectively.
Regional CPAs
United
has contractual relationships with various regional carriers to provide regional aircraft service branded as United Express.
Under these CPAs, the Company pays the regional carriers contractually agreed fees (carrier costs) for operating these
81
flights plus a variable reimbursement (incentive payment for operational performance) based on agreed performance metrics, subject to annual adjustments. The fees for carrier costs are based on specific rates for various operating expenses of the regional carriers, such as crew expenses, maintenance and aircraft ownership, some of which are multiplied by specific operating statistics (e.g., block hours, departures), while others are fixed monthly amounts. Under these CPAs, the Company is responsible for all fuel costs incurred, as well as landing fees and other costs, which are either passed through by the regional carrier to the Company without any markup or directly incurred by the Company, and, in some cases, the Company owns or leases some or all of the aircraft subject to the CPA, and leases or subleases, as applicable, such aircraft to the regional carrier.
United's CPAs are for
559
regional aircraft as of
December 31, 2018
, and the CPAs have terms expiring through
2029
. Aircraft operated under CPAs include aircraft leased directly from the regional carriers and those owned by United or leased from third-party lessors and operated by the regional carriers. See Part I, Item 2, Properties, of this report for additional information.
In 2017, United entered into a five-year CPA with Air Wisconsin Airlines for regional service under the United Express brand to operate up to
65
CRJ200 aircraft. In addition, United extended the term of its existing CPA with ExpressJet Airlines to operate up to approximately
125
aircraft through
December 31, 2022
.
United recorded approximately
$979 million
,
$907 million
and
$935 million
in expenses related to its CPAs with its regional carriers, in which United is a minority shareholder, for the years ended
December 31, 2018
,
2017
and
2016
, respectively. There were approximately
$53 million
and
$24 million
in accounts payable due to these companies as of
December 31, 2018
and December 31,
2017
, respectively. There were
no
material accounts receivables due from these companies as of
December 31, 2018
and December 31,
2017
. The CPAs with these related parties were executed in the ordinary course of business.
Our future commitments under our CPAs are dependent on numerous variables, and are, therefore, difficult to predict. The most important of these variables is the number of scheduled block hours. Although we are not required to purchase a minimum number of block hours under certain of our CPAs, we have set forth below estimates of our future payments under the CPAs based on our assumptions. United's estimates of its future payments under all of the CPAs do not include the portion of the underlying obligation for any aircraft leased to a regional carrier or deemed to be leased from other regional carriers and facility rent that are disclosed as part of aircraft and nonaircraft operating leases. For purposes of calculating these estimates, we have assumed (1) the number of block hours flown is based on our anticipated level of flight activity or at any contractual minimum utilization levels if applicable, whichever is higher, (2) that we will reduce the fleet as rapidly as contractually allowed under each CPA, (3) that aircraft utilization, stage length and load factors will remain constant, (4) that each carrier's operational performance will remain at historic levels and (5) an annual projected inflation rate. These amounts exclude variable pass-through costs such as fuel and landing fees, among others. Based on these assumptions as of
December 31, 2018
, our future payments through the end of the terms of our CPAs are presented in the table below (in billions):
|
2019
|
$
|
2.2
|
|
|
2020
|
2.0
|
|
|
|
2021
|
1.8
|
|
|
|
2022
|
1.4
|
|
|
|
2023
|
0.8
|
|
|
|
After 2023
|
3.1
|
|
|
|
$
|
11.3
|
|
|
The actual amounts we pay to our regional operators under CPAs could differ materially from these estimates. For example, a
10%
increase or decrease in scheduled block hours for all of United's regional operators (whether as a result of changes in average daily utilization or otherwise) in
2019
would result in a corresponding change in annual cash obligations under the CPAs of approximately
$160 million
.
NOTE 12 - VARIABLE INTEREST ENTITIES
Variable interests are contractual, ownership or other monetary interests in an entity that change with fluctuations in the fair value of the entity's net assets exclusive of variable interests. A VIE can arise from items such as lease agreements, loan arrangements, guarantees or service contracts. An entity is a VIE if (a) the entity lacks sufficient equity or (b) the entity's equity holders lack power or the obligation and right as equity holders to absorb the entity's expected losses or to receive its expected residual returns.
If an entity is determined to be a VIE, the entity must be consolidated by the primary beneficiary. The primary beneficiary is the holder of the variable interests that has the power to direct the activities of a VIE that (i) most significantly impact the VIE's economic performance and (ii) has the obligation to absorb losses of or the right to receive benefits from the VIE that could
82
potentially be significant to the VIE. Therefore, the Company must identify which activities most significantly impact the VIE's economic performance and determine whether it, or another party, has the power to direct those activities.
Aircraft Leases
. We are the lessee in a number of operating leases covering the majority of our leased aircraft. The lessors are trusts established specifically to purchase, finance and lease aircraft to us. These leasing entities meet the criteria for VIEs. We are generally not the primary beneficiary of the leasing entities if the lease terms are consistent with market terms at the inception of the lease and do not include a residual value guarantee, fixed-price purchase option or similar feature that obligates us to absorb decreases in value or entitles us to participate in increases in the value of the aircraft. This is the case for many of our operating leases; however, leases of
23
mainline jet aircraft contain a fixed-price purchase option that allow United to purchase the aircraft at predetermined prices on specified dates during the lease term. Additionally, leases covering
90
leased regional jet aircraft contain an option to purchase the aircraft at the end of the lease term at prices that, depending on market conditions, could be below fair value. United has not consolidated the related trusts because, even taking into consideration these purchase options, United is still not the primary beneficiary. United's maximum exposure under these leases is the remaining lease payments, which are reflected in future lease commitments in Note 11 of this report.
EETCs.
United evaluated whether the pass-through trusts formed for its EETC financings, treated as either debt or aircraft operating leases, are VIEs required to be consolidated by United under applicable accounting guidance, and determined that the pass-through trusts are VIEs. Based on United's analysis as described below, United determined that it does not have a variable interest in the pass-through trusts.
The primary risk of the pass-through trusts is credit risk (i.e. the risk that United, the issuer of the equipment notes, may be unable to make its principal and interest payments). The primary purpose of the pass-through trust structure is to enhance the credit worthiness of United's debt obligation through certain bankruptcy protection provisions, a liquidity facility (in certain of the EETC structures) and improved loan-to-value ratios for more senior debt classes. These credit enhancements lower United's total borrowing cost. Pass-through trusts are established to receive principal and interest payments on the equipment notes purchased by the pass-through trusts from United and remit these proceeds to the pass-through trusts' certificate holders.
United does not invest in or obtain a financial interest in the pass-through trusts. Rather, United has an obligation to make interest and principal payments on its equipment notes held by the pass-through trusts. United did not intend to have any voting or non-voting equity interest in the pass-through trusts or to absorb variability from the pass-through trusts. Based on this analysis, the Company determined that it is not required to consolidate the pass-through trusts.
Synergy affiliates
.
|
•
|
BRW Aviation LLC ("BRW"): Synergy's wholly-owned affiliate, BRW, is a special purpose entity created to be the borrower of the Synergy Term Loan. BRW is also the owner of the collateral that secures the Synergy Term Loan, including Synergy's shares of AVH. BRW is a VIE and United holds variable interests in BRW including the Synergy Term Loan. However, United is not the primary beneficiary of BRW because it does not hold BRW equity and does not have management rights at BRW and therefore does not have the power to direct the activities that most significantly impact BRW's economic performance.
|
|
•
|
AVH: United concluded that AVH is a VIE and that United holds a variable interest through its call option on Synergy's AVH shares. However, United is not the primary beneficiary because it does not hold a material number of shares of AVH and does not have the power through any other agreements to direct the activities that most significantly impact AVH's economic performance.
|
NOTE 13 - COMMITMENTS AND CONTINGENCIES
Commitments.
As of
December 31, 2018
, United had firm commitments and options to purchase aircraft from The Boeing Company ("Boeing"), Airbus S.A.S. ("Airbus") and Embraer S.A. ("Embraer") presented in the table below:
|
Aircraft Type
|
Number of Firm
Commitments (a) |
||
|
Airbus A350
|
45
|
|
|
|
Boeing 737 MAX
|
175
|
|
|
|
Boeing 777-300ER
|
4
|
|
|
|
Boeing 787
|
24
|
|
|
|
Embraer E175
|
25
|
|
|
|
(a) United also has options and purchase rights for additional aircraft.
|
|||
83
The aircraft listed in the table above are scheduled for delivery from
2019
through
2027
. To the extent the Company and the aircraft manufacturers with whom the Company has existing orders for new aircraft agree to modify the contracts governing those orders, the amount and timing of the Company's future capital commitments could change. In 2019, United expects to take delivery of
25
Embraer E175 aircraft,
20
Boeing 737 MAX aircraft,
8
Boeing 787 aircraft and
2
Boeing 777-300ER aircraft.
United also has agreements to purchase
20
used Airbus A319 aircraft with expected delivery dates through
2022
.
During the third quarter of 2018, United entered into an agreement with the lessor of
54
Embraer ERJ 145 aircraft to purchase those aircraft in 2019. The provisions of such agreement resulted in a change in accounting classification of the applicable leases from operating leases to capital leases up until the applicable purchase date.
The table below summarizes United's commitments as of
December 31, 2018
, which primarily relate to the acquisition of aircraft and related spare engines, aircraft improvements and include other capital purchase commitments for the years ended December 31 (in billions). Any new firm aircraft orders, including through the exercise of purchase options and purchase rights, will increase the total future capital commitments of the Company.
|
2019
|
$
|
4.2
|
|
|
2020
|
5.3
|
|
|
|
2021
|
3.5
|
|
|
|
2022
|
2.8
|
|
|
|
2023
|
1.9
|
|
|
|
After 2023
|
7.0
|
|
|
|
$
|
24.7
|
|
|
In February 2019, the Company secured
$1.0 billion
of EETC financing to finance certain aircraft deliveries in 2018 and 2019. The Company has also secured backstop financing commitments from certain of its aircraft manufacturers for a limited number of its future aircraft deliveries, subject to certain customary conditions. Financing may be necessary to satisfy the Company's capital commitments for its firm order aircraft and other related capital expenditures.
Legal and Environmental.
The Company has certain contingencies resulting from litigation and claims incident to the ordinary course of business. As of
December 31, 2018
, management believes, after considering a number of factors, including (but not limited to) the information currently available, the views of legal counsel, the nature of contingencies to which the Company is subject and prior experience, that the ultimate disposition of the litigation and claims will not materially affect the Company's consolidated financial position or results of operations. The Company records liabilities for legal and environmental claims when a loss is probable and reasonably estimable. These amounts are recorded based on the Company's assessments of the likelihood of their eventual disposition.
Guarantees and Indemnifications.
In the normal course of business, the Company enters into numerous real estate leasing and aircraft financing arrangements that have various guarantees included in the contracts. These guarantees are primarily in the form of indemnities under which the Company typically indemnifies the lessors and any tax/financing parties against tort liabilities that arise out of the use, occupancy, operation or maintenance of the leased premises or financed aircraft. Currently, the Company believes that any future payments required under these guarantees or indemnities would be immaterial, as most tort liabilities and related indemnities are covered by insurance (subject to deductibles). Additionally, certain leased premises such as fueling stations or storage facilities include indemnities of such parties for any environmental liability that may arise out of or relate to the use of the leased premises.
As of
December 31, 2018
, United is the guarantor of approximately
$1.9 billion
in aggregate principal amount of tax-exempt special facilities revenue bonds and interest thereon. These bonds, issued by various airport municipalities, are payable solely from rentals paid under long-term agreements with the respective governing bodies. The leasing arrangements associated with approximately
$1.3 billion
of these obligations are accounted for as operating leases with the associated expense recorded on a straight-line basis resulting in ratable accrual of the lease obligation over the expected lease term. These tax-exempt special facilities revenue bonds are included in our lease commitments disclosed in Note 11 of this report. The leasing arrangements associated with approximately
$466 million
of these obligations are accounted for as capital leases. All of these bonds are due between
2019
and
2038
.
In connection with funding the Synergy Loan Agreement, the Company entered into an agreement with AVH's significant minority shareholder, Kingsland Holdings Limited ("Kingsland"), pursuant to which, in return for Kingsland's pledge of its 144.8 million shares of AVH common stock (equivalent to 18.1 million American Depositary Receipts ("ADRs")) and its consent to Synergy's pledge of its AVH common stock to United under the Synergy Loan Agreement, United (1) granted to Kingsland the right to put its shares of AVH common stock to United at market price on the fifth anniversary of the Synergy
84
Loan Agreement, and (2) guaranteed Synergy's obligation to pay Kingsland (which amount, if paid by United, will increase United's secured loan to Synergy by such amount) if the market price of AVH common stock on the fifth anniversary is less than $12 per ADR on the NYSE, for an aggregate maximum possible combined put payment and guarantee amount on the fifth anniversary of $217.2 million. Accordingly, the Company recorded a liability of $31 million for the fair value of its guarantee to loan additional funds to Synergy if required. Any additional loans to Synergy would be collateralized by Synergy's shares of AVH stock and other collateral.
Increased Cost Provisions.
In United's financing transactions that include loans, United typically agrees to reimburse lenders for any reduced returns with respect to the loans due to any change in capital requirements and, in the case of loans in which the interest rate is based on LIBOR, for certain other increased costs that the lenders incur in carrying these loans as a result of any change in law, subject, in most cases, to obligations of the lenders to take certain limited steps to mitigate the requirement for, or the amount of, such increased costs. At December 31, 2018, the Company had
$3.5 billion
of floating rate debt and
$27 million
of fixed rate debt, with remaining terms of up to
12 years
, that are subject to these increased cost provisions. In several financing transactions involving loans or leases from non-U.S. entities, with remaining terms of up to
12 years
and an aggregate balance of
$3.2 billion
, the Company bears the risk of any change in tax laws that would subject loan or lease payments thereunder to non-U.S. entities to withholding taxes, subject to customary exclusions.
As of
December 31, 2018
, United is the guarantor of
$145 million
of aircraft mortgage debt issued by one of United's regional carriers. The aircraft mortgage debt is subject to similar increased cost provisions as described above for the Company's debt, and the Company would potentially be responsible for those costs under the guarantees.
Fuel Consortia.
United participates in numerous fuel consortia with other air carriers at major airports to reduce the costs of fuel distribution and storage. Interline agreements govern the rights and responsibilities of the consortia members and provide for the allocation of the overall costs to operate the consortia based on usage. The consortia (and in limited cases, the participating carriers) have entered into long-term agreements to lease certain airport fuel storage and distribution facilities that are typically financed through tax-exempt bonds, either special facilities lease revenue bonds or general airport revenue bonds, issued by various local municipalities. In general, each consortium lease agreement requires the consortium to make lease payments in amounts sufficient to pay the maturing principal and interest payments on the bonds. As of December 31, 2018, approximately
$1.7 billion
principal amount of such bonds were secured by significant fuel facility leases in which United participates, as to which United and each of the signatory airlines has provided indirect guarantees of the debt. As of December 31, 2018, the Company's contingent exposure was approximately
$164 million
principal amount of such bonds based on its recent consortia participation. The Company's contingent exposure could increase if the participation of other air carriers decreases. The guarantees will expire when the tax-exempt bonds are paid in full, which ranges from
2022
to
2051
. The Company did not record a liability at the time these indirect guarantees were made.
Regional Capacity Purchase.
As of
December 31, 2018
, United had
292
call options to purchase regional jet aircraft being operated by certain of its regional carriers with contract dates extending until 2029. These call options are exercisable upon wrongful termination or breach of contract, among other conditions. None of the call options were exercisable at
December 31, 2018
.
Credit Card Processing Agreements.
The Company has agreements with financial institutions that process customer credit card transactions for the sale of air travel and other services. Under certain of the Company's credit card processing agreements, the financial institutions in certain circumstances have the right to require that the Company maintain a reserve equal to a portion of advance ticket sales that has been processed by that financial institution, but for which the Company has not yet provided the air transportation. Such financial institutions may require additional cash or other collateral reserves to be established or additional withholding of payments related to receivables collected if the Company does not maintain certain minimum levels of unrestricted cash, cash equivalents and short-term investments (collectively, "Unrestricted Liquidity"). The Company's current level of Unrestricted Liquidity is substantially in excess of these minimum levels.
Labor Negotiations.
As of
December 31, 2018
, United, including its subsidiaries, had approximately
92,000
employees. Approximately
83%
of United's employees were represented by various U.S. labor organizations as of
December 31, 2018
.
The agreement with the International Brotherhood of Teamsters (the "IBT") contains provisions that require the Company to align contract terms with other airlines' workgroups under certain conditions.
On October 23, 2018, United's Catering Operations employees voted to unionize under the Railway Labor Act.
In an election overseen by the National Mediation Board, UNITE HERE received the majority of the votes and was officially certified to represent United's frontline Catering Operations employees. The Company expects contract negotiations to begin in 2019.
85
NOTE 14 - SPECIAL CHARGES
Special charges in the statements of consolidated operations consisted of the following for the years ended December 31 (in millions):
|
Operating:
|
2018
|
2017 (a)
|
2016 (a)
|
|||||||||
|
Impairment of assets
|
$
|
377
|
|
$
|
25
|
|
$
|
412
|
|
|||
|
Termination of an engine maintenance service agreement
|
64
|
|
—
|
|
—
|
|
||||||
|
Severance and benefit costs
|
41
|
|
116
|
|
37
|
|
||||||
|
Cleveland airport lease restructuring
|
—
|
|
—
|
|
74
|
|
||||||
|
Labor agreement costs
|
—
|
|
—
|
|
171
|
|
||||||
|
(Gains) losses on sale of assets and other special charges
|
5
|
|
35
|
|
51
|
|
||||||
|
Total operating special charges
|
487
|
|
176
|
|
745
|
|
||||||
|
Nonoperating:
|
||||||||||||
|
Postretirement curtailment gain
|
—
|
|
—
|
|
(107
|
)
|
||||||
|
Gains on extinguishment of debt and other
|
—
|
|
—
|
|
(1
|
)
|
||||||
|
Total operating and nonoperating special charges before income taxes
|
487
|
|
176
|
|
637
|
|
||||||
|
Nonoperating mark-to-market ("MTM") losses on financial instruments
|
5
|
|
—
|
|
—
|
|
||||||
|
Total special charges and MTM losses on financial instruments
|
492
|
|
176
|
|
637
|
|
||||||
|
Income tax benefit
|
(110
|
)
|
(63
|
)
|
(229
|
)
|
||||||
|
Income tax adjustments (Note 7)
|
(5
|
)
|
(179
|
)
|
180
|
|
||||||
|
Total special charges and MTM losses on financial instruments, net of income taxes and income tax adjustments
|
$
|
377
|
|
$
|
(66
|
)
|
$
|
588
|
|
|||
(a) Amounts adjusted due to the adoption of Accounting Standards Update No. 2014-09,
Revenue from Contracts with Customers (Topic 606)
and
Accounting Standards Update No. 2017-07,
Improving the Presentation of Net Periodic Pension Cost and Net Periodic Postretirement Benefit Cost.
See Note 1 to the financial statements contained in Part II, Item 8 of this report for additional information.
2018
The Company conducted its annual impairment review of intangible assets in the fourth quarter of 2018, which consisted of a comparison of the book value of specific assets to the fair value of those assets. Due to increased costs without sufficient corresponding increases in revenue in the Hong Kong market, the Company determined that the value of its Hong Kong routes had been impaired. Accordingly, in the fourth quarter of 2018, the Company recorded a special non-cash impairment charge of
$206 million
(
$160 million
net of taxes) associated with its Hong Kong routes. The collateral pledged under the Company's term loan, including the Hong Kong routes, continues to be sufficient to satisfy the loan covenants. The Company determined the fair value of the Hong Kong routes using a variation of the income approach known as the excess earnings method, which discounts an asset's projected future net cash flows to determine the current fair value. Assumptions used in the discounted cash flow methodology include a discount rate, which is based upon the Company's current weighted average cost of capital plus an asset-specific risk factor, and a projection of sales, expenses, gross margin, tax rates and contributory asset charges for four future years and a terminal growth rate. The assumptions used for future projections are determined based upon the Company's asset-specific forecasts along with the Company's strategic plan. These assumptions are inherently uncertain as they relate to future events and circumstances. Actual results will be influenced by the competitive environment, fuel costs and other expenses, and potentially other unforeseen events or circumstances that could have a material negative impact on future results.
In May 2018, the Brazil–United States open skies agreement was ratified, which provides air carriers with unrestricted access between the United States and Brazil. The Company determined that the approval of the open skies agreement impaired the entire value of its Brazil route authorities because the agreement removes all limitations or reciprocity requirements for flights between the United States and Brazil. Accordingly, the Company recorded a
$105 million
special charge (
$82 million
net of taxes) to write off the entire value of the intangible asset associated with its Brazil routes. This asset is not part of any collateral pledged against any of the Company's borrowings. The Company continues to maintain its slot assets related to Brazil since airport access is still regulated by slot allocations that are limited by airport facility constraints.
During 2018, the Company also recorded
$66 million
(
$51 million
net of taxes) of fair value adjustments related to aircraft purchased off lease, write-offs of unexercised aircraft purchase options and other impairments related to certain fleet types and international slots no longer in use.
86
During 2018, the Company recorded a one-time termination charge of
$64 million
(
$50 million
net of tax) related to one of its engine maintenance service agreements.
During 2018, the Company recorded severance and benefit costs related to a voluntary early-out program for its technicians and related employees represented by the IBT of
$22 million
(
$17 million
net of taxes). In the first quarter of 2017, approximately 1,000 technicians and related employees elected to voluntarily separate from the Company and receive a severance payment, with a maximum value of
$100,000
per participant, based on years of service, with retirement dates through the end of 2018. Also during 2018, the Company recorded other management severance of
$19 million
(
$15 million
net of taxes).
During 2018, the Company recorded gains of
$28 million
(
$22 million
net of taxes) for the change in market value of certain of its equity investments. Also, the Company recorded losses of
$33 million
(
$26 million
net of taxes) for the change in fair value of certain derivative assets related to equity of Avianca Holdings S.A. For equity investments and derivative assets subject to MTM accounting, the Company records gains and losses as part of Nonoperating income (expense): Miscellaneous, net in its statements of consolidated operations.
2017
During 2017 the Company recorded a
$10 million
(
$6 million
net of taxes) impairment charge related to obsolete spare parts inventory and a
$15 million
(
$10 million
net of taxes) intangible asset impairment charge related to a maintenance service agreement.
During 2017, the Company recorded
$83 million
(
$53 million
net of taxes) of severance and benefit costs related to the voluntary early-out program for its technicians and related employees represented by the IBT as described above. Also during 2017, the Company recorded
$33 million
(
$21 million
net of taxes) of other management severance.
2016
In April 2016, the Federal Aviation Administration ("FAA") announced that it will designate Newark Liberty International Airport ("Newark") as a Level 2 schedule-facilitated airport under the International Air Transport Association Worldwide Slot Guidelines. The designation was associated with an updated demand and capacity analysis of Newark by the FAA. In 2016, the Company determined that the FAA's action impaired the entire value of its Newark slots because the slots are no longer the mechanism that governs take-off and landing rights. Accordingly, the Company recorded a
$412 million
special charge (
$264 million
net of taxes) to write off the intangible asset.
During 2016, the Company recorded
$37 million
(
$24 million
net of taxes) of severance and benefit costs related to a voluntary early-out program for the Company's flight attendants and other severance agreements. In 2014, more than 2,500 flight attendants elected to voluntarily separate from the Company for a severance payment, with a maximum value of
$100,000
per participant, based on years of service, with retirement dates through the end of 2016.
In 2016, the City of Cleveland agreed to amend the Company's lease, which runs through 2029, associated with certain excess airport terminal space (principally Terminal D) and related facilities at Hopkins International Airport ("Cleveland"). The Company recorded an accrual for remaining payments under the lease for facilities that the Company no longer uses and will continue to incur costs under the lease without economic benefit to the Company. This liability was measured and recorded at its fair value when the Company ceased its right to use such facilities leased to it pursuant to the lease. The Company recorded a net charge of
$74 million
(
$47 million
net of taxes) related to the amended lease.
The fleet service, passenger service, storekeeper and other employees represented by the International Association of Machinists and Aerospace Workers (the "IAM") ratified
seven
new contracts with the Company which extended the contracts through
2021
. The technicians and related employees represented by the IBT ratified a six-year joint collective bargaining agreement which extended the contract through 2022. During 2016, the Company recorded
$171 million
(
$110 million
net of taxes) of special charges primarily for payments in conjunction with the IAM and IBT agreements described above.
As part of the ratified contract with the IBT, the Company amended some of its technicians and related employees' postretirement medical plans. The amendments triggered curtailment accounting, resulting in the recognition of a one-time
$60 million
gain (
$38 million
net of taxes) for accelerated recognition of a prior service credit in one of the plans. Also, as part of the ratified contract with the Association of Flight Attendants, the Company amended two of its flight attendant postretirement medical plans. The amendments triggered curtailment accounting, resulting in the recognition of a one-time
$47 million
gain (
$30 million
net of taxes) for accelerated recognition of a prior service credit.
87
Accrual Activity
Activity related to the accruals for severance and medical costs and future lease payments on permanently grounded aircraft is as follows (in millions):
|
Severance/ Benefit Costs
|
Permanently Grounded Aircraft
|
||||||
|
Balance at December 31, 2015
|
$
|
27
|
|
$
|
78
|
|
|
|
Accrual and related adjustments
|
37
|
|
(17
|
)
|
|||
|
Payments
|
(50
|
)
|
(20
|
)
|
|||
|
Balance at December 31, 2016
|
14
|
|
41
|
|
|||
|
Accrual
|
116
|
|
(4
|
)
|
|||
|
Payments
|
(93
|
)
|
(15
|
)
|
|||
|
Balance at December 31, 2017
|
37
|
|
22
|
|
|||
|
Accrual
|
41
|
|
(7
|
)
|
|||
|
Payments
|
(53
|
)
|
(3
|
)
|
|||
|
Balance at December 31, 2018
|
$
|
25
|
|
$
|
12
|
|
|
NOTE 15 - SELECTED QUARTERLY FINANCIAL DATA (UNAUDITED)
|
UAL
|
Quarter Ended
|
|||||||||||||||
|
(In millions, except per share amounts)
|
March 31
|
June 30
|
September 30
|
December 31
|
||||||||||||
|
2018
|
||||||||||||||||
|
Operating revenue
|
$
|
9,032
|
|
$
|
10,777
|
|
$
|
11,003
|
|
$
|
10,491
|
|
||||
|
Income from operations
|
276
|
|
1,161
|
|
1,203
|
|
652
|
|
||||||||
|
Net income
|
147
|
|
684
|
|
836
|
|
462
|
|
||||||||
|
Basic earnings per share
|
0.52
|
|
2.49
|
|
3.07
|
|
1.71
|
|
||||||||
|
Diluted earnings per share
|
0.52
|
|
2.48
|
|
3.06
|
|
1.70
|
|
||||||||
|
2017 (a)
|
||||||||||||||||
|
Operating revenue
|
$
|
8,426
|
|
$
|
10,008
|
|
$
|
9,899
|
|
$
|
9,451
|
|
||||
|
Income from operations
|
320
|
|
1,437
|
|
1,138
|
|
776
|
|
||||||||
|
Net income
|
99
|
|
821
|
|
645
|
|
579
|
|
||||||||
|
Basic earnings per share
|
0.32
|
|
2.67
|
|
2.15
|
|
1.99
|
|
||||||||
|
Diluted earnings per share
|
0.32
|
|
2.67
|
|
2.15
|
|
1.98
|
|
||||||||
(a) Amounts adjusted due to the adoption of Accounting Standards Update No. 2014-09,
Revenue from Contracts with Customers (Topic 606)
and
Accounting Standards Update No. 2017-07,
Improving the Presentation of Net Periodic Pension Cost and Net Periodic Postretirement Benefit Cost.
See Note 1 to the financial statements contained in Part II, Item 8 of this report for additional information.
UAL's quarterly financial data is subject to seasonal fluctuations and historically its second and third quarter financial results, which reflect higher travel demand, are better than its first and fourth quarter financial results. UAL's quarterly results were
88
impacted by the following significant items (in millions):
|
Quarter Ended
|
||||||||||||||||
|
March 31
|
June 30
|
September 30
|
December 31
|
|||||||||||||
|
2018
|
||||||||||||||||
|
Operating:
|
||||||||||||||||
|
Impairment of assets
|
$
|
23
|
|
$
|
111
|
|
$
|
11
|
|
$
|
232
|
|
||||
|
Termination of an engine maintenance service agreement
|
—
|
|
—
|
|
—
|
|
64
|
|
||||||||
|
Severance and benefit costs
|
14
|
|
11
|
|
9
|
|
7
|
|
||||||||
|
(Gains) losses on sale of assets and other special charges
|
3
|
|
7
|
|
(3
|
)
|
(2
|
)
|
||||||||
|
Total operating special charges
|
40
|
|
129
|
|
17
|
|
301
|
|
||||||||
|
Nonoperating:
|
||||||||||||||||
|
Nonoperating mark-to-market ("MTM") (gains) losses on financial instruments
|
(45
|
)
|
135
|
|
(29
|
)
|
(56
|
)
|
||||||||
|
Total special charges and MTM (gains) losses on financial instruments
|
(5
|
)
|
264
|
|
(12
|
)
|
245
|
|
||||||||
|
Income taxes:
|
||||||||||||||||
|
Income tax expense (benefit) related to special charges and MTM gains and losses on financial instruments
|
1
|
|
(59
|
)
|
3
|
|
(55
|
)
|
||||||||
|
Income tax adjustments
|
—
|
|
—
|
|
—
|
|
(5
|
)
|
||||||||
|
Total special charges and MTM (gains) losses on financial instruments, net of tax
|
$
|
(4
|
)
|
$
|
205
|
|
$
|
(9
|
)
|
$
|
185
|
|
||||
|
2017 (a)
|
|
|
|
|
||||||||||||
|
Operating:
|
||||||||||||||||
|
Severance and benefit costs
|
$
|
37
|
|
$
|
41
|
|
$
|
23
|
|
$
|
15
|
|
||||
|
Impairment of assets
|
—
|
|
—
|
|
15
|
|
10
|
|
||||||||
|
(Gains) losses on sale of assets and other special charges
|
14
|
|
3
|
|
12
|
|
6
|
|
||||||||
|
Total operating special charges
|
51
|
|
44
|
|
50
|
|
31
|
|
||||||||
|
Income taxes:
|
|
|
|
|
|
|
|
|
||||||||
|
Income tax benefit related to special charges
|
(18
|
)
|
(16
|
)
|
(18
|
)
|
(11
|
)
|
||||||||
|
Income tax adjustments
|
—
|
|
—
|
|
—
|
|
(179
|
)
|
||||||||
|
Total operating special charges, net of income taxes and income tax adjustments
|
$
|
33
|
|
$
|
28
|
|
$
|
32
|
|
$
|
(159
|
)
|
||||
(a) Amounts adjusted due to the adoption of Accounting Standards Update No. 2014-09,
Revenue from Contracts with Customers (Topic 606).
See Note 1 to the financial statements contained in Part II, Item 8 of this report for additional information.
See Note 14 of this report for additional information related to these items.
89
|
ITEM 9.
|
CHANGES IN AND DISAGREEMENTS WITH ACCOUNTANTS ON ACCOUNTING AND FINANCIAL DISCLOSURE.
|
None.
|
ITEM 9A.
|
CONTROLS AND PROCEDURES
|
Evaluation of Disclosure Control and Procedures
UAL and United each maintain controls and procedures that are designed to ensure that information required to be disclosed in the reports filed or submitted by UAL and United to the SEC is recorded, processed, summarized and reported, within the time periods specified by the SEC's rules and forms, and is accumulated and communicated to management including the Chief Executive Officer and Chief Financial Officer, as appropriate, to allow timely decisions regarding required disclosure. The management of UAL and United, including the Chief Executive Officer and Chief Financial Officer, performed an evaluation to conclude with reasonable assurance that UAL's and United's disclosure controls and procedures were designed and operating effectively to report the information each company is required to disclose in the reports they file with the SEC on a timely basis. Based on that evaluation, the Chief Executive Officer and the Chief Financial Officer of UAL and United have concluded that as of
December 31, 2018
, disclosure controls and procedures were effective.
Changes in Internal Control over Financial Reporting during the Quarter Ended
December 31, 2018
During the three months ended
December 31, 2018
, there was no change in UAL's or United's internal control over financial reporting that materially affected, or is reasonably likely to materially affect, their internal control over financial reporting.
90
REPORT OF INDEPENDENT REGISTERED PUBLIC ACCOUNTING FIRM
To the Stockholders and Board of Directors of United Continental Holdings, Inc.
Opinion on Internal Control over Financial Reporting
We have audited United Continental Holdings, Inc.'s (the "Company") internal control over financial reporting as of December 31, 2018, based on criteria established in Internal Control-Integrated Framework issued by the Committee of Sponsoring Organizations of the Treadway Commission (2013 framework) (the COSO criteria). In our opinion, the Company maintained, in all material respects, effective internal control over financial reporting as of December 31, 2018, based on the COSO criteria.
We also have audited, in accordance with the standards of the Public Company Accounting Oversight Board (United States) ("PCAOB"), the consolidated financial statements as of and for the year ended December 31, 2018 of the Company and our report dated
February 28, 2019
expressed an unqualified opinion thereon.
Basis for Opinion
The Company's management is responsible for maintaining effective internal control over financial reporting and for its assessment of the effectiveness of internal control over financial reporting included in the accompanying Management Report on Internal Control over Financial Reporting in Item 9A. Our responsibility is to express an opinion on the Company's internal control over financial reporting based on our audit. We are a public accounting firm registered with the PCAOB and are required to be independent with respect to the Company in accordance with the U.S. federal securities laws and the applicable rules and regulations of the Securities and Exchange Commission and the PCAOB.
We conducted our audit in accordance with the standards of the PCAOB. Those standards require that we plan and perform the audit to obtain reasonable assurance about whether effective internal control over financial reporting was maintained in all material respects.
Our audit included obtaining an understanding of internal control over financial reporting, assessing the risk that a material weakness exists, testing and evaluating the design and operating effectiveness of internal control based on the assessed risk, and performing such other procedures as we considered necessary in the circumstances. We believe that our audit provides a reasonable basis for our opinion.
Definition and Limitations of Internal Control Over Financial Reporting
A company's internal control over financial reporting is a process designed to provide reasonable assurance regarding the reliability of financial reporting and the preparation of financial statements for external purposes in accordance with generally accepted accounting principles. A company's internal control over financial reporting includes those policies and procedures that (1) pertain to the maintenance of records that, in reasonable detail, accurately and fairly reflect the transactions and dispositions of the assets of the company; (2) provide reasonable assurance that transactions are recorded as necessary to permit preparation of financial statements in accordance with generally accepted accounting principles, and that receipts and expenditures of the company are being made only in accordance with authorizations of management and directors of the company; and (3) provide reasonable assurance regarding prevention or timely detection of unauthorized acquisition, use, or disposition of the company's assets that could have a material effect on the financial statements.
Because of its inherent limitations, internal control over financial reporting may not prevent or detect misstatements. Also, projections of any evaluation of effectiveness to future periods are subject to the risk that controls may become inadequate because of changes in conditions, or that the degree of compliance with the policies or procedures may deteriorate.
/s/ Ernst & Young LLP
Chicago, Illinois
February 28, 2019
91
United Continental Holdings, Inc. Management Report on Internal Control Over Financial Reporting
February 28, 2019
To the Stockholders of United Continental Holdings, Inc.
Chicago, Illinois
The management of United Continental Holdings, Inc. ("UAL") is responsible for establishing and maintaining adequate internal control over financial reporting, as such term is defined in Exchange Act Rules 13a-15(f). Our internal control over financial reporting is designed to provide reasonable assurance regarding the reliability of financial reporting and the preparation of financial statements for external purposes in accordance with generally accepted accounting principles. Because of its inherent limitations, our internal control over financial reporting may not prevent or detect misstatements. Also, projections of any evaluation of effectiveness to future periods are subject to the risk that controls may become inadequate because of changes in conditions, or that the degree of compliance with the policies or procedures may deteriorate.
Under the supervision and with the participation of management, including our Chief Executive Officer and Chief Financial Officer, we conducted an evaluation of the design and operating effectiveness of our internal control over financial reporting as of December 31, 2018. In making this assessment, management used the framework set forth in Internal Control—Integrated Framework (2013 Framework)
issued by the Committee of the Sponsoring Organizations of the Treadway Commission. Based on this evaluation, our Chief Executive Officer and Chief Financial Officer concluded that our internal control over financial reporting was effective as of December 31, 2018.
Our independent registered public accounting firm, Ernst & Young LLP, who audited UAL's consolidated financial statements included in this Form 10-K, has issued a report on UAL's internal control over financial reporting, which is included herein.
United Airlines, Inc. Management Report on Internal Control Over Financial Reporting
February 28, 2019
To the Stockholder of United Airlines, Inc.
Chicago, Illinois
The management of United Airlines, Inc. ("United") is responsible for establishing and maintaining adequate internal control over financial reporting, as such term is defined in Exchange Act Rules 13a-15(f). United's internal control over financial reporting is designed to provide reasonable assurance regarding the reliability of financial reporting and the preparation of financial statements for external purposes in accordance with generally accepted accounting principles. Because of its inherent limitations, United's internal control over financial reporting may not prevent or detect misstatements. Also, projections of any evaluation of effectiveness to future periods are subject to the risk that controls may become inadequate because of changes in conditions, or that the degree of compliance with the policies or procedures may deteriorate.
Under the supervision and with the participation of management, including United's Chief Executive Officer and Chief Financial Officer, United conducted an evaluation of the design and operating effectiveness of its internal control over financial reporting as of December 31, 2018. In making this assessment, management used the framework set forth in Internal Control—Integrated Framework (2013 Framework) issued by the Committee of the Sponsoring Organizations of the Treadway Commission. Based on this evaluation, United's Chief Executive Officer and Chief Financial Officer concluded that its internal control over financial reporting was effective as of December 31, 2018.
This annual report does not include an attestation report of United's registered public accounting firm regarding internal control over financial reporting. Management's report was not subject to attestation by United's registered public accounting firm pursuant to the rules of the Securities and Exchange Commission that permit United to provide only management's report in this annual report.
92
|
ITEM 9B.
|
OTHER INFORMATION.
|
None.
PART III
ITEM 10. DIRECTORS, EXECUTIVE OFFICERS AND CORPORATE GOVERNANCE.
Certain information required by this item with respect to UAL is incorporated by reference from UAL's definitive proxy statement for its
2019
Annual Meeting of Stockholders under the captions "Election of Directors," "Corporate Governance" and "Beneficial Ownership of Securities—Section 16(a) Beneficial Ownership Reporting Compliance." Information regarding the executive officers of UAL is presented below.
Information required by this item with respect to United is omitted pursuant to General Instruction I(2)(c) of Form 10-K.
EXECUTIVE OFFICERS OF UAL
Kate Gebo.
Age 50. Ms. Gebo has served as Executive Vice President Human Resources and Labor Relations of UAL and United since December 2017. From November 2016 to November 2017, Ms. Gebo served as Senior Vice President, Global Customer Service Delivery and Chief Customer Officer of United. From October 2015 to November 2016, Ms. Gebo served as Vice President of the Office of the Chief Executive Officer. From November 2009 to October 2015, Ms. Gebo served as Vice President of Corporate Real Estate of United.
Brett J. Hart.
Age 49. Mr. Hart has served as Executive Vice President, Chief Administrative Officer and General Counsel of UAL and United since May 2017. From February 2012 to May 2017, he served as Executive Vice President and General Counsel of UAL and United. Mr. Hart served as acting Chief Executive Officer and principal executive officer of the Company, on an interim basis, from October 2015 to March 2016. From December 2010 to February 2012, he served as Senior Vice President, General Counsel and Secretary of UAL, United and Continental Airlines, Inc. ("Continental"). From June 2009 to December 2010, Mr. Hart served as Executive Vice President, General Counsel and Corporate Secretary at Sara Lee Corporation, a consumer food and beverage company. From March 2005 to May 2009, Mr. Hart served as Deputy General Counsel and Chief Global Compliance Officer of Sara Lee Corporation.
Gregory L. Hart.
Age 53. Mr. Hart has served as Executive Vice President and Chief Operations Officer of UAL and United since February 2014. From December 2013 to February 2014, he served as Senior Vice President Operations of UAL and United. From September 2012 to December 2013, Mr. Hart served as Senior Vice President Technical Operations of United. From October 2010 to September 2012, Mr. Hart served as Senior Vice President Network of United and Continental. From September 2008 to September 2010, Mr. Hart served as Vice President Network Strategy of Continental. Mr. Hart joined Continental in 1997.
Linda P. Jojo.
Age 53. Ms. Jojo has served as Executive Vice President Technology and Chief Digital Officer of UAL and United since May 2017. From November 2014 to May 2017, Ms. Jojo served as Executive Vice President and Chief Information Officer of UAL and United. From July 2011 to October 2014, Ms. Jojo served as Executive Vice President and Chief Information Officer of Rogers Communications, Inc., a Canadian communications and media company. From October 2008 to June 2011, Ms. Jojo served as Chief Information Officer of Energy Future Holdings, a Dallas-based privately held energy company and electrical utility provider.
Chris Kenny.
Age 54. Mr. Kenny has served as Vice President and Controller of UAL and United since October 2010. From September 2003 to September 2010, Mr. Kenny served as Vice President and Controller of Continental. Mr. Kenny joined Continental in 1997.
J. Scott Kirby.
Age 51. Mr. Kirby has served as President of UAL and United since August 2016. Prior to joining the Company, from December 2013 to August 2016, Mr. Kirby served as President of American Airlines Group and American Airlines, Inc. Mr. Kirby also previously served as President of US Airways from October 2006 to December 2013. Mr. Kirby held significant other leadership roles at US Airways and at America West prior to the 2005 merger of those carriers, including Executive Vice President—Sales and Marketing (2001 to 2006); Senior Vice President, e-business (2000 to 2001); Vice President, Revenue Management (1998 to 2000); Vice President, Planning (1997 to 1998); and Senior Director, Scheduling and Planning (1995 to 1998). Prior to joining America West, Mr. Kirby worked for American Airlines Decision Technologies and at the Pentagon.
Gerald Laderman.
Age 61
.
Mr. Laderman has served as Executive Vice President and Chief Financial Officer since August 2018. Mr. Laderman served as Senior Vice President Finance, Procurement and Treasurer for UAL and United from 2013 to August 2015, and again from August 2016 to May 2018. Mr. Laderman additionally was acting Chief Financial Officer from
93
August 2015 to August 2016 and from May 2018 to August 2018. Mr. Laderman served as Senior Vice President Finance and Treasurer for the Company from 2010 to 2013. From 2001 to 2010, Mr. Laderman served as Senior Vice President of Finance and Treasurer for Continental. Mr. Laderman joined Continental in 1988 as senior director legal affairs, finance and aircraft programs.
Oscar Munoz.
Age 60. Mr. Munoz has served as Chief Executive Officer of UAL and United since September 2015, and also as President of UAL and United from September 2015 until August 2016. From February 2015 to September 2015, Mr. Munoz served as President and Chief Operating Officer of CSX Corporation ("CSX"), a railroad and intermodal transportation services company, overseeing operations, sales and marketing, human resources, service design and information technology. Prior to his appointment as President and Chief Operating Officer of CSX, Mr. Munoz served as Executive Vice President and Chief Operating Officer of CSX from January 2012 to February 2015 and as Executive Vice President and Chief Financial Officer of CSX from 2003 to 2012. Mr. Munoz has been a member of the UAL Board of Directors since 2010.
Andrew Nocella.
Age 49. Mr. Nocella has served as Executive Vice President and Chief Commercial Officer of UAL and United since September 2017. From February 2017 to September 2017, he served as Executive Vice President and Chief Revenue Officer of UAL and United. Prior to joining the Company, from August 2016 to February 2017, Mr. Nocella served as Senior Vice President, Alliances and Sales of American Airlines, Inc. From December 2013 to August 2016, he served as Senior Vice President and Chief Marketing Officer of American Airlines, Inc. From August 2007 to December 2013, he served as Senior Vice President, Marketing and Planning of US Airways.
There are no family relationships among the executive officers or the directors of UAL. The executive officers are elected by UAL's Board of Directors each year and hold office until the next annual meeting of stockholders, until their successors are elected and qualified, or until their earlier death, resignation or removal.
The Company has a code of ethics, the "Code of Ethics and Business Conduct," for its directors, officers and employees. The code serves as a "Code of Ethics" as defined by SEC regulations, and as a "Code of Conduct" under Nasdaq Listing Rule 5610. The code is available on the Company's investor relations website at ir.united.com. Waivers granted to certain officers from compliance with or future amendments to the code will be disclosed on the Company's investor relations website in accordance with Item 5.05 of Form 8-K.
|
ITEM 11.
|
EXECUTIVE COMPENSATION.
|
Information required by this item with respect to UAL is incorporated by reference from UAL's definitive proxy statement for its
2019
Annual Meeting of Stockholders under the captions "Executive Compensation," "2018 Director Compensation" and "Corporate Governance—Compensation Committee Interlocks and Insider Participation."
Information required by this item with respect to United is omitted pursuant to General Instruction I(2)(c) of Form 10-K.
|
ITEM 12.
|
SECURITY OWNERSHIP OF CERTAIN BENEFICIAL OWNERS AND MANAGEMENT AND RELATED STOCKHOLDER MATTERS.
|
Information required by this item with respect to UAL is incorporated by reference from UAL's definitive proxy statement for its
2019
Annual Meeting of Stockholders under the caption "Beneficial Ownership of Securities."
Information required by this item with respect to United is omitted pursuant to General Instruction I(2)(c) of Form 10-K.
|
ITEM 13.
|
CERTAIN RELATIONSHIPS AND RELATED TRANSACTIONS, AND DIRECTOR INDEPENDENCE.
|
Information required by this item with respect to UAL is incorporated by reference from UAL's definitive proxy statement for its
2019
Annual Meeting of Stockholders under the captions "Corporate Governance—Certain Relationships and Related Transactions," "Corporate Governance—Committees of the Board" and "Corporate Governance—Director Independence."
Information required by this item with respect to United is omitted pursuant to General Instruction I(2)(c) of Form 10-K.
|
ITEM 14.
|
PRINCIPAL ACCOUNTANT FEES AND SERVICES.
|
The Audit Committee of the UAL Board of Directors has adopted a policy on pre-approval of services of the Company's independent registered public accounting firm. As a wholly-owned subsidiary of UAL, United's audit services are determined by UAL. The policy provides that the Audit Committee shall pre-approve all audit and non-audit services to be provided to UAL and its subsidiaries and affiliates by its independent auditors. The process by which this is carried out is as follows:
94
For recurring services, the Audit Committee reviews and pre-approves the independent registered public accounting firm's annual audit services in conjunction with the annual appointment of the outside auditors. The reviewed materials include a description of the services along with related fees. The Audit Committee also reviews and pre-approves other classes of recurring services along with fee thresholds for pre-approved services. In the event that the additional services are required prior to the next scheduled Audit Committee meeting, pre-approvals of additional services follow the process described below.
Any requests for audit, audit related, tax and other services not contemplated with the recurring services approval described above must be submitted to the Audit Committee for specific pre-approval and cannot commence until such approval has been granted. Normally, pre-approval is provided at regularly scheduled meetings. However, the authority to grant specific pre-approval between meetings, as necessary, has been delegated to the Chair of the Audit Committee. The Chair must update the Audit Committee at the next regularly scheduled meeting of any services that were granted specific pre-approval.
On a periodic basis, the Audit Committee reviews the status of services and fees incurred year-to-date and a list of newly pre-approved services since its last regularly scheduled meeting. The Audit Committee has considered whether the
2018
and
2017
non-audit services provided by Ernst & Young LLP, the Company's independent registered public accounting firm, are compatible with maintaining auditor independence.
All of the services in
2018
and
2017
under the Audit Fees, Audit Related Fees, Tax Fees and All Other Fees categories below have been approved by the Audit Committee pursuant to paragraph (c)(7) of Rule 2-01 of Regulation S-X of the Exchange Act.
The aggregate fees billed for professional services rendered by the Company's independent auditors in
2018
and
2017
are as follows (in thousands):
|
Service
|
2018
|
2017
|
||||||
|
Audit Fees
|
$
|
3,992
|
|
$
|
4,548
|
|
||
|
Audit Related Fees
|
375
|
|
565
|
|
||||
|
Tax Fees
|
166
|
|
584
|
|
||||
|
All Other Fees
|
2
|
|
2
|
|
||||
|
Total Fees
|
$
|
4,535
|
|
$
|
5,699
|
|
||
|
Note: UAL and United amounts are the same.
|
||||||||
AUDIT FEES
For
2018
and
2017
, audit fees consist primarily of the audit and quarterly reviews of the consolidated financial statements and the audit of the effectiveness of internal control over financial reporting of United Continental Holdings, Inc. and its wholly-owned subsidiaries. Audit fees also include the audit of the consolidated financial statements of United, employee benefit plan audits, attestation services required by statute or regulation, comfort letters, consents, assistance with and review of documents filed with the SEC, and accounting and financial reporting consultations and research work necessary to comply with generally accepted auditing standards.
AUDIT RELATED FEES
For
2018
and
2017
, fees for audit related services primarily consisted of professional services related to due diligence and consultations related to the adoption of new accounting standards.
TAX FEES
Tax fees for
2018
and
2017
relate to professional services provided for research and consultations regarding tax accounting and tax compliance matters and review of U.S. and international tax impacts of certain transactions, exclusive of tax services rendered in connection with the audit.
ALL OTHER FEES
Fees for all other services billed in
2018
and
2017
consist of subscriptions to Ernst & Young LLP's on-line accounting research tool.
95
PART IV
ITEM 15. EXHIBITS AND FINANCIAL STATEMENT SCHEDULES.
|
(a)
|
List of documents filed as part of this report:
|
|
|
(1)
|
Financial Statements
. The financial statements required by this item are listed in Part II, Item 8,
Financial Statements and Supplementary Data
herein.
|
|
|
(2)
|
Financial Statement Schedules.
The financial statement schedule required by this item is listed below and included in this report after the signature page hereto.
|
|
Schedule II-Valuation and Qualifying Accounts for the years ended December 31,
2018
,
2017
and
2016
.
|
All other schedules are omitted because they are not applicable, not required or the required information is shown in the consolidated financial statements or notes thereto.
|
||
|
(b)
|
Exhibits.
The exhibits required by this item are provided in the Exhibit Index.
|
|
ITEM 16. FORM 10-K SUMMARY.
None.
EXHIBIT INDEX
|
Exhibit No.
|
Registrant
|
Exhibit
|
|
Articles of Incorporation and Bylaws
|
||
|
3.1
|
UAL
|
|
|
3.2
|
UAL
|
|
|
3.3
|
United
|
|
|
3.4
|
United
|
|
|
Instruments Defining Rights of Security Holders, Including Indentures
|
||
|
4.1
|
UAL
United
|
|
|
4.2
|
UAL
United
|
|
96
|
4.3
|
UAL
United
|
|
|
4.4
|
UAL
United
|
|
|
4.5
|
UAL
United
|
|
|
4.6
|
UAL
United
|
|
|
4.7
|
UAL
United
|
|
|
4.8
|
UAL
United
|
|
|
4.9
|
UAL
United
|
|
|
4.10
|
UAL
United
|
|
|
4.11
|
UAL
United |
|
|
4.12
|
UAL
United |
|
|
4.13
|
UAL
United |
|
|
4.14
|
UAL
United |
|
|
4.15
|
UAL
United |
|
|
4.16
|
UAL
United |
|
|
Material Contracts
|
||
|
†10.1
|
UAL
|
|
|
†10.2
|
UAL
|
|
97
|
†10.3
|
UAL
|
|
|
†10.4
|
UAL
United |
|
|
†10.5
|
UAL
United |
|
|
†10.6
|
UAL
United |
|
|
†10.7
|
UAL
United |
|
|
†10.8
|
UAL
United |
|
|
†10.9
|
UAL
|
|
|
†10.10
|
UAL
|
|
|
†10.11
|
UAL
United |
|
|
†10.12
|
UAL
|
|
|
†10.13
|
UAL
|
|
|
†10.14
|
UAL
|
|
|
†10.15
|
UAL
|
|
|
†10.16
|
UAL
|
|
|
†10.17
|
UAL
|
|
|
†10.18
|
UAL
|
|
98
|
†10.19
|
UAL
|
|
|
†10.20
|
UAL
|
|
|
†10.21
|
UAL
|
|
|
†10.22
|
UAL
|
|
|
†10.23
|
UAL
|
|
|
†10.24
|
UAL
|
|
|
†10.25
|
UAL
|
|
|
†10.26
|
UAL
|
|
|
†10.27
|
UAL
|
|
|
†10.28
|
UAL
|
|
|
†10.29
|
UAL
|
|
|
†10.30
|
UAL
|
|
|
†10.31
|
UAL
|
|
|
†10.32
|
UAL
|
|
|
†10.33
|
UAL
|
|
99
|
†10.34
|
UAL
|
|
|
†10.35
|
UAL
|
|
|
†10.36
|
UAL
|
|
|
†10.37
|
UAL
|
|
|
†10.38
|
UAL
|
|
|
†10.39
|
UAL
|
|
|
†10.40
|
UAL
|
|
|
†10.41
|
UAL
|
|
|
†10.42
|
UAL
|
|
|
†10.43
|
UAL
United |
|
|
†10.44
|
UAL
United |
|
|
^10.45
|
UAL
United |
|
|
^10.46
|
UAL
United |
|
|
^10.47
|
UAL
United |
|
|
^10.48
|
UAL
United |
|
|
^10.49
|
UAL
United |
|
100
|
^10.50
|
UAL
United |
|
|
^10.51
|
UAL
United |
|
|
^10.52
|
UAL
United |
|
|
^10.53
|
UAL
United |
|
|
^10.54
|
UAL
United |
|
|
^10.55
|
UAL
United |
|
|
^10.56
|
UAL
United |
|
|
^10.57
|
UAL
United |
|
|
^10.58
|
UAL
United |
|
|
^10.59
|
UAL
United |
|
|
^10.60
|
UAL
United |
|
|
^10.61
|
UAL
United |
|
|
^10.62
|
UAL
United |
|
|
^10.63
|
UAL
United |
|
|
^10.64
|
UAL
United |
|
|
^10.65
|
UAL
United |
|
|
^10.66
|
UAL
United |
|
101
|
^10.67
|
UAL
United |
|
|
^10.68
|
UAL
United |
|
|
^10.69
|
UAL
United |
|
|
^10.70
|
UAL
United |
|
|
^10.71
|
UAL
United |
|
|
^10.72
|
UAL
United |
|
|
^10.73
|
UAL
United |
|
|
^10.74
|
UAL
United |
|
|
^10.75
|
UAL
United |
|
|
^10.76
|
UAL
United |
|
|
^10.77
|
UAL
United |
|
|
^10.78
|
UAL
United |
|
|
^10.79
|
UAL
United |
|
|
^10.80
|
UAL
United |
|
|
^10.81
|
UAL
United |
|
|
^10.82
|
UAL
United |
|
|
^10.83
|
UAL
United |
|
|
^10.84
|
UAL
United |
|
102
|
^10.85
|
UAL
United |
|
|
^10.86
|
UAL
United |
|
|
^10.87
|
UAL
United |
|
|
^10.88
|
UAL
United |
|
|
^10.89
|
UAL
United |
|
|
^10.90
|
UAL
United |
|
|
^10.91
|
UAL
United |
|
|
^10.92
|
UAL
United |
|
|
^10.93
|
UAL
United |
|
|
^10.94
|
UAL
United |
|
|
^10.95
|
UAL
United |
|
|
^10.96
|
UAL
United |
|
|
^10.97
|
UAL
United |
|
|
^10.98
|
UAL
United |
|
|
^10.99
|
UAL
United |
|
|
^10.100
|
UAL
United |
|
|
^10.101
|
UAL
United |
|
|
^10.102
|
UAL
United |
|
103
|
^10.103
|
UAL
United |
|
|
^10.104
|
UAL
United |
|
|
^10.105
|
UAL
United |
|
|
^10.106
|
UAL
United |
|
|
^10.107
|
UAL
United |
|
|
^10.108
|
UAL
United |
|
|
^10.109
|
UAL
United |
|
|
^10.110
|
UAL
United |
|
|
^10.111
|
UAL
United |
|
|
^10.112
|
UAL
United |
|
|
^10.113
|
UAL
United |
|
|
^10.114
|
UAL
United |
|
|
^10.115
|
UAL
United |
|
|
^10.116
|
UAL
United |
|
|
^10.117
|
UAL
United |
|
|
^10.118
|
UAL
United |
|
|
^10.119
|
UAL
United |
|
104
|
^10.120
|
UAL
United |
|
|
^10.121
|
UAL
United |
|
|
^10.122
|
UAL
United |
|
|
^10.123
|
UAL
United |
|
|
^10.124
|
UAL
United |
|
|
^10.125
|
UAL
United |
|
|
^10.126
|
UAL
United |
|
|
^10.127
|
UAL
United |
|
|
^10.128
|
UAL
United |
|
|
^10.129
|
UAL
United |
|
|
^10.130
|
UAL
United |
|
|
^10.131
|
UAL
United |
|
|
^10.132
|
UAL
United |
|
|
^10.133
|
UAL
United |
|
|
^10.134
|
UAL
United |
|
|
^10.135
|
UAL
United |
|
|
^10.136
|
UAL
United |
|
105
|
^10.137
|
UAL
United |
|
|
^10.138
|
UAL
United |
|
|
^10.139
|
UAL
United |
|
|
^10.140
|
UAL
United |
|
|
^10.141
|
UAL
United |
|
|
^10.142
|
UAL
United |
|
|
^10.143
|
UAL
United |
|
|
^10.144
|
UAL
United |
|
|
^10.145
|
UAL
United |
|
|
^10.146
|
UAL
United |
|
|
^10.147
|
UAL
United |
|
|
^10.148
|
UAL
United |
|
|
^10.149
|
UAL
United |
|
|
^10.150
|
UAL
United |
|
|
^10.151
|
UAL
United |
|
106
|
^10.152
|
UAL
United |
|
|
^10.153
|
UAL
United |
|
|
^10.154
|
UAL
United |
|
|
^10.155
|
UAL
United |
|
|
^10.156
|
UAL
United |
|
|
^10.157
|
UAL
United |
|
|
^10.158
|
UAL
United |
|
|
^10.159
|
UAL
United |
|
|
^10.160
|
UAL
United |
|
|
^10.161
|
UAL
United |
|
|
^10.162
|
UAL
United |
|
|
^10.163
|
UAL
United |
|
|
^10.164
|
UAL
United |
|
|
^10.165
|
UAL
United |
|
|
^10.166
|
UAL
United |
|
|
^10.167
|
UAL
United |
|
107
|
10.168
|
UAL
United |
|
|
10.169
|
UAL
United |
|
|
10.170
|
UAL
United |
|
|
List of Subsidiaries
|
||
|
21
|
UAL
United
|
|
|
Consents of Experts and Counsel
|
||
|
23.1
|
UAL
|
|
|
23.2
|
United
|
|
|
Rule 13a-14(a)/15d-14(a) Certifications
|
||
|
31.1
|
UAL
|
|
|
31.2
|
UAL
|
|
|
31.3
|
United
|
|
|
31.4
|
United
|
|
|
Section 1350 Certifications
|
||
|
32.1
|
UAL
|
|
|
32.2
|
United
|
|
|
Interactive Data File
|
||
|
101
|
UAL
United
|
The following materials from each of United Continental Holdings, Inc.'s and United Airlines, Inc.'s Annual Reports on Form 10-K for the year ended December 31, 2018, formatted in XBRL (Extensible Business Reporting Language): (i) the Statements of Consolidated Operations, (ii) the Statements of Consolidated Comprehensive Income (Loss), (iii) the Consolidated Balance Sheets, (iv) the Statements of Consolidated Cash Flows, (v) the Statements of Consolidated Stockholders' Equity (Deficit) and (vi) the Combined Notes to Consolidated Financial Statements.
|
|
†
|
Indicates management contract or compensatory plan or arrangement. Pursuant to Item 601(b)(10), United is permitted to omit certain compensation-related exhibits from this report and therefore only UAL is identified as the registrant for purposes of those items.
|
|
^
|
Confidential portion of this exhibit has been omitted and filed separately with the SEC pursuant to a request for confidential treatment.
|
108
SIGNATURES
Pursuant to the requirements of Section 13 or 15(d) of the Securities Exchange Act of 1934, each registrant has duly caused this report to be signed on its behalf by the undersigned, thereunto duly authorized.
|
|
UNITED CONTINENTAL HOLDINGS, INC.
UNITED AIRLINES, INC.
(Registrants)
|
|
|
By:
|
/s/ Gerald Laderman
|
|
|
|
Gerald Laderman
|
|
|
Executive Vice President and Chief Financial Officer
|
||
Date:
February 28, 2019
Pursuant to the requirements of the Securities Exchange Act of 1934, this report has been signed below by the following persons on behalf of United Continental Holdings, Inc. and in the capacities and on the date indicated.
|
Signature
|
Capacity
|
|
|
|
|
/s/ Oscar Munoz
|
Chief Executive Officer, Director
|
|
Oscar Munoz
|
(Principal Executive Officer)
|
|
|
|
|
/s/ Gerald Laderman
|
Executive Vice President and Chief Financial Officer
|
|
Gerald Laderman
|
(Principal Financial Officer)
|
|
|
|
|
/s/ Chris Kenny
|
Vice President and Controller
|
|
Chris Kenny
|
(Principal Accounting Officer)
|
|
|
|
|
/s/ Carolyn Corvi
|
Director
|
|
Carolyn Corvi
|
|
|
/s/ Jane C. Garvey
|
Director
|
|
Jane C. Garvey
|
|
|
/s/ Barney Harford
|
Director
|
|
Barney Harford
|
|
|
/s/ Michele J. Hooper
|
Director
|
|
Michele J. Hooper
|
|
|
/s/ Todd M. Insler
|
Director
|
|
Todd M. Insler
|
|
109
|
/s/ Walter Isaacson
|
Director
|
|
Walter Isaacson
|
|
|
/s/ James A.C. Kennedy
|
Director
|
|
James A.C. Kennedy
|
|
|
Director
|
|
|
William R. Nuti
|
|
|
/s/ Sito Pantoja
|
Director
|
|
Sito Pantoja
|
|
|
/s/ Edward M. Philip
|
Director
|
|
Edward M. Philip
|
|
|
/s/ Edward L. Shapiro
|
Director
|
|
Edward L. Shapiro
|
|
|
/s/ David J. Vitale
|
Director
|
|
David J. Vitale
|
|
|
/s/ James M. Whitehurst
|
Director
|
|
James M. Whitehurst
|
|
|
Date:
|
February 28, 2019
|
110
Pursuant to the requirements of the Securities Exchange Act of 1934, this report has been signed below by the following persons on behalf of United Airlines, Inc. and in the capacities and on the date indicated.
|
Signature
|
Capacity
|
|
|
|
|
/s/ Oscar Munoz
|
Chief Executive Officer, Director
|
|
Oscar Munoz
|
(Principal Executive Officer)
|
|
|
|
|
/s/ Gerald Laderman
|
Executive Vice President and Chief Financial Officer, Director
|
|
Gerald Laderman
|
(Principal Financial Officer)
|
|
|
|
|
/s/ Chris Kenny
|
Vice President and Controller
|
|
Chris Kenny
|
(Principal Accounting Officer)
|
|
|
|
|
/s/ Gregory L. Hart
|
Director
|
|
Gregory L. Hart
|
|
|
/s/ J. Scott Kirby
|
Director
|
|
J. Scott Kirby
|
|
Date:
February 28, 2019
111
Schedule II
Valuation and Qualifying Accounts
For the Years Ended
December 31, 2018
,
2017
and
2016
|
(In millions)
Description
|
Balance at
Beginning of
Period
|
Additions
Charged to
Costs and
Expenses
|
Deductions (a)
|
Other
|
Balance at
End of
Period
|
||||||||||||||
|
Allowance for doubtful accounts:
|
|||||||||||||||||||
|
2018
|
$
|
7
|
|
$
|
17
|
|
$
|
16
|
|
$
|
—
|
|
$
|
8
|
|
||||
|
2017
|
10
|
|
20
|
|
23
|
|
—
|
|
7
|
|
|||||||||
|
2016
|
18
|
|
18
|
|
26
|
|
—
|
|
10
|
|
|||||||||
|
Obsolescence allowance—spare parts:
|
|||||||||||||||||||
|
2018
|
$
|
354
|
|
$
|
73
|
|
$
|
15
|
|
$
|
—
|
|
$
|
412
|
|
||||
|
2017
|
295
|
|
75
|
|
17
|
|
1
|
|
354
|
|
|||||||||
|
2016
|
235
|
|
61
|
|
16
|
|
15
|
|
295
|
|
|||||||||
|
Valuation allowance for deferred tax assets:
|
|||||||||||||||||||
|
2018
|
$
|
63
|
|
$
|
2
|
|
$
|
6
|
|
$
|
—
|
|
$
|
59
|
|
||||
|
2017
|
68
|
|
11
|
|
27
|
|
11
|
|
63
|
|
|||||||||
|
2016
|
48
|
|
47
|
|
27
|
|
—
|
|
68
|
|
|||||||||
(a) Deduction from reserve for purpose for which reserve was created.
112
TABLE OF CONTENTS
Part IItem 1. BusinessItem 1A. Risk FactorsItem 1B. Unresolved Staff CommentsItem 2. PropertiesItem 3. Legal ProceedingsItem 4. Mine Safety DisclosuresPart IIItem 5. Market For Registrant's Common Equity, Related Stockholder Matters and Issuer Purchases Of Equity SecuritiesItem 6. Selected Financial DataItem 7. Management's Discussion and Analysis Of Financial Condition and Results Of OperationsItem 7A. Quantitative and Qualitative Disclosures About Market RiskItem 8. Financial Statements and Supplementary DataNote 1 - Significant Accounting PoliciesNote 2 - Goodwill and Other Intangible AssetsItem Gross Carryingamount Accumulatedamortization Gross Carryingamount AccumulatedamortizationNote 3 - Common Stockholders' Equity and Preferred SecuritiesNote 4 - Earnings Per ShareNote 5 - Share-based Compensation PlansNote 6 - Accumulated Other Comprehensive Income (loss)Note 7 - Income TaxesNote 8 - Pension and Other Postretirement PlansNote 9 - Investments and Fair Value MeasurementsNote 10 - DebtNote 11 - Leases and Capacity Purchase AgreementsNote 12 - Variable Interest EntitiesNote 13 - Commitments and ContingenciesNote 14 - Special ChargesNote 15 - Selected Quarterly Financial Data (unaudited)Item 9. Changes in and Disagreements with Accountants on Accounting and Financial DisclosureItem 9A. Controls and ProceduresItem 9B. Other InformationPart IIIItem 10. Directors, Executive Officers and Corporate GovernanceItem 11. Executive CompensationItem 12. Security Ownership Of Certain Beneficial Owners and Management and Related Stockholder MattersItem 13. Certain Relationships and Related Transactions, and Director IndependenceItem 14. Principal Accountant Fees and ServicesPart IVItem 15. Exhibits and Financial Statement SchedulesItem 16. Form 10-k Summary