UNITED STATES ANTIMONY CORP
10-Ks and 10-Qs
|
|
|
|
|
|
|
|
|
|
|
|
|
|
|
|
|
|
|
|
|
|
|
|
|
|
|
|
|
|
|
|
|
|
|
|
|
|
|
|
|
|
|
|
|
|
|
|
|
|
|
|
|
|
|
|
|
|
|
|
|
|
|
|
|
UNITED
STATES
SECURITIES AND EXCHANGE COMMISSION
Washington, D.C. 20549
Form 10-K
|
☑
|
ANNUAL REPORT PURSUANT TO SECTION 13 OR 15(d) OF THE SECURITIES
EXCHANGE ACT OF 1934
|
|
|
For the fiscal year ended: December 31, 2019
|
|
|
|
|
☐
|
TRANSITION REPORT PURSUANT TO SECTION 13 OR 15(d) OF THE SECURITIES
EXCHANGE ACT OF 1934
|
|
|
For the
transition period from
to
|
Commission
file number:
001-08675
UNITED STATES ANTIMONY CORPORATION
(Exact
name of registrant as specified in its charter)
|
Montana
|
|
81-0305822
|
|
(State
or other jurisdiction of incorporation or
organization)
|
|
(I.R.S.
Employer Identification No.)
|
|
|
|
|
|
P.O. Box 643, Thompson Falls, Montana
|
|
59873
|
|
(Address
of principal executive offices)
|
|
(Zip
Code)
|
Registrant’s
telephone number, including area code:
(406) 827-3523
|
Securities
registered under Section 12(b) of the Exchange Act:
|
||
|
Title
of each class
|
Trading
Symbol(s)
|
Name of
each exchange on which registered
|
|
|
|
|
|
None
|
N/A
|
N/A
|
Securities
registered under Section 12(g) of the Exchange Act:
|
Title
of each class
|
Trading
Symbol(s)
|
Name of
each exchange on which registered
|
|
|
|
|
|
Common stock, $0.01 par value
|
UAMY
|
NYSE American
|
Indicate
by checkmark if the registrant is a well-known seasoned issuer, as
defined in Rule 405 of the Securities Act. Yes ☐ No
☑
Indicate
by checkmark if the registrant is not required to file reports
pursuant to Section 13 or Section 15(d) of the Act. Yes ☐ No
☑
Indicate
by check mark whether the registrant: (1) has filed all reports
required to be filed by Section 13 or 15(d) of the Securities
Exchange Act of 1934 during the preceding 12 months (or for such
shorter period that the registrant was required to file such
reports), and (2) has been subject to such filing requirements for
the past 90 days. Yes ☑ No ☐
Indicate
by check mark whether the registrant has submitted electronically
and posted on its corporate Web site, if any, every Interactive
Data File required to be submitted and posted pursuant to Rule 405
of Regulation S-T (§232.405 of this chapter) during the
preceding 12 months (or for such shorter period that the registrant
was required to submit and post such files). Yes ☑ No
☐
Indicate
by check mark if disclosure of delinquent filers pursuant to Item
405 of Regulation S-K is not contained herein, and will not be
contained, to the best of registrant’s knowledge, in
definitive proxy or information statements incorporated by
reference in Part III of this Form 10-K or any amendment to this
Form 10-K. ☐
Indicate
by check mark whether the registrant is a large accelerated filer,
an accelerated filer, a non-accelerated filer, or a smaller
reporting company. See the definitions of “large accelerated
filer,” “accelerated filer” and “smaller
reporting company” in Rule 12b-2 of the Exchange Act. (Check
one):
|
Large
accelerated filer
|
☐
|
|
Accelerated
filer
|
☐
|
|
Non-accelerated
filer
Emerging
Growth Company
|
☐
☐
|
|
Smaller
reporting company
|
☑
|
Indicate
by check mark whether the registrant is a shell company (as defined
in Rule 12b-2 of the Act). Yes ☐ No ☑
The
aggregate market value of the registrant’s common stock held
by non-affiliates was $34,673,569, based on the reported last sale
price of common stock on June 30, 2019, which was the last business
day of the registrant’s most recently completed second fiscal
quarter. For purposes of this computation, all executive officers
and directors were deemed affiliates.
The
number of shares outstanding of the registrant's common stock as of
April 14, 2020: 69,661,436 shares.
UNITED STATES ANTIMONY CORPORATION
2019 ANNUAL REPORT
TABLE OF CONTENTS
|
|
|
|
|
DESCRIPTION OF BUSINESS
|
1
|
|
|
|
|
|
|
RISK FACTORS
|
4
|
|
|
|
|
|
|
UNRESOLVED STAFF COMMENTS
|
5
|
|
|
|
|
|
|
DESCRIPTION OF PROPERTIES
|
5
|
|
|
|
|
|
|
LEGAL PROCEEDINGS
|
14
|
|
|
|
|
|
|
MINE SAFETY DISCLOSURES
|
14
|
|
|
|
|
|
|
|
|
|
|
|
|
|
|
MARKET FOR COMMON EQUITY AND RELATED STOCKHOLDER
MATTERS
|
14
|
|
|
|
|
|
|
SELECTED FINANCIAL DATA
|
14
|
|
|
|
|
|
|
MANAGEMENT'S DISCUSSION AND ANALYSIS OR PLAN OF
OPERATIONS
|
14
|
|
|
|
|
|
|
QUANTITATIVE AND QUALITATIVE DISCLOSURES ABOUT MARKET
RISK
|
21
|
|
|
|
|
|
|
CRITICAL ACCOUNTING ESTIMATES
|
21
|
|
|
|
|
|
|
FINANCIAL STATEMENTS
|
21
|
|
|
|
|
|
|
CHANGES IN AND DISAGREEMENTS WITH ACCOUNTANTS ON
ACCOUNTING AND FINANCIAL DISCLOSURE
|
21
|
|
|
|
|
|
|
CONTROLS AND PROCEDURES
|
22
|
|
|
|
|
|
|
ITEM 9B.
|
OTHER INFORMATION
|
|
|
|
|
|
|
DIRECTORS, EXECUTIVE OFFICERS, PROMOTERS AND CONTROL
PERSONS
AND COMPLIANCE WITH SECTION 16(A) OF THE EXCHANGE
ACT
|
23
|
|
|
|
|
|
|
EXECUTIVE COMPENSATION
|
25
|
|
|
|
|
|
|
SECURITY OWNERSHIP OF CERTAIN BENEFICIAL OWNERS AND
MANAGEMENT
|
26
|
|
|
|
|
|
|
CERTAIN RELATIONSHIPS AND RELATED TRANSACTIONS
|
27
|
|
|
|
|
|
|
PRINCIPAL ACCOUNTANT FEES AND SERVICE
|
27
|
|
|
|
|
|
|
|
PART
IV
|
|
|
|
|
|
|
EXHIBITS AND REPORTS ON FORM 8-K
|
28
|
|
|
|
|
|
|
SIGNATURES
|
|
31
|
|
|
|
|
|
CERTIFICATIONS
|
|
|
|
|
|
|
|
FINANCIAL STATEMENTS
|
|
F-1-F-23
|
P
ART I
General
I
tem 1. Description of
Business
General
|
Explanatory Note
: As used in this
report, the terms "we," "us" and "our" are used to refer to United
States Antimony Corporation and, as the context requires, its
management.
|
Some of
the information in this Form 10-K contains forward-looking
statements that involve substantial risks and uncertainties. You
can identify these statements by forward-looking words as "may,"
"will," "expect," "anticipate," "believe," "estimate" and
"continue," or similar words. You should read statements that
contain these words carefully because they:
●
discuss our future
expectations;
●
contain projections
of our future results of operations or of our financial condition;
and
●
state other
"forward-looking" information.
History
United
States Antimony Corporation, or USAC, was incorporated in Montana
in January 1970 to mine and produce antimony products. In December
1983, we suspended antimony mining operations but continued to
produce antimony products from domestic and foreign sources. In
April 1998, we formed United States Antimony SA de CV or USAMSA, to
mine and smelt antimony in Mexico. Bear River Zeolite Company, or
BRZ, was incorporated in 2000, and it is mining and producing
zeolite in southeastern Idaho. On August 19, 2005, USAC formed
Antimonio de Mexico, S. A. de C. V. to explore and develop antimony
and silver deposits in Mexico. Our principal business is the
production and sale of antimony, silver, gold, and zeolite
products. On May 16, 2012, we started trading on the NYSE MKT (now
NYSE AMERICAN) under the symbol UAMY.
Antimony Division
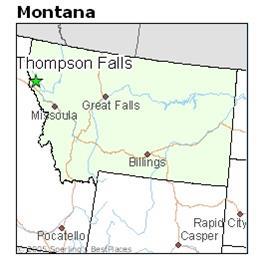
Our
antimony smelter and precious metals plant is located in the Burns
Mining District of Sanders County, Montana, approximately 15 miles
west of Thompson Falls, MT. We hold 2 patented mill sites where the
plant is located. We have no "proven reserves" or "probable
reserves" of antimony, as these terms are defined by the Securities
and Exchange Commission. Environmental restrictions preclude mining
at this site.
Mining
was suspended in December 1983, because antimony could be purchased
more economically from foreign sources.
For
2019, and since 1983, we relied on foreign sources for raw
materials, and there are risks of interruption in procurement from
these sources and/or volatile changes in world market prices for
these materials that are not controllable by us. We have sources of
antimony in Mexico but we are still depending on foreign companies
for raw material in the future. We expect to receive raw materials
from our owned and leased properties for 2019 and later years. We
continue working with suppliers in North America, Central America,
Europe, Australia, and South America.
We
currently own 100% of the common stock, equipment, and the leases
on real property of United States Antimony, Mexico S.A. de C.V. or
“USAMSA”, which was formed in April 1998. We currently
own 100% of the stock in Antimony de Mexico SA de CV (AM) which
owns the San Miguel concession of the Los Juarez property. USAMSA
has three divisions, (1) the Madero smelter in Coahuila, (2) the
Puerto Blanco flotation mill and oxide circuit in Guanajuato that
is ramping up for 2020, and (3) the Los Juarez mineral deposit with
concessions in Queretaro and the Wadley mining concession in San
Luis Potosi.
In our
existing operations in Montana, we produce antimony oxide, sodium
antimonate, antimony metal, and precious metals. Antimony oxide is
a fine, white powder that is used primarily in conjunction with a
halogen to form a synergistic flame retardant system for plastics,
rubber, fiberglass, textile goods, paints, coatings and paper.
Antimony oxide is also used as a color fastener in paint, as a
catalyst for production of polyester resins for fibers and film, as
a catalyst for production of polyethylene pthalate in plastic
bottles, as a phosphorescent agent in fluorescent light bulbs, and
as an opacifier for porcelains. Sodium antimonate is primarily used
as a fining agent (degasser) for glass in cathode ray tubes and as
a flame retardant. We also sell antimony metal for use in bearings,
storage batteries and ordnance.
We
estimate (but have not independently confirmed) that our present
share of the domestic market and international market for antimony
oxide products is approximately 4% and less than 1%, respectively.
We are the only significant U.S. producer of antimony products,
while China supplies 92% of the world antimony demand. We believe
we are competitive both domestically and world-wide due to the
following:
●
We have a
reputation for quality products delivered on a timely
basis.
●
We have two of the
three operating antimony smelters in North and Central
America.
●
We are the major
domestic producer of antimony products.
●
We can ship on
short notice to domestic customers.
●
We are vertically
integrated, with raw materials from our own mines, mills, and
smelter in Mexico, along with the raw materials from exclusive
supply agreements we have with numerous ore and raw material
suppliers.
●
As a vertically
integrated company, we will have more control over our raw material
costs.
1
Following
is a five year schedule of our antimony sales:
|
Schedule of Antimony Sales
|
|
||
|
|
Lbs Metal
|
|
Average
|
|
Year
|
Contained
|
$
|
Price/Lb
|
|
2019
|
1,566,585
|
$
5,450,649
|
$
3.48
|
|
2018
|
1,486,120
|
$
6,113,014
|
$
4.11
|
|
2017
|
1,891,439
|
$
7,588,470
|
$
4.01
|
|
2016
|
2,936,880
|
$
8,744,170
|
$
2.98
|
|
2015
|
2,487,321
|
$
9,863,933
|
$
3.97
|
|
|
|
|
|
Concentration of
Sales
:
During
the two years ended December 31, 2019 and 2018, the following sales
were made to our three largest customers:
|
Sales
to
|
For the
Year Ended
|
|
|
Largest
Customers
|
December
31, 2019
|
December
31, 2018
|
|
Mexichem
Specialty Compounds Inc.
|
$
1,823,194
|
$
2,698,770
|
|
Nyacol
Nanotechnologies
|
1,099,504
|
-
|
|
Kohler
Corporation
|
1,132,674
|
1,441,197
|
|
Ampacet
|
-
|
538,922
|
|
|
$
4,055,372
|
$
4,678,889
|
|
% of Total Revenues
|
49.05
%
|
51.79
%
|
While
the loss of one of our three largest customers would be a problem
in the short term, we have numerous requests from potential buyers
that we cannot fill, and we could quickly, in the present market
conditions, be able to replace the lost sales. Loss of all three of
our largest customers would be more serious and may affect our
profitability.
Marketing:
We
employ full-time marketing personnel and have negotiated various
commission-based sales agreements with other chemical distribution
companies.
Antimony Price Fluctuations:
Our operating results have been,
and will continue to be, related to the market prices of antimony
metal, which have fluctuated widely in recent years. The volatility
of prices is illustrated by the following table, which sets forth
the average prices of antimony metal per pound, as reported by
sources deemed reliable by us.
A five
year range of prices for antimony oxide and antimony metal, per
pound, was as follows:
|
|
USAC SALES
|
|
|
||
|
|
Oxide
|
Metal
|
Combined
|
USA
|
Rotterdam
|
|
|
|
|
(Metal Contained Price)
|
|
|
|
|
Average
|
Average
|
Average
|
Average
|
Average
|
|
Year
|
Price/Lb
|
Price/Lb
|
Price/Lb
|
Price/Lb
|
Price/Lb
|
|
2019
|
$
3.14
|
$
3.46
|
$
3.48
|
$
3.05
|
$
3.03
|
|
2018
|
$
3.77
|
$
3.70
|
$
4.11
|
$
3.82
|
$
3.74
|
|
2017
|
$
3.40
|
$
3.41
|
$
4.01
|
$
3.77
|
$
3.78
|
|
2016
|
$
3.11
|
$
2.62
|
$
2.98
|
$
2.99
|
$
2.94
|
|
2015
|
$
3.34
|
$
3.71
|
$
3.97
|
$
3.41
|
$
3.32
|
Antimony
metal prices are determined by a number of variables over which we
have no control. These include the availability and price of
imported metals, the quantity of new metal supply, and industrial
demand. If metal prices decline and remain depressed, our revenues
and profitability may be adversely affected.
We use
various antimony raw materials to produce our products. We
currently obtain antimony raw material from sources in Canada and
Mexico.
Zeolite Division
We own
100% of Bear River Zeolite Company, (BRZ an Idaho corporation) that
was incorporated on June 1, 2000. BRZ has a lease with Webster
Farm, L.L.C. that entitles BRZ to surface mine and process zeolite
on property located near Preston, Idaho, in exchange for a royalty
payment. In 2010 the royalty was adjusted to $10 per ton sold. The
current minimum annual royalty is $60,000. In addition, BRZ has
more zeolite on U.S. Bureau of Land Management land. The Company
pays various royalties on the sale of zeolite products. William
Raymond and Nancy Couse are paid a royalty that varies from $1 to
$5 per ton. On a combined basis, royalties vary from 8%-13%. BRZ
has constructed a processing plant on the property and has improved
its productive capacity. We constructed a new warehouse in 2018 to
expedite our shipping and packaging for customers.
2
We have
no "proven reserves" or "probable reserves" of zeolite, as these
terms are defined by the Securities and Exchange
Commission.
"Zeolite"
refers to a group of industrial minerals that consist of hydrated
aluminosilicates that hold cations such as calcium, sodium,
ammonium, various heavy metals, and potassium in their crystal
lattice. Water is loosely held in cavities in the lattice. BRZ
zeolite is regarded as one of the best zeolites in the world due to
its high CEC of approximately 180-220 meq/100 gr., its hardness and
high clinoptilolite content, its absence of clay minerals, and its
low sodium content. BRZ's zeolite deposits’ characteristics
which make the mineral useful for a variety of purposes
including:
●
Soil Amendment and Fertilizer
.
Zeolite has been successfully used to fertilize golf courses,
sports fields, parks and common areas, and high value agricultural
crops
●
Water Filtration
. Zeolite is
used for particulate, heavy metal and ammonium removal in swimming
pools, municipal water systems, fisheries, fish farms, and
aquariums.
●
Sewage Treatment
. Zeolite is
used in sewage treatment plants to remove nitrogen and as a carrier
for microorganisms.
●
Nuclear Waste and Other Environmental
Cleanup
. Zeolite has shown a strong ability to selectively
remove strontium, cesium, radium, uranium, and various other
radioactive isotopes from solution. Zeolite can also be used for
the cleanup of soluble metals such as mercury, chromium, copper,
lead, zinc, arsenic, molybdenum, nickel, cobalt, antimony, calcium,
silver and uranium.
●
Odor Control
. A major cause of
odor around cattle, hog, and poultry feed lots is the generation of
the ammonium in urea and manure. The ability of zeolite to absorb
ammonium prevents the formation of ammonia gas, which disperses the
odor.
●
Gas Separation
. Zeolite has
been used for some time to separate gases, to re-oxygenate
downstream water from sewage plants, smelters, pulp and paper
plants, and fish ponds and tanks, and to remove carbon dioxide,
sulfur dioxide and hydrogen sulfide from methane generators as
organic waste, sanitary landfills, municipal sewage systems, animal
waste treatment facilities, and is excellent in pressure swing
apparatuses.
●
Animal Nutrition
. According to
other research, feeding up to 2% zeolite increases growth rates,
decreases conversion rates, and prevents scours. BRZ does not make
these claims.
●
Miscellaneous Uses
. Other uses
include catalysts, petroleum refining, concrete, solar energy and
heat exchange, desiccants, pellet binding, horse and kitty litter,
floor cleaner and carriers for insecticides, pesticides and
herbicides.
Environmental Matters
Our
exploration, development and production programs conducted in the
United States are subject to local, state and federal regulations
regarding environmental protection. Some of our production and
mining activities are conducted on public lands. We believe that
our current discharge of waste materials from our processing
facilities is in material compliance with environmental regulations
and health and safety standards. The U.S. Forest Service
extensively regulates mining operations conducted in National
Forests. Department of Interior regulations cover mining operations
carried out on most other public lands. All operations by us
involving the exploration for or the production of minerals are
subject to existing laws and regulations relating to exploration
procedures, safety precautions, employee health and safety, air
quality standards, pollution of water sources, waste materials,
odor, noise, dust and other environmental protection requirements
adopted by federal, state and local governmental authorities. We
may be required to prepare and present data to these regulatory
authorities pertaining to the effect or impact that any proposed
exploration for, or production of, minerals may have upon the
environment. Any changes to our reclamation and remediation plans,
which may be required due to changes in state or federal
regulations, could have an adverse effect on our operations. The
range of reasonably possible loss in excess of the amounts accrued,
by site, cannot be reasonably estimated at this time.
We
accrue environmental liabilities when the occurrence of such
liabilities is probable and the costs are reasonably estimable. The
initial accruals for all our sites are based on comprehensive
remediation plans approved by the various regulatory agencies in
connection with permitting or bonding requirements. Our accruals
are further based on presently enacted regulatory requirements and
adjusted only when changes in requirements occur or when we revise
our estimate of costs to comply with existing requirements. As
remediation activity has physically commenced, we have been able to
refine and revise our estimates of costs required to fulfill future
environmental tasks based on contemporaneous cost information,
operating experience, and changes in regulatory requirements. In
instances where costs required to complete our remaining
environmental obligations are clearly determined to be in excess of
the existing accrual, we have adjusted the accrual accordingly.
When regulatory agencies require additional tasks to be performed
in connection with our environmental responsibilities, we evaluate
the costs required to perform those tasks and adjust our accrual
accordingly, as the information becomes available. In all cases,
however, our accrual at year-end is based on the best information
available at that time to develop estimates of environmental
liabilities.
Antimony Processing Site
We have
environmental remediation obligations at our antimony processing
site near Thompson Falls, Montana ("the Stibnite Hill Mine Site").
We are under the regulatory jurisdiction of the U.S. Forest Service
and subject to the operating permit requirements of the Montana
Department of Environmental Quality. At December 31, 2019 and 2018,
we have accrued $100,000 to fulfill our environmental
responsibilities.
3
BRZ
During
2001, we recorded a reclamation accrual for our BRZ subsidiary,
based on an analysis performed by us and reviewed and approved by
regulatory authorities for environmental bonding purposes. The
accrual of $7,500 represents our estimated costs of reclaiming, in
accordance with regulatory requirements, the acreage disturbed by
our zeolite operations, and remains unchanged at December 31,
2019.
General
Reclamation
activities at the Thompson Falls Antimony Plant have proceeded
under supervision of the U.S. Forest Service and Montana Department
of Environmental Quality. We have complied with regulators'
requirements and do not expect the imposition of substantial
additional requirements.
We have
posted cash performance bonds with a bank and the U.S. Forest
Service in connection with our reclamation activities.
We
believe we have accrued adequate reserves to fulfill our
environmental remediation responsibilities as of December 31, 2019.
We have made significant reclamation and remediation progress on
all our properties over thirty years and have complied with
regulatory requirements in our environmental remediation
efforts.
Employees
As of December 31, 2019, we employed 28 full-time employees in
Montana. In addition, we employed 19 people at our zeolite plant in
Idaho, and more than 50 employees at our mining, milling and
smelting operation in Mexico. We also employ approximately 80
contracted miners. The number of full-time employees may vary
seasonally. None of our employees are covered by any collective
bargaining agreement.
Other
We hold
no material patents, licenses, franchises or concessions. However,
we consider our antimony processing plants proprietary in
nature.
We are
subject to the requirements of the Federal Mining Safety and Health
Act of 1977, the Occupational Safety and Health Administration's
regulations, requirements of the state of Montana and the state of
Idaho, federal and state health and safety statutes and Sanders
County, Montana and Franklin County, Idaho health
ordinances.
I
tem 1A Risk Factors
There
may be events in the future that we are not able to accurately
predict or over which we have no control. The risk factors listed
below, as well as any cautionary language in this report, provide
examples of risks, uncertainties and events that may cause our
actual results to differ materially from the expectations we
describe in our forward-looking statements.
If we were liquidated, our common
stockholders could lose part, or all, of their
investment
.
In the
event of our dissolution, the proceeds, if any, realized from the
liquidation of our assets will be distributed to our stockholders
only after the satisfaction of the claims of our creditors and
preferred stockholders. The ability of a purchaser of shares to
recover all, or any portion, of the purchase price for the shares,
in that event, will depend on the amount of funds realized and the
claims to be satisfied by those funds.
We may have un-asserted liabilities for environmental
reclamation.
Our
research, development, manufacturing and production processes
involve the controlled use of hazardous materials, and we are
subject to various environmental and occupational safety laws and
regulations governing the use, manufacture, storage, handling, and
disposal of hazardous materials and some waste products. The risk
of accidental contamination or injury from hazardous materials
cannot be completely eliminated. In the event of an accident, we
could be held liable for any damages that result and any liability
could exceed our financial resources. We also have one ongoing
environmental reclamation and remediation project at our current
production facility in Montana. Adequate financial resources may
not be available to ultimately finish the reclamation activities if
changes in environmental laws and regulations occur, and these
changes could adversely affect our cash flow and profitability. We
do not have environmental liability insurance now, and we do not
expect to be able to obtain insurance at a reasonable cost. If we
incur liability for environmental damages while we are uninsured,
it could have a harmful effect on our financial condition and
results of operations. The range of reasonably possible losses from
our exposure to environmental liabilities in excess of amounts
accrued to date cannot be reasonably estimated at this
time.
4
We have accruals for asset retirement obligations and environmental
obligations.
We have
accruals totaling $283,868 on our balance sheet at December 31,
2019, for our environmental reclamation responsibilities and
estimated asset retirement obligations. If we are not able to
adequately perform these activities on a timely basis, we could be
subject to fines and penalties from regulatory
agencies.
Global health crises may adversely affect our planned
operations.
Our
business could be materially and adversely affected by the risks,
or the public perception of the risks, related to a pandemic or
other health crisis, such as the recent outbreak of novel
coronavirus (COVID-19). A significant outbreak of contagious
diseases in the human population could result in a widespread
health crisis that could adversely affect our planned operations.
Such events could result in the complete or partial closure of our
operations. In addition, it could impact economies and financial
markets, resulting in an economic downturn that could impact our
ability to raise capital.
I
tem 1B Unresolved Staff
Comments
Not
Applicable
I
tem 2 Description of
Properties
ANTIMONY DIVISION
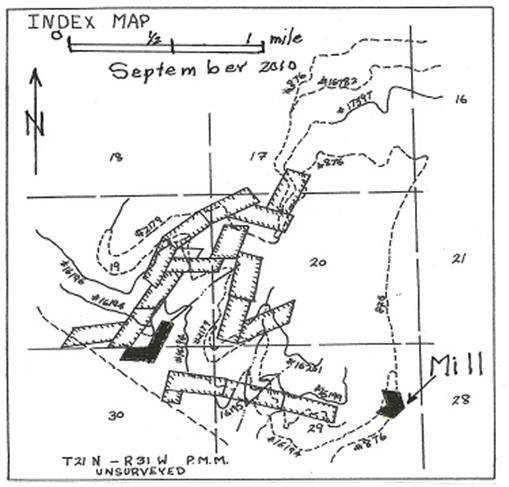
Our
antimony smelter and precious metals plant is located in the Burns
Mining District, Sanders County, Montana, approximately 14 miles
west of Thompson Falls on Montana Highway 471. This highway is
asphalt, and the property is accessed by cars and trucks. The
property includes two five-acre patented mill sites that are owned
in fee-simple by us. The claims are U. S. Antimony Mill Site No. 1
(Mineral Survey 10953) and U. S. Antimony Mill Site No. 2 (Mineral
Survey 10953). We also own five acre Black Jack
millsite.
The U.
S. Antimony Mill Sites were used to run a flotation mill and
processing plant for antimony that we mined on adjacent claims that
have been sold. Presently, we run a smelter that includes furnaces
of a proprietary design to produce antimony metal, antimony oxide,
and various other products. We also run a precious metals plant.
The facility includes 6 buildings and our main office. There are no
plans to resume mining on the claims that have been sold or
abandoned, although the mineral rights have been retained on many
of the patented mining claims. The U. S. Forest Service and Montana
Department of Environmental Quality have told us that the
resumption of mining would require an Environmental Impact
Statement, massive cash bonding, and would be followed by years of
law suits. The mill site is serviced with three-phase electricity
from Northwest Power, and water is pumped from a well.
We
claim no reserves on any of these properties.
5
Antimony
mining and milling operations in the U.S. were curtailed during
1983 due to continued declines in the price of antimony. We are
currently purchasing foreign raw antimony materials and producing
our own raw materials from our properties in Mexico. We continue to
produce antimony metal, oxide, sodium antimonite, and precious
metals from our processing facility near Thompson Falls,
Montana.
6
ANTIMONY MINERAL PROPERTIES
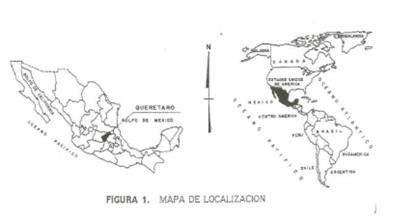
Los Juarez Group
We hold
properties that are collectively called the “Los
Juarez” property, in Queretaro, as follows:
1.
San
Miguel I and II were purchased by a USAC subsidiary, Antimonio de
Mexico, S. A. de C. V (AM), for $1,480,500, which was paid in full
as of December 31, 2018. As of December 31, 2019, we have paid for
the property and have incurred significant permitting costs. The
property consists of 40 hectares (100 acres)
2.
San
Juan I and II are concessions owned by AM and include 466 hectares
(1,152 acres)
3.
San
Juan III is held by a lease agreement by AM in which we will pay a
10% royalty, based on the net smelter returns from another USAC
Mexican subsidiary, named United States Antimony Mexico, S. A. de
C. V. or USAMSA. It consists of 214 hectares (529
acres).
The
concessions collectively constitute 720 hectares (1,780 acres). The
claims are accessed by roads that lead to highways.
7
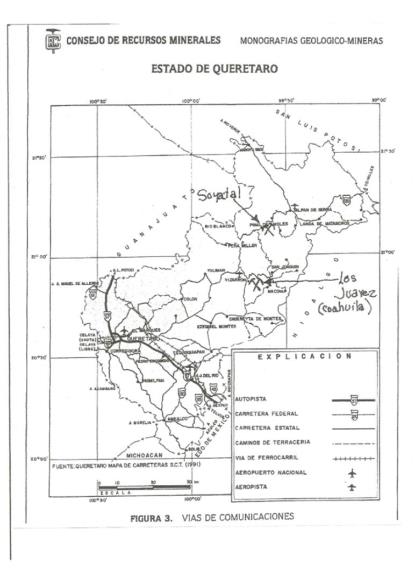
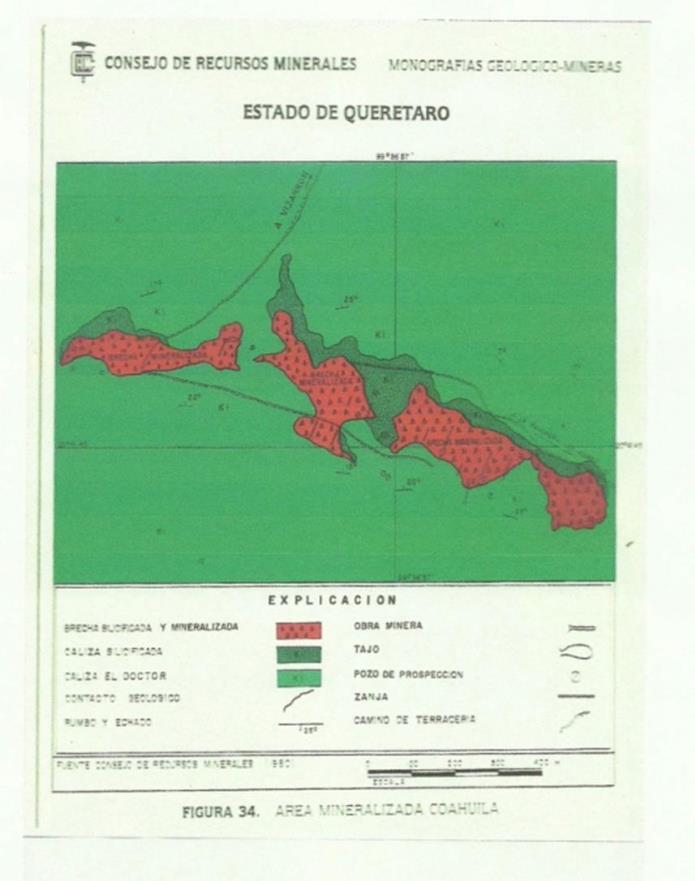
Part of
the USAC Mexican property, including San Miguel I, II and part of
San Juan III, was originally drilled by the Penoles Company in
1970, when antimony metal prices were high. They did not proceed
with the property, due to the complex metallurgy of antimony.
Subsequently, the Mexican Government did additional work and
reported a deposit of mineralized material of 1,000,000 metric tons
(mt) grading 1.8% antimony and 8.1 ounces of silver per metric ton
(opmt) in Consejo de Recursos Minerales (Publicacion
M-4e). Such a report does not qualify as a comprehensive
evaluation, such as a final or bankable feasibility study that
concludes legal and technical viability, and economic feasibility.
The Securities and Exchange Commission does not recognize this
report, and we claim no reserves.
8
9
The
mineralized zone is a classic jasperoid-type deposit in the
Cretaceous El Doctor Limestone. The mineralization is confined to
silicified jasperoid pipes intruded upwards into limestone. The
zone strikes north 70 degrees west. The dimension of the deposit is
still conjectural. However, the strike length of the jasperoid is
more than 3,500 meters.
The
mineralization is typically very fine-grained stibnite with silver
and gold. It is primarily sulfide in nature due to its
encapsulation in silica. The mining for many years will be by open
pit methods. Eventually it will be by underground methods. At the
present time, mining has included hauling dump rock and rock from
mine faces.
Soyatal Mining District, Pinal De Amoles, Queretaro,
Mexico
Soyatal
We
abandoned the Soyatal mining property and the associated debt in
the fourth quarter of 2019, and reported a loss on abandonment of
mineral properties on our consolidated statement of
operations.
USAMSA Puerto Blanco Flotation Mill, Guanajuato,
Mexico
The
flotation plant has a capacity of 100 metric tons per day. It
includes a 30” x 42” jaw crusher, a 4’x 8’
double-deck screen, a 36” cone crusher, an 8’x
36” Harding type ball mill, and eight No. 24 Denver sub A
type flotation machines, an 8’ disc filter, front end
loaders, tools and other equipment. The flotation circuit is used
for the processing of rock from Los Juarez and other properties. We
are in the process of installing a 400 metric ton per day flotation
mill that will be dedicated to processing ore from our Los Juarez
property. The crushing equipment currently in place is adequate for
both flotation mills. An oxide circuit was added to the plant in
2013 and 2014 to mill oxide ores from Soyatal and other properties.
It includes a vertical shaft impactor, 3 ore bins, 8 conveyors, a
4’ x 6’ high frequency screen, jig, 8 standard
concentrating tables, 5 pumps, sand screw and two buildings. The
capacity of the oxide circuit is 50 tons per day. We have installed
a cyanide leach circuit and settling pond that will be used to
recover precious metals from our Los Juarez mine. We expect to be
in commercial production of precious metals by the third quarter of
2020. During 2019 and 2018, less than 2% of the mill’s
capacity was utilized.
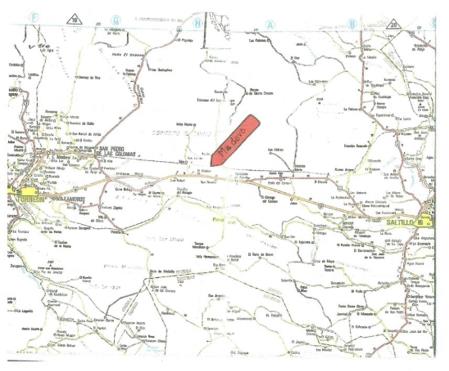
USAMSA Madero Smelter, Estacion Madero, Parras De La Fuente,
Coahuila, Mexico
USAC,
through its wholly owned subsidiary, USAMSA, owns and operates a
smelting facility at Estacion Madero, in the Municipio of Parras de
la Fuente, Coahuila, Mexico. The property includes 13.48 hectares
(30 acres). Seventeen small rotating furnaces (SRF’s) and
four large rotating furnaces (LRF) with an associated stack and
scrubbers, were permitted and installed by the end of 2019. Other
equipment includes cooling ducting, dust collectors, scrubber,
laboratory, warehouse, slag vault, stack, jaw crusher, screen,
hammer mill, and a 3.5’ x 8’ rod mill. The plant has a
feed capacity of twenty to thirty metric tons of direct shipping
ore or concentrates per day, depending on the quality of the
feedstock. If the feedstock is in the mid-range of 45% antimony,
the smelter could produce as much as 10MM pounds of contained
antimony annually. Concentrates from our flotation plant, and
hand-sorted ore from Mexico sources and other areas, are being
processed. During 2019, we completed the installation of a leach
circuit to process concentrates from the Puerto Blanco cyanide
leach plant containing precious metals from our Los Juarez Mining
property. The Madero production is either sold as metal directly to
customers or shipped to our Montana plant to produce finished
Antimony products and precious metals. Access to the plant is by
road and railroad. Set forth below are location maps:
10
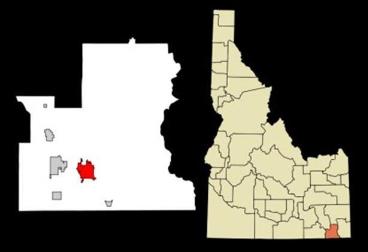
ZEOLITE DIVISION
Location
This
property is located in the southeast corner of Idaho, approximately
seven miles east of Preston, Idaho, 34 miles north of Logan, Utah,
79 miles south of Pocatello, Idaho, and 100 miles north of
Salt Lake City, Utah.
The
mine is located in the N ½ of section 10 and the W ½ of
section 2, section 3, and the E ½ section 4, Township 15,
Range 40 East of the Boise Meridian, Franklin County, Idaho. The
plant and the initial pit are located on the Webster Farm, L.L.C.,
which is private land.
Transportation
The
property is accessed by seven miles of paved road and about l mile
of gravel road from Preston, Idaho. Preston is near the major
north-south Interstate Highway 15 to Salt Lake City or
Pocatello.
Several
Union Pacific rail sidings may be available to the mine. Bonida is
approximately 25 miles west of the mine and includes acreage out of
town where bulk rock could be stored, possibly in existing silos or
on the ground. Three-phase power is installed at this abandoned
site. Finished goods can also be shipped from the
Franklin County Grain Growers feed mill in the town of Preston on
the Union Pacific Railroad.
The
Burlington Northern Railroad can be accessed at Logan,
Utah.
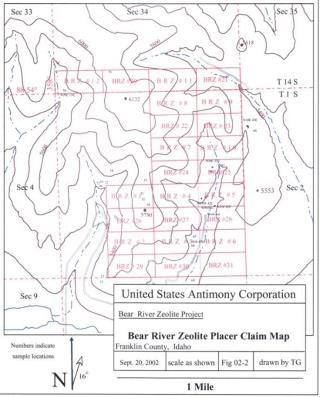
Location
Map
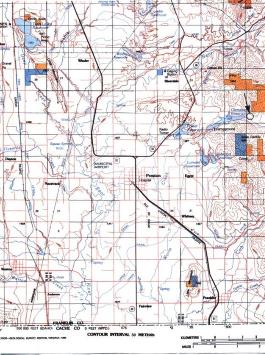
11
Property and Ownership
BRZ
leases 320 acres from the Webster Farm, L.L.C. The term of the
lease is 15 years and it began on March 1, 2010. This includes the
mill site and zeolite in the area of the open pit. The property is
the NW ¼ and W ½ of the SW ¼ of section 3 and the N
½ of the W ¼ of section 10, Township 15 South, Range 40
East of the Boise Meridian, Franklin County, Idaho. The lease
requires a payment of $10.00 per ton plus an additional annual
payment of $10,000 on March 1st of each year. In addition, there
are two other royalty holders. Nick Raymond and the estate of
George Desborough each have a graduated royalty of $1.00 per ton to
$5.00 per ton, depending on the sale price.
The
balance of the property is on Bureau of Land Management property
and includes 480 acres held by 24, 20-acre Placer claims. Should we
drop our lease with Webster Farms LLC., we will retain these placer
claims as follows:
|
BRZ
1 IMC
185308
BRZ
2 IMC
185309
BRZ
3 IMC
185310
BRZ
4 IMC
185311
BRZ
5 IMC
185312
BRZ
6 IMC
185313
BRZ
7 IMC
185314
BRZ
8 IMC
185315
BRZ
9 IMC
185316
BRZ
10 IMC 185317
BRZ
11 IMC 185318
BRZ
12 IMC 185319
|
BRZ
20 IMC 186183
BRZ
21 IMC 186184
BRZ
22 IMC 186185
BRZ
23 IMC 186186
BRZ
24 IMC 186187
BRZ
25 IMC 186188
BRZ
26 IMC 186189
BRZ
27 IMC 186190
BRZ
28 IMC 186191
BRZ
29 IMC 186192
BRZ
30 IMC 186193
BRZ
31 IMC 186194
|
12
Geology
The
deposit is a very thick, sedimentary deposit of zeolitized volcanic
ash of Tertiary age known as the Salt Lake Formation. The
sedimentary interval in which the clinoptilolite occurs is more
than 1000 feet thick in the area. Thick intervals of the zeolite
are separated by thin limestone and sandstone beds deposited in the
freshwater lake where the volcanic ash accumulated.
The
deposit includes an 800- foot mountain. Zeolite can be sampled over
a vertical extent of 800 feet on more than 700 acres. The current
pit covers more than 3 acres. Despite the
apparent size of the deposit, we claim no
reserves.
Exploration, Development, and Mining
Exploration
has been limited to the examination and sampling of surface
outcrops and mine faces.
Mining Methods
Depending
on the location, the zeolite is overlain by 1 to 12 feet of
zeolite-rich soil. On the ridges, the cover is very little, and in
the draws the soil is thicker. The overburden is stripped using a
tractor dozer, currently a Caterpillar D-8K. It is moved to the toe
of the pit, and will eventually be dozed back over the pit for
reclamation.
Although
near-surface rock is easily ripped, it is more economical to drill
and blast it. Breakage is generally good. Initial benches are 20
feet high, and each bench is accessed by a road.
Haulage
is over approximately 4,000 feet of road on an uphill grade of 2.5%
to the mill. On higher benches, the grade will eventually be
downhill. Caterpillar 769 B rock trucks are being used. They haul
18 to 20 tons per load, and the cycle time is about 30
minutes.
With
the trucks and the other existing equipment, the mine is capable of
producing 80 tons per hour.
MILLING
Primary Crusher
The
primary crushing circuit is a conventional closed circuit,
utilizing a Stephens-Adamson 42” x 12’ apron feeder,
Pioneer 30” x 42” jaw crusher, Nordberg standard
3’ cone crusher, a 5’ by 12’ double
deck Kohlberg screen, and has a self-cleaning dust collector. The
rock is crushed to minus 1 inch and the circuit has a rated
capacity of more than 50 tons per hour.
Dryer
There
are two dryer circuits, one for lines one and two, and one for the
Raymond mill. The dryer circuits include one 50 ton feed bin, and
each dryer has a conveyor bypass around each dryer, a bucket
elevator, and a dry rock bin. The dryers are 25 feet long, 5 feet
in diameter and are fired with propane burners rated at 750,000
BTUs. One self-cleaning bag house services both dryers. Depending
on the wetness of the feed rock, the capacity is in the range of 10
tons per hour per dryer. During most of the year, the dryers are
not run.
Coarse Products Circuit
There
are two lines to produce coarse products:
●
Line 1 is a
closed circuit with a 100 HP vertical shaft impactor and a 5 deck
Midwestern Multi Vibe high frequency screen.
●
Line 2 includes a
Jeffries 30” by 24” 60 HP hammer mill in a closed
circuit with two 5’ x 12’ triple deck Midwestern Multi
Vibe high frequency screens. The circuits also include bucket
elevators, (3) 125 ton capacity product silos, a 6 ton capacity
Crust Buster blender, augers, Sweco screens, and dust
collectors.
13
Fine Products Circuit
The
fine products circuit is in one building and it includes (2)
3.5’ x 10.5’ Derrick 2 deck high frequency (3450 RPM)
screens and various bucket elevators, augers, bins, and Sweco
screens for handling product. Depending on the screening sizes, the
plants can generate approximately 150 tons of granules and 125 tons
of fines per 24-hour day.
Raymond Mill Circuit
The
Raymond mill circuit includes a 6058 high-side Raymond mill with a
double whizzer, dust collector, two 100 ton product silos, feed
bin, conveyors, air slide, bucket elevators, and control booth. The
Raymond mill has a rated capacity of more than 10 tons per
hour.
I
tem 3 Legal Proceedings
No
director, officer or affiliate of USAC and no owner of record or
beneficial owner of more than 5.0% of our securities or any
associate of any such director, officer or security holder is a
party adverse to USAC or has a material interest adverse to USAC in
reference to pending litigation.
I
tem 4 Mine Safety
Disclosures
The
information concerning mine safety violations or other regulatory
matters required by section 1503(a) of the Dodd-Frank Wall Street
Reform and Consumer Protection Act and Item 104 of Regulation S-K
is included in Exhibit 95 to this Annual Report.
P
ART II
I
tem 5 Market for Common Equity and
Related Stockholder Matters
Currently,
our common stock is traded on the NYSE-AMERICAN under the symbol
UAMY.
The
approximate number of holders of record of our common stock at
April 14, 2020, is 2,500.
We have
not declared or paid any dividends to our stockholders during the
last five years and do not anticipate paying dividends on our
common stock in the foreseeable future. Instead, we expect to
retain earnings for the operation and expansion of our
business.
During
the year ended December 31, 2019, the Company awarded, but did not
issue, common stock with a value of $134,375 to its Board of
Directors as compensation for their services as directors. In
connection with the issuances, the Company recorded $134,375 in
director compensation expense and accrued common stock
payable.
In
January 2019, the Company issued Daniel Parks, the Company’s
Chief Financial Officer, 200,000 shares of the Company’s
common stock with a fair value of $136,000 to retain his services.
As part of the agreement, Mr. Parks’ hours worked and cash
compensation was reduced.
In
April 2019, the Company issued the Board members 330,183 shares of
the Company’s common stock for services provided during 2018
which was accrued at December 31, 2018, with a value of
$175,000.
During
2019, the Company sold units consisting of 904,082 shares of its
common stock and 452,041 warrants to purchase shares of common
stock for $0.48 per unit for total proceeds of $433,960. The
warrants are exercisable at $0.65 and expire in 2022. Offering
costs associated with the sale totaled $29,761.
I
tem 6
Selected Financial Data
Not
Applicable.
I
tem 7
Management's Discussion and Analysis or Plan
of Operations
Certain
matters discussed are forward-looking statements that involve risks
and uncertainties, including the impact of antimony prices and
production volatility, changing market conditions and the
regulatory environment and other risks. Actual results may differ
materially from those projected. These forward-looking statements
represent our judgment as of the date of this filing. We disclaim,
however, any intent or obligation to update these forward-looking
statements.
14
Overview
Company-wide
For the
year ended December 31, 2019, we reported net loss of $3,672,891,
after depreciation and amortization of $895,990, compared to a net
income of $873,225 for 2018 after depreciation and amortization of
$904,844. Our company-wide EBITDA was a negative $2,776,901 for
2019, compared to a positive EBITDA of $1,445,737 for
2018.
Net
non-cash expense items for 2019 totaled $2,653,757 and included
$1,410,736 for abandonment of Mexican mineral properties, $895,990
for depreciation and amortization, $54,112 for amortization of debt
discount, $134,375 for stock-based director compensation, $136,000
for stock-based employee compensation, $16,396 for the write-down
of inventory, and $6,148 for other items.
For the
year ended December 31, 2018, we reported net income of $873,225,
after depreciation and amortization of $904,844, compared to a loss
of $1,134,394 for 2017 after depreciation and amortization of
$968,888. Our company-wide EBITDA was $1,445,737 for 2018, compared
to a negative EBITDA of $165,506 for 2017.
Net
non-cash expense items for 2018 totaled $1,234,685 and included
$904,844 for depreciation and amortization, $83,991 for
amortization of debt discount, $175,000 for stock-based director
compensation, $64,702 for the write-down of inventory and $6,148
for other items.
During
the year ending December 31, 2019, there was a major transaction
that had a material impact on the Company’s net income and
balance sheet.
●
During the fourth
quarter of 2019, it was decided to abandon two mining claims in
Mexico, known as the Guadalupe mine and the Soyatal mine. This
decision was prompted by the low prices for antimony and the
expected cost to develop the properties. The effect of abandoning
the properties was a non-cash loss of $1,410,736 which was the
carrying value of the mineral properties less the balance of
related debt.
During
the year ending December 31, 2018, there were several transactions
that had a material impact on the Company’s net income and
balance sheet.
●
On August 31, 2018,
we completed an agreement to acquire a company that was an antimony
processing plant in Reynosa, Mexico for which we were paid
$1,500,000. As part of the demolition, we were able to salvage a
significant amount of equipment and plant infrastructure which will
enhance our Mexican operations. As of December 31, 2018, we had
incurred approximately $378,562 of expenses decommissioning the
antimony plant, of which we treated $225,925 as a capital
expenditure for salvaged equipment, and $152,636 were included in
other operating expense. We will incur additional costs in 2019. We
will use the equipment to improve and increase capacity at our
smelter at Madero, complete the cyanide leach plant at Puerto
Blanco for processing the precious metals ore from the Los Juarez
mine, and provide equipment for our mines.
●
In the third
quarter of 2018, we settled an income tax liability in Mexico for
$443,110 with a finding of no tax due. We paid our Mexican
attorneys and accountants $157,500 to represent us in this
matter.
●
In November 2018,
we sold the real property we acquired with the Reynosa processing
plant for $700,000. We were paid $300,000 in 2018 and received the
remainder by March 5, 2019.
Antimony Sales
During
2019, we saw our average sale price decrease by $0.63 per pound
from an average price of $4.11 per pound for 2018 to $3.48 per
pound for 2019. During 2019, our raw material from our North
American supplier increased by approximately 100,000 pounds and our
supply of raw material from our Mexican mines decrease by
approximately 20,000 pounds. Even though our sales volume
increased, our total sales of antimony decreased due to the
decrease in our sales price. This resulted in estimated decreased
sales of approximately $662,000. Normal shipments from our North
American supplier resumed in 2019 at a lower level than we
expected, and we do not expect an increase from this supplier in
the near future. We do not expect to see a significant increase in
the antimony produced by our Mexican mines in 2020.
During
2018, we saw our average sale price increase by $0.10 per pound to
$4.11 per pound from an average price of $4.01 per pound for 2017.
During 2018, we saw our raw material from our North American
supplier temporarily decrease by approximately 660,000 pounds and
our supply of raw material from our Mexican mines increase by
approximately 128,000 pounds. This resulted in estimated decreased
sales of $1.5 million (approximately 532,000 pounds of
antimony).
In the
third quarter of 2019, we renegotiated our sodium antimonite supply
agreement from our North American supplier to recognize that
antimony prices were in a world-wide slump, and that our general
and administrative costs were a larger percent of our revenues than
they were under the previous agreement. The new price agreement was
implemented in quarter three of 2019, and resulted in lower
antimony production costs and an improved cash flow for 2019 and
better expectations for the North American operations for
2020.
15
Zeolite Sales
Our
sales volume of zeolite in 2019 was 641 tons less than we sold in
2018, a decrease of 4.5%. Our average sales price increased by
approximately $6 per ton, from $186 per ton in 2018 to $192 per ton
in 2019 (2.7%). During 2019, total sales of zeolite decreased by
$43,827 from 2018. The zeolite division had an EBIDTA of $683,936
for 2019, compared to an EBITDA of $638,764 for 2018. Net income
increased from $449,961 in 2018 to $497,470 in 2019, approximately
$47,000.
Our
sales volume of zeolite in 2018 was 1,944 tons more than we sold in
2017, an increase of 16%. Our average sales price increased by
approximately $3 per ton, from $183 per ton in 2017 per ton to $186
per ton in 2018 (2%). During 2018, total sales of zeolite increased
by $400,308 from 2017. The zeolite division had EBIDTA of $638,764
for 2018, compared to EBITDA of $554,201 for 2017. Net income
increased from $331,472 in 2017 to $449,961 in 2018, approximately
$118,000.
Precious Metals Sales
|
Precious Metals Sales
|
|
|
|
Silver/Gold - Montana
|
2018
|
2019
|
|
Ounces
Gold Shipped (Au)
|
68.91
|
39.92
|
|
Ounces
Silver Shipped (Ag)
|
18,278
|
10,986
|
|
Revenues
|
$
254,445
|
$
171,668
|
|
Mexico
|
|
Mexico
|
|
Ounces
Gold Shipped (Au)
|
-
|
8.21
|
|
Ounces
Silver Shipped (Ag)
|
|
728
|
|
Revenues
- Gross
|
-
|
$
22,571
|
|
Revenues
to Hillgrove
|
-
|
$
0
|
|
Revenues
to USAC
|
-
|
$
22,571
|
|
|
|
|
|
Total Revenues
|
$
254,445
|
$
194,239
|
|
|
|
|
|
|
|
|
16
For the
years ended December 31, 2019 and 2018, the EBITDA for precious
metals was $194,239 and $254,445, respectively.
|
Results of Operations by Division
|
|
|
|
|
2019
|
2018
|
|
Antimony Division - United States:
|
|
|
|
Revenues
- Antimony (net of discount)
|
$
5,450,649
|
$
6,113,014
|
|
Domestic
cost of sales:
|
|
|
|
Production
costs
|
2,352,959
|
2,958,396
|
|
Depreciation
|
43,738
|
52,681
|
|
Freight
and delivery
|
243,341
|
263,673
|
|
Indirect
production costs
|
164,876
|
189,380
|
|
Direct
sales expense
|
65,652
|
65,738
|
|
Total
domestic antimony cost of sales
|
2,870,566
|
3,529,868
|
|
|
|
|
|
Cost
of sales - Mexico
|
|
|
|
Production
costs
|
3,268,277
|
2,287,694
|
|
Depreciation
and amortization
|
596,719
|
595,317
|
|
Freight
and delivery
|
-
|
54,943
|
|
Land
lease expense
|
166,800
|
166,800
|
|
Indirect
production costs
|
71,329
|
199,561
|
|
Total
Mexico antimony cost of sales
|
4,103,125
|
3,304,315
|
|
|
|
|
|
Total
revenues - antimony
|
5,450,649
|
6,113,014
|
|
Total
cost of sales - antimony
|
6,973,691
|
6,834,183
|
|
Total
gross profit (loss) - antimony
|
(1,523,042
)
|
(721,169
)
|
|
|
|
|
|
Precious Metals Division:
|
|
|
|
Revenues
|
194,239
|
254,445
|
|
Cost
of sales:
|
|
|
|
Depreciation
|
69,067
|
68,042
|
|
Total
cost of sales
|
69,067
|
68,042
|
|
Gross
profit - precious metals
|
125,172
|
186,403
|
|
|
|
|
|
Zeolite Division:
|
|
|
|
Revenues
|
2,623,117
|
2,666,944
|
|
Cost
of sales:
|
|
|
|
Production
costs
|
1,160,502
|
1,290,747
|
|
Depreciation
|
186,466
|
188,803
|
|
Freight
and delivery
|
200,140
|
177,932
|
|
Indirect
production costs
|
158,891
|
108,913
|
|
Royalties
|
266,388
|
272,821
|
|
Direct
sales expense
|
69,111
|
91,419
|
|
Total
cost of sales
|
2,041,498
|
2,130,635
|
|
Gross
profit - zeolite
|
581,619
|
536,309
|
|
|
|
|
|
Total
revenues - combined
|
8,268,005
|
9,034,403
|
|
Total
cost of sales - combined
|
9,084,256
|
9,032,860
|
|
Total
gross profit (loss) - combined
|
$
(816,251
)
|
$
1,543
|
|
|
|
|
17
|
Earnings before income taxes
|
|
|
|
depreciation and amortization
|
|
|
|
|
|
|
|
Antimony - Combined USA
|
|
|
|
and Mexico
|
2019
|
2018
|
|
Lbs
of Antimony Metal USA
|
794,770
|
693,861
|
|
Lbs
of Antimony Metal Mexico:
|
771,815
|
792,259
|
|
Total Lbs of Antimony Metal Sold
|
1,566,585
|
1,486,120
|
|
Average
Gross Income per Lb Metal
|
$
3.48
|
$
4.11
|
|
Net income (loss) per Lb Metal
|
$
(2.74
)
|
$
0.16
|
|
|
|
|
|
Gross
antimony revenue - net of discount
|
$
5,450,649
|
$
6,113,014
|
|
Cost
of sales - domestic
|
(2,870,566
)
|
(3,529,868
)
|
|
Cost
of sales - Mexico
|
(4,103,125
)
|
(3,304,315
)
|
|
Operating
income (expenses):
|
|
|
|
Operating
expenditures
|
(1,451,267
)
|
(1,580,141
)
|
|
Gain
(loss) on plant acquisition
|
-
|
1,500,000
|
|
Gain
on sale of land
|
-
|
700,000
|
|
Loss
on abandonment of mineral properties
|
(1,409,022
)
|
-
|
|
Non-operating
income (expenses)
|
87,798
|
5,839
|
|
Income
tax benefit
|
-
|
332,332
|
|
Net income (loss) - antimony
|
(4,295,533
)
|
236,861
|
|
Depreciation
and amortization
|
640,457
|
647,999
|
|
Income
tax benefit
|
-
|
(332,332
)
|
|
EBITDA - antimony
|
$
(3,655,076
)
|
$
552,528
|
|
|
|
|
|
Precious Metals
|
|
|
|
Ounces sold
|
|
|
|
Gold
|
48
|
69
|
|
Silver
|
11,714
|
18,278
|
|
|
|
|
|
Gross
precious metals revenue
|
$
194,239
|
$
254,445
|
|
Cost
of sales
|
(69,067
)
|
(68,042
)
|
|
Net income - precious metals
|
125,172
|
186,403
|
|
Depreciation
|
69,067
|
68,042
|
|
EBITDA - precious metals
|
$
194,239
|
$
254,445
|
|
|
|
|
|
Zeolite
|
|
|
|
Tons sold
|
13,680
|
14,321
|
|
Average
Sales Price/Ton
|
$
191.75
|
$
186.23
|
|
Net income /Ton
|
$
36.36
|
$
31.42
|
|
|
|
|
|
Gross
zeolite revenue
|
$
2,623,117
|
$
2,666,944
|
|
Cost
of sales
|
(2,041,498
)
|
(2,130,635
)
|
|
Operating
expenses
|
(68,567
)
|
(74,366
)
|
|
Non-operating
expenses
|
(15,582
)
|
(11,982
)
|
|
Net income - zeolite
|
497,470
|
449,961
|
|
Depreciation
|
186,466
|
188,803
|
|
EBITDA - zeolite
|
$
683,936
|
$
638,764
|
|
|
|
|
|
Company-wide
|
|
|
|
Gross
revenue
|
$
8,268,005
|
$
9,034,403
|
|
Production
costs
|
(9,084,256
)
|
(9,032,860
)
|
|
Operating
income (expenses)
|
(2,928,856
)
|
545,493
|
|
Non-operating
income (expenses)
|
72,216
|
(6,143
)
|
|
Income
tax benefit
|
-
|
332,332
|
|
Net income (loss)
|
(3,672,891
)
|
873,225
|
|
Depreciation,&
amortization
|
895,990
|
904,844
|
|
Income
tax benefit
|
-
|
(332,332
)
|
|
EBITDA
|
$
(2,776,901
)
|
$
1,445,737
|
18
During the period ended December 31, 2019, the
most significant event affecting our financial performance was the
decrease in the price of antimony. This decrease in prices caused
us to re-evaluate our commitment to the two antimony mines we were
purchasing in Mexico. We made the decision that with the depressed
prices and the
cost of developing the mines, it was in our
best interest to abandon these properties and look at re-acquiring
them in the future if antimony prices improved. It was decided that
our resources should be directed to completing our precious metals
facility at Puerto Blanco and starting precious metals production
in 2020. In connection with the low antimony prices, we negotiated
a lower cost agreement with our North American supplier which will
help us with future cash flow.
Our
plans are to process 14,000 tons of ore from the Los Juarez mine in
2020 and 24,000 tons in 2021. We think that the gross value of the
ore is approximately $120 per ton.
In
2018, we only received 50% of our expected supply from North
American sources, and we increased our raw material from Mexico by
approximately 130,000 pounds. We anticipated increasing the raw
material from Mexico and the resumption of normal shipments from
our North American supplier in 2019, but these plans did not
materialize due to low overall metal prices and the low antimony
prices in particular.
In both
2019 and 2018, the Puerto Blanco mill circuits were utilized less
than 2% of their capacity, but with the completion of the cyanide
leach circuit we expect it to be fully utilized processing precious
metals ore from the Los Juarez mine. Some antimony will be realized
as a by-product of processing the Los Juarez ore.
The
estimated recovery of precious metals per metric ton, after the
caustic leach and cyanide leach circuits, is as follows at Los
Juarez:
Antimony:
|
Schedule
of Los Juarez recovery values
|
Metal
|
Assay
|
Recovery
|
Value
|
Value/Mt
|
|
|
Gold
|
0.035
opmt
|
90
%
|
$1500/oz
|
$
47.00
|
|
|
Silver
|
3.27
opmt
|
90
%
|
$
12.00/oz
|
$
35.32
|
|
|
Antimony
|
0.652
%
|
70
%
|
3.15/lb
|
$
33.86
|
|
|
Total
|
|
|
|
$
116.18
|
The
following are highlights of the significant changes during
2019:
●
The sale of
antimony during 2019 was 1,566,585 pounds compared to 1,486,120
pounds in 2018, an increase of 80,465 pounds (5%).
●
The average sales
price of antimony during 2019 was $3.48 per pound compared to $4.11
during 2018, a decrease of $0.63 per pound (15%). During the
beginning of 2020, the Rotterdam price of antimony is approximately
$3.15 per pound.
●
The metallurgical
problem with the Los Juarez concentrates has been solved with the
cyanide and caustic leach plants, and initial production will
begin. This will put the Puerto Blanco mill in operation during
2020. During 2019 and 2018, the Puerto Blanco mill was operating at
less than 10% of capacity, while undergoing major construction
during 2019 and 2018.
●
The net loss for
antimony sold was $2.81 per pound in 2019. This was after a
$1,409,022 ($.90 per pound) non-cash loss from the abandonment of
mineral properties in Mexico.
●
Our cost of goods sold for antimony increased
from $6,834,183 in 2018 to $6,973,691 in 2019. This was primarily
due to the increase in raw material cost in Mexico.
For the years ended December 31, 2019
and 2018, costs of goods sold include operating and non-operating
production costs from Mexico operations.
●
Our cost of
production for the years ended December 31, 2019 and 2018 included
metallurgical testing at Puerto Blanco and Madero, Mexico, and to a
lesser degree, our plant in Thompson Falls, Montana.
●
We are producing
and buying raw materials, which will allow us to ensure a steady
flow of products for sale. Our smelter at Madero, Mexico, was
producing primarily from ore from the Wadley mine in 2019.
Production from Madero during 2019 and 2018 was primarily from our
own Mexican properties, and although we only received 50% of
expected raw materials from our North American supplier, we
purchased a significant portion of the raw materials for our
smelter in Montana.
●
We produced ingots
of antimony metal to be shipped directly to customers from our
Madero smelter in 2019. We intend to increase this for 2020 and
beyond. This will significantly reduce our production and shipping
costs.
●
We are proceeding
with the processing of Los Juarez ore in the 100 ton per day mill
at Puerto Blanco. We expect to process approximately 14,000 tons in
2020, and 24,000 tons per year in 2021 and 2022. A 400 ton per day
flotation mill is permitted and is partially installed, and we
expect to have it completed by the end of 2022. This mill will be
dedicated to processing rock from the Los Juarez mining property,
and we expect the volume of ore processed will increase to 500 tons
per day, or approximately 120,000 tons per year. We have adequate
crushing capacity in place to feed the 400 ton per day mill and the
existing mill. We estimate that we have approximately 30,000 tons
of ore stockpiled at our Los Juarez mine.
●
Our principal
smelter, a precious metals recovery operation, and our Company
headquarters remain in Montana.
Zeolite:
During
2019, BRZ sold 13,680 tons compared to 14,321 tons in 2018, a
decrease of 641 tons (4%). BRZ realized a net income of $497,470 in
2019 after depreciation of $186,466 compared to a net income of
$449,961 in 2018 after depreciation of $188,803.
19
General and Administrative:
General
and administrative costs, as reported in our statement of
operations, include fees paid to directors through stock based
compensation, office expenses, and fees to the NYSE AMERICAN, and
other non-operating costs. The combined general and administrative
costs were 8.1%, and 8.8%, of sales for 2019 and 2018,
respectively.
The
decrease in professional fees from 2018(approximately $118,000) was
primarily due to a decrease in attorney fees paid to our Mexican
tax attorney and accountants in 2018 for representation during the
audit of our Mexican subsidiary, which was resolved in our favor.
Our accounting fees for 2019 related to our annual audit and our
quarterly SEC filings $118,998 compared to $116,716 for
2018.
Factoring costs
increased in 2019 from approximately $5,000 in 2018 to
approximately $8,500 in 2019.
The
discounts we gave for early payments were approximately $100,000
for 2018 and $85,000 for 2019.
Subsidiaries
The
Company's consolidated financial statements include the accounts of
its wholly-owned subsidiaries BRZ, USAMSA, AM, and, since August
31, 2018, Lanxess Laurel and Lanxess Laurel Mexico. All
intercompany balances and transactions are eliminated in
consolidation.
Financial Condition and Liquidity
|
|
2019
|
2018
|
|
Current
assets
|
$
1,279,755
|
$
1,903,256
|
|
Current
liabilities
|
(3,975,681
)
|
(3,517,618
)
|
|
Net
Working Capital
|
$
(2,695,926
)
|
$
(1,614,362
)
|
|
|
|
|
|
Cash
provided (used) by operations
|
$
(5,711
)
|
$
(656,631
)
|
|
Cash
provided (used) by investing:
|
|
|
|
Cash
used for capital outlay
|
(792,925
)
|
(899,119
)
|
|
Proceeds
from plant acquisition
|
-
|
1,500,000
|
|
Proceeds
from sale of land
|
400,000
|
300,000
|
|
Cash
provided (used) by financing:
|
|
|
|
Net
payments (to) from factor
|
(5,644
)
|
5,644
|
|
Proceeds
from notes payable to bank
|
13,149
|
(8,648
)
|
|
Proceeds
from common stock issued
|
404,199
|
-
|
|
Principal
paid on long-term debt
|
(127,683
)
|
(236,915
)
|
|
Advances
from related party
|
237,400
|
135,000
|
|
Payments
on advances from related party
|
(35,066
)
|
(135,000
)
|
|
Checks
issued and payable
|
(28,849
)
|
18,234
|
|
Net
change in cash and restricted cash
|
$
58,870
|
$
22,565
|
Our net
working capital decreased for the year ended December 31, 2019 from
a negative amount of $1,614,362 at the beginning of the year to a
negative amount of $2,695,926 at the end of 2019. Our current
assets decreased primarily due to payment of a $400,000 note
receivable from the sale of land in Mexico, a decrease in accounts
receivable and inventories. Our current liabilities increased by
$458,063, which included a decrease of approximately $649,000 in
the current portion of long-term debt related to the write-off of
the Soyatal and Guadalupe properties and, increases in accounts
payable and other accrued liability accounts and the
reclassification of the Hillgrove/Red River Resources debt of
$378,074 from long term debt to current liabilities. Capital
improvements were paid for with cash and debt.
For the
year ending December 31, 2020, we are planning to finance our
improvements with operating cash flow. Our 2020 improvements are
expected to include improvements related to the cyanide leach
circuit at Puerto Blanco.
Going Concern Consideration
At
December 31, 2019, the Company’s consolidated financial
statements show negative working capital of approximately $2.7
million and an accumulated deficit of approximately $29.4
million. With the exception of 2018, the Company has incurred
losses for the past several years. The net income in 2018 was
primarily due to non-recurring events which contributed
approximately $2.5 million to net income. These factors indicate
that there is substantial doubt regarding the ability to continue
as a going concern for the next twelve months.
20
Over the past
several years, the Company has been able to make required principal
payments on its debt from cash generated from operations. The
abandonment of the mineral properties in Mexico (see Note 6)
resulted in the removal of approximately $1,500,000 of debt and the
related payments which were $86,000 in 2019 and $193,000 in
2018. Current portion of outstanding debt at
December 31, 2019 was $56,334 compared to $705,460 at December 31,
2018. The Company is confident it can make debt payments when
due. During 2019, the Company was successful in raising
$404,199 from sale of shares of its common stock to fund capital
projects in Mexico.
The
continuing losses are principally a result of the Company’s
antimony operations due to both depressed antimony prices and
production costs incurred in Mexico. To improve conditions,
the Company plans to continue searching for areas to reduce these
production costs. Management expects improvement in
cash flow in 2020 from the sale of precious metals extracted from
the leach circuit scheduled to come on line in Mexico in the second
half of 2020.
There
can be no assurance that management plans will alleviate the doubt
regarding the Company’s ability to continue as a going
concern over the next twelve months, particularly during the
current period of market instability related to the COVID-19
pandemic. If the going concern assumption were not
appropriate for these financial statements, then adjustments would
be necessary to the carrying values of the assets and liabilities,
the reported revenues and expenses, and the balance sheet
classifications used.
C
ritical Accounting
Estimates
We
have, besides our estimates of the amount of depreciation on our
assets, two critical accounting estimates. The percentage of
antimony contained in our unprocessed ore in inventory is based on
assays taken at the time the ore is delivered, and may vary when
the ore is processed. Also, the asset recovery obligation on our
balance sheet is based on an estimate of the future cost to recover
and remediate our properties as required by our permits upon
cessation of our operations, and may differ when we cease
operations.
●
The value of
unprocessed ore is based on assays taken at the time the ore is
delivered, and may vary when the ore is processed. We assay the ore
to estimate the amount of antimony contained per metric ton, and
then make a payment based on the Rotterdam price of antimony and
the % of antimony contained. Our payment scale incorporates a
penalty for ore with a low percentage of antimony. It is reasonably
likely that the initial assay will differ from the amount of metal
recovered from a given lot. If the initial assay of a lot of ore on
hand at the end of a reporting period were different, it would
cause a change in our reported inventory, but would not change our
accounts payable, reported cost of goods sold or net income
amounts. At December 31, 2019, if we had overestimated the per cent
of antimony in our total inventory of purchased ore by 2.5%, (a 10%
correction to the amount of antimony metal contained if we assayed
25.0% antimony per metric ton), the amount of our inventory and
accounts payable would be smaller by approximately $5,000. Our net
income would not be affected. Direct shipping ore (DSO) purchased
at our Madero smelter is paid for at a fixed amount at the time of
delivery and assaying, and is not subject to accounting estimates.
The amount of the accounting estimate for purchased ore at our
Puerto Blanco mill is in a constant state of change because the
amount of purchased ore and the per cent of metal contained are
constantly changing. Due to the amount of ore on hand at the end of
a reporting period, as compared to the amount of total assets,
liabilities, equity, and the ore processed during a reporting
period, any change in the amount of estimated metal contained would
likely not result in a material change to our financial
condition.
●
The asset
retirement obligation and asset on our balance sheet is based on an
estimate of the future cost to recover and remediate our properties
as required by our permits upon cessation of our operations, and
may differ when we cease operations. At December 31, 2011, we made
an estimate that the cost of the machine and man hours probable to
be needed to put our properties in the condition required by our
permits once we cease operations would be $134,000. For purposes of
the estimate, we used a probable life of 20 years and costs that,
initially, are comparable to rates that we would incur at the
present. We are adding to (an accretion of 6%) the liability each
year, and amortizing the asset over 20 years ($6,700 annually),
which decreases our net income in total each year (by $12,848 for
2018 and 2019). We make periodic reviews of the remaining life of
the mine and other operations, and the estimated remediation costs
upon closure, and adjust our account balances accordingly. At this
time, we think that an adjustment in our asset recovery obligation
is not required, and an adjustment in future periods would not have
a material impact in the year of adjustment, but would change the
amount of the annual accretion and amortization costs charged to
our expenses by an undetermined amount.
I
tem 7A Quantitative and Qualitative
Disclosures about Market Risk
Not
Applicable.
I
tem 8 Financial Statements
The
consolidated financial statements of the registrant are included
herein on pages F1-F22.
I
tem 9 Changes in and Disagreements with
Accountants on Accounting and Financial Disclosure
None
21
I
tem 9A Controls and
Procedures
Evaluation of disclosure controls and procedures
At the
end of the period covered by this Annual Report on Form 10-K, an
evaluation was carried out under the supervision of and with the
participation of our management, including the Principal Executive
Officer and the Principal Financial Officer of the effectiveness of
the design and operations of our disclosure controls and procedures
(as defined in Rule 13a – 15(e) and Rule 15d – 15(e)
under the Exchange Act) as of the end of the period covered by this
report. Based on that evaluation, the Principal Executive
Officer and the Principal Financial Officer have concluded that our
disclosure controls and procedures were not effective in ensuring
that: (i) information required to be disclosed by the Company in
reports that it files or submits to the Securities and Exchange
Commission under the Exchange Act is recorded, processed,
summarized, and reported within the time periods specified in
applicable rules and forms and (ii) material information required
to be disclosed in our reports filed under the Exchange Act is
accumulated and communicated to our management, including our CEO
and CFO, as appropriate, to allow for accurate and timely decisions
regarding required disclosure.
Disclosure controls
and procedures were not effective due primarily to material
weaknesses in the Company’s internal control of financial
reporting as discussed below.
Internal control over financial reporting
Management's annual report on internal control over financial
reporting
The
management of USAC is responsible for establishing and maintaining
adequate internal control over financial reporting. This internal
control system has been designed to provide reasonable assurance to
our management and Board of Directors regarding the preparation and
fair presentation of our published financial
statements.
All
internal control systems, no matter how well designed, have
inherent limitations. Therefore, even those systems determined to
be effective can provide only reasonable assurance with respect to
financial statement preparation and presentation.
The
management of USAC has assessed the effectiveness of our internal
control over financial reporting as of December 31, 2019. To make
this assessment, we used the criteria for effective internal
control over financial reporting described in Internal
Control-Integrated Framework (2013), issued by the Committee of
Sponsoring Organizations of the Treadway Commission
(COSO).
As a
result of our assessment, we concluded that we have material
weaknesses in our internal control over financial reporting as of
December 31, 2019. These weaknesses are as follows:
●
Inadequate
design of internal control over the preparation of the financial
statements and financial reporting processes;
●
Inadequate
monitoring of internal controls over significant accounts and
processes including controls associated with domestic and Mexican
subsidiary operations and the period-end financial reporting
process; and
●
The
absence of proper segregation of duties within significant
processes and ineffective controls over management oversight,
including antifraud programs and controls.
We are
aware of these material weaknesses and will develop procedures to
ensure that independent review of material transactions is
performed. The chief financial officer will develop internal
control measures to mitigate the inadequate documentation of
controls and the monitoring of internal controls over significant
accounts and processes including controls associated with the
period-ending reporting processes, and to mitigate the segregation
of duties within significant accounts and processes and the absence
of controls over management oversight, including antifraud programs
and controls.
We plan
to consult with independent experts when complex transactions are
entered into.
Because
these material weaknesses exist, management has concluded that our
internal control over financial reporting as of December 31, 2019,
is ineffective.
Changes in internal control over financial reporting
There
were no changes in internal control over financial reporting for
the quarter ended December 31, 2019.
22
P
ART III
I
tem 10
Directors, Executive Officers,
Promoters and Control Persons, Compliance with
Section
16(a) of the Exchange Act
Identification of directors and executive officers at December 31,
2019, is as follows:
|
Name
|
Age
|
Affiliation
|
Expiration of Term
|
|
John C.
Lawrence
|
81
|
Chairman,
President, Director
|
Annual
meeting
|
|
John C.
Gustavsen
|
71
|
First
Vice-President
|
Annual
meeting
|
|
Russell C.
Lawrence
|
51
|
Second
Vice-President, Director
|
Annual
meeting
|
|
Matthew
Keane
|
64
|
Third
Vice-President
|
Annual
meeting
|
|
Daniel L.
Parks
|
71
|
Chief Financial
Officer
|
Annual
meeting
|
|
Alicia
Hill
|
38
|
Secretary,
Controller,
and
Treasurer
|
Annual
meeting
|
|
Hart W.
Baitis
|
70
|
Director
|
Annual
meeting
|
|
Jeffrey
Wright
|
50
|
Director
|
Annual
meeting
|
|
Craig
Thomas
|
45
|
Director
|
Annual
meeting
|
|
Dr. Blaise
Aguirre
|
55
|
Director
|
Annual
meeting
|
Business Experience of Directors and Executive
Officers
John C. Lawrence
. Mr. Lawrence has been the president and a
director since our inception in 1969. Mr. Lawrence was the
president and a director of AGAU Mines, Inc., our corporate
predecessor. He is a member of the Society of Mining Engineers and
a recipient of the Uuno Sahinen Silver Medallion Award presented by
Butte Tech, University of Montana. He has a vast background in
mining, milling, smelting, chemical processing and oil and
gas.
Russell C. Lawrence
. Mr. Lawrence has experience in applied
physics, mining, refining, excavation, electricity, electronics,
and building contracting. He graduated from the University of Idaho
in 1994 with a degree in physics, and worked for the Physics
Department at the University of Idaho for a period of 10 years. He
has also worked as a building contractor and for USAC at the
smelter and laboratory at Thompson Falls, for USAMSA in the
construction and operation of the USAMSA smelter in Mexico, and for
Antimonio de Mexico, S. A. de C. V. at the San Miguel Mine in
Mexico.
Hart W. Baitis.
Mr. Baitis graduated from the University of
Oregon in 1971 with a B.S. in Geology, and was awarded a Ph. D. in
Geology in 1976. He has 35 years of experience as an exploration
geologist in the United States, Canada, Central America, and
Mexico. Mr. Baitis is experienced in numerous geologic environments
and terrains, and has been involved in all phases of exploration,
ranging from field geologist, consultant, management, and
acquisition team director.
Jeffrey D. Wright
. Mr. Wright graduated from North Carolina
University in 1991, and from the University of Southern California,
Marshall School of Business (MBA) in 2004. Mr. Wright was a naval
officer from 1991 through 1996, serving aboard the aircraft carrier
USS Carl Vinson and the destroyer USS John Young. After duty in the
military, Mr. Wright held successively more responsible positions
in the securities and finance industry. From 2011 through 2013 he
was the managing director metals and mining research for Global
Hunter Securities, and he held the same position for H.C.
Wainwright for 2013 through 2015.
Craig W. Thomas.
Mr. Thomas is a professional investor with
fifteen years of investing experience. He is currently
the co-founder of Shareholder Advocates for Value Enhancement and
the managing member of various investment
partnerships. Mr. Thomas is currently a director
of Full House Resorts, Inc. Mr. Thomas earned a B.A. from
Stanford University and an M.B.A. from the Graduate School of
Business at Stanford University.
Dr. Blaise Aguirre
.
Blaise Aguirre, MD joined
the Board of Directors of United States Antimony Corp. on August 14
2019, to replace a Director that retired for medical reasons. He
received his Medical Doctor’s degree in 1989 from the
University of the Witwatersrand, Johannesburg, South Africa, and
performed his residency at Boston University School of Medicine
from 1991 to 1994. He is an Assistant Professor of Psychiatry at
Harvard Medical School and he is the founding Medical Director of
3East at McLean Hospital. Dr. Aguirre is fluent in Spanish and
lectures worldwide. He was elected to the Board at Investors
Capital Holdings, Ltd in 2011 and remained on the Board until it
was sold to RCAP. He sits on the boards of various privately held
companies. He developed and maintains enduring relationships with
institutional money managers, venture capitalists, Angel investors
and developed an expertise as a small cap stock analyst as a broker
with series 7 and 63 securities licenses.
23
Alicia Hill.
Ms. Hill was hired by the Company in 2006 as an
accounting assistant, and was eventually promoted to chief
accountant responsible for the recording of transactions for three
companies. In 2011, she was appointed Company Controller,
Secretary, and Treasurer. Ms. Hill has guided the Company through
the listing on the NYSE-MKT, in the addition of a new division in
Mexico, and has been the liaison with the Company’s auditors
through a progressively complicated reporting process.
Daniel L. Parks.
Mr. Parks graduated from the University of
Idaho in 1974 with a B.S. in Accounting, and was licensed as a
certified public accountant in 1976. He worked as an auditor for
Coopers & Lybrand for three years, as controller for a lumber
manufacturing company for one year, and owned his own accounting
practice for thirty years. Mr. Parks was extensively involved in
auditing and financial statement preparation during this
time.
John C. Gustaven.
Mr. Gustaven graduated from Rutgers
University in 1970 with a BS in chemistry and started work for
Harshaw Chemical (purchased by Amspec Chemical Corporation), a
major producer of antimony trioxide. Mr. Gustaven took engineering
courses from 1976 through 1980, and became president and treasurer
of the company in 1983. He was promoted CEO in 1990. Mr. Gustaven
designed a new type of production furnace for antimony trioxide
that eventually produced 20 million pounds of antimony trioxide per
year. Mr. Gustaven is conversant in Spanish, Chinese, and other
languages, and travelled to many countries as part of his duties as
president of Amspec Chemical Corporation. Mr. Gustaven came to work
at United States Antimony Corporation in November of
2011.
Matt Keane
. Mr. Keane graduated from Mankato State
University in 1978 with degrees in geography and environmental
studies. Mr. Keane was owner of a construction business and a
retail building supply business before becoming the director of
sales for United States Antimony Corporation in 2000. Mr. Keane has
developed the Company’s growing zeolite sales through Bear
River Zeolite and the increase in the Company’s share of the
domestic market for antimony products.
We are
not aware of any involvement by our directors or executive officers
during the past five years in legal proceedings that are material
to an evaluation of the ability or integrity of any director or
executive officer.
Board Meetings and Committees
Our Board of Directors held
four (4) regular meetings during the 2018 calendar year. Each
incumbent director attended all of the meetings held during the
2019 calendar year, in the aggregate, by the Board and each
committee of the Board of which he was a member.
Our
Board of Directors established an Audit Committee on December 10,
2011. It consists of three members at December 31, 2019, Craig
Thomas (Chairman), Jeffrey Wright, and Hart Baitis. None of the
Audit Committee members are involved in our day-to-day financial
management. Jeffrey Wright and Craig Thomas are considered
financial experts.
During
2011, the Board also established a Compensation Committee and a
Nominating Committee.
Board Member Compensation
Following is a summary of fees,
cash payments, stock awards, and other reimbursements to Directors
during the year ended December 31, 2019:
Directors
Compensation
|
Name and Principal Position
|
Fees Earned paid in Cash
|
Fees Earned paid in Stock
|
Total Fees, Awards, and Other Compensation
|
|
John
C. Lawrence, Chairman
|
|
$
25,000
|
$
25,000
|
|
Russell
Lawrence, Director
|
|
$
25,000
|
$
25,000
|
|
Hartmut
Baitis, Director
|
|
$
25,000
|
$
25,000
|
|
Dr.
Blaise Aguirre, Director
|
|
$
9,375
|
$
9,375
|
|
Jeffrey
Wright, Director
|
|
$
25,000
|
$
25,000
|
|
Craig
Thomas, Director
|
|
$
25,000
|
$
25,000
|
|
Totals
|
$0
|
$
134,375
|
$
134,375
|
24
Section 16(a)
Beneficial Ownership Reporting Compliance
Section 16(a) of
the Securities Exchange Act of 1934 requires our directors and
executive officers and the holders of 10% or more of our common
stock to file reports of ownership and changes in ownership with
the Securities and Exchange Commission. Officers, directors and
stockholders holding more than 10% of our common stock are required
by the regulation to furnish us with copies of all Section 16(a)
forms they have filed. Based solely on our review of copies of
Forms 3, 4 and 5 furnished to us, Mr. Hart Baitis and Mr. Russell
Lawrence did not file timely Forms 3, 4 or Form 5 reports during
2019 and 2018.
Code of Ethics
The
Company has adopted a Code of Ethics that applies to the Company's
executive officers and its directors. The Company will provide,
without charge, a copy of the Code of Ethics on the written request
of any person addressed to the Company at: United States Antimony
Corporation, P.O. Box 643, Thompson Falls, MT 59873.
I
tem 11 Executive
Compensation
Summary Compensation Table
The
Securities and Exchange Commission requires the following table
setting forth the compensation paid by USAC to its principal
executive officer for fiscal years ended December 31, 2019 and
2018.
|
Name and Principal Position
|
Year
|
Salary
|
Bonus
|
Stock Awards (2)
|
Total
|
|
John
C. Lawrence
|
2019
|
$
141,000
|
N/A
|
$
25,000
|
$
166,000
|
|
President and Chief Executive Officer
|
2018
|
$
141,000
|
N/A
|
$
25,000
|
$
166,000
|
|
John
C. Gustaven
|
2019
|
$
100,000
|
N/A
|
|
$
100,000
|
|
Executive
Vice President
|
2018
|
$
100,000
|
N/A
|
|
$
100,000
|
|
Russell
Lawrence
|
2019
|
$
110,000
|
N/A
|
$
25,000
|
$
135,000
|
|
Vice President for Latin America
|
2018
|
$
110,000
|
N/A
|
$
25,000
|
$
135,000
|
(2)
These figures
represent the fair value, as of the date of issuance, the annual
director's fees for John C. Lawrence and Russell Lawrence payable
in shares of USAC's common stock.
Compensation for
all executive officers, except for the President/CEO position, is
recommended to the compensation committee of the Board of Directors
by the President/CEO. The compensation committee makes the
recommendation for the compensation of the President/CEO. The
compensation committee has identified a peer group of mining
companies to aid in reviewing the President’s compensation
recommendations for executives, and for reviewing the compensation
of the President/CEO. The full Board approves the compensation
amounts recommended by the compensation committee. Currently, the
executive managements’ compensation only includes base salary
and health insurance. The Company does not have annual performance
based salary increases, long term performance based cash
incentives, deferred compensation, retirement benefits, or
disability benefits.
Two
executive officers, the President/CEO and the Vice-President for
the Latin American operations, receive restricted stock awards for
their services as Board members.
The
following table sets forth information concerning the outstanding
equity awards at December 31, 2019, held by our principal executive
officer. There were not any other outstanding equity awards or plan
based awards to officers or directors as of December 31, 2019.
(John Lawrence, CEO, exercised his warrants at a price of $0.25 per
share for 250,000 shares on March 20, 2020. The receipt of $62,500
from the warrants will be used to reduce loans payable to Mr.
Lawrence.)
|
|
|
|
Outstanding Equity Awards
at Fiscal Year End
|
|
|
|
|
Number
of Securities Underlying Unexercised Warrants
|
Awards
|
|
||
|
|
Unexercisable
|
Equity
Incentive Plan Awards:
|
|
||
|
Name
|
Exercisable #
|
#
|
Number
of Securities
Underlying
Unexercised
Unearned
|
Exercise
Price
|
Expiration
Date
|
|
John
C. Lawrence,
(Chairman
of the Board
of
Directors and
Chief
Executive
Officer)
|
250,000
|
0
|
0
|
$
0.25
|
None
|
25
I
tem 12 Security Ownership of Certain
Beneficial Owners and Management
The
following table sets forth information regarding beneficial
ownership of our common stock as of April 1, 2019, by (i) each
person who is known by us to beneficially own more than 5% of our
Series B, C, and D preferred stock or common stock; (ii) each of
our executive officers and directors; and (iii) all of our
executive officers and directors as a group. Unless otherwise
stated, each person's address is c/o United States Antimony
Corporation, P.O. Box 643, 47 Cox Gulch, Thompson Falls, Montana
59873.
|
Title of
Class
|
Name and Address of Beneficial Owner
(1)
|
Amount and
Nature of Beneficial Ownership
|
Percent of Class
(1)
|
Percent of all
Voting Stock
|
|
Series
B Preferred
|
Excel
Mineral Company P.O. Box 3800 Santa Barbara, CA 93130
|
750,000
|
100.00
%
|
N/A
|
|
Series
C Preferred
|
Richard
A. Woods 59 PennCircle West Penn Plaza Apts. Pittsburgh, PA
15206
|
48,305
(4)
|
27.10
%
|
*
|
|
Series
C Preferred
|
Dr.
Warren A Evans 69 Ponfret Landing Road Brooklyn, CT
06234
|
32,203
(4)
|
18.10
%
|
*
|
|
Series
C Preferred
|
Edward
Robinson 1007 Spruce Street, 1st floor Philadelphia, PA
19107
|
32,203
(4)
|
18.10
%
|
*
|
|
Series
C Preferred
|
All
Series C Preferred Shareholders as a Group
|
177,904
(4)
|
100.00
%
|
*
|
|
Common
Stock
|
John
C. Lawrence
|
4,545,350
(2)
|
64.93
%
|
6.35
%
|
|
|
Russell
Lawrence
|
400,348
|
5.72
%
|
*
|
|
|
Hart
Baitis
|
386,243
|
5.52
%
|
*
|
|
|
Blaise
Aguirre
|
308,169
|
4.40
%
|
*
|
|
|
Jeffrey
Wright
|
282,973
|
4.04
%
|
*
|
|
|
Mathew
Keane
|
10,300
|
0.15
%
|
*
|
|
|
Daniel
Parks
|
464,500
|
6.64
%
|
*
|
|
|
Craig
Thomas
|
602,536
|
8.60
%
|
*
|
|
Common
Stock
|
All
Directors and Executive Officers as a Group
|
7,000,599
|
100.00
%
|
9.78
%
|
|
Series
D Preferred
|
John
C. Lawrence
|
1,590,672
(4)
|
90.80
%
|
2.22
%
|
|
|
Leo
Jackson
|
102,000
|
5.80
%
|
*
|
|
|
Garry
Babbitt
|
58,333
|
3.40
%
|
*
|
|
Series
D Preferred
|
All
Series D Preferred Shareholders as a Group
|
1,751,005
(4)
|
100.00
%
|
2.45
%
|
|
Common
Stock and Preferred Stock w/voting rights
|
All
Directors and Executive Officers as a Group
|
7,000,599
|
81.48
%
|
9.78
%
|
|
All
preferred Shareholders that are officers or directors
|
1,590,672
|
18.52
%
|
2.22
%
|
|
|
Common
and Preferred Voting Stock
|
|
8,591,271
|
100.00
%
|
12.00
%
|
(1)
Beneficial
Ownership is determined in accordance with the rules of the
Securities and Exchange Commission and generally includes voting or
investment power with respect to securities. Shares of common stock
subject to options or warrants currently exercisable or
convertible, or exercisable or convertible within 60 days of April
1, 2020, are deemed outstanding for computing the percentage of the
person holding options or warrants but are not deemed outstanding
for computing the percentage of any other person. Percentages are
based on a total of
69,661,436
shares of common stock, 750,000
shares of Series B Preferred Stock, 177,904 shares of Series C
Preferred Stock, and 1,751,005 shares of Series D Preferred Stock
outstanding on April 14, 2020. Total voting stock of 71,590,345
shares is a total of all the common stock issued, and all of the
Series C and Series D Preferred Stock outstanding at April 14,
2020.
(2)
Includes 4,295,350
shares of common stock and 250,000 stock purchase
warrants.
(4)
The outstanding
Series C and Series D preferred shares carry voting rights equal to
the same number of shares of common stock.
26
I
tem 13
Certain Relationships and Related
Transactions
Described
below are transactions during the last two years to which we are a
party and in which any director, executive officer or beneficial
owner of five percent (5%) or more of any class of our voting
securities or relatives of our directors, executive officers or
five percent (5%) beneficial owners has a direct or indirect
material interest.
During
the year ended December 31, 2019, the Company awarded, but did not
issue, common stock with a value of $134,375 to its Board of
Directors as compensation for their services as directors. In
connection with the issuances, the Company recorded $134,375 in
director compensation expense and accrued common stock
payable.
In
January 2019, the Company issued Daniel Parks, the Company’s
Chief Financial Officer, 200,000 shares of the Company’s
common stock with a fair value of $136,000 to retain his services.
As part of the agreement, Mr. Parks’ hours worked and cash
compensation was reduced.
In
April 2019, the Company issued the Board members 330,183 shares of
the Company’s common stock for services provided during 2018
which was accrued at December 31, 2018, with a value of
$175,000.
The
Company’s President and Chairman, John Lawrence, rents
equipment to the Company and charges the Company for lodging and
meals provided to consultants, customers and other parties by an
entity that Mr. Lawrence owns. The amount due to Mr. Lawrence as of
December 31, 2019 and 2018 was $156,974 and $93,567, respectively.
Expenses paid to Mr. Lawrence for the years ended December 31, 2019
and 2018 were $9,799 and $9,634, respectively
During
2019, the Company’s President and Chairman, John Lawrence,
made loans to the Company totaling $227,200, of which $35,006 had
been repaid as of December 31, 2019, leaving a note balance of
$192,134. John C. Gustaven, First Vice-President, loaned the
company $10,200 during 2019, of which none had been repaid as of
December 31, 2019.
During
the year ended December 31, 2018, the Company awarded, but did not
issue, common stock with a value of $175,000 to its Board of
Directors as compensation for their services as directors. In
connection with the issuances, the Company recorded $175,000 in
director compensation expense and accrued common stock
payable.
In May
2018, the Company issued the Board members 739,018 shares of the
Company’s common stock for services provided during 2017
which was accrued at December 31, 2017, with a value of
$175,000.
I
tem 14 Principal Accountant Fees and
Services
The
Company's Board of Directors and audit committee reviews and
approves audit and permissible non-audit services performed by
DeCoria, Maichel & Teague P.S., as well as the fees charged by
DeCoria, Maichel & Teague P.S. for such services. In its review
of non-audit service fees and its appointment of DeCoria, Maichel
& Teague P.S. as the Company's independent accountants, the
Board of Directors considered whether the provision of such
services is compatible with maintaining DeCoria, Maichel &
Teague P.S. independence. All of the services provided and fees
charged by DeCoria, Maichel & Teague P.S. in 2018 were
pre-approved by the Board of Directors and its audit
committee.
Audit Fees
The
aggregate fees billed by DeCoria, Maichel & Teague P.S. for
professional services for the audit of the annual financial
statements of the Company and the reviews of the financial
statements included in the Company's quarterly reports on Form 10-Q
for 2019 and 2018 were $118,998 and $116,716, respectively, net of
expenses.
Audit-Related Fees
There
were no other fees billed by DeCoria, Maichel & Teague P.S.
during the last three fiscal years for assurance and related
services that were reasonably related to the performance of the
audit or review of the Company's financial statements and not
reported under "Audit Fees" above.
Tax Fees
The
aggregate fees billed by DeCoria, Maichel & Teague P.S. during
the last two fiscal years for professional services rendered by
DeCoria, Maichel & Teague P.S. for tax compliance for 2019 and
2018 were $11,833 and $12,465, respectively.
All Other Fees
There
were no other fees billed by DeCoria, Maichel & Teague P.S.
during 2019. During 2018, we paid $5,998 for services related to
the acquisition of Lanxess, LLC, provided by DeCoria, Maichel &
Teague P.S.
27
I
tem 15. Exhibits and Reports on Form
8-K
|
Exhibit Number
|
Description
|
|
3.01
|
Articles of
Incorporation of USAC, filed as an exhibit to USAC's Form 10-KSB
for the fiscal year ended December 31, 1995 (File
No.001-08675), are incorporated herein by this
reference.
|
|
|
|
|
3.02
|
Amended and
Restated Bylaws of USAC, filed as an exhibit to amendment No. 2 to
USAC's Form SB-2 Registration Statement (Reg. No. 333-45508) are
incorporated herein by this reference.
|
|
|
|
|
3.03
|
Articles of
Correction of Restated Articles of Incorporation of
USAC.
|
|
|
|
|
3.04
|
Articles of
Amendment to the Articles of Incorporation of United States
Antimony Corporation, filed as an exhibit to USAC's Form 10-QSB for
the quarter ended September 30, 2002 (File No. 001-08675), are
incorporated herein by this reference.
|
|
|
|
|
4.01
|
Key Employees 2000
Stock Plan, filed as an exhibit to USAC's Form S-8 Registration
Statement filed on March 10, 2000 (File No. 333-32216) is
incorporated herein by this reference.
|
Documents
filed with USAC's Annual Report on Form 10-KSB for the year ended
December 31, 1995 (File No. 001-08675), are incorporated herein by
this reference:
|
|
|
|
10.10
|
Yellow Jacket
Venture Agreement
|
|
|
|
|
10.11
|
Agreement Between
Excel-Mineral USAC and Bobby C. Hamilton
|
|
|
|
|
10.12
|
Letter
Agreement
|
|
|
|
|
10.13
|
Columbia-Continental
Lease Agreement Revision
|
|
|
|
|
10.14
|
Settlement
Agreement with Excel Mineral Company
|
|
|
|
|
10.15
|
Memorandum
Agreement
|
|
|
|
|
10.16
|
Termination
Agreement
|
|
|
|
|
10.17
|
Amendment to
Assignment of Lease (Geosearch)
|
|
|
|
|
10.18
|
Series B Stock
Certificate to Excel-Mineral Company, Inc.
|
|
|
|
|
10.19
|
Division Order and
Purchase and Sale Agreement
|
|
|
|
|
10.20
|
Inventorynd Sales
Agreement
|
|
|
|
|
10.21
|
Processing
Agreement
|
|
|
|
|
10.22
|
Release and
settlement agreement between Bobby C. Hamilton and United States
Antimony Corporation
|
|
|
|
|
10.23
|
Columbia-Continental
Lease Agreement
|
|
|
|
|
10.24
|
Release of
Judgment
|
|
|
|
|
10.25
|
Covenant Not to
Execute
|
28
|
10.26
|
Warrant Agreements
filed as an exhibit to USAC's Annual Report on Form 10-KSB for the
year ended December 31, 1996 (File No. 001-08675), are incorporated
herein by this reference
|
|
|
|
|
10.27
|
Letter from EPA,
Region 10 filed as an exhibit to USAC's Quarterly Report on Form
10-QSB for the quarter ended September 30, 1997 (File No.
001-08675) is incorporated herein by this reference
|
|
|
|
|
10.28
|
Warrant Agreements
filed as an exhibit to USAC's Annual Report on Form 10-KSB for the
year ended December 31, 1997 (File No. 001-08675) are incorporated
herein by this reference
|
|
|
|
|
10.30
|
Answer,
Counterclaim and Third-Party Complaint filed as an exhibit to
USAC's Quarterly Report on Forms 10-QSB for the quarter ended
September 30, 1998 (File No. 001-08675) is incorporated herein by
this reference
|
Documents
filed with USAC's Annual Report on Form 10-KSB for the year ended
December 31, 1998 (File No. 001-08675), are incorporated herein by
this reference:
Documents
filed with USAC's Quarterly Report on Form 10-QSB for the quarter
ended March 31, 1999 (File No. 001-08675) is incorporated herein by
this reference:
Documents
filed as an exhibit to USAC's Form 10-KSB for the year ended
December 31, 1999 (File No. 001-08675) are incorporated herein by
this reference:
|
Maguire Settlement
Agreement
|
|
|
|
|
|
Warrant
Issue-Carlos Tejada
|
|
|
|
|
|
Warrant Issue-Al W.
Dugan
|
|
|
|
|
|
Memorandum of
Understanding with Geosearch Inc.
|
|
|
|
|
|
Factoring
Agreement-Systran Financial Services Company
|
|
|
|
|
|
Mortgage to John C.
Lawrence
|
|
|
|
|
|
Warrant Issue-Al W.
Dugan filed as an exhibit to USAC's Quarterly Report on Form 10-QSB
for the quarter ended March 31, 2000 (File No. 001-08675) is
incorporated herein by this reference
|
|
|
|
|
|
Agreement between
United States Antimony Corporation and Thomson Kernaghan & Co.,
Ltd. filed as an exhibit to USAC form 10-QSB for the quarter ended
June 30, 2000 (File No. 001-08675) are incorporated herein by this
reference
|
|
|
|
|
|
Settlement
agreement and release of all claims between the Estate of Bobby C.
Hamilton and United States Antimony Corporation filed as an exhibit
to USAC form 10-QSB for the quarter ended June 30, 2000 (File No.
001-08675) are incorporated herein by this reference.
|
|
|
|
|
|
Suply Contracts
with Fortune America Trading Ltd. filed as an exhibit to USAC form
10-QSB for the quarter ended June 32000 (File No. 001-08675) are
incorporated herein by this reference
|
|
|
|
|
|
10.45
|
Amended and
Restated Agreements with Thomson Kernaghan & Co., Ltd, filed as
an exhibit to amendment No. 3 to USAC's Form SB-2 Registration
Statement (Reg. No. 333-45508), are incorporated herein by this
reference
|
|
|
|
|
10.46
|
Purchase Order from
Kohler Company, filed as an exhibit to amendment No. 4 to USAC's
Form SB-2 Registration Statement (Reg. No. 333-45508) are
incorporated herein by this reference
|
29
Documents
filed as an exhibit to USAC's Form 10-QSB for the quarter ended
June 30, 2002 (File No. 001-08675) are incorporated herein by this
reference:
|
|
|
|
Bear River Zeolite
Company Royalty Agreement, dated May 29, 2002
|
|
|
|
|
|
Grant of Production
Royalty, dated June 1, 2002
|
|
|
|
|
|
Assignment of
Common Stock of Bear River Zeolite Company, dated May 29,
2002
|
|
|
|
|
|
Agreement to Issue
Warrants of USA, dated May 29, 2002
|
|
|
|
|
|
10.51
|
Secured convertible
note payable - Delaware Royalty Company dated December 22,
2003*
|
|
|
|
|
10.52
|
Convertible note
payable - John C. Lawrence dated December 22, 2003*
|
|
|
|
|
10.53
|
Pledge, Assignment
and Security Agreement dated December 22, 2003*
|
|
|
|
|
10.54
|
Note Purchase
Agreement dated December 22, 2003*
|
|
|
|
|
14.0
|
Code of
Ethics*
|
|
|
|
|
Rule
13a-14(a)/15d-14(a) Certifications
Certification of
John C. Lawrence*
|
|
|
|
|
|
Section 1350
Certifications
Certification of
John C. Lawrence*
|
|
|
|
|
|
44.1
|
CERCLA Letter from
U.S. Forest Service filed as an exhibit to USAC form 10-QSB for the
quarter ended June 30, 2000 (File No. 001-08675) are incorporated
herein by this reference and filed as an exhibit to USAC's Form
10-KSB for the year ended December 31, 1995 (File No. 1-8675) is
incorporated herein by this reference
|
* Filed
herewith.
Reports
on Form 8-K
Item
5.
Other Events - October 10, 2003.
30
SIGNATURES
Pursuant
to the requirements of Section 13 or 15(b) of the Securities
Exchange Act of 1934, the Registrant has duly caused this report to
be signed on its behalf by the undersigned, thereunto duly
authorized.
UNITED
STATES ANTIMONY CORPORATION
(Registrant)
By
/s/John C.
Lawrence
Date:
April 14, 2020
John C.
Lawrence, President, Director,
and
Principal Executive Officer
By
/s/Daniel L.
Parks
Date:
April 14, 2020
Daniel
L. Parks, Chief Financial Officer
By
/s/Alicia
Hill
Date:
April 14, 2020
Alicia
Hill, Controller
Pursuant
to the requirements of the Securities Exchange Act of 1934, this
report has been signed below by the following persons on behalf of
the Registrant and in the capacities and on the dates
indicated.
By
/s/John C.
Lawrence
Date:
April 14, 2020
John C.
Lawrence, Director and President
(Principal
Executive)
By
/s/Hart
Baitis
Date:
April 14, 2020
Hart
Baitis, Director
By
/s/Russell
Lawrence
Date:
April 14, 2020
Russell
Lawrence, Director
By
/s/Jeffrey
Wright
Date:
April 14, 2020
Jeffrey
Wright, Director
By
/s/Craig
Thomas
Date:
April 14, 2020
Craig
Thomas, Director
By
/s/Blaise
Aguirre
Date:
April 14, 2020
Blaise
Aguirre, Director
31
Report
of Independent Registered Public Accounting
Firm
To the shareholders and the board of directors of United States
Antimony Corporation
Opinion on the Financial Statements
We have audited the accompanying consolidated balance sheets of
United States Antimony Corporation and Subsidiaries (the "Company")
as of December 31, 2019 and 2018, the related consolidated
statements of operations, changes in stockholders’
equity and cash flows for the years then ended, and the related
notes (collectively referred to as the "financial statements"). In
our opinion, the financial statements present fairly, in all
material respects, the financial position of the Company as
of December 31, 2019 and 2018, and the results of its
operations and its cash flows for the years then ended, in
conformity with
accounting principles generally
accepted in the United States of America.
The Company’s Ability to Continue as a Going
Concern
The accompanying consolidated financial statements have been
prepared assuming that the Company will continue as a going
concern. As discussed in Note 2 to the financial statements, the
Company has negative working capital and accumulated deficit. These
factors raise substantial doubt about its ability to continue as a
going concern. Management’s plans in regard to these matters
are also described in Note 2. The financial statements do not
include any adjustments that might result from the outcome of this
uncertainty.
Basis for Opinion
These financial statements are the responsibility of the Company's
management. Our responsibility is to express an opinion on the
Company's financial statements based on our audits. We are a public
accounting firm registered with the Public Company Accounting
Oversight Board (United States) ("PCAOB") and are required to be
independent with respect to the Company in accordance with the U.S.
federal securities laws and the applicable rules and regulations of
the Securities and Exchange Commission and the
PCAOB.
We conducted our audits in accordance with the standards of the
PCAOB. Those standards require that we plan and perform the audit
to obtain reasonable assurance about whether the financial
statements are free of material misstatement, whether due to error
or fraud. The Company is not required to have, nor were we engaged
to perform, an audit of its internal control over financial
reporting. As part of our audits we are required to obtain an
understanding of internal control over financial reporting but not
for the purpose of expressing an opinion on the effectiveness of
the Company's internal control over financial reporting.
Accordingly, we express no such opinion.
Our audits included performing procedures to assess the risks of
material misstatement of the financial statements, whether due to
error or fraud, and performing procedures that respond to those
risks. Such procedures included examining, on a test basis,
evidence regarding the amounts and disclosures in the financial
statements. Our audits also included evaluating the accounting
principles used and significant estimates made by management, as
well as evaluating the overall presentation of the financial
statements. We believe that our audits provide a reasonable basis
for our opinion.
DeCoria, Maichel & Teague, P.S.
We have served as the Company's independent auditor since
1998.
Spokane, Washington
April 14, 2020
F-1
United
States Antimony Corporation and Subsidiaries
Consolidated
Balance Sheets
December 31, 2019 and 2018
|
ASSETS
|
|
|
|
|
2019
|
2018
|
|
Current
assets:
|
|
|
|
Cash
and cash equivalents
|
$
115,506
|
$
56,650
|
|
Certificates
of deposit
|
253,552
|
252,954
|
|
Accounts
receivable
|
284,453
|
438,391
|
|
Inventories
|
626,244
|
755,261
|
|
Note
receivable - sale of land
|
-
|
400,000
|
|
Total
current assets
|
1,279,755
|
1,903,256
|
|
|
|
|
|
Properties,
plants and equipment, net
|
12,186,848
|
15,227,172
|
|
Restricted
cash for reclamation bonds
|
57,261
|
57,247
|
|
IVA
receivable and other assets
|
170,111
|
369,448
|
|
Total
assets
|
$
13,693,975
|
$
17,557,123
|
|
|
|
|
|
LIABILITIES AND STOCKHOLDERS' EQUITY
|
|
|
|
Current
liabilities:
|
|
|
|
Checks
issued and payable
|
$
17,633
|
$
46,482
|
|
Accounts
payable
|
2,328,977
|
1,926,320
|
|
Due
to factor
|
10,880
|
16,524
|
|
Accrued
payroll, taxes and interest
|
260,800
|
159,037
|
|
Other
accrued liabilities
|
334,208
|
353,911
|
|
Payables
to related party
|
359,309
|
93,567
|
|
Deferred
revenue
|
32,400
|
32,400
|
|
Notes
payable to bank
|
197,066
|
183,917
|
|
Hillgrove
advances payable (Note 10)
|
378,074
|
-
|
|
Long-term
debt, current portion, net of discount
|
56,334
|
705,460
|
|
Total
current liabilities
|
3,975,681
|
3,517,618
|
|
|
|
|
|
Long-term
debt, net of discount and current portion
|
76,762
|
1,027,730
|
|
Hillgrove
advances payable (Note 10)
|
756,147
|
1,134,221
|
|
Stock
payable to directors for services
|
134,375
|
175,000
|
|
Asset
retirement obligations and accrued reclamation costs
|
283,868
|
277,720
|
|
Total
liabilities
|
5,226,833
|
6,132,289
|
|
Commitments
and contingencies (Note 4, 10 and 16)
|
|
|
|
|
|
|
|
Stockholders'
equity:
|
|
|
|
Preferred
stock $0.01 par value, 10,000,000 shares authorized:
|
|
|
|
Series
A: -0- shares issued and outstanding
|
-
|
-
|
|
Series
B: 750,000 shares issued and outstanding
|
|
|
|
(liquidation
preference $937,500 and $930,000
|
|
|
|
respectively)
|
7,500
|
7,500
|
|
Series
C: 177,904 shares issued and outstanding
|
|
|
|
(liquidation
preference $97,847 both years)
|
1,779
|
1,779
|
|
Series
D: 1,751,005 shares issued and outstanding
|
|
|
|
(liquidation
preference $5,043,622 and $5,002,473
|
|
|
|
respectively)
|
17,509
|
17,509
|
|
Common
stock, $0.01 par value, 90,000,000 shares authorized;
|
|
|
|
69,661,436
and 68,227,171 shares issued and outstanding,
respectively
|
696,614
|
682,271
|
|
Additional
paid-in capital
|
37,107,730
|
36,406,874
|
|
Accumulated
deficit
|
(29,363,990
)
|
(25,691,099
)
|
|
Total
stockholders' equity
|
8,467,142
|
11,424,834
|
|
Total
liabilities and stockholders' equity
|
$
13,693,975
|
$
17,557,123
|
The accompanying notes are an integral part of these
consolidated financial statements.
F-2
United
States Antimony Corporation and Subsidiaries
Consolidated Statements of Operations
For the years ended December 31, 2019 and 2018
|
|
2019
|
2018
|
|
REVENUES
|
$
8,268,005
|
$
9,034,403
|
|
|
|
|
|
COST OF REVENUES
|
9,084,256
|
9,032,860
|
|
|
|
|
|
GROSS PROFIT (LOSS)
|
(816,251
)
|
1,543
|
|
|
|
|
|
OPERATING
EXPENSES (INCOME):
|
|
|
|
General
and administrative
|
665,924
|
795,833
|
|
Salaries
and benefits
|
518,758
|
375,788
|
|
Gain
on sale of land
|
-
|
(700,000
)
|
|
Gain
on plant acquisition (Note 11)
|
-
|
(1,500,000
)
|
|
Loss
on abandonment of mineral properties
|
1,410,736
|
-
|
|
Other
operating expenses
|
88,347
|
119,076
|
|
Professional
fees
|
245,091
|
363,810
|
|
TOTAL
OPERATING EXPENSES (INCOME)
|
2,928,856
|
(545,493
)
|
|
|
|
|
|
INCOME
(LOSS) FROM OPERATIONS
|
(3,745,107
)
|
547,036
|
|
|
|
|
|
OTHER
INCOME (EXPENSE):
|
|
|
|
Gain
on tax settlement
|
-
|
110,778
|
|
Interest
expense
|
(78,344
)
|
(99,970
)
|
|
Other
income (expense)
|
150,560
|
(16,951
)
|
|
TOTAL
OTHER INCOME (EXPENSE)
|
72,216
|
(6,143
)
|
|
|
|
|
|
INCOME
(LOSS) BEFORE INCOME TAXES
|
(3,672,891
)
|
540,893
|
|
|
|
|
|
INCOME
TAX BENEFIT -CURRENT
|
-
|
332,332
|
|
|
|
|
|
NET INCOME (LOSS)
|
(3,672,891
)
|
873,225
|
|
|
|
|
|
Preferred
dividends
|
(48,649
)
|
(48,649
)
|
|
Net
income (loss) available to
|
|
|
|
common
stockholders
|
$
(3,721,540
)
|
$
824,576
|
|
|
|
|
|
Net
income (loss) per share of
|
|
|
|
common
stock:
|
|
|
|
Basic
and diluted
|
$
(0.05
)
|
$
0.01
|
|
|
|
|
|
Weighted
average shares outstanding:
|
|
|
|
Basic
|
69,004,897
|
67,978,132
|
|
Diluted
|
69,004,897
|
68,097,924
|
The accompanying notes are an integral part of these
consolidated financial statements.
F-3
United States Antimony Corporation and Subsidiaries
Consolidated Statement of Changes in Stockholders'
Equity
For the years ended December 31, 2019 and 2018
|
|
|
|
|
|
Additional
|
|
|
|
|
Total Preferred Stock
|
Common Stock
|
Paid
|
Accumulated
|
|
||
|
|
Shares
|
Amount
|
Shares
|
Amount
|
In Capital
|
Deficit
|
Total
|
|
|
|
|
|
|
|
|
|
|
Balances,
December 31, 2017
|
2,678,909
|
$
26,788
|
67,488,153
|
$
674,881
|
$
36,239,264
|
$
(26,564,324
)
|
$
10,376,609
|
|
|
|
|
|
|
|
|
|
|
Issuance
of common stock to directors for services
|
|
|
739,018
|
7,390
|
167,610
|
|
175,000
|
|
Net
income
|
|
|
|
|
|
873,225
|
873,225
|
|
Balances,
December 31, 2018
|
2,678,909
|
26,788
|
68,227,171
|
682,271
|
36,406,874
|
(25,691,099
)
|
11,424,834
|
|
|
|
|
|
|
|
|
|
|
Issuance
of common stock to chief financial officer for
services
|
|
|
200,000
|
2,000
|
134,000
|
|
136,000
|
|
Issuance
of common stock to directors for services
|
|
|
330,183
|
3,302
|
171,698
|
|
175,000
|
|
Issuance
of common stock and warrants for cash, net of offering
costs
|
|
|
904,082
|
9,041
|
395,158
|
|
404,199
|
|
Net
loss
|
|
|
|
|
|
(3,672,891
)
|
(3,672,891
)
|
|
Balances,
December 31, 2019
|
2,678,909
|
$
26,788
|
69,661,436
|
$
696,614
|
$
37,107,730
|
$
(29,363,990
)
|
$
8,467,142
|
The accompanying notes are an integral part of these
consolidated financial statements.
F-4
United States Antimony Corporation and Subsidiaries
Consolidated Statements of Cash Flows
For the years ended December 31, 2019 and 2018
|
Cash
Flows From Operating Activities:
|
2019
|
2018
|
|
Net
income (loss)
|
$
(3,672,891
)
|
$
873,225
|
|
Adjustments
to reconcile net income (loss) to net cash
|
|
|
|
provided
by operating activities:
|
|
|
|
Depreciation
and amortization
|
895,990
|
904,844
|
|
Amortization
of debt discount
|
54,112
|
83,991
|
|
Loss
on abandonment of mineral properties
|
1,410,736
|
-
|
|
Write-down
of inventory to net realizable value
|
16,396
|
64,702
|
|
Accretion
of asset retirement obligation
|
6,148
|
6,148
|
|
Common
stock issued for services
|
136,000
|
-
|
|
Common
stock accrued for directors fees
|
134,375
|
175,000
|
|
Gain
on sale of land
|
-
|
(700,000
)
|
|
Gain
(loss)on plant acquisition
|
-
|
(1,500,000
)
|
|
Non-cash
miscellaneous income
|
(598
)
|
(656
)
|
|
Change
in:
|
|
|
|
Accounts
receivable
|
153,938
|
(75,812
)
|
|
Inventories
|
112,621
|
94,746
|
|
Other
current assets
|
-
|
4,697
|
|
IVA
receivable and other assets
|
199,337
|
3,294
|
|
Accounts
payable
|
402,657
|
(350,037
)
|
|
Accrued
payroll, taxes and interest
|
101,763
|
(26,246
)
|
|
Other
accrued liabilities
|
(19,703
)
|
185,333
|
|
Deferred
revenue
|
-
|
(27,649
)
|
|
Payables
to related party
|
63,408
|
70,899
|
|
Income
taxes payable
|
-
|
(443,110
)
|
|
Net
cash provided (used) by operating activities
|
(5,711
)
|
(656,631
)
|
|
|
|
|
|
Cash
Flows From Investing Activities:
|
|
|
|
Proceeds
from sale of land
|
400,000
|
300,000
|
|
Proceeds
from plant acquisition
|
-
|
1,500,000
|
|
Purchase
of properties, plants and equipment
|
(792,925
)
|
(899,119
)
|
|
Net
cash provided (used) by investing activities
|
(392,925
)
|
900,881
|
|
|
|
|
|
Cash
Flows From Financing Activities:
|
|
|
|
Net
proceeds (to) from factor
|
(5,644
)
|
5,644
|
|
Proceeds
from notes payable to bank, net of payments
|
13,149
|
(8,648
)
|
|
Principal
payments of long-term debt
|
(127,683
)
|
(236,915
)
|
|
Proceeds
from sale of common stock and warrants, net
|
404,199
|
-
|
|
Proceeds
from related party loans
|
237,400
|
135,000
|
|
Payments
on advances from related party
|
(35,066
)
|
(135,000
)
|
|
Change
in checks issued and payable
|
(28,849
)
|
18,234
|
|
Net
cash provided (used) by financing activities
|
457,506
|
(221,685
)
|
|
NET
INCREASE (DECREASE) IN CASH
|
|
|
|
AND
CASH EQUIVALENTS AND RESTRICTED CASH
|
58,870
|
22,565
|
|
Cash
and cash equivalents and restricted cash at beginning of
year
|
113,897
|
91,332
|
|
Cash
and cash equivalents and restricted cash at end of
year
|
$
172,767
|
$
113,897
|
|
|
|
|
|
SUPPLEMENTAL
DISCLOSURE OF CASH FLOW INFORMATION
|
|
|
|
Interest
paid in cash
|
$
24,233
|
$
15,928
|
|
Noncash
investing and financing activities:
|
|
|
|
Properties,
plants & equipment acquired with long-term debt
|
-
|
100,000
|
|
Common
stock payable issued to directors
|
175,000
|
175,000
|
|
Note
receivable-sale of land
|
-
|
400,000
|
The accompanying notes are an integral part of these
consolidated financial statements.
F-5
United States Antimony Corporation and Subsidiaries
Notes to Consolidated Financial Statements
December 31, 2019 and 2018
1. Background of Company and Basis of
Presentation
AGAU
Mines, Inc., predecessor of United States Antimony Corporation
("USAC" or "the Company"), was incorporated in June 1968 as a
Delaware corporation to mine gold and silver. USAC was incorporated
in Montana in January 1970 to mine and produce antimony products.
In June 1973, AGAU Mines, Inc. was merged into USAC. In December
1983, the Company suspended its antimony mining operations when it
became possible to purchase antimony raw materials more
economically from foreign sources. The principal business of
the Company has been the production and sale of antimony
products.
During
2000, the Company formed a 75% owned subsidiary, Bear River Zeolite
Company ("BRZ"), to mine and market zeolite and zeolite products
from a mineral deposit in southeastern Idaho. In 2001, an
operating plant was constructed at the zeolite site and zeolite
production and sales commenced. During 2002, the Company
acquired the remaining 25% of BRZ and continued to produce and sell
zeolite products.
During
2005, the Company formed a 100% owned subsidiary, Antimonio de
Mexico S.A. de C.V. (“AM”), to explore and develop
potential antimony properties in Mexico.
During
2006, the Company acquired 100% ownership in United States
Antimony, Mexico S.A. de C.V. (“USAMSA”), which became
a wholly-owned subsidiary of the Company.
In 2018, the
Company acquired 100% ownership in Stibnite Holding Company US Inc.
(previously Lanxess Holding Company US Inc.), Antimony Mining and
Milling US LLC (previously Lanxess Laurel US LLC), a Delaware
limited liability company and Lanxess Laurel de Mexico, S.A. de C.V
(“Lanxess Laurel Mexico”), a Mexico corporation, both
of which became a wholly-owned subsidiary of the Company. See
Note 11.
2. Summary of Significant Accounting Policies
Principles of Consolidation
The
Company's consolidated financial statements include the accounts of
its wholly-owned subsidiaries BRZ, USAMSA, AM, and, since August
31, 2018, Stibnite Holding Company US Inc., and Antimony Mining and
Milling US LLC. All intercompany balances and transactions are
eliminated in consolidation.
Use of Estimates
The
preparation of financial statements in conformity with accounting
principles generally accepted in the United States of America
requires management to make estimates and assumptions that affect
the reported amounts of assets and liabilities and disclosure of
contingent assets and liabilities at the date of the financial
statements and the reported amounts of revenues and expenses during
the reporting period. Significant and critical estimates include
property, plant and equipment depreciation and potential
impairment, metal content of mineral resources, accounts receivable
allowance for uncollectible accounts, deferred income taxes, income
taxes payable, environmental remediation liabilities and asset
retirement obligations. Actual results could differ from those
estimates.
Cash and Cash Equivalents
The
Company considers cash in banks and investments with original
maturities of three months or less when purchased to be cash
equivalents.
Restricted Cash
Restricted cash at
December 31, 2019 and 2018 consists of cash held for reclamation
performance bonds and is held in certificates of deposit with
financial institutions.
F-6
United States Antimony Corporation and Subsidiaries
Notes to Consolidated Financial Statements
December 31, 2019 and 2018
2. Summary
of Significant Accounting Policies, continued:
Accounts Receivable
Accounts receivable
are stated at the amount that management expects to collect from
outstanding balances. Management provides for probable
uncollectible amounts through an allowance for doubtful accounts.
Changes to the allowance for doubtful accounts are based on
management’s judgment, considering historical write-offs,
collections and current credit conditions. Balances which remain
outstanding after management has used reasonable collection efforts
are written off through a charge to the allowance for doubtful
accounts and a credit to the applicable accounts receivable.
Payments received on receivables subsequent to being written off
are considered a bad debt recovery.
Inventories
Inventories at
December 31, 2019 and 2018 consisted of finished antimony products,
antimony metal, antimony concentrates, antimony ore, and finished
zeolite products, and are stated at the lower of first-in,
first-out weighted average cost or estimated net realizable value.
Finished antimony products, antimony metal and finished zeolite
products costs include raw materials, direct labor and processing
facility overhead costs and freight allocated based on production
quantity. Stockpiled ore is carried at the lower of average cost or
net realizable value. Since the Company's antimony inventory is a
commodity with a sales value that is subject to world prices for
antimony that are beyond the Company's control, a significant
change in the world market price of antimony could have a
significant effect on the net realizable value of inventories. The
Company periodically reviews its inventories to identify excess and
obsolete inventories and to estimate reserves for obsolete
inventories as necessary to reflect inventories at net realizable
value.
Translations of Foreign Currencies
All
amounts in the financial statements are presented in U.S. dollars,
which is the functional currency for all of the Company’s
operations. Foreign translation gains and losses relating to
Mexican subsidiaries are recognized as foreign exchange gain or
loss in the consolidated statement of operations.
Going Concern Consideration
At
December 31, 2019, the Company’s consolidated financial
statements show negative working capital of approximately $2.7
million and an accumulated deficit of approximately $29.4
million. With the exception of 2018, the Company has incurred
losses for the past several years. The net income in 2018 was
primarily due to non-recurring events which contributed
approximately $2.5 million to net income. These factors indicate
that there is substantial doubt regarding the ability to continue
as a going concern for the next twelve months.
Over
the past several years, the Company has been able to make required
principal payments on its debt from cash generated from
operations. The abandonment of the mineral properties in
Mexico (see Note 6) resulted in the removal of approximately
$1,500,000 of debt and the related payments which were $86,000 in
2019 and $193,000 in 2018. Current portion of
outstanding debt at December 31, 2019 was $56,334 compared to
$705,460 at December 31, 2018. The Company is confident it
can make debt payments when due. During 2019, the Company was
successful in raising $404,199 from sale of shares of its common
stock to fund capital projects in
Mexico.
The
continuing losses are principally a result of the Company’s
antimony operations due to both depressed antimony prices and
production costs incurred in Mexico. To improve conditions,
the Company plans to continue searching for areas to reduce these
production costs. Management expects improvement in
cash flow in 2020 from the sale of precious metals extracted from
the leach circuit scheduled to come on line in Mexico in the second
half of 2020.
F-7
United States Antimony Corporation and Subsidiaries
Notes to Consolidated Financial Statements
December 31, 2019 and 2018
2. Summary of Significant Accounting Policies,
continued:
There
can be no assurance that management plans will alleviate the doubt
regarding the Company’s ability to continue as a going
concern over the next twelve months, particularly during the
current period of market instability related to the COVID-19
pandemic. If the going concern assumption were not
appropriate for these financial statements, then adjustments would
be necessary to the carrying values of the assets and liabilities,
the reported revenues and expenses, and the balance sheet
classifications used.
Mineral Rights
The
costs to obtain the legal right to explore, extract and retain at
least a portion of the benefits from mineral deposits are
capitalized as mineral rights in the year of acquisition. These
capitalized costs are amortized on the statement of operations
using the straight line method over the expected life of the
mineral deposit when placed into production. Mineral rights are
assessed for impairment when facts and circumstances indicate that
the potential for impairment exists. Mineral rights are subject to
write down in the period the property is abandoned.
Properties, Plants and Equipment
Properties, plants
and equipment are stated at historical cost and are depreciated
using the straight-line method over estimated useful lives of two
to thirty years. Vehicles and office equipment are stated at cost
and are depreciated using the straight-line method over estimated
useful lives of three to twelve years. Maintenance and repairs are
charged to operations as incurred. Betterments of a major nature
are capitalized. Expenditures for new property, plant, equipment,
and improvements that extend the useful life or functionality of
the asset are capitalized. When assets are retired or sold, the
costs and related accumulated depreciation are eliminated from the
accounts and any resulting gain or loss is reflected in
operations.
Mineral
properties are amortized over the estimated economic life of the
mineral resource using the straight-line method, based upon
estimated lives of the properties, or the units-of-production
method, based upon estimated units of mineral
resource.
Management of the
Company periodically reviews the net carrying value of all of its
long-lived assets. These reviews consider the net realizable value
of each asset or group to determine whether a permanent impairment
in value has occurred and the need for any asset write-down. An
impairment loss is recognized when the estimated future cash flows
(undiscounted and without interest) expected to result from the use
of an asset are less than the carrying amount of the asset.
Measurement of an impairment loss is based on the estimated fair
value of the asset if the asset is expected to be held and
used.
Exploration and Development
The
Company recognizes exploration costs as operating expenses in the
period they occur, and capitalizes development costs on discrete
mineralized bodies that have proven reserves in compliance with
Securities and Exchange Commission Industry Guide 7, and are in
development or production.
Asset Retirement Obligations and Reclamation Costs
All of
the Company's mining operations are subject to reclamation and
remediation requirements. Minimum standards for mine reclamation
have been established by various governmental agencies. Costs are
estimated based primarily upon environmental and regulatory
requirements and are accrued. The liability for reclamation is
classified as current or noncurrent based on the expected timing of
expenditures. Reclamation differs from an asset retirement
obligation in that no associated asset is recorded in the case of
reclamation liabilities.
F-8
United States Antimony Corporation and Subsidiaries
Notes to Consolidated Financial Statements
December 31, 2019 and 2018
2. Summary of Significant Accounting Policies,
continued:
It is
reasonably possible that because of uncertainties associated with
defining the nature and extent of environmental contamination,
application of laws and regulations by regulatory authorities, and
changes in remediation technology, the ultimate cost of remediation
and reclamation could change in the future. The Company continually
reviews its accrued liabilities for such remediation and
reclamation costs as evidence becomes available indicating that its
remediation and reclamation liability has changed.
The
Company records the fair value of an asset retirement obligation as
a liability in the period in which the Company incurs a legal
obligation for the retirement of long-lived assets if it is
probable that such costs will be incurred and they are reasonably
estimable. A corresponding asset is also recorded and depreciated
over the life of the assets on a straight line basis. After the
initial measurement of the asset retirement obligation, the
liability will be adjusted to reflect changes in the estimated
future cash flows underlying the obligation. Determination of any
amounts included in determination of fair value is based upon
numerous estimates and assumptions, including future retirement
costs, future inflation rates, and the Company’s
credit-adjusted risk-free interest rates.
Revenue Recognition
Products consist of
the following:
●
Antimony: includes
antimony oxide, sodium antimonate,
antimony trisulfide, and antimony metal
●
Zeolite:
includes coarse and fine zeolite crushed in various
sizes
●
Precious Metals: includes unrefined and
refined gold and silver
For
antimony and zeolite products, revenue is recognized upon the
completion of the performance obligation which is met when the
transaction price can be reasonably estimated and revenue is
recognized generally at the time when risk is transferred. The
Company has determined the performance obligation is met and title
is transferred either upon shipment from the Company’s
warehouse locations or upon receipt by the customer as specified in
individual sales orders. The performance obligation is met because
at that time, 1) legal title is transferred to the customer, 2) the
customer has accepted the product and obtained the ability to
realize all of the benefits from the product, 3) the customer has
the significant risks and rewards of ownership to it, 4) it is very
unlikely product will be rejected by the customer upon physical
receipt, and 5) the Company has the right to payment for the
product. Shipping costs related to the sales of antimony and
zeolite products are recorded to cost of sales as incurred. For
zeolite products, royalty expense due a third party by the Company
is also recorded to cost of sales upon sale in accordance with
terms of underlying royalty agreements.
For
sales of precious metals, the performance obligation is met, the
transaction price is known, and revenue is recognized at the time
of transfer of control of the agreed-upon metal quantities to the
customer. Refining and shipping costs related to sales of precious
metals are recorded to cost of sales as incurred.
The
Company has determined that its contracts do not include a
significant financing component. Prepayments, which are not common,
received from customers prior to the time that products are
processed and shipped, are recorded as deferred revenue. For
antimony and zeolite sales contracts, the Company may factor
certain receivables and receive final payment within 30 days of the
performance obligation being met. For antimony and zeolite
receivables not factored, the Company typically receives payment
within 10 days. For precious metals sales, a provisional payment of
75% is typically received within 45 days of the date the product is
delivered to the customer. After an exchange of assays, a final
payment is normally received within 90 days of product
delivery.
Common Stock Issued for Consideration Other than Cash
All
transactions in which goods or services are received for the
issuance of shares of the Company’s common stock are
accounted for based on the fair value of the consideration received
or the fair value of the common stock issued, whichever is more
readily determinable.
F-9
United States Antimony Corporation and Subsidiaries
Notes to Consolidated Financial Statements
December 31, 2019 and 2018
2. Summary of Significant Accounting Policies,
continued:
Income Taxes
Income
taxes are accounted for under the liability method. Under this
method, deferred income tax liabilities or assets are determined at
the end of each period using the tax rate expected to be in effect
when the taxes are actually paid or recovered. A valuation
allowance is recognized on deferred tax assets when it is more
likely than not that some or all of these deferred tax assets will
not be realized.
The
Company applies generally accepted accounting principles for
recognition of uncertainty in income taxes and prescribing a
recognition threshold and measurement attribute for the recognition
and measurement of a tax position taken or expected to be taken in
a tax return.
Income (Loss) Per Common Share
Basic
earnings per share is calculated by dividing net income (loss)
available to common stockholders by the weighted average number of
common shares outstanding during the period. Diluted earnings per
share is calculated based on the weighted average number of common
shares outstanding during the period plus the effect of potentially
dilutive common stock equivalents, including stock options,
warrants to purchase the Company's common stock, and convertible
preferred stock. The calculation of diluted earnings per share for
the year ended December 31, 2018 includes 250,000
warrants.
For the
years ended December 31, 2019 and 2018, potentially dilutive common
stock equivalents not included in the calculation of diluted
earnings per share because they were anti-dilutive are as
follows:
|
|
December
31,
2019
|
December
31,
2018
|
|
Warrants
|
702,041
|
-
|
|
Convertible
preferred stock
|
1,751,005
|
1,751,005
|
|
Total
possible dilution
|
2,453,046
|
1,751,005
|
|
|
|
|
Fair Value of Financial Instruments
The
Company’s financial instruments include cash and cash
equivalents, certificates of deposits, restricted cash, due to
factor, notes payable to bank, and notes payable. The carrying
value of these instruments approximates fair value based on their
contractual terms.
Fair Value Measurements
When
required to measure assets or liabilities at fair value, the
Company uses a fair value hierarchy based on the level of
independent, objective evidence surrounding the inputs used. The
Company determines the level within the fair value hierarchy in
which the fair value measurements in their entirety fall. The
categorization within the fair value hierarchy is based upon the
lowest level of input that is significant to the fair value
measurement. Level 1
uses quoted prices in active markets for
identical assets or liabilities, Level 2 uses significant other
observable inputs, and Level 3 uses significant unobservable
inputs. The amount of the total gains or losses for the period are
included in earnings that are attributable to the change in
unrealized gains or losses relating to those assets and liabilities
still held at the reporting date. The Company has no financial
assets or liabilities that are adjusted to fair value on a
recurring basis.
F-10
United States Antimony Corporation and Subsidiaries
Notes to Consolidated Financial Statements
December 31, 2019 and 2018
2. Summary of Significant Accounting Policies,
continued:
Contingencies
In
determining accruals and disclosures with respect to loss
contingencies, the Company evaluates such accruals and
contingencies for each reporting period. Estimated losses from loss
contingencies are accrued by a charge to income when information
available prior to issuance of the financial statements indicates
that it is probable that a liability could be incurred and the
amount of the loss can be reasonably estimated. Legal expenses
associated with the contingency are expensed as incurred. If a loss
contingency is not probable or reasonably estimable, disclosure of
the loss contingency is made in the financial statements when it is
at least reasonably possible that a material loss could be
incurred.
Recent Accounting Pronouncements
Accounting Standards Updates Adopted
In
February 2016, the Financial Accounting Standards Board
(“FASB”) issued Accounting Standards Update
(“ASU”) No. 2016-02 Leases (Topic 842). The update
modified the classification criteria and requires lessees to
recognize the assets and liabilities on the balance sheet for most
leases. The update was effective for fiscal years beginning after
December 15, 2018, with early adoption permitted. Adoption of this
update as of January 1, 2019 did not have a material impact on the
Company’s consolidated financial statements because the
Company has no long-term operating leases.
In June
2018, the FASB issued ASU No. 2018-07 Compensation-Stock
Compensation (Topic 718): Improvements to Nonemployee Share-Based
Payment Accounting. The update involves simplification of several
aspects of accounting for nonemployee share-based payment
transactions by expanding the scope of Topic 718 to include
nonemployee awards. The update was effective for fiscal years
beginning after December 15, 2018, and interim periods within those
fiscal years, with early adoption permitted. Adoption of this
update as of January 1, 2019 did not have a material impact on the
Company’s consolidated financial statements.
Accounting Standards Updates to Become Effective in Future
Periods
In
August 2018, the FASB issued ASU No. 2018-13 Fair Value Measurement
(Topic 820): Disclosure Framework-Changes to the Disclosure
Requirements for Fair Value Measurement. The update removes,
modifies and makes additions to the disclosure requirements on fair
value measurements. The update is effective for fiscal years
beginning after December 15, 2019, with early adoption permitted.
Management is evaluating the impact of this update on the
Company’s fair value measurement disclosures.
Reclassifications
Certain
reclassifications have been made to conform the prior year’s
data to the current year’s presentation. These
reclassifications have no effect on previously reported operations,
stockholders’ equity or cash flows.
3.
Revenue
Recognition
Sales
of products for the years ended December 31, 2019 and 2018 were as
follows:
|
|
Year
Ended
|
|
|
|
December
31,
|
|
|
|
2019
|
2018
|
|
Antimony
|
$
5,450,649
|
$
6,113,014
|
|
Zeolite
|
2,623,117
|
2,666,944
|
|
Precious
metals
|
194,239
|
254,445
|
|
|
$
8,268,005
|
$
9,034,403
|
F-11
United States Antimony Corporation and Subsidiaries
Notes to Consolidated Financial Statements
December 31, 2019 and 2018
3.
Revenue
Recognition Continued:
The
following is sales information by geographic area based on the
location of customers for the years ended December 31, 2019 and
2018.
|
|
Year Ended
|
|
|
|
December 31,
|
|
|
|
2019
|
2018
|
|
United
States
|
$
7,454,163
|
$
8,242,141
|
|
Canada
|
813,842
|
792,262
|
|
|
$
8,268,005
|
$
9,034,403
|
|
|
|
|
Sales
of products to significant customers were as follows for the years
ended December 31, 2019 and 2018:
|
Sales
to
|
For the
Year Ended
|
|
|
Largest
Customers
|
December
31,
2019
|
December
31,
2018
|
|
Mexichem
Specialty Compounds Inc.
|
$
1,823,194
|
$
2,698,770
|
|
Nyacol
Nanotechnologies
|
1,099,504
|
-
|
|
Kohler
Corporation
|
1,132,674
|
1,441,197
|
|
Ampacet
|
-
|
538,922
|
|
|
$
4,055,372
|
$
4,678,889
|
|
% of Total Revenues
|
49.05
%
|
51.79
%
|
Accounts receivable
from largest customers were as follows for December 31, 2019 and
2018:
|
Largest
|
|
|
|
Accounts
Receivable
|
December
31,
2019
|
December
31,
2018
|
|
Nutreco
Canada Inc.
|
$
21,219
|
|
|
DanaMart
|
-
|
$
143,890
|
|
Lake
Shore Gold
|
27,854
|
-
|
|
Axens
North America Inc.
|
-
|
34,912
|
|
Earth
Innovations Inc.
|
-
|
35,967
|
|
Commerce
Industrial Chemical
|
54,684
|
-
|
|
|
$
103,757
|
$
214,769
|
|
% of Total Receivables
|
36.48
%
|
49.00
%
|
|
|
|
|
The
Company’s trade accounts receivable balance related to
contracts with customers was $284,453 at December 31, 2019 and
$438,391 at December 31, 2018.
F-12
United States Antimony Corporation and Subsidiaries
Notes to Consolidated Financial Statements
December 31, 2019 and 2018
4.
Accounts
Receivable and Due to Factor
The
Company factors designated trade receivables pursuant to a
factoring agreement with LSC Funding Group L.C., an unrelated
factor (the “Factor”). The agreement is for
a term of one year with automatic renewal for additional one-year
terms. The agreement specifies that eligible trade receivables are
factored with recourse. The performance of all obligations and
payments to the factoring company is personally guaranteed by John
C. Lawrence, the Company’s President and Chairman of the
Board of Directors. Selected trade receivables are submitted to the
Factor, and the Company receives 85% of the face value of the
receivable by wire transfer. Upon payment by the customer, the
remainder of the amount due is received from the Factor, less a
one-time servicing fee of 2% for the receivables
factored. This servicing fee is recorded on the
consolidated statement of operations in the period of sale to the
Factor.
Trade
receivables assigned to the Factor are carried at the original
invoice amount less an estimate made for doubtful
accounts. Under the terms of the recourse provision, the
Company is required to reimburse the Factor, upon demand, for
factored receivables that are not paid on
time. Accordingly, these receivables are accounted for
as a secured financing arrangement and not as a sale of financial
assets.
Receivables, net of
allowances, are presented as current assets and the amount
potentially due to the Factor is presented as a secured financing
in current liabilities.
|
Accounts
Receivble
|
December
31,
2019
|
December
31,
2018
|
|
Accounts
receivable - non-factored
|
$
273,573
|
$
421,867
|
|
Accounts
receivable - factored with recourse
|
10,880
|
16,524
|
|
Accounts
receivable - net
|
$
284,453
|
$
438,391
|
|
|
|
|
Factoring fees paid
by the Company during the years ended December 31, 2019 and 2018,
were $8,570 and $4,969, respectively. For the years ended December
31, 2019 and 2018, net accounts receivable of approximately $0.43
million and $0.25 million, respectively, were sold under the
agreement.
5. Inventories
The
major components of the Company's inventories at December 31, 2019
and 2018 were as follows:
|
|
2019
|
2018
|
|
Antimony
Metal
|
$
-
|
$
8,127
|
|
Antimony
Oxide
|
204,550
|
255,782
|
|
Antimony
Concentrates
|
5,654
|
2,214
|
|
Antimony
Ore
|
151,841
|
257,067
|
|
Total
antimony
|
362,045
|
523,190
|
|
Zeolite
|
264,199
|
232,071
|
|
|
$
626,244
|
$
755,261
|
|
|
|
|
At
December 31, 2019 and 2018, antimony metal consisted principally of
recast metal from antimony-based compounds, and metal purchased
from foreign suppliers. Antimony oxide inventory consisted of
finished product oxide held at the Company's plant. Antimony
concentrates and ore were held primarily at sites in Mexico and are
essentially raw material. At December 31, 2019 and 2018, the
antimony oxide and concentrates inventory in Mexico was valued at
estimated net realizable value resulting in write-downs of $16,396
and $64,702, respectively. The Company's zeolite inventory consists
of salable zeolite material.
F-13
United States Antimony Corporation and Subsidiaries
Notes to Consolidated Financial Statements
December 31, 2019 and 2018
6. Properties, Plants and Equipment
The
major components of the Company's properties, plants and equipment
by segment at December 31, 2019 and 2018 are shown
below:
|
|
Antimony
Segment
|
Zeolite
Segment
|
Precious
Metals
|
|
|
|
2019
|
USAC
|
USAMSA
|
BRZ
|
Segment
|
TOTAL
|
|
Plant
& Equipment
|
$
783,290
|
$
9,164,600
|
$
3,729,061
|
$
813,714
|
$
14,490,665
|
|
Buildings
|
247,210
|
902,707
|
410,780
|
-
|
1,560,697
|
|
Mineral
Rights and Interests
|
-
|
816,786
|
3,664
|
-
|
820,450
|
|
Land
& Other
|
3,274,572
|
2,529,294
|
15,310
|
-
|
5,819,176
|
|
|
4,305,072
|
13,413,387
|
4,158,815
|
813,714
|
22,690,988
|
|
Accumulated
Depreciation
|
(2,673,972
)
|
(4,612,567
)
|
(2,971,625
)
|
(245,976
)
|
(10,504,140
)
|
|
|
$
1,631,100
|
$
8,800,820
|
$
1,187,190
|
$
567,738
|
$
12,186,848
|
|
|
|
|
|
|
|
|
|
Antimony
Segment
|
Zeolite
Segment
|
Precious
Metals
|
|
|
|
2018
|
USAC
|
USAMSA
|
BRZ
|
Segment
|
TOTAL
|
|
Plant
& Equipment
|
$
743,767
|
$
8,466,461
|
$
3,690,249
|
$
792,628
|
$
13,693,105
|
|
Buildings
|
247,210
|
900,992
|
391,305
|
-
|
1,539,507
|
|
Mineral
Rights and Interests
|
-
|
3,793,502
|
3,664
|
-
|
3,797,166
|
|
Land
& Other
|
3,274,572
|
2,529,294
|
15,310
|
-
|
5,819,176
|
|
|
4,265,549
|
15,690,249
|
4,100,528
|
792,628
|
24,848,954
|
|
Accumulated
Depreciation
|
(2,630,234
)
|
(4,029,480
)
|
(2,785,159
)
|
(176,909
)
|
(9,621,782
)
|
|
|
$
1,635,315
|
$
11,660,769
|
$
1,315,369
|
$
615,719
|
$
15,227,172
|
|
|
|
|
|
|
|
In the
fourth quarter of 2019, the Company abandoned the Soyatal and
Guadalupe mineral properties in Mexico. The net carrying value of
the mineral properties of $2,937,259 less the outstanding related
notes payable balances, resulted in a loss of $1,410,736 recognized
on the abandonment of mineral properties.
At
December 31, 2019 and 2018, the Company had $1,306,579 and
$1,270,289, respectively, of assets that were not yet placed in
service and have not yet been depreciated.
7.
Asset
Retirement Obligation and Accrued Reclamation Costs
Changes
to the asset retirement obligation balance during 2019 and 2018 are
as follows:
|
Asset Retirement Obligation
|
|
|
Balance
December 31, 2017
|
$
164,072
|
|
Accretion
during 2018
|
6,148
|
|
Balance
December 31, 2018
|
170,220
|
|
Accretion
during 2019
|
6,148
|
|
Balance
December 31, 2019
|
$
176,368
|
|
|
|
The
Company’s total asset retirement obligation and accrued
reclamation costs of $283,868 and $277,720, at December 31, 2019
and 2018, respectively, include reclamation obligations for the
Idaho and Montana operations of $107,500.
F-14
United States Antimony Corporation and Subsidiaries
Notes to Consolidated Financial Statements
December 31, 2019 and 2018
8.
Long-Term
Debt:
|
Long-Term
debt at December 31, 2019 and December 31, 2018 is as
follows:
|
December
31,
|
December
31,
|
|
|
2019
|
2018
|
|
Note
payable to Zeo Inc., non interest bearing,
|
|
|
|
payable
in 11 quarterly installments of $8,300, starting the first quarter
of 2020,
|
|
|
|
with
a final payment of $8,700; maturing December 2022;
uncollateralized.
|
$
100,000
|
$
100,000
|
|
Note
payable to Cat Financial Services, bearing interest at
6%;
|
|
|
|
payable
in monthly installments of $1,300; maturing
|
|
|
|
August
2019; collateralized by equipment.
|
-
|
14,022
|
|
Note
payable to Cat Financial Services, bearing interest at
6%;
|
|
|
|
payable
in monthly installments of $778; maturing
|
|
|
|
December
2022; collateralized by equipment.
|
26,250
|
34,390
|
|
Note
payable to De Lage Landen Financial Services,
|
|
|
|
bearing
interest at 3.51%; payable in monthly installments of
$655;
|
|
|
|
maturing
September 2019; collateralized by equipment.
|
-
|
5,851
|
|
Note
payable to De Lage Landen Financial Services,
|
|
|
|
bearing
interest at 3.51%; payable in monthly installments of
$655;
|
|
|
|
maturing
September 2019; collateralized by equipment.
|
700
|
8,371
|
|
Note
payable to Phyllis Rice, bearing interest
|
|
|
|
at
1%; payable in monthly installments of $2,000; originally
maturing
|
|
|
|
March
2015; collateralized by equipment.
|
6,146
|
12,146
|
|
Obligation
payable for Soyatal Mine, non-interest bearing,
|
|
|
|
annual
payments of $100,000 or $200,000 through 2019, net of
discount.
|
-
|
639,747
|
|
Obligation
payable for Guadalupe Mine, non-interest bearing,
|
|
|
|
annual
payments from $60,000 to $149,078 through 2026, net of
discount.
|
-
|
918,663
|
|
|
133,096
|
1,733,190
|
|
Less
current portion
|
(56,334
)
|
(705,460
)
|
|
Long-term
portion
|
$
76,762
|
$
1,027,730
|
|
|
|
|
At
December 31, 2019, principal payments on debt are due as
follows:
|
12 Months Ending December 31,
|
Principal Payment
|
|
2020
|
$
56,334
|
|
2021
|
41,187
|
|
2022
|
33,915
|
|
2023
|
1,660
|
|
|
$
133,096
|
In the
fourth quarter 2019, the Company abandoned the Soyatal and
Guadalupe mineral properties in Mexico. The balances of the related
debt, net of discount, on the date of abandonment is $603,743 and
$922,780, respectively. The carrying value of the mineral
properties, less the outstanding related notes payable balances
resulted in a loss of $1,410,736 recognized on the abandonment of
mineral properties.
F-15
United States Antimony Corporation and Subsidiaries
Notes to Consolidated Financial Statements
December 31, 2019 and 2018
9.
Notes
Payable to Bank
|
At
December 31, 2019 and 2018, the Company had the following notes
payable to bank:
|
|
|
|
|
|
|
|
|
December
31,
|
December
31,
|
|
|
2019
|
2018
|
|
Promissory
note payable to First Security Bank of Missoula,
|
|
|
|
bearing
interest at 3.150%, payable on demand, collateralized
|
|
|
|
by
a lien on Certificate of Deposit
|
$
97,067
|
$
83,918
|
|
|
|
|
|
Promissory
note payable to First Security Bank of Missoula,
|
|
|
|
bearing
interest at 3.150%, payable on demand, collateralized
|
|
|
|
by
a lien on Certificate of Deposit
|
99,999
|
99,999
|
|
|
|
|
|
Total
notes payable to the bank
|
$
197,066
|
$
183,917
|
|
|
|
|
These
notes are personally guaranteed by John C. Lawrence the
Company’s President and Chairman of the Board of Directors.
The maximum amount available for borrowing under each note is
$99,999.
10.
Hillgrove
Advances Payable
On
November 7, 2014, the Company entered into an advance and
concentrate processing agreement with Hillgrove Mines Pty Ltd of
Australia (Hillgrove) in which the Company was advanced funds from
Hillgrove to build facilities to process Hillgrove antimony
concentrate. The Company has not processed Hillgrove concentrate
for the past two years. The agreement requires the Company to pay
the advance balance after Hillgrove issues a stop notice. Payments
would begin 90 days after the stop notice issue date and be made in
six equal and quarterly installments. The balance of the advance
liability due to Hillgrove was $1,134,221 at both December 31, 2019
and 2018. Hillgrove was acquired by Red River Resources LTD
(“Red River”) during 2019. Although the Company has not
received a stop notice through the date these financial statements
were issued, management has determined that one might be
forthcoming in 2020. Based on management’s assessment of
likelihood and the payment terms of the agreement, $378,074 of the
balance is classified as current as of December 31,
2019.
11.
Plant
Acquisition and Sale of Land
On
August 31, 2018, the Company closed a Member Interest and Capital
Share Agreement
(the
“Agreement”) with Great Lakes Chemical Corporation and
Lanxess Holding Company US Inc., as the sellers, and the Company as
the buyer. Under the Agreement, the Company acquired subsidiaries
of the sellers which include an antimony plant, equipment and land
located in Reynosa, Mexico. In addition, the Company
was paid $1,500,000 by the sellers, which was recognized as
operating income in the year ended December 31, 2018. The
transaction was accounted for as an asset acquisition as there was
no business associated with the acquired assets. The Company is
disassembling, salvaging, and transporting the antimony plant and
equipment for use in its existing operations in both Mexico and the
United States. The project involved moving heavy equipment and was
completed as of March 31, 2019.
During
November 2018, the Company sold the land acquired with the plant
for $700,000, and the Company received $300,000 in 2018 and
$400,000 in 2019. The Company recognized a gain on the sale of land
during the year ended December 31, 2018.
F-16
United States Antimony Corporation and Subsidiaries
Notes to Consolidated Financial Statements
December 31, 2019 and 2018
12.
Stockholders'
Equity
Issuance of Common Stock for Cash
During
2019, the Company sold units consisting of 904,082 shares of its
common stock and 452,041 warrants to purchase shares of common
stock for $0.48 per unit for total proceeds of $433,960. The
warrants are exercisable at $0.65 and expire in 2022. Offering
costs associated with the sale totaled $29,761.
The
Company did not issue any common stock or warrants for cash in
2018.
Issuance of Common Stock for Services to Directors and
Consultants
In
January 2019, the Company issued Daniel Parks, the Company’s
Chief Financial Officer, 200,000 shares of the Company’s
common stock with a fair value of $136,000 to retain his services.
As part of the agreement, Mr. Parks’ hours worked and cash
compensation was reduced.
During
the year ended December 31, 2019, the Company awarded, but did not
issue, common stock with a value of $134,375 to its Board of
Directors as compensation for their services as directors. In
connection with the issuances, the Company recorded $134,375 in
director compensation expense and accrued common stock
payable.
In
April 2019, the Company issued the Board members 330,183 shares of
the Company’s common stock for services provided during 2018
which was accrued at December 31, 2018, with a value of
$175,000.
During
the year ended December 31, 2018, the Company awarded, but did not
issue, common stock with a value of $175,000 to its Board of
Directors as compensation for their services as directors. In
connection with the issuances, the Company recorded $175,000 in
director compensation expense and accrued common stock
payable.
In May
2018, the Company issued the Board members 739,018 shares of the
Company’s common stock for services provided during 2017
which was accrued at December 31, 2017, with a value of
$175,000.
Common Stock Warrants
The
Company's Board of Directors has the authority to issue stock
warrants for the purchase of preferred or unregistered common stock
to directors and employees of the Company.
At
December 31, 2019 and 2018, warrants for purchase of 250,000 shares
of the Company’s common stock for $0.25 per share are
outstanding and have no expiration date. These warrants are owned
by the Company’s president.
In
addition to the warrants owed by the Company’s president,
common stock purchase warrants were sold with shares of common
stock during the year ended December 31, 2019. Total warrants for
purchase of 452,041 shares of the Company’s common stock were
issued with an exercise price of $0.65 per share and expire in
2022. None were exercised in 2019 and all are outstanding at
December 31, 2019.
Preferred Stock
The
Company's Articles of Incorporation authorize 10,000,000 shares of
$0.01 par value preferred stock available for issuance with such
rights and preferences, including liquidation, dividend,
conversion, and voting rights, as the Board of Directors may
determine.
Series B
During
1993, the Board established a Series B preferred stock, consisting
of 750,000 shares. The Series B preferred stock has preference over
the Company's common stock and Series A preferred stock (none of
which are outstanding); has no voting rights (absent default in
payment of declared dividends); and is entitled to cumulative
dividends of $0.01 per share per year, payable if and when declared
by the Board of Directors. During each of the years ended December
31, 2019 and 2018 the Company recognized $7,500 in Series B
preferred stock dividend. In the event of dissolution or
liquidation of the Company, the preferential amount payable to
Series B preferred stockholders is $1.00 per share plus dividends
in arrears. No dividends have been declared or paid with respect to
the Series B preferred stock. The Series B Preferred stock is no
longer convertible to shares of the Company’s common stock.
At December 31, 2019 and 2018, cumulative dividends in arrears on
the outstanding Series B shares were $187,500 and $180,000,
respectively.
F-17
United States Antimony Corporation and Subsidiaries
Notes to Consolidated Financial Statements
December 31, 2019 and 2018
12.
Stockholders' Equity
continued
:
Series C
During
2000, the Board established a Series C preferred stock, consisting
of 205,996 shares. In 2002, 28,092 shares were converted to common
stock and cancelled, leaving 177,904 Series C preferred shares
authorized and outstanding. The Series C preferred stock has
preference over the Company’s common stock and has voting
rights equal to that number of shares outstanding, but no
conversion or dividend rights. In the event of dissolution or
liquidation of the Company, the preferential amount payable to
Series C preferred stockholders is $0.55 per share.
Series D
During
2002, the Board established a Series D preferred stock, authorizing
the issuance of up to 2,500,000 shares. The Series D preferred
stock has preference over the Company’s common stock but is
subordinate to the liquidation preferences of the holders of the
Company’s outstanding Series A, Series B and Series C
preferred stock. Series D preferred stock carries voting rights and
is entitled to annual dividends of $0.0235 per share. The dividends
are cumulative and payable after payment and satisfaction of the
Series A, B and C preferred stock dividends. No dividends have been
declared or paid with respect to the Series D preferred stock. At
December 31, 2019 and 2018, the cumulative dividends in arrears on
the 1,751,005 outstanding Series D shares were $666,109 and
$624,960, respectively, payable if and when declared by the Board
of Directors. In the event of dissolution or liquidation of the
Company, the preferential amount payable to Series D preferred
stockholders is $2.50 per share. At December 31, 2019 and 2018, the
liquidation preference for Series D preferred stock was $5,043,622
and $5,002,473, respectively. Holders of the Series D preferred
stock have the right, subject to the availability of authorized but
unissued common stock, to convert their shares into shares of the
Company's common stock on a one-to-one basis without payment of
additional consideration and are not redeemable unless by mutual
consent. The majority of Series D preferred shares are held by John
Lawrence, president of the Company.
13. 2000 Stock Plan
In
January 2000, the Company's Board of Directors resolved to create
the United States Antimony Corporation 2000 Stock Plan ("the
Plan"). The purpose of the Plan is to attract and retain the best
available personnel for positions of substantial responsibility and
to provide additional incentive to employees, directors and
consultants to promote the success of the Company's business. The
maximum number of shares of common stock or options to purchase
common stock that may be issued pursuant to the Plan is 500,000. At
December 31, 2019 and 2018, 300,000 shares of the Company's common
stock had been previously issued under the Plan. There were no
issuances under the Plan during 2019 and 2018.
14. Income Taxes
During
the year ended December 31, 2019 and 2018, the Company recognized
an income tax benefit (provision) of nil and $332,332,
respectively. The 2018 benefit, which is a current foreign benefit,
is a result of a positive outcome to an audit of USAMSA’s
2013 income tax return in Mexico.
F-18
United States Antimony Corporation and Subsidiaries
Notes to Consolidated Financial Statements
December 31, 2019 and 2018
14. Income Taxes, continued:
Domestic and
foreign components of income (loss) from operations before income
taxes for the years ended December 31, 2019, and 2018, are as
follows:
|
|
2019
|
2018
|
|
Domestic
|
$
462,292
|
$
3,675,095
|
|
Foreign
|
(4,135,183
)
|
(3,134,202
)
|
|
Total
|
$
(3,672,891
)
|
$
540,893
|
The
income tax provision (benefit) differs from the amount of income
tax determined by applying the U.S. federal income tax rate to
pretax income (loss) for the years ended December 31, 2019 and
2018, due to the following:
|
|
2019
|
2018
|
|
Tax
benefit at federal statutory rate
|
$
(771,307
)
|
$
113,588
|
|
State
income tax effect
|
(177,435
)
|
12,602
|
|
Foreign
income tax effect
|
(147,166
)
|
(102,078
)
|
|
Non-deductible
items
|
801
|
492
|
|
Percentage
depletion
|
(52,416
)
|
(47,341
)
|
|
Adjustment
to prior year tax esimates - Domestic
|
(269,906
)
|
-
|
|
Adjustment
to prior year tax esimates - Foreign
|
641,438
|
-
|
|
Impact
on change in foreign exchange rate
|
103,218
|
-
|
|
Change
in valuation allowance - Domestic
|
926,873
|
(295,984
)
|
|
Change
in valuation allowance - Foreign
|
(254,101
)
|
318,721
|
|
Foreign
tax assessment (benefit)
|
-
|
(332,332
)
|
|
Total
|
$
-
|
$
(332,332
)
|
At
December 31, 2019 and 2018, the Company had net deferred tax assets
as follows:
|
|
2019
|
2018
|
|
Deferred
tax asset:
|
|
|
|
Domestic
net operating loss carry forward
|
$
1,111,779
|
$
219,666
|
|
Foreign
net operating loss carry forward
|
1,623,580
|
1,877,681
|
|
Other
|
-
|
1,006
|
|
Deferred
tax asset
|
2,735,359
|
2,098,353
|
|
|
|
|
|
Valuation
allowance (domestic)
|
(1,021,829
)
|
(94,956
)
|
|
Valuation
allowance (foreign)
|
(1,623,580
)
|
(1,877,681
)
|
|
Total
deferred tax asset
|
89,950
|
125,716
|
|
|
|
|
|
Deferred
tax liability
|
|
|
|
Property,
plant, and equipment
|
(88,292
)
|
(125,716
)
|
|
Other
|
(1,658
)
|
|
|
Total
deferred tax liability
|
(89,950
)
|
(125,716
)
|
|
|
|
|
|
Net
deferred tax asset
|
$
-
|
$
-
|
At
December 31, 2019 and 2018, the Company had deferred tax assets
arising principally from net operating loss carry forwards for
income tax purposes. As management cannot determine that it is more
likely than not the benefit of the net deferred tax asset will be
realized, a valuation allowance equal to 100% of the net deferred
tax asset has been recorded at December 31, 2019 and
2018.
F-19
United States Antimony Corporation and Subsidiaries
Notes to Consolidated Financial Statements
December 31, 2019 and 2018
14. Income Taxes, continued:
At
December 31, 2019, the Company has federal net operating loss
(“NOL”) carry forwards of approximately $0.7 million
that expire at various dates between 2034 and 2037. In addition,
the Company has federal NOL carry forwards of $2.7 million that
will never expire but utilization of which is limited to 80% of
taxable income in any future year. The Company has Montana state
NOL carry forwards of approximately $4.6 million which expire
between 2020 and 2027, and Idaho state NOL carry forwards of
approximately $2.8 million, which expire between 2033 and 2039. The
Company has approximately $4.7 million of Mexican NOL carry
forwards which expire between 2024 and 2029.
As
disclosed in Note 11, the Company acquired new subsidiaries in
2018. The subsidiaries have net operating loss carryforwards in
Mexico of approximately $800,000. Due to limitations, it is likely
that a portion of this carryforward will not be available to offset
the Company’s future taxable income in Mexico.
During
the years ended December 31, 2019 and 2018, there were no material
uncertain tax positions taken by the Company. The Company’s
United States income tax filings are subject to examination for the
years 2016 through 2018, and 2015 through 2018 in Mexico. The
Company charges penalties on assessments to general and
administrative expense and charges interest to interest
expense.
Mexican Tax Assessment
In
2015, the Mexican tax authority (“SAT”) initiated an
audit of the USAMSA’s 2013 income tax return. In October
2016, as a result of its audit, SAT assessed the Company $13.8
million pesos, which was approximately $666,400 in U.S. Dollars
(“USD”) as of December 31, 2016. SAT’s assessment
was based on the disallowance of specific costs that the Company
deducted on the 2013 USAMSA income tax return. These disallowed
costs were incurred by the Company for USAMSA’s business
operations. Management reviewed the assessment notice from SAT and
believed numerous findings had no merit. The Company engaged
accountants and tax attorneys in Mexico to defend its position. An
appeal was filed.
At
December 31, 2017, the Company had accrued a potential tax
liability of $443,110 associated with this assessment which
represented the potential contingent fee it would be required to
pay its attorney representing the Company in the appeal. In 2018,
SAT finalized its procedures with no assessment against the
Company. The accrual of $443,110 was reversed and recognized as
income tax benefit of $332,332 and a gain on tax settlement of
$110,778 which represented previously accrued interest and
penalties. The Company paid Mexican tax representatives $157,500 to
negotiate this settlement that was recognized as professional fees
expense during the year ended December 31, 2018.
In
early 2019, the Company was notified that SAT re-opened its
assessment of USAMSA’s 2013 income tax return and, in
November 2019, SAT assessed the Company $16.3 million pesos, which
was approximately $866,000 USD as of December 31,
2019
(approximately
$691,000 USD on April 9, 2020)
.
Management has
reviewed the 2019 assessment notice from SAT and, similar to the
earlier assessment, believes the findings have no merit. The
Company has engaged a tax attorney in Mexico to defend its
position. An appeal was filed by the Company in November 2019
suspending SAT from taking immediate action regarding the
assessment. The Company posted a guarantee of the amount in March
2020 as is required under the appeal process. Management expects
the appeal process to continue through 2020 and into
2021.
At
December 31, 2019, management assessed the possible outcomes for
this tax audit and believes, based on its discussions with its tax
attorney in Mexico, that the most likely outcome will be that the
Company will be successful in its appeal resulting in no tax due.
Management determined that no amount should be accrued at December
31, 2019 relating to this potential tax liability. There can be no
assurance that the Company’s ultimate liability, if any, will
not have a material adverse effect on the Company’s results
of operations or financial position.
If an
issue addressed during the SAT audit is resolved in a manner
inconsistent with management expectations, the Company will adjust
its net operating loss carryforward, or accrue penalties, interest,
and tax associated with the assessment.
15. Related-Party Transactions
The
Company’s President and Chairman, John Lawrence, rents
equipment to the Company and charges the Company for lodging and
meals provided to consultants, customers and other parties by an
entity that Mr. Lawrence owns. The amount due to Mr. Lawrence as of
December 31, 2019 and 2018 was $156,975 and $93,567, respectively.
Expenses paid to Mr. Lawrence for the years ended December 31, 2019
and 2018 were $9,799 and $9,634, respectively
During
2019, the Company’s President and Chairman, John Lawrence,
made loans to the Company totaling $227,200, of which $35,066 had
been repaid as of December 31, 2019, leaving a note balance of
$192,134. During 2018, Mr. Lawrence advanced the Company $135,000
for ongoing expenses, this amount had been fully repaid as of
December 31, 2018.
John C.
Gustaven, First Vice-President, loaned the Company $10,200 during
2019, of which none had been repaid as of December 31,
2019.
F-20
United States Antimony Corporation and Subsidiaries
Notes to Consolidated Financial Statements
December 31, 2019 and 2018
16. Commitments and Contingencies
In June
of 2013, the Company entered into a lease to mine antimony ore from
concessions located in the Wadley Mining district in Mexico. The
lease calls for a mandatory term of one year and requires payments
of $10,000 plus IVA tax of $1,600 per month. The lease is renewable
each year with a 15 day notice to the lessor, and agreement of
terms. The lease was renewed in June 2019 with the same terms
through June 2020.
From
time to time, the Company is assessed fines and penalties by the
Mine Safety and Health Administration (“MSHA”). Using
appropriate regulatory channels, management may contest these
proposed assessments. At December 31, 2019 and 2018, the Company
had accrued liabilities of $624 and $0, respectively, relating to
such assessments.
The
Company pays various royalties on the sale of zeolite products. On
a combined basis, royalties vary from 8%-13%. During the year ended
December 31, 2019 and 2018, the Company had royalty expense of
$266,388 and $272,821, respectively. At December 31, 2019 and 2018,
the Company had accrued royalties payable of $280,314 and $201,083,
respectively.
17. Business Segments
The
Company is currently organized and managed by four segments, which
represent the three operating units: United States antimony,
Mexican antimony, United States zeolite, and precious metals. The
Company’s other operating costs include general and
administrative expenses, freight and delivery, and other
non-production related costs. Other income and expense consists
primarily of interest income and expense and factoring
expense.
The
Madero smelter and Puerto Blanco mill at the Company’s Mexico
operation brings antimony up to a finished product or an
intermediate stage, which is then either shipped directly to
customers or to the United States operation for finishing and sales
at the Thompson Falls, Montana plant. The Zeolite operation
produces Zeolite near Preston, Idaho. Almost all of the sales of
products from the United States antimony and Zeolite operations are
to customers in the United States. Precious metal recovered from
the antimony process in the United States and Mexico is typically
sold to customers in the United States and Canada.
Segment
disclosures regarding sales to major customers and for property,
plant, and equipment are located in Notes 3 and 6,
respectively.
F-21
United States Antimony Corporation and Subsidiaries
Notes to Consolidated Financial Statements
December 31, 2019 and 2018
17. Business Segments, continued:
|
Total Assets:
|
December
31,
2019
|
December
31,
2018
|
|
Antimony
|
|
|
|
United
States
|
$
2,166,041
|
$
2,199,694
|
|
Mexico
|
9,193,521
|
12,824,291
|
|
Subtotal
Antimony
|
11,359,562
|
15,023,985
|
|
Precious
Metals
|
567,738
|
615,719
|
|
Zeolite
|
1,766,675
|
1,917,419
|
|
Total
|
$
13,693,975
|
$
17,557,123
|
|
|
|
|
|
|
For the
year ended
|
For the
year ended
|
|
Capital expenditures:
|
December
31, 2019
|
December
31, 2018
|
|
Antimony
|
|
|
|
United
States
|
$
8,429
|
$
-
|
|
Mexico
|
705,123
|
803,579
|
|
Subtotal
Antimony
|
713,552
|
803,579
|
|
Precious
metals
|
21,086
|
40,988
|
|
Zeolite
|
58,287
|
154,552
|
|
Total
|
$
792,925
|
$
999,119
|
|
|
|
|
|
Segment Operations for the
|
Antimony
|
Antimony
|
Total
|
Precious
|
Bear River
|
|
|
Year ended December 31, 2019
|
USA
|
Mexico
|
Antimony
|
Metals
|
Zeolite
|
Totals
|
|
|
|
|
|
|
|
|
|
Total
revenues
|
$
5,450,649
|
$
-
|
$
5,450,649
|
$
194,239
|
$
2,623,117
|
$
8,268,005
|
|
|
|
|
|
|
|
|
|
Depreciation
and amortization
|
43,738
|
596,719
|
640,457
|
69,067
|
186,466
|
895,990
|
|
|
|
|
|
|
|
|
|
Income
(loss) from operations
|
(144,208
)
|
(4,239,123
)
|
(4,383,331
)
|
125,172
|
513,052
|
(3,745,107
)
|
|
|
|
|
|
|
|
|
|
Other
income (expense)
|
(16,142
)
|
103,940
|
87,798
|
|
(15,582
)
|
72,216
|
|
|
|
|
|
|
|
|
|
Income
tax benefit
|
|
|
-
|
-
|
-
|
-
|
|
|
|
|
|
|
|
|
|
NET INCOME (LOSS)
|
$
(160,350
)
|
$
(4,135,183
)
|
$
(4,295,533
)
|
$
125,172
|
$
497,470
|
$
(3,672,891
)
|
F-22
United States Antimony Corporation and Subsidiaries
Notes to Consolidated Financial Statements
December 31, 2019 and 2018
17. Business Segments, continued:
|
Segment
Operations for the
|
Antimony
|
Antimony
|
Total
|
Precious
|
Bear
River
|
|
|
Year
ended December 31, 2018
|
USA
|
Mexico
|
Antimony
|
Metals
|
Zeolite
|
Totals
|
|
|
|
|
|
|
|
|
|
Total
revenues
|
$
6,113,014
|
$
-
|
$
6,113,014
|
$
254,445
|
$
2,666,944
|
$
9,034,403
|
|
|
|
|
|
|
|
|
|
Depreciation
and amortization
|
52,681
|
595,318
|
647,999
|
68,042
|
188,803
|
904,844
|
|
|
|
|
|
|
|
|
|
Income
(loss) from operations
|
3,046,782
|
(3,148,092
)
|
(101,310
)
|
186,403
|
461,943
|
547,036
|
|
|
|
|
|
|
|
|
|
Other
income (expense)
|
(8,051
)
|
13,890
|
5,839
|
-
|
(11,982
)
|
(6,143
)
|
|
|
|
|
|
|
|
|
|
Income
tax benefit
|
-
|
332,332
|
332,332
|
-
|
-
|
332,332
|
|
|
|
|
|
|
|
|
|
NET INCOME (LOSS)
|
$
3,038,731
|
$
(2,801,870
)
|
$
236,861
|
$
186,403
|
$
449,961
|
$
873,225
|
|
|
|
|
|
|
|
|
F-23
TABLE OF CONTENTS
Part IItem 1. Description Of BusinessItem 1A Risk FactorsItem 1B Unresolved Staff CommentsItem 2 Description Of PropertiesItem 3 Legal ProceedingsItem 4 Mine Safety DisclosuresPart IIItem 5 Market For Common Equity and Related Stockholder MattersItem 6 Selected Financial DataItem 7 Management's Discussion and Analysis Or Plan Of OperationsItem 7A Quantitative and Qualitative Disclosures About Market RiskItem 8 Financial StatementsItem 9 Changes in and Disagreements with Accountants on Accounting and Financial DisclosureItem 9A Controls and ProceduresPart IIIItem 10 Directors, Executive Officers, Promoters and Control Persons, Compliance with Section 16(a) Of The Exchange ActItem 10 Directors, Executive Officers, Promoters and Control Persons, Compliance withItem 11 Executive CompensationItem 12 Security Ownership Of Certain Beneficial Owners and ManagementItem 13 Certain Relationships and Related TransactionsItem 14 Principal Accountant Fees and ServicesItem 15. Exhibits and Reports on Form 8-kItem 5. Other Events - October 10, 2003