CVR PARTNERS, LP
10-Ks and 10-Qs
|
|
|
|
|
UNITED STATES
SECURITIES AND EXCHANGE COMMISSION
Washington, D.C. 20549
Form 10-Q
|
(Mark One)
|
|
|
þ
|
QUARTERLY REPORT PURSUANT TO
SECTION 13 OR 15(d)
OF THE SECURITIES EXCHANGE ACT OF 1934
|
|
For the quarterly period ended June 30, 2016
|
|
|
OR
|
|
|
¨
|
TRANSITION REPORT PURSUANT TO
SECTION 13 OR 15(d)
OF THE SECURITIES EXCHANGE ACT OF 1934
|
|
For the transition period from
to
.
|
|
Commission file number: 001-35120
CVR Partners, LP
(Exact name of registrant as specified in its charter)
|
Delaware
|
56-2677689
|
|
(State or other jurisdiction of
incorporation or organization)
|
(I.R.S. Employer
Identification No.)
|
|
2277 Plaza Drive, Suite 500
|
|
|
Sugar Land, Texas
(Address of principal executive offices)
|
77479
(Zip Code)
|
(281) 207-3200
(Registrant’s telephone number, including area code)
Indicate by check mark whether the registrant (1) has filed all reports required to be filed by Section 13 or 15(d) of the Securities Exchange Act of 1934 during the preceding 12 months (or for such shorter period that the registrant was required to file such reports), and (2) has been subject to such filing requirements for the past 90 days. Yes
þ
No
o
Indicate by check mark whether the registrant has submitted electronically and posted on its corporate Web site, if any, every Interactive Data File required to be submitted and posted pursuant to Rule 405 of Regulation S-T (§232.405 of this chapter) during the preceding 12 months (or for such shorter period that the registrant was required to submit and post such files). Yes
þ
No
o
Indicate by check mark whether the registrant is a large accelerated filer, an accelerated filer, a non-accelerated filer, or a smaller reporting company. See the definitions of "large accelerated filer," "accelerated filer" and "smaller reporting company" in Rule 12b-2 of the Exchange Act.
|
Large accelerated filer
o
|
Accelerated filer
þ
|
Non-accelerated filer
o
|
Smaller reporting company
o
|
|||
|
(Do not check if smaller reporting company.)
|
||||||
Indicate by check mark whether the registrant is a shell company (as defined by Rule 12b-2 of the Exchange Act). Yes
o
No
þ
There were
113,282,973
common units outstanding at
July 26, 2016
.
CVR PARTNERS, LP AND SUBSIDIARIES
INDEX TO QUARTERLY REPORT ON FORM 10-Q
For The Quarter Ended
June 30, 2016
|
Page No.
|
||
2
GLOSSARY OF SELECTED TERMS
The following are definitions of certain terms used in this Quarterly Report on Form 10-Q for the quarter ended
June 30, 2016
(this "Report"):
|
2015 Form 10-K
|
The Partnership's Annual Report on Form 10-K for the year ended December 31, 2015, filed with the SEC on February 18, 2016.
|
|
2021 Notes
|
$320.0 million aggregate principal amount of 6.5% Senior Notes due 2021, which were issued by CVR Nitrogen and CVR Nitrogen Finance. In June 2016 the majority of the Notes were repaid. $4.2 million aggregate principal amount of the Notes remain outstanding as of June 30, 2016.
|
|
2023 Notes
|
$645.0 million aggregate principal amount of 9.25% Senior Notes due 2023, which were issued through CVR Partners and CVR Nitrogen Finance.
|
|
ammonia
|
Ammonia is a direct application fertilizer and is primarily used as a building block for other nitrogen products for industrial applications and finished fertilizer products.
|
|
capacity
|
Capacity is defined as the throughput a process unit is capable of sustaining, either on a calendar or stream day basis. The throughput may be expressed in terms of maximum sustainable, nameplate or economic capacity. The maximum sustainable or nameplate capacities may not be the most economical. The economic capacity is the throughput that generally provides the greatest economic benefit based on considerations such as feedstock costs, product values and downstream unit constraints.
|
|
catalyst
|
A substance that alters, accelerates, or instigates chemical changes, but is neither produced, consumed nor altered in the process.
|
|
Change of Control Offer
|
The offer commenced on April 29, 2016 by the CVR Nitrogen and CVR Nitrogen Finance to purchase any and all of the outstanding 2021 Notes at 101% of par value.
|
|
Coffeyville Facility
|
CVR Partners' nitrogen fertilizer manufacturing facility located in Coffeyville, Kansas.
|
|
common units
|
Common units representing limited partner interests of CVR Partners.
|
|
corn belt
|
The primary corn producing region of the United States, which includes Illinois, Indiana, Iowa, Minnesota, Missouri, Nebraska, Ohio and Wisconsin.
|
|
Credit Agreement
|
CRNF's $125.0 million term loan, $25.0 million revolving and $50.0 million uncommitted incremental credit facility, guaranteed by the Partnership, entered into with a group of lenders including Goldman Sachs Lending Partners LLC, as administrative and collateral agent.
|
|
CRLLC
|
Coffeyville Resources, LLC, the subsidiary of CVR Energy which directly owns our general partner and 38,920,000 common units.
|
|
CRLLC Facility
|
The Partnership's $300.0 million senior term loan credit facility with CRLLC, which was repaid in full and terminated on June 10, 2016.
|
|
CRNF
|
Coffeyville Resources Nitrogen Fertilizers, LLC.
|
|
CVR Energy
|
CVR Energy, Inc., a publicly traded company listed on the New York Stock Exchange under the ticker symbol "CVI," which indirectly owns our general partner and the common units owned by CRLLC.
|
|
CVR Nitrogen Finance
|
CVR Nitrogen Finance Corporation, an indirect wholly-owned subsidiary of the Partnership (formerly known as East Dubuque Finance Corporation and also formerly known as Rentech Nitrogen Finance Corporation).
|
|
CVR Nitrogen
|
CVR Nitrogen, LP (formerly known as East Dubuque Nitrogen Partners, L.P. and also formerly known as Rentech Nitrogen Partners L.P.).
|
|
CVR Nitrogen GP
|
CVR Nitrogen GP, LLC (formerly known as East Dubuque Nitrogen GP, LLC and also formerly known as Rentech Nitrogen GP, LLC).
|
3
|
CVR Partners
|
CVR Partners, LP.
|
|
CVR Refining
|
CVR Refining, LP, a publicly traded limited partnership listed on the New York Stock Exchange under the ticker symbol "CVRR," which currently owns and operates a complex full coking medium-sour crude oil refinery with a rated capacity of 115,000 barrels per calendar day (bpcd) in Coffeyville, Kansas, a complex crude oil refinery with a rated capacity of 70,000 bpcd in Wynnewood, Oklahoma and ancillary businesses.
|
|
East Dubuque Facility
|
CVR Partners' nitrogen fertilizer manufacturing facility located in East Dubuque, Illinois.
|
|
East Dubuque Merger
|
The transactions contemplated by the Merger Agreement, whereby the Partnership acquired CVR Nitrogen and CVR Nitrogen GP on April 1, 2016.
|
|
EDNF
|
East Dubuque Nitrogen Fertilizers, LLC (formerly known as Rentech Nitrogen, LLC).
|
|
farm belt
|
Refers to the states of Illinois, Indiana, Iowa, Kansas, Minnesota, Missouri, Nebraska, North Dakota, Ohio, Oklahoma, South Dakota, Texas and Wisconsin.
|
|
GAAP
|
U.S. generally accepted accounting principles.
|
|
general partner
|
CVR GP, LLC, our general partner, which is a wholly-owned subsidiary of CRLLC.
|
|
Merger Agreement
|
The Agreement and Plan of Merger, dated as of August 9, 2015, whereby the Partnership acquired CVR Nitrogen and CVR Nitrogen GP.
|
|
Mid Corn Belt
|
Primarily includes Illinois, Indiana, Iowa, Missouri, Nebraska and Kansas.
|
|
MMBtu
|
One million British thermal units: a measure of energy. One Btu of heat is required to raise the temperature of one pound of water one degree Fahrenheit.
|
|
MSCF
|
One thousand standard cubic feet, a customary gas measurement.
|
|
netback
|
Netback represents net sales less freight revenue divided by product sales volume in tons. Netback is also referred to as product pricing at gate.
|
|
on-stream
|
Measurement of the reliability of the gasification, ammonia and UAN units, defined as the total number of hours operated by each unit divided by the total number of hours in the reporting period.
|
|
Partnership
|
CVR Partners, LP.
|
|
pet coke
|
Petroleum coke - a coal-like substance that is produced during the oil refining process.
|
|
product pricing at gate
|
Product pricing at gate represents net sales less freight revenue divided by product sales volume in tons. Product pricing at gate is also referred to as netback.
|
|
Southern Plains
|
Primarily includes Oklahoma, Texas and New Mexico.
|
|
Tender Offer
|
The cash tender offer commenced on April 29, 2016 by CVR Nitrogen and CVR Nitrogen Finance to purchase any and all of the outstanding 2021 Notes at 101.5% of par value.
|
|
throughput
|
The volume processed through a unit.
|
|
ton
|
One ton is equal to 2,000 pounds.
|
|
turnaround
|
A periodically required standard procedure to refurbish and maintain a facility that involves the shutdown and inspection of major processing units.
|
|
UAN
|
UAN is an aqueous solution of urea and ammonium nitrate used as a fertilizer.
|
|
Wells Fargo Credit Agreement
|
CVR Nitrogen's credit agreement with Wells Fargo Bank, National Association, as successor-in-interest by assignment from General Electric Company, as administrative agent, which was repaid in April 2016 and terminated.
|
|
wheat belt
|
The primary wheat producing region of the United States, which includes Oklahoma, Kansas, North Dakota, South Dakota and Texas
|
4
Item 1.
Financial Statements
CVR PARTNERS, LP AND SUBSIDIARIES
|
June 30,
2016 |
December 31,
2015 |
||||||
|
(unaudited)
|
|||||||
|
(in thousands, except unit data)
|
|||||||
|
ASSETS
|
|||||||
|
Current assets:
|
|||||||
|
Cash and cash equivalents
|
$
|
76,261
|
|
$
|
49,967
|
|
|
|
Accounts receivable, net of allowance for doubtful accounts of $42 and $27, at June 30, 2016 and December 31, 2015, respectively
|
16,059
|
|
7,187
|
|
|||
|
Inventories
|
53,113
|
|
37,529
|
|
|||
|
Prepaid expenses and other current assets, including $837 and $883 from affiliates at June 30, 2016 and December 31, 2015, respectively
|
6,403
|
|
3,862
|
|
|||
|
Total current assets
|
151,836
|
|
98,545
|
|
|||
|
Property, plant, and equipment, net of accumulated depreciation
|
1,154,568
|
|
393,133
|
|
|||
|
Goodwill
|
40,969
|
|
40,969
|
|
|||
|
Other long-term assets, including $688 and $777 with affiliates at June 30, 2016 and December 31, 2015, respectively
|
5,276
|
|
3,608
|
|
|||
|
Total assets
|
$
|
1,352,649
|
|
$
|
536,255
|
|
|
|
LIABILITIES AND PARTNERS’ CAPITAL
|
|||||||
|
Current liabilities:
|
|||||||
|
Accounts payable, including $2,075 and $1,940 due to affiliates at June 30, 2016 and December 31, 2015, respectively
|
$
|
33,998
|
|
$
|
11,103
|
|
|
|
Personnel accruals, including $1,946 and $1,974 with affiliates at June 30, 2016 and December 31, 2015, respectively
|
7,160
|
|
5,999
|
|
|||
|
Deferred revenue
|
1,326
|
|
3,129
|
|
|||
|
Accrued expenses and other current liabilities, including $1,545 and $2,334 with affiliates at June 30, 2016 and December 31, 2015, respectively
|
11,571
|
|
5,683
|
|
|||
|
Total current liabilities
|
54,055
|
|
25,914
|
|
|||
|
Long-term liabilities:
|
|||||||
|
Long-term debt, net of current portion
|
625,312
|
|
124,773
|
|
|||
|
Other long-term liabilities
|
1,142
|
|
16
|
|
|||
|
Total long-term liabilities
|
626,454
|
|
124,789
|
|
|||
|
Commitments and contingencies
|
|
|
|
|
|||
|
Partners’ capital:
|
|||||||
|
Common unitholders, 113,282,973 and 73,128,269 units issued and outstanding at June 30, 2016 and December 31, 2015, respectively
|
672,139
|
|
385,670
|
|
|||
|
General partner interest
|
1
|
|
1
|
|
|||
|
Accumulated other comprehensive loss
|
—
|
|
(119
|
)
|
|||
|
Total partners’ capital
|
672,140
|
|
385,552
|
|
|||
|
Total liabilities and partners’ capital
|
$
|
1,352,649
|
|
$
|
536,255
|
|
|
See accompanying notes to the condensed consolidated financial statements.
5
CVR PARTNERS, LP AND SUBSIDIARIES
|
Three Months Ended
June 30, |
Six Months Ended
June 30, |
||||||||||||||
|
2016
|
2015
|
2016
|
2015
|
||||||||||||
|
(unaudited)
|
|||||||||||||||
|
(in thousands, except per unit data)
|
|||||||||||||||
|
Net sales
|
$
|
119,797
|
|
$
|
80,815
|
|
$
|
192,889
|
|
$
|
173,865
|
|
|||
|
Operating costs and expenses:
|
|||||||||||||||
|
Cost of product sold (exclusive of depreciation and amortization) — Affiliates
|
536
|
|
2,184
|
|
1,357
|
|
4,002
|
|
|||||||
|
Cost of product sold (exclusive of depreciation and amortization) — Third parties
|
35,513
|
|
13,240
|
|
51,073
|
|
37,191
|
|
|||||||
|
36,049
|
|
15,424
|
|
52,430
|
|
41,193
|
|
||||||||
|
Direct operating expenses (exclusive of depreciation and amortization) — Affiliates
|
1,249
|
|
1,195
|
|
2,101
|
|
2,222
|
|
|||||||
|
Direct operating expenses (exclusive of depreciation and amortization) — Third parties
|
52,895
|
|
23,951
|
|
75,733
|
|
47,338
|
|
|||||||
|
54,144
|
|
25,146
|
|
77,834
|
|
49,560
|
|
||||||||
|
Selling, general and administrative expenses (exclusive of depreciation and amortization) — Affiliates
|
3,917
|
|
3,361
|
|
7,379
|
|
6,628
|
|
|||||||
|
Selling, general and administrative expenses (exclusive of depreciation and amortization) — Third parties
|
4,426
|
|
1,162
|
|
7,356
|
|
2,478
|
|
|||||||
|
8,343
|
|
4,523
|
|
14,735
|
|
9,106
|
|
||||||||
|
Depreciation and amortization
|
17,559
|
|
7,010
|
|
24,535
|
|
13,829
|
|
|||||||
|
Total operating costs and expenses
|
116,095
|
|
52,103
|
|
169,534
|
|
113,688
|
|
|||||||
|
Operating income
|
3,702
|
|
28,712
|
|
23,355
|
|
60,177
|
|
|||||||
|
Other income (expense):
|
|||||||||||||||
|
Interest expense and other financing costs
|
(15,552
|
)
|
(1,717
|
)
|
(17,187
|
)
|
(3,414
|
)
|
|||||||
|
Interest income
|
2
|
|
12
|
|
4
|
|
24
|
|
|||||||
|
Loss on extinguishment of debt
|
(5,116
|
)
|
—
|
|
(5,116
|
)
|
—
|
|
|||||||
|
Other income, net
|
34
|
|
5
|
|
58
|
|
11
|
|
|||||||
|
Total other income (expense)
|
(20,632
|
)
|
(1,700
|
)
|
(22,241
|
)
|
(3,379
|
)
|
|||||||
|
Income (loss) before income tax expense (benefit)
|
(16,930
|
)
|
27,012
|
|
1,114
|
|
56,798
|
|
|||||||
|
Income tax expense (benefit)
|
76
|
|
(4
|
)
|
77
|
|
8
|
|
|||||||
|
Net income (loss)
|
$
|
(17,006
|
)
|
$
|
27,016
|
|
$
|
1,037
|
|
$
|
56,790
|
|
|||
|
Net income (loss) per common unit – basic
|
$
|
(0.15
|
)
|
$
|
0.37
|
|
$
|
0.01
|
|
$
|
0.78
|
|
|||
|
Net income (loss) per common unit – diluted
|
$
|
(0.15
|
)
|
$
|
0.37
|
|
$
|
0.01
|
|
$
|
0.78
|
|
|||
|
Weighted-average common units outstanding:
|
|||||||||||||||
|
Basic
|
113,283
|
|
73,123
|
|
93,206
|
|
73,123
|
|
|||||||
|
Diluted
|
113,283
|
|
73,131
|
|
93,206
|
|
73,131
|
|
|||||||
See accompanying notes to the condensed consolidated financial statements.
6
CVR PARTNERS, LP AND SUBSIDIARIES
CONDENSED CONSOLIDATED STATEMENTS OF COMPREHENSIVE INCOME (LOSS)
|
Three Months Ended
June 30, |
Six Months Ended
June 30, |
||||||||||||||
|
2016
|
2015
|
2016
|
2015
|
||||||||||||
|
(unaudited)
|
|||||||||||||||
|
(in thousands)
|
|||||||||||||||
|
Net income (loss)
|
$
|
(17,006
|
)
|
$
|
27,016
|
|
$
|
1,037
|
|
$
|
56,790
|
|
|||
|
Other comprehensive income (loss):
|
|||||||||||||||
|
Change in fair value of interest rate swaps
|
—
|
|
(38
|
)
|
—
|
|
(110
|
)
|
|||||||
|
Net loss reclassified into income on settlement of interest rate swaps
|
—
|
|
266
|
|
119
|
|
533
|
|
|||||||
|
Other comprehensive income
|
—
|
|
228
|
|
119
|
|
423
|
|
|||||||
|
Total comprehensive income (loss)
|
$
|
(17,006
|
)
|
$
|
27,244
|
|
$
|
1,156
|
|
$
|
57,213
|
|
|||
See accompanying notes to the condensed consolidated financial statements.
7
CVR PARTNERS, LP AND SUBSIDIARIES
CONDENSED CONSOLIDATED STATEMENT OF PARTNERS’ CAPITAL
|
Common Units
|
General
Partner
Interest
|
Accumulated
Other
Comprehensive
Income/(Loss)
|
Noncontrolling Interest
|
Total
|
||||||||||||||||||
|
Issued
|
Amount
|
|||||||||||||||||||||
|
(unaudited)
|
||||||||||||||||||||||
|
(in thousands, except unit data)
|
||||||||||||||||||||||
|
Balance at December 31, 2015
|
73,128,269
|
|
$
|
385,670
|
|
$
|
1
|
|
$
|
(119
|
)
|
$
|
—
|
|
$
|
385,552
|
|
|||||
|
Cash distributions to common unitholders – Affiliates
|
—
|
|
(21,017
|
)
|
—
|
|
—
|
|
—
|
|
(21,017
|
)
|
||||||||||
|
Cash distributions to common unitholders – Non-affiliates
|
—
|
|
(29,314
|
)
|
—
|
|
—
|
|
—
|
|
(29,314
|
)
|
||||||||||
|
Share-based compensation – Affiliates
|
—
|
|
(1
|
)
|
—
|
|
—
|
|
—
|
|
(1
|
)
|
||||||||||
|
Issuance of common units for the merger consideration
|
40,154,704
|
|
335,693
|
|
—
|
|
—
|
|
—
|
|
335,693
|
|
||||||||||
|
Noncontrolling interest
|
—
|
|
—
|
|
—
|
|
—
|
|
4,564
|
|
4,564
|
|
||||||||||
|
Contribution from affiliates
|
—
|
|
—
|
|
—
|
|
—
|
|
507
|
|
507
|
|
||||||||||
|
Purchase of noncontrolling interest
|
—
|
|
71
|
|
—
|
|
—
|
|
(5,071
|
)
|
(5,000
|
)
|
||||||||||
|
Net income
|
—
|
|
1,037
|
|
—
|
|
—
|
|
—
|
|
1,037
|
|
||||||||||
|
Other comprehensive income
|
—
|
|
—
|
|
—
|
|
119
|
|
—
|
|
119
|
|
||||||||||
|
Balance at June 30, 2016
|
113,282,973
|
|
$
|
672,139
|
|
$
|
1
|
|
$
|
—
|
|
$
|
—
|
|
$
|
672,140
|
|
|||||
See accompanying notes to the condensed consolidated financial statements.
8
CVR PARTNERS, LP AND SUBSIDIARIES
|
Six Months Ended
June 30, |
|||||||
|
2016
|
2015
|
||||||
|
(unaudited)
|
|||||||
|
(in thousands)
|
|||||||
|
Cash flows from operating activities:
|
|||||||
|
Net income
|
$
|
1,037
|
|
$
|
56,790
|
|
|
|
Adjustments to reconcile net income to net cash provided by operating activities:
|
|||||||
|
Depreciation and amortization
|
24,535
|
|
13,829
|
|
|||
|
Allowance for doubtful accounts
|
15
|
|
(16
|
)
|
|||
|
Amortization of deferred financing costs and original issue discount
|
378
|
|
479
|
|
|||
|
Amortization of debt fair value adjustment
|
1,250
|
|
—
|
|
|||
|
(Gain) loss on disposition of fixed assets
|
44
|
|
22
|
|
|||
|
Loss on extinguishment of debt
|
5,116
|
|
—
|
|
|||
|
Share-based compensation – Affiliates
|
899
|
|
1,136
|
|
|||
|
Share-based compensation
|
718
|
|
289
|
|
|||
|
Change in assets and liabilities:
|
|||||||
|
Accounts receivable
|
54
|
|
(3,245
|
)
|
|||
|
Inventories
|
34,615
|
|
(107
|
)
|
|||
|
Prepaid expenses and other current assets
|
2,604
|
|
2,020
|
|
|||
|
Other long-term assets
|
(263
|
)
|
(52
|
)
|
|||
|
Accounts payable
|
8,955
|
|
908
|
|
|||
|
Deferred revenue
|
(31,640
|
)
|
(11,702
|
)
|
|||
|
Accrued expenses and other current liabilities
|
(19,231
|
)
|
(4,395
|
)
|
|||
|
Other long-term liabilities
|
68
|
|
(2
|
)
|
|||
|
Net cash provided by operating activities
|
29,154
|
|
55,954
|
|
|||
|
Cash flows from investing activities:
|
|||||||
|
Capital expenditures
|
(11,869
|
)
|
(6,033
|
)
|
|||
|
Acquisition of CVR Nitrogen, LP, net of cash acquired
|
(63,869
|
)
|
—
|
|
|||
|
Proceeds from sale of assets
|
—
|
|
32
|
|
|||
|
Net cash used in investing activities
|
(75,738
|
)
|
(6,001
|
)
|
|||
9
|
Six Months Ended
June 30, |
|||||||
|
2016
|
2015
|
||||||
|
(unaudited)
|
|||||||
|
(in thousands)
|
|||||||
|
Cash flows from financing activities:
|
|||||||
|
Principal and premium payments on 2021 Notes
|
(320,539
|
)
|
—
|
|
|||
|
Principal payment on CRLLC Facility
|
(300,000
|
)
|
—
|
|
|||
|
Principal payments on long-term debt
|
(125,000
|
)
|
—
|
|
|||
|
Payment of revolving debt
|
(49,100
|
)
|
—
|
|
|||
|
Payment of financing costs
|
(6,528
|
)
|
—
|
|
|||
|
Proceeds on issuance of 2023 Notes, net of original issue discount
|
628,869
|
|
—
|
|
|||
|
Proceeds on CRLLC Facility
|
300,000
|
|
—
|
|
|||
|
Contribution from affiliate
|
507
|
|
—
|
|
|||
|
Cash distributions to common unitholders – Affiliates
|
(21,017
|
)
|
(33,471
|
)
|
|||
|
Cash distributions to common unitholders – Non-affiliates
|
(29,314
|
)
|
(29,415
|
)
|
|||
|
Purchase of noncontrolling interest
|
(5,000
|
)
|
—
|
|
|||
|
Net cash provided by (used in) financing activities
|
72,878
|
|
(62,886
|
)
|
|||
|
Net increase (decrease) in cash and cash equivalents
|
26,294
|
|
(12,933
|
)
|
|||
|
Cash and cash equivalents, beginning of period
|
49,967
|
|
79,914
|
|
|||
|
Cash and cash equivalents, end of period
|
$
|
76,261
|
|
$
|
66,981
|
|
|
|
Supplemental disclosures:
|
|||||||
|
Cash paid for income taxes, net
|
$
|
14
|
|
$
|
35
|
|
|
|
Cash paid for interest, net of capitalized interest of $401 in 2016
|
$
|
22,304
|
|
$
|
2,934
|
|
|
|
Non-cash investing and financing activities:
|
|||||||
|
Construction in progress additions included in accounts payable
|
$
|
5,065
|
|
$
|
2,048
|
|
|
|
Change in accounts payable related to construction in progress
|
$
|
(145
|
)
|
$
|
982
|
|
|
|
Reduction of proceeds from 2023 Notes from underwriting discount
|
$
|
16,131
|
|
$
|
—
|
|
|
|
Fair value of common units issued in a business combination
|
$
|
335,693
|
|
$
|
—
|
|
|
|
Fair value of debt assumed in a business combination
|
$
|
367,500
|
|
$
|
—
|
|
|
See accompanying notes to the condensed consolidated financial statements.
10
CVR PARTNERS, LP AND SUBSIDIARIES
NOTES TO THE CONDENSED CONSOLIDATED FINANCIAL STATEMENTS
June 30, 2016
(unaudited)
(1) Formation of the Partnership, Organization and Nature of Business
Organization
CVR Partners, LP (referred to as "CVR Partners" or the "Partnership") is a Delaware limited partnership, formed by CVR Energy, Inc. (together with its subsidiaries, but excluding the Partnership and its subsidiaries, "CVR Energy") to own, operate and grow its nitrogen fertilizer business. Nitrogen fertilizer is used by farmers to improve the yield and quality of their crops, primarily corn and wheat. The Partnership principally produces ammonia and urea ammonium nitrate ("UAN"), an aqueous solution of urea and ammonium nitrate. The Partnership's product sales are sold on a wholesale basis in North America.
The Partnership produces nitrogen fertilizer products at
two
manufacturing facilities, which are located in Coffeyville, Kansas (the "Coffeyville Facility") and East Dubuque, Illinois (the "East Dubuque Facility"). On April 1, 2016, the Partnership completed the merger (the "East Dubuque Merger") with CVR Nitrogen, LP (formerly known as East Dubuque Nitrogen Partners, L.P. and also formerly known as Rentech Nitrogen Partners, L.P.) ("CVR Nitrogen") and with CVR Nitrogen GP, LLC (formerly known as East Dubuque Nitrogen GP, LLC and also formerly known as Rentech Nitrogen GP, LLC) ("CVR Nitrogen GP"), whereby the Partnership acquired the East Dubuque Facility. See
Note 4 ("East Dubuque Merger")
for further discussion.
The Partnership's subsidiaries include Coffeyville Resources Nitrogen Fertilizers, LLC ("CRNF"), which owns and operates the Coffeyville Facility, and East Dubuque Nitrogen Fertilizers, LLC ("EDNF"), which owns and operates the East Dubuque Facility. Both facilities manufacture ammonia and are able to further upgrade to other nitrogen fertilizer products, principally UAN.
As of
June 30, 2016
, public security holders held approximately
66%
of the Partnership's outstanding limited partner interests and Coffeyville Resources, LLC ("CRLLC"), a wholly-owned subsidiary of CVR Energy, held approximately
34%
of the Partnership's outstanding limited partner interests and
100%
of the noneconomic general partner interest. As of
June 30, 2016
, Icahn Enterprises L.P. and its affiliates owned approximately
82%
of the shares of CVR Energy.
Management and Operations
CVR GP, LLC ("CVR GP" or the "general partner") manages and operates the Partnership. Common unitholders have only limited voting rights on matters affecting the Partnership. In addition, common unitholders have no right to elect the general partner's directors on an annual or continuing basis.
The Partnership is operated by a combination of the general partner's senior management team and CVR Energy's senior management team pursuant to a services agreement among CVR Energy, CVR GP and the Partnership. The various rights and responsibilities of the Partnership's partners are set forth in the limited partnership agreement. The Partnership also is party to a number of agreements with CVR Energy and CVR GP to regulate certain business relations between the Partnership and the other parties thereto. See
Note 14 ("Related Party Transactions")
for further discussion.
(2) Basis of Presentation
The accompanying Partnership condensed consolidated financial statements include the accounts of CVR Partners and its subsidiaries. All intercompany accounts and transactions have been eliminated in consolidation. The accompanying condensed consolidated financial statements were prepared in accordance with U.S. generally accepted accounting principles ("GAAP") and in accordance with the rules and regulations of the Securities and Exchange Commission ("SEC"). These condensed consolidated financial statements should be read in conjunction with the
December 31, 2015
audited consolidated financial statements and notes thereto included in CVR Partners’ Annual Report on Form 10-K for the year ended
December 31, 2015
, which was filed with the SEC on February 18, 2016 (the "2015 Form 10-K").
The condensed consolidated financial statements include certain selling, general and administrative expenses and direct operating expenses that CVR Energy and its subsidiaries incurred on behalf of the Partnership. These related party transactions are governed by
11
CVR PARTNERS, LP AND SUBSIDIARIES
NOTES TO THE CONDENSED CONSOLIDATED FINANCIAL STATEMENTS (Continued)
June 30, 2016
(unaudited)
the services agreement. See
Note 14 ("Related Party Transactions")
for additional discussion of the services agreement and billing and allocation of certain costs.
In the opinion of the Partnership’s management, the accompanying condensed consolidated financial statements and related notes reflect all adjustments (consisting only of normal recurring adjustments) that are necessary to fairly present the financial position of the Partnership as of
June 30, 2016
and
December 31, 2015
, the results of operations and comprehensive income (loss) of the Partnership for the
three and six
months ended
June 30, 2016
and
2015
, the cash flows of the Partnership for the
six
months ended
June 30, 2016
and
2015
and the changes in partners’ capital for the Partnership for the
six
months ended
June 30, 2016
.
The preparation of condensed consolidated financial statements in conformity with GAAP requires management to make certain estimates and assumptions that affect the reported amounts of assets, liabilities, revenues, expenses and the disclosure of contingent assets and liabilities. Actual results could differ from those estimates. Results of operations and cash flows for the interim periods presented are not necessarily indicative of the results that will be realized for the year ending
December 31, 2016
or any other interim or annual period.
Planned Major Maintenance Costs
The direct-expense method of accounting is used for maintenance activities, including planned major maintenance activities and other less extensive shutdowns. Maintenance costs are recognized as expense when maintenance services are performed. Planned major maintenance activities generally occur every
two
to
three years
. During the second quarter of 2016, the East Dubuque Facility completed a major scheduled turnaround. Overall results were negatively impacted due to the lost production during the downtime that resulted in reduced sales and certain reduced variable expenses included in cost of product sold (exclusive of depreciation and amortization) and direct operating expenses (exclusive of depreciation and amortization). Costs of approximately
$6.6 million
, associated with the 2016 East Dubuque turnaround, are included in direct operating expenses (exclusive of depreciation and amortization) in the Condensed Consolidated Statements of Operations for both the three and
six
months ended
June 30, 2016
.
Cost Classifications
Cost of product sold (exclusive of depreciation and amortization) consist primarily of freight and distribution expenses, feedstock expenses, purchased ammonia and purchased hydrogen.
Direct operating expenses (exclusive of depreciation and amortization) consist primarily of energy and other utility costs, direct costs of labor, property taxes, plant-related maintenance services and environmental and safety compliance costs as well as catalyst and chemical costs. Direct operating expenses also include allocated share-based compensation from CVR Energy and its subsidiaries, as discussed in
Note 5 ("Share‑Based Compensation")
.
Selling, general and administrative expenses (exclusive of depreciation and amortization) consist primarily of direct and allocated legal expenses, treasury, accounting, marketing, human resources, information technology and maintaining the corporate offices. Selling, general and administrative expenses also include allocated share-based compensation from CVR Energy and its subsidiaries, as discussed in
Note 5 ("Share‑Based Compensation")
.
12
CVR PARTNERS, LP AND SUBSIDIARIES
NOTES TO THE CONDENSED CONSOLIDATED FINANCIAL STATEMENTS (Continued)
June 30, 2016
(unaudited)
Cost of product sold, direct operating expenses, and selling, general and administrative expenses are presented exclusive of depreciation and amortization on the Condensed Consolidated Statements of Operations. Depreciation and amortization consisted of the following:
|
Three Months Ended
June 30, |
Six Months Ended
June 30, |
||||||||||||||
|
2016
|
2015
|
2016
|
2015
|
||||||||||||
|
(in millions)
|
|||||||||||||||
|
Depreciation and amortization excluded from direct operating expenses
|
$
|
17.3
|
|
$
|
6.9
|
|
$
|
24.1
|
|
$
|
13.5
|
|
|||
|
Depreciation and amortization excluded from cost of product sold
|
0.2
|
|
0.1
|
|
0.3
|
|
0.3
|
|
|||||||
|
Depreciation and amortization excluded from selling, general and administrative expenses
|
0.1
|
|
—
|
|
0.1
|
|
—
|
|
|||||||
|
|
$
|
17.6
|
|
$
|
7.0
|
|
$
|
24.5
|
|
$
|
13.8
|
|
|||
Income Taxes
CVR Partners is treated as a partnership for U.S. federal income tax purposes. The income tax liability of the common unitholders is not reflected in the consolidated financial statements of the Partnership. Generally, each common unitholder is required to take into account its respective share of CVR Partners' income, gains, loss and deductions. The Partnership is not subject to income taxes, except for a franchise tax in the State of Texas and a replacement tax in the State of Illinois.
CVR Nitrogen Holdings, LLC, a corporate entity wholly owned by CVR Partners, generates income or loss based on its own activities. As a corporation, the entity is subject to federal and state income taxes.
Under the Financial Accounting Standards Board ("FASB") Accounting Standards Codification Topic ("ASC") 740,
Income Taxes
, both the Partnership (for taxes based on income such as the Texas franchise tax and the Illinois replacement tax) and the corporate entity account for income taxes using the asset and liability method under which deferred income taxes are recognized for the future tax effects of temporary differences between the financial statement carrying amounts and the tax basis of existing assets and liabilities using the enacted statutory tax rates in effect at the end of the period. A valuation allowance for deferred tax assets is recorded when it is more likely than not that the benefit from the deferred tax asset will not be realized. When applicable, penalties and interest related to uncertain tax positions are recorded as income tax expense.
(3) Recent Accounting Pronouncements
In May 2014, the FASB issued Accounting Standard Update ("ASU") No. 2014-09,
"Revenue from Contracts with Customers"
, which requires an entity to recognize the amount of revenue to which it expects to be entitled for the transfer of promised goods or services to customers. The standard was originally effective for interim and annual periods beginning after December 15, 2016 and permits the use of either the retrospective or cumulative effect transition method. Early adoption is not permitted. On July 9, 2015, the FASB approved a one-year deferral of the effective date making the standard effective for interim and annual periods beginning after December 15, 2017. The FASB will continue to permit entities to adopt the standard on the original effective date if they choose. The Partnership has not yet selected a transition method and is currently evaluating the standard and the impact on its consolidated financial statements and footnote disclosures.
In April 2015, the FASB issued ASU 2015-03,
"Simplifying the Presentation of Debt Issuance Costs"
("ASU 2015-03")
.
The new standard requires that all costs incurred to issue debt be presented in the balance sheet as a direct deduction from the carrying value of the debt. The standard is effective for interim and annual periods beginning after December 15, 2015 and is required to be applied on a retrospective basis. Early adoption was permitted. The Partnership adopted ASU 2015-03 as of January 1, 2016 and applied the standard retrospectively to the Condensed Consolidated Balance Sheet. Refer to
Note 11 ("Debt")
for further details.
In February 2016, the FASB issued ASU 2016-02, "
Leases"
("ASU 2016-02")
.
The new standard revises accounting for operating leases by a lessee, among other changes, and requires a lessee to recognize a liability to make lease payments and an asset representing its right to use the underlying asset for the lease term in the balance sheet. The standard is effective for the first interim and annual periods beginning after December 15, 2018, with early adoption permitted. At adoption, ASU 2016-02 will be applied using a modified
13
CVR PARTNERS, LP AND SUBSIDIARIES
NOTES TO THE CONDENSED CONSOLIDATED FINANCIAL STATEMENTS (Continued)
June 30, 2016
(unaudited)
retrospective approach. The Partnership is currently evaluating the standard and the impact on its consolidated financial statements and footnote disclosures.
(4) East Dubuque Merger
On April 1, 2016, the Partnership completed the East Dubuque Merger as contemplated by the Agreement and Plan of Merger, dated as of August 9, 2015 (the "Merger Agreement"), whereby the Partnership acquired CVR Nitrogen and CVR Nitrogen GP. Pursuant to the East Dubuque Merger, the Partnership acquired the East Dubuque Facility.
CVR Nitrogen was required to sell or spin off its facility located in Pasadena, Texas (the "Pasadena Facility") as a condition to closing of the East Dubuque Merger. On March 14, 2016, CVR Nitrogen completed the sale of
100%
of the issued and outstanding membership interests of its subsidiary that owned the Pasadena Facility to a third party. Holders of common units representing limited partner interests in CVR Nitrogen ("CVR Nitrogen common units") of record as of March 28, 2016 received consideration for the Pasadena Facility and may receive additional consideration in the future according to the terms of the purchase agreement. The Partnership did not receive and will not receive any consideration relating to the sale of the Pasadena Facility.
Under the terms of the Merger Agreement, holders of CVR Nitrogen common units eligible to receive consideration received
1.04
common units (the "unit consideration") representing limited partner interests in CVR Partners ("CVR Partners common units") and
$2.57
in cash, without interest, (the "cash consideration" and together with the unit consideration, the "merger consideration") for each CVR Nitrogen common unit. Pursuant to the Merger Agreement, CVR Partners issued approximately
40.2 million
CVR Partners common units and paid approximately
$99.2 million
in cash consideration to CVR Nitrogen common unitholders and certain holders of CVR Nitrogen phantom units discussed below.
Phantom units granted and outstanding under CVR Nitrogen’s equity plans and held by an employee who continued in the employment of a CVR Partners-affiliated entity upon closing of the East Dubuque Merger were canceled and replaced with new incentive awards of substantially equivalent value and on similar terms. See
Note 5 ("Share‑Based Compensation")
for further discussion. Each phantom unit granted and outstanding and held by (i) an employee who did not continue in employment of a CVR Partners-affiliated entity, or (ii) a director of CVR Nitrogen GP, upon closing of the East Dubuque Merger, vested in full and the holders thereof received the merger consideration.
In accordance with the FASB’s ASC Topic 805 —
Business Combinations
("ASC 805"), the Partnership accounted for the East Dubuque Merger as an acquisition of a business with CVR Partners as the acquirer. ASC 805 requires that the consideration transferred be measured at the current market price at the date of the closing of the East Dubuque Merger. The aggregate merger consideration was approximately
$802.4 million
, including the fair value of CVR Partners common units issued of
$335.7 million
, a cash contribution of
$99.2 million
and
$367.5 million
fair value of assumed debt. The East Dubuque Facility contributed net sales of
$59.7 million
and an operating loss of
$8.2 million
to our Condensed Consolidated Statement of Operations for both the three and
six
months ended
June 30, 2016
.
In March 2016, CVR Energy purchased
400,000
CVR Nitrogen common units, representing approximately
1%
of the outstanding CVR Nitrogen limited partner interests. CVR Energy did not receive merger consideration for these designated CVR Nitrogen common units. The Partnership recorded the noncontrolling interest fair value of
$4.6 million
in the purchase price consideration on April 1, 2016. Subsequent to the East Dubuque Merger, CVR Energy contributed
$0.5 million
to CVR Nitrogen, and the Partnership purchased the
400,000
CVR Nitrogen common units from CVR Energy during the second quarter of 2016 for
$5.0 million
. The transaction eliminated the noncontrolling interest, and the net impact of
$0.1 million
was recorded as an increase to partners' capital on the Condensed Consolidated Statement of Partners' Capital for the
six
months ended
June 30, 2016
. The Partnership owns
100%
of the outstanding limited partners interests of CVR Nitrogen as of
June 30, 2016
.
14
CVR PARTNERS, LP AND SUBSIDIARIES
NOTES TO THE CONDENSED CONSOLIDATED FINANCIAL STATEMENTS (Continued)
June 30, 2016
(unaudited)
Purchase Price Consideration
A summary of the total purchase price is as follows:
|
Purchase Price
|
||||
|
(in millions)
|
||||
|
Fair value of CVR Partners common units issued, as of the close of the East Dubuque Merger
|
$
|
335.7
|
|
|
|
Cash payment to CVR Nitrogen common unitholders and certain phantom unitholders
|
99.2
|
|
||
|
Fair value of consideration transferred
|
434.9
|
|
||
|
Fair value of noncontrolling interest for parent affiliate units (1)
|
4.6
|
|
||
|
Total purchase price consideration to be allocated
|
$
|
439.5
|
|
|
The fair value of the unit consideration was determined as follows:
|
Fair Value of Unit Consideration
|
||||
|
(units in thousands)
|
||||
|
CVR Nitrogen common units outstanding, as of the close of the East Dubuque Merger
|
38,985
|
|
||
|
Less: Noncontrolling interest from parent affiliate units (1)
|
400
|
|
||
|
Net units subject to merger consideration
|
38,585
|
|
||
|
Unit consideration per CVR Nitrogen common unit
|
1.04
|
|
||
|
Number of CVR Partners common units to be issued for merger consideration
|
40,129
|
|
||
|
Number of CVR Partners common units to be issued for CVR Nitrogen phantom units issued to noncontinuing employees and CVR Nitrogen board members (2)
|
26
|
|
||
|
Total number of CVR Partners units to be issued
|
40,155
|
|
||
|
Fair value per CVR Partners common unit, as of the close of the East Dubuque Merger
|
$
|
8.36
|
|
|
|
Fair value of CVR Partners common units issued (in millions)
|
$
|
335.7
|
|
|
_____________
|
(1)
|
See above for discussion of parent affiliate units.
|
|
(2)
|
As discussed above, each phantom unit granted and outstanding and held by (i) an employee who did not continue in the employment of a CVR Partners-affiliated entity, or (ii) a director of CVR Nitrogen GP, upon closing of the East Dubuque Merger, vested in full and the holders thereof received the merger consideration.
|
CVR Nitrogen’s debt arrangements that remained in place after the closing date of the East Dubuque Merger included
$320.0 million
of its
6.5%
notes due 2021 (the "2021 Notes"). The majority of the 2021 Notes were repurchased in June 2016, as discussed further in
Note 11 ("Debt")
.
Immediately prior to the East Dubuque Merger, CVR Nitrogen also had outstanding balances under a credit agreement with Wells Fargo Bank, National Association, as successor-in-interest by assignment from General Electric Company, as administrative agent (the "Wells Fargo Credit Agreement"). The Wells Fargo Credit Agreement consisted of a
$50.0 million
senior secured revolving credit facility with a
$10.0 million
letter of credit sublimit. In connection with the closing of the East Dubuque Merger, the Partnership paid
$49.4 million
for the outstanding balance, accrued interest and fees under the Wells Fargo Credit Agreement, and the Wells Fargo Credit Agreement was canceled.
15
CVR PARTNERS, LP AND SUBSIDIARIES
NOTES TO THE CONDENSED CONSOLIDATED FINANCIAL STATEMENTS (Continued)
June 30, 2016
(unaudited)
Preliminary Purchase Price Allocation
Under the acquisition method of accounting, the purchase price was allocated to CVR Nitrogen's net tangible assets based on their fair values as of April 1, 2016. The Partnership has obtained a preliminary independent appraisal of the net assets acquired. Determining the fair value of net tangible assets requires judgment and involves the use of significant estimates and assumptions. The Partnership based its fair value estimates on assumptions it believes to be reasonable but are inherently uncertain. Although the Partnership believes the estimates of fair value of the assets and liabilities acquired are accurate, these estimates are preliminary and are subject to change during the measurement period. This measurement period may extend up to one year from the acquisition date.
The following table, set forth below, displays the estimated purchase price allocated to CVR Nitrogen's net tangible assets based on their fair values as of April 1, 2016. There were
no
identifiable intangible assets.
|
Purchase Price Allocation
|
||||
|
(in millions)
|
||||
|
Cash
|
$
|
35.4
|
|
|
|
Accounts receivable
|
8.9
|
|
||
|
Inventories
|
49.5
|
|
||
|
Prepaid expenses and other current assets (1)
|
5.2
|
|
||
|
Property, plant and equipment
|
774.9
|
|
||
|
Other long-term assets
|
1.1
|
|
||
|
Deferred revenue
|
(29.8
|
)
|
||
|
Other current liabilities (2)
|
(37.0
|
)
|
||
|
Long-term debt
|
(367.5
|
)
|
||
|
Other long-term liabilities
|
(1.2
|
)
|
||
|
Total fair value of net assets acquired
|
439.5
|
|
||
|
Less: Cash acquired
|
35.4
|
|
||
|
Total consideration transferred, net of cash acquired
|
$
|
404.1
|
|
|
_____________
|
(1)
|
Includes
$4.0 million
for the estimated fair value of insurance proceeds related to an event that occurred prior to the East Dubuque Merger. The Partnership received
$4.0 million
during the three months ended
June 30, 2016
, which was included in operating activities on the Consolidated Statement of Cash Flows for the
six
months ended
June 30, 2016
.
|
|
(2)
|
Includes an assumed liability of
$11.8 million
for third-party financial advisory services provided to CVR Nitrogen that became payable upon the closing of the East Dubuque Merger, and was subsequently paid by CVR Partners on April 1, 2016, which was included in operating activities on the Consolidated Statement of Cash Flows for the
six
months ended
June 30, 2016
.
|
Pro Forma Financial Information
The summary pro forma financial information for the periods presented below gives effect to the East Dubuque Merger as if it had occurred at January 1, 2015. The pro forma financial information for all periods presented were adjusted to give effect to pro forma events that are i) directly attributable to the East Dubuque Merger, ii) factually supportable and iii) expected to have a continuing impact on the consolidated results of operations.
Pro forma net income (loss) has been adjusted to exclude
$1.2 million
and
$0.5 million
, respectively, of merger-related costs incurred during the three months ended June 30, 2016 and 2015 and to exclude
$3.2 million
and
$0.5 million
, respectively, of merger-related costs incurred during the six months ended June 30, 2016 and 2015. Pro forma net income (loss) has also been adjusted to
16
CVR PARTNERS, LP AND SUBSIDIARIES
NOTES TO THE CONDENSED CONSOLIDATED FINANCIAL STATEMENTS (Continued)
June 30, 2016
(unaudited)
exclude
$13.0 million
of nonrecurring expenses related to the fair value adjustment to acquisition-date inventory and deferred revenue for both the three and six months ended June 30, 2016.
Incremental interest expense for financing the cash merger consideration and financing the payoff of the Wells Fargo Credit Agreement has also been adjusted for in the pro forma financial information, as well as incremental depreciation resulting from increased fair value of the property, plant and equipment as noted in the preliminary purchase price allocation.
The summary pro forma financial information is for informational purposes only and does not purport to represent what the Partnership's consolidated results of operations actually would have been if the East Dubuque Merger had occurred at any date, and such data does not purport to project the Partnership's results of operations for any future period. The basic and diluted units outstanding used to calculate the pro forma net income (loss) per unit amounts presented below have been adjusted to assume units issued at the closing of the East Dubuque Merger were outstanding since January 1, 2015.
|
Three Months Ended June 30,
|
Six Months Ended
June 30, |
|||||||||||||||
|
2016
|
2015
|
2016
|
2015
|
|||||||||||||
|
(in thousands, except per unit data)
|
||||||||||||||||
|
Net sales
|
$
|
119,797
|
|
$
|
152,875
|
|
$
|
227,737
|
|
$
|
282,677
|
|
||||
|
Net income (loss)
|
(2,747
|
)
|
52,610
|
|
12,182
|
|
81,102
|
|
||||||||
|
Net income (loss) per common unit, basic and diluted
|
(0.02
|
)
|
0.46
|
|
0.11
|
|
0.72
|
|
||||||||
Expenses Associated with the East Dubuque Merger
During the three and
six
months ended
June 30, 2016
, the Partnership incurred
$1.2 million
and
$2.5 million
, respectively, of legal and other professional fees and other merger-related expenses, which were included in selling, general and administrative expenses (exclusive of depreciation and amortization).
(5) Share‑Based Compensation
Certain employees of CVR Partners and employees of CVR Energy who perform services for the Partnership under the services agreement with CVR Energy participate in equity-based compensation plans of CVR Partners' affiliates. Accordingly, CVR Partners has recorded compensation expense for these plans. All compensation expense related to these plans for full-time employees of CVR Partners has been allocated
100%
to the Partnership. For employees of CVR Energy, the Partnership records share-based compensation relative to the percentage of time spent by each employee providing services to the Partnership as compared to the total calculated share-based compensation by CVR Energy. The Partnership is not responsible for payment of the allocated share-based compensation for certain plans. Allocated expense amounts related to plans for which the Partnership is not responsible for payment are immaterial and are reflected as an increase or decrease to partners' capital.
Long-Term Incentive Plan – CVR Energy
CVR Energy has a Long-Term Incentive Plan ("CVR Energy LTIP") that permits the grant of options, stock appreciation rights, restricted shares, restricted stock units, dividend equivalent rights, share awards and performance awards (including performance share units, performance units and performance based restricted stock). As of
June 30, 2016
, performance units remain outstanding under the CVR Energy LTIP. Individuals who are eligible to receive awards and grants under the CVR Energy LTIP include CVR Energy’s or its subsidiaries’ (including the Partnership) employees, officers, consultants and directors.
Performance Unit Awards
In December 2015, CVR Energy entered into a performance unit award agreement (the "2015 Performance Unit Award Agreement") with its Chief Executive Officer. Compensation cost for the 2015 Performance Unit Award Agreement will be recognized over the performance cycle from January 1, 2016 to December 31, 2016. The performance unit award represents the right to receive, upon vesting, a cash payment equal to a defined threshold in accordance with the award agreement, multiplied by a performance factor
17
CVR PARTNERS, LP AND SUBSIDIARIES
NOTES TO THE CONDENSED CONSOLIDATED FINANCIAL STATEMENTS (Continued)
June 30, 2016
(unaudited)
that is based upon the achievement of certain operating objectives. The Partnership will be responsible for reimbursing CVR Energy for its allocated portion of the performance unit award. Assuming a target performance threshold and that the allocation of costs from CVR Energy remains consistent with the allocation percentages in place at
June 30, 2016
, there was approximately
$0.3 million
of total unrecognized compensation cost related to the 2015 Performance Unit Award Agreement to be recognized over a weighted-average period of approximately
0.5 years
. Compensation expense recorded for the three and
six
months ended
June 30, 2016
related to the awards was approximately
$0.1 million
and
$0.2 million
, respectively. The Partnership will be responsible for reimbursing CVR Energy for its allocated portion of the awards. As of
June 30, 2016
, the Partnership had a liability of
$0.2 million
, for its allocated portion of the 2015 Performance Unit Award Agreement, which is recorded in accrued expenses and other current liabilities on the Condensed Consolidated Balance Sheet.
Incentive Unit Awards – CVR Energy
CVR Energy has granted awards of incentive units and distribution equivalent rights to certain employees of CRLLC, CVR Energy and the Partnership's general partner who provide shared services to CVR Energy and its subsidiaries (including the Partnership). The awards are generally graded-vesting awards, which are expected to vest over
three
years, with one-third of the award vesting each year. Compensation expense is recognized on a straight-line basis over the vesting period of the respective tranche of the award. Each incentive unit and distribution equivalent right represents the right to receive, upon vesting, a cash payment equal to (i) the average fair market value of
one
common unit of CVR Refining, LP ("CVR Refining") in accordance with the award agreement, plus (ii) the per unit cash value of all distributions declared and paid by CVR Refining from the grant date to and including the vesting date. The awards, which are liability-classified, are remeasured at each subsequent reporting date until they vest.
Assuming the allocation of costs from CVR Energy remains consistent with the allocation percentages in place at
June 30, 2016
, there was approximately
$0.7 million
of total unrecognized compensation cost related to the incentive units and associated distribution equivalent rights to be recognized over a weighted-average period of approximately
1.2
years. Inclusion of a vesting table would not be meaningful due to changes in allocation percentages that may occur from time to time. The unrecognized compensation expense has been determined by the number of incentive units and respective allocation percentage for individuals for whom, as of
June 30, 2016
, compensation expense has been allocated to the Partnership. Compensation expense recorded for the three months ended
June 30, 2016
and
2015
related to the awards was nominal and approximately
$0.2 million
, respectively. Compensation expense recorded for the
six
months ended
June 30, 2016
and
2015
related to the awards was nominal and approximately
$0.4 million
, respectively. The Partnership will be responsible for reimbursing CVR Energy for its allocated portion of the awards.
As of both
June 30, 2016
and
December 31, 2015
, the Partnership had a liability of
$0.5 million
for its allocated portion of non-vested incentive units and associated distribution equivalent rights, which is recorded in accrued expenses and other current liabilities on the Condensed Consolidated Balance Sheets.
18
CVR PARTNERS, LP AND SUBSIDIARIES
NOTES TO THE CONDENSED CONSOLIDATED FINANCIAL STATEMENTS (Continued)
June 30, 2016
(unaudited)
Long-Term Incentive Plan – CVR Partners
The Partnership has a long-term incentive plan ("CVR Partners LTIP") that provides for the grant of options, unit appreciation rights, distribution equivalent rights, restricted units, phantom units and other unit-based awards, each in respect of common units. Individuals eligible to receive awards pursuant to the CVR Partners LTIP include (i) employees of the Partnership and its subsidiaries, (ii) employees of the general partner, (iii) members of the board of directors of the general partner, and (iv) certain CVR Partners' parent's employees, consultants and directors who perform services for the benefit of the Partnership.
Through the CVR Partners LTIP, phantom unit awards outstanding include awards granted to employees of both the Partnership and the general partner. Phantom unit awards made to employees of the general partner are considered non-employee equity based-awards. The phantom unit awards outstanding vest over a
three
-year period and are required to be remeasured each reporting period until they vest. The maximum number of common units issuable under the CVR Partners LTIP is
5,000,000
. As of
June 30, 2016
, there were
4,820,215
common units available for issuance under the CVR Partners LTIP. As all phantom unit awards discussed below are cash settled awards, they do not reduce the number of common units available for issuance.
Certain Units and Phantom Units Awards
Awards of phantom units and distribution equivalent rights have been granted to certain employees of the Partnership and its subsidiaries' employees and the employees of the general partner. The awards are generally graded-vesting awards, which are expected to vest over
three
years with one-third of the award vesting each year. Compensation expense is recognized on a straight-line basis over the vesting period of the respective tranche of the award. Each phantom unit and distribution equivalent right represents the right to receive, upon vesting, a cash payment equal to (i) the average fair market value of
one
unit of the Partnership's common units in accordance with the award agreement, plus (ii) the per unit cash value of all distributions declared and paid by the Partnership from the grant date to and including the vesting date. The awards, which are liability-classified, are remeasured at each subsequent reporting date until they vest.
In connection with the East Dubuque Merger as described in
Note 4 ("East Dubuque Merger")
,
195,980
phantom units were granted to certain CVR Nitrogen employees. A related liability of
$0.6 million
was recorded as part of the opening balance sheet and included in personnel accruals in the purchase price allocation in
Note 4 ("East Dubuque Merger")
. Subsequent to the East Dubuque Merger,
58,730
awards were subject to an accelerated vesting date and were paid in full resulting in the early recognition of
$0.3 million
as compensation expense in selling, general and administrative expenses (exclusive of depreciation and amortization).
A summary of the phantom unit activity during the
six
months ended
June 30, 2016
is presented below:
|
Phantom Units
|
Weighted-Average
Grant Date Fair Value |
|||||
|
Non-vested at January 1, 2016
|
391,903
|
|
$
|
8.71
|
|
|
|
Granted
|
199,455
|
|
8.07
|
|
||
|
Vested
|
(58,730
|
)
|
8.08
|
|
||
|
Forfeited
|
(5,975
|
)
|
8.96
|
|
||
|
Non-vested at June 30, 2016
|
526,653
|
|
$
|
8.54
|
|
|
Unrecognized compensation expense associated with the unvested phantom units at
June 30, 2016
was approximately
$2.6 million
and is expected to be recognized over a weighted average period of
1.5
years. Compensation expense recorded for the three months ended
June 30, 2016
and
2015
related to the awards under the CVR Partners LTIP was approximately
$0.8 million
and
$0.4 million
, respectively. Compensation expense recorded for the
six
months ended
June 30, 2016
and
2015
related to the awards under the CVR Partners LTIP was approximately
$1.3 million
and
$1.0 million
, respectively. Compensation expense related to the awards to employees of the Partnership and its subsidiaries under the CVR Partners LTIP has been recorded in selling, general and administrative expenses (exclusive of depreciation and amortization) - third parties and direct operating expenses (exclusive of depreciation and amortization) - third parties. Compensation expense related to the awards issued to employees of the general partner under the CVR Partners LTIP has been recorded in selling, general and administrative expenses (exclusive of depreciation and
19
CVR PARTNERS, LP AND SUBSIDIARIES
NOTES TO THE CONDENSED CONSOLIDATED FINANCIAL STATEMENTS (Continued)
June 30, 2016
(unaudited)
amortization) - affiliates and direct operating expenses (exclusive of depreciation and amortization) - affiliates. As of
June 30, 2016
and
December 31, 2015
the Partnership had a liability of
$2.2 million
and
$0.7 million
, respectively, for cash settled non-vested phantom unit awards and associated distribution equivalent rights, which is recorded in personnel accruals on the Condensed Consolidated Balance Sheets.
Performance-Based Phantom Unit Award
In May 2014, the Partnership entered into a Phantom Unit Agreement with Mark A. Pytosh, the Chief Executive Officer and President of the general partner, that included performance-based phantom units and distribution equivalent rights. Compensation cost for these awards is being recognized over the performance cycles of May 1, 2014 to December 31, 2014, January 1, 2015 to December 31, 2015 and January 1, 2016 to December 31, 2016, as the services are provided. Each phantom unit and distribution equivalent right represents the right to receive, upon vesting, a cash payment equal to (i) the average closing price of the Partnership's common units in accordance with the agreement, multiplied by a performance factor that is based upon the level of the Partnership’s production of UAN, and (ii) the per unit cash value of all distributions declared and paid by the Partnership from the grant date to and including the vesting date. Compensation expense recorded for the three months ended
June 30, 2016
and
2015
related to the awards was nominal. Compensation expense for the
six
months ended
June 30, 2016
and
2015
related to the awards was approximately
$52,000
and
$39,000
, respectively. Based on current estimates of performance thresholds for the remaining performance cycles, unrecognized compensation expense and the liability associated with the unvested phantom units as of
June 30, 2016
was
$0.1 million
. The unrecognized compensation expense and the liability associated with the unvested phantom units as of
December 31, 2015
were nominal.
(6) Inventories
Inventories consisted of the following:
|
|
June 30,
2016 |
December 31,
2015 |
|||||
|
(in thousands)
|
|||||||
|
Finished goods
|
$
|
9,317
|
|
$
|
9,589
|
|
|
|
Raw materials and precious metals
|
10,089
|
|
9,055
|
|
|||
|
Parts and supplies
|
33,707
|
|
18,885
|
|
|||
|
Total inventories
|
$
|
53,113
|
|
$
|
37,529
|
|
|
20
CVR PARTNERS, LP AND SUBSIDIARIES
NOTES TO THE CONDENSED CONSOLIDATED FINANCIAL STATEMENTS (Continued)
June 30, 2016
(unaudited)
(7) Property, Plant and Equipment
A summary of costs and accumulated depreciation for property, plant and equipment is as follows:
|
|
June 30,
2016 |
December 31,
2015 |
|||||
|
(in thousands)
|
|||||||
|
Land and improvements
|
$
|
12,958
|
|
$
|
5,441
|
|
|
|
Buildings and improvements
|
14,529
|
|
3,049
|
|
|||
|
Machinery and equipment
|
1,337,487
|
|
574,326
|
|
|||
|
Automotive equipment
|
529
|
|
448
|
|
|||
|
Furniture and fixtures
|
1,280
|
|
918
|
|
|||
|
Railcars
|
16,265
|
|
16,315
|
|
|||
|
Construction in progress
|
5,609
|
|
1,641
|
|
|||
|
$
|
1,388,657
|
|
$
|
602,138
|
|
||
|
Less: Accumulated depreciation
|
234,089
|
|
209,005
|
|
|||
|
Total property, plant and equipment, net
|
$
|
1,154,568
|
|
$
|
393,133
|
|
|
Capitalized interest recognized as a reduction of interest expense was
$0.4 million
and
$0
for the three and six months ended
June 30, 2016
and
2015
, respectively.
(8) Partners’ Capital and Partnership Distributions
The Partnership has
two
types of partnership interests outstanding:
|
•
|
common units; and
|
|
•
|
a general partner interest, which is not entitled to any distributions, and which is held by the general partner.
|
As of
June 30, 2016
, the Partnership had a total of
113,282,973
common units issued and outstanding, of which
38,920,000
common units were owned by CRLLC, representing approximately
34%
of the total Partnership common units outstanding.
The board of directors of the Partnership's general partner has a policy for the Partnership to distribute all available cash generated on a quarterly basis. Cash distributions will be made to the common unitholders of record on the applicable record date, generally within
60 days
after the end of each quarter. Available cash for each quarter will be determined by the board of directors of the general partner following the end of such quarter.
Available cash begins with Adjusted EBITDA reduced for cash needed for (i) net cash interest expense (excluding capitalized interest) and debt service and other contractual obligations; (ii) maintenance capital expenditures; and (iii) to the extent applicable, major scheduled turnaround expenses, reserves for future operating or capital needs that the board of directors of the general partner deems necessary or appropriate, and expenses associated with the East Dubuque Merger, if any. Adjusted EBITDA is defined as EBITDA (net income before interest expense, net, income tax expenses, depreciation and amortization) further adjusted for the impact of non-cash share-based compensation, and, when applicable, major scheduled turnaround expense, loss on disposition of assets and expenses associated with the East Dubuque Merger. Available cash for distribution may be increased by the release of previously established cash reserves, if any, at the discretion of the board of directors of the general partner, and available cash is increased by the business interruption insurance proceeds and the impact of purchase accounting. Actual distributions are set by the board of directors of the general partner. The board of directors of the general partner may modify the cash distribution policy at any time, and the partnership agreement does not require the board of directors of the general partner to make distributions at all.
21
CVR PARTNERS, LP AND SUBSIDIARIES
NOTES TO THE CONDENSED CONSOLIDATED FINANCIAL STATEMENTS (Continued)
June 30, 2016
(unaudited)
The following is a summary of cash distributions paid to the Partnership's unitholders during 2016 for the respective quarters to which the distributions relate:
|
December 31,
2015 |
March 31,
2016
(1)
|
Total Cash Distributions
Paid in 2016
|
|||||||||
|
($ in millions, except per common unit amounts)
|
|||||||||||
|
Amount paid to CRLLC
|
$
|
10.5
|
|
$
|
10.5
|
|
$
|
21.0
|
|
||
|
Amount paid to public unitholders
|
9.2
|
|
20.1
|
|
29.3
|
|
|||||
|
Total amount paid
|
$
|
19.7
|
|
$
|
30.6
|
|
$
|
50.3
|
|
||
|
Per common unit
|
$
|
0.27
|
|
$
|
0.27
|
|
$
|
0.54
|
|
||
|
Common units outstanding (in thousands)
|
73,128
|
|
113,283
|
|
|||||||
_____________________________
(1) The distribution per common unit for the three months ended March 31, 2016 is calculated based on the post-merger common units outstanding.
See Note 16 ("Subsequent Events")
for further information on the Partnership's second quarter of 2016 distribution.
(9) Net Income (Loss) per Common Unit
The Partnership's net income (loss) is allocated wholly to the common units, as the general partner does not have an economic interest. Basic and diluted net income (loss) per common unit is calculated by dividing net income (loss) by the weighted-average number of common units outstanding during the period and, when applicable, gives effect to certain units granted under the CVR Partners LTIP. The common units issued during the period are included on a weighted-average basis for the days in which they were outstanding.
(10) Accrued Expenses and Other Current Liabilities
Accrued expenses and other current liabilities were as follows:
|
|
As of
June 30, 2016 |
As of
December 31, 2015 |
|||||
|
(in thousands)
|
|||||||
|
Property taxes
|
$
|
1,686
|
|
$
|
1,371
|
|
|
|
Current interest rate swap liabilities
|
—
|
|
119
|
|
|||
|
Accrued interest
|
3,537
|
|
458
|
|
|||
|
Railcar maintenance accruals
|
2,098
|
|
209
|
|
|||
|
Affiliates (1)
|
1,545
|
|
2,334
|
|
|||
|
Other accrued expenses and liabilities
|
2,705
|
|
1,192
|
|
|||
|
$
|
11,571
|
|
$
|
5,683
|
|
||
____________
|
(1)
|
Accrued expenses and other current liabilities include amounts owed by the Partnership to CVR Energy and its subsidiaries, which are related parties, under the feedstock and shared services agreement and the services agreement. Refer to
Note 14 ("Related Party Transactions")
for additional discussion.
|
22
CVR PARTNERS, LP AND SUBSIDIARIES
NOTES TO THE CONDENSED CONSOLIDATED FINANCIAL STATEMENTS (Continued)
June 30, 2016
(unaudited)
(11) Debt
Long-term debt consisted of the following:
|
As of
June 30, 2016 |
As of
December 31, 2015 |
||||||
|
(in thousands)
|
|||||||
|
9.25% senior secured notes, due 2023
|
$
|
645,000
|
|
$
|
—
|
|
|
|
6.50% notes, due 2021
|
4,195
|
|
—
|
|
|||
|
Credit Agreement term loan, due 2016
|
—
|
|
125,000
|
|
|||
|
Total long-term debt, before debt issuance costs and discount
|
649,195
|
|
125,000
|
|
|||
|
Less:
|
|||||||
|
Unamortized discount
|
16,038
|
|
—
|
|
|||
|
Unamortized debt issuance costs
|
7,845
|
|
227
|
|
|||
|
Total long-term debt, net of current portion
|
$
|
625,312
|
|
$
|
124,773
|
|
|
As discussed in Note 3 ("Recent Accounting Pronouncements"), the Partnership adopted ASU 2015-03, "
Simplifying the Presentation of Debt Issuance Costs
", which requires that all costs incurred to issue debt be presented in the balance sheet as a direct deduction from the carrying value of the debt. As a result of adoption of the standard, debt issuance costs of
$0.2 million
were reclassified as a direct deduction from the carrying value of the related debt balances in the Condensed Consolidated Balance Sheets as of December 31, 2015. A nominal amount of debt issuance costs related to the revolving credit facility were presented as assets in the Condensed Consolidated Balance Sheet as of December 31, 2015.
For the three months ended
June 30, 2016
and
2015
, amortization of the discount on debt and amortization of deferred financing costs reported as interest expense and other financing costs totaled approximately
$0.1 million
and
$0.2 million
, respectively. For the
six
months ended
June 30, 2016
and
2015
, amortization of the discount on debt and amortization of deferred financing costs reported as interest expense and other financing costs totaled approximately
$0.4 million
and
$0.5 million
, respectively.
2023 Notes
On June 10, 2016, the Partnership and CVR Nitrogen Finance Corporation, an indirect wholly-owned subsidiary of the Partnership, (together the "2023 Notes Issuers"), certain subsidiary guarantors named therein and Wilmington Trust, National Association, as trustee and as collateral trustee, completed a private offering of
$645.0 million
aggregate principal amount of
9.250%
Senior Secured Notes due 2023 (the "2023 Notes"). The 2023 Notes mature on June 15, 2023, unless earlier redeemed or repurchased by the issuers. Interest on the 2023 Notes is payable semi-annually in arrears on June 15 and December 15 of each year, beginning on December 15, 2016. The 2023 Notes are guaranteed on a senior secured basis by all of the Partnership’s existing subsidiaries.
The 2023 Notes were issued at a
$16.1 million
discount, which is being amortized over the term of the 2023 Notes as interest expense using the effective-interest method. The Partnership received approximately
$622.9 million
of cash proceeds, net of the original issue discount and underwriting fees, but before deducting other third-party fees and expenses associated with the offering. The net proceeds from the sale of the 2023 Notes were used to: (i) repay all amounts outstanding under the CRLLC Facility (defined and discussed below); (ii) finance the 2021 Notes Tender Offer (defined and discussed below) and (iii) to pay related fees and expenses.
The debt issuance costs of the 2023 Notes totaled approximately
$7.9 million
and are being amortized over the term of the 2023 Notes as interest expense using the effective-interest amortization method.
The 2023 Notes contain customary covenants for a financing of this type that, among other things, restrict the Partnership’s ability and the ability of certain of its subsidiaries to: (i) sell assets; (ii) pay distributions on, redeem or repurchase the Partnership’s units or
23
CVR PARTNERS, LP AND SUBSIDIARIES
NOTES TO THE CONDENSED CONSOLIDATED FINANCIAL STATEMENTS (Continued)
June 30, 2016
(unaudited)
redeem or repurchase its subordinated debt; (iii) make investments; (iv) incur or guarantee additional indebtedness or issue preferred units; (v) create or incur certain liens; (vi) enter into agreements that restrict distributions or other payments from the Partnership’s restricted subsidiaries to the Partnership; (vii) consolidate, merge or transfer all or substantially all of the Partnership’s assets; (viii) engage in transactions with affiliates; and (ix) create unrestricted subsidiaries. As of June 30, 2016, the Partnership was in compliance with the covenants contained in the 2023 Notes.
Included in other current liabilities on the Condensed Consolidated Balance Sheets is accrued interest payable totaling approximately
$3.5 million
as of
June 30, 2016
related to the 2023 Notes. At
June 30, 2016
, the estimated fair value of the 2023 Notes was approximately
$656.3 million
. This estimate of fair value is Level 2 as it was determined by quotations obtained from a broker-dealer who makes a market in these and similar securities.
2021 Notes
The
$320.0 million
2021 Notes were issued by CVR Nitrogen and CVR Nitrogen Finance (the "2021 Notes Issuers") prior to the East Dubuque Merger. The 2021 Notes bear interest at a rate of
6.5%
per annum, payable semi-annually in arrears on April 15 and October 15 of each year. The 2021 Notes are scheduled to mature on April 15, 2021, unless repurchased or redeemed earlier in accordance with their terms.
On April 29, 2016, the 2021 Notes Issuers commenced a cash tender offer (the "Tender Offer") to purchase any and all of the outstanding 2021 Notes. In connection with the Tender Offer, the 2021 Notes Issuers solicited the consents of holders of the notes to certain proposed amendments to the indenture governing the notes (the "Consent Solicitation"). As a result of the Tender Offer, on June 10, 2016, the 2021 Notes Issuers repurchased
$315,245,000
of 2021 Notes, representing approximately
98.5%
of the total outstanding principal amount of the notes at a purchase price of
$1,015
per
$1,000
in principal amount. The total amount paid related to the Tender Offer was approximately
$320.0 million
, including an approximate
$4.7 million
premium. Additionally, the 2021 Notes Issuers paid
$3.1 million
for accrued and unpaid interest for the tendered notes up to the settlement date. The 2021 Notes Issuers received the requisite consents in respect of the 2021 Notes in connection with the Consent Solicitation to amend the indenture governing the 2021 Notes. As a result, the 2021 Notes Issuers executed a supplemental indenture, dated as of June 10, 2016, which eliminated or modified substantially all of the restrictive covenants relating to CVR Nitrogen and its subsidiaries, eliminated all events of default other than failure to pay principal, premium or interest on the 2021 Notes, eliminated all conditions to satisfaction and discharge, and released the liens on the collateral securing the 2021 Notes. The repurchase of a portion of the 2021 Notes resulted in a loss on extinguishment of debt of approximately
$5.1 million
for the three and
six
months ended
June 30, 2016
, which includes the Tender Offer premium of
$4.7 million
and the write-off of the unamortized portion of the purchase accounting adjustment of
$0.4 million
.
Concurrently with, but separately from the Tender Offer, the 2021 Notes Issuers also commenced an offer to purchase all of the outstanding 2021 Notes at a price equal to
101%
of the principal amount thereof, as required as a result of the East Dubuque Merger (the "Change of Control Offer"). The offer expired on June 28, 2016. As a result of the Change of Control Offer, the 2021 Notes Issuers repurchased
$560,000
of 2021 Notes at a purchase price of
$1,010
per
$1,000
in principal amount. The total amount paid related to the Change of Control Offer was approximately
$0.6 million
, including a nominal amount of premium and accrued and unpaid interest.
The
$4,195,000
of principal amount of the 2021 Notes that remained outstanding following the consummation of the Tender Offer and the Change of Control Offer will continue to be obligations of the 2021 Notes Issuers. Included in other current liabilities on the Condensed Consolidated Balance Sheets is accrued interest payable totaling approximately
$0.1 million
as of
June 30, 2016
related to the 2021 Notes. At
June 30, 2016
, the estimated fair value of the 2021 Notes was approximately
$4.2 million
. This estimate of fair value is Level 2 as it was determined by quotations obtained from a broker-dealer who makes a market in these and similar securities.
CRLLC Facility
On April 1, 2016, in connection with the closing of the East Dubuque Merger, the Partnership entered into a
$300.0 million
senior term loan credit facility (the "CRLLC Facility") with CRLLC, as the lender, the proceeds of which were used by the Partnership (i) to fund the repayment of amounts outstanding under the Wells Fargo Credit Agreement discussed in
Note 4 ("East Dubuque Merger")
(ii) to pay the cash consideration and to pay fees and expenses in connection with the East Dubuque Merger and related transactions and
24
CVR PARTNERS, LP AND SUBSIDIARIES
NOTES TO THE CONDENSED CONSOLIDATED FINANCIAL STATEMENTS (Continued)
June 30, 2016
(unaudited)
(iii) to repay all of the loans outstanding under the Credit Agreement discussed below. The CRLLC Facility had a term of
two
years and an interest rate of
12.0%
per annum. Interest was calculated on the basis of the actual number of days elapsed over a
360
-day year and payable quarterly. In April 2016, the Partnership borrowed
$300.0 million
under the CRLLC Facility. On June 10, 2016, the Partnership paid off the
$300.0 million
outstanding under the CRLLC Facility, paid
$7.0 million
in interest, and terminated the CRLLC Facility.
Credit Agreement
On April 13, 2011, CRNF, as borrower, and CVR Partners, as guarantor, entered into a credit facility with a group of lenders including Goldman Sachs Lending Partners LLC, as administrative and collateral agent (the "Credit Agreement"). The Credit Agreement included a term loan facility of
$125.0 million
and a revolving credit facility of
$25.0 million
with an uncommitted incremental facility of up to
$50.0 million
.
No
amounts were outstanding under the revolving credit facility at
December 31, 2015
. The Credit Agreement was scheduled to mature on April 13, 2016. On April 1, 2016, in connection with the completion of the East Dubuque Merger, the Partnership repaid all amounts outstanding under the Credit Agreement and paid
$0.3 million
for accrued and unpaid interest. Effective upon such repayment, the Credit Agreement and all related loan documents and security interests were terminated and released. The repayment was funded from amounts drawn on the CRLLC Facility, as discussed above. The Partnership recognized a nominal amount of loss on debt extinguishment in connection with the termination of the Credit Agreement.
Previous borrowings under the Credit Agreement bore interest at either a Eurodollar rate or a base rate plus in either case a margin based on a pricing grid determined by the trailing
four
quarter leverage ratio. The margin for borrowings under the Credit Agreement ranges from
3.50%
to
4.25%
for Eurodollar loans and
2.50%
to
3.25%
for base rate loans. During the periods presented, the interest rate was either the
Eurodollar rate
plus a margin of
3.50%
or, for base rate loans, the
prime rate
plus
2.50%
. At
December 31, 2015
, the effective rate of the term loan was approximately
4.60%
, inclusive of the impact of the interest rate swaps discussed in
Note 12 ("Interest Rate Swap Agreements")
.
The carrying value approximated fair value as of December 31, 2015.
(12) Interest Rate Swap Agreements
CRNF had
two
floating-to-fixed interest rate swap agreements for the purpose of hedging the interest rate risk associated with a portion of its
$125.0 million
floating rate term debt, which expired on February 12, 2016. The floating rate term debt is discussed in
Note 11 ("Debt")
. The aggregate notional amount covered under these agreements, which commenced on August 12, 2011, totals
$62.5 million
(split evenly between the
two
agreements). Under the terms of the interest rate swap agreement entered into on June 30, 2011, CRNF received a floating rate based on three-month LIBOR and paid a fixed rate of
1.94%
. Under the terms of the interest rate swap agreement entered into on July 1, 2011, CRNF receives a floating rate based on three-month LIBOR and paid a fixed rate of
1.975%
. Both swap agreements were settled every
90 days
. The effect of these swap agreements was to lock in a fixed rate of interest of approximately
1.96%
plus the applicable margin paid to lenders over three-month LIBOR governed by the credit facility. The agreements were designated as cash flow hedges at inception, and accordingly, the effective portion of the gain or loss on the swap was reported as a component of accumulated other comprehensive income (loss) ("AOCI") and reclassified into interest expense when the interest rate swap transaction affects earnings. Any ineffective portion of the gain or loss was recognized immediately in interest expense. The realized loss on the interest rate swap reclassified from AOCI into interest expense and other financing costs on the Condensed Consolidated Statements of Operations was
$0.3 million
for the three months ended
June 30, 2015
. The realized loss on the interest rate swap reclassified from AOCI into interest expense for the
six
months ended
June 30, 2016
and
2015
was
$0.1 million
and
$0.5 million
, respectively.
The interest rate swap agreements previously held by the Partnership also provided for the right to offset. However, as the interest rate swaps were in a liability position, there are no amounts offset in the Condensed Consolidated Balance Sheet as of
December 31, 2015
.
See Note 15 ("Fair Value Measurements")
for discussion of the fair value of the interest rate swap agreements.
25
CVR PARTNERS, LP AND SUBSIDIARIES
NOTES TO THE CONDENSED CONSOLIDATED FINANCIAL STATEMENTS (Continued)
June 30, 2016
(unaudited)
(13) Commitments and Contingencies
Leases and Unconditional Purchase Obligations
The minimum required payments for the Partnership’s operating leases and unconditional purchase obligations are as follows:
|
|
Operating
Leases
|
Unconditional
Purchase
Obligations
|
|||||
|
(in thousands)
|
|||||||
|
Six months ending December 31, 2016
|
$
|
2,613
|
|
$
|
11,616
|
|
|
|
Year Ending December 31,
|
|||||||
|
2017
|
4,328
|
|
13,549
|
|
|||
|
2018
|
3,452
|
|
11,961
|
|
|||
|
2019
|
2,836
|
|
10,453
|
|
|||
|
2020
|
2,310
|
|
7,917
|
|
|||
|
Thereafter
|
4,630
|
|
46,051
|
|
|||
|
$
|
20,169
|
|
$
|
101,547
|
|
||
_____________
CRNF leases railcars and facilities under long-term operating leases. Lease expense included in cost of product sold (exclusive of depreciation and amortization) and for the three months ended
June 30, 2016
and
2015
totaled approximately
$1.2 million
. For the
six
months ended
June 30, 2016
and
2015
, these expenses totaled approximately
$2.3 million
. The lease agreements have various remaining terms. Some agreements are renewable, at CRNF’s option, for additional periods. It is expected, in the ordinary course of business, that leases may be renewed or replaced as they expire. In the second quarter of 2016, the Partnership entered into agreements to lease
115
UAN railcars from a related party, which is included in the operating lease commitments shown above. See
Note 14 ("Related Party Transactions")
for further discussion.
CRNF’s purchase obligation for pet coke from CVR Refining and has been derived from a calculation of the average pet coke price paid to CVR Refining over the preceding
two
-year period. See
Note 14 ("Related Party Transactions")
for further discussion of the coke supply agreement.
CRNF is party to the Amended and Restated On-Site Product Supply Agreement with The BOC Group, Inc. (as predecessor in interest to Linde LLC). Pursuant to the agreement, which expires in 2020, CRNF is required to take as available and pay for the supply of oxygen and nitrogen to the fertilizer operation. Expenses associated with this agreement are included in direct operating expenses (exclusive of depreciation and amortization), and, for the three months ended
June 30, 2016
and
2015
, totaled approximately
$0.9 million
and
$0.8 million
, respectively. For the
six
months ended
June 30, 2016
and
2015
, the expense totaled
$1.9 million
and
$1.6 million
, respectively.
CRNF is a party to a pet coke supply agreement with HollyFrontier Corporation. The term of this agreement ends in December
2016
. The delivered cost of this pet coke is included in cost of product sold (exclusive of depreciation and amortization) and totaled approximately
$1.1 million
and
$1.0 million
, respectively, for the three months ended
June 30, 2016
and
2015
. For the
six
months ended
June 30, 2016
and
2015
, these expenses totaled approximately
$2.5 million
and
$2.3 million
, respectively.
26
CVR PARTNERS, LP AND SUBSIDIARIES
NOTES TO THE CONDENSED CONSOLIDATED FINANCIAL STATEMENTS (Continued)
June 30, 2016
(unaudited)
Commitments for natural gas purchases consist of the following:
|
June 30,
2016 |
|||
|
(in thousands, except weighted average rate)
|
|||
|
MMBtus under fixed-price contracts
|
775
|
|
|
|
Commitments to purchase natural gas
|
$
|
1,820
|
|
|
Weighted average rate per MMBtu (1)
|
$
|
2.35
|
|
____________
|
(1)
|
Weighted average rate per MMBtu is based on the fixed rates applicable to each contract.
|
Litigation
From time to time, the Partnership is involved in various lawsuits arising in the normal course of business, including environmental, health and safety ("EHS") matters described below under "Environmental, Health and Safety Matters." Liabilities, if any, related to such litigation are recognized when the related costs are probable and can be reasonably estimated. These provisions are reviewed at least quarterly and adjusted to reflect the impacts of negotiations, settlements, rulings, advice of legal counsel and other information and events pertaining to a particular case. It is possible that management’s estimates of the outcomes will change within the next year due to uncertainties inherent in litigation and settlement negotiations. There were no new proceedings or material developments in proceedings from those provided in the
2015
Form 10-K. In the opinion of management, the ultimate resolution of any other litigation matters is not expected to have a material adverse effect on the accompanying condensed consolidated financial statements. There can be no assurance that management’s beliefs or opinions with respect to liability for potential litigation matters are accurate.
Environmental, Health and Safety Matters
CRNF is subject to various stringent federal, state and local EHS rules and regulations. Liabilities related to EHS matters are recognized when the related costs are probable and can be reasonably estimated. Estimates of these costs are based upon currently available facts, existing technology, site-specific costs and currently enacted laws and regulations. In reporting EHS liabilities, no offset is made for potential recoveries. All liabilities are monitored and adjusted regularly as new facts emerge or changes in laws or technology occur.
There have been no new developments or material changes to the environmental accruals or expected capital expenditures related to compliance with the foregoing environmental matters from those provided in the
2015
Form 10-K. CRNF believes it is in substantial compliance with existing EHS rules and regulations. There can be no assurance that the EHS matters which may develop in the future will not have a material adverse effect on the Partnership's business, financial condition or results of operations.
(14) Related Party Transactions
Related Party Agreements
CVR Partners is party to, or otherwise subject to certain agreements with CVR Energy and its subsidiaries (including CVR Refining and its subsidiary Coffeyville Resources Refining & Marketing, LLC ("CRRM")) that govern the business relations among each party including: the (i) Feedstock and Shared Services Agreement; (ii) Coke Supply Agreement; (iii) Environmental Agreement; (iv) Services Agreement; (v) GP Services Agreement and (vi) Limited Partnership Agreement. The agreements are described as in effect at
June 30, 2016
. Except as otherwise described below, there have been no new developments or material changes to these agreements from those provided in the 2015 Form 10-K.
Amounts owed to CVR Partners and CRNF from CVR Energy and its subsidiaries with respect to these agreements are included in prepaid expenses and other current assets and other long-term assets on the Condensed Consolidated Balance Sheets. Conversely, amounts owed to CVR Energy and its subsidiaries by CVR Partners and CRNF with respect to these agreements are included in
27
CVR PARTNERS, LP AND SUBSIDIARIES
NOTES TO THE CONDENSED CONSOLIDATED FINANCIAL STATEMENTS (Continued)
June 30, 2016
(unaudited)
accounts payable, personnel accruals and accrued expenses and other current liabilities on the Partnership's Condensed Consolidated Balance Sheets.
Feedstock and Shared Services Agreement
CRNF is party to a feedstock and shared services agreement with CRRM under which the
two
parties provide feedstock and other services to one another. These feedstocks and services are utilized in the respective production processes of CRRM's Coffeyville, Kansas refinery and CRNF's nitrogen fertilizer plant.
Pursuant to the feedstock and shared services agreement, CRNF and CRRM have agreed to transfer hydrogen to one another; provided, CRNF is not required to sell hydrogen to CRRM if such hydrogen is required for operation of CRNF's nitrogen fertilizer plant, if such sale would adversely affect the Partnership's classification as a partnership for federal income tax purposes, or if such sale would not be in CRNF's best interest. Net monthly sales of hydrogen to CRRM have been reflected as net sales for CVR Partners, when applicable. Net monthly receipts of hydrogen from CRRM have been reflected in cost of product sold (exclusive of depreciation and amortization) for CVR Partners, when applicable. For the three months ended
June 30, 2016
and
2015
, the net sales generated from the sale of hydrogen to CRRM were approximately
$0.5 million
and
$2.0 million
, respectively. For the
six
months ended June 30, 2016 and 2015, the net sales generated from the sale of hydrogen to CRRM were approximately
$1.6 million
and
$8.5 million
, respectively. At
June 30, 2016
and
December 31, 2015
, there was approximately
$0.2 million
and
$0.5 million
, respectively, of receivables included in prepaid expenses and other current assets on the Condensed Consolidated Balance Sheets associated with unpaid balances related to hydrogen sales.
The agreement also provides a mechanism pursuant to which CRNF transfers a tail gas stream to CRRM. CRNF receives the benefit of eliminating a waste gas stream and recovers the fuel value of the tail gas system. For the
three and six
months ended
June 30, 2016
and
2015
, the net sales generated from the sale of tail gas to CRRM were nominal. In April 2011, in connection with the tail gas stream transfers to CRRM, CRRM installed a pipe between the Coffeyville, Kansas refinery and the nitrogen fertilizer plant to transfer the tail gas. CRNF agreed to pay CRRM the cost of installing the pipe and provide an additional
15%
to cover the cost of capital, which was due from CRNF to CRRM over
four years
. At
June 30, 2016
and
December 31, 2015
, there were assets of approximately
$0.2 million
and
$0.2 million
, respectively, included in prepaid expenses and other current assets and approximately
$0.7 million
and
$0.8 million
, respectively, included in other long-term assets in the Condensed Consolidated Balance Sheets.
At
June 30, 2016
and
December 31, 2015
, receivables of
$0.1 million
and
$0.2 million
, respectively, were included in prepaid expenses and other current assets on the Condensed Consolidated Balance Sheets for amounts yet to be received related to components of the feedstock and shared services agreement, other than amounts related to hydrogen transfers and tail gas discussed above. At
June 30, 2016
and
December 31, 2015
, current obligations of approximately
$0.6 million
and
$0.7 million
, respectively, were included in accounts payable on the Condensed Consolidated Balance Sheets associated with unpaid balances related to components of the feedstock and shared services agreement.
Coke Supply Agreement
CRNF is party to a coke supply agreement with CRRM pursuant to which CRRM supplies CRNF with pet coke. This agreement provides that CRRM must deliver to CRNF during each calendar year an annual required amount of pet coke equal to the lesser of
(i)
100 percent
of the pet coke produced at CRRM's Coffeyville, Kansas petroleum refinery or (ii)
500,000
tons of pet coke. CRNF is also obligated to purchase this annual required amount. If during a calendar month CRRM produces more than
41,667
tons of pet coke, then CRNF will have the option to purchase the excess at the purchase price provided for in the agreement. If CRNF declines to exercise this option, CRRM may sell the excess to a third party.
28
CVR PARTNERS, LP AND SUBSIDIARIES
NOTES TO THE CONDENSED CONSOLIDATED FINANCIAL STATEMENTS (Continued)
June 30, 2016
(unaudited)
CRNF obtains most (over
70%
on average during the last
five years
) of the pet coke it needs from CRRM's adjacent crude oil refinery pursuant to the pet coke supply agreement, and procures the remainder through a contract with HollyFrontier Corporation and on the open market. The price CRNF pays pursuant to the pet coke supply agreement is based on the lesser of a pet coke price derived from the price received for UAN (the "UAN-based price") or a pet coke price index. The UAN-based price begins with a pet coke price of
$25
per ton based on a price per ton for UAN that excludes transportation cost ("netback price") of
$205
per ton, and adjusts up or down
$0.50
per ton for every
$1.00
change in the netback price. The UAN-based price has a ceiling of
$40
per ton and a floor of
$5
per ton.
CRNF will pay any taxes associated with the sale, purchase, transportation, delivery, storage or consumption of the pet coke. CRNF is entitled to offset any amount payable for the pet coke against any amount due from CRRM under the feedstock and shared services agreement between the parties.
The cost of pet coke associated with the transfer of pet coke from CRRM to CRNF were approximately
$0.5 million
and
$2.1 million
for the three months ended
June 30, 2016
and
2015
, respectively, which was recorded in cost of product sold (exclusive of depreciation and amortization). For the six months ended
June 30, 2016
and
2015
, these expenses were approximately
$1.3 million
and
$3.9 million
, respectively. Payables of
$0.2 million
and
$0.3 million
related to the coke supply agreement were included in accounts payable on the Condensed Consolidated Balance Sheets at
June 30, 2016
and
December 31, 2015
, respectively.
Services Agreement
CVR Partners obtains certain management and other services from CVR Energy pursuant to a services agreement between the Partnership, CVR GP and CVR Energy.
Net amounts incurred under the services agreement for the
three and six
months ended
June 30, 2016
and
2015
were as follows:
|
Three Months Ended
June 30, |
Six Months Ended
June 30, |
||||||||||||||
|
2016
|
2015
|
2016
|
2015
|
||||||||||||
|
(in thousands)
|
|||||||||||||||
|
Direct operating expenses (exclusive of depreciation and amortization) — Affiliates
|
$
|
975
|
|
$
|
954
|
|
$
|
1,640
|
|
$
|
1,844
|
|
|||
|
Selling, general and administrative expenses (exclusive of depreciation and amortization) — Affiliates
|
3,059
|
|
2,535
|
|
5,622
|
|
4,918
|
|
|||||||
|
Total
|
$
|
4,034
|
|
$
|
3,489
|
|
$
|
7,262
|
|
$
|
6,762
|
|
|||
For services performed in connection with the services agreement, the Partnership recognized personnel costs, excluding amounts related to share-based compensation that are disclosed in
Note 5 ("Share‑Based Compensation")
, of
$1.9 million
and
$1.5 million
, respectively, for the three months ended
June 30, 2016
and
2015
. For services performed in connection with the services agreement, the Partnership recognized personnel costs, excluding amounts related to share-based compensation, of
$3.3 million
and
$2.6 million
for the six months ended June 30, 2016 and 2015, respectively. At
June 30, 2016
and
December 31, 2015
, current obligations of
$2.8 million
and
$3.2 million
, respectively, were included in accounts payable and accrued expenses and other current liabilities on the Condensed Consolidated Balance Sheets with respect to amounts billed in accordance with the services agreement.
29
CVR PARTNERS, LP AND SUBSIDIARIES
NOTES TO THE CONDENSED CONSOLIDATED FINANCIAL STATEMENTS (Continued)
June 30, 2016
(unaudited)
Limited Partnership Agreement
The partnership agreement provides that the Partnership will reimburse its general partner for all direct and indirect expenses it incurs or payments it makes on behalf of the Partnership (including salary, bonus, incentive compensation and other amounts paid to any person to perform services for the Partnership or for its general partner in connection with operating the Partnership). The Partnership reimbursed its general partner for the three months ended
June 30, 2016
and
2015
approximately
$1.1 million
and
$1.0 million
, respectively, pursuant to the partnership agreement primarily for personnel costs related to the compensation of executives at the general partner, who manage the Partnership's business. For the six months ended June 30, 2016 and 2015, approximately
$2.2 million
and
$2.1 million
were incurred related to amounts due for reimbursement, respectively. At
June 30, 2016
and
December 31, 2015
, current obligations of
$2.0 million
and
$2.0 million
, respectively, were included in personnel accruals and accrued expenses and other current liabilities on the Condensed Consolidated Balance Sheets related to amounts outstanding in accordance with the limited partnership agreement.
Insight Portfolio Group
Insight Portfolio Group LLC ("Insight Portfolio Group") is an entity formed by Mr. Carl C. Icahn in order to maximize the potential buying power of a group of entities with which Mr. Icahn has a relationship in negotiating with a wide range of suppliers of goods, services and tangible and intangible property at negotiated rates. In January 2013, CVR Energy acquired a minority equity interest in Insight Portfolio Group. The Partnership participates in Insight Portfolio Group’s buying group through its relationship with CVR Energy. The Partnership may purchase a variety of goods and services as members of the buying group at prices and on terms that management believes would be more favorable than those which would be achieved on a stand-alone basis. For the six months ended June 30, 2016, the Partnership paid Insight Portfolio Group a nominal amount. At
June 30, 2016
and
December 31, 2015
, there were
no
unpaid balances related to transactions with the Insight Portfolio Group.
AEPC Facility
On April 1, 2016, in connection with the closing of the East Dubuque Merger, the Partnership entered into a
$320.0 million
senior term loan facility (the "AEPC Facility") with American Entertainment Properties Corp., a Delaware corporation and an affiliate of the Partnership ("AEPC"), as the lender, which was to be used (i) by the Partnership to provide funds to CVR Nitrogen to make a change of control offer and, if applicable, a "clean-up" redemption in accordance with the indenture governing the 2021 Notes or (ii) by the Partnership or CVR Nitrogen to make a tender offer for the 2021 Notes and, in each case, pay fees and expenses related thereto. The AEPC Facility had a term of
two years
and an interest rate of
12%
per annum. In connection with the repayment of the substantial majority of the 2021 Notes, the AEPC Facility was terminated.
Commitment Letter
Simultaneously with the execution of the Merger Agreement, CVR Partners entered into a commitment letter (the "Commitment Letter") with CRLLC, pursuant to which CRLLC had committed to, on the terms and subject to the conditions set forth in the Commitment Letter, make available to CVR Partners term loan financing of up to
$150.0 million
, which amounts would have been available solely to fund the repayment of all of the loans outstanding under the Wells Fargo Credit Agreement, the cash consideration and expenses associated with the East Dubuque Merger. The term loan facility, if drawn, would have had a
one year
term at an interest rate of three-month LIBOR plus
3.0%
per annum. In connection with the CRLLC Facility discussed below, the Commitment Letter was terminated.
CRLLC Guaranty
On February 9, 2016, CRLLC and the Partnership entered into a guaranty (the "CRLLC Guaranty"), pursuant to which CRLLC agreed to guaranty the indebtedness outstanding under the Credit Agreement. If the Credit Agreement became due prior to a refinancing by the Partnership, CRLLC would have been required to pay the indebtedness pursuant to the guaranty. The Partnership's obligation to repay CRLLC for the indebtedness would have been pursuant to a promissory note (the "Note"). The terms of the Note would have been mutually agreed upon by the parties, provided, the term would be the lesser of
two years
or such time that the Partnership obtains third-party financing ("New Debt") of at least
$125.0 million
on terms acceptable to the Partnership with a term of greater than
one year
from the inception of the New Debt. In connection with the CRLLC Facility discussed below, the CRLLC Guaranty was terminated.
30
CVR PARTNERS, LP AND SUBSIDIARIES
NOTES TO THE CONDENSED CONSOLIDATED FINANCIAL STATEMENTS (Continued)
June 30, 2016
(unaudited)
CRLLC Facility
On April 1, 2016, in connection with the closing of the East Dubuque Merger, the Partnership entered into the CRLLC Facility. See
Note 11 ("Debt")
for further discussion.
Parent Affiliate Units
Subsequent to the East Dubuque Merger, the Partnership purchased
400,000
CVR Nitrogen common units from CVR Energy during the second quarter of 2016 for
$5.0 million
. See
Note 4 ("East Dubuque Merger")
for further discussion.
Railcar Lease Agreements
In the second quarter of 2016, the Partnership entered into agreements to lease a total of
115
UAN railcars from American Railcar Leasing, LLC, a company controlled by Mr. Carl C. Icahn, CVR Energy's majority stockholder. The lease agreements have a term of approximately
seven
years. The Partnership anticipates physical receipt of these leased railcars and associated lease payment obligations to begin in the second half of 2016.
(15) Fair Value Measurements
In accordance with ASC Topic 820 —
Fair Value Measurements and Disclosures
("ASC 820"), the Partnership utilizes the market approach to measure fair value for its financial assets and liabilities. The market approach uses prices and other relevant information generated by market transactions involving identical or comparable assets, liabilities or a group of assets or liabilities, such as a business.
ASC 820 utilizes a fair value hierarchy that prioritizes the inputs to valuation techniques used to measure fair value into three broad levels. The following is a brief description of those three levels:
|
•
|
Level 1 — Quoted prices in active markets for identical assets and liabilities
|
|
•
|
Level 2 — Other significant observable inputs (including quoted prices in active markets for similar assets or liabilities)
|
|
•
|
Level 3 — Significant unobservable inputs (including the Partnership’s own assumptions in determining the fair value).
|
There were no assets or liabilities measured at fair value on a recurring basis as of
June 30, 2016
. The following table sets forth the assets and liabilities measured at fair value on a recurring basis, by input level, as of
December 31, 2015
.
|
December 31, 2015
|
|||||||||||||||
|
Level 1
|
Level 2
|
Level 3
|
Total
|
||||||||||||
|
(in thousands)
|
|||||||||||||||
|
Financial Statement Caption and Description
|
|||||||||||||||
|
Other current liabilities (interest rate swaps)
|
$
|
—
|
|
$
|
119
|
|
$
|
—
|
|
$
|
119
|
|
|||
The Partnership had interest rate swaps that were measured at fair value on a recurring basis using Level 2 inputs. The swaps expired in February 2016. See further discussion in
Note 12 ("Interest Rate Swap Agreements")
. The fair values of these interest rate swap instruments were based on discounted cash flow models that incorporated the cash flows of the derivatives, as well as the current LIBOR rate and a forward LIBOR curve, along with other observable market inputs. The fair value of the debt issuances is disclosed in
Note 11 ("Debt")
.
31
CVR PARTNERS, LP AND SUBSIDIARIES
NOTES TO THE CONDENSED CONSOLIDATED FINANCIAL STATEMENTS (Continued)
June 30, 2016
(unaudited)
(16) Subsequent Events
Distribution
On
July 27, 2016
, the Board of Directors of the general partner of the Partnership declared a cash distribution for the second quarter of 2016 in the amount of
$0.17
per common unit, or approximately
$19.3 million
in aggregate. The cash distribution will be paid on
August 15, 2016
to the Partnership's unitholders of record at the close of business on
August 8, 2016
.
32
Item 2.
Management’s Discussion and Analysis of Financial Condition and
Results of Operations
The following discussion and analysis of our financial condition, results of operations and cash flows should be read in conjunction with the unaudited condensed consolidated financial statements and related notes and with the statistical information and financial data appearing in this Report, as well as the 2015 Form 10-K. Results of operations and cash flows for the
three and six
months ended
June 30, 2016
and
2015
are not necessarily indicative of results to be attained for any other period.
Forward-Looking Statements
This Report, including this Management’s Discussion and Analysis of Financial Condition and Results of Operations, contains "forward-looking statements" as defined by the SEC, including statements concerning contemplated transactions and strategic plans, expectations and objectives for future operations. Forward-looking statements include, without limitation:
|
•
|
statements, other than statements of historical fact, that address activities, events or developments that we expect, believe or anticipate will or may occur in the future;
|
|
•
|
statements relating to future financial or operational performance, future distributions, future capital sources and capital expenditures; and
|
|
•
|
any other statements preceded by, followed by or that include the words "anticipates," "believes," "expects," "plans," "intends," "estimates," "projects," "could," "should," "may" or similar expressions.
|
Although we believe that our plans, intentions and expectations reflected in or suggested by the forward-looking statements we make in this Report, including this Management’s Discussion and Analysis of Financial Condition and Results of Operations, are reasonable, we can give no assurance that such plans, intentions or expectations will be achieved. These statements are based on assumptions made by us based on our experience and perception of historical trends, current conditions, expected future developments and other factors that we believe are appropriate in the circumstances. Such statements are subject to a number of risks and uncertainties, many of which are beyond our control. You are cautioned that any such statements are not guarantees of future performance and actual results or developments may differ materially from those projected in the forward-looking statements as a result of various factors, including but not limited to those set forth under "Risk Factors" in the
2015
Form 10-K, the risk factors disclosed under "Risk Factors" in the Partnership's Quarterly Report on Form 10-Q for the three months ended March 31, 2016, filed with the SEC on April 29, 2016, as well as the risk factors disclosed under "Risk Factors" in Part II, Item 1.A. of this Report. Such factors include, among others:
|
•
|
our ability to make cash distributions on the common units;
|
|
•
|
the volatile nature of our business and the variable nature of our distributions;
|
|
•
|
the ability of our general partner to modify or revoke our distribution policy at any time;
|
|
•
|
the cyclical nature of our business;
|
|
•
|
the seasonal nature of our business;
|
|
•
|
the dependence of our operations on a few third-party suppliers, including providers of transportation services and equipment;
|
|
•
|
our reliance on pet coke that we purchase from CVR Refining;
|
|
•
|
our reliance on the natural gas and electricity that we purchase from third parties;
|
|
•
|
the supply and price levels of essential raw materials;
|
|
•
|
the risk of a material decline in production at our nitrogen fertilizer plants;
|
33
|
•
|
potential operating hazards from accidents, fire, severe weather, floods or other natural disasters;
|
|
•
|
competition in the nitrogen fertilizer businesses;
|
|
•
|
capital expenditures and potential liabilities arising from environmental laws and regulations;
|
|
•
|
existing and proposed environmental laws and regulations, including those relating to climate change, alternative energy or fuel sources, and the end-use and application of fertilizers;
|
|
•
|
new regulations concerning the transportation of hazardous chemicals, risks of terrorism and the security of chemical manufacturing facilities;
|
|
•
|
the risk of security breaches;
|
|
•
|
our lack of asset diversification;
|
|
•
|
our dependence on significant customers;
|
|
•
|
the potential loss of our transportation cost advantage over our competitors;
|
|
•
|
our partial dependence on customer and distributor transportation of purchased goods;
|
|
•
|
our potential inability to successfully implement our business strategies, including the completion of significant capital programs;
|
|
•
|
our reliance on CVR Energy’s senior management team and conflicts of interest they face operating each of CVR Partners, CVR Refining and CVR Energy;
|
|
•
|
the risk of labor disputes and adverse employee relations;
|
|
•
|
risks relating to our relationships with CVR Energy and CVR Refining;
|
|
•
|
control of our general partner by CVR Energy;
|
|
•
|
our ability to continue to license the technology used in our operations;
|
|
•
|
restrictions in our debt agreements;
|
|
•
|
changes in our treatment as a partnership for U.S. federal income or state tax purposes;
|
|
•
|
instability and volatility in the capital and credit markets;
|
|
•
|
risks, contingencies and uncertainties associated with the East Dubuque Merger;
|
|
•
|
our ability to complete the successful integration of the East Dubuque Facility into our business and to realize the synergies from the East Dubuque Merger; and
|
|
•
|
CVR Energy and its affiliates may compete with us.
|
All forward-looking statements contained in this Report speak only as of the date of this Report. We undertake no obligation to publicly update or revise any forward-looking statements to reflect events or circumstances that occur after the date of this Report, or to reflect the occurrence of unanticipated events, except to the extent required by law.
34
Partnership Overview
CVR Partners, LP ("CVR Partners," the "Partnership," "we," "us" or "our") is a Delaware limited partnership formed by CVR Energy to own, operate and grow our nitrogen fertilizer business. We produce and distribute nitrogen fertilizer products, which are used primarily by farmers to improve the yield and quality of their crops. Our principal products are UAN and ammonia. Our product sales are heavily weighted toward UAN and all of our products are sold on a wholesale basis.
We produce our nitrogen fertilizer products at two manufacturing facilities, which are located in Coffeyville, Kansas and East Dubuque, Illinois. We acquired the East Dubuque, Illinois facility in April 2016 through our acquisition of CVR Nitrogen. For a discussion of the East Dubuque Merger, refer to "
Recent Developments
" below in Part I, Item 2 of this Report and
Note 4 ("East Dubuque Merger")
of Part I, Item 1 of this Report. The consolidated financial statements and key operating metrics for the three and
six
months ended
June 30, 2016
include the results of the East Dubuque Facility beginning on April 1, 2016, the date of the closing of the acquisition.
Strategically located adjacent to CVR Refining’s refinery in Coffeyville, Kansas, our Coffeyville Facility is the only operation in North America that utilizes a petroleum coke, or pet coke, gasification process to produce nitrogen fertilizer. Our Coffeyville Facility includes a 1,300 ton-per-day ammonia unit, a 3,000 ton-per-day UAN unit, and a gasifier complex having a capacity of 89 million standard cubic feet per day of hydrogen. Our gasifier is a dual-train facility, with each gasifier able to function independently of the other, thereby providing redundancy and improving our reliability. We upgrade substantially all of the ammonia we produce at our Coffeyville Facility to higher margin UAN, which has historically commanded a premium price over ammonia. Approximately 96% of our produced ammonia tons and the majority of the purchased ammonia tons were upgraded into UAN in 2015. For the three months ended
June 30, 2016
and
2015
, approximately
90%
and
96%
, respectively, of our produced ammonia tons and the majority of purchased ammonia tons were upgraded into UAN. For the
six
months ended
June 30, 2016
and
2015
, approximately
89%
and
97%
, respectively, of our produced ammonia tons and the majority of purchased ammonia tons were upgraded into UAN.
Our recently acquired East Dubuque Facility includes a 1,025 ton-per-day ammonia unit and a 1,100 ton-per-day UAN unit. The facility is located on a 210-acre, 140-foot bluff above the Mississippi River, with access to the river for loading certain products. The East Dubuque Facility has the flexibility to significantly vary its product mix. This enables us to upgrade our ammonia production into varying amounts of UAN, nitric acid and liquid and granulated urea each season, depending on market demand, pricing and storage availability. Product sales are heavily weighted toward sales of ammonia and UAN. For the three months ended
June 30, 2016
, approximately
49%
of our produced ammonia tons were upgraded to other products.
CVR Energy, which indirectly owns our general partner and approximately
34%
of our outstanding common units, also indirectly owns the general partner and approximately
66%
of the outstanding common units of CVR Refining at
June 30, 2016
. CVR Refining owns and operates a complex full coking medium-sour crude oil refinery with a rated capacity of 115,000 barrels per calendar day (bpcd) in Coffeyville, Kansas, a complex crude oil refinery with a rated capacity of 70,000 bpcd in Wynnewood, Oklahoma and ancillary businesses.
We intend to continue to expand our existing asset base and utilize the experience of our and CVR Energy’s management teams to execute our growth strategy, which includes expanded production of UAN and acquiring and building additional infrastructure and production assets.
The primary raw material feedstock utilized in our Coffeyville Facility's production process is pet coke, which is produced during the crude oil refining process. In contrast, substantially all of our nitrogen fertilizer competitors use natural gas as their primary raw material feedstock. Our Coffeyville Facility's pet coke gasification process results in a significantly higher percentage of fixed costs than a natural gas-based fertilizer plant. We currently purchase most of the pet coke for our Coffeyville Facility from CVR Refining pursuant to a long-term agreement having an initial term that ends in 2027, subject to renewal. During the past five years, over 70% of the pet coke consumed by our Coffeyville Facility was produced and supplied by CVR Refining’s Coffeyville, Kansas crude oil refinery.
The East Dubuque Facility uses low-cost, North American natural gas to produce nitrogen fertilizer, primarily ammonia and UAN, We are able to purchase natural gas at competitive prices due to the plant’s connection to the Northern Natural Gas interstate pipeline system, which is within one mile of the facility, and the ANR Pipeline Company pipeline. Over the last five years, U.S. natural gas reserves have increased significantly due to, among other factors, advances in extracting shale gas, which have reduced and stabilized natural gas prices, significantly lowering our production costs.
35
Organizational Chart and Related Ownership
The following chart illustrates the organizational structure of the Partnership as of the date of this Report.
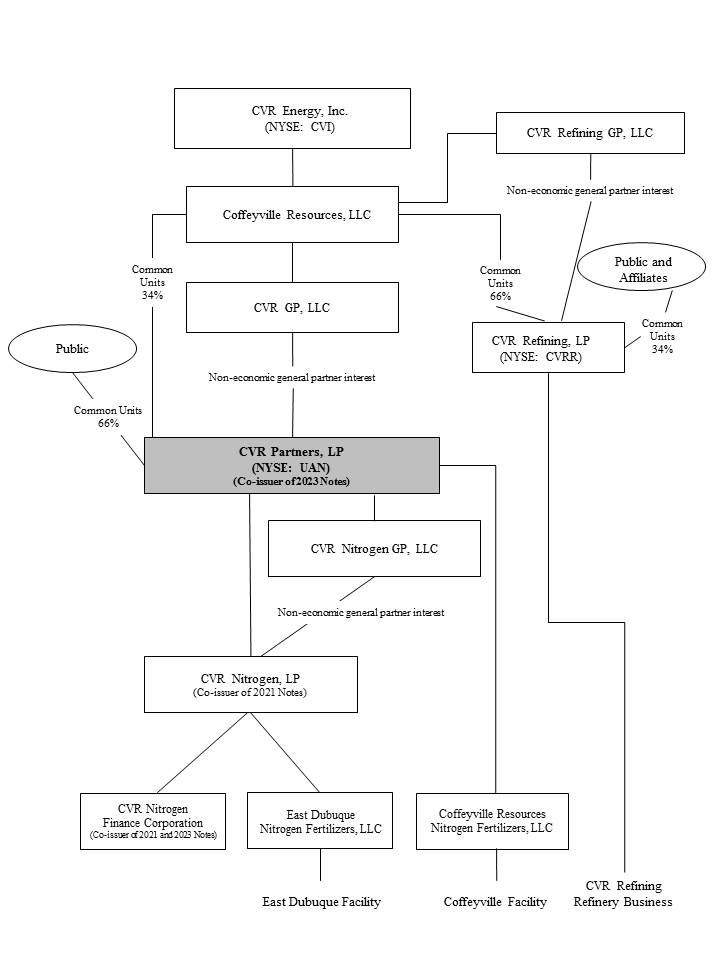
36
Recent Developments
On April 1, 2016, the Partnership completed the acquisition of CVR Nitrogen. Refer to
Note 4 ("East Dubuque Merger")
of Part I, Item 1 of this Report for further discussion of the East Dubuque Merger.
On June 10, 2016, the Partnership completed a private offering of
$645.0 million
aggregate principal amount of
9.250%
Senior Secured Notes due 2023. Additionally, during the three months ended June 30, 2016, the Partnership repurchased approximately
$315.8 million
of the 2021 Notes pursuant to a Tender Offer and a Change of Control Offer. Refer to
Note 11 ("Debt")
of Part I, Item 1 of this Report for further discussion of the debt transactions.
Major Influences on Results of Operations
Our earnings and cash flows from operations are primarily affected by the relationship between nitrogen fertilizer product prices, on-stream factors and direct operating expenses.
The price at which our products are ultimately sold depends on numerous factors, including the global supply and demand for nitrogen fertilizer products which, in turn, depends on, among other factors, world grain demand and production levels, changes in world population, the cost and availability of fertilizer transportation infrastructure, weather conditions, the availability of imports and the extent of government intervention in agriculture markets.
Nitrogen fertilizer prices are also affected by local factors, including local market conditions and the operating levels of competing facilities. An expansion or upgrade of competitors’ facilities, political and economic developments and other factors are likely to continue to play an important role in nitrogen fertilizer industry economics. These factors can impact, among other things, the level of inventories in the market, resulting in price volatility and a reduction in product margins. Moreover, the industry typically experiences seasonal fluctuations in demand for nitrogen fertilizer products.
We have the capacity to store approximately 160,000 tons of UAN and 80,000 tons of ammonia. Our storage tanks are located primarily at our two production facilities. Inventories are often allowed to accumulate to allow customers to take delivery to meet the seasonal demand.
In order to assess our operating performance, we calculate the product pricing at gate as an input to determine our operating margin. Product pricing at gate represents net sales less freight revenue divided by product sales volume in tons. We believe product pricing at gate is a meaningful measure because we sell products at our plant gate and terminal locations' gates ("sold gate") and delivered to the customer's designated delivery site ("sold delivered"). The relative percentage of sold gate versus sold delivered can change period to period. The product pricing at gate provides a measure that is consistently comparable period to period.
We and other competitors in the U.S. farm belt share a significant transportation cost advantage when compared to our out-of-region competitors in serving the U.S. farm belt agricultural market; therefore we are able to cost-effectively sell substantially all of our products in the higher margin agricultural market. Further, we believe a significant portion of our competitors’ revenues are derived from the lower margin industrial market.
Our products leave our Coffeyville Facility either in railcars for destinations located principally on the Union Pacific Railroad or in trucks for direct shipment to customers. We do not currently incur significant intermediate transfer, storage, barge freight or pipeline freight charges; however, we do incur costs to maintain and repair our railcar fleet. Selling products to customers within economic rail transportation limits of the Coffeyville Facility and keeping transportation costs low are keys to maintaining profitability.
The East Dubuque Facility is located in northwest Illinois, in the Mid Corn Belt. The East Dubuque primarily sells its product to customers located within 200 miles of the facility. In most instances, customers take delivery of nitrogen products at the plant and arrange and pay to transport them to their final destinations by truck. The East Dubuque Facility has direct access to a barge dock on the Mississippi River as well as a nearby rail spur serviced by the Canadian National Railway Company.
The high fixed cost of the Coffeyville Facility direct operating expense structure also directly affects our profitability. Our Coffeyville Facility's pet coke gasification process results in a significantly higher percentage of fixed costs than a natural gas-based fertilizer plant. Major fixed operating expenses of our Coffeyville Facility include a large portion of electrical energy, employee labor, maintenance, including contract labor and outside services. We estimate these fixed costs averaged approximately 80% of direct operating expenses over the 24 months ended
June 30, 2016
.
37
Our largest raw material expense used in the production of ammonia at our Coffeyville Facility is pet coke, which we purchase from CVR Refining and third parties. For the three months ended
June 30, 2016
and
2015
, we incurred approximately
$1.6 million
and
$3.1 million
, respectively, for the cost of pet coke, which equaled an average cost per ton of
$12
and
$25
, respectively. For the
six
months ended
June 30, 2016
and
2015
, we incurred approximately
$3.8 million
and
$6.7 million
, respectively, for the cost of pet coke, which equaled an average cost per ton of
$15
and
$27
, respectively.
Our largest raw material expense used in the production of ammonia at our East Dubuque Facility is natural gas, which we purchase from third parties. Our East Dubuque Facility's natural gas process results in a higher percentage of variable costs as compared to the Coffeyville Facility. For the three months ended
June 30, 2016
, we incurred approximately $2.5 million for feedstock natural gas, which equaled an average cost per MMBtu of
$2.33
.
Consistent, safe and reliable operations at our nitrogen fertilizer plants are critical to our financial performance and results of operations. Unplanned downtime may result in lost margin opportunity, increased maintenance expense and a temporary increase in working capital investment and related inventory position. The financial impact of planned downtime, such as major turnaround maintenance, is mitigated through a diligent planning process that takes into account margin environment, the availability of resources to perform the needed maintenance, feedstock logistics and other factors.
Historically, the Coffeyville Facility has undergone a full facility turnaround every two to three years. Turnarounds at the Coffeyville Facility are expected to last 14-21 days. The Coffeyville Facility underwent a full facility turnaround in the third quarter of 2015, at a cost of approximately $7.0 million. The Partnership is planning to undergo the next scheduled full facility turnaround at the Coffeyville Facility in the second half of 2017.
Historically, the East Dubuque Facility has also undergone a full facility turnaround every two to three years. The East Dubuque Facility underwent a full facility turnaround in the second quarter of 2016, at a cost of
$6.6 million
. The Partnership is planning to undergo the next scheduled full facility turnaround at the East Dubuque Facility in 2018.
Agreements with CVR Energy and CVR Refining
We are party to several agreements with CVR Energy and its affiliates that govern the business relations among us, CVR Energy and its subsidiaries (including CVR Refining), and our general partner. These include the pet coke supply agreement under which we buy the pet coke we use in our Coffeyville Facility; a services agreement, under which CVR Energy and its subsidiaries provide us with management services including the services of its senior management team; a feedstock and shared services agreement, which governs the provision of feedstocks for our Coffeyville Facility, including, but not limited to, hydrogen, high-pressure steam, nitrogen, instrument air, oxygen and natural gas; a raw water and facilities sharing agreement, which allocates raw water resources between the two businesses; an easement agreement; an environmental agreement; a lease agreement pursuant to which we lease office space and laboratory space; and certain financing agreements that we entered into in connection with the East Dubuque Merger. These agreements were not the result of arm's-length negotiations and the terms of these agreements are not necessarily as favorable to the parties to these agreements as terms which could have been obtained from unaffiliated third parties. See
Note 14 ("Related Party Transactions")
to Part I, Item 1 of this Report for additional discussion of the agreements.
Factors Affecting Comparability of Our Financial Results
Our historical results of operations for the periods presented may not be comparable with prior periods or to our results of operations in the future for the reason discussed below.
East Dubuque Merger
On April 1, 2016, the Partnership completed the East Dubuque Merger, whereby the Partnership acquired the East Dubuque Facility. The consolidated financial statements and key operating metrics for the three and
six
months ended
June 30, 2016
include the results of the East Dubuque Facility beginning on April 1, 2016, the date of the closing of the acquisition.
During the three and
six
months ended
June 30, 2016
, the Partnership incurred
$1.2 million
and
$2.5 million
, respectively, of legal and other professional fees and other merger-related expenses, which were included in selling, general and administrative expenses (exclusive of depreciation and amortization).
See
Note 4 ("East Dubuque Merger")
for further discussion.
38
Major Scheduled Turnaround Activities
During the second quarter of 2016, the East Dubuque Facility completed a major scheduled turnaround and the ammonia and UAN units were down for approximately 28 days. Overall results were negatively impacted due to the lost production during the downtime that resulted in lost sales and certain reduced variable expenses included in cost of product sold (exclusive of depreciation and amortization) and direct operating expenses (exclusive of depreciation and amortization). Costs of approximately
$6.6 million
associated with the 2016 turnaround are included in direct operating expenses (exclusive of depreciation and amortization) in the Consolidated Statements of Operations for the
three and six
months ended
June 30, 2016
.
Indebtedness
On April 1, 2016, as a result of the East Dubuque Merger, the Partnership acquired CVR Nitrogen, including its debt. During the second quarter of 2016, the Partnership used $300.0 million of funds from the CRLLC Facility to finance the payoff of CVR Partners' $125.0 million term loan, payoff CVR Nitrogen's credit facility outstanding balance of $49.1 million, and to fund the cash merger consideration and certain merger-related expenses. In June 2016, the Partnership issued
$645.0 million
aggregate principal of
9.250%
Senior Notes due 2023 to refinance the substantial majority of its existing debt, including the CRLLC Facility. As a result of the financing transactions, the Partnership wrote off approximately
$5.1 million
, including the write-off of the Tender Offer premium of
$4.7 million
and the unamortized portion of the purchase accounting adjustment of
$0.4 million
and is reflected on the Condensed Consolidated Statements of Operations as loss on extinguishment of debt for the
three and six
months ended
June 30, 2016
. Also as a result of the financing transactions, the Partnership's interest expense increased for the
three and six
months ended
June 30, 2016
as compared to the prior year.
A full discussion regarding the Partnership's indebtedness can be found in
Note 11 ("Debt")
of Part I, Item 1 of this Report.
Results of Operations
The period to period comparisons of our results of operations have been prepared using the historical periods included in our condensed consolidated financial statements. In order to effectively review and assess our historical financial information below, we have also included supplemental operating measures and industry measures that we believe are material to understanding our business.
To supplement our actual results calculated in accordance with GAAP for the applicable periods, the Partnership also uses certain non-GAAP financial measures, which are reconciled to our GAAP-based results below. These non-GAAP financial measures should not be considered as an alternative to GAAP results.
The following tables summarize the financial data and key operating statistics for CVR Partners and our operating subsidiaries for the
three and six
months ended
June 30, 2016
and
2015
. The results of operations for our East Dubuque Facility are included for the post acquisition period of April 1, 2016 through
June 30, 2016
. The following data should be read in conjunction with our condensed consolidated financial statements and the notes thereto included elsewhere in this Report. All information in "Management’s Discussion and Analysis of Financial Condition and Results of Operations," except for the balance sheet data as of
December 31, 2015
, is unaudited.
39
|
Three Months Ended
June 30, |
Six Months Ended
June 30, |
||||||||||||||
|
2016
|
|
2015
|
2016
|
|
2015
|
||||||||||
|
(in millions)
|
|||||||||||||||
|
Consolidated Statements of Operations Data:
|
|||||||||||||||
|
Net sales
|
$
|
119.8
|
|
$
|
80.8
|
|
$
|
192.9
|
|
$
|
173.9
|
|
|||
|
Cost of product sold – Affiliates (1)
|
0.5
|
|
2.2
|
|
1.4
|
|
4.0
|
|
|||||||
|
Cost of product sold – Third parties (1)
|
35.5
|
|
13.2
|
|
51.0
|
|
37.2
|
|
|||||||
|
36.0
|
|
15.4
|
|
52.4
|
|
41.2
|
|
||||||||
|
Direct operating expenses – Affiliates (1) (2) (3)
|
1.2
|
|
1.2
|
|
2.1
|
|
2.2
|
|
|||||||
|
Direct operating expenses – Third parties (1) (3)
|
46.4
|
|
23.5
|
|
69.2
|
|
47.0
|
|
|||||||
|
Major scheduled turnaround expenses
|
6.6
|
|
0.4
|
|
6.6
|
|
0.4
|
|
|||||||
|
54.2
|
|
25.1
|
|
77.9
|
|
49.6
|
|
||||||||
|
Selling, general and administrative expenses – Affiliates (1) (2) (4)
|
3.9
|
|
3.4
|
|
7.4
|
|
6.6
|
|
|||||||
|
Selling, general and administrative expenses – Third parties (1) (4)
|
4.4
|
|
1.2
|
|
7.3
|
|
2.5
|
|
|||||||
|
8.3
|
|
4.6
|
|
14.7
|
|
9.1
|
|
||||||||
|
Depreciation and amortization
|
17.6
|
|
7.0
|
|
24.5
|
|
13.8
|
|
|||||||
|
Operating income
|
3.7
|
|
28.7
|
|
23.4
|
|
60.2
|
|
|||||||
|
Interest expense and other financing costs
|
(15.5
|
)
|
(1.7)
|
|
(17.2
|
)
|
(3.4)
|
|
|||||||
|
Interest income
|
—
|
|
—
|
|
—
|
|
—
|
|
|||||||
|
Loss on extinguishment of debt
|
(5.1
|
)
|
—
|
|
(5.1
|
)
|
—
|
|
|||||||
|
Other income, net
|
—
|
|
—
|
|
—
|
|
—
|
|
|||||||
|
Total other income (expense)
|
(20.6
|
)
|
(1.7
|
)
|
(22.3
|
)
|
(3.4
|
)
|
|||||||
|
Income (loss) before income tax expense
|
(16.9
|
)
|
27.0
|
|
1.1
|
|
56.8
|
|
|||||||
|
Income tax expense
|
0.1
|
|
—
|
|
0.1
|
|
—
|
|
|||||||
|
Net income (loss)
|
$
|
(17.0
|
)
|
$
|
27.0
|
|
$
|
1.0
|
|
$
|
56.8
|
|
|||
|
EBITDA (5)
|
$
|
16.2
|
|
$
|
35.7
|
|
$
|
42.8
|
|
$
|
74.0
|
|
|||
|
Adjusted EBITDA (5)
|
$
|
29.1
|
|
$
|
36.1
|
|
$
|
57.0
|
|
$
|
74.5
|
|
|||
|
Available cash for distribution (6)
|
$
|
19.7
|
|
$
|
28.4
|
|
$
|
50.4
|
|
$
|
61.0
|
|
|||
|
Reconciliation to net sales:
|
|||||||||||||||
|
Sales net at gate
|
$
|
103.3
|
|
$
|
70.5
|
|
$
|
168.1
|
|
$
|
149.7
|
|
|||
|
Freight in revenue
|
8.7
|
|
7.8
|
|
15.6
|
|
14.8
|
|
|||||||
|
Hydrogen revenue
|
0.5
|
|
2.0
|
|
1.6
|
|
8.5
|
|
|||||||
|
Other, including the impact of purchase accounting
|
7.3
|
|
0.5
|
|
7.6
|
|
0.9
|
|
|||||||
|
Total net sales
|
$
|
119.8
|
|
$
|
80.8
|
|
$
|
192.9
|
|
$
|
173.9
|
|
|||
|
As of
June 30, 2016 |
As of
December 31, 2015 |
||||||
|
(audited)
|
|||||||
|
(in millions)
|
|||||||
|
Balance Sheet Data:
|
|||||||
|
Cash and cash equivalents
|
$
|
76.3
|
|
$
|
50.0
|
|
|
|
Working capital
|
97.8
|
|
72.7
|
|
|||
|
Total assets
|
1,352.6
|
|
536.3
|
|
|||
|
Total debt, net of current portion
|
625.3
|
|
124.8
|
|
|||
|
Total partners’ capital
|
672.1
|
|
385.6
|
|
|||
40
|
Three Months Ended
June 30, |
Six Months Ended
June 30, |
||||||||||||||
|
2016
|
2015
|
2016
|
2015
|
||||||||||||
|
(in millions)
|
|||||||||||||||
|
Cash Flow Data:
|
|||||||||||||||
|
Net cash flow provided by (used in):
|
|||||||||||||||
|
Operating activities
|
$
|
5.5
|
|
$
|
30.6
|
|
$
|
29.1
|
|
$
|
56.0
|
|
|||
|
Investing activities
|
(74.0
|
)
|
(3.4
|
)
|
(75.7
|
)
|
(6.0
|
)
|
|||||||
|
Financing activities
|
92.8
|
|
(32.9
|
)
|
72.9
|
|
(62.9
|
)
|
|||||||
|
Net increase (decrease) in cash and cash equivalents
|
$
|
24.3
|
|
$
|
(5.7
|
)
|
$
|
26.3
|
|
$
|
(12.9
|
)
|
|||
|
Capital expenditures:
|
|||||||||||||||
|
Maintenance capital expenditures
|
$
|
4.1
|
|
$
|
2.2
|
|
$
|
4.9
|
|
$
|
3.6
|
|
|||
|
Growth capital expenditures
|
6.0
|
|
1.2
|
|
7.0
|
|
2.4
|
|
|||||||
|
Total capital expenditures
|
$
|
10.1
|
|
$
|
3.4
|
|
$
|
11.9
|
|
$
|
6.0
|
|
|||
______________________________
|
(1)
|
Amounts are shown exclusive of depreciation and amortization. Depreciation and amortization is primarily comprised of the following components:
|
|
Three Months Ended
June 30, |
Six Months Ended
June 30, |
||||||||||||||
|
2016
|
2015
|
2016
|
2015
|
||||||||||||
|
(in millions)
|
|||||||||||||||
|
Depreciation and amortization excluded from direct operating expenses
|
$
|
17.3
|
|
$
|
6.9
|
|
$
|
24.1
|
|
$
|
13.5
|
|
|||
|
Depreciation and amortization excluded from cost of product sold
|
0.2
|
|
0.1
|
|
0.3
|
|
0.3
|
|
|||||||
|
Depreciation and amortization excluded from selling, general and administrative expenses
|
0.1
|
|
—
|
|
0.1
|
|
—
|
|
|||||||
|
|
$
|
17.6
|
|
$
|
7.0
|
|
$
|
24.5
|
|
$
|
13.8
|
|
|||
|
(2)
|
Our selling, general and administrative expenses and direct operating expenses include amounts for share-based compensation charges, which include amounts related to CVR Energy's share-based compensation expense allocated to us by CVR Energy for financial reporting purposes. See
|
|
(3)
|
Amounts are shown exclusive of major scheduled turnaround expenses that are separately disclosed.
|
|
(4)
|
The Partnership incurred approximately
$1.2 million
and
$2.5 million
of legal and other professional fees and other merger-related expenses for the three and
six
months ended
June 30, 2016
, respectively, as discussed in
Note 4 ("East Dubuque Merger")
to Part I, Item 1 of this Report, which are included in selling, general and administrative expenses.
|
|
(5)
|
EBITDA is defined as net income (loss) before (i) interest (income) expense, (ii) income tax expense and (iii) depreciation and amortization expense.
|
Adjusted EBITDA is defined as EBITDA further adjusted for the impact of non-cash share-based compensation, and, when applicable, major scheduled turnaround expenses, loss on extinguishment of debt, loss on disposition of assets and expenses associated with the East Dubuque Merger.
41
We present EBITDA because we believe it allows users of our financial statements, such as investors and analysts, to assess our financial performance without regard to financing methods, capital structure or historical cost basis. We present Adjusted EBITDA because we have found it helpful to consider an operating measure that excludes expenses, such as major scheduled turnaround expenses, loss on extinguishment of debt, loss on disposition of assets and expenses associated with the East Dubuque Merger, relating to transactions not reflective of our core operations. When applicable, each of these expenses is discussed herein, so that investors have complete information about expenses. In addition, we believe that it is useful to exclude from Adjusted EBITDA non-cash share-based compensation, although it is a recurring cost incurred in the ordinary course of business. In our view, non-cash share-based compensation, which also is presented in our financial statements and discussed herein, reflects a non-cash cost which may obscure, for a given period, trends in the underlying business, due to the timing and nature of the equity awards. We also present Adjusted EBITDA because it is the starting point used by the board of directors of our general partner when calculating our available cash for distribution.
EBITDA and Adjusted EBITDA are not recognized terms under GAAP and should not be substituted for net income (loss) or cash flows from operations. Management believes that EBITDA and Adjusted EBITDA enable investors and analysts to better understand our ability to make distributions to common unitholders, help investors and analysts evaluate our ongoing operating results and allow for greater transparency in reviewing our overall financial, operational and economic performance by allowing investors to evaluate the same information used by management. EBITDA and Adjusted EBITDA presented by other companies may not be comparable to our presentation, since each company may define these terms differently.
A reconciliation of our Net Income (Loss) to EBITDA and Adjusted EBITDA is as follows:
|
Three Months Ended
June 30, |
Six Months Ended
June 30, |
||||||||||||||
|
2016
|
2015
|
2016
|
2015
|
||||||||||||
|
(in millions)
|
|||||||||||||||
|
Net income (loss)
|
$
|
(17.0
|
)
|
$
|
27.0
|
|
$
|
1.0
|
|
$
|
56.8
|
|
|||
|
Add:
|
|||||||||||||||
|
Interest expense and other financing costs, net
|
15.5
|
|
1.7
|
|
17.2
|
|
3.4
|
|
|||||||
|
Income tax expense
|
0.1
|
|
—
|
|
0.1
|
|
—
|
|
|||||||
|
Depreciation and amortization
|
17.6
|
|
7.0
|
|
24.5
|
|
13.8
|
|
|||||||
|
EBITDA
|
$
|
16.2
|
|
$
|
35.7
|
|
$
|
42.8
|
|
$
|
74.0
|
|
|||
|
Add:
|
|||||||||||||||
|
Major scheduled turnaround expenses
|
6.6
|
|
0.4
|
|
6.6
|
|
0.4
|
|
|||||||
|
Share-based compensation, non-cash
|
—
|
|
—
|
|
—
|
|
0.1
|
|
|||||||
|
Loss on extinguishment of debt
|
5.1
|
|
—
|
|
5.1
|
|
—
|
|
|||||||
|
Expenses associated with the East Dubuque Merger
|
1.2
|
|
—
|
|
2.5
|
|
—
|
|
|||||||
|
Adjusted EBITDA
|
$
|
29.1
|
|
$
|
36.1
|
|
$
|
57.0
|
|
$
|
74.5
|
|
|||
|
(6)
|
The board of directors of our general partner has a policy to calculate available cash for distribution starting with Adjusted EBITDA. For the
three and six
months ended
June 30, 2016
and
2015
, available cash for distribution equaled our Adjusted EBITDA reduced for cash needed for (i) net cash interest expense (excluding capitalized interest) and debt service and other contractual obligations; (ii) maintenance capital expenditures; and (iii) to the extent applicable, major scheduled turnaround expenses, reserves for future operating or capital needs that the board of directors of the general partner deemed necessary or appropriate, and transaction expenses associated with the East Dubuque Merger, if any. Available cash for distribution may be increased by the release of previously established cash reserves, if any, at the discretion of the board of directors of our general partner, and available cash is increased by the business interruption insurance proceeds and the impact of purchase accounting. Actual distributions are set by the board of directors of our general partner. The board of directors of our general partner may modify our cash distribution policy at any time, and our partnership agreement does not require us to make distributions at all.
|
Available cash for distribution is not a recognized term under GAAP. Available cash for distribution should not be considered in isolation or as an alternative to net income (loss) or operating income, or any other measure of financial performance or operating performance. In addition, available cash for distribution is not presented as, and should not be considered, an alternative to cash flows from operations or as a measure of liquidity. Available cash for distribution as reported by the Partnership may not be comparable to similarly titled measures of other entities, thereby limiting its usefulness as a comparative measure.
42
A reconciliation of the available cash for distribution is as follows:
|
Three Months Ended
June 30, |
Six Months Ended
June 30, |
||||||||||||||
|
2016
|
2015
|
2016
|
2015
|
||||||||||||
|
(in millions, except units and per unit data)
|
|||||||||||||||
|
Adjusted EBITDA
|
$
|
29.1
|
|
$
|
36.1
|
|
$
|
57.0
|
|
$
|
74.5
|
|
|||
|
Adjustments:
|
|||||||||||||||
|
Less:
|
|||||||||||||||
|
Net cash interest expense (excluding capitalized interest) and debt service
|
(14.5
|
)
|
(1.5
|
)
|
(15.9
|
)
|
(2.9
|
)
|
|||||||
|
Maintenance capital expenditures
|
(4.1
|
)
|
(2.2
|
)
|
(4.9
|
)
|
(3.6
|
)
|
|||||||
|
Major scheduled turnaround expenses
|
(6.6
|
)
|
(0.4
|
)
|
(6.6
|
)
|
(0.4
|
)
|
|||||||
|
Cash reserves for future turnaround expenses
|
—
|
|
(4.0
|
)
|
—
|
|
(7.0
|
)
|
|||||||
|
Expenses associated with the East Dubuque Merger
|
(1.2
|
)
|
—
|
|
(2.5
|
)
|
—
|
|
|||||||
|
Plus:
|
|||||||||||||||
|
Insurance recovery - business interruption
|
4.0
|
|
—
|
|
4.0
|
|
—
|
|
|||||||
|
Impact of purchase accounting
|
13.0
|
|
—
|
|
13.0
|
|
—
|
|
|||||||
|
Available cash associated with East Dubuque 2016 first quarter
|
—
|
|
—
|
|
6.3
|
|
—
|
|
|||||||
|
Release of cash reserves established for turnaround expenses
|
—
|
|
0.4
|
|
—
|
|
0.4
|
|
|||||||
|
Available cash for distribution
|
$
|
19.7
|
|
$
|
28.4
|
|
$
|
50.4
|
|
$
|
61.0
|
|
|||
|
Available cash for distribution, per common unit
|
$
|
0.17
|
|
$
|
0.39
|
|
$
|
0.44
|
|
$
|
0.84
|
|
|||
|
Common units outstanding (in thousands)
|
113,283
|
|
73,123
|
|
113,283
|
|
73,123
|
|
|||||||
43
The following tables show selected information about key operating statistics and market indicators for our business:
|
|
Three Months Ended
June 30, |
|
Six Months Ended
June 30, |
||||||||||||
|
|
2016
|
|
2015
|
|
2016
|
|
2015
|
||||||||
|
Key Operating Statistics:
|
|
|
|
||||||||||||
|
|
|
|
|
||||||||||||
|
Consolidated sales (thousand tons):
|
|
|
|
||||||||||||
|
Ammonia
|
73.6
|
|
6.3
|
|
98.0
|
|
19.1
|
|
|||||||
|
UAN
|
339.4
|
|
249.8
|
|
606.4
|
|
524.3
|
|
|||||||
|
|
|
|
|
||||||||||||
|
Consolidated product pricing at gate (dollars per ton) (1):
|
|
|
|
||||||||||||
|
Ammonia
|
$
|
417
|
|
$
|
546
|
|
$
|
405
|
|
$
|
551
|
|
|||
|
UAN
|
$
|
199
|
|
$
|
269
|
|
$
|
204
|
|
$
|
265
|
|
|||
|
|
|
|
|
||||||||||||
|
Consolidated production volume (thousand tons):
|
|
|
|
||||||||||||
|
Ammonia (gross produced) (2)
|
171.5
|
|
107.1
|
|
285.1
|
|
203.0
|
|
|||||||
|
Ammonia (net available for sale) (2) (3)
|
45.6
|
|
4.4
|
|
60.7
|
|
19.1
|
|
|||||||
|
UAN
|
296.5
|
|
253.5
|
|
544.7
|
|
505.6
|
|
|||||||
|
|
|
|
|
||||||||||||
|
Feedstock:
|
|||||||||||||||
|
Petroleum coke used in production (thousand tons) (4)
|
130.6
|
|
128.2
|
|
257.5
|
|
253.1
|
|
|||||||
|
Petroleum coke used in production (dollars per ton) (4)
|
$
|
12
|
|
$
|
25
|
|
$
|
15
|
|
$
|
27
|
|
|||
|
Natural gas used in production (MMBtu) (5)
|
1,396.1
|
|
—
|
|
1,396.1
|
|
—
|
|
|||||||
|
Natural gas used in production (dollars per MMBtu) (5)
|
$
|
2.41
|
|
$
|
—
|
|
$
|
2.41
|
|
$
|
—
|
|
|||
|
Natural gas in cost of product sold (MMBtu) (5)
|
1,063.0
|
|
—
|
|
1,063.0
|
|
—
|
|
|||||||
|
Natural gas in cost of product sold (dollars per MMBtu) (5)
|
$
|
2.33
|
|
$
|
—
|
|
$
|
2.33
|
|
$
|
—
|
|
|||
|
|
|
|
|
||||||||||||
|
Coffeyville Facility on-stream factors (6):
|
|||||||||||||||
|
Gasification
|
98.0
|
%
|
100.0
|
%
|
97.8
|
%
|
99.7
|
%
|
|||||||
|
Ammonia
|
96.6
|
%
|
99.3
|
%
|
96.9
|
%
|
96.9
|
%
|
|||||||
|
UAN
|
93.7
|
%
|
96.6
|
%
|
92.5
|
%
|
97.2
|
%
|
|||||||
|
East Dubuque Facility on-stream factors (6):
|
|||||||||||||||
|
Ammonia
|
68.6
|
%
|
—
|
%
|
68.6
|
%
|
—
|
%
|
|||||||
|
UAN
|
69.1
|
%
|
—
|
%
|
69.1
|
%
|
—
|
%
|
|||||||
|
|
|
|
|
||||||||||||
|
Market Indicators:
|
|
|
|
||||||||||||
|
Ammonia - Southern Plains (dollars per ton)
|
$
|
419
|
|
$
|
546
|
|
$
|
397
|
|
$
|
550
|
|
|||
|
Ammonia - Corn belt (dollars per ton)
|
$
|
489
|
|
$
|
601
|
|
$
|
465
|
|
$
|
604
|
|
|||
|
UAN - Corn belt (dollars per ton)
|
$
|
239
|
|
$
|
305
|
|
$
|
234
|
|
$
|
309
|
|
|||
|
Natural gas NYMEX (dollars per MMBtu)
|
$
|
2.25
|
|
$
|
2.74
|
|
$
|
2.12
|
|
$
|
2.77
|
|
|||
______________________________
|
(1)
|
Product pricing at gate represents net sales less freight revenue divided by product sales volume in tons and is shown in order to provide a pricing measure that is comparable across the fertilizer industry.
|
|
(2)
|
Gross tons produced for ammonia represent total ammonia produced, including ammonia produced that was upgraded into other fertilizer products. Net tons available for sale represent ammonia available for sale that was not upgraded into other fertilizer products.
|
44
|
(3)
|
In addition to the produced ammonia, the Partnership acquired approximately
5.0 thousand
tons and
0.6 thousand
tons of ammonia during the three months ended
June 30, 2016
and
2015
, respectively. The Partnership acquired approximately
8.0 thousand
tons and
21.8 thousand
tons of ammonia during the
six
months ended
June 30, 2016
and
2015
, respectively.
|
|
(4)
|
Our pet coke cost per ton purchased from CVR Refining averaged
$5
and
$21
for the three months ended
June 30, 2016
and
2015
, respectively. Third-party pet coke prices averaged
$33
and
$39
for the three months ended
June 30, 2016
and
2015
, respectively. For the
six
months ended
June 30, 2016
and
2015
, our pet coke cost per ton purchased from CVR Refining averaged
$7
and
$21
, respectively. For the
six
months ended
June 30, 2016
and
2015
, third-party pet coke prices averaged
$33
and
$42
, respectively.
|
|
(5)
|
The cost per MMBtu excludes derivative activity, when applicable. The impact of natural gas derivative activity during the three and
six
months ended
June 30, 2016
and
2015
was not material.
|
|
(6)
|
On-stream factor is the total number of hours operated divided by the total number of hours in the reporting period and is included as a measure of operating efficiency.
|
Excluding the impact of the full facility turnaround at the East Dubuque Facility, the on-stream factors at the East Dubuque Facility would have been
100.0%
for ammonia and
99.6%
for UAN for the three months ended
June 30, 2016
.
Three Months Ended
June 30, 2016
Compared to the Three Months Ended
June 30, 2015
Net Sales.
Net sales were
$119.8 million
for the three months ended
June 30, 2016
compared to
$80.8 million
for the three months ended
June 30, 2015
. The
increase
of
$39.0 million
for the three months ended
June 30, 2016
compared to the three months ended
June 30, 2015
is primarily attributable to increased sales volumes due to the inclusion of the full quarter of the East Dubuque Facility (
$59.7 million
). For the three months ended
June 30, 2016
, UAN and ammonia made up
$76.7 million
and
$31.4 million
of our net sales, respectively. This compared to UAN and ammonia net sales of
$74.8 million
and
$3.5 million
, respectively, for the three months ended
June 30, 2015
.
Excluding the East Dubuque acquisition, net sales would have decreased by $20.7 million. The following table demonstrates the impact of changes in sales volumes and pricing for the primary components of net sales at the Coffeyville Facility for the three months ended
June 30, 2016
as compared to the three months ended
June 30, 2015
:
|
Price
Variance
|
Volume
Variance
|
||||||
|
(in millions)
|
|||||||
|
UAN
|
$
|
(18.2
|
)
|
$
|
(1.2
|
)
|
|
|
Ammonia
|
$
|
(1.1
|
)
|
$
|
0.6
|
|
|
|
Hydrogen
|
$
|
(0.2
|
)
|
$
|
(1.3
|
)
|
|
The decrease in UAN and ammonia sales prices for the three months ended
June 30, 2016
compared to the three months ended
June 30, 2015
was primarily attributable to pricing fluctuation in the market.
Cost of Product Sold (Exclusive of Depreciation and Amortization).
Cost of product sold consists primarily of freight and distribution expenses, feedstock expenses, purchased ammonia and purchased hydrogen. Cost of product sold for the three months ended
June 30, 2016
was
$36.0 million
, compared to
$15.4 million
for the three months ended
June 30, 2015
. The
$20.6 million
increase
was primarily attributable to the inclusion of the full quarter of the East Dubuque Facility (
$23.0 million
).
Excluding the East Dubuque acquisition, cost of product sold decreased $2.4 million, primarily due to lower costs from transactions with affiliates of $1.7 million and third parties of $0.7 million. The lower affiliate costs incurred were primarily the result of lower CVR Refining pet coke pricing. The decrease in third-party costs incurred was primarily the result of less product shipments, partially offset by increased railcar repairs and inspections.
Direct Operating Expenses (Exclusive of Depreciation and Amortization).
Direct operating expenses consist primarily of energy and utility costs, direct costs of labor, property taxes, plant-related maintenance services and environmental and safety compliance costs as well as catalyst and chemical costs. Direct operating expenses for the three months ended
June 30, 2016
were
$54.2 million
as compared to
$25.1 million
for the three months ended
June 30, 2015
. The
$29.1 million
increase
is primarily attributable to the inclusion of the full quarter of the East Dubuque Facility (
$31.7 million
).
45
Excluding the East Dubuque acquisition, direct operating expenses decreased $2.6 million, primarily from lower utilities, net. The lower utilities, net is primarily the result of lower electrical rates.
Selling, General and Administrative Expenses (Exclusive of Depreciation and Amortization).
Selling, general and administrative expenses include the direct selling, general and administrative expenses of our business as well as certain expenses incurred by our affiliates, CVR Energy and CRLLC, on our behalf and billed or allocated to us in accordance with the applicable agreements. We also reimburse our general partner in accordance with the partnership agreement for expenses it incurs on our behalf. Reimbursed expenses to our general partner are included as selling, general and administrative expenses from affiliates. Selling, general and administrative expenses were
$8.3 million
for the three months ended
June 30, 2016
and
$4.6 million
for the three months ended
June 30, 2015
. The
$3.7 million
increase
is primarily attributable to the inclusion of the full quarter of the East Dubuque Facility (
$2.6 million
) and expenses associated with the East Dubuque Merger (
$1.2 million
).
Depreciation and Amortization Expense.
Depreciation expense was
$17.6 million
for the three months ended
June 30, 2016
, as compared to
$7.0 million
for the three months ended
June 30, 2015
. The
increase
of
$10.6 million
is primarily attributable to the inclusion of the full quarter of the East Dubuque Facility.
Operating Income.
Operating income was
$3.7 million
for the three months ended
June 30, 2016
, as compared to operating income of
$28.7 million
for the three months ended
June 30, 2015
. The
decrease
of
$25.0 million
was the result of the increases in cost of product sold ($20.6 million), direct operating expenses ($29.1 million), depreciation and amortization ($10.6 million) and selling general and administrative expenses ($3.7 million), partially offset by increases in net sales ($39.0 million).
Interest Expense and Other Financing Costs.
Interest expense was
$15.5 million
for the three months ended
June 30, 2016
, as compared to
$1.7 million
for the three months ended
June 30, 2015
. The
increase
of
$13.8 million
was primarily due to the debt assumed in the East Dubuque Merger, the higher interest rate CRLLC Facility and higher interest rate on the 2023 Notes.
Six Months Ended
June 30, 2016
Compared to the
Six Months Ended
June 30, 2015
Net Sales.
Net sales were
$192.9 million
for the
six
months ended
June 30, 2016
compared to
$173.9 million
for the
six
months ended
June 30, 2015
. The
increase
of
$19.0 million
is primarily attributable to increased sales volume due to the inclusion of the full quarter of the East Dubuque Facility (
$59.7 million
). For the
six
months ended
June 30, 2016
, UAN and ammonia made up
$138.1 million
and
$40.5 million
of our net sales, respectively. This compared to UAN and ammonia net sales of
$153.7 million
and
$10.8 million
, respectively, for the
six
months ended
June 30, 2015
.
Excluding the East Dubuque acquisition, net sales would have decreased by $40.7 million. The following table demonstrates the impact of changes in sales volumes and pricing for the primary components of net sales at the Coffeyville Facility for the
six
months ended
June 30, 2016
as compared to the
six
months ended
June 30, 2015
:
|
Price
Variance
|
Volume
Variance
|
||||||
|
(in millions)
|
|||||||
|
UAN
|
$
|
(31.7
|
)
|
$
|
(4.3
|
)
|
|
|
Ammonia
|
$
|
(5.8
|
)
|
$
|
7.1
|
|
|
|
Hydrogen
|
$
|
(0.8
|
)
|
$
|
(6.0
|
)
|
|
The decrease in UAN and ammonia sales prices for the
six
months ended
June 30, 2016
compared to the
six
months ended
June 30, 2015
was primarily attributable to pricing fluctuation in the market. The increase of ammonia sales volume for the
six
months ended
June 30, 2016
compared to the
six
months ended
June 30, 2015
was primarily attributable to the timing of customer demand.
Cost of Product Sold (Exclusive of Depreciation and Amortization).
Cost of product sold consists primarily of freight and distribution expenses, feedstock expenses, purchased ammonia and purchased hydrogen. Cost of product sold for the
six
months ended
June 30, 2016
was
$52.4 million
, compared to
$41.2 million
for the
six
months ended
June 30, 2015
. The
$11.2 million
increase
was primarily attributable to the inclusion of the full quarter of the East Dubuque Facility (
$23.0 million
).
46
Excluding the East Dubuque acquisition, cost of product sold decreased $11.8 million, primarily due to lower costs from transactions with third parties of $9.2 million and affiliates of $2.6 million. The lower third-party costs incurred was primarily the result of less purchased ammonia. The lower affiliate costs incurred were primarily the result of lower expense of CVR Refining pet coke. The decrease in affiliate and third-party coke expense was primarily related to decreased market prices of petroleum coke.
Direct Operating Expenses (Exclusive of Depreciation and Amortization).
Direct operating expenses consist primarily of energy and utility costs, direct costs of labor, property taxes, plant-related maintenance services and environmental and safety compliance costs as well as catalyst and chemical costs. Direct operating expenses for the
six
months ended
June 30, 2016
were
$77.9 million
as compared to
$49.6 million
for the
six
months ended
June 30, 2015
. The
$28.3 million
increase
is primarily attributable to the inclusion of the full quarter of the East Dubuque Facility (
$31.7 million
).
Excluding the East Dubuque acquisition, direct operating expenses
decrease
d $3.4 million, primarily from lower utilities, net. The lower utilities, net is primarily the result of lower electrical rates.
Selling, General and Administrative Expenses (Exclusive of Depreciation and Amortization).
Selling, general and administrative expenses include the direct selling, general and administrative expenses of our business as well as certain expenses incurred by our affiliates, CVR Energy and CRLLC, on our behalf and billed or allocated to us in accordance with the applicable agreements. We also reimburse our general partner in accordance with the partnership agreement for expenses it incurs on our behalf. Reimbursed expenses to our general partner are included as selling, general and administrative expenses from affiliates. Selling, general and administrative expenses were
$14.7 million
for the
six
months ended
June 30, 2016
and
$9.1 million
for the
six
months ended
June 30, 2015
. The
$5.6 million
increase
is primarily attributable to the inclusion of the full quarter of the East Dubuque Facility. The increase includes the effect of the acquisition of the East Dubuque Facility (
$2.6 million
) and expenses associated with the East Dubuque Merger (
$2.5 million
).
Depreciation and Amortization Expense.
Depreciation expense was
$24.5 million
for the
six
months ended
June 30, 2016
, as compared to
$13.8 million
for the
six
months ended
June 30, 2015
. The
increase
of
$10.7 million
included
$10.6 million
attributable to the inclusion of a full quarter of the East Dubuque Facility.
Operating Income.
Operating income was
$23.4 million
for the
six
months ended
June 30, 2016
, as compared to operating income of
$60.2 million
for the
six
months ended
June 30, 2015
. The
decrease
of
$36.8 million
was the result of the increases in cost of product sold ($11.2 million), direct operating expenses ($28.3 million), depreciation and amortization ($10.7 million) and selling general and administrative expenses ($5.6 million), partially offset by increases in net sales ($19.0 million).
Interest Expense and Other Financing Costs.
Interest expense was
$17.2 million
for the
six
months ended
June 30, 2016
, as compared to
$3.4 million
for the
six
months ended
June 30, 2015
. The
decrease
of
$13.8 million
was primarily due to the debt assumed in the East Dubuque Merger, the higher interest rate CRLLC Facility and higher interest rate on the 2023 Notes.
Liquidity and Capital Resources
Our principal source of liquidity has historically been cash from operations, which can include cash advances from customers resulting from forward sales. Our principal uses of cash are funding our operations, distributions to common unitholders, capital expenditures and funding our debt service obligations.
We believe that our cash from operations will be adequate to satisfy anticipated commitments and planned capital expenditures for the next twelve months. However, our future capital expenditures and other cash requirements could be higher than we currently expect as a result of various factors. Additionally, our ability to generate sufficient cash from our operating activities and secure additional financing depends on our future performance, which is subject to general economic, political, financial, competitive and other factors outside of our control.
Depending on the needs of our business, contractual limitations and market conditions, we may from time to time seek to issue equity securities, incur additional debt, issue debt securities, or otherwise refinance our existing debt. There can be no assurance that we will seek to do any of the foregoing or that we will be able to do any of the foregoing on terms acceptable to us or at all. Further discussion of declared cash distributions is included below under
"Distributions to Unitholders."
47
Cash Balance and Other Liquidity
As of
June 30, 2016
, we had cash and cash equivalents of
$76.3 million
, including
$1.3 million
of customer advances. Working capital at
June 30, 2016
was
$97.8 million
, consisting of
$151.8 million
in current assets and approximately
$54.0 million
in current liabilities. Working capital at
December 31, 2015
was
$72.7 million
, consisting of
$98.5 million
in current assets and
$25.9 million
in current liabilities. As of
July 26, 2016
, we had cash and cash equivalents of $74.1 million.
Financing Activities
On April 1, 2016, we incurred additional indebtedness in connection with consummating the East Dubuque Merger. The additional indebtedness included the Wells Fargo Credit Agreement, the 2021 Notes and amounts drawn on the CRLLC Facility. The outstanding balance under the Wells Fargo Credit Agreement was repaid in full and terminated on April 1, 2016 utilizing funds from the CRLLC Facility. The CRLLC Facility is discussed further in
Note 11 ("Debt")
to Part I, Item 1 of this Report.
Also on April 1, 2016, the Partnership repaid all amounts outstanding under the Credit Agreement as further discussed in
Note 11 ("Debt")
to Part I, Item 1 of this Report. Effective upon such repayment, the Credit Agreement and all related loan documents and security interests were terminated and released. The repayment was funded from amounts drawn on the CRLLC Facility.
In June 2016, the Partnership and CVR Nitrogen Finance issued
$645.0 million
aggregate principal amount of the 2023 Notes. The Partnership received approximately
$622.9 million
of cash proceeds, net of the original issue discount and underwriting fees, but before deducting other third-party fees and expenses associated with the offering. The net proceeds from the sale of the 2023 Notes were used to (i) repay all amounts outstanding under the CRLLC Facility; (ii) finance the 2021 Notes Tender Offer and (iii) pay related fees and expenses.
On June 10, 2016, the Partnership paid off the
$300.0 million
outstanding under the CRLLC Facility and paid $7.0 million in interest, and the CRLLC Facility was terminated.
Also in June 2016, the Partnership repaid the substantial majority of the aggregate principal amount outstanding under the 2021 Notes in connection with the Tender Offer and the Change of Control Offer. The total amount paid related to the Tender Offer and Change of Control Offer was approximately $320.6 million, including an approximate
$4.7 million
premium. As of June 30, 2016,
$4,195,000
of aggregate principal amount of the 2021 Notes was outstanding. As of
June 30, 2016
, the 2021 Notes contain substantially no restrictive covenants and are not secured.
2023 Notes
On June 10, 2016, the Partnership and CVR Nitrogen Finance issued
$645.0 million
aggregate principal amount of 9.250% Senior Secured Notes due 2023. The 2023 Notes were issued at a
$16.1 million
discount, which is being amortized over the term of the 2023 Notes as interest expense using the effective-interest method. As a result of the issuance, approximately
$7.9 million
of debt issuance costs were incurred, which are being amortized over the term of the 2023 Notes as interest expense using the effective-interest method.
The 2023 Notes are guaranteed on a senior secured basis by all of the Partnership’s existing subsidiaries.
At any time prior to June 15, 2019, we may on any of one or more occasions redeem up to 35% of the aggregate principal amount of the 2023 Notes issued under the indenture governing the 2023 Notes in an amount not greater than the net proceeds of one or more public equity offerings at a redemption price of 109.250% of the principal amount of the 2023 Notes, plus any accrued and unpaid interest to the date of redemption. Prior to June 15, 2019, we may on any one or more occasions redeem all or part of the 2023 Notes at a redemption price equal to the sum of: (i) the principal amount thereof, plus (ii) the Make Whole Premium, as defined in the indenture governing the 2023 Notes, at the redemption date, plus any accrued and unpaid interest to the applicable redemption date.
On and after June 15, 2019, we may on any one or more occasions redeem all or a part of the 2023 Notes at the redemption prices (expressed as percentages of principal amount) set forth below, plus any accrued and unpaid interest to the applicable redemption date on such Notes, if redeemed during the twelve-month period beginning on June 15 of the years indicated below:
48
|
Year
|
Percentage
|
|
|
2019
|
104.625%
|
|
|
2020
|
102.313%
|
|
|
2021 and thereafter
|
100.000%
|
|
Upon the occurrence of certain change of control events as defined in the indenture (including the sale of all or substantially all of the properties or assets of the Partnership and its subsidiaries, taken as a whole), each holder of the 2023 Notes will have the right to require that the Partnership repurchase all or a portion of such holder’s 2023 Notes in cash at a purchase price equal to 101% of the aggregate principal amount thereof plus any accrued and unpaid interest to the date of repurchase.
The 2023 Notes contain customary covenants for a financing of this type that, among other things, restrict the Partnership’s ability and the ability of certain of its subsidiaries to: (i) sell assets; (ii) pay distributions on, redeem or repurchase the Partnership’s units or redeem or repurchase its subordinated debt; (iii) make investments; (iv) incur or guarantee additional indebtedness or issue preferred units; (v) create or incur certain liens; (vi) enter into agreements that restrict distributions or other payments from the Partnership’s restricted subsidiaries to the Partnership; (vii) consolidate, merge or transfer all or substantially all of the Partnership’s assets; (viii) engage in transactions with affiliates; and (ix) create unrestricted subsidiaries. Most of the foregoing covenants would cease to apply at such time that the 2023 Notes are rated investment grade by both Standard & Poor's Ratings Services and Moody's Investors Service, Inc. However, such covenants would be reinstituted if the 2023 Notes subsequently lost their investment grade rating. In addition, the indenture contains customary events of default, the occurrence of which would result in, or permit the trustee or the holders of at least 25% of the 2023 Notes to cause, the acceleration of the 2023 Notes, in addition to the pursuit of other available remedies.
The indenture governing the 2023 Notes prohibits us from making distributions to unitholders if any default or event of default (as defined in the indenture) exists. In addition, the indenture limits our ability to pay distributions to unitholders. The covenants will apply differently depending on our fixed charge coverage ratio (as defined in the indenture). If the fixed charge coverage ratio is not less than 1.75 to 1.0, we will generally be permitted to make restricted payments, including distributions to our unitholders, without substantive restriction. If the fixed charge coverage ratio is less than 1.75 to 1.0, we will generally be permitted to make restricted payments, including distributions to our unitholders, up to an aggregate $75.0 million basket plus certain other amounts referred to as "incremental funds" under the indenture. We were in compliance with the covenants as of June 30, 2016, and the ratio was satisfied (not less than 1.75 to 1.0).
Capital Spending
Our total capital expenditures for the
six
months ended
June 30, 2016
were approximately
$11.9 million
. We divide our capital spending needs into two categories: maintenance and growth. Maintenance capital spending includes only non-discretionary maintenance projects and projects required to comply with environmental, health and safety regulations. We also treat maintenance capital spending as a reduction of cash available for distribution to unitholders. Growth capital projects generally involve an expansion of existing capacity, improvement in product yields and/or a reduction in direct operating expenses. Major scheduled turnaround expenses are expensed when incurred.
Capital spending for our business has been and will be determined by the Board of Directors of our general partner. The following table summarizes our total actual capital expenditures for the
six
months ended
June 30, 2016
and current estimated capital expenditures for 2016 by major category:
|
Six Months Ended
June 30, 2016 |
2016 Full Year Estimate
(1)
|
||||||
|
(in millions)
|
|||||||
|
Maintenance
|
$
|
4.9
|
|
$
|
19.0
|
|
|
|
Growth
|
7.0
|
|
14.0
|
|
|||
|
Total capital spending
|
$
|
11.9
|
|
$
|
33.0
|
|
|
_____________
|
(1)
|
Includes amounts already spent during the
six
months ended
June 30, 2016
for the Coffeyville Facility and amounts already spent during the three months ended
June 30, 2016
for the East Dubuque Facility.
|
49
An ammonia synthesis converter was replaced at the East Dubuque Facility during the second quarter of 2016. The new ammonia synthesis converter is expected to increase reliability, production and plant efficiency. Growth capital expenditures for the ammonia synthesis converter were $5.3 million during the three months ended June 30, 2016. The total remaining expenditures for this project are estimated to be between
$3.0 million
to
$5.0 million
.
Future capital spending estimates may change as a result of unforeseen circumstances and a change in our plans and may be revised from time to time or amounts may not be spent in the manner discussed herein. Planned capital expenditures for
2016
are subject to change due to unanticipated increases in the cost, scope and completion time for our capital projects. For example, we may experience increases in labor or equipment costs necessary to comply with government regulations or to complete projects that sustain or improve the profitability of our nitrogen fertilizer plants.
Major Scheduled Turnaround Expenditures
Consistent, safe and reliable operations are critical to our financial performance and results of operations. Unplanned downtime of either plant may result in lost margin opportunity, increased maintenance expense and a temporary increase in working capital investment and related inventory position. The financial impact of planned downtime, such as major turnaround maintenance, is mitigated through a diligent planning process that takes into account margin environment, the availability of resources to perform the needed maintenance, feedstock logistics and other factors.
Historically, the East Dubuque Facility has also undergone a full facility turnaround every two to three years. The East Dubuque Facility underwent a full facility turnaround in the second quarter of 2016, at a cost of approximately
$6.6 million
. The Partnership is planning to undergo the next scheduled full facility turnaround at the East Dubuque Facility in 2018.
Historically, the Coffeyville Facility has undergone a full facility turnaround every two to three years. The Coffeyville Facility underwent a full facility turnaround in the third quarter of 2015, at a cost of approximately $7.0 million. The Partnership is planning to undergo the next scheduled full facility turnaround at the Coffeyville Facility in the second half of 2017. Turnarounds at the Coffeyville Facility are expected to last 14-21 days.
Distributions to Unitholders
The board of directors of the Partnership's general partner has a policy for the Partnership to distribute all available cash generated on a quarterly basis. Our policy is disclosed in
Note 8 ("Partners’ Capital and Partnership Distributions")
to Part I, Item 1 of this Report.
|
December 31,
2015 |
March 31,
2016
(1)
|
Total Cash Distributions
Paid in 2016
|
|||||||||
|
($ in millions, except per common unit amounts)
|
|||||||||||
|
Amount paid to CRLLC
|
$
|
10.5
|
|
$
|
10.5
|
|
$
|
21.0
|
|
||
|
Amount paid to public unitholders
|
9.2
|
|
20.1
|
|
29.3
|
|
|||||
|
Total amount paid
|
$
|
19.7
|
|
$
|
30.6
|
|
$
|
50.3
|
|
||
|
Per common unit
|
$
|
0.27
|
|
$
|
0.27
|
|
$
|
0.54
|
|
||
|
Common units outstanding (in thousands)
|
73,128
|
|
113,283
|
|
|||||||
______________________________
(1) The distribution per common unit for the three months ended March 31, 2016 is calculated based on the post-merger common units outstanding.
See Note 16 ("Subsequent Events")
to Part I, Item 1 of this Report for information on the Partnership's second quarter of 2016 distribution.
50
Cash Flows
The following table sets forth our cash flows for the periods indicated below:
|
|
Six Months Ended
June 30, |
||||||
|
2016
|
2015
|
||||||
|
(in millions)
|
|||||||
|
Net cash flow provided by (used in):
|
|||||||
|
Operating activities
|
$
|
29.1
|
|
$
|
56.0
|
|
|
|
Investing activities
|
(75.7
|
)
|
(6.0
|
)
|
|||
|
Financing activities
|
72.9
|
|
(62.9
|
)
|
|||
|
Net increase (decrease) in cash and cash equivalents
|
$
|
26.3
|
|
$
|
(12.9
|
)
|
|
Cash Flows Provided by Operating Activities
For purposes of this cash flow discussion, we define trade working capital as accounts receivable, inventory and accounts payable. Other working capital is defined as all other current assets and liabilities except trade working capital.
Net cash flows provided by operating activities for the
six
months ended
June 30, 2016
were approximately
$29.1 million
. Fluctuations in trade working capital increased our operating cash flow by $43.6 million due to a decrease in inventory of $34.6 million, an increase in accounts payable of $8.9 million, and a decrease in accounts receivable of $0.1 million. The decrease in inventory was primarily attributable to decrease in finished goods inventory as a result of increased sales volumes for the
six
months ended
June 30, 2016
. The increase in accounts payable was primarily attributable to product purchases in connection with marketing agreements, the East Dubuque major scheduled turnaround and expenses associated with the East Dubuque Merger. Fluctuations in other working capital of $48.3 million decreased our operating cash flow and were due to a decrease in deferred revenue of $31.6 million, a decrease to accrued expenses and other current liabilities of $19.2 million, partially offset by a decrease to prepaid expenses and other current assets of $2.6 million for the
six
months ended
June 30, 2016
. The decrease in deferred revenue was primarily attributable to increased sales for the
six
months ended
June 30, 2016
. The decrease in accrued expenses and other current liabilities was primarily due to the payout of third-party financial advisory services provided to CVR Nitrogen that became payable upon the closing of the East Dubuque Merger of $11.8 million and a decrease in accrued interest, net of $6.6 million.
Net cash flows provided by operating activities for the six months ended June 30, 2015 were approximately $56.0 million. Fluctuations in trade working capital decreased our operating cash flow by $2.4 million due to an increase in accounts receivable of $3.2 million and inventory of $0.1 million, partially offset by an increase in accounts payable of $0.9 million. The increase in accounts receivable was primarily attributable to an increase in sales and normal fluctuations in the timing of payments. Fluctuations in other working capital of $14.1 million decreased our operating cash flow and were due to a decrease in deferred revenue of $11.7 million, a decrease to accrued expenses and other current liabilities of $4.4 million, partially offset by a decrease to prepaid expenses and other current assets of $2.0 million for the six months ended June 30, 2015. The decrease in deferred revenue was primarily attributable to lower market demand for prepaid contracts and increased sales for the six months ended June 30, 2015. The decrease in accrued expenses and other current liabilities was primarily attributable to a decrease in balances related to accrued railcar regulatory inspections of $2.4 million due to a larger portion of our fleet due for regulatory inspections and repairs during 2014.
Cash Flows Used in Investing Activities
Net cash used in investing activities for the
six
months ended
June 30, 2016
was
$75.7 million
compared to
$6.0 million
for the
six
months ended
June 30, 2015
. For the
six
months ended
June 30, 2016
, net cash used in investing activities was the result of cash merger consideration of
$63.9 million
, net of cash acquired, and was the result of capital expenditures of
$11.9 million
. For the
six
months ended
June 30, 2015
, net cash used in investing activities was primarily the result of capital expenditures.
51
Cash Flows Used in Financing Activities
Net cash flows provided by financing activities for the
six
months ended
June 30, 2016
were
$72.9 million
, compared to net cash flows used in financing activities for the
six
months ended
June 30, 2015
of
$62.9 million
. The net cash provided by financing activities for the
six
months ended
June 30, 2016
was primarily attributable to the financing transactions discussed in
Liquidity and Capital Resources
above, partially offset by the quarterly cash distributions and the purchase of 400,000 CVR Nitrogen common units from CVR Energy for $5.0 million as discussed in
Note 4 ("East Dubuque Merger")
to Part I, Item 1 of this Report. The net cash used in financing activities for the
six
months ended
June 30, 2015
was primarily attributable to quarterly cash distributions.
Contractual Obligations
We are required to make payments relating to various types of obligations.
See Note 13 ("Commitments and Contingencies")
in Part I, Item 1 of this Report for more information. The following table summarizes our minimum payments as of
June 30, 2016
relating to long-term debt, operating leases, unconditional purchase obligations with third parties and affiliates and interest payments for the five years ending December 31, 2020 and thereafter.
|
Payments Due by Period
|
|||||||||||||||||||||||||||
|
Total
|
Six Months Ending December 31, 2016
|
2017
|
2018
|
2019
|
2020
|
Thereafter
|
|||||||||||||||||||||
|
(in millions)
|
|||||||||||||||||||||||||||
|
Contractual Obligations
|
|||||||||||||||||||||||||||
|
Long-term debt (1)
|
$
|
649.2
|
|
$
|
—
|
|
$
|
—
|
|
$
|
—
|
|
$
|
—
|
|
$
|
—
|
|
$
|
649.2
|
|
||||||
|
Operating leases (2)
|
20.2
|
|
2.6
|
|
4.3
|
|
3.5
|
|
2.9
|
|
2.3
|
|
4.6
|
|
|||||||||||||
|
Unconditional purchase obligations with third parties (3)
|
29.5
|
|
8.4
|
|
6.9
|
|
5.3
|
|
4.9
|
|
1.8
|
|
2.2
|
|
|||||||||||||
|
Unconditional purchase obligations with affiliates (4)
|
72.0
|
|
3.2
|
|
6.6
|
|
6.7
|
|
5.5
|
|
6.2
|
|
43.8
|
|
|||||||||||||
|
Interest payments (5)
|
416.5
|
|
30.0
|
|
59.9
|
|
59.9
|
|
59.9
|
|
59.9
|
|
146.9
|
|
|||||||||||||
|
Total
|
$
|
1,187.4
|
|
$
|
44.2
|
|
$
|
77.7
|
|
$
|
75.4
|
|
$
|
73.2
|
|
$
|
70.2
|
|
$
|
846.7
|
|
||||||
_____________
|
(1)
|
Long-term debt included
$645.0 million
related to the 2023 Notes issued June 10, 2016 and
$4.2 million
related to the 2021 Notes. Refer to
|
|
(2)
|
We lease various facilities and equipment, primarily railcars, under non-cancelable operating leases for various periods.
|
|
(3)
|
The amounts include commitments under a product supply agreement with Linde for the Coffeyville Facility that expires in 2020, a pet coke supply agreement with HollyFrontier Corporation for the Coffeyville Facility that expires in December 2016 and natural gas supply agreements for the East Dubuque Facility that expire in a period of less than six months.
|
|
(4)
|
The amounts include commitments under our long-term pet coke supply agreement between CRNF and CRRM to supply pet coke to the Coffeyville Facility, having an initial term that ends in 2027, subject to renewal. The Partnership's purchase obligations for pet coke from CRRM have been derived from a calculation of the average pet coke price paid to CRRM over the preceding two-year period.
|
|
(5)
|
Interest payments are based on stated interest rates for our long-term debt outstanding as of
June 30, 2016
.
|
Off-Balance Sheet Arrangements
We do not have any "off-balance sheet arrangements" as such term is defined within the rules and regulations of the SEC.
Recent Accounting Pronouncements
52
Refer to
Note 3 ("Recent Accounting Pronouncements")
to Part I, Item 1 of this Report for a discussion of recent accounting pronouncements applicable to the Partnership.
Critical Accounting Policies
Our critical accounting policies are disclosed in the "Critical Accounting Policies" section of our
2015
Form 10-K. No modifications have been made to our critical accounting policies.
53
Item 3.
Quantitative and Qualitative Disclosures About Market Risk
Commodity Price, Foreign Currency Exchange and Non-Operating Risks
We are exposed to significant market risk due to potential changes in prices for fertilizer products and natural gas. Natural gas is the primary raw material used in the production of various nitrogen-based products manufactured at our East Dubuque Facility. We have commitments to purchase natural gas for use in our East Dubuque Facility on the spot market, and through short-term, fixed supply, fixed price and index price purchase contracts. Natural gas prices have fluctuated during the last several years, increasing substantially in 2008 and subsequently declining to the current lower levels. A hypothetical increase of $0.10 per MMBtu of natural gas would increase the cost to produce one ton of ammonia at the East Dubuque Facility by approximately
$3.32
.
In the normal course of business, we produce nitrogen-based fertilizer products throughout the year to supply the needs of our customers during the high-delivery-volume spring and fall seasons. The value of fertilizer product inventory is subject to market risk due to fluctuations in the relevant commodity prices. Prices of nitrogen fertilizer products can be volatile. We believe that market prices of nitrogen products are affected by changes in grain prices and demand, natural gas prices and other factors. In the opinion of our management, there is no derivative financial instrument that correlates effectively with, and has a trading volume sufficient to hedge, our firm commitments and forecasted commodity sales transactions.
We do not currently use derivative financial instruments to manage risks related to changes in prices of commodities (e.g., UAN, ammonia, natural gas or pet coke). Given that our business is currently based entirely in the United States, we are not directly exposed to foreign currency exchange rate risk. We do not engage in activities that expose us to speculative or non-operating risks, including derivative trading activities. Our management may, in the future, elect to use derivative financial instruments consistent with our overall business objectives to avoid unnecessary risk and to limit, to the extent practical, risks associated with our operating activities.
54
Item 4.
Controls and Procedures
Evaluation of Disclosure Controls and Procedures
As of
June 30, 2016
, we have evaluated, under the direction of our Executive Chairman, Chief Executive Officer and Chief Financial Officer, the effectiveness of our disclosure controls and procedures, as defined in Rule 13a-15(e) under the Securities Exchange Act of 1934, as amended (the "Exchange Act"). There are inherent limitations to the effectiveness of any system of disclosure controls and procedures, including the possibility of human error and the circumvention or overriding of the controls and procedures. Accordingly, even effective disclosure controls and procedures can only provide reasonable assurance of achieving their control objectives. Based upon and as of the date of that evaluation, our Executive Chairman, Chief Executive Officer and Chief Financial Officer concluded that our disclosure controls and procedures were effective to provide reasonable assurance that information required to be disclosed in the reports that we file or submit under the Exchange Act is recorded, processed, summarized and reported within the time periods specified in the SEC’s rules and forms, and that such information is accumulated and communicated to the Partnership’s management, including our Executive Chairman, Chief Executive Officer and Chief Financial Officer, as appropriate, to allow timely decisions regarding required disclosure. It should be noted that any system of disclosure controls and procedures, however well designed and operated, can provide only reasonable, and not absolute, assurance that the objectives of the system are met. In addition, the design of any system of disclosure controls and procedures is based in part upon assumptions about the likelihood of future events. Due to these and other inherent limitations of any such system, there can be no assurance that any design will always succeed in achieving its stated goals under all potential future conditions.
Changes in Internal Control Over Financial Reporting
There has been no material change in our internal control over financial reporting required by Rule 13a-15 of the Exchange Act that occurred during the fiscal quarter ended
June 30, 2016
that has materially affected, or is reasonably likely to materially affect, our internal control over financial reporting, except as noted below regarding the East Dubuque Merger.
On April 1, 2016, we completed the acquisition of CVR Nitrogen and CVR Nitrogen GP whereby we acquired the East Dubuque Facility. Refer to
Note 4 ("East Dubuque Merger")
of Part I, Item 1 of this Report for additional information regarding the East Dubuque Merger. Management has not completed an assessment of the effectiveness of internal control over financial reporting of the acquired business as of
June 30, 2016
. The revenues attributable to the East Dubuque Facility represent approximately
50%
and
31%
of our consolidated revenues for the three and six months ended
June 30, 2016
, respectively. The assets of the East Dubuque Facility represent
62%
of our consolidated assets as of
June 30, 2016
. This acquisition is material to our results of operations, financial condition and cash flows, and the integration following this business combination is likely to materially impact the Partnership's internal control over financial reporting.
55
Item 1.
Legal Proceedings
See
Note 13 ("Commitments and Contingencies")
to Part I, Item 1 of this Report, which is incorporated by reference into this Part II, Item 1, for a description of certain litigation, legal and administrative proceedings and environmental matters.
56
Item 1A.
Risk Factors
You should carefully consider the information regarding certain factors which could materially adversely affect our business, financial condition, cash flows or results of operations as set forth under Item 1A. "Risk Factors" in our 2015 Form 10-K and in our March 31, 2016 Form 10-Q. Except as set forth below in this Item 1A. "Risk Factors," we do not believe that there have been any material changes to the risk factors previously disclosed in our 2015 Form 10-K and in our Quarterly Report on Form 10-Q for the three months ended March 31, 2016, filed with the SEC on April 29, 2016. We may disclose changes to such risk factors or disclose additional risk factors from time to time in our future filings with the SEC. Additional risks and uncertainties not presently known to us or that we currently believe not to be material may also materially adversely affect our business, financial condition, cash flows or results of operations.
Risks Related to Our Business
Our indebtedness may affect our ability to operate our business, and may have a material adverse effect on our financial condition and results of operations.
We have incurred indebtedness and we may be able to incur significant additional indebtedness in the future. If new indebtedness is added to our current indebtedness, the risks described below could increase. Our level of indebtedness could have important consequences, such as:
|
•
|
limiting our ability to obtain additional financing to fund our working capital needs, capital expenditures, debt service requirements, acquisitions or other purposes;
|
|
•
|
requiring us to utilize a significant portion of our cash flows to service our indebtedness, thereby reducing available cash and our ability to make distributions on our common units;
|
|
•
|
limiting our ability to use operating cash flow in other areas of our business because we must dedicate a substantial portion of these funds to service debt;
|
|
•
|
limiting our ability to compete with other companies who are not as highly leveraged, as we may be less capable of responding to adverse economic and industry conditions;
|
|
•
|
restricting us from making strategic acquisitions, introducing new technologies or exploiting business opportunities;
|
|
•
|
restricting the way in which we conduct our business because of financial and operating covenants in the agreements governing our and our subsidiaries' existing and future indebtedness, including, in the case of certain indebtedness of subsidiaries, certain covenants that restrict the ability of subsidiaries to pay dividends or make other distributions to us;
|
|
•
|
exposing us to potential events of default (if not cured or waived) under financial and operating covenants contained in our or our subsidiaries' debt instruments that could have a material adverse effect on our business, financial condition and operating results;
|
|
•
|
increasing our vulnerability to a downturn in general economic conditions or in pricing of our products; and
|
|
•
|
limiting our ability to react to changing market conditions in our industry and in our customers' industries.
|
In addition to our debt service obligations, our operations require substantial investments on a continuing basis. Our ability to make scheduled debt payments, to refinance our obligations with respect to our indebtedness and to fund capital and non-capital expenditures necessary to maintain the condition of our operating assets, properties and systems software, as well as to provide capacity for the growth of our business, depends on our financial and operating performance, which, in turn, is subject to prevailing economic conditions and financial, business, competitive, legal and other factors.
In addition, we are and will be subject to covenants contained in agreements governing our present and future indebtedness. These covenants include, or will likely include, restrictions on certain payments (including restrictions on distributions to our unitholders), the granting of liens, the incurrence of additional indebtedness, dividend restrictions affecting subsidiaries, asset sales, transactions with affiliates and mergers and consolidations. Any failure to comply with these covenants could result in a default under our current credit agreements or debt instruments or future credit agreements.
57
Item 6.
Exhibits
See the accompanying Exhibit Index and related note following the signature page to this Report for a list of exhibits filed or furnished with this Report, which Exhibit Index and related note are incorporated herein by reference.
58
SIGNATURES
Pursuant to the requirements of the Securities Exchange Act of 1934, the registrant has duly caused this report to be signed on its behalf by the undersigned thereunto duly authorized.
|
CVR Partners, LP
|
|||
|
By:
|
CVR GP, LLC, its general partner
|
||
|
July 28, 2016
|
By:
|
/s/ JOHN J. LIPINSKI
|
|
|
Executive Chairman
|
|||
|
(Principal Executive Officer)
|
|||
|
July 28, 2016
|
By:
|
/s/ MARK A. PYTOSH
|
|
|
|
Chief Executive Officer and President
|
||
|
|
(Principal Executive Officer)
|
||
|
July 28, 2016
|
By:
|
/s/ SUSAN M. BALL
|
|
|
Chief Financial Officer and Treasurer
|
|||
|
(Principal Financial and Accounting Officer)
|
|||
59
|
EXHIBIT INDEX
|
|
|
Exhibit
Number
|
Exhibit Title
|
|
1.1**
|
Purchase Agreement, dated June 3, 2016, by and among CVR Partners, LP, CVR Nitrogen Finance Corporation, Credit Suisse Securities (USA) LLC, UBS Securities LLC and the Guarantors named therein (incorporated by reference to Exhibit 1.1 of the Form 8-K filed on June 9, 2016).
|
|
4.1**
|
Indenture, dated June 10, 2016, by and among CVR Partners, LP, CVR Nitrogen Finance Corporation, the Guarantors (as defined therein) and Wilmington Trust, National Association, as Trustee and Collateral Trustee (incorporated by reference to Exhibit 4.1 of the Form 8-K filed on June 16, 2016).
|
|
4.2**
|
Form of 9.250% Senior Secured Note due 2023 (included within the Indenture filed as Exhibit 4.1).
|
|
4.3**
|
Indenture, dated as April 12, 2013, among Rentech Nitrogen Partners, L.P., Rentech Nitrogen Finance Corporation, the guarantors named therein, Wells Fargo Bank, National Association, as Trustee, and Wilmington Trust, National Association, as Collateral Trustee (incorporated by reference to Exhibit 4.1 to the Form 8-K filed by Rentech Nitrogen Partners, L.P. on April 16, 2013 (Commission File No. 001-35334)).
|
|
4.4**
|
Forms of 6.5% Second Lien Senior Secured Notes due 2021 (incorporated by reference to Exhibit 4.2 to the Form 8-K filed by Rentech Nitrogen Partners, L.P. on April 16, 2013 (Commission File No. 001-35334)).
|
|
4.5**
|
First Supplemental Indenture, dated as of June 10, 2016, among CVR Nitrogen, LP, CVR Nitrogen Finance Corporation, the guarantors party thereto, Wells Fargo Bank, National Association, as Trustee, and Wilmington Trust, National Association, as Collateral Trustee (incorporated by reference to Exhibit 10.3 of the Form 8-K filed on June 16, 2016).
|
|
10.1**
|
Senior Term Loan Credit Agreement dated as of April 1, 2016 between CVR Partners, LP, as Borrower, and American Entertainment Properties Corp., as Lender (incorporated by reference to Exhibit 10.1 of the Form 8-K filed on April 7, 2016).
|
|
10.2**
|
Senior Term Loan Credit Agreement dated as of April 1, 2016 between CVR Partners, LP, as Borrower, and Coffeyville Resources, LLC, as Lender (incorporated by reference to Exhibit 10.2 of the Form 8-K filed on April 7, 2016 ).
|
|
10.3**
|
Collateral Trust Agreement, dated as of June 10, 2016, among CVR Partners, LP, CVR Nitrogen Finance Corporation, the Guarantors (as defined therein) and Wilmington Trust, National Association, as Trustee and Collateral Trustee (incorporated by reference to Exhibit 10.1 of the Form 8-K filed on June 16, 2016).
|
|
10.4**
|
Parity Lien Security Agreement, dated as of June 10, 2016, among CVR Partners, LP, CVR Nitrogen Finance Corporation, the Guarantors (as defined therein) and Wilmington Trust, National Association, as Trustee and Collateral Trustee(incorporated by reference to Exhibit 10.2 of the Form 8-K filed on June 16, 2016).
|
|
31.1*
|
Rule 13a-14(a) or 15d-14(a) Certification of Executive Chairman.
|
|
31.2*
|
Rule 13a-14(a) or 15d-14(a) Certification of Chief Executive Officer and President.
|
|
31.3*
|
Rule 13a-14(a) or 15d-14(a) Certification of Chief Financial Officer and Treasurer.
|
|
32.1†
|
Section 1350 Certification of Executive Chairman.
|
|
32.2†
|
Section 1350 Certification of Chief Executive Officer and President.
|
|
32.3†
|
Section 1350 Certification of Chief Financial Officer and Treasurer.
|
|
101*
|
The following financial information for CVR Partners, LP’s Quarterly Report on Form 10-Q for the quarter ended June 30, 2016, formatted in XBRL ("Extensible Business Reporting Language") includes: (1) Condensed Consolidated Balance Sheets (unaudited), (2) Condensed Consolidated Statements of Operations (unaudited), (3) Condensed Consolidated Statements of Comprehensive Income (Loss) (unaudited), (4) Condensed Consolidated Statement of Partners’ Capital (unaudited), (5) Condensed Consolidated Statements of Cash Flows (unaudited) and (6) the Notes to Condensed Consolidated Financial Statements (unaudited), tagged in detail.
|
|
*
|
Filed herewith.
|
|
**
|
Previously filed.
|
|
†
|
Furnished herewith.
|
60
PLEASE NOTE: Pursuant to the rules and regulations of the SEC, we may file or incorporate by reference agreements referenced as exhibits to the reports that we file with or furnish to the SEC. The agreements are filed to provide investors with information regarding their respective terms. The agreements are not intended to provide any other factual information about the Partnership, its business or operations. In particular, the assertions embodied in any representations, warranties and covenants contained in the agreements may be subject to qualifications with respect to knowledge and materiality different from those applicable to investors and may be qualified by information in confidential disclosure schedules not included with the exhibits. These disclosure schedules may contain information that modifies, qualifies and creates exceptions to the representations, warranties and covenants set forth in the agreements. Moreover, certain representations, warranties and covenants in the agreements may have been used for the purpose of allocating risk between the parties, rather than establishing matters as facts. In addition, information concerning the subject matter of the representations, warranties and covenants may have changed after the date of the respective agreement, which subsequent information may or may not be fully reflected in the Partnership’s public disclosures. Accordingly, investors should not rely on the representations, warranties and covenants in the agreements as characterizations of the actual state of facts about the Partnership, its business or operations on the date hereof.
61
TABLE OF CONTENTS
Part I. Financial InformationItem 1. Financial StatementsNote 4 ("east Dubuque Merger")Note 14 ("related Party Transactions")Note 5 ("share Based Compensation")Note 11 ("debt")Note 12 ("interest Rate Swap Agreements")Item 2. Management S Discussion and Analysis Of Financial Condition and Results Of OperationsNote 8 ("partners Capital and Partnership Distributions")Note 3 ("recent Accounting Pronouncements")Item 3. Quantitative and Qualitative Disclosures About Market RiskItem 4. Controls and ProceduresPart II. Other InformationItem 1. Legal ProceedingsNote 13 ("commitments and Contingencies")Item 1A. Risk FactorsItem 6. Exhibits