UGI CORP /PA/
10-Ks and 10-Qs
|
|
|
|
|
|
|
|
|
|
|
|
|
|
|
|
|
|
|
|
|
|
|
|
|
|
|
|
|
|
|
|
|
|
|
|
|
|
|
|
|
|
|
|
|
|
|
|
|
|
|
|
|
UNITED STATES
SECURITIES AND EXCHANGE COMMISSION
WASHINGTON, D.C. 20549
FORM 10-K
ANNUAL REPORT PURSUANT TO SECTIONS 13 OR 15(d)
OF THE SECURITIES EXCHANGE ACT OF 1934
FOR THE FISCAL YEAR ENDED
SEPTEMBER 30, 2014
Commission file number 1-11071
UGI CORPORATION
(Exact name of registrant as specified in its charter)
|
Pennsylvania
|
|
23-2668356
|
|
(State or Other Jurisdiction of
Incorporation or Organization)
|
|
(I.R.S. Employer Identification No.)
|
460 North Gulph Road, King of Prussia, PA 19406
(Address of Principal Executive Offices) (Zip Code)
(610) 337-1000
(Registrant’s telephone number, including area code)
Securities registered pursuant to Section 12(b) of the Act:
|
Title of Each Class
|
|
Name of each Exchange
on Which Registered
|
|
Common Stock, without par value
|
|
New York Stock Exchange, Inc.
|
Securities registered pursuant to Section 12(g) of the Act:
None
Indicate by check mark if the registrant is a well-known seasoned issuer, as defined in Rule 405 of the Securities Act. Yes
þ
No
o
Indicate by check mark if the registrant is not required to file reports pursuant to Section 13 or Section 15(d) of the Act. Yes
o
No
þ
Indicate by check mark whether the registrant (1) has filed all reports required to be filed by Section 13 or 15(d) of the Securities Exchange Act of 1934 during the preceding 12 months (or for such shorter period that the registrant was required to file such reports), and (2) has been subject to such filing requirements for the past 90 days. Yes
þ
No
o
Indicate by check mark whether the registrant has submitted electronically and posted on its corporate Web site, if any, every Interactive Data File required to be submitted and posted pursuant to Rule 405 of Regulation S-T (§232.405 of this chapter) during the preceding 12 months (or for such shorter period that the registrant was required to submit and post such files).
Yes þ No o
Yes þ No o
Indicate by check mark if disclosure of delinquent filers pursuant to Item 405 of Regulation S-K (§229.405 of this chapter) is not contained herein, and will not be contained, to the best of registrant’s knowledge, in definitive proxy or information statements incorporated by reference in Part III of this Form 10-K or any amendment to this Form 10-K.
þ
Indicate by check mark whether the registrant is a large accelerated filer, an accelerated filer, a non-accelerated filer, or a smaller reporting company. See the definitions of “large accelerated filer,” “accelerated filer” and “smaller reporting company” in Rule 12b-2 of the Exchange Act.
|
Large accelerated filer
þ
|
Accelerated filer
o
|
Non-accelerated filer
o
|
Smaller reporting company
o
|
Indicate by check mark whether the registrant is a shell company (as defined in Rule 12b-2 of the Act). Yes
o
No
þ
The aggregate market value of UGI Corporation Common Stock held by non-affiliates of the registrant on
March 31, 2014
was
$5,249,082,631
.
At
November 18, 2014
, there were
172,425,384
shares of UGI Corporation Common Stock issued and outstanding.
Portions of the Proxy Statement for the Annual Meeting of Shareholders to be held on January 29, 2015 are incorporated by reference into Part III of this Form 10-K.
TABLE OF CONTENTS
|
|
Page
|
|
|
|
|
|
|
1
FORWARD-LOOKING INFORMATION
Information contained in this Annual Report on Form 10-K may contain forward-looking statements within the meaning of Section 27A of the Securities Act of 1933, as amended, and Section 21E of the Securities Exchange Act of 1934, as amended (the “Exchange Act”). Such statements use forward-looking words such as “believe,” “plan,” “anticipate,” “continue,” “estimate,” “expect,” “may,” or other similar words. These statements discuss plans, strategies, events or developments that we expect or anticipate will or may occur in the future.
A forward-looking statement may include a statement of the assumptions or bases underlying the forward-looking statement. We believe that we have chosen these assumptions or bases in good faith and that they are reasonable. However, we caution you that actual results almost always vary from assumed facts or bases, and the differences between actual results and assumed facts or bases can be material, depending on the circumstances. When considering forward-looking statements, you should keep in mind the following important factors which could affect our future results and could cause those results to differ materially from those expressed in our forward-looking statements: (1) adverse weather conditions resulting in reduced demand; (2) cost volatility and availability of propane and other liquefied petroleum gases, oil, electricity, and natural gas and the capacity to transport product to our customers; (3) changes in domestic and foreign laws and regulations, including safety, tax, consumer protection and accounting matters; (4) inability to timely recover costs through utility rate proceedings; (5) the impact of pending and future legal proceedings; (6) competitive pressures from the same and alternative energy sources; (7) failure to acquire new customers and retain current customers thereby reducing or limiting any increase in revenues; (8) liability for environmental claims; (9) increased customer conservation measures due to high energy prices and improvements in energy efficiency and technology resulting in reduced demand; (10) adverse labor relations; (11) large customer, counterparty or supplier defaults; (12) liability in excess of insurance coverage for personal injury and property damage arising from explosions and other catastrophic events, including acts of terrorism, resulting from operating hazards and risks incidental to generating and distributing electricity and transporting, storing and distributing natural gas and liquefied petroleum gases (“LPG”); (13) political, regulatory and economic conditions in the United States and in foreign countries, including the current conflicts in the Middle East and those involving Russia, and foreign currency exchange rate fluctuations, particularly the euro; (14) capital market conditions, including reduced access to capital markets and interest rate fluctuations; (15) changes in commodity market prices resulting in significantly higher cash collateral requirements; (16) reduced distributions from subsidiaries; (17) changes in Marcellus Shale gas production; (18) the timing and success of our acquisitions, commercial initiatives and investments to grow our businesses; and (19) our ability to successfully integrate acquired businesses and achieve anticipated synergies.
These factors are not necessarily all of the important factors that could cause actual results to differ materially from those expressed in any of our forward-looking statements. Other unknown or unpredictable factors could also have material adverse effects on future results. We undertake no obligation to update publicly any forward-looking statement whether as a result of new information or future events except as required by the federal securities laws.
ITEMS 1. AND 2. BUSINESS AND PROPERTIES
CORPORATE OVERVIEW
UGI Corporation (the “Company”) is a holding company that, through subsidiaries, distributes, stores, transports and markets energy products and related services. We are a domestic and international retail distributor of propane and butane (which are both LPG); a provider of natural gas and electric service through regulated local distribution utilities; a generator of electricity; a regional marketer of energy commodities; an owner and manager of midstream assets; and a regional provider of heating, ventilation, air conditioning, refrigeration and electrical contracting services. Our subsidiaries and affiliates operate principally in the following six business segments:
|
•
|
AmeriGas Propane
|
|
•
|
UGI International - Antargaz
|
|
•
|
UGI International - Flaga & Other
|
|
•
|
Energy Services
|
|
•
|
Electric Generation
|
|
•
|
Gas Utility
|
2
The AmeriGas Propane segment consists of the propane distribution business of AmeriGas Partners, L.P. (“AmeriGas Partners” or the “Partnership”), which is the nation’s largest retail propane distributor. The Partnership’s sole general partner is our subsidiary, AmeriGas Propane, Inc. (“AmeriGas Propane” or the “General Partner”). The common units of AmeriGas Partners represent limited partner interests in a Delaware limited partnership and trade on the New York Stock Exchange under the symbol “APU.” We have an effective 26% ownership interest in the Partnership and the remaining interest is publicly held. See
Note 1
to Consolidated Financial Statements.
The UGI International - Antargaz segment consists of the LPG distribution business of our wholly-owned subsidiary Antargaz, a French société anonyme, and our LPG distribution businesses in the Benelux countries (consisting of Belgium, the Netherlands, and Luxembourg) (collectively, “Antargaz”). Antargaz is one of the largest retail distributors of LPG in France and the Netherlands and the largest retail distributor of LPG in Belgium and Luxembourg.
The UGI International - Flaga & Other segment consists of the LPG distribution businesses of (i) Flaga GmbH, an Austrian limited liability company, and its subsidiaries (collectively, “Flaga”), (ii) AvantiGas Limited, a United Kingdom private limited company (“AvantiGas”), and (iii) ChinaGas Partners, L.P., a majority-owned Delaware limited partnership. Flaga is the largest retail LPG distributor in Austria and Denmark and one of the largest in Poland, the Czech Republic, Hungary, Slovakia, Norway, Sweden, and Finland. Flaga also distributes LPG in Romania and Switzerland. AvantiGas is an LPG distributor in the United Kingdom. ChinaGas Partners is an LPG distributor in the Nantong region of China. The UGI International - Antargaz and UGI International - Flaga & Other segments are collectively referred to as “UGI International.”
The Energy Services segment consists of energy-related businesses conducted by our wholly-owned subsidiary, UGI Energy Services, LLC (formerly known as UGI Energy Services, Inc. prior to its merger with and into UGI Energy Services, LLC, effective October 1, 2013) (“Energy Services”). These businesses include (i) energy marketing in the Mid-Atlantic region of the United States (the “U.S.”), (ii) operating and owning a natural gas liquefaction, storage and vaporization facility and propane-air mixing assets, (iii) managing natural gas pipeline and storage contracts, and (iv) developing, owning and operating pipelines, gathering infrastructure and gas storage facilities in the Marcellus Shale region of Pennsylvania.
The Electric Generation segment consists of electric generation facilities conducted by Energy Services’ wholly-owned subsidiary, UGI Development Company (“UGID”). UGID has an approximate 5.97% (approximately 102 megawatt) ownership interest in a coal-fired generation station in Pennsylvania. UGID also owns and operates (i) a 130 megawatt natural gas-fueled generating station in Pennsylvania, (ii) an 11 megawatt landfill gas-fueled generation plant in Pennsylvania, and (iii) 11.67 megawatts of solar-powered generation capacity in Pennsylvania, Maryland and New Jersey. The Energy Services and Electric Generation segments are collectively referred to as “Midstream & Marketing.”
The Gas Utility segment (“Gas Utility”) consists of the regulated natural gas distribution businesses of our subsidiary, UGI Utilities, Inc. (“UGI Utilities”), and UGI Utilities’ subsidiaries, UGI Penn Natural Gas, Inc. (“PNG”) and UGI Central Penn Gas, Inc. (“CPG”). Gas Utility serves over 600,000 customers in eastern and central Pennsylvania and several hundred customers in portions of one Maryland county. UGI Utilities’ natural gas distribution utility is referred to as “UGI Gas.” Gas Utility is regulated by the Pennsylvania Public Utility Commission (“PUC”) and, with respect to its several hundred customers in Maryland, the Maryland Public Service Commission.
In addition to the segments set forth herein, UGI Corporation also owns and operates (i) a regulated electric distribution business in Pennsylvania through UGI Utilities (“Electric Utility”), and (ii) a heating, ventilation, air-conditioning, refrigeration and electrical contracting service business in portions of eastern Pennsylvania and the Mid-Atlantic region of the U.S. through UGI HVAC Enterprises, Inc. (“HVAC”).
Business Strategy
Our business strategy is to grow the Company by focusing on our core competencies of distributing, storing, transporting and marketing energy products and services. We are utilizing our core competencies from our existing businesses and our national scope, international experience, extensive asset base and access to customers to accelerate both internal growth and growth through acquisitions in our existing businesses, as well as in related and complementary businesses. During Fiscal 2014, we completed a number of transactions in pursuit of this strategy and made progress on larger internally generated capital projects, including infrastructure projects to further support the development of natural gas in the Marcellus Shale region of Pennsylvania. A few of these transactions and projects are described below.
On November 11, 2014, our indirect wholly-owned French subsidiary, UGI Bordeaux Holding, entered into a Share Purchase Agreement with Total Marketing Services, a subsidiary of Total, to acquire all of the outstanding shares of Totalgaz, Total’s LPG distribution business in France (the “Total Acquisition”). Totalgaz distributed over 265 million retail gallons of LPG in 2013,
3
serving residential, commercial, industrial, and autogas customers. See “Management’s Discussion and Analysis of Financial Condition and Results of Operations.”
In the first quarter of Fiscal 2014, Energy Services placed its newly constructed 28-mile gathering pipeline and compressor station into service (Auburn II). The newly constructed pipeline transports locally produced natural gas from Energy Services’ compressor station in the Marcellus Shale region of Pennsylvania to PNG and two interstate pipelines. During Fiscal 2014, Energy Services also announced (i) a pipeline project to further expand its gathering system in the Marcellus Shale region of Pennsylvania (Auburn III), (ii) a pipeline project to transport locally produced natural gas to PNG (the Union Dale Lateral), and (iii) a joint project to develop an approximately 100-mile pipeline from Pennsylvania to New Jersey (the PennEast Pipeline Project). Energy Services also announced a project to increase the liquefaction capacity of its natural gas liquefaction, storage, and vaporization facility in Temple, Pennsylvania (the Temple Facility) in the fiscal year ending September 30, 2015 (“Fiscal 2015”).
In Fiscal 2014, Energy Services also acquired a retail natural gas marketing business from EQT Energy, LLC and expanded its industrial and commercial customer base in western Pennsylvania. See Note 4 to the Consolidated Financial Statements.
Corporate Information
UGI Corporation was incorporated in Pennsylvania in 1991. UGI Corporation is not subject to regulation by the PUC. UGI Corporation is a “holding company” under the Public Utility Holding Company Act of 2005 (“PUHCA 2005”). PUHCA 2005 and the implementing regulations of the Federal Energy Regulatory Commission (“FERC”) give FERC access to certain holding company books and records and impose certain accounting, record-keeping, and reporting requirements on holding companies. PUHCA 2005 also provides state utility regulatory commissions with access to holding company books and records in certain circumstances. Pursuant to a waiver granted in accordance with FERC’s regulations on the basis of UGI Corporation’s status as a single-state holding company system, UGI Corporation is not subject to certain of the accounting, record-keeping, and reporting requirements prescribed by FERC’s regulations.
Our executive offices are located at 460 North Gulph Road, King of Prussia, Pennsylvania 19406, and our telephone number is (610) 337-1000. In this report, the terms “Company” and “UGI,” as well as the terms “our,” “we,” and “its,” are sometimes used as abbreviated references to UGI Corporation or, collectively, UGI Corporation and its consolidated subsidiaries. Similarly, the terms “AmeriGas Partners” and the “Partnership” are sometimes used as abbreviated references to AmeriGas Partners, L.P. or, collectively, AmeriGas Partners, L.P. and its subsidiaries and the term “UGI Utilities” is sometimes used as an abbreviated reference to UGI Utilities, Inc. or, collectively, UGI Utilities, Inc. and its subsidiaries. The terms “Fiscal 2014” and “Fiscal 2013” refer to the fiscal years ended September 30, 2014 and September 30, 2013, respectively.
The Company’s corporate website can be found at www.ugicorp.com. Information on our website is not intended to be incorporated into this report. The Company makes available free of charge at this website (under the “Investor Relations - Financial Reports - SEC Filings and Proxy” caption) copies of its reports filed or furnished pursuant to Section 13(a) or 15(d) of the Exchange Act, including its Annual Reports on Form 10-K, its Quarterly Reports on Form 10-Q and its Current Reports on Form 8-K. The Company’s Principles of Corporate Governance, Code of Ethics for the Chief Executive Officer and Senior Financial Officers, Code of Business Conduct and Ethics for Directors, Officers and Employees, and charters of the Corporate Governance, Audit, Compensation and Management Development, and Safety, Environmental and Regulatory Compliance Committees of the Board of Directors are also available on the Company’s website, under the captions “Investor Relations - Corporate Governance - Committees.” All of these documents are also available free of charge by writing to Daniel J. Platt, Treasurer, UGI Corporation, P.O. Box 858, Valley Forge, PA 19482.
The Company’s common stock (“Common Stock”) trades on the New York Stock Exchange under the symbol “UGI.” On July 29, 2014, the Company announced that its Board of Directors had approved a three-for-two split of its Common Stock. The additional shares were distributed September 5, 2014 to shareholders of record on August 22, 2014. All shares and per share data provided herein gives effect to this stock split, applied retroactively.
4
AMERIGAS PROPANE
Products, Services and Marketing
Our domestic propane distribution business is conducted through AmeriGas Partners. AmeriGas Propane is responsible for managing the Partnership. The Partnership serves approximately 2 million customers in all 50 states from over 2,000 propane distribution locations. In addition to distributing propane, the Partnership also sells, installs and services propane appliances, including heating systems. Typically, the Partnership’s locations are in suburban and rural areas where natural gas is not readily available. Our district offices generally consist of a business office and propane storage. As part of its overall transportation and distribution infrastructure, the Partnership operates as an interstate carrier in all states throughout the continental U.S.
The Partnership sells propane primarily to residential, commercial/industrial, motor fuel, agricultural and wholesale customers. The Partnership distributed nearly 1.4 billion gallons of propane in Fiscal 2014. Approximately 93% of the Partnership’s Fiscal 2014 sales (based on gallons sold) were to retail accounts and approximately 7% were to wholesale and supply customers. Sales to residential customers in Fiscal 2014 represented approximately 41% of retail gallons sold; commercial/industrial customers 36%; motor fuel customers 13%; and agricultural customers 6%. Transport gallons, which are large-scale deliveries to retail customers other than residential, accounted for 4% of Fiscal 2014 retail gallons. No single customer represents, or is anticipated to represent, more than 5% of the Partnership’s consolidated revenues.
The Partnership continues to expand its AmeriGas Propane Exchange (“Propane Exchange”) program. At September 30, 2014, Propane Exchange cylinders were available at nearly 49,000 retail locations throughout the U.S. Sales of our Propane Exchange cylinders to retailers are included in commercial/industrial sales. The Propane Exchange program enables consumers to purchase or exchange propane cylinders at various retail locations such as home centers, gas stations, mass merchandisers and grocery and convenience stores. We also supply retailers with large propane tanks to enable retailers to replenish customers’ propane cylinders directly at the retailer’s location.
Residential and commercial customers use propane primarily for home heating, water heating and cooking purposes. Commercial users include hotels, restaurants, churches, warehouses, and retail stores. Industrial customers use propane to fire furnaces, as a cutting gas and in other process applications. Other industrial customers are large-scale heating accounts and local gas utility customers who use propane as a supplemental fuel to meet peak load deliverability requirements. As a motor fuel, propane is burned in internal combustion engines that power over-the-road vehicles, forklifts, commercial lawn mowers, and stationary engines. Agricultural uses include tobacco curing, chicken brooding, and crop drying. In its wholesale operations, the Partnership principally sells propane to large industrial end-users and other propane distributors.
Retail deliveries of propane are usually made to customers by means of bobtail and rack trucks. Propane is pumped from the bobtail truck, which generally holds 2,400 to 3,000 gallons of propane, into a stationary storage tank on the customer’s premises. The Partnership owns most of these storage tanks and leases them to its customers. The capacity of these tanks ranges from approximately 120 gallons to approximately 1,200 gallons. The Partnership also delivers propane in portable cylinders, including Propane Exchange cylinders. Some of these deliveries are made to the customer’s location, where cylinders are either picked up or replenished in place.
Propane Supply and Storage
The U.S. propane market has over 250 domestic and international sources of supply, including the spot market. Supplies of propane from the Partnership’s sources historically have been readily available. During Fiscal 2014, over 90% of the Partnership’s propane supply was purchased under supply agreements with terms of 1 to 3 years. The availability of propane supply is dependent upon, among other things, the severity of winter weather, the price and availability of competing fuels such as natural gas and crude oil, and the amount and availability of imported and exported supply. During the winter heating season of Fiscal 2014, there were wholesale supply challenges in certain regions of the U.S. due to industry-wide storage and transportation issues. These issues were exacerbated by prolonged periods of unusually cold winter weather, record volumes during the fall crop drying season that depleted propane storage inventories for the winter heating season, and an increase in demand for domestic propane overseas from the U.S.’ propane export market. The Partnership responded to these issues by instituting supply allocation measures, procuring propane from alternative supply sources, using its extensive transportation network to transport existing propane supplies to areas of the country that were most affected by the winter weather, and deploying employees from areas of the country that were less affected by the weather to those areas in need. Although no assurance can be given that supplies of propane will be readily available in the future, management currently expects to be able to secure adequate supplies during Fiscal 2015. If supply from major sources were interrupted, however, the cost of procuring replacement supplies and transporting those supplies from alternative locations might be materially higher and, at least on a short-term basis, margins could be adversely affected. Enterprise Products Partners, L.P., Plains Marketing, L.P., and Targa Liquids Marketing & Trade LLC supplied approximately 46% of the Partnership’s
5
Fiscal 2014 propane supply. No other single supplier provided more than 10% of the Partnership’s total propane supply in Fiscal 2014. In certain geographical areas, however, a single supplier provides more than 50% of the Partnership’s requirements. Disruptions in supply in these areas could also have an adverse impact on the Partnership’s margins.
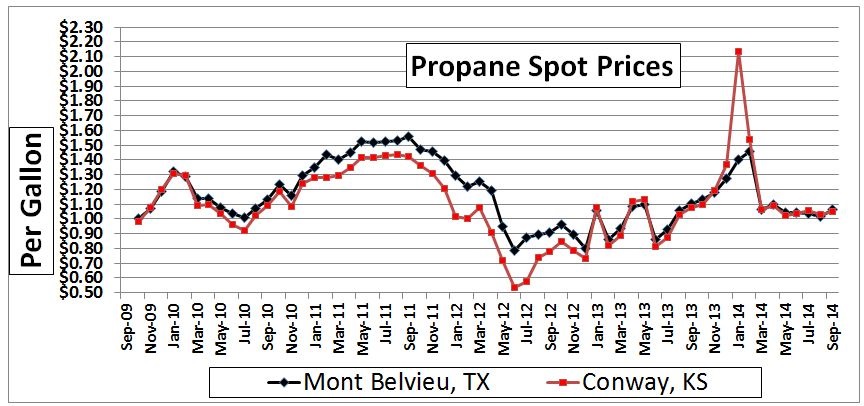
The Partnership’s supply contracts typically provide for pricing based upon (i) index formulas using the current prices established at a major storage point such as Mont Belvieu, Texas, or Conway, Kansas, or (ii) posted prices at the time of delivery. In addition, some agreements provide maximum and minimum seasonal purchase volume guidelines. The percentage of contract purchases, and the amount of supply contracted for at fixed prices, will vary from year to year as determined by the General Partner. The Partnership uses a number of interstate pipelines, as well as railroad tank cars, delivery trucks, and barges, to transport propane from suppliers to storage and distribution facilities. The Partnership stores propane at various storage facilities and terminals located in strategic areas across the U.S.
Because the Partnership’s profitability is sensitive to changes in wholesale propane costs, the Partnership generally seeks to pass on increases in the cost of propane to customers. There is no assurance, however, that the Partnership will always be able to pass on product cost increases fully, or keep pace with such increases, particularly when product costs rise rapidly. Product cost increases can be triggered by periods of severe cold weather, supply interruptions, increases in the prices of base commodities such as crude oil and natural gas, or other unforeseen events. The General Partner has adopted supply acquisition and product cost risk management practices to reduce the effect of volatility on selling prices. These practices currently include the use of summer storage, forward purchases and derivative commodity instruments, such as options and propane price swaps. See “Management’s Discussion and Analysis of Financial Condition and Results of Operations - Market Risk Disclosures.”
The following graph shows the average prices of propane on the propane spot market during the last five fiscal years at Mont Belvieu, Texas and Conway, Kansas, both major storage areas.
Average Propane Spot Market Prices
General Industry Information
Propane is separated from crude oil during the refining process and also extracted from natural gas or oil wellhead gas at processing plants. Propane is normally transported and stored in a liquid state under moderate pressure or refrigeration for economy and ease of handling in shipping and distribution. When the pressure is released or the temperature is increased, it is usable as a flammable gas. Propane is colorless and odorless; an odorant is added to allow for its detection. Propane is considered a clean alternative fuel under the Clean Air Act Amendments of 1990, producing negligible amounts of pollutants when properly consumed.
6
Competition
Propane competes with other sources of energy, some of which are less costly for equivalent energy value. Propane distributors compete for customers with suppliers of electricity, fuel oil and natural gas, principally on the basis of price, service, availability and portability. Electricity is generally more expensive than propane on a British thermal unit (“Btu”) equivalent basis, but the convenience and efficiency of electricity makes it an attractive energy source for consumers and developers of new homes. Fuel oil is also a major competitor of propane and, although a less environmentally attractive energy source, is currently less expensive than propane. Furnaces and appliances that burn propane will not operate on fuel oil, and vice versa, and, therefore, a conversion from one fuel to the other requires the installation of new equipment. Propane serves as an alternative to natural gas in rural and suburban areas where natural gas is unavailable or portability of product is required. Natural gas is generally a significantly less expensive source of energy than propane, although in areas where natural gas is available, propane is used for certain industrial and commercial applications and as a standby fuel during interruptions in natural gas service. The gradual expansion of the nation’s natural gas distribution systems has resulted in the availability of natural gas in some areas that previously depended upon propane. However, natural gas pipelines are not present in many areas of the country where propane is sold for heating and cooking purposes.
For motor fuel customers, propane competes with gasoline, diesel fuel, electric batteries, fuel cells and, in certain applications, liquefied natural gas and compressed natural gas. Wholesale propane distribution is a highly competitive, low margin business. Propane sales to other retail distributors and large-volume, direct-shipment industrial end-users are price sensitive and frequently involve a competitive bidding process.
Retail propane industry volumes have been declining for several years and no or modest growth in total demand is foreseen in the next several years. Therefore, the Partnership’s ability to grow within the industry is dependent on its ability to acquire other retail distributors and to achieve internal growth, which includes expansion of the Propane Exchange program and the National Accounts program (through which the Partnership encourages multi-location propane users to enter into a supply agreement with it rather than with many suppliers), as well as the success of its sales and marketing programs designed to attract and retain customers. The failure of the Partnership to retain and grow its customer base would have an adverse effect on its long-term results.
The domestic propane retail distribution business is highly competitive. The Partnership competes in this business with other large propane marketers, including other full-service marketers, and thousands of small independent operators. Some farm cooperatives, rural electric cooperatives, and fuel oil distributors include propane distribution in their businesses and the Partnership competes with them as well. The ability to compete effectively depends on providing high quality customer service, maintaining competitive retail prices and controlling operating expenses. The Partnership also offers customers various payment and service options, including guaranteed price programs, fixed price arrangements and pricing arrangements based on published propane prices at specified terminals.
In Fiscal 2014, the Partnership’s retail propane sales totaled nearly 1.3 billion gallons. Based on the most recent annual survey by the American Petroleum Institute, 2012 domestic retail propane sales (annual sales for other than chemical uses) in the U.S. totaled approximately 7.7 billion gallons. Based on LP-GAS magazine rankings, 2012 sales volume of the ten largest propane companies (including AmeriGas Partners) represented approximately 40% of domestic retail sales.
Properties
As of September 30, 2014, the Partnership owned over 91% of its approximately 750 district offices throughout the country. The transportation of propane requires specialized equipment. The trucks and railroad tank cars utilized for this purpose carry specialized steel tanks that maintain the propane in a liquefied state. As of September 30, 2014, the Partnership operated a transportation fleet with the following assets:
|
Approximate Quantity & Equipment Type
|
% Owned
|
% Leased
|
|
|
1,040
|
Trailers
|
82%
|
18%
|
|
370
|
Tractors
|
23%
|
77%
|
|
410
|
Railroad tank cars
|
4%
|
96%
|
|
3,900
|
Bobtail trucks
|
44%
|
56%
|
|
465
|
Rack trucks
|
43%
|
57%
|
|
4,000
|
Service and delivery trucks
|
57%
|
43%
|
Other assets owned at September 30, 2014 included approximately 1.8 million stationary storage tanks with typical capacities of more than 120 gallons and approximately 4.6 million portable propane cylinders with typical capacities of 1 to 120 gallons.
7
Trade Names, Trade and Service Marks
The Partnership markets propane principally under the “AmeriGas®”, “America’s Propane Company®”, “Heritage Propane®”, and “Relationships Matter®” trade names and related service marks. The Partnership also markets propane under various other trade names throughout the U.S. UGI owns, directly or indirectly, all the right, title and interest in the “AmeriGas” name and related trade and service marks. The General Partner owns all right, title and interest in the “America’s Propane Company” trade name and related service marks. The Partnership has an exclusive (except for use by UGI, AmeriGas, Inc., AmeriGas Polska Sp. z.o.o. and the General Partner), royalty-free license to use these trade names and related service marks. UGI and the General Partner each have the option to terminate its respective license agreement (on 12 months prior notice in the case of UGI), without penalty, if the General Partner is removed as general partner of the Partnership other than for cause. If the General Partner ceases to serve as the general partner of the Partnership for cause, the General Partner has the option to terminate its license agreement upon payment of a fee to UGI equal to the fair market value of the licensed trade names. UGI has a similar termination option; however, UGI must provide 12 months prior notice in addition to paying the fee to the General Partner.
Seasonality
Because many customers use propane for heating purposes, the Partnership’s retail sales volume is seasonal. During Fiscal 2014, approximately 67% of the Partnership’s retail sales volume occurred, and substantially all of the Partnership’s operating income was earned, during the peak heating season from October through March. As a result of this seasonality, sales are typically higher in the Partnership’s first and second fiscal quarters (October 1 through March 31). Cash receipts are generally greatest during the second and third fiscal quarters when customers pay for propane purchased during the winter heating season.
Sales volume for the Partnership traditionally fluctuates from year-to-year in response to variations in weather, prices, competition, customer mix and other factors, such as conservation efforts and general economic conditions. For information on national weather statistics, see “Management’s Discussion and Analysis of Financial Condition and Results of Operations.”
Government Regulation
The Partnership is subject to various federal, state and local environmental, health, safety and transportation laws and regulations governing the storage, distribution and transportation of propane and the operation of bulk storage propane terminals. Generally, these laws impose limitations on the discharge of pollutants, establish standards for the handling of solid and hazardous substances, and require the investigation and cleanup of environmental contamination. These laws include, among others, the federal Resource Conservation and Recovery Act, the Comprehensive Environmental Response, Compensation and Liability Act (“CERCLA”), the Clean Air Act, the Occupational Safety and Health Act (“OSHA”), the Homeland Security Act of 2002, the Emergency Planning and Community Right-to-Know Act, the Clean Water Act, and comparable state statutes. We incur expenses associated with compliance with our obligations under federal and state environmental laws and regulations, and we believe that we are in material compliance with all of our obligations. We maintain various permits that are necessary to operate our facilities, some of which may be material to our operations. We continually monitor our operations with respect to potential environmental issues, including changes in legal requirements.
Hazardous Substances and Wastes
The Partnership is investigating and remediating contamination at a number of present and former operating sites in the U.S., including former sites where we or our former subsidiaries operated manufactured gas plants. CERCLA and similar state laws impose joint and several liability on certain classes of persons considered to have contributed to the release or threatened release of a “hazardous substance” into the environment without regard to fault or the legality of the original conduct. Propane is not a hazardous substance within the meaning of federal and most state environmental laws.
Health and Safety
The Partnership is subject to the requirements of OSHA and comparable state laws that regulate the protection of the health and safety of our workers. These laws require the Partnership, among other things, to maintain information about materials, some of which may be hazardous or toxic, that are used, released, or produced in the course of our operations. Certain portions of this information must be provided to employees, state and local governmental authorities and responders, and local citizens in accordance with applicable federal and state Emergency Planning and Community Right-to-Know Act requirements. The Partnership’s operations are also subject to the safety hazard communication requirements and reporting obligations set forth in federal workplace standards.
8
All states in which the Partnership operates have adopted fire safety codes that regulate the storage and distribution of propane. In some states, these laws are administered by state agencies, and in others they are administered on a municipal level. The Partnership conducts training programs to help ensure that its operations are in compliance with applicable governmental regulations. With respect to general operations, National Fire Protection Association (“NFPA”) Pamphlets No. 54 and No. 58 and/or one or more of various international codes (including international fire, building and fuel gas codes) establish rules and procedures governing the safe handling of propane, or comparable regulations, which have been adopted by all states in which the Partnership operates. Management believes that the policies and procedures currently in effect at all of its facilities for the handling, storage and distribution of propane are consistent with industry standards and are in compliance in all material respects with applicable environmental, health and safety laws.
With respect to the transportation of propane by truck, the Partnership is subject to regulations promulgated under federal legislation, including the Federal Motor Carrier Safety Act and the Homeland Security Act of 2002. Regulations under these statutes cover the security and transportation of hazardous materials and are administered by the U.S. Department of Transportation (“DOT”), Pipeline and Hazardous Materials Safety Administration. The Natural Gas Safety Act of 1968 required the DOT to develop and enforce minimum safety regulations for the transportation of gases by pipeline. The DOT's pipeline safety regulations apply, among other things, to a propane gas system that supplies 10 or more residential customers or two or more commercial customers from a single source and to a propane gas system any portion of which is located in a public place. The DOT’s pipeline safety regulations require operators of all gas systems to provide operator qualification standards and training and written instructions for employees and third party contractors working on covered pipelines and facilities, establish written procedures to minimize the hazards resulting from gas pipeline emergencies, and conduct and keep records of inspections and testing. Operators are subject to the Pipeline Safety Improvement Act of 2002. Management believes that the procedures currently in effect at all of the Partnership’s facilities for the handling, storage, transportation and distribution of propane are consistent with industry standards and are in compliance, in all material respects, with applicable laws and regulations.
Climate Change
There continues to be concern, both nationally and internationally, about climate change and the contribution of greenhouse gas (“GHG”) emissions, most notably carbon dioxide, to global warming. Because propane is considered a clean alternative fuel under the federal Clean Air Act Amendments of 1990, we anticipate that this will provide us with a competitive advantage over other sources of energy, such as fuel oil and coal, to the extent new climate change regulations become effective. At the same time, increased regulation of GHG emissions, especially in the transportation sector, could impose significant additional costs on the Partnership, suppliers and customers. The impact of new legislation and regulations will depend on a number of factors, including (i) which industry sectors would be impacted, (ii) the timing of required compliance, (iii) the overall GHG emissions cap level, (iv) the allocation of emission allowances to specific sources, and (v) the costs and opportunities associated with compliance.
Employees
The Partnership does not directly employ any persons responsible for managing or operating the Partnership. The General Partner provides these services and is reimbursed for its direct and indirect costs and expenses, including all compensation and benefit costs. At September 30, 2014, the General Partner had nearly 8,400 employees, including nearly 400 part-time, seasonal and temporary employees, working on behalf of the Partnership. UGI also performs certain financial and administrative services for the General Partner on behalf of the Partnership and is reimbursed by the Partnership.
UGI INTERNATIONAL
ANTARGAZ
Our UGI International - Antargaz LPG distribution business is conducted in France and the Benelux countries (consisting of Belgium, the Netherlands, and Luxembourg). Antargaz also operates a natural gas marketing business in France and Belgium and sold approximately 7.3 million dekatherms of natural gas during Fiscal 2014.
Products, Services and Marketing
During Fiscal 2014, Antargaz sold approximately 235 million gallons of LPG in France and approximately 44 million gallons of LPG in the Benelux countries. Antargaz is one of the largest LPG distributors in France and the Netherlands and the largest LPG distributor in Belgium and Luxembourg. Antargaz’ customer base consists of residential, commercial, agricultural and motor fuel customer accounts that use LPG for space heating, cooking, water heating, process heat, forklift operations, and transportation. Antargaz sells LPG in cylinders, and in small, medium and large tanks. Sales of LPG are also made to service stations to
9
accommodate vehicles that run on LPG. Antargaz sells LPG in cylinders to approximately 15,000 retail outlets, such as supermarkets, individually owned stores and gas stations. Supermarket sales represented approximately 79% of butane cylinder sales volume and approximately 13% of propane cylinder sales volume in Fiscal 2014. At September 30, 2014, Antargaz had approximately 221,000 bulk customers, approximately 16,000 natural gas customers and nearly 10 million cylinders in circulation. Approximately 60% of Antargaz’ Fiscal 2014 sales (based on volumes) were cylinder and small bulk, 17% medium bulk, 20% large bulk and 3% to service stations for automobiles. Antargaz also engages in wholesale sales of LPG and provides logistic, storage and other services to third-party LPG distributors. In addition, Antargaz operates a natural gas marketing business in France and Belgium that services both commercial and residential customers. One wholesale customer represented over 10% of Antargaz’ total revenues in Fiscal 2014. No other customer represents, or is anticipated to represent, more than 10% of total revenues for Antargaz.
Sales to small bulk customers represent the largest segment of Antargaz’ business in terms of volume, revenue and total margin. Small bulk customers are primarily residential and small business users, such as restaurants, that use LPG mainly for heating and cooking. Small bulk customers also include municipalities, which use LPG for heating certain sports facilities and swimming pools, and the poultry industry for use in chicken brooding.
Medium bulk customers use propane only, and consist mainly of large residential developments such as housing developments, hospitals, municipalities and medium-sized industrial enterprises, and poultry brooders. Large bulk customers include agricultural companies and companies that use LPG in their industrial processes.
The principal end-users of cylinders are residential customers who use LPG supplied in this form for domestic applications such as cooking and heating. Butane cylinders accounted for approximately 53% of all LPG cylinders sold in Fiscal 2014, with propane cylinders accounting for the remainder. Propane cylinders are also used to supply fuel for forklift trucks. The market demand for cylinders continues to decline, due primarily to customers gradually changing to other household energy sources for cooking and heating, such as natural gas and electricity.
LPG Supply and Storage
Antargaz currently has an agreement with Totalgaz (currently owned by Total France until the closing of the proposed Total Acquisition) for the supply of butane in France, with pricing based on internationally quoted market prices. Under this agreement, approximately 50% of Antargaz’ requirements for butane are guaranteed until September 2015. Requirements are fixed annually and Antargaz has developed other sources of supply. In Fiscal 2014, Antargaz purchased substantially all of its propane supply for its operations in France from SHV and TOTSA. In the Benelux countries, Antargaz purchased substantially all of its butane and propane requirements from SHV and GUNVOR during Fiscal 2014. From time to time, as needed, Antargaz also purchases propane on the international market and on the domestic spot market.
Antargaz has three primary storage facilities in operation that are located at deep sea harbor facilities, and 29 secondary storage facilities. It also manages an extensive logistics and transportation network. Access to seaborne facilities allows Antargaz to diversify its LPG supplies through imports. LPG stored in primary storage facilities is transported to smaller storage facilities by rail, sea and road. At secondary storage facilities, LPG is filled into cylinders or trucks equipped with tanks and then delivered to customers.
Competition and Seasonality
The LPG markets in France and the Benelux countries are mature, with modest declines in total demand due to competition with other fuels and other energy sources, conservation and the economic climate. Sales volumes are affected principally by the severity of the weather and customer migration to alternative energy forms, including natural gas and electricity. Because Antargaz’ profitability is sensitive to changes in wholesale LPG costs, Antargaz generally seeks to pass on increases in the cost of LPG to customers. There is no assurance, however, that Antargaz will always be able to pass on product cost increases fully when product costs rise rapidly. Product cost increases can be triggered by periods of severe cold weather, supply interruptions, increases in the prices of base commodities such as crude oil and natural gas, or other unforeseen events. High LPG prices may result in slower than expected growth due to customer conservation and customers seeking less expensive alternative energy sources. France derives a significant portion of its electricity from nuclear power plants. Due to the nuclear power plants, as well as the regulation of electricity prices by the French government, electricity prices in France are generally less expensive than LPG. As a result, electricity has increasingly become a more significant competitor to LPG in France than in other countries where we operate. In addition, government policies and incentives that favor alternative energy sources can result in customers migrating to energy sources other than LPG in both France and the Benelux countries.
In Fiscal 2014, Antargaz competed in all of its product markets in France on a national level, principally with three LPG distribution
10
companies, Totalgaz (currently owned by Total France until the closing of the proposed Total Acquisition), Butagaz (owned by Societe des Petroles Shell), and Compagnie des Gaz de Petrole Primagaz (owned by SHV Holding NV), as well as with a regional competitor, Vitogaz. Antargaz also competes with supermarket chains that affiliate with LPG distributors to offer their own brands of cylinders. Antargaz has partnered with two supermarket chains in France in this market. If Antargaz is unsuccessful in expanding its services to other supermarket chains, its market share through supermarket sales may decline in France. In the Benelux countries, Antargaz competes in all of its product markets on a national level, principally with Compagnie des Gaz de Petrole Primagaz, as well as with several regional competitors. In recent years, competition has increased in the Benelux countries as small competitors have reduced their price offerings. In the Netherlands, several LPG distributors offer their own brands of cylinders. Antargaz seeks to increase demand for its butane and propane cylinders through marketing and product innovations. Some of Antargaz’ competitors are affiliates of its LPG suppliers. As a result, its competitors may obtain product at more competitive prices.
Because many of Antargaz’ customers use LPG for heating, sales volume is affected principally by the severity of the temperatures during the heating season months and traditionally fluctuates from year-to-year in response to variations in weather, prices and other factors, such as conservation efforts and the challenging economic climate. Demand for LPG is higher during the colder months of the year. During Fiscal 2014, approximately 66% of Antargaz’ retail sales volume occurred, and substantially all of Antargaz’ operating income was earned, during the six months from October through March. For historical information on weather statistics for Antargaz, see “Management’s Discussion and Analysis of Financial Condition and Results of Operations.”
Government Regulation
Antargaz’ business is subject to various laws and regulations at the national and European levels with respect to matters such as protection of the environment, the storage and handling of hazardous materials and flammable substances, the discharge of contaminants into the environment and the safety of persons and property. In Belgium and Luxembourg, Antargaz is also subject to price regulations that permit Antargaz to increase the price of LPG sold to small bulk, medium bulk, large bulk and cylinder customers (up to a defined maximum price) when Antargaz’ costs fluctuate.
Properties
Antargaz has three primary storage facilities in operation. One of these is a refrigerated facility. In addition, Antargaz is able to use 30,000 cubic meters of capacity of a storage facility, Donges, by virtue of Antargaz’ 50% ownership of Donges GIE. The table below sets forth details of Antargaz’ three primary storage facilities:
|
Ownership %
|
Antargaz
Storage Capacity -
Propane
(m3) (1)
|
Antargaz
Storage Capacity -
Butane
(m3) (1)
|
||||||
|
GIE Norgal
|
52.7
|
|
|
22,600
|
|
8,900
|
|
|
|
Geogaz-Lavera
|
16.7
|
|
|
17,400
|
|
32,500
|
|
|
|
Cobogal
|
15.0
|
|
1,300
|
|
450
|
|
||
_________________
|
(1)
|
Cubic meters (1 cubic meter is equivalent to approximately 264 gallons).
|
Antargaz has 29 secondary storage facilities, 19 of which are wholly-owned. The others are partially owned through joint ventures.
Employees
At September 30, 2014, Antargaz had approximately 1,040 employees.
FLAGA & OTHER
During Fiscal 2014, our UGI International - Flaga & Other LPG distribution business was conducted principally in Europe through our wholly-owned subsidiaries, Flaga and AvantiGas, and in China through our majority-owned partnership, ChinaGas Partners, L.P. Flaga is referred to in this section collectively with its subsidiaries as “Flaga” unless the context otherwise requires. Flaga operates in Austria, the Czech Republic, Denmark, Finland, Hungary, Norway, Poland, Romania, Slovakia, Sweden and Switzerland. AvantiGas operates in the United Kingdom.
During Fiscal 2014, Flaga sold approximately 340 million gallons of LPG. Flaga is the largest distributor of LPG in Austria and
11
Denmark and one of the largest distributors of LPG in Poland, the Czech Republic, Hungary, Slovakia, Norway, Sweden, and Finland. During Fiscal 2014, AvantiGas sold approximately 150 million gallons of LPG and our majority-owned partnership in China sold approximately 9 million gallons of LPG.
FLAGA
Products, Services and Marketing
During Fiscal 2014, Flaga sold approximately 340 million gallons of LPG (of which approximately 95 million gallons were to wholesale customers). Flaga serves customers that use LPG for residential, commercial, industrial, agricultural, resale, and automobile fuel (“auto gas”) purposes. Flaga’s customers primarily use LPG for heating, cooking, motor fuel (including forklifts), leisure activities, construction work, manufacturing, crop drying, power generation and irrigation. Flaga sells LPG in cylinders and in small, medium, and large bulk tanks. At September 30, 2014, Flaga had nearly 68,000 customers and 4.1 million cylinders in circulation. Approximately 24% of Flaga’s Fiscal 2014 sales (based on volumes) were cylinder and small bulk, 33% auto gas, 39% large bulk, and 4% medium bulk.
Flaga has a total of 18 sales offices throughout the countries it serves, although it does not have sales offices in Norway, Sweden or Finland, largely due to the commercial and industrial nature of Flaga’s business in those countries. Sales offices generally consist of an office location where customers can directly purchase LPG. Except for Poland, no single country represented more than 10% of Flaga’s total LPG gallons sold in Fiscal 2014. Flaga distributes cylinders directly to its customers and through the use of distributors who resell the cylinders to end users under the distributor’s pricing and terms. No single customer represents or is anticipated to represent more than 5% of total revenues for Flaga, with the exception of one auto gas customer that represented approximately 11% of Flaga’s total revenues in Fiscal 2014.
LPG Supply and Storage
Flaga typically enters into an annual LPG supply agreement with TCO/Chevron. During Fiscal 2014, TCO/Chevron supplied approximately 50% of Flaga’s LPG requirements, with pricing based on internationally quoted market prices. Flaga also purchases LPG on the international market and on the domestic markets, under annual term agreements with international oil and gas trading companies, including SIBUR, NOVATEK, LOTOS, and PGNIG, and from domestic refineries, primarily OMV, Shell, MOL, and Statoil. In addition, LPG purchases are made on the spot market from international oil and gas traders. During Fiscal 2014, 8 suppliers accounted for approximately 80% of Flaga’s LPG supply.
Flaga operates 11 main storage facilities, including one in Denmark that is located at a deep sea harbor facility, two LPG import terminals in Poland, and 58 secondary storage facilities. Flaga manages a widespread logistics and transportation network including approximately 300 leased railcars, and also maintains various transloading and filling agreements with third parties. LPG stored in primary storage facilities is transported to smaller storage facilities by rail or truck.
Competition and Seasonality
The retail propane industry in the Western European countries in which Flaga operates is mature, with slight declines in overall demand in recent years, due primarily to the expansion of natural gas, customer conservation and economic conditions. In the Eastern European countries in which Flaga operates, the demand for LPG is expected to grow in certain segments. Competition for customers is based on contract terms as well as on product prices. Flaga competes with other LPG marketers, including competitors located in other European countries, and also competes with providers of other sources of energy, principally natural gas, electricity and wood.
Because many of Flaga’s customers use LPG for heating, sales volumes in Flaga’s sales territories are affected by the severity of the temperatures during the heating season months and traditionally fluctuate from year-to-year in response to variations in weather, prices and other factors, such as conservation efforts and the economic climate. Because Flaga’s profitability is sensitive to changes in wholesale LPG costs, Flaga generally seeks to pass on increases in the cost of LPG to customers. There is no assurance, however, that Flaga will always be able to pass on product cost increases fully when product costs rise. In parts of Flaga’s sales territories, it is particularly difficult to pass on rapid increases in the price of LPG due to the low per capita income of customers in several of its territories and the intensity of competition. Product cost increases can be triggered by periods of severe cold weather, supply interruptions, increases in the prices of base commodities such as crude oil and natural gas, or other unforeseen events. High LPG prices may result in slower than expected growth due to customer conservation and customers seeking less expensive alternative energy sources. In many of Flaga’s sales territories, government policies and incentives that favor alternative energy sources may result in customers migrating to energy sources other than LPG. Rules and regulations applicable to LPG industry operations in many of the Eastern European countries where Flaga operates are still evolving, or are not consistently enforced, causing intensified
12
competitive conditions in those areas.
Government
Regulation
Flaga’s business is subject to various laws and regulations at both the national and European levels with respect to matters such as protection of the environment and the storage and handling of hazardous materials and flammable substances.
Employees
At September 30, 2014, Flaga had approximately 950 employees.
AVANTIGAS
Products, Services and Marketing
During Fiscal 2014, AvantiGas sold approximately 150 million gallons of LPG (of which approximately 91 million gallons were wholesale gallons). At September 30, 2014, AvantiGas had over 14,350 customers. AvantiGas serves customers that use LPG for wholesale, aerosol, agricultural, residential, commercial, industrial, and auto gas purposes. AvantiGas’ customers primarily use LPG for heating, cooking, motor fuel (including forklifts), leisure activities, industrial processes and aerosol propellant. AvantiGas sells LPG in small, medium, and large bulk tanks with small bulk sales representing approximately 5% of Fiscal 2014 sales (based on volumes), medium bulk sales representing approximately 34% of Fiscal 2014 sales and large bulk sales representing approximately 61% of Fiscal 2014 sales.
AvantiGas serves its customer base through a centralized customer service center and, therefore, does not have sales offices in the United Kingdom. Sales to wholesale customers represented approximately 61% of gallons sold; aerosol customers 21%; agricultural customers 5%; residential customers 5%; and commercial, industrial and autogas 8%. Three wholesale customers and one aerosol customer collectively represented over 55% of AvantiGas’ total revenues in Fiscal 2014. No other customer represents or is anticipated to represent more than 5% of total revenues for AvantiGas.
LPG Supply and Storage
AvantiGas has five-year agreements, which will terminate during the 2016 fiscal year, with Essar Energy plc’s Stanlow refinery and STASCO’s Mossmorran terminal, and a one-year agreement, which will terminate during Fiscal 2015, with Centrica plc, for the supply of an aggregate of approximately 92% of AvantiGas’ LPG requirements. Pricing for such agreements is based on internationally quoted market prices. AvantiGas purchased the remainder of its LPG requirements from other third party suppliers in Fiscal 2014.
AvantiGas operates eight main storage facilities in England, Scotland and Wales. AvantiGas manages a logistics and transportation network, consisting of approximately 40 trucks, and also maintains various transportation agreements with third parties. LPG stored in primary storage facilities is transported to smaller storage facilities or customers by truck.
Competition and Seasonality
The retail propane industry in the United Kingdom is highly concentrated and is mature, with slight declines in overall demand in recent years, due primarily to the expansion of natural gas, customer conservation and challenging economic conditions. Competition for customers is based on contract terms as well as on product prices. AvantiGas competes with other LPG marketers in the United Kingdom.
Because many of AvantiGas’ customers use gas for heating purposes, sales volumes in AvantiGas’ sales territories are affected principally by the severity of the temperatures during the heating season months and traditionally fluctuate from year-to-year in response to variations in weather, prices and other factors, such as energy conservation efforts and the economic climate. During Fiscal 2014, approximately 56% of AvantiGas’ retail sales volume occurred, and approximately 75% of AvantiGas’ operating income was earned, during the peak heating season where AvantiGas operates. Because AvantiGas’ profitability is sensitive to changes in wholesale LPG costs, AvantiGas generally seeks to pass on increases in the cost of LPG to customers. There is no assurance, however, that AvantiGas will always be able to pass on product cost increases fully when product costs rise. Product cost increases can be triggered by periods of severe cold weather, supply interruptions, increases in the prices of base commodities, such as crude oil and natural gas, or other unforeseen events. High LPG prices may result in slower than expected growth due to customer conservation and customers seeking less expensive alternative energy sources.
13
Government Regulation
AvantiGas’ business is subject to various laws and regulations at both the national and European levels with respect to matters such as competition, protection of the environment and the storage and handling of hazardous materials and flammable substances.
Employees
At September 30, 2014, AvantiGas had approximately 180 employees.
MIDSTREAM & MARKETING
ENERGY SERVICES
Retail Energy Marketing
Energy Services sells natural gas, liquid fuels and electricity to approximately 19,000 residential, commercial, and industrial customers at approximately 43,000 locations. Energy Services serves customers in all or portions of Pennsylvania, New Jersey, Delaware, New York, Ohio, Maryland, Massachusetts, Virginia, North Carolina and the District of Columbia. Energy Services distributes natural gas through the use of the distribution systems of 36 local gas utilities. It supplies power to customers through the use of the transmission systems of 20 utility systems.
Historically, a majority of Energy Services’ commodity sales have been made under fixed-price agreements, which typically contain a take-or-pay arrangement that requires customers to purchase a fixed amount of product for a fixed price during a specified period, and to pay for the product even if the customer does not take delivery of the product. However, a growing number of Energy Services’ commodity sales are currently being made under requirements contracts, under which Energy Services is typically an exclusive supplier and will supply as much product at a fixed price as the customer requires. Energy Services manages supply cost volatility related to these agreements by (i) entering into fixed-price supply arrangements with a diverse group of suppliers, (ii) holding its own interstate pipeline transportation and storage contracts to efficiently utilize gas supplies, (iii) entering into exchange-traded futures contracts on the New York Mercantile Exchange and the Intercontinental Exchange, (iv) entering into over-the-counter derivative arrangements with major international banks and major suppliers, (v) utilizing supply assets that it owns or manages, and (vi) utilizing financial transmission rights to hedge price risk against certain transmission costs. Energy Services also bears the risk for balancing and delivering natural gas and power to its customers under various gas pipeline and utility company tariffs. See “Management’s Discussion and Analysis of Financial Condition and Results of Operations - Market Risk Disclosures.”
Midstream Assets
Energy Services operates a natural gas liquefaction, storage and vaporization facility in Temple, Pennsylvania (“Temple Facility”), and propane storage and propane-air mixing stations in Bethlehem, Reading, Hunlock Creek, and White Deer, Pennsylvania. It also operates propane storage, rail transshipment terminals, and propane-air mixing stations in Steelton and Williamsport, Pennsylvania. These assets are used in Energy Services’ energy peaking business that provides supplemental energy, primarily liquefied natural gas and propane-air mixtures, to gas utilities on interstate pipelines at times of high demand (generally during periods of coldest winter weather). In recent years, Energy Services expanded its energy peaking services at the Temple Facility and began selling liquefied natural gas to customers for use by trucks, drilling rigs, other motor vehicles and facilities located off the gas grid. Energy Services also manages natural gas pipeline and storage contracts for UGI Utilities, subject to a competitive bid process, as well as storage capacity owned by Energy Services.
A wholly-owned subsidiary of Energy Services owns and operates underground natural gas storage and related high pressure pipeline facilities, which have FERC approval to sell storage services at market-based rates. The storage facilities are located in the Marcellus Shale region of Pennsylvania and have a total storage capacity of 15 million dekatherms and a maximum daily withdrawal quantity of 224,000 dekatherms. In Fiscal 2014, Energy Services leased more than 80% of the capacity at its underground natural gas facilities to third parties. Through its operation of a compressor station, Energy Services also receives natural gas from the Tennessee Gas Pipeline for injection into a storage facility on a firm basis throughout the year.
In Fiscal 2014, Energy Services continued making investments in infrastructure projects to support the development of natural gas in the Marcellus Shale region of Pennsylvania. In the first quarter of Fiscal 2014, Energy Services completed a project to extend its gathering system in Wyoming County, Pennsylvania and placed its newly constructed pipeline from Wyoming County to Luzerne County, Pennsylvania (Auburn II) into service. The expansion of the gathering system provides for (i) expanded capacity through additional compression; and (ii) additional delivery options by connecting the region served by PNG and two
14
interstate pipelines with Marcellus Shale producers. In Fiscal 2014, Energy Services also announced (i) plans to invest capital to further extend the gathering system, providing additional transportation capacity in the Marcellus Shale region (Auburn III); and (ii) a joint project to develop an approximately 100-mile pipeline from Luzerne County, Pennsylvania to the Trenton-Woodbury interconnection in New Jersey that will transport lower cost natural gas to residential and commercial customers (the PennEast Pipeline Project). Energy Services also commenced construction in the third quarter of Fiscal 2014 on a new pipeline project to transport locally produced natural gas to PNG (the Union Dale Lateral) and announced a project to increase the liquefaction capacity of its Temple Facility in Fiscal 2015.
Future planned investments are expected to cover a range of midstream asset opportunities, including interstate pipelines, local gathering systems and gas storage facilities and complementary and related investments in natural gas exploration, production and refining.
Competition
Energy Services competes with other midstream operators to sell gathering, compression, storage, and pipeline transportation services. Energy Services competes in both the regulated and non-regulated environment against interstate and intrastate pipelines that gather, compress, process, transport, and market natural gas. Energy Services sells midstream services primarily to producers, marketers, and utilities on the basis of price, customer service, flexibility, reliability, and operational experience. The competition in the midstream segment is significant and has grown recently in the northeast U.S. as more competitors seek opportunities offered by the development of the Marcellus and Utica Shales.
Energy Services also competes with other marketers, consultants, and local utilities to sell natural gas, liquid fuels, electric power, and related services to customers in its service area principally on the basis of price, customer service, and reliability. Energy Services has faced an increase in competition as new markets for natural gas, liquid fuels, electric power, and related services have emerged.
Government Regulation
FERC has jurisdiction over the rates and terms and conditions of service of wholesale sales of electric capacity and energy, as well as the sales for resale of natural gas and related storage and transportation services. Energy Services has a tariff on file with FERC pursuant to which it may make power sales to wholesale customers at market-based rates. Energy Services also has market-based rate authority for power sales to wholesale customers to the extent that Energy Services purchases power in excess of its retail customer needs. Two subsidiaries of Energy Services operate natural gas storage facilities under FERC certificate approvals and offer services to wholesale customers at FERC-approved market-based rates. Energy Services is also subject to FERC reporting requirements, market manipulation rules and other FERC enforcement and regulatory powers.
Energy Services is subject to various federal, state and local environmental, safety and transportation laws and regulations governing the storage, distribution and transportation of propane and the operation of bulk storage LPG terminals. These laws include, among others, the Resource Conservation and Recovery Act, CERCLA, the Clean Air Act, OSHA, the Homeland Security Act of 2002, the Emergency Planning and Community Right-to-Know Act, the Clean Water Act and comparable state statutes. CERCLA imposes joint and several liability on certain classes of persons considered to have contributed to the release or threatened release of a “hazardous substance” into the environment without regard to fault or the legality of the original conduct. Energy Services also is required to comply with the provisions of the Pipeline Safety Act and the regulations of the U.S. DOT with respect to the operation of natural gas gathering and transportation pipelines.
Employees
At September 30, 2014, Energy Services had approximately 205 employees.
ELECTRIC GENERATION
Products and Services
UGID has an approximate 5.97% (approximately 102 megawatt) ownership interest in the Conemaugh generation station (“Conemaugh”), a 1,711-megawatt, coal-fired generation station located near Johnstown, Pennsylvania. Conemaugh is owned by a consortium of energy companies and operated by a unit of NRG Energy. UGID also owns and operates the Hunlock Station located near Wilkes-Barre, Pennsylvania, a 130-megawatt natural gas-fueled generating station.
UGID also owns and operates a landfill gas-fueled generation plant near Hegins, Pennsylvania, with gross generating capacity of
15
11 megawatts. The plant qualifies for renewable energy credits.
UGID also owns and operates 11.67 megawatts of solar-powered generation capacity in Pennsylvania, Maryland and New Jersey. Several other solar generation projects are in development.
Competition
UGID competes with other generation stations on the interface of PJM Interconnection, LLC (“PJM”), a regional transmission organization that coordinates the movement of wholesale electricity in certain states, including the states in which we operate, and bases sales on bid pricing. Generally, each power generator has a small share of the total market on PJM.
Government Regulation
UGID owns electric generation facilities that are within the control area of PJM and are dispatched in accordance with a FERC-approved open access tariff and associated agreements administered by PJM. UGID receives certain revenues collected by PJM, determined under an approved rate schedule. UGID is also subject to FERC reporting requirements, market manipulation rules and other FERC enforcement and regulatory powers.
Employees
At September 30, 2014, UGID had approximately 25 employees.
GAS UTILITY
Gas Utility consists of the regulated natural gas distribution businesses of our subsidiary, UGI Utilities, and UGI Utilities’ subsidiaries, PNG and CPG. Gas Utility serves over 600,000 customers in eastern and central Pennsylvania and several hundred customers in portions of one Maryland county. Gas Utility is regulated by the PUC and, with respect to its several hundred customers in Maryland, the Maryland Public Service Commission.
Service Area; Revenue Analysis
Gas Utility is authorized to distribute natural gas to over 600,000 customers in portions of 46 eastern and central Pennsylvania counties through its distribution system of approximately 12,000 miles of gas mains. Contemporary materials, such as plastic or coated steel, comprise approximately 87% of Gas Utility’s 12,000 miles of gas mains, with bare steel pipe comprising approximately 10% and cast iron pipe comprising approximately 3% of Gas Utility’s gas mains. In accordance with Gas Utility’s agreement with the PUC, Gas Utility will replace the cast iron portion of its gas mains by March 2027 and the bare steel portion by March 2043. The service area includes the cities of Allentown, Bethlehem, Easton, Harrisburg, Hazleton, Lancaster, Lebanon, Reading, Scranton, Wilkes-Barre, Lock Haven, Pittston, Pottsville, and Williamsport, Pennsylvania, and the boroughs of Honesdale and Milford, Pennsylvania. Located in Gas Utility’s service area are major production centers for basic industries such as specialty metals, aluminum, glass and paper product manufacturing. Gas Utility also distributes natural gas to several hundred customers in portions of one Maryland county.
System throughput (the total volume of gas sold to or transported for customers within Gas Utility’s distribution system) for Fiscal 2014 was approximately 208.8 billion cubic feet (“bcf”). System sales of gas accounted for approximately 31% of system throughput, while gas transported for residential, commercial and industrial customers who bought their gas from others accounted for approximately 69% of system throughput.
Sources of Supply and Pipeline Capacity
Gas Utility is permitted to recover prudently incurred costs of natural gas it sells to its customers. See “Management’s Discussion and Analysis of Financial Condition and Results of Operations - Market Risk Disclosures” and
Note 9
to Consolidated Financial Statements. Gas Utility meets its service requirements by utilizing a diverse mix of natural gas purchase contracts with marketers and producers, along with storage and transportation service contracts. These arrangements enable Gas Utility to purchase gas from Gulf Coast, Mid-Continent, Appalachian and Canadian sources. For the transportation and storage function, Gas Utility has long-term agreements with a number of pipeline companies, including Texas Eastern Transmission Corporation, Columbia Gas Transmission, LLC, Transcontinental Gas Pipeline Company, LLC, Dominion Transmission, Inc., ANR Pipeline Company, and Tennessee Gas Pipeline Company, L.L.C.
16
Gas Supply Contracts
During Fiscal 2014, Gas Utility purchased approximately 84.2 bcf of natural gas for sale to retail core-market customers (principally comprised of firm- residential, commercial and industrial customers that purchase their gas from Gas Utility (“retail core-market”)) and off-system sales customers. Approximately 90% of the volumes purchased were supplied under agreements with 10 suppliers. The remaining 10% of gas purchased by Gas Utility was supplied by approximately 35 producers and marketers. Gas supply contracts for Gas Utility are generally no longer than 16 months. Gas Utility also has long-term contracts with suppliers for natural gas peaking supply during the months of November through March.
Seasonality
Because many of its customers use gas for heating purposes, Gas Utility’s sales are seasonal. During Fiscal 2014, approximately 65% of Gas Utility’s sales volume was supplied, and over 90% of Gas Utility’s operating income was earned, during the peak heating season from October through March.
Competition
Natural gas is a fuel that competes with electricity and oil, and to a lesser extent, with propane and coal. Competition among these fuels is primarily a function of their comparative price and the relative cost and efficiency of the equipment. Natural gas generally benefits from a competitive price advantage over oil, electricity, and propane. Fuel oil dealers compete for customers in all categories, including industrial customers. Gas Utility responds to this competition with marketing and sales efforts designed to retain, expand, and grow its customer base.
In substantially all of its service territories, Gas Utility is the only regulated gas distribution utility having the right, granted by the PUC or by law, to provide gas distribution services. Larger commercial and industrial customers have the right to purchase gas supplies from entities other than natural gas distribution utility companies. As a result of Pennsylvania’s Natural Gas Choice and Competition Act, effective July 1, 1999, all of Gas Utility’s customers, including core-market customers, have been afforded this opportunity.
A number of Gas Utility’s commercial and industrial customers have the ability to switch to an alternate fuel at any time and, therefore, are served on an interruptible basis under rates that are competitively priced with respect to the alternate fuel. Margin from these customers, therefore, is affected by the difference or “spread” between the customers’ delivered cost of gas and the customers’ delivered cost of the alternate fuel, the frequency and duration of interruptions, and alternative firm service options. See “Gas Utility Regulation and Rates - Pennsylvania Public Utility Commission Jurisdiction and Gas Utility Rates.”
Approximately 23% of Gas Utility’s annual throughput volume for commercial and industrial customers includes customers with locations that afford them the opportunity of seeking transportation service directly from interstate pipelines, thereby bypassing Gas Utility. In addition, approximately 31% of Gas Utility’s annual throughput volume for commercial and industrial customers is from customers who are served under interruptible rates and are also in a location near an interstate pipeline. Gas Utility has approximately 26 of such customers with transportation contracts extending beyond Fiscal 2015. The majority of these customers are served under transportation contracts having 3 to 20 year terms and all are among the largest customers for Gas Utility in terms of annual volumes. No single customer represents, or is anticipated to represent, more than 5% of Gas Utility’s total revenues.
Outlook for Gas Service and Supply
Gas Utility anticipates having adequate pipeline capacity, peaking services and other sources of supply available to it to meet the full requirements of all firm customers on its system through Fiscal 2015. Supply mix is diversified, market priced, and delivered pursuant to a number of long-term and short-term firm transportation and storage arrangements, including transportation contracts held by some of Gas Utility’s larger customers.
During Fiscal 2014, Gas Utility supplied transportation service to five major co-generation installations and four electric generation facilities. Gas Utility continues to seek new residential, commercial, and industrial customers for both firm and interruptible service. In Fiscal 2014, Gas Utility connected approximately 2,000 new commercial and industrial customers. In the residential market sector, Gas Utility connected nearly 16,000 residential heating customers during Fiscal 2014. Over 12,000 of these customers converted to natural gas heating from other energy sources, mainly oil and electricity. New home construction customers and existing non-heating gas customers who added gas heating systems to replace other energy sources primarily accounted for the other residential heating connections in Fiscal 2014.
UGI Utilities continues to monitor and participate, where appropriate, in rulemaking and individual rate and tariff proceedings
17
before FERC affecting the rates and the terms and conditions under which Gas Utility transports and stores natural gas. Among these proceedings are those arising out of certain FERC orders and/or pipeline filings that relate to (i) the pricing of pipeline services in a competitive energy marketplace; (ii) the flexibility of the terms and conditions of pipeline service tariffs and contracts; and (iii) pipelines’ requests to increase their base rates, or change the terms and conditions of their storage and transportation services.
UGI Utilities’ objective in negotiations with interstate pipeline and natural gas suppliers, and in proceedings before regulatory agencies, is to assure availability of supply, transportation, and storage alternatives to serve market requirements at the lowest cost possible, taking into account the need for security of supply. Consistent with that objective, UGI Utilities negotiates the terms of firm transportation capacity on all pipelines serving it, arranges for appropriate storage and peak-shaving resources, negotiates with producers for competitively priced gas purchases and aggressively participates in regulatory proceedings related to transportation rights and costs of service.
GAS UTILITY REGULATION AND RATES
Pennsylvania Public Utility Commission Jurisdiction and Gas Utility Rates
Gas Utility is subject to regulation by the PUC as to rates, terms and conditions of service, accounting matters, issuance of securities, contracts and other arrangements with affiliated entities, and various other matters. Rates that Gas Utility may charge for gas service come in two forms: (i) rates designed to recover purchased gas costs (“PGCs”); and (ii) rates designed to recover costs other than PGCs. Rates designed to recover PGCs are reviewed in PGC proceedings. Rates designed to recover costs other than PGCs are primarily established in general base rate proceedings.
The gas service tariffs for UGI Gas, PNG, and CPG contain PGC rates applicable to firm retail rate schedules. These PGC rates permit recovery of substantially all of the prudently incurred costs of natural gas that UGI Gas, PNG, and CPG sell to their customers. PGC rates are reviewed and approved annually by the PUC. UGI Gas, PNG, and CPG may request quarterly or, under certain conditions, monthly adjustments to reflect the actual cost of gas. Quarterly adjustments become effective on one day’s notice to the PUC and are subject to review during the next annual PGC filing. Each proposed annual PGC rate is required to be filed with the PUC six months prior to its effective date. During this period, the PUC holds hearings to determine whether the proposed rate reflects a least-cost fuel procurement policy consistent with the obligation to provide safe, adequate and reliable service. After completion of these hearings, the PUC issues an order permitting the collection of gas costs at levels that meet that standard. The PGC mechanism also provides for an annual reconciliation.
UGI Gas has two PGC rates: (i) applicable to small, firm, retail core-market customers consisting of the residential and small commercial and industrial classes; and (ii) applicable to firm, high-load factor, customers served on three separate rates. PNG and CPG each have one PGC rate applicable to all customers. Base rates for each of UGI Gas, PNG, and CPG were last established in 1995, 2009, and 2011, respectively.
On February 20, 2014, the PUC entered an order approving a Growth Extension Tariff (“GET Gas”) program under which UGI Gas, PNG, and CPG may invest up to $5 million per year for five years, or $75 million in the aggregate for all three utilities, to extend natural gas utility pipelines to provide service to unserved and underserved areas within their respective territories. Under the GET Gas program, customers utilizing the extended pipeline to receive natural gas will pay a monthly surcharge over a 10-year period to cover the cost of the extension. Gas Utility began connecting customers under the GET Gas program in October 2014.
FERC Market Manipulation Rules and Other FERC Enforcement and Regulatory Powers
Gas Utility is subject to Section 4A of the Natural Gas Act and Section 222 of the Federal Power Act, which prohibit the use or employment of any manipulative or deceptive devices or contrivances in connection with the purchase or sale of natural gas or natural gas transportation subject to the jurisdiction of FERC, and FERC regulations that are designed to promote the transparency, efficiency, and integrity of gas markets.
State Tax Surcharge Clauses
UGI Utilities’ gas service tariffs contain state tax surcharge clauses. The surcharges are recomputed whenever any of the tax rates included in their calculation are changed. These clauses protect UGI Utilities from the effects of increases in most of the Pennsylvania taxes to which it is subject.
18
Utility Franchises
UGI Utilities, PNG and CPG each hold certificates of public convenience issued by the PUC and certain “grandfather rights” predating the adoption of the Pennsylvania Public Utility Code and its predecessor statutes, which each of them believes are adequate to authorize them to carry on their business in substantially all of the territories to which they now render gas service. Under applicable Pennsylvania law, UGI Utilities, PNG and CPG also have certain rights of eminent domain as well as the right to maintain their facilities in streets and highways in their territories.
Other Government Regulation
In addition to regulation by the PUC and FERC, Gas Utility is subject to various federal, state and local laws governing environmental matters, occupational health and safety, pipeline safety and other matters. Gas Utility is subject to the requirements of the Resource Conservation and Recovery Act, the Comprehensive Environmental Response, Compensation, and Liability Act, and comparable state statutes with respect to the release of hazardous substances on property owned or operated by Gas Utility. See Note 16 to Consolidated Financial Statements.
Employees
At September 30, 2014, Gas Utility had approximately 1,400 employees.
ELECTRIC UTILITY AND HVAC
ELECTRIC UTILITY
Electric Utility supplies electric service to approximately 62,000 customers in portions of Luzerne and Wyoming counties in northeastern Pennsylvania through a system consisting of over 1,900 miles of lines and 13 substations. At September 30, 2014, UGI Utilities’ electric utility operations had approximately 70 employees.
In accordance with Electric Utility’s default service settlement with the PUC effective June 1, 2014 through May 31, 2017, Electric Utility is permitted to recover prudently incurred electricity costs, including costs to obtain supply to meet its customers’ energy requirements, pursuant to a supply plan filed with the PUC. UGI Utilities’ electric utility operations are subject to regulation by the PUC as to rates, terms and conditions of service, accounting matters, issuance of securities, contracts and other arrangements with affiliated entities, and various other matters. The most recent general base rate increase for Electric Utility became effective in 1996. PUC default service regulations became applicable to Electric Utility’s provision of default service effective January 1, 2010 and Electric Utility, consistent with these regulations, has received PUC approval through May 31, 2017 of (i) default service tariff rules, (ii) a reconcilable default service cost rate recovery mechanism to recover the cost of acquiring default service supplies, (iii) a plan for meeting the post-2009 requirements of the Alternative Energy Portfolio Standards Act (“AEPS Act”), which requires Electric Utility to directly or indirectly acquire certain percentages of its supplies from designated alternative energy sources, and (iv) a reconcilable AEPS Act cost recovery rate mechanism to recover the costs of complying with AEPS Act requirements applicable to default service supplies for service rendered through May 31, 2017. Under these rules, default service rates for most customers are adjusted quarterly.
FERC has jurisdiction over the rates and terms and conditions of service of electric transmission facilities used for wholesale or retail choice transactions. Electric Utility owns electric transmission facilities that are within the control area of PJM and are dispatched in accordance with a FERC-approved open access tariff and associated agreements administered by PJM. PJM is a regional transmission organization that regulates and coordinates generation supply and the wholesale delivery of electricity. Electric Utility receives certain revenues collected by PJM, determined under a formulary rate schedule that is adjusted in June of each year to reflect annual changes in Electric Utility’s electric transmission revenue requirements, when its transmission facilities are used by third parties. FERC has jurisdiction over the rates and terms and conditions of service of wholesale sales of electric capacity and energy. Electric Utility has a tariff on file with FERC pursuant to which it may make power sales to wholesale customers at market-based rates.
19
HVAC
We conduct our heating, ventilation, air-conditioning, refrigeration and electrical contracting service business through HVAC, which serves portions of eastern Pennsylvania and the Mid-Atlantic region, including the Philadelphia suburbs and portions of New Jersey and northern Delaware. This business serves more than 90,000 customers in residential, commercial, industrial and new construction markets. During Fiscal 2014, HVAC generated approximately $83 million in revenues and had approximately 450 employees.
BUSINESS SEGMENT INFORMATION
The table stating the amounts of revenues, operating income (loss) and identifiable assets attributable to each of UGI’s reportable business segments, and to the geographic areas in which we operate, for the 2014, 2013 and 2012 fiscal years appears in
Note 21
to Consolidated Financial Statements included in Item 8 of this Report and is incorporated herein by reference.
EMPLOYEES
At September 30, 2014, UGI and its subsidiaries had nearly 12,800 employees.
There are many factors that may affect our business and results of operations. Additional discussion regarding factors that may affect our business and operating results is included elsewhere in this Report.
Decreases in the demand for our energy products and services because of
warmer-than-normal heating season weather may adversely affect our results
of operations.
Because many of our customers rely on our energy products and services to heat their homes and businesses, our results of operations are adversely affected by warmer-than-normal heating season weather. Weather conditions have a significant impact on the demand for our energy products and services for both heating and agricultural purposes. Accordingly, the volume of our energy products sold is at its highest during the peak heating season of October through March and is directly affected by the severity of the winter weather. For example, historically, approximately 60% to 70% of AmeriGas Partners’ annual retail propane volume and Antargaz’ annual retail LPG volume, and 60% to 70% of Gas Utility’s natural gas throughput (the total volume of gas sold to or transported for customers within our distribution system) has been sold during these months. There can be no assurance that normal winter weather in our market areas will occur in the future.
Our holding company structure could limit our ability to pay dividends or
debt service.
We are a holding company whose material assets are the stock of our subsidiaries. Our ability to pay dividends on our common stock and to pay principal and accrued interest on our debt, if any, depends on the payment of dividends to us by our principal subsidiaries, AmeriGas, Inc., UGI Utilities, Inc. and UGI Enterprises, Inc. (including Antargaz). Payments to us by those subsidiaries, in turn, depend upon their consolidated results of operations and cash flows. The operations of our subsidiaries are affected by conditions beyond our control, including weather, competition in national and international markets we serve, the costs and availability of propane, butane, natural gas, electricity, and other energy sources and capital market conditions. The ability of our subsidiaries to make payments to us is also affected by the level of indebtedness of our subsidiaries, which is substantial, and the restrictions on payments to us imposed under the terms of such indebtedness.
Our profitability is subject to LPG pricing and inventory risk.
The retail LPG business is a “margin-based” business in which gross profits are dependent upon the excess of the sales price over the LPG supply costs. LPG is a commodity, and, as such, its unit price is subject to volatile fluctuations in response to changes in supply or other market conditions. We have no control over these market conditions. Consequently, the unit price of the LPG that our subsidiaries and other marketers purchase can change rapidly over a short period of time. Most of our domestic LPG product supply contracts permit suppliers to charge posted prices at the time of delivery or the current prices established at major U.S. storage points such as Mont Belvieu, Texas or Conway, Kansas. Most of our international LPG supply contracts are based on internationally quoted market prices. Because our subsidiaries’ profitability is sensitive to changes in wholesale propane supply costs, it will be adversely affected if we cannot pass on increases in the cost of propane to our customers. Due to competitive pricing in the industry, our subsidiaries may not fully be able to pass on product cost increases to our customers when product costs rise, or when our competitors do not raise their product prices in a timely manner. Finally, market volatility may cause our
20
subsidiaries to sell LPG at less than the price at which they purchased it, which would adversely affect our operating results.
Energy efficiency and technology advances, as well as price induced customer
conservation, may result in reduced demand for our energy products and
services.
The trend toward increased conservation and technological advances, including installation of improved insulation and the development of more efficient furnaces and other heating devices, may reduce the demand for energy products. Prices for LPG and natural gas are subject to volatile fluctuations in response to changes in supply and other market conditions. During periods of high energy commodity costs, our prices generally increase, which may lead to customer conservation and attrition. A reduction in demand could lower our revenues and, therefore, lower our net income and adversely affect our cash flows. State and/or federal regulation may require mandatory conservation measures, which would reduce the demand for our energy products. We cannot predict the materiality of the effect of future conservation measures or the effect that any technological advances in heating, conservation, energy generation or other devices might have on our operations.
Economic recession, volatility in the stock market and the low interest
rate environment may negatively impact our pension liability.
Economic recession, volatility in the stock market and the low interest rate environment have had a significant impact on our pension liability and funded status. Declines in the stock or bond market and valuation of stocks or bonds, combined with continued low interest rates, could further impact our pension liability and funded status and increase the amount of required contributions to our pension plans.
The adoption of financial reform legislation by the United States Congress and related regulations may have an adverse effect on our ability to use derivative instruments to hedge risks associated with our business.
Congress adopted the Dodd-Frank Wall Street Reform and Consumer Protection Act in 2010, which contains comprehensive financial reform legislation. That act imposes regulation on the over-the-counter derivatives market and entities that participate in that market. The act requires the Commodities Futures Trading Commission (“CFTC”), the U.S. Securities and Exchange Commission (“SEC”) and other regulators to implement the act’s provisions. Some rules and regulations under the act have been finalized but additional rules and regulations have yet to be adopted. It is possible that the rules and regulations under the act may increase our cost of using derivative instruments to hedge risks associated with our business or may reduce the availability of such instruments to protect against risks we encounter. Increased costs may arise from any new margin, clearing and trade-execution requirements imposed upon individual transactions, as well as from new capital, reporting, recordkeeping, compliance and business conduct requirements imposed upon our counterparties to the extent those costs are passed through to us. Position limits may be imposed that could further limit our ability to hedge risks. To the extent new rules and regulations require more collateral or margin for individual transactions, our available liquidity may be adversely affected. Additionally, new rules and regulations may restrict our ability to monetize or restructure existing derivative contracts and require us to restructure portions of our energy marketing and trading business. Accordingly, our business and operating results may be adversely affected if, as a result of the act and the rules and regulations promulgated under the act, we are forced to reduce or modify our current use of derivatives.
Supplier defaults may have a negative effect on our operating results.
When the Company enters into fixed-price sales contracts with customers, it typically enters into fixed-price purchase contracts with suppliers. Depending on changes in the market prices of products compared to the prices secured in our contracts with suppliers of LPG, natural gas and electricity, a default of one or more of our suppliers under such contracts could cause us to purchase those commodities at higher prices, which would have a negative impact on our operating results.
We are dependent on our principal propane suppliers, which increases the
risks from an interruption in supply and transportation.
During Fiscal 2014, AmeriGas Propane purchased over 90% of its propane needs from twenty suppliers. If supplies from these sources were interrupted, the cost of procuring replacement supplies and transporting those supplies from alternative locations might be materially higher and, at least on a short-term basis, our earnings could be affected. Additionally, in certain areas, a single supplier may provide more than 50% of AmeriGas Propane’s propane requirements. Disruptions in supply in these areas could also have an adverse impact on our earnings. Our international businesses are similarly dependent upon their suppliers. There is no assurance that our international businesses will be able to continue to acquire sufficient supplies of LPG to meet demand at prices or within time periods that would allow them to remain competitive. In addition, much of Flaga’s LPG is supplied by Kazakhstan and travels through Russia and Ukraine. The imposition of sanctions on Flaga’s suppliers or a significant change in Flaga’s LPG supply route could lead to supply disruptions and higher costs which could have an adverse impact on our earnings.
21
Changes in commodity market prices may have a significant negative effect on our
liquidity.
Depending on the terms of our contracts with suppliers as well as our use of financial instruments to reduce volatility in the cost of propane, changes in the market price of propane can create margin payment obligations for us and expose us to an increased liquidity risk. In addition, increased demand for domestically produced propane overseas may, depending on production volumes in the U.S., result in higher domestic propane prices and expose us to additional liquidity risks.
Our operations may be adversely affected by competition from other energy
sources.
Our energy products and services face competition from other energy sources, some of which are less costly for equivalent energy value. In addition, we cannot predict the effect that the development of alternative energy sources might have on our operations.
Our propane businesses compete for customers against suppliers of electricity, fuel oil and natural gas. Electricity is a major competitor of propane and, except in France, is generally more expensive than propane on a Btu equivalent basis for space heating, water heating and cooking. The convenience and efficiency of electricity makes it an attractive energy source for consumers and developers of new homes. Fuel oil is also a major competitor of propane and, although a less environmentally attractive energy source, is currently less expensive than propane. Furnaces and appliances that burn propane will not operate on fuel oil and vice versa, and, therefore, a conversion from one fuel to the other requires the installation of new equipment. Our customers generally have an incentive to switch to fuel oil only if fuel oil becomes significantly less expensive than propane. Except for certain industrial and commercial applications, propane is generally not competitive with natural gas in areas where natural gas pipelines already exist because natural gas is generally a significantly less expensive source of energy than propane. The gradual expansion of natural gas distribution systems in our service areas has resulted, and may continue to result, in the availability of natural gas in some areas that previously depended upon propane. As long as natural gas remains a less expensive energy source than propane, our propane business will lose customers in each region into which natural gas distribution systems are expanded. In France, the state-owned natural gas monopoly, Gaz de France, has in the past extended France’s natural gas grid. In addition, due to the prevalence of nuclear electric generation in France, the cost of electricity is generally less expensive than that of LPG, particularly when the cost to install new equipment to convert to LPG is considered.
Our natural gas businesses compete primarily with electricity and fuel oil, and, to a lesser extent, with propane and coal. Competition among these fuels is primarily a function of their comparative price and the relative cost and efficiency of fuel utilization equipment. There can be no assurance that our natural gas revenues will not be adversely affected by this competition.
Our ability to increase revenues is adversely affected by the decline of the
retail LPG industry.
The retail LPG distribution industry in the U.S. and each of the European countries in which we operate is mature and has been declining over the past several years in the U.S., with no or modest growth in total demand foreseen. Given this forecast, we expect that year-to-year industry volumes will be principally affected by weather patterns. Therefore, our ability to grow within the LPG industry is dependent on our ability to acquire other retail distributors and to achieve internal growth, which includes expansion of the domestic Propane Exchange and National Accounts programs in the U.S., as well as the success of our sales and marketing programs designed to attract and retain customers. A failure to retain and grow our customer base could have an adverse effect on our business, financial condition and results of operations.
Volatility in credit and capital markets may restrict our ability to grow,
increase the likelihood of defaults by our customers and counterparties and
adversely affect our operating results.
The volatility in credit and capital markets may create additional risks to our businesses in the future. We are exposed to financial market risk (including refinancing risk) resulting from, among other things, changes in interest rates and conditions in the credit and capital markets. Developments in the credit markets during the past few years increase our possible exposure to the liquidity, default and credit risks of our suppliers, counterparties associated with derivative financial instruments and our customers. Although we believe that current financial market conditions, if they were to continue for the foreseeable future, will not have a significant impact on our ability to fund our existing operations, such market conditions could restrict our ability to grow through acquisitions, could limit the scope of major capital projects if access to credit and capital markets is limited, or adversely affect our operating results.
Our ability to grow our businesses will be adversely affected if we are not
successful in making acquisitions or integrating the acquisitions we have
made.
One of our strategies is to grow through acquisitions in the U.S. and in international markets. We may choose to finance future
22
acquisitions with debt, equity, cash or a combination of the three. We can give no assurances that we will find attractive acquisition candidates in the future, that we will be able to acquire such candidates on economically acceptable terms, that we will be able to finance acquisitions on economically acceptable terms, that any acquisitions will not be dilutive to earnings or that any additional debt incurred to finance an acquisition will not affect our ability to pay dividends.
In addition, the restructuring of the energy markets in the U.S. and internationally, including the privatization of government-owned utilities and the sale of utility-owned assets, is creating opportunities for, and competition from, well-capitalized competitors, which may affect our ability to achieve our business strategy.
To the extent we are successful in making acquisitions, such acquisitions involve a number of risks. These risks include, but are not limited to, the assumption of material liabilities, the diversion of management’s attention from the management of daily operations to the integration of operations, difficulties in the assimilation and retention of employees and difficulties in the assimilation of different cultures and practices and internal controls, as well as in the assimilation of broad and geographically dispersed personnel and operations. The failure to successfully integrate acquisitions could have an adverse effect on our business, financial condition and results of operations.
Expanding our midstream asset business by constructing new facilities
subjects us to risks.
We seek to grow our midstream asset business by constructing new pipelines and gathering systems, expanding our LNG facility and improving our gas storage facilities. These construction projects involve numerous regulatory, environmental, political and legal uncertainties beyond our control and require the expenditure of significant amounts of capital. These projects may not be completed on schedule, or at all, or at the anticipated costs. Moreover, our revenues may not increase immediately upon the expenditure of funds on a particular project. We may construct facilities to capture anticipated future growth in production and demand in an area in which anticipated growth and demand does not materialize. As a result, there is the risk that new and expanded facilities may not be able to attract enough customers to achieve our expected investment returns, which could have a material adverse effect on our business, financial condition and results of operations.
Our need to comply with, and respond to industry-wide changes resulting from, comprehensive, complex, and sometimes unpredictable
governmental regulations, including regulatory initiatives aimed at increasing competition within our industry, may increase our costs and limit our revenue growth,
which may adversely affect our operating results.
While we generally refer to our Gas Utility and Electric Utility segments as our “regulated segments,” there are many governmental regulations that have an impact on all of our businesses. Currently, we are subject to extensive and changing international, federal, state, and local safety, health, transportation, tax, and environmental laws and regulations governing the storage, distribution, and transportation of our energy products. Moreover, existing statutes and regulations may be revised or reinterpreted and new laws and regulations may be adopted or become applicable to the Company that may affect our businesses in ways that we cannot predict.
New regulations, or a change in the interpretation of existing regulations, could result in increased expenditures. In addition, for many of our operations, we are required to obtain permits from regulatory authorities. Failure to obtain or comply with these permits or applicable laws could result in civil and criminal fines or the cessation of the operations in violation. Governmental regulations and policies in the U.S. and Europe may provide for subsidies or incentives to customers who use alternative fuels instead of carbon fuels. These subsidies and incentives may result in reduced demand for our energy products and services.
We are investigating and remediating contamination at a number of present and former operating sites in the U.S., including former sites where we or our former subsidiaries operated manufactured gas plants. We have also received claims from third parties that allege that we are responsible for costs to clean up properties where we or our former subsidiaries operated a manufactured gas plant or conducted other operations. Costs we incur to remediate sites outside of Pennsylvania cannot currently be recovered in PUC rate proceedings, and insurance may not cover all or even part of these costs. Our actual costs to clean up these sites may exceed our current estimates due to factors beyond our control, such as:
|
•
|
the discovery of presently unknown conditions;
|
|
•
|
changes in environmental laws and regulations;
|
|
•
|
judicial rejection of our legal defenses to the third-party claims; or
|
|
•
|
the insolvency of other responsible parties at the sites at which we are involved.
|
Moreover, if we discover additional contaminated sites, we could be required to incur material costs, which would reduce our net income.
23
We also may be unable to timely respond to changes within the energy and utility sectors that may result from regulatory initiatives to further increase competition within our industry. Such regulatory initiatives may create opportunities for additional competitors to enter our markets and, as a result, we may be unable to maintain our revenues or continue to pursue our current business strategy.
Regulators may not allow timely recovery of costs for UGI Utilities and its subsidiaries in the
future, which may adversely affect our results of operations.
In our Gas Utility and Electric Utility segments, our distribution operations are subject to regulation by the PUC. The PUC, among other things, approves the rates that UGI Utilities and its subsidiaries, PNG and CPG, may charge their utility customers, thus impacting the returns that UGI Utilities and its subsidiaries may earn on the assets that are dedicated to those operations. We expect that UGI Utilities and its subsidiaries will periodically file requests with the PUC to increase base rates that each company charges customers. If UGI Utilities or its applicable subsidiary is required in a rate proceeding to reduce the rates it charges its utility customers, or is unable to obtain approval for timely rate increases from the PUC, particularly when necessary to cover increased costs, UGI Utilities’ or such subsidiary’s revenue growth will be limited and earnings may decrease.
We are subject to operating and litigation risks that may not be covered by
insurance.
Our business operations in the U.S. and other countries are subject to all of the operating hazards and risks normally incidental to the handling, storage and distribution of combustible products, such as LPG, propane and natural gas, and the generation of electricity. These risks could result in substantial losses due to personal injury and/or loss of life, and severe damage to and destruction of property and equipment arising from explosions and other catastrophic events, including acts of terrorism. As a result, we are sometimes a defendant in legal proceedings and litigation arising in the ordinary course of business. There can be no assurance that our insurance will be adequate to protect us from all material expenses related to pending and future claims or that such levels of insurance will be available in the future at economical prices.
Our operations, capital expenditures and financial results may be affected
by regulatory changes and/or market responses to global climate change.
There continues to be concern, both nationally and internationally, about climate change and the contribution of GHG emissions, most notably carbon dioxide, to global warming. In addition to carbon dioxide, greenhouse gases include, among others, methane, a component of natural gas. While some states have adopted laws and regulations regulating the emission of GHGs for some industry sectors, there is currently no federal or regional legislation mandating the reduction of GHG emissions in the U.S. Although Congress has not enacted federal climate change legislation, the EPA has begun adopting and implementing regulations to restrict emissions of GHGs from motor vehicles and certain large stationary sources, and to require reporting of GHG emissions by certain regulated facilities on an annual basis. For the most part, our facilities are not currently subject to these regulations, but the potential increased costs of regulatory compliance and mandatory reporting by our customers and suppliers could have an effect on our operations or financial condition. The adoption of additional federal or state climate change legislation or regulatory programs to reduce emissions of GHGs could require us or our suppliers to incur increased capital and operating costs, with resulting impact on product price and demand. In September 2009, the EPA issued a final rule establishing a system for mandatory reporting of GHG emissions. In November 2010, the EPA expanded the reach of its GHG reporting requirements to include the petroleum and natural gas industries. Petroleum and natural gas facilities subject to the rule, which include facilities of our natural gas distribution business, were required to begin emissions monitoring in January 2011 and to submit detailed annual reports beginning in March 2012. The rule does not require affected facilities to implement GHG emission controls or reductions. However, in June 2014, the EPA proposed the Clean Power Plan, which will provide standards and guidelines for reducing existing power plants’ GHG emissions and related pollutants by 2030. The Clean Power Plan standards and guidelines are expected to be finalized by June 2015. The impact of new legislation and regulations will depend on a number of factors, including (i) which industry sectors would be impacted, (ii) the timing of required compliance, (iii) the overall GHG emissions cap level, (iv) the allocation of emission allowances to specific sources, and (v) the costs and opportunities associated with compliance. At this time, we cannot predict the effect that climate change regulation may have on our business, financial condition or operations in the future.
Our international operations could be subject to increased risks, which may
negatively affect our business results.
We currently operate LPG distribution businesses in Europe through our subsidiaries and we continue to explore the expansion of our international businesses. As a result, we face risks in doing business abroad that we do not face domestically. Certain aspects inherent in transacting business internationally could negatively impact our operating results, including:
|
•
|
costs and difficulties in staffing and managing international operations;
|
|
•
|
tariffs and other trade barriers;
|
|
•
|
difficulties in enforcing contractual rights;
|
24
|
•
|
longer payment cycles;
|
|
•
|
local political and economic conditions, including the current financial downturn in the euro zone;
|
|
•
|
potentially adverse tax consequences, including restrictions on repatriating earnings and the threat of “double taxation”;
|
|
•
|
fluctuations in currency exchange rates, which can affect demand and increase our costs;
|
|
•
|
internal control and risk management practices and policies;
|
|
•
|
potential violations of federal regulatory requirements, including the Foreign Corrupt Practices Act of 1977, as amended;
|
|
•
|
regulatory requirements and changes in regulatory requirements, including Norwegian, Swiss and EU competition laws that may adversely affect the terms of contracts with customers, including with respect to exclusive supply rights, and stricter regulations applicable to the storage and handling of LPG; and
|
|
•
|
new and inconsistently enforced LPG industry regulatory requirements, which can have an adverse effect on our competitive position.
|
If we are unable to protect our information technology systems against service interruption, misappropriation of data, or breaches of security resulting from cyber security attacks or other events, or we encounter other unforeseen difficulties in the operation of our information technology systems, our operations could be disrupted, our business and reputation may suffer, and our internal controls could be adversely affected.
In the ordinary course of business, we rely on information technology systems, including the Internet and third-party hosted services, to support a variety of business processes and activities and to store sensitive data, including (i) intellectual property, (ii) our proprietary business information and that of our suppliers and business partners, (iii) personally identifiable information of our customers and employees, and (iv) data with respect to invoicing and the collection of payments, accounting, procurement, and supply chain activities. In addition, we rely on our information technology systems to process financial information and results of operations for internal reporting purposes and to comply with financial reporting, legal, and tax requirements. Despite our security measures, our information technology systems may be vulnerable to attacks by hackers or breached due to employee error, malfeasance, sabotage, or other disruptions. A loss of our information technology systems, or temporary interruptions in the operation of our information technology systems, misappropriation of data, and breaches of security could have a material adverse effect on our business, financial condition, results of operations, and reputation. In addition, a cyber security attack could provide a cyber intruder with the ability to control or alter our pipeline operations. Such an act could result in critical pipeline failures.
Moreover, the efficient execution of the Company’s businesses is dependent upon the proper functioning of its internal systems, such as the information technology system that supports the Partnership’s Order-to-Cash business processes. Any significant failure or malfunction of such information technology systems may result in disruptions of our operations. In addition, the effectiveness of our internal controls could be adversely affected if we encounter unforeseen problems with respect to the operation of our information technology systems.
None.
With the exception of those matters set forth in
Note 16
to Consolidated Financial Statements included in Item 8 of this Report, no material legal proceedings are pending involving the Company, any of its subsidiaries, or any of their properties, and no such proceedings are known to be contemplated by governmental authorities other than claims arising in the ordinary course of business.
None.
EXECUTIVE OFFICERS
Information regarding our executive officers is included in Part III of this Report and is incorporated in Part I by reference.
25
|
ITEM 5.
|
MARKET FOR REGISTRANT’S COMMON EQUITY, RELATED STOCKHOLDER MATTERS AND ISSUER PURCHASES OF EQUITY SECURITIES
|
Market Information
Our Common Stock is traded on the New York Stock Exchange under the symbol “UGI.” On July 29, 2014, the Company announced that its Board of Directors had approved a three-for-two split of its Common Stock. The additional shares were distributed September 5, 2014 to shareholders of record on August 22, 2014. Sales prices and dividends paid for all periods presented in the following tables are reflected on a post-split basis. The following table sets forth the high and low sales prices for the Common Stock on the New York Stock Exchange Composite Transactions tape as reported in
The Wall Street Journal
for each full quarterly period within the two most recent fiscal years.
|
2014 Fiscal Year
|
High
|
Low
|
||||||
|
4th Quarter
|
$
|
36.69
|
|
$
|
31.53
|
|
||
|
3rd Quarter
|
$
|
33.73
|
|
$
|
29.77
|
|
||
|
2nd Quarter
|
$
|
30.52
|
|
$
|
26.83
|
|
||
|
1st Quarter
|
$
|
28.19
|
|
$
|
25.25
|
|
||
|
2013 Fiscal Year
|
High
|
Low
|
||||||
|
4th Quarter
|
$
|
28.83
|
|
$
|
25.35
|
|
||
|
3rd Quarter
|
$
|
28.07
|
|
$
|
24.29
|
|
||
|
2nd Quarter
|
$
|
25.64
|
|
$
|
21.93
|
|
||
|
1st Quarter
|
$
|
22.39
|
|
$
|
20.10
|
|
||
Dividends
Quarterly dividends on our Common Stock were paid in Fiscal 2014 and Fiscal 2013 as follows:
|
2014 Fiscal Year
|
Amount
|
|||
|
4th Quarter
|
$
|
0.1967
|
|
|
|
3rd Quarter
|
$
|
0.1883
|
|
|
|
2nd Quarter
|
$
|
0.1883
|
|
|
|
1st Quarter
|
$
|
0.1883
|
|
|
|
2013 Fiscal Year
|
Amount
|
|||
|
4th Quarter
|
$
|
0.1883
|
|
|
|
3rd Quarter
|
$
|
0.18
|
|
|
|
2nd Quarter
|
$
|
0.18
|
|
|
|
1st Quarter
|
$
|
0.18
|
|
|
Record Holders
On November 21, 2014, UGI had 6,620 holders of record of Common Stock.
26
Unregistered Sales of Equity Securities and Use of Proceeds
T
he following table sets forth information with respect to the Company’s repurchases of its Common Stock during the quarter ended September 30, 2014. The shares of UGI Corporation Common Stock presented in this table are reflected on a post-split basis.
|
Period
|
(a) Total Number of Shares Purchased
|
(b) Average Price Paid per Share (or Unit)
|
(c) Total Number of Shares (or Units) Purchased as Part of Publicly Announced Plans or Programs
(1)
|
(d) Maximum Number (or Approximate Dollar Value) of Shares (or Units) that May Yet Be Purchased Under the Plans or Programs
|
||||
|
July 1, 2014 to July 31, 2014
|
—
|
$0
|
—
|
14.3 million
|
||||
|
August 1, 2014 to August 31, 2014
|
433,385
|
$33.60
|
433,385
|
13.9 million
|
||||
|
September 1, 2014 to September 30, 2014
|
108,750
|
$35.29
|
108,750
|
13.8 million
|
||||
|
Total
|
542,135
|
542,135
|
||||||
(1) Shares of UGI Corporation Common Stock are repurchased through a share repurchase program announced by the Company on January 30, 2014. The Board of Directors authorized the repurchase of up to 10 million shares of UGI Corporation Common Stock over a four-year period, or 15,000,000 on a post-split basis.
27
|
ITEM 6.
|
SELECTED FINANCIAL DATA
|
|
|
Year Ended September 30,
|
|||||||||||||||||||
|
(Dollars in millions, except per share amounts)
|
2014
|
2013
|
2012 (b)
|
2011
|
2010
|
|||||||||||||||
|
FOR THE PERIOD:
|
|
|
|
|
|
|||||||||||||||
|
Income statement data:
|
|
|
|
|
|
|||||||||||||||
|
Revenues
|
$
|
8,277.3
|
|
$
|
7,194.7
|
|
$
|
6,521.3
|
|
$
|
6,090.9
|
|
$
|
5,591.1
|
|
|||||
|
Net income
|
$
|
532.6
|
|
$
|
427.6
|
|
$
|
197.7
|
|
$
|
320.0
|
|
$
|
346.6
|
|
|||||
|
(Deduct net income) add net loss attributable to noncontrolling interests, principally in AmeriGas Partners
|
(195.4
|
)
|
(149.5
|
)
|
12.5
|
|
(74.6
|
)
|
(94.8
|
)
|
||||||||||
|
Net income attributable to UGI Corporation
|
$
|
337.2
|
|
$
|
278.1
|
|
$
|
210.2
|
|
$
|
245.4
|
|
$
|
251.8
|
|
|||||
|
Earnings per common share attributable to UGI stockholders (a):
|
|
|
|
|
|
|||||||||||||||
|
Basic
|
$
|
1.95
|
|
$
|
1.63
|
|
$
|
1.24
|
|
$
|
1.46
|
|
$
|
1.53
|
|
|||||
|
Diluted
|
$
|
1.92
|
|
$
|
1.60
|
|
$
|
1.24
|
|
$
|
1.45
|
|
$
|
1.52
|
|
|||||
|
Cash dividends declared per common share (a)
|
$
|
0.791
|
|
$
|
0.737
|
|
$
|
0.707
|
|
$
|
0.68
|
|
$
|
0.60
|
|
|||||
|
AT PERIOD END:
|
|
|
|
|
|
|||||||||||||||
|
Balance sheet data:
|
|
|
|
|
|
|||||||||||||||
|
Total assets
|
$
|
10,093.0
|
|
$
|
10,008.8
|
|
$
|
9,676.9
|
|
$
|
6,660.9
|
|
$
|
6,373.6
|
|
|||||
|
Capitalization:
|
|
|
|
|
|
|||||||||||||||
|
Debt:
|
|
|
|
|
|
|||||||||||||||
|
Short-term debt:
|
||||||||||||||||||||
|
AmeriGas Propane
|
$
|
109.0
|
|
$
|
116.9
|
|
$
|
49.9
|
|
$
|
95.5
|
|
$
|
91.0
|
|
|||||
|
UGI International
|
8.0
|
|
6.5
|
|
21.0
|
|
18.9
|
|
92.4
|
|
||||||||||
|
UGI Utilities
|
86.3
|
|
17.5
|
|
9.2
|
|
—
|
|
17.0
|
|
||||||||||
|
Energy Services
|
7.5
|
|
87.0
|
|
85.0
|
|
24.3
|
|
—
|
|
||||||||||
|
Long-term debt (including current maturities):
|
|
|
|
|
||||||||||||||||
|
AmeriGas Propane
|
2,291.7
|
|
2,300.1
|
|
2,328.0
|
|
933.5
|
|
791.4
|
|
||||||||||
|
UGI International
|
565.0
|
|
654.4
|
|
573.9
|
|
571.3
|
|
561.1
|
|
||||||||||
|
UGI Utilities
|
642.0
|
|
642.0
|
|
600.0
|
|
640.0
|
|
640.0
|
|
||||||||||
|
Other
|
12.1
|
|
12.9
|
|
12.4
|
|
12.9
|
|
13.3
|
|
||||||||||
|
Total debt
|
3,721.6
|
|
3,837.3
|
|
3,679.4
|
|
2,296.4
|
|
2,206.2
|
|
||||||||||
|
UGI Corporation stockholders’ equity
|
2,659.1
|
|
2,492.5
|
|
2,229.8
|
|
1,973.5
|
|
1,824.0
|
|
||||||||||
|
Noncontrolling interests, principally in AmeriGas Partners
|
1,004.1
|
|
1,055.4
|
|
1,085.6
|
|
213.0
|
|
237.4
|
|
||||||||||
|
Total capitalization
|
$
|
7,384.8
|
|
$
|
7,385.2
|
|
$
|
6,994.8
|
|
$
|
4,482.9
|
|
$
|
4,267.6
|
|
|||||
|
Ratio of capitalization:
|
|
|
|
|
|
|||||||||||||||
|
Total debt
|
50.4
|
%
|
52.0
|
%
|
52.6
|
%
|
51.2
|
%
|
51.7
|
%
|
||||||||||
|
UGI Corporation stockholders’ equity
|
36.0
|
%
|
33.7
|
%
|
31.9
|
%
|
44.0
|
%
|
42.7
|
%
|
||||||||||
|
Noncontrolling interests, principally in AmeriGas Partners
|
13.6
|
%
|
14.3
|
%
|
15.5
|
%
|
4.8
|
%
|
5.6
|
%
|
||||||||||
|
|
100.0
|
%
|
100.0
|
%
|
100.0
|
%
|
100.0
|
%
|
100.0
|
%
|
||||||||||
28
|
|
Year Ended September 30,
|
|||||||||||||||||||
|
(Dollars in millions, except per share amounts)
|
2014
|
2013
|
2012 (b)
|
2011
|
2010
|
|||||||||||||||
|
NON-GAAP RECONCILATION:
|
||||||||||||||||||||
|
Adjusted net income attributable to UGI Corporation:
|
||||||||||||||||||||
|
Net income attributable to UGI Corporation
|
$
|
337.2
|
|
$
|
278.1
|
|
$
|
210.2
|
|
$
|
245.4
|
|
$
|
251.8
|
|
|||||
|
Net losses (gains) on Midstream & Marketing’s commodity derivative instruments not associated with current period transactions
|
4.9
|
|
(4.3
|
)
|
(8.9
|
)
|
(17.4
|
)
|
8.2
|
|
||||||||||
|
Net losses on AmeriGas Propane commodity derivative instruments entered into beginning April 1, 2014, not associated with current period transactions
|
1.7
|
|
—
|
|
—
|
|
—
|
|
—
|
|
||||||||||
|
Retroactive impact of change in French tax law
|
5.7
|
|
—
|
|
—
|
|
—
|
|
—
|
|
||||||||||
|
Adjusted net income attributable to UGI Corporation (c)
|
$
|
349.5
|
|
$
|
273.8
|
|
$
|
201.3
|
|
$
|
228.0
|
|
$
|
260.0
|
|
|||||
|
Adjusted earnings per common share attributable to UGI stockholders (a):
|
||||||||||||||||||||
|
Basic (c)
|
$
|
2.02
|
|
$
|
1.60
|
|
$
|
1.19
|
|
$
|
1.36
|
|
$
|
1.58
|
|
|||||
|
Diluted (c)
|
$
|
1.99
|
|
$
|
1.58
|
|
$
|
1.18
|
|
$
|
1.35
|
|
$
|
1.57
|
|
|||||
(a) All per share amounts presented reflect the retroactive effects of the three-for-two common stock split distributed September 5, 2014 to shareholders of record on August 22, 2014.
(b) Reflects Heritage Propane beginning January 1, 2012. See
Note 4
to Consolidated Financial Statements for further information.
(c) “Adjusted net income attributable to UGI Corporation” and “adjusted earnings per share - basic and diluted” are not measures of performance or financial condition under accounting principles generally accepted in the United States of America (“GAAP”). Non-GAAP financial measures are not in accordance with, or an alternative to, GAAP and should be considered in addition to, and not as a substitute for, the comparable GAAP measures. Management believes that these non-GAAP measures provide meaningful information to investors about UGI’s performance because they eliminate the impact of (1) gains and losses on Midstream & Marketing’s and, beginning April 1, 2014, AmeriGas Propane’s commodity derivative instruments that are not associated with current-period transactions and (2) those items that management regards as highly unusual in nature and not expected to recur. For further discussion of these financial measures, see the Executive Overview in Item 7, “Management’s Discussion and Analysis of Financial Condition and Results of Operations.”
29
|
ITEM 7.
|
MANAGEMENT’S DISCUSSION AND ANALYSIS OF FINANCIAL CONDITION AND RESULTS OF OPERATIONS
|
Management’s Discussion and Analysis of Financial Condition and Results of Operations (“MD&A”) discusses our results of operations and our financial condition. MD&A should be read in conjunction with our Items 1 & 2, “Business and Properties,” our Item 1A, “Risk Factors,” and our Consolidated Financial Statements in Item 8 below including “Segment Information” included in
Note 21
to Consolidated Financial Statements. On July 29, 2014, the Company announced that its Board of Directors had approved a three-for-two split of UGI Common Stock. The additional shares were distributed September 5, 2014, to shareholders of record on August 22, 2014. All references to shares and per share amounts have been retroactively adjusted to reflect the three-for-two stock split.
Executive Overview
We recorded net income attributable to UGI Corporation for Fiscal 2014 of $337.2 million, equal to $1.92 per diluted share, compared to net income attributable to UGI Corporation for Fiscal 2013 of $278.1 million, equal to $1.60 per diluted share. Net income attributable to UGI Corporation in Fiscal 2014 is net of after-tax losses of $4.9 million on commodity derivative instruments not associated with current-period transactions at Midstream & Marketing and net after-tax losses of $1.7 million on AmeriGas Propane’s commodity derivative instruments entered into beginning April 1, 2014, not associated with current period transactions. Net income attributable to UGI Corporation in Fiscal 2013 includes net after-tax gains of $4.3 million related to Midstream & Marketing commodity derivative instruments not associated with current-period transactions. These net after-tax gains and losses are included in “Corporate & Other” in the business unit summary tables below. Results in Fiscal 2014 also reflect the retroactive effect to Fiscal 2013 of a change in tax laws in France, which increased tax expense and reduced Fiscal 2014 net income by $5.7 million. Adjusted net income attributable to UGI excluding the effects of the previously mentioned commodity derivative instrument gains and losses, and the retroactive impact of the change in tax laws in France, was $349.5 million (equal to $1.99 per diluted share) in Fiscal 2014 compared to $273.8 million (equal to $1.58 per diluted share) in Fiscal 2013.
The $75.7 million increase in adjusted net income attributable to UGI in Fiscal 2014 reflects the effects of significantly colder and more volatile winter weather at Midstream & Marketing and significantly colder weather at our Gas Utility and in AmeriGas Propane’s service territory east of the Rocky Mountains. The significant increase in operating results from these domestic business units was partially offset by the effects of record warm temperatures at our European LPG business units. During Fiscal 2014, net income attributable to UGI increased $65.3 million at Midstream & Marketing, $24.5 million at Gas Utility, and $15.5 million at AmeriGas Propane. Midstream & Marketing’s integrated assets portfolio in the Marcellus Shale in Pennsylvania provided it with the opportunity to take advantage of periods of extreme cold winter weather in the Mid-Atlantic and Northeast U.S. that resulted in heightened natural gas price volatility due to locational basis differentials and increased the demand for, and the value of, winter peaking services. Midstream & Marketing’s Electric Generation business results also benefited from higher unit margins and higher production at its Hunlock and Conemaugh electricity generating facilities. The improved results in Fiscal 2014 at Gas Utility principally reflect the effects on core market volumes of weather that was nearly 11% colder than the prior year. The improved results at AmeriGas Propane reflect the retail volume effects of significantly colder weather in the U.S. east of the Rocky Mountains and the full-year realization of the Heritage Propane integration. The benefits of this colder weather on AmeriGas Propane retail volumes sold were offset, in part, by the unfavorable effects on retail volumes sold and distribution expenses from wholesale supply challenges in certain regions of the U.S., caused by industry-wide storage and transportation issues exacerbated by prolonged periods of unusually cold winter weather, and by significantly warmer winter weather in the western U.S. UGI International net income attributable to UGI declined $34.4 million in Fiscal 2014 principally due to the effects of much warmer than normal winter and spring temperatures at our European LPG businesses on retail volumes sold and the effects of changes in tax laws in France including the previously mentioned $5.7 million retroactive effect.
Our UGI International base-currency results are translated into U.S. dollars based upon exchange rates experienced during each of the reporting periods. Although the foreign currency to U.S. dollar exchange rates during Fiscal 2014 were slightly higher than in Fiscal 2013, such differences did not have a material impact on UGI International net income attributable to UGI.
We believe each of our business units has sufficient liquidity in the forms of revolving credit facilities, and with respect to Energy Services also an accounts receivable securitization facility, to fund business operations during Fiscal 2015 (see Financial Condition and Liquidity below).
Looking ahead, our results in Fiscal 2015 will be influenced by a number of factors including heating-season weather, the level and volatility of commodity prices for natural gas, LPG, electricity and oil, and economic conditions in the U.S. and Europe. We have made substantial progress on growth initiatives that will fuel earnings growth in the future. The volatility in domestic energy prices and prices for capacity and peaking services experienced in Fiscal 2014 were extreme and we do not expect such volatility to occur to a similar extent in Fiscal 2015. However, we expect that our Midstream & Marketing businesses will continue to
30
benefit from the growing demand for natural gas in the Northeast and Mid-Atlantic regions and the current infrastructure gap that exists in bringing Marcellus Shale gas to markets in these regions. In addition, we expect to see the beneficial earnings impact from investments that are already in progress or recently completed, including projects to address the Marcellus Shale infrastructure gap. Acquisition activity in Europe over the last several years makes us an attractive supply partner and creates new business opportunities and our proposed acquisition of Total’s retail LPG distribution business in France will further strengthen our position in Europe. At Gas Utility, we expect to continue to experience strong growth from conversions from oil as a result of sustained low natural gas prices. To the extent normal weather patterns return in our European LPG operations, we hope to reap the benefits from our acquisition activity in this region.
Non-GAAP Financial Measures - Adjusted Net Income Attributable to UGI and Adjusted Earnings Per Diluted Share
UGI management uses “adjusted net income attributable to UGI” and “adjusted diluted earnings per share,” both of which are non-GAAP financial measures, when evaluating UGI’s overall performance. Adjusted net income attributable to UGI is net income attributable to UGI after excluding (1) net after-tax gains and losses on commodity derivative instruments not associated with current-period transactions at Midstream & Marketing; (2) net after-tax gains and losses on commodity derivative instruments not associated with current-period transactions at AmeriGas Propane for commodity derivative instruments entered into beginning April 1, 2014; and (3) those items that management regards as highly unusual in nature and not expected to recur.
Midstream & Marketing accounts for realized and unrealized gains and losses on commodity derivative instruments as a component of cost of sales or revenues on the Consolidated Statements of Income. Effective April 1, 2014, AmeriGas Propane determined that on a prospective basis it would not elect cash flow hedge accounting for its commodity derivative transactions. As a result, all unrealized gains and losses on AmeriGas Propane’s commodity derivative instruments entered into beginning April 1, 2014, are included as a component of cost of sales on the Consolidated Statements of Income. Volatility in net income attributable to UGI can occur as a result of gains and losses on commodity derivative instruments not associated with current period transactions but included in earnings in accordance with generally accepted accounting principles (“GAAP”). These gains and losses result principally from recording unrealized gains and losses on unsettled commodity derivative instruments and, to a much lesser extent, certain realized gains and losses on settled commodity derivative instruments that are associated with transactions forecasted to occur in a future period.
Non-GAAP financial measures are not in accordance with, or an alternative to, GAAP and should be considered in addition to, and not as a substitute for, the comparable GAAP measures. Management believes that these non-GAAP measures provide meaningful information to investors about UGI’s performance because they eliminate the impact of (1) gains and losses on Midstream & Marketing’s and, beginning April 1, 2014, AmeriGas Propane’s commodity derivative instruments that are not associated with current-period transactions and (2) those items that management regards as highly unusual in nature and not expected to recur.
|
(Millions of dollars, except per share amounts)
|
2014
|
2013
|
2012
|
|||||||||
|
Adjusted net income attributable to UGI Corporation:
|
||||||||||||
|
Net income attributable to UGI Corporation
|
$
|
337.2
|
|
$
|
278.1
|
|
$
|
210.2
|
|
|||
|
Net losses (gains) on Midstream & Marketing’s commodity derivative instruments not associated with current period transactions
|
4.9
|
|
(4.3
|
)
|
(8.9
|
)
|
||||||
|
Net losses on AmeriGas Propane commodity derivative instruments entered into beginning April 1, 2014, not associated with current period transactions
|
1.7
|
|
—
|
|
—
|
|
||||||
|
Retroactive impact of change in French tax law
|
5.7
|
|
—
|
|
—
|
|
||||||
|
Adjusted net income attributable to UGI Corporation
|
$
|
349.5
|
|
$
|
273.8
|
|
$
|
201.3
|
|
|||
|
Adjusted diluted earnings per share:
|
||||||||||||
|
UGI Corporation earnings per share - diluted
|
$
|
1.92
|
|
$
|
1.60
|
|
$
|
1.24
|
|
|||
|
Net losses (gains) on Midstream & Marketing’s commodity derivative instruments not associated with current period transactions
|
0.03
|
|
(0.02
|
)
|
(0.06
|
)
|
||||||
|
Net losses on AmeriGas Propane commodity derivative instruments entered into beginning April 1, 2014, not associated with current period transactions
|
0.01
|
|
—
|
|
—
|
|
||||||
|
Retroactive impact of change in French tax law
|
0.03
|
|
—
|
|
—
|
|
||||||
|
Adjusted diluted earnings per share
|
$
|
1.99
|
|
$
|
1.58
|
|
$
|
1.18
|
|
|||
31
Results of Operations
The following analyses compare the Company’s results of operations for (1) Fiscal
2014
with Fiscal
2013
and (2) Fiscal
2013
with the fiscal year ended
September 30, 2012
(“Fiscal
2012
”).
Fiscal
2014
Compared with Fiscal
2013
Consolidated Results
Net Income Attributable to UGI Corporation by Business Unit:
|
|
2014
|
2013
|
Variance - Favorable
(Unfavorable)
|
||||||||||||||||||
|
(Dollars in millions)
|
Amount
|
% of
Total
|
Amount
|
% of
Total
|
Amount
|
% Change
|
|||||||||||||||
|
AmeriGas Propane
|
$
|
63.0
|
|
18.7
|
%
|
$
|
47.5
|
|
17.1
|
%
|
$
|
15.5
|
|
32.6
|
%
|
||||||
|
UGI International (a)
|
48.3
|
|
14.3
|
%
|
82.7
|
|
29.7
|
%
|
(34.4
|
)
|
(41.6
|
)%
|
|||||||||
|
Gas Utility
|
118.8
|
|
35.2
|
%
|
94.3
|
|
33.9
|
%
|
24.5
|
|
26.0
|
%
|
|||||||||
|
Midstream & Marketing
|
117.8
|
|
34.9
|
%
|
52.5
|
|
18.9
|
%
|
65.3
|
|
124.4
|
%
|
|||||||||
|
Corporate & Other (b)
|
(10.7
|
)
|
(3.1
|
)%
|
1.1
|
|
0.4
|
%
|
(11.8
|
)
|
N.M.
|
|
|||||||||
|
Net income attributable to UGI Corporation
|
$
|
337.2
|
|
100.0
|
%
|
$
|
278.1
|
|
100.0
|
%
|
$
|
59.1
|
|
21.3
|
%
|
||||||
|
(a)
|
Fiscal 2014 includes income tax expense of $5.7 million to reflect the retroactive effects of a change in tax laws in France.
|
|
(b)
|
Includes net after-tax gains (losses) on Midstream & Marketing’s unsettled and certain settled commodity derivative instruments not associated with current period transactions, and net after-tax gains (losses) on AmeriGas Propane’s unsettled commodity derivative instruments entered into beginning April 1, 2014, totaling $(6.6) million in Fiscal 2014 and $4.3 million in Fiscal 2013.
|
N.M. — Variance is not meaningful.
Highlights — Fiscal
2014
versus Fiscal
2013
|
•
|
Fiscal 2014 results reflect significantly colder and more volatile winter weather at Midstream & Marketing and significantly colder weather at Gas Utility and in AmeriGas Propane’s service territory east of the Rocky Mountains.
|
|
•
|
Midstream & Marketing’s integrated assets portfolio in the Marcellus Shale in Pennsylvania provided it with the opportunity to take advantage of periods of extreme cold winter weather that resulted in heightened natural gas price volatility due to locational basis differentials and increased the demand for winter peaking services.
|
|
•
|
Our UGI International operations in Europe experienced weather that was much warmer than normal which reduced retail volumes sold.
|
|
•
|
Fiscal 2014 results reflect the retroactive effects of a change in tax laws in France which increased UGI International tax expense and reduced Fiscal 2014 net income by $(5.7) million (equal to $(0.03) per diluted share).
|
|
•
|
Net income in Fiscal 2014 includes after-tax losses of $(6.6) million (equal to $(0.04) per diluted share) on commodity derivative instruments not associated with current-period transactions while net income in Fiscal 2013 includes after-tax gains of $4.3 million (equal to $0.02 per diluted share) on commodity derivative instruments not associated with current-period transactions.
|
32
|
AmeriGas Propane
|
2014
|
2013
|
Increase
|
||||||||||||
|
(Dollars in millions)
|
|
|
|
|
|||||||||||
|
Revenues
|
$
|
3,712.9
|
|
$
|
3,168.8
|
|
$
|
544.1
|
|
17.2
|
%
|
||||
|
Total margin (a)
|
$
|
1,605.8
|
|
$
|
1,511.6
|
|
$
|
94.2
|
|
6.2
|
%
|
||||
|
Operating and administrative expenses
|
$
|
964.1
|
|
$
|
945.1
|
|
$
|
19.0
|
|
2.0
|
%
|
||||
|
Partnership EBITDA (b)
|
$
|
664.8
|
|
$
|
596.5
|
|
$
|
68.3
|
|
11.5
|
%
|
||||
|
Operating income
|
$
|
472.0
|
|
$
|
394.4
|
|
$
|
77.6
|
|
19.7
|
%
|
||||
|
Retail gallons sold (millions)
|
1,275.6
|
|
1,245.2
|
|
30.4
|
|
2.4
|
%
|
|||||||
|
Degree days – % colder (warmer) than normal (c)
|
3.4
|
%
|
(4.9
|
)%
|
—
|
|
—
|
|
|||||||
(a) Total margin represents total revenues less total cost of sales. Total margin in Fiscal 2014 excludes net pre-tax losses of $9.5 million on AmeriGas Propane unsettled commodity derivative instruments entered into beginning April 1, 2014, not associated with current-period transactions.
|
(b)
|
Partnership EBITDA (earnings before interest expense, income taxes and depreciation and amortization) should not be considered as an alternative to net income (as an indicator of operating performance) and is not a measure of performance or financial condition under GAAP. Management uses Partnership EBITDA as the primary measure of segment profitability for the AmeriGas Propane segment (see
Note 21
to Consolidated Financial Statements). Partnership EBITDA for Fiscal 2013 includes transition expenses of $26.5 million associated with the integration of Heritage Propane acquired in January 2012.
|
|
(c)
|
Deviation from average heating degree days for the 30-year period 1971-2000 based upon national weather statistics provided by the National Oceanic and Atmospheric Administration (“NOAA”) for 335 airports in the United States, excluding Alaska.
|
The 2.4% increase in retail gallons sold in Fiscal 2014 reflects average temperatures based upon heating degree days that were 3.4% colder than normal and 8.8% colder than the prior year. The colder average weather reflects significantly colder winter weather in the eastern half of the United States partially offset by warmer weather in the western U.S. The effects of the colder winter weather on retail gallons sold, however, were muted by supply challenges in certain regions of the U.S. that experienced prolonged periods of unusually cold winter weather. In order to ensure that customers in these regions were adequately supplied during these extreme weather conditions, the Partnership instituted supply allocation measures in certain areas, which limited total retail volumes sold and increased distribution costs per gallon.
Retail propane revenues increased $529.7 million during Fiscal 2014 reflecting the effects of higher average retail selling prices ($461.9 million), largely the result of higher propane product costs, and the higher retail volumes sold ($67.8 million). Wholesale propane revenues increased $24.9 million during Fiscal 2014 reflecting the effects of higher wholesale selling prices ($33.8 million) partially offset by the effects of slightly lower wholesale volumes sold ($8.9 million). Average daily wholesale propane commodity prices during Fiscal 2014 at Mont Belvieu, Texas, one of the major supply points in the U.S., were approximately 25% higher than such prices during Fiscal 2013. In addition, certain regions of the U.S. experienced an even greater increase in wholesale commodity prices due to supply constraints caused by industry-wide storage and transportation issues exacerbated by the unusually cold winter weather conditions. Partially offsetting the higher retail and wholesale revenues were slightly lower revenues from fee income and other ancillary sales and services. Total cost of sales during Fiscal 2014 increased $449.9 million principally reflecting the effects of the higher average propane product costs ($429.2 million) and, to a lesser extent, the effects of the greater retail and wholesale volumes sold ($27.1 million) partially offset by lower cost of sales from ancillary sales and services.
Total margin increased $94.2 million in Fiscal 2014 principally reflecting higher retail propane total margin ($97.4 million) partially offset by lower margin from ancillary sales and services. The increase in retail propane total margin reflects modestly higher average retail propane unit margins and, to a lesser extent, the previously mentioned increase in retail volumes sold.
Partnership EBITDA in Fiscal 2014 increased $68.3 million principally reflecting the higher total margin ($94.2 million) partially offset by slightly higher operating and administrative expenses ($19.0 million) and lower other income. Partnership operating and administrative expenses in the prior fiscal year include $26.5 million of transition expenses associated with the integration of Heritage Propane acquired in January 2012 (see Note 4 to Consolidated Financial Statements). Excluding the effects of the Heritage Propane transition expenses in the prior year, Partnership operating and administrative expenses increased $45.5 million. The increase in operating and administrative expenses excluding the effects of the Heritage Propane transition expenses in the prior-year period reflects, among other things, higher distribution-related expenses associated with the higher retail volumes sold and higher distribution costs caused by the supply challenges in certain regions of the U.S. during the second quarter of Fiscal 2014. The increase in operating and administrative costs also reflects higher uncollectible accounts expense ($9.9 million) and higher
33
casualty and general liability expenses ($6.3 million). Operating income increased $77.6 million in Fiscal 2014 principally reflecting the higher Partnership EBITDA ($68.3 million) and slightly lower depreciation expense.
|
UGI International
|
2014
|
2013
|
Increase (Decrease)
|
||||||||||||
|
(Dollars in millions)
|
|
|
|
|
|||||||||||
|
Revenues
|
$
|
2,322.4
|
|
$
|
2,179.2
|
|
$
|
143.2
|
|
6.6
|
%
|
||||
|
Total margin (a)
|
$
|
664.4
|
|
$
|
680.8
|
|
$
|
(16.4
|
)
|
(2.4
|
)%
|
||||
|
Operating and administrative expenses
|
$
|
470.2
|
|
$
|
454.4
|
|
$
|
15.8
|
|
3.5
|
%
|
||||
|
Operating income
|
$
|
117.5
|
|
$
|
147.0
|
|
$
|
(29.5
|
)
|
(20.1
|
)%
|
||||
|
Income before income taxes
|
$
|
87.4
|
|
$
|
116.2
|
|
$
|
(28.8
|
)
|
(24.8
|
)%
|
||||
|
Retail gallons sold (millions) (b)
|
583.2
|
|
592.4
|
|
(9.2
|
)
|
(1.6
|
)%
|
|||||||
|
Antargaz degree days – % (warmer) colder than normal (c)
|
(14.1
|
)%
|
3.7
|
%
|
—
|
|
—
|
|
|||||||
|
Flaga degree days – % (warmer) colder than normal (c)
|
(15.7
|
)%
|
0.9
|
%
|
—
|
|
—
|
|
|||||||
|
(a)
|
Total margin represents total revenues less total cost of sales.
|
|
(b)
|
Excludes retail gallons from operations in China.
|
|
(c)
|
Deviation from average heating degree days for the 30-year period 1981-2010 at locations in our Antargaz and Flaga service territories.
|
Based upon heating degree day data, temperatures during Fiscal 2014 at our UGI International European LPG territories were significantly warmer than normal compared to temperatures in Fiscal 2013 that were slightly colder than normal. Total retail gallons sold were slightly lower reflecting the effects of the significantly warmer Fiscal 2014 weather partially offset by incremental retail gallons associated with BP Poland’s former LPG business in Poland acquired by Flaga in September 2013 (“BP Poland acquisition”). During Fiscal 2014, the average wholesale commodity price for propane in northwest Europe was approximately 9% lower than in the prior-year period while the average wholesale commodity price for butane was approximately 3% lower than the prior-year period.
UGI International base-currency results are translated into U.S. dollars based upon exchange rates experienced during the reporting periods. The functional currency of a significant portion of our UGI International results is the euro. During Fiscal 2014 and Fiscal 2013, the average un-weighted euro-to-dollar translation rate was approximately $1.36 and $1.31, respectively. The difference in euro to U.S. dollar translation rates and, to a lesser extent, the difference in the British pound sterling to the U.S. dollar translation rates, did not have a material impact on net income attributable to UGI.
UGI International revenues increased
$143.2 million
, notwithstanding the effects of the significantly warmer weather on retail volumes sold, principally reflecting greater total revenues at Flaga ($178.3 million) including incremental retail and wholesale revenues resulting from the BP Poland acquisition, and, to a much lesser extent, the currency conversion effects of the slightly stronger euro and British pound sterling. This increase in revenues was partially offset by lower total revenues at Antargaz ($27.1 million) and, to a lesser extent, at AvantiGas principally on lower LPG retail volumes sold partially offset by the currency conversion effects of the slightly stronger euro and British pound sterling. Cost of sales increased $159.6 million as greater cost of sales at Flaga ($172.1 million), primarily reflecting retail and wholesale gallons associated with the BP Poland acquisition and, to a lesser extent, the effects of the slightly stronger euro, were partially offset by lower cost of sales at Antargaz and AvantiGas principally as a result of the lower retail LPG gallons sold partially offset by the currency conversion effects of the slightly stronger euro and British pound sterling.
Total UGI International margin decreased
$16.4 million
during Fiscal 2014 reflecting lower total margin at Antargaz ($30.2 million) principally on the lower retail volumes partially offset by the effects of the slightly stronger euro. This decrease in margin was offset in part by slightly higher total margin at Flaga, due primarily to incremental margin associated with the BP Poland acquisition and the slightly stronger euro, and higher total margin at AvantiGas, principally the result of higher average retail unit margins and the slightly stronger British pound sterling.
UGI International operating income and income before income taxes decreased
$29.5 million
and
$28.8 million
, respectively. The decreases principally reflect the lower total margin ($16.4 million); increased operating, administrative and depreciation expenses at Flaga ($9.2 million) principally incremental expenses resulting from the BP Poland acquisition and to a lesser extent the currency conversion effects of the slightly stronger euro; and the currency conversion effects of the stronger euro and British pound sterling on Antargaz and AvantiGas operating, administrative and depreciation expenses. Fiscal 2014 UGI International operating and
34
administrative costs also include $6.5 million of incremental expenses associated with the proposed acquisition of Total’s retail LPG distribution business in France.
|
Gas Utility
|
2014
|
2013
|
Increase
|
||||||||||||
|
(Dollars in millions)
|
|
|
|
|
|||||||||||
|
Revenues
|
$
|
977.3
|
|
$
|
839.0
|
|
$
|
138.3
|
|
16.5
|
%
|
||||
|
Total margin (a)
|
$
|
480.5
|
|
$
|
431.8
|
|
$
|
48.7
|
|
11.3
|
%
|
||||
|
Operating and administrative expenses
|
$
|
183.8
|
|
$
|
176.2
|
|
$
|
7.6
|
|
4.3
|
%
|
||||
|
Operating income
|
$
|
236.2
|
|
$
|
196.5
|
|
$
|
39.7
|
|
20.2
|
%
|
||||
|
Income before income taxes
|
$
|
199.6
|
|
$
|
159.1
|
|
$
|
40.5
|
|
25.5
|
%
|
||||
|
System throughput – billions of cubic feet (“bcf”) -
|
|||||||||||||||
|
Core market
|
80.4
|
|
70.6
|
|
9.8
|
|
13.9
|
%
|
|||||||
|
Total
|
208.8
|
|
192.1
|
|
16.7
|
|
8.7
|
%
|
|||||||
|
Degree days – % colder (warmer) than normal (b)
|
10.0
|
%
|
(0.5
|
)%
|
—
|
|
—
|
|
|||||||
|
(a)
|
Total margin represents total revenues less total cost of sales.
|
|
(b)
|
Deviation from average heating degree days for the 15-year period 1995-2009 based upon weather statistics provided by NOAA for airports located within Gas Utility’s service territory.
|
Temperatures in Gas Utility’s service territory in Fiscal 2014 based upon heating degree days were 10.0% colder than normal and 10.6% colder than Fiscal 2013. Total distribution system throughput increased 16.7 bcf principally reflecting a 9.8 bcf (13.9%) increase in demand from Gas Utility’s core market customers and, to a lesser extent, greater net large firm and interruptible delivery service volumes. Gas Utility system throughput to core market customers was higher than last year principally reflecting the effects of the significantly colder weather and, to a lesser extent, customer growth due principally to conversions from other fuels prompted by sustained lower natural gas prices relative to heating oil prices. Gas Utility’s core market customers comprise firm- residential, commercial and industrial (“retail core-market”) customers who purchase their gas from Gas Utility and, to a much lesser extent, residential and small commercial customers who purchase their gas from alternate suppliers.
Gas Utility revenues increased $138.3 million during Fiscal 2014 principally reflecting higher revenues from core market customers ($83.6 million), higher revenues from off-system sales ($36.4 million) and, to a much lesser extent, higher revenues from large firm delivery service customers on higher throughput ($12.5 million). The increase in core market revenues principally reflects the effects of the higher core market throughput. Increases or decreases in retail core-market revenues and cost of sales principally result from changes in retail core-market volumes and the level of gas costs collected through the PGC recovery mechanism. Under the PGC recovery mechanism, Gas Utility records the cost of gas associated with sales to retail core-market customers at amounts included in PGC rates. The difference between actual gas costs and the amounts included in rates is deferred on the balance sheet as a regulatory asset or liability and represents amounts to be collected from or refunded to customers in a future period. As a result of this PGC recovery mechanism, increases or decreases in the cost of gas associated with retail core-market customers have no direct effect on retail core-market margin. Gas Utility’s cost of sales was $496.8 million in Fiscal 2014 compared with $407.2 million in Fiscal 2013 principally reflecting the effects of the greater retail core-market volumes sold ($50.1 million) and the effects of the higher off-system sales ($36.4 million).
Fiscal 2014 Gas Utility total margin increased $48.7 million principally reflecting higher core market total margin ($33.8 million) and greater large firm delivery service total margin ($10.8 million). The higher core market and large firm delivery service total margin reflects the effects of the previously mentioned colder weather and customer growth.
Gas Utility operating income and income before income taxes during Fiscal 2014 increased $39.7 million and $40.5 million, respectively, over Fiscal 2013. The increase in Gas Utility operating income principally reflects the $48.7 million increase in total margin partially offset by higher operating and administrative expenses. Operating and administrative expenses in Fiscal 2014 were modestly higher than the prior year principally reflecting greater Fiscal 2014 distribution system maintenance expenses ($5.3 million), higher uncollectible accounts expense ($3.0 million) and greater incentive compensation expense partially offset by lower pension expense. The increase in Gas Utility income before income taxes reflects the greater operating income ($39.7 million) and slightly lower interest expense.
35
|
Midstream & Marketing
|
2014
|
2013
|
Increase
|
||||||||||||
|
(Dollars in millions)
|
|
|
|
|
|||||||||||
|
Revenues (a)
|
$
|
1,368.9
|
|
$
|
1,037.6
|
|
$
|
331.3
|
|
31.9
|
%
|
||||
|
Total margin (b)
|
$
|
292.2
|
|
$
|
164.0
|
|
$
|
128.2
|
|
78.2
|
%
|
||||
|
Operating and administrative expenses
|
$
|
70.6
|
|
$
|
57.0
|
|
$
|
13.6
|
|
23.9
|
%
|
||||
|
Operating income
|
$
|
198.6
|
|
$
|
90.0
|
|
$
|
108.6
|
|
120.7
|
%
|
||||
|
Income before income taxes
|
$
|
195.7
|
|
$
|
86.8
|
|
$
|
108.9
|
|
125.5
|
%
|
||||
|
(a)
|
Amounts are net of intercompany revenues between Midstream & Marketing’s Energy Services and Electric Generation segments.
|
|
(b)
|
Total margin represents total revenues less total cost of sales. Amounts exclude pre-tax (losses) gains from changes in the fair values of Midstream & Marketing’s unsettled commodity derivative instruments and pre-tax (losses) gains on certain settled commodity derivative instruments not associated with current period transactions of $(8.5) million and $7.4 million in Fiscal 2014 and Fiscal 2013, respectively.
|
Fiscal 2014 total revenues were $331.3 million higher than Fiscal 2013 principally reflecting higher natural gas revenues ($255.9 million) and, to a much lesser extent, higher capacity management ($61.6 million), peaking ($25.4 million) and natural gas gathering revenues ($12.9 million). The increase in natural gas revenues principally reflects higher wholesale and retail natural gas volumes sold and higher natural gas prices during Fiscal 2014. The greater capacity management and peaking service revenues principally reflect higher demand for natural gas pipeline capacity at significantly higher prices caused by periods of extreme cold weather in the Northeast and Mid-Atlantic regions primarily during the months of January and February 2014. Midstream & Marketing revenues were also higher due to incremental revenues from the Auburn pipeline extension which was placed in service during the first quarter of Fiscal 2014. Midstream & Marketing cost of sales increased to $1,076.7 million in Fiscal 2014 compared to $873.6 million in Fiscal 2013 principally reflecting the higher natural gas volumes and prices.
Midstream & Marketing total margin increased $128.2 million (78.2%) in Fiscal 2014 principally reflecting higher capacity management and peaking service total margin ($78.8 million), higher retail natural gas total margin ($24.5 million), higher Electric Generation total margin ($13.9 million) and increased natural gas gathering total margin ($12.9 million) primarily reflecting incremental margin from the previously mentioned Auburn pipeline extension. The significant increase in total margin from capacity management and peaking activities reflects the effects of periods of extreme cold winter weather primarily during January and February which resulted in heightened natural gas price volatility due to locational basis differentials and also increased the demand for, and the value of, winter peaking services. The greater total margin from Electric Generation principally reflects the impact of higher unit margins at the Hunlock natural gas-fired electricity generating facility due in large part to lower locally-sourced natural gas feedstock costs, greater electricity production, and higher Electric Generation capacity revenues. These increases in total margin were partially offset by lower total margin from retail power sales.
Midstream & Marketing operating income and income before income taxes during Fiscal 2014 increased $108.6 million and $108.9 million, respectively, over Fiscal 2013 reflecting the previously mentioned significant increase in total margin ($128.2 million) partially offset by higher operating and administrative expenses ($13.6 million) and depreciation expenses ($5.4 million). The higher operating, administrative and depreciation expenses include, among other things, increased operating and depreciation expenses associated with storage and natural gas gathering assets and higher incentive compensation costs. Electric Generation operating expenses in Fiscal 2014 were slightly higher largely a result of the increased production activity at the Hunlock electricity generating facility offset, in part, by lower maintenance costs at the Conemaugh generating facility.
Interest Expense.
Our consolidated interest expense during Fiscal 2014 was $237.7 million, approximately equal to the $240.3 million of interest expense recorded during Fiscal 2013.
Income Taxes.
Our consolidated effective income tax rate for Fiscal 2014 was higher than Fiscal 2013. The higher effective tax rate in Fiscal 2014 reflects, in large part, the effects of new tax legislation in France approved by the French Parliament in December 2013 and, to a lesser extent, a higher proportion of pretax earnings from higher tax rate domestic business units. The new tax legislation in France, among other things, limits Antargaz’ ability to deduct certain interest expense for income tax purposes and increases the corporate surtax rate for a period of two years. Based upon our review of the new tax legislation, provisions of the new tax legislation associated with the deductibility of certain interest expense at Antargaz applies retroactively to Fiscal 2013. During the quarter ended December 31, 2013, the Company recorded additional income taxes of $5.7 million to reflect the retroactive effects of the new French tax legislation associated with the deductibility of certain interest expense.
36
Fiscal 2013 Compared with Fiscal 2012
Consolidated Results
Net Income Attributable to UGI Corporation by Business Unit:
|
|
2013
|
2012
|
Variance - Favorable
(Unfavorable)
|
||||||||||||||||||
|
(Dollars in millions)
|
Amount
|
% of
Total
|
Amount
|
% of
Total
|
Amount
|
% Change
|
|||||||||||||||
|
AmeriGas Propane
|
$
|
47.5
|
|
17.1
|
%
|
$
|
15.4
|
|
7.3
|
%
|
$
|
32.1
|
|
208.4
|
%
|
||||||
|
UGI International (a)
|
82.7
|
|
29.7
|
%
|
65.2
|
|
31.0
|
%
|
17.5
|
|
26.8
|
%
|
|||||||||
|
Gas Utility
|
94.3
|
|
33.9
|
%
|
81.6
|
|
38.8
|
%
|
12.7
|
|
15.6
|
%
|
|||||||||
|
Midstream & Marketing
|
52.5
|
|
18.9
|
%
|
37.7
|
|
17.9
|
%
|
14.8
|
|
39.3
|
%
|
|||||||||
|
Corporate & Other (a)
|
1.1
|
|
0.4
|
%
|
10.3
|
|
5.0
|
%
|
(9.2
|
)
|
N.M.
|
|
|||||||||
|
Net income attributable to UGI Corporation
|
$
|
278.1
|
|
100.0
|
%
|
$
|
210.2
|
|
100.0
|
%
|
$
|
67.9
|
|
32.3
|
%
|
||||||
|
(a)
|
Includes net after-tax gains on Midstream & Marketing’s unsettled and certain settled commodity derivative instruments not associated with current period transactions of $4.3 million and $8.9 million in Fiscal 2013 and Fiscal 2012, respectively.
|
N.M. — Variance is not meaningful.
Highlights — Fiscal 2013 versus Fiscal 2012
|
•
|
Net income increased significantly in Fiscal 2013 due primarily to a return to more normal winter weather patterns and cooler spring temperatures.
|
|
•
|
Fiscal 2013 results include the full-year effects of AmeriGas Partners’ January 2012 acquisition of Heritage Propane and the benefits from the integrations of Heritage Propane and Shell’s LPG distribution businesses in the United Kingdom, Belgium, the Netherlands, Luxembourg, Denmark, Finland, Norway and Sweden acquired in October 2011 (the “Shell Transaction”).
|
|
•
|
Fiscal 2013 results include Heritage Propane transition expenses of $26.5 million (after-tax impact to UGI of $(4.4) million equal to $(0.03) per diluted share). Fiscal 2012 results include combined Heritage Propane and Shell pre-tax acquisition and transition expenses totaling approximately $53 million (after-tax impact to UGI of $(13.3) million equal to $(0.08) per diluted share).
|
|
•
|
Fiscal 2013 LPG unit margins at AmeriGas Propane and UGI International were higher principally reflecting the benefit of lower average LPG commodity costs.
|
|
•
|
Midstream & Marketing’s Energy Services business benefited from the colder weather including higher income from winter peaking and capacity management activities. Additionally, Midstream & Marketing’s Electric Generation business results improved on higher generation volumes and higher average unit margins.
|
|
•
|
Gas Utility continued to experience record numbers of customer conversions to natural gas from alternative fuels.
|
|
•
|
AmeriGas Propane’s Fiscal 2012 results include a $2.2 million after-tax loss ( impact of $0.01 per diluted share) on extinguishments of debt.
|
|
•
|
Net income in Fiscal 2013 includes after-tax gain of $4.3 million (equal to $0.02 per diluted share) on commodity derivative instruments not associated with current-period transactions compared with after-tax gains of $8.9 million (impact of $0.06 per diluted share) on commodity derivative instruments not associated with current-period transactions in Fiscal 2012.
|
37
|
AmeriGas Propane
|
2013
|
2012
|
Increase
|
||||||||||||
|
(Dollars in millions)
|
|
|
|
|
|||||||||||
|
Revenues
|
$
|
3,168.8
|
|
$
|
2,921.5
|
|
$
|
247.3
|
|
8.5
|
%
|
||||
|
Total margin (a)
|
$
|
1,511.6
|
|
$
|
1,199.1
|
|
$
|
312.5
|
|
26.1
|
%
|
||||
|
Operating and administrative expenses
|
$
|
945.1
|
|
$
|
888.4
|
|
$
|
56.7
|
|
6.4
|
%
|
||||
|
Partnership EBITDA (b)
|
$
|
596.5
|
|
$
|
322.1
|
|
$
|
274.4
|
|
85.2
|
%
|
||||
|
Operating income
|
$
|
394.4
|
|
$
|
168.7
|
|
$
|
225.7
|
|
133.8
|
%
|
||||
|
Retail gallons sold (millions)
|
1,245.2
|
|
1,017.5
|
|
227.7
|
|
22.4
|
%
|
|||||||
|
Degree days – % (warmer) than normal (c)
|
(4.9
|
)%
|
(18.6
|
)%
|
—
|
|
—
|
|
|||||||
|
(a)
|
Total margin represents total revenues less total cost of sales.
|
|
(b)
|
Partnership EBITDA should not be considered as an alternative to net income (as an indicator of operating performance) and is not a measure of performance or financial condition under GAAP. Management uses Partnership EBITDA as the primary measure of segment profitability for the AmeriGas Propane segment (see
Note 21
to Consolidated Financial Statements). Partnership EBITDA for Fiscal 2012 includes pre-tax losses of $13.3 million associated with extinguishments of debt. Partnership EBITDA and operating income for Fiscal 2013 and Fiscal 2012 also include acquisition and transition expenses of $26.5 million and $46.2 million, respectively, associated with Heritage Propane.
|
|
(c)
|
Deviation from average heating degree days for the 30-year period 1971-2000 based upon national weather statistics provided by NOAA for 335 airports in the United States, excluding Alaska.
|
Results for Fiscal 2013 reflect the full-year operations of Heritage Propane acquired in January 2012. Based upon heating degree-day data, temperatures in the Partnership's service territories during Fiscal 2013 averaged approximately 4.9% warmer than normal but 16.2% colder than in Fiscal 2012. Retail gallons sold increased 227.7 million gallons (22.4%) principally reflecting the full-year impact of the Heritage Propane operations and the colder Fiscal 2013 weather.
Retail propane revenues increased $241.6 million during Fiscal 2013 reflecting the higher retail volumes sold ($567.6 million) partially offset by a decline in average retail selling prices ($326.0 million) resulting from lower propane product costs. Wholesale propane revenues declined $33.7 million principally reflecting lower average wholesale propane selling prices ($28.6 million) and lower wholesale volumes sold ($5.1 million). Average daily wholesale propane commodity prices during Fiscal 2013 at Mont Belvieu, Texas, one of the major supply points in the U.S., were approximately 19% lower than such prices during Fiscal 2012. Total revenues from fee income and other ancillary sales and services in Fiscal 2013 were $39.4 million higher than in Fiscal 2012 principally reflecting the full-year effects of Heritage Propane. Total propane cost of sales decreased $76.5 million principally reflecting the effects of the previously mentioned lower propane commodity prices on retail propane cost of sales ($376.3 million) and lower wholesale propane cost of sales ($36.8 million) substantially offset by the effects of the greater retail volumes sold ($336.6 million). Cost of sales associated with ancillary sales and services increased $11.3 million principally reflecting the full-year effects of Heritage Propane.
Total margin increased $312.5 million in Fiscal 2013 principally reflecting higher total propane margin ($284.4 million) and greater total margin from fee income and ancillary sales and services ($28.1 million). These increases principally reflect the incremental full-year effects of Heritage Propane, the colder Fiscal 2013 weather and, with respect to total propane margin, slightly higher average unit margins reflecting in large part the lower propane product costs.
Partnership EBITDA in Fiscal 2013 increased $274.4 million principally reflecting the higher total margin ($312.5 million) and the absence of the $13.3 million loss on extinguishments of debt recorded in Fiscal 2012 partially offset by higher Partnership operating and administrative expenses ($56.7 million) primarily attributable to the full-year effects of Heritage Propane operations. Operating and administrative expenses in Fiscal 2013 include $26.5 million of transition expenses associated with the integration of Heritage Propane while operating and administrative expenses in Fiscal 2012 include Heritage Propane acquisition and transition-related expenses of $46.2 million. AmeriGas Propane operating income increased $225.7 million in Fiscal 2013 principally reflecting the higher total margin ($312.5 million) partially offset by the previously mentioned greater operating and administrative expenses ($56.7 million) and increased depreciation and amortization expense ($37.8 million) reflecting in large part the full-year effects of Heritage Propane.
38
|
UGI International
|
2013
|
2012
|
Increase
|
||||||||||||
|
(Dollars in millions)
|
|
|
|
|
|||||||||||
|
Revenues
|
$
|
2,179.2
|
|
$
|
1,946.1
|
|
$
|
233.1
|
|
12.0
|
%
|
||||
|
Total margin (a)
|
$
|
680.8
|
|
$
|
620.3
|
|
$
|
60.5
|
|
9.8
|
%
|
||||
|
Operating and administrative expenses
|
$
|
454.4
|
|
$
|
435.9
|
|
$
|
18.5
|
|
4.2
|
%
|
||||
|
Operating income
|
$
|
147.0
|
|
$
|
111.9
|
|
$
|
35.1
|
|
31.4
|
%
|
||||
|
Income before income taxes
|
$
|
116.2
|
|
$
|
80.7
|
|
$
|
35.5
|
|
44.0
|
%
|
||||
|
Retail gallons sold (millions) (b)
|
592.4
|
|
576.5
|
|
15.9
|
|
2.8
|
%
|
|||||||
|
Antargaz degree days – % colder (warmer) than normal (c)
|
3.7
|
%
|
(7.1
|
)%
|
—
|
|
—
|
|
|||||||
|
Flaga degree days – % colder (warmer) than normal (c)
|
0.9
|
%
|
(6.4
|
)%
|
—
|
|
—
|
|
|||||||
|
(a)
|
Total margin represents total revenues less total cost of sales.
|
|
(b)
|
Excludes retail gallons from operations in China.
|
|
(c)
|
Deviation from average heating degree days for the 30-year period 1981-2010 at locations in our Antargaz and Flaga service territories.
|
Based upon heating degree day data, temperatures in our European LPG territories in Fiscal 2013 were colder than normal and colder than the prior year. Although Fiscal 2013 wholesale commodity prices for propane and butane based upon index prices in northwest Europe averaged only slightly lower than in Fiscal 2012, such LPG prices generally declined during the Fiscal 2013 peak heating season while LPG prices generally increased during the Fiscal 2012 peak heating season. Retail LPG gallons sold in Fiscal 2013 were higher than Fiscal 2012 principally reflecting the effects of significantly colder weather across all of our European operations partially offset by the effects of a decline in economic activity mainly on commercial and industrial customers in certain of our European markets.
Our UGI International base-currency results are translated into U.S. dollars based upon exchange rates experienced during each of the reporting periods. The functional currency of a significant portion of our UGI International results is the euro. During Fiscal 2013 and Fiscal 2012, the average unweighted translation rate was approximately $1.31 and $1.30 per euro, respectively. The difference in rates did not have a material impact on net income attributable to UGI.
UGI International revenues increased $233.1 million principally reflecting the effects on LPG revenues of greater low-margin wholesale sales, the increase in LPG retail volumes sold and, to a lesser extent, greater average retail prices. The increase in revenues also reflects higher revenues from natural gas marketing activities in France. Cost of sales increased to $1,498.4 million in Fiscal 2013 from $1,325.8 million in Fiscal 2012 principally reflecting the effects of the greater wholesale and retail LPG volumes sold. The higher UGI International cost of sales also reflects increased cost of sales associated with natural gas marketing activities in France.
Total UGI International margin increased $60.5 million during Fiscal 2013 principally reflecting higher retail LPG unit margins and volumes at Antargaz and, to a much lesser extent, higher total LPG margin at AvantiGas and Flaga.
UGI International operating income and income before income taxes increased $35.1 million and $35.5 million, respectively, principally reflecting the higher total margin ($60.5 million) partially offset by modestly higher operating and administrative expenses. Operating and administrative expenses in Fiscal 2013 principally reflect higher delivery, selling, and incentive compensation and benefits costs principally at Antargaz. Fiscal 2013 UGI International operating and administrative costs include approximately $4.0 million of acquisition and transition costs associated with Flaga’s September 2013 acquisition of BP’s LPG distribution business in Poland, while Fiscal 2012 UGI International operating and administrative expenses include acquisition and transition costs of approximately $7.0 million associated with the LPG businesses acquired from Shell in October 2011. UGI International net income in Fiscal 2013 as a percentage of UGI International’s earnings before income taxes was lower than the prior year as the Fiscal 2012 UGI International effective income tax rate reflects, in part, the effects of a greater proportion of UGI International tax benefits relative to pre-tax income and the realization of $4.7 million of previously unrecognized foreign tax credits.
39
|
Gas Utility
|
2013
|
2012
|
Increase
|
||||||||||||
|
(Dollars in millions)
|
|
|
|
|
|||||||||||
|
Revenues
|
$
|
839.0
|
|
$
|
785.4
|
|
$
|
53.6
|
|
6.8
|
%
|
||||
|
Total margin (a)
|
$
|
431.8
|
|
$
|
382.9
|
|
$
|
48.9
|
|
12.8
|
%
|
||||
|
Operating and administrative expenses
|
$
|
176.2
|
|
$
|
156.0
|
|
$
|
20.2
|
|
12.9
|
%
|
||||
|
Operating income
|
$
|
196.5
|
|
$
|
174.1
|
|
$
|
22.4
|
|
12.9
|
%
|
||||
|
Income before income taxes
|
$
|
159.1
|
|
$
|
134.0
|
|
$
|
25.1
|
|
18.7
|
%
|
||||
|
System throughput – bcf -
|
|||||||||||||||
|
Core market
|
70.6
|
|
59.2
|
|
11.4
|
|
19.3
|
%
|
|||||||
|
Total
|
192.1
|
|
177.6
|
|
14.5
|
|
8.2
|
%
|
|||||||
|
Degree days – % (warmer) than normal (b)
|
(0.5
|
)%
|
(16.3
|
)%
|
—
|
|
—
|
|
|||||||
|
(a)
|
Total margin represents total revenues less total cost of sales.
|
|
(b)
|
Deviation from average heating degree days for the 15-year period 1995-2009 based upon weather statistics provided by NOAA for airports located within Gas Utility’s service territory.
|
Temperatures in the Gas Utility service territory in Fiscal 2013 based upon heating degree days were 0.5% warmer than normal but 18.2% colder than Fiscal 2012. Total distribution system throughput increased principally reflecting significantly higher throughput to core market customers and, to a lesser extent, greater net volumes associated with lower margin firm and interruptible delivery service customers. Gas Utility system throughput to core market customers was above last year principally reflecting the effects of the significantly colder weather and, to a much lesser extent, customer growth, principally conversions from oil prompted by sustained lower natural gas prices relative to heating oil prices.
Gas Utility revenues increased $53.6 million during Fiscal 2013 principally reflecting higher revenues from core market customers ($52.8 million) and higher large firm delivery service revenues ($9.2 million) partially offset by lower off-system sales revenues ($8.6 million). The increase in core market revenues principally reflects the effects of higher retail core-market volumes on PGC revenues ($60.4 million) and greater core market delivery service revenues partially offset by the effects of lower average PGC rates on retail core-market revenues ($50.6 million).Gas Utility's cost of sales was $407.2 million in Fiscal 2013 compared with $402.5 million in Fiscal 2012 principally reflecting the effects on cost of sales of the greater retail core-market volumes ($60.4 million) substantially offset by the effects of lower average PGC rates ($50.6 million) and the lower off-system sales.
Gas Utility total margin increased $48.9 million in Fiscal 2013 principally reflecting higher core market margin ($38.1 million) and higher large firm delivery service total margin ($9.6 million). The higher core market margin reflects the effects of the greater core market volumes.
The increase in Gas Utility operating income during Fiscal 2013 principally reflects the increase in total margin ($48.9 million) partially offset by higher operating and administrative expenses ($20.2 million) including, among other things, higher pension and benefits expenses ($10.7 million), higher uncollectible accounts expenses ($2.8 million) on higher core market volumes, and greater injuries and damages and distribution system expenses ($4.5 million). The greater income before income taxes in Fiscal 2013 reflects the higher operating income ($22.4 million) and slightly lower interest expense on lower long-term debt outstanding.
40
|
Midstream & Marketing
|
2013
|
2012
|
Increase
|
||||||||||||
|
(Dollars in millions)
|
|
|
|
|
|||||||||||
|
Revenues (a)
|
$
|
1,037.6
|
|
$
|
853.9
|
|
$
|
183.7
|
|
21.5
|
%
|
||||
|
Total margin (b)
|
$
|
164.0
|
|
$
|
130.4
|
|
$
|
33.6
|
|
25.8
|
%
|
||||
|
Operating and administrative expenses
|
$
|
57.0
|
|
$
|
53.9
|
|
$
|
3.1
|
|
5.8
|
%
|
||||
|
Operating income
|
$
|
90.0
|
|
$
|
64.3
|
|
$
|
25.7
|
|
40.0
|
%
|
||||
|
Income before income taxes
|
$
|
86.8
|
|
$
|
59.5
|
|
$
|
27.3
|
|
45.9
|
%
|
||||
|
(a)
|
Amounts are net of intercompany revenues between Midstream & Marketing’s Energy Services and Electric Generation segments.
|
|
(b)
|
Total margin represents total revenues less total cost of sales. Amounts exclude pre-tax gains from changes in the fair values of Midstream & Marketing’s unsettled commodity derivative instruments and pre-tax gains on certain settled commodity derivative instruments not associated with current period transactions of $7.4 million and $15.1 million in Fiscal 2013 and Fiscal 2012, respectively.
|
Midstream & Marketing total revenues increased $183.7 million in Fiscal 2013 principally reflecting, among other things, higher natural gas revenues ($145.1 million) from higher wholesale volumes sold and higher average selling prices for natural gas, and higher Electric Generation total revenues ($30.7 million) principally the result of higher electricity volumes and prices.
Midstream & Marketing Fiscal 2013 total margin was $33.6 million higher than Fiscal 2012 reflecting higher Electric Generation total margin ($15.6 million), higher natural gas marketing total margin ($14.2 million), and greater peaking and capacity management total margin ($13.4 million) due to the colder weather and greater natural gas price volatility. These increases were partially offset by lower retail power total margin principally reflecting lower average unit margins. Total margin from natural gas marketing activities in Fiscal 2013 principally reflects the benefits of higher average unit margins. Natural gas marketing average unit margins in Fiscal 2013 benefited from higher-margin incremental sales resulting from the colder weather while average unit margins in Fiscal 2012 were negatively impacted by significantly warmer than normal weather. The greater total margin from Electric Generation principally reflects the impact of higher electricity production from our Hunlock natural gas-fired electricity generating station and greater volumes sold from the Conemaugh generating station. In Fiscal 2012 the Hunlock generating station was running at less than full capacity due to an accident at one unit and flood damage at another unit sustained late in Fiscal 2011. Unit margins from Electric Generation were higher in Fiscal 2013 reflecting higher electricity spot market prices, the effects of lower per unit fuel costs at the Hunlock generating station, and higher capacity revenues from the Hunlock and Conemaugh generating stations.
Midstream & Marketing operating income in Fiscal 2013 was $25.7 million higher than Fiscal 2012 reflecting the previously mentioned increase in total margin ($33.6 million) partially offset by higher operating, administrative and depreciation expenses.
The higher operating and administrative expenses ($3.1 million) include greater Energy Services operating expenses ($2.6 million) due in large part to expenses associated with peaking LNG liquefaction and storage facilities and incremental expenses associated with our non-operating working interest in natural gas acreage in the Marcellus Shale region in northern Pennsylvania acquired in January 2013. The increase in depreciation expenses ($4.9 million) principally reflects greater depreciation associated with the full-year operation of LNG facilities and the Hunlock generating station. The increase in Midstream & Marketing income before income taxes reflects the greater operating income and lower interest expense.
Interest Expense.
Our consolidated interest expense was $19.9 million higher in Fiscal 2013 primarily reflecting higher AmeriGas Propane interest expense ($25.0 million), principally full-year interest on debt issued to fund the cash portion of the January 12, 2012, acquisition of Heritage Propane, partially offset by slightly lower UGI Utilities interest expense ($2.9 million) on slightly lower long-term debt outstanding and lower Midstream & Marketing interest expense.
Income Taxes.
Income taxes as a percentage of pretax earnings was lower in Fiscal 2013 reflecting, in part, the effects of a higher percentage of income associated with noncontrolling interests not subject to tax, principally AmeriGas Partners, and the realization of previously unrecognized state deferred tax benefits while income taxes in Fiscal 2012 were reduced by $4.7 million as a result of the realization of previously unrecognized foreign tax credits.
41
Financial Condition and Liquidity
We depend on both internal and external sources of liquidity to provide funds for working capital and to fund capital requirements. Our short-term cash requirements not met by cash from operations are generally satisfied with borrowings under credit facilities and, in the case of Midstream & Marketing, also from a receivables purchase facility. Long-term cash requirements not met by cash from operations are generally met through issuance of long-term debt or equity securities. We believe that each of our business units has sufficient liquidity in the forms of cash and cash equivalents on hand; cash expected to be generated from operations; credit facility and receivables purchase facility borrowings; and the ability to obtain long-term financing to meet anticipated contractual and projected cash commitments. Issuances of debt and equity securities in the capital markets and additional credit facilities may not, however, be available to us on acceptable terms.
Our cash and cash equivalents, excluding cash in commodity futures brokerage accounts that is restricted from withdrawal, totaled
$419.5 million
at
September 30, 2014
, compared with
$389.3 million
at September 30,
2013
. Excluding cash and cash equivalents that reside at UGI’s operating subsidiaries, at
September 30, 2014
and
2013
, UGI had
$245.9 million
and
$192.5 million
, respectively, of cash and cash equivalents. Such cash is available to pay dividends on UGI Common Stock and for investment purposes.
The primary sources of UGI’s cash and cash equivalents are the dividends and other cash payments made to UGI or its corporate subsidiaries by its principal business units.
AmeriGas Propane’s ability to pay dividends to UGI is dependent upon distributions it receives from AmeriGas Partners. At
September 30, 2014
, our
27%
effective ownership interest in the Partnership consisted of approximately
23.8 million
Common Units and an aggregate 2% general partner interest. Approximately 45 days after the end of each fiscal quarter, the Partnership distributes all of its Available Cash (as defined in the Fourth Amended and Restated Agreement of Limited Partnership of AmeriGas Partners, as amended (the “Partnership Agreement”)) relating to such fiscal quarter. AmeriGas Propane, as general partner of AmeriGas Partners, is entitled to receive incentive distributions when AmeriGas Partners’ quarterly distribution exceeds $0.605 per limited partner unit (see
Note 15
to the Consolidated Financial Statements). The aggregate amounts of such incentive distributions in Fiscal 2014, Fiscal 2013 and Fiscal 2012 were
$23.9 million
,
$19.3 million
and
$13.0 million
, respectively.
During Fiscal
2014
, Fiscal
2013
and Fiscal
2012
, our principal business units paid cash dividends and made other cash payments to UGI and its subsidiaries as follows:
|
Year Ended September 30,
|
2014
|
2013
|
2012
|
|||||||||
|
(Millions of dollars)
|
|
|
|
|||||||||
|
AmeriGas Propane
|
$
|
92.0
|
|
$
|
96.2
|
|
$
|
78.6
|
|
|||
|
UGI Utilities
|
77.4
|
|
59.0
|
|
70.6
|
|
||||||
|
UGI International
|
11.2
|
|
22.3
|
|
14.9
|
|
||||||
|
Midstream & Marketing
|
—
|
|
—
|
|
55.0
|
|
||||||
|
Total
|
$
|
180.6
|
|
$
|
177.5
|
|
$
|
219.1
|
|
|||
Dividends in Fiscal 2012 from Midstream & Marketing were used to fund a portion of the October 2011 Shell Transaction (see Note 4 to Consolidated Financial Statements).
UGI Common Stock Split
On July 29, 2014, UGI's Board of Directors approved a 3-for-2 common stock split. The additional shares were distributed September 5, 2014, to shareholders of record on August 22, 2014. Basic and diluted earnings per share and dividends declared per share for all periods presented have been retroactively adjusted to reflect the stock split.
Dividends and Distributions
On July 29, 2014, UGI's Board of Directors approved an approximate 10.6% increase in the quarterly dividend rate on UGI Common Stock to $0.2175 per share or $0.87 per share on an annual basis. The new quarterly dividend was effective with the dividend payable on October 1, 2014, to shareholders of record on September 15, 2014. Previously, on April 29, 2014, UGI’s Board of Directors approved an approximate 4.4% increase in the quarterly dividend rate on UGI Common Stock to $0.1967 per share or $0.7867 per share on an annual basis. This quarterly dividend rate was effective with the dividend paid on July 1, 2014, to shareholders of record on June 16, 2014.
42
On April 28, 2014, the General Partner’s Board of Directors approved an increase in the quarterly distribution rate on AmeriGas Partners Common Units to $0.88 per Common Unit, equal to an annual rate of $3.52 per Common Unit. This quarterly distribution rate was effective with the distribution paid on May 19, 2014, to unitholders of record on May 9, 2014.
The Company’s debt outstanding at
September 30, 2014
, totaled
$3,721.6 million
(including current maturities of long-term debt of
$77.2 million
and short-term borrowings of
$210.8 million
) compared to debt outstanding at
September 30, 2013
, of
$3,837.3 million
(including current maturities of long-term debt of
$67.2 million
and short-term borrowings of
$227.9 million
). Total debt outstanding at
September 30, 2014
, consists of (1)
$2,400.7 million
of Partnership debt; (2)
$573.0 million
of UGI International debt; (3)
$728.3 million
of UGI Utilities’ debt; (4)
$7.5 million
of Energy Services debt; and (5)
$12.1 million
of other debt. For a detailed description of the Company’s debt, see below and Notes 5 and 6 to the Consolidated Financial Statements.
AmeriGas Partners.
AmeriGas Partners’ total debt at
September 30, 2014
, includes
$2,250.8 million
of AmeriGas Partners’ Senior Notes,
$40.9 million
of other long-term debt and
$109.0 million
of AmeriGas OLP short-term borrowings.
UGI International.
UGI International’s total debt at
September 30, 2014
, includes $
432.0 million
(
€342.0 million
) outstanding under Antargaz’ Senior Facilities term loan,
$52.0 million
under Flaga’s U.S. dollar-denominated term loan and a combined
$74.6 million
(€59.1 million) outstanding under Flaga’s euro-denominated term loans. Total UGI International debt outstanding at
September 30, 2014
, also includes (1) $
8.0 million
(
€6.3 million
) of Flaga short-term borrowings, and (2) $
6.4 million
(
€5.1 million
) of other long-term debt.
Antargaz
. Antargaz has a variable-rate term loan agreement with a consortium of banks (“Senior Facilities Agreement”). At September 30, 2014, the Senior Facilities Agreement consists of (1) a €342 million variable-rate term loan and (2) a €40 million credit facility. Scheduled maturities under the term loan are €34.2 million due May 2015 and €307.8 million due March 2016. Antargaz has entered into pay-fixed, receive-variable interest rate swaps to fix the underlying euribor rate of interest on the term loan at an average rate of approximately 2.45% through September 2015 and, thereafter, at a rate of approximately 3.71% through the date of the term loan’s final maturity in March 2016. At
September 30, 2014
, the effective interest rate on Antargaz’ term loan was
4.79%
.
Flaga
.
Flaga has a
$52.0 million
U.S. dollar-denominated three-year loan that expires in September 2016. The
$52.0 million
loan bears interest at one- to twelve-month euribor rates (as chosen by Flaga from time to time) plus a margin. Flaga has effectively fixed the euribor component of the interest rate, and has effectively fixed the U.S. dollar value of the interest and principal payments payable under the
$52.0 million
loan, by entering into a cross-currency swap arrangement with a bank. At
September 30, 2014
, the effective interest rate on the
$52.0 million
loan was
1.82%
.
Flaga also has a
€40 million
(
$50.5 million
) euro-based term loan agreement under which
€26.7 million
matures in August 2016 and
€13.3 million
matures in September 2016, and a
€19.1 million
(
$24.1 million
) euro-based variable rate term loan that matures in October 2016. The
€40 million
term loans bear interest at one- to twelve-month euribor rates (as chosen by Flaga from time to time) plus margins, and the
€19.1 million
term loan bears interest at three-month euribor rates plus a margin. Flaga has effectively fixed the euribor components of the interest rates on these term loans through the dates of their expiration by entering into interest rate swap agreements. At
September 30, 2014
, the effective interest rates on the
€40 million
and
€19.1 million
term loans were
4.25%
and
3.40%
, respectively.
UGI Utilities.
UGI Utilities’ total debt at
September 30, 2014
, includes long-term debt comprising $
450.0 million
of Senior Notes, $
192.0 million
of Medium-Term Notes, and
$86.3 million
of short-term borrowings.
In March 2014, UGI Utilities issued in a private placement
$175 million
of
4.98%
Senior Notes due March 2044 (“4.98% Senior Notes”). The 4.98% Senior Notes were issued pursuant to a Note Purchase Agreement dated October 30, 2013, between UGI Utilities and certain note purchasers. The 4.98% Senior Notes are unsecured and rank equally with UGI Utilities’ existing outstanding senior debt. The net proceeds from the sale of the 4.98% Senior Notes were used to repay
$175 million
of borrowings under UGI Utilities’
364
-day Term Loan Credit Agreement.
Short-term Debt
Due to the seasonal nature of the Company’s businesses, cash provided by operating activities is generally strongest during the second and third fiscal quarters when customers pay for natural gas, LPG, electricity and other energy products and services consumed during the peak heating season months. Conversely, cash from operating activities is generally at its lowest levels during the first and fourth fiscal quarters when the Company’s investment in working capital, principally inventories and accounts receivable, is generally greatest. AmeriGas Propane and UGI Utilities primarily use their credit facilities to satisfy their seasonal
43
operating cash flow needs. Energy Services historically has used its Receivables Facility to satisfy its operating cash flow needs. Energy Services also has a $240 million credit facility, which it can use for working capital and general corporate purposes. Flaga principally uses borrowings under its credit agreements to satisfy its operating cash flow needs. During Fiscal 2014, Fiscal 2013 and Fiscal 2012, Antargaz generally funded its operating cash flow needs without using its revolving credit facility and AvantiGas has funded its operating cash flow needs from cash on hand. Borrowings under the credit facilities and under the Energy Services Receivables Facility are classified as short-term debt on the Consolidated Balance Sheets.
AmeriGas Partners.
In June 2014, AmeriGas OLP entered into an Amended and Restated Credit Agreement (“AmeriGas Credit Agreement”) with a group of banks which provides for borrowings up to $525 million (including a sublimit of $125 million for letters of credit). The AmeriGas Credit Agreement amends and restates AmeriGas OLP’s prior credit agreement entered into with a group of banks in June 2011, as amended from time to time. Among other things, the AmeriGas Credit Agreement reduces the applicable margin on base rate and Eurodollar borrowings and reduces the facility fee. The aforementioned margins and facility fees are dependent upon AmeriGas Partners’ ratio of debt to earnings before interest expense, income taxes, depreciation and amortization (as defined) which amount excludes, among other things, unrealized gains and losses on economic hedge transactions. The AmeriGas Credit Agreement expires in June 2019.
UGI International.
Under its Senior Facilities Agreement, Antargaz has a €40 million credit facility that expires in March 2016 (“Antargaz Credit Facility”). Flaga has two principal working capital facilities (the “Flaga Credit Agreements”) comprising (1) a €46 million multi-currency working capital facility that includes an uncommitted €6 million overdraft facility (the “Flaga Multi-Currency Working Capital Facility”) and (2) a euro-denominated working capital facility that provides for borrowings and issuances of guarantees totaling €12 million (the “Euro Facility”). The Company intends to extend both the Flaga Multi-Currency Working Capital Facility and the Euro Facility prior to their expiration in December 2014.
UGI Utilities.
UGI Utilities has a revolving credit agreement (the “UGI Utilities Credit Agreement”) with a group of banks providing for borrowings of up to $300 million (including a $100 million sublimit for letters of credit) that expires in October 2015.
Midstream & Marketing.
Energy Services has an unsecured credit agreement (“Energy Services Credit Agreement”) with a group of lenders providing for borrowings of up to $240 million (including a $50 million sublimit for letters of credit) that expires in June 2016. The Energy Services Credit Agreement can be used for general corporate purposes of Energy Services and its subsidiaries and to fund dividend payments provided that, after giving effect to such dividend payments, Energy Services maintains a specified ratio of Consolidated Total Indebtedness to EBITDA, each as defined in the Energy Services Credit Agreement.
Information about the Company’s principal credit agreements (excluding the Energy Services Receivables Facility which is discussed below) as of
September 30, 2014
and
2013
, is presented in the tables below.
|
(Millions of dollars or euros)
|
Total Capacity
|
Borrowings Outstanding
|
Letters of Credit and Guarantees Outstanding
|
Available Capacity
|
Weighted Average Interest Rate - End of Year
|
||||||
|
September 30, 2014
|
|||||||||||
|
AmeriGas Credit Agreement
|
$525.0
|
$109.0
|
$64.7
|
$351.3
|
2.16
|
%
|
|||||
|
Antargaz Credit Facility
|
€40.0
|
€0.0
|
€0.0
|
€40.0
|
N.A.
|
|
|||||
|
Flaga Credit Agreements
|
€58.0
|
€0.0
|
€32.3
|
€25.7
|
N.A.
|
|
|||||
|
UGI Utilities Credit Agreement
|
$300.0
|
$86.3
|
$2.0
|
$211.7
|
1.03
|
%
|
|||||
|
Energy Services Credit Agreement
|
$240.0
|
$0.0
|
$0.0
|
$240.0
|
N.A.
|
|
|||||
|
September 30, 2013
|
|||||||||||
|
AmeriGas Credit Agreement
|
$525.0
|
$116.9
|
$53.7
|
$354.4
|
2.69
|
%
|
|||||
|
Antargaz Credit Facility
|
€40.0
|
€0.0
|
€0.0
|
€40.0
|
N.A.
|
|
|||||
|
Flaga Credit Agreements
|
€58.0
|
€0.2
|
€28.6
|
€29.2
|
4.21
|
%
|
|||||
|
UGI Utilities Credit Agreement
|
$300.0
|
$17.5
|
$2.0
|
$280.5
|
1.18
|
%
|
|||||
|
Energy Services Credit Agreement
|
$240.0
|
$57.0
|
$0.0
|
$183.0
|
2.91
|
%
|
|||||
44
The average daily and peak short-term borrowings under the Company’s principal credit agreements during
Fiscal 2014
and Fiscal
2013
are as follows:
|
2014
|
2013
|
|||||||
|
(Millions of dollars or euros)
|
Average
|
Peak
|
Average
|
Peak
|
||||
|
AmeriGas Credit Agreement
|
$156.6
|
$320.0
|
$103.8
|
$200.5
|
||||
|
Flaga Credit Agreements
|
€1.1
|
€3.6
|
€4.3
|
€11.9
|
||||
|
UGI Utilities Credit Agreement
|
$29.9
|
$86.3
|
$25.6
|
$79.0
|
||||
|
Energy Services Credit Agreement
|
$41.4
|
$114.0
|
$44.5
|
$85.0
|
||||
Energy Services has a receivables purchase facility (“Receivables Facility”) with an issuer of receivables-backed commercial paper currently scheduled to expire in October 2015. The Receivables Facility, as amended, provides Energy Services with the ability to borrow up to $150 million of eligible receivables during the period November through May, and up to $75 million of eligible receivables during the period June through October . Energy Services uses the Receivables Facility to fund working capital, margin calls under commodity futures contracts, capital expenditures, dividends and for general corporate purposes.
Under the Receivables Facility, Energy Services transfers, on an ongoing basis and without recourse, its trade accounts receivable to its wholly owned, special purpose subsidiary, Energy Services Funding Corporation (“ESFC”), which is consolidated for financial statement purposes. ESFC, in turn, has sold, and subject to certain conditions, may from time to time sell, an undivided interest in some or all of the receivables to a major bank. ESFC was created and has been structured to isolate its assets from creditors of Energy Services and its affiliates, including UGI. Trade receivables sold to the bank remain on the Company’s balance sheet and the Company reflects a liability equal to the amount advanced by the bank. The Company records interest expense on amounts owed to the bank.
At
September 30, 2014
, the outstanding balance of ESFC trade receivables was
$46.4 million
and there was
$7.5 million
that was sold to the bank and reflected as short-term borrowings on the Consolidated Balance Sheets. At
September 30, 2013
, the outstanding balance of ESFC trade receivables was
$55.0 million
of which
$30.0 million
was sold to a commercial paper conduit of the bank. During Fiscal
2014
and Fiscal
2013
, peak sales of receivables were
$70.0 million
and
$46.5 million
, respectively, and average daily amounts sold were
$15.7 million
and
$10.4 million
, respectively.
Cash Flows
Due to the seasonal nature of the Company’s businesses, cash flows from operating activities are generally strongest during the second and third fiscal quarters when customers pay for natural gas, LPG, electricity and other energy products and services consumed during the peak heating season months. Conversely, operating cash flows are generally at their lowest levels during the fourth and first fiscal quarters when the Company’s investment in working capital, principally inventories and accounts receivable, is generally greatest.
Operating Activities:
|
Year Ended September 30,
|
2014
|
2013
|
2012
|
|||||||||
|
(Millions of dollars)
|
|
|
|
|||||||||
|
Net cash provided by operating activities
|
$
|
1,005.4
|
|
$
|
801.5
|
|
$
|
707.7
|
|
|||
Year-to-year variations in cash flow from operations can be significantly affected by changes in operating working capital especially during periods of significant changes in energy commodity prices. Cash flow from operating activities before changes in operating working capital was
$1,011.9 million
in Fiscal
2014
,
$845.6 million
in Fiscal
2013
and
$629.0 million
in Fiscal
2012
. The year-over-year increases in cash flow from operating activities before changes in operating working capital largely reflect the year-over-year increases in the Company’s operating results. Changes in operating working capital (used) provided operating cash flow of
$(6.5) million
in Fiscal
2014
,
$(44.1) million
in Fiscal
2013
and
$78.7 million
in Fiscal
2012
. The lower cash required to fund changes in working capital in Fiscal 2014 compared with Fiscal 2013 reflects, in large part, the greater net cash flow from changes in accounts receivable resulting from the significantly warmer weather at UGI International partially offset by cash used to fund Fiscal 2014 increases in propane inventories at AmeriGas Propane and natural gas inventories at Antargaz. The higher cash from changes in working capital in Fiscal 2012 reflects the timing of the acquisition of Heritage Propane on cash receipts from Heritage Propane customers.
45
Investing Activities:
|
Year Ended September 30,
|
2014
|
2013
|
2012
|
|||||||||
|
(Millions of dollars)
|
|
|
|
|||||||||
|
Net cash used by investing activities
|
$
|
(487.6
|
)
|
$
|
(553.3
|
)
|
$
|
(1,904.5
|
)
|
|||
Investing activity cash flow is principally affected by cash expenditures for property, plant and equipment; cash paid for acquisitions of businesses; changes in restricted cash balances and net cash proceeds from sales of property, plant and equipment. Cash paid for acquisitions in Fiscal 2014 includes the acquisition by Midstream & Marketing of the retail natural gas marketing business of EQT Energy, LLC, and several Partnership acquisitions. Cash paid for acquisitions in Fiscal 2013 largely includes Flaga’s acquisition of BP’s LPG distribution business in Poland; Midstream & Marketing’s acquisition of a non-operating working interest in natural gas acreage in the Marcellus Shale region of Pennsylvania; and several Partnership acquisitions. Cash paid for acquisitions in Fiscal 2012 principally reflects the January 2012 acquisition of Heritage Propane and the October 2011 acquisition of certain of Shell’s European LPG businesses. Cash expenditures for property, plant and equipment totaled
$456.8 million
in Fiscal
2014
,
$486.0 million
in Fiscal
2013
and
$339.4 million
in Fiscal
2012
. Cash from changes in restricted cash in futures brokerage accounts (used) provided cash of $
(8.3) million
in Fiscal
2014
, $
(5.3) million
in Fiscal
2013
and $
14.2 million
in Fiscal
2012
. The amount of restricted cash required in such accounts is generally the result of changes in underlying commodity prices. Other cash from investing activities includes, among other things, cash from the sale of excess properties of the Partnership subsequent to the Heritage Propane acquisition.
Financing Activities:
|
Year Ended September 30,
|
2014
|
2013
|
2012
|
|||||||||
|
(Millions of dollars)
|
|
|
|
|||||||||
|
Net cash (used) provided by financing activities
|
$
|
(475.7
|
)
|
$
|
(186.1
|
)
|
$
|
1,278.5
|
|
|||
Changes in cash flow from financing activities are primarily due to issuances and repayments of long-term debt; short-term borrowings; dividends and distributions on UGI Common Stock and AmeriGas Partners Common Units; and issuances or repurchases of UGI and AmeriGas Partners equity instruments.
The increases in dividends on UGI Common Stock and distributions on AmeriGas Partners’ publicly held Common Units during the three-year period reflects annual increases in quarterly dividend and distribution rates. The increase in distributions on AmeriGas Partners’ publicly held Common Units in Fiscal 2013 compared to Fiscal 2012 also reflects the full-year impact of a greater number of Common Units outstanding subsequent to the acquisition of Heritage Propane. In order to finance the cash portion of the acquisition of Heritage Propane on January 12, 2012, AmeriGas Partners issued $550 million principal amount of 6.75% Notes due 2020 and $1.0 billion principal amount of 7.00% Notes due 2022. During March 2012, AmeriGas Partners sold 7 million Common Units in an underwritten public offering and used a portion of the net proceeds to repay $200 million of outstanding 6.50% Senior Notes due May 2021, to reduce short-term borrowings and for general corporate purposes.
Capital Expenditures
In the following table, we present capital expenditures (which exclude acquisitions but include capital leases) for Fiscal
2014
, Fiscal
2013
and Fiscal
2012
. We also provide amounts we expect to spend in Fiscal
2015
. We expect to finance Fiscal
2015
capital expenditures principally from cash generated by operations, borrowings under credit facilities and cash on hand.
|
Year Ended September 30,
|
2015
|
2014
|
2013
|
2012
|
||||||||||||
|
(Millions of dollars)
|
(estimate)
|
|
|
|
||||||||||||
|
AmeriGas Propane
|
$
|
111.0
|
|
$
|
113.9
|
|
$
|
111.1
|
|
$
|
103.1
|
|
||||
|
UGI International
|
83.8
|
|
73.2
|
|
70.8
|
|
64.2
|
|
||||||||
|
Gas Utility
|
191.9
|
|
156.4
|
|
144.4
|
|
109.0
|
|
||||||||
|
Midstream & Marketing
|
174.0
|
|
83.4
|
|
156.4
|
|
60.4
|
|
||||||||
|
Other
|
15.4
|
|
9.5
|
|
7.5
|
|
6.5
|
|
||||||||
|
Total
|
$
|
576.1
|
|
$
|
436.4
|
|
$
|
490.2
|
|
$
|
343.2
|
|
||||
Midstream & Marketing’s capital expenditures in Fiscal
2014
, Fiscal
2013
and Fiscal
2012
principally reflect capital expenditures related to natural gas storage, electric generation and Marcellus Shale infrastructure projects. AmeriGas Propane’s Fiscal
2013
46
and Fiscal
2012
capital expenditures include $20.4 million and $17.6 million, respectively, related to Heritage Propane integration activities. The higher levels of Gas Utility capital expenditures in Fiscal 2014 and Fiscal 2013 reflect greater main replacement and system improvement capital expenditures and increases in new business capital expenditures.
Contractual Cash Obligations and Commitments
The Company has contractual cash obligations that extend beyond Fiscal
2014
. Such obligations include scheduled repayments of long-term debt, interest on long-term fixed-rate debt, operating lease payments, unconditional purchase obligations for pipeline capacity, pipeline transportation and natural gas storage services and commitments to purchase natural gas, LPG and electricity, capital expenditures and derivative instruments. The following table presents contractual cash obligations with non-affiliates under agreements existing as of
September 30, 2014
:
|
|
Payments Due by Period
|
|||||||||||||||||||
|
(Millions of dollars)
|
Total
|
Fiscal
2015
|
Fiscal
2016 -
2017
|
Fiscal
2018 -
2019
|
Thereafter
|
|||||||||||||||
|
Long-term debt (a)
|
$
|
3,507.7
|
|
$
|
76.7
|
|
$
|
799.9
|
|
$
|
502.6
|
|
$
|
2,128.5
|
|
|||||
|
Interest on long-term-fixed rate debt (b)
|
1,571.9
|
|
215.8
|
|
375.7
|
|
341.0
|
|
639.4
|
|
||||||||||
|
Operating leases
|
309.1
|
|
72.6
|
|
107.0
|
|
65.0
|
|
64.5
|
|
||||||||||
|
AmeriGas Propane supply contracts
|
205.1
|
|
130.8
|
|
74.3
|
|
—
|
|
—
|
|
||||||||||
|
UGI International supply contracts
|
217.5
|
|
144.7
|
|
72.8
|
|
—
|
|
—
|
|
||||||||||
|
Midstream & Marketing supply contracts
|
455.5
|
|
302.1
|
|
149.1
|
|
4.3
|
|
—
|
|
||||||||||
|
UGI Utilities supply, storage and transportation contracts
|
389.4
|
|
156.9
|
|
111.7
|
|
54.4
|
|
66.4
|
|
||||||||||
|
Derivative instruments (c)
|
35.8
|
|
27.7
|
|
7.7
|
|
0.4
|
|
—
|
|
||||||||||
|
Other purchase obligations (d)
|
43.5
|
|
43.5
|
|
—
|
|
—
|
|
—
|
|
||||||||||
|
Total
|
$
|
6,735.5
|
|
$
|
1,170.8
|
|
$
|
1,698.2
|
|
$
|
967.7
|
|
$
|
2,898.8
|
|
|||||
|
(a)
|
Based upon stated maturity dates.
|
|
(b)
|
Based upon stated interest rates adjusted for the effects of interest rate swaps.
|
|
(c)
|
Represents the sum of amounts due from us if derivative instrument liabilities were settled at
September 30, 2014
, amounts reflected in the Consolidated Balance Sheet (but excluding amounts associated with interest rate swaps).
|
|
(d)
|
Includes material capital expenditure obligations.
|
Other noncurrent liabilities included in our Consolidated Balance Sheet at
September 30, 2014
, principally comprise refundable tank and cylinder deposits (as further described in
Note 2
to Consolidated Financial Statements under the caption “Refundable Tank and Cylinder Deposits”); litigation, property and casualty liabilities and obligations under environmental remediation agreements (see
Note 16
to Consolidated Financial Statements); pension and other postretirement benefit liabilities recorded in accordance with accounting guidance relating to employee retirement plans (see
Note 8
to Consolidated Financial Statements); and liabilities associated with executive compensation plans (see
Note 14
to Consolidated Financial Statements). These liabilities are not included in the table of Contractual Cash Obligations and Commitments because they are estimates of future payments and not contractually fixed as to timing or amount. Required minimum contributions to UGI Utilities’ pension plan (as further described below under “U.S. Pension Plan”) in Fiscal 2015 are not expected to be material. Required minimum contributions to the U.S. Pension Plan in years beyond Fiscal 2015 will depend in large part on the impact of future returns and interest rates on pension plan assets. Certain of our operating lease arrangements, primarily vehicle leases with remaining lease terms of one to ten years, have residual value guarantees. Although such fair values at the end of the leases have historically exceeded the guaranteed amount, at
September 30, 2014
, the maximum potential amount of future payments under lease guarantees assuming the leased equipment was deemed worthless was approximately $23.9 million.
Pending Acquisition of Total LPG Distribution Business in France
On November 11, 2014, UGI Corporation’s indirect wholly owned subsidiary, UGI Bordeaux Holding, entered into a Share Purchase Agreement with Total Marketing Services, a subsidiary of Total, to acquire all of the outstanding shares of Totalgaz, Total’s LPG distribution business in France, for a purchase price between €400 - €450 million in cash subject to working capital and other adjustments. Totalgaz distributed over 265 million retail gallons of LPG in 2013, serving residential, commercial,
47
industrial and autogas customers. The transaction is subject to customary closing conditions, including regulatory approvals, and is expected to close during the first half of calendar year 2015. UGI expects to fund the purchase of Totalgaz with a combination of long-term debt and cash on the balance sheet.
On October 17, 2014, UGI Corporation’s indirect wholly owned subsidiary, UGI International Enterprises, Inc. (“International Enterprises”), entered into a €300 million Senior Secured Bridge Facility Agreement with a consortium of lenders (“Bridge Facility”) to provide an additional source of financing, if necessary, to fund a portion of the pending acquisition of Totalgaz. The availability of the Bridge Facility, which has not yet been drawn, is subject to compliance with certain terms and conditions as set forth in the Bridge Facility, including, among others, the substantially concurrent consummation of the Totalgaz acquisition. Any loans under the Bridge Facility will mature on the date that is one year following the closing date of the acquisition of Totalgaz or if not paid in full will be converted into a term loan maturing on the seventh anniversary of such closing date. The Bridge Facility will be secured on a first-priority basis by certain assets of International Enterprises’ subsidiaries and, if drawn, will be guaranteed on a senior unsecured basis by UGI Corporation.
U.S. Pension Plan
In the U.S., we sponsor a defined benefit pension plan for employees hired prior to January 1, 2009, of UGI, UGI Utilities, PNG, CPG and certain of UGI’s other domestic wholly owned subsidiaries (“U.S. Pension Plan”). The fair values of the U.S. Pension Plan’s assets totaled
$442.4 million
and
$398.2 million
at
September 30, 2014
and
2013
, respectively. At
September 30, 2014
and
2013
, the underfunded positions of the U.S. Pension Plan, defined as the excess of the projected benefit obligation (“PBO”) over the U.S. Pension Plan’s assets, were $97.3 million and $88.3 million, respectively.
We believe we are in compliance with regulations governing defined benefit pension plans, including Employee Retirement Income Security Act of 1974 (“ERISA”) rules and regulations. Required minimum contributions to the U.S. Pension Plan in Fiscal 2015 are not expected to be material. Pre-tax pension cost associated with the U.S. Pension Plan in Fiscal
2014
was $10.9 million. Pre-tax pension cost associated with the U.S. Pension Plan in Fiscal
2015
is expected to be approximately $11.0 million.
GAAP guidance associated with pension and other postretirement plans generally requires recognition of an asset or liability in the statement of financial position reflecting the funded status of pension and other postretirement benefit plans with current year changes recognized in shareholders’ equity unless such amounts are subject to regulatory recovery. At
September 30, 2014
, we have recorded after-tax charges to UGI Corporation’s stockholders’ equity of $20.6 million and recorded regulatory assets totaling $110.1 million in order to reflect the funded status of our pension and other postretirement benefit plans. For a more detailed discussion of the U.S. Pension Plan and our other postretirement benefit plans, see
Note 8
to Consolidated Financial Statements.
Related Party Transactions
During Fiscal
2014
, Fiscal
2013
and Fiscal
2012
, we did not enter into any related-party transactions that had a material effect on our financial condition, results of operations or cash flows.
Off-Balance-Sheet Arrangements
UGI primarily enters into guarantee arrangements on behalf of its consolidated subsidiaries. These arrangements are not subject to the recognition and measurement guidance relating to guarantees under GAAP.
We do not have any off-balance-sheet arrangements that are expected to have a material effect on our financial condition, change in financial condition, revenues or expenses, results of operations, liquidity, capital expenditures or capital resources.
Utility Matters
On February 20, 2014, the PUC entered an order approving a Growth Extension Tariff (“GET Gas”) program under which UGI Gas, PNG and CPG may invest up to $5 million per year for five years to extend natural gas utility pipelines to provide service to unserved and underserved areas within their respective territories. Under the GET Gas program, customers utilizing the extended pipeline to receive natural gas will pay a monthly surcharge over a 10-year period to cover the cost of the extension. UGI Gas, PNG, and CPG began connecting customers under the GET Gas program in October 2014.
On February 1, 2012, CPG filed an application with the PUC for review and approval of the transfer of an 11-mile natural gas pipeline, related facilities and rights of way located in Delmar Township, Pennsylvania (“TL-96 line”) to Energy Services. The PUC approved the transfer and, in April 2013, the TL-96 line was dividended to UGI and subsequently contributed to Energy Services. The net book value of the TL-96 line was approximately $2.6 million.
48
Manufactured Gas Plants
CPG is party to a Consent Order and Agreement (“CPG-COA”) with the DEP requiring CPG to perform a specified level of activities associated with environmental investigation and remediation work at certain properties in Pennsylvania on which manufactured gas plant (“MGP”) related facilities were operated (“CPG MGP Properties”) and to plug a minimum number of non-producing natural gas wells per year. In addition, PNG is a party to a Multi-Site Remediation Consent Order and Agreement (“PNG-COA”) with the DEP. The PNG-COA requires PNG to perform annually a specified level of activities associated with environmental investigation and remediation work at certain properties on which MGP-related facilities were operated (“PNG MGP Properties”). Under these agreements, environmental expenditures relating to the CPG MGP Properties and the PNG MGP Properties are capped at
$1.8
million and
$1.1
million, respectively, in any calendar year. The CPG-COA is scheduled to terminate at the end of 2018. The PNG-COA terminates in 2019 but may be terminated by either party effective at the end of any
two
-year period beginning with the original effective date in March 2004. At
September 30, 2014
and
2013
, our accrued liabilities for environmental investigation and remediation costs related to the CPG-COA and the PNG-COA totaled
$10.7 million
and
$14.0 million
, respectively. In accordance with GAAP related to rate-regulated entities, we have recorded associated regulatory assets in equal amounts.
From the late 1800s through the mid-1900s, UGI Utilities and its former subsidiaries owned and operated a number of MGPs prior to the general availability of natural gas. Some constituents of coal tars and other residues of the manufactured gas process are today considered hazardous substances under the Superfund Law and may be present on the sites of former MGPs. Between 1882 and 1953, UGI Utilities owned the stock of subsidiary gas companies in Pennsylvania and elsewhere and also operated the businesses of some gas companies under agreement. Pursuant to the requirements of the Public Utility Holding Company Act of 1935, by the early 1950s UGI Utilities divested all of its utility operations other than certain Pennsylvania operations, including those which now constitute UGI Gas and Electric Utility.
UGI Utilities does not expect its costs for investigation and remediation of hazardous substances at Pennsylvania MGP sites to be material to its results of operations because (1) UGI Gas is currently permitted to include in rates, through future base rate proceedings, a
five
-year average of such prudently incurred remediation costs and (2) CPG and PNG are currently receiving regulatory recovery of estimated environmental investigation and remediation costs associated with Pennsylvania sites. At
September 30, 2014
, neither the undiscounted nor the accrued liability for environmental investigation and cleanup costs for UGI Gas was material.
From time to time, UGI Utilities is notified of sites outside Pennsylvania on which private parties allege MGPs were formerly owned or operated by UGI Utilities or owned or operated by its former subsidiaries. Such parties generally investigate the extent of environmental contamination or perform environmental remediation. Management believes that under applicable law UGI Utilities should not be liable in those instances in which a former subsidiary owned or operated an MGP. There could be, however, significant future costs of an uncertain amount associated with environmental damage caused by MGPs outside Pennsylvania that UGI Utilities directly operated, or that were owned or operated by former subsidiaries of UGI Utilities if a court were to conclude that (1) the subsidiary’s separate corporate form should be disregarded or (2) UGI Utilities should be considered to have been an operator because of its conduct with respect to its subsidiary’s MGP.
Market Risk Disclosures
Our primary market risk exposures are (1) commodity price risk; (2) interest rate risk; and (3) foreign currency exchange rate risk. Although we use derivative financial and commodity instruments to reduce market price risk associated with forecasted transactions, we do not use derivative financial and commodity instruments for speculative or trading purposes.
Commodity Price Risk
The risk associated with fluctuations in the prices the Partnership and our UGI International operations pay for LPG is principally a result of market forces reflecting changes in supply and demand for propane and other energy commodities. Their profitability is sensitive to changes in LPG supply costs. Increases in supply costs are generally passed on to customers. The Partnership and UGI International may not, however, always be able to pass through product cost increases fully or on a timely basis, particularly when product costs rise rapidly. In order to reduce the volatility of LPG market price risk, the Partnership uses contracts for the forward purchase or sale of propane, propane fixed-price supply agreements and over-the-counter derivative commodity instruments including price swap and option contracts. Our UGI International operations use over-the-counter derivative commodity instruments and may from time to time enter into other derivative contracts, similar to those used by the Partnership, to reduce market risk associated with a portion of their LPG purchases. Over-the-counter derivative commodity instruments used to hedge forecasted purchases of propane are generally settled at expiration of the contract. In addition, Antargaz hedges a portion
49
of its future U.S. dollar-denominated LPG product purchases through the use of forward foreign exchange contracts as further described below.
Gas Utility's tariffs contain clauses that permit recovery of all of the prudently incurred costs of natural gas it sells to its customers, including the cost of financial instruments used to hedge purchased gas costs. The recovery clauses provide for periodic adjustments for the difference between the total amounts actually collected from customers through PGC rates and the recoverable costs incurred. Because of this ratemaking mechanism, there is limited commodity price risk associated with our Gas Utility operations. Gas Utility uses derivative financial instruments, including natural gas futures and option contracts traded on the New York Mercantile Exchange (“NYMEX”) to reduce volatility in the cost of gas it purchases for its retail core-market customers. The cost of these derivative financial instruments, net of any associated gains or losses, is included in Gas Utility's PGC recovery mechanism.
Electric Utility's default service (“DS”) tariffs contain clauses which permit recovery of all prudently incurred power costs, including the cost of financial instruments used to hedge electricity costs, through the application of DS rates. Because of this ratemaking mechanism, there is limited power cost risk, including the cost of financial transmission rights (“FTRs”) and forward electricity purchase contracts, associated with our Electric Utility operations.
In addition, Gas Utility and Electric Utility from time to time enter into exchange-traded gasoline futures and swap contracts for a portion of gasoline volumes expected to be used in their operations. These gasoline futures and swap contracts are recorded at fair value with changes in fair value reflected in other income.
In order to manage market price risk relating to substantially all of Midstream & Marketing’s fixed-price sales contracts for natural gas and electricity, Midstream & Marketing enters into NYMEX, Intercontinental Exchange and over-the-counter natural gas and electricity futures and natural gas basis swap contracts or enters into fixed-price supply arrangements. Midstream & Marketing also uses NYMEX and over-the-counter electricity futures contracts to economically hedge a portion of its anticipated sales of electricity from its electricity generation facilities. Although Midstream & Marketing’s fixed-price supply arrangements mitigate most risks associated with its fixed-price sales contracts, should any of the suppliers under these arrangements fail to perform, increases, if any, in the cost of replacement natural gas or electricity would adversely impact Midstream & Marketing’s results. In order to reduce this risk of supplier nonperformance, Midstream & Marketing has diversified its purchases across a number of suppliers.
Midstream & Marketing purchases FTRs to economically hedge certain transmission costs that may be associated with its fixed-price electricity sales contracts. Midstream & Marketing from time to time also enters into New York Independent System Operator (“NYISO”) capacity swap contracts to economically hedge the locational basis differences for customers it serves on the NYISO electricity grid. Midstream & Marketing also uses NYMEX futures contracts to economically hedge the gross margin associated with the purchase and anticipated later sale of natural gas or propane.
Midstream & Marketing has entered into fixed-price sales agreements for a portion of the electricity expected to be generated by its electric generation assets. In the event that these generation assets would not be able to produce all of the electricity needed to supply electricity under these agreements, Midstream & Marketing would be required to purchase electricity on the spot market or under contract with other electricity suppliers. Accordingly, increases in the cost of replacement power could negatively impact Midstream & Marketing’s results.
Interest Rate Risk
We have both fixed-rate and variable-rate debt. Changes in interest rates impact the cash flows of variable-rate debt but generally do not impact their fair value. Conversely, changes in interest rates impact the fair value of fixed-rate debt but do not impact their cash flows.
Our variable-rate debt includes short-term borrowings and Antargaz’ and Flaga’s variable-rate term loans. These debt agreements have interest rates that are generally indexed to short-term market interest rates. Antargaz and Flaga have effectively fixed the underlying euribor interest rates on their euro-denominated term loans through their scheduled maturity dates through the use of interest rate swaps. In addition, Flaga’s $52 million U.S. dollar-denominated loan has been swapped from fixed-rate U.S. dollars to fixed-rate euro currency at issuance through cross currency swaps, removing interest rate risk and foreign currency exchange risk associated with the underlying interest and principal payments. At September 30, 2014, combined borrowings outstanding under variable-rate debt agreements, excluding Antargaz’ and Flaga’s effectively fixed-rate term loans and Flaga’s U.S. dollar-denominated loan, totaled $210.8 million. Based upon average borrowings outstanding under variable-rate borrowings (excluding Antargaz’ and Flaga’s effectively fixed-rate term loan debt and Flaga’s U.S. dollar-denominated loan), an increase in short-term interest rates of 100 basis points (1%) would have increased our Fiscal 2014 and Fiscal 2013 interest expense by approximately $2.3 million and $1.8 million, respectively. The remainder of our debt outstanding is subject to fixed rates of interest. A 100 basis point increase in market interest rates would result in decreases in the fair value of this fixed-rate debt of approximately $143
50
million and $170 million at September 30, 2014 and 2013, respectively. A 100 basis point decrease in market interest rates would result in increases in the fair value of this fixed-rate debt of approximately $120 million and $102 million at September 30, 2014 and 2013, respectively.
Long-term debt associated with our domestic businesses is typically issued at fixed rates of interest based upon market rates for debt having similar terms and credit ratings. As these long-term debt issues mature, we may refinance such debt with new debt having interest rates reflecting then-current market conditions. In order to reduce interest rate risk associated with near- to medium-term forecasted issuances of fixed-rate debt, from time to time we enter into interest rate protection agreements (“IRPAs”). There were no unsettled IRPAs at September 30, 2014.
Foreign Currency Exchange Rate Risk
Our primary currency exchange rate risk is associated with the U.S. dollar versus the euro. The U.S. dollar value of our foreign currency denominated assets and liabilities will fluctuate with changes in the associated foreign currency exchange rates. From time to time, we use derivative instruments to hedge portions of our net investments in foreign subsidiaries (“net investment hedges”). Gains or losses on net investment hedges remain in accumulated other comprehensive income until such foreign operations are liquidated. At September 30, 2014, there were no unsettled net investment hedges outstanding. With respect to our net investments in our International Propane operations, a 10% decline in the value of the associated foreign currencies versus the U.S. dollar, excluding the effects of any net investment hedges, would reduce their aggregate net book value at September 30, 2014, by approximately $96 million, which amount would be reflected in other comprehensive income.
In addition, in order to reduce volatility, Antargaz hedges a portion of its anticipated U.S. dollar-denominated LPG product purchases during the months of October through March through the use of forward foreign exchange contracts. The amount of dollar-denominated purchases of LPG associated with such contracts generally represents approximately 15% - 30% of estimated dollar-denominated purchases to occur during the heating-season months of October to March.
Derivative Instrument Credit Risk
We are exposed to risk of loss in the event of nonperformance by our derivative financial instrument counterparties. Our derivative financial instrument counterparties principally comprise large energy companies and major U.S. and international financial institutions. We maintain credit policies with regard to our counterparties that we believe reduce overall credit risk. These policies include evaluating and monitoring our counterparties' financial condition, including their credit ratings, and entering into agreements with counterparties that govern credit limits.
Certain of our derivative instrument agreements call for the posting of collateral by the counterparty or by the Company in the forms of letters of credit, parental guarantees or cash. Additionally, our natural gas and electricity exchange-traded futures contracts generally require cash deposits in margin accounts. Changes in natural gas, LPG and electricity product costs can require our business units to post collateral with counterparties or make margin deposits to brokerage accounts. At September 30, 2014 and 2013, restricted cash in brokerage accounts totaled $16.6 million and $7.0 million, respectively.
The following table summarizes the fair values of unsettled market risk sensitive derivative instruments assets (liabilities) held at September 30, 2014 and 2013. The table also includes the changes in fair values of derivative instruments that would result if there were (1) a 10% adverse change in the market prices of LPG, gasoline, natural gas, electricity and electricity transmission congestion charges; (2) a 50 basis point adverse change in the three-month and one-month Euribor rates; and (3) a 10% change in the value of the euro versus the U.S. dollar. Gas Utility’s and Electric Utility’s derivative instruments other than gasoline futures and swap contracts are excluded from the table below because any associated net gains or losses are refundable to or recoverable from customers in accordance with Gas Utility and Electric Utility ratemaking.
51
|
|
Asset (Liability)
|
|||||||
|
(Millions of dollars)
|
Fair Value
|
Change in
Fair Value
|
||||||
|
September 30, 2014:
|
|
|
||||||
|
Commodity price risk
|
$
|
(23.2
|
)
|
$
|
(64.7
|
)
|
||
|
Interest rate risk
|
$
|
(20.9
|
)
|
$
|
(3.7
|
)
|
||
|
Foreign currency exchange rate risk
|
$
|
14.8
|
|
$
|
(26.4
|
)
|
||
|
September 30, 2013:
|
|
|
||||||
|
Commodity price risk
|
$
|
14.0
|
|
$
|
(48.3
|
)
|
||
|
Interest rate risk
|
$
|
(31.0
|
)
|
$
|
(7.4
|
)
|
||
|
Foreign currency exchange rate risk
|
$
|
(7.5
|
)
|
$
|
(26.2
|
)
|
||
Critical Accounting Policies and Estimates
Accounting policies and estimates discussed in this section are those that we consider to be the most critical to an understanding of our financial statements because they involve significant judgments and uncertainties. Changes in these policies and estimates could have a material effect on the financial statements. The application of these accounting policies and estimates necessarily requires management’s most subjective or complex judgments regarding estimates and projected outcomes of future events which could have a material impact on the financial statements. Management has reviewed these critical accounting policies, and the estimates and assumptions associated with them, with the Company’s Audit Committee. In addition, management has reviewed the following disclosures regarding the application of these critical accounting policies and estimates with the Audit Committee. Also, see
Note 2
to Consolidated Financial Statements which discusses the significant accounting policies that we have selected from acceptable alternatives.
Litigation Accruals and Environmental Remediation Liabilities.
We are involved in litigation regarding pending claims and legal actions that arise in the normal course of business. In addition, UGI Utilities and its former subsidiaries owned and operated a number of MGPs in Pennsylvania and elsewhere, and PNG and CPG owned and operated a number of MGP sites located in Pennsylvania, at which hazardous substances may be present. In accordance with GAAP, when a loss is considered probable and reasonably estimable, we record a liability in the amount of our best estimate for the ultimate loss. When there is a range of possible loss with equal likelihood, liabilities recorded are based upon the low end of such range. The likelihood of a loss with respect to a particular contingency is often difficult to predict and determining a reasonable estimate of the loss or a range of possible loss may not be practicable based upon the information available and the potential effects of future events and decisions by third parties that will determine the ultimate resolution of the contingency. Reasonable estimates involve management judgments based on a broad range of information and prior experience. These judgments are reviewed quarterly as more information is received, and the amounts reserved are updated as necessary. Such estimated reserves may differ materially from the actual liability and such reserves may change materially as more information becomes available and estimated reserves are adjusted.
Accounting For Derivative Instruments At Fair Value.
The Company enters into derivative instruments to economically hedge the risks associated with changes in commodity prices, interest rates and foreign currency rates. Accounting requirements for derivatives and related hedging activities are complex and may be subject to further clarification by standard-setting bodies. These derivatives are recognized as assets and liabilities at fair value on the Consolidated Balance Sheets. Derivative assets and liabilities are presented net by counterparty on our Consolidated Balance Sheets if the right of offset exists. The accounting for changes in fair value depends upon the purpose of the derivative instrument and whether it is designated and qualifies for hedge accounting. Changes in the fair values of certain derivative instruments that qualify and are designated as cash flow hedges are recorded in accumulated other comprehensive income (“AOCI”) or noncontrolling interests, both of which are components of equity, to the extent effective at offsetting changes in the hedged item, until earnings are affected by the hedged item. Changes in the fair values of derivative instruments that we do not designate as, or that do not qualify for, hedge accounting under GAAP, which currently comprise substantially all of Midstream & Marketing’s commodity derivative instruments and, beginning April 1, 2014, AmeriGas Propane’s commodity derivative instruments, are recognized in earnings on the Consolidated Statements of Income. The fair values of our derivative instruments are determined based upon actively-quoted market prices for identical assets and liabilities, indicative price quotations available through brokers, industry price publications or recent market transactions and related market indicators. We maximize the use of observable inputs and minimize the use of unobservable inputs when measuring fair value. Gains and losses associated with derivatives utilized by UGI Utilities to manage the price risk inherent in its natural gas and electricity purchasing activities are recoverable through PGC or Electric Utility DS mechanisms, subject to PUC approval. Accordingly, the offset to the change in fair value of these derivatives is recorded as either a regulatory asset or liability on the Consolidated Balance
52
Sheets. At
September 30, 2014
, the net fair value of our derivative assets totaled
$27.0 million
and the net fair value of our derivative liabilities totaled
$56.8 million
.
Regulatory Assets and Liabilities.
Gas Utility and Electric Utility are subject to regulation by the PUC. In accordance with accounting guidance associated with rate-regulated entities, we record the effects of rate regulation in our financial statements as regulatory assets or regulatory liabilities. We continually assess whether the regulatory assets are probable of future recovery by evaluating the regulatory environment, recent rate orders and public statements issued by the PUC, and the status of any pending deregulation legislation. If future recovery of regulatory assets ceases to be probable, the elimination of those regulatory assets would adversely impact our results of operations and cash flows. As of
September 30, 2014
, our regulatory assets totaled
$268.2 million
. See Notes
2
and
9
to Consolidated Financial Statements.
Depreciation and Amortization of Long-Lived Assets.
We compute depreciation on utility property, plant and equipment on a straight-line basis over the average remaining lives of its various classes of depreciable property and on our non-utility property, plant and equipment on a straight-line basis over estimated useful lives generally ranging from 3 to 40 years. We also use amortization methods and determine asset values of intangible assets subject to amortization using reasonable assumptions and projections. Changes in the estimated useful lives of property, plant and equipment and changes in intangible asset amortization methods or values could have a material effect on our results of operations. As of
September 30, 2014
, our net property, plant and equipment totaled
$4,543.7 million
and we recorded depreciation expense of
$305.7 million
during Fiscal
2014
. As of
September 30, 2014
, our net intangible assets subject to amortization totaled $
448.2 million
and we recorded amortization expense on intangible assets subject to amortization of
$48.2 million
during Fiscal
2014
.
Purchase Price Allocations.
From time to time, the Company enters into material business combinations. In accordance with accounting guidance associated with business combinations, the purchase price is allocated to the various assets acquired and liabilities assumed at their estimated fair value. Fair values of assets acquired and liabilities assumed are based upon available information and we may involve an independent third party to perform appraisals. Estimating fair values can be complex and subject to significant business judgment and most commonly impacts property, plant and equipment and intangible assets, including those with indefinite lives. Generally, we have, if necessary, up to one year from the acquisition date to finalize the purchase price allocation.
Impairment of Goodwill.
We perform impairment tests on goodwill resulting from purchase business combinations at least annually at the reporting unit level. A reporting unit is the operating segment, or a business one level below the operating segment (a component), if discrete financial information is prepared and regularly reviewed by segment management. Components are aggregated if they have similar economic characteristics. In accordance with GAAP, each of our reporting units with goodwill is required to perform impairment tests annually or whenever events or circumstances indicate that the value of goodwill may be impaired. For certain of our reporting units, we assess qualitative factors to determine whether it is more likely than not that the fair value of such reporting unit is less than its carrying amount. For our other reporting units with goodwill, we determine fair values generally based on a weighting of income and market approaches. For purposes of the income approach, fair values are determined based upon the present value of the reporting unit’s estimated future cash flows, including an estimate of the reporting unit’s terminal value based upon these cash flows, discounted at appropriate risk-adjusted rates. We use our internal forecasts to estimate future cash flows which may include estimates of long-term future growth rates based upon our most recent reviews of the long-term outlook for each reporting unit. Cash flow estimates used to establish fair values under our income approach involve management judgments based on a broad range of information and historical results. In addition, external economic and competitive conditions can influence future performance. For purposes of the market approach, we use valuation multiples for companies comparable to our reporting units. The market approach requires judgment to determine the appropriate valuation multiples. We are required to recognize an impairment charge under GAAP if the carrying amount of a reporting unit exceeds its fair value and the carrying amount of the reporting unit’s goodwill exceeds the implied fair value of that goodwill. As of
September 30, 2014
, our goodwill totaled
$2,833.4 million
. We did not record any impairments of goodwill in Fiscal
2014
, Fiscal
2013
or Fiscal
2012
.
Pension Plan Assumptions.
Pension plan assumptions are significant inputs to the actuarial models that measure pension benefit obligations and pension expense. The cost of providing benefits under the U.S. Pension Plan is dependent on historical information such as employee age, length of service, level of compensation and the actual rate of return on plan assets. In addition, certain assumptions relating to the future are used to determine pension expense including the discount rate applied to benefit obligations, the expected rate of return on plan assets and the rate of compensation increase, among others. Assets of the U.S. Pension Plan are held in trust and consist principally of equity and fixed income mutual funds and common stock. Changes in plan assumptions as well as fluctuations in actual equity or fixed income market returns could have a material impact on future pension costs. We believe the two most critical assumptions are (1) the expected rate of return on plan assets and (2) the discount rate. A decrease in the expected rate of return on U.S. Pension Plan assets of 50 basis points to a rate of 7.25% would result in an increase in pre-tax pension cost of approximately $2.0 million in Fiscal 2015. A decrease in the discount rate of 50 basis points to a rate of 4.10% would result in an increase in pre-tax pension cost of approximately $3.3 million in Fiscal 2015.
53
Income Taxes.
We use the asset and liability method of accounting for income taxes. Under this method, income tax expense is recognized for the amount of taxes payable or refundable for the current year and for deferred tax liabilities and assets for the future tax consequences of events that have been recognized in our financial statements or tax returns. Positions taken by an entity in its tax returns must satisfy a more-likely-than-not recognition threshold assuming the positions will be examined by tax authorities with full knowledge of relevant information. We use assumptions, judgments and estimates to determine our current provision for income taxes. We also use assumptions, judgments and estimates to determine our deferred tax assets and liabilities and any valuation allowance to be recorded against a deferred tax asset. Our assumptions, judgments and estimates relative to the current provision for income tax give consideration to current tax laws, our interpretation of current tax laws and possible outcomes of current and future audits conducted by foreign and domestic tax authorities. Changes in tax law or our interpretation thereof and the resolution of current and future tax audits could significantly impact the amounts provided for income taxes in our consolidated financial statements. Our assumptions, judgments and estimates relative to the amount of deferred income taxes take into account estimates of the amount of future taxable income. Actual taxable income or future estimates of taxable income could render our current assumptions, judgments and estimates inaccurate. Changes in the assumptions, judgments and estimates mentioned above could cause our actual income tax obligations to differ significantly from our estimates. As of September 30,
2014
, our net deferred tax liabilities totaled
$1,008.5 million
.
Recently Issued Accounting Pronouncements
See
Note 3
to the Consolidated Financial Statements for a discussion of the effects of recently issued accounting guidance.
|
ITEM 7A.
|
QUANTITATIVE AND QUALITATIVE DISCLOSURES ABOUT MARKET RISK
|
“Quantitative and Qualitative Disclosures About Market Risk” are contained in Item 7 - Management’s Discussion and Analysis of Financial Condition and Results of Operations under the caption “Market Risk Disclosures” and are incorporated by reference.
|
ITEM 8.
|
FINANCIAL STATEMENTS AND SUPPLEMENTARY DATA
|
Management’s Annual Report on Internal Control Over Financial Reporting and the financial statements and financial statement schedules referred to in the Index contained on page F-2 of this Report are incorporated herein by reference.
|
ITEM 9.
|
CHANGES IN AND DISAGREEMENTS WITH ACCOUNTANTS ON ACCOUNTING AND FINANCIAL DISCLOSURE
|
None.
|
ITEM 9A.
|
CONTROLS AND PROCEDURES
|
|
(a)
|
The Company's disclosure controls and procedures are designed to provide reasonable assurance that the information required to be disclosed by the Company in reports filed or submitted under the Securities Exchange Act of 1934, as amended, is (i) recorded, processed, summarized, and reported within the time periods specified in the SEC’s rules and forms, and (ii) accumulated and communicated to our management, including the Chief Executive Officer and Chief Financial Officer, as appropriate to allow timely decisions regarding required disclosure. The Company's management, with the participation of the Company’s Chief Executive Officer and Chief Financial Officer, evaluated the effectiveness of the Company's disclosure controls and procedures as of the end of the period covered by this report. Based on that evaluation, the Chief Executive Officer and Chief Financial Officer concluded that the Company's disclosure controls and procedures, as of
September 30, 2014
, were effective at the reasonable assurance level.
|
|
(b)
|
For “Management’s Annual Report on Internal Control over Financial Reporting” see Item 8 of this Report (which information is incorporated herein by reference).
|
|
(c)
|
During the most recent fiscal quarter, no change in the Company’s internal control over financial reporting occurred that has materially affected, or is reasonably likely to materially affect, the Company’s internal control over financial reporting.
|
|
ITEM 9B.
|
OTHER INFORMATION
|
None.
54
ITEMS 10 THROUGH 14.
In accordance with General Instruction G(3), and except as set forth below, the information required by Items 10, 11, 12, 13 and 14 is incorporated in this Report by reference to the following portions of UGI’s Proxy Statement, which will be filed with the SEC by December 31, 2014.
|
|
Information
|
Captions of Proxy Statement
Incorporated by Reference
|
|
|
Item 10.
|
Directors, Executive Officers and Corporate Governance
|
Election of Directors - Nominees; Corporate Governance; Director Independence; Board and Committee Structure; Communications with the Board; Securities Ownership of Management - Section 16(a) - Beneficial Ownership Reporting Compliance; Report of the Audit Committee of the Board of Directors
|
|
|
|
The Code of Ethics for the Chief Executive Officer and Senior Financial Officers of UGI Corporation is available without charge on the Company’s website, www.ugicorp.com, or by writing to Daniel J. Platt, Treasurer, UGI Corporation, P. O. Box 858, Valley Forge, PA 19482.
|
|
|
|
Item 11.
|
Executive Compensation
|
Compensation of Directors; Report of the Compensation and Management Development Committee of the Board of Directors; Compensation Discussion and Analysis; Compensation of Executive Officers; Compensation Committee Interlocks and Insider Participation
|
|
|
Item 12.
|
Security Ownership of Certain Beneficial Owners and Management and Related Stockholder Matters
|
Securities Ownership of Certain Beneficial Owners; Securities Ownership of Management
|
|
|
Item 13.
|
Certain Relationships and Related Transactions, and Director Independence
|
Election of Directors - Director Independence and Board and Committee Structure; Policy for Approval of Related Person Transactions
|
|
|
Item 14.
|
Principal Accounting Fees and Services
|
Our Independent Registered Public Accounting Firm
|
|
55
Equity Compensation Table
The following table sets forth information as of the end of Fiscal 2014 with respect to compensation plans under which our equity securities are authorized for issuance.
|
Plan category
|
Number of securities to be
issued upon exercise of outstanding options, warrants and rights
(a)
|
|
Weighted average
exercise price of outstanding options, warrants and rights
(b)
|
|
Number of securities
remaining available for future issuance under equity compensation plans (excluding securities reflected
in column (a)) (c)
|
||||||
|
Equity compensation plans approved by security holders
|
8,957,290
|
|
(1)
|
$
|
21.44
|
|
|
17,672,170
|
|
(2)
|
|
|
|
1,306,181
|
|
(3)
|
$
|
0
|
|
|
|
|||
|
Equity compensation plans not approved by security holders
|
0
|
|
|
||||||||
|
Total
|
10,263,471
|
|
|
$
|
21.44
|
|
(4)
|
||||
|
(1)
|
Represents 8,957,290 stock options under the UGI Corporation 2004 Omnibus Equity Compensation Plan Amended and Restated as of December 5, 2006 and the UGI Corporation 2013 Omnibus Incentive Compensation Plan.
|
|
(2)
|
Represents 172,646 securities remaining for future issuance of stock options from the 2004 Omnibus Equity Compensation Plan Amended and Restated as of December 5, 2006 and 17,499,524 of securities for issuance from the UGI Corporation 2013 Omnibus Incentive Compensation Plan. The UGI Corporation 2013 Omnibus Incentive Compensation Plan was approved by shareholders on January 24, 2013.
|
|
(3)
|
Represents 1,306,181 phantom share units under the UGI Corporation 2004 Omnibus Equity Compensation Plan Amended and Restated as of December 5, 2006 and the UGI Corporation 2013 Omnibus Incentive Compensation Plan.
|
|
(4)
|
Weighted-average exercise price of outstanding options; excludes phantom share units.
|
The information concerning the Company’s executive officers required by Item 10 is set forth below.
EXECUTIVE OFFICERS
|
Name
|
Age
|
Position
|
||
|
John L. Walsh
|
59
|
President and Chief Executive Officer
|
||
|
Kirk R. Oliver
|
56
|
Chief Financial Officer
|
||
|
Davinder S. Athwal
|
47
|
Vice President - Accounting and Financial Control and Chief Risk Officer
|
||
|
Jerry E. Sheridan
|
49
|
President and Chief Executive Officer, AmeriGas Propane, Inc.
|
||
|
Robert F. Beard
|
49
|
President and Chief Executive Officer, UGI Utilities, Inc.
|
||
|
Monica M. Gaudiosi
|
52
|
Vice President, General Counsel and Secretary
|
||
|
Bradley C. Hall
|
61
|
Vice President - New Business Development
|
||
All officers are elected for a one-year term at the organizational meetings of the respective Boards of Directors held each year.
There are no family relationships between any of the officers or between any of the officers and any of the directors.
56
John L. Walsh
Mr. Walsh is a Director and President (since 2005) and Chief Executive Officer (since 2013) of UGI Corporation. In addition, Mr. Walsh serves as a Director and Vice Chairman of AmeriGas Propane, Inc. (since 2005) and UGI Utilities, Inc. (since 2005), both of which are subsidiaries of UGI Corporation. Previously, he also served as Chief Operating Officer of UGI Corporation (2005 to 2013) and as President and Chief Executive Officer of UGI Utilities, Inc. (2009 to 2011). Mr. Walsh was the Chief Executive of the Industrial and Special Products Division of the BOC Group plc, an industrial gases company, a position he assumed in 2001. He was also an Executive Director of BOC (2001 to 2005). He joined BOC in 1986 as Vice President - Special Gases and held various senior management positions in BOC, including President of Process Gas Solutions, North America (2000 to 2001) and President of BOC Process Plants (1996 to 2000).
Kirk R. Oliver
Mr. Oliver is Chief Financial Officer of UGI (since October 2012). From December 2011 until September 2012, Mr. Oliver served as Senior Managing Director & Chief Operating Officer of InfraREIT Capital Partners, LLC, a partnership that invests in infrastructure assets, primarily electric transmission and gas pipeline assets. Prior to joining InfraREIT Capital, Mr. Oliver served as Senior Vice President and Chief Financial Officer of Allegheny Energy, Inc., an electric utility company, from 2008 to 2011, and as a Senior Executive at Hunt Power, LLC, a company that develops and invests in electric and gas utility projects, from 2007 to 2008. Mr. Oliver served in various positions at TXU Corp. (now Energy Future Holdings Corp.), an electricity distribution, generation and transmission company in Texas, from 1998 to 2006, including as Executive Vice President and Chief Financial Officer from 2004 to 2006, Senior Vice President, Finance from 2000 to 2003 and Vice President, Treasurer and Assistant Secretary from 1998 to 1999. Prior to joining TXU Corp., Mr. Oliver spent eleven years as an investment banker in the Global Power and Energy Group at Lehman Brothers and six years at Motorola Inc.
Davinder S. Athwal
Mr. Athwal is Vice President - Accounting and Financial Control and Chief Risk Officer (since January 2009). He previously served as the Global Mergers & Acquisitions Controller of Nortel Networks, Inc., a global supplier of telecommunications equipment and solutions from 2007 through 2008. Mr. Athwal served as Director, Global Revenue Governance for Nortel Networks, Inc. from 2006 through 2007. Mr. Athwal previously served in both accounting and risk management roles for IBM Corporation, a globally integrated innovation and technology company (2003 to 2006).
Jerry E. Sheridan
Mr. Sheridan is President, Chief Executive Officer and a Director of AmeriGas Propane, Inc. (since March 2012). Previously, he served as Vice President - Operations and Chief Operating Officer (2011 to 2012) and as Vice President - Finance and Chief Financial Officer (2005 to 2011) of AmeriGas Propane, Inc. Mr. Sheridan served as President and Chief Executive Officer (2003 to 2005) of Potters Industries, Inc., a global manufacturer of engineered glass materials and a wholly-owned subsidiary of PQ Corporation, a global producer of inorganic specialty chemicals. In addition, Mr. Sheridan served as Executive Vice President (2003 to 2005) and as Vice President and Chief Financial Officer (1999 to 2003) of PQ Corporation. Mr. Sheridan also serves on the Management Board of CP Kelco (since 2013), a privately held company that provides innovative products and solutions through the use of nature-based chemistry.
Robert F. Beard
Mr. Beard is President and Chief Executive Officer of UGI Utilities, Inc. (since September 2011). He previously served as Vice President - Marketing, Rates and Gas Supply (2010 to 2011) and Vice President - Southern Region (2008 to 2010) of UGI Utilities, Inc. From 2006 until 2008, Mr. Beard served as Vice President - Operations and Engineering of PPL Gas Utilities Corporation and, from 2002 until 2006, he served as Director - Operations and Engineering of PPL Gas Utilities Corporation.
Monica M. Gaudiosi
Ms. Gaudiosi is Vice President, General Counsel and Secretary (since April 2012). She also serves as Vice President and Secretary of AmeriGas Propane, Inc. and UGI Utilities, Inc. (since April 2012). Prior to joining UGI, Ms. Gaudiosi served as Senior Vice President and General Counsel (2007 to 2012) and Senior Vice President and Associate General Counsel (2005 to 2007) of Southern Union Company. Prior to joining Southern Union Company in 2005, Ms. Gaudiosi held various positions with General Electric Capital Corporation (1997 to 2005). Before joining General Electric Capital Corporation, Ms. Gaudiosi was an associate at the law firms of Hunton & Williams (1994 to 1997) and Sutherland, Asbill & Brennan (1988 to 1994).
57
Bradley C. Hall
Mr. Hall is Vice President - New Business Development (since October 1994). He also serves as President of UGI Enterprises, Inc. (since 1994) and UGI Energy Services, LLC (formerly known as UGI Energy Services, Inc.) (since 1995). He joined the Company in 1982 and held various positions in UGI Utilities, Inc., including Vice President - Marketing and Rates.
|
ITEM 15.
|
EXHIBITS AND FINANCIAL STATEMENT SCHEDULES
|
|
(a)
|
Documents filed as part of this report:
|
|
(1)
|
Financial Statements:
|
Included under Item 8 are the following financial statements and supplementary data:
Management’s Annual Report on Internal Control over Financial Reporting
Report of Independent Registered Public Accounting Firm
Consolidated Balance Sheets as of
September 30, 2014
and
2013
Consolidated Statements of Income for the years ended
September 30, 2014
,
2013
and
2012
Consolidated Statements of Comprehensive Income for the years ended
September 30, 2014
,
2013
and
2012
Consolidated Statements of Cash Flows for the years ended
September 30, 2014
,
2013
and
2012
Consolidated Statements of Changes in Equity for the years ended
September 30, 2014
,
2013
and
2012
Notes to Consolidated Financial Statements
|
(2)
|
Financial Statement Schedules:
|
I —
Condensed Financial Information of Registrant (Parent Company)
II —
Valuation and Qualifying Accounts for the years ended
September 30, 2014
,
2013
and
2012
We have omitted all other financial statement schedules because the required information is (1) not present; (2) not present in amounts sufficient to require submission of the schedule; or (3) included elsewhere in the financial statements or related notes.
|
(3)
|
List of Exhibits:
|
The exhibits filed as part of this report are as follows (exhibits incorporated by reference are set forth with the name of the registrant, the type of report and registration number or last date of the period for which it was filed, and the exhibit number in such filing):
|
Incorporation by Reference
|
||||||
|
Exhibit No.
|
Exhibit
|
Registrant
|
Filing
|
Exhibit
|
||
|
2.1
|
Contribution and Redemption Agreement, dated October 15, 2011, by and among AmeriGas Partners, L.P., Energy Transfer Partners, L.P., Energy Transfer Partners GP, L.P. and Heritage ETC, L.P
|
AmeriGas
Partners, L.P.
|
Form 8-K (10/15/11)
|
2.1
|
||
58
|
Incorporation by Reference
|
||||||
|
Exhibit No.
|
Exhibit
|
Registrant
|
Filing
|
Exhibit
|
||
|
2.2
|
Amendment No. 1, dated as of December 1, 2011, to the Contribution and Redemption Agreement, dated as of October 15, 2011, by and among Energy Transfer Partners, L.P., Energy Transfer Partners GP, L.P., Heritage ETC, L.P. and AmeriGas Partners, L.P.
|
AmeriGas
Partners, L.P.
|
Form 8-K
(12/1/11)
|
2.1
|
||
|
2.3
|
Amendment No. 2, dated as of January 11, 2012, to the Contribution and Redemption Agreement, dated as of October 15, 2012, by and among Energy Transfer Partners, L.P., Energy Transfer Partners GP, L.P., Heritage ETC, L.P. and AmeriGas Partners, L.P.
|
AmeriGas
Partners, L.P.
|
Form 8-K
(1/11/12)
|
2.1
|
||
|
2.4
|
Letter Agreement, dated as of January 11, 2012, by and among Energy Transfer Partners, L.P., Energy Transfer Partners GP, L.P., Heritage ETC, L.P. and AmeriGas Partners, L.P.
|
AmeriGas
Partners, L.P.
|
Form 8-K
(1/11/12)
|
2.1
|
||
|
2.5
|
Amendment to Contribution and Redemption Agreement, dated as of October 15, 2011, by an among Energy Transfer Partners, L.P., Energy Transfer Partners GP, L.P., Heritage ETC, L.P. and AmeriGas Partners, L.P., dated as of March 20, 2013.
|
AmeriGas
Partners, L.P.
|
Form 10-Q (3/31/13)
|
2.1
|
||
|
3.1
|
(Second) Amended and Restated Articles of Incorporation of the Company as amended through June 6, 2005.
|
UGI
|
Form 10-Q (6/30/05)
|
3.1
|
||
|
3.2
|
Articles of Amendment to the Amended and Restated Articles of Incorporation of UGI Corporation.
|
UGI
|
Form 8-K (7/29/14)
|
3.1
|
||
|
3.3
|
Amended and Restated Bylaws of UGI Corporation.
|
UGI
|
Form 8-K (7/30/13)
|
3.1
|
||
|
4.1
|
Instruments defining the rights of security holders, including indentures. (The Company agrees to furnish to the Commission upon request a copy of any instrument defining the rights of holders of long-term debt not required to be filed pursuant to Item 601(b)(4) of Regulation S-K).
|
|||||
59
|
Incorporation by Reference
|
||||||
|
Exhibit No.
|
Exhibit
|
Registrant
|
Filing
|
Exhibit
|
||
|
4.2
|
The description of the Company’s Common Stock contained in the Company’s registration statement filed under the Securities Exchange Act of 1934, as amended.
|
UGI
|
Form 8-B/A (4/17/96)
|
3.(4)
|
||
|
4.3
|
UGI’s (Second) Amended and Restated Articles of Incorporation and Bylaws referred to in 3.1 and 3.2 above.
|
|||||
|
4.4
|
Fourth Amended and Restated Agreement of Limited Partnership of AmeriGas Partners, L.P. dated as of July 27, 2009.
|
AmeriGas
Partners, L.P.
|
Form 10-Q (6/30/09)
|
3.1
|
||
|
4.5
|
Amendment No. 1 to Fourth Amended and Restated Agreement of Limited Partnership of AmeriGas Partners, L.P. dated as of March 13, 2012.
|
AmeriGas
Partners, L.P.
|
Form 8-K
(3/14/12)
|
3.1
|
||
|
4.6
|
Indenture, dated as of January 20, 2011, by and among AmeriGas Partners, L.P., AmeriGas Finance Corp. and U.S. Bank National Association, as trustee.
|
AmeriGas
Partners, L.P.
|
Form 10-Q (12/31/10)
|
4.1
|
||
|
4.7
|
First Supplemental Indenture, dated as of January 20, 2011, to Indenture dated as of January 20, 2011, by and among AmeriGas Partners, L.P., AmeriGas Finance Corp. and U.S. Bank National Association, as trustee.
|
AmeriGas
Partners, L.P.
|
Form 8-K (1/19/11)
|
4.1
|
||
|
4.8
|
Second Supplemental Indenture, dated as of August 10, 2011, to Indenture dated as of January 20, 2011, by and among AmeriGas Partners, L.P., AmeriGas Finance Corp. and U.S. Bank National Association, as trustee.
|
AmeriGas
Partners, L.P.
|
Form 8-K (8/10/11)
|
4.1
|
||
|
4.9
|
Indenture, dated as of August 1, 1993, by and between UGI Utilities, Inc., as Issuer, and U.S. Bank National Association, as successor trustee, incorporated by reference to the Registration Statement on Form S-3 filed on April 8, 1994.
|
Utilities
|
Registration Statement No. 33-77514
(4/8/94) |
4(c)
|
||
60
|
Incorporation by Reference
|
||||||
|
Exhibit No.
|
Exhibit
|
Registrant
|
Filing
|
Exhibit
|
||
|
4.10
|
Supplemental Indenture, dated as of September 15, 2006, by and between UGI Utilities, Inc., as Issuer, and U.S. Bank National Association, successor trustee to Wachovia Bank, National Association.
|
Utilities
|
Form 8-K (9/12/06)
|
4.2
|
||
|
4.11
|
Indenture, dated as of January 12, 2012, among AmeriGas Finance Corp., AmeriGas Finance LLC, AmeriGas Partners, L.P., as guarantor, and U.S. Bank National Association, as trustee.
|
AmeriGas
Partners, L.P.
|
Form 8-K
(1/12/12)
|
4.1
|
||
|
4.12
|
First Supplemental Indenture, dated as of January 12, 2012, among AmeriGas Finance Corp., AmeriGas Finance LLC, AmeriGas Partners, L.P., as guarantor, and U.S. Bank National Association, as trustee.
|
AmeriGas
Partners, L.P.
|
Form 8-K
(1/12/12)
|
4.2
|
||
|
4.13
|
Form of Fixed Rate Medium-Term Note.
|
Utilities
|
Form 8-K (8/26/94)
|
4(i)
|
||
|
4.14
|
Form of Fixed Rate Series B Medium-Term Note.
|
Utilities
|
Form 8-K (8/1/96)
|
4(i)
|
||
|
4.15
|
Form of Floating Rate Series B Medium-Term Note.
|
Utilities
|
Form 8-K (8/1/96)
|
4(ii)
|
||
|
4.16
|
Officer’s Certificate establishing Medium-Term Notes Series.
|
Utilities
|
Form 8-K (8/26/94)
|
4(iv)
|
||
|
4.17
|
Form of Officer’s Certificate establishing Series B Medium-Term Notes under the Indenture.
|
Utilities
|
Form 8-K (8/1/96)
|
4(iv)
|
||
|
4.18
|
Form of Officers’ Certificate establishing Series C Medium-Term Notes under the Indenture.
|
Utilities
|
Form 8-K (5/21/02)
|
4.2
|
||
|
4.19
|
Forms of Floating Rate and Fixed Rate Series C Medium-Term Notes.
|
Utilities
|
Form 8-K (5/21/02)
|
4.1
|
||
|
4.20
|
Form of Note Purchase Agreement dated October 30, 2013 between the Company and the purchasers listed as signatories thereto.
|
Utilities
|
Form 8-K (10/30/13)
|
4.1
|
||
|
10.1**
|
UGI Corporation 2004 Omnibus Equity Compensation Plan Amended and Restated as of December 5, 2006.
|
UGI
|
Form 8-K (2/27/07)
|
10.1
|
||
61
|
Incorporation by Reference
|
||||||
|
Exhibit No.
|
Exhibit
|
Registrant
|
Filing
|
Exhibit
|
||
|
10.2**
|
UGI Corporation 2004 Omnibus Equity Compensation Plan Amended and Restated as of December 5, 2006 - Terms and Conditions as amended and restated effective November, 2012.
|
UGI
|
Form 10-K (9/30/13)
|
10.2
|
||
|
10.3**
|
UGI Corporation 2013 Omnibus Incentive Compensation Plan, effective as of January 24, 2013.
|
UGI
|
Registration Statement No. 333-186178 (1/24/13)
|
99.1
|
||
|
10.4**
|
UGI Corporation Senior Executive Employee Severance Plan, as amended and restated as of November 16, 2012.
|
UGI
|
Form 10-Q (6/30/13)
|
10.1
|
||
|
10.5**
|
UGI Corporation Executive Employee Severance Plan, as amended and restated as of November 16, 2012.
|
UGI
|
Form 10-Q (6/30/13)
|
10.2
|
||
|
10.6**
|
UGI Corporation Executive Annual Bonus Plan effective as of October 1, 2006, as amended November 16, 2012.
|
UGI
|
Form 10-Q (3/31/13)
|
10.14
|
||
|
10.7**
|
AmeriGas Propane, Inc. 2010 Long-Term Incentive Plan on Behalf of AmeriGas Partners, L.P. effective July 30, 2010.
|
AmeriGas
Partners, L.P.
|
Form 8-K (7/30/10)
|
10.2
|
||
|
10.8**
|
AmeriGas Propane, Inc. 2010 Long-Term Incentive Plan on Behalf of AmeriGas Partners, L.P. effective July 30, 2010 - Terms and Conditions.
|
AmeriGas
Partners, L.P.
|
Form 10-K (9/30/10)
|
10.10
|
||
|
10.9**
|
AmeriGas Propane, Inc. 2010 Long-Term Incentive Plan on Behalf of AmeriGas Partners, L.P., Performance Unit Grant Letter (Alerian) for Employees, dated January 1, 2014.
|
AmeriGas
Partners, L.P.
|
Form 10-Q (3/31/14)
|
10.1
|
||
|
10.10**
|
AmeriGas Propane, Inc. 2010 Long-Term Incentive Plan on Behalf of AmeriGas Partners, L.P., Performance Unit Grant Letter (Propane) for Employees, dated January 1, 2014.
|
AmeriGas
Partners, L.P.
|
Form 10-Q
(3/31/14)
|
10.2
|
||
|
10.11**
|
AmeriGas Propane, Inc. 2010 Long-Term Incentive Plan on Behalf of AmeriGas Partners, L.P., Phantom Unit Grant Letter for Directors, dated January 8, 2014.
|
AmeriGas
Partners, L.P.
|
Form 10-Q
(3/31/14)
|
10.3
|
||
62
|
Incorporation by Reference
|
||||||
|
Exhibit No.
|
Exhibit
|
Registrant
|
Filing
|
Exhibit
|
||
|
10.12**
|
AmeriGas Propane, Inc. 2010 Long-Term Incentive Plan on Behalf of AmeriGas Partners, L.P., Phantom Unit Grant Letter, dated January 16, 2014.
|
AmeriGas
Partners, L.P.
|
Form 10-Q
(3/31/14)
|
10.6
|
||
|
10.13**
|
AmeriGas Propane, Inc. Non-Qualified Deferred Compensation Plan, as Amended and Restated effective November 22, 2013.
|
AmeriGas
Partners, L.P.
|
Form 10-Q (3/31/14)
|
10.4
|
||
|
10.14**
|
AmeriGas Propane, Inc. Senior Executive Employee Severance Plan, as amended and restated as of November 15, 2012.
|
AmeriGas
Partners, L.P.
|
Form 10-Q
(6/30/13)
|
10.1
|
||
|
10.15**
|
AmeriGas Propane, Inc. Executive Employee Severance Plan, as amended and restated as of November 15, 2012.
|
AmeriGas
Partners, L.P.
|
Form 10-Q
(6/30/13)
|
10.2
|
||
|
10.16**
|
AmeriGas Propane, Inc. Supplemental Executive Retirement Plan, as Amended and Restated effective November 22, 2013.
|
AmeriGas
Partners, L.P.
|
Form 10-Q (3/31/14)
|
10.5
|
||
|
10.17**
|
AmeriGas Propane, Inc. Executive Annual Bonus Plan, effective as of October 1, 2006, as amended November 15, 2012.
|
AmeriGas
Partners, L.P.
|
Form 10-Q (3/31/13)
|
10.9
|
||
|
10.18**
|
UGI Utilities, Inc. Senior Executive Employee Severance Plan, as amended and restated as of November 16, 2012.
|
Utilities
|
Form 10-Q (6/30/13)
|
10.1
|
||
|
10.19**
|
UGI Utilities, Inc. Executive Annual Bonus Plan, effective as of October 1, 2006, as amended as of November 16, 2012.
|
Utilities
|
Form 10-Q (3/31/13)
|
10.2
|
||
|
10.20**
|
UGI Corporation 2013 Omnibus Incentive Compensation Plan, Performance Unit Grant Letter for UGI Employees, dated January 1, 2014.
|
UGI
|
Form 10-Q (3/31/14)
|
10.7
|
||
|
10.21**
|
UGI Corporation 2013 Omnibus Incentive Compensation Plan Stock Unit Grant Letter for Non Employee Directors, dated January 8, 2014.
|
UGI
|
Form 10-Q
(3/31/14)
|
10.8
|
||
63
|
Incorporation by Reference
|
||||||
|
Exhibit No.
|
Exhibit
|
Registrant
|
Filing
|
Exhibit
|
||
|
10.22**
|
UGI Corporation 2004 Omnibus Equity Compensation Plan Nonqualified Stock Option Grant Letter for Non Employee Directors, dated January 8, 2014.
|
UGI
|
Form 10-Q (3/31/14)
|
10.6
|
||
|
10.23**
|
UGI Corporation 2013 Omnibus Incentive Compensation Plan Nonqualified Stock Option Grant Letter for UGI Employees, dated January 1, 2014.
|
UGI
|
Form 10-Q
(3/31/14)
|
10.9
|
||
|
10.24**
|
UGI Corporation 2013 Omnibus Incentive Compensation Plan Nonqualified Stock Option Grant Letter for AmeriGas Employees, dated January 1, 2014.
|
UGI
|
Form 10-Q
(3/31/14)
|
10.10
|
||
|
10.25**
|
UGI Corporation 2013 Omnibus Incentive Compensation Plan Nonqualified Stock Option Grant Letter for UGI Utilities Employees, dated January 1, 2014.
|
UGI
|
Form 10-Q
(3/31/14)
|
10.11
|
||
|
10.26**
|
UGI Corporation 2013 Omnibus Incentive Compensation Plan Performance Unit Grant Letter for UGI Utilities Employees, dated January 1, 2014.
|
UGI
|
Form 10-Q (3/31/14)
|
10.12
|
||
|
10.27**
|
UGI Corporation 2009 Deferral Plan, as Amended and Restated effective January 24, 2014.
|
UGI
|
Form 10-Q (3/31/14)
|
10.5
|
||
|
*10.28**
|
Description of oral compensation arrangements for Messrs. Walsh, Hall, and Oliver and Ms. Gaudiosi.
|
|||||
|
10.29**
|
Description of oral compensation arrangement for Mr. Sheridan.
|
AmeriGas
Partners, L.P.
|
Form 10-K
(9/30/14)
|
10.33
|
||
|
*10.30**
|
Summary of Director Compensation as of October 1, 2014.
|
|||||
|
10.31**
|
Form of Change in Control Agreement Amended and Restated as of May 12, 2008 for Mr. Walsh.
|
UGI
|
Form 10-Q (6/30/08)
|
10.3
|
||
|
10.32**
|
Change in Control Agreement for Monica M. Gaudiosi dated as of April 23, 2012.
|
UGI
|
Form 10-Q (6/30/12)
|
10.1
|
||
64
|
Incorporation by Reference
|
||||||
|
Exhibit No.
|
Exhibit
|
Registrant
|
Filing
|
Exhibit
|
||
|
10.33**
|
Change in Control Agreement for Kirk R. Oliver dated as of October 1, 2012.
|
UGI
|
Form 10-Q (12/31/12)
|
10.1
|
||
|
10.34**
|
Change in Control Agreement for Mr. Sheridan Amended and Restated as of March 3, 2012.
|
AmeriGas Partners, L.P.
|
Form 10-Q (3/31/12)
|
10.6
|
||
|
10.35**
|
UGI Corporation Supplemental Executive Retirement Plan and Supplemental Savings Plan, as Amended and Restated effective November 22, 2013.
|
UGI
|
Form 10-Q (3/31/14)
|
10.3
|
||
|
10.36**
|
UGI Corporation 2009 Supplemental Executive Retirement Plan for New Employees, as Amended and Restated effective November 22, 2013.
|
UGI
|
Form 10-Q (3/31/14)
|
10.4
|
||
|
10.37**
|
Trademark License Agreement dated April 19, 1995 among UGI Corporation, AmeriGas, Inc., AmeriGas Propane, Inc., AmeriGas Partners, L.P. and AmeriGas Propane, L.P.
|
UGI
|
Form 10-K (9/30/10)
|
10.37
|
||
|
10.38**
|
Trademark License Agreement, dated April 19, 1995 among AmeriGas Propane, Inc., AmeriGas Partners, L.P. and AmeriGas Propane, L.P.
|
AmeriGas
Partners, L.P.
|
Form 10-Q (12/31/10)
|
10.1
|
||
|
10.39
|
Credit Agreement dated as of June 21, 2011, as amended through and including Amendment No. 4 thereto dated April 18, 2012, by and among AmeriGas Propane, L.P., as Borrower, AmeriGas Propane, Inc., as a Guarantor, Wells Fargo Bank, National Association, as Administrative Agent, Swingline Lender and Issuing Lender (“Agent”), Wells Fargo Securities, LLC, as Sole Lead Arranger and Sole Book Manager and the financial institutions from time to time party thereto.
|
AmeriGas Partners, L.P.
|
Form 10-K (9/30/12)
|
10.39
|
||
65
|
Incorporation by Reference
|
||||||
|
Exhibit No.
|
Exhibit
|
Registrant
|
Filing
|
Exhibit
|
||
|
10.40
|
Release of Liens and Termination of Security Documents dated as of November 6, 2006 by and among AmeriGas Propane, Inc., Petrolane Incorporated, AmeriGas Propane, L.P., AmeriGas Propane Parts & Service, Inc. and Wachovia Bank, National Association, as Collateral Agent for the Secured Creditors, pursuant to the Intercreditor and Agency Agreement dated as of April 19, 1995.
|
AmeriGas
Partners, L.P.
|
Form 10-K (9/30/06)
|
10.3
|
||
|
10.41
|
Receivables Purchase Agreement, dated as of November 30, 2001, as amended through and including Amendment No. 8 thereto dated April 22, 2010 and Amendment No. 9 thereto dated August 26, 2010, by and among UGI Energy Services, Inc., as servicer, Energy Services Funding Corporation, as seller, Market Street Funding, LLC, as issuer, and PNC Bank, National Association, as administrator.
|
UGI
|
Form 10-K
(9/30/11)
|
10.47
|
||
|
10.42
|
Amendment No. 10, dated as of April 21, 2011 to Receivables Purchase Agreement, dated as of November 30, 2001(as amended, supplemented or modified from time to time), by and among UGI Energy Services, Inc. as servicer, Energy Services Funding Corporation, as seller, Market Street Funding LLC, as issuer, and PNC Bank, National Association, as administrator.
|
UGI
|
Form 8-K (4/21/11)
|
|||
|
10.43
|
Amendment No. 11, dated as of April 19, 2012, to Receivables Purchase Agreement, dated as of November 30, 2001 (as amended, supplemented or modified from time to time), by and among UGI Energy Services, Inc., as servicer, Energy Services Funding Corporation, as seller, Market Street Funding LLC, as issuer, and PNC Bank, National Association, as administrator.
|
UGI
|
Form 8-K
(4/19/12)
|
10.1
|
||
66
|
Incorporation by Reference
|
||||||
|
Exhibit No.
|
Exhibit
|
Registrant
|
Filing
|
Exhibit
|
||
|
10.44
|
Amendment No. 12, dated as of April 18, 2013, to Receivables Purchase Agreement, dated as of November 30, 2001 (as amended, supplemented, or modified from time to time), by and among UGI Energy Services, Inc., as servicer, Energy Services Funding Corporation, as seller, Market Street Funding LLC, as issuer, and PNC Bank, National Association, as administrator.
|
UGI
|
Form 8-K (4/18/13)
|
10.1
|
||
|
10.45
|
Credit Agreement, dated as of May 25, 2011 among UGI Utilities, Inc., as borrower, and PNC Bank, National Association, as administrative agent, Citizens Bank of Pennsylvania, as syndication agent, PNC Capital Markets LLC and RBS Citizens, N.A., as joint lead arrangers and joint bookrunners, and PNC Bank, National Association, Citizens Bank of Pennsylvania, Citibank, N.A., Credit Suisse AG, Cayman Islands Branch, JPMorgan Chase Bank, N.A., Wells Fargo Bank, National Association, The Bank of New York Mellon, and the other financial institutions from time to time parties thereto.
|
Utilities
|
Form 8-K (5/25/11)
|
10.1
|
||
|
10.46
|
Purchase and Sale Agreement, dated as of November 30, 2001, as amended through and including Amendment No. 3 thereto dated August 26, 2010, by and between UGI Energy Services, Inc. and Energy Services Funding Corporation.
|
UGI
|
Form 10-K (9/30/10)
|
10.47
|
||
|
10.47
|
Amended and Restated Credit Agreement, dated as of December 18, 2012, among UGI Energy Services, Inc., as borrower, and JPMorgan Chase Bank, N.A., as administrative agent, PNC Bank, National Association, as syndication agent, and Wells Fargo Bank, National Association, as documentation agent.
|
UGI
|
Form 8-K (12/18/12)
|
10.1
|
||
67
|
Incorporation by Reference
|
||||||
|
Exhibit No.
|
Exhibit
|
Registrant
|
Filing
|
Exhibit
|
||
|
10.48
|
Amendment No. 1, dated as of March 15, 2013, to Amended and Restated Credit Agreement, dated as of December 18, 2012, among UGI Energy Services, Inc., as borrower, and JPMorgan Chase Bank, N.A., as administrative agent, PNC Bank, National Association, as syndication agent, and Wells Fargo Bank, National Association, as documentation agent.
|
UGI
|
Form 10-Q (3/31/13)
|
10.1
|
||
|
10.49
|
Senior Facilities Agreement dated March 16, 2011 by and among AGZ Holding, as Parent and Borrower, Antargaz, as Borrower, BNP Paribas, Caisse Régionale de Crédit Agricole Mutuel de Paris et d’Ile de France, Credit Lyonnais and Natixis, as Mandated Lead Arrangers and Bookrunners, Barclays Bank PLC, Banque Commerciale pour le Marché de l’Entreprise and ING Belgium SA, Succursale en France, as Mandated Lead Arrangers, Natixis, as Facility Agent and Security Agent, Banco Bilbao Vizcaya Argentaria, Crédit du Nord, HSBC France, Crédit Suisse International, Bred Banque Populaire and Banque Palatine, as Arrangers and the Financial Institutions named therein.
|
UGI
|
Form 10-Q (3/31/11)
|
10.1
|
||
|
10.50
|
Pledge of Financial Instruments Account relating to Financial Instruments held by AGZ Holding in Antargaz, dated March 16, 2011, by and among AGZ Holding, as Pledgor, Natixis, as Security Agent and Bank Account Holder, and the Lenders, as Beneficiaries.
|
UGI
|
Form 10-Q (3/31/11)
|
10.2
|
||
|
10.51
|
Pledge of Financial Instruments Account relating to Financial Instruments held by Antargaz in certain subsidiary companies, dated March 16, 2011, by and among Antargaz, as Pledgor, Natixis, as Security Agent and Bank Account Holder, and the Lenders, as Beneficiaries.
|
UGI
|
Form 10-Q (3/31/11)
|
10.3
|
||
68
|
Incorporation by Reference
|
||||||
|
Exhibit No.
|
Exhibit
|
Registrant
|
Filing
|
Exhibit
|
||
|
10.52
|
Master Agreement for Assignment of Receivables dated March 16, 2011 between AGZ Holding, as Assignor, Natixis, as Security Agent, and the Beneficiaries.
|
UGI
|
Form 10-Q (3/31/11)
|
10.4
|
||
|
10.53
|
Master Agreement for Assignment of Receivables dated March 16, 2011 between Antargaz, as Assignor, Natixis, as Security Agent, and the Beneficiaries.
|
UGI
|
Form 10-Q (3/31/11)
|
10.5
|
||
|
10.54
|
First Demand Guarantee dated March 16, 2011 by UGI Corporation in favor of Natixis and the Lenders set forth in the Senior Facilities Agreement dated March 16, 2011.
|
UGI
|
Form 10-Q (3/31/11)
|
10.6
|
||
|
10.55
|
FSS Service Agreement No. 79028 effective as of December 1, 2014 by and between Columbia Gas Transmission, LLC and UGI Utilities, Inc.
|
Utilities
|
Form 10-K (9/30/14)
|
10.16
|
||
|
10.56
|
Firm Storage and Delivery Service Agreement (Rate GSS) dated July 1, 1996 between Transcontinental Gas Pipe Line Corporation and PG Energy.
|
Utilities
|
Form 8-K
(8/24/06)
|
10.8
|
||
|
10.57
|
Service Agreement For Use Under Seller’s GSS Rate Schedule dated July 9, 2012 between Transcontinental Gas Pipe Line Company, LLC and UGI Penn Natural Gas, Inc.
|
Utilities
|
Form 10-Q (6/30/12)
|
10.1
|
||
|
10.58
|
SST Service Agreement No. 79133 effective as of December 1, 2014 by and between Columbia Gas Transmission, LLC and UGI Utilities, Inc.
|
Utilities
|
Form 10-K
(9/30/14)
|
10.19
|
||
|
10.59
|
Contingent Residential Support Agreement dated as of January 12, 2012, among Energy Transfer Partners, L.P., AmeriGas Finance LLC, AmeriGas Finance Corp., AmeriGas Partners, L.P., and for certain limited purposes only, UGI Corporation.
|
AmeriGas
Partners, L.P.
|
Form 8-K
(1/11/12)
|
10.1
|
||
69
|
Incorporation by Reference
|
||||||
|
Exhibit No.
|
Exhibit
|
Registrant
|
Filing
|
Exhibit
|
||
|
10.60
|
Amendment to Contingent Residual Support Agreement dated as of January 12, 2012, among Energy Transfer Partners, L.P., AmeriGas Finance LLC, AmeriGas Finance Corp., AmeriGas Partners, L.P., and for certain limited purposes only, UGI Corporation, dated as of March 20, 2013.
|
AmeriGas
Partners, L.P.
|
Form 10-Q (3/31/13)
|
10.1
|
||
|
10.61
|
Unitholder Agreement, dated as of January 12, 2012, by and among Heritage ETC, L.P., AmeriGas Partners, L.P., and, for limited purposes, Energy Transfer Partners, L.P., Energy Transfer Partners GP, L.P., and Energy Transfer Equity, L.P.
|
AmeriGas
Partners, L.P.
|
Form 8-K
(1/11/12)
|
10.2
|
||
|
10.62
|
Amendment No. 13, dated as of October 1, 2013, to Receivables Purchase Agreement, dated as of November 30, 2001 (as amended, supplemented, or modified from time to time), by and among UGI Energy Services, LLC, as servicer, Energy Services Funding Corporation, as seller, Market Street Funding LLC, as issuer, and PNC Bank, National Association, as administrator.
|
UGI
|
Form 10-K (9/30/13)
|
10.72
|
||
|
10.63
|
Amendment No. 4 dated as of October 1, 2013 to Purchase and Sale Agreement dated as of November 30, 2001 by and between UGI Energy Services, LLC and Energy Services Funding Corporation.
|
UGI
|
Form 10-K (9/30/13)
|
10.73
|
||
|
10.64
|
Amendment No. 14, dated as of October 1, 2013, to Receivables Purchase Agreement, dated as of November 30, 2001 (as amended, supplemented, or modified from time to time), by and among UGI Energy Services, LLC, as servicer, Energy Services Funding Corporation, as seller, Market Street Funding LLC, as issuer, and PNC Bank, National Association, as administrator.
|
UGI
|
Form 10-K (9/30/13)
|
10.74
|
||
70
|
Incorporation by Reference
|
||||||
|
Exhibit No.
|
Exhibit
|
Registrant
|
Filing
|
Exhibit
|
||
|
10.65
|
Amendment No. 15, dated as of October 31, 2014, to Receivables Purchase Agreement, dated as of November 30, 2001 (as amended, supplemented, or modified from time to time), by and among UGI Energy Services, LLC, as servicer, Energy Services Funding Corporation, as seller, Market Street Funding LLC, as issuer, and PNC Bank, National Association, as administrator.
|
UGI
|
Form 8-K (10/31/14)
|
10.1
|
||
|
10.66
|
Term Loan Facility Agreement dated March 21, 2014 by and between UGI Europe, Inc., as borrower, UGI Corporation, as guarantor, and Wells Fargo Bank, National Association, London Branch, as creditor.
|
UGI
|
Form 10-Q (3/31/14)
|
10.1
|
||
|
10.67
|
Guaranty dated March 21, 2014 by and between UGI Corporation, as guarantor, and Wells Fargo Bank, National Association, London Branch, as creditor.
|
UGI
|
Form 10-Q (3/31/14)
|
10.2
|
||
|
10.68
|
Amended and Restated Credit Agreement dated as of June 18, 2014 by and among AmeriGas Propane, L.P., as Borrower, AmeriGas Propane, Inc., as Guarantor, Wells Fargo Securities, LLC, as Sole Lead Arranger and Sole Book Manager, and the other financial institutions from time to time party thereto.
|
AmeriGas
|
Form 8-K (6/18/14)
|
10.1
|
||
|
*10.69
|
Senior Secured Bridge Facility Agreement dated as of October 17, 2014 by and between UGI International Enterprises, Inc., as borrower, Credit Suisse AG, London Branch, Bank of America Merrill Lynch International Limited and Natixis, New York Branch, as mandated lead arrangers, and Credit Suisse AG, Cayman Island Branch, as agent and security agent.
|
|||||
|
*10.70
|
Guarantee dated as of October 17, 2014 by and between UGI Corporation and Credit Suisse AG, Cayman Island Branch, as agent.
|
|||||
|
14
|
Code of Ethics for principal executive, financial and accounting officers.
|
UGI
|
Form 10-K (9/30/03)
|
14
|
||
71
|
Incorporation by Reference
|
||||||
|
Exhibit No.
|
Exhibit
|
Registrant
|
Filing
|
Exhibit
|
||
|
*21
|
Subsidiaries of the Registrant.
|
|||||
|
*23
|
Consent of PricewaterhouseCoopers LLP.
|
|||||
|
*31.1
|
Certification by the Chief Executive Officer relating to the Registrant’s Report on Form 10-K for the fiscal year ended September 30, 2014 pursuant to Section 302 of the Sarbanes-Oxley Act of 2002.
|
|||||
|
*31.2
|
Certification by the Chief Financial Officer relating to the Registrant’s Report on Form 10-K for the fiscal year ended September 30, 2014 pursuant to Section 302 of the Sarbanes-Oxley Act of 2002.
|
|||||
|
*32
|
Certification by the Chief Executive Officer and the Chief Financial Officer relating to the Registrant’s Report on Form 10-K for the fiscal year ended September 30, 2014, pursuant to Section 906 of the Sarbanes-Oxley Act of 2002.
|
|||||
|
*101.INS
|
XBRL.Instance
|
|||||
|
*101.SCH
|
XBRL Taxonomy Extension Schema
|
|||||
|
*101.CAL
|
XBRL Taxonomy Extension Calculation Linkbase
|
|||||
|
*101.DEF
|
XBRL Taxonomy Extension Definition Linkbase
|
|||||
|
*101.LAB
|
XBRL Taxonomy Extension Labels Linkbase
|
|||||
|
*101.PRE
|
XBRL Taxonomy Extension Presentation Linkbase
|
|||||
|
*
|
Filed herewith.
|
|
**
|
As required by Item 15(a)(3), this exhibit is identified as a compensatory plan or arrangement.
|
72
SIGNATURES
Pursuant to the requirements of Section 13 or 15(d) of the Securities Exchange Act of 1934, the Registrant has duly caused this Report to be signed on its behalf by the undersigned, thereunto duly authorized.
|
|
|
|
|
|
UGI CORPORATION
|
|||
|
Date:
|
November 28, 2014
|
By:
|
/s/ Kirk R. Oliver
|
|
|
|
Kirk R. Oliver
Chief Financial Officer
|
|
Pursuant to the requirements of the Securities Exchange Act of 1934, this Report has been signed below on
November 28, 2014
, by the following persons on behalf of the Registrant in the capacities indicated.
|
Signature
|
|
Title
|
|
|
|
|
|
/s/ John L. Walsh
|
|
President and Chief Executive Officer
(Principal Executive Officer) and Director
|
|
John L. Walsh
|
||
|
|
|
|
|
/s/ Kirk R. Oliver
|
|
Chief Financial Officer (Principal Financial Officer)
|
|
Kirk R. Oliver
|
||
|
/s/ Davinder S. Athwal
|
|
Vice President — Accounting and Financial Control,
Chief Risk Officer (Principal Accounting Officer)
|
|
Davinder S. Athwal
|
||
|
|
|
|
|
/s/ Lon R. Greenberg
|
Chairman and Director
|
|
|
Lon R. Greenberg
|
||
|
/s/ Richard W. Gochnauer
|
|
Director
|
|
Richard W. Gochnauer
|
||
|
|
|
|
|
/s/ Frank S. Hermance
|
|
Director
|
|
Frank S. Hermance
|
||
|
|
|
|
|
/s/ Ernest E. Jones
|
|
Director
|
|
Ernest E. Jones
|
||
|
|
|
|
|
/s/ Anne Pol
|
|
Director
|
|
Anne Pol
|
||
|
|
|
|
|
/s/ M. Shawn Puccio
|
|
Director
|
|
M. Shawn Puccio
|
||
|
|
|
|
|
/s/ Marvin O. Schlanger
|
|
Director
|
|
Marvin O. Schlanger
|
||
|
|
|
|
|
/s/ Roger B. Vincent
|
|
Director
|
|
Roger B. Vincent
|
||
73
UGI CORPORATION AND SUBSIDIARIES
FINANCIAL INFORMATION
FOR INCLUSION IN ANNUAL REPORT ON FORM 10-K
YEAR ENDED
SEPTEMBER 30, 2014
F-1
UGI CORPORATION
INDEX TO FINANCIAL STATEMENTS AND FINANCIAL STATEMENT SCHEDULES
|
|
Pages
|
|
|
|
|
Financial Statement Schedules:
|
|
|
For the years ended September 30, 2014, 2013 and 2012:
|
|
We have omitted all other financial statement schedules because the required information is either (1) not present; (2) not present in amounts sufficient to require submission of the schedule; or (3) included elsewhere in the financial statements or related notes.
F-2
Reports of Management
Financial Statements
The Company’s consolidated financial statements and other financial information contained in this Annual Report were prepared by management, which is responsible for their fairness, integrity and objectivity. The consolidated financial statements and related information were prepared in accordance with accounting principles generally accepted in the United States of America (“GAAP”) and include amounts that are based on management’s best judgments and estimates.
The Audit Committee of the Board of Directors is composed of three members, each of whom is independent and a non-employee director of the Company. The Committee is responsible for monitoring and overseeing the financial reporting process, the adequacy of internal accounting controls, the independence and performance of the Company’s independent registered accounting firm and internal auditors. The Committee meets regularly, with and without management present, with the independent registered accounting firm and the internal auditors, both of which report directly to the Committee. In addition, the Committee provides regular reports to the Board of Directors.
Management’s Annual Report on Internal Control over Financial Reporting
Management is responsible for establishing and maintaining adequate internal control over financial reporting for the Company, as such term is defined in Rule 13a-15(f) of the Securities Exchange Act of 1934, as amended. In order to evaluate the effectiveness of internal control over financial reporting, as required by Section 404 of the Sarbanes-Oxley Act of 2002, management has conducted an assessment, including testing, of the Company’s internal control over financial reporting as of
September 30, 2014
, using the criteria in
Internal Control - Integrated Framework
(1992), issued by the Committee of Sponsoring Organizations of the Treadway Commission (“COSO Framework”).
Internal control over financial reporting refers to the process, designed under the supervision and with the participation of management, including our Chief Executive Officer and our Chief Financial Officer, and effected by the Company’s Board of Directors, to provide reasonable, but not absolute, assurance regarding the reliability of financial reporting and the preparation of financial statements for external purposes in accordance with GAAP and includes policies and procedures that (1) pertain to the maintenance of records that, in reasonable detail, accurately and fairly reflect the transactions and dispositions of the assets of the Company; (2) provide reasonable assurance that transactions are recorded as necessary to permit preparation of financial statements in accordance with generally accepted accounting principles, and that receipts and expenditures of the Company are being made only in accordance with authorizations of management and directors of the Company; and (3) provide reasonable assurance regarding prevention or timely detection of unauthorized acquisition, use or disposition of the Company’s assets that could have a material effect on the financial statements.
Because of its inherent limitations, internal control over financial reporting may not prevent or detect misstatements. Also, projections of any evaluation of effectiveness to future periods are subject to the risk that controls may become inadequate due to changing conditions, or the degree of compliance with the policies or procedures may deteriorate.
Based on its assessment, management has concluded that the Company’s internal control over financial reporting was effective as of
September 30, 2014
, based on the COSO Framework. PricewaterhouseCoopers LLP, our independent registered public accounting firm, has audited the effectiveness of the Company’s internal control over financial reporting as of
September 30, 2014
, as stated in their report, which appears herein.
/s/ John L. Walsh
Chief Executive Officer
/s/ Kirk R. Oliver
Chief Financial Officer
/s/ Davinder S. Athwal
Chief Accounting Officer
F-3
Report of Independent Registered Public Accounting Firm
To the Board of Directors and Stockholders of UGI Corporation:
In our opinion, the accompanying consolidated balance sheets and the related consolidated statements of income, of comprehensive income, of changes in equity and of cash flows present fairly, in all material respects, the financial position of UGI Corporation and its subsidiaries at September 30, 2014 and 2013, and the results of their operations and their cash flows for each of the three years in the period ended September 30, 2014 in conformity with accounting principles generally accepted in the United States of America. In addition, in our opinion, the financial statement schedules listed in the index appearing under Item 15 (a)(2) present fairly, in all material respects, the information set forth therein when read in conjunction with the related consolidated financial statements. Also in our opinion, the Company maintained, in all material respects, effective internal control over financial reporting as of September 30, 2014, based on criteria established in
Internal Control - Integrated Framework
(1992
)
issued by the Committee of Sponsoring Organizations of the Treadway Commission (COSO). The Company's management is responsible for these financial statements and financial statement schedules, for maintaining effective internal control over financial reporting and for its assessment of the effectiveness of internal control over financial reporting, included in the accompanying Management's Annual Report on Internal Control over Financial Reporting. Our responsibility is to express opinions on these financial statements, on the financial statement schedules, and on the Company's internal control over financial reporting based on our integrated audits. We conducted our audits in accordance with the standards of the Public Company Accounting Oversight Board (United States). Those standards require that we plan and perform the audits to obtain reasonable assurance about whether the financial statements are free of material misstatement and whether effective internal control over financial reporting was maintained in all material respects. Our audits of the financial statements included examining, on a test basis, evidence supporting the amounts and disclosures in the financial statements, assessing the accounting principles used and significant estimates made by management, and evaluating the overall financial statement presentation. Our audit of internal control over financial reporting included obtaining an understanding of internal control over financial reporting, assessing the risk that a material weakness exists, and testing and evaluating the design and operating effectiveness of internal control based on the assessed risk. Our audits also included performing such other procedures as we considered necessary in the circumstances. We believe that our audits provide a reasonable basis for our opinions.
A company’s internal control over financial reporting is a process designed to provide reasonable assurance regarding the reliability of financial reporting and the preparation of financial statements for external purposes in accordance with generally accepted accounting principles. A company’s internal control over financial reporting includes those policies and procedures that (i) pertain to the maintenance of records that, in reasonable detail, accurately and fairly reflect the transactions and dispositions of the assets of the company; (ii) provide reasonable assurance that transactions are recorded as necessary to permit preparation of financial statements in accordance with generally accepted accounting principles, and that receipts and expenditures of the company are being made only in accordance with authorizations of management and directors of the company; and (iii) provide reasonable assurance regarding prevention or timely detection of unauthorized acquisition, use, or disposition of the company’s assets that could have a material effect on the financial statements.
Because of its inherent limitations, internal control over financial reporting may not prevent or detect misstatements. Also, projections of any evaluation of effectiveness to future periods are subject to the risk that controls may become inadequate because of changes in conditions, or that the degree of compliance with the policies or procedures may deteriorate.
/s/ PricewaterhouseCoopers LLP
Philadelphia, Pennsylvania
November 28, 2014
F-4
UGI CORPORATION AND SUBSIDIARIES
CONSOLIDATED BALANCE SHEETS
(Millions of dollars)
|
|
September 30,
|
||||||
|
|
2014
|
2013
|
|||||
|
ASSETS
|
|
|
|||||
|
Current assets
|
|
|
|||||
|
Cash and cash equivalents
|
$
|
419.5
|
|
$
|
389.3
|
|
|
|
Restricted cash
|
16.6
|
|
8.3
|
|
|||
|
Accounts receivable (less allowances for doubtful accounts of $39.1 and $39.5, respectively)
|
684.7
|
|
745.6
|
|
|||
|
Accrued utility revenues
|
14.3
|
|
18.9
|
|
|||
|
Inventories
|
423.0
|
|
365.5
|
|
|||
|
Deferred income taxes
|
10.1
|
|
10.6
|
|
|||
|
Utility regulatory assets
|
13.2
|
|
8.2
|
|
|||
|
Derivative instruments
|
14.5
|
|
23.8
|
|
|||
|
Prepaid expenses and other current assets
|
67.1
|
|
57.1
|
|
|||
|
Total current assets
|
1,663.0
|
|
1,627.3
|
|
|||
|
Property, plant and equipment
|
|
|
|||||
|
Non-utility
|
4,608.2
|
|
4,612.7
|
|
|||
|
Utilities
|
2,568.5
|
|
2,427.8
|
|
|||
|
|
7,176.7
|
|
7,040.5
|
|
|||
|
Accumulated depreciation and amortization
|
(2,633.0
|
)
|
(2,560.3
|
)
|
|||
|
Net property, plant, and equipment
|
4,543.7
|
|
4,480.2
|
|
|||
|
Goodwill
|
2,833.4
|
|
2,873.7
|
|
|||
|
Intangible assets, net
|
576.4
|
|
607.9
|
|
|||
|
Utility regulatory assets
|
255.0
|
|
236.7
|
|
|||
|
Derivative instruments
|
12.5
|
|
0.4
|
|
|||
|
Other assets
|
209.0
|
|
182.6
|
|
|||
|
Total assets
|
$
|
10,093.0
|
|
$
|
10,008.8
|
|
|
|
LIABILITIES AND EQUITY
|
|
|
|||||
|
Current liabilities
|
|
|
|||||
|
Current maturities of long-term debt
|
$
|
77.2
|
|
$
|
67.2
|
|
|
|
Short-term borrowings
|
210.8
|
|
227.9
|
|
|||
|
Accounts payable
|
459.8
|
|
472.3
|
|
|||
|
Employee compensation and benefits accrued
|
106.5
|
|
97.0
|
|
|||
|
Deposits and advances
|
211.5
|
|
205.2
|
|
|||
|
Derivative instruments
|
40.2
|
|
30.0
|
|
|||
|
Accrued interest
|
57.9
|
|
60.6
|
|
|||
|
Other current liabilities
|
267.0
|
|
264.7
|
|
|||
|
Total current liabilities
|
1,430.9
|
|
1,424.9
|
|
|||
|
Debt and other liabilities
|
|
|
|||||
|
Long-term debt
|
3,433.6
|
|
3,542.2
|
|
|||
|
Deferred income taxes
|
1,005.1
|
|
962.3
|
|
|||
|
Deferred investment tax credits
|
3.9
|
|
4.3
|
|
|||
|
Derivative instruments
|
16.6
|
|
25.4
|
|
|||
|
Other noncurrent liabilities
|
539.7
|
|
501.8
|
|
|||
|
Total liabilities
|
6,429.8
|
|
6,460.9
|
|
|||
|
Commitments and contingencies (Note 16)
|
|
|
|||||
|
Equity:
|
|
|
|||||
|
UGI Corporation stockholders’ equity:
|
|
|
|||||
|
UGI Common Stock, without par value (authorized - 450,000,000 shares; issued - 173,770,641 and 173,675,691 shares, respectively)
|
1,215.6
|
|
1,208.1
|
|
|||
|
Retained earnings
|
1,509.4
|
|
1,308.3
|
|
|||
|
Accumulated other comprehensive (loss) income
|
(21.2
|
)
|
8.4
|
|
|||
|
Treasury stock, at cost
|
(44.7
|
)
|
(32.3
|
)
|
|||
|
Total UGI Corporation stockholders’ equity
|
2,659.1
|
|
2,492.5
|
|
|||
|
Noncontrolling interests, principally in AmeriGas Partners
|
1,004.1
|
|
1,055.4
|
|
|||
|
Total equity
|
3,663.2
|
|
3,547.9
|
|
|||
|
Total liabilities and equity
|
$
|
10,093.0
|
|
$
|
10,008.8
|
|
|
See accompanying Notes to Consolidated Financial Statements.
F-5
UGI CORPORATION AND SUBSIDIARIES
CONSOLIDATED STATEMENTS OF INCOME
(Millions of dollars, except per share amounts)
|
|
Year Ended September 30,
|
||||||||||
|
|
2014
|
2013
|
2012
|
||||||||
|
Revenues
|
|
|
|
||||||||
|
Non-utility
|
$
|
7,191.9
|
|
$
|
6,255.7
|
|
$
|
5,638.8
|
|
||
|
Utility
|
1,085.4
|
|
939.0
|
|
882.5
|
|
|||||
|
|
8,277.3
|
|
7,194.7
|
|
6,521.3
|
|
|||||
|
Costs and Expenses
|
|
|
|
||||||||
|
Cost of sales (excluding depreciation shown below):
|
|
|
|
||||||||
|
Non-utility
|
4,612.8
|
|
3,858.4
|
|
3,640.0
|
|
|||||
|
Utility
|
562.9
|
|
466.0
|
|
459.1
|
|
|||||
|
Operating and administrative expenses
|
1,752.6
|
|
1,692.0
|
|
1,591.1
|
|
|||||
|
Utility taxes other than income taxes
|
16.6
|
|
16.9
|
|
17.3
|
|
|||||
|
Depreciation
|
305.7
|
|
301.4
|
|
263.2
|
|
|||||
|
Amortization
|
57.2
|
|
61.7
|
|
51.8
|
|
|||||
|
Other income, net
|
(36.1
|
)
|
(32.8
|
)
|
(39.8
|
)
|
|||||
|
|
7,271.7
|
|
6,363.6
|
|
5,982.7
|
|
|||||
|
Operating income
|
1,005.6
|
|
831.1
|
|
538.6
|
|
|||||
|
Loss from equity investees
|
(0.1
|
)
|
(0.4
|
)
|
(0.3
|
)
|
|||||
|
Loss on extinguishments of debt
|
—
|
|
—
|
|
(13.3
|
)
|
|||||
|
Interest expense
|
(237.7
|
)
|
(240.3
|
)
|
(220.4
|
)
|
|||||
|
Income before income taxes
|
767.8
|
|
590.4
|
|
304.6
|
|
|||||
|
Income taxes
|
(235.2
|
)
|
(162.8
|
)
|
(106.9
|
)
|
|||||
|
Net income
|
532.6
|
|
427.6
|
|
197.7
|
|
|||||
|
(Deduct net income) add net loss attributable to noncontrolling interests, principally in AmeriGas Partners
|
(195.4
|
)
|
(149.5
|
)
|
12.5
|
|
|||||
|
Net income attributable to UGI Corporation
|
$
|
337.2
|
|
$
|
278.1
|
|
$
|
210.2
|
|
||
|
Earnings per common share attributable to UGI Corporation stockholders:
|
|
|
|
||||||||
|
Basic
|
$
|
1.95
|
|
$
|
1.63
|
|
$
|
1.24
|
|
||
|
Diluted
|
$
|
1.92
|
|
$
|
1.60
|
|
$
|
1.24
|
|
||
|
Average common shares outstanding (thousands):
|
|
|
|
||||||||
|
Basic
|
172,733
|
|
170,885
|
|
168,872
|
|
|||||
|
Diluted
|
175,231
|
|
173,282
|
|
170,148
|
|
|||||
See accompanying Notes to Consolidated Financial Statements.
F-6
UGI CORPORATION AND SUBSIDIARIES
CONSOLIDATED STATEMENTS OF COMPREHENSIVE INCOME
(Millions of dollars)
|
|
Year Ended September 30,
|
||||||||||
|
|
2014
|
2013
|
2012
|
||||||||
|
Net income
|
$
|
532.6
|
|
$
|
427.6
|
|
$
|
197.7
|
|
||
|
Net gains (losses) on derivative instruments (net of tax of $(12.2), $(7.2) and $29.3, respectively)
|
54.0
|
|
14.4
|
|
(105.4
|
)
|
|||||
|
Reclassifications of net (gains) losses on derivative instruments (net of tax of $2.0, $(10.3) and $(14.6), respectively)
|
(45.2
|
)
|
53.5
|
|
56.3
|
|
|||||
|
Foreign currency translation adjustments (net of tax of $13.8, $(6.6) and $2.8, respectively)
|
(23.2
|
)
|
28.8
|
|
(20.6
|
)
|
|||||
|
Foreign currency (losses) gains on long-term intra-company transactions (net of tax of $10.6, $(0.8) and $0.7, respectively)
|
(19.8
|
)
|
3.2
|
|
(1.7
|
)
|
|||||
|
Benefit plans (net of tax of $2.6, $(3.8) and $6.0, respectively)
|
(5.2
|
)
|
5.3
|
|
(11.5
|
)
|
|||||
|
Reclassifications of benefit plans actuarial losses and prior service costs to net income (net of tax of $(0.6), $(0.8) and $(0.5), respectively)
|
1.0
|
|
1.2
|
|
0.7
|
|
|||||
|
Other comprehensive (loss) income
|
(38.4
|
)
|
106.4
|
|
(82.2
|
)
|
|||||
|
Comprehensive income
|
494.2
|
|
534.0
|
|
115.5
|
|
|||||
|
(Deduct comprehensive income) add comprehensive loss attributable to noncontrolling interests, principally in AmeriGas Partners
|
(186.6
|
)
|
(192.3
|
)
|
38.6
|
|
|||||
|
Comprehensive income attributable to UGI Corporation
|
$
|
307.6
|
|
$
|
341.7
|
|
$
|
154.1
|
|
||
See accompanying Notes to Consolidated Financial Statements.
F-7
UGI CORPORATION AND SUBSIDIARIES
CONSOLIDATED STATEMENTS OF CASH FLOWS
(Millions of dollars)
|
|
Year Ended September 30,
|
||||||||||
|
|
2014
|
2013
|
2012
|
||||||||
|
CASH FLOWS FROM OPERATING ACTIVITIES
|
|
|
|
||||||||
|
Net income
|
$
|
532.6
|
|
$
|
427.6
|
|
$
|
197.7
|
|
||
|
Adjustments to reconcile net income to net cash provided by operating activities:
|
|
|
|
||||||||
|
Depreciation and amortization
|
362.9
|
|
363.1
|
|
315.0
|
|
|||||
|
Deferred income taxes, net
|
66.7
|
|
48.7
|
|
90.2
|
|
|||||
|
Provision for uncollectible accounts
|
43.5
|
|
30.2
|
|
26.5
|
|
|||||
|
Unrealized losses (gains) on derivative instruments
|
18.6
|
|
(0.2
|
)
|
(17.2
|
)
|
|||||
|
Equity-based compensation expense
|
25.8
|
|
17.6
|
|
14.5
|
|
|||||
|
Loss on extinguishments of debt
|
—
|
|
—
|
|
13.3
|
|
|||||
|
Other, net
|
(38.2
|
)
|
(41.4
|
)
|
(11.0
|
)
|
|||||
|
Net change in:
|
|
|
|
||||||||
|
Accounts receivable and accrued utility revenues
|
18.1
|
|
(110.8
|
)
|
65.5
|
|
|||||
|
Inventories
|
(65.1
|
)
|
4.6
|
|
89.2
|
|
|||||
|
Utility deferred fuel costs, net of changes in unsettled derivatives
|
(17.6
|
)
|
9.3
|
|
(8.2
|
)
|
|||||
|
Accounts payable
|
3.7
|
|
38.7
|
|
(78.7
|
)
|
|||||
|
Other current assets
|
(1.2
|
)
|
36.3
|
|
(12.5
|
)
|
|||||
|
Other current liabilities
|
55.6
|
|
(22.2
|
)
|
23.4
|
|
|||||
|
Net cash provided by operating activities
|
1,005.4
|
|
801.5
|
|
707.7
|
|
|||||
|
CASH FLOWS FROM INVESTING ACTIVITIES
|
|
|
|
||||||||
|
Expenditures for property, plant and equipment
|
(456.8
|
)
|
(486.0
|
)
|
(339.4
|
)
|
|||||
|
Acquisitions of businesses, net of cash acquired
|
(37.1
|
)
|
(78.9
|
)
|
(1,580.5
|
)
|
|||||
|
(Increase) decrease in restricted cash
|
(8.3
|
)
|
(5.3
|
)
|
14.2
|
|
|||||
|
Other, net
|
14.6
|
|
16.9
|
|
1.2
|
|
|||||
|
Net cash used by investing activities
|
(487.6
|
)
|
(553.3
|
)
|
(1,904.5
|
)
|
|||||
|
CASH FLOWS FROM FINANCING ACTIVITIES
|
|
|
|
||||||||
|
Dividends on UGI Common Stock
|
(136.1
|
)
|
(125.8
|
)
|
(119.1
|
)
|
|||||
|
Distributions on AmeriGas Partners publicly held Common Units
|
(237.7
|
)
|
(226.5
|
)
|
(181.7
|
)
|
|||||
|
Issuances of debt
|
174.5
|
|
227.1
|
|
1,550.2
|
|
|||||
|
Repayments of debt
|
(242.6
|
)
|
(168.7
|
)
|
(299.9
|
)
|
|||||
|
Receivables Facility net (repayments) borrowings
|
(22.5
|
)
|
30.0
|
|
(14.3
|
)
|
|||||
|
Increase in credit agreement borrowings
|
5.8
|
|
32.3
|
|
41.7
|
|
|||||
|
Issuances of UGI Common Stock
|
10.9
|
|
36.4
|
|
23.2
|
|
|||||
|
Repurchases of UGI Common Stock
|
(39.8
|
)
|
—
|
|
—
|
|
|||||
|
Issuances of AmeriGas Partners Common Units
|
—
|
|
—
|
|
276.6
|
|
|||||
|
Other
|
11.8
|
|
9.1
|
|
1.8
|
|
|||||
|
Net cash (used) provided by financing activities
|
(475.7
|
)
|
(186.1
|
)
|
1,278.5
|
|
|||||
|
Effect of exchange rate changes on cash
|
(11.9
|
)
|
7.3
|
|
(0.3
|
)
|
|||||
|
Cash and cash equivalents increase
|
$
|
30.2
|
|
$
|
69.4
|
|
$
|
81.4
|
|
||
|
CASH AND CASH EQUIVALENTS
|
|
|
|
||||||||
|
End of year
|
$
|
419.5
|
|
$
|
389.3
|
|
$
|
319.9
|
|
||
|
Beginning of year
|
389.3
|
|
319.9
|
|
238.5
|
|
|||||
|
Increase
|
$
|
30.2
|
|
$
|
69.4
|
|
$
|
81.4
|
|
||
|
SUPPLEMENTAL CASH FLOW INFORMATION
|
|
|
|
||||||||
|
Cash paid for:
|
|
|
|
||||||||
|
Interest
|
$
|
228.3
|
|
$
|
243.6
|
|
$
|
168.8
|
|
||
|
Income taxes
|
$
|
141.6
|
|
$
|
60.0
|
|
$
|
33.3
|
|
||
See accompanying Notes to Consolidated Financial Statements.
F-8
UGI CORPORATION AND SUBSIDIARIES
CONSOLIDATED STATEMENTS OF CHANGES IN EQUITY
(Millions of dollars, except per share amounts)
|
|
Year Ended September 30,
|
||||||||||
|
|
2014
|
2013
|
2012
|
||||||||
|
Common stock, without par value
|
|
|
|
||||||||
|
Balance, beginning of year
|
$
|
1,208.1
|
|
$
|
1,157.7
|
|
$
|
937.4
|
|
||
|
Common stock issued:
|
|
|
|
||||||||
|
Employee and director plans (including (losses) gains on treasury stock transactions), net of tax withheld
|
(16.4
|
)
|
29.7
|
|
13.6
|
|
|||||
|
Dividend reinvestment plan
|
—
|
|
1.4
|
|
2.2
|
|
|||||
|
Excess tax benefits realized on equity-based compensation
|
12.5
|
|
9.4
|
|
1.8
|
|
|||||
|
Equity-based compensation expense
|
11.4
|
|
9.9
|
|
8.3
|
|
|||||
|
Adjustments to reflect change in ownership of AmeriGas Partners, net of tax
|
—
|
|
—
|
|
194.4
|
|
|||||
|
Balance, end of year
|
$
|
1,215.6
|
|
$
|
1,208.1
|
|
$
|
1,157.7
|
|
||
|
Retained earnings
|
|
|
|
||||||||
|
Balance, beginning of year
|
$
|
1,308.3
|
|
$
|
1,156.0
|
|
$
|
1,064.9
|
|
||
|
Net income attributable to UGI Corporation
|
337.2
|
|
278.1
|
|
210.2
|
|
|||||
|
Cash dividends on common stock ($0.791, $0.737 and $0.707 per share, respectively)
|
(136.1
|
)
|
(125.8
|
)
|
(119.1
|
)
|
|||||
|
Balance, end of year
|
$
|
1,509.4
|
|
$
|
1,308.3
|
|
$
|
1,156.0
|
|
||
|
Accumulated other comprehensive income (loss)
|
|
|
|
||||||||
|
Balance, beginning of year
|
$
|
8.4
|
|
$
|
(55.2
|
)
|
$
|
(1.0
|
)
|
||
|
Net gains (losses) on derivative instruments, net of tax
|
21.6
|
|
9.8
|
|
(45.6
|
)
|
|||||
|
Reclassification of net (gains) losses on derivative instruments, net of tax
|
(4.0
|
)
|
15.3
|
|
22.6
|
|
|||||
|
Benefit plans, principally actuarial (losses) gains, net of tax
|
(5.2
|
)
|
5.3
|
|
(11.5
|
)
|
|||||
|
Reclassification of benefit plans actuarial losses and prior service costs, net of tax, to net income
|
1.0
|
|
1.2
|
|
0.7
|
|
|||||
|
Adjustments to reflect change in ownership of AmeriGas Partners, net of tax
|
—
|
|
—
|
|
1.9
|
|
|||||
|
Foreign currency (losses) gains on long-term intra-company transactions, net of tax
|
(19.8
|
)
|
3.2
|
|
(1.7
|
)
|
|||||
|
Foreign currency translation adjustments, net of tax
|
(23.2
|
)
|
28.8
|
|
(20.6
|
)
|
|||||
|
Balance, end of year
|
$
|
(21.2
|
)
|
$
|
8.4
|
|
$
|
(55.2
|
)
|
||
|
Treasury stock
|
|
|
|
||||||||
|
Balance, beginning of year
|
$
|
(32.3
|
)
|
$
|
(28.7
|
)
|
$
|
(27.8
|
)
|
||
|
Common stock issued:
|
|
|
|
||||||||
|
Employee and director plans
|
65.8
|
|
35.2
|
|
6.4
|
|
|||||
|
Dividend reinvestment plan
|
—
|
|
0.8
|
|
0.9
|
|
|||||
|
Repurchases of common stock
|
(39.8
|
)
|
—
|
|
—
|
|
|||||
|
Reacquired common stock - employee and director plans
|
(38.4
|
)
|
(39.6
|
)
|
(8.2
|
)
|
|||||
|
Balance, end of year
|
$
|
(44.7
|
)
|
$
|
(32.3
|
)
|
$
|
(28.7
|
)
|
||
|
Total UGI Corporation stockholders’ equity
|
$
|
2,659.1
|
|
$
|
2,492.5
|
|
$
|
2,229.8
|
|
||
|
Noncontrolling interests
|
|
|
|
||||||||
|
Balance, beginning of year
|
$
|
1,055.4
|
|
$
|
1,085.6
|
|
$
|
213.0
|
|
||
|
Net income (loss) attributable to noncontrolling interests, principally in AmeriGas Partners
|
195.4
|
|
149.5
|
|
(12.5
|
)
|
|||||
|
Net gains (losses) on derivative instruments
|
32.4
|
|
4.6
|
|
(59.8
|
)
|
|||||
|
Reclassification of net (gains) losses on derivative instruments
|
(41.2
|
)
|
38.2
|
|
33.7
|
|
|||||
|
Dividends and distributions
|
(238.0
|
)
|
(226.7
|
)
|
(182.1
|
)
|
|||||
|
AmeriGas Partners Common Unit public offering
|
—
|
|
—
|
|
276.6
|
|
|||||
|
AmeriGas Partners Common Units issued for Heritage Acquisition
|
—
|
|
—
|
|
1,132.6
|
|
|||||
|
Adjustments to reflect change in ownership of AmeriGas Partners
|
—
|
|
—
|
|
(321.4
|
)
|
|||||
|
Other
|
0.1
|
|
4.2
|
|
5.5
|
|
|||||
|
Balance, end of year
|
$
|
1,004.1
|
|
$
|
1,055.4
|
|
$
|
1,085.6
|
|
||
|
Total equity
|
$
|
3,663.2
|
|
$
|
3,547.9
|
|
$
|
3,315.4
|
|
||
See accompanying Notes to Consolidated Financial Statements.
F-9
UGI Corporation and Subsidiaries
Notes to Consolidated Financial Statements
(Millions of dollars and euros, except per share amounts and where indicated otherwise)
Index to Notes
Note 1 — Nature of Operations
Note 2 — Summary of Significant Accounting Policies
Note 3 — Accounting Changes
Note 4 — Acquisitions
Note 5 — Short-term Borrowings
Note 6 — Long-term Debt
Note 7 — Income Taxes
Note 8 — Employee Retirement Plans
Note 9 — Utility Regulatory Assets and Liabilities and Regulatory Matters
Note 10 — Inventories
Note 11 — Property, Plant and Equipment
Note 12 — Goodwill and Intangible Assets
Note 13 — Series Preferred Stock
Note 14 — Common Stock and Equity-Based Compensation
Note 15 — Partnership Distributions and Common Unit Offerings
Note 16 — Commitments and Contingencies
Note 17 — Fair Value Measurements
Note 18 — Derivative Instruments and Hedging Activities
Note 19 — Other Income, Net
Note 20 — Quarterly Data (unaudited)
Note 21 — Segment Information
UGI Corporation (“UGI”) is a holding company that, through subsidiaries and affiliates, distributes, stores, transports and markets energy products and related services. In the United States, we (1) are the general partner and own limited partner interests in a retail propane marketing and distribution business; (2) own and operate natural gas and electric distribution utilities; (3) own all or a portion of electricity generation facilities; and (4) own and operate an energy marketing, midstream infrastructure, storage, natural gas gathering, natural gas production and energy services business. Internationally, we market and distribute propane and other liquefied petroleum gases (“LPG”) in Europe and China. We refer to UGI and its consolidated subsidiaries collectively as “the Company” or “we.”
We conduct a domestic propane marketing and distribution business through AmeriGas Partners, L.P. (“AmeriGas Partners”). AmeriGas Partners is a publicly traded limited partnership that conducts a national propane distribution business through its principal operating subsidiary AmeriGas Propane, L.P. (“AmeriGas OLP”) and, prior to its merger with AmeriGas OLP on July 1, 2013, AmeriGas OLP’s principal operating subsidiary Heritage Operating, L.P. (“HOLP”). In addition, from January 12, 2012, through the date of its merger with and into AmeriGas OLP in August 2012, we also conducted business through AmeriGas OLP’s operating subsidiary, Titan Propane LLC (“Titan LLC”). HOLP and Titan LLC (collectively, “Heritage Propane”) were acquired on January 12, 2012, from Energy Transfer Partners, L.P. (“ETP”) (see
Note 4
for additional information about the acquisition of Heritage Propane). AmeriGas OLP along with HOLP and Titan LLC (prior to their mergers with and into AmeriGas OLP) are referred to herein as the “Operating Partnership.” AmeriGas Partners and AmeriGas OLP are Delaware limited partnerships. UGI’s wholly owned second-tier subsidiary AmeriGas Propane, Inc. (the “General Partner”) serves as the general partner of AmeriGas Partners and AmeriGas OLP. We refer to AmeriGas Partners and its subsidiaries together as the “Partnership” and the General Partner and its subsidiaries, including the Partnership, as “AmeriGas Propane.” At
September 30, 2014
, the General Partner held a
1%
general partner interest and
25.3%
limited partner interest in AmeriGas Partners, and held an effective
27.1%
ownership interest in AmeriGas OLP. Our limited partnership interest in AmeriGas Partners comprises
23,756,882
AmeriGas Partners Common Units (“Common Units”). The General Partner also holds incentive distribution rights that entitle it to receive distribution from AmeriGas Partners under certain circumstances (see
Note 15
). The remaining
73.7%
interest in AmeriGas Partners comprises
69,110,322
Common Units held by the public.
Our wholly owned subsidiary, UGI Enterprises, Inc. (“Enterprises”), through subsidiaries, conducts (1) an LPG distribution business in France, Belgium, the Netherlands and Luxembourg (“Antargaz”); (2) an LPG distribution business in central, northern and
F-10
UGI Corporation and Subsidiaries
Notes to Consolidated Financial Statements
(Millions of dollars and euros, except per share amounts and where indicated otherwise)
eastern Europe (“Flaga”); (3) an LPG distribution business in the United Kingdom (“AvantiGas”); and (4) an LPG distribution business in the Nantong region of China. We refer to our foreign LPG operations collectively as “UGI International.”
Enterprises, through UGI Energy Services, LLC (formerly known as UGI Energy Services, Inc. prior to its merger with and into UGI Energy Services, LLC effective October 1, 2013) and its subsidiaries conduct an energy marketing, midstream infrastructure, storage, natural gas gathering, natural gas production and energy services business primarily in the Mid-Atlantic and Northeast U.S. In addition, UGI Energy Services, LLC’s wholly owned subsidiary, UGI Development Company (“UGID”), owns all or a portion of electricity generation facilities principally located in Pennsylvania. These businesses are referred to herein collectively as “Midstream & Marketing.” UGI Energy Services, LLC and its predecessor company, UGI Energy Services, Inc. are referred to herein as “Energy Services.” Enterprises also conducts heating, ventilation, air-conditioning, refrigeration and electrical contracting businesses in the Mid-Atlantic region through first-tier subsidiaries.
Our natural gas distribution utility business (“Gas Utility”) is conducted through our wholly owned subsidiary, UGI Utilities, Inc. (“UGI Utilities”), and its subsidiaries UGI Penn Natural Gas, Inc. (“PNG”) and UGI Central Penn Gas, Inc. (“CPG”). UGI Utilities, PNG and CPG own and operate natural gas distribution utilities in eastern, northeastern and central Pennsylvania and in a portion of one Maryland county. UGI Utilities also owns and operates an electric distribution utility in northeastern Pennsylvania (“Electric Utility”). UGI Utilities’ natural gas distribution utility is referred to as “UGI Gas.” Gas Utility is subject to regulation by the Pennsylvania Public Utility Commission (“PUC”) and, with respect to a small service territory in one Maryland county, the Maryland Public Service Commission. Electric Utility is subject to regulation by the PUC. Gas Utility and Electric Utility are collectively referred to as “Utilities.”
Basis of Presentation
Our consolidated financial statements are prepared in accordance with accounting principles generally accepted in the United States of America (“GAAP”).
The preparation of financial statements in accordance with GAAP requires management to make estimates and assumptions that affect the reported amounts of assets, liabilities, revenues, expenses and costs. These estimates are based on management’s knowledge of current events, historical experience and various other assumptions that are believed to be reasonable under the circumstances. Accordingly, actual results may be different from these estimates and assumptions.
On July 29, 2014, UGI's Board of Directors approved a
three-for-two
common stock split. The additional shares were distributed September 5, 2014, to shareholders of record on August 22, 2014. All references to shares and per share amounts have been retroactively adjusted to reflect the
three-for-two
stock split.
Certain prior-year amounts have been reclassified to conform to the current-year presentation.
Principles of Consolidation
The consolidated financial statements include the accounts of UGI and its controlled subsidiary companies which, except for the Partnership, are majority owned. We report the public’s interests in the Partnership, and outside ownership interests in other consolidated but less than
100%
-owned subsidiaries, as noncontrolling interests. We eliminate all significant intercompany accounts and transactions when we consolidate. Entities in which we do not have control but have significant influence over operating and financial policies are accounted for by the equity method. Undistributed net earnings of our equity investees included in consolidated retained earnings were not material at
September 30, 2014
. Investments in business entities that are not publicly traded and in which we hold less than
20%
of voting rights are accounted for using the cost method. Such investments are recorded in other assets and totaled
$77.8
and
$82.0
at
September 30, 2014
and
2013
, respectively (including
$17.4
and
$16.4
, respectively, associated with our approximate
3.5%
interest in a private equity partnership that invests in renewable energy companies). Undivided interests in natural gas production assets and an electricity generation facility are consolidated on a proportionate basis.
Effects of Regulation
UGI Utilities accounts for the financial effects of regulation in accordance with the Financial Accounting Standards Board’s (“FASB’s”) guidance in Accounting Standards Codification (“ASC”) Topic “Regulated Operations.” In accordance with this guidance, incurred costs and estimated future expenditures that would otherwise be charged to expense are capitalized and recorded as regulatory assets when it is probable that the incurred costs or estimated future expenditures will be recovered in rates in the
F-11
UGI Corporation and Subsidiaries
Notes to Consolidated Financial Statements
(Millions of dollars and euros, except per share amounts and where indicated otherwise)
future. Similarly, we recognize regulatory liabilities when it is probable that regulators will require customer refunds through future rates or when revenue is collected from customers for expenditures that have not yet been incurred. Regulatory assets and liabilities are classified as current if, upon initial recognition, the entire amount related to that item will be recovered or refunded within a year of the balance sheet date. Generally, regulatory assets are amortized into expense and regulatory liabilities are amortized into income over the period authorized by the regulator. For additional information regarding the effects of rate regulation on our utility operations, see
Note 9
.
Fair Value Measurements
The Company applies fair value measurements on a recurring and, as otherwise required under GAAP, also on a nonrecurring basis. Fair value measurements performed on a recurring basis principally relate to derivative instruments and investments held in supplemental executive retirement plan grantor trusts.
GAAP establishes a fair value hierarchy that prioritizes the inputs to valuation techniques used to measure fair value into three levels. The hierarchy gives the highest priority to quoted prices in active markets for identical assets or liabilities (level 1 measurements) and the lowest priority to unobservable inputs (level 3 measurements). A level within the fair value hierarchy is based on the lowest level of any input that is significant to the fair value measurement.
We use the following fair value hierarchy, which prioritizes the inputs to valuation techniques used to measure fair value into three broad levels:
|
•
|
Level 1 — Quoted prices (unadjusted) in active markets for identical assets and liabilities that we have the ability to access at the measurement date.
|
|
•
|
Level 2 — Inputs other than quoted prices included within Level 1 that are either directly or indirectly observable for the asset or liability, including quoted prices for similar assets or liabilities in active markets, quoted prices for identical or similar assets or liabilities in markets that are not active, inputs other than quoted prices that are observable for the asset or liability, and inputs that are derived from observable market data by correlation or other means.
|
|
•
|
Level 3 — Unobservable inputs for the asset or liability including situations where there is little, if any, market activity for the asset or liability.
|
Fair value is based upon assumptions that market participants would use when pricing an asset or liability, including assumptions about risk and risks inherent in valuation techniques and inputs to valuations. This includes not only the credit standing of counterparties and credit enhancements but also the impact of our own nonperformance risk on our liabilities. We evaluate the need for credit adjustments to our derivative instrument fair values. These credit adjustments were not material to the fair values of our derivative instruments.
Derivative Instruments
Derivative instruments are reported in the Consolidated Balance Sheets at their fair values, unless the derivative instruments qualify for the normal purchase and normal sale (“NPNS”) exemption under GAAP. The accounting for changes in fair value depends upon the purpose of the derivative instrument and whether it is designated and qualifies for hedge accounting.
Certain of our derivative instruments are designated and qualify as cash flow hedges or net investment hedges. For cash flow hedges, changes in the fair values of the derivative instruments are recorded in accumulated other comprehensive income (“AOCI”) or noncontrolling interests, to the extent effective at offsetting changes in the hedged item, until earnings are affected by the hedged item. We discontinue cash flow hedge accounting if the occurrence of the forecasted transaction is determined to be no longer probable. Gains and losses on net investment hedges which relate to our foreign operations are included in AOCI until such foreign net investment is sold or liquidated. Unrealized gains and losses on certain commodity derivative instruments used by Gas Utility and Electric Utility are included in regulatory assets or liabilities in accordance with FASB guidance regarding accounting for rate-regulated entities.
Substantially all of Midstream & Marketing’s commodity derivative instruments do not qualify for, or are not designated as, cash flow hedges. In addition, effective April 1, 2014, AmeriGas Propane determined that on a prospective basis it would not elect cash flow hedge accounting for its commodity derivative instruments. Changes in the fair values of these commodity derivative instruments are reflected in cost of sales or revenues, as appropriate, on the Consolidated Statements of Income.
F-12
UGI Corporation and Subsidiaries
Notes to Consolidated Financial Statements
(Millions of dollars and euros, except per share amounts and where indicated otherwise)
From time to time, the Company may enter into foreign currency exchange transactions to economically hedge the local-currency purchase price of anticipated foreign business acquisitions. These transactions do not qualify for hedge accounting treatment and any changes in fair value are recorded in other income, net.
Cash flows from derivative instruments, other than net investment hedges, are included in cash flows from operating activities. Cash flows from net investment hedges are included in cash flows from investing activities.
For a more detailed description of the derivative instruments we use, our accounting for derivatives, our objectives for using them and other information, see
Note 18
.
Foreign Currency Translation
Balance sheets of international subsidiaries are translated into U.S. dollars using the exchange rate at the balance sheet date. Income statements and equity investee results are translated into U.S. dollars using an average exchange rate for each reporting period. Where the local currency is the functional currency, translation adjustments are recorded in other comprehensive income.
Revenue Recognition
Revenues from the sale of LPG are recognized principally upon delivery. Midstream & Marketing records revenues when energy products are delivered or services are provided to customers. Revenues from the sale of appliances and equipment are recognized at the later of sale or installation. Revenues from repair or maintenance services are recognized upon completion of services.
UGI Utilities’ regulated revenues are recognized as natural gas and electricity are delivered and include estimated amounts for distribution service and commodities rendered but not billed at the end of each month. We reflect the impact of Gas Utility and Electric Utility rate increases or decreases at the time they become effective.
We present revenue-related taxes collected from customers and remitted to taxing authorities, principally sales and use taxes, on a net basis. Electric Utility gross receipts taxes are included in total revenues in accordance with regulatory practice.
LPG Delivery Expenses
Expenses associated with the delivery of LPG to customers of the Partnership and our UGI International operations (including vehicle expenses, expenses of delivery personnel, vehicle repair and maintenance and general liability expenses) are classified as operating and administrative expenses on the Consolidated Statements of Income. Depreciation expense associated with the Partnership and UGI International delivery vehicles is classified in depreciation on the Consolidated Statements of Income.
Income Taxes
AmeriGas Partners and the Operating Partnerships are not directly subject to federal income taxes. Instead, their taxable income or loss is allocated to the individual partners. We record income taxes on (1) our share of the Partnership’s current taxable income or loss and (2) the differences between the book and tax basis of our investment in the Partnership. The Operating Partnership has subsidiaries which operate in corporate form and are directly subject to federal and state income taxes. Legislation in certain states allows for taxation of partnership income and the accompanying financial statements reflect state income taxes resulting from such legislation.
Gas Utility and Electric Utility record deferred income taxes in the Consolidated Statements of Income resulting from the use of accelerated tax depreciation methods based upon amounts recognized for ratemaking purposes. They also record a deferred income tax liability for tax benefits, principally the result of accelerated tax depreciation for state income tax purposes, that are flowed through to ratepayers when temporary differences originate and record a regulatory income tax asset for the probable increase in future revenues that will result when the temporary differences reverse.
We are amortizing deferred investment tax credits related to UGI Utilities’ plant additions over the service lives of the related property. UGI Utilities reduces its deferred income tax liability for the future tax benefits that will occur when investment tax credits, which are not taxable, are amortized. We also reduce the regulatory income tax asset for the probable reduction in future revenues that will result when such deferred investment tax credits amortize. Investment tax credits associated with Midstream & Marketing’s qualifying solar energy property under the Emergency Economic Stabilization Act of 2008 are reflected in income taxes for assets placed in service after Fiscal 2011 and are amortized over the estimated useful life of the property for assets placed in service prior to Fiscal 2012.
F-13
UGI Corporation and Subsidiaries
Notes to Consolidated Financial Statements
(Millions of dollars and euros, except per share amounts and where indicated otherwise)
We record interest on tax deficiencies and income tax penalties in income taxes on the Consolidated Statements of Income. For
Fiscal 2014
,
2013
and
2012
, interest (income) expense recognized in income taxes on the Consolidated Statements of Income was not material.
Earnings Per Common Share
Basic earnings per share attributable to UGI Corporation stockholders reflect the weighted-average number of common shares outstanding. Diluted earnings per share include the effects of dilutive stock options and common stock awards. In the following table, we present shares used in computing basic and diluted earnings per share for
Fiscal 2014
,
Fiscal 2013
and
Fiscal 2012
:
|
(Thousands of shares)
|
2014
|
2013
|
2012
|
||||||
|
Average common shares outstanding for basic computation
|
172,733
|
|
170,885
|
|
168,872
|
|
|||
|
Incremental shares issuable for stock options and common stock awards (a)
|
2,498
|
|
2,397
|
|
1,276
|
|
|||
|
Average common shares outstanding for diluted computation
|
175,231
|
|
173,282
|
|
170,148
|
|
|||
|
(a)
|
For
Fiscal 2014
,
Fiscal 2013
and
Fiscal 2012
, there were approximately
0
shares,
132
shares and
122
shares, respectively, associated with outstanding stock option awards that were not included in the computation of diluted earnings per share above because their effect was antidilutive.
|
Comprehensive Income
Comprehensive income comprises net income and other comprehensive income (loss). Other comprehensive income (loss) principally comprises (1) gains and losses on derivative instruments qualifying as cash flow hedges, net of reclassifications to net income; (2) actuarial gains and losses on postretirement benefit plans, net of associated amortization; and (3) foreign currency translation and intracompany transaction adjustments.
Changes in AOCI during
Fiscal 2014
are as follows:
|
Postretirement
Benefit
Plans
|
Derivative
Instruments
|
Foreign
Currency
|
Total
|
||||||||||||
|
AOCI - September 30, 2013
|
$
|
(16.4
|
)
|
$
|
(26.9
|
)
|
$
|
51.7
|
|
$
|
8.4
|
|
|||
|
Other comprehensive (loss) income before reclassification adjustments (after-tax)
|
(5.2
|
)
|
54.0
|
|
(43.0
|
)
|
5.8
|
|
|||||||
|
Amounts reclassified from AOCI and noncontrolling interests:
|
|||||||||||||||
|
Reclassification adjustments (pre-tax)
|
1.6
|
|
(47.2
|
)
|
—
|
|
(45.6
|
)
|
|||||||
|
Reclassification adjustments tax (expense) benefit
|
(0.6
|
)
|
2.0
|
|
—
|
|
1.4
|
|
|||||||
|
Reclassification adjustments (after-tax)
|
1.0
|
|
(45.2
|
)
|
—
|
|
(44.2
|
)
|
|||||||
|
Other comprehensive (loss) income
|
(4.2
|
)
|
8.8
|
|
(43.0
|
)
|
(38.4
|
)
|
|||||||
|
Add comprehensive loss attributable to noncontrolling interests, principally in AmeriGas Partners
|
—
|
|
8.8
|
|
—
|
|
8.8
|
|
|||||||
|
Other comprehensive (loss) income attributable to UGI
|
(4.2
|
)
|
17.6
|
|
(43.0
|
)
|
(29.6
|
)
|
|||||||
|
AOCI - September 30, 2014
|
$
|
(20.6
|
)
|
$
|
(9.3
|
)
|
$
|
8.7
|
|
$
|
(21.2
|
)
|
|||
For additional information on amounts reclassified from AOCI relating to derivative instruments, see
Note 18
.
Cash and Cash Equivalents
All highly liquid investments with maturities of
three months or less
when purchased are classified as cash equivalents.
Restricted Cash
Restricted cash principally represents those cash balances in our commodity futures brokerage accounts that are restricted from withdrawal.
F-14
UGI Corporation and Subsidiaries
Notes to Consolidated Financial Statements
(Millions of dollars and euros, except per share amounts and where indicated otherwise)
Inventories
Our inventories are stated at the lower of cost or market. We determine cost using an average cost method for natural gas, propane and other LPG; specific identification for appliances; and the first-in, first-out (“FIFO”) method for all other inventories.
Property, Plant and Equipment and Related Depreciation
We record property, plant and equipment at original cost. The amounts assigned to property, plant and equipment of acquired businesses are based upon estimated fair value at date of acquisition.
We record depreciation expense on non-utility plant and equipment on a straight-line basis over estimated economic useful lives ranging from
10
to
40
years for buildings and improvements;
6
to
40
years for storage and customer tanks and cylinders;
25
to
40
years for electricity generation facilities;
25
to
40
years for pipeline and related assets, and
3
to
12
years for vehicles, equipment and office furniture and fixtures. Costs to install Partnership and Antargaz-owned tanks, net of amounts billed to customers, are capitalized and amortized over the estimated period of benefit not exceeding
10
years.
We record depreciation expense for Utilities’ plant and equipment on a straight-line basis over the estimated average remaining lives of the various classes of its depreciable property. Depreciation expense as a percentage of the related average depreciable base for Gas Utility was
2.3%
in
Fiscal 2014
,
2.3%
in
Fiscal 2013
and
2.2%
in
Fiscal 2012
. Depreciation expense as a percentage of the related average depreciable base for Electric Utility was
2.5%
in
Fiscal 2014
,
2.4%
in
Fiscal 2013
and
2.4%
in
Fiscal 2012
. When Utilities retires depreciable utility plant and equipment, we charge the original cost to accumulated depreciation for financial accounting purposes. Costs incurred to retire utility plant and equipment, net of salvage, are recorded in regulatory assets.
We include in property, plant and equipment costs associated with computer software we develop or obtain for use in our businesses. We amortize computer software costs on a straight-line basis over expected periods of benefit generally not exceeding
10
years once the installed software is ready for its intended use.
No depreciation expense is included in cost of sales in the Consolidated Statements of Income.
Goodwill and Intangible Assets
In accordance with GAAP relating to intangible assets, we amortize intangible assets over their estimated useful lives unless we determine their lives to be indefinite. Estimated useful lives of definite-lived intangible assets, primarily consisting of customer relationships and noncompete agreements, do not exceed
15
years. We review definite-lived intangible assets for impairment whenever events or changes in circumstances indicate that the associated carrying amounts may not be recoverable. Determining whether an impairment loss occurred requires comparing the carrying amount to the sum of undiscounted cash flows expected to be generated by the asset. Intangible assets with indefinite lives are not amortized but are tested annually for impairment and written down to fair value as required.
We do not amortize goodwill, but test it at least annually for impairment at the reporting unit level. A reporting unit is an operating segment or one level below an operating segment (a component) if discrete financial information is prepared and regularly reviewed by segment management. Components are aggregated as a single reporting unit if they have similar economic characteristics. In accordance with GAAP, each of our reporting units with goodwill is required to perform impairment tests annually or whenever events or circumstances indicate that the value of goodwill may be impaired. For certain of our reporting units, we assess qualitative factors to determine whether it is more likely than not that the fair value of such reporting unit is less than its carrying amount. For our other reporting units with goodwill, we determine fair values generally based on a weighting of income and market approaches. For purposes of the income approach, fair values are determined based upon the present value of the reporting unit’s estimated future cash flows, including an estimate of the reporting unit’s terminal value based upon these cash flows, discounted at appropriate risk-adjusted rates. We use our internal forecasts to estimate future cash flows which may include estimates of long-term future growth rates based upon our most recent reviews of the long-term outlook for each reporting unit. Cash flow estimates used to establish fair values under our income approach involve management judgments based on a broad range of information and historical results. In addition, external economic and competitive conditions can influence future performance. For purposes of the market approach, we use valuation multiples for companies comparable to our reporting units. The market approach requires judgment to determine the appropriate valuation multiples. We are required to recognize an impairment charge under GAAP if the carrying amount of a reporting unit exceeds its fair value and the carrying amount of the reporting unit’s goodwill exceeds the implied fair value of that goodwill.
F-15
UGI Corporation and Subsidiaries
Notes to Consolidated Financial Statements
(Millions of dollars and euros, except per share amounts and where indicated otherwise)
There were
no
accumulated impairment losses at
September 30, 2014
, and
no
provisions for goodwill or other intangible asset impairments were recorded during
Fiscal 2014
,
Fiscal 2013
or
Fiscal 2012
. No amortization expense of intangible assets is included in cost of sales in the Consolidated Statements of Income (see
Note 12
).
Impairment of Long-Lived Assets and Cost Basis Investments
We evaluate the impairment of long-lived assets whenever events or changes in circumstances indicate that the carrying amount of such assets may not be recoverable. We evaluate recoverability based upon undiscounted future cash flows expected to be generated by such assets.
No
material provisions for impairments were recorded during
Fiscal 2014
,
Fiscal 2013
or
Fiscal 2012
.
We reduce the carrying values of our cost basis investments when we determine that a decline in fair value is other than temporary. During Fiscal 2013, we recorded a pre-tax loss of
$6.3
associated with an other-than-temporary impairment of an investment in a private equity partnership.
Deferred Debt Issuance Costs
Included in other assets on our Consolidated Balance Sheets are net deferred debt issuance costs of
$36.7
and
$39.4
at
September 30, 2014
and
2013
, respectively. We are amortizing these costs over the terms of the related debt.
Refundable Tank and Cylinder Deposits
Included in other noncurrent liabilities on our Consolidated Balance Sheets are customer paid deposits on Antargaz owned tanks and cylinders of
$200.0
and
$214.6
at
September 30, 2014
and
2013
, respectively. Deposits are refundable to customers when the tanks or cylinders are returned in accordance with contract terms.
Environmental Matters
We are subject to environmental laws and regulations intended to mitigate or remove the effects of past operations and improve or maintain the quality of the environment. These laws and regulations require the removal or remedy of the effect on the environment of the disposal or release of certain specified hazardous substances at current or former operating sites.
Environmental reserves are accrued when assessments indicate that it is probable that a liability has been incurred and an amount can reasonably be estimated. Amounts recorded as environmental liabilities on the balance sheets represent our best estimate of costs expected to be incurred or, if no best estimate can be made, the minimum liability associated with a range of expected environmental investigation and remediation costs. Our estimated liability for environmental contamination is reduced to reflect anticipated participation of other responsible parties but is not reduced for possible recovery from insurance carriers. In those instances for which the amount and timing of cash payments associated with environmental investigation and cleanup are reliably determinable, we discount such liabilities to reflect the time value of money. We intend to pursue recovery of incurred costs through all appropriate means, including regulatory relief. UGI Gas is permitted to amortize as removal costs site-specific environmental investigation and remediation costs, net of related third-party payments, associated with Pennsylvania sites. UGI Gas is currently permitted to include in rates, through future base rate proceedings, a
five
-year average of such prudently incurred remediation costs, and CPG and PNG are currently receiving regulatory recovery of estimated environmental investigation and remediation costs associated with Pennsylvania sites. For further information, see
Note 16
.
Employee Retirement Plans
We use a market-related value of plan assets and an expected long-term rate of return to determine the expected return on assets of our pension and other postretirement plans. The market-related value of plan assets, other than equity investments, is based upon fair values. The market-related value of equity investments is calculated by rolling forward the prior-year’s market-related value with contributions, disbursements and the expected return on plan assets. One third of the difference between the expected and the actual value is then added to or subtracted from the expected value to determine the new market-related value (see
Note 8
).
Equity-Based Compensation
All of our equity-based compensation, principally comprising UGI stock options, grants of UGI stock-based equity instruments and grants of AmeriGas Partners equity instruments (together with UGI stock-based equity instruments, “Units”), are measured at fair value on the grant date, date of modification or end of the period, as applicable. Compensation expense is recognized on a
F-16
UGI Corporation and Subsidiaries
Notes to Consolidated Financial Statements
(Millions of dollars and euros, except per share amounts and where indicated otherwise)
straight-line basis over the requisite service period. Depending upon the settlement terms of the awards, all or a portion of the fair value of equity-based awards may be presented as a liability or as equity on our Consolidated Balance Sheets. Equity-based compensation costs associated with the portion of Unit awards classified as equity are measured based upon their estimated fair value on the date of grant or modification. Equity-based compensation costs associated with the portion of Unit awards classified as liabilities are measured based upon their estimated fair value at the grant date and remeasured as of the end of each period.
We have calculated a tax windfall pool using the shortcut method. We record deferred tax assets for awards that we expect will result in deductions on our income tax returns based on the amount of compensation cost recognized and the statutory tax rate in the jurisdiction in which we will receive a deduction. Differences between the deferred tax assets recognized for financial reporting purposes and the actual tax benefit received on the income tax return are recorded in Common Stock (if the tax benefit exceeds the deferred tax asset) or in the Consolidated Statements of Income (if the deferred tax asset exceeds the tax benefit and no tax windfall pool exists from previous awards).
For additional information on our equity-based compensation plans and related disclosures, see
Note 14
.
Adoption of New Accounting Standards
Disclosures about Reclassifications Out of Accumulated Other Comprehensive Income
. In Fiscal 2014, the Company adopted new accounting guidance regarding disclosures for items reclassified out of AOCI. The disclosures required by the new accounting guidance are included in
Note 2
and
Note 18
to Consolidated Financial Statements. The new disclosures are applied prospectively. As this guidance only affects disclosure requirements, the adoption of this guidance did not impact our results of operations, cash flows or financial position.
Disclosures about Offsetting Assets and Liabilities.
Effective October 1, 2013, the Company adopted new accounting guidance requiring entities to disclose both gross and net information about recognized derivative instruments that are offset on the balance sheet as a result of an enforceable master netting arrangement or similar agreement, irrespective of whether they are offset on the balance sheet. The new disclosures are applied retroactively to all periods presented. The required disclosures are included in
Note 18
to Consolidated Financial Statements. As this guidance only affects disclosure requirements, the adoption of this guidance did not impact our results of operations, cash flows or financial position.
Accounting Standards Not Yet Adopted
Revenue Recognition.
In May 2014, the FASB issued Accounting Standards Update (“ASU”) No. 2014-09, “Revenue from Contracts with Customers.” This ASU supersedes the revenue recognition requirements in ASC 605, “Revenue Recognition,” and most industry-specific guidance included in the ASC. The standard requires that an entity recognize revenue to depict the transfer of promised goods or services to customers in an amount that reflects the consideration to which the company expects to be entitled in exchange for those goods or services. This standard is effective for the Company beginning in Fiscal 2018 and allows for either full retrospective adoption or modified retrospective adoption. The Company is in the process of assessing the impact of the adoption of ASU 2014-09 on its results of operations, cash flows and financial position.
Discontinued Operations.
In April 2014, the FASB issued authoritative guidance amending existing requirements for reporting discontinued operations. Under the new guidance, discontinued operations reporting will be limited to disposal transactions that represent strategic shifts having a major effect on operations and financial results. The amended guidance also enhances disclosures and requires assets and liabilities of a discontinued operation to be classified as such for all periods presented in the financial statements. Public entities will apply the amended guidance prospectively to all disposals occurring within annual periods beginning on or after December 15, 2014, and interim periods within those years. The Company will adopt this standard on October 1, 2015. Due to the change in requirements for reporting discontinued operations described above, presentation and disclosure of future disposal transactions after adoption may be different than under current standards.
F-17
UGI Corporation and Subsidiaries
Notes to Consolidated Financial Statements
(Millions of dollars and euros, except per share amounts and where indicated otherwise)
AmeriGas Partners Acquisition of Heritage Propane
On January 12, 2012 (the “Acquisition Date”), AmeriGas Partners completed the acquisition of Heritage Propane from ETP (“Heritage Acquisition”). Total consideration paid for the Heritage Acquisition totaled
$2,604.8
, comprising
$1,472.2
in cash and
29,567,362
AmeriGas Partners Common Units with a fair value of
$1,132.6
. In order to finance the cash portion of the Heritage Acquisition, AmeriGas Finance Corp. and AmeriGas Finance LLC, wholly owned finance subsidiaries of AmeriGas Partners, issued Senior Notes (see
Note 6
).
The Heritage Acquisition was consummated pursuant to a Contribution and Redemption Agreement dated October 15, 2011, as amended (the “Contribution Agreement”), by and among AmeriGas Partners, ETP, Energy Transfer Partners GP, L.P., the general partner of ETP, and Heritage ETC, L.P. (the “Contributor”). The acquired business conducted its propane operations in
41 states
. According to LP-Gas Magazine rankings published on February 1, 2012, Heritage Propane was the third largest retail propane distributor in the United States, delivering over
500 million
gallons to more than
one million
retail propane customers in 2011. The Heritage Acquisition was consistent with our growth strategies, one of which is to grow the Partnership’s core business through acquisitions.
Pursuant to the Contribution Agreement, the Contributor contributed to AmeriGas Partners a
99.999%
limited partner interest in HOLP; a
100%
membership interest in Heritage Operating GP, LLC, a Delaware limited liability company and holder of a
0.001%
general partner interest in HOLP; a
99.99%
limited partner interest in Titan Energy Partners, L.P., a Delaware limited partnership and the sole member of Titan LLC; and a
100%
membership interest in Titan Energy GP, L.L.C., a Delaware limited liability company and holder of a
0.01%
general partner interest in Titan Energy Partners, L.P. As a result of the Heritage Acquisition, the General Partner, in order to maintain its general partner interests in AmeriGas Partners and AmeriGas OLP, contributed
934,327
Common Units to the Partnership having a fair value of
$41.7
. These Common Units were subsequently cancelled.
The final allocation of the purchase price to the assets acquired and liabilities assumed for the Heritage Acquisition is as follows:
|
Assets acquired:
|
||||
|
Current assets
|
$
|
301.4
|
|
|
|
Property, plant & equipment
|
890.2
|
|
||
|
Customer relationships (estimated useful life of 15 years)
|
418.9
|
|
||
|
Trademarks and tradenames (a)
|
91.1
|
|
||
|
Goodwill (a) (b)
|
1,217.7
|
|
||
|
Other assets
|
9.9
|
|
||
|
Total assets acquired
|
$
|
2,929.2
|
|
|
|
Liabilities assumed:
|
||||
|
Current liabilities
|
$
|
(238.1
|
)
|
|
|
Long-term debt
|
(62.9
|
)
|
||
|
Other noncurrent liabilities
|
(23.4
|
)
|
||
|
Total liabilities assumed
|
$
|
(324.4
|
)
|
|
|
Total
|
$
|
2,604.8
|
|
|
|
(a)
|
During Fiscal 2013, the Partnership made correcting adjustments to trademarks and tradenames and goodwill which are not reflected in the table above (see
Note 12
).
|
|
(b)
|
Goodwill associated with the Heritage Acquisition principally results from synergies expected from combining the operations and from assembled workforce. The tax effects of such goodwill will be realized over a
15
-year period.
|
Transaction expenses associated with the Heritage Acquisition, which are included in operating and administrative expenses in the Consolidated Statements of Income, totaled
$5.3
for Fiscal 2012. The results of operations of Heritage Propane are included in the Consolidated Statements of Income since the acquisition. As a result of combining the Heritage Propane operations with the Partnership’s legacy operations, it is impracticable to determine the impact of the Heritage Propane operations on the revenues and earnings of the Company.
F-18
UGI Corporation and Subsidiaries
Notes to Consolidated Financial Statements
(Millions of dollars and euros, except per share amounts and where indicated otherwise)
The following presents unaudited Fiscal
2012
pro forma income statement and earnings per share data as if the Heritage Acquisition had occurred at the beginning of the period:
|
2012
|
||||
|
Revenues
|
$
|
7,013.0
|
|
|
|
Net income attributable to UGI Corporation
|
$
|
208.4
|
|
|
|
Earnings per common share attributable to UGI Corporation stockholders:
|
||||
|
Basic
|
$
|
1.23
|
|
|
|
Diluted
|
$
|
1.22
|
|
|
The unaudited pro forma results of operations reflect Heritage Propane’s historical operating results after giving effect to adjustments directly attributable to the transaction that are expected to have a continuing effect. The unaudited pro forma consolidated results of operations are not necessarily indicative of the results that would have occurred had the Heritage Acquisition occurred on the date indicated nor are they necessarily indicative of future operating results.
Other Acquisitions
During Fiscal 2014, Energy Services acquired a retail natural gas marketing business located principally in western Pennsylvania from EQT Energy, LLC, an affiliate of EQT Corporation, for cash consideration of
$20
and AmeriGas OLP acquired several retail propane distribution businesses for
$15.7
in cash.
During Fiscal 2013, Flaga acquired BP’s LPG distribution business in Poland for total cash consideration of approximately
$36
which Flaga financed with cash proceeds from the issuance of long-term debt (see
Note 6
); AmeriGas OLP acquired
two
domestic retail propane distribution businesses for total cash consideration of
$20
; and Energy Services acquired a non-operating working interest in natural gas acreage in the Marcellus Shale region of Pennsylvania for approximately
$23
in cash.
During Fiscal 2012, AmeriGas OLP acquired several retail propane distribution businesses for
$13.5
in cash.
Short-term borrowings are comprised of the following at September 30:
|
2014
|
2013
|
||||||
|
Credit Agreements:
|
|||||||
|
AmeriGas Propane
|
$
|
109.0
|
|
$
|
116.9
|
|
|
|
UGI International
|
8.0
|
|
6.5
|
|
|||
|
UGI Utilities
|
86.3
|
|
17.5
|
|
|||
|
Energy Services
|
—
|
|
57.0
|
|
|||
|
Energy Services Accounts Receivable Securitization Facility
|
7.5
|
|
30.0
|
|
|||
|
Total short-term borrowings
|
$
|
210.8
|
|
$
|
227.9
|
|
|
AmeriGas Propane
In June 2014, AmeriGas OLP entered into an Amended and Restated Credit Agreement (“AmeriGas Credit Agreement”) with a group of banks which provides for borrowings up to
$525
(including a sublimit of
$125
for letters of credit) and expires in June 2019. The AmeriGas Credit Agreement amends and restates AmeriGas OLP’s prior credit agreement entered into in June 2011, as amended from time to time. The AmeriGas Credit Agreement permits AmeriGas OLP to borrow at prevailing interest rates, including the base rate, defined as the higher of the Federal Funds rate plus
0.50%
or the agent bank’s prime rate, or at a one-week, one-, two-, three-, or six-month Eurodollar Rate, as defined in the AmeriGas Credit Agreement, plus a margin. Under the AmeriGas Credit Agreement, the applicable margin on base rate borrowings ranges from
0.50%
to
1.50%
; the applicable margin on Eurodollar Rate borrowings ranges from
1.50%
to
2.50%
; and the facility fee ranges from
0.30%
to
0.45%
. The aforementioned margins and facility fees are dependent upon AmeriGas Partners’ ratio of debt to earnings before interest expense, income taxes, depreciation and amortization (each as defined in the AmeriGas Credit Agreement).
F-19
UGI Corporation and Subsidiaries
Notes to Consolidated Financial Statements
(Millions of dollars and euros, except per share amounts and where indicated otherwise)
The weighted-average interest rates on AmeriGas OLP borrowings under the AmeriGas Credit Agreement and the prior credit agreement at
September 30, 2014
and
2013
, were
2.16%
and
2.69%
, respectively. At
September 30, 2014
and
2013
, issued and outstanding letters of credit, which reduce available borrowings under these credit agreements, totaled
$64.7
and
$53.7
, respectively.
Restrictive Covenants.
The AmeriGas Credit Agreement restricts the incurrence of additional indebtedness and also restricts certain liens, guarantees, investments, loans and advances, payments, mergers, consolidations, asset transfers, transactions with affiliates, sales of assets, acquisitions and other transactions. The AmeriGas Credit Agreement requires that AmeriGas OLP and AmeriGas Partners maintain ratios of total indebtedness to EBITDA, as defined, below certain thresholds. In addition, the Partnership must maintain a minimum ratio of EBITDA to interest expense, as defined and as calculated on a rolling four-quarter basis. Generally, as long as no default exists or would result therefrom, AmeriGas OLP is permitted to make cash distributions not more frequently than quarterly in an amount not to exceed available cash, as defined, for the immediately preceding calendar quarter.
UGI International
Antargaz has a Senior Facilities Agreement comprising a variable rate term loan (see
Note 6
) and a
€40
credit facility (“Senior Facilities Agreement Credit Facility”). Borrowings under the Senior Facilities Agreement Credit Facility bear interest at one-, two-, three- or six-month euribor, plus a margin. The margin on the Senior Facilities Agreement Credit Facility borrowings (which range from
1.75%
to
2.50%
) is dependent upon the ratio of Antargaz’ total net debt to EBITDA, each as defined in the Senior Facilities Agreement. Borrowings under the Senior Facilities Agreement Credit Facility are collateralized by substantially all of Antargaz’ shares in its subsidiaries and by substantially all of its accounts receivables. There were
no
amounts outstanding under the Senior Facilities Agreement Credit Facility at
September 30, 2014
or
2013
.
At
September 30, 2014
, Flaga has
two
principal working capital facilities (the “Flaga Credit Agreements”) comprising (1) a
€46
multi-currency working capital facility which includes an uncommitted
€6
overdraft facility (the “Multi-Currency Working Capital Facility”) and (2) a euro-denominated working capital facility that provides for borrowings and issuances of guarantees totaling
€12
(the “Euro Working Capital Facility”). Both the Multi-Currency Working Capital Facility and the Euro Working Capital Facility are currently scheduled to expire in December 2014. At
September 30, 2014
, there were
no
borrowings outstanding under the Flaga Credit Agreements. At
September 30, 2013
, borrowings outstanding under the Flaga Credit Agreements were
€0.2
(
$0.3
).
Borrowings under the Flaga Credit Agreements generally bear interest at market rates (a daily euro-based rate or three-month euribor rates) plus a margin. The weighted-average interest rate on borrowings under the Flaga Credit Agreements at
September 30, 2013
was
4.21%
. Issued and outstanding letters of credit, which reduce available borrowings under the Flaga Credit Agreements, totaled
€32.3
(
$40.8
) and
€28.6
(
$38.7
) at
September 30, 2014
and
2013
, respectively.
Flaga also has certain in-country uncommitted overdraft facilities which it uses, from time to time, to fund short-term working capital needs. At
September 30, 2014
and
2013
, borrowings outstanding under these overdraft facilities totaled
€6.3
(
$8.0
) and
€4.6
(
$6.2
), respectively.
Restrictive Covenants and Guarantees.
The Senior Facilities Agreement restricts the ability of Antargaz to, among other things, incur additional indebtedness, make investments, incur liens, and effect mergers, consolidations and sales of assets, and requires Antargaz to maintain a ratio of net debt to EBITDA on a French generally accepted accounting basis, as defined in the agreement, that shall not exceed
3.50
to 1.00. Under this agreement, Antargaz is generally permitted to make restricted payments, such as dividends, if no event of default exists or would exist upon payment of such restricted payment. UGI has guaranteed up to
€100
of payments between the variable rate term loan (see
Note 6
) and the Senior Facilities Agreement Credit Facility.
The Flaga working capital facilities are guaranteed by UGI. In addition, under certain conditions regarding changes in certain financial ratios of UGI, the lending banks may accelerate repayment of the debt.
UGI Utilities
UGI Utilities has an unsecured credit agreement (“UGI Utilities Credit Agreement”) with a group of banks providing for borrowings up to
$300
(including a
$100
sublimit for letters of credit) which expires in October 2015. UGI Utilities may borrow at various prevailing market interest rates, including LIBOR and the banks’ prime rate, plus a margin. The margin on such borrowings ranges from
0.0%
to
2.0%
and is based upon the credit ratings of certain indebtedness of UGI Utilities. The weighted-average interest rates on UGI Utilities Credit Agreement borrowings at
September 30, 2014
and
2013
were
1.03%
and
1.18%
, respectively. Issued and outstanding letters of credit, which reduce available borrowings under the UGI Utilities Credit Agreement, totaled
$2.0
and
$2.0
at
September 30, 2014
and
2013
, respectively.
F-20
UGI Corporation and Subsidiaries
Notes to Consolidated Financial Statements
(Millions of dollars and euros, except per share amounts and where indicated otherwise)
Restrictive Covenants.
The UGI Utilities Credit Agreement requires UGI Utilities not to exceed a ratio of Consolidated Debt to Consolidated Total Capital, as defined, of
0.65
to 1.00.
Energy Services
Credit Agreement.
Energy Services has an unsecured credit agreement (“Energy Services Credit Agreement”) with a group of lenders providing for borrowings of up to
$240
(including a
$50
sublimit for letters of credit) which expires in June 2016. The Energy Services Credit Agreement can be used for general corporate purposes of Energy Services and its subsidiaries. Energy Services may not pay a dividend unless, after giving effect to such dividend payment, the ratio of Consolidated Total Indebtedness to EBITDA, each as defined in the Energy Services Credit Agreement, does not exceed
2.25
to 1.00. At
September 30, 2014
, there were
no
borrowings outstanding under the Energy Services Credit Agreement. At
September 30, 2013
, borrowings outstanding under the Energy Services Credit Agreement were
$57.0
.
Borrowings under the Energy Services Credit Agreement bear interest at either (i) a rate derived from LIBOR (the “LIBO Rate”) plus
2.5%
or (ii) the Alternate Base Rate plus
1.5%
. The Alternate Base Rate (as defined in the Energy Services Credit Agreement) is generally the greater of (a) the Agent Bank’s prime rate, (b) the federal funds rate plus
0.50%
and (c) the one-month LIBO Rate plus
1.0%
. The weighted-average interest rate on Energy Services Credit Agreement borrowings at
September 30, 2013
was
2.91%
. The Energy Services Credit Agreement is guaranteed by certain subsidiaries of Energy Services.
Restrictive Covenants.
The Energy Services Credit Agreement restricts the ability of Energy Services to dispose of assets, effect certain consolidations or mergers, incur indebtedness and guaranty obligations, create liens, make acquisitions or investments, make certain dividend or other distributions and make any material changes to the nature of its businesses. In addition, the Energy Services Credit Agreement requires Energy Services to not exceed a ratio of Consolidated Total Indebtedness, as defined, to Consolidated EBITDA, as defined; a minimum ratio of Consolidated EBITDA to Consolidated Interest Expense, as defined; a maximum ratio of Consolidated Total Indebtedness to Consolidated Total Capitalization, as defined, at any time when Consolidated Total Indebtedness is greater than
$250
; and a minimum Consolidated Net Worth, as defined, of
$200
.
Accounts Receivable Securitization Facility.
Energy Services has a receivables purchase facility (“Receivables Facility”) with an issuer of receivables-backed commercial paper currently scheduled to expire in October 2015. The Receivables Facility, as amended, provides Energy Services with the ability to borrow up to
$150
of eligible receivables during the period November to May, and up to
$75
of eligible receivables during the period June to October. Energy Services uses the Receivables Facility to fund working capital, margin calls under commodity futures contracts, capital expenditures, dividends and for general corporate purposes.
Under the Receivables Facility, Energy Services transfers, on an ongoing basis and without recourse, its trade accounts receivable to its wholly owned, special purpose subsidiary, Energy Services Funding Corporation (“ESFC”), which is consolidated for financial statement purposes. ESFC, in turn, has sold and, subject to certain conditions, may from time to time sell, an undivided interest in some or all of the receivables to a major bank and, prior to October 1, 2013, a commercial paper conduit of the bank. ESFC was created and has been structured to isolate its assets from creditors of Energy Services and its affiliates, including UGI. Trade receivables sold to the bank or, prior to October 1, 2013, the commercial paper conduit, remain on the Company’s balance sheet and the Company reflects a liability equal to the amount advanced by the bank or the commercial paper conduit. The Company records interest expense on amounts owed to the bank or the commercial paper conduit. Energy Services continues to service, administer and collect trade receivables on behalf of the bank or commercial paper issuer, as applicable.
During Fiscal
2014
, Fiscal
2013
and Fiscal
2012
, Energy Services transferred trade receivables totaling
$1,260.6
,
$975.3
and
$836.0
, respectively, to ESFC. During Fiscal
2014
, Fiscal
2013
and Fiscal
2012
, ESFC sold an aggregate
$354.0
,
$291.0
and
$286.0
, respectively, of undivided interests in its trade receivables to the bank or the commercial paper conduit. At
September 30, 2014
, the outstanding balance of ESFC trade receivables was
$46.4
of which
$7.5
was sold to the bank. At September 30,
2013
, the outstanding balance of ESFC trade receivables was
$55.0
of which
$30.0
amount was sold to the commercial paper conduit. Losses on sales of receivables to the bank or the commercial paper conduit during Fiscal
2014
, Fiscal
2013
and Fiscal
2012
, which amounts are included in interest expense on the Consolidated Statements of Income, totaled
$0.6
,
$0.7
and
$1.0
, respectively.
F-21
UGI Corporation and Subsidiaries
Notes to Consolidated Financial Statements
(Millions of dollars and euros, except per share amounts and where indicated otherwise)
Long-term debt comprises the following at September 30:
|
2014
|
2013
|
||||||
|
AmeriGas Propane:
|
|
|
|||||
|
AmeriGas Partners Senior Notes:
|
|
|
|||||
|
7.00%, due May 2022
|
$
|
980.8
|
|
$
|
980.8
|
|
|
|
6.75%, due May 2020
|
550.0
|
|
550.0
|
|
|||
|
6.50%, due May 2021
|
270.0
|
|
270.0
|
|
|||
|
6.25%, due August 2019
|
450.0
|
|
450.0
|
|
|||
|
HOLP Senior Secured Notes
|
26.5
|
|
32.0
|
|
|||
|
Other
|
14.4
|
|
17.3
|
|
|||
|
Total AmeriGas Propane
|
2,291.7
|
|
2,300.1
|
|
|||
|
UGI International:
|
|
|
|||||
|
Antargaz Senior Facilities term loan, due through March 2016
|
432.0
|
|
514.0
|
|
|||
|
Flaga term loan, due September 2016
|
52.0
|
|
52.0
|
|
|||
|
Flaga term loan, due through September 2016
|
50.5
|
|
54.1
|
|
|||
|
Flaga term loan, due October 2016
|
24.1
|
|
25.8
|
|
|||
|
Flaga term loan, due through June 2014
|
—
|
|
1.9
|
|
|||
|
Other
|
6.4
|
|
6.6
|
|
|||
|
Total UGI International
|
565.0
|
|
654.4
|
|
|||
|
UGI Utilities:
|
|
|
|||||
|
Term Loan Credit Agreement
|
—
|
|
175.0
|
|
|||
|
Senior Notes:
|
|||||||
|
5.75%, due September 2016
|
175.0
|
|
175.0
|
|
|||
|
4.98%, due March 2044
|
175.0
|
|
—
|
|
|||
|
6.21%, due September 2036
|
100.0
|
|
100.0
|
|
|||
|
Medium-Term Notes:
|
|||||||
|
5.16%, due May 2015
|
20.0
|
|
20.0
|
|
|||
|
7.37%, due October 2015
|
22.0
|
|
22.0
|
|
|||
|
5.64%, due December 2015
|
50.0
|
|
50.0
|
|
|||
|
6.17%, due June 2017
|
20.0
|
|
20.0
|
|
|||
|
7.25%, due November 2017
|
20.0
|
|
20.0
|
|
|||
|
5.67%, due January 2018
|
20.0
|
|
20.0
|
|
|||
|
6.50%, due August 2033
|
20.0
|
|
20.0
|
|
|||
|
6.13%, due October 2034
|
20.0
|
|
20.0
|
|
|||
|
Total UGI Utilities
|
642.0
|
|
642.0
|
|
|||
|
Other
|
12.1
|
|
12.9
|
|
|||
|
Total long-term debt
|
3,510.8
|
|
3,609.4
|
|
|||
|
Less: current maturities
|
(77.2
|
)
|
(67.2
|
)
|
|||
|
Total long-term debt due after one year
|
$
|
3,433.6
|
|
$
|
3,542.2
|
|
|
F-22
UGI Corporation and Subsidiaries
Notes to Consolidated Financial Statements
(Millions of dollars and euros, except per share amounts and where indicated otherwise)
Scheduled principal repayments of long-term debt due in fiscal years
2015
to
2019
follow:
|
2015
|
2016
|
2017
|
2018
|
2019
|
|||||||||||||||
|
AmeriGas Propane
|
$
|
11.0
|
|
$
|
7.6
|
|
$
|
5.6
|
|
$
|
4.9
|
|
$
|
454.5
|
|
||||
|
UGI Utilities
|
20.0
|
|
247.0
|
|
20.0
|
|
40.0
|
|
—
|
|
|||||||||
|
UGI International
|
45.0
|
|
492.9
|
|
25.4
|
|
0.9
|
|
0.7
|
|
|||||||||
|
Other
|
0.7
|
|
0.7
|
|
0.7
|
|
0.8
|
|
0.8
|
|
|||||||||
|
Total
|
$
|
76.7
|
|
$
|
748.2
|
|
$
|
51.7
|
|
$
|
46.6
|
|
$
|
456.0
|
|
||||
AmeriGas Propane
In order to finance the cash portion of the Heritage Acquisition, on January 12, 2012, AmeriGas Finance Corp. and AmeriGas Finance LLC, wholly owned finance subsidiaries of AmeriGas Partners (the “Issuers”), issued
$550
principal amount of
6.75%
Notes due May 2020 and
$1,000
principal amount of
7.00%
Notes due May 2022. The
6.75%
Notes and the
7.00%
Notes are fully and unconditionally guaranteed on a senior unsecured basis by AmeriGas Partners. The Issuers have the right to redeem the
6.75%
Notes, in whole or in part, at any time on or after May 20, 2016, and to redeem the
7.00%
Notes, in whole or in part, at any time on or after May 20, 2017, subject to certain restrictions. A premium applies to redemptions of the
6.75%
Notes and
7.00%
Notes through May 2018 and May 2020, respectively. On or prior to May 20, 2015, the Issuers may also redeem, at a premium and subject to certain restrictions, up to
35%
of each of the
6.75%
Notes and the
7.00%
Notes with the proceeds of an AmeriGas Partners registered public equity offering. The 6.75% Notes and the 7.00% Notes and the guarantees rank equal in right of payment with all of AmeriGas Partners’ existing Senior Notes. In connection with the Heritage Acquisition, AmeriGas Partners, AmeriGas Finance Corp., AmeriGas Finance LLC and UGI entered into a Contingent Residual Support Agreement (“CRSA”) with ETP pursuant to which ETP will provide contingent, residual support of
$1,500
of debt (“Supported Debt” as defined in the CRSA).
On March 28, 2012, AmeriGas Partners announced that holders of approximately
$383.5
in aggregate principal amount of outstanding
6.50%
Senior Notes due May 2021 (the “
6.50%
Notes”), representing approximately
82%
of the total
$470
principal amount outstanding, had validly tendered their notes in connection with the Partnership’s March 14, 2012, offer to purchase for cash up to
$200
of the
6.50%
Notes. Tendered
6.50%
Notes in the amount of
$200
were redeemed on March 28, 2012, at an effective price of
105%
using an approximate proration factor of
52.3%
of total notes tendered. During June 2012, AmeriGas Partners repurchased approximately
$19.2
aggregate principal amount of outstanding
7.00%
Notes. The Partnership recorded a net loss of
$13.3
on these extinguishments of debt which amount is reflected on the Fiscal 2012 Consolidated Statement of Income under the caption loss on extinguishments of debt. The net loss reduced net income attributable to UGI Corporation by
$2.2
during Fiscal 2012.
The Partnership’s total long-term debt at
September 30, 2014
, includes $
26.5
of HOLP Senior Secured Notes (including unamortized premium of
$3.1
). At
September 30, 2014
, the face interest rates on the HOLP Notes range from
7.89%
to
8.87%
with an effective interest rate of
6.75%
. The HOLP Senior Secured Notes are collateralized by AmeriGas OLP’s receivables, contracts, equipment, inventory, general intangibles and cash.
Restrictive Covenants.
The AmeriGas Partners Senior Notes restrict the ability of the Partnership and AmeriGas OLP to, among other things, incur additional indebtedness, make investments, incur liens, issue preferred interests, prepay subordinated indebtedness, and effect mergers, consolidations and sales of assets. Under the AmeriGas Partners Senior Notes Indentures, AmeriGas Partners is generally permitted to make cash distributions equal to Available Cash, as defined, as of the end of the immediately preceding quarter, if certain conditions are met. At
September 30, 2014
, these restrictions did not limit the amount of Available Cash. See
Note 15
for definition of Available Cash included in the Fourth Amended and Restated Agreement of Limited Partnership of AmeriGas Partners, L.P. (“Partnership Agreement”).
The HOLP Senior Secured Notes contain restrictive covenants including the maintenance of financial covenants and limitations on the disposition of assets, changes in ownership, additional indebtedness, restrictive payments and the creation of liens. The financial covenants require AmeriGas OLP to maintain a ratio of Consolidated Funded Indebtedness to Consolidated EBITDA (as defined) below certain thresholds and to maintain a minimum ratio of Consolidated EBITDA to Consolidated Interest Expense (as defined).
F-23
UGI Corporation and Subsidiaries
Notes to Consolidated Financial Statements
(Millions of dollars and euros, except per share amounts and where indicated otherwise)
UGI International
At
September 30, 2014
, Antargaz has a
€342
(
$432.0
) variable-rate term loan under its Senior Facilities Agreement with a consortium of banks. Scheduled maturities under the term loan are
€34.2
(
$43.2
) due May 2015, and
€307.8
(
$388.8
) due March 2016. Term loan borrowings bear interest at one-, two-, three- or six-month euribor, plus a margin, as defined by the Senior Facilities Agreement. The margin on the term loan (which range from
1.75%
to
2.50%
) is dependent upon the ratio of Antargaz’ total net debt to EBITDA, each as defined in the Senior Facilities Agreement. Antargaz has entered into pay-fixed, receive-variable interest rate swaps to fix the underlying euribor rate of interest on the term loan at an average rate of approximately
2.45%
through September 2015 and, thereafter, at a rate of
3.71%
through the date of the term loan’s final maturity in March 2016. At
September 30, 2014
and
2013
, the effective interest rates on Antargaz’ term loan were
4.79%
and
4.41%
, respectively. The Senior Facilities Agreement is collateralized by substantially all of Antargaz’ shares in its subsidiaries and by substantially all of its accounts receivables.
In order to finance the purchase of BP’s LPG distribution business in Poland in September 2013, Flaga entered into a
$52
U.S. dollar-denominated three-year term loan which matures in September 2016. The
$52
loan bears interest at one- to twelve-month euribor rates (as chosen by Flaga from time to time) plus a margin of
1.25%
. Flaga has effectively fixed the euribor component of the interest rate, and has effectively fixed the U.S. dollar value of the interest and principal payments payable under the
$52
loan, by entering into a cross-currency swap arrangement with a bank. At
September 30, 2014
and
2013
, the effective interest rate on the
$52
loan was
1.82%
.
Flaga has a
€19.1
(
$24.1
) euro-based variable-rate term loan that matures in October 2016. The
€19.1
term loan bears interest at three-month euribor rates plus a margin. The margin on such borrowings ranges from
1.175
% to
2.525
% and is based upon certain consolidated equity, return on assets and debt to EBITDA ratios. Flaga has effectively fixed the euribor component of the interest rate on this term loan at
1.79
% by entering into an interest rate swap agreement. The effective interest rates on this term loan at
September 30, 2014
and
2013
, were
3.40%
and
3.85%
, respectively.
Flaga also has a
€40
(
$50.5
) euro-based term loan agreement under which
€26.7
(
$33.7
) matures in August 2016 and
€13.3
(
$16.8
) matures in September 2016. The term loans bear interest at one- to twelve-month euribor rates (as chosen by Flaga from time to time) plus margins. The margins on such borrowings range from
1.125%
to
2.55%
and are based upon certain consolidated equity, return on assets and debt to EBITDA ratios. Flaga has effectively fixed the euribor component of the interest rates on these term loans through September 2016 at
2.68%
by entering into an interest rate swap agreement. The effective interest rates on these term loans at September 30, 2014 and 2013, were
4.25%
and
4.68%
, respectively.
Restrictive Covenants and Guarantees.
The Senior Facilities Agreement restricts the ability of Antargaz to, among other things, incur additional indebtedness, make investments, incur liens, and effect mergers, consolidations and sales of assets, and requires Antargaz to maintain a ratio of net debt to EBITDA on a French generally accepted accounting basis, as defined in the agreement, that shall not exceed
3.50
to 1.00. Under this agreement, Antargaz is generally permitted to make restricted payments, such as dividends, if no event of default exists or would exist upon payment of such restricted payment. UGI has guaranteed up to
€100
of payments between the variable-rate term loan and the Senior Facilities Agreement Credit Facility (see
Note 5
).
The Flaga term loans, interest rate and cross currency agreements are guaranteed by UGI. In addition, under certain conditions regarding changes in certain financial ratios of UGI, the lending banks may accelerate repayment of the debt.
UGI Utilities
In March 2014, UGI Utilities issued in a private placement
$175
of
4.98%
Senior Notes due March 2044 (“4.98% Senior Notes”). The 4.98% Senior Notes were issued pursuant to a Note Purchase Agreement dated October 30, 2013, between UGI Utilities and certain note purchasers. The 4.98% Senior Notes are unsecured and rank equally with UGI Utilities’ existing outstanding senior debt. The net proceeds from the sale of the 4.98% Senior Notes were used to repay
$175
of borrowings under UGI Utilities’
364
-day Term Loan Credit Agreement. Because the Company had the intent and ability to refinance the Term Loan Credit Agreement on a long-term basis as of September 30, 2013, amounts outstanding under the Term Loan Credit Agreement were classified as long-term on the 2013 Consolidated Balance Sheet.
Restrictive Covenants.
The 4.98% Senior Notes include the usual and customary covenants for similar type notes including, among others, maintenance of existence, payment of taxes when due, compliance with laws and maintenance of insurance. The 4.98% Senior Notes also contain restrictive and financial covenants including a requirement that UGI Utilities not exceed a ratio of Consolidated Debt to Consolidated Total Capital, as defined therein, of
0.65
to 1.00.
F-24
UGI Corporation and Subsidiaries
Notes to Consolidated Financial Statements
(Millions of dollars and euros, except per share amounts and where indicated otherwise)
Restricted Net Assets
At
September 30, 2014
, the amount of net assets of UGI’s consolidated subsidiaries that was restricted from transfer to UGI under debt agreements, subsidiary partnership agreements and regulatory requirements under foreign laws totaled approximately
$1,600
.
Income before income taxes comprises the following:
|
2014
|
2013
|
2012
|
|||||||||
|
Domestic
|
$
|
699.2
|
|
$
|
494.1
|
|
$
|
245.6
|
|
||
|
Foreign
|
68.6
|
|
96.3
|
|
59.0
|
|
|||||
|
Total income before income taxes
|
$
|
767.8
|
|
$
|
590.4
|
|
$
|
304.6
|
|
||
The provisions for income taxes consist of the following:
|
2014
|
2013
|
2012
|
|||||||||
|
Current expense (benefit):
|
|||||||||||
|
Federal
|
$
|
102.4
|
|
$
|
53.3
|
|
$
|
(10.4
|
)
|
||
|
State
|
30.7
|
|
25.1
|
|
11.2
|
|
|||||
|
Foreign
|
37.0
|
|
37.3
|
|
18.8
|
|
|||||
|
Investment tax credit
|
(1.6
|
)
|
(1.6
|
)
|
(2.9
|
)
|
|||||
|
Total current expense
|
168.5
|
|
114.1
|
|
16.7
|
|
|||||
|
Deferred expense (benefit):
|
|||||||||||
|
Federal
|
61.9
|
|
54.6
|
|
81.7
|
|
|||||
|
State
|
7.8
|
|
(0.7
|
)
|
7.0
|
|
|||||
|
Foreign
|
(2.7
|
)
|
(4.9
|
)
|
1.8
|
|
|||||
|
Investment tax credit amortization
|
(0.3
|
)
|
(0.3
|
)
|
(0.3
|
)
|
|||||
|
Total deferred expense
|
66.7
|
|
48.7
|
|
90.2
|
|
|||||
|
Total income tax expense
|
$
|
235.2
|
|
$
|
162.8
|
|
$
|
106.9
|
|
||
Federal income taxes for
Fiscal 2014
,
Fiscal 2013
and
Fiscal 2012
are net of foreign tax credits of
$12.1
,
$34.9
and
$5.2
, respectively.
A reconciliation from the U.S. federal statutory tax rate to our effective tax rate is as follows:
|
2014
|
2013
|
2012
|
||||||
|
U.S. federal statutory tax rate
|
35.0
|
%
|
35.0
|
%
|
35.0
|
%
|
||
|
Difference in tax rate due to:
|
||||||||
|
Noncontrolling interests not subject to tax
|
(9.0
|
)
|
(8.7
|
)
|
1.2
|
|
||
|
State income taxes, net of federal benefit
|
3.4
|
|
3.4
|
|
4.0
|
|
||
|
Valuation allowance adjustments
|
—
|
|
(0.5
|
)
|
(1.5
|
)
|
||
|
Effects of foreign operations
|
1.0
|
|
(1.8
|
)
|
(3.3
|
)
|
||
|
Other, net
|
0.2
|
|
0.2
|
|
(0.3
|
)
|
||
|
Effective tax rate
|
30.6
|
%
|
27.6
|
%
|
35.1
|
%
|
||
In December 2013, the French Parliament approved the Finance Bill for 2014 and amended the Finance Bill for 2013 (collectively, the “Finance Bills”). Among other things, the Finance Bills limit Antargaz’ ability to deduct certain interest expense for income tax purposes and temporarily increases the corporate surtax rate for a period of
two years
. Based upon our review of the Finance
F-25
UGI Corporation and Subsidiaries
Notes to Consolidated Financial Statements
(Millions of dollars and euros, except per share amounts and where indicated otherwise)
Bills and interpretive guidance, provisions of the Finance Bills associated with the deductibility of certain interest expense at Antargaz apply retroactively to such interest expense incurred during Fiscal 2013. In December 2013, the Company recorded additional income taxes of
$5.7
to reflect the effects of the retroactive provisions of the Finance Bills and is included in effects of foreign operations in the effective tax rate table above.
The effects of foreign operations in the table above for Fiscal 2012 reflects the impact of tax efficient structuring of certain of our international operations and, as a result of the Fiscal 2012 Shell Transaction, also reflects a greater proportion of pretax income in countries in which the statutory income tax rate is less than the U.S. statutory tax rate. The tax restructuring of certain of our international operations also permitted us to reduce our foreign tax credit valuation allowance by
$4.6
during Fiscal 2012 which is included as a valuation allowance adjustment in the table above.
Earnings of the Company’s foreign subsidiaries are generally subject to U.S. taxation upon repatriation to the U.S. and the Company’s tax provision reflects the related incremental U.S. tax except for certain foreign subsidiaries whose unremitted earnings are considered to be indefinitely reinvested. At
September 30, 2014
, unremitted earnings of foreign subsidiaries of approximately
$42.7
were deemed to be indefinitely reinvested. No deferred tax liability has been recognized with regard to the remittance of such earnings. Because of the availability of U.S. foreign tax credits, it is likely no U.S. tax would be due if such earnings were repatriated.
Pennsylvania utility ratemaking practice permits the flow through to ratepayers of state tax benefits resulting from accelerated tax depreciation. For
Fiscal 2014
,
Fiscal 2013
and
Fiscal 2012
, the beneficial effects of state tax flow through of accelerated depreciation reduced income tax expense by
$2.0
,
$1.5
and
$3.2
, respectively. The higher state tax flow through amount in Fiscal 2012 reflects the impact of 2010 U.S. Federal tax legislation that allowed taxpayers to fully deduct qualifying capital expenditures incurred after September 8, 2010, through the end of calendar 2011, when such property was placed in service before 2012. This legislation was also permitted for Pennsylvania state corporate income tax purposes.
Deferred tax liabilities (assets) comprise the following at September 30:
|
2014
|
2013
|
||||||
|
Excess book basis over tax basis of property, plant and equipment
|
$
|
675.7
|
|
$
|
626.9
|
|
|
|
Investment in AmeriGas Partners
|
325.1
|
|
313.0
|
|
|||
|
Intangible assets and goodwill
|
53.0
|
|
65.1
|
|
|||
|
Utility regulatory assets
|
110.0
|
|
101.6
|
|
|||
|
Foreign currency translation adjustment
|
—
|
|
9.5
|
|
|||
|
Other
|
3.5
|
|
2.7
|
|
|||
|
Gross deferred tax liabilities
|
1,167.3
|
|
1,118.8
|
|
|||
|
Pension plan liabilities
|
(40.6
|
)
|
(36.2
|
)
|
|||
|
Employee-related benefits
|
(48.8
|
)
|
(47.9
|
)
|
|||
|
Operating loss carryforwards
|
(27.9
|
)
|
(32.1
|
)
|
|||
|
Foreign tax credit carryforwards
|
(47.8
|
)
|
(81.8
|
)
|
|||
|
Utility regulatory liabilities
|
(14.8
|
)
|
(15.5
|
)
|
|||
|
Foreign currency translation adjustment
|
(14.1
|
)
|
—
|
|
|||
|
Derivative instruments
|
(11.0
|
)
|
(15.0
|
)
|
|||
|
Other
|
(13.0
|
)
|
(20.5
|
)
|
|||
|
Gross deferred tax assets
|
(218.0
|
)
|
(249.0
|
)
|
|||
|
Deferred tax assets valuation allowance
|
59.2
|
|
97.6
|
|
|||
|
Net deferred tax liabilities
|
$
|
1,008.5
|
|
$
|
967.4
|
|
|
At
September 30, 2014
, foreign net operating loss carryforwards principally relating to Flaga and certain operations of Antargaz totaled
$37.4
and
$8.2
, respectively, with no expiration dates. We have state net operating loss carryforwards primarily relating to certain subsidiaries which approximate
$171.9
and expire through
2034
. We also have operating loss carryforwards of
$16.8
for certain operations of AmeriGas Propane that expire through
2033
. At
September 30, 2014
, deferred tax assets relating to
F-26
UGI Corporation and Subsidiaries
Notes to Consolidated Financial Statements
(Millions of dollars and euros, except per share amounts and where indicated otherwise)
operating loss carryforwards include
$8.4
for Flaga,
$2.7
for Antargaz,
$0.8
for UGI International Holdings BV,
$6.5
for AmeriGas Propane and
$9.5
for certain other subsidiaries. A valuation allowance of
$15.1
has been provided for deferred tax assets related to state net operating loss carryforwards and other state deferred tax assets of certain subsidiaries because, on a state reportable basis, it is more likely than not that these assets will expire unused. A valuation allowance of
$3.0
was also provided for deferred tax assets related to certain operations of Antargaz, Flaga and UGI International Holdings BV. Operating activities and tax deductions related to the exercise of non-qualified stock options contributed to the state net operating losses disclosed above. We first recognize the utilization of state net operating losses from operations (which exclude the impact of tax deductions for exercises of non-qualified stock options) to reduce income tax expense. Then, to the extent state net operating loss carryforwards, if realized, relate to non-qualified stock option deductions, the resulting benefits will be credited to UGI Corporation stockholders’ equity. The table of deferred tax assets and liabilities do not include
$6.7
for
Fiscal 2014
and
$5.9
for
Fiscal 2013
of deferred tax assets and associated valuation allowance for unrealized state tax benefits for equity compensation deductions.
We have foreign tax credit carryforwards of approximately
$47.8
expiring through
2024
resulting from the actual and planned repatriation of Antargaz’ accumulated earnings since acquisition which are includable in U.S. taxable income. Because we expect that these credits will expire unused, a valuation allowance has been provided for the entire foreign tax credit carryforward amount. The valuation allowance for all deferred tax assets decreased by
$38.4
in
Fiscal 2014
due to decreases in unusable foreign tax credits of
$34.0
and foreign operating loss carryforwards of
$4.8
, partially offset by increases in unusable state operating loss tax benefits of
$0.4
.
We conduct business and file tax returns in the U.S., numerous states, local jurisdictions and in France and certain other European countries. Our U.S. federal income tax returns are settled through the 2010 tax year, our French tax returns are settled through the 2010 tax year. The Antargaz French tax returns from 2011 to 2013 are currently under audit. Our Austrian tax returns are settled through 2012 and our other European tax returns are effectively settled for various years from 2005 to 2012. State and other income tax returns in the U.S. are generally subject to examination for a period of three to five years after the filing of the respective returns.
As of
September 30, 2014
, we have unrecognized income tax benefits totaling
$2.5
including related accrued interest of
$0.1
. If these unrecognized tax benefits were subsequently recognized,
$2.5
would be recorded as a benefit to income taxes on the Consolidated Statement of Income and, therefore, would impact the reported effective tax rate. Generally, a net reduction in unrecognized tax benefits could occur because of the expiration of the statute of limitations in certain jurisdictions or as a result of settlements with tax authorities. There is an expected change in unrecognized tax benefits and related interest in the next twelve months in the amount of
$0.6
.
A reconciliation of the beginning and ending amounts of unrecognized tax benefits is as follows:
|
2014
|
2013
|
2012
|
|||||||||
|
Unrecognized tax benefits - beginning of year
|
$
|
3.4
|
|
$
|
2.9
|
|
$
|
6.3
|
|
||
|
Additions for tax positions of the current year
|
0.7
|
|
0.7
|
|
0.5
|
|
|||||
|
Additions for tax positions taken in prior years
|
—
|
|
—
|
|
0.6
|
|
|||||
|
Settlements with tax authorities
|
(1.7
|
)
|
(0.2
|
)
|
(4.5
|
)
|
|||||
|
Unrecognized tax benefits - end of year
|
$
|
2.4
|
|
$
|
3.4
|
|
$
|
2.9
|
|
||
Defined Benefit Pension and Other Postretirement Plans
In the U.S., we sponsor a defined benefit pension plan for employees hired prior to January 1, 2009, of UGI, UGI Utilities, PNG, CPG and certain of UGI’s other domestic wholly owned subsidiaries (“U.S. Pension Plan”). U.S. Pension Plan benefits are based on years of service, age and employee compensation.
We also provide postretirement health care benefits to certain retirees and active employees and postretirement life insurance benefits to nearly all U.S. active and retired employees. In addition, Antargaz employees are covered by certain defined benefit pension and postretirement plans. Although the disclosures in the tables below include amounts related to the Antargaz plans, such amounts are not material.
F-27
UGI Corporation and Subsidiaries
Notes to Consolidated Financial Statements
(Millions of dollars and euros, except per share amounts and where indicated otherwise)
The following table provides a reconciliation of the projected benefit obligations (“PBOs”) of the U.S. Pension Plan and the Antargaz pension plans, the accumulated benefit obligations (“ABOs”) of our other postretirement benefit plans, plan assets, and the funded status of pension and other postretirement plans as of
September 30, 2014
and
2013
. ABO is the present value of benefits earned to date with benefits based upon current compensation levels. PBO is ABO increased to reflect estimated future compensation.
|
Pension
Benefits
|
Other Postretirement
Benefits
|
||||||||||||||
|
|
2014
|
2013
|
2014
|
2013
|
|||||||||||
|
Change in benefit obligations:
|
|
|
|
|
|||||||||||
|
Benefit obligations — beginning of year
|
$
|
516.5
|
|
$
|
573.4
|
|
$
|
19.7
|
|
$
|
24.7
|
|
|||
|
Service cost
|
9.4
|
|
11.3
|
|
0.5
|
|
0.6
|
|
|||||||
|
Interest cost
|
26.1
|
|
23.8
|
|
0.9
|
|
0.9
|
|
|||||||
|
Actuarial (gain) loss
|
46.8
|
|
(72.7
|
)
|
1.3
|
|
(3.6
|
)
|
|||||||
|
Plan amendments
|
—
|
|
1.0
|
|
—
|
|
(1.8
|
)
|
|||||||
|
Foreign currency
|
(2.4
|
)
|
1.5
|
|
(0.3
|
)
|
0.2
|
|
|||||||
|
Benefits paid
|
(22.8
|
)
|
(21.8
|
)
|
(0.8
|
)
|
(1.3
|
)
|
|||||||
|
Benefit obligations — end of year
|
$
|
573.6
|
|
$
|
516.5
|
|
$
|
21.3
|
|
$
|
19.7
|
|
|||
|
Change in plan assets:
|
|
|
|
|
|||||||||||
|
Fair value of plan assets — beginning of year
|
$
|
415.3
|
|
$
|
369.9
|
|
$
|
11.7
|
|
$
|
11.2
|
|
|||
|
Actual gain on plan assets
|
47.9
|
|
42.2
|
|
1.4
|
|
1.1
|
|
|||||||
|
Foreign currency
|
(1.2
|
)
|
0.8
|
|
—
|
|
—
|
|
|||||||
|
Employer contributions
|
20.2
|
|
24.2
|
|
0.5
|
|
0.7
|
|
|||||||
|
Benefits paid
|
(22.8
|
)
|
(21.8
|
)
|
(0.8
|
)
|
(1.3
|
)
|
|||||||
|
Fair value of plan assets — end of year
|
$
|
459.4
|
|
$
|
415.3
|
|
$
|
12.8
|
|
$
|
11.7
|
|
|||
|
Funded status of the plans — end of year
|
$
|
(114.2
|
)
|
$
|
(101.2
|
)
|
$
|
(8.5
|
)
|
$
|
(8.0
|
)
|
|||
|
Assets (liabilities) recorded in the balance sheet:
|
|
|
|
|
|||||||||||
|
Assets in excess of liabilities — included in other noncurrent assets
|
$
|
—
|
|
$
|
—
|
|
$
|
4.0
|
|
$
|
3.2
|
|
|||
|
Unfunded liabilities — included in other current liabilities
|
(1.1
|
)
|
(17.9
|
)
|
(0.1
|
)
|
(0.4
|
)
|
|||||||
|
Unfunded liabilities — included in other noncurrent liabilities
|
(113.1
|
)
|
(83.3
|
)
|
(12.4
|
)
|
(10.8
|
)
|
|||||||
|
Net amount recognized
|
$
|
(114.2
|
)
|
$
|
(101.2
|
)
|
$
|
(8.5
|
)
|
$
|
(8.0
|
)
|
|||
|
Amounts recorded in UGI Corporation stockholders’ equity (pre-tax):
|
|
|
|
|
|||||||||||
|
Prior service credit
|
$
|
(0.1
|
)
|
$
|
(0.1
|
)
|
$
|
(0.1
|
)
|
$
|
(0.1
|
)
|
|||
|
Net actuarial loss (gain)
|
20.8
|
|
16.7
|
|
0.8
|
|
(0.4
|
)
|
|||||||
|
Total
|
$
|
20.7
|
|
$
|
16.6
|
|
$
|
0.7
|
|
$
|
(0.5
|
)
|
|||
|
Amounts recorded in regulatory assets and liabilities (pre-tax):
|
|
|
|
|
|||||||||||
|
Prior service cost (credit)
|
$
|
1.9
|
|
$
|
2.2
|
|
$
|
(3.6
|
)
|
$
|
(4.3
|
)
|
|||
|
Net actuarial loss
|
107.4
|
|
91.3
|
|
2.6
|
|
3.6
|
|
|||||||
|
Total
|
$
|
109.3
|
|
$
|
93.5
|
|
$
|
(1.0
|
)
|
$
|
(0.7
|
)
|
|||
In Fiscal
2015
, we estimate that we will amortize approximately
$10.3
of net actuarial losses, primarily associated with the U.S. Pension Plan, and
$0.2
of prior service credits from UGI stockholders’ equity and regulatory assets into retiree benefit cost.
F-28
UGI Corporation and Subsidiaries
Notes to Consolidated Financial Statements
(Millions of dollars and euros, except per share amounts and where indicated otherwise)
Actuarial assumptions for our U.S. plans are described below. Assumptions for the Antargaz plans are based upon market conditions in France, Belgium and the Netherlands. The discount rate assumption was determined by selecting a hypothetical portfolio of high quality corporate bonds appropriate to provide for the projected benefit payments of the plans. The discount rate was then developed as the single rate that equates the market value of the bonds purchased to the discounted value of the plans’ benefit payments. The expected rate of return on assets assumption is based on current and expected asset allocations as well as historical and expected returns on various categories of plan assets (as further described below).
|
|
Pension Plan
|
Other Postretirement Benefits
|
|||||||||||||||||
|
|
2014
|
2013
|
2012
|
2014
|
2013
|
2012
|
|||||||||||||
|
Weighted-average assumptions:
|
|
|
|
|
|
|
|||||||||||||
|
Discount rate - benefit obligations
|
4.60
|
%
|
5.20
|
%
|
4.20
|
%
|
4.60
|
%
|
5.10% - 5.40%
|
|
4.10% - 4.30%
|
|
|||||||
|
Discount rate - benefit cost
|
5.20
|
%
|
4.20
|
%
|
5.30
|
%
|
5.10% - 5.40%
|
|
4.10% - 4.30%
|
|
5.30
|
%
|
|||||||
|
Expected return on plan assets
|
7.75
|
%
|
7.75
|
%
|
7.75
|
%
|
5.00
|
%
|
5.00
|
%
|
5.20
|
%
|
|||||||
|
Rate of increase in salary levels
|
3.25
|
%
|
3.25
|
%
|
3.25
|
%
|
3.25
|
%
|
3.25
|
%
|
3.25
|
%
|
|||||||
The ABOs for the U.S. Pension Plan were
$499.1
and
$451.3
as of
September 30, 2014
and
2013
, respectively.
Net periodic pension expense and other postretirement benefit cost includes the following components:
|
|
Pension Benefits
|
Other Postretirement Benefits
|
|||||||||||||||||||||
|
|
2014
|
2013
|
2012
|
2014
|
2013
|
2012
|
|||||||||||||||||
|
Service cost
|
$
|
9.4
|
|
$
|
11.3
|
|
$
|
9.3
|
|
$
|
0.5
|
|
$
|
0.6
|
|
$
|
0.4
|
|
|||||
|
Interest cost
|
26.1
|
|
23.8
|
|
25.1
|
|
0.9
|
|
0.9
|
|
1.1
|
|
|||||||||||
|
Expected return on assets
|
(29.7
|
)
|
(27.8
|
)
|
(26.2
|
)
|
(0.6
|
)
|
(0.5
|
)
|
(0.5
|
)
|
|||||||||||
|
Amortization of:
|
|
|
|
|
|
|
|||||||||||||||||
|
Prior service cost (benefit)
|
0.3
|
|
0.3
|
|
0.2
|
|
(0.5
|
)
|
(0.3
|
)
|
(0.3
|
)
|
|||||||||||
|
Actuarial loss
|
7.7
|
|
15.1
|
|
8.4
|
|
—
|
|
0.4
|
|
0.3
|
|
|||||||||||
|
Net benefit cost
|
13.8
|
|
22.7
|
|
16.8
|
|
0.3
|
|
1.1
|
|
1.0
|
|
|||||||||||
|
Change in associated regulatory liabilities
|
—
|
|
—
|
|
—
|
|
3.7
|
|
3.3
|
|
3.2
|
|
|||||||||||
|
Net benefit cost after change in regulatory liabilities
|
$
|
13.8
|
|
$
|
22.7
|
|
$
|
16.8
|
|
$
|
4.0
|
|
$
|
4.4
|
|
$
|
4.2
|
|
|||||
The U.S. Pension Plan’s assets are held in trust. It is our general policy to fund amounts for U.S. Pension Plan benefits equal to at least the minimum required contribution set forth in applicable employee benefit laws. From time to time we may, at our discretion, contribute additional amounts. During Fiscal
2014
, Fiscal
2013
and Fiscal
2012
, we made cash contributions to the U.S. Pension Plan of
$19.2
,
$22.4
and
$31.2
respectively. The minimum required contributions in Fiscal 2015 are not expected to be material.
UGI Utilities has established a Voluntary Employees’ Beneficiary Association (“VEBA”) trust to pay retiree health care and life insurance benefits by depositing into the VEBA the annual amount of postretirement benefits costs, if any, determined under GAAP. The difference between such amount and amounts included in UGI Gas’ and Electric Utility’s rates is deferred for future recovery from, or refund to, ratepayers. The required contributions to the VEBA during Fiscal
2015
, if any, are not expected to be material.
F-29
UGI Corporation and Subsidiaries
Notes to Consolidated Financial Statements
(Millions of dollars and euros, except per share amounts and where indicated otherwise)
Expected payments for pension and other postretirement welfare benefits are as follows:
|
Pension
Benefits
|
Other
Postretirement
Benefits
|
||||||
|
Fiscal 2015
|
$
|
25.6
|
|
$
|
1.1
|
|
|
|
Fiscal 2016
|
$
|
25.8
|
|
$
|
1.1
|
|
|
|
Fiscal 2017
|
$
|
27.2
|
|
$
|
1.0
|
|
|
|
Fiscal 2018
|
$
|
30.3
|
|
$
|
1.0
|
|
|
|
Fiscal 2019
|
$
|
32.6
|
|
$
|
1.0
|
|
|
|
Fiscal 2020 - 2024
|
$
|
175.1
|
|
$
|
4.9
|
|
|
The assumed domestic health care cost trend rates at September 30 are as follows:
|
2014
|
2013
|
||||
|
Health care cost trend rate assumed for next year
|
7.0
|
%
|
7.5
|
%
|
|
|
Rate to which the cost trend rate is assumed to decline (ultimate trend rate)
|
5.0
|
%
|
5.0
|
%
|
|
|
Fiscal year that the rate reaches the ultimate trend rate
|
2019
|
|
2019
|
|
|
A one percentage point change in the assumed health care cost trend rate would not have a material impact on the Fiscal 2014 other postretirement benefit cost or
September 30, 2014
, other postretirement benefit ABO.
We also sponsor unfunded and non-qualified supplemental executive retirement plans (“Supplemental Defined Benefit Plans”). At
September 30, 2014
and
2013
, the PBOs of these plans, including obligations for amounts held in grantor trusts, were
$38.4
and
$33.9
, respectively. We recorded pre-tax costs for these plans of
$2.6
in Fiscal
2014
,
$3.0
in Fiscal
2013
and
$3.0
in Fiscal
2012
. These costs are not included in the tables above. Amounts recorded in UGI’s stockholders’ equity for these plans include pre-tax losses of
$10.2
and
$9.4
at
September 30, 2014
and
2013
, respectively, principally representing unrecognized actuarial losses. We expect to amortize approximately
$0.9
of such pre-tax actuarial losses into retiree benefit cost in Fiscal
2015
. During Fiscal 2014 and Fiscal 2013, the Company made payments with respect to the Supplemental Defined Benefit Plans totaling
$0.3
and
$21.6
, respectively, including
$21.0
in Fiscal 2013 to fund self-directed grantor trusts established by the Company for participants who chose to defer their Supplemental Defined Benefit Plan payment upon retirement. The total fair value of the grantor trust investment assets associated with the Supplemental Defined Benefit Plans, which are included in other assets on the Consolidated Balance Sheets, totaled
$26.6
and
$23.7
at
September 30, 2014
and
2013
, respectively.
U.S. Pension Plan and VEBA Assets
The assets of the U.S. Pension Plan and the VEBA are held in trust. The investment policies and asset allocation strategies for the assets in these trusts are determined by an investment committee comprising officers of UGI and UGI Utilities. The overall investment objective of the U.S. Pension Plan and the VEBA is to achieve the best long-term rates of return within prudent and reasonable levels of risk. To achieve the stated objective, investments are made principally in publicly traded, diversified equity and fixed income mutual funds and, to a much lesser extent, smallcap common stocks and UGI Common Stock.
F-30
UGI Corporation and Subsidiaries
Notes to Consolidated Financial Statements
(Millions of dollars and euros, except per share amounts and where indicated otherwise)
The targets, target ranges and actual allocations for the U.S. Pension Plan and VEBA trust assets at September 30 are as follows:
U.S. Pension Plan
|
|
Actual
|
Target
Asset
Allocation
|
Permitted
Range
|
|||||||
|
|
2014
|
2013
|
||||||||
|
Equity investments:
|
|
|
|
|
||||||
|
Domestic
|
55.6
|
%
|
57.5
|
%
|
52.5
|
%
|
40.0% - 65.0%
|
|||
|
International
|
11.3
|
%
|
11.1
|
%
|
12.5
|
%
|
7.5% - 17.5%
|
|||
|
Total
|
66.9
|
%
|
68.6
|
%
|
65.0
|
%
|
60.0% - 70.0%
|
|||
|
Fixed income funds & cash equivalents
|
33.1
|
%
|
31.4
|
%
|
35.0
|
%
|
30.0% - 40.0%
|
|||
|
Total
|
100.0
|
%
|
100.0
|
%
|
100.0
|
%
|
|
|||
VEBA
|
|
Actual
|
Target
Asset
Allocation
|
Permitted
Range
|
|||||||
|
|
2014
|
2013
|
||||||||
|
Domestic equity investments
|
67.9
|
%
|
65.6
|
%
|
65.0
|
%
|
60.0% - 70.0%
|
|||
|
Fixed income funds & cash equivalents
|
32.1
|
%
|
34.4
|
%
|
35.0
|
%
|
30.0% - 40.0%
|
|||
|
Total
|
100.0
|
%
|
100.0
|
%
|
100.0
|
%
|
|
|||
Domestic equity investments include investments in large-cap mutual funds indexed to the S&P 500, actively managed mid- and small-cap mutual funds, and a self-directed portfolio of smallcap common stocks. Investments in international equity mutual funds seek to track performance of companies primarily in developed markets. The fixed income investments comprise investments designed to match the performance and duration of the Barclays U.S. Aggregate Index. According to statute, the aggregate holdings of all qualifying employer securities may not exceed
10%
of the fair value of trust assets at the time of purchase. UGI Common Stock represented
9.6%
and
8.2%
of U.S. Pension Plan assets at
September 30, 2014
and
2013
, respectively.
F-31
UGI Corporation and Subsidiaries
Notes to Consolidated Financial Statements
(Millions of dollars and euros, except per share amounts and where indicated otherwise)
The fair values of U.S. Pension Plan and VEBA trust assets are derived from quoted market prices as substantially all of these instruments have active markets. Cash equivalents are valued at the fund’s unit net asset value as reported by the trustee. The fair values of the U.S. Pension Plan and VEBA trust assets by asset class and level within the fair value hierarchy, as described in
Note 2
, as of
September 30, 2014
and
2013
are as follows:
|
|
U.S. Pension Plan
|
||||||||||||||
|
Level 1
|
Level 2
|
Level 3
|
Total
|
||||||||||||
|
September 30, 2014:
|
|
|
|
|
|||||||||||
|
Domestic equity investments:
|
|
|
|
|
|||||||||||
|
S&P 500 Index equity mutual funds
|
$
|
152.6
|
|
$
|
—
|
|
$
|
—
|
|
$
|
152.6
|
|
|||
|
Small and midcap equity mutual funds
|
41.4
|
|
—
|
|
—
|
|
41.4
|
|
|||||||
|
Smallcap common stocks
|
9.3
|
|
—
|
|
—
|
|
9.3
|
|
|||||||
|
UGI Corporation Common Stock
|
42.5
|
|
—
|
|
—
|
|
42.5
|
|
|||||||
|
Total domestic equity investments
|
245.8
|
|
—
|
|
—
|
|
245.8
|
|
|||||||
|
International index equity mutual funds
|
49.9
|
|
—
|
|
—
|
|
49.9
|
|
|||||||
|
Fixed income investments:
|
|||||||||||||||
|
Bond index mutual funds
|
141.0
|
|
—
|
|
—
|
|
141.0
|
|
|||||||
|
Cash equivalents
|
—
|
|
5.7
|
|
—
|
|
5.7
|
|
|||||||
|
Total fixed income investments
|
141.0
|
|
5.7
|
|
—
|
|
146.7
|
|
|||||||
|
Total
|
$
|
436.7
|
|
$
|
5.7
|
|
$
|
—
|
|
$
|
442.4
|
|
|||
|
September 30, 2013:
|
|
|
|
|
|||||||||||
|
Domestic equity investments:
|
|
|
|
|
|||||||||||
|
S&P 500 Index equity mutual funds
|
$
|
141.8
|
|
$
|
—
|
|
$
|
—
|
|
$
|
141.8
|
|
|||
|
Small and midcap equity mutual funds
|
54.5
|
|
—
|
|
—
|
|
54.5
|
|
|||||||
|
UGI Corporation Common Stock
|
32.6
|
|
—
|
|
—
|
|
32.6
|
|
|||||||
|
Total domestic equity investments
|
228.9
|
|
—
|
|
—
|
|
228.9
|
|
|||||||
|
International index equity mutual funds
|
44.4
|
|
—
|
|
—
|
|
44.4
|
|
|||||||
|
Fixed income investments:
|
|||||||||||||||
|
Bond index mutual funds
|
120.9
|
|
—
|
|
—
|
|
120.9
|
|
|||||||
|
Cash equivalents
|
—
|
|
4.0
|
|
—
|
|
4.0
|
|
|||||||
|
Total fixed income investments
|
120.9
|
|
4.0
|
|
—
|
|
124.9
|
|
|||||||
|
Total
|
$
|
394.2
|
|
$
|
4.0
|
|
$
|
—
|
|
$
|
398.2
|
|
|||
|
|
VEBA
|
||||||||||||||
|
Level 1
|
Level 2
|
Level 3
|
Total
|
||||||||||||
|
September 30, 2014:
|
|
|
|
|
|||||||||||
|
S&P 500 Index equity mutual fund
|
$
|
8.7
|
|
$
|
—
|
|
$
|
—
|
|
$
|
8.7
|
|
|||
|
Bond index mutual fund
|
3.7
|
|
—
|
|
—
|
|
3.7
|
|
|||||||
|
Cash equivalents
|
—
|
|
0.4
|
|
—
|
|
0.4
|
|
|||||||
|
Total
|
$
|
12.4
|
|
$
|
0.4
|
|
$
|
—
|
|
$
|
12.8
|
|
|||
|
September 30, 2013:
|
|
|
|
|
|||||||||||
|
S&P 500 Index equity mutual fund
|
$
|
7.7
|
|
$
|
—
|
|
$
|
—
|
|
$
|
7.7
|
|
|||
|
Bond index mutual fund
|
3.8
|
|
—
|
|
—
|
|
3.8
|
|
|||||||
|
Cash equivalents
|
—
|
|
0.2
|
|
—
|
|
0.2
|
|
|||||||
|
Total
|
$
|
11.5
|
|
$
|
0.2
|
|
$
|
—
|
|
$
|
11.7
|
|
|||
F-32
UGI Corporation and Subsidiaries
Notes to Consolidated Financial Statements
(Millions of dollars and euros, except per share amounts and where indicated otherwise)
The expected long-term rates of return on U.S. Pension Plan and VEBA trust assets have been developed using a best estimate of expected returns, volatilities and correlations for each asset class. The estimates are based on historical capital market performance data and future expectations provided by independent consultants. Future expectations are determined by using simulations that provide a wide range of scenarios of future market performance. The market conditions in these simulations consider the long-term relationships between equities and fixed income as well as current market conditions at the start of the simulation. The expected rate begins with a risk-free rate of return with other factors being added such as inflation, duration, credit spreads and equity risk premiums. The rates of return derived from this process are applied to our target asset allocation to develop a reasonable return assumption.
Defined Contribution Plans
We sponsor 401(k) savings plans for eligible employees of UGI and certain of UGI’s domestic subsidiaries. Generally, participants in these plans may contribute a portion of their compensation on either a before-tax basis, or on both a before-tax and after-tax basis. These plans also provide for employer matching contributions at various rates. The cost of benefits under the savings plans totaled
$14.7
in Fiscal
2014
,
$14.0
in Fiscal
2013
and
$13.7
in Fiscal
2012
. The Company also sponsors certain nonqualified supplemental defined contribution executive retirement plans. These plans generally provide supplemental benefits to certain executives that would otherwise be provided under retirement plans but are prohibited due to limitations imposed by the Internal Revenue Code. The Company makes payments to self-directed grantor trusts with respect to these supplemental defined contribution plans. Such payments during Fiscal
2014
, Fiscal
2013
or Fiscal
2012
were not material. At
September 30, 2014
and
2013
, the total fair values of the grantor trust investment assets, which amounts are included in other noncurrent assets on the Consolidated Balance Sheets, was
$3.4
.
The following regulatory assets and liabilities associated with Utilities are included in our accompanying balance sheets at September 30:
|
2014
|
2013
|
||||||
|
Regulatory assets:
|
|
|
|||||
|
Income taxes recoverable
|
$
|
110.7
|
|
$
|
106.1
|
|
|
|
Underfunded pension and postretirement plans
|
110.1
|
|
94.5
|
|
|||
|
Environmental costs
|
14.6
|
|
17.1
|
|
|||
|
Deferred fuel and power costs
|
11.8
|
|
8.3
|
|
|||
|
Removal costs, net
|
16.8
|
|
13.3
|
|
|||
|
Other
|
4.2
|
|
5.6
|
|
|||
|
Total regulatory assets
|
$
|
268.2
|
|
$
|
244.9
|
|
|
|
Regulatory liabilities (a):
|
|
|
|||||
|
Postretirement benefits
|
$
|
18.6
|
|
$
|
16.5
|
|
|
|
Environmental overcollections
|
0.3
|
|
2.6
|
|
|||
|
Deferred fuel and power refunds
|
0.3
|
|
8.3
|
|
|||
|
State tax benefits — distribution system repairs
|
10.1
|
|
8.4
|
|
|||
|
Other
|
3.2
|
|
1.5
|
|
|||
|
Total regulatory liabilities
|
$
|
32.5
|
|
$
|
37.3
|
|
|
(a) Regulatory liabilities are recorded in other current and other noncurrent liabilities in the Consolidated Balance Sheets.
Income taxes recoverable
.
This regulatory asset is the result of recording deferred tax liabilities pertaining to temporary tax differences principally as a result of the pass through to ratepayers of accelerated tax depreciation for state income tax purposes, and the flow through of accelerated tax depreciation for federal income tax purposes for certain years prior to 1981. These deferred taxes have been reduced by deferred tax assets pertaining to utility deferred investment tax credits. Utilities has recorded regulatory income tax assets related to these deferred tax liabilities representing future revenues recoverable through the ratemaking process over the average remaining depreciable lives of the associated property ranging from
1
to approximately
65
years.
F-33
UGI Corporation and Subsidiaries
Notes to Consolidated Financial Statements
(Millions of dollars and euros, except per share amounts and where indicated otherwise)
Underfunded pension and other postretirement plans
.
This regulatory asset represents the portion of prior service cost and net actuarial losses associated with pension and other postretirement benefits which are probable of being recovered through future rates based upon established regulatory practices. These regulatory assets are adjusted annually or more frequently under certain circumstances when the funded status of the plans is recorded in accordance with GAAP. These costs are amortized over the average remaining future service lives of plan participants.
Environmental costs
.
Environmental costs represent amounts actually spent by UGI Gas to clean up sites in Pennsylvania as well as the portion of estimated probable future environmental remediation and investigation costs principally at manufactured gas plant (“MGP”) sites that CPG and PNG expect to incur in conjunction with remediation consent orders and agreements with the Pennsylvania Department of Environmental Protection (see
Note 16
). Consistent with prior ratemaking treatment, UGI Gas anticipates it will recover in rates, through future base rate proceedings, a
five
-year average of prudently incurred remediation costs at Pennsylvania sites and UGI Gas is currently amortizing such costs over a
five
-year period. PNG and CPG are currently recovering and expect to continue to recover environmental remediation and investigation costs in base rate revenues. At
September 30, 2014
, the period over which PNG and CPG expect to recover these costs will depend upon future remediation activity.
Deferred fuel and power — costs and refunds.
Gas Utility’s and Electric Utility’s tariffs contain clauses which permit recovery of all prudently incurred purchased gas and power costs through the application of purchased gas cost (“PGC”) rates in the case of Gas Utility and default service (“DS”) tariffs in the case of Electric Utility. The clauses provide for periodic adjustments to PGC and DS rates for differences between the total amount of purchased gas and electric generation supply costs collected from customers and recoverable costs incurred. Net undercollected costs are classified as a regulatory asset and net overcollections are classified as a regulatory liability.
Gas Utility uses derivative instruments to reduce volatility in the cost of gas it purchases for firm- residential, commercial and industrial (“retail core-market”) customers. Realized and unrealized gains or losses on natural gas derivative instruments are included in deferred fuel costs or refunds. Net unrealized losses on such contracts at
September 30, 2014
and
2013
were
$1.4
and
$1.7
, respectively.
Electric Utility enters into forward electricity purchase contracts to meet a substantial portion of its electricity supply needs. Because most of these contracts currently do not qualify for the normal purchases and normal sales exception under GAAP related to derivative instruments, these electricity supply contracts are recognized on the balance sheet at fair value with an associated adjustment to regulatory assets or liabilities in accordance with GAAP related to rate-regulated entities. At
September 30, 2014
and
2013
, the fair values of Electric Utility’s electricity supply contracts were gains (losses) of
$0.3
and
$(4.8)
, respectively. These amounts are reflected in current derivative assets and current derivative liabilities on the Consolidated Balance Sheets with equal and offsetting amounts reflected in deferred fuel and power costs and refunds in the table above.
In order to reduce volatility associated with a substantial portion of its electric transmission congestion costs, Electric Utility obtains financial transmission rights (“FTRs”). FTRs are derivative instruments that entitle the holder to receive compensation for electricity transmission congestion charges when there is insufficient electricity transmission capacity on the electric transmission grid. Because Electric Utility is entitled to fully recover its DS costs, realized and unrealized gains or losses on FTRs are included in deferred fuel and power costs or deferred fuel and power refunds. Unrealized gains or losses on FTRs at
September 30, 2014
and
2013
, were not material.
Removal costs, net
.
This regulatory asset represents costs incurred, net of salvage, associated with the retirement of depreciable utility plant. Consistent with prior ratemaking treatment, UGI Utilities expects to recover these costs over
5
years.
Postretirement benefits
.
Gas Utility and Electric Utility are recovering ongoing postretirement benefit costs at amounts permitted by the PUC in prior base rate proceedings. With respect to UGI Gas and Electric Utility, the difference between the amounts recovered through rates and the actual costs incurred in accordance with accounting for postretirement benefits are being deferred for future refund to or recovery from ratepayers. Such amounts are reflected in regulatory liabilities in the table above. In addition, this regulatory liability includes the portion of prior service credits and net actuarial gains associated with certain other postretirement benefit plans.
Environmental overcollections.
This regulatory liability represents the difference between amounts recovered in rates and actual costs incurred (net of insurance proceeds) associated with the terms of a consent order agreement between CPG and the Pennsylvania Department of Environmental Protection (“DEP”) to remediate certain gas plant sites.
F-34
UGI Corporation and Subsidiaries
Notes to Consolidated Financial Statements
(Millions of dollars and euros, except per share amounts and where indicated otherwise)
State income tax benefits — distribution system repairs.
This regulatory liability represents Pennsylvania state income tax benefits, net of federal income tax expense, resulting from the deduction for income tax purposes of repair and maintenance costs associated with Gas Utility or Electric Utility assets which are capitalized for regulatory and GAAP reporting. The tax benefits associated with these repair and maintenance deductions will be reflected as a reduction to income tax expense over the remaining tax lives of the related book assets.
Other
.
Other regulatory assets comprise a number of items including, among others, deferred postretirement costs, deferred asset retirement costs, deferred rate case expenses, customer choice implementation costs and deferred software development costs. At
September 30, 2014
, UGI Utilities expects to recover these costs over periods of approximately
1
to
20
years.
UGI Utilities’ regulatory liabilities relating to postretirement benefits, environmental overcollections and state tax benefits — distribution system repairs are included in other noncurrent liabilities on the Consolidated Balance Sheets. UGI Utilities does not recover a rate of return on its regulatory assets.
Other Regulatory Matters
Transfers of Assets
.
On February 1, 2012, CPG filed an application with the PUC for review and approval of the transfer of an
11
-mile natural gas pipeline, related facilities and rights of way located in Delmar Township, Pennsylvania (“TL-96 line”) to Energy Services. The PUC approved the transfer and, in April 2013, the TL-96 line was dividended to UGI and subsequently contributed to Energy Services. The net book value of the TL-96 line was approximately
$2.6
.
Inventories comprise the following at September 30:
|
2014
|
2013
|
||||||
|
Non-utility LPG and natural gas
|
$
|
283.6
|
|
$
|
230.0
|
|
|
|
Gas Utility natural gas
|
82.7
|
|
78.9
|
|
|||
|
Materials, supplies and other
|
56.7
|
|
56.6
|
|
|||
|
Total inventories
|
$
|
423.0
|
|
$
|
365.5
|
|
|
At
September 30, 2014
, UGI Utilities is a party to
four
principal storage contract administrative agreements (“SCAAs”) having terms of
one
to
three
years. Pursuant to SCAAs, UGI Utilities has, among other things, released certain storage and transportation contracts for the terms of the SCAAs. UGI Utilities also transferred certain associated storage inventories upon commencement of the SCAAs, will receive a transfer of storage inventories at the end of the SCAAs, and makes payments associated with refilling storage inventories during the terms of the SCAAs. The historical cost of natural gas storage inventories released under the SCAAs, which represents a portion of Gas Utility’s total natural gas storage inventories, and any exchange receivable (representing amounts of natural gas inventories used by the other parties to the agreement but not yet replenished), are included in the caption “Gas Utility natural gas” in the table above.
As of
September 30, 2014
, UGI Utilities has principal SCAAs with Energy Services and a non-affiliate. The carrying values of gas storage inventories released under SCAAs with non-affiliates at
September 30, 2014
and
2013
, comprising
3.9
billion cubic feet (“bcf”) and
0.6
bcf of natural gas, was
$16.8
and
$2.4
, respectively. Effective November 1, 2014, UGI Utilities entered into a new SCAA with Energy Services having a term of
one
year.
F-35
UGI Corporation and Subsidiaries
Notes to Consolidated Financial Statements
(Millions of dollars and euros, except per share amounts and where indicated otherwise)
Property, plant and equipment comprise the following at September 30:
|
2014
|
2013
|
||||||
|
Utilities:
|
|
|
|||||
|
Distribution
|
$
|
2,294.6
|
|
$
|
2,162.6
|
|
|
|
Transmission
|
88.2
|
|
86.6
|
|
|||
|
General and other, including work in process
|
185.7
|
|
178.6
|
|
|||
|
Total Utilities
|
2,568.5
|
|
2,427.8
|
|
|||
|
Non-utility:
|
|
|
|||||
|
Land
|
170.2
|
|
178.4
|
|
|||
|
Buildings and improvements
|
317.4
|
|
308.1
|
|
|||
|
Transportation equipment
|
288.4
|
|
273.8
|
|
|||
|
Equipment, primarily cylinders and tanks
|
3,042.7
|
|
3,161.9
|
|
|||
|
Electric generation
|
273.4
|
|
264.8
|
|
|||
|
Pipeline and related assets
|
162.3
|
|
22.5
|
|
|||
|
Other, including work in process
|
353.8
|
|
403.2
|
|
|||
|
Total non-utility
|
4,608.2
|
|
4,612.7
|
|
|||
|
Total property, plant and equipment
|
$
|
7,176.7
|
|
$
|
7,040.5
|
|
|
Changes in the carrying amount of goodwill by reportable segment are as follows:
|
|
UGI International
|
|
|||||||||||||||||||||||||
|
|
AmeriGas
Propane
|
Gas
Utility
|
Energy Services
|
Antargaz
|
Flaga & Other
|
Corporate &
Other
|
Total
|
||||||||||||||||||||
|
Balance September 30, 2012
|
$
|
1,919.2
|
|
$
|
182.1
|
|
$
|
2.8
|
|
$
|
612.0
|
|
$
|
95.2
|
|
$
|
7.0
|
|
$
|
2,818.3
|
|
||||||
|
Acquisitions
|
12.5
|
|
—
|
|
—
|
|
—
|
|
—
|
|
—
|
|
12.5
|
|
|||||||||||||
|
Correcting adjustment
|
9.3
|
|
—
|
|
—
|
|
—
|
|
—
|
|
—
|
|
9.3
|
|
|||||||||||||
|
Foreign currency translation
|
—
|
|
—
|
|
—
|
|
31.7
|
|
1.9
|
|
—
|
|
33.6
|
|
|||||||||||||
|
Balance September 30, 2013
|
1,941.0
|
|
182.1
|
|
2.8
|
|
643.7
|
|
97.1
|
|
7.0
|
|
2,873.7
|
|
|||||||||||||
|
Acquisitions
|
6.8
|
|
—
|
|
2.8
|
|
—
|
|
—
|
|
—
|
|
9.6
|
|
|||||||||||||
|
Purchase accounting adjustments
|
(2.7
|
)
|
—
|
|
—
|
|
—
|
|
0.9
|
|
—
|
|
(1.8
|
)
|
|||||||||||||
|
Foreign currency translation
|
—
|
|
—
|
|
—
|
|
(42.5
|
)
|
(5.6
|
)
|
—
|
|
(48.1
|
)
|
|||||||||||||
|
Balance September 30, 2014
|
$
|
1,945.1
|
|
$
|
182.1
|
|
$
|
5.6
|
|
$
|
601.2
|
|
$
|
92.4
|
|
$
|
7.0
|
|
$
|
2,833.4
|
|
||||||
The correcting adjustment to goodwill during
Fiscal 2013
primarily reflects a correcting adjustment associated with the Heritage Acquisition.
F-36
UGI Corporation and Subsidiaries
Notes to Consolidated Financial Statements
(Millions of dollars and euros, except per share amounts and where indicated otherwise)
Intangible assets comprise the following at September 30:
|
2014
|
2013
|
||||||
|
Customer relationships, noncompete agreements and other
|
$
|
712.0
|
|
$
|
704.8
|
|
|
|
Trademarks and tradenames (not subject to amortization)
|
128.2
|
|
130.2
|
|
|||
|
Gross carrying amount
|
840.2
|
|
835.0
|
|
|||
|
Accumulated amortization
|
(263.8
|
)
|
(227.1
|
)
|
|||
|
Intangible assets, net
|
$
|
576.4
|
|
$
|
607.9
|
|
|
Amortization expense of intangible assets was
$48.2
,
$52.8
and
$44.5
for Fiscal
2014
, Fiscal
2013
and Fiscal
2012
, respectively. Estimated amortization expense of intangible assets during the next five fiscal years is as follows: Fiscal
2015
—
$51.9
; Fiscal
2016
—
$44.7
; Fiscal
2017
—
$37.9
; Fiscal
2018
—
$36.4
; Fiscal
2019
—
$34.7
.
UGI has
10,000,000
shares of UGI Series Preferred Stock authorized for issuance, including both series subject to and series not subject to mandatory redemption. We had
no
shares of UGI Series Preferred Stock outstanding at
September 30, 2014
or
2013
.
UGI Utilities has
2,000,000
shares of UGI Utilities Series Preferred Stock authorized for issuance, including both series subject to and series not subject to mandatory redemption. At
September 30, 2014
and
2013
, there were
no
shares of UGI Utilities Series Preferred Stock outstanding.
Common Stock
On January 30, 2014, the Company’s Board of Directors authorized the repurchase of up to
10,000,000
shares of UGI Corporation Common Stock over a
four
-year period. Pursuant to such authorization, during Fiscal
2014
, the Company purchased and placed in treasury stock
1,227,654
shares at a total cost of
$39.8
.
UGI Common Stock share activity for Fiscal
2012
, Fiscal
2013
and Fiscal
2014
follows:
|
Issued
|
Treasury
|
Outstanding
|
||||||
|
Balance, September 30, 2011
|
173,260,641
|
|
(5,506,608
|
)
|
167,754,033
|
|
||
|
Issued:
|
|
|||||||
|
Employee and director plans
|
176,250
|
|
1,237,388
|
|
1,413,638
|
|
||
|
Dividend reinvestment plan
|
—
|
|
157,491
|
|
157,491
|
|
||
|
Shares reacquired - employee and director plans
|
—
|
|
(394,530
|
)
|
(394,530
|
)
|
||
|
Balance, September 30, 2012
|
173,436,891
|
|
(4,506,259
|
)
|
168,930,632
|
|
||
|
Issued:
|
|
|
|
|||||
|
Employee and director plans
|
238,800
|
|
3,933,507
|
|
4,172,307
|
|
||
|
Dividend reinvestment plan
|
—
|
|
93,253
|
|
93,253
|
|
||
|
Shares reacquired - employee and director plans
|
—
|
|
(1,552,905
|
)
|
(1,552,905
|
)
|
||
|
Balance, September 30, 2013
|
173,675,691
|
|
(2,032,404
|
)
|
171,643,287
|
|
||
|
Issued:
|
|
|
|
|||||
|
Employee and director plans
|
94,950
|
|
2,928,140
|
|
3,023,090
|
|
||
|
Repurchases of Common Stock
|
—
|
|
(1,227,654
|
)
|
(1,227,654
|
)
|
||
|
Shares reacquired - employee and director plans
|
—
|
|
(1,164,942
|
)
|
(1,164,942
|
)
|
||
|
Balance, September 30, 2014
|
173,770,641
|
|
(1,496,860
|
)
|
172,273,781
|
|
||
As a result of the January 2012 issuance of
29,567,362
AmeriGas Partners Common Units to ETP in conjunction with the Heritage Acquisition and related General Partner Common Unit transactions (see
Note 4
), and the March 2012 issuance of
7,000,000
F-37
UGI Corporation and Subsidiaries
Notes to Consolidated Financial Statements
(Millions of dollars and euros, except per share amounts and where indicated otherwise)
AmeriGas Partners Common Units pursuant to AmeriGas Partners’ public offering (see
Note 15
), the Company recorded a
$196.3
increase in UGI Corporation stockholders’ equity (which amount is net of deferred income taxes) and an associated
$321.4
pre-tax decrease in noncontrolling interests equity during Fiscal 2012.
Equity-Based Compensation
The Company grants equity-based awards to employees and non-employee directors comprising UGI stock options, UGI Common stock-based equity instruments and AmeriGas Partners Common Unit-based equity instruments as further described below. We recognized total pre-tax equity-based compensation expense of
$25.8
(
$16.6
after-tax),
$17.6
(
$11.4
after-tax) and
$14.5
(
$8.7
after-tax) in Fiscal
2014
, Fiscal
2013
and Fiscal
2012
, respectively.
UGI Equity-Based Compensation Plans and Awards.
On January 24, 2013, the Company’s shareholders approved the UGI Corporation 2013 Omnibus Incentive Compensation Plan (the “2013 OICP”). The 2013 OICP succeeds the UGI Corporation 2004 Omnibus Equity Compensation Plan Amended and Restated as of December 5, 2006 (the “2004 OECP”) for awards granted on or after January 24, 2013. The 2004 OECP will continue in effect but all future grants issued pursuant to it will be solely in the form of options to acquire Common Stock. Under the 2013 OICP, we may grant options to acquire shares of UGI Common Stock, stock appreciation rights (“SARs”), UGI Units (comprising “Stock Units” and “UGI Performance Units”), other equity-based awards and cash to key employees and non-employee directors. The exercise price for options may not be less than the fair market value on the grant date. Awards granted under the 2013 OICP may vest immediately or ratably over a period of years, and stock options can be exercised no later than
ten years
from the grant date. In addition, the 2013 OICP provides that awards of UGI Units may also provide for the crediting of dividend equivalents to participants’ accounts. Except in the event of retirement, death or disability, each grant, unless paid, will terminate when the participant ceases to be employed. There are certain change of control and retirement eligibility conditions that, if met, generally result in accelerated vesting or elimination of further service requirements.
Under the 2004 OECP, we could grant options to acquire shares of UGI Common Stock, UGI Units and other equity-based awards to key employees and non-employee directors through January 23, 2013 (except with respect to the granting of stock option awards as previously mentioned). Under the 2004 OECP, the exercise price for stock options could not be less than the fair market value on the grant date. Awards granted under the 2004 OECP could vest immediately or ratably over a period of years, and stock options could be exercised no later than ten years from the date of grant. In addition, the 2004 OECP provided that the awards of UGI Units could include the crediting of dividend equivalents to participants’ accounts.
Under the 2013 OICP, awards representing up to
21,750,000
shares of UGI Common Stock may be granted. Dividend equivalents on UGI Unit awards to employees will be paid in cash. Dividend equivalents on non-employee director awards are accumulated in additional Stock Units. UGI Unit awards granted to employees and non-employee directors are settled in shares of Common Stock and cash. UGI Unit awards granted to Antargaz employees are settled in shares of Common Stock. With respect to UGI Performance Unit awards, the actual number of shares (or their cash equivalent) ultimately issued, and the actual amount of dividend equivalents paid, is generally dependent upon the achievement of market performance goals and service conditions. It is currently our practice to issue treasury shares to satisfy substantially all option exercises and UGI Unit awards. Beginning during Fiscal 2012, options may be net exercised whereby shares equal to the option price and grantee’s minimum applicable payroll tax withholding are withheld from the number of shares payable (“net exercise”). We record shares withheld pursuant to a net exercise as shares reacquired.
F-38
UGI Corporation and Subsidiaries
Notes to Consolidated Financial Statements
(Millions of dollars and euros, except per share amounts and where indicated otherwise)
UGI Stock Option Awards
.
Stock option transactions under equity-based compensation plans during Fiscal
2012
, Fiscal
2013
and Fiscal
2014
follow:
|
Shares
|
Weighted
Average
Option Price
|
Total
Intrinsic
Value
|
Weighted
Average
Contract Term
(Years)
|
|||||||||
|
Shares under option — September 30, 2011
|
11,509,769
|
|
$
|
17.03
|
|
$
|
15.1
|
|
6.2
|
|||
|
Granted
|
2,262,075
|
|
$
|
19.51
|
|
|
|
|||||
|
Cancelled
|
(482,400
|
)
|
$
|
18.49
|
|
|
|
|||||
|
Exercised
|
(1,202,786
|
)
|
$
|
13.95
|
|
$
|
7.2
|
|
|
|||
|
Shares under option — September 30, 2012
|
12,086,658
|
|
$
|
17.75
|
|
$
|
41.4
|
|
6.1
|
|||
|
Granted
|
2,275,350
|
|
$
|
22.38
|
|
|
|
|||||
|
Cancelled
|
(134,754
|
)
|
$
|
20.34
|
|
|
|
|||||
|
Exercised
|
(4,033,302
|
)
|
$
|
16.39
|
|
$
|
35.4
|
|
|
|||
|
Shares under option — September 30, 2013
|
10,193,952
|
|
$
|
19.28
|
|
$
|
69.6
|
|
6.8
|
|||
|
Granted
|
1,665,600
|
|
$
|
27.93
|
|
|
|
|||||
|
Cancelled
|
(86,707
|
)
|
$
|
22.76
|
|
|
|
|||||
|
Exercised
|
(2,815,555
|
)
|
$
|
17.44
|
|
$
|
37.4
|
|
|
|||
|
Shares under option — September 30, 2014
|
8,957,290
|
|
$
|
21.44
|
|
$
|
113.3
|
|
7.0
|
|||
|
Options exercisable — September 30, 2012
|
7,976,547
|
|
$
|
16.88
|
|
|
|
|||||
|
Options exercisable — September 30, 2013
|
5,871,091
|
|
$
|
17.95
|
|
|
|
|||||
|
Options exercisable — September 30, 2014
|
5,073,347
|
|
$
|
19.45
|
|
$
|
74.2
|
|
6.0
|
|||
|
Options not exercisable — September 30, 2014
|
3,883,943
|
|
$
|
24.02
|
|
$
|
39.1
|
|
8.5
|
|||
Cash received from stock option exercises and associated tax benefits were
$22.2
and
$13.0
,
$30.8
and
$12.1
, and
$9.4
and
$2.3
in Fiscal
2014
, Fiscal
2013
and Fiscal
2012
, respectively. As of
September 30, 2014
, there was
$6.5
of unrecognized compensation cost associated with unvested stock options that is expected to be recognized over a weighted-average period of
1.7
years.
The following table presents additional information relating to stock options outstanding and exercisable at
September 30, 2014
:
|
|
Range of exercise prices
|
||||||||||||||
|
|
Under
$15.00
|
$15.01 -
$20.00
|
$20.01 -
$25.00
|
Over
$25.00
|
|||||||||||
|
Options outstanding at September 30, 2014:
|
|
|
|
|
|||||||||||
|
Number of options
|
102,000
|
|
3,452,480
|
|
3,500,910
|
|
1,901,900
|
|
|||||||
|
Weighted average remaining contractual life (in years)
|
1.4
|
|
5.7
|
|
7.2
|
|
9.2
|
|
|||||||
|
Weighted average exercise price
|
$
|
14.47
|
|
$
|
18.15
|
|
$
|
21.45
|
|
$
|
27.74
|
|
|||
|
Options exercisable at September 30, 2014:
|
|
|
|
|
|||||||||||
|
Number of options
|
102,000
|
|
2,727,509
|
|
2,077,840
|
|
165,998
|
|
|||||||
|
Weighted average exercise price
|
$
|
14.47
|
|
$
|
17.81
|
|
$
|
21.27
|
|
$
|
26.85
|
|
|||
UGI Stock Option Fair Value Information.
The per share weighted-average fair value of stock options granted under our option plans was
$4.97
in Fiscal
2014
,
$3.29
in Fiscal
2013
and
$2.87
in Fiscal
2012
. These amounts were determined using a Black-Scholes option pricing model which values options based on the stock price at the grant date, the expected life of the option, the estimated volatility of the stock, expected dividend payments and the risk-free interest rate over the expected life of the option. The expected life of option awards represents the period of time during which option grants are expected to be outstanding and is derived from historical exercise patterns. Expected volatility is based on historical volatility of the price of UGI’s Common
F-39
UGI Corporation and Subsidiaries
Notes to Consolidated Financial Statements
(Millions of dollars and euros, except per share amounts and where indicated otherwise)
Stock. Expected dividend yield is based on historical UGI dividend rates. The risk free interest rate is based on U.S. Treasury bonds with terms comparable to the options in effect on the date of grant.
The assumptions we used for valuing option grants during Fiscal
2014
, Fiscal
2013
and Fiscal
2012
are as follows:
|
2014
|
2013
|
2012
|
|||
|
Expected life of option
|
5.75 years
|
5.75 years
|
5.75 years
|
||
|
Weighted average volatility
|
24.3%
|
24.9%
|
24.7%
|
||
|
Weighted average dividend yield
|
2.9%
|
3.6%
|
3.5%
|
||
|
Expected volatility
|
23.7% - 24.4%
|
24.4% - 24.9%
|
24.7%
|
||
|
Expected dividend yield
|
2.7% - 2.9%
|
3.2% - 3.7%
|
3.3% - 3.7%
|
||
|
Risk free rate
|
1.8% - 2.0%
|
0.8% - 1.7%
|
0.8% - 1.1%
|
||
UGI Unit Awards
.
UGI Stock Unit and UGI Performance Unit awards entitle the grantee to shares of UGI Common Stock or cash once the service condition is met and, with respect to UGI Performance Unit awards, subject to market performance conditions. UGI Performance Unit grant recipients are awarded a target number of Performance Units. The number of UGI Performance Units ultimately paid at the end of the performance period (generally
three
years) may be higher or lower than the target amount, or even zero, based on UGI’s Total Shareholder Return (“TSR”) percentile rank relative to (i) companies in the Standard & Poor’s Utilities Index for grants prior to January 1, 2011 and (ii) the Russell Midcap Utility Index, excluding telecommunication companies, for grants on or after January 1, 2011 (each a respective “UGI comparator group”). For grants issued on or after January 1, 2013,
grantees may receive 0% to 200% of the target award granted. For such grants, if UGI’s TSR ranks below the 25th percentile compared to the UGI comparator group, the employee will not be paid. At the 25th percentile, the employee will be paid an award equal to 25% of the target award; at the 40th percentile, 70%; at the 50th percentile, 100%; and at the 90th percentile and above, 200%
. For grants issued prior to January 1, 2013,
grantees may receive 0% to 200% of the target award granted. For such grants, if UGI’s TSR ranks below the 40th percentile compared to the UGI comparator group, the employee will not be paid. At the 40th percentile, the employee will be paid an award equal to 50% of the target award; at the 50th percentile, 100%; and at the 100th percentile, 200%
. The actual amount of the award is interpolated between these percentile rankings. Dividend equivalents are paid in cash only on UGI Performance Units that eventually vest.
The fair value of UGI Stock Units on the grant date is equal to the market price of UGI Stock on the grant date plus the fair value of dividend equivalents if applicable. Under GAAP, UGI Performance Units are equity awards with a market-based condition which, if settled in shares, results in the recognition of compensation cost over the requisite employee service period regardless of whether the market-based condition is satisfied. The fair values of UGI Performance Units are estimated using a Monte Carlo valuation model. The fair value associated with the target award is accounted for as equity and the fair value of the award over the target, as well as all dividend equivalents, is accounted for as a liability. The expected term of the UGI Performance Unit awards is
three years
based on the performance period. Expected volatility is based on the historical volatility of UGI Common Stock over a three-year period. The risk-free interest rate is based on the yields on U.S. Treasury bonds at the time of grant. Volatility for all companies in the UGI comparator groups is based on historical volatility.
The following table summarizes the weighted average assumptions used to determine the fair value of UGI Performance Unit awards and related compensation costs:
|
|
Grants Awarded in Fiscal
|
|||||||
|
|
2014
|
2013
|
2012
|
|||||
|
Risk free rate
|
0.8
|
%
|
0.4
|
%
|
0.4
|
%
|
||
|
Expected life
|
3 years
|
|
3 years
|
|
3 years
|
|
||
|
Expected volatility
|
20.3
|
%
|
21.1
|
%
|
22.2
|
%
|
||
|
Dividend yield
|
2.7
|
%
|
3.3
|
%
|
3.5
|
%
|
||
The weighted-average grant date fair value of UGI Performance Unit awards was estimated to be
$32.32
for Units granted in Fiscal
2014
,
$25.31
for Units granted in Fiscal
2013
and
$18.17
for Units granted in Fiscal
2012
.
F-40
UGI Corporation and Subsidiaries
Notes to Consolidated Financial Statements
(Millions of dollars and euros, except per share amounts and where indicated otherwise)
The following table summarizes UGI Unit award activity for Fiscal
2014
:
|
|
Total
|
Vested
|
Non-Vested
|
|||||||||||||||||
|
Number of
UGI
Units
|
Weighted
Average
Grant Date
Fair Value
(per Unit)
|
Number of
UGI
Units
|
Weighted
Average
Grant Date
Fair Value
(per Unit)
|
Number of
UGI
Units
|
Weighted
Average
Grant Date
Fair Value
(per Unit)
|
|||||||||||||||
|
September 30, 2013
|
1,380,902
|
|
$
|
18.35
|
|
822,975
|
|
$
|
15.45
|
|
557,927
|
|
$
|
22.62
|
|
|||||
|
UGI Performance Units:
|
|
|
|
|
|
|
||||||||||||||
|
Granted
|
189,450
|
|
$
|
32.32
|
|
9,570
|
|
$
|
32.02
|
|
179,880
|
|
$
|
32.33
|
|
|||||
|
Forfeited
|
(7,200
|
)
|
$
|
24.95
|
|
—
|
|
$
|
—
|
|
(7,200
|
)
|
$
|
24.95
|
|
|||||
|
Vested
|
—
|
|
$
|
—
|
|
205,282
|
|
$
|
21.15
|
|
(205,282
|
)
|
$
|
21.15
|
|
|||||
|
Unit awards paid
|
(267,146
|
)
|
$
|
22.17
|
|
(267,146
|
)
|
$
|
22.17
|
|
—
|
|
$
|
—
|
|
|||||
|
UGI Stock Units:
|
|
|
|
|
|
|
||||||||||||||
|
Granted (a)
|
44,814
|
|
$
|
27.41
|
|
43,689
|
|
$
|
27.35
|
|
1,125
|
|
$
|
29.84
|
|
|||||
|
Vested
|
—
|
|
$
|
—
|
|
1,500
|
|
$
|
22.29
|
|
(1,500
|
)
|
$
|
22.29
|
|
|||||
|
Unit awards paid
|
(34,639
|
)
|
$
|
14.41
|
|
(34,639
|
)
|
$
|
14.41
|
|
—
|
|
$
|
—
|
|
|||||
|
September 30, 2014
|
1,306,181
|
|
$
|
20.58
|
|
781,231
|
|
$
|
16.60
|
|
524,950
|
|
$
|
26.51
|
|
|||||
|
(a)
|
Generally, shares granted under UGI Stock Unit awards are paid
approximately 70% in shares
. UGI Stock Unit awards granted in Fiscal 2013 and Fiscal 2012 were
51,038
and
63,668
, respectively.
|
During Fiscal
2014
, Fiscal
2013
and Fiscal
2012
, the Company paid UGI Performance Unit and UGI Stock Unit awards in shares and cash as follows:
|
2014
|
2013
|
2012
|
|||||||||
|
UGI Performance Unit awards:
|
|
|
|
||||||||
|
Number of original awards granted
|
331,038
|
|
328,025
|
|
316,125
|
|
|||||
|
Fiscal year granted
|
2011
|
|
2010
|
|
2009
|
|
|||||
|
Payment of awards:
|
|
|
|
||||||||
|
Shares of UGI Common Stock issued
|
174,168
|
|
97,622
|
|
—
|
|
|||||
|
Cash paid
|
$
|
3.1
|
|
$
|
1.6
|
|
$
|
—
|
|
||
|
UGI Stock Unit awards:
|
|
|
|
||||||||
|
Number of original awards granted
|
34,639
|
|
54,269
|
|
49,347
|
|
|||||
|
Payment of awards:
|
|
|
|
||||||||
|
Shares of UGI Common Stock issued
|
22,604
|
|
35,274
|
|
32,636
|
|
|||||
|
Cash paid
|
$
|
0.4
|
|
$
|
0.5
|
|
$
|
0.2
|
|
||
During Fiscal
2014
, Fiscal
2013
and Fiscal
2012
, we granted UGI Unit awards representing
234,264
,
381,900
and
359,768
shares, respectively, having weighted-average grant date fair values per Unit of
$31.38
,
$24.87
and
$18.45
, respectively.
As of
September 30, 2014
, there was a total of approximately
$8.8
of unrecognized compensation cost associated with
1,306,181
UGI Unit awards outstanding that is expected to be recognized over a weighted-average period of
1.7
years. The total fair values of UGI Units that vested during Fiscal
2014
, Fiscal
2013
and Fiscal
2012
were
$8.7
,
$6.0
and
$3.6
, respectively. As of
September 30, 2014
and
2013
, total liabilities of
$18.5
and
$8.0
, respectively, associated with UGI Unit awards are reflected in employee compensation and benefits accrued and other noncurrent liabilities in the Consolidated Balance Sheets.
At
September 30, 2014
,
17,499,524
shares of Common Stock were available for future grants under the 2013 OICP, and up to
172,646
shares of Common Stock were available for future grants of stock options under the 2004 OECP.
F-41
UGI Corporation and Subsidiaries
Notes to Consolidated Financial Statements
(Millions of dollars and euros, except per share amounts and where indicated otherwise)
AmeriGas Partners Equity-Based Compensation Plans and Awards.
Under the AmeriGas Propane, Inc. 2010 Long-Term Incentive Plan on Behalf of AmeriGas Partners, L.P. (“2010 Propane Plan”), the General Partner may award to employees and non-employee directors grants of AmeriGas Partners Units (comprising “AmeriGas Stock Units” and “AmeriGas Performance Units”), options, unit appreciation rights and other Common Unit-based awards. The total aggregate number of Common Units that may be issued under the 2010 Propane Plan is
2,800,000
. The exercise price for options may not be less than the fair market value on the date of grant. Awards granted under the 2010 Propane Plan may vest immediately or ratably over a period of years, and options can be exercised no later than
ten years
from the grant date. In addition, the 2010 Propane Plan provides that Common Unit-based awards may also provide for the crediting of Common Unit distribution equivalents to participants’ accounts.
AmeriGas Stock Unit and AmeriGas Performance Unit awards entitle the grantee to AmeriGas Partners Common Units or cash once the service condition is met and, with respect to AmeriGas Performance Units, subject to market performance conditions. Recipients of AmeriGas Performance Unit awards are awarded a target number of AmeriGas Performance Units. The number of AmeriGas Performance Units ultimately paid at the end of the performance period (generally
three years
) may be higher or lower than the target number, or it may be zero, based upon AmeriGas Partners’ Total Unitholder Return (“TUR”) percentile rank relative to entities in a master limited partnership peer group (“Alerian MLP Group”) and, for certain AmeriGas Performance Unit awards granted beginning in January 2014, based upon AmeriGas Partners’ TUR relative to the two other publicly traded propane master limited partnerships in the Alerian MLP Group (“Propane MLP Group”).
With respect to AmeriGas Performance Unit awards subject to measurement compared with the Alerian MLP Group, grantees may receive from 0% to 200% of the target award granted. For grants issued on or after January 1, 2013, if AmeriGas Partners’ TUR is below the 25th percentile compared to the peer group, the grantee will not be paid. At the 25th percentile, the employee will be paid an award equal to 25% of the target award; at the 40th percentile, 70%; at the 50th percentile, 100%; at the 60th percentile, 125%; at the 75th percentile, 162.5%; and at the 90th percentile or above, 200%. For grants issued before January 1, 2013, grantees of AmeriGas Performance Units will not be paid if AmeriGas Partners’ TUR is below the 40th percentile of the Alerian MLP Group. At the 40th percentile, the grantee will be paid an award equal to 50% of the target award; at the 50th percentile, 100%; at the 60th percentile, 125%; at the 75th percentile, 150%; at the 90th percentile, 175%; and at the 100th percentile, 200%. The actual amount of the award is interpolated between these percentile rankings.
With respect to AmeriGas Performance Unit awards subject to measurement compared with the Propane MLP Group, grantees will receive 150% of the target award if AmeriGas Partners’ TUR exceeds the TUR of all the other members in the Propane MLP Group. Otherwise there will be no payout of such AmeriGas Performance Units. If one of the other two members of the Propane MLP Group ceases to exist as a publicly traded company or declares bankruptcy (“MLP Event”), the ultimate amount of such AmeriGas Performance Unit awards to be issued, and the amount of distribution equivalents to be paid, will depend upon AmeriGas Partners’ TUR rank relative to (1) the Alerian MLP Group for the entire performance period; (2) the Alerian MLP Group for the entire performance period and the Propane MLP Group through the date of the MLP Event; or (3) the Propane MLP Group through the date of the MLP Event.
Any Common Unit distribution equivalents earned are paid in cash. Generally, except in the event of retirement, death or disability, each grant, unless paid, will terminate when the participant ceases to be employed by the General Partner. There are certain change of control and retirement eligibility conditions that, if met, generally result in accelerated vesting or elimination of further service requirements.
Under GAAP, AmeriGas Performance Units are equity awards with a market-based condition which, if settled in Common Units, results in the recognition of compensation cost over the requisite employee service period regardless of whether the market-based condition is satisfied. The fair values of AmeriGas Performance Units are estimated using a Monte Carlo valuation model. The fair value associated with the target award will be paid in Common Units, is accounted for as equity and the fair value of the award over the target, as well as all Common Unit distribution equivalents, which will be paid in cash, is accounted for as a liability. The expected term of the AmeriGas Performance Unit awards is
three years
based on the performance period. Expected volatility is based on the historical volatility of Common Units over a three-year period. The risk-free interest rate is based on the rates on U.S. Treasury bonds at the time of grant. Volatility for all limited partnerships in the peer group is based on historical volatility.
F-42
UGI Corporation and Subsidiaries
Notes to Consolidated Financial Statements
(Millions of dollars and euros, except per share amounts and where indicated otherwise)
The following table summarizes the weighted-average assumptions used to determine the fair value of AmeriGas Performance Unit awards and related compensation costs:
|
|
Grants Awarded in Fiscal
|
|||||||
|
|
2014
|
2013
|
2012
|
|||||
|
Risk-free rate
|
0.8
|
%
|
0.4
|
%
|
0.4
|
%
|
||
|
Expected life
|
3 years
|
|
3 years
|
|
3 years
|
|
||
|
Expected volatility
|
21.1
|
%
|
20.7
|
%
|
23.0
|
%
|
||
|
Dividend yield
|
7.5
|
%
|
8.2
|
%
|
6.4
|
%
|
||
The General Partner granted awards under the 2010 Propane Plan representing
86,458
,
65,136
and
248,818
Common Units in Fiscal
2014
, Fiscal
2013
and Fiscal
2012
, respectively, having weighted-average grant date fair values per Common Unit subject to award of
$43.34
,
$42.58
and
$43.22
, respectively. At
September 30, 2014
,
2,443,808
Common Units were available for future award grants under the 2010 Propane Plan.
The following table summarizes AmeriGas Common Unit-based award activity for Fiscal
2014
:
|
|
Total
|
Vested
|
Non-Vested
|
|||||||||||||||||
|
Number of
AmeriGas
Partners
Common
Units
Subject
to Award
|
Weighted
Average
Grant Date
Fair Value
(per Unit)
|
Number of
AmeriGas
Partners
Common
Units
Subject
to Award
|
Weighted
Average
Grant Date
Fair Value
(per Unit)
|
Number of
AmeriGas
Partners
Common
Units
Subject
to Award
|
Weighted
Average
Grant Date
Fair Value
(per Unit)
|
|||||||||||||||
|
September 30, 2013
|
224,167
|
|
$
|
47.88
|
|
47,715
|
|
$
|
47.92
|
|
176,452
|
|
$
|
47.87
|
|
|||||
|
AmeriGas Performance Units:
|
|
|
|
|
|
|
|
|
|
|
|
|
||||||||
|
Granted
|
53,800
|
|
$
|
41.50
|
|
633
|
|
$
|
41.37
|
|
53,167
|
|
$
|
41.50
|
|
|||||
|
Forfeited
|
(8,150
|
)
|
$
|
45.96
|
|
—
|
|
$
|
—
|
|
(8,150
|
)
|
$
|
45.96
|
|
|||||
|
Vested
|
—
|
|
$
|
—
|
|
15,319
|
|
$
|
53.93
|
|
(15,319
|
)
|
$
|
53.93
|
|
|||||
|
Performance criteria not met
|
(31,317
|
)
|
$
|
54.51
|
|
(31,317
|
)
|
$
|
54.51
|
|
—
|
|
$
|
—
|
|
|||||
|
AmeriGas Stock Units:
|
||||||||||||||||||||
|
Granted
|
32,658
|
|
$
|
46.37
|
|
15,936
|
|
$
|
48.00
|
|
16,722
|
|
$
|
44.81
|
|
|||||
|
Forfeited
|
(7,783
|
)
|
$
|
51.10
|
|
—
|
|
$
|
—
|
|
(7,783
|
)
|
$
|
(51.10
|
)
|
|||||
|
Vested
|
—
|
|
$
|
—
|
|
52,061
|
|
$
|
47.58
|
|
(52,061
|
)
|
$
|
47.58
|
|
|||||
|
Awards paid
|
(63,140
|
)
|
$
|
48.00
|
|
(63,140
|
)
|
$
|
48.00
|
|
—
|
|
$
|
—
|
|
|||||
|
September 30, 2014
|
200,235
|
|
$
|
44.82
|
|
37,207
|
|
$
|
44.27
|
|
163,028
|
|
$
|
44.95
|
|
|||||
F-43
UGI Corporation and Subsidiaries
Notes to Consolidated Financial Statements
(Millions of dollars and euros, except per share amounts and where indicated otherwise)
During Fiscal
2014
, Fiscal
2013
and Fiscal
2012
, the Partnership paid AmeriGas Performance Unit and AmeriGas Stock Unit awards in Common Units and cash as follows:
|
2014
|
2013
|
2012
|
|||||||||
|
AmeriGas Performance Unit awards:
|
|||||||||||
|
Number of Common Units subject to original awards granted
|
41,251
|
|
48,150
|
|
53,600
|
|
|||||
|
Fiscal year granted
|
2011
|
|
2010
|
|
2009
|
|
|||||
|
Payment of awards:
|
|
|
|
||||||||
|
AmeriGas Partners Common Units issued
|
—
|
|
—
|
|
—
|
|
|||||
|
Cash paid
|
$
|
—
|
|
$
|
—
|
|
$
|
—
|
|
||
|
AmeriGas Stock Unit awards:
|
|||||||||||
|
Number of Common Units subject to original awards granted
|
72,023
|
|
35,934
|
|
67,246
|
|
|||||
|
Payment of awards:
|
|||||||||||
|
AmeriGas Partners Common Units issued
|
40,842
|
|
23,192
|
|
44,016
|
|
|||||
|
Cash paid
|
$
|
1.4
|
|
$
|
0.6
|
|
$
|
1.0
|
|
||
As of
September 30, 2014
, there was a total of approximately
$2.9
of unrecognized compensation cost associated with
200,235
Common Units subject to award that is expected to be recognized over a weighted-average period of
1.7
years. The total fair values of Common Unit-based awards that vested during Fiscal
2014
, Fiscal
2013
and Fiscal
2012
were
$4.1
,
$2.8
and
$5.1
, respectively. As of
September 30, 2014
and
2013
, total liabilities of
$1.5
and
$1.1
associated with Common Unit-based awards are reflected in employee compensation and benefits accrued and other noncurrent liabilities in the Consolidated Balance Sheets.
The Partnership makes distributions to its partners approximately
45 days after the end of each fiscal quarter in a total amount equal to its Available Cash (as defined in the Partnership Agreement) for such quarter
. Available Cash generally means:
|
1.
|
all cash on hand at the end of such quarter,
|
|
2.
|
plus all additional cash on hand as of the date of determination resulting from borrowings after the end of such quarter,
|
|
3.
|
less the amount of cash reserves established by the General Partner in its reasonable discretion.
|
The General Partner may establish reserves for the proper conduct of the Partnership’s business and for distributions during the next four quarters.
Distributions of Available Cash are made
98%
to limited partners and
2%
to the General Partner (representing a
1%
General Partner interest in AmeriGas Partners and
1.01%
interest in AmeriGas OLP) until Available Cash exceeds the Minimum Quarterly Distribution of
$0.55
and the First Target Distribution of
$0.055
per Common Unit (or a total of
$0.605
per Common Unit).
When Available Cash exceeds $0.605 per Common Unit in any quarter, the General Partner will receive a greater percentage of the total Partnership distribution (the “incentive distribution”) but only with respect to the amount by which the distribution per Common Unit to limited partners exceeds $0.605
.
During Fiscal
2014
, Fiscal
2013
and Fiscal
2012
, the Partnership made quarterly distributions to Common Unitholders in excess of
$0.605
per limited partner unit. As a result, the General Partner has received a greater percentage of the total Partnership distribution than its aggregate
2%
general partner interest in AmeriGas OLP and AmeriGas Partners. During Fiscal
2014
, Fiscal
2013
and Fiscal
2012
, the total amount of distributions received by the General Partner with respect to its aggregate
2%
general partner ownership interests totaled
$32.4
,
$27.4
and
$19.7
, respectively. Included in these amounts are incentive distributions received by the General Partner during Fiscal
2014
, Fiscal
2013
and Fiscal
2012
of
$23.9
,
$19.3
and
$13.0
, respectively.
In March 2012, AmeriGas Partners sold
7,000,000
Common Units in an underwritten public offering at a public offering price of
$41.25
per unit. The net proceeds of the public offering totaling
$276.6
and the associated capital contributions from the General Partner totaling
$2.8
were used to redeem
$200
of AmeriGas Partners’
6.50%
Senior Notes pursuant to a tender offer (see
Note 6
), to reduce bank loan borrowings and for general partnership purposes.
F-44
UGI Corporation and Subsidiaries
Notes to Consolidated Financial Statements
(Millions of dollars and euros, except per share amounts and where indicated otherwise)
Commitments
We lease various buildings and other facilities and vehicles, computer and office equipment under operating leases. Certain of our leases contain renewal and purchase options and also contain step-rent provisions. Our aggregate rental expense for such leases was
$79.7
in Fiscal
2014
,
$82.5
in Fiscal
2013
and
$77.9
in Fiscal
2012
.
Minimum future payments under operating leases with non-affiliates that have initial or remaining noncancelable terms in excess of one year are as follows:
|
2015
|
2016
|
2017
|
2018
|
2019
|
After 2019
|
||||||||||||||||||
|
AmeriGas Propane
|
$
|
56.2
|
|
$
|
46.6
|
|
$
|
36.5
|
|
$
|
30.6
|
|
$
|
25.9
|
|
$
|
63.0
|
|
|||||
|
UGI Utilities
|
6.7
|
|
6.2
|
|
4.5
|
|
3.7
|
|
1.4
|
|
0.7
|
|
|||||||||||
|
UGI International
|
7.8
|
|
6.1
|
|
4.4
|
|
2.0
|
|
0.4
|
|
0.5
|
|
|||||||||||
|
Other
|
1.9
|
|
1.8
|
|
0.9
|
|
0.6
|
|
0.4
|
|
0.3
|
|
|||||||||||
|
Total
|
$
|
72.6
|
|
$
|
60.7
|
|
$
|
46.3
|
|
$
|
36.9
|
|
$
|
28.1
|
|
$
|
64.5
|
|
|||||
Our businesses enter into contracts of varying lengths and terms to meet their supply, pipeline transportation, storage, capacity and energy needs. Gas Utility currently has gas supply agreements with producers and marketers with terms not exceeding
16
months. Gas Utility also has agreements for firm pipeline transportation and natural gas storage services, which Gas Utility may terminate at various dates through Fiscal
2030
. Gas Utility’s costs associated with transportation and storage capacity agreements are included in its annual PGC filings with the PUC and are recoverable through PGC rates. In addition, Gas Utility has short-term gas supply agreements which permit it to purchase certain of its gas supply needs on a firm or interruptible basis at spot-market prices. Electric Utility purchases its electricity needs under contracts with various suppliers and on the spot market. Contracts with producers for energy needs expire at various dates through Fiscal
2016
. Midstream & Marketing enters into fixed-price contracts with suppliers to purchase natural gas and electricity to meet its sales commitments. Generally, these contracts have terms of less than
two
years. The Partnership enters into fixed-price and variable-price contracts to purchase a portion of its supply requirements. These contracts currently have terms that do not exceed
three
years. UGI International enters into fixed-price and variable-priced contracts to purchase a portion of its supply requirements that currently do not exceed
three
years.
The following table presents contractual obligations with non-affiliates under Gas Utility, Electric Utility, Midstream & Marketing, AmeriGas Propane and UGI International supply, storage and service contracts existing at
September 30, 2014
:
|
2015
|
2016
|
2017
|
2018
|
2019
|
After 2019
|
||||||||||||||||||
|
UGI Utilities supply, storage and transportation contracts
|
$
|
156.9
|
|
$
|
66.8
|
|
$
|
44.9
|
|
$
|
30.8
|
|
$
|
23.6
|
|
$
|
66.4
|
|
|||||
|
Midstream & Marketing supply contracts
|
302.1
|
|
107.0
|
|
42.1
|
|
4.3
|
|
—
|
|
—
|
|
|||||||||||
|
AmeriGas Propane supply contracts
|
130.8
|
|
74.3
|
|
—
|
|
—
|
|
—
|
|
—
|
|
|||||||||||
|
UGI International supply contracts
|
144.7
|
|
72.8
|
|
—
|
|
—
|
|
—
|
|
—
|
|
|||||||||||
|
Total
|
$
|
734.5
|
|
$
|
320.9
|
|
$
|
87.0
|
|
$
|
35.1
|
|
$
|
23.6
|
|
$
|
66.4
|
|
|||||
The Partnership and UGI International also enter into other contracts to purchase LPG to meet supply requirements. Generally, these contracts are
one
- to
three
-year agreements subject to annual price and quantity adjustments.
F-45
UGI Corporation and Subsidiaries
Notes to Consolidated Financial Statements
(Millions of dollars and euros, except per share amounts and where indicated otherwise)
Contingencies
Environmental Matters
UGI Utilities
CPG is party to a Consent Order and Agreement (“CPG-COA”) with the DEP requiring CPG to perform a specified level of activities associated with environmental investigation and remediation work at certain properties in Pennsylvania on which MGP related facilities were operated (“CPG MGP Properties”) and to plug a minimum number of non-producing natural gas wells per year. In addition, PNG is a party to a Multi-Site Remediation Consent Order and Agreement (“PNG-COA”) with the DEP. The PNG-COA requires PNG to perform annually a specified level of activities associated with environmental investigation and remediation work at certain properties on which MGP-related facilities were operated (“PNG MGP Properties”). Under these agreements, environmental expenditures relating to the CPG MGP Properties and the PNG MGP Properties are capped at
$1.8
and
$1.1
, respectively, in any calendar year. The CPG-COA is scheduled to terminate at the end of 2018. The PNG-COA terminates in 2019 but may be terminated by either party effective at the end of any
two
-year period beginning with the original effective date in March 2004. At
September 30, 2014
and
2013
, our accrued liabilities for environmental investigation and remediation costs related to the CPG-COA and the PNG-COA totaled
$10.7
and
$14.0
, respectively. In accordance with GAAP related to rate-regulated entities, we have recorded associated regulatory assets in equal amounts.
From the late 1800s through the mid-1900s, UGI Utilities and its former subsidiaries owned and operated a number of MGPs prior to the general availability of natural gas. Some constituents of coal tars and other residues of the manufactured gas process are today considered hazardous substances under the Superfund Law and may be present on the sites of former MGPs. Between 1882 and 1953, UGI Utilities owned the stock of subsidiary gas companies in Pennsylvania and elsewhere and also operated the businesses of some gas companies under agreement. Pursuant to the requirements of the Public Utility Holding Company Act of 1935, by the early 1950s UGI Utilities divested all of its utility operations other than certain Pennsylvania operations, including those which now constitute UGI Gas and Electric Utility.
UGI Utilities does not expect its costs for investigation and remediation of hazardous substances at Pennsylvania MGP sites to be material to its results of operations because (1) UGI Gas is currently permitted to include in rates, through future base rate proceedings, a
five
-year average of such prudently incurred remediation costs and (2) CPG and PNG are currently receiving regulatory recovery of estimated environmental investigation and remediation costs associated with Pennsylvania sites. At
September 30, 2014
, neither the undiscounted nor the accrued liability for environmental investigation and cleanup costs for UGI Gas was material.
From time to time, UGI Utilities is notified of sites outside Pennsylvania on which private parties allege MGPs were formerly owned or operated by UGI Utilities or owned or operated by its former subsidiaries. Such parties generally investigate the extent of environmental contamination or perform environmental remediation. Management believes that under applicable law UGI Utilities should not be liable in those instances in which a former subsidiary owned or operated an MGP. There could be, however, significant future costs of an uncertain amount associated with environmental damage caused by MGPs outside Pennsylvania that UGI Utilities directly operated, or that were owned or operated by former subsidiaries of UGI Utilities if a court were to conclude that (1) the subsidiary’s separate corporate form should be disregarded or (2) UGI Utilities should be considered to have been an operator because of its conduct with respect to its subsidiary’s MGP.
Other Matters
Federal Trade Commission Investigation of Propane Grill Cylinder Filling Practices.
On or about November 4, 2011, the General Partner received notice that the Federal Trade Commission (“FTC”) had initiated an antitrust and consumer protection investigation into certain practices of the Partnership relating to the filling of portable propane cylinders. On February 2, 2012, the Partnership received a Civil Investigative Demand from the FTC that requested documents and information concerning, among other things, (i) the Partnership’s decision, in 2008, to reduce the volume of propane in cylinders it sells to consumers from
17
pounds to
15
pounds, and (ii) cross-filling, related service arrangements and communications regarding the foregoing with competitors. The Partnership responded to that subpoena and cooperated with subsequent requests for information. On March 27, 2014, the FTC issued an administrative complaint against the Partnership and UGI alleging that the General Partner and one of its competitors colluded in 2008 to persuade its common customer, Walmart Stores, Inc., to accept the cylinder fill reduction from
17
pounds to
15
pounds. The complaint does not seek monetary remedies. The Partnership and UGI filed their answer to the complaint on April 18, 2014. On August 25, 2014, the parties entered into an Agreement Containing Consent Orders, and on August 27, 2014, the FTC issued an Order Withdrawing Matter from Adjudication for the Purpose of Considering a Proposed Consent Agreement.
F-46
UGI Corporation and Subsidiaries
Notes to Consolidated Financial Statements
(Millions of dollars and euros, except per share amounts and where indicated otherwise)
The consent agreement was accepted by the FTC on October 31, 2014, and is subject to a
30-day
public comment period. Thereafter, the FTC may either withdraw its acceptance of the consent agreement or issue its decision and order in settlement of the proceeding.
Purported Class Action Lawsuits.
Following the issuance of the FTC’s administrative complaint described above, more than
35
class action lawsuits were filed in multiple jurisdictions against the Partnership/UGI Corporation and a competitor by certain of their direct and indirect customers. The class action lawsuits allege that the Partnership and its competitor colluded in 2008 to reduce the fill level and combined to persuade its common customer, Walmart Stores, Inc., to accept that fill reduction, resulting in increased cylinder costs to retailers and end-user customers in violation of federal and certain state antitrust laws. The claims seek treble damages, injunctive relief, attorneys’ fees and costs on behalf of the putative classes. On October 16, 2014, the United States Judicial Panel on Multidistrict Litigation transferred all of these purported class action cases to the Western Division of the Western District of Missouri. We are unable to reasonably estimate the impact, if any, arising from such litigation. We believe we have strong defenses to the claims and intend to vigorously defend against them.
In addition to the matters described above, there are other pending claims and legal actions arising in the normal course of our businesses. Although we cannot predict the final results of these pending claims and legal actions, we believe, after consultation with counsel, that the final outcome of these matters will not have a material effect on our consolidated financial position, results of operations or cash flows.
F-47
UGI Corporation and Subsidiaries
Notes to Consolidated Financial Statements
(Millions of dollars and euros, except per share amounts and where indicated otherwise)
Derivative Instruments
The following table presents on a gross basis our financial assets and liabilities including both current and noncurrent portions, that are measured at fair value on a recurring basis within the fair value hierarchy as described in
Note 2
, as of
September 30, 2014
and
2013
:
|
|
Asset (Liability)
|
||||||||||||||
|
Level 1
|
Level 2
|
Level 3
|
Total
|
||||||||||||
|
September 30, 2014:
|
|
|
|
|
|||||||||||
|
Derivative instruments:
|
|
|
|
|
|||||||||||
|
Assets:
|
|
|
|
|
|||||||||||
|
Commodity contracts
|
$
|
10.6
|
|
$
|
19.8
|
|
$
|
—
|
|
$
|
30.4
|
|
|||
|
Foreign currency contracts
|
$
|
—
|
|
$
|
12.8
|
|
$
|
—
|
|
$
|
12.8
|
|
|||
|
Cross-currency swaps
|
$
|
—
|
|
$
|
2.1
|
|
$
|
—
|
|
$
|
2.1
|
|
|||
|
Interest rate contracts
|
$
|
—
|
|
$
|
0.1
|
|
$
|
—
|
|
$
|
0.1
|
|
|||
|
Liabilities:
|
|
|
|
|
|||||||||||
|
Commodity contracts
|
$
|
(21.2
|
)
|
$
|
(32.9
|
)
|
$
|
—
|
|
$
|
(54.1
|
)
|
|||
|
Foreign currency contracts
|
$
|
—
|
|
$
|
(0.1
|
)
|
$
|
—
|
|
$
|
(0.1
|
)
|
|||
|
Interest rate contracts
|
$
|
—
|
|
$
|
(21.0
|
)
|
$
|
—
|
|
$
|
(21.0
|
)
|
|||
|
Non-qualified supplemental postretirement grantor trust investments (a)
|
$
|
30.0
|
|
$
|
—
|
|
$
|
—
|
|
$
|
30.0
|
|
|||
|
September 30, 2013 (b):
|
|
|
|
|
|||||||||||
|
Derivative instruments:
|
|
|
|
|
|||||||||||
|
Assets:
|
|
|
|
|
|||||||||||
|
Commodity contracts
|
$
|
2.6
|
|
$
|
22.8
|
|
$
|
—
|
|
$
|
25.4
|
|
|||
|
Foreign currency contracts
|
$
|
—
|
|
$
|
0.9
|
|
$
|
—
|
|
$
|
0.9
|
|
|||
|
Liabilities:
|
|
|
|
|
|||||||||||
|
Commodity contracts
|
$
|
(8.8
|
)
|
$
|
(9.3
|
)
|
$
|
—
|
|
$
|
(18.1
|
)
|
|||
|
Foreign currency contracts
|
$
|
—
|
|
$
|
(7.2
|
)
|
$
|
—
|
|
$
|
(7.2
|
)
|
|||
|
Interest rate contracts
|
$
|
—
|
|
$
|
(31.0
|
)
|
$
|
—
|
|
$
|
(31.0
|
)
|
|||
|
Cross-currency swaps
|
$
|
—
|
|
$
|
(1.2
|
)
|
$
|
—
|
|
$
|
(1.2
|
)
|
|||
|
Non-qualified supplemental postretirement grantor trust investments (a)
|
$
|
27.1
|
|
$
|
—
|
|
$
|
—
|
|
$
|
27.1
|
|
|||
|
(a)
|
Consists primarily of mutual fund investments held in grantor trusts associated with non-qualified supplemental retirement plans (see
Note 8
).
|
|
(b)
|
Certain immaterial amounts have been revised to correct the classification of derivatives.
|
The fair values of our Level 1 exchange-traded commodity futures and option contracts and non exchange-traded commodity futures and forward contracts are based upon actively-quoted market prices for identical assets and liabilities. The remainder of our derivative instruments are designated as Level 2. The fair values of certain non-exchange traded commodity derivatives designated as Level 2 are based upon indicative price quotations available through brokers, industry price publications or recent market transactions and related market indicators. For commodity option contracts designated as Level 2 which are not traded on an exchange, we use a Black Scholes option pricing model that considers time value and volatility of the underlying commodity.
F-48
UGI Corporation and Subsidiaries
Notes to Consolidated Financial Statements
(Millions of dollars and euros, except per share amounts and where indicated otherwise)
The fair values of our Level 2 interest rate contracts and foreign currency contracts are based upon third-party quotes or indicative values based on recent market transactions. The fair values of investments held in grantor trusts are derived from quoted market prices as substantially all of the investments in these trusts have active markets. There were no transfers between Level 1 and Level 2 during the periods presented.
Other Financial Instruments
The carrying amounts of other financial instruments included in current assets and current liabilities (except for current maturities of long-term debt) approximate their fair values because of their short-term nature. At
September 30, 2014
, the carrying amount and estimated fair value of our long-term debt (including current maturities) were
$3,510.8
and
$3,686.1
, respectively. At
September 30, 2013
, the carrying amount and estimated fair value of our long-term debt (including current maturities) were
$3,609.4
and
$3,761.8
, respectively. We estimate the fair value of long-term debt by using current market rates and by discounting future cash flows using rates available for similar type debt (Level 2).
Financial instruments other than derivative instruments, such as our short-term investments and trade accounts receivable, could expose us to concentrations of credit risk. We limit our credit risk from short-term investments by investing only in investment-grade commercial paper, money market mutual funds, securities guaranteed by the U.S. Government or its agencies and FDIC insured bank deposits. The credit risk from trade accounts receivable is limited because we have a large customer base which extends across many different U.S. markets and several foreign countries. For information regarding concentrations of credit risk associated with our derivative instruments, see
Note 18
. Our investment in a private equity partnership is measured at fair value on a non-recurring basis. Generally this measurement uses Level 3 fair value inputs because the investment does not have a readily available market value.
We are exposed to certain market risks related to our ongoing business operations. Management uses derivative financial and commodity instruments, among other things, to manage these risks. The primary risks managed by derivative instruments are (1) commodity price risk, (2) interest rate risk and (3) foreign currency exchange rate risk. Although we use derivative financial and commodity instruments to reduce market risk associated with forecasted transactions, we do not use derivative financial and commodity instruments for speculative or trading purposes. The use of derivative instruments is controlled by our risk management and credit policies which govern, among other things, the derivative instruments we can use, counterparty credit limits and contract authorization limits. For information on the accounting for our derivative instruments, see
Note 2
.
Commodity Price Risk
In order to manage market price risk associated with the Partnership’s fixed-price programs the Partnership uses over-the-counter derivative commodity instruments, principally price swap contracts. In addition, the Partnership, certain other domestic business units and our UGI International operations also use over-the-counter price swap and option contracts to reduce commodity price volatility associated with a portion of their forecasted LPG purchases. In addition, the Partnership from time to time enters into price swap and put option agreements to reduce the effects of short-term commodity price volatility. At September 30, 2014 and 2013, total volumes associated with LPG commodity derivative instruments totaled
344.5 million
gallons and
279.0 million
gallons, respectively. The maximum period over which we are economically hedging our exposure to LPG commodity price risk is
21
months.
Gas Utility’s tariffs contain clauses that permit recovery of all of the prudently incurred costs of natural gas it sells to retail core-market customers, including the cost of financial instruments used to hedge purchased gas costs. As permitted and agreed to by the PUC pursuant to Gas Utility’s annual PGC filings, Gas Utility currently uses New York Mercantile Exchange (“NYMEX”) natural gas futures and option contracts to reduce commodity price volatility associated with a portion of the natural gas it purchases for its retail core-market customers. At
September 30, 2014
and
2013
, the volumes of natural gas associated with Gas Utility’s unsettled NYMEX natural gas futures and option contracts totaled
16.9
million dekatherms and
15.0
million dekatherms, respectively. At
September 30, 2014
, the maximum period over which Gas Utility is economically hedging natural gas market price risk is
12
months. Gains and losses on natural gas futures contracts and any gains on natural gas option contracts are recorded in regulatory assets or liabilities on the Consolidated Balance Sheets in accordance with GAAP related to rate-regulated entities and reflected in cost of sales through the PGC mechanism (see
Note 9
).
Electric Utility’s DS tariffs permit the recovery of all prudently incurred costs of electricity it sells to DS customers, including the cost of financial instruments used to hedge electricity costs. Electric Utility enters into forward electricity purchase contracts to
F-49
UGI Corporation and Subsidiaries
Notes to Consolidated Financial Statements
(Millions of dollars and euros, except per share amounts and where indicated otherwise)
meet a substantial portion of its electricity supply needs. Because most of these contracts currently do not qualify for the NPNS exception under GAAP, the fair values of these contracts are reflected in current and noncurrent derivative instrument assets and liabilities in the accompanying Consolidated Balance Sheets. Associated gains and losses on these forward contracts are recorded in regulatory assets and liabilities on the Consolidated Balance Sheets in accordance with GAAP related to rate-regulated entities and reflected in cost of sales through the DS mechanism (see Note 9). At
September 30, 2014
and
2013
, the volumes of Electric Utility’s forward electricity purchase contracts were
237.0
million kilowatt hours and
245.8
million kilowatt hours, respectively. At
September 30, 2014
, the maximum period over which these contracts extend is
8
months.
In order to reduce volatility associated with a substantial portion of its electricity transmission congestion costs, Electric Utility obtains FTRs through an annual allocation process. Midstream & Marketing purchases FTRs to economically hedge electricity transmission congestion costs associated with its fixed-price electricity sales contracts and from time to time also enters into New York Independent System Operator (“NYISO”) capacity swap contracts to economically hedge the locational basis differences for customers it serves on the NYISO electricity grid. Gains and losses on Electric Utility FTRs are recorded in regulatory assets or liabilities in accordance with GAAP related to rate-regulated entities and reflected in cost of sales through the DS recovery mechanism (see
Note 9
). At
September 30, 2014
and
2013
, the total volumes associated with FTRs and NYISO capacity contracts totaled
232.1
million kilowatt hours and
189.3
million kilowatt hours, respectively. At
September 30, 2014
, the maximum period over which we are economically hedging electricity congestion and locational basis differences is
8
months.
In order to manage market price risk relating to fixed-price sales contracts for natural gas and electricity, Midstream & Marketing enters into NYMEX and over-the-counter natural gas futures contracts, IntercontinentalExchange (“ICE”) natural gas basis swap contracts, and electricity futures contracts. Midstream & Marketing also uses NYMEX and over the counter electricity futures contracts to hedge the price of a portion of its anticipated future sales of electricity from its electric generation facilities. In addition, Midstream & Marketing uses NYMEX futures contracts to economically hedge the gross margin associated with the purchase and anticipated later near-term sale of natural gas or propane. During the second quarter of Fiscal 2014, Energy Services determined that it could no longer assert the NPNS exception under GAAP for new contracts entered into for the forward purchase of natural gas and pipeline transportation. These contracts, as well as other Midstream & Marketing derivative instruments described above, are not accounted for as hedges under GAAP. These derivative instruments are recorded at fair value with changes in fair value reflected in income.
At
September 30, 2014
and
2013
, total volumes associated with Midstream & Marketing’s natural gas futures, forward and pipeline contracts totaled
113.7 million
dekatherms and
24.3 million
dekatherms, respectively. At
September 30, 2014
, the maximum period over which we are hedging our exposure to the variability in cash flows associated with natural gas commodity price risk is
41
months. At
September 30, 2014
and
2013
, total volumes associated with Midstream & Marketing’s electricity call contracts and electricity put contracts totaled
394.4 million
kilowatt hours and
206.6 million
kilowatt hours, and
754.4 million
kilowatt hours and
393.0 million
kilowatt hours, respectively. At
September 30, 2014
, the maximum period over which we are hedging our exposure to the variability in cash flows associated with electricity commodity price risk (excluding Electric Utility) is
24
months for electricity call contracts and
12
months for electricity put contracts. At
September 30, 2014
, the volumes associated with Midstream & Marketing’s natural gas and propane storage NYMEX contracts totaled
3.9
million dekatherms and
1.3
million gallons, respectively. At
September 30, 2013
, the volumes associated with Midstream & Marketing’s natural gas and propane storage NYMEX contracts totaled
2.9 million
dekatherms and
2.8 million
gallons, respectively.
In order to reduce operating expense volatility, UGI Utilities from time to time enters into NYMEX gasoline futures and swap contracts for a portion of gasoline volumes expected to be used in the operation of its vehicles and equipment. Associated volumes, fair values and effects on net income were not material for all periods presented.
A portion of our commodity derivative instruments are designated and qualify as cash flow hedges. At
September 30, 2014
, the amount of net losses associated with commodity price risk hedges expected to be reclassified into earnings during the next twelve months based upon current fair values is
$2.3
.
Interest Rate Risk
Antargaz’ and Flaga’s long-term debt agreements have interest rates that are generally indexed to short-term market interest rates. Antargaz and Flaga have each entered into pay-fixed, receive-variable interest rate swap agreements to hedge the underlying euribor rate of interest on their variable-rate term loans through the respective scheduled maturity dates. As of
September 30, 2014
and
2013
, the total notional amounts of variable-rate debt subject to interest rate swap agreements (excluding Flaga’s cross-currency swap as described below) were
€401.1
and
€440.5
, respectively.
F-50
UGI Corporation and Subsidiaries
Notes to Consolidated Financial Statements
(Millions of dollars and euros, except per share amounts and where indicated otherwise)
Our domestic businesses’ long-term debt is typically issued at fixed rates of interest. As these long-term debt issues mature, we typically refinance such debt with new debt having interest rates reflecting then-current market conditions. In order to reduce market rate risk on the underlying benchmark rate of interest associated with near- to medium-term forecasted issuances of fixed-rate debt, from time to time we enter into interest rate protection agreements (“IRPAs”). At
September 30, 2014
and
2013
, we had
no
unsettled IRPAs.
During Fiscal 2012, UGI Utilities reclassified pre-tax losses of
$0.7
from AOCI into income as a result of the discontinuance of cash flow hedge accounting for a portion of expected interest payments associated with the issuance of long-term debt originally anticipated to occur in September 2012. Such losses are included in other income, net, in the Fiscal 2012 Consolidated Statement of Income.
We account for interest rate swaps and IRPAs as cash flow hedges. At
September 30, 2014
, the amount of net losses associated with interest rate hedges (excluding pay-fixed, receive-variable interest rate swaps) expected to be reclassified into earnings during the next twelve months is
$2.7
.
Foreign Currency Exchange Rate Risk
In order to reduce volatility, Antargaz hedges a portion of its anticipated U.S. dollar-denominated LPG product purchases through the use of forward foreign currency exchange contracts. The amount of U.S. dollar-denominated purchases of LPG associated with such contracts generally represents approximately
15%
to
30%
of estimated U.S. dollar-denominated purchases of LPG to occur during the heating-season months of October through March. At
September 30, 2014
and
2013
, we were hedging a total of
$219.8
and
$200.2
of U.S. dollar-denominated LPG purchases, respectively. At
September 30, 2014
, the maximum period over which we are hedging our exposure to the variability in cash flows associated with U.S. dollar-denominated purchases of LPG is
27
months. From time to time we also enter into forward foreign currency exchange contracts to reduce the volatility of the U.S. dollar value on a portion of our International Propane euro-denominated net investments. At
September 30, 2014
and
2013
, we had
no
euro-denominated net investment hedges.
We account for foreign currency exchange contracts associated with anticipated purchases of U.S. dollar-denominated LPG as cash flow hedges. At
September 30, 2014
, the amount of net losses associated with currency rate risk (other than net investment hedges) expected to be reclassified into earnings during the next twelve months based upon current fair values is
$4.6
.
Cross-Currency Swaps
During Fiscal 2013, Flaga entered into a cross-currency swap to hedge its exposure to the variability in expected future cash flows associated with foreign currency and interest rate risk resulting from the issuance of
$52.0
of U.S. dollar-denominated variable-rate debt. The cross-currency hedge includes initial and final exchanges of principal from a fixed euro denomination to a fixed U.S. dollar-denominated amount, to be exchanged at a specified rate, which was determined by the market spot rate on the date of issuance. The cross-currency swap also includes an interest rate swap of a fixed foreign-denominated interest rate to a fixed U.S. dollar-denominated interest rate. We have designated this cross-currency swap as a cash flow hedge. At
September 30, 2014
, the amount of net gains associated with this cross-currency swap expected to be reclassified into earnings over the next twelve months is not material.
Derivative Instrument Credit Risk
We are exposed to risk of loss in the event of nonperformance by our derivative instrument counterparties. Our derivative instrument counterparties principally comprise large energy companies and major U.S. and international financial institutions. We maintain credit policies with regard to our counterparties that we believe reduce overall credit risk. These policies include evaluating and monitoring our counterparties’ financial condition, including their credit ratings, and entering into agreements with counterparties that govern credit limits or entering into netting agreements that allow for offsetting counterparty receivable and payable balances for certain financial transactions, as deemed appropriate. Certain of these agreements call for the posting of collateral by the counterparty or by the Company in the form of letters of credit, parental guarantees or cash. Additionally, our natural gas and electricity exchange-traded futures contracts generally require cash deposits in margin accounts. At
September 30, 2014
and
2013
, restricted cash in brokerage accounts totaled
$16.6
and
$7.0
, respectively. Although we have concentrations of credit risk associated with derivative instruments, the maximum amount of loss, based upon the gross fair values of the derivative instruments, we would incur if these counterparties failed to perform according to the terms of their contracts was not material at
September 30, 2014
. Certain of the Partnership’s derivative contracts have credit-risk-related contingent features that may require the posting of additional collateral in the event of a downgrade of the Partnership’s debt rating. At
September 30, 2014
, if the credit-risk-related contingent features were triggered, the amount of collateral required to be posted would not be material.
F-51
UGI Corporation and Subsidiaries
Notes to Consolidated Financial Statements
(Millions of dollars and euros, except per share amounts and where indicated otherwise)
Offsetting Derivative Assets and Liabilities
Derivative assets and liabilities are presented net by counterparty on our Consolidated Balance Sheets if the right of offset exists. Our derivative instruments include both those that are executed on an exchange through brokers and centrally cleared and over-the-counter transactions. Exchange contracts utilize a financial intermediary, exchange, or clearinghouse to enter, execute, or clear the transactions. Over-the-counter contracts are bilateral contracts that are transacted directly with a third party. Certain over-the-counter and exchange contracts contain contractual rights of offset through master netting arrangements, derivative clearing agreements, and contract default provisions. In addition, the contracts are subject to conditional rights of offset through counterparty nonperformance, insolvency, or other conditions.
In general, most of our over-the-counter transactions and all exchange contracts are subject to collateral requirements. Types of collateral generally include cash or letters of credit. Cash collateral paid by us to our derivative counterparties, if any, is reflected in the table below to offset derivative liabilities. Cash collateral received by us from our derivative counterparties, if any, is reflected in the table below to offset derivative assets. Certain other accounts receivable and accounts payable balances recognized on our Consolidated Balance Sheets with our derivative counterparties are not included in the table below but could reduce our net exposure to such counterparties because such balances are subject to master netting or similar arrangements.
F-52
UGI Corporation and Subsidiaries
Notes to Consolidated Financial Statements
(Millions of dollars and euros, except per share amounts and where indicated otherwise)
Fair Value of Derivative Instruments
The following table presents our derivative assets and liabilities by type, as well as the effects of offsetting, as of
September 30, 2014
and
2013
:
|
2014
|
2013 (a)
|
||||||
|
Derivative assets:
|
|||||||
|
Derivatives designated as hedging instruments:
|
|
|
|||||
|
Commodity contracts
|
$
|
2.8
|
|
$
|
18.0
|
|
|
|
Foreign currency contracts
|
12.8
|
|
0.9
|
|
|||
|
Cross-currency contracts
|
2.1
|
|
—
|
|
|||
|
Interest rate contracts
|
0.1
|
|
—
|
|
|||
|
17.8
|
|
18.9
|
|
||||
|
Derivatives accounted for under ASC 980:
|
|||||||
|
Commodity contracts
|
1.7
|
|
—
|
|
|||
|
Derivatives not designated as hedging instruments:
|
|
|
|||||
|
Commodity contracts
|
25.9
|
|
7.4
|
|
|||
|
Total derivative assets - gross
|
45.4
|
|
26.3
|
|
|||
|
Gross amounts offset in the balance sheet
|
(18.4
|
)
|
(2.1
|
)
|
|||
|
Total derivative assets - net
|
$
|
27.0
|
|
$
|
24.2
|
|
|
|
Derivative liabilities:
|
|||||||
|
Derivatives designated as hedging instruments:
|
|||||||
|
Commodity contracts
|
$
|
(5.3
|
)
|
$
|
(4.5
|
)
|
|
|
Foreign currency contracts
|
(0.1
|
)
|
(7.2
|
)
|
|||
|
Cross-currency contracts
|
—
|
|
(1.2
|
)
|
|||
|
Interest rate contracts
|
(21.0
|
)
|
(31.0
|
)
|
|||
|
(26.4
|
)
|
(43.9
|
)
|
||||
|
Derivatives accounted for under ASC 980:
|
|||||||
|
Commodity contracts
|
(2.2
|
)
|
(6.7
|
)
|
|||
|
Derivatives not designated as hedging instruments:
|
|||||||
|
Commodity contracts
|
(46.6
|
)
|
(6.9
|
)
|
|||
|
Total derivative liabilities - gross
|
(75.2
|
)
|
(57.5
|
)
|
|||
|
Gross amounts offset in the balance sheet
|
18.4
|
|
2.1
|
|
|||
|
Total derivative liabilities - net
|
$
|
(56.8
|
)
|
$
|
(55.4
|
)
|
|
|
(a)
|
Certain immaterial amounts have been revised to correct the classification of derivatives.
|
F-53
UGI Corporation and Subsidiaries
Notes to Consolidated Financial Statements
(Millions of dollars and euros, except per share amounts and where indicated otherwise)
Effect of Derivative Instruments
The following tables provide information on the effects of derivative instruments in the Consolidated Statements of Income and changes in AOCI and noncontrolling interests for Fiscal
2014
,
2013
and
2012
:
|
Gain or (Loss)
Recognized in
AOCI and
Noncontrolling Interests
|
Gain or (Loss)
Reclassified from
AOCI and Noncontrolling
Interests into Income
|
Location of Gain or (Loss) Reclassified from
AOCI and Noncontrolling
Interests into Income
|
|||||||||||||||||||||||
|
|
2014
|
2013
|
2012
|
2014
|
2013
|
2012
|
|||||||||||||||||||
|
Cash Flow Hedges:
|
|
|
|
|
|
|
|
||||||||||||||||||
|
Commodity contracts
|
$
|
50.8
|
|
$
|
8.3
|
|
$
|
(98.0
|
)
|
$
|
67.0
|
|
$
|
(49.5
|
)
|
$
|
(61.4
|
)
|
Cost of sales
|
||||||
|
Foreign currency contracts
|
15.3
|
|
(8.3
|
)
|
(0.5
|
)
|
(3.7
|
)
|
(0.1
|
)
|
2.1
|
|
Cost of sales
|
||||||||||||
|
Cross-currency contracts
|
3.1
|
|
(1.2
|
)
|
—
|
|
(0.1
|
)
|
—
|
|
—
|
|
Interest expense
|
||||||||||||
|
Interest rate contracts
|
(3.1
|
)
|
22.9
|
|
(36.8
|
)
|
(15.9
|
)
|
(14.2
|
)
|
(11.5
|
)
|
Interest expense /other income, net
|
||||||||||||
|
Total
|
$
|
66.1
|
|
$
|
21.7
|
|
$
|
(135.3
|
)
|
$
|
47.3
|
|
$
|
(63.8
|
)
|
$
|
(70.8
|
)
|
|
||||||
|
Net Investment Hedges:
|
|
|
|
|
|
|
|
||||||||||||||||||
|
Foreign currency contracts
|
$
|
—
|
|
$
|
—
|
|
$
|
0.6
|
|
|
|
|
|
||||||||||||
|
Gain or (Loss)
Recognized in Income
|
Location of
Gain or (Loss)
Recognized in Income
|
||||||||||||
|
|
2014
|
2013
|
2012
|
||||||||||
|
Derivatives Not Designated as Hedging Instruments:
|
|||||||||||||
|
Commodity contracts
|
$
|
(36.3
|
)
|
$
|
9.3
|
|
$
|
0.1
|
|
Cost of sales
|
|||
|
Commodity contracts
|
—
|
|
—
|
|
0.2
|
|
Operating and administrative expenses / other income, net
|
||||||
|
Foreign currency contracts
|
—
|
|
(0.4
|
)
|
0.5
|
|
Other income, net
|
||||||
|
Total
|
$
|
(36.3
|
)
|
$
|
8.9
|
|
$
|
0.8
|
|
|
|||
The amounts of derivative gains or losses representing ineffectiveness, and the amounts of gains or losses recognized in income as a result of excluding derivatives from ineffectiveness testing, were not material for Fiscal
2014
, Fiscal
2013
and Fiscal
2012
.
We are also a party to a number of other contracts that have elements of a derivative instrument. These contracts include, among others, binding purchase orders, contracts which provide for the purchase and delivery, or sale, of energy products, and service contracts that require the counterparty to provide commodity storage, transportation or capacity service to meet our normal sales commitments. Although many of these contracts have the requisite elements of a derivative instrument, certain of these contracts qualify for NPNS exception accounting under GAAP because they provide for the delivery of products or services in quantities that are expected to be used in the normal course of operating our business and the price in the contract is based on an underlying that is directly associated with the price of the product or service being purchased or sold.
F-54
UGI Corporation and Subsidiaries
Notes to Consolidated Financial Statements
(Millions of dollars and euros, except per share amounts and where indicated otherwise)
Other income, net, comprises the following:
|
2014
|
2013
|
2012
|
|||||||||
|
Interest and interest-related income
|
$
|
3.6
|
|
$
|
2.2
|
|
$
|
2.4
|
|
||
|
Utility non-tariff service income
|
2.7
|
|
2.8
|
|
2.7
|
|
|||||
|
Finance charges
|
17.5
|
|
21.4
|
|
18.8
|
|
|||||
|
Gains on sales of fixed assets
|
5.4
|
|
1.4
|
|
1.9
|
|
|||||
|
Loss on private equity partnership investment
|
—
|
|
(6.3
|
)
|
—
|
|
|||||
|
Other, net
|
6.9
|
|
11.3
|
|
14.0
|
|
|||||
|
Total other income, net
|
$
|
36.1
|
|
$
|
32.8
|
|
$
|
39.8
|
|
||
The following unaudited quarterly data includes adjustments (consisting only of normal recurring adjustments with the exception of those indicated below) which we consider necessary for a fair presentation unless otherwise indicated. Our quarterly results fluctuate because of the seasonal nature of our businesses.
|
December 31,
|
March 31,
|
June 30,
|
September 30,
|
||||||||||||||||||||||||
|
2013(a)
|
2012
|
2014
|
2013
|
2014
|
2013
|
2014
|
2013 (b)
|
||||||||||||||||||||
|
Revenues
|
$
|
2,315.9
|
|
$
|
2,018.7
|
|
$
|
3,163.3
|
|
$
|
2,542.7
|
|
$
|
1,486.7
|
|
$
|
1,374.3
|
|
$
|
1,311.4
|
|
$
|
1,259.0
|
|
|||
|
Operating income (loss)
|
$
|
363.7
|
|
$
|
294.2
|
|
$
|
588.6
|
|
$
|
507.7
|
|
$
|
62.7
|
|
$
|
41.5
|
|
$
|
(9.4
|
)
|
$
|
(12.3
|
)
|
|||
|
Net income (loss)
|
$
|
217.5
|
|
$
|
167.8
|
|
$
|
387.8
|
|
$
|
341.7
|
|
$
|
(12.7
|
)
|
$
|
(22.8
|
)
|
$
|
(60.0
|
)
|
$
|
(59.1
|
)
|
|||
|
Net income (loss) attributable to UGI Corporation
|
$
|
122.0
|
|
$
|
102.5
|
|
$
|
214.4
|
|
$
|
180.7
|
|
$
|
20.6
|
|
$
|
9.1
|
|
$
|
(19.8
|
)
|
$
|
(14.2
|
)
|
|||
|
Earnings (loss) per common share attributable to UGI Corporation stockholders:
|
|||||||||||||||||||||||||||
|
Basic
|
$
|
0.71
|
|
$
|
0.60
|
|
$
|
1.24
|
|
$
|
1.06
|
|
$
|
0.12
|
|
$
|
0.05
|
|
$
|
(0.11
|
)
|
$
|
(0.08
|
)
|
|||
|
Diluted
|
$
|
0.70
|
|
$
|
0.60
|
|
$
|
1.22
|
|
$
|
1.05
|
|
$
|
0.12
|
|
$
|
0.05
|
|
$
|
(0.11
|
)
|
$
|
(0.08
|
)
|
|||
|
(a)
|
Includes income tax expense of
$5.7
to reflect the retroactive effects to Fiscal
2013
of new tax legislation in France regarding the deductibility of certain interest expense which decreased net income attributable to UGI Corporation by
$5.7
or
$0.03
per diluted share (see
Note 7
).
|
|
(b)
|
Includes impairment loss on private equity partnership investment which increased operating loss by
$6.3
and net loss attributable to UGI Corporation by
$3.7
or
$0.02
per share (see
Note 2
).
|
F-55
UGI Corporation and Subsidiaries
Notes to Consolidated Financial Statements
(Millions of dollars and euros, except per share amounts and where indicated otherwise)
Our operations comprise
six
reportable segments generally based upon products sold, geographic location and regulatory environment. Our reportable segments comprise: (1) AmeriGas Propane; (2) an international LPG segment comprising Antargaz; (3) an international LPG segment principally comprising Flaga and AvantiGas; (4) Gas Utility; (5) Energy Services; and (6) Electric Generation. We refer to both international segments together as “UGI International” and Energy Services and Electric Generation together as “Midstream & Marketing.”
AmeriGas Propane derives its revenues principally from the sale of propane and related equipment and supplies to retail customers in all
50
states. Antargaz’ revenues are derived principally from the distribution of LPG to retail customers in France and, to a lesser extent, the sale of LPG to retail customers in Belgium, the Netherlands and Luxembourg and the marketing of natural gas in France and Belgium. Flaga & Other revenues are derived principally from the distribution of LPG to customers in northern, central and eastern Europe and the United Kingdom. Gas Utility’s revenues are derived principally from the sale and distribution of natural gas to customers in eastern, northeastern and central Pennsylvania. Energy Services revenues are derived from the sale of natural gas and, to a lesser extent, LPG, electricity and fuel oil as well as storage, pipeline transportation as well as fees from other energy services provided to customers located primarily in the Mid-Atlantic region of the United States. Electric Generation revenues are derived principally from the sale of electricity through PJM, a regional electricity transmission organization in the eastern U.S.
The accounting policies of our reportable segments are the same as those described in
Note 2
. We evaluate AmeriGas Propane’s performance principally based upon the Partnership’s earnings before interest expense, income taxes, depreciation and amortization (“Partnership EBITDA”). Although we use Partnership EBITDA to evaluate AmeriGas Propane’s profitability, it should not be considered as an alternative to net income (as an indicator of operating performance) or as an alternative to cash flow (as a measure of liquidity or ability to service debt obligations) and is not a measure of performance or financial condition under GAAP. Our definition of Partnership EBITDA may be different from that used by other companies. We evaluate the performance of our other reportable segments principally based upon their income before income taxes.
No
single customer represents more than
ten
percent of our consolidated revenues. In addition, all of our reportable segments’ revenues, other than those of UGI International, are derived from sources within the United States, and all of our reportable segments’ long-lived assets, other than those of UGI International, are located in the United States.
|
|
|
|
|
|
|
Midstream & Marketing
|
UGI International
|
|
|||||||||||||||||||||||||||
|
Total
|
Elim-
inations
|
AmeriGas
Propane
|
Gas Utility
|
Energy Services
|
Electric Generation
|
Antargaz
|
Flaga &
Other
|
Corporate &
Other (b)
|
|||||||||||||||||||||||||||
|
2014
|
|
|
|
|
|
|
|
|
|
|
|||||||||||||||||||||||||
|
Revenues
|
$
|
8,277.3
|
|
$
|
(321.3
|
)
|
(c)
|
$
|
3,712.9
|
|
$
|
977.3
|
|
$
|
1,305.5
|
|
$
|
85.1
|
|
$
|
1,295.5
|
|
$
|
1,026.9
|
|
$
|
195.4
|
|
|||||||
|
Cost of sales
|
$
|
5,175.7
|
|
$
|
(317.7
|
)
|
(c)
|
$
|
2,107.1
|
|
$
|
496.8
|
|
$
|
1,058.8
|
|
$
|
39.6
|
|
$
|
848.1
|
|
$
|
809.9
|
|
$
|
133.1
|
|
|||||||
|
Operating income (loss)
|
$
|
1,005.6
|
|
$
|
0.2
|
|
|
$
|
472.0
|
|
$
|
236.2
|
|
$
|
180.5
|
|
$
|
18.1
|
|
$
|
79.1
|
|
$
|
38.4
|
|
$
|
(18.9
|
)
|
|||||||
|
Loss from equity investees
|
(0.1
|
)
|
—
|
|
|
—
|
|
—
|
|
—
|
|
—
|
|
(0.1
|
)
|
—
|
|
—
|
|
||||||||||||||||
|
Interest expense
|
(237.7
|
)
|
—
|
|
|
(165.6
|
)
|
(36.6
|
)
|
(2.9
|
)
|
—
|
|
(25.1
|
)
|
(4.9
|
)
|
(2.6
|
)
|
||||||||||||||||
|
Income (loss) before income taxes
|
$
|
767.8
|
|
$
|
0.2
|
|
|
$
|
306.4
|
|
$
|
199.6
|
|
$
|
177.6
|
|
$
|
18.1
|
|
$
|
53.9
|
|
$
|
33.5
|
|
$
|
(21.5
|
)
|
|||||||
|
Net income (loss) attributable to UGI
|
$
|
337.2
|
|
$
|
—
|
|
|
$
|
63.0
|
|
$
|
118.8
|
|
$
|
105.2
|
|
$
|
12.6
|
|
$
|
20.6
|
|
$
|
27.7
|
|
$
|
(10.7
|
)
|
|||||||
|
Depreciation and amortization
|
$
|
362.9
|
|
$
|
—
|
|
|
$
|
197.2
|
|
$
|
54.8
|
|
$
|
12.3
|
|
$
|
10.7
|
|
$
|
54.5
|
|
$
|
27.1
|
|
$
|
6.3
|
|
|||||||
|
Noncontrolling interests’ net income (loss)
|
$
|
195.4
|
|
$
|
—
|
|
|
$
|
195.8
|
|
$
|
—
|
|
$
|
—
|
|
$
|
—
|
|
$
|
(0.4
|
)
|
$
|
—
|
|
$
|
—
|
|
|||||||
|
Partnership EBITDA (a)
|
$
|
655.3
|
|
$
|
—
|
|
|
$
|
664.8
|
|
$
|
—
|
|
$
|
—
|
|
$
|
—
|
|
$
|
—
|
|
$
|
—
|
|
$
|
(9.5
|
)
|
|||||||
|
Total assets
|
$
|
10,093.0
|
|
$
|
(86.5
|
)
|
$
|
4,377.0
|
|
$
|
2,214.1
|
|
$
|
569.0
|
|
$
|
277.7
|
|
$
|
1,659.1
|
|
$
|
643.6
|
|
$
|
439.0
|
|
||||||||
|
Short-term borrowings
|
$
|
210.8
|
|
$
|
—
|
|
|
$
|
109.0
|
|
$
|
86.3
|
|
$
|
7.5
|
|
$
|
—
|
|
$
|
—
|
|
$
|
8.0
|
|
$
|
—
|
|
|||||||
|
Capital expenditures
|
$
|
436.4
|
|
$
|
—
|
|
|
$
|
113.9
|
|
$
|
156.4
|
|
$
|
67.8
|
|
$
|
15.6
|
|
$
|
50.2
|
|
$
|
23.0
|
|
$
|
9.5
|
|
|||||||
|
Investments in equity investees
|
$
|
0.6
|
|
$
|
—
|
|
|
$
|
—
|
|
$
|
—
|
|
$
|
—
|
|
$
|
—
|
|
$
|
—
|
|
$
|
0.6
|
|
$
|
—
|
|
|||||||
|
Goodwill
|
$
|
2,833.4
|
|
$
|
—
|
|
|
$
|
1,945.1
|
|
$
|
182.1
|
|
$
|
5.6
|
|
$
|
—
|
|
$
|
601.2
|
|
$
|
92.4
|
|
$
|
7.0
|
|
|||||||
F-56
UGI Corporation and Subsidiaries
Notes to Consolidated Financial Statements
(Millions of dollars and euros, except per share amounts and where indicated otherwise)
|
|
|
|
|
|
|
Midstream & Marketing
|
UGI International
|
|
|||||||||||||||||||||||||||
|
Total
|
Elim-
inations
|
AmeriGas
Propane
|
Gas Utility
|
Energy Services
|
Electric Generation
|
Antargaz
|
Flaga &
Other
|
Corporate &
Other (b)
|
|||||||||||||||||||||||||||
|
2013
|
|
|
|
|
|
|
|
|
|
|
|||||||||||||||||||||||||
|
Revenues
|
$
|
7,194.7
|
|
$
|
(223.8
|
)
|
(c)
|
$
|
3,168.8
|
|
$
|
839.0
|
|
$
|
969.4
|
|
$
|
71.4
|
|
$
|
1,322.6
|
|
$
|
856.6
|
|
$
|
190.7
|
|
|||||||
|
Cost of sales
|
$
|
4,324.4
|
|
$
|
(217.5
|
)
|
(c)
|
$
|
1,657.2
|
|
$
|
407.2
|
|
$
|
836.9
|
|
$
|
39.9
|
|
$
|
845.0
|
|
$
|
653.4
|
|
$
|
102.3
|
|
|||||||
|
Operating income
|
$
|
831.1
|
|
$
|
(1.1
|
)
|
|
$
|
394.4
|
|
$
|
196.5
|
|
$
|
82.5
|
|
$
|
7.5
|
|
$
|
111.4
|
|
$
|
35.6
|
|
$
|
4.3
|
|
|||||||
|
Loss from equity investees
|
(0.4
|
)
|
—
|
|
|
—
|
|
—
|
|
—
|
|
—
|
|
(0.4
|
)
|
—
|
|
—
|
|
||||||||||||||||
|
Interest expense
|
(240.3
|
)
|
—
|
|
|
(166.6
|
)
|
(37.4
|
)
|
(3.2
|
)
|
—
|
|
(25.3
|
)
|
(5.1
|
)
|
(2.7
|
)
|
||||||||||||||||
|
Income before income taxes
|
590.4
|
|
(1.1
|
)
|
|
227.8
|
|
159.1
|
|
79.3
|
|
7.5
|
|
85.7
|
|
30.5
|
|
1.6
|
|
||||||||||||||||
|
Net income attributable to UGI
|
$
|
278.1
|
|
$
|
(0.6
|
)
|
|
$
|
47.5
|
|
$
|
94.3
|
|
$
|
46.3
|
|
$
|
6.2
|
|
$
|
57.2
|
|
$
|
25.5
|
|
$
|
1.7
|
|
|||||||
|
Depreciation and amortization
|
$
|
363.1
|
|
$
|
—
|
|
|
$
|
205.9
|
|
$
|
51.7
|
|
$
|
7.6
|
|
$
|
10.0
|
|
$
|
57.6
|
|
$
|
24.1
|
|
$
|
6.2
|
|
|||||||
|
Noncontrolling interests’ net (loss) income
|
$
|
149.5
|
|
$
|
—
|
|
|
$
|
149.6
|
|
$
|
—
|
|
$
|
—
|
|
$
|
—
|
|
$
|
(0.2
|
)
|
$
|
0.1
|
|
$
|
—
|
|
|||||||
|
Partnership EBITDA (a)
|
|
|
|
|
|
$
|
596.5
|
|
|
|
|
|
|
|
|
|
|
|
|
|
|||||||||||||||
|
Total assets
|
$
|
10,008.8
|
|
$
|
(100.3
|
)
|
$
|
4,429.3
|
|
$
|
2,069
|
|
$
|
501.2
|
|
$
|
269.7
|
|
$
|
1,784.4
|
|
$
|
667.1
|
|
$
|
388.4
|
|
||||||||
|
Short-term borrowings
|
$
|
227.9
|
|
$
|
—
|
|
|
$
|
116.9
|
|
$
|
17.5
|
|
$
|
87.0
|
|
$
|
—
|
|
$
|
—
|
|
$
|
6.5
|
|
$
|
—
|
|
|||||||
|
Capital expenditures
|
$
|
489.1
|
|
$
|
(1.1
|
)
|
|
$
|
111.1
|
|
$
|
144.4
|
|
$
|
133.8
|
|
$
|
22.6
|
|
$
|
53.4
|
|
$
|
17.4
|
|
$
|
7.5
|
|
|||||||
|
Investments in equity investees
|
$
|
0.3
|
|
$
|
—
|
|
|
$
|
—
|
|
$
|
—
|
|
$
|
—
|
|
$
|
—
|
|
$
|
—
|
|
$
|
0.3
|
|
$
|
—
|
|
|||||||
|
Goodwill
|
$
|
2,873.7
|
|
$
|
—
|
|
|
$
|
1,941.0
|
|
$
|
182.1
|
|
$
|
2.8
|
|
$
|
—
|
|
$
|
643.7
|
|
$
|
97.1
|
|
$
|
7.0
|
|
|||||||
|
2012
|
|
|
|
|
|
|
|
|
|
|
|||||||||||||||||||||||||
|
Revenues
|
$
|
6,521.3
|
|
$
|
(178.8
|
)
|
(c)
|
$
|
2,921.5
|
|
$
|
785.4
|
|
$
|
816.4
|
|
$
|
43.9
|
|
$
|
1,121.4
|
|
$
|
824.7
|
|
$
|
186.8
|
|
|||||||
|
Cost of sales
|
$
|
4,099.1
|
|
$
|
(174.0
|
)
|
(c)
|
$
|
1,722.4
|
|
$
|
402.5
|
|
$
|
701.9
|
|
$
|
28.0
|
|
$
|
685.5
|
|
$
|
640.3
|
|
$
|
92.5
|
|
|||||||
|
Operating income (loss)
|
$
|
538.6
|
|
$
|
—
|
|
|
$
|
168.7
|
|
$
|
174.1
|
|
$
|
70.8
|
|
$
|
(6.5
|
)
|
$
|
88.3
|
|
$
|
23.6
|
|
$
|
19.6
|
|
|||||||
|
Loss from equity investees
|
(0.3
|
)
|
—
|
|
|
—
|
|
—
|
|
—
|
|
—
|
|
(0.3
|
)
|
—
|
|
—
|
|
||||||||||||||||
|
Loss on extinguishments of debt
|
(13.3
|
)
|
—
|
|
(13.3
|
)
|
—
|
|
—
|
|
—
|
|
—
|
|
—
|
|
—
|
|
|||||||||||||||||
|
Interest expense
|
(220.4
|
)
|
—
|
|
|
(141.5
|
)
|
(40.1
|
)
|
(4.8
|
)
|
—
|
|
(26.3
|
)
|
(4.6
|
)
|
(3.1
|
)
|
||||||||||||||||
|
Income (loss) before income taxes
|
$
|
304.6
|
|
$
|
—
|
|
|
$
|
13.9
|
|
$
|
134.0
|
|
$
|
66.0
|
|
$
|
(6.5
|
)
|
$
|
61.7
|
|
$
|
19.0
|
|
$
|
16.5
|
|
|||||||
|
Net income (loss) attributable to UGI
|
$
|
210.2
|
|
$
|
—
|
|
|
$
|
15.4
|
|
$
|
81.6
|
|
$
|
38.7
|
|
$
|
(1.0
|
)
|
$
|
51.4
|
|
$
|
13.8
|
|
$
|
10.3
|
|
|||||||
|
Depreciation and amortization
|
$
|
315.0
|
|
$
|
—
|
|
|
$
|
168.1
|
|
$
|
49.0
|
|
$
|
3.7
|
|
$
|
9.0
|
|
$
|
57.1
|
|
$
|
22.1
|
|
$
|
6.0
|
|
|||||||
|
Noncontrolling interests’ net (loss) income
|
$
|
(12.5
|
)
|
$
|
—
|
|
|
$
|
(12.7
|
)
|
$
|
—
|
|
$
|
—
|
|
$
|
—
|
|
$
|
0.2
|
|
$
|
—
|
|
$
|
—
|
|
|||||||
|
Partnership EBITDA (a)
|
|
|
|
$
|
322.1
|
|
|
|
|
|
|
|
|||||||||||||||||||||||
|
Total assets
|
$
|
9,676.9
|
|
$
|
(104.1
|
)
|
$
|
4,533.8
|
|
$
|
2,045.5
|
|
$
|
368.5
|
|
$
|
258.2
|
|
$
|
1,686.5
|
|
$
|
531.8
|
|
$
|
356.7
|
|
||||||||
|
Short-term borrowings
|
$
|
165.1
|
|
$
|
—
|
|
$
|
49.9
|
|
$
|
9.2
|
|
$
|
85.0
|
|
$
|
—
|
|
$
|
—
|
|
$
|
21.0
|
|
$
|
—
|
|
||||||||
|
Capital expenditures
|
$
|
343.2
|
|
$
|
—
|
|
$
|
103.1
|
|
$
|
109.0
|
|
$
|
36.0
|
|
$
|
24.4
|
|
$
|
47.3
|
|
$
|
16.9
|
|
$
|
6.5
|
|
||||||||
|
Investments in equity investees
|
$
|
0.3
|
|
$
|
—
|
|
$
|
—
|
|
$
|
—
|
|
$
|
—
|
|
$
|
—
|
|
$
|
—
|
|
$
|
0.3
|
|
$
|
—
|
|
||||||||
|
Goodwill
|
$
|
2,818.3
|
|
$
|
—
|
|
$
|
1,919.2
|
|
$
|
182.1
|
|
$
|
2.8
|
|
$
|
—
|
|
$
|
612.0
|
|
$
|
95.2
|
|
$
|
7.0
|
|
||||||||
F-57
UGI Corporation and Subsidiaries
Notes to Consolidated Financial Statements
(Millions of dollars and euros, except per share amounts and where indicated otherwise)
|
(a)
|
The following table provides a reconciliation of Partnership EBITDA to AmeriGas Propane operating income:
|
|
2014
|
2013
|
2012
|
||||||||||
|
Partnership EBITDA
|
$
|
664.8
|
|
$
|
596.5
|
|
$
|
322.1
|
|
|||
|
Depreciation and amortization
|
(197.2
|
)
|
(205.9
|
)
|
(168.1
|
)
|
||||||
|
Loss on extinguishments of debt
|
—
|
|
—
|
|
13.3
|
|
||||||
|
Noncontrolling interests (i)
|
4.4
|
|
3.8
|
|
1.4
|
|
||||||
|
Operating income
|
$
|
472.0
|
|
$
|
394.4
|
|
$
|
168.7
|
|
|||
|
(i)
|
Principally represents the General Partner’s
1.01%
interest in AmeriGas OLP.
|
|
(b)
|
Corporate & Other results principally comprise (1) Electric Utility, (2) Enterprises’ heating, ventilation, air-conditioning, refrigeration and electrical contracting businesses (“HVAC”), (3) net expenses of UGI’s captive general liability insurance company, (4) UGI Corporation’s unallocated corporate and general expenses and interest income and (5) net (losses) gains on Midstream & Marketing’s unsettled commodity derivative instruments and certain settled commodity derivative instruments not associated with current period transactions, and net (losses) gains on AmeriGas Propane’s unsettled commodity derivative instruments entered into beginning April 1, 2014, totaling
$(18.0)
,
$7.4
and
$15.1
in Fiscal 2014, Fiscal 2013 and Fiscal 2012, respectively. Corporate & Other assets principally comprise cash, short-term investments, the assets of Electric Utility and HVAC, and an intercompany loan. The intercompany loan and associated interest is removed in the segment presentation.
|
|
(c)
|
Represents the elimination of intersegment transactions principally among Midstream & Marketing, Gas Utility and AmeriGas Propane.
|
F-58
UGI CORPORATION AND SUBSIDIARIES
SCHEDULE I — CONDENSED FINANCIAL INFORMATION OF REGISTRANT (PARENT COMPANY)
BALANCE SHEETS
(Millions of dollars)
|
|
September 30,
|
||||||
|
|
2014
|
2013
|
|||||
|
ASSETS
|
|
|
|||||
|
Current assets:
|
|
|
|||||
|
Cash and cash equivalents
|
$
|
0.8
|
|
$
|
0.9
|
|
|
|
Accounts and notes receivable
|
3.9
|
|
2.9
|
|
|||
|
Deferred income taxes
|
0.4
|
|
0.4
|
|
|||
|
Prepaid expenses and other current assets
|
0.3
|
|
0.3
|
|
|||
|
Total current assets
|
5.4
|
|
4.5
|
|
|||
|
Investments in subsidiaries
|
2,663.9
|
|
2,488.7
|
|
|||
|
Other assets
|
55.5
|
|
49.9
|
|
|||
|
Total assets
|
$
|
2,724.8
|
|
$
|
2,543.1
|
|
|
|
LIABILITIES AND COMMON STOCKHOLDERS’ EQUITY
|
|
|
|||||
|
Current liabilities:
|
|
|
|||||
|
Accounts and notes payable
|
$
|
11.8
|
|
$
|
11.0
|
|
|
|
Derivative instruments
|
—
|
|
—
|
|
|||
|
Accrued liabilities
|
6.0
|
|
3.9
|
|
|||
|
Total current liabilities
|
17.8
|
|
14.9
|
|
|||
|
Noncurrent liabilities
|
47.9
|
|
35.7
|
|
|||
|
Commitments and contingencies (Note 1)
|
|
|
|||||
|
Common stockholders’ equity:
|
|
|
|||||
|
Common Stock, without par value (authorized - 450,000,000 shares; issued - 173,770,641 and 173,675,691 shares, respectively)
|
1,215.6
|
|
1,208.1
|
|
|||
|
Retained earnings
|
1,509.4
|
|
1,308.3
|
|
|||
|
Accumulated other comprehensive (loss) income
|
(21.2
|
)
|
8.4
|
|
|||
|
Treasury stock, at cost
|
(44.7
|
)
|
(32.3
|
)
|
|||
|
Total common stockholders’ equity
|
2,659.1
|
|
2,492.5
|
|
|||
|
Total liabilities and common stockholders’ equity
|
$
|
2,724.8
|
|
$
|
2,543.1
|
|
|
In addition to the guarantees of Flaga’s and Antargaz’ debt as described in
Note 6
to Consolidated Financial Statements, at
September 30, 2014
, UGI Corporation had agreed to indemnify the issuers of
$65.1
of surety bonds issued on behalf of certain UGI subsidiaries. UGI Corporation is authorized to guarantee up to
$500.0
of obligations to suppliers and customers of Energy Services and subsidiaries of which
$414.1
of such obligations were outstanding as of
September 30, 2014
. UGI Corporation has guaranteed the floating to fixed rate interest rate swaps at Flaga, which obligations totaled
$3.5
at
September 30, 2014
.
S-1
UGI CORPORATION AND SUBSIDIARIES
SCHEDULE I — CONDENSED FINANCIAL INFORMATION OF REGISTRANT (PARENT COMPANY)
STATEMENTS OF INCOME
(Millions of dollars, except per share amounts)
|
Year Ended
September 30,
|
|||||||||||
|
|
2014
|
2013
|
2012
|
||||||||
|
Revenues
|
$
|
—
|
|
$
|
—
|
|
$
|
—
|
|
||
|
Costs and expenses:
|
|
|
|
||||||||
|
Operating and administrative expenses
|
44.5
|
|
36.9
|
|
27.8
|
|
|||||
|
Other income, net (a)
|
(44.2
|
)
|
(36.7
|
)
|
(28.1
|
)
|
|||||
|
|
0.3
|
|
0.2
|
|
(0.3
|
)
|
|||||
|
Operating (loss) income
|
(0.3
|
)
|
(0.2
|
)
|
0.3
|
|
|||||
|
Intercompany interest income
|
0.2
|
|
0.2
|
|
0.2
|
|
|||||
|
(Loss) income before income taxes
|
(0.1
|
)
|
—
|
|
0.5
|
|
|||||
|
Income tax expense
|
2.4
|
|
3.1
|
|
0.3
|
|
|||||
|
(Loss) income before equity in income of unconsolidated subsidiaries
|
(2.5
|
)
|
(3.1
|
)
|
0.2
|
|
|||||
|
Equity in income of unconsolidated subsidiaries
|
339.7
|
|
281.2
|
|
210.0
|
|
|||||
|
Net income
|
$
|
337.2
|
|
$
|
278.1
|
|
$
|
210.2
|
|
||
|
Earnings per common share:
|
|
|
|
||||||||
|
Basic
|
$
|
1.95
|
|
$
|
1.63
|
|
$
|
1.24
|
|
||
|
Diluted
|
$
|
1.92
|
|
$
|
1.60
|
|
$
|
1.24
|
|
||
|
Average common shares outstanding (thousands):
|
|
|
|
||||||||
|
Basic
|
172,733
|
|
170,885
|
|
168,872
|
|
|||||
|
Diluted
|
175,231
|
|
173,282
|
|
170,148
|
|
|||||
|
(a)
|
UGI provides certain financial and administrative services to certain of its subsidiaries. UGI bills these subsidiaries monthly for all direct expenses incurred by UGI on behalf of its subsidiaries as well as allocated shares of indirect corporate expense incurred or paid with respect to services provided by UGI. The allocation of indirect UGI corporate expenses to certain of its subsidiaries utilizes a weighted, three-component formula comprising revenues, operating expenses, and net assets employed and considers the relative percentage of such items for each subsidiary to the total of such items for all UGI operating subsidiaries for which general and administrative services are provided. Management believes that this allocation method is reasonable and equitable to its subsidiaries. These billed expenses are classified as “Other income, net” in the Statements of Income above.
|
S-2
UGI CORPORATION AND SUBSIDIARIES
SCHEDULE I — CONDENSED FINANCIAL INFORMATION OF REGISTRANT (PARENT COMPANY)
STATEMENTS OF CASH FLOWS
(Millions of dollars)
|
Year Ended
September 30,
|
|||||||||||
|
|
2014
|
2013
|
2012
|
||||||||
|
NET CASH PROVIDED BY OPERATING ACTIVITIES (a)
|
$
|
199.7
|
|
$
|
139.4
|
|
$
|
158.3
|
|
||
|
CASH FLOWS FROM INVESTING ACTIVITIES:
|
|
|
|
||||||||
|
Net investments in unconsolidated subsidiaries
|
(47.3
|
)
|
(59.1
|
)
|
(54.4
|
)
|
|||||
|
Net cash used by investing activities
|
(47.3
|
)
|
(59.1
|
)
|
(54.4
|
)
|
|||||
|
CASH FLOWS FROM FINANCING ACTIVITIES:
|
|
|
|
||||||||
|
Payment of dividends on Common Stock
|
(136.1
|
)
|
(125.8
|
)
|
(119.1
|
)
|
|||||
|
Purchases of UGI Common Stock
|
(39.8
|
)
|
—
|
|
—
|
|
|||||
|
Issuance of Common Stock
|
23.4
|
|
44.5
|
|
16.7
|
|
|||||
|
Net cash used by financing activities
|
(152.5
|
)
|
(81.3
|
)
|
(102.4
|
)
|
|||||
|
Cash and cash equivalents (decrease) increase
|
$
|
(0.1
|
)
|
$
|
(1.0
|
)
|
$
|
1.5
|
|
||
|
Cash and cash equivalents:
|
|
|
|
||||||||
|
End of year
|
$
|
0.8
|
|
$
|
0.9
|
|
$
|
1.9
|
|
||
|
Beginning of year
|
0.9
|
|
1.9
|
|
0.4
|
|
|||||
|
(Decrease) increase
|
$
|
(0.1
|
)
|
$
|
(1.0
|
)
|
$
|
1.5
|
|
||
|
(a)
|
Includes dividends received from unconsolidated subsidiaries of
$186.4
,
$155.2
and
$156.0
for the years ended
September 30, 2014
,
2013
and
2012
, respectively.
|
S-3
UGI CORPORATION AND SUBSIDIARIES
SCHEDULE II — VALUATION AND QUALIFYING ACCOUNTS
(Millions of dollars)
|
Balance at
beginning
of year
|
Charged
(credited)
to costs and
expenses
|
Other
|
Balance at
end of
year
|
|||||||||||||
|
Year Ended September 30, 2014
|
|
|
|
|
|
|
||||||||||
|
Reserves deducted from assets in the consolidated balance sheet:
|
|
|
|
|
|
|
||||||||||
|
Allowance for doubtful accounts
|
$
|
39.5
|
|
$
|
43.5
|
|
$
|
(43.0
|
)
|
(1)
|
$
|
39.1
|
|
|
||
|
(0.9
|
)
|
(2)
|
||||||||||||||
|
Other reserves:
|
|
|
|
|
|
|
||||||||||
|
Deferred tax assets valuation allowance
|
$
|
97.6
|
|
$
|
0.4
|
|
$
|
(34.0
|
)
|
(3)
|
$
|
59.2
|
|
|
||
|
(4.8
|
)
|
(4)
|
||||||||||||||
|
Year Ended September 30, 2013
|
|
|
|
|
|
|
||||||||||
|
Reserves deducted from assets in the consolidated balance sheet:
|
|
|
|
|
|
|
||||||||||
|
Allowance for doubtful accounts
|
$
|
36.1
|
|
$
|
30.2
|
|
$
|
(27.4
|
)
|
(1)
|
$
|
39.5
|
|
|
||
|
0.6
|
|
(2)
|
||||||||||||||
|
Other reserves:
|
|
|
|
|
|
|
||||||||||
|
Deferred tax assets valuation allowance
|
$
|
77.0
|
|
$
|
(5.7
|
)
|
26.3
|
|
(3)
|
$
|
97.6
|
|
|
|||
|
Year Ended September 30, 2012
|
|
|
|
|
|
|
||||||||||
|
Reserves deducted from assets in the consolidated balance sheet:
|
|
|
|
|
|
|
||||||||||
|
Allowance for doubtful accounts
|
$
|
36.8
|
|
$
|
26.5
|
|
$
|
(26.8
|
)
|
(1)
|
$
|
36.1
|
|
|
||
|
|
|
|
(0.4
|
)
|
(2)
|
|
|
|||||||||
|
Other reserves:
|
|
|
|
|
|
|
||||||||||
|
Deferred tax assets valuation allowance
|
$
|
78.2
|
|
$
|
(4.0
|
)
|
$
|
2.8
|
|
(5)
|
$
|
77.0
|
|
|
||
|
(1)
|
Uncollectible accounts written off, net of recoveries.
|
|
(2)
|
Effects of currency exchange.
|
|
(3)
|
Foreign tax credit valuation allowance adjustment.
|
|
(4)
|
Decrease in unusable foreign operating loss carryforwards.
|
|
(5)
|
Acquisition.
|
S-4
EXHIBIT INDEX
|
Exhibit No.
|
Description
|
|
10.28
|
Description of oral compensation arrangements for Messrs. Walsh, Hall, and Oliver and Ms. Gaudiosi.
|
|
10.30
|
Summary of Director Compensation as of October 1, 2014.
|
|
10.69
|
Senior Secured Bridge Facility Agreement dated as of October 17, 2014 by and between UGI International Enterprises, Inc., as borrower, Credit Suisse AG, London Branch, Bank of America Merrill Lynch International Limited and Natixis, New York Branch, as mandated lead arrangers, and Credit Suisse AG, Cayman Island Branch, as agent and security agent.
|
|
10.70
|
Guarantee dated as of October 17, 2014 by and between UGI Corporation and Credit Suisse AG, Cayman Island Branch, as agent.
|
|
21
|
Subsidiaries of the Registrant
|
|
23
|
Consent of PricewaterhouseCoopers LLP
|
|
31.1
|
Certification by the Chief Executive Officer relating to the Registrant’s Report on Form 10-K for the fiscal year ended September 30, 2014 pursuant to Section 302 of the Sarbanes-Oxley Act of 2002
|
|
31.2
|
Certification by the Chief Financial Officer relating to the Registrant’s Report on Form 10-K for the fiscal year ended September 30, 2014 pursuant to Section 302 of the Sarbanes-Oxley Act of 2002
|
|
32
|
Certification by the Chief Executive Officer and the Chief Financial Officer relating to the Registrant’s Report on Form 10-K for the fiscal year ended September 30, 2014, pursuant to Section 906 of the Sarbanes-Oxley Act of 2002
|
|
101.INS
|
XBRL.Instance
|
|
101.SCH
|
XBRL Taxonomy Extension Schema
|
|
101.CAL
|
XBRL Taxonomy Extension Calculation Linkbase
|
|
101.DEF
|
XBRL Taxonomy Extension Definition Linkbase
|
|
101.LAB
|
XBRL Taxonomy Extension Labels Linkbase
|
|
101.PRE
|
XBRL Taxonomy Extension Presentation Linkbase
|
TABLE OF CONTENTS
Part I:Item 1A. Risk FactorsItem 1B. Unresolved Staff CommentsItem 3. Legal ProceedingsItem 4. Mine Safety DisclosuresPart Ii:Item 5. Market For Registrant S Common Equity, Related Stockholder Matters and Issuer Purchases Of Equity SecuritiesItem 6. Selected Financial DataItem 7. Management S Discussion and Analysis Of Financial Condition and Results Of OperationsItem 7A. Quantitative and Qualitative Disclosures About Market RiskItem 8. Financial Statements and Supplementary DataItem 9. Changes in and Disagreements with Accountants on Accounting and Financial DisclosureItem 9A. Controls and ProceduresItem 9B. Other InformationPart Iii:Item 14. Principal Accounting Fees and Services Our Independent Registered Public Accounting FirmPart Iv:Item 15. Exhibits and Financial Statement SchedulesNote 1 Nature Of OperationsNote 2 Summary Of Significant Accounting PoliciesNote 3 Accounting ChangesNote 4 AcquisitionsNote 5 Short-term BorrowingsNote 6 Long-term DebtNote 7 Income TaxesNote 8 Employee Retirement PlansNote 9 Utility Regulatory Assets and Liabilities and Regulatory MattersNote 10 InventoriesNote 11 Property, Plant and EquipmentNote 12 Goodwill and Intangible AssetsNote 13 Series Preferred StockNote 14 Common Stock and Equity-based CompensationNote 15 Partnership Distributions and Common Unit OfferingsNote 16 Commitments and ContingenciesNote 17 Fair Value MeasurementsNote 18 Derivative Instruments and Hedging ActivitiesNote 19 Other Income, NetNote 20 Quarterly Data (unaudited)Note 21 Segment InformationNote 1 Commitments and Contingencies: