UNISYS CORP
10-Ks and 10-Qs
|
|
|
|
|
|
|
|
|
|
|
|
|
|
|
|
|
|
|
|
|
|
|
|
|
|
|
|
|
|
|
|
|
|
|
|
|
|
|
|
|
|
|
|
|
|
|
|
|
|
|
|
|
|
|
|
UNITED STATES
SECURITIES AND EXCHANGE COMMISSION
WASHINGTON, D.C. 20549
FORM 10-K
(Mark One)
|
ý
|
ANNUAL REPORT PURSUANT TO SECTION 13 OR 15(d) OF THE SECURITIES EXCHANGE ACT OF 1934
|
For the fiscal year ended
December 31, 2017
or
|
¨
|
TRANSITION REPORT PURSUANT TO SECTION 13 OR 15(d) OF THE SECURITIES EXCHANGE ACT OF 1934
|
For the transition period from
to
.
Commission file number 1-8729
UNISYS CORPORATION
(Exact name of registrant as specified in its charter)
|
Delaware
|
|
38-0387840
|
|
(State or other jurisdiction of
incorporation or organization)
|
|
(I.R.S. Employer
Identification No.)
|
|
801 Lakeview Drive, Suite 100
Blue Bell, Pennsylvania
|
|
19422
|
|
(Address of principal executive offices)
|
|
(Zip Code)
|
Registrant’s telephone number, including area code: (215) 986-4011
Securities registered pursuant to Section 12(b) of the Act:
|
Title of each class
|
|
Name of each exchange on which registered
|
|
Common Stock, par value $.01
|
|
New York Stock Exchange
|
Securities registered pursuant to Section 12(g) of the Act:
None
Indicate by check mark if the registrant is a well-known seasoned issuer, as defined in Rule 405 of the Securities Act.
¨
Yes
ý
No
Indicate by check mark if the registrant is not required to file reports pursuant to Section 13 or Section 15(d) of the Act.
¨
Yes
ý
No
Indicate by check mark whether the registrant (1) has filed all reports required to be filed by Section 13 or 15(d) of the Securities Exchange Act of 1934 during the preceding 12 months (or for such shorter period that the registrant was required to file such reports), and (2) has been subject to such filing requirements for the past 90 days.
ý
Yes
¨
No
Indicate by check mark whether the registrant has submitted electronically and posted on its corporate Web site, if any, every Interactive Data File required to be submitted and posted pursuant to Rule 405 of Regulation S-T during the preceding 12 months (or for such shorter period that the registrant was required to submit and post such files).
ý
Yes
¨
No
1
Indicate by check mark if disclosure of delinquent filers pursuant to Item 405 of Regulation S-K is not contained herein, and will not be contained, to the best of registrant’s knowledge, in definitive proxy or information statements incorporated by reference in Part III of this Form 10-K or any amendment to this Form 10-K.
ý
Indicate by check mark whether the registrant is a large accelerated filer, an accelerated filer, a non-accelerated filer, smaller reporting company, or an emerging growth company. See definitions of “large accelerated filer,” “accelerated filer,” “smaller reporting company,” and “emerging growth company” in Rule 12b-2 of the Exchange Act.
|
Large accelerated filer
|
|
¨
|
|
Accelerated filer
|
|
ý
|
|
Non-accelerated filer
|
|
¨
(Do not check if a smaller reporting company)
|
|
Smaller reporting company
|
|
¨
|
|
Emerging growth company
|
¨
|
|||||
If an emerging growth company, indicate by check mark if the registrant has elected not to use the extended transition period for complying with any new or revised financial accounting standards provided pursuant to Section 13(a) of the Exchange Act.
¨
Indicate by check mark whether the registrant is a shell company (as defined in Rule 12b-2 of the Act).
¨
Yes
ý
No
Aggregate market value of the voting and non-voting common equity held by non-affiliates as of the last business day of the registrant’s most recently completed second fiscal quarter: approximately
$639.0 million
.
The amount shown is based on the closing price of Unisys Common Stock as reported on the New York Stock Exchange composite tape on
June 30, 2017
. Voting stock beneficially held by officers and directors is not included in the computation. However, Unisys Corporation has not determined that such individuals are “affiliates” within the meaning of Rule 405 under the Securities Act of 1933.
Number of shares of Unisys Common Stock, par value $.01, outstanding as of
January 31, 2018
:
50,484,040
DOCUMENTS INCORPORATED BY REFERENCE
Portions of Unisys Corporation’s Definitive Proxy Statement for the
2018
Annual Meeting of Stockholders are incorporated by reference into Part III hereof.
2
Table of Contents
|
Part I
|
Page Number
|
||
|
Item 1.
|
Business
|
||
|
Executive Officers of the Registrant
|
|||
|
Item 1A.
|
Risk Factors
|
||
|
Item 1B.
|
Unresolved Staff Comments
|
||
|
Item 2.
|
Properties
|
||
|
Item 3.
|
Legal Proceedings
|
||
|
Item 4.
|
Mine Safety Disclosures
|
||
|
Part II
|
|||
|
Item 5.
|
Market for the Registrant’s Common Equity, Related Stockholder Matters and Issuer Purchases of Equity Securities
|
||
|
Item 6.
|
Selected Financial Data
|
||
|
Item 7.
|
Management’s Discussion and Analysis of Financial Condition and Results of Operations
|
||
|
Item 7A.
|
Quantitative and Qualitative Disclosures about Market Risk
|
||
|
Item 8.
|
Financial Statements and Supplementary Data
|
||
|
Item 9.
|
Changes in and Disagreements with Accountants on Accounting and Financial Disclosure
|
||
|
Item 9A.
|
Controls and Procedures
|
||
|
Item 9B.
|
Other Information
|
||
|
Part III
|
|||
|
Item 10.
|
Directors, Executive Officers and Corporate Governance
|
||
|
Item 11.
|
Executive Compensation
|
||
|
Item 12.
|
Security Ownership of Certain Beneficial Owners and Management and Related Stockholder Matters
|
||
|
Item 13.
|
Certain Relationships and Related Transactions, and Director Independence
|
||
|
Item 14.
|
Principal Accountant Fees and Services
|
||
|
Part IV
|
|||
|
Item 15.
|
Exhibits and Financial Statement Schedules
|
||
|
Item 16.
|
Form 10-K Summary
|
||
|
Signatures
|
|||
3
Disclosure Regarding Forward-Looking Statements
In this Annual Report on Form 10-K, we have included information that may constitute “forward-looking” statements, as defined in the Private Securities Litigation Reform Act of 1995. Forward-looking statements provide current expectations of future events and include any statement that does not directly relate to any historical or current fact. Words such as “anticipates,” “believes,” “expects,” “intends,” “plans,” “projects” and similar expressions may identify such forward-looking statements.
Factors that could affect our future results include, but are not limited to, the following:
|
•
|
our ability to improve revenue and margins in our Services business;
|
|
•
|
our ability to maintain our installed base and sell new solutions in our Technology business;
|
|
•
|
our ability to effectively anticipate and respond to volatility and rapid technological innovation in our industry;
|
|
•
|
our ability to retain significant clients;
|
|
•
|
the potential adverse effects of aggressive competition in the information services and technology marketplace;
|
|
•
|
cybersecurity breaches could result in significant costs and could harm our business and reputation;
|
|
•
|
our significant pension obligations and required cash contributions and requirements to make additional significant cash contributions to our defined benefit pension plans;
|
|
•
|
our ability to attract, motivate and retain experienced and knowledgeable personnel in key positions;
|
|
•
|
the risks of doing business internationally when a significant portion of our revenue is derived from international operations;
|
|
•
|
our contracts may not be as profitable as expected or provide the expected level of revenues;
|
|
•
|
our ability to access financing markets;
|
|
•
|
contracts with U.S. governmental agencies may subject us to audits, criminal penalties, sanctions and other expenses and fines;
|
|
•
|
a significant disruption in our IT systems could adversely affect our business and reputation;
|
|
•
|
we may face damage to our reputation or legal liability if our clients are not satisfied with our services or products;
|
|
•
|
the performance and capabilities of third parties with whom we have commercial relationships;
|
|
•
|
an involuntary termination of the company’s U.S. qualified defined benefit pension plan;
|
|
•
|
the potential for intellectual property infringement claims to be asserted against us or our clients;
|
|
•
|
the business and financial risk in implementing future acquisitions or dispositions;
|
|
•
|
the adverse effects of global economic conditions, acts of war, terrorism or natural disasters; and
|
|
•
|
the possibility that pending litigation could affect our results of operations or cash flow.
|
Any forward-looking statement should be read in conjunction with our consolidated financial statements and the related notes included elsewhere in this Annual Report on Form 10-K. All forward-looking statements rely on assumptions and are subject to risks, uncertainties and other factors that could cause the company’s actual results to differ materially from expectations. Factors that could affect future results include, but are not limited to, those discussed in “Risk Factors” in Part I, Item 1A of this Form 10-K. Any forward-looking statement speaks only as of the date on which that statement is made. Unisys Corporation assumes no obligation to update any forward-looking statement to reflect events or circumstances that occur after the date on which the statement is made.
4
General
Unisys Corporation, a Delaware corporation (“Unisys,” “we,” “our,” or the “company”), is a global information technology (“IT”) company that builds high-performance, security-centric solutions for clients across the Government, Financial Services and Commercial markets. Unisys offerings include security software and services; digital transformation and workplace services; industry applications and services; and innovative software operating environments for high-intensity enterprise computing.
We operate in two business segments – Services and Technology. Financial information concerning the two segments can be found in Note 15, “Segment information,” of the Notes to Consolidated Financial Statements (Part II, Item 8 of this Form 10-K) (the “Notes to Consolidated Financial Statements”).
Principal Products and Services
We deliver high-performance, security-centric, leveraged services across industries, industry-specific application products and technology solutions worldwide to our primary target markets: government (the U.S. federal government and other public sector organizations around the world), commercial (e.g., travel and transportation and life sciences and healthcare) and financial services (e.g., commercial and retail banking).
Our solutions are designed to build better outcomes - securely - for our clients, enabling them to:
|
•
|
Transform core business processes to compete more effectively in their markets;
|
|
•
|
Improve user engagement for customers and workers, streamline operations and enhance go-to-market efforts;
|
|
•
|
Optimize IT infrastructure to meet digital-business requirements;
|
|
•
|
Simplify management of IT infrastructure and service delivery; and
|
|
•
|
Enhance enterprise security.
|
Within Services, our principal solutions include cloud and infrastructure services, application services and business process outsourcing services.
|
•
|
In cloud and infrastructure services, we help clients apply cloud and as-a-service delivery models to capitalize on business opportunities, make their end users more productive and manage and secure their IT infrastructure and operations more economically.
|
|
•
|
In application services, we help clients transform their business processes by developing and managing new leading-edge applications for select industries, offering advanced data analytics and modernizing existing enterprise applications.
|
|
•
|
In business process outsourcing services, we assume management of critical processes and functions for clients in target industries, helping them improve performance and reduce costs.
|
In Technology, we design and develop software and offer hardware and other related products to help clients reduce costs, improve security and flexibility and improve the efficiency of their data-center environments. As a pioneer in large-scale computing, we offer deep experience and rich technological capabilities in transaction-intensive, mission-critical environments. We provide a range of data-center, infrastructure management and cloud computing offerings to help clients virtualize and automate their data-center environments.
Our industry application products include solutions that allow law enforcement agencies to share critical investigative intelligence, integrated child support case management tools, and solutions that allow travel and transportation companies to manage freight and distribution as well as leverage predictive analytics. Our solutions also provide life sciences and healthcare companies with the ability to manage medical devices and enhanced visibility over the pharmaceutical supply chain. We also provide financial solutions to deliver secure, omnichannel banking.
Our Technology products include:
|
•
|
Unisys ClearPath Forward
®
, a secure, scalable, hardware-independent software operating environment for high-volume enterprise computing capable of delivering Unisys security across multiple hardware platforms. In 2016, Unisys began offering hardware-independent versions of the ClearPath operating environment, providing a tested, integrated stack of software products that can run on an Intel x86 server of the client’s choice.
|
5
|
•
|
Unisys Stealth
®
security software, which enables trusted identities to access micro-segmented critical assets and safely communicate through secure, encrypted channels. Stealth™ establishes irrefutable user authentication, prevents lateral attacker movement and reduces data center, mobile and cloud attack surfaces. Stealth also reduces the cost and complexity of securing information and operation technology as well as industrial control systems, allowing organizations to meet compliance and security mandates.
|
We market our services and products primarily through a direct sales force. Complementing our direct sales force, we make use of a select group of resellers and alliance partners to market our services and product portfolio. In certain foreign countries, we market primarily through distributors.
Materials
Unisys purchases components and supplies from a number of suppliers around the world. For certain Technology products, we rely on a single or limited number of suppliers, although we make every effort to assure that alternative sources are available if the need arises. The failure of our suppliers to deliver components and supplies in sufficient quantities and in a timely manner could adversely affect our business. For more information on the risks associated with purchasing components and supplies, see “Risk Factors” (Part I, Item 1A of this Form 10-K).
Patents, Trademarks and Licenses
As of January 31,
2018
, Unisys owns over
730
active U.S. patents and over
75
active patents granted in
twelve
non-U.S. jurisdictions. These patents cover systems and methods related to a wide variety of technologies, including, but not limited to, information security, cloud computing, virtualization, database encryption/management and user interfaces. We have granted licenses covering both single patents, and particular groups of patents, to others. Likewise, we have active licensing agreements granting us rights under patents owned by other entities. However, our business is not materially dependent upon any single patent, patent license, or related group thereof.
Unisys also maintains
26
U.S. trademark and service mark registrations, and over
540
additional trademark and service mark registrations in over
85
non-U.S. jurisdictions as of January 31,
2018
. These marks are valuable assets used on or in connection with our services and products, and as such are actively monitored, policed and protected by Unisys and its agents.
Seasonality
Our revenue is affected by such factors as the introduction of new services and products, the length of sales cycles and the seasonality of purchases. Seasonality has generally resulted in higher fourth quarter revenues than in other quarters.
Customers
No single client accounted for more than
10%
of our revenue in the year ended December 31,
2017
. Sales of commercial services and products to various agencies of the U.S. government represented approximately
21%
of total consolidated revenue in
2017
. For more information on the risks associated with contracting with governmental entities, see “Risk Factors” (Part I, Item 1A of this Form 10-K).
Backlog
In the Services segment, firm order backlog at
December 31, 2017
was
$4.3 billion
, compared to
$3.9 billion
at
December 31, 2016
. Approximately
$1.7 billion
(
40%
) of
2017
backlog is expected to be converted to revenue in
2018
. Although we believe that this backlog is firm, we may, for commercial reasons, allow the orders to be cancelled, with or without penalty. In addition, funded government contracts included in this backlog are generally subject to termination, in whole or part, at the convenience of the government or if funding becomes unavailable. In such cases, we are generally entitled to receive payment for work completed plus allowable termination or cancellation costs.
Because of the relatively short cycle between order and shipment in our Technology segment, we believe that backlog information for this segment is not material to the understanding of our business.
Competition
Our business is affected by rapid change in technology in the information services and technology industries and aggressive competition from many domestic and foreign companies. Principal competitors are systems integrators, consulting and other professional services firms, outsourcing providers, infrastructure services providers, computer hardware manufacturers and software providers. We compete primarily on the basis of service, product performance, technological innovation, and price. We believe that our continued focused investment in engineering and research and development, coupled with our sales and marketing capabilities, will have a favorable impact on our competitive position. For more information on the competitive risks we face, see “Risk Factors” (Part I, Item 1A of this Form 10-K).
6
Research and Development
Unisys-sponsored research and development costs were
$47.2 million
in
2017
,
$55.4 million
in
2016
, and
$76.4 million
in
2015
.
Environmental Matters
Our capital expenditures, earnings and competitive position have not been materially affected by compliance with federal, state and local laws regulating the protection of the environment. Capital expenditures for environmental control facilities are not expected to be material in
2018
and
2019
.
Employees
At
December 31, 2017
, we employed approximately
20,000
employees serving clients around the world.
International and Domestic Operations
We serve clients around the world, including multinational clients with operations in several regions. For the year ended December 31,
2017
, over 50% of our revenue was derived from international operations.
Financial information by geographic area is set forth in Note 15, “Segment information,” of the Notes to Consolidated Financial Statements. For more information on the risks of doing business internationally, see “Risk Factors” (Part I, Item 1A of this Form 10-K).
Available Information
Our Investor web site is located at www.unisys.com/investor. Through our web site, we make available, free of charge, our annual report on Form 10-K, quarterly reports on Form 10-Q, current reports on Form 8-K, and amendments to those reports filed or furnished pursuant to Section 13(a) or 15(d) of the Securities Exchange Act of 1934, as soon as reasonably practicable after this material is electronically filed with or furnished to the U.S. Securities and Exchange Commission (the “SEC”). We also make available on our web site our Guidelines on Significant Corporate Governance Issues, the charters of the Audit and Finance Committee, Compensation Committee, and Nominating and Corporate Governance Committee of our board of directors, and our Code of Ethics and Business Conduct. This information is also available in print to stockholders upon request. We do not intend for information on our web site to be part of this Annual Report on Form 10-K.
7
EXECUTIVE OFFICERS OF THE REGISTRANT
Information concerning the executive officers of Unisys as of February 15,
2018
is set forth below.
|
Name
|
Age
|
Position with Unisys
|
||
|
Peter A. Altabef
|
58
|
President and Chief Executive Officer
|
||
|
Tarek El-Sadany
|
54
|
Senior Vice President, Technology, and Chief Technology Officer
|
||
|
Eric Hutto
|
53
|
Senior Vice President and President, Enterprise Solutions
|
||
|
Gerald P. Kenney
|
66
|
Senior Vice President, General Counsel and Secretary
|
||
|
David A. Loeser
|
63
|
Senior Vice President, Worldwide Human Resources
|
||
|
Venkatapathi R. Puvvada
|
57
|
Senior Vice President; President, Federal Systems
|
||
|
Jeffrey E. Renzi
|
57
|
Senior Vice President and President, Global Sales
|
||
|
Ann S. Ruckstuhl
|
55
|
Senior Vice President, Chief Marketing Officer
|
||
|
Inder M. Singh
|
59
|
Senior Vice President, Chief Financial Officer
|
||
|
Shalabh Gupta
|
56
|
Vice President and Treasurer
|
||
|
Michael M. Thomson
|
49
|
Vice President and Corporate Controller
|
||
There is no family relationship among any of the above-named executive officers. The By-Laws provide that the officers of Unisys shall be elected annually by the Board of Directors and that each officer shall hold office for a term of one year and until a successor is elected and qualified, or until the officer’s earlier resignation or removal.
Mr. Altabef is President and Chief Executive Officer and is a member and Chairman-elect of the Board of Directors. Prior to joining Unisys in 2015, Mr. Altabef was the President and Chief Executive Officer, and a member of the board of directors, of MICROS Systems, Inc. from 2013 through 2014, when MICROS Systems, Inc. was acquired by Oracle Corporation. He previously served as President and Chief Executive Officer of Perot Systems Corporation from 2004 until 2009, when Perot Systems was acquired by Dell, Inc. Thereafter, Mr. Altabef served as President of Dell Services (a unit of Dell Inc.) until his departure in 2011. Mr. Altabef also serves on the President’s National Security Telecommunications Advisory Committee, the Board of Directors of NiSource Inc. and Petrus Trust Company, L.T.A., the Board of the East West Institute and the Board of Advisors of Merit Energy Company, LLC. He previously served as Senior Advisor to 2M Companies, Inc. in 2012, and served as a director of Belo Corporation from 2011 through 2013. Mr. Altabef has been an officer since 2015.
Mr. El-Sadany has been Senior Vice President, Technology, and Chief Technology Officer since 2015. Prior to joining Unisys, Mr. El-Sadany was Chief Operating Officer of Remedy Informatics, a provider of healthcare and life sciences predictive informatics solutions (2012-2014). Prior to Remedy, he served as Chairman and Chief Executive Officer of Egypt National Post and Chief Executive Officer of the Technology Innovation and Entrepreneurship Center of Egypt (2008-2012). Other positions held by Mr. El-Sadany include Senior Vice President of Development and Head of Operations at Iris Financial Solutions (2006-2008), Vice President of Global Product Support Services at Oracle Corporation (2003-2005), and Founder, Chief Executive Officer and Chief Technology Officer of DatAcme Corporation (2001-2003). Mr. El-Sadany has been an officer since 2015.
Mr. Hutto has been Senior Vice President and President, Enterprise Solutions since 2015, after joining Unisys earlier in that year as Vice President and General Manager, U.S. and Canada, Enterprise Solutions. Prior to joining Unisys, Mr. Hutto held senior leadership positions with Dell Services (a unit of Dell Inc.) (2006-2015), serving most recently as Global Vice President/General Manager, Infrastructure, Cloud and Consulting and Vice President/General Manager, Americas. Mr. Hutto has been an officer since 2015.
Mr. Kenney has been Senior Vice President, General Counsel and Secretary since 2013. Prior to joining Unisys, he had been with NEC Corporation of America, the North American subsidiary of global technology company NEC Corporation, since 1999, serving most recently as Senior Vice President, General Counsel and Corporate Secretary (2004-2013). Mr. Kenney has been an officer since 2013.
Mr. Loeser has been Senior Vice President, Chief Human Resources Officer since 2013. Prior to joining Unisys, Mr. Loeser was Executive Vice President, Human Resources for Mitel, a global provider of business communications and collaboration software and services (2012-2013). Before Mitel, he held strategic management and human resources executive positions with several multinational companies including Hostess Foods, Celanese, Quaker State, PepsiCo, Continental Airlines, Chevron, and CompuCom. Mr. Loeser has been an officer since 2013.
8
Mr. Puvvada has been Senior Vice President and President, Federal Systems since 2015. Mr. Puvvada had been serving as acting President of Federal Systems since 2014. Prior to that time, he served as group Vice President for the Unisys federal civilian agency business since 2010. From 2005 to 2010, he was Managing Partner and Chief Technology Officer for Unisys Federal Systems. Previously, Mr. Puvvada held various management positions since joining Unisys in 1992. Mr. Puvvada has been an officer since 2015.
Mr. Renzi has been Senior Vice President and President, Global Sales since 2014. Prior to joining Unisys, Mr. Renzi was Senior Vice President, Sales & Marketing, at Arise Virtual Solutions (2012-2013). From 2009 to 2012, Mr. Renzi held key sales and service management roles at Dell Corporation. From 2003 to 2009, Mr. Renzi served as Executive Vice President, Global Sales and Marketing, Alliances & Procurement, at Perot Systems. Prior to Perot Systems, he held a variety of sales leadership and individual sales contributor roles at Electronic Data Systems from 1989 to 2003. Mr. Renzi has been an officer since 2014.
Ms. Ruckstuhl has been Senior Vice President and Chief Marketing Officer since 2016. Prior to joining Unisys, she had been the Chief Marketing Officer at SOASTA, Inc., a digital performance management platform provider acquired by Akamai Technologies, Inc., from 2015 to 2016. Previously, Ms. Ruckstuhl was the Chief Marketing Officer at Live Ops (2012-2015), and head of marketing at Symantec’s NortonLive Services (2009-2011). She has also held marketing leadership positions with several other technology companies including Sybase, Inc., eBay, Inc. and Hewlett-Packard. Ms. Ruckstuhl has been an officer since 2016.
Mr. Singh has been Senior Vice President and Chief Financial Officer since 2016. He joined Unisys as Senior Vice President, Chief Marketing and Strategy Officer earlier that year. Prior to joining Unisys, he had been a Managing Director focusing on the technology, media and telecommunications sectors at SunTrust Robinson Humphrey, Inc. from 2014 to 2016. Previously, Mr. Singh served as Senior Vice President, Strategy and Finance for Comcast Corporation from 2012 to 2014 and as Vice President, Corporate Financial Strategy at Cisco Systems from 2009 to 2012. He has held other leadership roles at Cisco Systems, Lehman Brothers, Prudential Securities, Lucent Technologies, Inc., AT&T Corporation, and the American Express Company. Mr. Singh has been an officer since 2016.
Mr. Gupta has been Vice President and Treasurer since August 2017. Prior to Unisys, Mr. Gupta served as Vice President and Corporate Treasurer for Avon Products from 2012 until 2016. He also served as Treasurer for Evraz Inc. NA (2011 - 2012) and held the roles of Senior Vice President and Corporate Treasurer (2007 - 2011), Vice President and Assistant Treasurer (2005 - 2007) and Managing Director, Capital Markets, Pensions, Foreign Exchange (2004 - 2005) at Sara Lee Corporation. Mr. Gupta also held treasury roles at Delphi Corporation and General Motors Corporation. Mr. Gupta has been an officer since August 2017.
Mr. Thomson has been Vice President and Corporate Controller since 2015. Prior to joining Unisys, Mr. Thomson served as Controller of Towers Watson & Co. from 2010 until 2015, and he previously held the same position at Towers Perrin from 2007 until the consummation of that firm’s merger with Watson Wyatt in 2010. He also served as principal accounting officer of Towers Watson from 2012 until October 2015. Prior to that, Mr. Thomson worked for Towers Perrin as Director of Financial Systems from 2001 to 2004 and then Assistant Controller from 2004 to 2007. Prior to joining Towers Perrin, Mr. Thomson was with RCN Corporation, where he served as Director of Financial Reporting & Financial Systems from 1997 to 2001. Mr. Thomson has been an officer since 2015.
9
Factors that could affect future results include the following:
Future results may be adversely impacted if the company is unable to improve revenue and margins in its Services business.
The company’s strategy places an emphasis on an industry go-to-market approach with an increased focus within the company’s Services business on improving revenue trends, including specifically on higher value and higher margin offerings. The company’s ability to grow revenue and profitability in this business will depend on the level of demand for projects and the portfolio of solutions the company offers for specific industries. It will also depend on an efficient utilization of services delivery personnel. Revenue and profit margins in this business are a function of both the portfolio of solutions sold in a given period and the rates the company is able to charge for services and the chargeability of its professionals. If the company is unable to attain sufficient rates and chargeability for its professionals, revenue and profit margins will be adversely affected. The rates the company is able to charge for services are affected by a number of factors, including clients’ perception of the company’s ability to add value through its services; introduction of new services or products by the company or its competitors; pricing policies of competitors; and general economic conditions. Chargeability is also affected by a number of factors, including the company’s ability to transition resources from completed projects to new engagements and across geographies, and its ability to forecast demand for services and thereby maintain appropriate resource levels. The company’s results of operations and financial condition may be adversely impacted if sales of higher margin offerings do not offset declines resulting from lower margin offerings.
Future results may be adversely impacted if the company is unable to maintain its installed base and sell new solutions in its Technology business.
The company continues to invest in its ClearPath Forward operating system software in order to retain existing clients in its Technology business. If clients do not believe in the value proposition provided by ClearPath Forward or choose not to renew their contracts for any other reason, there may not be a meaningful return on these investments, and revenue could decline meaningfully. The company also continues to invest in its Stealth family of software, as well as in industry-specific software and solutions for its focus industries. If the company is unsuccessful in selling these Stealth products or industry-specific solutions and related services, there may not be a meaningful return on these investments. Further, the revenues generated by Stealth and other new solutions and related services may be insufficient to offset any revenue declines caused if the company is unable to retain its installed base.
The company’s future results may be adversely impacted if it is unable to effectively anticipate and respond to volatility and rapid technological innovation in its industry.
The company operates in a highly volatile industry characterized by rapid technological innovation, evolving technology standards, short product life cycles and continually changing customer demand patterns. Future success will depend in part on the company’s ability to anticipate and respond to these market trends and to design, develop, introduce, deliver or obtain new and innovative services and products on a timely and cost-effective basis using new delivery models such as cloud computing. The company may not be successful in anticipating or responding to changes in technology, industry standards or customer preferences, and the market may not demand or accept its services and product offerings. In addition, services and products developed by competitors may make the company’s offerings less competitive.
The company’s future results will depend on its ability to retain significant clients.
The company has a number of significant long-term contracts with clients, including governmental entities, and its future success will depend, in part, on retaining its relationships with these clients. The company could lose clients for reasons such as contract expiration, conversion to a competing service provider, disputes with clients or a decision to in-source services, including contracts with governmental entities as part of the rebid process. The company could also lose clients as a result of their merger, acquisition or business failure. The company may not be able to replace the revenue and earnings from any such lost client.
The company faces aggressive competition in the information services and technology marketplace, which could lead to reduced demand for the company’s services and products and could have an adverse effect on the company’s business.
The information services and technology markets in which the company operates include a large number of companies vying for customers and market share both domestically and internationally. The company’s competitors include systems integrators, consulting and other professional services firms, outsourcing providers, infrastructure services providers, computer hardware manufacturers and software providers. Some of the company’s competitors may develop competing services and products that offer better price-performance or that reach the market in advance of the company’s offerings. Some competitors also have or may develop greater financial and other resources than the company, with enhanced ability to compete for market share, in some instances through significant economic incentives to secure contracts. Some also may be better able to compete for skilled professionals. Any of these factors could lead to reduced demand for the company’s services and products and could have an adverse effect on the company’s business. Future results will depend on the company’s ability to mitigate the effects of aggressive competition on revenues, pricing and margins and on the company’s ability to attract and retain talented people.
10
Cybersecurity breaches could result in the company incurring significant costs and could harm the company’s business and reputation.
The company’s business includes managing, processing, storing and transmitting proprietary and confidential data, including personal information, intellectual property and proprietary business information, within the company’s own IT systems and those that the company designs, develops, hosts or manages for clients. Cybersecurity breaches involving these systems by hackers, other third parties or the company’s employees, despite established security controls, could disrupt these systems or result in the loss or corruption of data or the unauthorized disclosure or misuse of information of the company, its clients or others. This could result in claims, investigations, litigation and legal liability for the company, lead to the loss of existing or potential clients and adversely affect the market’s perception of the security and reliability of the company’s services and products. In addition, such breaches could subject the company to fines and penalties for violations of laws and result in the company incurring other significant costs. This may negatively impact the company’s reputation and financial results.
The company has significant pension obligations and required cash contributions and may be required to make additional significant cash contributions to its defined benefit pension plans.
The company has significant unfunded obligations under its U.S. and non-U.S. defined benefit pension plans. In
2017
, the company made cash contributions of
$138.4 million
to its worldwide defined benefit pension plans. Based on current legislation, global regulations, recent interest rates and expected returns, in
2018
the company estimates that it will make cash contributions to its worldwide defined benefit pension plans of approximately
$149.7 million
, which are comprised of approximately
$86.3 million
for the company’s U.S. qualified defined benefit pension plan and approximately
$63.4 million
primarily for non-U.S. defined benefit pension plans. Although estimates for future cash contributions are likely to change based on a number of factors including market conditions and changes in discount rates, the company currently anticipates that its required cash contributions will increase in 2020 and for the next several years.
Deterioration in the value of the company’s worldwide defined benefit pension plan assets, as well as discount rate changes or changes in economic or demographic trends, could require the company to make cash contributions to its defined benefit pension plans in the future in an amount larger than currently anticipated. Increased cash contribution requirements or an acceleration in the due date of such cash contributions would reduce the cash available for working capital, capital expenditures and other corporate uses and may have an adverse impact on the company’s operations, financial condition and liquidity.
If the company is unable to attract, motivate and retain experienced and knowledgeable personnel in key positions, its future results could be adversely impacted.
The success of the company’s business is dependent upon its ability to employ and train individuals with the requisite knowledge, skills and experience to execute the company’s business model and achieve its business objectives. The failure of the company to retain key personnel or implement an appropriate succession plan could adversely impact the company’s ability to successfully carry out its business strategy and retain other key personnel.
A significant portion of the company’s revenue is derived from operations outside of the United States, and the company is subject to the risks of doing business internationally.
A significant portion of the company’s total revenue is derived from international operations. The risks of doing business internationally include foreign currency exchange rate fluctuations, currency restrictions and devaluations, changes in political or economic conditions, trade protection measures, import or export licensing requirements, multiple and possibly overlapping and conflicting tax laws, new tax legislation, weaker intellectual property protections in some jurisdictions and additional legal and regulatory compliance requirements applicable to businesses that operate internationally, including the U.S. Foreign Corrupt Practices Act, economic and trade sanctions regulations administered by the U.S. Treasury Department’s Office of Foreign Assets Control, regulations in the European Union such as the General Data Protection Regulation, the U.K. Bribery Act and other U.S. and non-U.S. laws and regulations.
The company’s contracts may not be as profitable as expected or provide the expected level of revenues
.
In a number of the company’s long-term services contracts, the company’s revenue is based on the volume of services and products provided. As a result, revenue levels anticipated at the contract’s inception are not guaranteed. In addition, some of these contracts may permit termination at the customer’s discretion before the end of the contract’s term or may permit termination or impose other penalties if the company does not meet the performance levels specified in the contracts.
The company’s contracts with governmental entities are subject to the availability of appropriated funds. These contracts also contain provisions allowing the governmental entity to terminate the contract at the governmental entity’s discretion before the end of the contract’s term. In addition, if the company’s performance is unacceptable to the customer under a government contract, the government retains the right to pursue remedies under the affected contract, which remedies could include termination.
11
Certain of the company’s services agreements require that the company’s prices be benchmarked if the customer requests it and provide that those prices may be adjusted downward if the pricing for similar services in the market has changed. As a result, revenues anticipated at the beginning of the terms of these contracts may decline in the future.
Some of the company’s services contracts are fixed-price contracts under which the company assumes the risk for delivery of the contracted services and products at an agreed-upon fixed price. Should the company experience problems in performing fixed-price contracts on a profitable basis, adjustments to the estimated cost to complete may be required. Future results will depend on the company’s ability to perform these services contracts profitably.
If the company is unable to access the financing markets, it may adversely impact the company’s business and liquidity
.
Market conditions may impact the company’s ability to access the financing markets on terms acceptable to the company or at all. If the company is unable to access the financing markets, the company would be required to use cash on hand to fund operations and repay outstanding debt as it comes due. There is no assurance that the company will generate sufficient cash to fund its operations and refinance such debt. A failure by the company to generate such cash would have a material adverse effect on its business if the company were unable to access financing markets. Market conditions may also impact the company’s ability to utilize surety bonds, letters of credit, foreign exchange derivatives or other financial instruments the company uses to conduct its business.
The company’s contracts with U.S. governmental agencies may subject the company to audits, criminal penalties, sanctions and other expenses and fines.
The company frequently enters into contracts with governmental entities. U.S. government agencies, including the Defense Contract Audit Agency and the Department of Labor, routinely audit government contractors. These agencies review a contractor’s performance under its contracts, cost structure and compliance with applicable laws, regulations and standards. The U.S. government also may review the adequacy of, and a contractor’s compliance with, contract terms and conditions, and its systems and policies, including the contractor’s purchasing, property, estimating, billing, accounting, compensation and management information systems. Any costs found to be overcharged or improperly allocated to a specific contract or any amounts improperly billed or charged for products or services will be subject to reimbursement to the government. In addition, government contractors, such as the company, are required to disclose credible evidence of certain violations of law and contract overcharging to the federal government. If the company is found to have participated in improper or illegal activities, the company may be subject to civil and criminal penalties and administrative sanctions, including termination of contracts, forfeiture of profits, suspension of payments, fines and suspension or prohibition from doing business with the U.S. government. Any negative publicity related to such contracts, regardless of the accuracy of such publicity, may adversely affect the company’s business or reputation.
A significant disruption in the company’s IT systems could adversely affect the company’s business and reputation.
We rely extensively on our IT systems to conduct our business and perform services for our clients. Our systems are subject to damage or interruption from power outages, telecommunications failures, computer viruses and malicious attacks, cybersecurity breaches and catastrophic events. If our systems are accessed without our authorization, damaged or fail to function properly, we could incur substantial repair or replacement costs, experience data loss and impediments to our ability to conduct our business, and damage the market’s perception of our services and products. In addition, a disruption could result in the company failing to meet performance standards and obligations in its client contracts, which could subject the company to liability, penalties and contract termination. This may adversely affect the company’s reputation and financial results.
The company may face damage to its reputation or legal liability if its clients are not satisfied with its services or products.
The success of the company’s business is dependent on strong, long-term client relationships and on its reputation for responsiveness and quality. As a result, if a client is not satisfied with the company’s services or products, its reputation could be damaged and its business adversely affected. Allegations by private litigants or regulators of improper conduct, as well as negative publicity and press speculation about the company, whatever the outcome and whether or not valid, may harm its reputation. In addition to harm to reputation, if the company fails to meet its contractual obligations, it could be subject to legal liability, which could adversely affect its business, operating results and financial condition.
Future results will depend in part on the performance and capabilities of third parties with whom the company has commercial relationships.
The company maintains business relationships with suppliers, channel partners and other parties that have complementary products, services or skills. Future results will depend, in part, on the performance and capabilities of these third parties, on the ability of external suppliers to deliver components at reasonable prices and in a timely manner, and on the financial condition of, and the company’s relationship with, distributors and other indirect channel partners, which can affect the company’s capacity to effectively and efficiently serve current and potential customers and end users.
12
An involuntary termination of the company’s U.S. qualified defined benefit pension plan would adversely affect the company’s financial condition and results of operations.
As of December 31,
2017
, the company had approximately
$1.3 billion
of underfunded pension obligations under its U.S. qualified defined benefit pension plan. The Pension Benefit Guaranty Corporation (the “PBGC”) has authority under the Employment Retirement Income Security Act of 1974, as amended, to terminate an underfunded defined benefit pension plan under certain circumstances, including when (1) the plan has not met the minimum funding requirements, (2) the plan cannot pay current benefits when due, or (3) the loss to the PBGC is reasonably expected to increase unreasonably over time if the plan is not terminated. If the PBGC were to terminate the company’s U.S. qualified defined benefit pension plan, the company’s obligations with respect to such plan would become due and payable in full. Any such event or the failure by the company to pay its pension plan insurance premiums with respect to its U.S. qualified defined benefit pension plan could result in the PBGC obtaining a lien on the company’s assets. Such an event would result in an event of default under the company’s debt agreements and would materially and adversely affect the Company’s financial condition and results of operations.
The company’s services or products may infringe upon the intellectual property rights of others.
The company cannot be sure that its services and products do not infringe on the intellectual property rights of third parties, and it may have infringement claims asserted against it or against its clients. These claims could cost the company money, prevent it from offering some services or products, or damage its reputation.
The company could face business and financial risk in implementing future acquisitions or dispositions.
As part of the company’s business strategy, it may from time to time consider acquiring complementary technologies, products and businesses, or disposing of existing technologies, products and businesses that may no longer be in alignment with its strategic direction, including transactions of a material size. Any acquisitions may result in the incurrence of substantial additional indebtedness or contingent liabilities. Acquisitions could also result in potentially dilutive issuances of equity securities and an increase in amortization expenses related to intangible assets. Additional potential risks associated with acquisitions include integration difficulties; difficulties in maintaining or enhancing the profitability of any acquired business; risks of entering markets in which the company has no or limited prior experience; potential loss of employees or failure to maintain or renew any contracts of any acquired business; and expenses of any undiscovered or potential liabilities of the acquired product or business, including relating to employee benefits contribution obligations or environmental requirements. Potential risks with respect to dispositions include difficulty finding buyers or alternative exit strategies on acceptable terms in a timely manner; potential loss of employees or clients; dispositions at unfavorable prices or on unfavorable terms, including relating to retained liabilities; and post-closing indemnity claims. Further, with respect to both acquisitions and dispositions, management’s attention could be diverted from other business concerns. Adverse credit conditions could also affect the company’s ability to consummate acquisitions or dispositions. The risks associated with acquisitions and dispositions could have a material adverse effect upon the company’s business, financial condition and results of operations. There can be no assurance that the company will be successful in consummating future acquisitions or dispositions on favorable terms or at all.
The company’s business can be adversely affected by global economic conditions, acts of war, terrorism or natural disasters.
The company’s financial results have been impacted by the global economic slowdown in recent years. If economic conditions worsen, the company could see reductions in demand and increased pressure on revenue and profit margins. The company could also see a further consolidation of clients, which could also result in a decrease in demand. The company’s business could also be affected by acts of war, terrorism or natural disasters. Current world tensions could escalate, and this could have unpredictable consequences on the world economy and on the company’s business.
Pending litigation could affect the company’s results of operations or cash flow.
There are various lawsuits, claims, investigations and proceedings that have been brought or asserted against the company, which arise in the ordinary course of business, including actions with respect to commercial and government contracts, labor and employment, employee benefits, environmental matters, intellectual property and non-income tax matters. See Note 14, “Litigation and contingencies,” of the Notes to Consolidated Financial Statements for more information on litigation. The company believes that it has valid defenses with respect to legal matters pending against it. Litigation is inherently unpredictable, however, and it is possible that the company’s results of operations or cash flows could be materially affected in any particular period by the resolution of one or more of the legal matters pending against it.
Our controls and procedures may fail or be circumvented, which may result in a material adverse effect on our business, results of operations and financial condition.
Management periodically reviews and updates our internal controls, disclosure controls and procedures and corporate governance policies. Any system of controls, however well designed and operated, is based in part on certain assumptions and can provide only reasonable, not absolute, assurances that the objectives of the system are met. Any failure or circumvention of the controls and procedures, or failure to comply with regulations related to controls and procedures, could have a material adverse effect on our business, results of operations and financial condition.
13
As disclosed in Item 9A. “Controls and Procedures,” a material weakness was identified in our internal control over financial reporting resulting from risk assessment procedures over Technology revenue that did not adequately consider changes in business operations and the demands on personnel created by the efforts required to adopt the new revenue accounting pronouncement that will impact future financial reporting. As a result, the company had missing process level controls and insufficient trained personnel to operate process level controls over the measurement and recognition of multiple-element arrangements within Technology revenue. Based on this material weakness, management concluded that our disclosure controls and procedures were not effective as of December 31, 2017. A material weakness is a deficiency, or a combination of deficiencies, in internal control over financial reporting, such that there is a reasonable possibility that a material misstatement of a company's annual or interim financial statements will not be prevented or detected on a timely basis. The material weakness did not result in any misstatement of the Company’s consolidated financial statements for any period presented and we are implementing remedial measures intended to address the material weakness and related disclosure controls. However, if the remedial measures we are implementing are insufficient, or if additional material weaknesses or significant deficiencies in our internal control over financial reporting or in our disclosure controls occur in the future, our future consolidated financial statements or other information filed with the SEC may contain material misstatements. Failure to maintain effective controls or to timely implement any necessary improvement of our internal and disclosure controls could, among other things, result in losses from errors, harm our reputation, or cause investors to lose confidence in the reported financial information, all of which could have a material adverse effect on our business, results of operations and financial condition.
Other factors discussed in this report, although not listed here, also could materially affect our future results.
14
Not applicable.
As of
December 31, 2017
, we had
eight
major facilities in the United States, with an aggregate floor space of approximately
1.1 million
square feet, located in Minnesota, Pennsylvania, Virginia, Utah, California and Georgia. We owned
one
of these facilities, with aggregate floor space of approximately
0.3 million
square feet;
seven
of these facilities, with approximately
0.8 million
square feet of floor space, were leased to us. Approximately
1.0 million
square feet of the U.S. facilities were in current operation and approximately
0.1 million
square feet were subleased to others.
As of
December 31, 2017
, we had
eleven
major facilities outside the United States, with an aggregate floor space of approximately
1.2 million
square feet, located in the United Kingdom, India, Brazil, Australia, Hungary and New Zealand. We owned
one
of these facilities, with approximately
0.2 million
square feet of floor space;
ten
of these facilities, with approximately
1.0 million
square feet of floor space, were leased to us. Approximately
0.9 million
square feet of the facilities outside the United States were in current operation and approximately
0.2 million
square feet were subleased to others.
Our major facilities include offices, data centers, call centers, engineering centers and sales centers. We believe that our facilities are suitable and adequate for current and presently projected needs. We continuously review our anticipated requirements for facilities and will from time to time acquire additional facilities, expand existing facilities, and dispose of existing facilities or parts thereof, as necessary.
Information with respect to litigation is set forth in Note 14, “Litigation and contingencies,” of the Notes to Consolidated Financial Statements and is incorporated herein by reference.
Not applicable.
15
Market Information
Unisys Common Stock (trading symbol “UIS”) is listed for trading on the New York Stock Exchange and London Stock Exchange. Information on the high and low sales prices for Unisys Common Stock is set forth below. At
December 31, 2017
, there were approximately
50.5 million
shares outstanding.
|
First
Quarter
|
|
Second
Quarter
|
|
Third
Quarter
|
|
Fourth
Quarter
|
|
Year
|
|
|||||||||||||
|
2017
|
||||||||||||||||||||||
|
Market price per share
|
– high
|
$
|
15.25
|
|
$
|
14.15
|
|
$
|
13.25
|
|
$
|
9.15
|
|
$
|
15.25
|
|
||||||
|
|
– low
|
11.55
|
|
10.75
|
|
6.90
|
|
7.20
|
|
6.90
|
|
|||||||||||
|
2016
|
||||||||||||||||||||||
|
Market price per share
|
– high
|
12.00
|
|
8.58
|
|
10.70
|
|
16.70
|
|
16.70
|
|
|||||||||||
|
|
– low
|
7.10
|
|
6.72
|
|
6.74
|
|
8.95
|
|
6.72
|
|
|||||||||||
Market prices per share are as quoted on the New York Stock Exchange composite listing.
Holders of Record
At
December 31, 2017
, there were approximately
5,600
stockholders of record.
Dividend Policy
Unisys has not declared or paid any cash dividends on its Common Stock since 1990, and we do not anticipate declaring or paying cash dividends in the foreseeable future.
Repurchase of Equity Securities
None.
16
Stock Performance
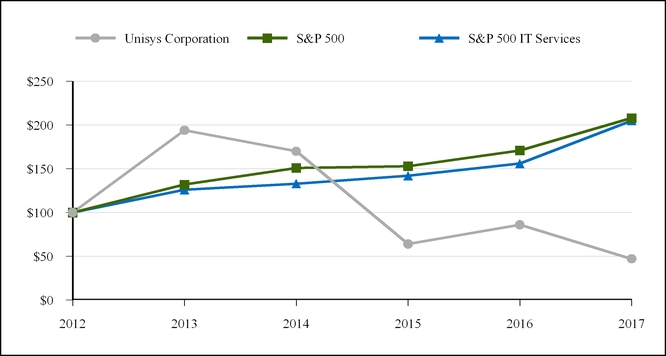
The following graph compares the cumulative total stockholder return on Unisys common stock during the five fiscal years ended December 31,
2017
, with the cumulative total return on the Standard & Poor’s 500 Stock Index and the Standard & Poor’s 500 IT Services Index. The comparison assumes $100 was invested on December 31, 2012, in Unisys common stock and in each of such indices and assumes reinvestment of any dividends.
|
2012
|
|
2013
|
|
2014
|
|
2015
|
|
2016
|
|
2017
|
|
|||||||
|
Unisys Corporation
|
$
|
100
|
|
$
|
194
|
|
$
|
170
|
|
$
|
64
|
|
$
|
86
|
|
$
|
47
|
|
|
S&P 500
|
$
|
100
|
|
$
|
132
|
|
$
|
151
|
|
$
|
153
|
|
$
|
171
|
|
$
|
208
|
|
|
S&P 500 IT Services
|
$
|
100
|
|
$
|
126
|
|
$
|
133
|
|
$
|
142
|
|
$
|
156
|
|
$
|
205
|
|
17
Five-year summary of selected financial data
|
(Dollars in millions, except per share data)
|
2017
(a)
|
|
2016
(a)
|
2015
(a)
|
|
2014
|
|
2013
|
|
|||||||||||
|
Results of operations
|
||||||||||||||||||||
|
Revenue
|
$
|
2,741.8
|
|
$
|
2,820.7
|
|
$
|
3,015.1
|
|
$
|
3,356.4
|
|
$
|
3,456.5
|
|
|||||
|
Operating profit (loss)
|
4.6
|
|
47.6
|
|
(55.1
|
)
|
154.9
|
|
219.5
|
|
||||||||||
|
Income (loss) before income taxes
|
(72.1
|
)
|
20.5
|
|
(58.8
|
)
|
145.5
|
|
219.4
|
|
||||||||||
|
Net income (loss) attributable to noncontrolling interests
|
(1.3
|
)
|
11.0
|
|
6.7
|
|
12.6
|
|
11.6
|
|
||||||||||
|
Net income (loss) attributable to Unisys Corporation common shareholders
|
(65.3
|
)
|
(47.7
|
)
|
(109.9
|
)
|
44.0
|
|
92.3
|
|
||||||||||
|
Earnings (loss) per common share
|
||||||||||||||||||||
|
Basic
|
(1.30
|
)
|
(0.95
|
)
|
(2.20
|
)
|
0.89
|
|
2.10
|
|
||||||||||
|
Diluted
|
(1.30
|
)
|
(0.95
|
)
|
(2.20
|
)
|
0.89
|
|
2.08
|
|
||||||||||
|
Financial position
|
||||||||||||||||||||
|
Total assets
|
$
|
2,542.4
|
|
$
|
2,021.6
|
|
$
|
2,130.0
|
|
$
|
2,321.0
|
|
$
|
2,497.8
|
|
|||||
|
Long-term debt
|
633.9
|
|
194.0
|
|
233.7
|
|
219.2
|
|
205.9
|
|
||||||||||
|
Deficit
|
(1,326.5
|
)
|
(1,647.4
|
)
|
(1,378.6
|
)
|
(1,452.4
|
)
|
(663.9
|
)
|
||||||||||
|
Other data
|
||||||||||||||||||||
|
Capital additions of properties
|
$
|
25.8
|
|
$
|
32.5
|
|
$
|
49.6
|
|
$
|
53.3
|
|
$
|
47.2
|
|
|||||
|
Capital additions of outsourcing assets
|
86.3
|
|
51.3
|
|
102.0
|
|
85.9
|
|
39.9
|
|
||||||||||
|
Investment in marketable software
|
64.4
|
|
63.3
|
|
62.1
|
|
73.6
|
|
64.3
|
|
||||||||||
|
Depreciation and amortization
|
||||||||||||||||||||
|
Properties
|
39.7
|
|
38.9
|
|
57.5
|
|
52.0
|
|
46.7
|
|
||||||||||
|
Outsourcing assets
|
53.7
|
|
51.9
|
|
55.7
|
|
58.1
|
|
53.5
|
|
||||||||||
|
Amortization of marketable software
|
63.1
|
|
64.8
|
|
66.9
|
|
58.5
|
|
59.4
|
|
||||||||||
|
Common shares outstanding (millions)
|
50.5
|
|
50.1
|
|
49.9
|
|
49.7
|
|
44.0
|
|
||||||||||
|
Stockholders of record (thousands)
|
5.6
|
|
6.0
|
|
6.2
|
|
11.1
|
|
11.8
|
|
||||||||||
|
Employees (thousands)
|
20.5
|
|
21.0
|
|
23.0
|
|
23.2
|
|
22.8
|
|
||||||||||
|
(a)
|
Includes pretax cost reduction and other charges of
$146.8 million
,
$82.1 million
and
$118.5 million
for the years ended December 31, 2017, 2016 and 2015, respectively. See Note 3, “Cost reduction actions,” of the Notes to Consolidated Financial Statements.
|
18
Overview
In April 2015, the company initiated a restructuring plan in connection with organizational initiatives to create a more cost competitive cost structure and rebalance the company’s global skill set. During the years ended December 31,
2017
,
2016
and
2015
, the company recognized charges and other costs of
$146.8 million
,
$82.1 million
and
$118.5 million
, respectively, in connection with this plan, principally related to a reduction in employees.
The company reported a
2017
net loss attributable to Unisys Corporation of
$65.3 million
, or a loss of
$1.30
per diluted share, compared with a
2016
net loss attributable to Unisys Corporation of
$47.7 million
, or a loss of
$0.95
per diluted share. The company’s results of operations in the current year were impacted by higher cost reduction charges, higher interest expense principally caused by the issuance of the senior secured notes partially offset by savings derived from the cost reduction actions and lower income tax expense.
The company’s underfunded defined benefit pension plan obligations
decreased
by approximately
$390 million
to
$1.78 billion
at
December 31, 2017
from
$2.17 billion
at
December 31, 2016
, principally due to higher pension plan assets partially offset by a decrease in discount rates.
Results of operations
Company results
During
2017
, the company recognized charges in connection with its cost reduction plan and other costs of
$146.8 million
. The charges related to work-force reductions were
$117.9 million
, principally related to severance costs, and were comprised of: (a) a charge of
$9.4 million
for
542
employees and
$(1.3) million
for changes in estimates in the U.S. and (b) a charge of
$109.4 million
for
2,274
employees,
$8.2 million
for additional benefits provided in
2017
and
$(7.8) million
for changes in estimates outside the U.S. In addition, the company recorded charges of
$28.9 million
comprised of
$4.7 million
for idle leased facilities costs,
$5.4 million
for contract amendment and termination costs,
$5.2 million
for professional fees and other expenses related to the cost reduction effort,
$1.8 million
for net asset sales and write-offs and
$11.8 million
for net foreign currency losses related to exiting foreign countries.
The
2017
charges were recorded in the following statement of income classifications: cost of revenue - services,
$99.6 million
; cost of revenue - technology,
$0.4 million
; selling, general and administrative expenses,
$33.6 million
; research and development expenses,
$1.4 million
; and other income (expense), net,
$11.8 million
.
During
2016
, the company recognized charges of
$82.1 million
in connection with this plan. The charges related to work-force reductions were
$62.6 million
, principally related to severance costs, and were comprised of: (a) charges of
$8.3 million
for
351
employees and
$(1.3) million
for changes in estimates in the U.S. and (b) a charge of
$58.6 million
for
1,048
employees and
$(3.0) million
for changes in estimates outside the U.S. In addition, the company recorded charges of
$19.5 million
comprised of
$1.4 million
for idle leased facilities,
$4.1 million
for contract amendment and termination costs and
$13.3 million
for professional fees and other expenses related to the cost reduction effort and
$0.7 million
for net asset sales and write-offs.
The
2016
charges were recorded in the following statement of income classifications: cost of revenue - services,
$42.4 million
; selling, general and administrative expenses,
$38.0 million
; and research and development expenses,
$1.7 million
.
During
2015
, the company recognized charges of
$118.5 million
in connection with this plan, principally related to a reduction in employees. The charges related to work-force reductions were
$78.8 million
and were comprised of: (a) a charge of
$27.9 million
for
700
employees in the U.S. and (b) a charge of
$50.9 million
for
782
employees outside the U.S. In addition, the company recorded charges of
$39.7 million
comprised of
$20.2 million
for asset impairments and
$19.5 million
for other expenses related to the cost reduction effort.
The 2015 charges were recorded in the following statement of income classifications: cost of revenue - services,
$52.3 million
; cost of revenue - technology,
$0.3 million
; selling, general and administrative expenses,
$53.5 million
; and research and development expenses,
$12.4 million
.
Revenue for
2017
was
$2.74 billion
compared with
$2.82 billion
for
2016
, a
decrease
of
3%
. Foreign currency fluctuations had a
1
-percentage-point
positive
impact on revenue in the current year compared with the year-ago period.
Services revenue
decreased
3%
and Technology revenue was flat year over year. Foreign currency fluctuations had a negligible impact on Services revenue and a
1
-percentage-point
positive
impact on Technology revenue in the current year compared with the year-ago period.
Revenue for
2016
was
$2.82 billion
compared with
2015
revenue of
$3.02 billion
, a
decrease
of
6%
. Foreign currency had a
2
-percentage-point
negative
impact on revenue in
2016
compared with
2015
.
19
Services revenue in
2016
decreased
by
8%
compared with
2015
. Technology revenue in
2016
increased
by
1%
compared with
2015
.
Revenue from international operations in
2017
,
2016
and
2015
was
$1.48 billion
,
$1.51 billion
and
$1.56 billion
, respectively. Foreign currency had a
1
-percentage-point
positive
impact on international revenue in
2017
compared with
2016
, and a
4
-percentage-point
negative
impact on international revenue in
2016
compared with
2015
. Revenue from U.S. operations was
$1.26 billion
in
2017
,
$1.31 billion
in
2016
and
$1.45 billion
in
2015
.
Gross profit as a percent of total revenue, or gross profit percent, was
17.4%
in
2017
,
19.8%
in
2016
and
17.9%
in
2015
. The
decline
in
2017
from
2016
was principally due to higher cost reduction charges of
$57.6 million
and higher pension expense of
$10.0 million
. The increase in
2016
from
2015
was principally due to higher sales of the company’s proprietary enterprise software and servers in
2016
, lower cost reduction charges of
$10.2 million
and lower pension expense of
$17.3 million
.
Selling, general and administrative expenses were
$426.5 million
in
2017
(
15.6%
of revenue),
$455.6 million
in
2016
(
16.2%
of revenue) and
$519.6 million
in
2015
(
17.2%
of revenue). Cost reduction charges of
$33.6 million
were recorded in 2017 compared with
$38.0 million
in 2016. Exclusive of these charges, the decline was due to benefits derived from the cost reduction actions.
Research and development (“R&D”) expenses in
2017
were
$47.2 million
compared with
$55.4 million
in
2016
and
$76.4 million
in
2015
. The decline principally reflects savings due to cost reduction actions.
Pension expense for
2017
was
$92.4 million
compared with
$82.7 million
in
2016
and
$108.7 million
in
2015
. For
2018
, the company expects to recognize pension expense of approximately
$72.8 million
. The expected decrease in pension expense in
2018
compared with
2017
is principally due to a lower interest cost component of pension expense for the company’s U.S. defined benefit pension plans. The company records pension income or expense, as well as other employee-related costs such as payroll taxes and medical insurance costs, in operating income in the following income statement categories: cost of revenue; selling, general and administrative expenses; and research and development expenses. The amount allocated to each category is based on where the salaries of active employees are charged.
Effective January 1, 2018, the company approved an amendment to reorganize its U.S. defined benefit pension plan from one plan into two distinct plans. Participants were divided between plans to maximize administrative efficiencies in compliance with all regulations. The company estimates administrative costs including Pension Benefit Guaranty Corporation (“PBGC”) premiums, and the resulting contributions to fund such costs, will be reduced by approximately $10 million per year through 2021. Benefits offered to plans’ participants are unchanged. This amendment had no impact on the company’s consolidated results of operations and financial position for the year ended and as of December 31, 2017.
In
2017
, the company reported an operating profit of
$4.6 million
compared with an operating profit of
$47.6 million
in
2016
and an operating loss of
$55.1 million
in
2015
. The current year principally reflects higher cost reduction charges and higher pension expense partially offset by savings due to cost reduction actions.
Interest expense was
$52.8 million
in
2017
,
$27.4 million
in
2016
and
$11.9 million
in
2015
. The increase in
2017
compared with
2016
was principally caused by the issuance of senior secured notes (see Note 9, “Debt,” of the Notes to Consolidated Financial Statements).
Other income (expense), net was expense of
$23.9 million
in
2017
, compared with income of
$0.3 million
in
2016
and income of
$8.2 million
in
2015
. Included in
2017
were $11.8 million of net foreign currency losses related to exiting foreign countries in connection with the company’s restructuring plan and foreign exchange losses of
$9.9 million
.
2016
and
2015
included foreign exchange gains of
$2.3 million
and
$8.1 million
.
Income (loss) before income taxes in
2017
was a loss of
$72.1 million
compared with income of
$20.5 million
in
2016
and a loss of
$58.8 million
in
2015
.
The (benefit) provision for income taxes in
2017
,
2016
and
2015
was
$(5.5) million
,
$57.2 million
and
$44.4 million
, respectively. In
2017
,
2016
and
2015
, the provision for income taxes includes a benefit of
$4.6 million
,
$16.4 million
and
$5.4 million
, respectively, related to changes in judgment on the realizability of certain of its deferred tax assets. The 2016 and 2015 income tax provisions include a charge of
$3.5 million
and
$9.1 million
, respectively, due to reductions in the UK income tax rate (see Note 7, “Income taxes,” of the Notes to Consolidated Financial Statements).
The Tax Cuts and Jobs Act (“TCJA”) was enacted by the U.S. on December 22, 2017. The TCJA eliminates the corporate Alternative Minimum Tax (“AMT”) beginning in 2018, and also provides for refunds of all remaining AMT credits. Consequently, the company recorded a benefit of $50.4 million in 2017. Of this total, $9.1 million was received in 2017, and approximately $7.2 million will be received in 2018 under Internal Revenue Code section 168(k)(4) of the prior tax law. The remainder, $34.1 million, will be refundable under the TCJA between 2019 and 2022.
In addition to AMT repeal, the TCJA includes extensive changes to U.S. corporate taxation. The company has considered the implications of the TCJA for 2017 financial reporting as well as implications going forward. The U.S. federal tax rate has been
20
reduced from 35% to 21% effective in 2018. This rate decrease results in a remeasurement of U.S. deferred tax balances, with no net financial statement impact due to the valuation allowance recorded against all U.S. deferred tax assets.
There will be no expiration of U.S. tax losses generated in 2018 and beyond, but such losses will only be able to offset 80% of future U.S. taxable income. The TJCA did not include any law changes for losses that were generated prior to 2018; and consequently, the company can utilize its U.S. tax loss carryforwards from years prior to 2018 without limitation, but the losses continue to be subject to a twenty-year expiration.
The TCJA introduced a “base erosion and anti-abuse tax” (“BEAT”) which imposes a new minimum tax computed on a modified U.S. taxable income that adds back certain “base eroding payments” to offshore related parties. These addbacks include such items as interest and service payments. The minimum tax will be imposed at 5% for 2018, 10% for 2019-2025, and 12.5% from 2026. The BEAT has the potential to impact the company beginning in 2018. The company is currently assessing the impact. To the extent BEAT is applicable, it will be recorded as a period cost when incurred, and consequently has no impact on the 2017 financial statements.
The TCJA also introduced a tax on “global intangible low-taxed income” (“GILTI”). Beginning in 2018, rather than deferring the taxation of offshore earnings until repatriation as had been the law prior to 2018, U.S. taxable income each year will include GILTI, which is essentially the net foreign subsidiaries’ earnings above a routine 10% return on their tangible assets. The company has made an accounting policy election to treat the GILTI as a period cost when included in U.S. taxable income, and consequently GILTI has no impact on the 2017 financial statements. The company will continue to assess the impact of GILTI, but does not expect it to result in a U.S. cash tax for the forseeable future due to tax loss carryforwards.
The company will continue to assess the impact of other provisions of the TCJA, including limitations on deductions for net interest expense and executive compensation. None of these impact the 2017 financial statements, and are not expected to result in a U.S. cash tax for the forseeable future due to tax loss carryforwards.
The company evaluates quarterly the realizability of its deferred tax assets by assessing its valuation allowance and by adjusting the amount of such allowance, if necessary. The company records a tax provision or benefit for those international subsidiaries that do not have a full valuation allowance against their deferred tax assets. Any profit or loss recorded for the company’s U.S. operations will have no provision or benefit associated with it due to the company’s valuation allowance, except with respect to refundable tax credits and withholding taxes not creditable against future taxable income. As a result, the company’s provision or benefit for taxes may vary significantly period to period depending on the geographic distribution of income.
The realization of the company’s net deferred tax assets as of
December 31, 2017
is primarily dependent on forecasted future taxable income within certain foreign jurisdictions. Any reduction in estimated forecasted future taxable income may require the company to record an additional valuation allowance against the remaining deferred tax assets. Any increase or decrease in the valuation allowance would result in additional or lower income tax expense in such period and could have a significant impact on that period’s earnings.
Net income (loss) attributable to Unisys Corporation common shareholders for
2017
was a loss of
$65.3 million
, or a loss of
$1.30
per diluted common share, compared with a loss of
$47.7 million
, or
$0.95
per diluted common share, in
2016
and a loss of
$109.9 million
, or
$2.20
per diluted common share, in
2015
.
Segment results
The company has two business segments: Services and Technology. Revenue classifications within the Services and Technology segment are as follows:
|
•
|
Cloud and infrastructure services. This represents revenue from helping clients apply cloud and as-a-service delivery models to capitalize on business opportunities, make their end users more productive and manage and secure their IT infrastructure and operations more economically.
|
|
•
|
Application services. This represents revenue from helping clients transform their business processes by developing and managing new leading-edge applications for select industries, offering advanced data analytics and modernizing existing enterprise applications.
|
|
•
|
Business process outsourcing (“BPO”) services. This represents revenue from the management of critical processes and functions for clients in target industries, helping them improve performance and reduce costs.
|
|
•
|
Technology. This represents revenue from designing and developing software and offering hardware and other related products to help clients reduce costs, improve security and flexibility and improve the efficiency of their data-center environments.
|
The accounting policies of each business segment are the same as those followed by the company as a whole. Intersegment sales and transfers are priced as if the sales or transfers were to third parties. Accordingly, the Technology segment recognizes intersegment revenue and manufacturing profit on software and hardware shipments to customers under Services contracts. The Services segment, in turn, recognizes customer revenue and marketing profits on such shipments of company software and hardware to customers. The Services segment also includes the sale of software and hardware products sourced from third
21
parties that are sold to customers through the company’s Services channels. In the company’s consolidated statements of income, the manufacturing costs of products sourced from the Technology segment and sold to Services customers are reported in cost of revenue for Services.
Also included in the Technology segment’s sales and operating profit are sales of software and hardware sold to the Services segment for internal use in Services engagements. The amount of such profit included in operating income of the Technology segment for the years ended December 31,
2017
,
2016
and
2015
was
$6.3 million
,
$0.7 million
and
$9.2 million
, respectively. The profit on these transactions is eliminated in Corporate.
The company evaluates business segment performance based on operating income exclusive of pension income or expense, restructuring charges and unusual and nonrecurring items, which are included in Corporate. All other corporate and centrally incurred costs are allocated to the business segments based principally on revenue, employees, square footage or usage. See Note 15, “Segment information,” of the Notes to Consolidated Financial Statements.
Information by business segment for
2017
,
2016
and
2015
is presented below:
|
(millions)
|
Total
|
|
Corporate
|
|
Services
|
|
Technology
|
|
||||||||
|
2017
|
|
|
|
|
||||||||||||
|
Customer revenue
|
$
|
2,741.8
|
|
$
|
—
|
|
$
|
2,328.2
|
|
$
|
413.6
|
|
||||
|
Intersegment
|
—
|
|
(25.9
|
)
|
—
|
|
25.9
|
|
||||||||
|
Total revenue
|
$
|
2,741.8
|
|
$
|
(25.9
|
)
|
$
|
2,328.2
|
|
$
|
439.5
|
|
||||
|
Gross profit percent
|
17.4
|
%
|
16.8
|
%
|
59.4
|
%
|
||||||||||
|
Operating income percent
|
0.2
|
%
|
2.8
|
%
|
38.8
|
%
|
||||||||||
|
2016
|
|
|
|
|
|
|
|
|
||||||||
|
Customer revenue
|
$
|
2,820.7
|
|
$
|
—
|
|
$
|
2,406.3
|
|
$
|
414.4
|
|
||||
|
Intersegment
|
—
|
|
(22.6
|
)
|
—
|
|
22.6
|
|
||||||||
|
Total revenue
|
$
|
2,820.7
|
|
$
|
(22.6
|
)
|
$
|
2,406.3
|
|
$
|
437.0
|
|
||||
|
Gross profit percent
|
19.8
|
%
|
16.2
|
%
|
59.9
|
%
|
||||||||||
|
Operating income percent
|
1.7
|
%
|
1.9
|
%
|
37.0
|
%
|
||||||||||
|
2015
|
|
|
|
|
|
|
|
|
||||||||
|
Customer revenue
|
$
|
3,015.1
|
|
$
|
—
|
|
$
|
2,605.6
|
|
$
|
409.5
|
|
||||
|
Intersegment
|
—
|
|
(49.0
|
)
|
0.1
|
|
48.9
|
|
||||||||
|
Total revenue
|
$
|
3,015.1
|
|
$
|
(49.0
|
)
|
$
|
2,605.7
|
|
$
|
458.4
|
|
||||
|
Gross profit percent
|
17.9
|
%
|
15.8
|
%
|
55.3
|
%
|
||||||||||
|
Operating income (loss) percent
|
(1.8
|
)%
|
2.3
|
%
|
24.8
|
%
|
||||||||||
Gross profit percent and operating income percent are as a percent of total revenue.
Customer revenue by classes of similar products or services, by segment, for
2017
,
2016
and
2015
is presented below:
|
Year ended December 31 (millions)
|
2017
|
|
2016
|
|
Percentage
Change
|
|
2015
|
|
Percentage
Change
|
|
||||||||
|
Services
|
||||||||||||||||||
|
Cloud & infrastructure services
|
$
|
1,317.0
|
|
$
|
1,352.9
|
|
(2.7
|
)%
|
$
|
1,513.1
|
|
(10.6
|
)%
|
|||||
|
Application services
|
808.3
|
|
859.0
|
|
(5.9
|
)%
|
868.9
|
|
(1.1
|
)%
|
||||||||
|
BPO services
|
202.9
|
|
194.4
|
|
4.4
|
%
|
223.6
|
|
(13.1
|
)%
|
||||||||
|
2,328.2
|
|
2,406.3
|
|
(3.2
|
)%
|
2,605.6
|
|
(7.6
|
)%
|
|||||||||
|
Technology
|
413.6
|
|
414.4
|
|
(0.2
|
)%
|
409.5
|
|
1.2
|
%
|
||||||||
|
Total customer revenue
|
$
|
2,741.8
|
|
$
|
2,820.7
|
|
(2.8
|
)%
|
$
|
3,015.1
|
|
(6.4
|
)%
|
|||||
In the Services segment, customer revenue was
$2.3 billion
in
2017
,
$2.4 billion
in
2016
and
$2.6 billion
in
2015
. Foreign currency fluctuations had a negligible impact on revenue in
2017
compared with
2016
.
Revenue from cloud & infrastructure services was
$1.3 billion
in
2017
down
2.7%
compared with
2016
, and
2016
was
down
10.6%
from
2015
. Foreign currency fluctuations had a
1
-percentage-point
positive
impact on cloud & infrastructure services revenue in the current period compared with the year-ago period.
22
Application services revenue
decreased
5.9%
for
2017
compared with
2016
, and
2016
was
down
1.1%
compared with
2015
. Foreign currency fluctuations had a
1
-percentage-point
positive
impact on application services revenue in the current period compared with the year-ago period.
Business process outsourcing services revenue
increased
4.4%
in
2017
compared with
2016
, and was
down
13.1%
in
2016
compared with
2015
. Foreign currency fluctuations had a
4
-percentage-point
negative
impact on business process outsourcing services revenue in the current period compared with the year-ago period.
Services gross profit percent was
16.8%
in
2017
compared with
16.2%
in
2016
and
15.8%
in
2015
. Services operating income percent was
2.8%
in
2017
compared with
1.9%
in
2016
and
2.3%
in
2015
.
In the Technology segment, customer revenue
decreased
0.2%
to
$413.6 million
in
2017
compared with
$414.4 million
in
2016
. Revenue in
2016
increased
1.2%
compared with
2015
. Foreign currency translation had a
1
-percentage-point
positive
impact on Technology revenue in
2017
compared with
2016
.
Technology gross profit was
59.4%
in
2017
compared with
59.9%
in
2016
and
55.3%
in
2015
. Technology operating income percent was
38.8%
in
2017
compared with
37.0%
in
2016
and
24.8%
in
2015
.
New accounting pronouncements
Accounting Pronouncements Adopted
Effective January 1, 2017, the company adopted Accounting Standards Update (“ASU”) No. 2017-04
Intangibles - Goodwill and Other (Topic 350): Simplifying the Test for Goodwill Impairment
issued by the Financial Accounting Standards Board (“FASB”) which simplifies how an entity is required to test goodwill for impairment by eliminating Step 2 from the goodwill impairment test. Step 2 measures a goodwill impairment loss by comparing the implied fair value of a reporting unit’s goodwill with the carrying amount of that goodwill. Under the amended guidance, an entity will perform its annual or interim goodwill impairment test by comparing the fair value of a reporting unit with its carrying amount. An impairment charge will be recognized for the amount by which the carrying amount exceeds the reporting unit’s fair value. Adoption of this new guidance had no impact on the company’s consolidated results of operations and financial position.
Effective January 1, 2017, the company adopted ASU No. 2016-18
Statement of Cash Flows (Topic 230) - Restricted Cash
issued by the FASB which requires companies to include amounts generally described as restricted cash or restricted cash equivalents with cash and cash equivalents when reconciling the beginning-of-period and end-of-period total amounts shown on the statement of cash flows. The new guidance has been applied on retrospective basis whereby prior-period financial statements have been adjusted to reflect the application of the new guidance, as required by the FASB. Amounts reclassified in the consolidated statements of cash flows for the years ended December 31, 2016 and 2015 are as follows:
|
Year ended December 31,
|
2016
|
|
2015
|
|
||||
|
Cash flows from operating activities
|
||||||||
|
Other assets
|
$
|
(1.9
|
)
|
2.60
|
|
$
|
2.6
|
|
|
Cash flows from investing activities
|
||||||||
|
Other
|
1.6
|
|
(2.3
|
)
|
||||
|
Effect of exchange rate changes on cash, cash equivalents and restricted cash
|
(0.8
|
)
|
(4.6
|
)
|
||||
|
Cash, cash equivalents and restricted cash, beginning of year
|
31.6
|
|
35.9
|
|
||||
|
Cash, cash equivalents and restricted cash, end of year
|
30.5
|
|
31.6
|
|
||||
Effective January 1, 2017, the company adopted ASU No. 2016-16
Income Taxes (Topic 740): Intra-Entity Transfers of Assets Other Than Inventory
issued by the FASB which allows the recognition of deferred income taxes for an intra-entity asset transfer, other than inventory, when the transfer occurs. Historically, recognition of the income tax consequence was not recognized until the asset was sold to an outside party. The new guidance has been applied on a modified retrospective basis through a cumulative-effect adjustment directly to accumulated deficit. At January 1, 2017, the adjustment to accumulated deficit was an increase of
$4.4 million
.
Effective January 1, 2017, the company adopted ASU No. 2016-15
Statement of Cash Flows (Topic 230): Classification of Certain Cash Receipts and Cash Payments (a consensus of the Emerging Issues Task Force)
, issued by the FASB which clarifies the treatment of several cash flow categories. In addition, the guidance also clarifies that when cash receipts and cash payments have aspects of more than one class of cash flows and cannot be separated, classification will depend on the predominant source or use. The company previously reported premium payments on and proceeds from the settlement of corporate-owned life insurance policies as cash flows from operating activities in the company’s consolidated statement of cash flows. Under the new guidance, these amounts were reclassified to investing activities. The new guidance has been applied on a retrospective basis whereby prior-period financial statements have been adjusted to reflect the application of the new guidance,
23
as required by the FASB. For the years ended December 31, 2016 and 2015,
$1.5 million
and
$1.1 million
, respectively, were reclassified from “other assets” in operating activities to “other” in investing activities in the company’s consolidated statements of cash flows.
Effective January 1, 2017, the company adopted ASU No. 2016-09
Compensation—Stock Compensation (Topic 718): Improvements to Employee Share-Based Payment Accounting
, issued by the FASB, which changes certain aspects of accounting for share-based payments to employees. The new guidance requires all income tax effects of awards to be recognized in the income statement when the awards vest or are settled. It also allows an employer to repurchase more of an employee’s shares than it can today for tax withholding purposes without triggering liability accounting and to make a policy election to account for forfeitures as they occur. Additionally, the standard requires all tax-related cash flows resulting from share-based payments to be reported as operating activities on the consolidated statement of cash flows, and any cash payments made to taxing authorities on an employee’s behalf as financing activities, which the company previously reported as operating activities. The new guidance has been applied on a retrospective basis whereby prior-period financial statements have been adjusted to reflect the application of the new guidance, as required by the FASB. For the years ended December 31, 2016 and 2015,
$0.4 million
and
$0.8 million
, respectively, were reclassified from “accounts payable and other accrued liabilities” in operating activities to “other” in financing activities in the company’s consolidated statements of cash flows.
Accounting Pronouncements Not Yet Adopted
In March 2017, the FASB issued ASU No. 2017-07
Compensation—Retirement Benefits (Topic 715): Improving the Presentation of Net Periodic Pension Cost and Net Periodic Postretirement Benefit Cost
, which requires employers to present the service cost component of net periodic benefit cost in the same income statement line item(s) as other employee compensation costs arising from services rendered during the period. Only the service cost component will be eligible for capitalization in assets. The other components of net periodic benefit cost will be presented separately from the line items that include service cost and outside the subtotal of operating income. This update is effective for annual periods beginning after December 15, 2017, which for the company is January 1, 2018. Adoption of this new guidance will result in the reclassification of net periodic benefit cost, other than service costs (
$92.5 million
and
$81.6 million
for the years ended December 31, 2017 and 2016, respectively), from operating income to non-operating income. There will be no overall impact on the company’s consolidated financial position.
In June 2016, the FASB issued ASU No. 2016-13
Financial Instruments—Credit Losses (Topic 326): Measurement of Credit Losses on Financial Instruments
, which introduces a new model for recognizing credit losses on financial instruments based on an estimate of current expected losses. This includes trade and other receivables, loans and other financial instruments. This update is effective for annual periods beginning after December 15, 2019, with earlier adoption permitted. The company is currently assessing when it will choose to adopt, and is currently evaluating the impact of the adoption on its consolidated financial statements.
In February 2016, the FASB issued ASU No. 2016-02
Leases (Topic 842)
, which is intended to improve financial reporting about leasing transactions. The ASU requires organizations that lease assets, referred to as lessees, to recognize on the balance sheet the assets and liabilities for the rights and obligations created by those leases. The standard requires disclosures to help investors and other financial statement users better understand the amount, timing and uncertainty of cash flows arising from leases. The standard is effective for annual reporting periods beginning after December 15, 2018, with earlier adoption permitted. The company will adopt the new guidance on January 1, 2019, and is currently evaluating the impact of the adoption on its consolidated results of operations and financial position.
In May 2014, the FASB issued ASU No. 2014-09
Revenue from Contracts with Customers (Topic 606)
, which establishes principles that an entity shall apply to report useful information to users of financial statements about the nature, amount, timing and uncertainty of revenue and cash flows from a contract with a customer. The standard, and its various amendments, is effective for annual reporting periods beginning after December 15, 2017, which for the company is January 1, 2018. The standard allows for either “full retrospective” adoption, meaning the standard is applied to all periods presented, or “modified retrospective” adoption, meaning the standard is applied only to the most current period presented in the financial statements. The new standard would require the company to recognize revenue for certain transactions, including extended payment term software licenses and short-term software licenses, sooner than the current rules would allow and require the company to recognize software license extensions and renewals, later than the current rules would allow. The standard also requires significantly expanded disclosure requirements. The company will adopt the standard on January 1, 2018 using the modified retrospective method.
The net impact to the company’s consolidated financial position upon adoption is expected to be an immaterial increase to accumulated deficit which will be recognized as a cumulative effect adjustment to the 2018 opening balance. The prospective impact to the company’s consolidated results of operations resulting from this cumulative effect adjustment is expected to be a net increase to 2018 consolidated revenue and results of operations, with most of that difference occurring in the first quarter of 2018 when the majority of the contractual terms of software license extensions and renewals, executed principally late in 2017, commence. The company’s results of operations for 2017 and for 2018 will not be fully comparable to each other and the
24
company will present supplemental disclosures about the actual effects of the new standard on 2018 results of operations to facilitate comparison to 2017 results of operations.
Financial condition
The company’s principal sources of liquidity are cash on hand, cash from operations and its revolving credit facility, discussed below. The company and certain international subsidiaries have access to uncommitted lines of credit from various banks. The company believes that it will have adequate sources of liquidity to meet its expected
2018
cash requirements.
Cash and cash equivalents at December 31,
2017
were
$733.9 million
compared with
$370.6 million
at December 31,
2016
. The increase was primarily due to the net proceeds received from the sale of $440.0 million of 10.75% senior secured notes due 2022 and was partially offset by the redemption of $95.0 million of remaining outstanding 6.25% senior notes due 2017. See Note 9, “Debt,” of the Notes to Consolidated Financial Statements.
As of December 31,
2017
,
$364.7 million
of cash and cash equivalents were held by the company’s foreign subsidiaries and branches operating outside of the U.S. In the future, if these funds are needed for the company’s operations in the U.S., it is expected the company would be required to pay taxes on only a limited portion of this balance. See Note 7, “Income taxes,” of the Notes to Consolidated Financial Statements regarding the company’s intention to indefinitely reinvest earnings of foreign subsidiaries.
During
2017
, cash provided by operations was
$166.4 million
compared with
$218.2 million
in
2016
. The fluctuation in cash flows from operating activities is principally attributed to lower operating income partially offset by an improvement in working capital management.
Cash used for investing activities in
2017
was
$152.5 million
compared with cash usage of
$182.1 million
in
2016
. Net proceeds from investments in
2017
were
$24.8 million
compared with net purchases of
$34.1 million
in
2016
. Proceeds from investments and purchases of investments represent derivative financial instruments used to manage the company’s currency exposure to market risks from changes in foreign currency exchange rates. In addition, capital additions of properties were
$25.8 million
in
2017
compared with
$32.5 million
in
2016
, capital additions of outsourcing assets were
$86.3 million
in
2017
compared with
$51.3 million
in
2016
and the investment in marketable software was
$64.4 million
in
2017
compared with
$63.3 million
in
2016
. The increase in capital additions of outsourcing assets is attributed to assets acquired by the company for its U.K. business process outsourcing joint venture.
Cash provided by financing activities during
2017
was
$329.9 million
compared with cash used for financing activities of
$17.1 million
in
2016
. In the current year, the company issued $440.0 million of senior notes and received net proceeds of $427.9 million and retired the remaining aggregate principal amount of $95.0 million of its 6.25% senior notes. During 2016, the company issued $213.5 million of convertible senior notes and received net proceeds of $178.9 million, net of capped call fees of $27.3 million. The company also retired $115.0 million of its 6.25% senior notes and paid down the outstanding balance of $65.8 million of its revolving credit facility.
At December 31,
2017
, total debt was
$644.7 million
compared with
$300.0 million
at December 31,
2016
. The increase was principally caused by the issuance of the notes referred to above, partially offset by the retirement of the remaining 6.25% senior notes due 2017.
The company has a secured revolving credit facility (the “Credit Agreement”) that provides for loans and letters of credit up to an aggregate amount of
$125.0 million
(with a limit on letters of credit of $30.0 million). The Credit Agreement includes an accordion feature allowing for an increase in the amount of the facility up to
$150.0 million
. Availability under the credit facility is subject to a borrowing base calculated by reference to the company’s receivables. At December 31,
2017
, the company had
no
borrowings and
$4.7 million
of letters of credit outstanding, and availability under the facility was
$110.5 million
net of letters of credit issued. The Credit Agreement expires October 5, 2022, subject to a springing maturity (i) on the date that is
91
days prior to the maturity date of the company’s convertible notes due 2021 unless, on such date, certain conditions are met; or (ii) on the date that is
60
days prior to the maturity date of the company’s secured notes due 2022 unless, by such date, such secured notes have not been redeemed or refinanced.
The credit facility is guaranteed by Unisys Holding Corporation, Unisys NPL, Inc., Unisys AP Investment Company I and any future material domestic subsidiaries. The facility is secured by the assets of the company and the subsidiary guarantors, other than certain excluded assets, under a security agreement entered into by the company and the subsidiary guarantors in favor of JPMorgan Chase Bank, N.A., as agent for the lenders under the credit facility.
The company is required to maintain a minimum fixed charge coverage ratio if the availability under the credit facility falls below the greater of
10%
of the lenders’ commitments under the facility and
$15 million
.
The Credit Agreement contains customary representations and warranties, including that there has been no material adverse change in the company’s business, properties, operations or financial condition. The Credit Agreement includes limitations on the ability of the company and its subsidiaries to, among other things, incur other debt or liens, dispose of assets and make
25
acquisitions, loans and investments, repurchase its equity, and prepay other debt. Events of default include non-payment, failure to comply with covenants, materially incorrect representations and warranties, change of control and default under other debt aggregating at least
$50.0 million
.
At December 31,
2017
, the company has met all covenants and conditions under its various lending and funding agreements. The company expects to continue to meet these covenants and conditions.
At December 31,
2017
, the company had outstanding standby letters of credit and surety bonds totaling approximately
$318 million
related to performance and payment guarantees. On the basis of experience with these arrangements, the company believes that any obligations that may arise will not be material.
As described more fully in Notes 3, “Cost reduction actions,” 9, “Debt,” and 11, “Rental expense and commitments,” of the Notes to Consolidated Financial Statements, at December 31,
2017
, the company had certain cash obligations, which are due as follows:
|
(millions)
|
Total
|
|
Less than
1 year
|
|
1-3 years
|
|
4-5 years
|
|
After 5 years
|
|
||||||||||
|
Long-term debt (including current portion)
|
$
|
644.7
|
|
$
|
10.8
|
|
$
|
3.7
|
|
$
|
621.8
|
|
$
|
8.4
|
|
|||||
|
Interest payments on debt
|
260.3
|
|
60.2
|
|
120.2
|
|
78.4
|
|
1.5
|
|
||||||||||
|
Operating leases
|
198.7
|
|
47.4
|
|
74.2
|
|
37.7
|
|
39.4
|
|
||||||||||
|
Work-force reductions
|
113.5
|
|
85.9
|
|
27.6
|
|
—
|
|
—
|
|
||||||||||
|
Total
|
$
|
1,217.2
|
|
$
|
204.3
|
|
$
|
225.7
|
|
$
|
737.9
|
|
$
|
49.3
|
|
|||||
In connection with the company’s aforementioned cost reduction actions, the company currently estimates cash expenditures for this program to be approximately
$320 million
through 2019, approximately
$70 million
,
$74 million
and
$59 million
of which were made in
2017
,
2016
and
2015
, respectively. The company generated annualized net cost savings (principally related to workforce reductions) of approximately
$270 million
exiting 2017.
As described in Note 16, “Employee plans,” of the Notes to Consolidated Financial Statements, in
2018
, the company expects to make cash contributions to its worldwide defined benefit pension plans of approximately
$149.7 million
, which is comprised of
$63.4 million
primarily for international defined benefit pension plans and
$86.3 million
for the company’s U.S. qualified defined benefit pension plans.
The company maintains a shelf registration statement with the Securities and Exchange Commission that covers the offer and sale of up to
$700.0 million
of debt or equity securities. Subject to the company’s ongoing compliance with securities laws, the company may offer and sell debt and equity securities from time to time under the shelf registration statement.
In addition, from time to time the company has explored, and expects to continue to explore, a variety of debt and equity sources to fund its liquidity and capital needs.
The company may, from time to time, redeem, tender for, or repurchase its securities in the open market or in privately negotiated transactions depending upon availability, market conditions and other factors.
Critical accounting policies and estimates
The preparation of financial statements in conformity with U.S. generally accepted accounting principles requires management to make estimates, judgments and assumptions that affect the amounts reported in the financial statements and accompanying notes. Certain accounting policies, methods and estimates are particularly important because of their significance to the financial statements and because of the possibility that future events affecting them may differ from management’s current judgments. The company bases its estimates and judgments on historical experience and on other assumptions that it believes are reasonable under the circumstances; however, to the extent there are material differences between these estimates, judgments and assumptions and actual results, the financial statements will be affected. Although there are a number of accounting policies, methods and estimates affecting the company’s financial statements as described in Note 1, “Summary of significant accounting policies,” of the Notes to Consolidated Financial Statements, the following critical accounting policies reflect the significant estimates, judgments and assumptions. The development and selection of these critical accounting policies have been determined by management of the company and the related disclosures have been reviewed with the Audit and Finance Committee of the Board of Directors.
Revenue recognition
Many of the company’s sales agreements contain standard business terms and conditions; however, some agreements contain multiple elements or non-standard terms and conditions. As discussed in Note 1, “Summary of significant accounting policies,” of the Notes to Consolidated Financial Statements, the company enters into multiple-element arrangements, which may include any combination of hardware, software or services. As a result, significant contract interpretation is sometimes required to determine the appropriate accounting, including whether the deliverables specified in a multiple-element arrangement should
26
be treated as separate units of accounting for revenue recognition purposes, and, if so, how the price should be allocated among the elements and when to recognize revenue for each element. The company recognizes revenue on delivered elements only if: (a) any undelivered services or products are not essential to the functionality of the delivered services or products, (b) the company has an enforceable claim to receive the amount due in the event it does not deliver the undelivered services or products, (c) there is evidence of the selling price for each undelivered service or product, and (d) the revenue recognition criteria otherwise have been met for the delivered elements. Otherwise, revenue on delivered elements is recognized as the undelivered elements are delivered. For arrangements with multiple elements involving the licensing or sale of software and software-related elements, the allocation of revenue is based on vendor-specific objective evidence (“VSOE”), which is based upon normal pricing and discounting practices for those services and products when sold separately. The company’s continued ability to determine VSOE of fair value will depend on continued sufficient volumes and sufficient consistent pricing of stand-alone sales of such undelivered elements. In addition, the company’s revenue recognition policy states that revenue is not recognized until collectability is deemed probable. Changes in judgments on these assumptions and estimates could materially impact the timing of revenue recognition.
For long-term fixed price systems integration contracts, the company recognizes revenue and profit as the contracts progress using the percentage-of-completion method of accounting, which relies on estimates of total expected contract revenues and costs. The company follows this method because reasonably dependable estimates of the revenue and costs applicable to various elements of a contract can be made. The financial reporting of these contracts depends on estimates, which are assessed continually during the term of the contracts and therefore, recognized revenues and profit are subject to revisions as the contract progresses to completion. Revisions in profit estimates are reflected in the period in which the facts that give rise to the revision become known. Accordingly, favorable changes in estimates result in additional revenue and profit recognition, and unfavorable changes in estimates result in a reduction of recognized revenue and profit. When estimates indicate that a loss will be incurred on a contract upon completion, a provision for the expected loss is recorded in the period in which the loss becomes evident. As work progresses under a loss contract, revenue continues to be recognized, and a portion of the contract costs incurred in each period is charged to the contract loss reserve. For other systems integration projects, the company recognizes revenue when the services have been performed.
In addition to outright sales, the company sells hardware under bundled lease arrangements which typically include hardware, services and a financing component. Recognizing revenue under these arrangements requires the company to allocate the total consideration received to the lease and non-lease deliverables included in the bundled arrangement, based upon the estimated fair values of each element.
Outsourcing
Typically, the initial terms of the company’s outsourcing contracts are between 3 and 5 years. Revenue under these contracts is recognized when the company performs the services or processes transactions in accordance with contractual performance standards. Customer prepayments (even if nonrefundable) are deferred (classified as a liability) and recognized systematically as revenue over the initial contract term.
Costs on outsourcing contracts are charged to expense as incurred. However, direct costs incurred related to the inception of an outsourcing contract (principally initial customer setup) are deferred and charged to expense over the initial contract term. In addition, the costs of equipment and software, some of which are internally developed, are capitalized and depreciated over the shorter of their life or the initial contract term.
Recoverability of outsourcing assets is subject to various business risks. Quarterly, the company compares the carrying value of the outsourcing assets with the undiscounted future cash flows expected to be generated by the outsourcing assets to determine if the assets are impaired. If impaired, the outsourcing assets are reduced to an estimated fair value on a discounted cash flow approach. The company prepares its cash flow estimates based on assumptions that it believes to be reasonable but are also inherently uncertain. Actual future cash flows could differ from these estimates.
Income Taxes
Accounting rules governing income taxes require that deferred tax assets and liabilities be recognized using enacted tax rates for the effect of temporary differences between the book and tax bases of recorded assets and liabilities. These rules also require that deferred tax assets be reduced by a valuation allowance if it is more likely than not that some portion or the entire deferred tax asset will not be realized.
At December 31,
2017
and
2016
, the company had deferred tax assets in excess of deferred tax liabilities of
$1,551.8 million
and
$2,224.5 million
, respectively. For the reasons cited below, at December 31,
2017
and
2016
, management determined that it is more likely than not that
$110.7 million
and
$139.9 million
, respectively, of such assets will be realized, resulting in a valuation allowance of
$1,441.1 million
and
$2,084.6 million
, respectively.
The company evaluates the realizability of its deferred tax assets by assessing its valuation allowance and by adjusting the amount of such allowance, if necessary. The factors used to assess the likelihood of realization are the company’s historical profitability, forecast of future taxable income and available tax-planning strategies that could be implemented to realize the net
27
deferred tax assets. The company uses tax-planning strategies to realize or renew net deferred tax assets to avoid the potential loss of future tax benefits. Failure to achieve forecasted taxable income might affect the ultimate realization of the net deferred tax assets. Factors that may affect the company’s ability to achieve sufficient forecasted taxable income include, but are not limited to, the following: increased competition, a decline in sales or margins, loss of market share, delays in product availability or technological obsolescence. See “Item 1A. Risk Factors.”
Internal Revenue Code Sections 382 and 383 provide annual limitations with respect to the ability of a corporation to utilize its net operating loss (as well as certain built-in losses) and tax credit carryforwards, respectively (“Tax Attributes”), against future U.S. taxable income, if the corporation experiences an “ownership change.” In general terms, an ownership change may result from transactions increasing the ownership of certain stockholders in the stock of a corporation by more than 50 percentage points over a three-year period. The company regularly monitors ownership changes (as calculated for purposes of Section 382). The company has determined that, for purposes of the rules of Section 382 described above, an ownership change occurred in February 2011. Any future transaction or transactions and the timing of such transaction or transactions could trigger additional ownership changes under Section 382.
As a result of the February 2011 ownership change, utilization for certain of the company’s Tax Attributes, U.S. net operating losses and tax credits, is subject to an overall annual limitation of
$70.6 million
. The cumulative limitation as of December 31,
2017
is approximately
$416.0 million
. This limitation will be applied first to any recognized built in losses, then to any net operating losses, and then to any other Tax Attributes. Any unused limitation may be carried over to later years. Based on presently available information and the existence of tax planning strategies, the company does not expect to incur a U.S. cash tax liability in the near term. The company maintains a full valuation allowance against the realization of all U.S. deferred tax assets as well as certain foreign deferred tax assets in excess of deferred tax liabilities. See Note 7, “Income taxes,” of the Notes to Consolidated Financial Statements.
The company’s provision for income taxes and the determination of the resulting deferred tax assets and liabilities involve a significant amount of management judgment and are based on the best information available at the time. The company operates within federal, state and international taxing jurisdictions and is subject to audit in these jurisdictions. These audits can involve complex issues, which may require an extended period of time to resolve. As a result, the actual income tax liabilities in the jurisdictions with respect to any fiscal year are ultimately determined long after the financial statements have been published.
Accounting rules governing income taxes also prescribe a recognition threshold and measurement attribute for the financial statement recognition and measurement of a tax position taken or expected to be taken in a tax return. The company maintains reserves for estimated tax exposures including penalties and interest. Income tax exposures include potential challenges of intercompany pricing and other tax matters. Exposures are settled primarily through the settlement of audits within these tax jurisdictions, but can also be affected by changes in applicable tax law or other factors, which could cause management of the company to believe a revision of past estimates is appropriate. Management believes that an appropriate liability has been established for estimated exposures; however, actual results may differ materially from these estimates. The liabilities are reviewed quarterly for their adequacy and appropriateness. See Note 7, “Income taxes,” of the Notes to Consolidated Financial Statements.
Pensions
Accounting rules governing defined benefit pension plans require that amounts recognized in financial statements be determined on an actuarial basis. The measurement of the company’s pension obligations, costs and liabilities is dependent on a variety of assumptions selected by the company and used by the company’s actuaries. These assumptions include estimates of the present value of projected future pension payments to plan participants, taking into consideration the likelihood of potential future events such as salary increases and demographic experience. The assumptions used in developing the required estimates include the following key factors: discount rates, salary growth, retirement rates, inflation, expected return on plan assets and mortality rates.
As permitted for purposes of computing pension expense, the company uses a calculated value of plan assets (which is further described below). This allows the effects of the performance of the pension plan’s assets on the company’s computation of pension income or expense to be amortized over future periods. A substantial portion of the company’s pension plan assets relates to its qualified defined benefit plan in the United States.
A significant element in determining the company’s pension income or expense is the expected long-term rate of return on plan assets. The company sets the expected long-term rate of return based on the expected long-term return of the various asset categories in which it invests. The company considers the current expectations for future returns and the actual historical returns of each asset class. Also, because the company’s investment policy is to actively manage certain asset classes where the potential exists to outperform the broader market, the expected returns for those asset classes are adjusted to reflect the expected additional returns. For
2018
, the company has assumed that the expected long-term rate of return on U.S. plan assets will be
6.80%
, and on the company’s non-U.S. plan assets will be
4.38%
. A change of
25
basis points in the expected long-term rate of return for the company’s U.S. and non-U.S. pension plans causes a change of approximately $
8 million
and
$7 million
,
28
respectively, in pension expense. The assumed long-term rate of return on assets is applied to a calculated value of plan assets, which recognizes changes in the fair value of plan assets in a systematic manner over four years. This produces the expected return on plan assets that is included in pension income or expense. The difference between this expected return and the actual return on plan assets is deferred. The net deferral of past asset gains or losses affects the calculated value of plan assets and, ultimately, future pension income or expense. At December 31,
2017
, for the company’s U.S. qualified defined benefit pension plan, the calculated value of plan assets was
$3.52 billion
and the fair value was
$3.58 billion
.
At the end of each year, the company determines the discount rate to be used to calculate the present value of plan liabilities. The discount rate is an estimate of the current interest rate at which the pension liabilities could be effectively settled at the end of the year. In estimating this rate, the company looks to rates of return on high-quality, fixed-income investments that (a) receive one of the two highest ratings given by a recognized ratings agency and (b) are currently available and expected to be available during the period to maturity of the pension benefits. At December 31,
2017
, the company determined this rate to be
3.87%
for its U.S. defined benefit pension plans, a
decrease
of
51
basis points from the rate used at December 31,
2016
, and
2.24%
for the company’s non-U.S. defined benefit pension plans, a
decrease
of
10
basis points from the rate used at December 31,
2016
. A change of
25
basis points in the U.S. and non-U.S. discount rates causes a change in pension expense of approximately
$2 million
and
$300 thousand
, respectively, and a change of approximately
$123 million
and
$130 million
, respectively, in the benefit obligation. These estimates are intended to be illustrative based on a single 25 basis point change. The sensitivity to rate changes is not linear and additional changes in rates may result in a different impact on the pension liability. The net effect of changes in the discount rate, as well as the net effect of other changes in actuarial assumptions and experience, has been deferred, as permitted.
Funding requirements for its U.S. qualified pension plan are calculated by the plan’s actuaries based on certain assumptions including, as permitted under the Bi-partisan Budget Act of 2015, a discount rate constrained to be within 10% of the 25-year average of the relevant rates. The effect of this limitation is that the funding discount rate is higher than the GAAP discount rate applied for balance sheet purposes, and the liability is therefore lower. In addition, this constraint mitigates the effect of changes in market interest rates on the funding discount rate and the funding liability. Changes to the benefit obligation caused by a 25 basis point change noted above are related to the balance sheet obligation and are not necessarily indicative of the impact on the funding liability.
Gains and losses are defined as changes in the amount of either the projected benefit obligation or plan assets resulting from experience different from that assumed and from changes in assumptions. Because gains and losses may reflect refinements in estimates as well as real changes in economic values and because some gains in one period may be offset by losses in another and vice versa, the accounting rules do not require recognition of gains and losses as components of net pension cost of the period in which they arise.
At a minimum, amortization of an unrecognized net gain or loss must be included as a component of net pension cost for a year if, as of the beginning of the year, that unrecognized net gain or loss exceeds 10 percent of the greater of the projected benefit obligation or the calculated value of plan assets. If amortization is required, the minimum amortization is that excess above the 10 percent divided by the average remaining life expectancy of the plan participants. For the company’s U.S. qualified defined benefit pension plan and the company’s non-U.S. pension plans, that period is approximately
17
and
25
years, respectively. At December 31,
2017
, the estimated unrecognized loss for the company’s U.S. qualified defined benefit pension plan and the company’s non-U.S. pension plans was
$2.60 billion
and
$0.98 billion
, respectively.
For the year ended December 31,
2017
, the company recognized consolidated pension expense of
$92.4 million
, compared with
$82.7 million
for the year ended December 31,
2016
. For
2018
, the company expects to recognize pension expense of approximately
$72.8 million
. See Note 16, “Employee plans,” of the Notes to Consolidated Financial Statements.
Goodwill
Accounting rules governing goodwill require a company test goodwill for impairment at least annually, as well as whenever there are events or changes in circumstances (triggering events) which suggest that the carrying amount may not be recoverable.
When determining the fair value of a reporting unit, as appropriate for the individual reporting unit, the company uses both an income and market approach. The methodology used to determine the fair values using the income and market approaches, as described below, are weighted to determine the fair value for each reporting unit.
The income approach is a forward-looking approach to estimating fair value and relies primarily on internal forecasts. Within the income approach, the method used is the discounted cash flow method. The company starts with a forecast of all expected net cash flows associated with the reporting unit, which includes the application of a terminal value, and then a reporting unit-specific discount rate is applied to arrive at a net present value amount. Some of the more significant estimates and assumptions inherent in this approach include the amount and timing of projected net cash flows, long term growth rate and the discount rate. Cash flow projections are based on management’s estimates of economic and market conditions, which drive key
29
assumptions of revenue growth rates, operating margins, capital expenditures and working capital requirements. The discount rate in turn is based on various market factors and specific risk characteristics of each reporting unit.
The market approach relies primarily on external information for estimating the fair value. Some of the more significant estimates and assumptions inherent in this approach include the selection of appropriate guideline companies and the selected performance metric used in this approach.
Estimating the fair value of reporting units requires the use of estimates and significant judgments about key assumptions. There are a number of factors including potential events and changes in circumstances that could change in future periods, including: projected operating results; valuation multiples exhibited by the company and by companies considered comparable to the reporting units; and other macro-economic factors that could impact the discount rate. It is reasonably possible that the judgments and estimates described above could change in future periods.
Goodwill by reporting unit at December 31,
2017
, was as follows (dollars in millions):
|
Reporting unit
|
Carrying Value
|
||
|
Cloud and infrastructure
|
$
|
33.9
|
|
|
Application services
|
27.4
|
|
|
|
Business process outsourcing
|
10.8
|
|
|
|
Technology
|
108.7
|
|
|
|
Total
|
$
|
180.8
|
|
As a result of the impairment review, the company concluded that none of its goodwill was impaired as of December 31,
2017
, and does not believe that any of its reporting units are at risk of failing the impairment test since all reporting unit fair values were substantially in excess of carrying value as of the last impairment test.
30
Interest rate risk
The company has exposure to interest rate risk from its short-term and long-term debt. In general, the company’s long-term debt is fixed rate and, to the extent it has any, its short-term debt is variable rate. See Note 9, “Debt,” of the Notes to Consolidated Financial Statements for components of the company’s long-term debt. The company believes that the market risk assuming a hypothetical 10% increase in interest rates would not be material to the fair value of these financial instruments, or the related cash flows, or future results of operations.
Market risk
As of December 31,
2017
, the company had outstanding
$429.6 million
of senior secured notes due 2022 and
$186.3 million
of convertible senior notes due 2021. The interest rates on these notes are fixed and therefore do not expose the company to risk related to rising interest rates. As of December 31,
2017
, the fair value of the convertible senior notes was
$237.9 million
. In connection with the offering of the convertible senior notes, the company paid $27.3 million to purchase a capped call covering approximately 21.9 million shares of the company’s common stock. If the price per share of the company’s common stock is below $9.76, these capped call transactions would provide no benefit from potential dilution. If the price per share of the company’s common stock is above $12.75, then to the extent of the excess, these capped call transactions would result in no additional benefit for potential dilution at conversion.
Foreign currency exchange rate risk
The company is also exposed to foreign currency exchange rate risks. The company is a net receiver of currencies other than the U.S. dollar and, as such, can benefit from a weaker dollar, and can be adversely affected by a stronger dollar relative to currencies worldwide. Accordingly, changes in exchange rates, and in particular a strengthening of the U.S. dollar, may adversely affect consolidated revenue and operating margins as expressed in U.S. dollars. Currency exposure gains and losses are mitigated by purchasing components and incurring expenses in local currencies.
In addition, the company uses derivative financial instruments, primarily foreign exchange forward contracts, to reduce its exposure to market risks from changes in foreign currency exchange rates on intercompany balances. See Note 12, “Financial instruments and concentration of credit risks,” of the Notes to Consolidated Financial Statements for additional information on the company’s derivative financial instruments.
The company has performed a sensitivity analysis assuming a hypothetical 10% adverse movement in foreign currency exchange rates applied to these derivative financial instruments described above. As of December 31,
2017
and
2016
, the analysis indicated that such market movements would have reduced the estimated fair value of these derivative financial instruments by approximately
$39 million
and
$36 million
, respectively. Based on changes in the timing and amount of interest rate and foreign currency exchange rate movements and the company’s actual exposures and hedges, actual gains and losses in the future may differ from the above analysis.
31
|
Index
|
Page Number
|
|
|
Report of Management
|
||
|
Report of Independent Registered Public Accounting Firm
|
||
|
Consolidated Statements of Income
|
||
|
Consolidated Statements of Comprehensive Income
|
||
|
Consolidated Balance Sheets
|
||
|
Consolidated Statements of Cash Flows
|
||
|
Consolidated Statements of Deficit
|
||
|
Notes to Consolidated Financial Statements
|
||
32
Report of Management
Management’s Report on the Financial Statements
The management of the company is responsible for the integrity of its financial statements. These statements have been prepared in conformity with U.S. generally accepted accounting principles and include amounts based on the best estimates and judgments of management. Financial information included elsewhere in this report is consistent with that in the financial statements.
KPMG LLP, an independent registered public accounting firm, has audited the company’s financial statements. Its accompanying report is based on an audit conducted in accordance with the standards of the Public Company Accounting Oversight Board (United States).
The Board of Directors, through its Audit and Finance Committee, which is composed entirely of independent directors, oversees management’s responsibilities in the preparation of the financial statements and selects the independent registered public accounting firm, subject to stockholder ratification. The Audit and Finance Committee meets regularly with the independent registered public accounting firm, representatives of management, and the internal auditors to review the activities of each and to assure that each is properly discharging its responsibilities. To ensure complete independence, the internal auditors and representatives of KPMG LLP have full access to meet with the Audit and Finance Committee, with or without management representatives present, to discuss the results of their audits and their observations on the adequacy of internal controls and the quality of financial reporting.
Management’s Report on Internal Control Over Financial Reporting
The management of the company is responsible for establishing and maintaining adequate internal control over financial reporting, as defined in Rules 13a-15(f) and 15d-15(f) under the Exchange Act. The company’s internal control over financial reporting is a process designed to provide reasonable assurance regarding the reliability of financial reporting and the preparation of financial statements for external purposes in accordance with U.S. generally accepted accounting principles. Internal control over financial reporting includes those policies and procedures that (1) pertain to the maintenance of records that in reasonable detail accurately and fairly reflect the transactions and dispositions of the assets of the company; (2) provide reasonable assurance that transactions are recorded as necessary to permit preparation of the financial statements in accordance with U.S. generally accepted accounting principles, and that receipts and expenditures of the company are being made only in accordance with authorizations of management and directors of company; and (3) provide reasonable assurance regarding prevention or timely detection of unauthorized acquisition, use or disposition of the company’s assets that could have a material effect on the financial statements.
Because of its inherent limitations, internal control over financial reporting may not prevent or detect misstatements. Also, projections of any evaluation of effectiveness to future periods are subject to the risk that controls may become inadequate because of changes in conditions, or that the degree of compliance with the policies and procedures may deteriorate.
A material weakness is a deficiency, or combination of deficiencies, in internal control over financial reporting, such that there is a reasonable possibility that a material misstatement of the company’s annual or interim financial statements will not be prevented or detected on a timely basis.
Management assessed the effectiveness of the company’s internal control over financial reporting as of
December 31, 2017
, based on criteria established in
Internal Control - Integrated Framework (2013)
issued by the Committee of Sponsoring Organizations of the Treadway Commission. Based on our assessment and those criteria, we identified the following deficiencies in our internal control described below.
Our risk assessment procedures over Technology revenue did not adequately identify risks and consider changes in business operations and the demands on personnel created by the efforts required to adopt the new revenue accounting pronouncement that will impact future financial reporting. As a result, the company had missing process level controls and insufficient trained personnel to operate process level controls over the measurement and recognition of multiple-element arrangements within Technology revenue.
Although no material misstatements were identified in our consolidated financial statements, these control deficiencies resulted in immaterial misstatements in the preliminary consolidated financial statements as of and for the year ended
December 31, 2017
related to Technology revenue and deferred revenue that were corrected. However, the control deficiencies create a reasonable possibility that a material misstatement in the company’s consolidated financial statements will not be prevented or detected on a timely basis and we concluded that our internal control over financial reporting as of
December 31, 2017
was not effective due to a material weakness in internal control.
33
KPMG LLP, an independent registered public accounting firm, has audited the company’s financial statements in this Annual Report on Form 10-K and, as part of its audit, has issued an adverse opinion on the effectiveness of the company’s internal control over financial reporting as of
December 31, 2017
, which is included in this Annual Report on Form 10-K on page
36
.
|
/s/ Peter A. Altabef
|
/s/ Inder M. Singh
|
|
|
Peter A. Altabef
|
Inder M. Singh
|
|
|
President and Chief Executive Officer
|
Senior Vice President and Chief Financial Officer
|
|
34
Report of Independent Registered Public Accounting Firm
To the stockholders and board of directors
Unisys Corporation:
Opinion on the Consolidated Financial Statements
We have audited the accompanying consolidated balance sheets of Unisys Corporation and subsidiaries (the Company) as of
December 31, 2017
and
2016
, the related consolidated statements of income, comprehensive income, deficit and cash flows for each of the years in the three-year period ended
December 31, 2017
, and the related notes and financial statement schedule II - Valuation and Qualifying Accounts (collectively, the consolidated financial statements). In our opinion, the consolidated financial statements present fairly, in all material respects, the financial position of the Company as of
December 31, 2017
and
2016
, and the results of its operations and its cash flows for each of the years in the three-year period ended
December 31, 2017
, in conformity with U.S. generally accepted accounting principles.
We also have audited, in accordance with the standards of the Public Company Accounting Oversight Board (United States) (PCAOB), the Company’s internal control over financial reporting as of
December 31, 2017
, based on criteria established in
Internal Control - Integrated Framework (2013)
issued by the Committee of Sponsoring Organizations of the Treadway Commission, and our report dated
March 12, 2018
expressed an adverse opinion on the effectiveness of the Company’s internal control over financial reporting.
Basis for Opinion
These consolidated financial statements are the responsibility of the Company’s management. Our responsibility is to express an opinion on these consolidated financial statements based on our audits. We are a public accounting firm registered with the PCAOB and are required to be independent with respect to the Company in accordance with the U.S. federal securities laws and the applicable rules and regulations of the Securities and Exchange Commission and the PCAOB.
We conducted our audits in accordance with the standards of the PCAOB. Those standards require that we plan and perform the audit to obtain reasonable assurance about whether the consolidated financial statements are free of material misstatement, whether due to error or fraud. Our audits included performing procedures to assess the risks of material misstatement of the consolidated financial statements, whether due to error or fraud, and performing procedures that respond to those risks. Such procedures included examining, on a test basis, evidence regarding the amounts and disclosures in the consolidated financial statements. Our audits also included evaluating the accounting principles used and significant estimates made by management, as well as evaluating the overall presentation of the consolidated financial statements. We believe that our audits provide a reasonable basis for our opinion.
|
/s/ KPMG LLP
|
||||
|
We have served as the Company’s auditor since 2008.
|
||||
|
Philadelphia, Pennsylvania
|
||||
|
March 12, 2018
|
||||
35
Report of Independent Registered Public Accounting Firm
To the stockholders and board of directors
Unisys Corporation:
Opinion on Internal Control Over Financial Reporting
We have audited Unisys Corporation and subsidiaries’ (the Company) internal control over financial reporting as of
December 31, 2017
, based on criteria established in
Internal Control - Integrated Framework (2013)
issued by the Committee of Sponsoring Organizations of the Treadway Commission. In our opinion, because of the effect of the material weakness, described below, on the achievement of the objectives of the control criteria, the Company has not maintained effective internal control over financial reporting as of
December 31, 2017
, based on criteria established in
Internal Control - Integrated Framework (2013)
issued by the Committee of Sponsoring Organizations of the Treadway Commission.
We also have audited, in accordance with the standards of the Public Company Accounting Oversight Board (United States) (PCAOB), the consolidated balance sheets of the Company as of
December 31, 2017
and
2016
, the related consolidated statements of income, comprehensive income, deficit, and cash flows for each of the years in the three-year period ended
December 31, 2017
, and the related notes and financial statement schedule II - Valuation and Qualifying Accounts (collectively, the consolidated financial statements), and our report dated
March 12, 2018
expressed an unqualified opinion on those consolidated financial statements.
A material weakness is a deficiency, or a combination of deficiencies, in internal control over financial reporting, such that there is a reasonable possibility that a material misstatement of the company’s annual or interim financial statements will not be prevented or detected on a timely basis. A material weakness related to ineffective risk assessment procedures, insufficient trained personnel, and ineffective process level control activities over Technology revenue has been identified and included in management’s assessment. The material weakness was considered in determining the nature, timing, and extent of audit tests applied in our audit of the
2017
consolidated financial statements, and this report does not affect our report on those consolidated financial statements.
Basis for Opinion
The Company’s management is responsible for maintaining effective internal control over financial reporting and for its assessment of the effectiveness of internal control over financial reporting, included in the accompanying Management’s Report on Internal Control Over Financial Reporting. Our responsibility is to express an opinion on the Company’s internal control over financial reporting based on our audit. We are a public accounting firm registered with the PCAOB and are required to be independent with respect to the Company in accordance with the U.S. federal securities laws and the applicable rules and regulations of the Securities and Exchange Commission and the PCAOB.
We conducted our audit in accordance with the standards of the PCAOB. Those standards require that we plan and perform the audit to obtain reasonable assurance about whether effective internal control over financial reporting was maintained in all material respects. Our audit of internal control over financial reporting included obtaining an understanding of internal control over financial reporting, assessing the risk that a material weakness exists, and testing and evaluating the design and operating effectiveness of internal control based on the assessed risk. Our audit also included performing such other procedures as we considered necessary in the circumstances. We believe that our audit provides a reasonable basis for our opinion.
Definition and Limitations of Internal Control Over Financial Reporting
A company’s internal control over financial reporting is a process designed to provide reasonable assurance regarding the reliability of financial reporting and the preparation of financial statements for external purposes in accordance with generally accepted accounting principles. A company’s internal control over financial reporting includes those policies and procedures that (1) pertain to the maintenance of records that, in reasonable detail, accurately and fairly reflect the transactions and dispositions of the assets of the company; (2) provide reasonable assurance that transactions are recorded as necessary to permit preparation of financial statements in accordance with generally accepted accounting principles, and that receipts and expenditures of the company are being made only in accordance with authorizations of management and directors of the company; and (3) provide reasonable assurance regarding prevention or timely detection of unauthorized acquisition, use, or disposition of the company’s assets that could have a material effect on the financial statements.
Because of its inherent limitations, internal control over financial reporting may not prevent or detect misstatements. Also, projections of any evaluation of effectiveness to future periods are subject to the risk that controls may become inadequate because of changes in conditions, or that the degree of compliance with the policies or procedures may deteriorate.
|
/s/ KPMG LLP
|
||||
|
Philadelphia, Pennsylvania
|
||||
|
March 12, 2018
|
||||
36
UNISYS CORPORATION
(Millions, except per share data)
|
Year ended December 31,
|
2017
|
|
2016
|
|
2015
|
|
||||||
|
Revenue
|
||||||||||||
|
Services
|
$
|
2,328.2
|
|
$
|
2,406.3
|
|
$
|
2,605.6
|
|
|||
|
Technology
|
413.6
|
|
414.4
|
|
409.5
|
|
||||||
|
2,741.8
|
|
2,820.7
|
|
3,015.1
|
|
|||||||
|
Costs and expenses
|
||||||||||||
|
Cost of revenue:
|
||||||||||||
|
Services
|
2,102.1
|
|
2,092.9
|
|
2,306.7
|
|
||||||
|
Technology
|
161.4
|
|
169.2
|
|
167.5
|
|
||||||
|
2,263.5
|
|
2,262.1
|
|
2,474.2
|
|
|||||||
|
Selling, general and administrative expenses
|
426.5
|
|
455.6
|
|
519.6
|
|
||||||
|
Research and development expenses
|
47.2
|
|
55.4
|
|
76.4
|
|
||||||
|
2,737.2
|
|
2,773.1
|
|
3,070.2
|
|
|||||||
|
Operating income (loss)
|
4.6
|
|
47.6
|
|
(55.1
|
)
|
||||||
|
Interest expense
|
52.8
|
|
27.4
|
|
11.9
|
|
||||||
|
Other income (expense), net
|
(23.9
|
)
|
0.3
|
|
8.2
|
|
||||||
|
Income (loss) before income taxes
|
(72.1
|
)
|
20.5
|
|
(58.8
|
)
|
||||||
|
(Benefit) provision for income taxes
|
(5.5
|
)
|
57.2
|
|
44.4
|
|
||||||
|
Consolidated net loss
|
(66.6
|
)
|
(36.7
|
)
|
(103.2
|
)
|
||||||
|
Net income (loss) attributable to noncontrolling interests
|
(1.3
|
)
|
11.0
|
|
6.7
|
|
||||||
|
Net loss attributable to Unisys Corporation common shareholders
|
$
|
(65.3
|
)
|
$
|
(47.7
|
)
|
$
|
(109.9
|
)
|
|||
|
Loss per common share attributable to Unisys Corporation
|
||||||||||||
|
Basic
|
$
|
(1.30
|
)
|
$
|
(0.95
|
)
|
$
|
(2.20
|
)
|
|||
|
Diluted
|
$
|
(1.30
|
)
|
$
|
(0.95
|
)
|
$
|
(2.20
|
)
|
|||
See notes to consolidated financial statements
37
UNISYS CORPORATION
CONSOLIDATED STATEMENTS OF COMPREHENSIVE INCOME
(Millions)
|
Year ended December 31,
|
2017
|
|
2016
|
|
2015
|
|
||||||
|
Consolidated net loss
|
$
|
(66.6
|
)
|
$
|
(36.7
|
)
|
$
|
(103.2
|
)
|
|||
|
Other comprehensive income
|
||||||||||||
|
Foreign currency translation
|
117.8
|
|
(108.4
|
)
|
(100.8
|
)
|
||||||
|
Postretirement adjustments, net of tax of $18.3 in 2017, $(13.3) in 2016 and $18.1 in 2015
|
265.1
|
|
(137.6
|
)
|
265.7
|
|
||||||
|
Total other comprehensive income (loss)
|
382.9
|
|
(246.0
|
)
|
164.9
|
|
||||||
|
Comprehensive income (loss)
|
316.3
|
|
(282.7
|
)
|
61.7
|
|
||||||
|
Comprehensive income (loss) attributable to noncontrolling interests
|
44.6
|
|
(27.5
|
)
|
3.5
|
|
||||||
|
Comprehensive income (loss) attributable to Unisys Corporation
|
$
|
271.7
|
|
$
|
(255.2
|
)
|
$
|
58.2
|
|
|||
See notes to consolidated financial statements
38
UNISYS CORPORATION
(Millions)
|
As of December 31,
|
2017
|
|
2016
|
|
|||
|
Assets
|
|||||||
|
Current assets
|
|||||||
|
Cash and cash equivalents
|
$
|
733.9
|
|
$
|
370.6
|
|
|
|
Accounts receivable, net
|
503.3
|
|
505.8
|
|
|||
|
Inventories:
|
|||||||
|
Parts and finished equipment
|
13.6
|
|
14.0
|
|
|||
|
Work in process and materials
|
12.5
|
|
15.0
|
|
|||
|
Prepaid expenses and other current assets
|
126.2
|
|
121.9
|
|
|||
|
Total current assets
|
1,389.5
|
|
1,027.3
|
|
|||
|
Properties
|
898.8
|
|
886.6
|
|
|||
|
Less – Accumulated depreciation and amortization
|
756.3
|
|
741.3
|
|
|||
|
Properties, net
|
142.5
|
|
145.3
|
|
|||
|
Outsourcing assets, net
|
202.3
|
|
172.5
|
|
|||
|
Marketable software, net
|
138.3
|
|
137.0
|
|
|||
|
Prepaid postretirement assets
|
148.3
|
|
33.3
|
|
|||
|
Deferred income taxes
|
119.9
|
|
146.1
|
|
|||
|
Goodwill
|
180.8
|
|
178.6
|
|
|||
|
Restricted cash
|
30.2
|
|
30.5
|
*
|
|||
|
Other long-term assets
|
190.6
|
|
151.0
|
*
|
|||
|
Total assets
|
$
|
2,542.4
|
|
$
|
2,021.6
|
|
|
|
Liabilities and deficit
|
|||||||
|
Current liabilities:
|
|||||||
|
Current maturities of long-term debt
|
$
|
10.8
|
|
$
|
106.0
|
|
|
|
Accounts payable
|
241.8
|
|
189.0
|
|
|||
|
Deferred revenue
|
327.5
|
|
337.4
|
|
|||
|
Other accrued liabilities
|
391.5
|
|
349.2
|
|
|||
|
Total current liabilities
|
971.6
|
|
981.6
|
|
|||
|
Long-term debt
|
633.9
|
|
194.0
|
|
|||
|
Long-term postretirement liabilities
|
2,004.4
|
|
2,292.6
|
|
|||
|
Long-term deferred revenue
|
159.0
|
|
117.6
|
|
|||
|
Other long-term liabilities
|
100.0
|
|
83.2
|
|
|||
|
Commitments and contingencies
|
|
|
|||||
|
Deficit:
|
|||||||
|
Common stock, par value $.01 per share (150.0 million shares authorized; 53.4 million shares and 52.8 million shares issued)
|
0.5
|
|
0.5
|
|
|||
|
Accumulated deficit
|
(1,963.1
|
)
|
(1,893.4
|
)
|
|||
|
Treasury stock, at cost
|
(102.7
|
)
|
(100.5
|
)
|
|||
|
Paid-in capital
|
4,526.4
|
|
4,515.2
|
|
|||
|
Accumulated other comprehensive loss
|
(3,815.8
|
)
|
(4,152.8
|
)
|
|||
|
Total Unisys stockholders’ deficit
|
(1,354.7
|
)
|
(1,631.0
|
)
|
|||
|
Noncontrolling interests
|
28.2
|
|
(16.4
|
)
|
|||
|
Total deficit
|
(1,326.5
|
)
|
(1,647.4
|
)
|
|||
|
Total liabilities and deficit
|
$
|
2,542.4
|
|
$
|
2,021.6
|
|
|
*Amounts were changed to conform to the current-year presentation. See Note 5
See notes to consolidated financial statements
39
UNISYS CORPORATION
(Millions)
|
Year ended December 31,
|
2017
|
|
2016
|
|
2015
|
|
||||||
|
Cash flows from operating activities
|
||||||||||||
|
Consolidated net loss
|
$
|
(66.6
|
)
|
$
|
(36.7
|
)
|
$
|
(103.2
|
)
|
|||
|
Adjustments to reconcile consolidated net loss to net cash provided by operating activities:
|
||||||||||||
|
Foreign currency transaction losses
|
21.7
|
|
0.4
|
|
8.4
|
|
||||||
|
Non-cash interest expense
|
9.5
|
|
7.0
|
|
—
|
|
||||||
|
Loss on debt extinguishment
|
1.5
|
|
4.0
|
|
—
|
|
||||||
|
Employee stock compensation
|
11.2
|
|
9.5
|
|
9.4
|
|
||||||
|
Depreciation and amortization of properties
|
39.7
|
|
38.9
|
|
57.5
|
|
||||||
|
Depreciation and amortization of outsourcing assets
|
53.7
|
|
51.9
|
|
55.7
|
|
||||||
|
Amortization of marketable software
|
63.1
|
|
64.8
|
|
66.9
|
|
||||||
|
Other non-cash operating activities
|
3.2
|
|
1.9
|
|
4.6
|
|
||||||
|
Loss on disposal of capital assets
|
5.0
|
|
6.2
|
|
9.7
|
|
||||||
|
Pension contributions
|
(138.4
|
)
|
(132.5
|
)
|
(148.3
|
)
|
||||||
|
Pension expense
|
92.4
|
|
82.7
|
|
108.7
|
|
||||||
|
Decrease in deferred income taxes, net
|
3.4
|
|
2.7
|
|
1.2
|
|
||||||
|
Changes in operating assets and liabilities:
|
||||||||||||
|
Receivables, net
|
5.9
|
|
87.3
|
|
(11.5
|
)
|
||||||
|
Inventories
|
4.1
|
|
15.3
|
|
(3.7
|
)
|
||||||
|
Other assets
|
(27.5
|
)
|
16.5
|
*
|
18.1
|
*
|
||||||
|
Accounts payable and other accrued liabilities
|
48.6
|
|
7.5
|
*
|
(60.3
|
)*
|
||||||
|
Other liabilities
|
35.9
|
|
(9.2
|
)
|
(7.5
|
)
|
||||||
|
Net cash provided by operating activities
|
166.4
|
|
218.2
|
|
5.7
|
*
|
||||||
|
Cash flows from investing activities
|
||||||||||||
|
Proceeds from investments
|
4,717.2
|
|
4,455.9
|
|
3,831.6
|
|
||||||
|
Purchases of investments
|
(4,692.4
|
)
|
(4,490.0
|
)
|
(3,806.2
|
)
|
||||||
|
Capital additions of properties
|
(25.8
|
)
|
(32.5
|
)
|
(49.6
|
)
|
||||||
|
Capital additions of outsourcing assets
|
(86.3
|
)
|
(51.3
|
)
|
(102.0
|
)
|
||||||
|
Investment in marketable software
|
(64.4
|
)
|
(63.3
|
)
|
(62.1
|
)
|
||||||
|
Other
|
(0.8
|
)
|
(0.9
|
)*
|
7.0
|
*
|
||||||
|
Net cash used for investing activities
|
(152.5
|
)
|
(182.1
|
)*
|
(181.3
|
)*
|
||||||
|
Cash flows from financing activities
|
||||||||||||
|
Proceeds from issuance of long-term debt
|
452.9
|
|
213.5
|
|
31.8
|
|
||||||
|
Payments for capped call transactions
|
—
|
|
(27.3
|
)
|
—
|
|
||||||
|
Issuance costs relating to long-term debt
|
(12.1
|
)
|
(7.3
|
)
|
—
|
|
||||||
|
Payments of long-term debt
|
(107.5
|
)
|
(129.8
|
)
|
(10.4
|
)
|
||||||
|
Proceeds from exercise of stock options
|
—
|
|
—
|
|
3.7
|
|
||||||
|
Net (payments) proceeds from short-term borrowings
|
—
|
|
(65.8
|
)
|
65.8
|
|
||||||
|
Financing fees
|
(1.1
|
)
|
—
|
|
(0.3
|
)
|
||||||
|
Other
|
(2.3
|
)
|
(0.4
|
)*
|
(0.8
|
)*
|
||||||
|
Net cash provided by (used for) financing activities
|
329.9
|
|
(17.1
|
)*
|
89.8
|
*
|
||||||
|
Effect of exchange rate changes on cash, cash equivalents and restricted cash
|
19.2
|
|
(14.7
|
)*
|
(47.6
|
)*
|
||||||
|
Increase (decrease) in cash, cash equivalents and restricted cash
|
363.0
|
|
4.3
|
*
|
(133.4
|
)*
|
||||||
|
Cash, cash equivalents and restricted cash, beginning of year
|
401.1
|
|
396.8
|
*
|
530.2
|
*
|
||||||
|
Cash, cash equivalents and restricted cash, end of year
|
$
|
764.1
|
|
$
|
401.1
|
*
|
$
|
396.8
|
*
|
|||
*Amounts were changed to conform to the current-year presentation. See Note 5
See notes to consolidated financial statements.
40
UNISYS CORPORATION
CONSOLIDATED STATEMENTS OF DEFICIT
(Millions)
|
|
|
Unisys Corporation
|
|
|||||||||||||||||||||||||||||
|
Total
|
Total Unisys Corporation
|
Common Stock Par Value
|
Accumu-lated Deficit
|
Treasury Stock At Cost
|
Paid-in Capital
|
Accumu-lated Other Compre-hensive Loss
|
Non-controlling Interests
|
|||||||||||||||||||||||||
|
Balance at December 31, 2014
|
$
|
(1,452.4
|
)
|
$
|
(1,460.0
|
)
|
$
|
0.5
|
|
$
|
(1,735.8
|
)
|
$
|
(99.6
|
)
|
$
|
4,488.3
|
|
$
|
(4,113.4
|
)
|
$
|
7.6
|
|
||||||||
|
Consolidated net income (loss)
|
(103.2
|
)
|
(109.9
|
)
|
|
(109.9
|
)
|
|
|
|
6.7
|
|
||||||||||||||||||||
|
Stock-based compensation
|
12.1
|
|
12.1
|
|
|
|
(0.5
|
)
|
12.6
|
|
|
|
||||||||||||||||||||
|
Translation adjustments
|
(100.8
|
)
|
(96.0
|
)
|
|
|
|
|
(96.0
|
)
|
(4.8
|
)
|
||||||||||||||||||||
|
Postretirement plans
|
265.7
|
|
264.1
|
|
|
|
|
|
264.1
|
|
1.6
|
|
||||||||||||||||||||
|
Balance at December 31, 2015
|
$
|
(1,378.6
|
)
|
$
|
(1,389.7
|
)
|
$
|
0.5
|
|
$
|
(1,845.7
|
)
|
$
|
(100.1
|
)
|
$
|
4,500.9
|
|
$
|
(3,945.3
|
)
|
$
|
11.1
|
|
||||||||
|
Consolidated net income (loss)
|
(36.7
|
)
|
(47.7
|
)
|
|
(47.7
|
)
|
|
|
|
11.0
|
|
||||||||||||||||||||
|
Stock-based compensation
|
8.8
|
|
8.8
|
|
|
|
(0.4
|
)
|
9.2
|
|
|
|
||||||||||||||||||||
|
Discount on debt issuance
|
33.6
|
|
33.6
|
|
|
|
|
|
33.6
|
|
|
|
|
|||||||||||||||||||
|
Capped call on debt issuance
|
(27.3
|
)
|
(27.3
|
)
|
|
|
|
|
(27.3
|
)
|
|
|
||||||||||||||||||||
|
Expenses of convertible notes
|
(1.2
|
)
|
(1.2
|
)
|
|
|
|
|
(1.2
|
)
|
|
|
|
|||||||||||||||||||
|
Translation adjustments
|
(108.4
|
)
|
(93.3
|
)
|
|
|
|
|
|
|
(93.3
|
)
|
(15.1
|
)
|
||||||||||||||||||
|
Postretirement plans
|
(137.6
|
)
|
(114.2
|
)
|
|
|
|
|
(114.2
|
)
|
(23.4
|
)
|
||||||||||||||||||||
|
Balance at December 31, 2016
|
$
|
(1,647.4
|
)
|
$
|
(1,631.0
|
)
|
$
|
0.5
|
|
$
|
(1,893.4
|
)
|
$
|
(100.5
|
)
|
$
|
4,515.2
|
|
$
|
(4,152.8
|
)
|
$
|
(16.4
|
)
|
||||||||
|
Cumulative effect adjustment -
ASU No. 2016-16
|
(4.4
|
)
|
(4.4
|
)
|
(4.4
|
)
|
||||||||||||||||||||||||||
|
Consolidated net loss
|
(66.6
|
)
|
(65.3
|
)
|
|
(65.3
|
)
|
|
|
|
(1.3
|
)
|
||||||||||||||||||||
|
Stock-based compensation
|
9.0
|
|
9.0
|
|
|
|
(2.2
|
)
|
11.2
|
|
|
|
||||||||||||||||||||
|
Translation adjustments
|
117.8
|
|
110.1
|
|
|
|
|
|
|
|
110.1
|
|
7.7
|
|
||||||||||||||||||
|
Postretirement plans
|
265.1
|
|
226.9
|
|
|
|
|
|
226.9
|
|
38.2
|
|
||||||||||||||||||||
|
Balance at December 31, 2017
|
$
|
(1,326.5
|
)
|
$
|
(1,354.7
|
)
|
$
|
0.5
|
|
$
|
(1,963.1
|
)
|
$
|
(102.7
|
)
|
$
|
4,526.4
|
|
$
|
(3,815.8
|
)
|
$
|
28.2
|
|
||||||||
See notes to consolidated financial statements.
41
UNISYS CORPORATION
NOTES TO CONSOLIDATED FINANCIAL STATEMENTS
(Dollars in millions, except share and per share amounts)
Principles of consolidation
The consolidated financial statements include the accounts of all majority-owned subsidiaries.
Use of estimates
The preparation of financial statements in conformity with U.S. generally accepted accounting principles requires management to make estimates and assumptions about future events. These estimates and assumptions affect the amounts of assets and liabilities reported, disclosures about contingent assets and liabilities and the reported amounts of revenue and expenses. Such estimates include the valuation of accounts receivable, inventories, outsourcing assets, marketable software, goodwill and other long-lived assets, legal contingencies, indemnifications, assumptions used in the measurement of progress toward completion for systems integration projects, income taxes and retirement and other post-employment benefits, among others. These estimates and assumptions are based on management’s best estimates and judgment. Management evaluates its estimates and assumptions on an ongoing basis using historical experience and other factors, including the current economic environment, which management believes to be reasonable under the circumstances. Management adjusts such estimates and assumptions when facts and circumstances dictate. As future events and their effects cannot be determined with precision, actual results could differ significantly from these estimates. Changes in those estimates resulting from continuing changes in the economic environment will be reflected in the financial statements in future periods.
Cash and Cash equivalents
Cash and cash equivalents consists of cash on hand, short-term investments purchased with a maturity of three months or less and certificates of deposit which may be withdrawn at any time at the discretion of the company without penalty.
Cash and cash equivalents subject to contractual restrictions and not readily available are classified as restricted cash. Restricted cash primarily consists of cash the company is contractually obligated to maintain in accordance with the terms of its U.K. business process outsourcing joint venture agreement.
The following table provides a reconciliation of cash and cash equivalents and restricted cash reported within the consolidated balance sheets to the total of the amounts shown in the consolidated statements of cash flows.
|
As of December 31,
|
2017
|
2016
|
||||||
|
Cash and cash equivalents
|
$
|
733.9
|
|
$
|
370.6
|
|
||
|
Restricted cash
|
30.2
|
|
30.5
|
|
||||
|
Total cash, cash equivalents and restricted cash shown in the consolidated statements of cash flows
|
$
|
764.1
|
|
$
|
401.1
|
|
||
Inventories
Inventories are valued at the lower of cost and net realizable value. Cost is determined on the first-in, first-out method.
Properties
Properties are carried at cost and are depreciated over the estimated lives of such assets using the straight-line method. The estimated lives used, in years, are as follows: buildings,
20
–
50
; machinery and office equipment,
4
–
7
; rental equipment,
4
; and internal-use software,
3
–
10
.
Advertising costs
All advertising costs are expensed as incurred. The amount charged to expense during
2017
,
2016
and
2015
was
$1.6 million
,
$2.7 million
and
$4.9 million
, respectively.
Shipping and handling
Costs related to shipping and handling are included in cost of revenue.
Goodwill
Goodwill arising from the acquisition of an entity represents the excess of the cost of acquisition over the fair value of the acquired identifiable assets, liabilities and contingent liabilities of the entity recognized at the date of acquisition. Goodwill is initially recognized as an asset and is subsequently measured at cost less any accumulated impairment losses. Goodwill is held in the currency of the acquired entity and revalued to the closing rate at each balance sheet date.
The company tests goodwill for impairment annually in the fourth quarter using data as of September 30th of that year, as well as whenever there are events or changes in circumstances (triggering events) that would more likely than not reduce the fair value of one or more reporting units below its respective carrying amount. The company compares the fair value of each of its reporting units to their respective carrying value. If the carrying value exceeds fair value, an impairment charge is recognized for the difference. Impaired goodwill is written down to its fair value through a charge to the consolidated statement of income in the period the impairment is identified.
We estimate the fair value of each reporting unit using a combination of the income approach and market approach.
The income approach incorporates the use of a discounted cash flow method in which the estimated future cash flows and terminal values for each reporting unit are discounted to present value. Cash flow projections are based on management’s
42
estimates of economic and market conditions, which drive key assumptions of revenue growth rates, operating margins, capital expenditures and working capital requirements. The discount rate in turn is based on various market factors and specific risk characteristics of each reporting unit.
The market approach estimates fair value by applying performance metric multiples to the reporting unit’s prior and expected operating performance. The multiples are derived from comparable publicly traded companies with similar operating and investment characteristics as the reporting unit.
If the fair value of the reporting unit derived using the income approach is significantly different from the fair value estimate using the market approach, the company reevaluates its assumptions used in the two models. When considering the weighting between the market approach and income approach, we gave more weighting to the income approach. The higher weighting assigned to the income approach took into consideration that the guideline companies used in the market approach generally represent larger diversified companies relative to the reporting units and may have different long term growth prospects, among other factors.
In order to assess the reasonableness of the calculated reporting unit fair values, the company also compares the sum of the reporting units’ fair values to its market capitalization (per share stock price multiplied by shares outstanding) and calculates an implied control premium (the excess of the sum of the reporting units’ fair values over the market capitalization).
Estimating the fair value of reporting units requires the use of estimates and significant judgments that are based on a number of factors including actual operating results. It is reasonably possible that the judgments and estimates described above could change in future periods.
Revenue recognition
Revenue is recognized when persuasive evidence of an arrangement exists, delivery has occurred or services have been rendered, the fee is fixed or determinable, and collectability is probable.
Revenue from hardware sales with standard payment terms is recognized upon the passage of title and the transfer of risk of loss. Outside the United States, the company recognizes revenue even if it retains a form of title to products delivered to customers, provided the sole purpose is to enable the company to recover the products in the event of customer payment default and the arrangement does not prohibit the customer’s use of the product in the ordinary course of business.
Revenue from software licenses with standard payment terms is recognized at the inception of the initial license term and upon execution of an extension to the license term.
The company also enters into multiple-element arrangements, which may include any combination of software, hardware, or services. For example, a client may purchase an enterprise server that includes operating system software. In addition, the arrangement may include post-contract support for the software and a contract for post-warranty maintenance for service of the hardware. These arrangements consist of multiple deliverables, with software and hardware delivered in one reporting period and the software support and hardware maintenance services delivered across multiple reporting periods. In another example, the company may provide desktop managed services to a client on a long term multiple year basis and periodically sell software and hardware products to the client. The services are provided on a continuous basis across multiple reporting periods and the software and hardware products are delivered in one reporting period. To the extent that a deliverable in a multiple-deliverable arrangement is subject to specific guidance, that deliverable is accounted for in accordance with such specific guidance. Examples of such arrangements may include leased hardware which is subject to specific leasing guidance or software which is subject to specific software revenue recognition guidance.
In these transactions, the company allocates the total revenue to be earned under the arrangement among the various elements based on a selling price hierarchy. The selling price for a deliverable is based on its vendor specific objective evidence (“VSOE”) if available, third party evidence (“TPE”) if VSOE is not available, or the best estimated selling price (“ESP”) if neither VSOE nor TPE is available. VSOE of selling price is based upon the normal pricing and discounting practices for those services and products when sold separately. TPE of selling price is based on evaluating largely similar and interchangeable competitor products or services in standalone sales to similarly situated customers. ESP is established considering factors such as margin objectives, discounts off of list prices, market conditions, competition and other factors. ESP represents the price at which the company would transact for the deliverable if it were sold by the company regularly on a standalone basis.
As mentioned above, some of the company’s multiple-element arrangements may include leased hardware which is subject to specific leasing guidance. Revenue under these arrangements is allocated considering the relative selling prices of the lease and non-lease elements. Lease deliverables include hardware, financing, maintenance and other executory costs, while non-lease deliverables generally consist of services other than maintenance. The determination of the amount of revenue allocated to the lease deliverables begins by allocating revenue to maintenance and other executory costs plus a profit thereon. These elements are generally recognized over the term of the lease. The remaining amounts are allocated to the hardware and financing elements. The amount allocated to hardware is recognized as revenue monthly over the term of the lease for those leases which are classified as operating leases and at the inception of the lease term for those leases which are classified as sales-type leases.
43
The amount of finance income attributable to sales-type leases is recognized on the accrual basis using the effective interest method.
For multiple-element arrangements that involve the licensing, selling or leasing of software, for software and software-related elements, the allocation of revenue is based on VSOE. There may be cases in which there is VSOE of fair value of the undelivered elements but no such evidence for the delivered elements. In these cases, the residual method is used to allocate the arrangement consideration. Under the residual method, the amount of consideration allocated to the delivered elements equals the total arrangement consideration less the aggregate VSOE of fair value of the undelivered elements.
For multiple-element arrangements that include services or products that (a) do not include the licensing, selling or leasing of software, or (b) contain software that is incidental to the services or products as a whole or (c) contain software components that are sold, licensed or leased with tangible products when the software components and non-software components (i.e., the software and hardware) of the tangible product function together to deliver the tangible product’s essential functionality (e.g., sales of the company’s enterprise-class servers including software and hardware), or some combination of the above, the allocation of revenue is based on the relative selling prices of each of the deliverables in the arrangement based on the selling price hierarchy, discussed above.
For multiple-element arrangements that include both software and non-software deliverables, the company allocates arrangement consideration to the software group and to the non-software group based on the relative selling prices of the deliverables in the arrangement based on the selling price hierarchy discussed above. For the software group, arrangement consideration is further allocated using VSOE as described above.
The company recognizes revenue on delivered elements only if: (a) any undelivered services or products are not essential to the functionality of the delivered services or products, (b) the company has an enforceable claim to receive the amount due in the event it does not deliver the undelivered services or products, (c) there is evidence of the selling price for each undelivered service or product, and (d) the revenue recognition criteria otherwise have been met for the delivered elements. Otherwise, revenue on delivered elements is recognized as the undelivered elements are delivered. The company evaluates each deliverable in an arrangement to determine whether it represents a separate unit of accounting. A delivered element constitutes a separate unit of accounting when it has standalone value and there is no customer-negotiated refund or return right for the delivered elements. If these criteria are not met, the deliverable is combined with the undelivered elements and the allocation of the arrangement consideration and revenue recognition are determined for the combined unit as a single unit.
Revenue from hardware sales and software licenses with extended payment terms is recognized as payments from customers become due (assuming that all other conditions for revenue recognition have been satisfied).
Revenue for operating leases is recognized on a monthly basis over the term of the lease and for sales-type leases at the inception of the lease term.
Revenue from equipment and software maintenance and post-contract support is recognized on a straight-line basis as earned over the terms of the respective contracts. Cost related to such contracts is recognized as incurred.
Revenue and profit under systems integration contracts are recognized either on the percentage-of-completion method of accounting using the cost-to-cost method, or when services have been performed, depending on the nature of the project. For contracts accounted for on the percentage-of-completion basis, revenue and profit recognized in any given accounting period are based on estimates of total projected contract costs. The estimates are continually reevaluated and revised, when necessary, throughout the life of a contract. Any adjustments to revenue and profit resulting from changes in estimates are accounted for in the period of the change in estimate. When estimates indicate that a loss will be incurred on a contract upon completion, a provision for the expected loss is recorded in the period in which the loss becomes evident.
Revenue from time and materials service contracts and outsourcing contracts is recognized as the services are provided using either an objective measure of output or on a straight-line basis over the term of the contract.
Income taxes
Income taxes are based on income before taxes for financial reporting purposes and reflect a current tax liability for the estimated taxes payable in the current-year tax returns and changes in deferred taxes. Deferred tax assets or liabilities are determined based on differences between financial reporting and tax bases of assets and liabilities and are measured using enacted tax laws and rates. A valuation allowance is provided on deferred tax assets if it is determined that it is more likely than not that the asset will not be realized. The company recognizes penalties and interest accrued related to income tax liabilities in provision for income taxes in its consolidated statements of income.
The Tax Cuts & Jobs Act (“TCJA”) was enacted by the U.S. on December 22, 2017 and introduced a tax on “global intangible low-taxed income” (“GILTI”) effective in 2018. The company will treat GILTI as a period cost when included in U.S. taxable income.
44
Marketable software
The cost of development of computer software to be sold or leased, incurred subsequent to establishment of technological feasibility, is capitalized and amortized to cost of sales over the estimated revenue-producing lives of the products, which is generally not in excess of
three
years following product release. The company performs quarterly reviews to ensure that unamortized costs remain recoverable from future revenue.
Internal-use software
The company capitalizes certain internal and external costs incurred to acquire or create internal-use software, principally related to software coding, designing system interfaces, and installation and testing of the software. These costs are amortized in accordance with the fixed asset policy described above.
Outsourcing assets
Costs on outsourcing contracts are generally expensed as incurred. However, certain costs incurred upon initiation of an outsourcing contract (principally initial customer setup) are deferred and expensed over the initial contract life. Fixed assets and software used in connection with outsourcing contracts are capitalized and depreciated over the shorter of the initial contract life or in accordance with the fixed asset policy described above.
Recoverability of outsourcing assets is subject to various business risks. Quarterly, the company compares the carrying value of the outsourcing assets with the undiscounted future cash flows expected to be generated by the outsourcing assets to determine if there is impairment. If impaired, the outsourcing assets are reduced to an estimated fair value on a discounted cash flow basis. The company prepares its cash flow estimates based on assumptions that it believes to be reasonable but are also inherently uncertain. Actual future cash flows could differ from these estimates.
Translation of foreign currency
The local currency is the functional currency for most of the company’s international subsidiaries, and as such, assets and liabilities are translated into U.S. dollars at year-end exchange rates. Income and expense items are translated at average exchange rates during the year. Translation adjustments resulting from changes in exchange rates are reported in other comprehensive income (loss). Exchange gains and losses on intercompany balances are reported in other income (expense), net.
For those international subsidiaries operating in highly inflationary economies, the U.S. dollar is the functional currency, and as such, nonmonetary assets and liabilities are translated at historical exchange rates, and monetary assets and liabilities are translated at current exchange rates. Exchange gains and losses arising from translation are included in other income (expense), net.
Stock-based compensation plans
Stock-based compensation represents the cost related to stock-based awards granted to employees and directors. The company recognizes compensation expense for the fair value of stock options, which have graded vesting, on a straight-line basis over the requisite service period. The company estimates the fair value of stock options using a Black-Scholes valuation model. The expense is recorded in selling, general and administrative expenses.
Retirement benefits
Accounting rules covering defined benefit pension plans and other postretirement benefits require that amounts recognized in financial statements be determined on an actuarial basis. A significant element in determining the company’s retirement benefits expense or income is the expected long-term rate of return on plan assets. This expected return is an assumption as to the average rate of earnings expected on the funds invested or to be invested to provide for the benefits included in the projected pension benefit obligation. The company applies this assumed long-term rate of return to a calculated value of plan assets, which recognizes changes in the fair value of plan assets in a systematic manner over
four
years. This produces the expected return on plan assets that is included in retirement benefits expense or income. The difference between this expected return and the actual return on plan assets is deferred. The net deferral of past asset losses or gains affects the calculated value of plan assets and, ultimately, future retirement benefits expense or income.
At December 31 of each year, the company determines the fair value of its retirement benefits plan assets as well as the discount rate to be used to calculate the present value of plan liabilities. The discount rate is an estimate of the interest rate at which the retirement benefits could be effectively settled. In estimating the discount rate, the company looks to rates of return on high-quality, fixed-income investments currently available and expected to be available during the period to maturity of the retirement benefits. The company uses a portfolio of fixed-income securities, which receive at least the second-highest rating given by a recognized ratings agency.
Fair value measurements
Fair value is defined as the price that would be received to sell an asset or paid to transfer a liability in an orderly transaction between market participants at the measurement date. When determining fair value measurements for assets and liabilities required to be recorded at fair value, the company assumes that the transaction is an orderly transaction that assumes exposure to the market for a period before the measurement date to allow for marketing activities that are usual and customary for transactions involving such assets or liabilities; it is not a forced transaction (for example, a forced liquidation or distress sale). The fair value hierarchy has three levels of inputs that may be used to measure fair value: Level 1 – Quoted prices (unadjusted) in active markets for identical assets or liabilities that the company can access at the measurement date; Level 2 – Inputs other than quoted prices within Level 1 that are observable for the asset or liability, either directly or indirectly; and Level 3 – Unobservable inputs for the asset or liability. The company has applied fair value measurements to its long-term debt (see note 9), derivatives (see note 12) and to its postretirement plan assets (see note 16).
45
Noncontrolling interest
The company owns a
fifty-one
percent interest in Intelligent Processing Solutions Ltd. (“iPSL”), a U.K. business process outsourcing joint venture. The remaining interests, which are reflected as a noncontrolling interest in the company’s financial statements, are owned by three financial institutions for which iPSL performs services.
The following table shows how the loss per common share attributable to Unisys Corporation was computed for the three years ended
December 31, 2017
(shares in thousands).
|
Year ended December 31,
|
2017
|
|
2016
|
|
2015
|
|
||||||
|
Basic earnings (loss) per common share computation:
|
||||||||||||
|
Net loss attributable to Unisys Corporation common shareholders
|
$
|
(65.3
|
)
|
$
|
(47.7
|
)
|
$
|
(109.9
|
)
|
|||
|
Weighted average shares
|
50,409
|
|
50,060
|
|
49,905
|
|
||||||
|
Basic loss per common share
|
$
|
(1.30
|
)
|
$
|
(0.95
|
)
|
$
|
(2.20
|
)
|
|||
|
Diluted earnings (loss) per common share computation:
|
|
|
|
|||||||||
|
Net loss attributable to Unisys Corporation for diluted earnings per share
|
$
|
(65.3
|
)
|
$
|
(47.7
|
)
|
$
|
(109.9
|
)
|
|||
|
Weighted average shares
|
50,409
|
|
50,060
|
|
49,905
|
|
||||||
|
Diluted loss per common share
|
$
|
(1.30
|
)
|
$
|
(0.95
|
)
|
$
|
(2.20
|
)
|
|||
|
Anti-dilutive weighted-average stock options and restricted stock units
(a)
|
2,206
|
|
3,553
|
|
2,915
|
|
||||||
|
Anti-dilutive weighted-average common shares issuable upon conversion of the 5.50% convertible senior notes
(a)
|
21,868
|
|
17,230
|
|
—
|
|
||||||
(a)
Amounts represent shares excluded from the computation of diluted earnings per share, as their effect, if included, would have been anti-dilutive for the periods presented.
In 2015, the company initiated a restructuring plan in connection with organizational initiatives to create a more competitive cost structure and rebalance the company’s global skill set. The company recognized charges and other costs of
$347.4 million
through 2017 in connection with this plan, principally related to a reduction in employees.
During
2015
, the company recognized charges of
$118.5 million
in connection with this plan, principally related to a reduction in employees. The charges related to work-force reductions were
$78.8 million
and were comprised of: (a) a charge of
$27.9 million
for
700
employees in the U.S. and (b) a charge of
$50.9 million
for
782
employees outside the U.S. In addition, the company recorded charges of
$39.7 million
comprised of
$20.2 million
for asset impairments and
$19.5 million
for other expenses related to the cost reduction effort. The charges were recorded in the following statement of income classifications: cost of revenue - services,
$52.3 million
; cost of revenue - technology,
$0.3 million
; selling, general and administrative expenses,
$53.5 million
; and research and development expenses,
$12.4 million
.
During
2016
, the company recognized charges of
$82.1 million
in connection with this plan, principally related to a reduction in employees. The charges related to work-force reductions were
$62.6 million
, principally related to severance costs, and were comprised of: (a) a charge of
$8.3 million
for
351
employees and
$(1.3) million
for changes in estimates in the U.S. and (b) a charge of
$58.6 million
for
1,048
employees and
$(3.0) million
for changes in estimates outside the U.S. In addition, the company recorded charges of
$19.5 million
comprised of
$1.4 million
for idle leased facilities costs,
$4.1 million
for contract amendment and termination costs,
$13.3 million
for professional fees and other expenses related to the cost reduction effort and
$0.7 million
for net asset sales and write-offs. The charges were recorded in the following statement of income classifications: cost of revenue – services,
$42.4 million
; selling, general and administrative expenses,
$38.0 million
; and research and development expenses,
$1.7 million
.
During
2017
, the company recognized charges of
$146.8 million
in connection with this plan. The charges related to work-force reductions were
$117.9 million
, principally related to severance costs, and were comprised of: (a) a charge of
$9.4 million
for
542
employees and
$(1.3) million
for changes in estimates in the U.S. and (b) a charge of
$109.4 million
for
2,274
employees,
$8.2 million
for additional benefits provided in 2017 and
$(7.8) million
for changes in estimates outside the U.S. In addition, the company recorded charges of
$28.9 million
comprised of
$4.7 million
for idle leased facilities costs,
$5.4 million
for contract amendment and termination costs,
$5.2 million
for professional fees and other expenses related to the cost reduction effort,
$1.8 million
for net asset sales and write-offs and
$11.8 million
for net foreign currency losses related to exiting foreign countries. The charges were recorded in the following statement of income classifications: cost of revenue - services,
$99.6 million
; cost of revenue - technology,
$0.4 million
; selling, general and administrative expenses,
$33.6 million
; and research and development expenses,
$1.4 million
; and other income (expense), net,
$11.8 million
.
46
Liabilities and expected future payments related to these costs are as follows:
|
Work-Force Reductions
|
Idle Leased
|
|||||||||||||||
|
Total
|
U.S.
|
International
|
Facilities Costs
|
|||||||||||||
|
Charges for work-force reductions
|
$
|
78.8
|
|
$
|
27.9
|
|
$
|
50.9
|
|
$
|
—
|
|
||||
|
Payments
|
(45.3
|
)
|
(23.7
|
)
|
(21.6
|
)
|
—
|
|
||||||||
|
Translation adjustments
|
(0.5
|
)
|
|
(0.5
|
)
|
—
|
|
|||||||||
|
Balance at December 31, 2015
|
33.0
|
|
4.2
|
|
28.8
|
|
—
|
|
||||||||
|
Additional Provisions
|
68.3
|
|
8.3
|
|
58.6
|
|
1.4
|
|
||||||||
|
Payments
|
(59.3
|
)
|
(9.4
|
)
|
(49.9
|
)
|
—
|
|
||||||||
|
Changes in estimates
|
(4.3
|
)
|
(1.3
|
)
|
(3.0
|
)
|
—
|
|
||||||||
|
Translation adjustments
|
(1.1
|
)
|
—
|
|
(1.1
|
)
|
—
|
|
||||||||
|
Balance at December 31, 2016
|
36.6
|
|
1.8
|
|
33.4
|
|
1.4
|
|
||||||||
|
Additional Provisions
|
131.2
|
|
9.4
|
|
117.6
|
|
4.2
|
|
||||||||
|
Payments
|
(49.3
|
)
|
(6.0
|
)
|
(41.3
|
)
|
(2.0
|
)
|
||||||||
|
Changes in estimates
|
(8.6
|
)
|
(1.3
|
)
|
(7.8
|
)
|
0.5
|
|
||||||||
|
Translation adjustments
|
7.9
|
|
—
|
|
7.7
|
|
0.2
|
|
||||||||
|
Balance at December 31, 2017
|
$
|
117.8
|
|
$
|
3.9
|
|
$
|
109.6
|
|
$
|
4.3
|
|
||||
|
Expected future payments on balance at December 31, 2017
|
||||||||||||||||
|
In 2018
|
$
|
87.7
|
|
$
|
3.9
|
|
$
|
82.0
|
|
$
|
1.8
|
|
||||
|
Beyond 2018
|
30.1
|
|
—
|
|
27.6
|
|
2.5
|
|
||||||||
During the fourth quarter of
2017
, the company performed its annual impairment test of goodwill for all of our reporting units. The fair values of each of the reporting units exceeded their carrying values; therefore,
no
goodwill impairment was required.
At December 31,
2017
, the amount of goodwill allocated to reporting units with negative net assets was as follows: Business Process Outsourcing Services,
$10.8
.
Changes in the carrying amount of goodwill by segment for the years ended
December 31, 2017
and
2016
were as follows:
|
Total
|
|
Services
|
|
Technology
|
|
|||||||
|
Balance at December 31, 2015
|
$
|
177.4
|
|
$
|
68.7
|
|
$
|
108.7
|
|
|||
|
Translation adjustments
|
1.2
|
|
1.2
|
|
—
|
|
||||||
|
Balance at December 31, 2016
|
178.6
|
|
69.9
|
|
108.7
|
|
||||||
|
Translation adjustments
|
2.2
|
|
2.2
|
|
—
|
|
||||||
|
Balance at December 31, 2017
|
$
|
180.8
|
|
$
|
72.1
|
|
$
|
108.7
|
|
|||
Accounting Pronouncements Adopted
Effective January 1, 2017, the company adopted Accounting Standards Update (“ASU”) No. 2017-04
Intangibles - Goodwill and Other (Topic 350): Simplifying the Test for Goodwill Impairment
issued by the Financial Accounting Standards Board (“FASB”) which simplifies how an entity is required to test goodwill for impairment by eliminating Step 2 from the goodwill impairment test. Step 2 measures a goodwill impairment loss by comparing the implied fair value of a reporting unit’s goodwill with the carrying amount of that goodwill. Under the amended guidance, an entity will perform its annual or interim goodwill impairment test by comparing the fair value of a reporting unit with its carrying amount. An impairment charge will be recognized for the amount by which the carrying amount exceeds the reporting unit’s fair value. Adoption of this new guidance had no impact on the company’s consolidated results of operations and financial position.
Effective January 1, 2017, the company adopted ASU No. 2016-18
Statement of Cash Flows (Topic 230) - Restricted Cash
issued by the FASB which requires companies to include amounts generally described as restricted cash or restricted cash equivalents with cash and cash equivalents when reconciling the beginning-of-period and end-of-period total amounts shown on the statement of cash flows. The new guidance has been applied on retrospective basis whereby prior-period financial
47
statements have been adjusted to reflect the application of the new guidance, as required by the FASB. Amounts reclassified in the consolidated statements of cash flows for the years ended December 31, 2016 and 2015 are as follows:
|
Year ended December 31,
|
2016
|
|
2015
|
|
||||
|
Cash flows from operating activities
|
||||||||
|
Other assets
|
$
|
(1.9
|
)
|
2.60
|
|
$
|
2.6
|
|
|
Cash flows from investing activities
|
||||||||
|
Other
|
1.6
|
|
(2.3
|
)
|
||||
|
Effect of exchange rate changes on cash, cash equivalents and restricted cash
|
(0.8
|
)
|
(4.6
|
)
|
||||
|
Cash, cash equivalents and restricted cash, beginning of year
|
31.6
|
|
35.9
|
|
||||
|
Cash, cash equivalents and restricted cash, end of year
|
30.5
|
|
31.6
|
|
||||
Effective January 1, 2017, the company adopted ASU No. 2016-16
Income Taxes (Topic 740): Intra-Entity Transfers of Assets Other Than Inventory
issued by the FASB which allows the recognition of deferred income taxes for an intra-entity asset transfer, other than inventory, when the transfer occurs. Historically, recognition of the income tax consequence was not recognized until the asset was sold to an outside party. The new guidance has been applied on a modified retrospective basis through a cumulative-effect adjustment directly to accumulated deficit. At January 1, 2017, the adjustment to accumulated deficit was an increase of
$4.4 million
.
Effective January 1, 2017, the company adopted ASU No. 2016-15
Statement of Cash Flows (Topic 230): Classification of Certain Cash Receipts and Cash Payments (a consensus of the Emerging Issues Task Force)
, issued by the FASB which clarifies the treatment of several cash flow categories. In addition, the guidance also clarifies that when cash receipts and cash payments have aspects of more than one class of cash flows and cannot be separated, classification will depend on the predominant source or use. The company previously reported premium payments on and proceeds from the settlement of corporate-owned life insurance policies as cash flows from operating activities in the company’s consolidated statement of cash flows. Under the new guidance, these amounts were reclassified to investing activities. The new guidance has been applied on a retrospective basis whereby prior-period financial statements have been adjusted to reflect the application of the new guidance, as required by the FASB. For the years ended December 31, 2016 and 2015,
$1.5 million
and
$1.1 million
, respectively, were reclassified from “other assets” in operating activities to “other” in investing activities in the company’s consolidated statements of cash flows.
Effective January 1, 2017, the company adopted ASU No. 2016-09
Compensation—Stock Compensation (Topic 718): Improvements to Employee Share-Based Payment Accounting
, issued by the FASB, which changes certain aspects of accounting for share-based payments to employees. The new guidance requires all income tax effects of awards to be recognized in the income statement when the awards vest or are settled. It also allows an employer to repurchase more of an employee’s shares than it can today for tax withholding purposes without triggering liability accounting and to make a policy election to account for forfeitures as they occur. Additionally, the standard requires all tax-related cash flows resulting from share-based payments to be reported as operating activities on the consolidated statement of cash flows, and any cash payments made to taxing authorities on an employee’s behalf as financing activities, which the company previously reported as operating activities. The new guidance has been applied on a retrospective basis whereby prior-period financial statements have been adjusted to reflect the application of the new guidance, as required by the FASB. For the years ended December 31, 2016 and 2015,
$0.4 million
and
$0.8 million
, respectively, were reclassified from “accounts payable and other accrued liabilities” in operating activities to “other” in financing activities in the company’s consolidated statements of cash flows.
Accounting Pronouncements Not Yet Adopted
In March 2017, the FASB issued ASU No. 2017-07
Compensation—Retirement Benefits (Topic 715): Improving the Presentation of Net Periodic Pension Cost and Net Periodic Postretirement Benefit Cost
, which requires employers to present the service cost component of net periodic benefit cost in the same income statement line item(s) as other employee compensation costs arising from services rendered during the period. Only the service cost component will be eligible for capitalization in assets. The other components of net periodic benefit cost will be presented separately from the line items that include service cost and outside the subtotal of operating income. This update is effective for annual periods beginning after December 15, 2017, which for the company is January 1, 2018. Adoption of this new guidance will result in the reclassification of net periodic benefit cost, other than service costs (
$92.5 million
and
$81.6 million
for the years ended December 31, 2017 and 2016, respectively), from operating income to non-operating income. There will be no overall impact on the company’s consolidated financial position.
In June 2016, the FASB issued ASU No. 2016-13
Financial Instruments—Credit Losses (Topic 326): Measurement of Credit Losses on Financial Instruments
, which introduces a new model for recognizing credit losses on financial instruments based on an estimate of current expected losses. This includes trade and other receivables, loans and other financial instruments. This
48
update is effective for annual periods beginning after December 15, 2019, with earlier adoption permitted. The company is currently assessing when it will choose to adopt, and is currently evaluating the impact of the adoption on its consolidated financial statements.
In February 2016, the FASB issued ASU No. 2016-02
Leases (Topic 842)
, which is intended to improve financial reporting about leasing transactions. The ASU requires organizations that lease assets, referred to as lessees, to recognize on the balance sheet the assets and liabilities for the rights and obligations created by those leases. The standard requires disclosures to help investors and other financial statement users better understand the amount, timing and uncertainty of cash flows arising from leases. The standard is effective for annual reporting periods beginning after December 15, 2018, with earlier adoption permitted. The company will adopt the new guidance on January 1, 2019, and is currently evaluating the impact of the adoption on its consolidated results of operations and financial position.
In May 2014, the FASB issued ASU No. 2014-09
Revenue from Contracts with Customers (Topic 606)
, which establishes principles that an entity shall apply to report useful information to users of financial statements about the nature, amount, timing and uncertainty of revenue and cash flows from a contract with a customer. The standard, and its various amendments, is effective for annual reporting periods beginning after December 15, 2017, which for the company is January 1, 2018. The standard allows for either “full retrospective” adoption, meaning the standard is applied to all periods presented, or “modified retrospective” adoption, meaning the standard is applied only to the most current period presented in the financial statements. The new standard would require the company to recognize revenue for certain transactions, including extended payment term software licenses and short-term software licenses, sooner than the current rules would allow and require the company to recognize software license extensions and renewals (the most significant impact upon adoption), later than the current rules would allow. The standard also requires significantly expanded disclosure requirements. The company will adopt the standard on January 1, 2018 using the modified retrospective method. The company does not believe there will be a material impact to its consolidated financial position upon adoption.
Accounts receivable consist principally of trade accounts receivable from customers and are generally unsecured and due within 30 to 90 days. Credit losses relating to these receivables consistently have been within management’s expectations. Expected credit losses are recorded as an allowance for doubtful accounts in the consolidated balance sheets. Estimates of expected credit losses are based primarily on the aging of the accounts receivable balances. The company records a specific reserve for individual accounts when it becomes aware of a customer’s inability to meet its financial obligations, such as in the case of bankruptcy filings or deterioration in the customer’s operating results or financial position. The collection policies and procedures of the company vary by credit class and prior payment history of customers.
Revenue recognized in excess of billings on services contracts, or unbilled accounts receivable, was
$109.4 million
and
$98.0 million
at
December 31, 2017
and
2016
, respectively.
As of
December 31, 2017
, receivables under sales-type leases before the allowance for unearned income were collectible as follows:
|
Year
|
|||
|
2018
|
$
|
45.5
|
|
|
2019
|
25.8
|
|
|
|
2020
|
16.3
|
|
|
|
2021
|
10.8
|
|
|
|
2022
|
9.7
|
|
|
|
Thereafter
|
19.1
|
|
|
|
Total
|
$
|
127.2
|
|
Unearned income, which is deducted from accounts receivable, was
$12.5 million
and
$7.0 million
at
December 31, 2017
and
2016
, respectively. The allowance for doubtful accounts, which is reported as a deduction from accounts receivable, was
$22.0 million
and
$22.8 million
at
December 31, 2017
and
2016
, respectively. The provision for doubtful accounts, which is reported in selling, general and administrative expenses in the consolidated statements of income, was expense of
$3.1 million
,
$2.2 million
and
$3.0 million
, in
2017
,
2016
and
2015
, respectively.
49
Following is the total income (loss) before income taxes and the provision for income taxes for the three years ended December 31,
2017
.
|
Year ended December 31,
|
2017
|
|
2016
|
|
2015
|
|
||||||
|
Income (loss) before income taxes
|
||||||||||||
|
United States
|
$
|
(152.7
|
)
|
$
|
(88.3
|
)
|
$
|
(130.6
|
)
|
|||
|
Foreign
|
80.6
|
|
108.8
|
|
71.8
|
|
||||||
|
Total income (loss) before income taxes
|
$
|
(72.1
|
)
|
$
|
20.5
|
|
$
|
(58.8
|
)
|
|||
|
Provision for income taxes
|
||||||||||||
|
Current
|
||||||||||||
|
United States
|
$
|
(42.8
|
)
|
$
|
6.7
|
|
$
|
1.0
|
|
|||
|
Foreign
|
33.9
|
|
47.7
|
|
42.2
|
|
||||||
|
State and local
|
—
|
|
—
|
|
0.3
|
|
||||||
|
Total
|
(8.9
|
)
|
54.4
|
|
43.5
|
|
||||||
|
Deferred
|
||||||||||||
|
Foreign
|
3.4
|
|
2.8
|
|
0.9
|
|
||||||
|
Total (benefit) provision for income taxes
|
$
|
(5.5
|
)
|
$
|
57.2
|
|
$
|
44.4
|
|
|||
Following is a reconciliation of the (benefit) provision for income taxes at the United States statutory tax rate to the provision for income taxes as reported:
|
Year ended December 31,
|
2017
|
|
2016
|
|
2015
|
|
||||||
|
United States statutory income tax provision (benefit)
|
$
|
(25.2
|
)
|
$
|
7.2
|
|
$
|
(20.6
|
)
|
|||
|
Income and losses for which no provision or benefit has been recognized
|
70.3
|
|
65.5
|
|
69.1
|
|
||||||
|
Foreign rate differential and other foreign tax expense
|
(11.3
|
)
|
(21.1
|
)
|
(15.9
|
)
|
||||||
|
Income tax withholdings
|
16.8
|
|
22.8
|
|
12.5
|
|
||||||
|
Permanent items
|
(3.0
|
)
|
(4.7
|
)
|
(1.9
|
)
|
||||||
|
Enacted rate changes
|
(0.4
|
)
|
3.5
|
|
9.1
|
|
||||||
|
Change in uncertain tax positions
|
2.3
|
|
0.4
|
|
1.5
|
|
||||||
|
Change in valuation allowances due to changes in judgment
|
(4.6
|
)
|
(16.4
|
)
|
(5.4
|
)
|
||||||
|
Income tax credits, U.S.
|
(50.4
|
)
|
—
|
|
(4.0
|
)
|
||||||
|
(Benefit) provision for income taxes
|
$
|
(5.5
|
)
|
$
|
57.2
|
|
$
|
44.4
|
|
|||
The TCJA was enacted by the U.S. on December 22, 2017. The TCJA eliminates the corporate Alternative Minimum Tax (“AMT”) beginning in 2018, and also provides for refunds of all remaining AMT credits. Consequently, the company recorded a benefit of
$50.4 million
in 2017. Of this total,
$9.1 million
was received in 2017, and approximately
$7.2 million
will be received in 2018 under Internal Revenue Code section 168(k)(4) of the prior tax law. The remainder,
$34.1 million
, will be refundable under the TCJA between 2019 and 2022.
The 2016 and 2015 provision for income taxes included
$3.5 million
and
$9.1 million
due to a reduction in the UK income tax rate. The rate reductions were enacted in the third quarter of 2016 and the fourth quarter of 2015 and reduced the rate from
18%
to
17%
and from
20%
to
18%
effective April 1, 2020 and 2017, respectively.
50
The tax effects of temporary differences and carryforwards that give rise to significant portions of deferred tax assets and liabilities at
December 31, 2017
and
2016
were as follows:
|
As of December 31,
|
2017
|
|
2016
|
|
||||
|
Deferred tax assets
|
||||||||
|
Tax loss carryforwards
|
$
|
837.6
|
|
$
|
889.6
|
|
||
|
Postretirement benefits
|
437.7
|
|
728.9
|
|
||||
|
Foreign tax credit carryforwards
|
127.0
|
|
317.6
|
|
||||
|
Other tax credit carryforwards
|
29.1
|
|
91.4
|
|
||||
|
Deferred revenue
|
40.9
|
|
81.0
|
|
||||
|
Employee benefits and compensation
|
35.2
|
|
49.1
|
|
||||
|
Purchased capitalized software
|
22.2
|
|
32.6
|
|
||||
|
Depreciation
|
24.5
|
|
28.3
|
|
||||
|
Warranty, bad debts and other reserves
|
5.3
|
|
16.1
|
|
||||
|
Capitalized costs
|
3.1
|
|
10.9
|
|
||||
|
Other
|
39.3
|
|
27.7
|
|
||||
|
1,601.9
|
|
2,273.2
|
|
|||||
|
Valuation allowance
|
(1,441.1
|
)
|
(2,084.6
|
)
|
||||
|
Total deferred tax assets
|
$
|
160.8
|
|
$
|
188.6
|
|
||
|
Deferred tax liabilities
|
||||||||
|
Capitalized research and development
|
$
|
24.3
|
|
$
|
20.3
|
|
||
|
Other
|
25.8
|
|
28.4
|
|
||||
|
Total deferred tax liabilities
|
$
|
50.1
|
|
$
|
48.7
|
|
||
|
Net deferred tax assets
|
$
|
110.7
|
|
$
|
139.9
|
|
||
The TCJA reduced the U.S. federal tax rate from 35% to 21% effective in 2018. This rate decrease resulted in a remeasurement of U.S. deferred tax balances in 2017, with no net financial statement impact due to the valuation allowance recorded against all U.S. deferred tax assets.
At
December 31, 2017
, the company has tax effected U.S. Federal (
$319.5 million
), state and local (
$250.7 million
), and foreign (
$267.4 million
) tax loss carryforwards, the total of which is
$837.6 million
. These carryforwards will expire as follows:
2018
,
$5.3
;
2019
,
$7.3
;
2020
,
$28.5
;
2021
,
$14.5
;
2022
,
$114.0
; and
$668.0
thereafter. The company also has available tax credit carryforwards of
$127.0 million
, which will expire as follows:
2018
,
$10.1
;
2019
,
$10.2
;
2020
,
$20.9
;
2021
,
$8.7
;
2022
,
$7.7
; and
$69.4
thereafter.
Failure to achieve forecasted taxable income might affect the ultimate realization of the company’s net deferred tax assets. Factors that may affect the company’s ability to achieve sufficient forecasted taxable income include, but are not limited to, the following: increased competition, a decline in sales or margins, loss of market share, the impact of the economic environment, delays in product availability and technological obsolescence.
Under U.S. tax law effective through December 31, 2017, undistributed earnings of foreign subsidiaries were generally taxable upon repatriation to the U.S. shareholder. Under the TCJA, effective January 1, 2018, distributions from foreign subsidiaries to U.S. shareholders are generally exempt from taxation. As a part of the transition to this new participation exemption system of taxation, the TCJA requires a transition tax to be paid on the net accumulated post-1986 undistributed earnings of foreign subsidiaries. The company has determined that, due to accumulated deficits of foreign subsidiaries offsetting the accumulated earnings of foreign subsidiaries, the company will not incur a transition tax.
With this change in U.S. taxation of earnings of foreign subsidiaries under the TCJA, future distributions of earnings from foreign subsidiaries will generally be exempt from U.S. taxation. Consequently, the deferred income tax liability on undistributed earnings is generally limited to any foreign withholding or other foreign taxes that will be imposed on such distributions. As the company currently intends to indefinitely reinvest the earnings of certain foreign subsidiaries, no provision has been made for income taxes that may become payable upon distribution of the earnings of such subsidiaries. The unrecognized deferred income tax liability at December 31, 2017 approximated
$21.5 million
.
While subsequent to 2017, the U.S. will not generally tax distributions from foreign subsidiaries, the TCJA introduced a tax on GILTI. Beginning in 2018, U.S. taxable income will include GILTI, which essentially includes net foreign subsidiaries’ earnings above a routine 10% return on their aggregate specified tangible assets. The company has made an accounting policy election to treat the GILTI as a period cost when included in U.S. taxable income, and consequently GILTI has no impact on the 2017 financial statements.
51
Cash paid for income taxes, net of refunds, during
2017
,
2016
and
2015
was
$34.3 million
,
$46.4 million
and
$59.7 million
, respectively.
A reconciliation of the beginning and ending amount of unrecognized tax benefits is as follows:
|
Year ended December 31,
|
2017
|
|
2016
|
|
2015
|
|
||||||
|
Balance at January 1
|
$
|
35.8
|
|
$
|
27.7
|
|
$
|
35.0
|
|
|||
|
Additions based on tax positions related to the current year
|
4.2
|
|
2.7
|
|
3.4
|
|
||||||
|
Changes for tax positions of prior years
|
(11.2
|
)
|
12.0
|
|
(4.0
|
)
|
||||||
|
Reductions as a result of a lapse of applicable statute of limitations
|
(2.7
|
)
|
(2.8
|
)
|
(3.4
|
)
|
||||||
|
Settlements
|
(0.2
|
)
|
(0.1
|
)
|
(0.9
|
)
|
||||||
|
Changes due to foreign currency
|
2.0
|
|
(3.7
|
)
|
(2.4
|
)
|
||||||
|
Balance at December 31
|
$
|
27.9
|
|
$
|
35.8
|
|
$
|
27.7
|
|
|||
The company recognizes penalties and interest accrued related to income tax liabilities in the provision for income taxes in its consolidated statements of income. At December 31,
2017
and
2016
, the company had an accrual of
$2.3 million
and
$1.2 million
, respectively, for the payment of penalties and interest.
At December 31,
2017
, all of the company’s liability for unrecognized tax benefits, if recognized, would affect the company’s effective tax rate. Within the next
12 months
, the company believes that it is reasonably possible that the amount of unrecognized tax benefits may significantly change; however, various events could cause this belief to change in the future.
The company and its subsidiaries file income tax returns in the U.S. federal jurisdiction, and various states and foreign jurisdictions. Several U.S. state and foreign income tax audits are in process. The company is under an audit in India, for which years prior to
2006
are closed. For the most significant jurisdictions outside the U.S., the audit periods through 2012 are closed for Brazil, and the audit periods through 2013 are closed for the United Kingdom. All of the various ongoing income tax audits throughout the world are not expected to have a material impact on the company’s financial position.
Internal Revenue Code Sections 382 and 383 provide annual limitations with respect to the ability of a corporation to utilize its net operating loss (as well as certain built-in losses) and tax credit carryforwards, respectively (“Tax Attributes”), against future U.S. taxable income, if the corporation experiences an “ownership change.” In general terms, an ownership change may result from transactions increasing the ownership of certain stockholders in the stock of a corporation by more than
50
percentage points over a three-year period. The company regularly monitors ownership changes (as calculated for purposes of Section 382). The company has determined that, for purposes of the rules of Section 382 described above, an ownership change occurred in February 2011. Any future transaction or transactions and the timing of such transaction or transactions could trigger additional ownership changes under Section 382.
As a result of the February 2011 ownership change, utilization for certain of the company’s Tax Attributes, U.S. net operating losses and tax credits, is subject to an overall annual limitation of
$70.6 million
. The cumulative limitation as of December 31,
2017
is approximately
$416.0 million
. This limitation will be applied first to any recognized built in losses, then to any net operating losses, and then to any other Tax Attributes. Any unused limitation may be carried over to later years. Based on presently available information and the existence of tax planning strategies, the company does not expect to incur a U.S. cash tax liability in the near term. The company maintains a full valuation allowance against the realization of all U.S. deferred tax assets as well as certain foreign deferred tax assets in excess of deferred tax liabilities.
Properties comprise the following:
|
As of December 31,
|
2017
|
|
2016
|
|
||||
|
Land
|
$
|
2.8
|
|
$
|
2.7
|
|
||
|
Buildings
|
91.3
|
|
88.2
|
|
||||
|
Machinery and office equipment
|
601.7
|
|
591.7
|
|
||||
|
Internal-use software
|
157.4
|
|
145.9
|
|
||||
|
Rental equipment
|
45.6
|
|
58.1
|
|
||||
|
Total properties
|
$
|
898.8
|
|
$
|
886.6
|
|
||
52
Long-term debt is comprised of the following:
|
As of December 31,
|
2017
|
|
2016
|
|
||||
|
10.75% senior secured notes due April 15, 2022 ($440.0 million face value less unamortized discount and fees of $10.4 million at December 31, 2017)
|
$
|
429.6
|
|
$
|
—
|
|
||
|
5.50% convertible senior notes due March 1, 2021 ($213.5 million face value less unamortized discount and fees of $27.2 million and $34.4 million at December 31, 2017 and 2016, respectively)
|
186.3
|
|
179.1
|
|
||||
|
6.25% senior notes
|
—
|
|
94.7
|
|
||||
|
Capital leases
|
7.5
|
|
10.1
|
|
||||
|
Other debt
|
21.3
|
|
16.1
|
|
||||
|
Total
|
644.7
|
|
300.0
|
|
||||
|
Less – current maturities
|
10.8
|
|
106.0
|
|
||||
|
Total long-term debt
|
$
|
633.9
|
|
$
|
194.0
|
|
||
Long-term debt is carried at amortized cost and its estimated fair value is based on market prices classified as Level 2 in the fair value hierarchy. Presented below are the estimated fair values of long-term debt as of December 31,
2017
and
2016
.
|
As of December 31,
|
2017
|
|
2016
|
|
|||
|
10.75% senior secured notes due April 15, 2022
(a)
|
$
|
492.8
|
|
$
|
—
|
|
|
|
5.50% convertible senior notes due March 1, 2021
|
237.9
|
|
379.8
|
|
|||
|
6.25% senior notes
(b)
|
—
|
|
97.8
|
|
|||
(a)
Issued in April 2017
(b)
Retired in April 2017
Maturities of long-term debt, including capital leases, in each of the next five years and thereafter are as follows:
|
Year
|
Total
|
|
Long-Term Debt
|
|
Capital Leases
|
|
|||||
|
2018
|
$
|
10.8
|
|
$
|
8.2
|
|
$
|
2.6
|
|
||
|
2019
|
1.4
|
|
—
|
|
1.4
|
|
|||||
|
2020
|
2.3
|
|
0.9
|
|
1.4
|
|
|||||
|
2021
|
189.5
|
|
188.1
|
|
1.4
|
|
|||||
|
2022
|
432.3
|
|
431.5
|
|
0.8
|
|
|||||
|
Thereafter
|
8.4
|
|
8.4
|
|
—
|
|
|||||
|
Total
|
$
|
644.7
|
|
$
|
637.1
|
|
$
|
7.6
|
|
||
Cash paid for interest during
2017
,
2016
and
2015
was
$39.9 million
,
$22.1 million
and
$14.4 million
, respectively. Capitalized interest expense during
2017
,
2016
and
2015
was
$4.2 million
,
$3.0 million
and
$3.1 million
, respectively.
On April 17, 2017, the company issued
$440.0 million
aggregate principal amount of
10.75%
Senior Secured Notes due 2022 (the “Notes”). The Notes are initially fully and unconditionally guaranteed on a senior secured basis by Unisys Holding Corporation, Unisys AP Investment Company I and Unisys NPL, Inc. (together with the Company, the “Grantors”). In the future, the Notes will be guaranteed by each material domestic subsidiary and each restricted subsidiary that guarantees the secured revolving credit facility and other indebtedness of the company or another subsidiary guarantor. The Notes and the guarantees will rank equally in right of payment with all of the existing and future senior debt of the company and the subsidiary guarantors. The Notes and the guarantees will be structurally subordinated to all existing and future liabilities (including preferred stock, trade payables and pension liabilities) of the company’s subsidiaries that are not subsidiary guarantors.
The Notes pay interest semiannually on April 15 and October 15, commencing on October 15, 2017, at an annual rate of
10.75%
, and will mature on April 15, 2022, unless earlier repurchased or redeemed.
The company may, at its option, redeem some or all of the Notes at any time on or after April 15, 2020 at a redemption price determined in accordance with the redemption schedule set forth in the indenture governing the Notes (the “indenture”), plus accrued and unpaid interest, if any.
53
Prior to April 15, 2020, the company may, at its option, redeem some or all of the Notes at any time, at a price equal to
100%
of the principal amount of the Notes redeemed plus a “make-whole” premium, plus accrued and unpaid interest, if any. The company may also redeem, at its option, up to
35%
of the Notes at any time prior to April 15, 2020, using the proceeds of certain equity offerings at a redemption price of
110.75%
of the principal amount thereof, plus accrued and unpaid interest, if any. In addition, the company may redeem all (but not less than all) of the Notes at any time that the Collateral Coverage Ratio is less than the Required Collateral Coverage Ratio (as such terms are described below and further defined in the indenture) at a price equal to
100%
of the principal amount of the Notes plus accrued and unpaid interest, if any.
The indenture contains covenants that limit the ability of the company and its restricted subsidiaries to, among other things: (i) incur additional indebtedness and guarantee indebtedness; (ii) pay dividends or make other distributions or repurchase or redeem its capital stock; (iii) prepay, redeem or repurchase certain debt; (iv) make certain prepayments in respect of pension obligations; (v) issue certain preferred stock or similar equity securities; (vi) make loans and investments (including investments by the company and subsidiary guarantors in subsidiaries that are not guarantors); (vii) sell assets; (viii) create or incur liens; (ix) enter into transactions with affiliates; (x) enter into agreements restricting its subsidiaries’ ability to pay dividends; and (xi) consolidate, merge or sell all or substantially all of its assets. These covenants are subject to several important limitations and exceptions.
The indenture also includes a covenant requiring that the company maintain a Collateral Coverage Ratio of not less than
1.50
:
1.00
(the “Required Collateral Coverage Ratio”) as of any test date. The Collateral Coverage Ratio is based on the ratio of (A) Grantor unrestricted cash and cash equivalents plus
4.75
multiplied by of the greater of (x) Grantor EBITDA for the most recently ended four fiscal quarters and (y) (i) the average quarterly Grantor EBITDA for the most recently ended seven fiscal quarters, multiplied by (ii)
four
, to (B) secured indebtedness of the Grantors. The Collateral Coverage Ratio is tested quarterly. If the Collateral Coverage Ratio is less than the Required Collateral Coverage Ratio as of any test date, and the company has not redeemed the Notes within
90
days thereafter, this will be an event of default under the indenture.
If the company experiences certain kinds of changes of control, it must offer to purchase the Notes at
101%
of the principal amount of the Notes, plus accrued and unpaid interest, if any. In addition, if the company sells assets under certain circumstances it must apply the proceeds towards an offer to repurchase the Notes at a price equal to par plus accrued and unpaid interest, if any.
The indenture also provides for events of default, which, if any of them occurs, would permit or require the principal, premium, if any, interest and any other monetary obligations on all the then outstanding Notes to be due and payable immediately.
On May 8, 2017, the company redeemed all of its then outstanding
6.25%
senior notes due 2017. As a result of this redemption, the company recognized a charge of
$1.5 million
in “Other income (expense), net” in the second quarter of 2017, which is comprised of
$1.3 million
of premium and expenses paid and
$0.2 million
for the write-off of unamortized discount and fees related to the portion of the notes redeemed.
In 2016, the company issued
$213.5 million
aggregate principal amount of Convertible Senior Notes due 2021 (the “2021 Notes”). The 2021 Notes, which are senior unsecured obligations, bear interest at a coupon rate of
5.50%
(or
9.5%
effective interest rate) per year until maturity, payable semiannually in arrears on March 1 and September 1 of each year, beginning on September 1, 2016. The 2021 Notes are not redeemable prior to maturity and are convertible into shares of the company’s common stock. The conversion rate for the 2021 Notes is
102.4249
shares of the company’s common stock per
$1,000
principal amount of the 2021 Notes (or a total amount of
21,867,716
shares), which is equivalent to an initial conversion price of approximately
$9.76
per share of the company’s common stock. Upon any conversion, the company will settle its conversion obligation in cash, shares of its common stock, or a combination of cash and shares of its common stock, at its election.
In connection with the issuance of the 2021 Notes, the company also paid
$27.3 million
to enter into privately negotiated capped call transactions with the initial purchasers and/or affiliates of the initial purchasers. The capped call transactions will cover, subject to customary anti-dilution adjustments, the number of shares of the company’s common stock that will initially underlie the 2021 Notes. The capped call transactions will effectively raise the conversion premium on the 2021 Notes from approximately
22.5%
to approximately
60%
, which raises the initial conversion price from approximately
$9.76
per share of common stock to approximately
$12.75
per share of common stock. The capped call transactions are expected to reduce potential dilution to the company’s common stock and/or offset potential cash payments the company is required to make in excess of the principal amount upon any conversion of the 2021 Notes.
54
Interest expense related to the 2021 Notes
(a)
is comprised of the following:
|
Year ended December 31,
|
2017
|
|
2016
|
|
|||
|
Contractual interest coupon
|
$
|
11.8
|
|
$
|
9.2
|
|
|
|
Amortization of debt discount
|
6.0
|
|
4.3
|
|
|||
|
Amortization of debt issuance costs
|
1.2
|
|
1.0
|
|
|||
|
Total
|
$
|
19.0
|
|
$
|
14.5
|
|
|
(a)
Issued in 2016
The company has a secured revolving credit facility (the “Credit Agreement”) that provides for loans and letters of credit up to an aggregate amount of
$125.0 million
(with a limit on letters of credit of
$30.0 million
). The Credit Agreement includes an accordion feature allowing for an increase in the amount of the facility up to
$150.0 million
. Availability under the credit facility is subject to a borrowing base calculated by reference to the company’s receivables. At December 31,
2017
, the company had
no
borrowings and
$4.7 million
of letters of credit outstanding, and availability under the facility was
$110.5 million
net of letters of credit issued. The Credit Agreement expires October 5, 2022, subject to a springing maturity (i) on the date that is
91
days prior to the maturity date of the 2021 Notes unless, on such date, certain conditions are met; or (ii) on the date that is
60
days prior to the maturity date of the Notes unless, by such date, such secured notes have not been redeemed or refinanced.
The credit facility is guaranteed by Unisys Holding Corporation, Unisys NPL, Inc., Unisys AP Investment Company I and any future material domestic subsidiaries. The facility is secured by the assets of the company and the subsidiary guarantors, other than certain excluded assets, under a security agreement entered into by the company and the subsidiary guarantors in favor of JPMorgan Chase Bank, N.A., as agent for the lenders under the credit facility.
The company is required to maintain a minimum fixed charge coverage ratio if the availability under the credit facility falls below the greater of
10%
of the lenders’ commitments under the facility and
$15 million
.
The Credit Agreement contains customary representations and warranties, including that there has been no material adverse change in the company’s business, properties, operations or financial condition. The Credit Agreement includes limitations on the ability of the company and its subsidiaries to, among other things, incur other debt or liens, dispose of assets and make acquisitions, loans and investments, repurchase its equity, and prepay other debt. Events of default include non-payment, failure to comply with covenants, materially incorrect representations and warranties, change of control and default under other debt aggregating at least
$50.0 million
.
At December 31,
2017
, the company has met all covenants and conditions under its various lending agreements. The company expects to continue to meet these covenants and conditions.
The company’s principal sources of liquidity are cash on hand, cash from operations and its revolving credit facility, discussed above. The company and certain international subsidiaries have access to uncommitted lines of credit from various banks.
The company’s anticipated future cash expenditures include anticipated contributions to its defined benefit pension plans. The company believes that it has adequate sources of liquidity to meet its expected
2018
cash requirements.
Other accrued liabilities (current) are comprised of the following:
|
As of December 31,
|
2017
|
|
2016
|
|
||||
|
Payrolls and commissions
|
$
|
120.2
|
|
$
|
110.6
|
|
||
|
Cost reduction
|
87.7
|
|
21.2
|
|
||||
|
Accrued vacations
|
42.8
|
|
47.1
|
|
||||
|
Taxes other than income taxes
|
29.1
|
|
25.4
|
|
||||
|
Income taxes
|
26.0
|
|
35.3
|
|
||||
|
Postretirement
|
18.5
|
|
19.3
|
|
||||
|
Accrued interest
|
13.8
|
|
6.1
|
|
||||
|
Other
|
53.4
|
|
84.2
|
|
||||
|
Total other accrued liabilities
|
$
|
391.5
|
|
$
|
349.2
|
|
||
55
Rental expense and income from subleases for the three years ended December 31,
2017
were as follows:
|
Year ended December 31,
|
2017
|
|
2016
|
|
2015
|
|
|||||
|
Rental expense, less income from subleases
|
$
|
71.7
|
|
$
|
77.4
|
|
$
|
80.6
|
|
||
|
Income from subleases
|
$
|
4.4
|
|
$
|
7.8
|
|
$
|
9.1
|
|
||
Minimum net rental commitments under noncancelable operating leases, including idle leases, outstanding at December 31,
2017
, substantially all of which relate to real properties, were as follows:
|
Year
|
|||
|
2018
|
$
|
47.4
|
|
|
2019
|
41.3
|
|
|
|
2020
|
32.9
|
|
|
|
2021
|
21.5
|
|
|
|
2022
|
16.2
|
|
|
|
Thereafter
|
39.4
|
|
|
|
Total
|
$
|
198.7
|
|
Such rental commitments have been reduced by minimum sublease rentals of
$7.2 million
, due in the future under noncancelable subleases.
At December 31,
2017
, the company had outstanding standby letters of credit and surety bonds totaling approximately
$318 million
related to performance and payment guarantees. On the basis of experience with these arrangements, the company believes that any obligations that may arise will not be material. In addition, at December 31,
2017
, the company had deposits and collateral of approximately
$14 million
in other long-term assets, principally related to tax contingencies in Brazil.
Due to its foreign operations, the company is exposed to the effects of foreign currency exchange rate fluctuations on the U.S. dollar, principally related to intercompany account balances. The company uses derivative financial instruments to reduce its exposure to market risks from changes in foreign currency exchange rates on such balances. The company enters into foreign exchange forward contracts, generally having maturities of
three months
or less, which have not been designated as hedging instruments. At December 31,
2017
and
2016
, the notional amount of these contracts was
$514.0 million
and
$428.9 million
, respectively. The fair value of these forward contracts is based on quoted prices for similar but not identical financial instruments; as such, the inputs are considered Level 2 inputs.
The following table summarizes the fair value of the company’s foreign exchange forward contracts as of December 31,
2017
and
2016
.
|
As of December 31,
|
2017
|
|
2016
|
|
|||||
|
Balance Sheet Location
|
|||||||||
|
Prepaid expenses and other current assets
|
$
|
4.9
|
|
$
|
2.4
|
|
|||
|
Other accrued liabilities
|
1.6
|
|
1.9
|
|
|||||
|
Total fair value
|
$
|
3.3
|
|
0.5
|
|
$
|
0.5
|
|
|
The following table summarizes the location and amount of gains and losses recognized on foreign exchange forward contracts
for the three years ended December 31,
2017
.
|
Year Ended December 31,
|
2017
|
|
2016
|
|
2015
|
|
|||||
|
Statement of Income Location
|
|||||||||||
|
Other income (expense), net
|
$
|
27.5
|
|
$
|
(29.1
|
)
|
$
|
15.6
|
|
||
Financial instruments also include temporary cash investments and customer accounts receivable. Temporary investments are placed with creditworthy financial institutions, primarily in money market funds, time deposits and certificate of deposits which may be withdrawn at any time at the discretion of the company without penalty. At December 31,
2017
and
2016
, the company’s cash equivalents principally have maturities of less than one month or can be withdrawn at any time at the
56
discretion of the company without penalty. Due to the short maturities of these instruments, they are carried on the consolidated balance sheets at cost plus accrued interest, which approximates market value. Receivables are due from a large number of customers that are dispersed worldwide across many industries. At December 31,
2017
and
2016
, the company had no significant concentrations of credit risk with any one customer. At December 31,
2017
and
2016
, the company had
$75.8 million
and
$74.0 million
, respectively, of receivables due from various U.S. federal governmental agencies. At December 31,
2017
and
2016
, the carrying amount of cash and cash equivalents approximated fair value.
During the years ended December 31,
2017
,
2016
and
2015
, the company recognized foreign exchange gains (losses) in “Other income (expense), net” in its consolidated statements of income of
$(9.9) million
,
$2.3 million
and
$8.1 million
, respectively. The year ended December 31, 2017 also includes
$11.8 million
of net foreign currency losses related to exiting foreign countries in connection with the company’s restructuring plan.
There are various lawsuits, claims, investigations and proceedings that have been brought or asserted against the company, which arise in the ordinary course of business, including actions with respect to commercial and government contracts, labor and employment, employee benefits, environmental matters, intellectual property, and non-income tax matters. The company records a provision for these matters when it is both probable that a liability has been incurred and the amount of the loss can be reasonably estimated. Any provisions are reviewed at least quarterly and are adjusted to reflect the impact and status of settlements, rulings, advice of counsel and other information and events pertinent to a particular matter.
The company believes that it has valid defenses with respect to legal matters pending against it. Based on its experience, the company also believes that the damage amounts claimed in the lawsuits disclosed below are not a meaningful indicator of the company’s potential liability. Litigation is inherently unpredictable, however, and it is possible that the company’s results of operations or cash flows could be materially affected in any particular period by the resolution of one or more of the legal matters pending against it.
In April 2007, the Ministry of Justice of Belgium sued Unisys Belgium SA-NV, a Unisys subsidiary (“Unisys Belgium”), in the Court of First Instance of Brussels. The Belgian government had engaged the company to design and develop software for a computerized system to be used to manage the Belgian court system. The Belgian State terminated the contract and in its lawsuit has alleged that the termination was justified because Unisys Belgium failed to deliver satisfactory software in a timely manner. It claims damages of approximately
€28.0 million
. Unisys Belgium filed its defense and counterclaim in April 2008, in the amount of approximately
€18.5 million
. The company believes it has valid defenses to the claims and contends that the Belgian State’s termination of the contract was unjustified.
The company’s Brazilian operations, along with those of many other companies doing business in Brazil, are involved in various litigation matters, including numerous governmental assessments related to indirect and other taxes, as well as disputes associated with former employees and contract labor. The tax-related matters pertain to value added taxes, customs, duties, sales and other non-income related tax exposures. The labor-related matters include claims related to compensation. The company believes that appropriate accruals have been established for such matters based on information currently available. At
December 31, 2017
, excluding those matters that have been assessed by management as being remote as to the likelihood of ultimately resulting in a loss, the amount related to unreserved tax-related matters, inclusive of any related interest, is estimated to be up to approximately
$135.0 million
.
On June 26, 2014, the State of Louisiana filed a Petition for Damages against, among other defendants, the company and Molina Information Systems, LLC, in the Parish of East Baton Rouge, 19th Judicial District. The State alleged that between 1989 and 2012 the defendants, each acting successively as the State’s Medicaid fiscal intermediary, utilized an incorrect reimbursement formula for the payment of pharmaceutical claims causing the State to pay excessive amounts for prescription drugs. The State contends overpayments of approximately
$68.0 million
for the period January 2002 through July 2011 and is seeking data to identify the claims at issue for the remaining time period. The company believes that it has valid defenses to Louisiana’s claims and is asserting them in the pending litigation.
With respect to the specific legal proceedings and claims described above, except as otherwise noted, either (i) the amount or range of possible losses in excess of amounts accrued, if any, is not reasonably estimable or (ii) the company believes that the amount or range of possible losses in excess of amounts accrued that are estimable would not be material.
Litigation is inherently unpredictable and unfavorable resolutions could occur. Accordingly, it is possible that an adverse outcome from such matters could exceed the amounts accrued in an amount that could be material to the company’s financial condition, results of operations and cash flows in any particular reporting period.
Notwithstanding that the ultimate results of the lawsuits, claims, investigations and proceedings that have been brought or asserted against the company are not currently determinable, the company believes that at
December 31, 2017
, it has adequate provisions for any such matters.
57
The company has
two
business segments: Services and Technology. Revenue classifications within the Services and Technology segment are as follows:
|
•
|
Cloud and infrastructure services. This represents revenue from helping clients apply cloud and as-a-service delivery models to capitalize on business opportunities, make their end users more productive and manage and secure their IT infrastructure and operations more economically.
|
|
•
|
Application services. This represents revenue from helping clients transform their business processes by developing and managing new leading-edge applications for select industries, offering advanced data analytics and modernizing existing enterprise applications.
|
|
•
|
Business process outsourcing (“BPO”) services. This represents revenue from the management of critical processes and functions for clients in target industries, helping them improve performance and reduce costs.
|
|
•
|
Technology. This represents revenue from designing and developing software and offering hardware and other related products to help clients reduce costs, improve security and flexibility and improve the efficiency of their data-center environments.
|
The accounting policies of each business segment are the same as those followed by the company as a whole. Intersegment sales and transfers are priced as if the sales or transfers were to third parties. Accordingly, the Technology segment recognizes intersegment revenue and manufacturing profit on software and hardware shipments to customers under Services contracts. The Services segment, in turn, recognizes customer revenue and marketing profits on such shipments of company software and hardware to customers. The Services segment also includes the sale of software and hardware products sourced from third parties that are sold to customers through the company’s Services channels. In the company’s consolidated statements of income, the manufacturing costs of products sourced from the Technology segment and sold to Services customers are reported in cost of revenue for Services.
Also included in the Technology segment’s sales and operating profit are sales of software and hardware sold to the Services segment for internal use in Services engagements. The amount of such profit included in operating income of the Technology segment for the years ended December 31,
2017
,
2016
and
2015
was
$6.3 million
,
$0.7 million
and
$9.2 million
, respectively. The profit on these transactions is eliminated in Corporate.
The company evaluates business segment performance based on operating income exclusive of pension income or expense, restructuring charges and unusual and nonrecurring items, which are included in Corporate. All other corporate and centrally incurred costs are allocated to the business segments based principally on revenue, employees, square footage or usage.
No
single customer accounts for more than 10% of revenue. Revenue from various agencies of the U.S. Government, which is reported in both business segments, was approximately
$571 million
,
$564 million
and
$569 million
in
2017
,
2016
and
2015
, respectively.
Corporate assets are principally cash and cash equivalents, prepaid postretirement assets and deferred income taxes. The expense or income related to corporate assets is allocated to the business segments.
Customer revenue by classes of similar products or services, by segment, is presented below:
|
Year ended December 31,
|
2017
|
|
2016
|
|
2015
|
|
||||||
|
Services
|
||||||||||||
|
Cloud & infrastructure services
|
$
|
1,317.0
|
|
$
|
1,352.9
|
|
$
|
1,513.1
|
|
|||
|
Application services
|
808.3
|
|
859.0
|
|
868.9
|
|
||||||
|
BPO services
|
202.9
|
|
194.4
|
|
223.6
|
|
||||||
|
Total Services
|
2,328.2
|
|
2,406.3
|
|
2,605.6
|
|
||||||
|
Technology
|
413.6
|
|
414.4
|
|
409.5
|
|
||||||
|
Total customer revenue
|
$
|
2,741.8
|
|
$
|
2,820.7
|
|
$
|
3,015.1
|
|
|||
58
Presented below is a reconciliation of segment operating income to consolidated income (loss) before income taxes:
(a)
Year ended December 31, 2017 excludes
$11.8 million
for net foreign currency losses related to exiting foreign countries which are reported in Other income (expense), net in the consolidated statements of income.
|
Year ended December 31,
|
2017
|
|
2016
|
|
2015
|
|
||||||
|
Total segment operating income
|
$
|
235.4
|
|
$
|
208.4
|
|
$
|
174.9
|
|
|||
|
Interest expense
|
(52.8
|
)
|
(27.4
|
)
|
(11.9
|
)
|
||||||
|
Other income (expense), net
|
(23.9
|
)
|
0.3
|
|
8.2
|
|
||||||
|
Cost reduction charges
(a)
|
(135.0
|
)
|
(82.1
|
)
|
(118.5
|
)
|
||||||
|
Corporate and eliminations
|
(95.8
|
)
|
(78.7
|
)
|
(111.5
|
)
|
||||||
|
Total income (loss) before income taxes
|
$
|
(72.1
|
)
|
$
|
20.5
|
|
$
|
(58.8
|
)
|
|||
Presented below is a reconciliation of total business segment assets to consolidated assets:
|
As of December 31,
|
2017
|
|
2016
|
|
2015
|
|
||||||
|
Total segment assets
|
$
|
1,364.5
|
|
$
|
1,339.0
|
|
$
|
1,486.0
|
|
|||
|
Cash and cash equivalents
|
733.9
|
|
370.6
|
|
365.2
|
|
||||||
|
Deferred income taxes
|
119.9
|
|
146.1
|
|
127.4
|
|
||||||
|
Prepaid postretirement assets
|
148.3
|
|
33.3
|
|
45.1
|
|
||||||
|
Other corporate assets
|
175.8
|
|
132.6
|
|
106.3
|
|
||||||
|
Total assets
|
$
|
2,542.4
|
|
$
|
2,021.6
|
|
$
|
2,130.0
|
|
|||
A summary of the company’s operations by business segment for
2017
,
2016
and
2015
is presented below:
|
Total
|
|
Corporate
|
|
Services
|
|
Technology
|
|
|||||||||
|
2017
|
||||||||||||||||
|
Customer revenue
|
$
|
2,741.8
|
|
$
|
—
|
|
$
|
2,328.2
|
|
$
|
413.6
|
|
||||
|
Intersegment
|
—
|
|
(25.9
|
)
|
—
|
|
25.9
|
|
||||||||
|
Total revenue
|
$
|
2,741.8
|
|
$
|
(25.9
|
)
|
$
|
2,328.2
|
|
$
|
439.5
|
|
||||
|
Operating income (loss)
|
$
|
4.6
|
|
$
|
(230.8
|
)
|
$
|
64.8
|
|
$
|
170.6
|
|
||||
|
Depreciation and amortization
|
156.5
|
|
—
|
|
84.6
|
|
71.9
|
|
||||||||
|
Total assets
|
2,542.4
|
|
1,177.9
|
|
985.9
|
|
378.6
|
|
||||||||
|
Capital expenditures
|
176.5
|
|
4.3
|
|
102.7
|
|
69.5
|
|
||||||||
|
2016
|
||||||||||||||||
|
Customer revenue
|
$
|
2,820.7
|
|
$
|
—
|
|
$
|
2,406.3
|
|
$
|
414.4
|
|
||||
|
Intersegment
|
—
|
|
(22.6
|
)
|
—
|
|
22.6
|
|
||||||||
|
Total revenue
|
$
|
2,820.7
|
|
$
|
(22.6
|
)
|
$
|
2,406.3
|
|
$
|
437.0
|
|
||||
|
Operating income (loss)
|
$
|
47.6
|
|
$
|
(160.8
|
)
|
$
|
46.9
|
|
$
|
161.5
|
|
||||
|
Depreciation and amortization
|
155.6
|
|
—
|
|
81.8
|
|
73.8
|
|
||||||||
|
Total assets
|
2,021.6
|
|
682.6
|
|
963.3
|
|
375.7
|
|
||||||||
|
Capital expenditures
|
147.1
|
|
3.0
|
|
74.8
|
|
69.3
|
|
||||||||
|
2015
|
||||||||||||||||
|
Customer revenue
|
$
|
3,015.1
|
|
$
|
—
|
|
$
|
2,605.6
|
|
$
|
409.5
|
|
||||
|
Intersegment
|
—
|
|
(49.0
|
)
|
0.1
|
|
48.9
|
|
||||||||
|
Total revenue
|
$
|
3,015.1
|
|
$
|
(49.0
|
)
|
$
|
2,605.7
|
|
$
|
458.4
|
|
||||
|
Operating income (loss)
|
$
|
(55.1
|
)
|
$
|
(230.0
|
)
|
$
|
61.2
|
|
$
|
113.7
|
|
||||
|
Depreciation and amortization
|
180.1
|
|
—
|
|
104.8
|
|
75.3
|
|
||||||||
|
Total assets
|
2,130.0
|
|
644.0
|
|
1,081.7
|
|
404.3
|
|
||||||||
|
Capital expenditures
|
213.7
|
|
1.9
|
|
143.3
|
|
68.5
|
|
||||||||
59
Geographic information about the company’s revenue, which is principally based on location of the selling organization, properties and outsourcing assets, is presented below:
|
Year ended December 31,
|
2017
|
|
2016
|
|
2015
|
|
||||||
|
Revenue
|
||||||||||||
|
United States
|
$
|
1,257.0
|
|
$
|
1,309.3
|
|
$
|
1,454.9
|
|
|||
|
United Kingdom
|
315.8
|
|
348.0
|
|
375.8
|
|
||||||
|
Other foreign
|
1,169.0
|
|
1,163.4
|
|
1,184.4
|
|
||||||
|
Total Revenue
|
$
|
2,741.8
|
|
$
|
2,820.7
|
|
$
|
3,015.1
|
|
|||
|
Properties, net
|
||||||||||||
|
United States
|
$
|
85.8
|
|
$
|
91.4
|
|
$
|
96.9
|
|
|||
|
United Kingdom
|
16.7
|
|
15.1
|
|
18.8
|
|
||||||
|
Other foreign
|
40.0
|
|
38.8
|
|
38.1
|
|
||||||
|
Total Properties, net
|
$
|
142.5
|
|
$
|
145.3
|
|
$
|
153.8
|
|
|||
|
Outsourcing assets, net
|
||||||||||||
|
United States
|
$
|
81.1
|
|
$
|
105.1
|
|
$
|
119.4
|
|
|||
|
United Kingdom
|
89.9
|
|
39.0
|
|
36.6
|
|
||||||
|
Other foreign
|
31.3
|
|
28.4
|
|
26.0
|
|
||||||
|
Total Outsourcing assets, net
|
$
|
202.3
|
|
$
|
172.5
|
|
$
|
182.0
|
|
|||
Stock plans
Under stockholder approved stock-based plans, stock options, stock appreciation rights, restricted stock and restricted stock units may be granted to officers, directors and other key employees. At December 31,
2017
,
3.2 million
shares of unissued common stock of the company were available for granting under these plans.
As of December 31,
2017
, the company has granted non-qualified stock options and restricted stock units under these plans. The company recognizes compensation cost net of a forfeiture rate in selling, general and administrative expenses, and recognizes the compensation cost for only those awards expected to vest. The company estimates the forfeiture rate based on its historical experience and its expectations about future forfeitures.
The company’s employee stock option grants include a provision that, if termination of employment occurs after the participant has attained age
55
and completed
5
years of service with the company, the participant shall continue to vest in each of his or her awards in accordance with the vesting schedule set forth in the applicable award agreement. Compensation expense for such awards is recognized over the period to the date the employee first becomes eligible for retirement. Time-based restricted stock unit grants for the company’s directors vest upon award and compensation expense for such awards is recognized upon grant.
Options have been granted to purchase the company’s common stock at an exercise price equal to or greater than the fair market value at the date of grant, generally have a maximum duration of
seven
years for options issued in 2015 and later and
five
years for options issued before 2015, and become exercisable in annual installments over a
three
-year period following date of grant.
During the years ended December 31,
2017
,
2016
and
2015
, the company recognized
$11.2 million
,
$9.5 million
and
$9.4 million
of share-based compensation expense, which is comprised of
$10.1 million
,
$7.5 million
and
$4.7 million
of restricted stock unit expense and
$1.1 million
,
$2.0 million
and
$4.7 million
of stock option expense, respectively.
For stock options, the fair value is estimated at the date of grant using a Black-Scholes option pricing model. Principal assumptions used are as follows: (a) expected volatility for the company’s stock price is based on historical volatility and implied market volatility, (b) historical exercise data is used to estimate the options’ expected term, which represents the period of time that the options granted are expected to be outstanding, and (c) the risk-free interest rate is the rate on zero-coupon U.S. government issues with a remaining term equal to the expected life of the options. The company recognizes compensation expense for the fair value of stock options, which have graded vesting, on a straight-line basis over the requisite service period of the awards. The compensation expense recognized as of any date must be at least equal to the portion of the grant-date fair value that is vested at that date.
60
There were
no
grants of stock option awards for the year ended December 31,
2017
.
The fair value of stock option awards granted in
2016
and
2015
was estimated using the Black-Scholes option pricing model with the following assumptions and weighted-average fair values as follows:
|
Year Ended December 31,
|
2016
|
|
2015
|
|
||||
|
Weighted-average fair value of grant
|
$
|
4.53
|
|
$
|
8.92
|
|
||
|
Risk-free interest rate
|
1.29
|
%
|
1.28
|
%
|
||||
|
Expected volatility
|
51.30
|
%
|
45.46
|
%
|
||||
|
Expected life of options in years
|
4.90
|
|
4.92
|
|
||||
|
Expected dividend yield
|
—
|
|
—
|
|
||||
A summary of stock option activity for the year ended December 31,
2017
follows (shares in thousands):
|
Shares
|
Weighted- Average Exercise Price
|
Weighted- Average Remaining Contractual Term (years)
|
Aggregate Intrinsic Value ($ in millions)
|
||||||||||
|
Outstanding at December 31, 2016
|
2,099
|
|
$
|
25.41
|
|
||||||||
|
Granted
|
—
|
|
—
|
|
|||||||||
|
Exercised
|
(1
|
)
|
10.65
|
|
|||||||||
|
Forfeited and expired
|
(340
|
)
|
20.59
|
|
|||||||||
|
Outstanding at December 31, 2017
|
1,758
|
|
26.35
|
|
1.56
|
$
|
—
|
|
|||||
|
Expected to vest at December 31, 2017
|
198
|
|
23.20
|
|
3.42
|
$
|
—
|
|
|||||
|
Exercisable at December 31, 2017
|
1,558
|
|
26.76
|
|
1.33
|
$
|
—
|
|
|||||
The aggregate intrinsic value represents the total pretax value of the difference between the company’s closing stock price on the last trading day of the period and the exercise price of the options, multiplied by the number of in-the-money stock options that would have been received by the option holders had all option holders exercised their options on December 31,
2017
. The intrinsic value of the company’s stock options changes based on the closing price of the company’s stock. The total intrinsic value of options exercised for the year ended December 31,
2017
was immaterial, and for the years ended December 31,
2016
and
2015
was
zero
and
$0.6 million
, respectively. As of December 31,
2017
,
$0.1 million
of total unrecognized compensation cost related to stock options is expected to be recognized over a weighted-average period of
0.5
years.
Restricted stock unit awards may contain time-based units, performance-based units or a combination of both. Each performance-based unit will vest into
zero
to
2.0
shares depending on the degree to which the performance goals are met. Compensation expense resulting from these awards is recognized as expense ratably for each installment from the date of grant until the date the restrictions lapse and is based on the fair market value at the date of grant and the probability of achievement of the specific performance-related goals.
A summary of restricted stock unit activity for the year ended December 31,
2017
follows (shares in thousands):
|
Restricted Stock Units
|
Weighted-Average Grant-Date Fair Value
|
||||||
|
Outstanding at December 31, 2016
|
1,454
|
|
$
|
12.68
|
|
||
|
Granted
|
1,042
|
|
13.85
|
|
|||
|
Vested
|
(555
|
)
|
13.31
|
|
|||
|
Forfeited and expired
|
(253
|
)
|
11.88
|
|
|||
|
Outstanding at December 31, 2017
|
1,688
|
|
13.39
|
|
|||
The fair value of restricted stock units is determined based on the trading price of the company’s common shares on the date of grant. The aggregate weighted-average grant-date fair value of restricted stock units granted during the years ended December 31,
2017
,
2016
and
2015
was
$14.4 million
,
$12.9 million
and
$10.2 million
, respectively. As of December 31,
2017
, there was
$9.8 million
of total unrecognized compensation cost related to outstanding restricted stock units granted under the company’s plans. That cost is expected to be recognized over a weighted-average period of
1.9
years. The aggregate
61
weighted-average grant-date fair value of restricted stock units vested during the years ended December 31,
2017
,
2016
and
2015
was
$7.4 million
,
$3.5 million
and
$2.1 million
, respectively.
Common stock issued upon exercise of stock options or upon lapse of restrictions on restricted stock units are newly issued shares. Cash received from the exercise of stock options for the year ended December 31,
2017
was immaterial, and for the year ended December 31, 2016 was
zero
. During
2017
and
2016
, the company did not recognize any tax benefits from the exercise of stock options or upon issuance of stock upon lapse of restrictions on restricted stock units because of its tax position. Any such tax benefits resulting from tax deductions in excess of the compensation costs recognized are classified as operating cash flows.
Defined contribution and compensation plans
U.S. employees are eligible to participate in an employee savings plan. Under this plan, employees may contribute a percentage of their pay for investment in various investment alternatives. The company matches
50 percent
of the first
6 percent
of eligible pay contributed by participants to the plan on a before-tax basis (subject to IRS limits). The company funds the match with cash. The charge to income related to the company match for the years ended December 31,
2017
,
2016
and
2015
, was
$10.8 million
,
$10.7 million
and
$9.9 million
, respectively.
The company has defined contribution plans in certain locations outside the United States. The charge to income related to these plans was
$18.5 million
,
$19.0 million
and
$21.4 million
, for the years ended December 31,
2017
,
2016
and
2015
, respectively.
The company has non-qualified compensation plans, which allow certain highly compensated employees and directors to defer the receipt of a portion of their salary, bonus and fees. Participants can earn a return on their deferred balance that is based on hypothetical investments in various investment vehicles. Changes in the market value of these investments are reflected as an adjustment to the liability with an offset to expense. As of December 31,
2017
and
2016
, the liability to the participants of these plans was
$13.4 million
and
$12.3 million
, respectively. These amounts reflect the accumulated participant deferrals and earnings thereon as of that date. The company makes no contributions to the deferred compensation plans and remains contingently liable to the participants.
Retirement benefits
For the company’s more significant defined benefit pension plans, including the U.S., U.K. and the Netherlands, accrual of future benefits under the plans has ceased.
The company adopted changes to a foreign defined benefit pension plan, which ended the accrual of future benefits, effective June 30, 2017. A curtailment gain of
$5.4 million
was recorded in 2017.
In December 2016, the company completed a lump-sum offer for eligible former associates who had a deferred vested benefit under the company’s U.S. pension plan to receive the value of their entire pension benefit in a lump-sum payment. As a result, the pension plan trust made lump sum payments to approximately
5,800
former associates of
$215.9 million
. In accordance with accounting guidance on settlements of a pension benefit obligation, no settlement charges were recorded as a result of this action.
62
Retirement plans’ funded status and amounts recognized in the company’s consolidated balance sheets at December 31,
2017
and
2016
follows:
|
|
U.S. Plans
|
International Plans
|
||||||||||||||
|
As of December 31,
|
2017
|
2016
|
2017
|
2016
|
||||||||||||
|
Change in projected benefit obligation
|
||||||||||||||||
|
Benefit obligation at beginning of year
|
$
|
4,972.0
|
|
$
|
5,231.4
|
|
$
|
3,076.2
|
|
$
|
2,987.8
|
|
||||
|
Service cost
|
—
|
|
—
|
|
5.1
|
|
7.4
|
|
||||||||
|
Interest cost
|
211.3
|
|
231.3
|
|
72.8
|
|
87.8
|
|
||||||||
|
Plan participants’ contributions
|
—
|
|
—
|
|
1.9
|
|
2.3
|
|
||||||||
|
Plan amendment
|
—
|
|
—
|
|
(52.5
|
)
|
—
|
|
||||||||
|
Plan curtailment
|
—
|
|
—
|
|
(2.2
|
)
|
(3.7
|
)
|
||||||||
|
Actuarial loss (gain)
|
177.0
|
|
87.2
|
|
(93.8
|
)
|
502.2
|
|
||||||||
|
Benefits paid
|
(358.7
|
)
|
(577.9
|
)
|
(117.1
|
)
|
(110.0
|
)
|
||||||||
|
Foreign currency translation adjustments
|
—
|
|
—
|
|
299.3
|
|
(397.6
|
)
|
||||||||
|
Benefit obligation at end of year
|
$
|
5,001.6
|
|
$
|
4,972.0
|
|
$
|
3,189.7
|
|
$
|
3,076.2
|
|
||||
|
Change in plan assets
|
||||||||||||||||
|
Fair value of plan assets at beginning of year
|
$
|
3,452.1
|
|
$
|
3,759.4
|
|
$
|
2,429.7
|
|
$
|
2,496.8
|
|
||||
|
Actual return on plan assets
|
424.0
|
|
211.8
|
|
172.3
|
|
287.7
|
|
||||||||
|
Employer contribution
|
61.0
|
|
58.8
|
|
77.4
|
|
73.7
|
|
||||||||
|
Plan participants’ contributions
|
—
|
|
—
|
|
1.9
|
|
2.3
|
|
||||||||
|
Benefits paid
|
(358.7
|
)
|
(577.9
|
)
|
(117.1
|
)
|
(110.0
|
)
|
||||||||
|
Foreign currency translation and other adjustments
|
—
|
|
—
|
|
269.7
|
|
(320.8
|
)
|
||||||||
|
Fair value of plan assets at end of year
|
$
|
3,578.4
|
|
$
|
3,452.1
|
|
$
|
2,833.9
|
|
$
|
2,429.7
|
|
||||
|
Funded status at end of year
|
$
|
(1,423.2
|
)
|
$
|
(1,519.9
|
)
|
$
|
(355.8
|
)
|
$
|
(646.5
|
)
|
||||
|
Amounts recognized in the consolidated balance sheets consist of:
|
||||||||||||||||
|
Prepaid postretirement assets
|
$
|
—
|
|
$
|
—
|
|
$
|
147.4
|
|
$
|
31.9
|
|
||||
|
Other accrued liabilities
|
(6.8
|
)
|
(6.7
|
)
|
(0.2
|
)
|
(0.2
|
)
|
||||||||
|
Long-term postretirement liabilities
|
(1,416.4
|
)
|
(1,513.2
|
)
|
(503.0
|
)
|
(678.2
|
)
|
||||||||
|
Total funded status
|
$
|
(1,423.2
|
)
|
$
|
(1,519.9
|
)
|
$
|
(355.8
|
)
|
$
|
(646.5
|
)
|
||||
|
Accumulated other comprehensive loss, net of tax
|
||||||||||||||||
|
Net loss
|
$
|
2,690.6
|
|
$
|
2,828.8
|
|
$
|
1,067.8
|
|
$
|
1,144.7
|
|
||||
|
Prior service credit
|
$
|
(39.8
|
)
|
$
|
(42.4
|
)
|
$
|
(69.8
|
)
|
$
|
(27.7
|
)
|
||||
|
Accumulated benefit obligation
|
$
|
5,001.6
|
|
$
|
4,972.0
|
|
$
|
3,188.0
|
|
$
|
3,072.1
|
|
||||
Information for defined benefit retirement plans with an accumulated benefit obligation in excess of plan assets at December 31,
2017
and
2016
follows:
|
As of December 31,
|
2017
|
|
2016
|
|
||||
|
Accumulated benefit obligation
|
$
|
7,151.7
|
|
$
|
7,551.8
|
|
||
|
Fair value of plan assets
|
5,227.0
|
|
5,357.2
|
|
||||
Information for defined benefit retirement plans with a projected benefit obligation in excess of plan assets at December 31,
2017
and
2016
follows:
|
As of December 31,
|
2017
|
|
2016
|
|
||||
|
Projected benefit obligation
|
$
|
7,153.4
|
|
$
|
7,555.2
|
|
||
|
Fair value of plan assets
|
5,227.0
|
|
5,357.2
|
|
||||
63
Net periodic pension cost (income) for
2017
,
2016
and
2015
includes the following components:
|
|
U.S. Plans
|
International Plans
|
||||||||||||||||||||||
|
Year ended December 31,
|
2017
|
|
2016
|
|
2015
|
|
2017
|
|
2016
|
|
2015
|
|
||||||||||||
|
Service cost
|
$
|
—
|
|
$
|
—
|
|
$
|
—
|
|
$
|
5.1
|
|
$
|
7.4
|
|
$
|
8.7
|
|
||||||
|
Interest cost
|
211.3
|
|
231.3
|
|
224.1
|
|
72.8
|
|
87.8
|
|
94.1
|
|
||||||||||||
|
Expected return on plan assets
|
(235.2
|
)
|
(253.1
|
)
|
(254.8
|
)
|
(127.5
|
)
|
(139.5
|
)
|
(155.4
|
)
|
||||||||||||
|
Amortization of prior service credit
|
(2.5
|
)
|
(2.5
|
)
|
(2.4
|
)
|
(2.4
|
)
|
(3.0
|
)
|
(1.9
|
)
|
||||||||||||
|
Recognized net actuarial loss
|
126.4
|
|
116.0
|
|
132.7
|
|
49.8
|
|
40.3
|
|
63.6
|
|
||||||||||||
|
Curtailment gain
|
—
|
|
—
|
|
—
|
|
(5.4
|
)
|
(2.0
|
)
|
—
|
|
||||||||||||
|
Net periodic pension cost (income)
|
$
|
100.0
|
|
$
|
91.7
|
|
$
|
99.6
|
|
$
|
(7.6
|
)
|
$
|
(9.0
|
)
|
$
|
9.1
|
|
||||||
Weighted-average assumptions used to determine net periodic pension cost for the years ended December 31 were as follows:
|
|
U.S. Plans
|
International Plans
|
||||||||||||||||
|
Year ended December 31,
|
2017
|
|
2016
|
|
2015
|
|
2017
|
|
2016
|
|
2015
|
|
||||||
|
Discount rate
|
4.38
|
%
|
4.56
|
%
|
4.09
|
%
|
2.34
|
%
|
3.30
|
%
|
3.05
|
%
|
||||||
|
Rate of compensation increase
|
N/A
|
|
N/A
|
|
N/A
|
|
1.66
|
%
|
1.66
|
%
|
1.68
|
%
|
||||||
|
Expected long-term rate of return on assets
|
6.80
|
%
|
6.80
|
%
|
6.80
|
%
|
5.30
|
%
|
5.99
|
%
|
6.45
|
%
|
||||||
|
Weighted-average assumptions used to determine benefit obligations at December 31 were as follows:
|
||||||||||||||||||
|
Discount rate
|
3.87
|
%
|
4.38
|
%
|
4.56
|
%
|
2.24
|
%
|
2.34
|
%
|
3.30
|
%
|
||||||
|
Rate of compensation increase
|
N/A
|
|
N/A
|
|
N/A
|
|
1.55
|
%
|
1.66
|
%
|
1.68
|
%
|
||||||
The expected pretax amortization in
2018
of net periodic pension cost is as follows: net loss,
$167.6 million
; and prior service credit,
$(6.3) million
. The amortization of these items is recorded as an element of pension expense. In
2017
, pension expense included amortization of
$176.2 million
of net losses and
$(4.9) million
of prior service credit.
The company’s investment policy targets and ranges for each asset category are as follows:
|
|
U.S.
|
International
|
|||||||||
|
Asset Category
|
Target
|
|
Range
|
|
Target
|
|
Range
|
||||
|
Equity securities
|
58
|
%
|
52-64%
|
|
24
|
%
|
18-30%
|
||||
|
Debt securities
|
36
|
%
|
33-39%
|
|
60
|
%
|
53-66%
|
||||
|
Real estate
|
6
|
%
|
3-9%
|
|
1
|
%
|
0-3%
|
||||
|
Cash
|
—
|
%
|
0-5%
|
|
1
|
%
|
0-5%
|
||||
|
Other
|
—
|
%
|
—
|
%
|
14
|
%
|
7-21%
|
||||
The company periodically reviews its asset allocation, taking into consideration plan liabilities, local regulatory requirements, plan payment streams and then-current capital market assumptions. The actual asset allocation for each plan is monitored at least quarterly, relative to the established policy targets and ranges. If the actual asset allocation is close to or out of any of the ranges, a review is conducted. Rebalancing will occur toward the target allocation, with due consideration given to the liquidity of the investments and transaction costs.
The objectives of the company’s investment strategies are as follows: (a) to provide a total return that, over the long term, increases the ratio of plan assets to liabilities by maximizing investment return on assets, at a level of risk deemed appropriate, (b) to maximize return on assets by investing primarily in equity securities in the U.S. and for international plans by investing in appropriate asset classes, subject to the constraints of each plan design and local regulations, (c) to diversify investments within asset classes to reduce the impact of losses in single investments, and (d) for the U.S. plan to invest in compliance with the Employee Retirement Income Security Act of 1974 (“ERISA”), as amended and any subsequent applicable regulations and laws, and for international plans to invest in a prudent manner in compliance with local applicable regulations and laws.
The company sets the expected long-term rate of return based on the expected long-term return of the various asset categories in which it invests. The company considered the current expectations for future returns and the actual historical returns of each asset class. Also, since the company’s investment policy is to actively manage certain asset classes where the potential exists to
64
outperform the broader market, the expected returns for those asset classes were adjusted to reflect the expected additional returns.
In
2018
, the company expects to make cash contributions of
$149.7 million
to its worldwide defined benefit pension plans, which are comprised of
$63.4 million
primarily for international defined benefit pension plans and
$86.3 million
for the company’s U.S. qualified defined benefit pension plan.
As of December 31,
2017
, the following benefit payments, which reflect expected future service where applicable, are expected to be paid from the defined benefit pension plans:
|
Year ending December 31,
|
U.S.
|
|
International
|
|
||||
|
2018
|
$
|
364.4
|
|
$
|
98.7
|
|
||
|
2019
|
361.4
|
|
102.8
|
|
||||
|
2020
|
359.3
|
|
106.9
|
|
||||
|
2021
|
357.6
|
|
110.3
|
|
||||
|
2022
|
355.1
|
|
117.5
|
|
||||
|
2023 - 2027
|
1,693.6
|
|
642.5
|
|
||||
Other postretirement benefits
A reconciliation of the benefit obligation, fair value of the plan assets and the funded status of the postretirement benefit plan at December 31,
2017
and
2016
, follows:
|
As of December 31,
|
2017
|
|
2016
|
|
||||
|
Change in accumulated benefit obligation
|
||||||||
|
Benefit obligation at beginning of year
|
$
|
120.1
|
|
$
|
131.5
|
|
||
|
Service cost
|
0.5
|
|
0.4
|
|
||||
|
Interest cost
|
5.6
|
|
6.2
|
|
||||
|
Plan participants’ contributions
|
3.5
|
|
3.8
|
|
||||
|
Amendments
|
(7.4
|
)
|
(3.3
|
)
|
||||
|
Actuarial gain
|
(4.3
|
)
|
(1.4
|
)
|
||||
|
Federal drug subsidy
|
0.3
|
|
1.4
|
|
||||
|
Benefits paid
|
(15.7
|
)
|
(16.9
|
)
|
||||
|
Foreign currency translation and other adjustments
|
0.6
|
|
(1.6
|
)
|
||||
|
Benefit obligation at end of year
|
$
|
103.2
|
|
$
|
120.1
|
|
||
|
Change in plan assets
|
||||||||
|
Fair value of plan assets at beginning of year
|
$
|
7.9
|
|
$
|
7.7
|
|
||
|
Actual return on plan assets
|
(0.3
|
)
|
(0.3
|
)
|
||||
|
Employer contributions
|
12.2
|
|
13.6
|
|
||||
|
Plan participants’ contributions
|
3.5
|
|
3.8
|
|
||||
|
Benefits paid
|
(15.7
|
)
|
(16.9
|
)
|
||||
|
Fair value of plan assets at end of year
|
$
|
7.6
|
|
$
|
7.9
|
|
||
|
Funded status at end of year
|
$
|
(95.6
|
)
|
$
|
(112.2
|
)
|
||
|
Amounts recognized in the consolidated balance sheets consist of:
|
||||||||
|
Prepaid postretirement assets
|
$
|
0.9
|
|
$
|
1.4
|
|
||
|
Other accrued liabilities
|
(11.5
|
)
|
(12.4
|
)
|
||||
|
Long-term postretirement liabilities
|
(85.0
|
)
|
(101.2
|
)
|
||||
|
Total funded status
|
$
|
(95.6
|
)
|
$
|
(112.2
|
)
|
||
|
Accumulated other comprehensive loss, net of tax
|
||||||||
|
Net loss
|
$
|
14.9
|
|
$
|
19.0
|
|
||
|
Prior service credit
|
(9.8
|
)
|
(3.2
|
)
|
||||
65
Net periodic postretirement benefit cost for
2017
,
2016
and
2015
, follows:
|
Year ended December 31,
|
2017
|
|
2016
|
|
2015
|
|
||||||
|
Service cost
|
$
|
0.5
|
|
$
|
0.4
|
|
$
|
0.6
|
|
|||
|
Interest cost
|
5.6
|
|
6.2
|
|
6.9
|
|
||||||
|
Expected return on assets
|
(0.5
|
)
|
(0.4
|
)
|
(0.4
|
)
|
||||||
|
Amortization of prior service cost
|
(0.7
|
)
|
—
|
|
1.1
|
|
||||||
|
Recognized net actuarial loss
|
0.8
|
|
0.5
|
|
1.8
|
|
||||||
|
Net periodic benefit cost
|
$
|
5.7
|
|
$
|
6.7
|
|
$
|
10.0
|
|
|||
Weighted-average assumptions used to determine net periodic postretirement benefit cost for the years ended December 31 were as follows:
|
Year ended December 31,
|
2017
|
|
2016
|
|
2015
|
|
|||
|
Discount rate
|
5.53
|
%
|
5.61
|
%
|
5.27
|
%
|
|||
|
Expected return on plan assets
|
5.50
|
%
|
5.50
|
%
|
5.50
|
%
|
|||
Weighted-average assumptions used to determine benefit obligation at December 31 were as follows:
|
Year ended December 31,
|
2017
|
|
2016
|
|
2015
|
|
|||
|
Discount rate
|
5.30
|
%
|
5.53
|
%
|
5.61
|
%
|
|||
The expected pretax amortization in
2018
of net periodic postretirement benefit cost is as follows: net loss,
$1.2 million
; and prior service cost,
$(1.6) million
.
The company reviews its asset allocation periodically, taking into consideration plan liabilities, plan payment streams and then-current capital market assumptions. The company sets the long-term expected return on asset assumption, based principally on the long-term expected return on debt securities. These return assumptions are based on a combination of current market conditions, capital market expectations of third-party investment advisors and actual historical returns of the asset classes. In
2018
, the company expects to contribute approximately
$12 million
to its postretirement benefit plan.
|
Assumed health care cost trend rates at December 31,
|
2017
|
|
2016
|
|
||
|
Health care cost trend rate assumed for next year
|
6.6
|
%
|
5.8
|
%
|
||
|
Rate to which the cost trend rate is assumed to decline (the ultimate trend rate)
|
4.8
|
%
|
4.8
|
%
|
||
|
Year that the rate reaches the ultimate trend rate
|
2023
|
|
2023
|
|
||
A one-percentage-point change in assumed health care cost trend rates would have the following effects:
|
1-Percentage- Point Increase
|
|
1-Percentage- Point Decrease
|
|
|||||
|
Effect on service and interest cost
|
$
|
0.1
|
|
$
|
(0.1
|
)
|
||
|
Effect on postretirement benefit obligation
|
2.0
|
|
(1.7
|
)
|
||||
As of December 31,
2017
, the following benefits are expected to be paid to or from the company’s postretirement plan:
|
Year ending December 31,
|
Gross
Medicare
Receipts
|
|
Gross
Expected
Payments
|
|
||||
|
2018
|
$
|
0.1
|
|
$
|
12.7
|
|
||
|
2019
|
—
|
|
10.5
|
|
||||
|
2020
|
—
|
|
10.0
|
|
||||
|
2021
|
—
|
|
9.4
|
|
||||
|
2022
|
—
|
|
8.8
|
|
||||
|
2023 – 2027
|
—
|
|
34.4
|
|
||||
66
The following provides a description of the valuation methodologies and the levels of inputs used to measure fair value, and the general classification of investments in the company’s U.S. and international defined benefit pension plans, and the company’s other postretirement benefit plan.
Level 1 – These investments include cash, common stocks, real estate investment trusts, exchange traded funds, futures and options and U.S. government securities. These investments are valued using quoted prices in an active market. Payables and receivables are also included as Level 1 investments and are valued at face value.
Level 2 – These investments include the following:
Pooled Funds – These investments are comprised of money market funds and fixed income securities. The money market funds are valued using the readily determinable fair value (“RDFV”) provided by trustees of the funds. The fixed income securities are valued based on quoted prices for identical or similar investments in markets that may not be active.
Commingled Funds – These investments are comprised of debt, equity and other securities and are valued using the RDFV provided by trustees of the funds. The fair value per share for these funds are published and are the basis for current transactions.
Other Fixed Income – These investments are comprised of corporate and government fixed income investments and asset and mortgage backed securities for which there are quoted prices for identical or similar investments in markets that may not be active.
Derivatives – These investments include forward exchange contracts and options, which are traded on an active market, but not on an exchange; therefore, the inputs may not be readily observable. These investments also include fixed income futures and other derivative instruments.
Level 3 – These investments include the following:
Insurance Contracts – These investments are insurance contracts which are carried at book value, are not publicly traded and are reported at a fair value determined by the insurance provider.
Certain investments are valued using net asset value (“NAV”) as a practical expedient. These investments may not be redeemable on a daily basis and may have redemption notice periods of up to 90 days. These investments include the following:
Commingled Funds – These investments are comprised of debt, equity and other securities.
Private Real Estate and Private Equity - These investments represent interests in limited partnerships which invest in privately held companies or privately held real estate or other real assets. Net asset values are developed and reported by the general partners that manage the partnerships. These valuations are based on property appraisals, utilization of market transactions that provide valuation information for comparable companies, discounted cash flows, and other methods. These valuations are reported quarterly and adjusted as necessary at year end based on cash flows within the most recent period.
67
The following table sets forth by level, within the fair value hierarchy, the plans’ assets (liabilities) at fair value at December 31,
2017
.
|
|
U.S. Plans
|
International Plans
|
||||||||||||||||||||||||||||||
|
As of December 31, 2017
|
Fair Value
|
|
Level 1
|
|
Level 2
|
|
Level 3
|
|
Fair Value
|
|
Level 1
|
|
Level 2
|
|
Level 3
|
|
||||||||||||||||
|
Pension plans
|
||||||||||||||||||||||||||||||||
|
Equity Securities
|
||||||||||||||||||||||||||||||||
|
Common Stocks
|
$
|
1,465.1
|
|
$
|
1,461.9
|
|
$
|
3.2
|
|
$
|
—
|
|
$
|
—
|
|
$
|
—
|
|
$
|
—
|
|
$
|
—
|
|
||||||||
|
Commingled Funds
|
584.4
|
|
584.4
|
|
84.0
|
|
84.0
|
|
||||||||||||||||||||||||
|
Debt Securities
|
||||||||||||||||||||||||||||||||
|
U.S. Govt. Securities
|
139.8
|
|
139.8
|
|
||||||||||||||||||||||||||||
|
Other Fixed Income
|
830.6
|
|
830.6
|
|
254.1
|
|
2.6
|
|
251.5
|
|
||||||||||||||||||||||
|
Insurance Contracts
|
135.8
|
|
135.8
|
|
||||||||||||||||||||||||||||
|
Commingled Funds
|
|
267.5
|
|
267.5
|
|
|||||||||||||||||||||||||||
|
Real Estate
|
||||||||||||||||||||||||||||||||
|
Real Estate Investment Trusts
|
113.5
|
|
113.5
|
|
1.4
|
|
0.4
|
|
1.0
|
|
||||||||||||||||||||||
|
Other
|
||||||||||||||||||||||||||||||||
|
Derivatives
|
2.6
|
|
13.1
|
|
(10.5
|
)
|
1.2
|
|
1.2
|
|
||||||||||||||||||||||
|
Commingled Funds
|
357.1
|
|
357.1
|
|
||||||||||||||||||||||||||||
|
Pooled Funds
|
228.0
|
|
228.0
|
|
29.2
|
|
29.2
|
|
||||||||||||||||||||||||
|
Cash
|
34.8
|
|
34.8
|
|
25.1
|
|
25.1
|
|
||||||||||||||||||||||||
|
Receivables
|
58.1
|
|
58.1
|
|
19.9
|
|
19.9
|
|
||||||||||||||||||||||||
|
Payables
|
(116.7
|
)
|
(116.7
|
)
|
|
|
(1.5
|
)
|
(1.5
|
)
|
|
|
||||||||||||||||||||
|
Total plan assets in fair value hierarchy
|
$
|
3,340.2
|
|
$
|
1,704.5
|
|
$
|
1,635.7
|
|
$
|
—
|
|
$
|
1,173.8
|
|
$
|
46.5
|
|
$
|
991.5
|
|
$
|
135.8
|
|
||||||||
|
Plan assets measured using NAV as a practical expedient
(a):
|
||||||||||||||||||||||||||||||||
|
Commingled Funds
|
||||||||||||||||||||||||||||||||
|
Equity
|
$
|
—
|
|
$
|
780.7
|
|
||||||||||||||||||||||||||
|
Debt
|
19.8
|
|
837.7
|
|
||||||||||||||||||||||||||||
|
Other
|
105.1
|
|
25.2
|
|
||||||||||||||||||||||||||||
|
Private Real Estate
|
112.4
|
|
16.5
|
|
||||||||||||||||||||||||||||
|
Private Equity
|
0.9
|
|
—
|
|
||||||||||||||||||||||||||||
|
Total pension plan assets
|
$
|
3,578.4
|
|
$
|
2,833.9
|
|
||||||||||||||||||||||||||
|
Other postretirement plans
|
||||||||||||||||||||||||||||||||
|
Insurance Contracts
|
$
|
7.6
|
|
|
|
$
|
7.6
|
|
||||||||||||||||||||||||
(a)
Investments measured at fair value using NAV as a practical expedient have not been classified in the fair value hierarchy. The fair value amounts presented in this table for these investments are included to permit reconciliation of the fair value hierarchy to the total plan assets.
68
The following table sets forth by level, within the fair value hierarchy, the plans’ assets (liabilities) at fair value at December 31,
2016
.
|
|
U.S. Plans
|
International Plans
|
||||||||||||||||||||||||||||||
|
As of December 31, 2016
|
Fair Value
|
|
Level 1
|
|
Level 2
|
|
Level 3
|
|
Fair Value
|
|
Level 1
|
|
Level 2
|
|
Level 3
|
|
||||||||||||||||
|
Pension plans
|
||||||||||||||||||||||||||||||||
|
Equity Securities
|
||||||||||||||||||||||||||||||||
|
Common Stocks
|
$
|
1,443.1
|
|
$
|
1,438.3
|
|
$
|
4.8
|
|
$
|
—
|
|
$
|
—
|
|
$
|
—
|
|
$
|
—
|
|
$
|
—
|
|
||||||||
|
Commingled Funds
|
517.9
|
|
517.9
|
|
76.0
|
|
76.0
|
|
||||||||||||||||||||||||
|
Debt Securities
|
||||||||||||||||||||||||||||||||
|
U.S. Govt. Securities
|
158.5
|
|
158.5
|
|
||||||||||||||||||||||||||||
|
Other Fixed Income
|
812.4
|
|
812.4
|
|
241.4
|
|
0.5
|
|
240.9
|
|
||||||||||||||||||||||
|
Insurance Contracts
|
|
|
|
|
116.2
|
|
116.2
|
|
||||||||||||||||||||||||
|
Commingled Funds
|
242.8
|
|
242.8
|
|
||||||||||||||||||||||||||||
|
Real Estate
|
||||||||||||||||||||||||||||||||
|
Real Estate Investment Trusts
|
156.2
|
|
156.2
|
|
1.6
|
|
1.2
|
|
0.4
|
|
||||||||||||||||||||||
|
Other
|
||||||||||||||||||||||||||||||||
|
Derivatives
|
3.1
|
|
(1.1
|
)
|
4.2
|
|
4.9
|
|
4.9
|
|
||||||||||||||||||||||
|
Commingled Funds
|
294.5
|
|
294.5
|
|
||||||||||||||||||||||||||||
|
Pooled Funds
|
272.0
|
|
272.0
|
|
6.7
|
|
6.7
|
|
||||||||||||||||||||||||
|
Cash
|
12.2
|
|
12.2
|
|
11.4
|
|
11.4
|
|
||||||||||||||||||||||||
|
Receivables
|
107.2
|
|
107.2
|
|
||||||||||||||||||||||||||||
|
Payables
|
(195.3
|
)
|
(195.3
|
)
|
|
|
|
|
|
|
|
|
||||||||||||||||||||
|
Total plan assets in fair value hierarchy
|
$
|
3,287.3
|
|
$
|
1,676.0
|
|
$
|
1,611.3
|
|
$
|
—
|
|
$
|
995.5
|
|
$
|
13.1
|
|
$
|
866.2
|
|
$
|
116.2
|
|
||||||||
|
Plan assets measured using NAV as a practical expedient
(a):
|
||||||||||||||||||||||||||||||||
|
Commingled Funds
|
||||||||||||||||||||||||||||||||
|
Equity
|
$
|
—
|
|
$
|
726.7
|
|
||||||||||||||||||||||||||
|
Debt
|
18.6
|
|
640.0
|
|
||||||||||||||||||||||||||||
|
Other
|
104.6
|
|
25.8
|
|
||||||||||||||||||||||||||||
|
Private Real Estate
|
40.5
|
|
41.7
|
|
||||||||||||||||||||||||||||
|
Private Equity
|
1.1
|
|
—
|
|
||||||||||||||||||||||||||||
|
Total pension plan assets
|
$
|
3,452.1
|
|
$
|
2,429.7
|
|
||||||||||||||||||||||||||
|
Other postretirement plans
|
||||||||||||||||||||||||||||||||
|
Insurance Contracts
|
$
|
7.9
|
|
$
|
7.9
|
|
||||||||||||||||||||||||||
(a)
Investments measured at fair value using NAV as a practical expedient have not been classified in the fair value hierarchy. The fair value amounts presented in this table for these investments are included to permit reconciliation of the fair value hierarchy to the total plan assets.
69
The following table sets forth a summary of changes in the fair value of the plans’ Level 3 assets for the year ended December 31,
2017
.
|
January 1,
2017
|
Realized
gains
(losses)
|
Purchases
or
acquisitions
|
Sales
or
dispositions
|
Currency and unrealized gains (losses) relating to instruments still held at December 31, 2017
|
December 31,
2017
|
|||||||||||||||||||
|
U.S. plans
|
||||||||||||||||||||||||
|
Other postretirement plans
|
||||||||||||||||||||||||
|
Insurance Contracts
|
$
|
7.9
|
|
$
|
(0.2
|
)
|
$
|
0.2
|
|
$
|
(0.3
|
)
|
$
|
—
|
|
$
|
7.6
|
|
||||||
|
International pension plans
|
||||||||||||||||||||||||
|
Insurance Contracts
|
$
|
116.2
|
|
$
|
—
|
|
$
|
10.8
|
|
$
|
(11.4
|
)
|
$
|
20.2
|
|
$
|
135.8
|
|
||||||
The following table sets forth a summary of changes in the fair value of the plans’ Level 3 assets for the year ended December 31,
2016
.
|
January 1,
2016
|
Realized
gains
(losses)
|
Purchases
or
acquisitions
|
Sales
or
dispositions
|
Currency and unrealized gains (losses) relating to instruments still held at December 31, 2016
|
December 31,
2016
|
|||||||||||||||||||
|
U.S. plans
|
||||||||||||||||||||||||
|
Other postretirement plans
|
||||||||||||||||||||||||
|
Insurance Contracts
|
$
|
7.7
|
|
$
|
(0.3
|
)
|
$
|
0.5
|
|
$
|
—
|
|
$
|
—
|
|
$
|
7.9
|
|
||||||
|
International pension plans
|
||||||||||||||||||||||||
|
Insurance Contracts
|
$
|
120.6
|
|
$
|
—
|
|
$
|
4.7
|
|
$
|
(11.0
|
)
|
$
|
1.9
|
|
$
|
116.2
|
|
||||||
70
The following table presents additional information about plan assets valued using the net asset value as a practical expedient within the fair value hierarchy table.
|
2017
|
2016
|
|||||||||||||||||||||||
|
Fair Value
|
Unfunded Commit-ments
|
Redemption Frequency
|
Redemption Notice Period Range
|
Fair Value
|
Unfunded Commit-ments
|
Redemption Frequency
|
Redemption Notice Period Range
|
|||||||||||||||||
|
U.S. plans
|
||||||||||||||||||||||||
|
Commingled Funds
|
||||||||||||||||||||||||
|
Debt
|
$
|
19.8
|
|
$
|
—
|
|
Daily
|
5 days
|
$
|
18.6
|
|
$
|
—
|
|
Daily
|
5 days
|
||||||||
|
Other
|
105.1
|
|
—
|
|
Monthly
|
5 days
|
104.6
|
|
—
|
|
Monthly
|
5 days
|
||||||||||||
|
Private Real Estate
(a)
|
112.4
|
|
—
|
|
Quarterly
|
Up to 90 days
|
40.5
|
|
—
|
|
Quarterly
|
60 days
|
||||||||||||
|
Private Equity
(b)
|
0.9
|
|
—
|
|
1.1
|
|
—
|
|
||||||||||||||||
|
Total
|
$
|
238.2
|
|
$
|
—
|
|
$
|
164.8
|
|
$
|
—
|
|
||||||||||||
|
International pension plans
|
||||||||||||||||||||||||
|
Commingled Funds
|
||||||||||||||||||||||||
|
Equity
|
$
|
780.7
|
|
$
|
—
|
|
Weekly, Monthly
|
Up to 30 days
|
$
|
726.7
|
|
$
|
—
|
|
Weekly, Monthly
|
Up to 90 days
|
||||||||
|
Debt
|
837.7
|
|
—
|
|
Weekly, Biweekly, Bimonthly, Monthly
|
Up to 30 days
|
640.0
|
|
—
|
|
Weekly, Biweekly, Bimonthly, Monthly
|
Up to 90 days
|
||||||||||||
|
Other
|
25.2
|
|
—
|
|
Monthly
|
Up to 30 days
|
25.8
|
|
—
|
|
Monthly, Quarterly
|
Up to 90 days
|
||||||||||||
|
Private Real Estate
|
16.5
|
|
—
|
|
Monthly
|
Up to 90 days
|
41.7
|
|
—
|
|
Monthly, Quarterly
|
Up to 90 days
|
||||||||||||
|
Total
|
$
|
1,660.1
|
|
$
|
—
|
|
$
|
1,434.2
|
|
$
|
—
|
|
||||||||||||
(a)
Includes investments in private real estate funds and limited partnerships. The funds invest in U.S. real estate and allow redemptions quarterly, though queues, restrictions, and gates may extend the period. The limited partnerships include investments in primarily U.S. real estate, and can never be redeemed. The partnerships are all currently being wound up, and are expected to make all distributions over the next
three years
.
(b)
Includes investments in limited partnerships, which invest primarily in U.S. buyouts and venture capital. The investments can never be redeemed. The partnerships are all currently being wound up, and are expected to make all distributions over the next
three years
.
The company has
150 million
authorized shares of common stock, par value
$.01
per share, and
40 million
shares of authorized preferred stock, par value
$1
per share, issuable in series.
At December 31,
2017
,
35.1 million
shares of unissued common stock of the company were reserved for stock-based incentive plans and the company’s convertible senior notes.
71
Accumulated other comprehensive income (loss) as of December 31,
2017
,
2016
and
2015
, is as follows:
|
Total
|
|
Translation
Adjustments
|
|
Postretirement
Plans
|
|
|||||||
|
Balance at December 31, 2014
|
$
|
(4,113.4
|
)
|
$
|
(737.8
|
)
|
$
|
(3,375.6
|
)
|
|||
|
Other comprehensive income before reclassifications
|
346.2
|
|
(96.0
|
)
|
442.2
|
|
||||||
|
Amounts reclassified from accumulated other comprehensive income
|
(178.1
|
)
|
—
|
|
(178.1
|
)
|
||||||
|
Current period other comprehensive income
|
168.1
|
|
(96.0
|
)
|
264.1
|
|
||||||
|
Balance at December 31, 2015
|
(3,945.3
|
)
|
(833.8
|
)
|
(3,111.5
|
)
|
||||||
|
Other comprehensive income before reclassifications
|
(64.9
|
)
|
(93.3
|
)
|
28.4
|
|
||||||
|
Amounts reclassified from accumulated other comprehensive income
|
(142.6
|
)
|
—
|
|
(142.6
|
)
|
||||||
|
Current period other comprehensive income
|
(207.5
|
)
|
(93.3
|
)
|
(114.2
|
)
|
||||||
|
Balance at December 31, 2016
|
(4,152.8
|
)
|
(927.1
|
)
|
(3,225.7
|
)
|
||||||
|
Other comprehensive income before reclassifications
|
506.8
|
|
121.9
|
|
384.9
|
|
||||||
|
Amounts reclassified from accumulated other comprehensive income
|
(169.8
|
)
|
(11.8
|
)
|
(158.0
|
)
|
||||||
|
Current period other comprehensive income
|
337.0
|
|
110.1
|
|
226.9
|
|
||||||
|
Balance at December 31, 2017
|
$
|
(3,815.8
|
)
|
$
|
(817.0
|
)
|
$
|
(2,998.8
|
)
|
|||
Amounts reclassified out of accumulated other comprehensive income for the three years ended December 31,
2017
are as follows:
|
Year ended December 31,
|
2017
|
|
2016
|
|
2015
|
|
||||||
|
Translation Adjustments:
|
||||||||||||
|
Adjustment for substantial completion of liquidation of foreign subsidiaries
(a)
|
$
|
(11.8
|
)
|
$
|
—
|
|
$
|
—
|
|
|||
|
Postretirement Plans:
|
||||||||||||
|
Amortization of prior service cost
(b)
|
5.6
|
|
5.6
|
|
3.1
|
|
||||||
|
Amortization of actuarial losses
(b)
|
(174.1
|
)
|
(155.2
|
)
|
(189.7
|
)
|
||||||
|
Curtailment gain
(b)
|
5.4
|
|
2.0
|
|
—
|
|
||||||
|
Total before tax
|
(174.9
|
)
|
(147.6
|
)
|
(186.6
|
)
|
||||||
|
Income tax benefit
|
5.1
|
|
5.0
|
|
8.5
|
|
||||||
|
Total reclassifications for the period
|
$
|
(169.8
|
)
|
$
|
(142.6
|
)
|
$
|
(178.1
|
)
|
|||
(a)
Reported in Other income (expense), net in the consolidated statements of income
(b)
These items are included in net periodic postretirement cost (see Note 16).
The following table summarizes the changes in shares of common stock and treasury stock during the three years ended December 31,
2017
:
|
Common
Stock
|
|
Treasury
Stock
|
|
|||
|
Balance at December 31, 2014
|
52.4
|
|
2.7
|
|
||
|
Stock-based compensation
|
0.2
|
|
—
|
|
||
|
Balance at December 31, 2015
|
52.6
|
|
2.7
|
|
||
|
Stock-based compensation
|
0.2
|
|
—
|
|
||
|
Balance at December 31, 2016
|
52.8
|
|
2.7
|
|
||
|
Stock-based compensation
|
0.6
|
|
0.2
|
|
||
|
Balance at December 31, 2017
|
53.4
|
|
2.9
|
|
||
72
|
First
Quarter
|
|
Second
Quarter
|
|
Third
Quarter
|
|
Fourth
Quarter
|
|
Year
|
|
|||||||||||||
|
2017
|
||||||||||||||||||||||
|
Revenue
|
$
|
664.5
|
|
$
|
666.2
|
|
$
|
666.3
|
|
$
|
744.8
|
|
$
|
2,741.8
|
|
|||||||
|
Gross profit
|
120.2
|
|
102.5
|
|
86.1
|
|
169.5
|
|
478.3
|
|
||||||||||||
|
Income (loss) before income taxes
|
(16.8
|
)
|
(42.3
|
)
|
(40.4
|
)
|
27.4
|
|
(72.1
|
)
|
||||||||||||
|
Net income (loss) attributable to Unisys Corporation common shareholders
|
(32.7
|
)
|
(42.0
|
)
|
(41.1
|
)
|
50.5
|
|
(65.3
|
)
|
||||||||||||
|
Earnings (loss) per common share attributable to Unisys Corporation
|
||||||||||||||||||||||
|
Basic
|
(0.65
|
)
|
(0.83
|
)
|
(0.81
|
)
|
1.00
|
|
(1.30
|
)
|
||||||||||||
|
Diluted
|
(0.65
|
)
|
(0.83
|
)
|
(0.81
|
)
|
0.76
|
|
(1.30
|
)
|
||||||||||||
|
2016
|
||||||||||||||||||||||
|
Revenue
|
$
|
666.8
|
|
$
|
748.9
|
|
$
|
683.3
|
|
$
|
721.7
|
|
$
|
2,820.7
|
|
|||||||
|
Gross profit
|
98.5
|
|
178.3
|
|
121.6
|
|
160.2
|
|
558.6
|
|
||||||||||||
|
Income (loss) before income taxes
|
(33.2
|
)
|
44.3
|
|
(15.2
|
)
|
24.6
|
|
20.5
|
|
||||||||||||
|
Net income (loss) attributable to Unisys Corporation common shareholders
|
(39.9
|
)
|
21.6
|
|
(28.2
|
)
|
(1.2
|
)
|
(47.7
|
)
|
||||||||||||
|
Earnings (loss) per common share attributable to Unisys Corporation
|
||||||||||||||||||||||
|
Basic
|
(0.80
|
)
|
0.43
|
|
(0.56
|
)
|
(0.02
|
)
|
(0.95
|
)
|
||||||||||||
|
Diluted
|
(0.80
|
)
|
0.36
|
|
(0.56
|
)
|
(0.02
|
)
|
(0.95
|
)
|
||||||||||||
In the first, second, third and fourth quarters of 2017, the company recorded pretax cost-reduction and other charges of
$25.4 million
,
$27.5 million
,
$46.1 million
and
$47.8 million
, respectively. See Note 3, “Cost reduction actions,” of the Notes to Consolidated Financial Statements.
In the first, second, third and fourth quarters of 2016, the company recorded pretax cost-reduction and other charges of
$26.9 million
,
$10.2 million
,
$31.9 million
and
$13.1 million
, respectively. See Note 3, “Cost reduction actions,” of the Notes to Consolidated Financial Statements.
The individual quarterly per-share amounts may not total to the per-share amount for the full year because of accounting rules governing the computation of earnings per share.
73
Not applicable.
Disclosure Controls and Procedures
As of the end of the period covered by this Annual Report, management performed, with the participation of the Chief Executive Officer (“CEO”) and the Chief Financial Officer (“CFO”), an evaluation of the effectiveness of the company’s disclosure controls and procedures as defined in Rules 13a-15(e) and 15d-15(e) of the Securities Exchange Act of 1934 (the “Exchange Act”). In designing and evaluating the disclosure controls and procedures, management recognized that any controls and procedures, no matter how well designed and operated, can provide only reasonable assurance of achieving the desired control objectives. Based upon that evaluation, the CEO and the CFO concluded that, as of
December 31, 2017
, due to the material weakness in our internal control over financial reporting described below, our disclosure controls and procedures were not effective.
Notwithstanding such material weakness in internal control over financial reporting, our management concluded that our consolidated financial statements in this Annual Report on Form 10-K present fairly, in all material respects, the company’s financial position, results of operations and cash flows as of the dates, and for the periods presented, in conformity with generally accepted accounting principles (“GAAP”).
Management’s Report on Internal Control Over Financial Reporting
The management of the company is responsible for establishing and maintaining adequate internal control over financial reporting, as defined in Rules 13a-15(f) and 15d-15(f) under the Exchange Act. The company’s internal control over financial reporting is a process designed to provide reasonable assurance regarding the reliability of financial reporting and the preparation of financial statements for external purposes in accordance with U.S. generally accepted accounting principles. Internal control over financial reporting includes those policies and procedures that (1) pertain to the maintenance of records that in reasonable detail accurately and fairly reflect the transactions and dispositions of the assets of the company; (2) provide reasonable assurance that transactions are recorded as necessary to permit preparation of the financial statements in accordance with U.S. generally accepted accounting principles, and that receipts and expenditures of the company are being made only in accordance with authorizations of management and directors of company; and (3) provide reasonable assurance regarding prevention or timely detection of unauthorized acquisition, use or disposition of the company’s assets that could have a material effect on the financial statements.
Because of its inherent limitations, internal control over financial reporting may not prevent or detect misstatements. Also, projections of any evaluation of effectiveness to future periods are subject to the risk that controls may become inadequate because of changes in conditions, or that the degree of compliance with the policies and procedures may deteriorate.
A material weakness is a deficiency, or combination of deficiencies, in internal control over financial reporting, such that there is a reasonable possibility that a material misstatement of the company’s annual or interim financial statements will not be prevented or detected on a timely basis.
Management assessed the effectiveness of the company’s internal control over financial reporting as of
December 31, 2017
, based on criteria established in
Internal Control - Integrated Framework (2013)
issued by the Committee of Sponsoring Organizations of the Treadway Commission. Based on our assessment and those criteria, we identified the following deficiencies in our internal control described below.
Our risk assessment procedures over Technology revenue did not adequately identify risks and consider changes in business operations and the demands on personnel created by the efforts required to adopt the new revenue accounting pronouncement that will impact future financial reporting. As a result, the company had missing process level controls and insufficient trained personnel to operate process level controls over the measurement and recognition of multiple-element arrangements within Technology revenue.
Although no material misstatements were identified in our consolidated financial statements, these control deficiencies resulted in immaterial misstatements in the preliminary consolidated financial statements as of and for the year ended
December 31, 2017
related to Technology revenue and deferred revenue that were corrected. However, the control deficiencies create a reasonable possibility that a material misstatement in the company’s consolidated financial statements will not be prevented or detected on a timely basis and we concluded that our internal control over financial reporting as of
December 31, 2017
was not effective due to a material weakness in internal control.
74
KPMG LLP, an independent registered public accounting firm, has audited the company’s financial statements in this Annual Report on Form 10-K and, as part of its audit, has issued an adverse opinion on the effectiveness of the company’s internal control over financial reporting as of
December 31, 2017
, which is included in this Annual Report on Form 10-K on page
36
.
Remediation Plan
Management is actively remediating the identified material weakness, and has identified the following remediation steps:
|
•
|
The company will add personnel with an appropriate level of U.S. GAAP revenue recognition knowledge and experience by hiring additional personnel or by internal realignment.
|
|
•
|
Additional revenue recognition training will be provided to responsible staff.
|
|
•
|
Implementation of enhanced procedures whereby a comprehensive review will be performed for a sample of low dollar Technology transactions.
|
|
•
|
Enhanced processes to review all major multiple-element transactions will be implemented.
|
•
Data elements that support enhanced analytics and controls will be added to the revenue recognition process.
|
•
|
The company will continue to supplement existing revenue recognition resources with consultants where necessary.
|
Changes in Internal Control over Financial Reporting
Except for the identification of the material weakness described above, there have been no changes in internal control over financial reporting during the fourth quarter of
2017
that have materially affected, or are reasonably likely to materially affect, our internal control over financial reporting.
Not applicable.
75
Information regarding our executive officers appears in Part I, Item 1 of this Form 10-K.
The following information is incorporated herein by reference to our Definitive Proxy Statement for the
2018
Annual Meeting of Stockholders (the “Proxy Statement”):
|
•
|
Information regarding our directors is set forth under the heading “Information Regarding Nominees.”
|
|
•
|
Information regarding the Unisys Code of Ethics and Business Conduct is set forth under the heading “Code of Ethics and Business Conduct.”
|
|
•
|
Information regarding our audit and finance committee and audit committee financial experts is set forth under the heading “Committees.”
|
|
•
|
Information regarding compliance with Section 16(a) is set forth under the heading “Section 16(a) Beneficial Ownership Reporting Compliance.”
|
|
•
|
Information regarding our director nomination process is set forth under the heading “Director Nomination Process.”
|
Information regarding executive compensation is set forth under the heading “EXECUTIVE COMPENSATION” in the Proxy Statement and is incorporated herein by reference.
The following information is incorporated herein by reference to the Proxy Statement:
|
•
|
Information regarding securities authorized for issuance under equity compensation plans is set forth under the heading “EQUITY COMPENSATION PLAN INFORMATION.”
|
|
•
|
Information regarding the security ownership of certain beneficial owners, directors and executive officers is set forth under the heading “SECURITY OWNERSHIP BY CERTAIN BENEFICIAL OWNERS AND MANAGEMENT.”
|
The following information is incorporated herein by reference to the Proxy Statement:
|
•
|
Information regarding transactions with related persons is set forth under the heading “Related Party Transactions.”
|
|
•
|
Information regarding director independence is set forth under the heading “Independence of Directors.”
|
Information concerning fees and services of the company’s principal accountants is set forth under the heading “Independent Registered Public Accounting Firm Fees and Services” in the Proxy Statement and is incorporated herein by reference.
76
1. Unisys Corporation’s consolidated financial statements are filed as a part of this report on Form 10-K in Item 8, Financial Statements and Supplementary Data, and a list of Unisys Corporation’s consolidated financial statements are found on page
32
on this report. Schedule II, Valuation and Qualifying Accounts, is found on page
81
on this report; all other financial statement schedules are omitted because the required information is not applicable, or because the information required is included in the consolidated financial statements and notes thereto.
2. Exhibits required to be filed by Item 601 of Regulation S-K:
|
Exhibit
Number
|
Description
|
|
Restated Certificate of Incorporation of Unisys Corporation (incorporated by reference to Exhibit 3.1 to the Company’s Current Report on Form 8-K filed on April 30, 2010)
|
|
|
Certificate of Amendment of the Restated Certificate of Incorporation of Unisys Corporation (incorporated by reference to Exhibit 3.1 to the Company’s Current Report on Form 8–K filed on April 28, 2011)
|
|
|
Certificate of Amendment of the Restated Certificate of Incorporation of Unisys Corporation (incorporated by reference to Exhibit 3.1 to the Company’s Current Report on Form 8-K filed on April 28, 2017)
|
|
|
By-Laws of Unisys Corporation, as amended through April 30, 2015 (incorporated by reference to Exhibit 3.3 to the Company’s Quarterly Report on Form 10-Q filed on April 30, 2015)
|
|
|
4.1
|
Agreement to furnish to the Commission on request a copy of any instrument defining the rights of the holders of long-term debt which authorizes a total amount of debt not exceeding 10% of the total assets of the Company (incorporated by reference to Exhibit 4 to the Company’s Annual Report on Form 10-K for the year ended December 31, 1982 (File No. 1-145))
|
|
Indenture, dated as of March 15, 2016, between Unisys Corporation and Wells Fargo Bank, National Association, as Trustee (incorporated by reference to Exhibit 4.1 to the Company’s Current Report on Form 8-K filed on March 15, 2016)
|
|
|
Indenture, dated as of April 17, 2017, among Unisys Corporation, Unisys Holding Corporation, Unisys AP Investment Company I, Unisys NPL, Inc. and Wells Fargo Bank, National Association (incorporated by reference to Exhibit 4.1 to the registrant's Current Report on Form 8-K filed on April 17, 2017)
|
|
|
10.1
|
Form of Indemnification Agreement between Unisys Corporation and each of its Directors (incorporated by reference to Exhibit B to the Company’s Proxy Statement, dated March 22, 1988, for its 1988 Annual Meeting of Stockholders)
|
|
Unisys Corporation Director Stock Unit Plan, as amended and restated effective September 22, 2000 (incorporated by reference to Exhibit 10.5 to the Company’s Quarterly Report on Form 10-Q for the quarterly period ended September 30, 2000)
|
|
|
Deferred Compensation Plan for Directors of Unisys Corporation, as amended and restated effective April 22, 2004 (incorporated by reference to Exhibit 10.2 to the Company’s Quarterly Report on Form 10-Q for the quarterly period ended June 30, 2004)
|
|
|
2005 Deferred Compensation Plan for Directors of Unisys Corporation, as amended and restated effective December 2, 2010 except as otherwise noted therein (incorporated by reference to Exhibit 10.17 to the Company’s Annual Report on Form 10-K for the year ended December 31, 2010)
|
|
|
Unisys Corporation 2003 Long-Term Incentive and Equity Compensation Plan, as amended and restated effective January 1, 2009 (incorporated by reference to Exhibit 10.13 to the Company’s Annual Report on Form 10-K for the year ended December 31, 2008)
|
|
|
Amendment to Unisys Corporation 2003 Long-Term Incentive and Equity Compensation Plan, effective February 12, 2009 (incorporated by reference to Exhibit 10.14 to the Company’s Annual Report on Form 10-K for the year ended December 31, 2008)
|
|
|
Unisys Corporation 2007 Long-Term Incentive and Equity Compensation Plan, as amended and restated effective January 1, 2009 (incorporated by reference to Exhibit 10.20 to the Company’s Annual Report on Form 10-K for the year ended December 31, 2008)
|
|
77
|
Amendment to Unisys Corporation 2007 Long-Term Incentive and Equity Compensation Plan, effective February 12, 2009 (incorporated by reference to Exhibit 10.21 to the Company’s Annual Report on Form 10-K for the year ended December 31, 2008)
|
|
|
Unisys Corporation 2010 Long-Term Incentive and Equity Compensation Plan (incorporated by reference to Appendix E to the Company’s Proxy Statement, dated March 18, 2010, for its 2010 Annual Meeting of Stockholders)
|
|
|
Unisys Corporation 2016 Long-Term Incentive and Equity Compensation Plan (incorporated by reference to Exhibit 10.1 to the Company’s Quarterly Report on Form 10-Q for the quarterly period ended March 31, 2016)
|
|
|
Form of Performance-Based Restricted Stock Unit Agreement (incorporated by reference to Exhibit 10.10 to the Company’s Annual Report on Form 10-K for the year ended December 31, 2015)
|
|
|
Form of Time-Based Restricted Stock Unit Agreement (incorporated by reference to Exhibit 10.11 to the Company’s Annual Report on Form 10-K for the year ended December 31, 2014)
|
|
|
Form of Stock Option Agreement (incorporated by reference to Exhibit 10.12 to the Company’s Annual Report on Form 10-K for the year ended December 31, 2014)
|
|
|
Form of Performance Cash Award Agreement (incorporated by reference to Exhibit 10.2 to the Company’s Quarterly Report on Form 10-Q for the quarterly period ended March 31, 2016)
|
|
|
10.15
|
Unisys Executive Annual Variable Compensation Plan (incorporated by reference to Exhibit A to the Company’s Proxy Statement, dated March 23, 1993, for its 1993 Annual Meeting of Stockholders)
|
|
Unisys Corporation Deferred Compensation Plan as amended and restated effective September 22, 2000 (incorporated by reference to Exhibit 10.3 to the Company’s Quarterly Report on Form 10-Q for the quarterly period ended September 30, 2000)
|
|
|
Unisys Corporation 2005 Deferred Compensation Plan, as amended and restated effective September 19, 2014 except as otherwise noted therein (incorporated by reference to Exhibit 10.1 to the Company’s Quarterly Report on Form 10-Q for the quarterly period ended September 30, 2014)
|
|
|
Form of Executive Employment Agreement for U.S. executive officers (incorporated by reference to Exhibit 10.11 to the Company’s Annual Report on Form 10-K for the year ended December 31, 2012)
|
|
|
Form of letter agreement by and between Unisys Corporation and each of its executive officers who report directly to the Chief Executive Officer (incorporated by reference to Exhibit 10.3 to the Company’s Current Report on Form 8-K filed on December 16, 2014)
|
|
|
Unisys Corporation Executive Life Insurance Program, as amended and restated effective April 22, 2004 (incorporated by reference to Exhibit 10.21 to the Company’s Annual Report on Form 10-K for the year ended December 31, 2005)
|
|
|
Amendment to the Unisys Corporation Executive Life Insurance Program, effective January 1, 2009 (incorporated by reference to Exhibit 10.23 to the Company’s Annual Report on Form 10-K for the year ended December 31, 2008)
|
|
|
Unisys Corporation Supplemental Executive Retirement Income Plan, as amended and restated effective January 1, 2009 (incorporated by reference to Exhibit 10.25 to the Company’s Annual Report on Form 10-K for the year ended December 31, 2008)
|
|
|
Unisys Corporation Savings Plan, as amended and restated effective January 1, 2016 (incorporated by reference to Exhibit 10.23 to the Company’s Annual Report on Form 10-K for the year ended December 31, 2015)
|
|
|
Amendment 2017-1 to the Unisys Savings Plan effective January 1, 2017 (incorporated by reference to Exhibit 10.27 to the Company’s Annual Report on Form 10-K for the year ended December 31, 2016)
|
|
|
Summary of supplemental benefits provided to elected officers of Unisys Corporation (incorporated by reference to Exhibit 10.25 to the Company’s Annual Report on Form 10-K for the year ended December 31, 2014)
|
|
|
Letter Agreement, dated December 12, 2014, between Unisys Corporation and Peter Altabef (incorporated by reference to Exhibit 10.1 to the Company’s Current Report on Form 8-K filed on December 16, 2014)
|
|
|
Employment Agreement, dated December 12, 2014, between Unisys Corporation and Peter Altabef (incorporated by reference to Exhibit 10.2 to the Company’s Current Report on Form 8-K filed on December 16, 2014)
|
|
|
Security Agreement dated as of April 17, 2017 by and among Unisys Corporation, Unisys Holding Corporation, Unisys AP Investment Company I, Unisys NPL, Inc. and Wells Fargo Bank, National Association, as agent (incorporated by reference to Exhibit 10.1 to the Company’s Current Report on Form 8-K filed on April 17, 2017)
|
|
78
|
Collateral Trust Agreement dated as of April 17, 2017 by and among Unisys Corporation, Unisys Holding Corporation, Unisys AP Investment Company I, Unisys NPL, Inc. and Wells Fargo Bank, National Association, as agent (incorporated by reference to Exhibit 10.2 to the Company’s Current Report on Form 8-K filed on April 17, 2017)
|
|
|
Credit Agreement dated as of October 5, 2017 by and among Unisys Corporation, the lenders from time to time party thereto and JPMorgan Chase Bank, N.A., as Administrative Agent (incorporated by reference to Exhibit 10.1 to the Company’s Current Report on Form 8-K filed on October 6, 2017)
|
|
|
Security Agreement dated as of October 5, 2017 by Unisys Corporation, Unisys Holding Corporation, Unisys NPL, Inc., and Unisys AP Investment Company I in favor of JPMorgan Chase Bank, N.A., as Administrative Agent (incorporated by reference to Exhibit 10.2 to the Company’s Current Report on Form 8-K filed on October 6, 2017)
|
|
|
Intercreditor Agreement dated as of October 5, 2017 by and among JPMorgan Chase Bank, N.A., as Administrative Agent, Wells Fargo Bank, National Association, as Collateral Trustee, and Unisys Corporation, Unisys Holding Corporation, Unisys NPL, Inc., and Unisys AP Investment Company I (incorporated by reference to Exhibit 10.3 to the Company’s Current Report on Form 8-K filed on October 6, 2017)
|
|
|
Statement of Computation of Ratio of Earnings to Combined Fixed Charges and Preferred Stock Dividends
|
|
|
Subsidiaries of the Company
|
|
|
Consent of KPMG LLP
|
|
|
Power of Attorney
|
|
|
Certification of Peter A. Altabef required by Rule 13a-14(a) or Rule 15d-14(a)
|
|
|
Certification of Inder M. Singh required by Rule 13a-14(a) or Rule 15d-14(a)
|
|
|
Certification of Peter A. Altabef required by Rule 13a-14(b) or Rule 15d-14(b) and Section 906 of the Sarbanes-Oxley Act of 2002, 18 U.S.C. Section 1350
|
|
|
Certification of Inder M. Singh required by Rule 13a-14(b) or Rule 15d-14(b) and Section 906 of the Sarbanes-Oxley Act of 2002, 18 U.S.C. Section 1350
|
|
|
101.INSXBRL
|
Instance Document
|
|
101.SCHXBRL
|
Taxonomy Extension Schema Document
|
|
101.CALXBRL
|
Taxonomy Extension Calculation Linkbase Document
|
|
101.LABXBRL
|
Taxonomy Extension Labels Linkbase Document
|
|
101.PREXBRL
|
Taxonomy Extension Presentation Linkbase Document
|
|
101.DEFXBRL
|
Taxonomy Extension Definition Linkbase Document
|
None.
79
SIGNATURES
Pursuant to the requirements of Section 13 or 15(d) of the Securities Exchange Act of 1934, the registrant has duly caused this report to be signed on its behalf by the undersigned, thereunto duly authorized.
|
|
UNISYS CORPORATION
|
|
|
By:
|
/s/ Peter A. Altabef
|
|
|
Peter A. Altabef
|
||
|
President and Chief Executive Officer
|
||
|
Date: March 12, 2018
|
||
Pursuant to the requirements of the Securities Exchange Act of 1934, this report has been signed below by the following persons on behalf of the registrant and in the capacities indicated on
March 12, 2018
.
|
|
/s/ Peter A. Altabef
|
|
*Denise K. Fletcher
|
|
Peter A. Altabef
|
|
Denise K. Fletcher
Director
|
|
|
Director, President and Chief Executive Officer
|
|
||
|
(principal executive officer)
|
|
||
|
|
/s/ Inder M. Singh
|
|
*Philippe Germond
|
|
Inder M. Singh
|
|
Philippe Germond
|
|
|
Senior Vice President and Chief Financial Officer
|
|
Director
|
|
|
(principal financial officer)
|
|
||
|
|
/s/ Michael M. Thomson
|
|
*Deborah Lee James
|
|
Michael M. Thomson
|
|
Deborah Lee James
|
|
|
Vice President and Corporate Controller
|
Director
|
||
|
(principal accounting officer)
|
|
||
|
|
*Jared L. Cohon
|
|
*Paul E. Martin
|
|
Jared L. Cohon
|
|
Paul E. Martin
|
|
|
Director
|
|
Director
|
|
|
|
*Alison Davis
|
|
*Lee D. Roberts
|
|
Alison Davis
|
|
Lee D. Roberts
|
|
|
Director
|
|
Director
|
|
|
|
*Nathaniel A. Davis
|
|
*Paul E. Weaver
|
|
Nathaniel A. Davis
|
|
Paul E. Weaver
|
|
|
Director
|
|
Director
|
|
|
*By:
|
/s/ Peter A. Altabef
|
|
|
|
Peter A. Altabef
|
|
||
|
Attorney-in-fact
|
|
||
80
UNISYS CORPORATION
SCHEDULE II - VALUATION AND QUALIFYING ACCOUNTS
(Millions)
|
Description
|
Balance at
Beginning
of Period
|
Additions
Charged to
Costs and
Expenses
|
Deductions
(a)
|
Balance at
End of
Period
|
||||||||||||
|
Allowance for doubtful accounts (deducted from accounts receivable):
|
||||||||||||||||
|
Year Ended December 31, 2015
|
$
|
30.1
|
|
$
|
3.0
|
|
$
|
(12.0
|
)
|
$
|
21.1
|
|
||||
|
Year Ended December 31, 2016
|
$
|
21.1
|
|
$
|
2.2
|
|
$
|
(0.5
|
)
|
$
|
22.8
|
|
||||
|
Year Ended December 31, 2017
|
$
|
22.8
|
|
$
|
3.1
|
|
$
|
(3.9
|
)
|
$
|
22.0
|
|
||||
|
(a)
|
Includes write-off of bad debts less recoveries, reclassifications from other current liabilities and foreign currency translation adjustments.
|
81
TABLE OF CONTENTS
Part IItem 1. BusinessItem 1A. Risk FactorsItem 1B. Unresolved Staff CommentsItem 2. PropertiesItem 3. Legal ProceedingsItem 4. Mine Safety DisclosuresPart IIItem 5. Market For The Registrant S Common Equity, Related Stockholder Matters and Issuer Purchases Of Equity SecuritiesItem 6. Selected Financial DataItem 7. Management S Discussion and Analysis Of Financial Condition and Results Of OperationsItem 7A. Quantitative and Qualitative Disclosures About Market RiskItem 8. Financial Statements and Supplementary DataNote 1 Summary Of Significant Accounting PoliciesNote 2 Earnings Per Common ShareNote 3 Cost Reduction ActionsNote 4 GoodwillNote 5 Recent Accounting Pronouncements and Accounting ChangesNote 6 Accounts ReceivableNote 7 Income TaxesNote 8 PropertiesNote 9 DebtNote 10 Other Accrued LiabilitiesNote 11 Rental Expense and CommitmentsNote 12 Financial Instruments and Concentration Of Credit RisksNote 13 Foreign CurrencyNote 14 Litigation and ContingenciesNote 15 Segment InformationNote 16 Employee PlansPart DNote 17 Stockholders EquityNote 18 Quarterly Financial Information (unaudited)Item 9. Changes in and Disagreements with Accountants on Accounting and Financial DisclosureItem 9A. Controls and ProceduresItem 9B. Other InformationPart IIIItem 10. Directors, Executive Officers and Corporate GovernanceItem 11. Executive CompensationItem 12. Security Ownership Of Certain Beneficial Owners and Management and Related Stockholder MattersItem 13. Certain Relationships and Related Transactions, and Director IndependenceItem 14. Principal Accountant Fees and ServicesPart IVItem 15. Exhibits and Financial Statement SchedulesItem 16. Form 10-k Summary