Table of Contents
SECURITIES AND EXCHANGE COMMISSION
Washington, D.C. 20549
FORM 20-F
| (Mark one) | ||
| ☐ | REGISTRATION STATEMENT PURSUANT TO SECTION 12(b) OR (g) OF THE SECURITIES EXCHANGE ACT OF 1934 | |
| OR | ||
| ☒ | ANNUAL REPORT PURSUANT TO SECTION 13 OR 15(d) OF THE SECURITIES EXCHANGE ACT OF 1934 | |
| FOR THE FISCAL YEAR ENDED DECEMBER 31, 2016 | ||
| OR | ||
| ☐ | TRANSITION REPORT PURSUANT TO SECTION 13 OR 15(d) OF THE SECURITIES EXCHANGE ACT OF 1934 | |
| OR | ||
| ☐ |
SHELL COMPANY REPORT PURSUANT TO SECTION 13 OR 15(d) OF THE SECURITIES EXCHANGE ACT OF 1934 |
|
Date of event requiring this shell company report
For the transition period from to
Commission file number 001-04546
UNILEVER PLC
(Exact name of Registrant as specified in its charter)
ENGLAND
(Jurisdiction of incorporation or organization)
100 Victoria Embankment, London, England
(Address of principal executive offices)
T. E. Lovell, Group Secretary
Tel: +44(0)2078225252, Fax: +44(0)2078225464
100 Victoria Embankment, London EC4Y 0DY, UK
(Name, telephone number, facsimile number and address of Company Contact)
Securities registered or to be registered pursuant to Section 12(b) of the Act:
|
Title of each class |
Name of each exchange on which registered |
|
| American Shares (evidenced by Depositary Receipts) each representing one ordinary share of the nominal amount of 3 1/9p each | New York Stock Exchange | |
|
0.85% Notes due 2017 2.2% Notes due 2019 2.1% Notes due 2020 4.25% Notes due 2021 1.375% Notes due 2021 3.1% Notes due 2025 2.0% Notes due 2026 5.9% Notes due 2032 4.8% Notes due 2019 |
New York Stock Exchange New York Stock Exchange New York Stock Exchange New York Stock Exchange New York Stock Exchange New York Stock Exchange New York Stock Exchange New York Stock Exchange New York Stock Exchange |
Securities registered or to be registered pursuant to Section 12(g) of the Act: None
Securities for which there is a reporting obligation pursuant to Section 15(d) of the Act: None
Indicate the number of outstanding shares of each of the issuer’s classes of capital or common stock as of the close of the period covered by the annual report.
The total number of outstanding shares of the issuer’s capital stock at the close of the period covered by the annual report was: 1,310,156,361 ordinary shares
Indicate by check mark if the registrant is a well-known seasoned issuer, as defined in Rule 405 of the Securities Act:
Yes ☒ No ☐
If this report is an annual or transition report, indicate by check mark if the registrant is not required to file reports pursuant to Section 13 or 15(d) of the Securities Exchange Act of 1934:
Yes ☐ No ☒
Indicate by check mark whether the registrant: (1) has filed all reports required to be filed by Section 13 or 15(d) of the Securities Exchange Act of 1934 during the preceding 12 months (or for such shorter period that the registrant was required to file such reports), and (2) has been subject to such filing requirements for the past 90 days.
Yes ☒ No ☐
Indicate by check mark whether the registrant has submitted electronically and posted on its corporate Web site, if any, every Interactive Data File required to be submitted and posted pursuant to Rule 405 of Regulation S-T (§232.405 of this chapter) during the preceding 12 months (or for such shorter period that the registrant was required to submit and post such files).
Yes ☐ No ☐
Indicate by check mark whether the registrant is a large accelerated filer, an accelerated filer, or a non-accelerated filer. See definition of “accelerated filer and large accelerated filer” in Rule 12b-2 of the Exchange Act.
Large Accelerated filer ☒ Accelerated filer ☐ Non-accelerated filer ☐
Indicate by check mark which basis of accounting the registrant has used to prepare the financial statements included in this filing:
| U.S. GAAP ☐ | International Financial Reporting Standards as issued by the International Accounting Standards Board ☒ | Other ☐ |
If ‘Other’ has been checked in response to the previous question, indicate by check mark which financial statement item the registrant has elected to follow. Item 17 ☐ Item 18 ☐
If this is an annual report, indicate by check mark whether the registrant is a shell company (as defined in Rule 12b-2 of the Exchange Act):
Yes ☐ No ☒
Table of Contents
CAUTIONARY STATEMENT
This document may contain forward-looking statements, including ‘forward-looking statements’ within the meaning of the United States Private Securities Litigation Reform Act of 1995. Words such as ‘will’, ‘aim’, ‘expects’, ‘anticipates’, ‘intends’, ‘looks’, ‘believes’, ‘vision’, or the negative of these terms and other similar expressions of future performance or results, and their negatives, are intended to identify such forward-looking statements. These forward-looking statements are based upon current expectations and assumptions regarding anticipated developments and other factors affecting the Unilever Group (the ‘Group’). They are not historical facts, nor are they guarantees of future performance.
Because these forward-looking statements involve risks and uncertainties, there are important factors that could cause actual results to differ materially from those expressed or implied by these forward-looking statements. Among other risks and uncertainties, the material or principal factors which could cause actual results to differ materially are: Unilever’s global brands not meeting consumer preferences; Unilever’s ability to innovate and remain competitive; Unilever’s investment choices in its portfolio management; inability to find sustainable solutions to support long-term growth; customer relationships; the recruitment and retention of talented employees; disruptions in our supply chain; the cost of raw materials and commodities; the production of safe and high quality products; secure and reliable IT infrastructure; successful execution of acquisitions, divestitures and business transformation projects; economic and political risks and natural disasters; the effect of climate change on Unilever’s business; financial risks; failure to meet high and ethical standards; and managing regulatory, tax and legal matters.
These forward-looking statements speak only as of the date of this document. Except as required by any applicable law or regulation, the Group expressly disclaims any obligation or undertaking to release publicly any updates or revisions to any forward-looking statements contained herein to reflect any change in the Group’s expectations with regard thereto or any change in events, conditions or circumstances on which any such statement is based.
Further details of potential risks and uncertainties affecting the Group are described in the Group’s filings with the London Stock Exchange, Euronext Amsterdam and the US Securities and Exchange Commission, including in the Unilever Annual Report and Accounts 2016.
Table of Contents
MAKING
SUSTAINABLE LIVING
COMMONPLACE
ANNUAL REPORT ON
FORM 20-F 2016
Table of Contents
Table of Contents
| ABOU T US | OUR PURPOSE |
| Annual Report on Form 20-F 2016 | Strategic Report | 1 |
Table of Contents
| CHAIR MAN’S STATEMENT |
| 2 | Strategic Report | Annual Report on Form 20-F 2016 |
Table of Contents
| BO ARD OF DIRECTORS |
MARIJN DEKKERS. Chairman. Previous relevant experience: Bayer AG (CEO); Thermo Fisher Scientific Inc. (CEO). Current external appointments: General Electric (NED)
ANN FUDGE. Vice-Chairman/Senior Independent Director. Previous relevant experience: General Electric (NED); Marriott International (NED); Young & Rubicam (Chairman and CEO). Current external appointments: Novartis AG (NED); Northrop Grumman (NED); US Programs Advisory Panel of Gates Foundation (Chairman); Brookings (Honorary Trustee); Catalyst (Honorary Director)
PAUL POLMAN. CEO, Dutch, Male, 60. Appointed CEO: January 2009. Appointed Director: October 2008. Previous relevant experience: Procter & Gamble Co. (Group President, Europe); Nestlé S.A. (CFO); Alcon Inc (Director) . Current external appointments: The Dow Chemical Company (NED); World Business Council for Sustainable Development (Chairman, Executive Committee); UN Global Compact (Board member); UK Business Ambassador
GRAEME PITKETHLY. CFO, British, Male, 50. Appointed CFO: October 2015. Appointed Director: April 2016. Previous Unilever posts include: Unilever UK and Ireland (EVP and General Manager); Finance Global Markets (EVP); Group Treasurer; Head of Mergers & Acquisitions; Unilever Indonesia (CFO); Group Chief Accountant
NILS SMEDEGAARD ANDERSEN. Previous relevant experience: A.P. Moller – Maersk A/S (Group CEO); Inditex (NED); Carlsberg A/S and Carlsberg Breweries A/S (CEO); Danske Sukkerfabrikker; Tuborg International; Union Cervecera; Hannen Brauerei; Hero Group; European Round Table of Industrialists (Vice-Chairman). Current external appointments: Dansk Supermarket Group (Chairman); BP PLC (NED)
LAURA CHA. Previous relevant experience: Securities and Futures Commission, Hong Kong; China Securities Regulatory Commission. Current external appointments: HSBC Holdings plc (Independent NED); China Telecom Corporation Limited (Independent NED); The Hongkong and Shanghai Banking Corporation (Non-executive deputy Chairman); Foundation Asset Management AB (Senior international advisor)
VITTORIO COLAO. Previous relevant experience: RCS MediaGroup (CEO); McKinsey & Co (Partner); Finmeccanica Group (NED); RAS Insurance (NED). Current external appointments: Vodafone Group Plc (CEO); Bocconi University (International Advisory Board); Harvard Business School (Dean’s Advisory Board); European Round Table of Industrialists (Vice-Chairman); Oxford Martin School (Advisor)
PROFESSOR LOUISE FRESCO. Previous relevant experience: Rabobank (Supervisory Director); Agriculture Department of the UN’s Food and Agriculture Organisation (Assistant director-general for agriculture). Current external appointments: Wageningen UR (President of the Executive Board)
JUDITH HARTMANN. Previous relevant experience: Bertelsmann SE & Co. KGaA (CFO); General Electric; The Walt Disney Company; RTL Group (NED); Penguin Random House (NED); Gruner + Jahr GmbH & Co KG (NED). Current external appointments: Suez (NED); ENGIE (CFO)
MARY MA. Previous relevant experience: TPG Capital (Partner); TPG China (Co-Chairman). Current external appointments: Boyu Capital (Managing Partner); MXZ Investment Limited (Director); Lenovo (NED); Securities and Futures Commission in Hong Kong (NED)
STRIVE MASIYIWA. Previous relevant experience: Africa Against Ebola Solidarity Trust (Co-Founder and Chairman); Grow Africa (Co-Chairman); Micronutrient Initiative (Chairman). Current external appointments: Econet Group (Founder and Executive Chairman); AGRA (Chairman); Rockefeller Foundation (Board member); US Council on Foreign Relations (Member Global Advisory Board); Africa Progress Panel (Board member); Asia Society (Trustee)
YOUNGME MOON. Previous relevant experience: Harvard Business School (Chairman and Senior Associated Dean for the MBA Program); Massachusetts Institute of Technology (Professor); American Red Cross (Board of Governors Member). Current external appointments: Avid Technology (NED); Rakuten (NED); Harvard Business School (Professor)
JOHN RISHTON. Previous relevant experience: Rolls-Royce Holdings plc (CEO); Royal Ahold N.V. (CEO, President and CFO); ICA AB (NED); Allied Domecq plc (NED); AeroSpace and Defence Trade Organisation (ASD) (Board member); British Airways plc (CFO). Current external appointments: Informa PLC (NED); Serco Group PLC (NED); Associated British Ports (NED)
FEIKE SIJBESMA. Previous relevant experience: Supervisory Board of DSM Netherlands (Chairman); Dutch Genomics Initiative (NGI) (Member); Utrecht University (Board member); Dutch Cancer Institute (NKI/AVL) (Board member). Current external appointments: Royal DSM N.V. (CEO and Chairman of the Managing Board); De Nederlandsche Bank (Member of the Supervisory Board); Carbon Pricing Leadership Coalition (Co-Chairman) and Climate Leader, convened by the World Bank Group
Unilever’s Group Secretary is Tonia Lovell and she was appointed in 2010.
OVERVIEW OF NON-EXECUTIVE DIRECTORS – INCLUDING DIVERSITY AND EXPERIENCE
| Marijn | Nils | Laura | Vittorio | Louise | Ann | Judith | Mary | Strive | Youngme | John | Feike | |||||||||||||
| Dekkers | Andersen | Cha | Colao | Fresco | Fudge | Hartmann | Ma | Masiyiwa | Moon | Rishton | Sijbesma | |||||||||||||
|
Age |
59 | 58 | 67 | 55 | 65 | 65 | 47 | 64 | 56 | 52 | 59 | 57 | ||||||||||||
|
Gender |
Male | Male | Female | Male | Female | Female | Female | Female | Male | Female | Male | Male | ||||||||||||
|
Nationality |
Dutch /
American |
Danish | Chinese | Italian | Dutch | American | Austrian | Chinese |
Zimbab-
wean |
American | British | Dutch | ||||||||||||
|
Appointment date |
April
2016 |
April
2015 |
May
2013 |
July
2015 |
May
2009 |
May
2009 |
April
2015 |
May
2013 |
April
2016 |
April
2016 |
May
2013 |
November
2014 |
||||||||||||
|
Committee membership* |
CC, NCGC | AC | CRC, NCGC | CC |
CRC
(Chairman) |
CC
(Chairman) |
AC | AC | CC | CRC |
AC
(Chairman) |
NCGC
(Chairman), CRC |
||||||||||||
|
Attendance at planned Board Meetings** |
3/3 | 6/6 | 6/6 | 6/6 | 6/6 | 6/6 | 6/6 | 6/6 | 3/3 | 3/3 | 6/6 | 6/6 | ||||||||||||
|
Attendance at ad hoc Board Meetings |
2/2 | 1/2 | 1/2 | 1/2 | 1/2 | 2/2 | 2/2 | 2/2 | 2/2 | 2/2 | 0/2 | 2/2 | ||||||||||||
|
Consumer |
✓ | ✓ | ✓ | ✓ | ✓ | ✓ | ✓ | ✓ | ✓ | |||||||||||||||
|
Sales & Marketing |
✓ | ✓ | ✓ | ✓ | ✓ | ✓ | ||||||||||||||||||
|
Geopolitical networks and insights |
✓ | ✓ | ✓ | ✓ | ✓ | ✓ | ✓ | ✓ | ✓ | ✓ | ||||||||||||||
|
Science & Technology |
✓ | ✓ | ✓ | ✓ | ✓ | ✓ | ||||||||||||||||||
|
Finance |
✓ | ✓ | ✓ | ✓ | ✓ | ✓ | ✓ | ✓ | ✓ | |||||||||||||||
| * | AC refers to the Audit Committee; CC refers to the Compensation Committee; CRC refers to the Corporate Responsibility Committee; and NCGC refers to the Nominating and Corporate Governance Committee. |
| ** | Attendance is expressed as the number of meetings attended out of the number eligible to be attended. |
| Annual Report on Form 20-F 2016 | Strategic Report | 3 |
Table of Contents
| CHIEF EX ECUTIVE OFFICER’S REVIEW | ||
| 4 | Strategic Report | Annual Report on Form 20-F 2016 |
Table of Contents
| UNILEVE R LEADERSHIP EXECUTIVE (ULE) | ||
FOR PAUL POLMAN AND GRAEME PITKETHLY SEE PAGE 3
|
|
|
|
|
|||
|
DAVID BLANCHARD Chief R&D Officer
|
MARC ENGEL Chief Supply Chain Officer |
KEVIN HAVELOCK President, Refreshment |
ALAN JOPE President, Personal Care |
|||
|
|
|
|
|
|||
|
Nationality British Age 52, Male Appointed to ULE January 2013 Joined Unilever 1986 Previous Unilever posts include: Unilever Research & Development (SVP); Unilever Canada Inc. (Chairman); Foods America (SVP Marketing Operations); Global Dressings (VP R&D); Margarine and Spreads (Director of Product Development) Current external appointments: Ingleby Farms and Forests (NED) |
Nationality Dutch Age 50, Male Appointed to ULE January 2016 Joined Unilever 1990 Previous Unilever posts include: Unilever East Africa and Emerging Markets (EVP); Chief Procurement Officer; Supply Chain, Spreads, Dressings and Olive Oil Europe (VP); Ice Cream Brazil (Managing Director); Ice Cream Brazil (VP); Corporate Strategy Group; Birds Eye Wall’s, Unilever UK (Operations Manager) Current external appointments: PostNL (Member of the Supervisory Board)
|
Nationality British Age 59, Male Appointed to ULE November 2011 Joined Unilever 1985 Previous Unilever posts include: Global Ice Cream Category (EVP); Unilever North America and Caribbean (EVP); Unilever France (Président Directeur Général); Unilever Arabia (Chairman); Unilever UK (Chairman) Current external appointments: Pepsi/Lipton JV (Co-Chairman) |
Nationality British Age 52, Male Appointed to ULE November 2011 Joined Unilever 1985 Previous Unilever posts include: Unilever Russia, Africa and Middle East (President); Unilever North Asia (President); SCC and Dressings (Global Category Leader); Home and Personal Care business in North America (President) |
|||
|
|
|
|
|
|||
|
KEES KRUYTHOFF President, North America
|
LEENA NAIR Chief Human Resources Officer |
NITIN PARANJPE President, Home Care |
RITVA SOTAMAA Chief Legal Officer |
|||
|
|
|
|
|
|||
|
Nationality Dutch Age 48, Male Appointed to ULE November 2011 Joined Unilever 1993 Previous Unilever posts include: Brazil (EVP); Unilever Foods South Africa (CEO); Unilever Bestfoods Asia (SVP and Board member) Current external appointments: Pepsi/Lipton JV (Board member); Enactus (Chairman) |
Nationality Indian Age 47, Female Appointed to ULE March 2016 Joined Unilever 1992 Previous Unilever posts include: HR Leadership and Organisational Development and Global Head of Diversity (SVP) |
Nationality Indian Age 53, Male Appointed to ULE October 2013 Joined Unilever 1987 Previous Unilever posts include: Hindustan Unilever Limited (CEO); Home and Personal Care, India (Executive Director); Home Care (VP); Fabric Wash (Category Head); Laundry and Household Cleaning, Asia (Regional Brand Director) |
Nationality Finnish Age 53, Female Appointed to ULE February 2013 Joined Unilever 2013 Previous posts include: Siemens AG – Siemens Healthcare (GC); General Electric Company – GE Healthcare (various positions including GE Healthcare Systems (GC)); Instrumentarium Corporation (GC) Current external appointments: Fiskars Corporation (NED)
|
|||
|
|
|
|
|
|||
|
AMANDA SOURRY President, Foods |
KEITH WEED Chief Marketing & Communications Officer
|
JAN ZIJDERVELD President, Europe |
||||
|
|
|
|
||||
|
Nationality British Age 53, Female Appointed to ULE October 2015 Joined Unilever 1985 Previous Unilever posts include: Global Hair (EVP); Unilever UK and Ireland (EVP and Chairman); Global Spreads and Dressings (EVP); Unilever US Foods (SVP) Current external appointments: PHV Corp. (NED) |
Nationality British Age 55, Male Appointed to ULE April 2010 Joined Unilever 1983 Previous Unilever posts include: Global Home Care and Hygiene (EVP); Lever Fabergé (Chairman); Hair and Oral Care (SVP) Current external appointments: Business in the Community International Board (Chairman); Business in the Community (Board member) |
Nationality Dutch Age 52, Male Appointed to ULE February 2011 Joined Unilever 1988 Previous Unilever posts include: South East Asia and Australasia (EVP); Unilever Middle East North Africa (Chairman); Nordic ice cream business (Chairman) Current external appointments: AIM (Vice-President); FoodDrinkEurope (Board member); Pepsi/Lipton JV (Board member); ECR Europe (Efficient Consumer Response) (Board member)
|
||||
|
|
|
|
||||
| Annual Report on Form 20-F 2016 | Strategic Report | 5 |
Table of Contents
| OUR MARKETS |
| 6 | Strategic Report | Annual Report on Form 20-F 2016 |
Table of Contents
| Annual Report on Form 20-F 2016 | Strategic Report | 7 |
Table of Contents
| 8 | Strategic Report | Annual Report on Form 20-F 2016 |
Table of Contents
| Annual Report on Form 20-F 2016 | Strategic Report | 9 |
Table of Contents
| OUR STRA TEGIC FOCUS |
|
WINNING WITH BRANDS AND INNOVATION
|
|
We are innovating to meet trends displaying high growth. For instance, Pure Leaf tea responds to the demand for natural ingredients, Sunsilk Hijab Recharge shampoo benefits Muslim women wearing hijabs, while Lux Silicone-Free and the recently launched Hellmann’s vegan mayonnaise provide ‘free-from’ alternatives.
Our ambition is to divide our innovation work as follows: 70% global brands at scale, such as Magnum and Axe; 20% global brands locally adapted, for example Knorr and Sunsilk; 10% local brands like Bango and Marmite.
We are focused on innovating in high-growth segments, creating our own disruptive technologies, innovating faster and being more agile locally. In 2016 43% of innovation turnover was driven by new technology which differentiates us from competitors, up by more than 20% in recent years. This is increasingly driven by collaboration with external parties through our global R&D, supply chain and procurement functions.
Marketing drives consumer-led growth but has to remain relevant. In 2016 we have trained more than 5,000 marketers globally with over 90,000 lessons through our Connected World Programme to increase the digital skills and understanding that are essential in a connected world.
We work closely with partners developing leading marketing and insight technology. Through Unilever Ventures, for example, we have invested in and partnered with Blis to provide geo-located mobile targeting services to drive footfall to our T2 tea stores. Technology also drives further efficiency in our € 8 billion annual marketing spend. For instance, ULTRA is our proprietary trading desk which allows programmatic planning and buying across digital platforms globally.
|
| 10 | Strategic Report | Annual Report on Form 20-F 2016 |
Table of Contents
|
WINNING IN THE MARKETPLACE
|
|
We lead market development by growing new channels with a focus on execution through our Perfect Stores programme.
We work with customers, such as large retail chains, to generate insights about who visits their stores using technology that creates detailed shopper profiles. This allows us to target and personalise campaigns. We also work closely with these customers for our new ‘Selling with Purpose’ programme, which will increase the number of touch-points in our distribution chain, thereby creating more employment opportunities for people across the world, and enabling our consumers to enjoy our brands with purpose, which in turn unlocks growth.
E-commerce grew 49% in 2016 and the direct to consumer channel expanded significantly, mainly through the acquisition of Dollar Shave Club, growing at 47% year-on-year.
Acquisitions are part of our relentless focus on actively managing our brand portfolio. They help preserve our market position in attractive segments where we can bring our global scale and local strengths to bear. They also bring us disruptive business models and business styles that are entrepreneurial, helping transform our business culture. Disposals liberate capital to reinvest in higher-growth segments in support of our objective of long-term growth.
|
|
WINNING THROUGH CONTINUOUS IMPROVEMENT
|
|
Key to Unilever meeting its growth ambitions is building agility and resilience into our organisation. We have three key initiatives within our Connected 4 Growth programme:
Organisational Change – a programme to make us faster, simpler, more consumer and customer-centric while unlocking capacity. It will make us more agile at lower cost with a more streamlined organisation. We are deploying more resource in global brand communities and local operations, with fewer layers in decision-making. It will allow us to leverage what can be done globally at scale while empowering people to take more effective action locally.
Zero-Based Budgeting (ZBB) – we have analysed expenditure and challenged what we spend, where and why to help drive value and growth. Having benchmarked Unilever to identify where we spend above and below peers, we have identified which activities can deliver savings and which have appropriate expenditure. ZBB, together with the Organisational Change programme, will aim to deliver at least € 1 billion of savings by 2018 and more than € 1 billion by 2019, to further support our business.
Net Revenue Management (NRM) – a detailed programme to optimise pricing which aims to drive additional volume as well as value. It ensures the right packs, at the right prices in the right channels to optimise differing buying opportunities. At the end of 2016 NRM had been applied to about 50% of our turnover since its introduction.
|
|
WINNING WITH PEOPLE
|
|
Our People strategy aims to ensure that we attract and retain the talent we require to achieve our strategic growth priorities. Our workforce, totalling around 169,000 people, is our most powerful resource to transform our business.
We are becoming a more agile and empowered organisation. By changing our structure, we are creating more capable leaders with more time to focus on their roles and we are inspiring our people through purpose, well-being and management. Our people are also key to delivering the USLP and contributing to its targets.
More details about Our People can be found on pages 20 and 21.
|
.
| Annual Report on Form 20-F 2016 | Strategic Report | 11 |
Table of Contents
THE BENEFITS THAT OUR VISION AND STRATEGY DELIVER TRANSLATE INTO PERFORMANCE FOR SHAREHOLDERS AND SOCIETY AT LARGE.
FINANCIAL PERFORMANCE
|
GROWING THE BUSINESS: GROUP
|
||||||
| TURNOVER GROWTH | OPERATING MARGIN | |||||
| 2016 | 2016 | |||||
| (1.0)% | 14.8% | |||||
|
2015: 10.0%
|
2015: 14.1%
|
|||||
| UNDERLYING SALES GROWTH * | UNDERLYING VOLUME GROWTH * | CORE OPERATING MARGIN * | FREE CASH FLOW * | |||
| 2016 | 2016 | 2016 | 2016 | |||
| 3.7% | 0.9% | 15.3% | € 4.8 billion | |||
| 2015: 4.1% | 2015: 2.1% | 2015: 14.8% | 2015: € 4.8 billion | |||
|
Underlying sales growth averaged 4.4% over five years. |
Underlying volume growth averaged 2.0% over five years. |
Core operating margin has steadily increased over five years from 13.7% to 15.3%.
|
Unilever has generated free cash flow of € 20.9 billion over five years.
|
|||
|
GROWING THE BUSINESS: CATEGORIES
|
||||||
| PERSONAL CARE | FOODS | HOME CARE | REFRESHMENT | |||
| Turnover | Turnover | Turnover | Turnover | |||
| € 20.2 billion | € 12.5 billion | € 10.0 billion | € 10.0 billion | |||
| 2015: € 20.1 billion | 2015: € 12.9 billion | 2015: € 10.2 billion | 2015: € 10.1 billion | |||
| Turnover growth | Turnover growth | Turnover growth | Turnover growth | |||
| 0.5% | (3.1)% | (1.5)% | (1.1)% | |||
| 2015: 13.2% | 2015: 4.5% | 2015: 10.9% | 2015: 10.3% | |||
| Underlying sales growth | Underlying sales growth | Underlying sales growth | Underlying sales growth | |||
| 4.2% | 2.1% | 4.9% | 3.5% | |||
| 2015: 4.1% | 2015: 1.5% | 2015: 5.9% | 2015: 5.4% | |||
| Operating margin | Operating margin | Operating margin | Operating margin | |||
| 18.4% | 17.4% | 9.5% | 9.7% | |||
| 2015: 18.1% | 2015: 17.8% | 2015: 7.3% | 2015: 8.3% | |||
| Core operating margin | Core operating margin | Core operating margin | Core operating margin | |||
| 19.1% | 17.9% | 9.7% | 9.9% | |||
| 2015: 18.9% |
2015: 18.2%
|
2015: 7.6% | 2015: 9.4% | |||
| * | Key Financial Indicators. |
Underly ing sales growth, underlying volume growth, core operating margin and free cash flow are non-GAAP measures. For further information about these measures, and the reasons why we believe they are important for an understanding of the performance of the business, please refer to our commentary on non-GAAP measures on pages 26 to 28.
| 12 | Strategic Report | Annual Report on Form 20-F 2016 |
Table of Contents
UNILEVER SUSTAINABLE LIVING PLAN
|
IMPROVING HEALTH AND WELL-BEING
|
ENHANCING LIVELIHOODS
|
|||||||
|
By 2020 we will help more than a billion people take action to improve their health and well-being.
|
By 2020 we will enhance the livelihoods of millions of people as we grow our business. |
|||||||
|
HEALTH AND HYGIENE
TARGET By 2020 we will help more than a billion people to improve their health and hygiene. This will help reduce the incidence of life-threatening diseases like diarrhoea.
PERFORMANCE Around 538 million people reached by end 2016 through our programmes on handwashing, safe drinking water, oral health, sanitation and self-esteem. |
NUTRITION
TARGET By 2020 we will double the proportion of our portfolio that meets the highest nutritional standards, based on globally recognised dietary guidelines. This will help hundreds of millions of people to achieve a healthier diet.
PERFORMANCE 35% of our portfolio by volume met the highest nutritional standards in 2016, based on globally recognised dietary guidelines. |
FAIRNESS IN THE WORKPLACE
TARGET By 2020 we will advance human rights across our operations and extended supply chain.
PERFORMANCE 67% of procurement spend through suppliers meeting mandatory requirements of our Responsible Sourcing Policy.
We continued to embed human rights with a focus on our eight salient human rights issues which are documented in our 2015 Human Rights Report.
Our Total Recordable Frequency Rate for 2016 was 1.01 per million hours worked (2015: 1.12).** ◇ f
Engagement score among 6,228 employees surveyed in 2016 was 76% (2015: 77%).** ‡
|
OPPORTUNITIES FOR WOMEN
TARGET By 2020 we will empower 5 million women.
PERFORMANCE
We enabled around 920,000 women to access initiatives aiming to promote their safety, develop their skills and expand their
opportunities.
The percentage of persons of each sex who were Unilever managers was 54% male and 46% female (2015: 55% male and 45% female).** |
INCLUSIVE BUSINESS
TARGET By 2020 we will have a positive impact on the lives of 5.5 million people.
PERFORMANCE
In 2016 we enabled around 650,000 smallholder farmers and 1.5 million small-scale retailers to access initiatives aiming to improve their agricultural practices or
increase their incomes.
|
||||

|
REDUCING ENVIRONMENTAL IMPACT
|
||||||
|
By 2030 our goal is to halve the environmental footprint of the making and use of our products as we grow our business.
|
||||||
|
GREENHOUSE GASES
TARGET Halve the greenhouse gas impact of our products across the lifecycle by 2030.
PERFORMANCE
OUR OPERATIONS We produced 83.52 kg CO 2 from energy per tonne of manufacturing production (2015: 88.49kg).** ◇ f
OUR PRODUCTS’ LIFECYCLE Our greenhouse gas impact per consumer use has increased by around 8% since 2010. q |
WATER
TARGET Halve the water associated with the consumer use of our products by 2020.
PERFORMANCE
OUR OPERATIONS We used 1.85m 3 water per tonne of manufacturing production (2015: 1.88m 3 ).** ◇ f
OUR PRODUCTS IN USE Our water impact per consumer use has reduced by around 7% since 2010. |
WASTE
TARGET Halve the waste associated with the disposal of our products by 2020.
PERFORMANCE
OUR OPERATIONS We sent for disposal 0.35kg of total waste per tonne of manufacturing production (2015: 0.26kg).** ◇ f
OUR PRODUCTS AT DISPOSAL Our waste impact per consumer use has reduced by around 28% since 2010. ◇ q
|
SUSTAINABLE SOURCING
TARGET By 2020 we will source 100% of our agricultural raw materials sustainably.
PERFORMANCE 51% of agricultural raw materials sustainably sourced by end of 2016 (2015: 60%). y This includes 48% as physical sustainable sources (2015: 39%) and 3% in the form of certificates used mainly in soy and sugar (2015: 3%). In 2016, we stopped buying GreenPalm certificates (2015: 18%). See Society (page 18) for an explanation. |
|||
| ** | Key Non-Financial Indicators. |
| ◇ | PricewaterhouseCoopers (PwC) assured. For details and the basis of preparation see www.unilever.com/ara2016/downloads. |
| f | Measured 1 October – 30 September. |
| ‡ | Full Global People Survey not undertaken in 2015. Comparator is for full survey among managers in 2014. |

|
Around 300,000 women have accessed initiatives under both the Inclusive Business and the Opportunities for Women pillars in 2016. |
| q | The 2010 baseline has been restated by a reduction of 0.2g CO 2 per consumer use for Greenhouse Gases and a reduction of 0.04g per consumer use for Waste. |
| y | In 2016 had we continued to buy GreenPalm certificates our overall sustainable sourcing performance in 2016 would have been 66%. |
| For more details see www.unilever.com/sustainable-living. |
| Annual Report on Form 20-F 2016 | Strategic Report | 13 |
Table of Contents
| DELIVERING VALUE FOR OUR STAKEHOLDERS | ||
| 14 | Strategic Report | Annual Report on Form 20-F 2016 |
Table of Contents
| Annual Report on Form 20-F 2016 | Strategic Report | 15 |
Table of Contents
DELIVERING VALUE FOR OUR STAKEHOLDERS CONTINUED
| 16 | Strategic Report | Annual Report on Form 20-F 2016 |
Table of Contents
| Annual Report on Form 20-F 2016 | Strategic Report | 17 |
Table of Contents
| DELIVERING VALUE FOR OUR STAKEHOLDERS CONTINUED |
| 18 | Strategic Report | Annual Report on Form 20-F 2016 |
Table of Contents
THE GLOBAL GOALS FOR SUSTAINABLE DEVELOPMENT
Through our Unilever Sustainable Living Plan, Sustainable Living brands and our transformational change agenda we contribute to the Global Goals.
|
GLOBAL GOALS
|
RELATED USLP PILLARS |
|
|
Goal 1: No poverty |
Fairness in the workplace Inclusive business Opportunities for women
|
|
|
Goal 2: Zero hunger |
Improving nutrition Inclusive business Opportunities for women Sustainable sourcing
|
|
|
Goal 3: Good health and well-being |
Fairness in the workplace Health & hygiene Improving nutrition
|
|
|
Goal 4: Quality education |
Inclusive business Opportunities for women Sustainable sourcing
|
|
|
Goal 5: Gender equality |
Opportunities for women
|
|
|
Goal 6: Clean water and sanitation |
Health & hygiene Water use
|
|
|
Goal 7: Affordable and clean energy |
Greenhouse gases
|
|
|
Goal 8: Decent work and economic growth |
All USLP pillars
|
|
|
Goal 9: Industry, innovation and infrastructure |
Greenhouse gases Inclusive business Opportunities for women Waste & packaging Water use
|
|
|
Goal 10: Reduce inequality |
Fairness in the workplace Opportunities for women Inclusive business
|
|
|
Goal 11: Sustainable cities and communities |
Health & hygiene Waste & packaging
|
|
|
Goal 12: Responsible consumption and production |
Greenhouse gases Waste & packaging Water use
|
|
|
Goal 13: Climate action |
Greenhouse gases Sustainable sourcing Water use
|
|
|
Goal 14: Life below water |
Waste & packaging
|
|
|
Goal 15: Life on land |
Sustainable sourcing
|
|
|
Goal 16: Peace, justice and strong institutions |
Fairness in the workplace
|
|
|
Goal 17: Partnerships for the goals |
All USLP pillars
|
| Annual Report on Form 20-F 2016 | Strategic Report | 19 |
Table of Contents
DELIVERING VALUE FOR OUR STAKEHOLDERS CONTINUED
| 20 | Strategic Report | Annual Report on Form 20-F 2016 |
Table of Contents
| Annual Report on Form 20-F 2016 | Strategic Report | 21 |
Table of Contents
| DELIVERING VALUE FOR OUR STAKEHOLDERS CONTINUED |
| 22 | Strategic Report | Annual Report on Form 20-F 2016 |
Table of Contents
| FINANCIAL REVIEW |
FINANCIAL OVERVIEW 2016
Turnover declined 1.0% to € 52.7 billion including a negative currency impact of 5.1% (2015: 5.9% favourable currency impact) primarily from Latin America and the UK. Underlying sales growth was 3.7% (2015: 4.1%) coming from volume growth of 0.9% (2015: 2.1%) and price growth of 2.8% (2015: 1.9%). Acquisitions and disposals had a positive impact of 0.6% (2015: negative 0.1%) coming from the businesses acquired in the last two years including Dermalogica, Murad, Dollar Shave Club, Zest & Camay and Seventh Generation. Emerging markets contributed 57% of total turnover with underlying sales growth of 6.5% (2015: 7.1%) driven by price growth of 5.4% (2015: 4.3%). Developed markets underlying sales growth declined by 0.2% with volume growth in North America offset by negative pricing in Europe.
Core operating margin improved 0.5 percentage points to 15.3%. Gross margin improved 0.5 percentage points driven by margin-accretive innovation, acquisitions and savings programmes. Brand and marketing investment as a percentage of turnover was down 0.4 percentage points due to sales leverage and efficiencies from Zero Based Budgeting. Higher gross margin and lower brand and marketing investment were partially offset by a 0.4 percentage points increase in overheads driven by increased restructuring costs related to the implementation of the ‘Connected 4 Growth’ programme and the higher overheads ratio of acquired businesses.
Operating profit was up 3.8% at € 7.8 billion (2015: € 7.5 billion) including € 245 million (2015: € 350 million) of non-core charges mainly being acquisition and disposal-related costs and losses on business disposals.
Highlights for the year ended 31 December
| 2016 | 2015 |
%
|
||||||||||
|
Turnover ( € million) |
52,713 | 53,272 | (1 | ) | ||||||||
|
Operating profit ( € million) |
7,801 | 7,515 | 4 | |||||||||
|
Core operating profit ( € million)* |
8,046 | 7,865 | 2 | |||||||||
|
Profit before tax ( € million) |
7,469 | 7,220 | 3 | |||||||||
|
Net profit ( € million) |
5,547 | 5,259 | 6 | |||||||||
|
Diluted earnings per share ( € ) |
1.82 | 1.72 | 6 | |||||||||
|
Core earnings per share ( € )* |
1.88 | 1.82 | 3 | |||||||||
Net cost of financing borrowings was € 469 million compared with € 372 million in 2015. The increase was driven by higher borrowing levels and reduced interest on cash deposits. The average interest rate on net debt increased to 3.5% compared with 3.0% in 2015. The charge for pension financing decreased by € 27 million to € 94 million (2015: € 121 million) as a result of a lower net deficit at the beginning of the year.
The effective tax rate was 26.2% compared with 27.6% in 2015. This included the impact of favourable tax audit settlements.
Net profit from joint ventures and associates contributed € 127 million compared with € 107 million in 2015 due to higher profits from the Pepsi Lipton joint venture. Other income from non-current investment and associates increased to € 104 million compared with € 91 million in 2015, primarily driven by a gain of € 107 million from the sale of financial assets. Diluted earnings per share increased by 5.7% to € 1.82 largely due to improved margin. Core earnings per share increased by 3.1% to € 1.88 including an adverse currency impact of 3.7%.
The independent auditors’ reports issued by KPMG Accountants N.V. and KPMG LLP on the consolidated results of the Group, as set out in the financial statements, were unqualified and contained no exceptions or emphasis of matter. For more details see pages 79 to 83.
The consolidated financial statements have been prepared in accordance with IFRS as adopted by the EU and IFRS as issued by the International Accounting Standards Board. The critical accounting policies and those that are most significant in connection with our financial reporting are set out in note 1 on pages 88 to 90 and are consistent with those applied in 2015.
| * | Certain measures used in our reporting are not defined under IFRS. For further information about these measures, please refer to the commentary on non-GAAP measures on pages 26 to 28. |
| Annual Report on Form 20-F 2016 | Strategic Report | 23 |
Table of Contents
FINANCIAL REVIEW CONTINUED
| 24 | Strategic Report | Annual Report on Form 20-F 2016 |
Table of Contents
| Annual Report on Form 20-F 2016 | Strategic Report | 25 |
Table of Contents
FINANCIAL REVIEW CONTINUED
| 26 | Strategic Report | Annual Report on Form 20-F 2016 |
Table of Contents
| Annual Report on Form 20-F 2016 | Strategic Report | 27 |
Table of Contents
FINANCIAL REVIEW CONTINUED
| 28 | Strategic Report | Annual Report on Form 20-F 2016 |
Table of Contents

| Annual Report on Form 20-F 2016 | Governance | 29 |
Table of Contents
CORPORATE GOVERNANCE CONTINUED
| 30 | Governance | Annual Report on Form 20-F 2016 |
Table of Contents

| Annual Report on Form 20-F 2016 | Governance | 31 |
Table of Contents
CORPORATE GOVERNANCE CONTINUED
| 32 | Governance | Annual Report on Form 20-F 2016 |
Table of Contents
| Annual Report on Form 20-F 2016 | Governance | 33 |
Table of Contents
CORPORATE GOVERNANCE CONTINUED
| 34 | Governance | Annual Report on Form 20-F 2016 |
Table of Contents
| Annual Report on Form 20-F 2016 | Governance | 35 |
Table of Contents
| 36 | Governance | Annual Report on Form 20-F 2016 |
Table of Contents
| Annual Report on Form 20-F 2016 | Governance | 37 |
Table of Contents
RISKS CONTINUED
|
DESCRIPTION OF RISK |
|
BRAND PREFERENCE
As a branded goods business, Unilever’s success depends on the value and relevance of our brands and products to consumers around the world and on our ability to innovate and remain competitive.
Consumer tastes, preferences and behaviours are constantly changing and Unilever’s ability to anticipate and respond to these changes and to continue to differentiate our brands and products is vital to our business.
We are dependent on creating innovative products that continue to meet the needs of our consumers. If we are unable to innovate effectively, Unilever’s sales or margins could be materially adversely affected.
|
|
PORTFOLIO MANAGEMENT
Unilever’s strategic investment choices will affect the long-term growth and profits of our business.
Unilever’s growth and profitability are determined by our portfolio of categories, geographies and channels and how these evolve over time. If Unilever does not make optimal strategic investment decisions then opportunities for growth and improved margin could be missed.
|
|
SUSTAINABILITY
The success of our business depends on finding sustainable solutions to support long-term growth.
Unilever’s Vision to accelerate growth in the business while reducing our environmental footprint and increasing our positive social impact will require more sustainable ways of doing business. In a world where resources are scarce and demand for them continues to increase it is critical that we succeed in reducing our resource consumption and converting to sustainably sourced supplies. In doing this we are dependent on the efforts of partners and various certification bodies. We are also committed to improving health and well-being and enhancing livelihoods around the world so Unilever and our communities grow successfully together. There can be no assurance that sustainable business solutions will be developed and failure to do so could limit Unilever’s growth and profit potential and damage our corporate reputation.
|
|
CLIMATE CHANGE
Climate changes and governmental actions to reduce such changes may disrupt our operations and/or reduce consumer demand for our products.
Climate changes are occurring around the globe which may impact our business in various ways.
They could lead to water shortages which would reduce demand for those of our products that require a significant amount of water during consumer use. They could also lead to an increase in raw material prices or reduced availability.
Governments may take action to reduce climate change such as the introduction of a carbon tax which could impact our business through higher costs or reduced flexibility of operations.
Climate change could result therefore in making products less affordable or less available for our consumers resulting in reduced growth and profitability.
|
| 38 | Governance | Annual Report on Form 20-F 2016 |
Table of Contents
|
DESCRIPTION OF RISK |
|
CUSTOMER RELATIONSHIPS
Successful customer relationships are vital to our business and continued growth.
Maintaining strong relationships with our existing customers and building relationships with new customers who serve changing shopper habits are necessary to ensure our brands are well presented to our consumers and available for purchase at all times.
The strength of our customer relationships also affects our ability to obtain pricing and competitive trade terms. Failure to maintain strong relationships with customers could negatively impact our terms of business with affected customers and reduce the availability of our products to consumers.
|
|
TALENT AND ORGANISATION
A skilled workforce and agile organisation are essential for the continued success of our business.
Our ability to attract, develop, organise and retain the right number of appropriately qualified people is critical if we are to compete and grow effectively.
This is especially true in our key emerging markets where there can be a high level of competition for a limited talent pool. The loss of management or other key personnel or the inability to identify, attract and retain qualified personnel could make it difficult to manage the business and could adversely affect operations and financial results.
|
|
SUPPLY CHAIN
Our business depends on purchasing materials, efficient manufacturing and the timely distribution of products to our customers.
Our supply chain network is exposed to potentially adverse events such as physical disruptions, environmental and industrial accidents or bankruptcy of a key supplier which could impact our ability to deliver orders to our customers.
The cost of our products can be significantly affected by the cost of the underlying commodities and materials from which they are made. Fluctuations in these costs cannot always be passed on to the consumer through pricing.
|
|
SAFE AND HIGH QUALITY PRODUCTS
The quality and safety of our products are of paramount importance for our brands and our reputation.
The risk that raw materials are accidentally or maliciously contaminated throughout the supply chain or that other product defects occur due to human error, equipment failure or other factors cannot be excluded.
|
| Annual Report on Form 20-F 2016 | Governance | 39 |
Table of Contents
RISKS CONTINUED
|
DESCRIPTION OF RISK |
|
SYSTEMS AND INFORMATION
Unilever’s operations are increasingly dependent on IT systems and the management of information.
Increasing digital interactions with customers, suppliers and consumers place ever greater emphasis on the need for secure and reliable IT systems and infrastructure and careful management of the information that is in our possession.
Disruption of our IT systems could inhibit our business operations in a number of ways, including disruption to sales, production and cash flows, ultimately impacting our results.
There is also a threat from unauthorised access and misuse of sensitive information. Unilever’s information systems could be subject to unauthorised access or the mistaken disclosure of information which disrupts Unilever’s business and/or leads to loss of assets.
|
|
BUSINESS TRANSFORMATION
Successful execution of business transformation projects is key to delivering their intended business benefits and avoiding disruption to other business activities.
Unilever is continually engaged in major change projects, including acquisitions, disposals and organisational transformation, to drive continuous improvement in our business and to strengthen our portfolio and capabilities.
Failure to execute such transactions or change projects successfully could result in under-delivery of the expected benefits. Furthermore, disruption may be caused in other parts of the business.
|
|
ECONOMIC AND POLITICAL INSTABILITY
Unilever operates around the globe and is exposed to economic and political instability that may reduce consumer demand for our products, disrupt sales operations and/or impact the profitability of our operations.
Adverse economic conditions may affect one or more countries within a region, or may extend globally.
Government actions such as foreign exchange or price controls can impact on the growth and profitability of our local operations.
In 2016, more than half of Unilever’s turnover came from emerging markets which can offer greater growth opportunities but also expose Unilever to related economic and political volatility.
|
| 40 | Governance | Annual Report on Form 20-F 2016 |
Table of Contents
|
DESCRIPTION OF RISK |
|
TREASURY AND PENSIONS
Unilever is exposed to a variety of external financial risks in relation to Treasury and Pensions.
The relative values of currencies can fluctuate widely and could have a significant impact on business results. Further, because Unilever consolidates its financial statements in euros it is subject to exchange risks associated with the translation of the underlying net assets and earnings of its foreign subsidiaries.
We are also subject to the imposition of exchange controls by individual countries which could limit our ability to import materials paid in foreign currency or to remit dividends to the parent company.
Unilever may face liquidity risk, ie difficulty in meeting its obligations, associated with its financial liabilities. A material and sustained shortfall in our cash flow could undermine Unilever’s credit rating, impair investor confidence and also restrict Unilever’s ability to raise funds.
We are exposed to market interest rate fluctuations on our floating rate debt. Increases in benchmark interest rates could increase the interest cost of our floating rate debt and increase the cost of future borrowings.
In times of financial market volatility, we are also potentially exposed to counter-party risks with banks, suppliers and customers.
Certain businesses have defined benefit pension plans, most now closed to new employees, which are exposed to movements in interest rates, fluctuating values of underlying investments and increased life expectancy. Changes in any or all of these inputs could potentially increase the cost to Unilever of funding the schemes and therefore have an adverse impact on profitability and cash flow.
|
|
ETHICAL
Acting in an ethical manner, consistent with the expectations of customers, consumers and other stakeholders, is essential for the protection of the reputation of Unilever and its brands.
Unilever’s brands and reputation are valuable assets and the way in which we operate, contribute to society and engage with the world around us is always under scrutiny both internally and externally. Despite the commitment of Unilever to ethical business and the steps we take to adhere to this commitment, there remains a risk that activities or events cause us to fall short of our desired standard, resulting in damage to Unilever’s corporate reputation and business results.
|
|
LEGAL AND REGULATORY
Compliance with laws and regulations is an essential part of Unilever’s business operations.
Unilever is subject to national and regional laws and regulations in such diverse areas as product safety, product claims, trademarks, copyright, patents, competition, employee health and safety, the environment, corporate governance, listing and disclosure, employment and taxes.
Failure to comply with laws and regulations could expose Unilever to civil and/or criminal actions leading to damages, fines and criminal sanctions against us and/or our employees with possible consequences for our corporate reputation.
Changes to laws and regulations could have a material impact on the cost of doing business. Tax, in particular, is a complex area where laws and their interpretation are changing regularly, leading to the risk of unexpected tax exposures. International tax reform remains a key focus of attention with the OECD’s Base Erosion & Profit Shifting project and further potential tax reform in the EU and the United States.
|
| Annual Report on Form 20-F 2016 | Governance | 41 |
Table of Contents
| 42 | Governance | Annual Report on Form 20-F 2016 |
Table of Contents
| Annual Report on Form 20-F 2016 | Governance | 43 |
Table of Contents
REPORT OF THE CORPORATE RESPONSIBILITY COMMITTEE
| 44 | Governance | Annual Report on Form 20-F 2016 |
Table of Contents
| Annual Report on Form 20-F 2016 | Governance | 45 |
Table of Contents
CORPORATE GOVERNANCE COMMITTEE
| 46 | Governance | Annual Report on Form 20-F 2016 |
Table of Contents
| Annual Report on Form 20-F 2016 | Governance | 47 |
Table of Contents
DIRECTORS’ REMUNERATION REPORT
| 48 | Governance | Annual Report on Form 20-F 2016 |
Table of Contents
| Annual Report on Form 20-F 2016 | Governance | 49 |
Table of Contents
DIRECTORS’ REMUNERATION REPORT CONTINUED
| 50 | Governance | Annual Report on Form 20-F 2016 |
Table of Contents
AT A GLANCE: HOW THE REMUNERATION POLICY WILL BE APPLIED TO EXECUTIVE DIRECTORS IN 2017
The table below sets out a summary of the new remuneration structure that will apply during the 2017 financial year subject to shareholder approval at our 2017 AGMs. Further details are set out in the Directors’ Remuneration Policy on pages 65-77.
| CEO | CFO | |||
| Base salary | £1,010,000 | £656,250 | ||
| No change | Increase of 5% from current £625,000 | |||
| Fixed allowances | Fixed allowance –£250,000 | Fixed allowance – £200,000 | ||
| and other benefits | Other benefits operated in line with policy | Other benefits operated in line with policy | ||
| No change | No change | |||
| Annual bonus | 120% of base salary at target, 200% at maximum | 100% of base salary at target, 150% at maximum | ||
| No change | No change | |||
| MCIP | Can invest up to the value of 60% of the gross 2016 annual bonus into the MCIP. | |||
| MCIP awards matching shares in the range of zero to 150% based on Unilever’s performance over 4 years. | ||||
| Performance period has increased from current 3 years and has revised performance measures. | ||||
| GSIP | Target award: 200% of salary, | Target award: 150% of salary, | ||
| Maximum award: 400% of salary | Maximum award: 300% of salary | |||
| Performance assessed over 3 years with | Performance assessed over 3 years with | |||
| a subsequent 2 year holding period | a subsequent 2 year holding period | |||
| Holding period is an additional requirement | Holding period is an additional requirement | |||
| under the new Remuneration Policy | under the new Remuneration Policy | |||
| Conditional | £117,123 | n/a | ||
| supplemental | No change | No change | ||
| pension | ||||
| Shareholding | 5 x base salary = £5.05m | 4 x base salary = £2.625m | ||
| requirement | Increase from 4 x salary | Increase from 3 x salary | ||
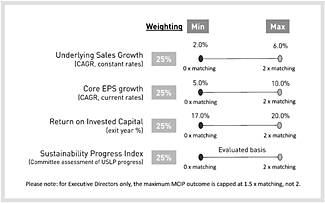
INCENTIVE PERFORMANCE MEASURES
Performance measures for Executive Directors that will apply to MCIP and GSIP granted in 2017 and the 2017 bonus are as follows:
Performance target ranges for the Annual Bonus are considered to be commercially sensitive and will be disclosed in full in the 2017 DRR.
| MCIP 2017 TARGETS | GSIP 2017 TARGETS | |
| Performance conditions are assessed over a four-year period. The performance conditions and target ranges for 2017 are as follows: | Performance conditions are assessed over a three-year period. The performance conditions and target ranges for 2017 are as follows: | |
|
|

|
|
| Annual Report on Form 20-F 2016 | Governance | 51 |
Table of Contents
DIRECTORS’ REMUNERATION REPORT CONTINUED
DIRECTORS’ REMUNERATION POLICY
POLICY REPORT
POLICY TABLE
The following sets out our new Directors’ Remuneration Policy (the Remuneration Policy). This new Remuneration Policy will be presented for approval by shareholders at the April 2017 AGMs and, if approved, applies to payments made after that date and replaces the existing remuneration policy in its entirety. It is intended that the new Remuneration Policy will apply for three years, although the Compensation Committee may seek approval for a new policy at an earlier point if it is considered appropriate. The supporting information section provides the rationale for any changes from the existing remuneration policy where appropriate.
|
BASE SALARY
|
||
|
PURPOSE AND LINK TO STRATEGY Supports the recruitment and retention of Executive Directors of the calibre required to implement our strategy. Reflects the individual’s skills, experience, performance and role within the Group.
OPERATION Set by the Boards on the recommendation of the Committee and generally reviewed once a year, with any changes usually effective from 1 January (although changes may be made at any other time if the Committee considers that is appropriate).
Salary is paid in cash and is generally paid monthly.
Salary is set at an appropriate level to attract and retain Executive Directors of the required calibre, taking into account:
i. our policy generally to pay at around the median of an appropriate peer group of other global companies of a similar financial size and complexity to Unilever;*
ii. the individual’s skills, experience and performance; and
iii. pay and conditions across the wider organisation. |
OPPORTUNITY Any increases will normally be in line with the range of increases awarded to other employees within the Group.
Increases may be above this level or applied more frequently in certain circumstances, such as: • where there is, in the Committee’s opinion, a significant change in an Executive Director’s scope or role; • where a new Executive Director has been appointed to the Boards on a salary lower than the typical market level for such a role and becomes established in the role; and • where it is considered necessary to reflect significant changes in market practice.
The maximum aggregate increase for the current Executive Directors during the time in which this policy applies will be no higher than 15%. This excludes the proposed increase of salary for the CFO for 2017.
PERFORMANCE MEASURES n/a.
SUPPORTING INFORMATION A cap on the aggregate increase in salary over the duration of this Remuneration Policy has been set at 15% (excluding the 5% salary increase for the CFO set out in the Letter from the Chair). There are no other changes relative to the previous Remuneration Policy.
|
|
|
FIXED ALLOWANCE
|
||
|
PURPOSE AND LINK TO STRATEGY Provides a simple competitive alternative to the provision of itemised benefits and pension, not linked to base salary.
OPERATION The fixed allowance is reviewed periodically by the Committee and changes are usually effective from 1 January.
Set at an appropriate level taking into account the median of an appropriate peer group in line with the approach to base salary and individual circumstances (such as whether they have been required to relocate to undertake their role).
Normally, paid monthly in cash.
|
OPPORTUNITY The fixed allowance will not exceed the value of current allowance provided as follows: • CEO – £250,000 • CFO – £200,000.
PERFORMANCE MEASURES n/a.
SUPPORTING INFORMATION A cap on the fixed allowance has been set at the current levels provided. There are no other changes relative to the previous Remuneration Policy. |
| 52 | Governance | Annual Report on Form 20-F 2016 |
Table of Contents
|
BENEFITS
|
||
|
PURPOSE AND LINK TO STRATEGY Provides certain benefits on a cost-effective basis to aid attraction and retention of Executive Directors.
OPERATION Provision of death, disability and medical insurance cover, directors’ liability insurance and actual tax return preparation costs. Other benefits may be provided in the future where it is considered necessary by the Committee and/or required by legislation.
In the event that Unilever were to require an existing or new Executive Director to relocate, Unilever may pay appropriate relocation allowances for a specified time period of no more than three years. This may cover costs such as (but not limited to) relocation, cost of living, housing benefit, home leave, tax and social security equalisation and education assistance.
In line with the commitments made to the current CEO upon recruitment, Unilever pays the social security obligation in the CEO’s country of residence to protect him against the difference between the employee social security obligations in his country of residence versus the UK. He also receives a conditional supplemental pension accrual to compensate him for the arrangement forfeited on leaving his previous employer. This supplemental pension accrual is conditional on the CEO remaining in employment with Unilever to age 60 and subsequently retiring from active service or his death or total disability prior to retirement.
Executive Directors are entitled to participate on the same terms as all UK employees in the Unilever PLC ShareBuy plan.
|
OPPORTUNITY Based on the cost to Unilever of providing the benefit and dependent on individual circumstances.
Relocation allowances – the level of such benefits would be set at an appropriate level by the Committee, taking into account the circumstances of the individual and typical market practice.
Social security obligation in the current CEO’s country of residence dependent on earnings and rates of social security.
The supplemental pension accrual for the CEO is capped from 2012 onwards at £117,123.
Awards under the all-employee Unilever PLC ShareBuy Plan may be up to HMRC-approved limits. The only change in the value of the current benefits (for single figure purposes) will reflect changes in the costs of providing those benefits.
PERFORMANCE MEASURES n/a.
SUPPORTING INFORMATION The ability to provide additional benefits has been restricted to only instances that the Committee considers are necessary or legally required. |
| * | The current peer group includes AstraZeneca, BASF, Bayer, BHP Billiton, BMW (XET), BP, British American Tobacco, BT, Carrefour, Centrica, Daimler (XET), Danone, Diageo, GlaxoSmithKline, Henkel (XET), Imperial Brands, L’Oréal, Metro, National Grid, Nestlé, Novartis, Reckitt Benckiser, Rio Tinto, Roche, Royal Dutch Shell, SABMiller, Sanofi, Siemens, Tesco, Total and Volkswagen. The peer group used for benchmarking purposes is reviewed regularly and companies are added and/or removed at the Committee’s discretion to ensure that it remains appropriate. |
| Annual Report on Form 20-F 2016 | Governance | 53 |
Table of Contents
DIRECTORS’ REMUNERATION REPORT CONTINUED
|
ANNUAL BONUS
|
||
|
PURPOSE AND LINK TO STRATEGY Incentivises year-on-year delivery of stretching short-term financial, strategic and operational objectives selected to support our annual business strategy and the ongoing enhancement of shareholder value.
The ability to recognise performance through annual bonus enables us to control our cost base flexibly and react to events and market circumstances.
OPERATION Each year Executive Directors may have the opportunity to participate in the annual bonus plan. Executive Directors are set a target opportunity that is assessed against the Business Performance Multiplier of up to 150% of target opportunity at the end of the year.
Executive Directors’ personal performance is also assessed at the year end and may result in a Personal Performance Multiplier of up to 150%.
The Business and Personal Performance Multipliers cannot result in a bonus payout greater than the maximum set out in this Remuneration Policy.
Unless otherwise determined by the Committee, Executive Directors are required to invest at least 25% and can invest up to a maximum of 60% of their gross annual bonus into Unilever shares under the MCIP (see the MCIP section on page 55).
Ultimate remedy/malus and claw-back provisions apply (see details on page 57). |
OPPORTUNITY Target bonus opportunities (as a percentage of base salary) are: • CEO – 120% • Other Executive Directors – 100%
Maximum bonus opportunities (as a percentage of base salary) are: • CEO – 200% • Other Executive Directors – 150%
Achievement of threshold performance results in a payout of 0% of the maximum opportunity, with straight-line vesting between threshold and maximum.
PERFORMANCE MEASURES The Business Performance Multiplier is based on a range of business metrics set by the Committee on an annual basis to ensure that they are appropriately stretching for the delivery of threshold, target and maximum performance. These performance measures may include underlying sales growth (USG), core operating margin improvement (COM) and free cash flow (FCF).
The Committee has discretion to adjust the formulaic outcome of the Business Performance Multiplier up or down by up to plus or minus 25%, based on results, if it believes this better reflects the underlying performance of Unilever. In any event, the overall Business Performance Multiplier will not exceed 150%. The use of any discretion will be fully disclosed in the Remuneration Report for the year to which discretion relates.
When determining pay-outs the Committee will also consider performance against personal performance goals and the quality of results delivered in terms of both business results and leadership.
The Committee may introduce non-financial measures in the future subject to a minimum of 70% of targets being financial in nature.
Performance is normally measured over the financial year.
SUPPORTING INFORMATION The maximum Personal Performance Multiplier is 150%. The Committee’s discretion to adjust the formulaic outcome of the Business Performance Multiplier up or down has been capped at 25%. There are no other changes relative to the previous Remuneration Policy.
|
| 54 | Governance | Annual Report on Form 20-F 2016 |
Table of Contents
|
MANAGEMENT CO-INVESTMENT PLAN (MCIP)
|
||
|
PURPOSE AND LINK TO STRATEGY The MCIP encourages senior management to invest their own money into Unilever shares, aligning their interests with shareholders, and focus on the sustained delivery of high performance results over the long-term.
OPERATION The MCIP is a share matching arrangement whereby Executive Directors can invest their own after-tax money into Unilever shares (“investment shares”) and be awarded matching shares which vest at the end of a four-year performance period.
Depending on Unilever’s performance, Executive Directors may receive up to 1.5 x the number the shares they have purchased provided that they keep them for the duration of the four-year period.
Executive Directors are able to choose whether they invest in PLC or NV shares or a 50/50 mix. Executive Directors receive a corresponding number of performance-related shares (‘matching shares’). Matching shares will be awarded in the same form as the investment shares (i.e. in PLC or NV shares or a 50/50 mix).
Ultimate remedy/malus and claw-back provisions apply (see details on page 57). |
OPPORTUNITY Executive Directors are required to invest 25% and may invest up to 60% of their gross annual bonus into Unilever shares.
The number of matching shares received at the end of the performance period is a multiple of the number of shares invested into the MCIP which depends on performance as follows (there is straight line vesting between each of the points below): • Threshold – 0 x • Target – 1 x • Maximum – 1.5 x
The maximum possible opportunity as a % of salary is therefore: • CEO – 180% • Other Executive Directors – 135%
PERFORMANCE MEASURES The Committee sets performance measures for each MCIP matching share award. These will be tested over the four financial years starting with that following the one to which the bonus relates.
MCIP performance measures are currently Underlying Sales Growth, Core Earnings Per Share, Return On Invested Capital, and the Unilever sustainability progress index. Each measure has a 25% weighting. The Committee retains the discretion to change these measures and/or weighting for future grants, based on strategic priorities for Unilever at that time.
The Committee will ensure that the targets set are appropriately stretching for the delivery of threshold, target and maximum performance.
SUPPORTING INFORMATION The performance measures for the MCIP to be granted in 2017 have been amended to reflect Unilever’s strategic direction.
The MCIP (which will operate under a new set of plan rules for which approval will be sought at the 2017 AGMs) is now assessed over a four-year performance period. The previous MCIP was measured over a three-year performance period.
|
| Annual Report on Form 20-F 2016 | Governance | 55 |
Table of Contents
DIRECTORS’ REMUNERATION REPORT CONTINUED
|
GLOBAL SHARE INCENTIVE PLAN (GSIP)
|
||
|
PURPOSE AND LINK TO STRATEGY The GSIP incentivises Executive Directors to achieve Unilever’s clearly stated growth ambition by delivering sustained high performance and sustainable returns for shareholders over the longer term.
OPERATION Awards of shares are normally made annually with vesting conditional on Unilever’s performance against long-term targets over a three-year performance period and the quality of results delivered.
A two-year holding period will apply following the three-year vesting period (although shares may be sold to satisfy tax and other relevant liabilities as a result of the award vesting).
Prior to vesting Executive Directors are able to choose whether they receive any shares that are due to vest in PLC or NV shares or a 50/50 mix.
Ultimate remedy/malus and claw-back provisions apply (see details on page 57). |
OPPORTUNITY Target awards of conditional shares under the GSIP each year (as a percentage of base salary) are limited to: • CEO – 200% • other Executive Directors – 150%
The vesting range for awards of conditional shares is between 0% and 200% of target award. Accordingly, the maximum award of shares under the GSIP is (as a percentage of base salary at grant): • CEO – 400% • other Executive Directors – 300%
31% of the grant level would pay out at threshold performance. However, this may be amended at the discretion of the Committee if the number of companies in the TSR comparator group changes.
PERFORMANCE MEASURES The Committee sets three-year performance measures for each conditional GSIP award.
GSIP performance measures are currently Underlying Sales Growth, Core Operating Margin, Cumulative Operating Cash Flow and Total Shareholder Return. Each measure has a 25% weighting. The Committee retains the discretion to change these measures and/or weighting for future grants, based on strategic priorities for Unilever at that time.
The Committee will ensure that the targets set are appropriately stretching for the delivery of threshold, target and maximum performance.
For the three business-focused measures, 25% of awards vest for threshold performance and for maximum performance 200% of the GSIP awards vest. The TSR measure is measured against the TSR comparator group, comprising 18 other companies (19 including Unilever): 50% vests if Unilever is ranked 10th, 100% vests if Unilever is ranked 7th and 200% of the GSIP award vests if Unilever is ranked 3rd or above. Further details of the TSR comparator group are set out on page 66.
SUPPORTING INFORMATION The GSIP rules were approved by shareholders at the 2007 AGMs and will expire in May 2017. The GSIP will subsequently be operated under a new set of plan rules for which approval will be sought at the 2017 AGMs.
The GSIP awards made to the Executive Directors on 13 February 2017 will have a two-year post-vesting holding period beyond the three-year vesting period, making it a five-year plan, and this will also apply to GSIP awards in subsequent years under this Remuneration Policy.
|
ELEMENTS OF PREVIOUS POLICY THAT WILL CONTINUE
MCIP and GSIP awards granted under the previous Remuneration Policy will continue to operate under the terms of that policy and the relevant plan rules. Further details of the terms of the awards made are included in the Annual Remuneration Reports for their respective years. This applies to the GSIP awards granted in 2015, 2016 and 2017 and the MCIP awards granted in 2015 and 2016. This provision will cease to apply once all of these awards have vested, been exercised or been forfeited as appropriate as per the relevant policy and plan rules. Additional details are set out below.
| 56 | Governance | Annual Report on Form 20-F 2016 |
Table of Contents
CLAW-BACK, ULTIMATE REMEDY, DISCRETION AND FLEXIBILITY
Claw-back: The Committee has discretion to reclaim or claw back some or all of the value of awards of performance-related payments to Executive Directors in the event of a significant downward restatement of the financial results of Unilever. This includes the annual bonus together with any awards that have been made and/or vested shares under the GSIP and the MCIP (awards under both this Remuneration Policy and the previous remuneration policy). This claw-back may be effected up to two years from vesting by reducing outstanding awards or requiring the return of the net value of vested awards to Unilever.
Ultimate remedy/malus: Grants under the GSIP and MCIP (under both this Remuneration Policy and the previous Remuneration Policy) are subject to ultimate remedy. Upon vesting of an award, the Committee shall have the discretionary power to adjust the value of the award if the award, in the Committee’s opinion taking all circumstances into account, produces an unfair result. In exercising this discretion, the Committee may take into account Unilever’s performance against non-financial measures. The Committee may apply malus to reduce a GSIP or MCIP award granted under this Remuneration Policy or to GSIP or MCIP awards granted from 2015 under the previous Remuneration Policy, or determine that any such award will not vest or only vest in part in the event of a significant downward restatement of the financial results of Unilever, gross misconduct or gross negligence, material breach of Unilever’s Code of Business Principles or any of the Unilever Code Policies, breach of restrictive covenants by which the individual has agreed to be bound, or conduct by the individual which results in significant losses or serious reputation damage to Unilever. The annual bonus will also be subject to malus on the same grounds as apply for MCIP awards.
For future awards under the GSIP and MCIP, the Committee may change the terms of a performance measure or target in accordance with its terms or if anything happens which causes the Committee reasonably to consider it appropriate to do so, and may adjust the number or class of shares subject to awards if certain corporate events (e.g. rights issues) occur. For legacy awards under the MCIP and GSIP, the Committee may change the terms of a performance measure or target during the performance period to take into account any structural changes relating to the shares or the Group (e.g. rights issues) in accordance with established market practice.
The Committee reserves the right to make any remuneration payments and payments for loss of office (including exercising any relevant discretions) notwithstanding that they are not in line with this Remuneration Policy where the terms of the payment were agreed before this Remuneration Policy came into effect or at a time when the relevant individual was not a Director of Unilever N.V. or PLC and, in the opinion of the Committee, the payment was not in consideration for the individual becoming a Director of Unilever N.V. or PLC. For these purposes, ‘payments’ includes the Committee satisfying awards of variable remuneration and, in relation to an award over shares, the terms of the payment are ‘agreed’ at the time the award is granted.
REMUNERATION SCENARIOS - OUR EMPHASIS ON PERFORMANCE-RELATED PAY
It is Unilever’s policy that the total remuneration package for Executive Directors should be competitive with other global companies and that a significant proportion should be performance-related.
For the remuneration scenarios below, the maximum and target pay opportunities have been chosen to be consistent with the current levels for Executive Directors. In reviewing the appropriate level of pay opportunity for the Executive Directors, the Committee considers internal and external comparators. Although pay is not driven by benchmarking, the Committee is aware that pay needs to be within a reasonable range of competitive practice. The Committee notes that base salary and fixed allowance and total target pay for the Executive Directors is between median and lower quartile for the benchmark group used by the Committee (see page 53).
The Committee typically reviews, on at least an annual basis, the impact of different performance scenarios on the potential reward opportunity and payouts to be received by Executive Directors and the alignment of these with the returns that might be received by shareholders. The Committee believes that the level of remuneration that can be delivered in the various scenarios is appropriate for the level of performance delivered and the value that would be delivered to shareholders.
The charts below show hypothetical values of the remuneration package for Executive Directors in the first year of the policy under three assumed performance scenarios:
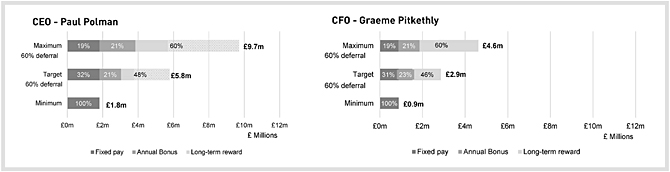
| Annual Report on Form 20-F 2016 | Governance | 57 |
Table of Contents
DIRECTORS’ REMUNERATION REPORT CONTINUED
DETAILS OF FIXED ELEMENT OF REMUNERATION FOR CEO AND CFO AND ASSUMPTIONS FOR SCENARIO CHARTS
|
FIXED REMUNERATION (FIXED PAY AND BENEFITS) |
Assumptions as follows (for actual Executive Director pay details please see Implementation Report below): |
|||
|
• Base salary for CEO = £1,010,000. |
||||
|
• Base salary for CFO effective from 1 May 2017 = £656,250. |
||||
|
• Fixed allowance = £250,000 for CEO and £200,000 for CFO. |
||||
|
• CEO supplemental pension = £117,123. |
||||
|
• Benefits assumed to be £447,000 for CEO and £19,000 for CFO in line with 2016.
|
||||
|
VARIABLE REMUNERATION |
BELOW THRESHOLD
|
• No bonus payout and no vesting under the MCIP or the GSIP. |
||
| ON TARGET |
• Target payout of the annual bonus (120% of base salary for the CEO and 100% of base salary for the CFO). |
|||
|
• Target vesting under the MCIP (1 x matching shares of the target 2017 annual bonus for CEO and CFO). |
||||
|
• Target vesting under the GSIP (200% of base salary for the CEO and 150% of base salary for the CFO). |
||||
|
• Scenarios assume 60% of the gross annual bonus is invested.
|
||||
| MAXIMUM |
• Maximum payout of the annual bonus (200% of base salary for the CEO and 150% of base salary for the CFO). |
|||
|
• Maximum vesting under the MCIP (1.5 x matching of the maximum 2017 annual bonus for CEO and CFO). |
||||
|
• Maximum vesting under the GSIP (400% of 2016 base salary for the CEO and 300% of 2016 base salary for the CFO). |
||||
|
• Scenarios assume 60% of the gross annual bonus is invested.
|
||||
|
NOTES TO VARIABLE REMUNERATION |
• Dividends, dividend equivalents and share price movements are ignored for the purposes of the illustrations above. |
|||
LEGACY ARRANGEMENTS
For the duration of this Remuneration Policy, entitlements arising before the adoption of this Remuneration Policy will continue to be honoured in line with the approved remuneration policy under which they were granted, or their contractual terms. The last award under the legacy MCIP was made on 11 February 2016, relating to the annual bonus earned in 2015, which will vest on 11 February 2018. The last award under the GSIP rules approved at the 2007 AGMs was made on 13 February 2017 and will vest on 13 February 2020. Further details of these awards can be found within the existing remuneration policy approved at the 2014 AGMs and included within the 2013 and subsequent Annual Report and Accounts.
PERFORMANCE MEASURES AND THE LINK TO STRATEGY
Performance measures are selected to align with Unilever’s short-term performance targets and long-term business strategy objectives. Unilever’s primary business objective is to create value in a sustainable way. Performance measures focus management on the delivery of a combination of top-line revenue growth and bottom-line profit growth that Unilever believes will build shareholder value over the longer term.
The measures chosen for the incentives will support the delivery of this objective, with distinct measures for each of the annual and longer-term incentive programmes. For the annual incentive, we continue to have a balanced set of performance measures in terms of sales, profitability and cash flow. Performance measures for our long-term incentive relate to the key objectives driving long-term value creation for investors: growth (in the form of USG) is fundamental to our model; core earnings per share (EPS) gives clear line of sight to share price via the Price/Earnings multiple; sustainability (USLP) is at the heart of our strategy for long-term value creation; and return on invested capital (ROIC) is an important measure of value creation, and an appropriate measure for ULE members given their decision-making responsibility regarding merger and acquisition activity. In 2017 there will be no change to the performance measures used for GSIP. For 2018, if the GSIP is maintained, it is intended that a consistent set of performance measures will be used across the MCIP and GSIP.
| 58 | Governance | Annual Report on Form 20-F 2016 |
Table of Contents
The following sets out the performance measures for short- and long-term executive incentive plans to be awarded in 2017, as well as the business performance and the behaviours that they drive.
APPROACH TO TARGET SETTING
| INCENTIVE PLAN |
PERFORMANCE MEASURE
|
LINK TO STRATEGY | ||
|
SHORT-TERM: ANNUAL BONUS |
Underlying sales growth (USG) at constant rates |
Clear, simple and well understood measure supporting the achievement of Unilever’s growth ambition
|
||
| Free cash flow (FCF) at constant rates |
Provides clear focus on the achievement of Unilever’s cash generation ambition and on cost reduction
|
|||
| Core operating margin improvement (COM) at current rates |
Underlines the importance of achieving increasingly profitable growth
|
|||
|
LONG-TERM: MCIP |
Underlying sales growth CAGR (USG) at constant rates |
Supports the achievement of Unilever’s ambition to deliver sustainable growth over the longer term
|
||
| Core earnings per share (Core EPS) at current rates |
Provides focus on a measure which is widely understood and applied externally by investors in valuing companies
|
|||
| Return on invested capital (ROIC) |
Supports disciplined investment of capital within the business and discourages acquisitions with low returns and long paybacks (an especially relevant measure for members of the ULE who make investment decisions)
|
|||
| Unilever sustainability progress index (USLP) |
The Unilever Sustainable Living Plan (USLP) helps to secure long-term value creation by decoupling our growth from our environmental impact, while increasing our positive social impact. To avoid over-focus on any one element of the USLP, the progress index is an assessment made by the Committee taking into account progress towards the targets in our reported USLP scorecard
|
|||
|
LONG-TERM: GSIP |
USG at constant rates |
Supports the achievement of Unilever’s ambition to deliver sustainable growth over the longer term
|
||
| COM at current rates |
Underlines the importance of achieving sustainable profitable growth over the longer term
|
|||
| Cumulative operating cash flow |
Provides clear focus on the achievement of Unilever’s cash generation ambition and on cost reduction
|
|||
| Relative total shareholder return (TSR) | Provides a relative ranking of share price growth and dividend compared with a set of peer companies | |||
The Committee sets performance targets for incentive plans, taking into account internal budgets, business priorities and external forecasts so that the targets are sufficiently stretching. Good performance results in target payout while maximum payout is only achieved for delivering exceptional performance.
| Annual Report on Form 20-F 2016 | Governance | 59 |
Table of Contents
DIRECTORS’ REMUNERATION REPORT CONTINUED
DIFFERENCES IN PAY POLICY GENERALLY
As the Chairman’s letter sets out, the reward arrangements for the ULE (excluding the Executive Directors) and ‘Top 500’ managers have been significantly simplified by consolidating fixed pay into a single figure and discontinuing the GSIP. Pay for this population (effective from mid-2017) will comprise three elements:
| • | fixed pay; |
| • | annual bonus; and |
| • | MCIP. |
To achieve a genuinely longer-term performance horizon of five years, we will encourage our managers to invest a proportion of their annual bonus after tax in Unilever shares through a revised longer-term version of Unilever’s MCIP, for which approval will be sought at the 2017 AGMs. The operation of this new MCIP is the same for the Executive Directors, except that the current cap of 150% will continue to apply to the vesting of Executive Directors’ MCIP matching shares. For other participants the MCIP matching shares may vest up to 200%, based upon Unilever’s performance.
For the ULE (excluding Executive Directors) and our ‘Top 500’ managers this new MCIP is the only long term incentive. These individuals have received increases in fixed pay and bonus opportunity and they can invest up to 100% of their gross annual bonus into MCIP. The new remuneration structure has been structured in a way to maintain broadly the same levels of pay for target performance, if they continue to invest 60% of their gross annual bonus in Unilever shares through the MCIP.
We plan to apply the principles driving these proposals to the way we pay all of our 15,000+ managers, not just our senior leaders. As a responsible employer with around 169,000 people in 109 countries as at year end, we are also very mindful of how we pay our many non-management staff.
Remuneration arrangements are determined throughout the Group based on the same principle - that reward should support our business strategy and should be sufficient to attract and retain high-performing individuals without paying more than is necessary. Unilever is a global organisation with employees at a number of different levels of seniority and in a number of different countries and, while this principle underpins all reward arrangements, the way it is implemented varies by geography and level.
In principle, all our managers participate in the same Unilever annual bonus scheme with the same performance measures based on Unilever’s overall performance. All middle and senior management are invited to participate in the MCIP. All other employees will have the opportunity to participate in the global “buy 3 get 1 free” employee share plan called ‘SHARES’.
Through these initiatives we will encourage all our employees fully to adopt an owner’s mindset with the goal of achieving our growth ambition, so they can continuously re-invest and share in the future long-term success of Unilever.
CONSIDERATION OF CONDITIONS ELSEWHERE IN THE GROUP
When determining the pay of Executive Directors, the Committee considers the pay arrangements for other employees in the Group, including considering the average global pay review budget for the management population, to ensure that remuneration arrangements for Executive Directors remain reasonable.
Unilever employs around 169,000 people in 109 countries as at year end and, given this geographic spread and other factors, the Committee did not consider that it was appropriate to consult employees on the Remuneration Policy for Executive Directors during the year. However, Unilever takes the views of its employees seriously and on an ongoing basis we operate the ‘Rate-My-Reward’ survey to gauge the views of employees on the different parts of their reward package.
The Committee has taken note of the Fair Compensation Unilever Framework (https://www.unilever.com/sustainable-living/the-sustainable-living-plan/enhancing-livelihoods/fairness-in-the-workplace/fair-compensation/) and the advanced living wage awareness together with responsible supplier policies within the Group. Over the last three years we have also offered the award-winning SHARES plan to our non-management staff around the world. We will continue to advance these initiatives over the year ahead and beyond to enhance the livelihoods of all our employees.
CONSIDERATION OF SHAREHOLDER VIEWS
The Committee takes the views of shareholders seriously. In a year when we are proposing to introduce this new Remuneration Policy shareholders have been consulted extensively and their views have been influential in shaping this Remuneration Policy.
We maintain an open and regular dialogue with our shareholders on remuneration matters, including consulting with our largest shareholders, when we are considering making material changes to our Remuneration Policy. As such we will be in contact with our largest shareholders during 2017 to determine how best to structure remuneration for the Executive Directors for 2018 and beyond.
MINIMUM SHAREHOLDING REQUIREMENT
The remuneration arrangements applicable to our Executive Directors require them to build and retain a personal shareholding in Unilever (by the later of 2018 or five years from the date of appointment) to align their interests with those of Unilever’s long-term shareholders. The current requirement is 5 x base salary for the CEO and 4 x base salary for the CFO.
Upon leaving Unilever, all Executive Directors will be required to maintain at least 100% of their minimum shareholding requirement for one year after leaving, and at least 50% for two years after leaving. If the leaver has not yet met their shareholding requirements on departure they will be required to retain the shares they do own up to these limits.
| 60 | Governance | Annual Report on Form 20-F 2016 |
Table of Contents
REMUNERATION POLICY FOR NEW HIRES
|
AREA
|
POLICY AND OPERATION
|
|
| Overall | The Committee will pay new Executive Directors in accordance with the approved Remuneration Policy and all its elements as set out herein above. The terms of service contracts will not overall be more generous than those of the current CEO and CFO summarised below. The ongoing annual remuneration arrangements for new Executive Directors will therefore comprise salary, fixed allowance, benefits, annual bonus, MCIP and GSIP. In addition, the recruitment policy below permits the Committee to take the following actions, as appropriate, in the best interests of Unilever and therefore shareholders. | |
|
For internal promotions, any variable remuneration element awarded in respect of a prior role may be paid out according to its original terms.
|
||
| Base salary |
Salary would be set at an appropriate level to recruit the best candidate based on their skills, experience and current remuneration.
|
|
| Fixed allowance |
Fixed allowance provision would be in line with the approved normal Remuneration Policy and for a new external hire may be consolidated into salary.
|
|
| Benefits |
Benefits provision would be in line with the approved normal Remuneration Policy. Where appropriate the Executive Director may also receive relocation benefits or other benefits reflective of normal market practice in the territory in which the Executive Director is employed. In addition, the Committee may agree that Unilever will pay certain allowances linked to repatriation on termination of employment.
|
|
| Incentive awards | Incentive awards would be made under the annual bonus, MCIP and GSIP in line with the normal policy. | |
|
Transition awards and buyout awards |
In addition to normal incentive awards, additional awards may be made to align the joiner as quickly as possible with Unilever’s long-term goals, and to reflect value forfeited through an individual leaving their current employer. | |
| Transition awards | ||
| In the event that we were to appoint a new Executive Director, the Committee’s preferred approach would be to offer a transition award in Unilever shares to immediately align the new Executive Director with the long-term goals of the business and to recognise that no other long-term incentive will be vesting in their first years of employment at Unilever. The transition award permits the joiner to potentially receive matching awards under the MCIP and GSIP awards as if they had invested a proportion of their target bonus into the in-flight MCIP cycles and had been made awards in previous GSIP cycles that started before they joined Unilever. Accordingly, the transition award may comprise two elements. The first can be worth up to 240% (4 x 60%) of the new Executive Director’s initial target annual bonus and vests 25% per year thereafter at the actual performance multiplier (0 x to 1.5 x) for the MCIP cycle ending in the corresponding year. The second element of the transition award may be worth up to 200% of the new Executive Director’s initial salary and vests 50% per year thereafter at the actual performance multiplier (0 x to 2 x) for the GSIP cycle ending in the corresponding year. Within these limits the Committee will determine the size of the transition award based on individual circumstances. To be eligible for the transition award element related to MCIP (i.e 4 x 60% of target bonus) the Executive Director must invest no less than a corresponding percentage (i.e. 60%) of actual annual bonus into new cycles of MCIP starting in each of the years that the transition award vests. The final vesting value of the transition award will be scaled back if the corresponding level of investment the new Executive Director has made into the MCIP in that year is lower than the initial commitment. If the Executive Director elects to make a higher investment in new MCIP cycles than the initial commitment, the transition award will not be increased. | ||
| A transition award would only be offered if required to compensate an Executive Director for awards foregone. If an Executive Director joins without the need to compensate for awards foregone, a transition award would not be provided. | ||
| Buyout awards | ||
| The Committee’s preference is to use transition awards rather than buyout awards. However, as we need to be able to source the best talent from any market, instead of the approach set out above the Committee may elect to compensate Executive Directors hired from outside for any awards they lose by leaving previous employers broadly on a like-for-like basis (although a transition award may form part of this). Incoming Executive Directors will be required to retain all shares vesting from any share awards until their minimum shareholding requirements have been met in full. | ||
| If a buyout award is required, the Committee would aim to reflect the nature, timing, and value of awards forgone in any replacement awards. Awards may be made in cash, shares or any other method as deemed appropriate by the Committee. Where possible, share awards will be replaced with share awards. Where performance measures applied to the forfeited awards, performance measures will be applied to the replacement award or the award size will be discounted accordingly. In establishing the appropriate value of any buyout the Committee would also take into account the value of the other elements of the new remuneration package. | ||
| The Committee would aim to minimise the cost to Unilever, although buyout awards are not subject to a formal maximum. Any awards would be broadly no more valuable than those being replaced. | ||
| Annual Report on Form 20-F 2016 | Governance | 61 |
Table of Contents
DIRECTORS’ REMUNERATION REPORT CONTINUED
SERVICE CONTRACTS
POLICY IN RELATION TO EXECUTIVE DIRECTOR SERVICE CONTRACTS AND PAYMENTS IN THE EVENT OF LOSS OF OFFICE
|
SERVICE CONTRACTS & NOTICE PERIOD |
Current Executive Directors’ service contracts are terminable upon notice as follows: • 12 months’ notice from Unilever; and • 6 months’ notice from the Executive Director. |
|
| Starting dates of the service contracts for the current CEO and CFO: | ||
| CEO: 1 October 2008 (signed on 7 October 2008); and | ||
| CFO: 1 October 2015 (signed on 16 December 2015). | ||
|
Service contracts are available to shareholders to view at the AGMs or on request from the Group Secretary.
|
||
|
TERMINATION PAYMENTS |
A payment in lieu of notice can be made, to the value of no more than 12 months’ base salary, fixed allowance and other benefits (unless the Boards, at the proposal of the Committee, find this manifestly unreasonable given the circumstances or unless dictated by applicable law).
|
|
|
OTHER ELEMENTS |
• Executive Directors may, at the discretion of the Boards, remain eligible to receive an annual bonus for the financial year in which they cease employment. Such annual bonus will be determined by the Committee taking into account time in employment and performance. • Treatment of share awards as set out below. • Any outstanding all-employee share arrangements will be treated in accordance with HMRC-approved terms. • Other payments, such as legal or other professional fees, repatriation or relocation costs and/or outplacement fees, may be paid if it is considered appropriate.
|
|
| 62 | Governance | Annual Report on Form 20-F 2016 |
Table of Contents
LEAVER PROVISIONS IN PLAN RULES
|
‘GOOD LEAVERS’ AS DETERMINED BY THE COMMITTEE IN ACCORDANCE WITH THE PLAN RULES*
|
LEAVERS IN OTHER CIRCUMSTANCES* |
CHANGE OF CONTROL |
||||
|
INVESTMENT SHARES (MCIP) |
Investment shares are not impacted by termination (although they may be transferred to the personal representative of the Executive Director in the event of his or her death without causing the corresponding matching shares to lapse).
|
Investment shares are not impacted by termination. |
Investment shares may normally be disposed of in connection with a change of control without causing the corresponding matching shares to lapse.
Alternatively, participants may be required to exchange the investment shares for equivalent shares in the acquiring company.
|
|||
|
MATCHING SHARES (MCIP), PERFORMANCE SHARES (GSIP) |
Awards will normally vest following the end of the original performance period, taking into account performance and (unless the Boards on the proposal of the Committee determine otherwise) pro-rated for time in employment.
Alternatively, the Boards may determine that awards shall vest upon termination based on performance at that time and pro-rated for time in employment (unless the Boards on the proposal of the Committee determine otherwise). If a director dies, awards will vest at the time of death at the target level of vesting (pro-rated for time in employment if the director had previously left as a good leaver).
|
Awards will normally lapse upon termination. |
In accordance with Dutch law, matching shares and performance shares are shares that are obtained as part of the Executive Director’s remuneration. Therefore their value is frozen for a period of four weeks before an announcement of a public offer and four weeks after the conclusion of a public offer. Under current Dutch law requirements, any increase in value in this period has to be reclaimed by Unilever from the Executive Director upon retirement or sale of these shares, if at that time the value of the shares is higher than the value four weeks before the announcement of the public offer. If the law changes, Unilever will seek to comply with any new Dutch law requirements that may apply from time to time.
Awards will vest based on performance at the time of the change of control and the Boards, on the proposal of the Committee, have the discretion to pro-rate for time. Alternatively, participants may be required to exchange the awards for equivalent awards over shares in the acquiring company.
|
|||
| * | An Executive Director will usually be treated as a good leaver if he or she leaves due to ill-health, injury or disability, retirement with Unilever’s agreement or redundancy. The Boards may decide to treat an Executive Director who leaves in other circumstances as a good leaver. An Executive Director will not be treated as a good leaver if he or she chooses to leave for another job elsewhere unless the Boards determine otherwise, if he or she is summarily dismissed or leaves because of concerns about performance. In deciding whether or not to treat an Executive Director as a good leaver, the Boards will have regard to his or her performance in the role. |
| If Unilever is affected by a demerger, special distribution or other transaction which may affect the value of awards, the Committee may allow matching shares under the current and legacy MCIP and performance shares under the GSIP to vest early over such number of shares as it shall determine (to the extent any performance measures have been met) and may be pro-rated to reflect the acceleration of vesting at the Committee’s discretion. |
| Annual Report on Form 20-F 2016 | Governance | 63 |
Table of Contents
DIRECTORS’ REMUNERATION REPORT CONTINUED
NON-EXECUTIVE DIRECTORS
KEY ASPECTS OF UNILEVER’S 2017 FEE POLICY FOR NON-EXECUTIVE DIRECTORS
|
APPROACH TO SETTING FEES |
Non-Executive Directors receive annual fees from Unilever N.V. and PLC. The Boards determine Non-Executive Director fee levels within total annual limits as approved by shareholders (as specified in PLC’s Articles, this is currently PLC £2,000,000 or its equivalent in any other currency based upon such foreign currency exchange rates as the Committee shall determine, and NV € 3,000,000).
Unilever’s policy is to set fees at a level which is sufficient to attract, motivate and retain high-class talent of the calibre required to direct the strategy of the business. They are set taking into account: • Unilever’s Group-wide reward philosophy; • the commitment and contribution expected by the Group; and • fee levels paid in other global non-financial services companies based in Europe.
Fees are paid in cash.
|
|
| OPERATION |
Unilever applies a modular fee structure for Non-Executive Directors to ensure we fairly reflect the roles and responsibilities of Committee membership and Chairmanship. Our basic philosophy is to pay the Chairman an all-inclusive fee. Other Board members receive a basic fee and additional fees for being Vice-Chair, chairing or membership of various committees. The fees are currently split 50/50 between PLC (in sterling) and NV (in euros). The Boards may decide to pay fees in any other currency based on such foreign exchange rates as the Boards shall determine, provided total Non-Executive Director fees stay within the annual limits as approved by shareholders from time to time. The current 2017 fee structure can be found in the Directors’ Remuneration Report on page 73. The fee structure may vary from year to year within the terms of this Remuneration Policy.
Fees are normally reviewed annually but may be reviewed less frequently.
Additional allowances are made available to Non-Executive Directors where appropriate, to reflect any additional time commitment or duties.
|
|
| OTHER ITEMS |
Non-Executive Directors are encouraged to build up a personal shareholding of at least 100% of their total annual fees over the five years from appointment.
Non-Executive Directors are not entitled to participate in any of the Group’s incentive plans.
All reasonable travel and other expenses incurred by Non-Executive Directors in the course of performing their duties are considered to be business expenses and are reimbursed together with any tax payable. Non-Executive Directors also receive expenses relating to the attendance of the Director’s spouse or partner, when they are invited by Unilever. Other benefits or additional payments may be provided in the future if, in the view of the Boards, this is considered appropriate. Such benefits and/or payments would be within the total annual limits as approved by shareholders as described above.
|
|
REMUNERATION POLICY FOR NEW NON-EXECUTIVE DIRECTOR HIRES
In the event of hiring a new Non-Executive Director, the Committee will align the remuneration package with the Remuneration Policy as set out herein above.
NON-EXECUTIVE DIRECTORS’ LETTERS OF APPOINTMENT
The terms of engagement of Non-Executive Directors are set out in letters of appointment which each Non-Executive Director signed upon appointment. Non-Executive Directors are currently appointed for a one-year term, subject to satisfactory performance, re-nomination at the discretion of the Boards on the recommendation of the Nominating and Corporate Governance Committee and re-election at forthcoming annual shareholder meetings. It is Unilever’s expectation that Non-Executive Directors serve for a minimum of three years. The letters of appointment allow for Unilever to terminate a Non-Executive Director’s appointment in cases of gross misconduct, bankruptcy or where the Non-Executive Director is prevented from occupying such a position by law.
The letters do not contain provision for notice periods or compensation if the Non-Executive Directors’ appointments are terminated by Unilever. Non-Executive Directors may terminate their engagement upon three months’ notice. Except in exceptional circumstances, the Boards will not propose Non-Executive Directors for re-nomination when nine years have elapsed since the date of their appointment. Letters of appointment are available for inspection on request from the Group Secretary.
In considering appointments to the Boards, the Directors and Unilever give due consideration to the time commitment required to fulfil the role appropriately.
| 64 | Governance | Annual Report on Form 20-F 2016 |
Table of Contents
ANNUAL REMUNERATION REPORT
The following sets out how Unilever’s existing Remuneration Policy (which is available on our website – see www.unilever.com/ara2015/downloads ) was implemented in 2016, and how our new Remuneration Policy (set out on pages 52 to 64) will be implemented if it receives shareholder approval at the 2017 AGMs.
IMPLEMENTATION OF THE REMUNERATION POLICY IN 2017 FOR EXECUTIVE DIRECTORS
If approved by shareholders, Unilever’s new Remuneration Policy will be implemented with effect from the 2017 AGMs as set out below. If the new Remuneration Policy is not approved, Unilever’s existing Remuneration Policy will continue to apply.
ELEMENTS OF REMUNERATION
|
ELEMENTS OF REMUNERATION |
AT A GLANCE |
ADDITIONAL INFORMATION |
||
|
BASE SALARY |
Salary effective from 1 May 2017: • CEO: £1,010,000 (unchanged from 2016) • CFO: £656,250 |
No salary increase is to be awarded to the CEO during 2017. The Committee notes that the CEO’s salary continues to be below competitive benchmarks compared to similar-sized UK and European companies, but that he has consistently refused a salary increase over recent years.
The CFO was recently appointed to the Board and has performed strongly in role since appointment. The Committee has therefore determined, in line with our Remuneration Policy, to award the CFO a salary increase of 5% that reflects his strong performance since appointment and development in role. This is above the average increase awarded to the broader employee population, but after careful consideration is considered appropriate by the Committee.
In particular, the Committee notes that the CFO was appointed with a salary significantly below that of his predecessor, and that, even with this increase, the CFO’s salary is still below the lower quartile of the market when assessed against our benchmarking peer group (as disclosed on page 53).
The Committee will continue to review the CFO’s salary in view of his performance and development in role, and may make salary increases that exceed that of the wider workforce, although any further salary increases awarded will not exceed 15% on aggregate over the course of this Remuneration Policy.
|
||
|
FIXED ALLOWANCE |
Fixed allowance for 2017: • CEO: £250,000 (unchanged from 2016) • CFO: £200,000 (unchanged from 2016)
|
n/a | ||
|
OTHER BENEFIT ENTITLEMENTS |
Implemented in line with the 2017 Remuneration Policy.
|
n/a | ||
| ANNUAL BONUS |
• Implemented in line with the 2017 Remuneration Policy. • Target annual bonus of 120% of base salary for the CEO and 100% of base salary for the CFO. • Business Performance Multiplier of between 0% and 150% based on achievement against business targets over the year. • Personal Performance Multiplier of between 0% and 150% based on personal performance of the Executive Director. • Maximum annual bonus is 200% of base salary for the CEO and 150% for the CFO.
|
For 2017, the Business Performance Multiplier will be based on the following metrics:
A 0% multiplier will be applied for threshold performance, and up to 150% multiplier for maximum performance. Performance target ranges are considered to be commercially sensitive and will be disclosed in full with the corresponding performance outcomes retrospectively following the end of the relevant performance year.
|
||
| Annual Report on Form 20-F 2016 | Governance | 65 |
Table of Contents
DIRECTORS’ REMUNERATION REPORT CONTINUED
|
ELEMENTS OF REMUNERATION |
AT A GLANCE |
ADDITIONAL INFORMATION |
||
|
GSIP 2017 AWARDS |
• Implemented in line with the 2014 Remuneration Policy. • GSIP award made on 13 February 2017 (vesting 13 February 2020). • Target award 200% of base salary for the CEO (salary = £1,010,000) and 150% of base salary for the CFO (salary = £625,000). • Maximum vesting of 200% of initial award (so maximum vesting of 400% of base salary for the CEO (£4,040,000), and 300% of base salary for the CFO (£1,875,000)). • In addition, a two-year post-vesting holding period will apply to this award (beyond the three-year vesting period) for the CEO and CFO.
|
Performance conditions are assessed over a three-year period. The performance conditions and target ranges for 2017 awards will be as follows:
For the three business-focused performance conditions, 25% of target awards vest for achieving threshold performance, 100% for target and 200% for maximum performance (with straight-line vesting between threshold and maximum). For the TSR measure, 50% of the target award vests for threshold performance at 10th place, 100% at 7th place, and 200% vests at 3rd place or above (with straight-line vesting occurring between these points). (a) |
||
| NEW MCIP |
• Implemented in line with the 2017 Remuneration Policy. • It is intended to make initial awards under the MCIP in May 2017. • Paul Polman elected to invest the value of 60% (£1,119,888) of his 2016 annual bonus into the MCIP (upon the plan’s approval at the 2017 AGMs). • Graeme Pitkethly elected to invest the value of 60% (£453,750) of his 2016 annual bonus in MCIP investment shares (upon the plan’s approval at the 2017 AGMs). • Matching shares are awarded based on performance up to a maximum of 1.5 x matching shares. • Therefore the maximum value from the matching shares for the CEO would be £1,679,832 and for the CFO would be £680,625. |
Performance conditions are assessed over a four-year period. The performance conditions and target ranges for 2017 awards under the new MCIP will be as follows:
Threshold results in no matching shares being awarded, target performance results in an award of 1 x matching shares, up to a maximum award of 1.5 x matching shares for Executive Directors, with straight-line vesting between threshold and maximum (although the maximum for other participants is 2 x matching)
Participants are required to hold all their own investment shares and remain employed by Unilever for the duration.
It is the Committee’s intention that management should be assessed against the progress they make on the USLP as a whole, rather than selected components of it. Unilever already publishes periodic progress reports for the USLP on our website and so our shareholders are able to monitor performance against USLP goals. At the end of the MCIP performance period, the Committee will disclose a full narrative setting out the performance achieved and the corresponding outcome that the Committee determines for the Sustainability Progress Index.
|
||
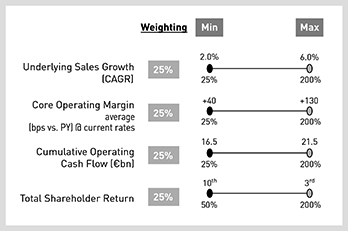
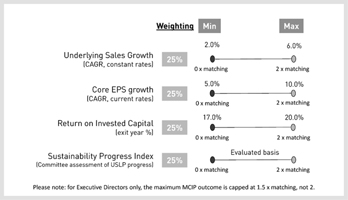
| (a) | For the relative TSR measure, Unilever’s TSR is measured against a comparator group of other consumer goods companies. TSR measures the return received by a shareholder, capturing both the increase in share price and the value of dividend income (assuming dividends are reinvested). The TSR results are measured on a common currency basis to better reflect the shareholder experience. The current TSR peer group consists of 18 companies (19 including Unilever) as follows: |
| Avon | Colgate-Palmolive | Henkel | L’Oréal | Reckitt Benckiser | ||||
| Beiersdorf | Danone | Kao | Nestlé | Shiseido | ||||
| Campbell Soup | General Mills | Kellogg’s | PepsiCo | |||||
| Coca-Cola | Estée Lauder | Kimberly-Clark | Procter & Gamble |
The Committee may change the TSR vesting levels set out above if the number of companies in the TSR comparator group changes (e.g. via M&A activity etc).
| 66 | Governance | Annual Report on Form 20-F 2016 |
Table of Contents
ULTIMATE REMEDY/MALUS AND CLAWBACK
Grants under the GSIP and MCIP are subject to ultimate remedy as explained in the 2017 Remuneration Policy. Malus and clawback apply to all performance-related payments as explained in the 2017 Remuneration Policy.
In 2016, the Committee did not reclaim or claw back any of the value of awards of performance-related payments to Executive Directors.
SINGLE FIGURE OF REMUNERATION AND IMPLEMENTATION OF THE REMUNERATION POLICY IN 2016 FOR EXECUTIVE DIRECTORS (AUDITED)
The table below shows a single figure of remuneration for each of our Executive Directors, for the years 2015 and 2016.
|
Paul Polman CEO (UK) (€‘000) |
Graeme Pitkethly CFO (UK) (€‘000) |
Jean-Marc Huët former CFO (UK) (€‘000) |
||||||||||||||||||||||
| 2016 | 2015 | 2016 | (b) | 2015 (b) | 2016 | (c) | 2015 | (c) | ||||||||||||||||
|
(A) Base salary |
1,239 | 1,392 | 511 | - | - | 738 | ||||||||||||||||||
|
(B) Fixed allowances and other benefits |
855 | 901 | 185 | - | - | 273 | ||||||||||||||||||
|
(C) Annual bonus |
2,289 | 2,573 | 928 | - | - | 812 | ||||||||||||||||||
|
(D) MCIP matching shares – (required by UK law) (d) |
1,240 | 1,933 | (a) | 153 | - | - | 375 | (a) | ||||||||||||||||
|
Long-term incentives |
||||||||||||||||||||||||
|
(E) GSIP performance shares – (required by UK law) (d) |
2,603 | 3,336 | (a) | 305 | - | - | 1,783 | (a) | ||||||||||||||||
|
Long-term incentives (sub-total) |
3,843 | 5,269 | 458 | - | - | 2,158 | ||||||||||||||||||
|
(F) Conditional supplemental pension |
144 | 161 | - | - | - | - | ||||||||||||||||||
|
Total remuneration paid – (required by UK law) (A+B+C+D+E+F) |
8,370 | 10,296 | 2,082 | - | - | 3,981 | ||||||||||||||||||
|
(G) Share awards (required by Dutch law) |
3,170 | 3,274 | 674 | - | - | 573 | ||||||||||||||||||
|
Total remuneration paid – (required by Dutch law) (A+B+C+F+G) |
7,697 | 8,301 | 2,298 | - | - | 2,396 | ||||||||||||||||||
| (a) | Amount restated using actual share price(s) on relevant dates rather than three-month average share price to 31 December 2015 (which was used for the 2015 report). |
| (b) | The figures included relate to amounts paid or payable to Graeme Pitkethly for his services from 21 April 2016 for the remainder of the year, being the date on which he was appointed as an Executive Director of the Boards of NV and PLC. Although Graeme Pitkethly assumed the role of CFO and became a member of the ULE on 1 October 2015, he did not serve as an Executive Director during that year, and therefore his 2015 remuneration is not disclosed herein. |
| (c) | The figures included relate to amounts paid to Jean-Marc Huët for his services between 1 January and 1 October 2015, being the date on which he ceased to be CFO and an Executive Director of Unilever. |
| (d) | Graeme Pitkethly’s GSIP and MCIP values in the above single figure table for 2016 include GSIP performance shares and MCIP matching shares previously granted to him in 2014, before his appointment as an Executive Director. |
Where relevant, amounts for 2016 have been translated into euros using the average exchange rate over 2016 ( € 1 = £0.8152), excluding amounts in respect of MCIP and GSIP which have been translated into euros using the exchange rate at vesting date of 14 February 2017 ( € 1 = £0.8494). Amounts for 2015 have been translated into euros using the average exchange rate over 2015 ( € 1 = £0.7254), excluding amounts in respect of MCIP and GSIP which have been translated into euros using the exchange rate at vesting date of 18 February 2016 ( € 1 = £0.7763).
We do not grant our Executive Directors any personal loans or guarantees.
ELEMENTS OF SINGLE FIGURE REMUNERATION 2016
(A) BASE SALARY (AUDITED)
Salary set in sterling and paid in 2016:
| • | CEO – £1,010,000. |
| • | CFO – £416,667 (amount paid to Graeme Pitkethly for his services from 21 April 2016, being the date on which he was appointed as an Executive Director of the Boards of NV and PLC; Graeme Pitkethly’s annual salary is £625,000). |
(B) FIXED ALLOWANCE AND OTHER BENEFITS (AUDITED)
For 2016 this comprises:
|
|
Paul Polman
CEO (UK) (£) |
(a) |
|
Graeme Pitkethly
CFO (UK) (£) (a)(b) |
|
|||
| 2016 | 2016 | |||||||
|
Fixed allowance |
250,000 | 133,333 | ||||||
|
Medical insurance cover and actual tax return preparation costs |
29,390 | 14,087 | ||||||
|
Provision of death-in-service benefits and administration |
11,011 | 3,370 | ||||||
| Payment to protect against difference between employee social security obligations in country of residence versus UK | 406,247 | - | ||||||
|
Total |
696,648 | 150,790 | ||||||
| (a) | The numbers in this table are quoted in sterling and translated into euros for the single figure of remuneration table above using the average exchange rate over 2016 of € 1 = £0.8152. |
| (b) | The figures included relate to amounts paid or payable to Graeme Pitkethly for his services from 21 April 2016 for the remainder of the year, being the date on which he was elected at the AGMs as an Executive Director of the Boards of NV and PLC. |
| Annual Report on Form 20-F 2016 | Governance | 67 |
Table of Contents
DIRECTORS’ REMUNERATION REPORT CONTINUED
(C) ANNUAL BONUS (AUDITED)
Annual bonus 2016 actual outcomes
| • | CEO – £1,866,480 (which is 92.5% of maximum, 185% of base salary). |
| • | CFO – £756,250 (which is 80.7% of maximum, 121% of base salary). |
This includes cash and the portion of annual bonus that Executive Directors have indicated will be re-invested in shares under the MCIP. See below for details. Performance against targets:
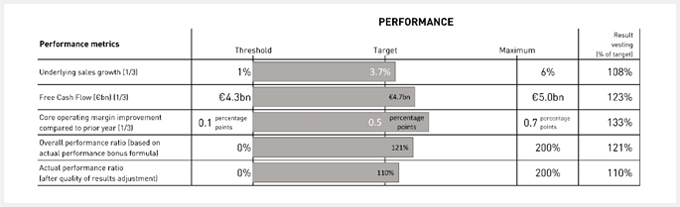
At the beginning of the year, the Committee set stretching financial performance targets which management delivered against during the course of the year. In 2016 we achieved underlying sales growth of 3.7%, ahead of our markets, driven by a good step-up in price growth with balanced volume. Improvement in core operating margin compared with 2015 was 0.5 percentage points driven by savings, improved product mix and operational leverage. All categories delivered progress against their strategic priorities. For the annual bonus calculations, free cash flow (FCF) is calculated on a constant basis at € 4.7 billion (equivalent to the reported € 4.8 billion at current rates), driven by the increase in core operating profit and improvement in working capital, in line with the strong delivery in 2015.
The 2016 results represent good all-round performance despite difficult conditions. The consistent delivery of top-line and bottom-line growth has been established over the last eight years. Operating margin performance, despite significant restructuring spend, was well above target with cash flow and underlying sales growth more in line with target. Hence, the Committee has decided to award a performance factor of 110% versus target. Although purely mathematically the bonus would have been 121%, management recommended the adjustment slightly downwards in light of overall quality of results as we ended the year with slower growth. The Committee considered this to be a fair representation of the performance delivery by the executive team during 2016.
| • | Paul Polman |
In determining bonus outcomes for Paul Polman, the Committee also considered his very strong personal performance. Again in 2016, Paul demonstrated very firm leadership, both internally and externally. He received significant recognition for his work in leading Unilever and in helping to promote sustainable and responsible business models around the world. He was awarded the Chevalier de la Legion d’Honneur, the highest decoration in France, and the Public Service Star from the Singapore Government. Despite increasingly difficult market conditions in 2016, Unilever maintained its consistent track record of delivering underlying sales growth ahead of its markets and growth in core operating margin together with strong free cash flow. In 2016 Paul also introduced and pushed forward a number of major transformation initiatives for Unilever – notably Connected 4 Growth (C4G) – which are already helping to strengthen the company and will enable it to meet the demands of a fast-changing environment with even greater speed, agility and confidence. In 2016 Paul also oversaw a number of strategic acquisitions that will help to bolster Unilever’s position in some fast-growing areas of the market. As a consequence of the review of his personal performance, Paul Polman was awarded a personal performance multiplier of 140%. This resulted in his receiving a bonus of 185% of his base salary, calculated as follows:

| • | Graeme Pitkethly |
In determining bonus outcomes for Graeme Pitkethly, the Committee considered his personal performance and leadership, including the management of Unilever’s financial risk exposure and the continuing drive for enterprise-wide efficiencies. It also took account of his strong focus as CFO on performance management and the extent to which this was reflected in Unilever’s positive business results in 2016. Graeme also played an important role in the successful launch of the C4G major organisational re-design, as well as driving the implementation of the ambitious Zero-Based Budgeting (ZBB) programme across the Group, which is already generating savings for reinvestment within Unilever and has the potential to restructure Unilever’s cost base over the next two years. Graeme has also pushed to instil enhanced levels of investment discipline and cash delivery. As a consequence of that review, Graeme was awarded a personal performance multiplier of 110%. This resulted in his receiving a bonus of 121% of his base salary, calculated as follows:

| 68 | Governance | Annual Report on Form 20-F 2016 |
Table of Contents
(D) MCIP – UK LAW REQUIREMENT (AUDITED)
2016 OUTCOMES
This includes MCIP matching shares granted on 14 February 2014 (based on the percentage of 2013 bonus that Paul Polman and Graeme Pitkethly had invested in Unilever shares, as well as performance in the three-year period to 31 December 2016) which vested on 14 February 2017. Further details of the performance measures are disclosed below in note (E).
The values included in the single figure table for 2016 are calculated by multiplying the number of shares granted on 14 February 2014 (including additional shares in respect of accrued dividends through to 31 December 2016) by the level of vesting (70% of target award for the CEO and 84% of target award for the CFO) and the share prices on the date of vesting (NV € 38.81 and PLC £32.86). The CFO’s award vested at a different level than the CEO’s award as it relates to an award granted in 2014 before his appointment as an Executive Director. Performance measures and performance against them are as set out in the table below (although the weightings of the measures were different for participants below Board level, so the weightings of each measure in the award that vested for the CFO are Underlying Sales Growth at 30%, Core Operating Margin Improvement at 30%, Cumulative Operating Cash Flow at 30% and TSR at 10%). These have been translated into euros using the exchange rate on the date of vesting ( € 1 = £0.8494).
(E) GSIP – UK LAW REQUIREMENT (AUDITED)
2016 OUTCOMES
This includes GSIP performance shares granted on 14 February 2014, based on performance in the three-year period to 31 December 2016, which vested on 14 February 2017.
The values included in the single figure table for 2016 are calculated by multiplying the number of shares granted on 14 February 2014 (including additional shares in respect of accrued dividends through to 31 December 2016) by the level of vesting (70% of target award for the CEO and 84% of target award for the CFO) and the share price on the date of vesting (NV € 38.81 and PLC £32.86). The CFO’s award vested at a different level than the CEO’s award as it relates to an award granted in 2014 before his appointment as an Executive Director with the performance measures and weighting as set out under heading (D) above. These have been translated into euros using the exchange rate on the date of vesting ( € 1 = £0.8494).
Performance against targets:
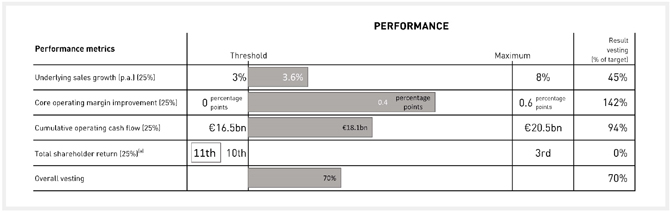
| (a) | For details of comparator group please see page 66. |
Over the past three years, Unilever has delivered consistent financial performance. Underlying sales growth during this period was 3.6% per year and core operating margin improvement over the period was an average of 0.4 percentage points per year, demonstrating management’s continued drive for consistent top- and bottom-line growth. Unilever also generated strong operating cash in the period, with cumulative operating cash flow of € 18.1 billion. Total shareholder return (TSR) over this three-year period was in the middle third of the peer group just below the threshold for minimum vesting and, as such, no part of the GSIP and MCIP awards related to TSR will vest. On the basis of this performance, the Committee determined that the GSIP and MCIP awards to the end of 2016 will vest at 70% of initial award levels (ie 35% of maximum for GSIP and 47% of maximum for MCIP (which is capped at 150% for the Executive Directors)).
(F) CONDITIONAL SUPPLEMENTAL PENSION (AUDITED)
CEO (Paul Polman): Conditional supplemental pension provision agreed with Paul Polman on hiring, which will be paid on his retirement (or his death or total disability prior to retirement). This was £117,123 based on 12% of a capped salary of £976,028 for 2016.
(G) SHARE INCENTIVES – DUTCH LAW REQUIREMENT (AUDITED)
As per the Dutch requirements, these costs are non-cash costs and relate to the expenses recognised for the period following IFRS 2. This is based on share prices on grant dates and a 98% adjustment factor for GSIP shares and MCIP matching shares awarded in 2016, 2015 and 2014.
| Annual Report on Form 20-F 2016 | Governance | 69 |
Table of Contents
DIRECTORS’ REMUNERATION REPORT CONTINUED
SCHEME INTERESTS AWARDED IN THE YEAR (AUDITED)
|
PLAN |
BASIS OF AWARD |
MAXIMUM
|
THRESHOLD
|
PERFORMANCE
|
DETAILS OF PERFORMANCE MEASURES |
|||||
|
MCIP Conditional matching share award made on 11 February 2016 |
Based on the level of 2015 bonus paid in 2016 invested by the CEO and CFO.
The following numbers of matching shares were awarded on 11 February 2016 (a) :
CEO: PLC – 0 NV – 39,318
CFO: PLC – 4,912 NV – 4,912
Maximum vesting results in 150% of target awards vesting.
|
CEO:
£1,763,984 (b)
CFO: £434,415 (b) |
Four equally
weighted long-term performance measures. For the three business- focused metrics, 25% of the target award vests for threshold performance. For the TSR measure, 50% of the target award vests for threshold performance. |
1 January 2016 –
31 December 2018 |
Subject to four equally weighted performance measures:
Participants are required to hold all their own investment shares and remain employed by Unilever for the duration. |
|||||
|
GSIP Conditional share award made on 11 February 2016 |
The CEO received a target award of 200% of base salary.
CEO: PLC – 35,115 NV – 35,115
The CFO received a target award of 150% of base salary.
CFO: PLC – 16,297 NV – 16,297
Maximum vesting results in 200% of target awards vesting, which translates to a maximum vesting of 400% of base salary for the CEO and 300% of base salary for the CFO.
|
CEO:
£4,140,739 (b)
CFO: £1,921,732 (b) |
As above | As above |
Subject to four equally weighted performance measures:
|
|||||
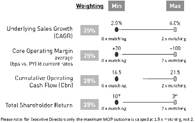
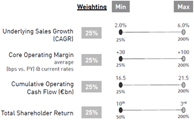
| (a) | Under MCIP, Executive Directors are able to choose whether they invest in PLC shares or NV shares or an equal number of shares in each. Executive Directors receive a corresponding number of performance-related matching shares. Matching shares will be awarded in the same form as the investment shares (i.e. in PLC shares, NV shares or an equal number of shares in each). On 11 February 2016, the CEO invested 60% (£1,119,888) and the CFO invested 60% (£282,520) of their 2015 bonus in MCIP investment shares. The CEO elected to invest fully in NV shares. The CFO elected to receive an equal number of shares in each of PLC and NV. |
| (b) | The face values included in this table are calculated by multiplying the number of shares granted on 11 February 2016 by the share price on that day of PLC £29.05 and NV € 36.69 respectively, assuming maximum performance and therefore maximum vesting of 200% for GSIP and 150% for MCIP and then translating into sterling using an average exchange rate over 2016 of € 1 = £0.8152. |
| 70 | Governance | Annual Report on Form 20-F 2016 |
Table of Contents
MINIMUM SHAREHOLDING REQUIREMENT AND EXECUTIVE DIRECTOR SHARE INTERESTS (UNAUDITED)
The table below shows the Executive Directors’ share ownership against the minimum shareholding requirements as at 31 December 2016 and the interest in NV and PLC ordinary shares of Executive Directors and their connected persons as at 31 December 2016.
When calculating an Executive Director’s personal shareholding the following methodology is used:
| • | Base salary at the date of measurement. |
| • | Shares in either Unilever PLC or Unilever N.V. (or a combination of both) will qualify provided they are personally owned by the Executive Director, by a member of his (immediate) family or by certain corporate bodies, trusts or partnerships as required by law from time to time (each a ‘connected person’). |
| • | Shares purchased under the MCIP from the annual bonus will qualify as from the moment of purchase as these are held in the individual’s name and are not subject to further restrictions. |
| • | Shares or entitlements to shares that are subject only to the Director remaining in employment will qualify on a net of tax basis. |
| • | Shares awarded on a conditional basis by way of the GSIP or MCIP will not qualify until the moment of vesting (i.e. once the precise number of shares is fixed after the three-year vesting period, or a four-year vesting period for the MCIP, has elapsed). |
| • | The shares will be valued on the date of measurement or, if that outcome fails the personal shareholding test, on the date of acquisition. The share price for the relevant measurement date will be based on the average closing share prices and the euro/sterling/US dollar exchange rates from the 60 calendar days prior to the measurement date. |
Executive Directors are required to hold shares to the value of 100% of their shareholding requirement for 12 months post cessation of employment at Unilever, and 50% of these shares for 24 months post cessation of employment with Unilever. All ULE members are required to build a shareholding of 300% of base salary. This requirement is 150% of base salary for the ‘Top 100’ management layer below ULE.
EXECUTIVE DIRECTORS’ AND THEIR CONNECTED PERSONS’ INTERESTS IN SHARES AND SHARE OWNERSHIP (AUDITED)
| Share ownership | Actual share | Shares held as at | Shares held as at | |||||||||||||||||||||||||
| guideline as % of | Have guidelines | ownership as a % | 1 January 2016 (b) | 31 December 2016 | ||||||||||||||||||||||||
| base salary (as at | been met (as at | of base salary (as at | NV | PLC | NV | PLC | ||||||||||||||||||||||
| 31 December 2016) | 31 December 2016)? | 31 December 2016) (a) | ||||||||||||||||||||||||||
|
CEO: Paul Polman |
400 | Yes | 3,433% | 655,307 | 297,008 | 824,245 | 307,239 | |||||||||||||||||||||
|
CFO: Graeme Pitkethly |
300 | Yes | 367% | 17,468 | 27,569 | 32,189 | 42,908 | |||||||||||||||||||||
| (a) | Calculated based on the minimum shareholding requirements and methodology set out above and the base salaries as detailed for the CEO and CFO in section (A) on page 67. |
| (b) | NV shares are ordinary € 0.16 shares and PLC shares are ordinary 3 1 ⁄ 9 p shares. |
During the period between 31 December 2016 and 21 February 2017, the following changes in interests have occurred:
| • | Graeme Pitkethly purchased 8 PLC shares under the Unilever PLC ShareBuy Plan: 4 on 10 January 2017 at a share price of £33.50, and a further 4 on 8 February 2017 at a share price of £33.09; and |
| • | as detailed under headings (D) and (E) on page 69, on 14 February 2017: |
| ○ | Paul Polman acquired 31,964 NV shares following the vesting of his 2014 MCIP award, and 67,186 NV shares following the vesting of his 2014 GSIP award, in accordance with his share choice to receive 100% NV shares on the vesting of these awards; and |
| ○ | Graeme Pitkethly acquired 1,964 NV shares and 1,983 PLC shares following the vesting of his 2014 MCIP award, and 3,915 NV shares and 3,952 PLC shares following the vesting of his 2014 GSIP award. |
The voting rights of the Directors (Executive and Non-Executive) and members of the ULE who hold interests in the share capital of NV and PLC are the same as for other holders of the class of shares indicated. As at 21 February 2017 none of the Directors’ (Executive and Non-Executive) or other ULE members’ shareholdings amounted to more than 1% of the issued shares in that class of share, excluding the holdings of the Leverhulme Trust and the Leverhulme Trade Charities Trust, which amounted to 5.5%. All shareholdings in the table above are beneficial. In addition, 68,531,182 shares are held by the Leverhulme Trust and 2,035,582 shares are held by the Leverhulme Trade Charities Trust, of which Paul Polman is a director.
INFORMATION IN RELATION TO OUTSTANDING SHARE INCENTIVE AWARDS
As at 31 December 2016, Paul Polman held awards over a total of 362,163 shares which are subject to performance conditions, and Graeme Pitkethly held awards over a total of 66,760 shares which are subject to performance conditions. There are no awards of shares without performance conditions and no awards in the form of options.
| Annual Report on Form 20-F 2016 | Governance | 71 |
Table of Contents
DIRECTORS’ REMUNERATION REPORT CONTINUED
MANAGEMENT CO-INVESTMENT PLAN (AUDITED)
The following conditional shares vested during 2016 or were outstanding at 31 December 2016 under the MCIP:
| Balance of | Balance of | |||||||||||||||||||||||||||||||||||||||
| conditional shares | Conditional shares | conditional shares | ||||||||||||||||||||||||||||||||||||||
| at 1 January 2016 | awarded in 2016 (a) | at 31 December 2016 | ||||||||||||||||||||||||||||||||||||||
| Dividend | ||||||||||||||||||||||||||||||||||||||||
| Performance | shares | Additional | ||||||||||||||||||||||||||||||||||||||
| period | accrued | shares | ||||||||||||||||||||||||||||||||||||||
| Share | Original | 1 January 2016 to | Price at | during | Vested in | earned in | Price at | Shares | No. of | |||||||||||||||||||||||||||||||
| type | award | 31 December 2018 | award | the year (d) | 2016 (e) | 2016 | vesting | lapsed | shares | |||||||||||||||||||||||||||||||
|
Paul Polman |
NV | 99,362 | (b) | 39,318 | € | 36.69 | 3,327 | 24,779 | 0 | € | 38.85 | 505 | 116,723 | |||||||||||||||||||||||||||
| PLC | 25,509 | (b) | 0 | £ | 29.05 | 0 | 24,999 | 0 | £ | 30.25 | 510 | 0 | ||||||||||||||||||||||||||||
|
Graeme Pitkethly |
NV | 5,401 | (c) | 4,912 | € | 36.69 | 192 | 3,700 | 564 | € | 38.85 | 0 | 7,369 | |||||||||||||||||||||||||||
| PLC | 7,715 | (c) | 4,912 | £ | 29.05 | 301 | 3,733 | 569 | £ | 30.25 | 0 | 9,765 | ||||||||||||||||||||||||||||
| (a) | Each award of conditional matching shares vests three years after the date of the award, subject to performance conditions (further details can be found on pages 69-70). Awards are all subject to continued employment and maintenance of the underlying investment shares. Under MCIP, Executive Directors are able to choose whether they invest in PLC or NV shares or an equal number of shares in each. Executive Directors receive a corresponding number of performance-related matching shares. |
| Matching shares will be awarded in the same form as the investment shares (i.e. in PLC shares, NV shares or an equal number of shares in each). On 11 February 2016, Paul Polman and Graeme Pitkethly each invested in the MCIP 60% of their annual bonus earned during 2015 and paid in 2016, and received a corresponding award of matching shares (which will vest, subject to performance, on 11 February 2019). |
| (b) | This includes a grant of 22,999 of each of NV and PLC shares made on 18 February 2013 (98% of which vested on 18 February 2016), a grant of 41,775 NV shares made on 14 February 2014 (70% of which vested on 14 February 2017), a grant of 29,128 NV shares made on 13 February 2015 (vesting 13 February 2018) and 5,460 NV shares and 2,510 PLC shares from reinvested dividends accrued in prior years in respect of awards. |
| (c) | This includes grants that were made to Graeme Pitkethly before his appointment as Executive Director on 21 April 2016, being a grant of 2,852 of each of NV and PLC shares made on 18 February 2013 (118% of which vested on 18 February 2016), a grant of 2,139 of each of NV and PLC shares made on 14 February 2014 (84% of which vested on 14 February 2017), a grant of 2,215 PLC shares made on 13 February 2015 (vesting 13 February 2018) and 410 NV shares and 509 PLC shares from reinvested dividends accrued in prior years in respect of awards. |
| (d) | Reflects reinvested dividend equivalents accrued during 2016 and subject to the same performance conditions as the underlying matching shares. |
| (e) | The 18 February 2013 grant vested on 18 February 2016 at 98% for Paul Polman and 118% for Graeme Pitkethly. In accordance with Unilever’s existing Remuneration Policy ( www.unilever.com/ara2016/downloads ), Executive Directors are able to choose whether they receive any shares due to vest under MCIP in PLC or NV shares or an equal number of shares in each. Paul Polman elected for share choice and chose to receive his shares in the form of 100% NV shares. Therefore, upon vesting, his 18 February 2013 PLC award was cancelled and converted and delivered to him as 24,971 NV shares (resulting in a total vesting for the 18 February grant of 49,750 NV shares). Graeme Pitkethly elected to receive his shares in the form of an equal number of shares in each of PLC and NV. |
GLOBAL SHARE INCENTIVE PLAN (AUDITED)
The following conditional shares vested during 2016 or were outstanding at 31 December 2016 under the GSIP:
| Balance of | Balance of | |||||||||||||||||||||||||||||||||||||||
| conditional shares | Conditional shares | conditional shares | ||||||||||||||||||||||||||||||||||||||
| at 1 January 2016 | awarded in 2016 (a) | at 31 December 2016 | ||||||||||||||||||||||||||||||||||||||
| Dividend | ||||||||||||||||||||||||||||||||||||||||
| Performance | shares | Additional | ||||||||||||||||||||||||||||||||||||||
| period | accrued | shares | ||||||||||||||||||||||||||||||||||||||
| Share | Original | 1 January 2016 to | Price at | during | Vested in | earned in | Price at | Shares | No. of | |||||||||||||||||||||||||||||||
| type | award | 31 December 2018 | award | the year (d) | 2016 (e) | 2016 | vesting | lapsed | shares | |||||||||||||||||||||||||||||||
|
Paul Polman |
NV | 127,306 | (b) | 35,115 | € | 36.69 | 3,532 | 42,769 | 0 | € | 38.85 | 873 | 122,311 | |||||||||||||||||||||||||||
| PLC | 128,029 | (b) | 35,115 | £ | 29.05 | 4,014 | 43,150 | 0 | £ | 30.25 | 879 | 123,129 | ||||||||||||||||||||||||||||
|
Graeme Pitkethly |
NV | 12,281 | (c) | 16,297 | € | 36.69 | 647 | 5,278 | 805 | € | 38.85 | 0 | 24,752 | |||||||||||||||||||||||||||
| PLC | 12,353 | (c) | 16,297 | £ | 29.05 | 737 | 5,325 | 812 | £ | 30.25 | 0 | 24,874 | ||||||||||||||||||||||||||||
| (a) | Each award of conditional shares vests three years after the date of the award, subject to performance conditions (further details can be found on pages 69-70). The 2016 award was made on 11 February 2016 (vesting 11 February 2019). |
| (b) | This includes a grant of 39,698 of each of NV and PLC shares made on 18 February 2013 (98% of which vested on 18 February 2016), a grant of 43,700 of each of NV and PLC shares made on 14 February 2014 (70% of which vested on 14 February 2017), a grant of 36,497 of each of NV and PLC shares made on 13 February 2015 (vesting 13 February 2018) and 7,411 NV shares and 8,134 PLC shares from reinvested dividends accrued in prior years in respect of awards. |
| (c) | This includes grants that were made to Graeme Pitkethly before his appointment as Executive Director on 21 April 2016, being a grant of 4,068 of each of NV and PLC shares made on 18 February 2013 (118% of which vested on 18 February 2016), a grant of 4,263 of each of NV and PLC shares made on 14 February 2014 (84% of which vested on 14 February 2017), a grant of 3,216 of each of NV and PLC shares made on 13 February 2015 (vesting 13 February 2018) and 734 NV shares and 806 PLC shares from reinvested dividends accrued in prior years in respect of awards. |
| (d) | Reflects reinvested dividend equivalents accrued during 2016, subject to the same performance conditions as the underlying GSIP shares. |
| (e) | The 18 February 2013 grant vested on 18 February 2016 at 98% for Paul Polman and 118% for Graeme Pitkethly. In accordance with Unilever’s existing Remuneration Policy ( www.unilever.com/ara2015/downloads ), Executive Directors are able to choose whether they receive any shares due to vest under GSIP in PLC or NV shares or an equal number of shares in each. Paul Polman elected for share choice and chose to receive his shares in the form of 100% NV shares. Therefore, upon vesting, his 18 February 2013 PLC award was cancelled and converted and delivered to him as 43,102 NV shares (resulting in a total vesting for the 18 February grant of 85,871 NV shares). Graeme Pitkethly elected to receive his shares in the form of an equal number of shares in each of PLC and NV. |
On 13 February 2017, under the GSIP Paul Polman received an award of 30,532 NV and 30,532 PLC performance-related shares, and Graeme Pitkethly received an award of 14,171 NV and 14,171 PLC performance-related shares.
| 72 | Governance | Annual Report on Form 20-F 2016 |
Table of Contents
EXECUTIVE DIRECTORS’ SERVICE CONTRACTS
Starting dates of our Executive Directors’ service contracts:
| • | Paul Polman: 1 October 2008 (signed on 7 October 2008); and |
| • | Graeme Pitkethly: 1 October 2015 (signed on 16 December 2015). |
Service contracts are available to shareholders to view at the AGMs or on request from the Group Secretary, and can be terminated with 12 months’ notice from Unilever or six months’ notice from the Executive Director. A payment in lieu of notice can be made of no more than one year’s base salary, fixed allowance and other benefits unless the Boards, at the proposal of the Committee, find this manifestly unreasonable given the circumstances or unless dictated by applicable law. Other payments that can be made to Executive Directors in the event of loss of office are disclosed in our existing Remuneration Policy which is available on our website (see www.unilever.com/ara2015/downloads ) , and in our new Remuneration Policy detailed above (in the event of its approval by shareholders).
PAYMENTS TO FORMER DIRECTORS (AUDITED)
There have been no payments to former Directors during the year.
PAYMENTS FOR LOSS OF OFFICE (AUDITED)
There were no payments for loss of office.
IMPLEMENTATION OF THE REMUNERATION POLICY IN 2017 FOR NON-EXECUTIVE DIRECTORS
The current Non-Executive Director fee levels will not be changed for 2017 and we will review fee levels for 2018 during the course of the year. The table below outlines the current fee structure (with fees paid 50% by each of Unilever N.V. and Unilever PLC):
| Role |
Reference
sterling total fees |
NV | PLC | |||||||||||||||||||||
| Basic Non-Executive Director fee | £75,000 | €48,065 | and | £37,500 | ||||||||||||||||||||
| Current Chairman (all-inclusive figure) (a) | £600,000 | €384,510 | and | £300,000 | ||||||||||||||||||||
| Vice-Chairman | £30,000 | €19,226 | and | £15,000 | ||||||||||||||||||||
| Membership of the Nominating and Corporate Governance, Compensation or Corporate Responsibility Committee | £10,000 | €6,409 | and | £5,000 | ||||||||||||||||||||
| Membership of the Audit Committee | £15,000 | €9,613 | and | £7,500 | ||||||||||||||||||||
| Chair of the Nominating and Corporate Governance, Compensation or Corporate Responsibility Committee | £20,000 | €12,817 | and | £10,000 | ||||||||||||||||||||
| Chair of the Audit Committee | £30,000 | €19,226 | and | £15,000 | ||||||||||||||||||||
| (a) | During 2016 the Compensation Committee increased the Chairman’s fee from the previous figure of £550,000; the increase took effect upon the appointment of Marijn Dekkers as Chairman on 21 April 2016. |
All reasonable travel and other expenses incurred by Non-Executive Directors in the course of performing their duties are considered to be business expenses. Non-Executive Directors also receive expenses relating to the attendance of the Director’s spouse or partner, when they are invited by Unilever.
| Annual Report on Form 20-F 2016 | Governance | 73 |
Table of Contents
DIRECTORS’ REMUNERATION REPORT CONTINUED
SINGLE FIGURE OF REMUNERATION IN 2016 FOR NON-EXECUTIVE DIRECTORS (AUDITED)
The table below shows a single figure of remuneration for each of our Non-Executive Directors, for the years 2015 and 2016.
| 2016 | 2015 | |||||||||||||||||||||||
| Non-Executive Director |
|
Fees
€’000 |
(a)
|
|
Benefits
€’000 |
(b)
|
|
Total
remuneration
|
|
|
Fees
€ ’000 |
(a)
|
|
Benefits
€ ’000 |
(b)
|
|
Total
remuneration
|
|
||||||
|
Marijn Dekkers (c) |
502 | 18 | 520 | – | – | – | ||||||||||||||||||
|
Michael Treschow (d)(h) |
230 | 5 | 235 | 732 | 2 | 734 | ||||||||||||||||||
|
Nils Andersen |
111 | 17 | 128 | 75 | 4 | 79 | ||||||||||||||||||
|
Laura Cha |
119 | - | 119 | 122 | – | 122 | ||||||||||||||||||
|
Vittorio Colao |
107 | - | 107 | 57 | – | 57 | ||||||||||||||||||
|
Louise Fresco (e) |
119 | - | 119 | 126 | – | 126 | ||||||||||||||||||
|
Ann Fudge (f) |
157 | - | 157 | 149 | – | 149 | ||||||||||||||||||
|
Byron Grote (g) |
– | – | – | 47 | – | 47 | ||||||||||||||||||
|
Judith Hartmann |
113 | 9 | 122 | 80 | – | 80 | ||||||||||||||||||
|
Mary Ma |
113 | - | 113 | 120 | – | 120 | ||||||||||||||||||
|
Strive Masiyiwa |
71 | - | 71 | – | – | – | ||||||||||||||||||
|
Youngme Moon |
71 | - | 71 | – | – | – | ||||||||||||||||||
|
Hixonia Nyasulu (h) |
38 | - | 38 | 120 | – | 120 | ||||||||||||||||||
|
Sir Malcolm Rifkind (g) |
– | – | – | 38 | – | 38 | ||||||||||||||||||
|
John Rishton (i) |
132 | 8 | 140 | 133 | – | 133 | ||||||||||||||||||
|
Kees Storm (g) |
– | – | – | 73 | – | 73 | ||||||||||||||||||
|
Feike Sijbesma (j) |
132 | – | 132 | 126 | 1 | 127 | ||||||||||||||||||
|
Paul Walsh (g) |
– | – | – | 42 | – | 42 | ||||||||||||||||||
|
Total |
2,015 | 57 | 2,072 | 2,040 | 7 | 2,047 | ||||||||||||||||||
| (a) | This includes fees received from NV in euros and PLC in sterling for 2015 and 2016 respectively. Includes basic Non-Executive Director fee and Committee chairmanship and/or membership. |
| (b) | The only benefit received relates to travel by spouses or partners where they are invited by Unilever. |
| (c) | Chairman with effect from 21 April 2016. |
| (d) | Chairman until 21 April 2016. |
| (e) | Chair, Corporate Responsibility Committee. |
| (f) | Vice-Chairman and Chair of the Compensation Committee. |
| (g) | Retired from the Boards at the April 2015 AGMs. |
| (h) | Retired from the Boards at the April 2016 AGMs. |
| (i) | Chair, Audit Committee. |
| (j) | Chair, Nominating and Corporate Governance Committee. |
We do not grant our Non-Executive Directors any personal loans or guarantees, nor are they entitled to any severance payments.
NON-EXECUTIVE DIRECTORS’ INTERESTS IN SHARES (AUDITED)
Non-Executive Directors are encouraged to build up a personal shareholding of at least 1 x their annual fees over the five years from 1 January 2012 (or appointment if later). The table shows the interests in NV and PLC ordinary shares of Non-Executive Directors and their connected persons as at 31 December 2016. There has been no change in these interests between 31 December 2016 and 21 February 2017 (other than Judith Hartmann, who bought 1,500 NV shares on 31 January 2017 at a share price of € 37.60).
| 74 | Governance | Annual Report on Form 20-F 2016 |
Table of Contents
NON-EXECUTIVE DIRECTORS’ LETTERS OF APPOINTMENT
All Non-Executive Directors were re-appointed to the Boards at the 2016 AGMs, with the exception of Marijn Dekkers, Strive Masiyiwa and Youngme Moon (who were appointed for the first time), and Michael Treschow and Hixonia Nyasulu (who retired from the Boards).
| Non-Executive Director |
|
Date first appointed
to the Board |
|
|
Effective date of
current appointment |
(a) |
||
|
Marijn Dekkers |
21 April 2016 | 21 April 2016 | ||||||
|
Michael Treschow |
16 May 2007 | n/a | ||||||
|
Nils Andersen |
30 April 2015 | 21 April 2016 | ||||||
|
Laura Cha |
15 May 2013 | 21 April 2016 | ||||||
|
Vittorio Colao |
1 July 2015 | 21 April 2016 | ||||||
|
Louise Fresco |
14 May 2009 | 21 April 2016 | ||||||
|
Ann Fudge |
14 May 2009 | 21 April 2016 | ||||||
|
Judith Hartmann |
30 April 2015 | 21 April 2016 | ||||||
|
Mary Ma |
15 May 2013 | 21 April 2016 | ||||||
|
Strive Masiyiwa |
21 April 2016 | 21 April 2016 | ||||||
|
Youngme Moon |
21 April 2016 | 21 April 2016 | ||||||
|
Hixonia Nyasulu |
16 May 2007 | n/a | ||||||
|
John Rishton |
15 May 2013 | 21 April 2016 | ||||||
|
Feike Sijbesma |
1 November 2014 | 21 April 2016 |
| (a) | The unexpired term for all Non-Executive Directors’ letters of appointment is the period up to the 2017 AGMs, as they all, unless they are retiring, submit themselves for annual re-appointment. |
OTHER DISCLOSURES RELATED TO DIRECTORS’ REMUNERATION
SERVING AS A NON-EXECUTIVE ON THE BOARD OF ANOTHER COMPANY
Executive Directors serving as non-executive directors on the boards of other companies are permitted to retain all remuneration and fees earned from outside directorships subject to a maximum of one outside listed directorship (see ‘Independence and Conflicts’ on page 30 for further details).
Paul Polman is a non-executive director of The Dow Chemical Company and received an annual fee of € 127,749 (US$115,000) based on the average exchange rate over the year 2016 of € 1 = US$1.1109. In addition, he received a restricted award of 2,680 ordinary shares with a nominal value of US$2.50 per share in the capital of The Dow Chemical Company. The shares include the rights to vote and to receive dividends thereon. The shares cannot be sold or transferred until Paul Polman leaves the board of directors of The Dow Chemical Company, and in any case not earlier than 13 May 2018.
EIGHT-YEAR HISTORICAL TOTAL SHAREHOLDER RETURN (TSR) PERFORMANCE
The graph below includes:
| • | growth in the value of a hypothetical £100 holding over eight years’ FTSE 100 comparison based on 30-trading-day average values; and |
| • | growth in the value of a hypothetical € 100 investment over eight years’ AEX comparison based on 30-trading-day average values. |
The Committee has decided to show Unilever’s performance against the FTSE 100 Index, London and also the Euronext 100 index (AEX), Amsterdam as these are the most relevant indices in the UK and the Netherlands where we have our principal listings. Unilever is a constituent of both these indices.
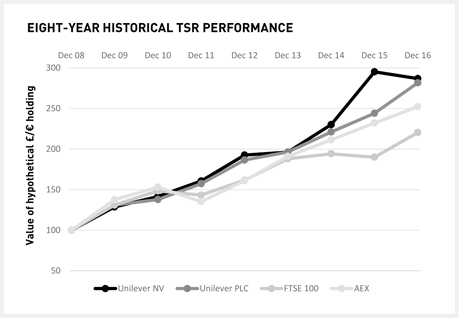
| Annual Report on Form 20-F 2016 | Governance | 75 |
Table of Contents
DIRECTORS’ REMUNERATION REPORT CONTINUED
CEO SINGLE FIGURE EIGHT-YEAR HISTORY
The table below shows the eight-year history of the CEO single figure of total remuneration:
| 2009 | 2010 | 2011 | 2012 | 2013 | 2014 | 2015 | 2016 | |||||||||||||||||||||||||
|
CEO |
||||||||||||||||||||||||||||||||
|
Single figure of total remuneration ( € ‘000) |
3,859 | 6,292 | 6,010 | 7,852 | 7,740 | 9,561 | 10,296 | 8,370 | ||||||||||||||||||||||||
|
Annual bonus award rates against maximum opportunity |
82% | 80% | 68% | 100% | 78% | 66% | 92% | 92% | ||||||||||||||||||||||||
|
GSIP performance shares vesting rates against maximum opportunity |
n/a | 47% | 44% | 55% | 64% | 61% | 49% | 35% | ||||||||||||||||||||||||
|
MCIP matching shares vesting rates against maximum opportunity |
n/a | n/a | n/a | n/a | n/a | 81% | 65% | 47% | ||||||||||||||||||||||||
|
Share Matching Plan vesting rates against maximum opportunity (a) |
100% | 100% | n/a | n/a | n/a | n/a | n/a | n/a | ||||||||||||||||||||||||
| (a) | Shown in year of award. |
PERCENTAGE CHANGE IN REMUNERATION OF DIRECTOR UNDERTAKING THE ROLE OF CHIEF EXECUTIVE OFFICER
The table below shows the percentage change from 2015 to 2016 for base salary, bonus and benefits (excluding pension) for both the CEO and all UK and Dutch management in Unilever. The subset of UK and Dutch management has been used as a fair representation of our dual listing status.
| % change from 2015 to 2016 | Salary | Bonus |
Benefits
(not including pension) |
|||||||||
|
CEO (a)(b) |
-11.0% | -11.0% | -5.1% | |||||||||
|
UK and Dutch management (c) |
-4.3% | -11.7% | -23.6% | |||||||||
| (a) | Calculated using the data from the Executive Directors’ single figure table on page 67. |
| (b) | It is noted that although the CEO’s salary and annual bonus have decreased by 11.0% in the above table, this is due to currency movements, rather than any change in remuneration amounts (as base salary was £1,010,000 in both 2015 and 2016, and actual annual bonus was £1,866,480 in both years). |
| (c) | Similarly, figures for UK and Dutch management have also been affected by the sterling:euro exchange rate, and a rebalancing of fixed pay amounts to roll up some local allowances into salary. |
RELATIVE IMPORTANCE OF SPEND ON PAY
The chart below shows the relative spend on pay compared with dividends paid to Unilever shareholders and core earnings. Core earnings represent the net profit attributable to Unilever shareholders, adjusted for non-core items. Over time, both core earnings and core earnings growth provide a good reference point to compare spend on pay.
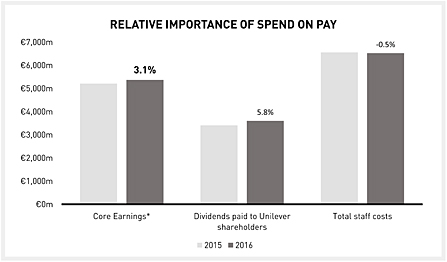
| * | In calculating core earnings, net profit attributable to shareholders’ equity is adjusted to eliminate the post-tax impact of non-core items. Refer to note 7, and the table entitled ‘Calculation of core earnings’ on page 103 for reconciliation of core earnings to net profit attributable to shareholders’ equity. |
| 76 | Governance | Annual Report on Form 20-F 2016 |
Table of Contents
THE COMPENSATION COMMITTEE
The Committee’s membership has been further refreshed in 2016. Ann Fudge (Chair) and Vittorio Colao both served throughout this period. Former Chairman Michael Treschow was a member of the Committee until 21 April 2016, when he retired from the Boards; he was effectively replaced by his successor in that role, Marijn Dekkers, who became a member of the Committee on 21 April 2016 immediately upon his appointment as Chairman. Similarly, Nils Andersen stepped down from the Committee on 21 April 2016, with his place being taken by Strive Masiyiwa, who joined the Committee immediately upon his appointment as a Non-Executive Director becoming effective on 21 April 2016.
The Committee reviewed its terms of reference during the year. The Committee’s revised terms of reference are contained within ‘The Governance of Unilever’, and are also set out on our website ( www.unilever.com/corporategovernance ).
As part of the internal Board evaluation carried out in 2016, the Boards evaluated the performance of the Committee. The Committee also carried out an assessment of its own performance in 2016. Overall the Committee members concluded that the Committee is performing effectively, and has enhanced its effectiveness and that of the Boards by keeping the Boards informed of the progress of its review of the executive remuneration framework (and related shareholder consultation) in a timely manner, so as to enhance Board decision-making concerning these proposals. The Committee intends to further enhance its effectiveness in 2017 by reducing pre-read materials where possible, and building in longer NED-only Committee sessions for members to share views and priorities.
ADVISERS
While it is the Committee’s responsibility to exercise independent judgement, the Committee does request advice from management and professional advisers, as appropriate, to ensure that its decisions are fully informed given the internal and external environment.
The Committee appointed Tom Gosling of PricewaterhouseCoopers (PwC) to provide independent advice on various matters it considered. The wider PwC firm has also provided tax and consultancy services to Unilever including tax compliance, transfer pricing, other tax-related services, contract compliance reviews, internal audit advice and secondees, third party risk and compliance advice, cyber security advice, sustainability assurance and consulting, and financial due diligence on disposals. PwC is a member of the Remuneration Consultants Group and, as such, voluntarily operates under the code of conduct in relation to executive remuneration consulting in the UK, which is available at www.remunerationconsultantsgroup.com.
The Committee is satisfied that the PwC engagement partner and team, which provide remuneration advice to the Committee, do not have connections with Unilever N.V. or Unilever PLC that might impair their independence. The Committee reviewed the potential for conflicts of interest and judged that there were appropriate safeguards against such conflicts. The fees paid to PwC in relation to advice provided to the Committee in the year to 31 December 2016 were £107,900. This figure is calculated based on time spent and expenses incurred for the majority of advice provided, but on occasion for specific projects a fixed fee may be agreed.
During the year, the Committee also sought input from the CEO (Paul Polman), the Chief Human Resources Officer (Leena Nair, who succeeded Doug Baillie upon his retirement from this role in March 2016) and the EVP Global Head of Reward (Peter Newhouse) on various subjects including the remuneration of senior management. No individual Executive Director was present when their own remuneration was being discussed to ensure a conflict of interest did not arise. The Committee also received legal and governance advice from the Group Secretary (Tonia Lovell) and General Counsel - Executive Remuneration & Employment (Margot Fransen).
CLARIFICATION STATEMENT (APPLICABLE TO 2014 REMUNERATION POLICY)
After publication of our Directors’ Remuneration Report 2013 the Committee issued a clarification statement at the request of The Investment Association (previously: IMA and ABI). The statement is available on our website. The statement confirms that, under our existing Remuneration Policy, we will not make share awards higher than the maximum awards stated in our existing Remuneration Policy for current and newly hired Executive Directors without prior shareholder approval. It further clarifies that awards to newly hired Executive Directors to buy out remuneration items on leaving the previous employer as provided in the new hires policy will be made under the GSIP. Consequently, under such exceptional circumstances, the aggregated GSIP share awards for a newly hired Executive Director may be higher than the maximum annual award set out in the existing Remuneration Policy. As stated in the existing Remuneration Policy in relation to new hires, we will inform shareholders of any such buyout awards when announcing the appointment. Further details of our existing Remuneration Policy are available at www.unilever.com/ara2016/downloads , and for details of our proposed new Remuneration Policy please see above.
SHAREHOLDER VOTING
Unilever remains committed to ongoing shareholder dialogue and takes an active interest in voting outcomes. In the event of a substantial vote against a resolution in relation to Directors’ remuneration, Unilever would seek to understand the reasons for any such vote and would set out in the following Annual Report and Accounts any actions in response to it. The following table sets out actual voting in respect of our previous report:
|
Voting outcome (% of votes)
|
For
|
Against
|
||||||||
|
2015 Directors’ Remuneration Report (excluding the Directors’ Remuneration Policy) (2016 AGM) (a) |
PLC | 94.49% | 5.51% | |||||||
|
2014 Directors’ Remuneration Policy (2014 AGM) (b) |
PLC | 97.51% | 2.49% | |||||||
|
2014 Directors’ Remuneration Policy (2014 AGM) (c) |
NV | 98.37% | 1.63% | |||||||
| (a) | 1,772,026 votes were withheld (approximately 0.14% of share capital). |
| (b) | 7,606,237 votes were withheld (approximately 0.85% of share capital). |
| (c) | 4,188,993 votes were withheld (approximately 0.27% of share capital). |
The Directors’ Remuneration Report is not subject to a shareholder vote in the Netherlands. It has been approved by the Boards, and signed on their behalf by Tonia Lovell, Group Secretary.
| Annual Report on Form 20-F 2016 | Governance | 77 |
Table of Contents
STATEMENT OF DIRECTORS’ RESPONSIBILITIES
| 78 | Financial Statements | Annual Report on Form 20-F 2016 |
Table of Contents
REPORT OF INDEPENDENT REGISTERED PUBLIC ACCOUNTING FIRMS
THE BOARD OF DIRECTORS AND SHAREHOLDERS
We have audited the accompanying consolidated balance sheets of the Unilever Group (Unilever N.V. and Unilever PLC, together with their subsidiaries) as at 31 December 2016 and 2015 and the related consolidated income statements, consolidated statements of comprehensive income, consolidated statements of changes in equity, and consolidated cash flow statements for each of the years in the three-year period ended 31 December 2016 on pages 84 to 143 of the Unilever Group’s Annual Report and Accounts 2016 (excluding note 25 on page 130) and the Guarantor financial information included in the Guarantor Statements on pages 170 to 174 of this Form 20-F (hereafter referred to as ‘Consolidated Financial Statements’). We also have audited the Unilever Group’s internal control over financial reporting as at 31 December 2016, based on criteria established in Internal Control – Integrated Framework (2013) issued by the Committee of Sponsoring Organizations of the Treadway Commission (COSO). The Unilever Group’s management is responsible for these Consolidated Financial Statements, for maintaining effective internal control over financial reporting, and for its assessment of the effectiveness of internal control over financial reporting included in Management’s Report on Internal Control over Financial Reporting included on page 167 of this Form 20-F. Our responsibility is to express an opinion on these Consolidated Financial Statements and an opinion on the Unilever Group’s internal control over financial reporting based on our audits.
We conducted our audits in accordance with the standards of the Public Company Accounting Oversight Board (United States). Those standards require that we plan and perform the audits to obtain reasonable assurance about whether the Consolidated Financial Statements are free of material misstatement and whether effective internal control over financial reporting was maintained in all material respects. Our audits of the Consolidated Financial Statements included examining, on a test basis, evidence supporting the amounts and disclosures in the Consolidated Financial Statements, assessing the accounting principles used and significant estimates made by management, and evaluating the overall financial statement presentation. Our audit of internal control over financial reporting included obtaining an understanding of internal control over financial reporting, assessing the risk that a material weakness exists, and testing and evaluating the design and operating effectiveness of internal control based on the assessed risk. Our audits also included performing such other procedures as we considered necessary in the circumstances. We believe that our audits provide a reasonable basis for our opinions.
A company’s internal control over financial reporting is a process designed to provide reasonable assurance regarding the reliability of financial reporting and the preparation of financial statements for external purposes in accordance with generally accepted accounting principles. A company’s internal control over financial reporting includes those policies and procedures that (i) pertain to the maintenance of records that, in reasonable detail, accurately and fairly reflect the transactions and dispositions of the assets of the company; (ii) provide reasonable assurance that transactions are recorded as necessary to permit preparation of financial statements in accordance with generally accepted accounting principles, and that receipts and expenditures of the company are being made only in accordance with authorisations of management and Directors of the company; and (iii) provide reasonable assurance regarding prevention or timely detection of unauthorised acquisition, use, or disposition of the company’s assets that could have a material effect on the Consolidated Financial Statements.
Because of its inherent limitations, internal control over financial reporting may not prevent or detect misstatements. Also, projections of any evaluation of effectiveness to future periods are subject to the risk that controls may become inadequate because of changes in conditions, or that the degree of compliance with the policies or procedures may deteriorate.
In our opinion, the Consolidated Financial Statements referred to above present fairly, in all material respects, the financial position of the Unilever Group as at 31 December 2016 and 2015, and the results of its operations and its cash flows for each of the years in the three-year period ended 31 December 2016, in conformity with International Financial Reporting Standards (IFRS) as issued by the International Accounting Standards Board and in conformity with IFRS as adopted by the European Union. Also in our opinion, the Unilever Group maintained, in all material respects, effective internal control over financial reporting as of 31 December 2016, based on criteria established in Internal Control – Integrated Framework (2013) issued by the Committee of Sponsoring Organizations of the Treadway Commission (COSO).
| KPMG LLP | KPMG Accountants N.V. | |
|
London, United Kingdom
/s/ KPMG LLP |
Amsterdam, the Netherlands
/s/ KPMG Accountants N.V. |
|
| 24 February 2017 | ||
| Annual Report on Form 20-F 2016 | Financial Statements | 79 |
Table of Contents
THIS PAGE IS INTENTIONALLY LEFT BLANK
| 80 | Financial Statements | Annual Report on Form 20-F 2016 |
Table of Contents
THIS PAGE IS INTENTIONALLY LEFT BLANK
| Annual Report on Form 20-F 2016 | Financial Statements | 81 |
Table of Contents
THIS PAGE IS INTENTIONALLY LEFT BLANK
| 82 | Financial Statements | Annual Report on Form 20-F 2016 |
Table of Contents
THIS PAGE IS INTENTIONALLY LEFT BLANK
| Annual Report on Form 20-F 2016 | Financial Statements | 83 |
Table of Contents
CONSOLIDATED FINANCIAL STATEMENTS
UNILEVER GROUP
for the year ended 31 December
| Notes |
€ million
2016 |
€
million
2015 |
€
million
2014 |
|||||||||||
|
Turnover |
2 | 52,713 | 53,272 | 48,436 | ||||||||||
|
Operating profit |
2 | 7,801 | 7,515 | 7,980 | ||||||||||
|
After (charging)/crediting non-core items |
3 | (245 | ) | (350 | ) | 960 | ||||||||
|
Net finance costs |
5 | (563 | ) | (493 | ) | (477 | ) | |||||||
|
Finance income |
115 | 144 | 117 | |||||||||||
|
Finance costs |
(584 | ) | (516 | ) | (500 | ) | ||||||||
|
Pensions and similar obligations |
(94 | ) | (121 | ) | (94 | ) | ||||||||
|
Share of net profit/(loss) of joint ventures and associates |
11 | 127 | 107 | 98 | ||||||||||
|
Other income/(loss) from non-current investments and associates |
104 | 91 | 45 | |||||||||||
|
Profit before taxation |
7,469 | 7,220 | 7,646 | |||||||||||
|
Taxation |
6A | (1,922 | ) | (1,961 | ) | (2,131 | ) | |||||||
|
Net profit |
5,547 | 5,259 | 5,515 | |||||||||||
|
Attributable to: |
||||||||||||||
|
Non-controlling interests |
363 | 350 | 344 | |||||||||||
|
Shareholders’ equity |
5,184 | 4,909 | 5,171 | |||||||||||
|
Combined earnings per share |
7 | |||||||||||||
|
Basic earnings per share ( € ) |
1.83 | 1.73 | 1.82 | |||||||||||
|
Diluted earnings per share ( € ) |
1.82 | 1.72 | 1.79 | |||||||||||
CONSOLIDATED STATEMENT OF COMPREHENSIVE INCOME
for the year ended 31 December
| Notes |
€ million
2016 |
€
million
2015 |
€ million 2014 |
|||||||||||
|
Net profit |
5,547 | 5,259 | 5,515 | |||||||||||
|
Other comprehensive income |
6C | |||||||||||||
|
Items that will not be reclassified to profit or loss: |
||||||||||||||
|
Remeasurement of defined benefit pension plans net of tax |
15B | (980 | ) | 884 | (1,250) | |||||||||
|
Items that may be reclassified subsequently to profit or loss: |
||||||||||||||
|
Currency retranslation gains/(losses) net of tax (a) |
15B | 217 | (481 | ) | (25) | |||||||||
|
Fair value gains/(losses) on financial instruments net of tax |
15B | (15 | ) | 100 | (85) | |||||||||
|
Total comprehensive income |
4,769 | 5,762 | 4,155 | |||||||||||
|
Attributable to: |
||||||||||||||
|
Non-controlling interests |
374 | 357 | 404 | |||||||||||
|
Shareholders’ equity |
4,395 | 5,405 | 3,751 | |||||||||||
| (a) | Includes fair value gains/(losses) on net investment hedges and exchange differences in net investments in foreign operations of € (365) million (2015: € 617 million; 2014: € 412 million). |
References in the consolidated income statement, consolidated statement of comprehensive income, consolidated statement of changes in equity, consolidated balance sheet and consolidated cash flow statement relate to notes on pages 90 to 143, which form an integral part of the consolidated financial statements.
| 84 | Financial Statements | Annual Report on Form 20-F 2016 |
Table of Contents
CONSOLIDATED STATEMENT OF CHANGES IN EQUITY
| € million | € million | € million | € million | € million | € million | € million | ||||||||||||||||||||||
| Consolidated statement of changes in equity |
Called up
share capital |
Share
premium account |
Other
reserves |
Retained
profit |
Total |
Non-
controlling interests |
Total
equity |
|||||||||||||||||||||
|
31 December 2013 |
484 | 138 | (6,746 | ) | 20,468 | 14,344 | 471 | 14,815 | ||||||||||||||||||||
|
Profit or loss for the period |
- | - | - | 5,171 | 5,171 | 344 | 5,515 | |||||||||||||||||||||
|
Other comprehensive income net of tax: |
||||||||||||||||||||||||||||
|
Fair value gains/(losses) on financial instruments |
- | - | (85 | ) | - | (85 | ) | - | (85 | ) | ||||||||||||||||||
|
Remeasurement of defined benefit pension plans net of tax |
- | - | - | (1,253 | ) | (1,253 | ) | 3 | (1,250 | ) | ||||||||||||||||||
|
Currency retranslation gains/(losses) |
- | - | (290 | ) | 208 | (82 | ) | 57 | (25 | ) | ||||||||||||||||||
|
Total comprehensive income |
- | - | (375 | ) | 4,126 | 3,751 | 404 | 4,155 | ||||||||||||||||||||
|
Dividends on ordinary capital |
- | - | - | (3,196 | ) | (3,196 | ) | - | (3,196 | ) | ||||||||||||||||||
|
Movements in treasury stock (a) |
- | - | (235 | ) | (217 | ) | (452 | ) | - | (452 | ) | |||||||||||||||||
|
Share-based payment credit (b) |
- | - | - | 188 | 188 | - | 188 | |||||||||||||||||||||
|
Dividends paid to non-controlling interests |
- | - | - | - | - | (342 | ) | (342 | ) | |||||||||||||||||||
|
Currency retranslation gains/(losses) net of tax |
- | 7 | - | - | 7 | (2 | ) | 5 | ||||||||||||||||||||
|
Other movements in equity (c) |
- | - | (182 | ) | (809 | ) | (991 | ) | 81 | (910 | ) | |||||||||||||||||
|
31 December 2014 |
484 | 145 | (7,538 | ) | 20,560 | 13,651 | 612 | 14,263 | ||||||||||||||||||||
|
Profit or loss for the period |
- | - | - | 4,909 | 4,909 | 350 | 5,259 | |||||||||||||||||||||
|
Other comprehensive income net of tax: |
||||||||||||||||||||||||||||
|
Fair value gains/(losses) on financial instruments |
- | - | 100 | - | 100 | - | 100 | |||||||||||||||||||||
|
Remeasurement of defined benefit pension plans net of tax |
- | - | - | 882 | 882 | 2 | 884 | |||||||||||||||||||||
|
Currency retranslation gains/(losses) |
- | - | (377 | ) | (109 | ) | (486 | ) | 5 | (481 | ) | |||||||||||||||||
|
Total comprehensive income |
- | - | (277 | ) | 5,682 | 5,405 | 357 | 5,762 | ||||||||||||||||||||
|
Dividends on ordinary capital |
- | - | - | (3,404 | ) | (3,404 | ) | - | (3,404 | ) | ||||||||||||||||||
|
Movements in treasury stock (a) |
- | - | 6 | (282 | ) | (276 | ) | - | (276 | ) | ||||||||||||||||||
|
Share-based payment credit (b) |
- | - | - | 150 | 150 | - | 150 | |||||||||||||||||||||
|
Dividends paid to non-controlling interests |
- | - | - | - | - | (326 | ) | (326 | ) | |||||||||||||||||||
|
Currency retranslation gains/(losses) net of tax |
- | 7 | - | - | 7 | - | 7 | |||||||||||||||||||||
|
Other movements in equity |
- | - | (7 | ) | (87 | ) | (94 | ) | - | (94 | ) | |||||||||||||||||
|
31 December 2015 |
484 | 152 | (7,816 | ) | 22,619 | 15,439 | 643 | 16,082 | ||||||||||||||||||||
|
Profit or loss for the period |
- | - | - | 5,184 | 5,184 | 363 | 5,547 | |||||||||||||||||||||
|
Other comprehensive income net of tax: |
||||||||||||||||||||||||||||
|
Fair value gains/(losses) on financial instruments |
- | - | (15 | ) | - | (15 | ) | - | (15 | ) | ||||||||||||||||||
|
Remeasurement of defined benefit pension plans net of tax |
- | - | - | (980 | ) | (980 | ) | - | (980 | ) | ||||||||||||||||||
|
Currency retranslation gains/(losses) |
- | - | 189 | 17 | 206 | 11 | 217 | |||||||||||||||||||||
|
Total comprehensive income |
- | - | 174 | 4,221 | 4,395 | 374 | 4,769 | |||||||||||||||||||||
|
Dividends on ordinary capital |
- | - | - | (3,600 | ) | (3,600 | ) | - | (3,600 | ) | ||||||||||||||||||
|
Movements in treasury stock (a) |
- | - | (45 | ) | (213 | ) | (258 | ) | - | (258 | ) | |||||||||||||||||
|
Share-based payment credit (b) |
- | - | - | 198 | 198 | - | 198 | |||||||||||||||||||||
|
Dividends paid to non-controlling interests |
- | - | - | - | - | (364 | ) | (364 | ) | |||||||||||||||||||
|
Currency retranslation gains/(losses) net of tax |
- | (18 | ) | - | - | (18 | ) | - | (18 | ) | ||||||||||||||||||
|
Other movements in equity |
- | - | 244 | (46 | ) | 198 | (27 | ) | 171 | |||||||||||||||||||
|
31 December 2016 |
484 | 134 | (7,443 | ) | 23,179 | 16,354 | 626 | 16,980 | ||||||||||||||||||||
| (a) | Includes purchases and sales of treasury stock, and transfer from treasury stock to retained profit of share-settled schemes arising from prior years and differences between exercise and grant price of share options. |
| (b) | The share-based payment credit relates to the non-cash charge recorded against operating profit in respect of the fair value of share options and awards granted to employees. |
| (c) | 2014 includes the impact of the purchase of Estate shares (see note 24). |
| Annual Report on Form 20-F 2016 | Financial Statements | 85 |
Table of Contents
CONSOLIDATED FINANCIAL STATEMENTS
UNILEVER GROUP CONTINUED
as at 31 December
| Notes |
€ million
2016 |
€
million
2015 |
||||||||||
|
Assets |
||||||||||||
|
Non-current assets |
||||||||||||
|
Goodwill |
9 | 17,624 | 16,213 | |||||||||
|
Intangible assets |
9 | 9,809 | 8,846 | |||||||||
|
Property, plant and equipment |
10 | 11,673 | 11,058 | |||||||||
|
Pension asset for funded schemes in surplus |
4B | 694 | 934 | |||||||||
|
Deferred tax assets |
6B | 1,354 | 1,185 | |||||||||
|
Financial assets |
17A | 673 | 605 | |||||||||
|
Other non-current assets |
11 | 718 | 771 | |||||||||
| 42,545 | 39,612 | |||||||||||
|
Current assets |
||||||||||||
|
Inventories |
12 | 4,278 | 4,335 | |||||||||
|
Trade and other current receivables |
13 | 5,102 | 4,804 | |||||||||
|
Current tax assets |
317 | 230 | ||||||||||
|
Cash and cash equivalents |
17A | 3,382 | 2,302 | |||||||||
|
Other financial assets |
17A | 599 | 836 | |||||||||
|
Non-current assets held for sale |
22 | 206 | 179 | |||||||||
| 13,884 | 12,686 | |||||||||||
|
Total assets |
56,429 | 52,298 | ||||||||||
|
Liabilities |
||||||||||||
|
Current liabilities |
||||||||||||
|
Financial liabilities |
15C | 5,450 | 4,789 | |||||||||
|
Trade payables and other current liabilities |
14 | 13,871 | 13,788 | |||||||||
|
Current tax liabilities |
844 | 1,127 | ||||||||||
|
Provisions |
19 | 390 | 309 | |||||||||
|
Liabilities associated with assets held for sale |
22 | 1 | 6 | |||||||||
| 20,556 | 20,019 | |||||||||||
|
Non-current liabilities |
||||||||||||
|
Financial liabilities |
15C | 11,145 | 9,854 | |||||||||
|
Non-current tax liabilities |
120 | 121 | ||||||||||
|
Pensions and post-retirement healthcare liabilities: |
||||||||||||
|
Funded schemes in deficit |
4B | 2,163 | 1,569 | |||||||||
|
Unfunded schemes |
4B | 1,704 | 1,685 | |||||||||
|
Provisions |
19 | 1,033 | 831 | |||||||||
|
Deferred tax liabilities |
6B | 2,061 | 1,744 | |||||||||
|
Other non-current liabilities |
14 | 667 | 393 | |||||||||
| 18,893 | 16,197 | |||||||||||
|
Total liabilities |
39,449 | 36,216 | ||||||||||
|
Equity |
||||||||||||
|
Shareholders’ equity |
||||||||||||
|
Called up share capital |
15A | 484 | 484 | |||||||||
|
Share premium account |
134 | 152 | ||||||||||
|
Other reserves |
15B | (7,443 | ) | (7,816 | ) | |||||||
|
Retained profit |
23,179 | 22,619 | ||||||||||
| 16,354 | 15,439 | |||||||||||
|
Non-controlling interests |
626 | 643 | ||||||||||
|
Total equity |
16,980 | 16,082 | ||||||||||
|
Total liabilities and equity |
56,429 | 52,298 | ||||||||||
These financial statements have been approved by the Directors.
The Board of Directors
24 February 2017
| 86 | Financial Statements | Annual Report on Form 20-F 2016 |
Table of Contents
CONSOLIDATED CASH FLOW STATEMENT
for the year ended 31 December
| € million | € million | € million | ||||||||||||||
| Notes | 2016 | 2015 | 2014 | |||||||||||||
|
Net profit |
5,547 | 5,259 | 5,515 | |||||||||||||
|
Taxation |
1,922 | 1,961 | 2,131 | |||||||||||||
|
Share of net profit of joint ventures/associates and other income/(loss) from non-current investments and associates |
(231 | ) | (198 | ) | (143 | ) | ||||||||||
|
Net finance costs |
5 | 563 | 493 | 477 | ||||||||||||
|
Operating profit |
7,801 | 7,515 | 7,980 | |||||||||||||
|
Depreciation, amortisation and impairment |
1,464 | 1,370 | 1,432 | |||||||||||||
|
Changes in working capital: |
51 | 720 | 8 | |||||||||||||
|
Inventories |
190 | (129 | ) | (47 | ) | |||||||||||
|
Trade and other receivables |
142 | 2 | 82 | |||||||||||||
|
Trade payables and other liabilities |
(281 | ) | 847 | (27 | ) | |||||||||||
|
Pensions and similar obligations less payments |
(327 | ) | (385 | ) | (364 | ) | ||||||||||
|
Provisions less payments |
65 | (94 | ) | 32 | ||||||||||||
|
Elimination of (profits)/losses on disposals |
127 | 26 | (1,460 | ) | ||||||||||||
|
Non-cash charge for share-based compensation |
198 | 150 | 188 | |||||||||||||
|
Other adjustments |
(81 | ) | 49 | 38 | ||||||||||||
|
Cash flow from operating activities |
9,298 | 9,351 | 7,854 | |||||||||||||
|
Income tax paid |
(2,251 | ) | (2,021 | ) | (2,311 | ) | ||||||||||
|
Net cash flow from operating activities |
7,047 | 7,330 | 5,543 | |||||||||||||
|
Interest received |
105 | 119 | 123 | |||||||||||||
|
Purchase of intangible assets |
(232 | ) | (334 | ) | (359 | ) | ||||||||||
|
Purchase of property, plant and equipment |
(1,804 | ) | (1,867 | ) | (1,893 | ) | ||||||||||
|
Disposal of property, plant and equipment |
158 | 127 | 207 | |||||||||||||
|
Acquisition of group companies, joint ventures and associates |
(1,731 | ) | (1,897 | ) | (313 | ) | ||||||||||
|
Disposal of group companies, joint ventures and associates |
30 | 199 | 1,741 | |||||||||||||
|
Acquisition of other non-current investments |
(208 | ) | (78 | ) | (82 | ) | ||||||||||
|
Disposal of other non-current investments |
173 | 127 | 69 | |||||||||||||
|
Dividends from joint ventures, associates and other non-current investments |
186 | 176 | 162 | |||||||||||||
|
(Purchase)/sale of financial assets |
135 | (111 | ) | 4 | ||||||||||||
|
Net cash flow (used in)/from investing activities |
(3,188 | ) | (3,539 | ) | (341 | ) | ||||||||||
|
Dividends paid on ordinary share capital |
(3,609 | ) | (3,331 | ) | (3,189 | ) | ||||||||||
|
Interest and preference dividends paid |
(472 | ) | (579 | ) | (521 | ) | ||||||||||
|
Purchase of Estate shares |
24 | - | - | (880 | ) | |||||||||||
|
Net change in short-term borrowings |
258 | 245 | 338 | |||||||||||||
|
Additional financial liabilities |
6,761 | 7,566 | 5,174 | |||||||||||||
|
Repayment of financial liabilities |
(5,213 | ) | (6,270 | ) | (5,305 | ) | ||||||||||
|
Capital element of finance lease rental payments |
(35 | ) | (14 | ) | (16 | ) | ||||||||||
|
Other movements on treasury stock |
(257 | ) | (276 | ) | (467 | ) | ||||||||||
|
Other financing activities |
(506 | ) | (373 | ) | (324 | ) | ||||||||||
|
Net cash flow (used in)/from financing activities |
(3,073 | ) | (3,032 | ) | (5,190 | ) | ||||||||||
|
Net increase/(decrease) in cash and cash equivalents |
786 | 759 | 12 | |||||||||||||
|
Cash and cash equivalents at the beginning of the year |
2,128 | 1,910 | 2,044 | |||||||||||||
|
Effect of foreign exchange rate changes |
284 | (541 | ) | (146 | ) | |||||||||||
|
Cash and cash equivalents at the end of the year |
17A | 3,198 | 2,128 | 1,910 | ||||||||||||
The cash flows of pension funds (other than contributions and other direct payments made by the Group in respect of pensions and similar obligations) are not included in the Group cash flow statement.
| Annual Report on Form 20-F 2016 | Financial Statements | 87 |
Table of Contents
NOTES TO THE CONSOLIDATED FINANCIAL STATEMENTS
UNILEVER GROUP
| 88 | Financial Statements | Annual Report on Form 20-F 2016 |
Table of Contents
1. ACCOUNTING INFORMATION AND POLICIES CONTINUED
RECENT ACCOUNTING DEVELOPMENTS
ADOPTED BY THE GROUP
The Group applied for the first time amendments to two standards from 1 January 2016. These did not have a material impact on the Group.
| APPLICABLE STANDARD | KEY REQUIREMENTS | IMPACT ON GROUP | ||
|
Amendments to IAS 1 ‘Presentation of Financial Statements’
|
This change provides additional principles to assist preparers with the presentation and disclosure of financial statements.
|
There is no impact as current reporting is consistent with these principles. |
||
|
Amendments to IAS 41 ‘Agriculture: Bearer Plants’ |
This changes the reporting for bearer plants to be consistent with IAS 16 ‘Property, Plant and Equipment’. This is because these assets are similar to manufacturing assets.
|
There is no material impact as Unilever does not have material bearer plants. |
All other standards or amendments to standards that have been issued by the IASB and were effective by 1 January 2016 were not applicable to Unilever.
NEW STANDARDS, AMENDMENTS AND INTERPRETATIONS OF EXISTING STANDARDS THAT ARE NOT YET EFFECTIVE AND HAVE NOT BEEN EARLY ADOPTED BY THE GROUP
The following three new standards have been released, but are not yet adopted by the Group. The expected impact and progress is shown below.
| APPLICABLE STANDARD |
KEY REQUIREMENTS OR CHANGES IN ACCOUNTING POLICY |
IMPLEMENTATION PROGRESS AND EXPECTED IMPACT |
||
|
IFRS 9 ‘Financial Instruments’
Effective from the year ended 31 December 2018
The standard has been endorsed by the EU |
This standard introduces new requirements in three areas:
Classification and measurement: Financial assets will now be classified based on 1) the objective of the Group in holding the asset and 2) the contractual cash flows.
Impairment: A new expected credit loss model will be used for calculating impairment on financial assets. A loss event does not have to occur before credit losses are recognised.
Hedge accounting: New general hedge accounting requirements will allow hedge accounting based on the Group’s risk management policies rather than only prescribed scenarios.
|
During 2016, the Group continued assessing the impact of the new requirements in IFRS 9, the work on classification and measurement is most advanced.
Classification and measurement: We expect a slight increase in assets classified as fair value through profit or loss driven by the removal of available-for-sale classification, which currently have fair value movements recognised within equity.
Impairment: Based on preliminary work we estimate the impact will be immaterial.
Hedge accounting: Based on preliminary work we estimate the impact will be immaterial. |
||
|
IFRS 15 ‘Revenue from Contracts with Customers’
Effective from the year ended 31 December 2018
The standard has been endorsed by the EU |
The standard clarifies the accounting for bundled services and identifying each ‘performance obligation’ in contractual arrangements. It also provides more guidance on the measurement of revenue contracts which have discounts, rebates, payments to suppliers and consignment stock. |
During 2016, the Group completed a detailed review of the requirements of IFRS 15 against our current accounting policies. This focused on accounting for trade expenditure, consignment stock, bad debts and incentives.
As a result of our review we concluded that our current accounting policies are in line with the new standard. As our business model evolves, we will continue to review the Group’s contracts and transactions with customers to ensure compliance with IFRS 15 on adoption.
|
||
|
IFRS 16 ‘Leases’
Effective from the year ended 31 December 2019
The standard is not yet endorsed by the EU
|
This standard changes the recognition, measurement, presentation and disclosure of leases. In particular it requires lessees to record all leases on the balance sheet with exemptions available for low value and short-term leases. |
Based on preliminary work we estimate that more leases will be recorded on the Group balance sheet. Significant work is required to determine the impact due to a high volume of lease contracts and exemptions available. |
In addition to the above, the Group does not currently believe adoption of the following amendments will have a material impact on the consolidated results or financial position of the Group.
| Annual Report on Form 20-F 2016 | Financial Statements | 89 |
Table of Contents
NOTES TO THE CONSOLIDATED FINANCIAL STATEMENTS
UNILEVER GROUP CONTINUED
1. ACCOUNTING INFORMATION AND POLICIES CONTINUED
| APPLICABLE STANDARD |
KEY REQUIREMENTS OR CHANGES IN ACCOUNTING POLICY |
IMPACT ON GROUP | ||
|
Amendments to IAS 7 ‘Statement of Cash Flows’
Effective from the year ended 31 December 2017
The standard is not yet endorsed by the EU
|
This change adds a new requirement to explain changes in liabilities relating to financing activities. |
This will require additional disclosure to be presented by the Group. |
All other standards or amendments to standards that have been issued by the IASB and are effective from 1 January 2017 onwards are not applicable to Unilever.
2. SEGMENT INFORMATION
| SEGMENTAL REPORTING | ||||
| Personal Care | – | primarily sales of skin care and hair care products, deodorants and oral care products. | ||
| Foods | – | primarily sales of soups, bouillons, sauces, snacks, mayonnaise, salad dressings, margarines and spreads. | ||
| Home Care | – | primarily sales of home care products, such as powders, liquids and capsules, soap bars and a wide range of cleaning products. | ||
| Refreshment | – | primarily sales of ice cream and tea-based beverages. | ||
REVENUE
Turnover comprises sales of goods after the deduction of discounts, sales taxes and estimated returns. It does not include sales between group companies. Discounts given by Unilever include rebates, price reductions and incentives given to customers, promotional couponing and trade communication costs.
Turnover is recognised when the risks and rewards of the underlying products have been substantially transferred to the customer. Depending on individual customer terms, this can be at the time of dispatch, delivery or upon formal customer acceptance.
CORE OPERATING PROFIT
Core operating profit represents our measure of segment profit or loss as it is the primary measure used for the purpose of making decisions about allocating resources and assessing performance of segments. Core operating margin is calculated as core operating profit divided by turnover.
| 90 | Financial Statements | Annual Report on Form 20-F 2016 |
Table of Contents
2. SEGMENT INFORMATION CONTINUED
| € million | € million | € million | € million | € million | ||||||||||||||||||||||||
| Notes |
Personal Care |
Foods | Home Care |
Refresh- ment |
Total | |||||||||||||||||||||||
|
2016 |
||||||||||||||||||||||||||||
|
Turnover |
20,172 | 12,524 | 10,009 | 10,008 | 52,713 | |||||||||||||||||||||||
|
Operating profit |
3,704 | 2,180 | 949 | 968 | 7,801 | |||||||||||||||||||||||
|
Non-core items |
3 | 140 | 60 | 18 | 27 | 245 | ||||||||||||||||||||||
|
Core operating profit |
3,844 | 2,240 | 967 | 995 | 8,046 | |||||||||||||||||||||||
|
Share of net profit/(loss) of joint ventures and associates |
(5 | ) | 4 | 1 | 127 | 127 | ||||||||||||||||||||||
|
Significant non-cash charges: |
||||||||||||||||||||||||||||
|
Depreciation and amortisation (a) |
437 | 322 | 236 | 469 | 1,464 | |||||||||||||||||||||||
|
Impairment and other non-cash charges (b) |
208 | 151 | 131 | 108 | 598 | |||||||||||||||||||||||
|
2015 |
||||||||||||||||||||||||||||
|
Turnover |
20,074 | 12,919 | 10,159 | 10,120 | 53,272 | |||||||||||||||||||||||
|
Operating profit |
3,637 | 2,298 | 740 | 840 | 7,515 | |||||||||||||||||||||||
|
Non-core items |
3 | 151 | 56 | 35 | 108 | 350 | ||||||||||||||||||||||
|
Core operating profit |
3,788 | 2,354 | 775 | 948 | 7,865 | |||||||||||||||||||||||
|
Share of net profit/(loss) of joint ventures and associates |
(4 | ) | 4 | - | 107 | 107 | ||||||||||||||||||||||
|
Significant non-cash charges: |
||||||||||||||||||||||||||||
|
Depreciation and amortisation (a) |
377 | 308 | 235 | 450 | 1,370 | |||||||||||||||||||||||
|
Impairment and other non-cash charges (b) |
267 | 113 | 134 | 153 | 667 | |||||||||||||||||||||||
|
2014 |
||||||||||||||||||||||||||||
|
Turnover |
17,739 | 12,361 | 9,164 | 9,172 | 48,436 | |||||||||||||||||||||||
|
Operating profit |
3,259 | 3,607 | 576 | 538 | 7,980 | |||||||||||||||||||||||
|
Non-core items |
3 | 66 | (1,302 | ) | 3 | 273 | (960 | ) | ||||||||||||||||||||
|
Core operating profit |
3,325 | 2,305 | 579 | 811 | 7,020 | |||||||||||||||||||||||
|
Share of net profit/(loss) of joint ventures and associates |
(1 | ) | 3 | - | 96 | 98 | ||||||||||||||||||||||
|
Significant non-cash charges: |
||||||||||||||||||||||||||||
|
Depreciation and amortisation (a) |
307 | 257 | 192 | 371 | 1,127 | |||||||||||||||||||||||
|
Impairment and other non-cash charges (b) |
198 | 122 | 100 | 393 | 813 | |||||||||||||||||||||||
| (a) | All amounts included within core operating profit. |
| (b) | These comprise share-based compensation, movements in provisions and foreign exchange losses resulting from remeasurement of the Argentinian business (in 2016 and 2015) and Venezuelan business (in 2015). Certain amounts are included within non-core items. |
Transactions between the Unilever Group’s reportable segments are immaterial and are carried out on an arm’s length basis.
The Unilever Group is not reliant on revenues from transactions with any single customer and does not receive 10% or more of its revenues from transactions with any single customer.
Segment assets and liabilities are not provided because they are not reported to or reviewed by our chief operating decision-maker, which is Unilever Leadership Executive (ULE) as explained in the Corporate Governance Section.
The home countries of the Unilever Group are the Netherlands and the United Kingdom. Turnover and non-current assets for these two countries combined, for the United States (being the largest country outside the home countries) and for all other countries are:
| € million | € million | € million | € million | |||||||||||||||||||||||||
| 2016 |
Netherlands/
United Kingdom |
United States |
Others | Total | ||||||||||||||||||||||||
|
Turnover |
3,819 | 8,263 | 40,631 | 52,713 | ||||||||||||||||||||||||
|
Non-current assets (c) |
4,770 | 11,696 | 23,358 | 39,824 | ||||||||||||||||||||||||
| 2015 | ||||||||||||||||||||||||||||
|
Turnover |
4,157 | 7,956 | 41,159 | 53,272 | ||||||||||||||||||||||||
|
Non-current assets (c) |
4,878 | 9,674 | 22,336 | 36,888 | ||||||||||||||||||||||||
| 2014 | ||||||||||||||||||||||||||||
|
Turnover |
3,851 | 6,684 | 37,901 | 48,436 | ||||||||||||||||||||||||
|
Non-current assets (c) |
3,921 | 7,668 | 21,714 | 33,303 | ||||||||||||||||||||||||
| (c) | Non-current assets excluding financial assets, deferred tax assets and pension assets for funded schemes in surplus. |
No other country had turnover or non-current assets (as shown above) greater than 10% of the Group total.
| Annual Report on Form 20-F 2016 | Financial Statements | 91 |
Table of Contents
NOTES TO THE CONSOLIDATED FINANCIAL STATEMENTS
UNILEVER GROUP CONTINUED
2. SEGMENT INFORMATION CONTINUED
ADDITIONAL INFORMATION BY GEOGRAPHIES
Although the Group’s operations are managed by product area, we provide additional information based on geographies. The analysis of turnover by geographical area is stated on the basis of origin.
| € million | € million | € million | € million | |||||||||||||||||||||||||
|
|
Asia/
AMET/RUB |
(d) |
|
The
Americas |
|
Europe | Total | |||||||||||||||||||||
|
2016 |
||||||||||||||||||||||||||||
|
Turnover |
22,445 | 17,105 | 13,163 | 52,713 | ||||||||||||||||||||||||
|
Operating profit |
3,275 | 2,504 | 2,022 | 7,801 | ||||||||||||||||||||||||
|
Non-core items |
19 | 222 | 4 | 245 | ||||||||||||||||||||||||
|
Core operating profit |
3,294 | 2,726 | 2,026 | 8,046 | ||||||||||||||||||||||||
|
Share of net profit/(loss) of joint ventures and associates |
(2 | ) | 108 | 21 | 127 | |||||||||||||||||||||||
|
2015 |
||||||||||||||||||||||||||||
|
Turnover |
22,425 | 17,294 | 13,553 | 53,272 | ||||||||||||||||||||||||
|
Operating profit |
3,019 | 2,273 | 2,223 | 7,515 | ||||||||||||||||||||||||
|
Non-core items |
16 | 244 | 90 | 350 | ||||||||||||||||||||||||
|
Core operating profit |
3,035 | 2,517 | 2,313 | 7,865 | ||||||||||||||||||||||||
|
Share of net profit/(loss) of joint ventures and associates |
(1 | ) | 96 | 12 | 107 | |||||||||||||||||||||||
|
2014 |
||||||||||||||||||||||||||||
|
Turnover |
19,703 | 15,514 | 13,219 | 48,436 | ||||||||||||||||||||||||
|
Operating profit |
2,626 | 3,233 | 2,121 | 7,980 | ||||||||||||||||||||||||
|
Non-core items |
(15 | ) | (959 | ) | 14 | (960 | ) | |||||||||||||||||||||
|
Core operating profit |
2,611 | 2,274 | 2,135 | 7,020 | ||||||||||||||||||||||||
|
Share of net profit/(loss) of joint ventures and associates |
- | 68 | 30 | 98 | ||||||||||||||||||||||||
| (d) | Refers to Asia, Africa, Middle East, Turkey, Russia, Ukraine and Belarus. |
Transactions between the Unilever Group’s geographical regions are immaterial and are carried out on an arm’s length basis.
3. GROSS PROFIT AND OPERATING COSTS
RESEARCH AND MARKET SUPPORT COSTS
Expenditure on research and market support, such as advertising, is charged to the income statement as incurred.
NON-CORE ITEMS
Disclosed on the face of the income statement are costs and revenues relating to business disposals, acquisition and disposal-related costs, impairments and other one-off items, which we collectively term non-core items due to their nature and/or frequency of occurrence. These items are material in terms of nature and/or amount and are relevant to an understanding of our financial performance.
Business disposals generate both gains and losses which are not reflective of underlying performance. Acquisition and disposal-related costs are charges directly attributable to the acquisition or disposal of group companies.
| € million | € million | € million | ||||||||||
| 2016 | 2015 | 2014 | ||||||||||
|
Turnover |
52,713 | 53,272 | 48,436 | |||||||||
|
Cost of sales |
(30,229 | ) | (30,808 | ) | (28,387 | ) | ||||||
|
of which: Distribution costs |
(3,246 | ) | (3,358 | ) | (3,079 | ) | ||||||
|
Gross profit |
22,484 | 22,464 | 20,049 | |||||||||
|
Selling and administrative expenses |
(14,683 | ) | (14,949 | ) | (12,069 | ) | ||||||
|
of which: Brand and Marketing Investment |
(7,731 | ) | (8,003 | ) | (7,166 | ) | ||||||
|
Research and Development |
(978 | ) | (1,005 | ) | (955 | ) | ||||||
|
Operating profit |
7,801 | 7,515 | 7,980 | |||||||||
| 92 | Financial Statements | Annual Report on Form 20-F 2016 |
Table of Contents
3. GROSS PROFIT AND OPERATING COSTS CONTINUED
NON-CORE ITEMS
Non-core items are disclosed on the face of the income statement to provide additional information to users to help them better understand underlying business performance.
| € million | € million | € million | ||||||||||
| 2016 | 2015 | 2014 | ||||||||||
|
Acquisition and disposal-related costs |
(132 | ) | (105 | ) | (97 | ) | ||||||
|
Gain/(loss) on disposal of group companies (a) |
(95 | ) | (9 | ) | 1,392 | |||||||
|
Impairments and other one-off items (b) |
(18 | ) | (236 | ) | (335 | ) | ||||||
|
Non-core items before tax |
(245 | ) | (350 | ) | 960 | |||||||
|
Tax impact of non-core items |
60 | 49 | (423 | ) | ||||||||
|
Non-core items after tax |
(185 | ) | (301 | ) | 537 | |||||||
|
Attributable to: |
||||||||||||
|
Non-controlling interests |
1 | - | – | |||||||||
|
Shareholders’ equity |
(186 | ) | (301 | ) | 537 | |||||||
| (a) | 2014 includes a gain of € 1,316 million from the sale of the Ragú & Bertolli brands and related assets. The total cash consideration for this transaction was approximately US$2.15 billion. |
| (b) | 2016 includes € 18 million in foreign exchange losses resulting from remeasurement of the Argentinian business (2015: € 52 million). 2015 includes an € 86 million charge for legal cases pertaining to a number of investigations by local competition regulators (2014: € 30 million), a € 14 million charge relating to other one-off legal cases (2014: nil), and € 84 million in foreign exchange losses resulting from remeasurement of the Venezuelan business. 2014 includes an impairment charge of € 305 million on assets related to the Slim.Fast business. |
OTHER
Other significant cost items by nature within operating costs include:
| € million | € million | € million | ||||||||||||||||||
| Notes | 2016 | 2015 | 2014 | |||||||||||||||||
|
Staff costs |
4A | (6,523 | ) | (6,555 | ) | (6,054 | ) | |||||||||||||
|
Raw and packaging materials and goods purchased for resale |
(21,122 | ) | (21,543 | ) | (19,816 | ) | ||||||||||||||
|
Amortisation of finite-life intangible assets and software |
9 | (310 | ) | (273 | ) | (180 | ) | |||||||||||||
|
Depreciation of property, plant and equipment |
10 | (1,154 | ) | (1,097 | ) | (947 | ) | |||||||||||||
|
Exchange gains/(losses): |
(209 | ) | (87 | ) | 12 | |||||||||||||||
|
On underlying transactions |
(28 | ) | (118 | ) | 15 | |||||||||||||||
|
On covering forward contracts |
(181 | ) | 31 | (3 | ) | |||||||||||||||
|
Lease rentals: |
(531 | ) | (534 | ) | (535 | ) | ||||||||||||||
|
Minimum operating lease payments |
(536 | ) | (546 | ) | (544 | ) | ||||||||||||||
|
Less: Sub-lease income relating to operating lease agreements |
5 | 12 | 9 | |||||||||||||||||
| Annual Report on Form 20-F 2016 | Financial Statements | 93 |
Table of Contents
NOTES TO THE CONSOLIDATED FINANCIAL STATEMENTS
UNILEVER GROUP CONTINUED
4. EMPLOYEES
4A. STAFF AND MANAGEMENT COSTS
| € million | € million | € million | ||||||||||
| Staff costs | 2016 | 2015 | 2014 | |||||||||
|
Wages and salaries |
(5,347 | ) | (5,474 | ) | (4,992 | ) | ||||||
|
Social security costs |
(606 | ) | (606 | ) | (586 | ) | ||||||
|
Other pension costs |
(372 | ) | (325 | ) | (288 | ) | ||||||
|
Share-based compensation costs |
(198 | ) | (150 | ) | (188 | ) | ||||||
| (6,523 | ) | (6,555 | ) | (6,054 | ) | |||||||
| ‘000 | ‘000 | ‘000 | ||||||||||
| Average number of employees during the year | 2016 | 2015 | 2014 | |||||||||
|
Asia/AMET/RUB |
95 | 97 | 99 | |||||||||
|
The Americas |
42 | 42 | 42 | |||||||||
|
Europe |
32 | 32 | 32 | |||||||||
| 169 | 171 | 173 | ||||||||||
| € million | € million | € million | ||||||||||
| Key management compensation (a) | 2016 | 2015 | 2014 | |||||||||
|
Salaries and short-term employee benefits |
(31 | ) | (34 | ) | (28 | ) | ||||||
|
Non-Executive Directors’ fees |
(2 | ) | (2 | ) | (2 | ) | ||||||
|
Post-employment benefits |
(1 | ) | (1 | ) | (1 | ) | ||||||
|
Share-based benefits (b) |
(17 | ) | (30 | ) | (19 | ) | ||||||
| (51 | ) | (67 | ) | (50 | ) | |||||||
|
Of which: |
||||||||||||
|
Executive Directors |
(13 | ) | (18 | ) | (15 | ) | ||||||
|
Non-Executive Directors |
(2 | ) | (2 | ) | (2 | ) | ||||||
|
Other (c) |
(36 | ) | (47 | ) | (33 | ) | ||||||
| (51 | ) | (67 | ) | (50 | ) | |||||||
| (a) | Includes full year compensation for Unilever Leadership Executive members joining part way through the year. |
| (b) | Share-based benefits are shown on a vesting basis. |
| (c) | Other includes all members of the Unilever Leadership Executive, other than Executive Directors. |
Key management are defined as the members of Unilever Leadership Executive and the Non-Executive Directors.
Details of the remuneration of Directors are given in the parts noted as audited in the Directors’ Remuneration Report on pages 48 to 77.
4B. PENSIONS AND SIMILAR OBLIGATIONS
For defined benefit plans, operating and finance costs are recognised separately in the income statement. The amount charged to operating cost in the income statement is the cost of accruing pension benefits promised to employees over the year, plus the costs of individual events such as past service benefit changes, settlements and curtailments (such events are recognised immediately in the income statement). The amount charged or credited to finance costs is a net interest expense calculated by applying the liability discount rate to the net defined benefit liability or asset. Any differences between the expected interest on assets and the return actually achieved, and any changes in the liabilities over the year due to changes in assumptions or experience within the plans, are recognised immediately in the statement of comprehensive income.
The defined benefit plan surplus or deficit on the balance sheet comprises the total for each plan of the fair value of plan assets less the present value of the defined benefit liabilities (using a discount rate based on high-quality corporate bonds, or a suitable alternative where there is no active corporate bond market).
All defined benefit plans are subject to regular actuarial review using the projected unit method, either by external consultants or by actuaries employed by Unilever. The Group policy is that the most important plans, representing approximately 84% of the defined benefit liabilities, are formally valued every year. Other major plans, accounting for a further 13% of the liabilities, have their liabilities updated each year. Group policy for the remaining plans requires a full actuarial valuation at least every three years. Asset values for all plans are updated every year.
For defined contribution plans, the charges to the income statement are the company contributions payable, as the company’s obligation is limited to the contributions paid into the plans. The assets and liabilities of such plans are not included in the balance sheet of the Group.
| 94 | Financial Statements | Annual Report on Form 20-F 2016 |
Table of Contents
4B. PENSIONS AND SIMILAR OBLIGATIONS CONTINUED
DESCRIPTION OF PLANS
The Group increasingly operates a number of defined contribution plans, the assets of which are held in external funds. In certain countries the Group operates defined benefit pension plans based on employee pensionable remuneration and length of service. The majority of defined benefit plans are either career average, final salary or hybrid plans and operate on a funded basis. Benefits are determined by the plan rules and are linked to inflation in some countries. The Group also provides other post-employment benefits, mainly post-employment healthcare plans in the United States. These plans are predominantly unfunded.
GOVERNANCE
The majority of the Group’s externally funded plans are established as trusts, foundations or similar entities. The operation of these entities is governed by local regulations and practice in each country, as is the nature of the relationship between the Group and the Trustees (or equivalent) and their composition. Where Trustees (or equivalent) are in place to operate plans, they are generally required to act on behalf of the plan’s stakeholders. They are tasked with periodic reviews of the solvency of the fund in accordance with local legislation and play a role in the long-term investment and funding strategy. The Group also has an internal body, the Pensions and Equity Committee, that is responsible for setting the company’s policies and decision-making on plan matters, including but not limited to design, funding, investments, risk management and governance.
INVESTMENT STRATEGY
The Group’s investment strategy in respect of its funded plans is implemented within the framework of the various statutory requirements of the territories where the plans are based. The Group has developed policy guidelines for the allocation of assets to different classes with the objective of controlling risk and maintaining the right balance between risk and long-term returns in order to limit the cost to the Group of the benefits provided. To achieve this, investments are well diversified, such that the failure of any single investment would not have a material impact on the overall level of assets. The plans continue to invest a good proportion of the assets in equities, which the Group believes offer the best returns over the long-term, commensurate with an acceptable level of risk. The plans expose the Group to a number of actuarial risks such as investment risk, interest rate risk, longevity risk and, in certain markets, inflation risk. There are no unusual entity or plan-specific risks to the Group. For risk control, the pension funds also have significant investments in liability matching assets (bonds) as well as in property and other alternative assets; additionally, the Group uses derivatives to further mitigate the impact of the risks outlined above. The majority of assets are managed by a number of external fund managers with a small proportion managed in-house. Unilever has a pooled investment vehicle (Univest) which it believes offers its pension plans around the world a simplified externally managed investment vehicle to implement their strategic asset allocation models, currently for bonds, equities and alternative assets. The aim is to provide high-quality, well diversified, cost-effective, risk-controlled vehicles. The pension plans’ investments are overseen by Unilever’s internal investment company, the Univest Company.
ASSUMPTIONS
With the objective of presenting the assets and liabilities of the pensions and other post-employment benefit plans at their fair value on the balance sheet, assumptions under IAS 19 are set by reference to market conditions at the valuation date. The actuarial assumptions used to calculate the benefit liabilities vary according to the country in which the plan is situated. The following table shows the assumptions, weighted by liabilities, used to value the principal defined benefit plans (which cover approximately 96% of total pension liabilities) and the plans providing other post-employment benefits.
| 31 December 2016 | 31 December 2015 | |||||||||||||||
|
Principal defined benefit pension plans |
Other post-employment benefit plans |
Principal defined benefit pension plans |
Other post-employment benefit plans |
|||||||||||||
|
Discount rate |
2.6% | 4.8% | 3.4% | 5.0% | ||||||||||||
|
Inflation |
2.5% | n/a | 2.4% | n/a | ||||||||||||
|
Rate of increase in salaries |
2.9% | 3.0% | 2.7% | 3.1% | ||||||||||||
|
Rate of increase for pensions in payment (where provided) |
2.4% | n/a | 2.3% | n/a | ||||||||||||
|
Rate of increase for pensions in deferment (where provided) |
2.7% | n/a | 2.5% | n/a | ||||||||||||
|
Long-term medical cost inflation |
n/a | 5.3% | n/a | 5.2% | ||||||||||||
The valuations of other post-employment benefit plans generally assume a higher initial level of medical cost inflation, which falls from 6% to the long-term rate within the next five years. Assumed healthcare cost trend rates have a significant effect on the amounts reported for healthcare plans.
| Annual Report on Form 20-F 2016 | Financial Statements | 95 |
Table of Contents
NOTES TO THE CONSOLIDATED FINANCIAL STATEMENTS
UNILEVER GROUP CONTINUED
4B. PENSIONS AND SIMILAR OBLIGATIONS CONTINUED
For the most important pension plans, representing approximately 84% of all defined benefit plans liabilities, the assumptions used at 31 December 2016 and 2015 were:
| United Kingdom | Netherlands | United States | Germany | |||||||||||||
| 2016 | 2015 | 2016 | 2015 | 2016 | 2015 | 2016 | 2015 | |||||||||
|
Discount rate |
2.7% | 3.7% | 1.8% | 2.5% | 4.3% | 4.5% | 1.8% | 2.5% | ||||||||
|
Inflation |
3.2% | 3.0% | 1.7% | 1.7% | 2.1% | 2.3% | 1.7% | 1.7% | ||||||||
|
Rate of increase in salaries |
3.1% | 2.9% | 2.2% | 2.2% | 3.0% | 3.0% | 3.0% | 2.8% | ||||||||
|
Rate of increase for pensions in payment
|
3.1% | 2.8% | 1.7% | 1.7% | - | - | 1.7% | 1.7% | ||||||||
|
Rate of increase for pensions in deferment
|
3.1% | 2.9% | 1.7% | 1.7% | - | - | - | - | ||||||||
|
Number of years a current pensioner is expected to live beyond age 65: |
||||||||||||||||
|
Men |
22.5 | 22.4 | 21.8 | 21.7 | 20.8 | 21.2 | 21.7 | 19.4 | ||||||||
|
Women |
24.6 | 24.6 | 24.0 | 23.8 | 22.8 | 23.2 | 24.0 | 23.0 | ||||||||
|
Number of years a future pensioner currently aged 45 is expected to live beyond age 65: |
||||||||||||||||
|
Men |
23.8 | 23.7 | 24.1 | 23.9 | 23.1 | 22.9 | 21.7 | 19.4 | ||||||||
|
Women |
26.5 | 26.4 | 26.3 | 25.9 | 26.2 | 24.9 | 24.0 | 23.0 | ||||||||
Demographic assumptions, such as mortality rates, are set with having regard to the latest trends in life expectancy (including expectations of future improvements), plan experience and other relevant data. These assumptions are reviewed and updated as necessary as part of the periodic actuarial valuation of the pension plans. The years of life expectancy for 2016 above have been translated from the following tables:
| • | UK: the year of use S1 series all pensioners (‘S1PA’) tables have been adopted, which are based on the experience of UK pension schemes over the period 2000-2006. Scaling factors are applied reflecting the experience of our pension funds appropriate to the member’s gender and status. Future improvements in longevity have been allowed for in line with the 2012 CMI core projections and a 1% pa long-term improvement rate. |
| • | The Netherlands: the Dutch Actuarial Society’s AG Prognosetafel 2016 table is used with correction factors to allow for the typically longer life expectancy for fund members relative to the general population. This table has an in-built allowance for future improvements in longevity. |
| • | United States: the table RP-2016 with MP-2016 generational mortality improvement. This table has an in-built allowance for future improvements in longevity. |
| • | Germany: fund specific tables are used which broadly equate to the Heubeck 2005 base table projected to 2045. |
Assumptions for the remaining defined benefit plans vary considerably, depending on the economic conditions of the countries where they are situated.
INCOME STATEMENT
The charge to the income statement comprises:
| € million | € million | € million | ||||||||||||||||||
| Notes | 2016 | 2015 | 2014 | |||||||||||||||||
|
Charged to operating profit: |
||||||||||||||||||||
|
Defined benefit pension and other benefit plans: |
||||||||||||||||||||
|
Current service cost |
(226 | ) | (271 | ) | (259 | ) | ||||||||||||||
|
Employee contributions |
17 | 17 | 16 | |||||||||||||||||
|
Special termination benefits |
(6 | ) | (9 | ) | (27 | ) | ||||||||||||||
|
Past service cost including (losses)/gains on curtailments |
32 | 129 | 87 | |||||||||||||||||
|
Settlements |
(2 | ) | 6 | 10 | ||||||||||||||||
|
Defined contribution plans |
(187 | ) | (197 | ) | (115 | ) | ||||||||||||||
|
Total operating cost |
4A | (372 | ) | (325 | ) | (288 | ) | |||||||||||||
|
Finance income/(cost) |
5 | (94 | ) | (121 | ) | (94 | ) | |||||||||||||
|
Net impact on the income statement (before tax) |
(466 | ) | (446 | ) | (382 | ) | ||||||||||||||
| 96 | Financial Statements | Annual Report on Form 20-F 2016 |
Table of Contents
4B. PENSIONS AND SIMILAR OBLIGATIONS CONTINUED
STATEMENT OF COMPREHENSIVE INCOME
Amounts recognised in the statement of comprehensive income on the remeasurement of the net defined benefit liability.
| € million | € million | € million | ||||||||||
| 2016 | 2015 | 2014 | ||||||||||
|
Return on plan assets excluding amounts included in net finance income/(cost) |
1,877 | (254 | ) | 1,316 | ||||||||
|
Actuarial gains/(losses) arising from changes in demographic assumptions |
(217 | ) | (22 | ) | (28 | ) | ||||||
|
Actuarial gains/(losses) arising from changes in financial assumptions |
(2,963 | ) | 1,167 | (3,076 | ) | |||||||
|
Experience gains/(losses) arising on pension plan and other benefit plan liabilities |
82 | 233 | 78 | |||||||||
|
Total of defined benefit costs recognised in other comprehensive income |
(1,221 | ) | 1,124 | (1,710 | ) | |||||||
BALANCE SHEET
The assets, liabilities and surplus/(deficit) position of the pension and other post-employment benefit plans at the balance sheet date were:
|
€ million 2016 |
€ million 2015 |
|||||||||||||||
|
Pension plans |
Other post- employment benefit plans |
Pension plans |
Other post- employment benefit plans |
|||||||||||||
|
Fair value of assets |
21,162 | 21 | 20,723 | 19 | ||||||||||||
|
Present value of liabilities |
(23,751 | ) | (605 | ) | (22,466 | ) | (596 | ) | ||||||||
|
Net liabilities |
(2,589 | ) | (584 | ) | (1,743 | ) | (577 | ) | ||||||||
|
Pension liability net of assets |
(2,589 | ) | (584 | ) | (1,743 | ) | (577 | ) | ||||||||
|
Of which in respect of: |
||||||||||||||||
|
Funded plans in surplus: |
||||||||||||||||
|
Liabilities |
(5,833 | ) | - | (5,936 | ) | - | ||||||||||
|
Assets |
6,524 | 3 | 6,867 | 3 | ||||||||||||
|
Aggregate surplus |
691 | 3 | 931 | 3 | ||||||||||||
|
Pension asset net of liabilities |
691 | 3 | 931 | 3 | ||||||||||||
|
Funded plans in deficit: |
||||||||||||||||
|
Liabilities |
(16,783 | ) | (36 | ) | (15,411 | ) | (30 | ) | ||||||||
|
Assets |
14,638 | 18 | 13,856 | 16 | ||||||||||||
|
Pension liability net of assets |
(2,145 | ) | (18 | ) | (1,555 | ) | (14 | ) | ||||||||
|
Unfunded plans: |
||||||||||||||||
|
Pension liability |
(1,135 | ) | (569 | ) | (1,119 | ) | (566 | ) | ||||||||
RECONCILIATION OF CHANGE IN ASSETS AND LIABILITIES
Movements in assets and liabilities during the year:
|
€ million Assets 2016 |
€ million Assets 2015 |
€ million Liabilities 2016 |
€ million Liabilities 2015 |
€ million Total 2016 |
€ million Total 2015 |
|||||||||||||||||||
|
1 January |
20,742 | 20,484 | (23,062 | ) | (24,055 | ) | (2,320 | ) | (3,571 | ) | ||||||||||||||
|
Current service cost |
- | - | (226 | ) | (271 | ) | (226 | ) | (271 | ) | ||||||||||||||
|
Employee contributions |
17 | 17 | - | - | 17 | 17 | ||||||||||||||||||
|
Special termination benefits |
- | - | (6 | ) | (9 | ) | (6 | ) | (9 | ) | ||||||||||||||
|
Past service costs including losses/(gains) on curtailments |
- | - | 32 | 129 | 32 | 129 | ||||||||||||||||||
|
Settlements |
- | (16 | ) | (2 | ) | 22 | (2 | ) | 6 | |||||||||||||||
|
Actual return on plan assets (excluding amounts in net finance
|
1,877 | (254 | ) | - | - | 1,877 | (254 | ) | ||||||||||||||||
|
Interest cost |
- | - | (758 | ) | (773 | ) | (758 | ) | (773 | ) | ||||||||||||||
|
Interest income |
664 | 652 | - | - | 664 | 652 | ||||||||||||||||||
|
Actuarial gain/(loss) arising from changes in demographic assumptions |
- | - | (217 | ) | (22 | ) | (217 | ) | (22 | ) | ||||||||||||||
|
Actuarial gain/(loss) arising from changes in financial assumptions |
- | - | (2,963 | ) | 1,167 | (2,963 | ) | 1,167 | ||||||||||||||||
|
Actuarial gain/(loss) arising from experience adjustments |
- | - | 82 | 233 | 82 | 233 | ||||||||||||||||||
|
Employer contributions |
512 | 513 | - | - | 512 | 513 | ||||||||||||||||||
|
Benefit payments |
(1,326 | ) | (1,345 | ) | 1,326 | 1,345 | - | - | ||||||||||||||||
|
Reclassification of benefits (a) |
(2 | ) | - | 2 | (8 | ) | - | (8 | ) | |||||||||||||||
|
Currency retranslation |
(1,301 | ) | 691 | 1,436 | (820 | ) | 135 | (129 | ) | |||||||||||||||
|
31 December |
21,183 | 20,742 | (24,356 | ) | (23,062 | ) | (3,173 | ) | (2,320 | ) | ||||||||||||||
| (a) | Certain liabilities have been reclassified as employee benefit liabilities. |
| Annual Report on Form 20-F 2016 | Financial Statements | 97 |
Table of Contents
NOTES TO THE CONSOLIDATED FINANCIAL STATEMENTS
UNILEVER GROUP CONTINUED
4B. PENSIONS AND SIMILAR OBLIGATIONS CONTINUED
The actual return on plan assets during 2016 was € 2,541 million, being the sum of € 1,877 million and € 664 million from the table above (2015: € 398 million).
The duration of the principal defined benefit liabilities at 31 December 2016 is between 8 and 20 years (2015: 9 and 18 years). The liabilities are split between different categories of plan participants as follows:
| • | active members 19.9% (2015: 18.7%); |
| • | deferred members 26.0% (2015: 23.4%); and |
| • | retired members 54.1% (2015: 57.9%). |
ASSETS
The fair value of plan assets at the end of the reporting period for our major and principal plans for each category are as follows:
|
€ million 31 December 2016 |
€ million 31 December 2015 |
|||||||||||||||
|
Pension plans |
Other post- employment benefit plans |
Pension plans |
Other post- employment benefit plans |
|||||||||||||
|
Total assets |
21,162 | 21 | 20,723 | 19 | ||||||||||||
|
Equities total |
8,133 | - | 7,993 | - | ||||||||||||
|
– Europe |
2,197 | - | 2,526 | - | ||||||||||||
|
– North America |
3,829 | - | 3,313 | - | ||||||||||||
|
– Other |
2,107 | - | 2,154 | - | ||||||||||||
|
Fixed income total |
10,282 | 20 | 9,741 | 18 | ||||||||||||
|
– Government bonds |
5,326 | 8 | 4,870 | 18 | ||||||||||||
|
– Investment grade corporate bonds |
2,927 | 12 | 2,970 | - | ||||||||||||
|
– Other fixed income |
2,029 | - | 1,901 | - | ||||||||||||
|
Derivatives |
(1,446 | ) | - | (1,647 | ) | - | ||||||||||
|
Private equity |
634 | - | 721 | - | ||||||||||||
|
Property and real estate |
1,461 | - | 1,689 | - | ||||||||||||
|
Hedge funds |
1,171 | - | 1,123 | - | ||||||||||||
|
Other |
591 | 1 | 810 | 1 | ||||||||||||
|
Other plans |
336 | - | 293 | - | ||||||||||||
The fair values of the above equity and fixed income instruments are determined based on quoted market prices in active markets. The fair value of private equity, properties, derivatives and hedge funds are not based on quoted market prices in active markets. The Group uses swaps to hedge some of its exposure to inflation and interest rate risk. Foreign currency exposures in part are also hedged by the use of forward foreign exchange contracts. Assets included in the Other category are commodities, cash and insurance contracts which are also unquoted assets.
Equity securities include Unilever securities amounting to € 12 million (0.1% of total plan assets) and € 14 million (0.1% of total plan assets) at 31 December 2016 and 2015 respectively. Property includes property occupied by Unilever amounting to € 34 million at 31 December 2016 (2015: € 17 million).
The pension assets above exclude the assets in a Special Benefits Trust amounting to € 79 million (2015: € 86 million) to fund pension and similar liabilities in the United States (see also note 17A on pages 121 to 122) and € 68 million (2015: nil) in an escrow account that would otherwise have been payable to the main UK pension fund (see also note 11 on pages 107 to 108).
SENSITIVITIES
The sensitivity of the overall pension liabilities to changes in the weighted key assumptions are:
| Change in assumption | Change in liabilities | |||||
|
Discount rate |
Increase by 0.5% | -8% | ||||
|
Inflation rate |
Increase by 0.5% | +6% | ||||
|
Life expectancy |
Increase by 1 year | +4% | ||||
|
Long-term medical cost inflation (b) |
Increase by 1.0% | +1% | ||||
An equivalent decrease in each assumption would have an equal and opposite impact on liabilities.
| (b) | Long-term medical cost inflation only relates to post retirement medical plans. |
The sensitivity analyses above have been determined based on reasonably possible changes of the respective assumptions occurring at the end of the reporting period and may not be representative of the actual change. It is based on a change in the key assumption while holding all other assumptions constant. When calculating the sensitivity to the assumption, the same method used to calculate the liability recognised in the balance sheet has been applied. The methods and types of assumptions used in preparing the sensitivity analysis did not change compared with the previous period.
| 98 | Financial Statements | Annual Report on Form 20-F 2016 |
Table of Contents
4B. PENSIONS AND SIMILAR OBLIGATIONS CONTINUED
CASH FLOW
Group cash flow in respect of pensions and similar post-employment benefits comprises company contributions paid to funded plans and benefits paid by the company in respect of unfunded plans. The table below sets out these amounts:
| € million | € million | € million | ||||||||||
| 2016 | 2015 | 2014 | ||||||||||
|
Company contributions to funded plans: |
||||||||||||
|
Defined benefit |
355 | 356 | 386 | |||||||||
|
Defined contributions |
187 | 197 | 115 | |||||||||
|
Benefits paid by the company in respect of unfunded plans: |
||||||||||||
|
Defined benefit |
157 | 157 | 151 | |||||||||
|
Group cash flow in respect of pensions and similar benefits |
699 | 710 | 652 | |||||||||
The triennial valuation of the UK pension fund is currently underway. The outcome will determine our funding requirements for 2017 and beyond. Excluding the UK pension fund deficit contributions, the current estimated Group employer contributions to be paid in 2017 are € 480 million for our defined benefit plans and € 210 million for our defined contribution plans.
The Group’s funding policy is to periodically review the contributions made to the plans while taking account of local legislations.
4C. SHARE-BASED COMPENSATION PLANS
The fair value of awards at grant date is calculated using appropriate pricing models. This value is expensed over their vesting period, with a corresponding credit to equity. The expense is reviewed and adjusted to reflect changes to the level of awards expected to vest, except where this arises from a failure to meet a market condition. Any cancellations are recognised immediately in the income statement.
As at 31 December 2016, the Group had share-based compensation plans in the form of performance shares, share options and other share awards.
The numbers in this note include those for Executive Directors shown in the Directors’ Remuneration Report on pages 48 to 77 and those for key management shown in note 4A on page 94. Non-Executive Directors do not participate in any of the share-based compensation plans.
The charge in each of the last three years is shown below, and relates to equity-settled plans:
| € million | € million | € million | ||||||||||
| Income statement charge | 2016 | 2015 | 2014 | |||||||||
|
Performance share plans |
(185 | ) | (143 | ) | (186 | ) | ||||||
|
Other plans |
(13 | ) | (7 | ) | (2 | ) | ||||||
| (198 | ) | (150 | ) | (188 | ) | |||||||
PERFORMANCE SHARE PLANS
Performance share awards are made under the Management Co-Investment Plan (MCIP) and the Global Share Incentive Plan (GSIP). The MCIP allows Unilever’s managers to invest up to 60% of their annual bonus in shares in Unilever and to receive a corresponding award of performance-related shares. Under GSIP, Unilever’s managers receive annual awards of NV and PLC shares. The awards of both plans will vest after three years between 0% and 200% of grant level, depending on the satisfaction of performance metrics.
The performance metrics of both MCIP and GSIP are underlying sales growth, operating cash flow and core operating margin improvement for the Group, except for GSIP awards granted to the managers of certain business units (below the Unilever Leadership Executive) which are subject to similar performance metrics but specific to the relevant business unit. There is an additional target based on relative total shareholder return (TSR) for senior executives.
A summary of the status of the Performance Share Plans as at 31 December 2016, 2015 and 2014 and changes during the years ended on these dates is presented below:
|
2016 Number of shares |
2015 Number of shares |
2014 Number of shares |
||||||||||
|
Outstanding at 1 January |
15,979,140 | 17,468,291 | 18,909,204 | |||||||||
|
Awarded |
7,016,274 | 8,890,394 | 9,724,186 | |||||||||
|
Vested |
(6,983,053 | ) | (8,448,454 | ) | (9,347,225 | ) | ||||||
|
Forfeited |
(1,194,301 | ) | (1,931,091 | ) | (1,817,874 | ) | ||||||
|
Outstanding at 31 December |
14,818,060 | 15,979,140 | 17,468,291 | |||||||||
| Annual Report on Form 20-F 2016 | Financial Statements | 99 |
Table of Contents
NOTES TO THE CONSOLIDATED FINANCIAL STATEMENTS
UNILEVER GROUP CONTINUED
4C. SHARE-BASED COMPENSATION PLANS CONTINUED
| Share award value information | 2016 | 2015 | 2014 | |||||||||
|
Fair value per share award during the year |
€35.43 | € 33.17 | € 27.80 | |||||||||
ADDITIONAL INFORMATION
At 31 December 2016, shares and options in NV or PLC totalling 16,085,024 (2015: 17,363,014) were held in respect of share-based compensation plans of NV, PLC and its subsidiaries, including North American plans.
To satisfy the options granted, certain NV group companies hold 16,936,797 (2015: 17,772,147) ordinary shares of NV or PLC. Shares acquired during 2016 represent 0.20% of the Group’s called up share capital. The balance of shares held in connection with share plans at 31 December 2016 represented 0.6% (2015: 0.6%) of the Group’s called up share capital.
The book value of € 727 million (2015: € 639 million) of all shares held in respect of share-based compensation plans for both NV and PLC is eliminated on consolidation by deduction from other reserves. Their market value at 31 December 2016 was € 658 million (2015: € 710 million).
At 31 December 2016, the exercise price of nil PLC options (2015: nil) were above the market price of the shares.
Shares held to satisfy options are accounted for in accordance with IAS 32 ‘Financial Instruments: Presentation’. All differences between the purchase price of the shares held to satisfy options granted and the proceeds received for the shares, whether on exercise or lapse, are charged to reserves. The basis of the charge to operating profit for the economic value of options granted is discussed on page 99.
Between 31 December 2016 and 21 February 2017 (the latest practicable date for inclusion in this report), 2,862,195 shares were granted, 4,803,965 shares were vested and 13,036 shares were forfeited related to the Performance Share Plans.
5. NET FINANCE COSTS
Net finance costs are comprised of finance costs and finance income, including net finance costs in relation to pensions and similar obligations.
Finance income includes income on cash and cash equivalents and income on other financial assets. Finance costs include interest costs in relation to financial liabilities.
Borrowing costs are recognised based on the effective interest method.
| Net finance costs | Notes | 2016 | 2015 | 2014 | ||||||||||||||||
|
Finance costs |
(584 | ) | (516 | ) | (500 | ) | ||||||||||||||
|
Bank loans and overdrafts |
(67 | ) | (56 | ) | (57 | ) | ||||||||||||||
|
Interest on bonds and other loans (a) |
(501 | ) | (492 | ) | (425 | ) | ||||||||||||||
|
Dividends paid on preference shares |
(4 | ) | (4 | ) | (4 | ) | ||||||||||||||
|
Net gain/(loss) on transactions for which hedge accounting is not applied (b) |
(12 | ) | 36 | (14 | ) | |||||||||||||||
|
On foreign exchange derivatives |
(215 | ) | (218 | ) | (655 | ) | ||||||||||||||
|
Exchange difference on underlying items |
203 | 254 | 641 | |||||||||||||||||
|
Finance income |
115 | 144 | 117 | |||||||||||||||||
|
Pensions and similar obligations |
4B | (94 | ) | (121 | ) | (94 | ) | |||||||||||||
| (563 | ) | (493 | ) | (477 | ) | |||||||||||||||
| (a) | ‘Interest on bonds and other loans’ includes the impact of interest rate derivatives that are part of a fair value hedge accounting relationship and the recycling of results from the cash flow hedge accounting reserve relating to derivatives that were part of a cash flow hedge accounting relation. |
| (b) | For further details of derivatives for which hedge accounting is not applied, please refer to note 16C. |
| 100 | Financial Statements | Annual Report on Form 20-F 2016 |
Table of Contents
6. TAXATION
6A. INCOME TAX
Income tax on the profit for the year comprises current and deferred tax. Income tax is recognised in the income statement except to the extent that it relates to items recognised directly in equity.
Current tax is the expected tax payable on the taxable income for the year, using tax rates enacted or substantively enacted at the balance sheet date, and any adjustments to tax payable in respect of previous years.
Current tax in the consolidated income statement will differ from the income tax paid in the consolidated cash flow statement primarily because of deferred tax arising on temporary differences and payment dates for income tax occurring after the balance sheet date.
Unilever is subject to taxation in the many countries in which it operates. The tax legislation of these countries differs, is often complex and is subject to interpretation by management and the government authorities. These matters of judgement give rise to the need to create provisions for tax payments that may arise in future years. Provisions are made against individual exposures and take into account the specific circumstances of each case, including the strength of technical arguments, recent case law decisions or rulings on similar issues and relevant external advice. The provision is estimated based on the individual most likely outcome approach.
| € million | € million | € million | ||||||||||
| Tax charge in income statement | 2016 | 2015 | 2014 | |||||||||
|
Current tax |
||||||||||||
|
Current year |
(2,026 | ) | (1,992 | ) | (2,111 | ) | ||||||
|
Over/(under) provided in prior years |
158 | (57 | ) | 68 | ||||||||
| (1,868 | ) | (2,049 | ) | (2,043 | ) | |||||||
|
Deferred tax |
||||||||||||
|
Origination and reversal of temporary differences |
(65 | ) | 82 | (112 | ) | |||||||
|
Changes in tax rates |
(7 | ) | (13 | ) | 4 | |||||||
|
Recognition of previously unrecognised losses brought forward |
18 | 19 | 20 | |||||||||
| (54 | ) | 88 | (88 | ) | ||||||||
| (1,922 | ) | (1,961 | ) | (2,131 | ) | |||||||
The reconciliation between the computed weighted average rate of income tax expense, which is generally applicable to Unilever companies, and the actual rate of taxation charged is as follows:
| Reconciliation of effective tax rate |
% 2016 |
% 2015 |
% 2014 |
|||||||||
|
Computed rate of tax (a) |
26 | 24 | 27 | |||||||||
|
Differences due to: |
||||||||||||
|
Incentive tax credits |
(4 | ) | (5 | ) | (5 | ) | ||||||
|
Withholding tax on dividends |
3 | 2 | 2 | |||||||||
|
Expenses not deductible for tax purposes |
1 | 2 | 1 | |||||||||
|
Irrecoverable witholding tax |
1 | 2 | 1 | |||||||||
|
Income tax reserve adjustments – current and prior year |
(1 | ) | 2 | 1 | ||||||||
|
Transfer to/(from) unrecognised deferred tax assets |
- | 1 | 1 | |||||||||
|
Effective tax rate |
26 | 28 | 28 | |||||||||
| (a) | The computed tax rate used is the average of the standard rate of tax applicable in the countries in which Unilever operates, weighted by the amount of profit before taxation generated in each of those countries. For this reason the rate may vary from year to year according to the mix of profit and related tax rates. |
Our tax rate is reduced by incentive tax credits, the benefit from preferential tax regimes that have been legislated by the countries and provinces concerned in order to promote economic development and investment. The tax rate is increased by business expenses which are not deductible for tax, such as entertainment costs and some interest expense and by irrecoverable withholding taxes on dividends paid by subsidiary companies and on other cross-border payments such as royalties and service fees, which cannot be offset against other taxes due. In 2016 there has been a net decrease in the amount provided for uncertain tax provisions, principally as the result of favourable audit settlements (versus a net increase in 2015).
The Group’s future tax charge and effective tax rate could be affected by several factors, including changes in tax laws and their interpretation and still to be determined tax reform proposals in the EU, Switzerland and the United States, as well as the impact of acquisitions, disposals and any restructuring of our businesses.
| Annual Report on Form 20-F 2016 | Financial Statements | 101 |
Table of Contents
NOTES TO THE CONSOLIDATED FINANCIAL STATEMENTS
UNILEVER GROUP CONTINUED
6B. DEFERRED TAX
Deferred tax is recognised using the liability method on taxable temporary differences between the tax base and the accounting base of items included in the balance sheet of the Group. Certain temporary differences are not provided for as follows:
| • | goodwill not deductible for tax purposes; |
| • | the initial recognition of assets or liabilities that affect neither accounting nor taxable profit; and |
| • | differences relating to investments in subsidiaries to the extent that it is probable that they will not reverse in the foreseeable future. |
The amount of deferred tax provided is based on the expected manner of realisation or settlement of the carrying amount of assets and liabilities, using tax rates enacted, or substantively enacted, at the year end.
A deferred tax asset is recognised only to the extent that it is probable that future taxable profits will be available against which the asset can be utilised. Deferred tax assets are reduced to the extent that it is no longer probable that the related tax benefit will be realised.
| € million | € million | € million | € million | € million | € million | € million | € million | |||||||||||||||||||||||||
| Movements in 2016 and 2015 |
As at 1 January 2016 |
Income statement |
Other |
As at 31 December 2016 |
As at 1 January 2015 |
Income statement |
Other |
As at 31 December 2015 |
||||||||||||||||||||||||
|
Pensions and similar obligations |
557 | 7 | 202 | 766 | 874 | (23 | ) | (294 | ) | 557 | ||||||||||||||||||||||
|
Provisions |
708 | 68 | 146 | 922 | 657 | 144 | (93 | ) | 708 | |||||||||||||||||||||||
|
Goodwill and intangible assets |
(1,301 | ) | (104 | ) | (523 | ) | (1,928 | ) | (1,292 | ) | 8 | (17 | ) | (1,301 | ) | |||||||||||||||||
|
Accelerated tax depreciation |
(752 | ) | (85 | ) | (33 | ) | (870 | ) | (753 | ) | 7 | (6 | ) | (752 | ) | |||||||||||||||||
|
Tax losses |
123 | (6 | ) | 14 | 131 | 123 | 14 | (14 | ) | 123 | ||||||||||||||||||||||
|
Fair value gains |
(25 | ) | 14 | 4 | (7 | ) | (10 | ) | (2 | ) | (13 | ) | (25 | ) | ||||||||||||||||||
|
Fair value losses |
16 | 8 | 5 | 29 | 10 | (62 | ) | 68 | 16 | |||||||||||||||||||||||
|
Share-based payments |
190 | (14 | ) | (7 | ) | 169 | 172 | (2 | ) | 20 | 190 | |||||||||||||||||||||
|
Other |
(75 | ) | 58 | 98 | 81 | (29 | ) | 4 | (50 | ) | (75 | ) | ||||||||||||||||||||
| (559 | ) | (54 | ) | (94 | ) | (707 | ) | (248 | ) | 88 | (399 | ) | (559 | ) | ||||||||||||||||||
At the balance sheet date, the Group had unused tax losses of € 4,138 million (2015: € 3,338 million) and tax credits amounting to € 644 million (2015: € 629 million) available for offset against future taxable profits. Deferred tax assets have not been recognised in respect of unused tax losses of € 3,622 million (2015: € 2,941 million) and tax credits of € 629 million (2015: € 629 million), as it is not probable that there will be future taxable profits within the entities against which the losses can be utilised. The majority of these tax losses and credits arise in tax jurisdictions where they do not expire with the exception of € 2,363 million (2015: € 1,790 million) comprising corporate income tax losses in the Netherlands which expire between now and 2025 and state and federal tax losses in the US which expire between now and 2036.
Other deductible temporary differences of € 52 million (2015: € 67 million) have not been recognised as a deferred tax asset. There is no expiry date for these differences.
At the balance sheet date, the aggregate amount of temporary differences associated with undistributed earnings of subsidiaries for which deferred tax liabilities have not been recognised was € 1,557 million (2015: € 1,505 million). No liability has been recognised in respect of these differences because the Group is in a position to control the timing of the reversal of the temporary differences, and it is probable that such differences will not reverse in the foreseeable future.
Deferred tax assets and liabilities are offset when there is a legally enforceable right to set off current tax assets against current tax liabilities and when the deferred income taxes relate to the same fiscal authority. The following amounts, determined after appropriate offsetting, are shown in the consolidated balance sheet:
| € million | € million | € million | € million | € million | € million | |||||||||||||||||||
| Deferred tax assets and liabilities |
Assets 2016 |
Assets 2015 |
Liabilities 2016 |
Liabilities 2015 |
Total 2016 |
Total 2015 |
||||||||||||||||||
|
Pensions and similar obligations |
568 | 434 | 198 | 123 | 766 | 557 | ||||||||||||||||||
|
Provisions |
579 | 516 | 343 | 192 | 922 | 708 | ||||||||||||||||||
|
Goodwill and intangible assets |
2 | 126 | (1,930 | ) | (1,427 | ) | (1,928 | ) | (1,301 | ) | ||||||||||||||
|
Accelerated tax depreciation |
(60 | ) | (66 | ) | (810 | ) | (686 | ) | (870 | ) | (752 | ) | ||||||||||||
|
Tax losses |
128 | 96 | 3 | 27 | 131 | 123 | ||||||||||||||||||
|
Fair value gains |
28 | 12 | (35 | ) | (37 | ) | (7 | ) | (25 | ) | ||||||||||||||
|
Fair value losses |
9 | (5 | ) | 20 | 21 | 29 | 16 | |||||||||||||||||
|
Share-based payments |
44 | 59 | 125 | 131 | 169 | 190 | ||||||||||||||||||
|
Other |
56 | 13 | 25 | (88 | ) | 81 | (75 | ) | ||||||||||||||||
| 1,354 | 1,185 | (2,061 | ) | (1,744 | ) | (707 | ) | (559 | ) | |||||||||||||||
|
Of which deferred tax to be recovered/(settled) after more than 12 months |
1,157 | 856 | (2,206 | ) | (1,811 | ) | (1,049 | ) | (955 | ) | ||||||||||||||
| 102 | Financial Statements | Annual Report on Form 20-F 2016 |
Table of Contents
6C. TAX ON OTHER COMPREHENSIVE INCOME
Income tax is recognised in other comprehensive income for items recognised directly in equity.
Tax effects of the components of other comprehensive income were as follows:
| € million | € million | € million | € million | € million | € million | |||||||||||||||||||
|
Before tax 2016 |
Tax (charge)/ credit 2016 |
After tax 2016 |
Before tax 2015 |
Tax (charge)/ credit 2015 |
After tax 2015 |
|||||||||||||||||||
|
Fair value gains/(losses) on financial instruments |
(15 | ) | - | (15 | ) | 82 | 18 | 100 | ||||||||||||||||
|
Remeasurements of defined benefit pension plans |
(1,221 | ) | 241 | (980 | ) | 1,124 | (240 | ) | 884 | |||||||||||||||
|
Currency retranslation gains/(losses) |
217 | - | 217 | (510 | ) | 29 | (481 | ) | ||||||||||||||||
| (1,019 | ) | 241 | (778 | ) | 696 | (193 | ) | 503 | ||||||||||||||||
7. COMBINED EARNINGS PER SHARE
The combined earnings per share calculations are based on the average number of share units representing the combined ordinary shares of NV and PLC in issue during the period, less the average number of shares held as treasury stock.
In calculating diluted earnings per share and core earnings per share, a number of adjustments are made to the number of shares, principally: (i) conversion into PLC ordinary shares in the year 2038 of shares in a group company (refer below) and (ii) the exercise of share options by employees.
On 19 May 2014 Unilever PLC purchased the shares convertible to PLC ordinary shares in 2038. Due to the repurchase the average number of combined share units is not adjusted for these shares from 20 May 2014 to 31 December 2016. For 2014 the adjusted average number of share units is calculated based on the number of days the shares were dilutive during the year ended 31 December 2014.
Earnings per share for total operations for the 12 months were calculated as follows:
| € | € | € | ||||||||||||||||||
| Combined earnings per share | 2016 | 2015 | 2014 | |||||||||||||||||
|
Basic earnings per share |
1.83 | 1.73 | 1.82 | |||||||||||||||||
|
Diluted earnings per share |
1.82 | 1.72 | 1.79 | |||||||||||||||||
|
Core EPS |
1.88 | 1.82 | 1.61 | |||||||||||||||||
| Millions of share units | ||||||||||||||||||||
| Calculation of average number of share units | 2016 | 2015 | 2014 | |||||||||||||||||
|
Average number of shares: NV |
1,714.7 | 1,714.7 | 1,714.7 | |||||||||||||||||
|
PLC |
1,310.2 | 1,310.2 | 1,310.2 | |||||||||||||||||
|
Less shares held by employee share trusts and companies |
(184.7 | ) | (184.8 | ) | (184.4 | ) | ||||||||||||||
|
Combined average number of share units |
2,840.2 | 2,840.1 | 2,840.5 | |||||||||||||||||
|
Add shares issuable in 2038 |
- | - | 26.8 | |||||||||||||||||
|
Add dilutive effect of share-based compensation plans |
13.7 | 15.3 | 15.3 | |||||||||||||||||
|
Diluted combined average number of share units |
2,853.9 | 2,855.4 | 2,882.6 | |||||||||||||||||
| Calculation of earnings |
€ million 2016 |
€ million 2015 |
€ million 2014 |
|||||||||||||||||
|
Net profit |
5,547 | 5,259 | 5,515 | |||||||||||||||||
|
Non-controlling interests |
(363 | ) | (350 | ) | (344 | ) | ||||||||||||||
|
Net profit attributable to shareholders’ equity |
5,184 | 4,909 | 5,171 | |||||||||||||||||
| Calculation of core earnings | Notes |
€ million 2016 |
€ million 2015 |
€ million 2014 |
||||||||||||||||
|
Net profit attributable to shareholders’ equity |
5,184 | 4,909 | 5,171 | |||||||||||||||||
|
Post-tax impact of non-core items |
3 | 186 | 301 | (537 | ) | |||||||||||||||
|
Core profit attributable to shareholders’ equity |
5,370 | 5,210 | 4,634 | |||||||||||||||||
| Annual Report and Accounts 2016 | Financial Statements | 103 |
Table of Contents
NOTES TO THE CONSOLIDATED FINANCIAL STATEMENTS
UNILEVER GROUP CONTINUED
8. DIVIDENDS ON ORDINARY CAPITAL
Dividends are recognised on the date that the shareholder’s right to receive payment is established. This is generally the date when the dividend is declared.
| € million | € million | € million | ||||||||||
| Dividends on ordinary capital during the year | 2016 | 2015 | 2014 | |||||||||
|
NV dividends |
(1,974 | ) | (1,862 | ) | (1,757 | ) | ||||||
|
PLC dividends |
(1,626 | ) | (1,542 | ) | (1,439 | ) | ||||||
| (3,600 | ) | (3,404 | ) | (3,196 | ) | |||||||
Four quarterly interim dividends were declared and paid during 2016 totalling € 1.26 (2015: € 1.19) per NV ordinary share and £1.04 (2015: £0.87) per PLC ordinary share.
Quarterly dividends of € 0.32 per NV ordinary share and £0.28 per PLC ordinary share were declared on 26 January 2017, to be paid in March 2017. See note 26 ‘Events after the balance sheet date’ on page 130. Total dividends declared in relation to 2016 were € 1.28 (2015: € 1.21) per NV ordinary share and £1.09 (2015: £0.88) per PLC ordinary share.
9. GOODWILL AND INTANGIBLE ASSETS
GOODWILL
Goodwill is initially recognised based on the accounting policy for business combinations (see note 21). Goodwill is subsequently measured at cost less amounts provided for impairment. The Group’s cash generating units (CGUs) are based on the four product categories and the three geographical areas.
Goodwill acquired in a business combination is allocated to the Group’s CGUs, or groups of CGUs, that are expected to benefit from the synergies of the combination. These might not always be the same as the CGUs that include the assets and liabilities of the acquired business. Each unit or group of units to which the goodwill is allocated represents the lowest level within the Group at which the goodwill is monitored for internal management purposes, and is not larger than an operating segment.
INTANGIBLE ASSETS
Separately purchased intangible assets are initially measured at cost, being the purchase price as at the date of acquisition. On acquisition of new interests in group companies, Unilever recognises any specifically identifiable intangible assets separately from goodwill. These intangible assets are initially measured at fair value as at the date of acquisition.
Development expenditure for internally-produced intangible assets is capitalised only if the costs can be reliably measured, future economic benefits are probable, the product is technically feasible and the Group has the intent and the resources to complete the project. Research expenditure to support development of internally-produced intangible assets is recognised in profit or loss as incurred.
Indefinite-life intangibles mainly comprise trademarks and brands. These assets are not amortised but are subject to a review for impairment annually, or more frequently if events or circumstances indicate this is necessary. Any impairment is charged to the income statement as it arises.
Finite-life intangible assets mainly comprise software, patented and non-patented technology, know-how and customer lists. These assets are amortised on a straight-line basis in the income statement over the period of their expected useful lives, or the period of legal rights if shorter. None of the amortisation periods exceeds ten years.
| 104 | Financial Statements | Annual Report on Form 20-F 2016 |
Table of Contents
9. GOODWILL AND INTANGIBLE ASSETS CONTINUED
| € million | € million | € million | € million | € million | ||||||||||||||||
| Movements during 2016 | Goodwill |
Indefinite-life intangible assets |
Finite-life intangible assets |
Software | Total | |||||||||||||||
|
Cost |
||||||||||||||||||||
|
1 January 2016 |
17,378 | 7,444 | 819 | 2,538 | 28,179 | |||||||||||||||
|
Acquisitions of group companies |
1,140 | 911 | 236 | - | 2,287 | |||||||||||||||
|
Disposals of group companies |
(2 | ) | (83 | ) | - | - | (85 | ) | ||||||||||||
|
Reclassification to held for disposal |
(55 | ) | - | - | - | (55 | ) | |||||||||||||
|
Additions |
- | 2 | 6 | 225 | 233 | |||||||||||||||
|
Disposals |
- | - | (1 | ) | (42 | ) | (43 | ) | ||||||||||||
|
Currency retranslation |
328 | 84 | 8 | (143 | ) | 277 | ||||||||||||||
|
31 December 2016 |
18,789 | 8,358 | 1,068 | 2,578 | 30,793 | |||||||||||||||
|
Accumulated amortisation and impairment |
||||||||||||||||||||
|
1 January 2016 |
(1,165 | ) | (13 | ) | (673 | ) | (1,269 | ) | (3,120 | ) | ||||||||||
|
Amortisation/impairment for the year |
- | - | (19 | ) | (291 | ) | (310 | ) | ||||||||||||
|
Disposals |
- | - | 1 | 42 | 43 | |||||||||||||||
|
Currency retranslation |
- | - | (7 | ) | 34 | 27 | ||||||||||||||
|
31 December 2016 |
(1,165 | ) | (13 | ) | (698 | ) | (1,484 | ) | (3,360 | ) | ||||||||||
|
Net book value 31 December 2016 |
17,624 | 8,345 | 370 | 1,094 | 27,433 | |||||||||||||||
| Movements during 2015 | ||||||||||||||||||||
|
Cost |
||||||||||||||||||||
|
1 January 2015 |
15,725 | 6,364 | 685 | 2,136 | 24,910 | |||||||||||||||
|
Acquisitions of group companies |
1,012 | 842 | 112 | - | 1,966 | |||||||||||||||
|
Disposals of group companies |
(5 | ) | (42 | ) | - | - | (47 | ) | ||||||||||||
|
Reclassification to held for disposal |
(34 | ) | (9 | ) | - | - | (43 | ) | ||||||||||||
|
Additions |
- | 3 | 3 | 329 | 335 | |||||||||||||||
|
Disposals |
- | - | (3 | ) | (7 | ) | (10 | ) | ||||||||||||
|
Currency retranslation |
680 | 286 | 22 | 80 | 1,068 | |||||||||||||||
|
31 December 2015 |
17,378 | 7,444 | 819 | 2,538 | 28,179 | |||||||||||||||
|
Accumulated amortisation and impairment |
||||||||||||||||||||
|
1 January 2015 |
(1,083 | ) | (12 | ) | (644 | ) | (997 | ) | (2,736 | ) | ||||||||||
|
Amortisation/impairment for the year |
- | - | (8 | ) | (265 | ) | (273 | ) | ||||||||||||
|
Disposals |
- | - | 3 | 7 | 10 | |||||||||||||||
|
Currency retranslation |
(82 | ) | (1 | ) | (24 | ) | (14 | ) | (121 | ) | ||||||||||
|
31 December 2015 |
(1,165 | ) | (13 | ) | (673 | ) | (1,269 | ) | (3,120 | ) | ||||||||||
|
Net book value 31 December 2015 |
16,213 | 7,431 | 146 | 1,269 | 25,059 | |||||||||||||||
There are no significant carrying amounts of goodwill and intangible assets that are allocated across multiple cash generating units.
IMPAIRMENT CHARGES
We have tested all material goodwill and indefinite-life intangible assets for impairment. No impairments were identified.
SIGNIFICANT CGUs
The goodwill and indefinite-life intangible assets held in the three CGUs relating to Foods across the geographical areas and Personal Care The Americas are considered significant within the total carrying amounts of goodwill and indefinite-life intangible assets at 31 December 2016 in terms of size, headroom and sensitivity to assumptions used. No other CGUs are considered significant in this respect.
The goodwill and indefinite-life intangible assets held in the significant CGUs are:
| € billion | € billion | € billion | € billion | |||||||||||||
| 2016 | 2016 | 2015 | 2015 | |||||||||||||
| Goodwill |
Indefinite- life intangibles |
Goodwill |
Indefinite- life intangibles |
|||||||||||||
|
Foods Europe |
5.8 | 1.6 | 6.0 | 1.6 | ||||||||||||
|
Foods The Americas |
3.9 | 1.6 | 3.7 | 1.6 | ||||||||||||
|
Foods Asia/AMET/RUB |
1.8 | 0.5 | 1.6 | 0.5 | ||||||||||||
|
Personal Care The Americas |
2.8 | 1.7 | 2.1 | 1.6 | ||||||||||||
Value in use has been calculated as the present value of projected cash flows. A pre-tax discount rate of 7.4% (2015: 7.4%) was used.
| Annual Report on Form 20-F 2016 | Financial Statements | 105 |
Table of Contents
NOTES TO THE CONSOLIDATED FINANCIAL STATEMENTS
UNILEVER GROUP CONTINUED
9. GOODWILL AND INTANGIBLE ASSETS CONTINUED
For the significant CGUs, the following key assumptions were used in the discounted cash flow projections:
| Foods | Foods | Foods | Personal Care | |||||||||||||
| Europe |
The Americas |
Asia/ AMET/RUB |
The Americas |
|||||||||||||
|
Longer-term sustainable growth rates |
0.4% | 1.2% | 4.3% | 1.2% | ||||||||||||
|
Average near-term nominal growth rates |
-1.3% | 3.0% | 5.6% | 6.3% | ||||||||||||
|
Average operating margins |
16% | 15% | 9% | 17% | ||||||||||||
The projections cover a period of five years, as we believe this to be the most appropriate timescale over which to review and consider annual performances before applying a fixed terminal value multiple to the final year cash flows.
The growth rates and margins used to estimate future performance are based on the conservative end of the range of estimates from past performance, our annual forecast and three year strategic plan extended to year 4 and 5.
We have performed sensitivity analyses around the base assumptions. There are no reasonably possible changes in a key assumption that would cause the carrying amount to exceed recoverable amount.
10. PROPERTY, PLANT AND EQUIPMENT
Property, plant and equipment is measured at cost including eligible borrowing costs less depreciation and accumulated impairment losses.
Depreciation is provided on a straight-line basis over the expected average useful lives of the assets. Residual values are reviewed at least annually. Estimated useful lives by major class of assets are as follows:
| • Freehold buildings (no depreciation on freehold land) | 40 years | |
| • Leasehold land and buildings | 40 years (or life of lease if less) | |
| • Plant and equipment | 2–20 years |
Property, plant and equipment is subject to review for impairment if triggering events or circumstances indicate that this is necessary. If an indication of impairment exists, the asset’s or cash generating unit’s recoverable amount is estimated and any impairment loss is charged to the income statement as it arises.
| € million | € million | € million | ||||||||||
| Land and | Plant and | |||||||||||
| Movements during 2016 | buildings | equipment | Total | |||||||||
|
Cost |
||||||||||||
|
1 January 2016 |
4,551 | 15,366 | 19,917 | |||||||||
|
Acquisitions of group companies |
- | 13 | 13 | |||||||||
|
Disposals of group companies |
(1 | ) | (11 | ) | (12 | ) | ||||||
|
Additions |
358 | 1,553 | 1,911 | |||||||||
|
Disposals |
(84 | ) | (521 | ) | (605 | ) | ||||||
|
Currency retranslation |
23 | 64 | 87 | |||||||||
|
Reclassification as held for sale |
(102 | ) | (2 | ) | (104 | ) | ||||||
|
31 December 2016 |
4,745 | 16,462 | 21,207 | |||||||||
|
Accumulated amortisation and impairment |
||||||||||||
|
1 January 2016 |
(1,443 | ) | (7,416 | ) | (8,859 | ) | ||||||
|
Disposals of group companies |
1 | 7 | 8 | |||||||||
|
Depreciation charge for the year |
(149 | ) | (1,005 | ) | (1,154 | ) | ||||||
|
Disposals |
56 | 332 | 388 | |||||||||
|
Currency retranslation |
5 | (15 | ) | (10 | ) | |||||||
|
Reclassification as held for sale |
47 | 46 | 93 | |||||||||
|
31 December 2016 |
(1,483 | ) | (8,051 | ) | (9,534 | ) | ||||||
|
Net book value 31 December 2016 (a) |
3,262 | 8,411 | 11,673 | |||||||||
|
Includes payments on account and assets in course of construction |
189 | 1,236 | 1,425 | |||||||||
| (a) | Includes € 249 million (2015: € 270 million) of freehold land. |
The Group has commitments to purchase property, plant and equipment of € 478 million (2015: € 535 million).
| 106 | Financial Statements | Annual Report on Form 20-F 2016 |
Table of Contents
10. PROPERTY, PLANT AND EQUIPMENT CONTINUED
| € million | € million | € million | ||||||||||
| Land and | Plant and | |||||||||||
| Movements during 2015 | buildings | equipment | Total | |||||||||
|
Cost |
||||||||||||
|
1 January 2015 |
4,200 | 14,714 | 18,914 | |||||||||
|
Acquisitions of group companies |
40 | 13 | 53 | |||||||||
|
Disposals of group companies |
- | (5 | ) | (5 | ) | |||||||
|
Additions |
369 | 1,513 | 1,882 | |||||||||
|
Disposals |
(64 | ) | (723 | ) | (787 | ) | ||||||
|
Currency retranslation |
37 | (5 | ) | 32 | ||||||||
|
Reclassification as held for sale |
(31 | ) | (141 | ) | (172 | ) | ||||||
|
31 December 2015 |
4,551 | 15,366 | 19,917 | |||||||||
|
Accumulated depreciation |
||||||||||||
|
1 January 2015 |
(1,346 | ) | (7,096 | ) | (8,442 | ) | ||||||
|
Disposals of group companies |
- | 2 | 2 | |||||||||
|
Depreciation charge for the year |
(120 | ) | (977 | ) | (1,097 | ) | ||||||
|
Disposals |
31 | 620 | 651 | |||||||||
|
Currency retranslation |
(29 | ) | (29 | ) | (58 | ) | ||||||
|
Reclassification as held for sale |
21 | 64 | 85 | |||||||||
|
31 December 2015 |
(1,443 | ) | (7,416 | ) | (8,859 | ) | ||||||
|
Net book value 31 December 2015 |
3,108 | 7,950 | 11,058 | |||||||||
|
Includes payments on account and assets in course of construction |
217 | 1,334 | 1,551 | |||||||||
11. OTHER NON-CURRENT ASSETS
Joint ventures are undertakings in which the Group has an interest and which are jointly controlled by the Group and one or more other parties. Associates are undertakings where the Group has an investment in which it does not have control or joint control but can exercise significant influence.
Interests in joint ventures and associates are accounted for using the equity method and are stated in the consolidated balance sheet at cost, adjusted for the movement in the Group’s share of their net assets and liabilities. The Group’s share of the profit or loss after tax of joint ventures and associates is included in the Group’s consolidated profit before taxation.
Where the Group’s share of losses exceeds its interest in the equity accounted investee, the carrying amount of the investment is reduced to zero and the recognition of further losses is discontinued, except to the extent that the Group has an obligation to make payments on behalf of the investee.
Biological assets are measured at fair value less costs to sell with any changes recognised in the income statement.
| € million | € million | |||||||
| 2016 | 2015 | |||||||
|
Interest in net assets of joint ventures |
36 | 48 | ||||||
|
Interest in net assets of associates |
51 | 59 | ||||||
|
Long-term trade and other receivables |
421 | 413 | ||||||
|
Fair value of biological assets |
51 | 48 | ||||||
|
Other non-current assets (a) |
159 | 203 | ||||||
| 718 | 771 | |||||||
| (a) | Mainly relate to assets held in escrow for the UK pension fund and tax assets. |
| Annual Report on Form 20-F 2016 | Financial Statements | 107 |
Table of Contents
NOTES TO THE CONSOLIDATED FINANCIAL STATEMENTS
UNILEVER GROUP CONTINUED
11. OTHER NON-CURRENT ASSETS CONTINUED
| € million | € million | |||||||
| Movements during 2016 and 2015 | 2016 | 2015 | ||||||
|
Joint ventures (a) |
||||||||
|
1 January |
48 | 52 | ||||||
|
Additions |
24 | 4 | ||||||
|
Dividends received/reductions |
(151 | ) | (137 | ) | ||||
|
Share of net profit/(loss) |
130 | 117 | ||||||
|
Currency retranslation |
(15 | ) | 12 | |||||
|
31 December |
36 | 48 | ||||||
|
Associates (b) |
||||||||
|
1 January |
59 | 42 | ||||||
|
Additions |
7 | 24 | ||||||
|
Dividend received/reductions |
(8 | ) | - | |||||
|
Share of net profit/(loss) |
(3 | ) | (10 | ) | ||||
|
Currency retranslation |
(4 | ) | 3 | |||||
|
31 December |
51 | 59 | ||||||
| (a) | Our principal joint ventures are Unilever Jerónimo Martins for Portugal, the Pepsi/Lipton Partnership for the US and Pepsi Lipton International for the rest of the world. |
| (b) | Associates as at 31 December 2016 primarily comprise our investments in Langholm Capital Partners. Other Unilever Ventures assets are included under ‘Other non-current non-financial assets’. In 2015 we sold shares in an associate (carrying value zero) for consideration of € 110 million. |
The joint ventures and associates have no significant contingent liabilities to which the Group is exposed, and the Group has no significant contingent liabilities in relation to its interests in the joint ventures and associates.
The Group has no outstanding capital commitments to joint ventures.
Outstanding balances with joint ventures and associates are shown in note 23 on page 129.
12. INVENTORIES
Inventories are valued at the lower of weighted average cost and net realisable value. Cost comprises direct costs and, where appropriate, a proportion of attributable production overheads. Net realisable value is the estimated selling price less the estimated costs necessary to make the sale.
| € million | € million | |||||||
| Inventories | 2016 | 2015 | ||||||
|
Raw materials and consumables |
1,385 | 1,381 | ||||||
|
Finished goods and goods for resale |
2,893 | 2,954 | ||||||
| 4,278 | 4,335 | |||||||
Inventories with a value of € 110 million (2015: € 100 million) are carried at net realisable value, this being lower than cost. During 2016, € 113 million (2015: € 119 million) was charged to the income statement for damaged, obsolete and lost inventories. In 2016, € 113 million (2015: € 123 million) was utilised or released to the income statement from inventory provisions taken in earlier years.
13. TRADE AND OTHER CURRENT RECEIVABLES
Trade and other receivables are initially recognised at fair value plus any directly attributable transaction costs. Subsequently these assets are held at amortised cost, using the effective interest method and net of any impairment losses.
We do not consider the fair values of trade and other receivables to be significantly different from their carrying values. Concentrations of credit risk with respect to trade receivables are limited, due to the Group’s customer base being large and diverse. Our historical experience of collecting receivables, supported by the level of default, is that credit risk is low across territories and so trade receivables are considered to be a single class of financial assets. Balances are considered for impairment on an individual basis rather than by reference to the extent that they become overdue.
| 108 | Financial Statements | Annual Report on Form 20-F 2016 |
Table of Contents
13. TRADE AND OTHER CURRENT RECEIVABLES CONTINUED
| € million | € million | |||||||
| Trade and other current receivables | 2016 | 2015 | ||||||
|
Due within one year |
||||||||
|
Trade receivables |
3,329 | 2,917 | ||||||
|
Prepayments and accrued income |
504 | 561 | ||||||
|
Other receivables |
1,269 | 1,326 | ||||||
| 5,102 | 4,804 | |||||||
Other receivables comprise financial assets of € 396 million (2015: € 379 million), and non-financial assets of € 873 million (2015: € 947 million). Financial assets include supplier and customer deposits, employee advances and certain derivatives. Non-financial assets mainly consist of reclaimable sales tax.
| € million | € million | |||||||
| Ageing of trade receivables | 2016 | 2015 | ||||||
|
Total trade receivables |
3,472 | 3,047 | ||||||
|
Less impairment provision for trade receivables |
(143 | ) | (130 | ) | ||||
| 3,329 | 2,917 | |||||||
|
Of which: |
||||||||
|
Not overdue |
2,537 | 2,200 | ||||||
|
Past due less than three months |
666 | 634 | ||||||
|
Past due more than three months but less than six months |
102 | 73 | ||||||
|
Past due more than six months but less than one year |
69 | 52 | ||||||
|
Past due more than one year |
98 | 88 | ||||||
|
Impairment provision for trade receivables |
(143 | ) | (130 | ) | ||||
| 3,329 | 2,917 | |||||||
| € million | € million | |||||||
| Impairment provision for trade and other receivables – current and non-current impairments | 2016 | 2015 | ||||||
|
1 January |
155 | 145 | ||||||
|
Charged to income statement |
42 | 38 | ||||||
|
Reductions/releases |
(35 | ) | (25 | ) | ||||
|
Currency retranslation |
4 | (3 | ) | |||||
|
31 December |
166 | 155 | ||||||
14. TRADE PAYABLES AND OTHER LIABILITIES
Trade payables and other liabilities are initially recognised at fair value less any directly attributable transaction costs. Trade payables and accruals are subsequently measured at amortised cost, using the effective interest method. Other liabilities are subsequently measured either at amortised cost, using the effective interest method or at fair value, with changes being recognised in the income statement.
We do not consider the fair values of trade payables and other liabilities to be significantly different from their carrying values.
| € million | € million | |||||||
| Trade payables and other liabilities | 2016 | 2015 | ||||||
|
Due within one year |
||||||||
|
Trade payables |
8,591 | 8,296 | ||||||
|
Accruals |
3,655 | 3,616 | ||||||
|
Social security and sundry taxes |
468 | 559 | ||||||
|
Others |
1,157 | 1,317 | ||||||
| 13,871 | 13,788 | |||||||
|
Due after more than one year |
||||||||
|
Accruals |
159 | 120 | ||||||
|
Others |
508 | 273 | ||||||
| 667 | 393 | |||||||
|
Total trade payables and other liabilities |
14,538 | 14,181 | ||||||
Included in others is deferred consideration on acquisitions, third party royalties, certain derivatives and dividends to non-controlling interests.
| Annual Report on Form 20-F 2016 | Financial Statements | 109 |
Table of Contents
NOTES TO THE CONSOLIDATED FINANCIAL STATEMENTS
UNILEVER GROUP CONTINUED
15. CAPITAL AND FUNDING
ORDINARY SHARES
Ordinary shares are classified as equity. Incremental costs directly attributable to the issue of ordinary shares are recognised as a deduction from equity, net of any tax effects.
INTERNAL HOLDINGS
The ordinary shares numbered 1 to 2,400 (inclusive) in NV (‘Special Shares’) and deferred stock of PLC are held as to one half of each class by N.V. Elma – a subsidiary of NV – and one half by United Holdings Limited – a subsidiary of PLC. This capital is eliminated on consolidation.
SHARE-BASED COMPENSATION
The Group operates a number of share-based compensation plans involving options and awards of ordinary shares of NV and PLC. Full details of these plans are given in note 4C on pages 99 to 100.
OTHER RESERVES
Other reserves include the fair value reserve, the foreign currency translation reserve, the capital redemption reserve and treasury stock.
SHARES HELD BY EMPLOYEE SHARE TRUSTS AND GROUP COMPANIES
Certain PLC trusts, NV and group companies purchase and hold NV and PLC shares to satisfy performance shares granted, share options granted and other share awards (see note 4C). The assets and liabilities of these trusts and shares held by group companies are included in the consolidated financial statements. The book value of shares held is deducted from other reserves, and trusts’ borrowings are included in the Group’s liabilities. The costs of the trusts are included in the results of the Group. These shares are excluded from the calculation of earnings per share.
FINANCIAL LIABILITIES
Financial liabilities are initially recognised at fair value, less any directly related transaction costs. Certain bonds are designated as being part of a fair value hedge relationship. In these cases, the bonds are carried at amortised cost, adjusted for the fair value of the risk being hedged, with changes in value shown in profit and loss. Other financial liabilities, excluding derivatives, are subsequently carried at amortised cost.
DERIVATIVE FINANCIAL INSTRUMENTS
The Group’s use of, and accounting for, derivative instruments is explained in note 16 on page 115 and on pages 119 to 120.
The Group’s Treasury activities are designed to:
| • | maintain a competitive balance sheet in line with A+/A1 rating (see below); |
| • | secure funding at lowest costs for the Group’s operations, M&A activity and external dividend payments (see below); |
| • | protect the Group’s financial results and position from financial risks (see note 16); |
| • | maintain market risks within acceptable parameters, while optimising returns (see note 16); and |
| • | protect the Group’s financial investments, while maximising returns (see note 17). |
The Treasury department provides central deposit taking, funding and foreign exchange management services for the Group’s operations. The department is governed by standards and processes which are approved by Unilever Leadership Executive (ULE). In addition to guidelines and exposure limits, a system of authorities and extensive independent reporting covers all major areas of activity. Performance is monitored closely by senior management. Reviews are undertaken periodically by corporate audit.
Key instruments used by the department are:
| • | short-term and long-term borrowings; |
| • | cash and cash equivalents; and |
| • | plain vanilla derivatives, including interest rate swaps and foreign exchange contracts. |
The Treasury department maintains a list of approved financial instruments. The use of any new instrument must be approved by the Chief Financial Officer. The use of leveraged instruments is not permitted.
| 110 | Financial Statements | Annual Report on Form 20-F 2016 |
Table of Contents
15. CAPITAL AND FUNDING CONTINUED
Unilever considers the following components of its balance sheet to be managed capital:
| • | total equity – retained profit, other reserves, share capital, share premium, non-controlling interests (notes 15A and 15B); |
| • | short-term debt – current financial liabilities (note 15C); and |
| • | long-term debt – non-current bank loans, bonds and other loans (note 15C). |
The Group manages its capital so as to safeguard its ability to continue as a going concern and to optimise returns to our shareholders through an appropriate balance of debt and equity. The capital structure of the Group is based on management’s judgement of the appropriate balance of key elements in order to meet its strategic and day-to-day needs. We consider the amount of capital in proportion to risk and manage the capital structure in light of changes in economic conditions and the risk characteristics of the underlying assets.
Our current long-term credit rating is A+/A1 and our short-term credit rating is A1/P1. We aim to maintain a competitive balance sheet which we consider to be the equivalent of a credit rating of A+/A1 in the long-term. This provides us with:
| • | appropriate access to the debt and equity markets; |
| • | sufficient flexibility for acquisitions; |
| • | sufficient resilience against economic and financial uncertainty while ensuring ample liquidity; and |
| • | optimal weighted average cost of capital, given the above constraints. |
Unilever monitors the qualitative and quantitative factors utilised by the rating agencies. This information is publicly available and is updated by the credit rating agencies on a regular basis.
Unilever will take appropriate steps in order to maintain, or if necessary adjust, its capital structure. Unilever is not subject to financial covenants in any of its significant financing agreements.
15A. SHARE CAPITAL
| Issued, | Issued, | |||||||||||||||
| called up | called up | |||||||||||||||
| and | and | |||||||||||||||
| Authorised | (a) | fully paid | (b) | Authorised | (a) | fully paid | (b) | |||||||||
| 2016 | 2016 | 2015 | 2015 | |||||||||||||
| Unilever N.V. | € million | € million | € million | € million | ||||||||||||
|
NV ordinary shares of € 0.16 each |
480 | 274 | 480 | 274 | ||||||||||||
|
NV ordinary shares of € 428.57 each (shares numbered 1 to 2,400 – ‘Special Shares’) |
1 | 1 | 1 | 1 | ||||||||||||
|
Internal holdings eliminated on consolidation ( € 428.57 shares) |
- | (1 | ) | - | (1 | ) | ||||||||||
| 481 | 274 | 481 | 274 | |||||||||||||
| Unilever PLC | £ million | £ million | ||||||||||||||
|
PLC ordinary shares of 3 1 / 9 p each |
40.8 | 40.8 | ||||||||||||||
|
PLC deferred stock of £1 each |
0.1 | 0.1 | ||||||||||||||
|
Internal holding eliminated on consolidation (£1 stock) |
(0.1 | ) | (0.1 | ) | ||||||||||||
| 40.8 | 40.8 | |||||||||||||||
| € million | € million | |||||||||||||||
|
Euro equivalent in millions (at £1.00 = € 5.143) (c) |
210 | 210 | ||||||||||||||
| Unilever Group | € million | € million | ||||||||||||||
|
Ordinary share capital of NV |
274 | 274 | ||||||||||||||
|
Ordinary share capital of PLC |
210 | 210 | ||||||||||||||
| 484 | 484 | |||||||||||||||
| (a) | At 31 December 2016, Unilever N.V. had 3,000,000,000 (2015: 3,000,000,000) authorised ordinary shares. The requirement for a UK company to have an authorised share capital was abolished by the UK Companies Act 2006. In May 2010 Unilever PLC shareholders approved new Articles of Association to reflect this. |
| (b) | At 31 December 2016, the following quantities of shares were in issue: 1,714,727,700 of NV ordinary shares; 2,400 of NV Special Shares; 1,310,156,361 of PLC ordinary shares and 100,000 of PLC deferred stock. The same quantities were in issue at 31 December 2015. |
| (c) | Conversion rate for PLC ordinary shares nominal value to euros is £1 = € 5.143 (which is calculated by dividing the nominal value of NV ordinary shares by the nominal value of PLC ordinary shares). |
For information on the rights of shareholders of NV and PLC and the operation of the Equalisation Agreement, see the Corporate Governance report on pages 29 to 35.
A nominal dividend of 6% per annum is paid on the deferred stock of PLC.
| Annual Report on Form 20-F 2016 | Financial Statements | 111 |
Table of Contents
NOTES TO THE CONSOLIDATED FINANCIAL STATEMENTS
UNILEVER GROUP CONTINUED
15B. EQUITY
BASIS OF CONSOLIDATION
Unilever is the majority shareholder of all material subsidiaries and has control in all cases. Information in relation to group companies is provided on pages 131 to 143.
SUBSIDIARIES WITH SIGNIFICANT NON-CONTROLLING INTERESTS
Unilever has one subsidiary company which has a material non-controlling interest, Hindustan Unilever Limited (HUL). Summary financial information in relation to HUL is shown below.
| € million | € million | |||||||
| HUL Balance sheet as at 31 December | 2016 | 2015 | ||||||
|
Non-current assets |
791 | 649 | ||||||
|
Current assets |
1,160 | 1,265 | ||||||
|
Current liabilities |
(980 | ) | (968 | ) | ||||
|
Non-current liabilities |
(110 | ) | (125 | ) | ||||
| HUL Comprehensive income for the year ended 31 December | ||||||||
|
Turnover |
4,084 | 4,212 | ||||||
|
Profit after tax |
475 | 438 | ||||||
|
Total comprehensive income |
484 | 484 | ||||||
| HUL Cash flow for the year ended 31 December | ||||||||
|
Net increase/(decrease) in cash and cash-equivalents |
14 | (107 | ) | |||||
| HUL Non-controlling interest | ||||||||
|
1 January |
(271 | ) | (258 | ) | ||||
|
Share of (profit)/loss for the year ended 31 December |
(157 | ) | (143 | ) | ||||
|
Other comprehensive income |
(8 | ) | (10 | ) | ||||
|
Dividend paid to the non-controlling interest |
157 | 152 | ||||||
|
Other changes in equity |
- | - | ||||||
|
Currency translation |
(3 | ) | (12 | ) | ||||
|
31 December |
(282 | ) | (271 | ) | ||||
ANALYSIS OF RESERVES FOR THE GROUP
| € million | € million | € million | ||||||||||
| Total | Total | Total | ||||||||||
| 2016 | 2015 | 2014 | ||||||||||
|
Fair value reserves |
(113 | ) | (98 | ) | (198 | ) | ||||||
|
Cash flow hedges |
(168 | ) | (174 | ) | (234 | ) | ||||||
|
Available-for-sale financial assets |
55 | 76 | 36 | |||||||||
|
Currency retranslation of group companies |
(3,034 | ) | (3,285 | ) | (2,901 | ) | ||||||
|
Adjustment on translation of PLC’s ordinary capital at 3 1 / 9 p = € 0.16 |
(164 | ) | (164 | ) | (164 | ) | ||||||
|
Capital redemption reserve |
32 | 32 | 32 | |||||||||
|
Book value of treasury stock |
(4,164 | ) | (4,119 | ) | (4,125 | ) | ||||||
|
Other (a) |
- | (182 | ) | (182 | ) | |||||||
| (7,443 | ) | (7,816 | ) | (7,538 | ) | |||||||
| (a) | Relates to option on purchase of subsidiary for non-controlling interest. |
Unilever acquired 3,902,584 (2015: 3,342,212) NV ordinary shares and 2,268,600 (2015: 2,102,300) PLC shares through purchases on the stock exchanges during the year. These shares are held as treasury stock as a separate component of other reserves. The total number held at 31 December 2016 was 151,953,411 (2015: 152,638,561) NV shares and 33,241,009 (2015: 33,391,209) PLC shares. Of these, 10,392,782 NV shares and 6,544,015 PLC shares were held in connection with share-based compensation plans (see note 4C on pages 99 to 100).
| 112 | Financial Statements | Annual Report on Form 20-F 2016 |
Table of Contents
15B. EQUITY CONTINUED
| € million | € million | |||||||
| Treasury stock – movements during the year | 2016 | 2015 | ||||||
|
1 January |
(4,119 | ) | (4,125 | ) | ||||
|
Purchases and other utilisations |
(45 | ) | 6 | |||||
|
31 December |
(4,164 | ) | (4,119 | ) | ||||
| € million | € million | |||||||
| Currency retranslation reserve – movements during the year | 2016 | 2015 | ||||||
|
1 January |
(3,285 | ) | (2,901 | ) | ||||
|
Currency retranslation during the year |
599 | (1,001 | ) | |||||
|
Movement in net investment hedges and exchange differences in net investments in foreign operations |
(365 | ) | 617 | |||||
|
Recycled to income statement |
17 | - | ||||||
|
31 December |
(3,034 | ) | (3,285 | ) | ||||
| OTHER COMPREHENSIVE INCOME RECONCILIATION | ||||||||
| € million | € million | |||||||
| Fair value gains/(losses) on financial instruments – movement during the year | 2016 | 2015 | ||||||
|
1 January |
(98 | ) | (198 | ) | ||||
|
Cash flow hedges |
6 | 60 | ||||||
|
Available for sale financial assets |
(21 | ) | 40 | |||||
|
31 December |
(113 | ) | (98 | ) | ||||
Refer to the consolidated statement of comprehensive income on page 84, the consolidated statement of changes in equity on page 85, and note 6C on page 103.
| € million | € million | |||||||
| Remeasurement of defined benefit pension plans net of tax | 2016 | 2015 | ||||||
|
1 January |
(1,473 | ) | (2,357 | ) | ||||
|
Movement during the year |
(980 | ) | 884 | |||||
|
31 December |
(2,453 | ) | (1,473 | ) | ||||
Refer to the consolidated statement of comprehensive income on page 84, the consolidated statement of changes in equity on page 85, note 4B from page 94 to 99 and note 6C on page 103.
| € million | € million | |||||||
| Currency retranslation gains/(losses) – movement during the year | 2016 | 2015 | ||||||
|
1 January |
(3,512 | ) | (3,031 | ) | ||||
|
Currency retranslation during the year: |
||||||||
|
Other reserves |
189 | (377 | ) | |||||
|
Retained profit |
17 | (109 | ) | |||||
|
Non-controlling interest |
11 | 5 | ||||||
|
31 December |
(3,295 | ) | (3,512 | ) | ||||
| Annual Report on Form 20-F 2016 | Financial Statements | 113 |
Table of Contents
NOTES TO THE CONSOLIDATED FINANCIAL STATEMENTS
UNILEVER GROUP CONTINUED
15C. FINANCIAL LIABILITIES
| € million | € million | € million | € million | € million | € million | |||||||||||||||||||||||||||
| Current | Non-current | Total | Current | Non-current | Total | |||||||||||||||||||||||||||
| Financial liabilities 2016 (a)(b) | Notes | 2016 | 2016 | 2016 | 2015 | 2015 | 2015 | |||||||||||||||||||||||||
|
Preference shares |
- | 68 | 68 | - | 68 | 68 | ||||||||||||||||||||||||||
|
Bank loans and overdrafts |
899 | 247 | 1,146 | 762 | 302 | 1,064 | ||||||||||||||||||||||||||
|
Bonds and other loans |
4,367 | 10,686 | 15,053 | 3,583 | 9,120 | 12,703 | ||||||||||||||||||||||||||
|
Finance lease creditors |
20 | 9 | 134 | 143 | 37 | 158 | 195 | |||||||||||||||||||||||||
|
Derivatives |
175 | 10 | 185 | 118 | 6 | 124 | ||||||||||||||||||||||||||
|
Other financial liabilities |
- | - | - | 289 | 200 | 489 | ||||||||||||||||||||||||||
| 5,450 | 11,145 | 16,595 | 4,789 | 9,854 | 14,643 | |||||||||||||||||||||||||||
| (a) | For the purposes of notes 15C and 17A, financial assets and liabilities exclude trade and other current receivables and trade payables and other liabilities which are covered in notes 13 and 14 respectively. |
| (b) | Financial liabilities include € 2 million (2015: € 4 million) of secured liabilities. |
ANALYSIS OF BONDS AND OTHER LOANS
| € million | € million | |||||||
| Total | Total | |||||||
| 2016 | 2015 | |||||||
|
Unilever N.V. |
||||||||
|
Floating Rate Notes 2018 ( € ) |
749 | 749 | ||||||
|
1.750% Bonds 2020 ( € ) |
748 | 747 | ||||||
|
0.500% Notes 2022 ( € ) |
743 | 742 | ||||||
|
1.125% Bonds 2028 ( € ) |
692 | - | ||||||
|
1.000% Notes 2023 ( € ) |
496 | 495 | ||||||
|
0.500% Notes 2024 ( € ) |
492 | - | ||||||
|
0.000% Notes 2020 ( € ) |
299 | - | ||||||
|
2.950% Notes 2017 (Renminbi) |
41 | 42 | ||||||
|
Commercial paper |
819 | 1,551 | ||||||
|
Total NV |
5,079 | 4,326 | ||||||
|
Unilever PLC |
||||||||
|
4.750% Bonds 2017 (£) |
466 | 542 | ||||||
|
2.000% Notes 2018 (£) |
294 | (c) | 339 | (c) | ||||
|
Commercial paper |
373 | - | ||||||
|
Total PLC |
1,133 | 881 | ||||||
|
Other group companies |
||||||||
|
Switzerland |
||||||||
|
Other |
- | 29 | ||||||
|
United States |
||||||||
|
4.250% Notes 2021 (US$) |
950 | 912 | ||||||
|
5.900% Bonds 2032 (US$) |
942 | 904 | ||||||
|
4.800% Bonds 2019 (US$) |
714 | 686 | ||||||
|
2.200% Notes 2019 (US$) |
711 | 681 | ||||||
|
2.000% Notes 2026 (US$) |
655 | - | ||||||
|
0.850% Notes 2017 (US$) |
524 | 502 | ||||||
|
1.375% Notes 2021 (US$) |
519 | - | ||||||
|
2.100% Notes 2020 (US$) |
474 | 454 | ||||||
|
3.100% Notes 2025 (US$) |
470 | 451 | ||||||
|
7.250% Bonds 2026 (US$) |
276 | 265 | ||||||
|
6.625% Bonds 2028 (US$) |
216 | 206 | ||||||
|
5.150% Notes 2020 (US$) |
149 | 145 | ||||||
|
7.000% Bonds 2017 (US$) |
142 | 136 | ||||||
|
5.600% Bonds 2097 (US$) |
87 | 84 | ||||||
|
2.750% Notes 2016 (US$) |
- | 458 | ||||||
|
Commercial paper (US$) |
1,892 | 1,532 | ||||||
|
Other countries |
120 | 51 | ||||||
|
Total other group companies |
8,841 | 7,496 | ||||||
|
Total bonds and other loans |
15,053 | 12,703 | ||||||
| (c) | Of which € 3 million (2015: € 1 million) relates to a fair value adjustment following the fair value hedge accounting of a fix-to-float interest rate swap. |
Information in relation to the derivatives used to hedge bonds and other loans within a fair value hedge relationship is shown in note 16.
| 114 | Financial Statements | Annual Report on Form 20-F 2016 |
Table of Contents
16. TREASURY RISK MANAGEMENT
DERIVATIVES AND HEDGE ACCOUNTING
Derivatives are measured at fair value with any related transaction costs expensed as incurred. The treatment of changes in the value of derivatives depends on their use as explained below.
(I) FAIR VALUE HEDGES (a)
Certain derivatives are held to hedge the risk of changes in value of a specific bond or other loan. In these situations, the Group designates the liability and related derivative to be part of a fair value hedge relationship. The carrying value of the bond is adjusted by the fair value of the risk being hedged, with changes going to the income statement. Gains and losses on the corresponding derivative are also recognised in the income statement. The amounts recognised are offset in the income statement to the extent that the hedge is effective. When the relationship no longer meets the criteria for hedge accounting, the fair value hedge adjustment made to the bond is amortised to the income statement using the effective interest method.
(II) CASH FLOW HEDGES (a)
Derivatives are also held to hedge the uncertainty in timing or amount of future forecast cash flows. Such derivatives are classified as being part of cash flow hedge relationships. For an effective hedge, gains and losses from changes in the fair value of derivatives are recognised in equity. Any ineffective elements of the hedge are recognised in the income statement. If the hedged cash flow relates to a non-financial asset, the amount accumulated in equity is subsequently included within the carrying value of that asset. For other cash flow hedges, amounts deferred in equity are taken to the income statement at the same time as the related cash flow.
When a derivative no longer qualifies for hedge accounting, any cumulative gain or loss remains in equity until the related cash flow occurs. When the cash flow takes place, the cumulative gain or loss is taken to the income statement. If the hedged cash flow is no longer expected to occur, the cumulative gain or loss is taken to the income statement immediately.
(III) NET INVESTMENT HEDGES (a)
Certain derivatives are designated as hedges of the currency risk on the Group’s investment in foreign subsidiaries. The accounting policy for these arrangements is set out in note 1.
(IV) DERIVATIVES FOR WHICH HEDGE ACCOUNTING IS NOT APPLIED
Derivatives not classified as hedges are held in order to hedge certain balance sheet items and commodity exposures. No hedge accounting is applied to these derivatives, which are carried at fair value with changes being recognised in the income statement.
| (a) | Applying hedge accounting has not led to material ineffectiveness being recognised in the income statement for both 2016 and 2015. |
The Group is exposed to the following risks that arise from its use of financial instruments, the management of which is described in the following sections:
| • | liquidity risk (see note 16A); |
| • | market risk (see note 16B); and |
| • | credit risk (see note 17B). |
16A. MANAGEMENT OF LIQUIDITY RISK
Liquidity risk is the risk that the Group will face in meeting its obligations associated with its financial liabilities. The Group’s approach to managing liquidity is to ensure that it will have sufficient funds to meet its liabilities when due without incurring unacceptable losses. In doing this, management considers both normal and stressed conditions. A material and sustained shortfall in our cash flow could undermine the Group’s credit rating, impair investor confidence and also restrict the Group’s ability to raise funds.
The Group maintained a cautious funding strategy, with a positive cash balance throughout 2015. This was the result of cash delivery from the business, coupled with the proceeds from bond issuances. This cash has been invested conservatively with low risk counter-parties at maturities of less than six months.
Cash flow from operating activities provides the funds to service the financing of financial liabilities on a day-to-day basis. The Group seeks to manage its liquidity requirements by maintaining access to global debt markets through short-term and long-term debt programmes. In addition, Unilever has committed credit facilities for general corporate use.
On 31 December 2016 Unilever had undrawn revolving 364-day bilateral credit facilities in aggregate of US$6,550 million (2015: US$6,550 million) with a 364-day term out. As part of the regular annual process, the intention is that these facilities will again be renewed in 2017.
| Annual Report on Form 20-F 2016 | Financial Statements | 115 |
Table of Contents
NOTES TO THE CONSOLIDATED FINANCIAL STATEMENTS
UNILEVER GROUP CONTINUED
16A. MANAGEMENT OF LIQUIDITY RISK CONTINUED
The following table shows Unilever’s contractually agreed undiscounted cash flows, including expected interest payments, which are payable under financial liabilities at the balance sheet date:
| € million | € million | € million | € million | € million | € million | € million | € million | |||||||||||||||||||||||||||
| Net | ||||||||||||||||||||||||||||||||||
| carrying | ||||||||||||||||||||||||||||||||||
| Due | Due | Due | Due | amount as | ||||||||||||||||||||||||||||||
| Due | between | between | between | between | Due | shown in | ||||||||||||||||||||||||||||
| within | 1 and | 2 and | 3 and | 4 and | after | balance | ||||||||||||||||||||||||||||
| Undiscounted cash flows | Notes | 1 year | 2 years | 3 years | 4 years | 5 years | 5 years | Total | sheet | |||||||||||||||||||||||||
|
2016 |
||||||||||||||||||||||||||||||||||
|
Non-derivative financial liabilities: |
||||||||||||||||||||||||||||||||||
|
Preference shares |
(4 | ) | (4 | ) | (4 | ) | (4 | ) | (4 | ) | (72 | ) | (92 | ) | (68 | ) | ||||||||||||||||||
|
Bank loans and overdrafts |
(909 | ) | (4 | ) | (243 | ) | - | - | - | (1,156 | ) | (1,146 | ) | |||||||||||||||||||||
|
Bonds and other loans |
(4,700 | ) | (1,335 | ) | (1,669 | ) | (1,882 | ) | (1,634 | ) | (6,733 | ) | (17,953 | ) | (15,053 | ) | ||||||||||||||||||
|
Finance lease creditors |
20 | (24 | ) | (18 | ) | (18 | ) | (17 | ) | (16 | ) | (127 | ) | (220 | ) | (143 | ) | |||||||||||||||||
|
Other financial liabilities |
- | - | - | - | - | - | - | - | ||||||||||||||||||||||||||
|
Trade payables excluding social
|
14 | (13,156 | ) | (125 | ) | - | - | - | - | (13,281 | ) | (13,476 | ) | |||||||||||||||||||||
|
Deferred consideration |
(247 | ) | (18 | ) | (24 | ) | - | (490 | ) | (10 | ) | (789 | ) | (594 | ) | |||||||||||||||||||
|
Issued financial guarantees |
- | - | - | - | - | - | - | - | ||||||||||||||||||||||||||
| (19,040 | ) | (1,504 | ) | (1,958 | ) | (1,903 | ) | (2,144 | ) | (6,942 | ) | (33,491 | ) | (30,480 | ) | |||||||||||||||||||
|
Derivative financial liabilities: |
||||||||||||||||||||||||||||||||||
|
Interest rate derivatives: |
||||||||||||||||||||||||||||||||||
|
Derivative contracts – receipts |
56 | 420 | - | - | - | - | 476 | |||||||||||||||||||||||||||
|
Derivative contracts – payments |
(70 | ) | (429 | ) | - | - | - | - | (499 | ) | ||||||||||||||||||||||||
|
Foreign exchange derivatives: |
||||||||||||||||||||||||||||||||||
|
Derivative contracts – receipts |
9,263 | - | - | - | - | - | 9,263 | |||||||||||||||||||||||||||
|
Derivative contracts – payments |
(9,580 | ) | - | - | - | - | - | (9,580 | ) | |||||||||||||||||||||||||
|
Commodity derivatives: |
||||||||||||||||||||||||||||||||||
|
Derivative contracts – receipts |
- | - | - | - | - | - | - | |||||||||||||||||||||||||||
|
Derivative contracts – payments |
(3 | ) | - | - | - | - | - | (3 | ) | |||||||||||||||||||||||||
| (334 | ) | (9 | ) | - | - | - | - | (343 | ) | (331 | ) | |||||||||||||||||||||||
|
Total |
(19,374 | ) | (1,513 | ) | (1,958 | ) | (1,903 | ) | (2,144 | ) | (6,942 | ) | (33,834 | ) | (30,811 | ) | ||||||||||||||||||
|
2015 |
||||||||||||||||||||||||||||||||||
|
Non-derivative financial liabilities: |
||||||||||||||||||||||||||||||||||
|
Preference shares |
(4 | ) | (4 | ) | (4 | ) | (4 | ) | (4 | ) | (72 | ) | (92 | ) | (68 | ) | ||||||||||||||||||
|
Bank loans and overdrafts |
(741 | ) | (337 | ) | - | - | - | - | (1,078 | ) | (1,064 | ) | ||||||||||||||||||||||
|
Bonds and other loans |
(3,912 | ) | (1,493 | ) | (1,331 | ) | (1,567 | ) | (1,519 | ) | (5,509 | ) | (15,331 | ) | (12,703 | ) | ||||||||||||||||||
|
Finance lease creditors |
20 | (51 | ) | (25 | ) | (22 | ) | (20 | ) | (18 | ) | (166 | ) | (302 | ) | (195 | ) | |||||||||||||||||
|
Other financial liabilities |
(289 | ) | - | - | - | - | (200 | ) | (489 | ) | (489 | ) | ||||||||||||||||||||||
|
Trade payables excluding social |
14 | (13,205 | ) | (235 | ) | - | - | - | - | (13,440 | ) | (13,442 | ) | |||||||||||||||||||||
|
security and sundry taxes |
||||||||||||||||||||||||||||||||||
|
Deferred consideration |
(23 | ) | (158 | ) | - | - | - | - | (181 | ) | (179 | ) | ||||||||||||||||||||||
|
Issued financial guarantees |
(15 | ) | - | - | - | - | - | (15 | ) | - | ||||||||||||||||||||||||
| (18,240 | ) | (2,252 | ) | (1,357 | ) | (1,591 | ) | (1,541 | ) | (5,947 | ) | (30,928 | ) | (28,141 | ) | |||||||||||||||||||
|
Derivative financial liabilities: |
||||||||||||||||||||||||||||||||||
|
Interest rate derivatives: |
||||||||||||||||||||||||||||||||||
|
Derivative contracts – receipts |
(255 | ) | (65 | ) | (125 | ) | - | - | - | (445 | ) | |||||||||||||||||||||||
|
Derivative contracts – payments |
198 | 60 | 124 | - | - | - | 382 | |||||||||||||||||||||||||||
|
Foreign exchange derivatives: |
||||||||||||||||||||||||||||||||||
|
Derivative contracts – receipts |
5,686 | - | - | - | - | - | 5,686 | |||||||||||||||||||||||||||
|
Derivative contracts – payments |
(5,817 | ) | - | - | - | - | - | (5,817 | ) | |||||||||||||||||||||||||
|
Commodity derivatives: |
||||||||||||||||||||||||||||||||||
|
Derivative contracts – receipts |
- | - | - | - | - | - | - | |||||||||||||||||||||||||||
|
Derivative contracts – payments |
(11 | ) | - | - | - | - | - | (11 | ) | |||||||||||||||||||||||||
| (199 | ) | (5 | ) | (1 | ) | - | - | - | (205 | ) | (194 | ) | ||||||||||||||||||||||
|
Total |
(18,439 | ) | (2,257 | ) | (1,358 | ) | (1,591 | ) | (1,541 | ) | (5,947 | ) | (31,133 | ) | (28,334 | ) | ||||||||||||||||||
| 116 | Financial Statements | Annual Report on Form 20-F 2016 |
Table of Contents
16A. MANAGEMENT OF LIQUIDITY RISK CONTINUED
The following table shows cash flows for which cash flow hedge accounting is applied. The derivatives in the cash flow hedge relationships are expected to have an impact on profit and loss in the same periods as the cash flows occur.
| € million | € million | € million | € million | € million | € million | € million | € million | |||||||||||||||||||||||||
| Net | ||||||||||||||||||||||||||||||||
| Due | Due | Due | Due | carrying | ||||||||||||||||||||||||||||
| Due | between | between | between | between | Due | amount of | ||||||||||||||||||||||||||
| within | 1 and 2 | 2 and 3 | 3 and 4 | 4 and 5 | after | related | ||||||||||||||||||||||||||
| 1 year | years | years | years | years | 5 years | Total | derivatives | (a) | ||||||||||||||||||||||||
|
2016 |
||||||||||||||||||||||||||||||||
|
Foreign exchange cash inflows |
2,863 | - | - | - | - | - | 2,863 | |||||||||||||||||||||||||
|
Foreign exchange cash outflows |
(2,905 | ) | - | - | - | - | - | (2,905 | ) | (40 | ) | |||||||||||||||||||||
|
Interest rate cash flows |
4 | (6 | ) | - | - | - | - | (2 | ) | - | ||||||||||||||||||||||
|
Commodity contracts cash flows |
(3 | ) | - | - | - | - | - | (3 | ) | 18 | ||||||||||||||||||||||
|
2015 |
||||||||||||||||||||||||||||||||
|
Foreign exchange cash inflows |
2,884 | 6 | 348 | - | - | - | 3,238 | |||||||||||||||||||||||||
|
Foreign exchange cash outflows |
(2,883 | ) | - | (300 | ) | - | - | - | (3,183 | ) | 41 | |||||||||||||||||||||
|
Interest rate cash flows |
(2 | ) | (1 | ) | - | - | - | - | (3 | ) | (1 | ) | ||||||||||||||||||||
|
Commodity contracts cash flows |
(11 | ) | - | - | - | - | - | (11 | ) | (5 | ) | |||||||||||||||||||||
| (a) | See note 16C. |
16B. MANAGEMENT OF MARKET RISK
Unilever’s size and operations result in it being exposed to the following market risks that arise from its use of financial instruments:
| • | commodity price risk; |
| • | currency risk; and |
| • | interest rate risk. |
The above risks may affect the Group’s income and expenses, or the value of its financial instruments. The objective of the Group’s management of market risk is to maintain this risk within acceptable parameters, while optimising returns. Generally, the Group applies hedge accounting to manage the volatility in profit and loss arising from market risk.
The Group’s exposure to, and management of, these risks is explained below. It often includes derivative financial instruments, the uses of which are described in note 16C.
| POTENTIAL IMPACT OF RISK |
MANAGEMENT POLICY AND HEDGING STRATEGY
|
SENSITIVITY TO THE RISK | ||
|
(I) COMMODITY PRICE RISK The Group is exposed to the risk of changes in commodity prices in relation to its purchase of certain raw materials.
At 31 December 2016, the Group had hedged its exposure to future commodity purchases with commodity derivatives valued at € 441 million (2015: € 221 million). |
The Group uses commodity forward contracts to hedge against this risk. All commodity forward contracts hedge future purchases of raw materials and the contracts are settled either in cash or by physical delivery.
Commodity derivatives are generally designated as hedging instruments in cash flow hedge accounting relations. All commodity forward contracts are done in line with approvals from the Global Commodity Executive which is chaired by the Unilever Chief Supply Chain Officer (CSCO).
|
A 10% increase in commodity prices as at 31 December 2016 would have led to a € 46 million gain on the commodity derivatives in the cash flow hedge reserve (2015: € 22 million gain in the cash flow hedge reserve). A decrease of 10% in commodity prices on a full-year basis would have the equal but opposite effect. |
||
|
(II) CURRENCY RISK Currency risk on sales, purchases and borrowings Because of Unilever’s global reach, it is subject to the risk that changes in foreign currency values impact the Group’s sales, purchases and borrowings.
At 31 December 2016, the exposure to the Group from companies holding financial assets and liabilities other than in their functional currency amounted to € 76 million (2015: € 60 million). |
The Group manages currency exposures within prescribed limits, mainly through the use of forward foreign currency exchange contracts.
Operating companies manage foreign exchange exposures within prescribed limits. Local compliance is monitored centrally.
Exchange risks related to the principal amounts of the US$ and Swiss franc denominated debt either form part of hedging relationships themselves, or are hedged through forward contracts.
The aim of the Group’s approach to management of currency risk is to leave the Group with no material residual risk. This aim has been achieved in all years presented.
|
As an estimation of the approximate impact of the residual risk, with respect to financial instruments, the Group has calculated the impact of a 10% change in exchange rates.
Impact on income statement A 10% strengthening of the euro against key currencies to which the Group is exposed would have led to approximately an additional € 7 million gain in the income statement (2015: € 6 million gain). A 10% weakening of the euro against these currencies would have led to an equal but opposite effect. |
||
| Annual Report on Form 20-F 2016 | Financial Statements | 117 |
Table of Contents
NOTES TO THE CONSOLIDATED FINANCIAL STATEMENTS
UNILEVER GROUP CONTINUED
16B. MANAGEMENT OF MARKET RISK CONTINUED
| POTENTIAL IMPACT OF RISK |
MANAGEMENT POLICY AND HEDGING STRATEGY
|
SENSITIVITY TO THE RISK | ||
|
Currency risk on the Group’s net investments The Group is also subject to exchange risk in relation to the translation of the net investments of its foreign operations into euros for inclusion in its consolidated financial statements.
These net investments include Group financial loans, which are monetary items that form part of our net investment in foreign operations, of € 7.9 billion (2015: € 8.2 billion), of which € 3.5 billion (2015: € 4.1 billion) is denominated in GBP. In accordance with IAS 21, the exchange differences on these financial loans are booked through reserves.
Part of the currency exposure on the Group’s investments is also managed using US$ and Swiss franc net investment hedges with a nominal value of € 3.5 billion (2015: € 3.9 billion) for US$ and € (0.9) billion (2015: nil) for Swiss francs.
At 31 December 2016, the net exposure of the net investments in foreign currencies amounts to € 11.1 billion (2015: € 11.3 billion). |
Unilever aims to minimise this foreign investment exchange exposure by borrowing in local currency in the operating companies themselves. In some locations, however, the Group’s ability to do this is inhibited by local regulations, lack of local liquidity or by local market conditions.
Where the residual risk from these countries exceeds prescribed limits, Treasury may decide on a case-by-case basis to actively hedge the exposure. This is done either through additional borrowings in the related currency, or through the use of forward foreign exchange contracts.
Where local currency borrowings, or forward contracts, are used to hedge the currency risk in relation to the Group’s net investment in foreign subsidiaries, these relationships are designated as net investment hedges for accounting purposes. |
Impact on equity – trade-related cash flow hedges A 10% strengthening of the euro against other currencies would have led to a € 17 million (2015: € 22 million) loss (of which € 51 million (2015: € 40 million) loss would relate to strengthening against sterling) on hedges used to cover future trade cash flows to which cash flow hedge accounting is applied. A 10% weakening of the euro against other currencies would have led to a € 19 million (2015: € 24 million) gain (out of which € 56 million (2015: € 44 million) gain would relate to strengthening against sterling) on hedges used to cover future trade cash flows to which cash flow hedge accounting is applied.
Impact on equity – net investment hedges A 10% strengthening of the euro against other currencies would have led to a € 242 million (2015: € 352 million) loss on the net investment hedges used to manage the currency exposure on the Group’s investments. A 10% weakening of the euro against other currencies would have led to a € 295 million (2015: € 430 million) gain on the net investment hedges used to manage the currency exposure on the Group’s investments.
Impact on equity – net investments in group companies A 10% strengthening of the euro against all other currencies would have led to a € 1,008 million negative retranslation effect (2015: € 675 million negative retranslation effect). A 10% weakening of the euro against those currencies would have led to a € 1,232 million positive retranslation effect (2015: € 825 million positive retranslation effect). In line with accepted hedge accounting treatment and our accounting policy for financial loans, the retranslation differences would be recognised in equity.
|
||
|
(III) INTEREST RATE RISK (a) The Group is exposed to market interest rate fluctuations on its floating rate debt. Increases in benchmark interest rates could increase the interest cost of our floating-rate debt and increase the cost of future borrowings. The Group’s ability to manage interest costs also has an impact on reported results.
Taking into account the impact of interest rate swaps, at 31 December 2016, interest rates were fixed on approximately 81% of the expected net debt for 2017, and 71% for 2018 (70% for 2016 and 61% for 2017 at 31 December 2015).
For interest management purposes, transactions with a maturity shorter than six months from inception date are not included as fixed interest transactions.
The average interest rate on short-term borrowings in 2016 was 0.9% (2015: 0.9%).
|
Unilever’s interest rate management approach aims for an optimal balance between fixed and floating-rate interest rate exposures on expected net debt. The objective of this approach is to minimise annual interest costs after tax and to reduce volatility.
This is achieved either by issuing fixed or floating-rate long-term debt, or by modifying interest rate exposure through the use of interest rate swaps.
Furthermore, Unilever has interest rate swaps for which cash flow hedge accounting is applied. |
Assuming that all other variables remain constant, a 1.0 percentage point increase in floating interest rates on a full-year basis as at 31 December 2016 would have led to an additional € 11 million of finance costs (2015: € 21 million additional finance costs). A 1.0 percentage point decrease in floating interest rates on a full-year basis would have an equal but opposite effect.
Assuming that all other variables remain constant, a 1.0 percentage point increase in floating interest rates on a full-year basis as at 31 December 2016 would have led to an additional € 1 million debit in equity from derivatives in cash flow hedge relationships (2015: € 1 million credit). A 1.0 percentage point decrease in floating interest rates on a full-year basis would have led to an additional € 1 million credit in equity from derivatives in cash flow hedge relationships (2015: € 1 million debit). |
||
| (a) | See the weighted average amount of net debt with fixed rate interest shown in the following table. |
| 118 | Financial Statements | Annual Report on Form 20-F 2016 |
Table of Contents
16B. MANAGEMENT OF MARKET RISK CONTINUED
The following table shows the split in fixed and floating-rate interest exposures, taking into account the impact of interest rate swaps and cross-currency swaps:
|
€ million 2016 |
€ million 2015 |
|||||||
|
Cash and cash equivalents |
3,382 | 2,302 | ||||||
|
Current other financial assets |
599 | 836 | ||||||
|
Current financial liabilities |
(5,450 | ) | (4,789 | ) | ||||
|
Non-current financial liabilities |
(11,145 | ) | (9,854 | ) | ||||
|
Net debt |
(12,614 | ) | (11,505 | ) | ||||
|
Of which: |
||||||||
|
Fixed rate (weighted average amount of fixing for the following year) |
(11,539 | ) | (9,429 | ) | ||||
16C. DERIVATIVES AND HEDGING
The Group does not use derivative financial instruments for speculative purposes. The uses of derivatives and the related values of derivatives are summarised in the following table. Derivatives used to hedge:
| € million | € million | € million | € million | € million | € million | |||||||||||||||||||||||||||
| Trade | Non- | |||||||||||||||||||||||||||||||
| Trade | payables | Current | current | |||||||||||||||||||||||||||||
| and other | Financial | and other | financial | financial | ||||||||||||||||||||||||||||
| receivables | assets | liabilities | liabilities | liabilities | Total | |||||||||||||||||||||||||||
|
31 December 2016 |
||||||||||||||||||||||||||||||||
|
Foreign exchange derivatives including cross currency swaps |
||||||||||||||||||||||||||||||||
|
Fair value hedges |
- | - | - | - | - | - | ||||||||||||||||||||||||||
|
Cash flow hedges |
36 | - | (76) | - | - | (40 | ) | |||||||||||||||||||||||||
|
Hedges of net investments in foreign operations |
- | 174 | (a) | - | (27 | ) | - | 147 | ||||||||||||||||||||||||
|
Hedge accounting not applied |
79 | (133 | ) (a) | (67) | (134 | ) | - | (255 | ) | |||||||||||||||||||||||
|
Interest rate swaps |
||||||||||||||||||||||||||||||||
|
Fair value hedges |
- | 3 | - | - | - | 3 | ||||||||||||||||||||||||||
|
Cash flow hedges |
- | 4 | - | - | (4 | ) | - | |||||||||||||||||||||||||
|
Hedge accounting not applied |
- | 43 | - | (14 | ) | (6 | ) | 23 | ||||||||||||||||||||||||
|
Commodity contracts |
||||||||||||||||||||||||||||||||
|
Cash flow hedges |
21 | - | (3) | - | - | 18 | ||||||||||||||||||||||||||
|
Hedge accounting not applied |
(1) | - | - | - | - | (1 | ) | |||||||||||||||||||||||||
| 135 | 91 | (146) | (175 | ) | (10 | ) | (105 | ) | ||||||||||||||||||||||||
| Total assets | 226 | Total liabilities | (331 | ) | (105 | ) | ||||||||||||||||||||||||||
|
31 December 2015 |
||||||||||||||||||||||||||||||||
|
Foreign exchange derivatives including cross currency swaps |
||||||||||||||||||||||||||||||||
|
Fair value hedges |
- | 1 | - | - | - | 1 | ||||||||||||||||||||||||||
|
Cash flow hedges |
29 | 45 | (34) | - | - | 40 | ||||||||||||||||||||||||||
|
Hedges of net investments in foreign operations |
- | 155 | (a) | - | - | - | 155 | |||||||||||||||||||||||||
|
Hedge accounting not applied |
39 | 25 | (a) | (26) | (118 | ) | (5 | ) | (85 | ) | ||||||||||||||||||||||
|
Interest rate swaps |
||||||||||||||||||||||||||||||||
|
Fair value hedges |
- | - | - | - | - | - | ||||||||||||||||||||||||||
|
Cash flow hedges |
- | - | - | - | (1 | ) | (1 | ) | ||||||||||||||||||||||||
|
Hedge accounting not applied |
- | 4 | - | - | - | 4 | ||||||||||||||||||||||||||
|
Commodity contracts |
||||||||||||||||||||||||||||||||
|
Cash flow hedges |
5 | - | (10) | - | - | (5 | ) | |||||||||||||||||||||||||
|
Hedge accounting not applied |
- | - | - | - | - | - | ||||||||||||||||||||||||||
| 73 | 230 | (70) | (118 | ) | (6 | ) | 109 | |||||||||||||||||||||||||
| Total assets | 303 | Total liabilities | (194 | ) | 109 | |||||||||||||||||||||||||||
| (a) | Swaps that hedge the currency risk on intra-group loans and offset € 174 million (2015: € 155 million) within ‘Hedges of net investments in foreign operations’ are included within ‘Hedge accounting not applied’. |
| Annual Report on Form 20-F 2016 | Financial Statements | 119 |
Table of Contents
NOTES TO THE CONSOLIDATED FINANCIAL STATEMENTS
UNILEVER GROUP CONTINUED
16C. DERIVATIVES AND HEDGING CONTINUED
MASTER NETTING OR SIMILAR AGREEMENTS
A number of legal entities within our Group enter into derivative transactions under International Swap and Derivatives Association (ISDA) master netting agreements. In general, under such agreements the amounts owed by each counter-party on a single day in respect of all transactions outstanding in the same currency are aggregated into a single net amount that is payable by one party to the other. In certain circumstances, such as when a credit event such as a default occurs, all outstanding transactions under the agreement are terminated, the termination value is assessed and only a single net amount is payable in settlement of all transactions.
The ISDA agreements do not meet the criteria for offsetting the positive and negative values in the consolidated balance sheet. This is because the Group does not have any currently legally enforceable right to offset recognised amounts, between various Group and bank affiliates, because the right to offset is enforceable only on the occurrence of future credit events such as a default.
The column ‘Related amounts not set off in the balance sheet – Financial instruments’ shows the netting impact of our ISDA agreements, assuming the agreements are respected in the relevant jurisdiction.
(A) FINANCIAL ASSETS
The following financial assets are subject to offsetting, enforceable master netting arrangements and similar agreements.
| Related amounts not set | ||||||||||||||||||||||||
| off in the balance sheet | ||||||||||||||||||||||||
| € million | € million | € million | € million | € million | € million | |||||||||||||||||||
| Gross amounts of | ||||||||||||||||||||||||
| recognised | Net amounts of | |||||||||||||||||||||||
| Gross amounts | financial liabilities | financial assets | Cash | |||||||||||||||||||||
| of recognised | set off in the | presented in the | Financial | collateral | ||||||||||||||||||||
| As at 31 December 2016 | financial assets | balance sheet | balance sheet | instruments | received | Net amount | ||||||||||||||||||
|
Derivative financial assets |
400 | (174 | ) | 226 | (147 | ) | - | 79 | ||||||||||||||||
|
As at 31 December 2015 |
||||||||||||||||||||||||
|
Derivative financial assets |
458 | (155 | ) | 303 | (153 | ) | (30 | ) | 120 | |||||||||||||||
|
(B) FINANCIAL LIABILITIES The following financial liabilities are subject to offsetting, enforceable master netting arrangements and similar agreements.
|
||||||||||||||||||||||||
| Related amounts not set | ||||||||||||||||||||||||
| off in the balance sheet | ||||||||||||||||||||||||
| € million | € million | € million | € million | € million | € million | |||||||||||||||||||
| Gross amounts of | ||||||||||||||||||||||||
| recognised | Net amounts of | |||||||||||||||||||||||
| Gross amounts | financial liabilities | financial liabilities | Cash | |||||||||||||||||||||
| of recognised | set off in the | presented in the | Financial | collateral | ||||||||||||||||||||
| As at 31 December 2016 | financial liabilities | balance sheet | balance sheet | instruments | pledged | Net amount | ||||||||||||||||||
|
Derivative financial liabilities |
505 | (174 | ) | 331 | (147 | ) | - | 184 | ||||||||||||||||
|
As at 31 December 2015 |
||||||||||||||||||||||||
|
Derivative financial liabilities |
349 | (155 | ) | 194 | (153 | ) | - | 41 | ||||||||||||||||
17. INVESTMENT AND RETURN
CASH AND CASH EQUIVALENTS
Cash and cash equivalents in the balance sheet include deposits, investments in money market funds and highly liquid investments. To be classified as cash and cash equivalents, an asset must:
| • | be readily convertible into cash; |
| • | have an insignificant risk of changes in value; and |
| • | have a maturity period of three months or less at acquisition. |
Cash and cash equivalents in the cash flow statement also include bank overdrafts and are recorded at amortised cost.
OTHER FINANCIAL ASSETS
Other financial assets are first recognised on the trade date. At that point, they are classified as:
| • | held-to-maturity investments; |
| • | loans and receivables; |
| • | available-for-sale financial assets; or |
| • | financial assets at fair value through profit or loss. |
| 120 | Financial Statements | Annual Report on Form 20-F 2016 |
Table of Contents
17. INVESTMENT AND RETURN CONTINUED
(I) HELD-TO-MATURITY INVESTMENTS
These are assets with set cash flows and fixed maturities which Unilever intends to hold to maturity. They are held at cost plus interest using the effective interest method, less any impairment.
(II) LOANS AND RECEIVABLES
These are assets with an established payment profile and which are not listed on a recognised stock exchange. They are initially recognised at fair value, which is usually the original invoice amount plus any directly related transaction costs. Afterwards, loans and receivables are carried at amortised cost, less any impairment.
(III) AVAILABLE-FOR-SALE FINANCIAL ASSETS
Any financial assets not classified as either loans and receivables or financial assets at fair value through profit or loss or held-to-maturity investments are designated as available-for-sale. They are initially recognised at fair value, usually the original invoice amount plus any directly related transaction costs. Afterwards, they are measured at fair value with changes being recognised in equity. When the investment is sold or impaired, the accumulated gains and losses are moved from equity to the income statement. Interest and dividends from these assets are recognised in the income statement.
(IV) FINANCIAL ASSETS AT FAIR VALUE THROUGH PROFIT OR LOSS
These are derivatives and assets that are held for trading. Related transaction costs are expensed as incurred. Unless they form part of a hedging relationship, these assets are held at fair value, with changes being recognised in the income statement.
IMPAIRMENT OF FINANCIAL ASSETS
Each year, the Group assesses whether there is evidence that financial assets are impaired. A significant or prolonged fall in value below the cost of an asset generally indicates that an asset may be impaired. If impaired, financial assets are written down to their estimated recoverable amount. Impairment losses on assets classified as loans and receivables are recognised in profit and loss. When a later event causes the impairment losses to decrease, the reduction in impairment loss is also recognised in profit and loss. Impairment losses on assets classified as available-for-sale are recognised by moving the loss accumulated in equity to the income statement. Any subsequent recovery in value of an available-for-sale debt security is recognised within profit and loss. However, any subsequent recovery in value of an equity security is recognised within equity, and is recorded at amortised cost.
17A. FINANCIAL ASSETS
The Group’s Treasury function aims to protect the Group’s financial investments, while maximising returns. The fair value of financial assets is the same as the carrying amount for 2016 and 2015. The Group’s cash resources and other financial assets are shown below.
| € million | € million | € million | € million | € million | € million | |||||||||||||||||||
| Non- | Non- | |||||||||||||||||||||||
| Current | current | Total | Current | current | Total | |||||||||||||||||||
| Financial assets (a) | 2016 | 2016 | 2016 | 2015 | 2015 | 2015 | ||||||||||||||||||
|
Cash and cash equivalents |
||||||||||||||||||||||||
|
Cash at bank and in hand |
1,779 | – | 1,779 | 1,547 | – | 1,547 | ||||||||||||||||||
|
Short-term deposits with maturity of less than three months |
1,513 | – | 1,513 | 655 | – | 655 | ||||||||||||||||||
|
Other cash equivalents |
90 | – | 90 | 100 | – | 100 | ||||||||||||||||||
| 3,382 | – | 3,382 | 2,302 | – | 2,302 | |||||||||||||||||||
|
Other financial assets |
||||||||||||||||||||||||
|
Held-to-maturity investments |
43 | 99 | 142 | 38 | 106 | 144 | ||||||||||||||||||
|
Loans and receivables (b) |
208 | 190 | 398 | 269 | 34 | 303 | ||||||||||||||||||
|
Available-for-sale financial assets (c) |
126 | 383 | 509 | 179 | 462 | 641 | ||||||||||||||||||
|
Financial assets at fair value through profit or loss: |
||||||||||||||||||||||||
|
Derivatives |
91 | – | 91 | 230 | – | 230 | ||||||||||||||||||
|
Other |
131 | 1 | 132 | 120 | 3 | 123 | ||||||||||||||||||
| 599 | 673 | 1,272 | 836 | 605 | 1,441 | |||||||||||||||||||
|
Total |
3,981 | 673 | 4,654 | 3,138 | 605 | 3,743 | ||||||||||||||||||
| (a) | For the purposes of notes 15C and 17A, financial assets and liabilities exclude trade and other current receivables and trade payables and other liabilities which are covered in notes 13 and 14 respectively. |
| (b) | Current loans and receivables include short-term deposits with banks with maturities of longer than three months. |
| (c) | Current available-for-sale financial assets include government securities and A- or higher rated money and capital market instruments. Non-current available-for-sale financial assets predominantly consist of investments in a number of companies and financial institutions in Europe, India and the US, including € 79 million (2015: € 86 million) of assets in a trust to fund benefit obligations in the US (see also note 4B). |
| Annual Report on Form 20-F 2016 | Financial Statements | 121 |
Table of Contents
NOTES TO THE CONSOLIDATED FINANCIAL STATEMENTS
UNILEVER GROUP CONTINUED
17A. FINANCIAL ASSETS CONTINUED
| Cash and cash equivalents reconciliation to the cash flow statement |
€ million
2016 |
€
million
2015 |
||||||
|
Cash and cash equivalents per balance sheet |
3,382 | 2,302 | ||||||
|
Less: bank overdrafts |
(184 | ) | (174 | ) | ||||
|
Cash and cash equivalents per cash flow statement |
3,198 | 2,128 | ||||||
Approximately € 1.5 billion (or 43%) of the Group’s cash and cash equivalents are held in the parent and central finance companies, for maximum flexibility. These companies provide loans to our subsidiaries that are also funded through retained earnings and third party borrowings. We maintain access to global debt markets through an infrastructure of short and long-term debt programmes. We make use of plain vanilla derivatives, such as interest rate swaps and foreign exchange contracts, to help mitigate risks. More detail is provided in notes 16, 16A, 16B and 16C on pages 115 to 120.
The remaining € 1.9 billion (57%) of the Group’s cash and cash equivalents are held in foreign subsidiaries which repatriate distributable reserves on a regular basis. For most countries, this is done through dividends which are in some cases subject to withholding or distribution tax. This balance includes € 240 million (2015: € 284 million, 2014: € 452 million) of cash that is held in a few countries where we face cross-border foreign exchange controls and/or other legal restrictions that inhibit our ability to make these balances available for general use by the wider business. The cash will generally be invested or held in the relevant country and, given the other capital resources available to the Group, does not significantly affect the ability of the Group to meet its cash obligations.
17B. CREDIT RISK
Credit risk is the risk of financial loss to the Group if a customer or counter-party fails to meet its contractual obligations. Additional information in relation to credit risk on trade receivables is given in note 13. These risks are generally managed by local controllers. Credit risk related to the use of treasury instruments is managed on a Group basis. This risk arises from transactions with financial institutions involving cash and cash equivalents, deposits and derivative financial instruments. The maximum exposure to credit risk at the reporting date is the carrying value of each class of financial assets. To reduce this risk, Unilever has concentrated its main activities with a limited number of counter-parties which have secure credit ratings. Individual risk limits are set for each counter-party based on financial position, credit rating and past experience. Credit limits and concentration of exposures are actively monitored by the Group’s treasury department. Netting agreements are also put in place with Unilever’s principal counter-parties. In the case of a default, these arrangements would allow Unilever to net assets and liabilities across transactions with that counter-party. To further reduce the Group’s credit exposures on derivative financial instruments, Unilever has collateral agreements with Unilever’s principal counter-parties in relation to derivative financial instruments. Under these arrangements, counter-parties are required to deposit securities and/or cash as a collateral for their obligations in respect of derivative financial instruments. At 31 December 2016 the collateral held by Unilever under such arrangements amounted to € 3 million (2015: € 30 million), of which € nil (2015: € 30 million) was in cash, and € 3 million (2015: € nil) was in the form of bond securities. The non-cash collateral has not been recognised as an asset in the Group’s balance sheet.
Further details in relation to the Group’s exposure to credit risk are shown in note 13 and note 16A.
18. FINANCIAL INSTRUMENTS FAIR VALUE RISK
The Group is exposed to the risks of changes in fair value of its financial assets and liabilities. The following table summarises the fair values and carrying amounts of financial instruments.
| € million | € million | € million | € million | |||||||||||||
| Carrying | Carrying | |||||||||||||||
| Fair value | Fair value | amount | amount | |||||||||||||
| Fair values of financial assets and financial liabilities | 2016 | 2015 | 2016 | 2015 | ||||||||||||
|
Financial assets |
||||||||||||||||
|
Cash and cash equivalents |
3,382 | 2,302 | 3,382 | 2,302 | ||||||||||||
|
Held-to-maturity investments |
142 | 144 | 142 | 144 | ||||||||||||
|
Loans and receivables |
398 | 303 | 398 | 303 | ||||||||||||
|
Available-for-sale financial assets |
509 | 641 | 509 | 641 | ||||||||||||
|
Financial assets at fair value through profit or loss: |
||||||||||||||||
|
Derivatives |
91 | 230 | 91 | 230 | ||||||||||||
|
Other |
132 | 123 | 132 | 123 | ||||||||||||
| 4,654 | 3,743 | 4,654 | 3,743 | |||||||||||||
|
Financial liabilities |
||||||||||||||||
|
Preference shares |
(125 | ) | (132 | ) | (68 | ) | (68 | ) | ||||||||
|
Bank loans and overdrafts |
(1,147 | ) | (1,067 | ) | (1,146 | ) | (1,064 | ) | ||||||||
|
Bonds and other loans |
(15,844 | ) | (13,509 | ) | (15,053 | ) | (12,703 | ) | ||||||||
|
Finance lease creditors |
(165 | ) | (217 | ) | (143 | ) | (195 | ) | ||||||||
|
Derivatives |
(185 | ) | (124 | ) | (185 | ) | (124 | ) | ||||||||
|
Other financial liabilities |
- | (489 | ) | - | (489 | ) | ||||||||||
| (17,466 | ) | (15,538 | ) | (16,595 | ) | (14,643 | ) | |||||||||
| 122 | Financial Statements | Annual Report on Form 20-F 2016 |
Table of Contents
18. FINANCIAL INSTRUMENTS FAIR VALUE RISK CONTINUED
The fair value of trade receivables and payables is considered to be equal to the carrying amount of these items due to their short-term nature. The instruments that have a fair value that is different from the carrying amount are classified as Level 2 for both 2015 and 2016 with exception of preference shares which are classified as Level 1 for both years.
FAIR VALUE HIERARCHY
The fair values shown in notes 15C and 17A have been classified into three categories depending on the inputs used in the valuation technique. The categories used are as follows:
| • | Level 1: quoted prices for identical instruments; |
| • | Level 2: directly or indirectly observable market inputs, other than Level 1 inputs; and |
| • | Level 3: inputs which are not based on observable market data. |
For assets and liabilities which are carried at fair value, the classification of fair value calculations by category is summarised below:
| € million | € million | € million | € million | € million | € million | € million | € million | |||||||||||||||||||||||||||||
| Total fair | Total fair | |||||||||||||||||||||||||||||||||||
| Level 1 | Level 1 | Level 2 | Level 2 | Level 3 | Level 3 | value | value | |||||||||||||||||||||||||||||
| Notes | 2016 | 2015 | 2016 | 2015 | 2016 | 2015 | 2016 | 2015 | ||||||||||||||||||||||||||||
|
Assets at fair value |
||||||||||||||||||||||||||||||||||||
|
Other cash equivalents |
17A | - | - | 90 | 100 | - | - | 90 | 100 | |||||||||||||||||||||||||||
|
Available-for-sale financial assets |
17A | 138 | 14 | 98 | 180 | 273 | 447 | 509 | 641 | |||||||||||||||||||||||||||
|
Financial assets at fair value through profit or loss: |
||||||||||||||||||||||||||||||||||||
|
Derivatives (a) |
16C | - | - | 226 | 303 | - | - | 226 | 303 | |||||||||||||||||||||||||||
|
Other |
17A | - | 120 | 131 | - | 1 | 3 | 132 | 123 | |||||||||||||||||||||||||||
|
Liabilities at fair value |
||||||||||||||||||||||||||||||||||||
|
Derivatives (b) |
16C | - | - | (331 | ) | (194 | ) | - | - | (331 | ) | (194 | ) | |||||||||||||||||||||||
|
Contingent consideration |
21 | - | - | - | - | (380 | ) | (104 | ) | (594 | ) | (179 | ) | |||||||||||||||||||||||
| (a) | Includes € 135 million (2015: € 73 million) derivatives, reported within trade receivables, that hedge trading activities. |
| (b) | Includes € (146) million (2015: € (71) million) derivatives, reported within trade payables, that hedge trading activities. |
There were no significant changes in classification of fair value of financial assets and financial liabilities since 31 December 2015. There were also no significant movements between the fair value hierarchy classifications since 31 December 2015.
The impact in the 2016 income statement due to Level 3 instruments is a gain of € 94 million (2015: loss of € 45 million).
Reconciliation of Level 3 fair value measurements of financial assets is given below:
| Reconciliation of movements in Level 3 valuations |
€ million
2016 |
€
million
2015 |
||||||
|
1 January |
346 | 475 | ||||||
|
Gains and losses recognised in profit and loss |
94 | (45 | ) | |||||
|
Gains and losses recognised in other comprehensive income |
(12 | ) | 120 | |||||
|
Purchases and new issues |
(247 | ) | (91 | ) | ||||
|
Sales and settlements |
(187 | ) | (113 | ) | ||||
|
Transfers into Level 3 |
- | - | ||||||
|
Transfers out of Level 3 |
(100 | ) | - | |||||
|
31 December |
(106 | ) | 346 | |||||
SIGNIFICANT UNOBSERVABLE INPUTS USED IN LEVEL 3 FAIR VALUES
The largest asset valued using Level 3 techniques is a Split-Dollar Life Insurance of € 43 million (2015: € 41 million).
A change in one or more of the inputs to reasonably possible alternative assumptions would not change the value significantly.
During the year, an asset with a carrying value of € 62 million as at 31 December 2015 (2014: € 189 million, 2013: € 190 million) was de-recognised. The asset was previously valued using Level 3 techniques and related to an unlisted investment recognised as an available for sale financial asset. The asset was impaired in 2015 but due to unforeseen circumstances, in 2016, this impairment was reversed and the asset disposed for a total consideration of € 130 million. The 2016 profit or loss impact of the reversal of the previous impairment was a gain of € 63 million recognised within ‘other income/(loss) from non-current investments’. Interest income of € 5m was also recognised from this asset in 2016.
CALCULATION OF FAIR VALUES
The fair values of the financial assets and liabilities are defined as the price that would be received to sell an asset or paid to transfer a liability in an orderly transaction between market participants at the measurement date. Methods and assumptions used to estimate the fair values are consistent with those used in the year ended 31 December 2015.
| Annual Report on Form 20-F 2016 | Financial Statements | 123 |
Table of Contents
NOTES TO THE CONSOLIDATED FINANCIAL STATEMENTS
UNILEVER GROUP CONTINUED
18. FINANCIAL INSTRUMENTS FAIR VALUE RISK CONTINUED
ASSETS AND LIABILITIES CARRIED AT FAIR VALUE
| • | The fair values of quoted investments falling into Level 1 are based on current bid prices. |
| • | The fair values of unquoted available-for-sale financial assets are based on recent trades in liquid markets, observable market rates, discounted cash flow analysis and statistical modelling techniques such as the Monte Carlo simulation. If all significant inputs required to fair value an instrument are observable, the instrument is included in Level 2. If one or more of the significant inputs is not based on observable market data, the instrument is included in Level 3. |
| • | Derivatives are valued using valuation techniques with market observable inputs. The models incorporate various inputs including the credit quality of counter-parties, foreign exchange spot and forward rates, interest rate curves and forward rate curves of the underlying commodities. |
| • | For listed securities where the market is not liquid, and for unlisted securities, valuation techniques are used. These include the use of recent arm’s length transactions, reference to other instruments that are substantially the same and discounted cash flow calculations. |
OTHER FINANCIAL ASSETS AND LIABILITIES (FAIR VALUES FOR DISCLOSURE PURPOSES ONLY)
| • | Cash and cash equivalents, trade and other current receivables, bank loans and overdrafts, trade payables and other current liabilities have fair values that approximate to their carrying amounts due to their short-term nature. |
| • | The fair values of preference shares and listed bonds are based on their market value. |
| • | Non-listed bonds, other loans, bank loans and non-current receivables and payables are based on the net present value of the anticipated future cash flows associated with these instruments using rates currently available for debt on similar terms, credit risk and remaining maturities. |
| • | Fair values for finance lease creditors have been assessed by reference to current market rates for comparable leasing arrangements. |
POLICIES AND PROCESSES USED IN RELATION TO THE CALCULATION OF LEVEL 3 FAIR VALUES
Assets valued using Level 3 valuation techniques are primarily made up of long-term cash receivables and unlisted investments. Valuation techniques used are specific to the circumstances involved. Unlisted investments include € 172 million (2015: € 192 million) of investments within Unilever Ventures companies.
19. PROVISIONS
Provisions are recognised where a legal or constructive obligation exists at the balance sheet date, as a result of a past event, where the amount of the obligation can be reliably estimated and where the outflow of economic benefit is probable.
| € million | € million | |||||||||||||||||||
| Provisions | 2016 | 2015 | ||||||||||||||||||
|
Due within one year |
390 | 309 | ||||||||||||||||||
|
Due after one year |
1,033 | 831 | ||||||||||||||||||
|
Total provisions |
1,423 | 1,140 | ||||||||||||||||||
| € million | € million | € million | € million | € million | ||||||||||||||||
| Movements during 2016 | Restructuring | Legal |
Disputed
indirect taxes |
Other | Total | |||||||||||||||
|
1 January 2016 |
188 | 161 | 570 | 221 | 1,140 | |||||||||||||||
|
Income Statement: |
||||||||||||||||||||
|
Charges |
258 | 72 | 154 | 69 | 553 | |||||||||||||||
|
Releases |
(33 | ) | (51 | ) | (46 | ) | (41 | ) | (171 | ) | ||||||||||
|
Utilisation |
(116 | ) | (55 | ) | (38 | ) | (38 | ) | (247 | ) | ||||||||||
|
Currency translation |
(6 | ) | (2 | ) | 154 | 2 | 148 | |||||||||||||
|
31 December 2016 |
291 | 125 | 794 | 213 | 1,423 | |||||||||||||||
Restructuring provisions primarily include people costs such as redundancy costs and cost of compensation where manufacturing, distribution or selling agreements are to be terminated.
The Group is involved from time to time in legal and arbitration proceedings arising in the ordinary course of business. As previously disclosed, along with other consumer products companies and retail customers, Unilever is involved in a number of ongoing investigations by national competition authorities. These proceedings and investigations are at various stages and concern a variety of product markets. Where specific issues arise, provisions are made to the extent appropriate.
Unilever expects the issues relating to these restructuring, legal and other provisions to be substantively resolved within five years.
The provision for disputed indirect taxes is primarily comprised of disputes with Brazilian authorities, in particular relating to tax credits that can be taken for the PIS and COFINS indirect taxes in Brazil. Due to the nature of these disputes, the timing of any utilisation in relation to these provisions is uncertain.
| 124 | Financial Statements | Annual Report on Form 20-F 2016 |
Table of Contents
20. COMMITMENTS AND CONTINGENT LIABILITIES
Leases are classified as finance leases whenever the terms of the lease transfer substantially all the risks and rewards of ownership. All other leases are classified as operating leases.
Assets held under finance leases are initially recognised at the lower of fair value at the date of commencement of the lease and the present value of the minimum lease payments. Subsequent to initial recognition, these assets are accounted for in accordance with the accounting policy relating to that specific asset. The corresponding liability is included in the balance sheet as a finance lease obligation. Lease payments are apportioned between finance costs in the income statement and reduction of the lease obligation so as to achieve a constant rate of interest on the remaining balance of the liability.
Lease payments under operating leases are charged to the income statement on a straight-line basis over the term of the lease.
Contingent liabilities are either possible obligations that will probably not require a transfer of economic benefits, or present obligations that may, but probably will not, require a transfer of economic benefits. It is not appropriate to make provisions for contingent liabilities, but there is a chance that they will result in an obligation in the future. Contingent liabilities are disclosed at the risk adjusted best estimate of the amount that would be required to settle the liability as at the balance sheet date. Where a risk weighting is not available, the maximum exposure is reported.
| € million | € million | € million | € million | € million | € million | |||||||||||||||||||
| Long-term finance lease commitments |
Future
minimum lease payments 2016 |
Finance Cost 2016 |
Present value 2016 |
Future
minimum lease payments 2015 |
Finance cost 2015 |
Present value 2015 |
||||||||||||||||||
|
Buildings (a) |
202 | 75 | 127 | 284 | 105 | 179 | ||||||||||||||||||
|
Plant and machinery |
18 | 2 | 16 | 18 | 2 | 16 | ||||||||||||||||||
| 220 | 77 | 143 | 302 | 107 | 195 | |||||||||||||||||||
|
The commitments fall due as follows: |
||||||||||||||||||||||||
|
Within 1 year |
24 | 15 | 9 | 51 | 14 | 37 | ||||||||||||||||||
|
Later than 1 year but not later than 5 years |
69 | 28 | 41 | 85 | 37 | 48 | ||||||||||||||||||
|
Later than 5 years |
127 | 34 | 93 | 166 | 56 | 110 | ||||||||||||||||||
| 220 | 77 | 143 | 302 | 107 | 195 | |||||||||||||||||||
|
(a) All leased land is classified as operating leases.
The table below shows the net book value of property, plant and equipment under a number of finance lease agreements.
|
||||||||||||||||||||||||
| € million | € million | € million | ||||||||||||||||||||||
| Net book value | Buildings |
Plant and
equipment |
Total | |||||||||||||||||||||
|
Cost |
211 | 134 | 345 | |||||||||||||||||||||
|
Accumulated depreciation |
|
(79 | ) | (115 | ) | (194 | ) | |||||||||||||||||
|
31 December 2016 |
132 | 19 | 151 | |||||||||||||||||||||
|
Cost |
239 | 154 | 393 | |||||||||||||||||||||
|
Accumulated depreciation |
|
(82 | ) | (133 | ) | (215 | ) | |||||||||||||||||
|
31 December 2015 |
157 | 21 | 178 | |||||||||||||||||||||
|
The Group has sublet part of the leased properties under finance
leases. Future minimum sublease payments of
€
31 million (2015:
€
41 million) are
|
||||||||||||||||||||||||
| € million | € million | |||||||||||||||||||||||
| Long-term operating lease commitments | 2016 | 2015 | ||||||||||||||||||||||
|
Land and buildings |
2,149 | 2,024 | ||||||||||||||||||||||
|
Plant and machinery |
692 | 430 | ||||||||||||||||||||||
| 2,841 | 2,454 | |||||||||||||||||||||||
| € million | € million | € million | € million | |||||||||||||||||||||
| Operating lease and other commitments fall due as follows: |
Operating leases 2016 |
Operating leases 2015 |
Other
commitments 2016 |
Other
commitments 2015 |
||||||||||||||||||||
|
Within 1 year |
457 | 410 | 1,204 | 919 | ||||||||||||||||||||
|
Later than 1 year but not later than 5 years |
|
1,393 | 1,187 | 1,231 | 830 | |||||||||||||||||||
|
Later than 5 years |
991 | 857 | 30 | 35 | ||||||||||||||||||||
| 2,841 | 2,454 | 2,465 | 1,784 | |||||||||||||||||||||
The Group has sublet part of the leased properties under operating leases. Future minimum sublease payments of € 17 million (2015: € 5 million) are expected to be received.
Other commitments principally comprise commitments under contracts to purchase materials and services. They do not include commitments to purchase property, plant and equipment, which are reported in note 10 on page 106.
| Annual Report on Form 20-F 2016 | Financial Statements | 125 |
Table of Contents
NOTES TO THE CONSOLIDATED FINANCIAL STATEMENTS
UNILEVER GROUP CONTINUED
20. COMMITMENTS AND CONTINGENT LIABILITIES CONTINUED
CONTINGENT LIABILITIES
Contingent liabilities are possible obligations that are not probable. They arise in respect of litigation against Group companies, investigations by competition, regulatory and fiscal authorities and obligations arising under environmental legislation. In many markets, there is a high degree of complexity involved in the local tax regimes. The majority of contingent liabilities are in respect of fiscal matters.
Assessing the amount of liabilities that are not probable is highly judgemental. Our best estimate of contingent liabilities at 31 December 2016 was € 2,360 million (2015: € 1,310 million), the largest of which relates to the local corporate reorganisation in 2001 explained further below. There has been no material change in our total contingent liability exposure since 2015. However, in prior years the contingent liabilities in respect of fiscal matters were disclosed on a tax assessment basis whereas in 2016 the basis has been extended to include unassessed years.
During 2004, and in common with many other businesses operating in Brazil, one of our Brazilian subsidiaries received a notice of infringement from the Federal Revenue Service in respect of indirect taxes. The notice alleges that a 2001 reorganisation of our local corporate structure was undertaken without valid business purpose. The 2001 reorganisation was comparable with restructurings done by many companies in Brazil. The original dispute was resolved in the courts in the Group’s favour. However, in 2013 a new assessment was raised in respect of a similar matter. Additionally, during the course of 2014 another notice of infringement was issued based on the same grounds argued in the previous assessments. The total amount of the tax assessments in respect of this matter is € 1,464 million. The judicial process in Brazil is likely to take a number of years to conclude.
During 2006, Unilever filed a judicial measure to obtain the right to exclude the Brazilian ICMS indirect tax from the taxable base for the Brazilian PIS and COFINS indirect taxes, and obtained a favourable decision in 2007. In November 2016, this favourable decision was reversed on appeal to a higher court. The Group intends to appeal this decision. The total amount of the tax assessments in respect of this matter is € 655 million.
The Group believes that the likelihood that the tax authorities will ultimately prevail is low, however there can be no guarantee of success in court. In each case we believe our position is strong so they have not been provided for and are considered to be contingent liabilities.
21. ACQUISITIONS AND DISPOSALS
Business combinations are accounted for using the acquisition accounting method as at the acquisition date, which is the date at which control is transferred to the Group.
Goodwill is measured at the acquisition date as the fair value of consideration transferred, plus non-controlling interests and the fair value of any previously-held equity interests less the net recognised amount (which is generally fair value) of the identifiable assets and liabilities assumed. Goodwill is subject to an annual review for impairment (or more frequently if necessary) in accordance with our accounting policies. Any impairment is charged to the income statement as it arises.
Contingent consideration is measured at fair value with changes being recognised in the income statement. All other deferred consideration is held at amortised cost. Consideration transferred does not include amounts related to settlement of pre-existing relationships. Such amounts are generally recognised in net profit.
Transaction costs are expensed as incurred, other than those incurred in relation to the issue of debt or equity securities.
Changes in ownership that do not result in a change of control are accounted for as equity transactions and therefore do not have any impact on goodwill. The difference between consideration and the non-controlling share of net assets acquired is recognised within equity.
| 126 | Financial Statements | Annual Report on Form 20-F 2016 |
Table of Contents
21. ACQUISITIONS AND DISPOSALS CONTINUED
2016
In 2016, the Group completed the following business acquisitions and disposals as listed below. Total consideration for 2016 acquisitions is € 2,069 million (2015: € 2,011 million for acquisitions completed during that year). More information related to the 2016 acquisitions is given on page 22.
|
DEAL COMPLETION DATE
|
ACQUIRED/DISPOSED BUSINESS |
|
|
31 March 2016
|
Sold the bread and bakery business under the brand ‘Modern’ in India to Nimman Foods Private Limited, part of the Everstone Group.
|
|
|
7 April 2016
|
Acquired Indulekha and Vayodha brands from Mosons Group.
|
|
|
6 May 2016
|
Sold local Alberto Culver brands Antiall, Farmaco, Veritas, the rights for VO5 in Argentina and a manufacturing plant to Santiago Saenz.
|
|
|
31 July 2016
|
Sold the Rice Exports business in India to LT Foods Middle East DMCC, a Group company of LT Foods Limited.
|
|
|
10 August 2016
|
Acquired Dollar Shave Club, a subscription-based direct-to-consumer male grooming business.
|
|
|
20 October 2016
|
Acquired Seventh Generation, a North American home and personal care eco-friendly naturals business.
|
|
|
1 December 2016
|
Acquired Blueair, a supplier of innovative mobile indoor air purification technologies and solutions.
|
|
On 1 June 2016 the Group announced that it had signed an agreement with Coca-Cola FEMSA and The Coca-Cola Company to sell the AdeS soy beverage business in Latin America for an aggregate amount of US$575 million. Subject to regulatory approval, the transaction is expected to complete during the first quarter of 2017.
On 16 December 2016 the Group announced that it had signed an agreement to purchase Living Proof Inc., an innovative premium hair care business. The transaction completed on 1 February 2017 after receiving regulatory approval. Due to the proximity of deal completion to the issuance of the financial statements, no valuation work has commenced and no provisional numbers have been disclosed in the notes to the consolidated financial statements.
EFFECT ON CONSOLIDATED INCOME STATEMENT
Since the acquisition dates the 2016 acquisitions above have contributed € 149 million to Group revenue and € 21 million loss to Group operating profit.
If all the above acquisitions had taken place at the beginning of the year, Group revenue would have been € 53,127 million and Group operating profit would have been € 7,807 million.
2015
In 2015, the Group completed the following business acquisitions listed below. The acquisition accounting has been finalised and subsequent changes to the provisional numbers published last year were immaterial.
|
DEAL COMPLETION DATE
|
ACQUIRED BUSINESS |
|
|
1 May 2015
|
Acquired REN Skincare, a prestige Personal Care business with an iconic British skin care brand.
|
|
|
1 May 2015
|
Camay and Zest brands acquired from The Procter & Gamble Company. In addition a manufacturing site was acquired.
|
|
|
6 May 2015
|
Acquired Kate Somerville Skincare, a prestige Personal Care business with a leading independent skin care brand.
|
|
|
1 August 2015
|
Acquired Dermalogica, a prestige Personal Care business with the leading skin care brand in professional salons and spas. The assets acquired were principally the Dermalogica brand.
|
|
|
1 September 2015
|
Murad, the leading clinical skin care brand, part of our prestige Personal Care business.
|
|
|
30 September 2015
|
Acquired Grom, a premium Italian gelato business.
|
|
| Annual Report on Form 20-F 2016 | Financial Statements | 127 |
Table of Contents
NOTES TO THE CONSOLIDATED FINANCIAL STATEMENTS
UNILEVER GROUP CONTINUED
21. ACQUISITIONS AND DISPOSALS CONTINUED
EFFECT ON CONSOLIDATED BALANCE SHEET
The following table sets out the effect of the acquisitions in 2016, 2015 and 2014 on the consolidated balance sheet. The fair values currently established for all acquisitions made in 2016 are provisional. Detailed information relating to goodwill is given in note 9 on pages 104 to 106.
| € million | € million | € million | ||||||||||
| Acquisitions | 2016 | 2015 | 2014 | |||||||||
|
Net assets acquired |
929 | 999 | 240 | |||||||||
|
Goodwill arising in subsidiaries |
1,140 | 1,012 | 184 | |||||||||
|
Total consideration |
2,069 | 2,011 | 424 | |||||||||
In 2016 the net assets acquired and total consideration consist of:
| € million | ||||
| 2016 | ||||
|
Intangible assets |
1,147 | |||
|
Other non-current assets |
115 | |||
|
Trade and other receivables |
44 | |||
|
Other current assets |
122 | |||
|
Non-current liabilities |
(398 | ) | ||
|
Current liabilities |
(101 | ) | ||
|
Net assets acquired |
929 | |||
|
Cash consideration |
1,640 | |||
|
Deferred consideration |
429 | |||
|
Total consideration |
2,069 | |||
|
Goodwill |
1,140 | |||
No contingent liabilities were acquired in the acquisitions described above.
Deferred consideration includes future payments which are contingent on acquired businesses achieving or exceeding contractually agreed financial targets within a predetermined timescale. These payments fall due up until 2021 with the maximum possible total payment of € 1,950 million. A financial liability representing the best estimate of the Group’s future cash outflows is recognised in other current liabilities and other non-current liabilities on the balance sheet. This is initially recorded at fair-value and revalued at each reporting date with movements in fair value taken to the income statement.
At 31 December 2016, the balance held in deferred consideration for acquisitions is € 594 million (2015: € 179 million), of which contingent consideration is € 380 million (2015: € 104 million).
Goodwill represents the future value which the Group believes it will obtain through operational synergies and the application of acquired company ideas to existing Unilever channels and businesses.
The table below shows the impact of all disposals during the year on the Group. The results of disposed businesses are included in the consolidated financial statements up to their date of disposal:
| € million | € million | € million | ||||||||||
| Disposals | 2016 | 2015 | 2014 | |||||||||
|
Goodwill and intangible assets |
85 | 47 | 229 | |||||||||
|
Other non-current assets |
29 | 2 | 106 | |||||||||
|
Current assets |
5 | 23 | 50 | |||||||||
|
Trade creditors and other payables |
- | (2 | ) | (5 | ) | |||||||
|
Net assets sold |
119 | 70 | 380 | |||||||||
|
(Gain)/loss on recycling of currency retranslation on disposal |
- | - | (76 | ) | ||||||||
|
Profit/(loss) on sale attributable to Unilever |
(95 | ) | (9 | ) | 1,392 | |||||||
|
Consideration |
24 | 61 | 1,696 | |||||||||
|
Cash |
16 | 62 | 1,727 | |||||||||
|
Cash balances of businesses sold |
8 | (1 | ) | (4 | ) | |||||||
|
Non-cash items and deferred consideration |
- | - | (27 | ) | ||||||||
| 24 | 61 | 1,696 | ||||||||||
| 128 | Financial Statements | Annual Report on Form 20-F 2016 |
Table of Contents
22. ASSETS AND LIABILITIES HELD FOR SALE
Non-current assets and groups of assets and liabilities which comprise disposal groups are classified as ‘held for sale’ when all of the following criteria are met: a decision has been made to sell; the assets are available for sale immediately; the assets are being actively marketed; and a sale has been agreed or is expected to be concluded within 12 months of the balance sheet date.
Immediately prior to classification as held for sale, the assets or groups of assets are remeasured in accordance with the Group’s accounting policies. Subsequently, assets and disposal groups classified as held for sale are valued at the lower of book value or fair value less disposal costs. Assets held for sale are not depreciated.
|
€ million
2016 |
€
million
2015 |
|||||||
|
Groups of assets held for sale (a) |
||||||||
|
Goodwill and intangibles |
98 | 43 | ||||||
|
Property, plant and equipment |
46 | 73 | ||||||
|
Inventories |
34 | 35 | ||||||
|
Trade and other receivables |
1 | 3 | ||||||
|
Other |
5 | 5 | ||||||
| 184 | 159 | |||||||
|
Non-current assets held for sale |
||||||||
|
Property, plant and equipment |
22 | 20 | ||||||
|
Liabilities held for sale |
||||||||
|
Liabilities associated with assets held for sale |
1 | 6 | ||||||
| (a) | Groups of assets held for sale are primarily assets of the AdeS soy beverage business in Latin America. Refer to note 21 on pages 126 to 128. |
23. RELATED PARTY TRANSACTIONS
A related party is a person or entity that is related to the Group. These include both people and entities that have, or are subject to, the influence or control of the Group.
The following related party balances existed with associate or joint venture businesses at 31 December:
| Related party balances |
€ million
2016 |
€
million
2015 |
||||||
|
Trading and other balances due from joint ventures |
115 | 116 | ||||||
|
Trading and other balances due from/(to) associates |
- | - | ||||||
JOINT VENTURES
Sales by Unilever group companies to Unilever Jerónimo Martins and Pepsi Lipton joint ventures were € 118 million and € 69 million in 2016 (2015: € 121 million and € 69 million) respectively. Sales from Unilever Jerónimo Martins and from Pepsi Lipton joint ventures to Unilever group companies were € 66 million and € 51 million in 2016 (2015: € 46 million and € 51 million) respectively. Balances owed by/(to) Unilever Jerónimo Martins and Pepsi Lipton joint ventures at 31 December 2016 were € 119 million and € (4) million (2015: € 121 million and € (5) million) respectively.
ASSOCIATES
Langholm Capital Partners invests in private European companies with above-average longer-term growth prospects.
Langholm Capital II was launched in 2009. Unilever has invested € 57 million in Langholm Capital II, with an outstanding commitment at the end of 2016 of € 18 million (2015: € 20 million).
| Annual Report on Form 20-F 2016 | Financial Statements | 129 |
Table of Contents
NOTES TO THE CONSOLIDATED FINANCIAL STATEMENTS
UNILEVER GROUP CONTINUED
24. 2014 PURCHASE OF ESTATE SHARES CONVERTIBLE TO UNILEVER PLC SHARES IN 2038
The first Viscount Leverhulme was the founder of the company which became Unilever PLC. When he died in 1925, he left in his will a large number of PLC shares in various trusts. When the will trusts were varied in 1983, the interests of the beneficiaries of his will were also preserved. Four classes of special shares were created in Margarine Union (1930) Limited, a subsidiary of PLC.
One of these classes of shares (‘Estate shares’) has rights that enable it to be converted at the end of the year 2038 to 70,875,000 Unilever PLC ordinary shares. Before this date, these shares have no rights to dividends nor do they allow early conversion. There are 20,000 Estate shares with a nominal value of £0.01 each.
On 19 May 2014, Unilever PLC purchased all of the Estate shares for a cash consideration of £715 million plus transaction costs. The resulting loss of € 880 million, being the difference between the nominal value and the amount paid, was recorded in retained earnings. Unilever does not intend to re-sell these shares.
25. REMUNERATION OF AUDITORS
This note includes all amounts paid to the Group’s auditors, whether in relation to their audit of the Group or otherwise.
During the year the Group (including its subsidiaries) obtained the following services from the Group auditors and its associates:
|
€ million
2016 |
€
million
2015 |
€
million
2014 |
||||||||||
|
Fees payable to the Group’s auditors for the audit of the consolidated and parent company accounts of Unilever N.V. and Unilever PLC (a) |
4 | 5 | 5 | |||||||||
|
Fees payable to the Group’s auditors for the audit of accounts of subsidiaries of Unilever N.V. and Unilever PLC pursuant to legislation (b) |
10 | 9 | 9 | |||||||||
|
Total statutory audit fees (c) |
14 | 14 | 14 | |||||||||
|
Audit-related assurance services |
– | (d) | – | (d) | – | (d) | ||||||
|
Other taxation advisory services |
– | (d) | – | (d) | – | (d) | ||||||
|
Services relating to corporate finance transactions |
– | – | – | |||||||||
|
Other assurance services |
– | (d) | – | (d) | – | (d) | ||||||
|
All other non-audit services |
– | (d) | – | (d) | – | (d) | ||||||
| (a) | Of which € 1 million was payable to KPMG Accountants N.V. (2015: € 1 million; 2014: € 1 million) and € 3 million was payable to KPMG LLP (2015: € 4 million; 2014: € 4 million). |
| (b) | Comprises fees payable to the KPMG network of independent member firms affiliated with KPMG International Cooperative for audit work on statutory financial statements and Group reporting returns of subsidiary companies. |
| (c) | Amount payable to KPMG in respect of services supplied to associated pension schemes was less than € 1 million individually and in aggregate (2015: less than € 1 million individually and in aggregate; 2014: less than € 1 million individually and in aggregate). |
| (d) | Amounts paid in relation to each type of service are individually less than € 1 million. In aggregate the fees paid were € 1 million (2015: € 1 million; 2014: less than € 1 million). |
26. EVENTS AFTER THE BALANCE SHEET DATE
Where events occurring after the balance sheet date provide evidence of conditions that existed at the end of the reporting period, the impact of these events is adjusted within the financial statements. Otherwise, events after the balance sheet date of a material size or nature are disclosed below.
On 26 January 2017 Unilever announced a quarterly dividend with the 2016 fourth quarter results of € 0.3201 per NV ordinary share and £0.2768 per PLC ordinary share.
On 1 February 2017 the Group completed the acquisition of Living Proof Inc.
| 130 | Financial Statements | Annual Report on Form 20-F 2016 |
Table of Contents
27. GROUP COMPANIES
AS AT 31 DECEMBER 2016
In accordance with section 409 of the Companies Act 2006 a list of subsidiaries, partnerships, associates, and joint ventures as at 31 December 2016 is set out below. All subsidiary undertakings are subsidiary undertakings of their immediate parent undertaking(s) pursuant to section 1162 (2) (a) of the Companies Act 2006 unless otherwise indicated – see the notes on page 143. All subsidiary undertakings not included in the consolidation are not included because they are not material for such purposes. All associated undertakings are included in the Unilever Group’s financial statements using the equity method of accounting unless otherwise indicated – see the notes on page 143.
Principal group companies are identified in bold . These companies are incorporated and principally operate in the countries under which they are shown.
The aggregate percentage of capital held by the Group is shown in the first column, except where it is 100%.
SUBSIDIARY UNDERTAKINGS INCLUDED IN THE CONSOLIDATION
|
%
|
Country of
|
Name of Undertaking
|
% holding as between NV/PLC
|
Class of share held in subsidiary undertaking
|
Registered address
|
|||||
| 72.50 | Algeria | Unilever Algérie SPA | NV 72.50 | DZD1,000.00 Ordinary | Zone Industrielle Hassi Ameur Oran 31000 | |||||
| Argentina | Alimentos de Soja S.A.U. | NV 64.55 PLC 35.45 | ARA1.00 Ordinary | Tucumán 1, Piso 4°, Cdad. de Buenos Aires | ||||||
| Argentina | Arisco S.A. | NV 64.55 PLC 35.45 | ARA1.00 Ordinary | Tucumán 1, Piso 4°, Cdad. de Buenos Aires | ||||||
| Argentina | Helket S.A. | NV 64.55 PLC 35.45 | ARA1.00 Ordinary | Mendoza km 7/8 – Pocitos, San Juan | ||||||
| 98 | Argentina | S.A.G.R.A. S.A. | NV 63.26 PLC 34.74 | ARA1.00 Ordinary | Tucumán 1, Piso 4°, Cdad. de Buenos Aires | |||||
| Argentina | Unilever de Argentina S.A. | NV 64.55 PLC 35.45 | ARA1.00 Ordinary | Tucumán 1, Piso 4°, Cdad. de Buenos Aires | ||||||
| Australia | Ben & Jerry’s Franchising Australia Limited | PLC 100 | AUD1.00 Ordinary | Level 17, 2-26 Park Street, Sydney, NSW 2000 | ||||||
| Australia | Dermalogica Holdings Pty Limited | PLC 100 | AUD1.00 Ordinary | 111 Chandos Street, Crows Nest, NSW 2065 | ||||||
| Australia | Dermalogica Pty Limited | PLC 100 | AUD2.00 Ordinary | 111 Chandos Street, Crows Nest, NSW 2065 | ||||||
| Australia | DSC Australia Pty Limited | NV 55.40 PLC 44.60 | AUD1.00 Ordinary | DLA Piper Australia, Level 38, 201 Elizabeth Street, Sydney, NSW 2000 | ||||||
| Australia | Tea Too Pty Limited | PLC 100 | AUD1.00 Ordinary | Level 17, 2-26 Park Street, Sydney, NSW 2000 | ||||||
| Australia | TIGI Australia Pty Limited | PLC 100 | AUD1.00 Ordinary-A | Level 17, 2-26 Park Street, Sydney, NSW 2000 | ||||||
| PLC 100 | AUD1.00 Ordinary-B | |||||||||
| Australia | Unilever Australia (Holdings) Pty Limited | PLC 100 | AUD1.00 Ordinary | Level 17, 2-26 Park Street, Sydney, NSW 2000 | ||||||
| Australia | Unilever Australia Group Partnership | PLC 100 | Partnership Interest | Level 17, 2-26 Park Street, Sydney, NSW 2000 | ||||||
| Australia | Unilever Australia Group Pty Limited | PLC 100 | AUD2.00 Ordinary | Level 17, 2-26 Park Street, Sydney, NSW 2000 | ||||||
| Australia | Unilever Australia Limited | PLC 100 | AUD1.00 Ordinary | Level 17, 2-26 Park Street, Sydney, NSW 2000 | ||||||
| Australia | Unilever Australia Supply Services Limited | PLC 100 | AUD1.00 Ordinary | Level 17, 2-26 Park Street, Sydney, NSW 2000 | ||||||
| Australia | Unilever Australia Trading Limited | PLC 100 | AUD1.00 Ordinary | Level 17, 2-26 Park Street, Sydney, NSW 2000 | ||||||
| Austria | Delico Handels GmbH | NV 100 | EUR36,337.00 Ordinary | Stella-Klein-Löw Weg 13, 1023 Wien | ||||||
| Austria | Kuner Nahrungsmittel GmbH | NV 100 | EUR36,336.00 Ordinary | Stella-Klein-Löw Weg 13, 1023 Wien | ||||||
| Austria | Intuiskin GmbH | NV 100 | EUR35,000.00 Ordinary | Seilerstätte 13, 1010, Wien | ||||||
| Austria | TIGI Handels GmbH | NV 100 | EUR36,336.00 Ordinary | Stella-Klein-Löw Weg 13, 1023 Wien | ||||||
| Austria | ULPC Handels GmbH | NV 100 | EUR218,019.00 Ordinary | Stella-Klein-Löw Weg 13, 1023 Wien | ||||||
| Austria | Unilever Austria GmbH | NV 100 | EUR10,000,000.00 Ordinary | Stella-Klein-Löw Weg 13, 1023 Wien | ||||||
| Austria | Unilever BCS Austria GmbH | NV 55.40 PLC 44.60 | EUR35,000.00 Ordinary | Stella-Klein-Löw Weg 13, 1023 Wien | ||||||
| 60.75 | Bangladesh | Unilever Bangladesh Limited | NV 0 PLC 60.75 | BDT100.00 Ordinary | 51 Kalurghat Heavy Industrial Area, Kalurghat, Chittagong | |||||
| Belgium | Intuiskin SPRL | NV 100 | EUR185.50 Ordinary | Rond-Point Schuman, 6 Box 5, 1040 Ettebeek | ||||||
| Belgium | Unilever BCS Belgium NV/SA | NV 55.40 PLC 44.60 | No Par Value Ordinary | Humaniteitslaan 292, 1190 Brussels | ||||||
| Belgium | Unilever Belgium NV/SA | NV 100 | No Par Value Ordinary | Humaniteitslaan 292, 1190 Brussels | ||||||
| Belgium | Unilever Belgium Services SA/NV | NV 100 | No Par Value Ordinary | Humaniteitslaan 292, 1190 Brussels | ||||||
| Belgium | Unilever Lipton Tea NV/SA | NV 100 | EUR1.00 Ordinary | Humaniteitslaan 292, 1190 Brussels | ||||||
| Bolivia | Unilever Andina Bolivia S.A. | NV 100 | BOB10.00 Ordinary | Av. Blanco Galindo Km. 10.4 Cochabamba | ||||||
| Brazil | Alberto Culver Participacoes Limitada | NV 55.40 PLC 44.60 | BRL1.00 Quotas |
Rua Líbero Badaró, 293 – 27° Floor – Suite 27D, Room 18 – São Paulo/SP |
||||||
| Brazil |
Alberto-Culver do Brasil Cosmeticos Limitada |
NV 55.40 PLC 44.60 | BRL1.00 Quotas | Rua Caio Prado, 267 – Room 13, São Paulo/SP | ||||||
| Brazil | Euphoria Ice Cream Comercio de Alimentos Limitada | NV 64.55 PLC 35.45 | BRL1.00 Quotas |
São Paulo, Estado de São Paulo, na Rua Pedroso Alvarenga, 1046, sala 147, Itaim Bibi, CEP 04531-004 |
||||||
| Brazil |
Cicanorte Industria de Conservas Alimenticas S.A. |
NV 64.55 PLC 35.45 | BRL2.80 Ordinary | Rod. BR 101-Norte, s/n, km. 43,6 – Room 4, Igarassu /PE | ||||||
| Brazil |
RGG – Comércio E Representações De Produtos De Higiene Pessoal Limitada |
NV 64.55 PLC 35.45 | BRL1.00 Quotas |
Av. Presidente Juscelino Kubitschek, 1.309 –13° floor – Room 19 – São Paulo/SP |
||||||
| Brazil |
Sorvete Escola Comercio de Alimentos Limitada |
NV 64.55 PLC 35.45 | BRL1.00 Quotas | Rua Pedroso Alvarenga, 1046, Suit 146, Itaim Bibi, Sao Paulo | ||||||
| Brazil |
UB 4 – Comércio de Produtos de Limpeza Limitada |
NV 64.55 PLC 35.45 | BRL1.00 Quotas |
Av. Presidente Juscelino Kubitschek, 1.309 –13° floor – Room 29 – São Paulo/SP |
||||||
| Brazil |
UBA 2 – Comércio e Representação de Alimentos Limitada |
NV 64.55 PLC 35.45 | BRL1.00 Quotas |
Av. Presidente Juscelino Kubitschek, 1.309 –13° floor – Room 21 – São Paulo/SP |
||||||
| Brazil | UBI 2 – Comercio de Alimentos Limitada | NV 64.55 PLC 35.45 | BRL1.00 Quotas |
Av. Presidente Juscelino Kubitschek, 1.309 –13° floor – Room 24 – São Paulo/SP |
||||||
| Brazil | UBI 4 – Comércio de Alimentos Limitada | NV 64.55 PLC 35.45 | BRL1.00 Quotas |
Av. Presidente Juscelino Kubitschek, 1.309 –13° floor – Room 28 – São Paulo/SP |
||||||
| Brazil | Unilever Brasil Gelados do Nordeste S.A. | NV 64.55 PLC 35.45 | No Par Value Ordinary – A | Rod. BR 232, s/n, km. 13 – Jaboatão dos Guararapes/PE | ||||||
| NV 64.55 PLC 35.45 | No Par Value Ordinary – B | |||||||||
| Brazil | Unilever Brasil Gelados Limitada | NV 64.55 PLC 35.45 | BRL1.00 Quotas | Av. Presidente Juscelino Kubitschek, 1.309 –13° floor – Room 23 | ||||||
| Brazil | Unilever Brasil Industrial Limitada | NV 64.55 PLC 35.45 | BRL1.00 Quotas | Av. Presidente Juscelino Kubitschek, 1.309 –13° floor – Room 4 | ||||||
| Brazil | Unilever Brasil Limitada | NV 64.55 PLC 35.45 | BRL1.00 Quotas |
Av. Presidente Juscelino Kubitschek, 1.309 –12° floor – Room 23, part of 13° floor and 14° floor – São Paulo/SP |
||||||
| 50 | Brazil | UP! Alimentos Limitada | NV 32.28 PLC 17.72 | BRL1.00 Quotas | Av. Escola Politécnica, 760, 2° Floor – Room 6 – São Paulo/SP | |||||
| 99 | Brazil | Veritas do Brazil Limitada | NV 63.90 PLC 35.10 | BRL1.00 Quotas | Av. Marechal Floriano, 19 – Room 1001 Part – Rio de Janeiro/RJ | |||||
| Bulgaria | Unilever BCS Bulgaria EOOD | NV 55.40 PLC 44.60 | BGN1,000.00 Ordinary | City of Sofia, Borough Mladost, 1, Business Park, Building 3, Floor 1 | ||||||
| Annual Report on Form 20-F 2016 | Financial Statements | 131 |
Table of Contents
NOTES TO THE CONSOLIDATED FINANCIAL STATEMENTS
UNILEVER GROUP CONTINUED
27. GROUP COMPANIES CONTINUED
|
%
|
Country of
|
Name of Undertaking
|
% holding as between NV/PLC
|
Class of share held in subsidiary undertaking
|
Registered address
|
|||||
| Bulgaria | Unilever Bulgaria EOOD | NV 100 | BGN1,000.00 Ordinary | City of Sofia, Borough Mladost, 1, Business Park, Building 3, Floor 1 | ||||||
| Cambodia | Unilever (Cambodia) Limited | NV 100 | KHR20,000.00 Ordinary | No. 443A Street 105, Sangkat Boeung Pralit, Khan 7 Makara Phnom Penh Capital | ||||||
| Canada | Dermalogica Canada Limited | PLC 100 | No Par Value Class A | 3081, 3rd Avenue, Whitehorse, Yukon Territory, Y1A 4Z7 | ||||||
| Common | ||||||||||
| Canada | DSC Canada, Inc | NV 55.40 PLC 44.60 | CAD0.01 Common | P.O. Box 49130, 2900 – 595 Burrard Street, Vancouver BC V7X 1J5 | ||||||
| Canada | Rexdale Property Inc. | NV 55.40 PLC 44.60 | No Par Value Common | 195 Belfield Road, Rexdale, Toronto, Ontario M9W 1G9 | ||||||
| Canada | Seventh Generation Family & Home ULC | NV 55.40 PLC 44.60 | No Par Value Common | 800-885 West Georgia Street, Vancouver BC V6C 3H1 | ||||||
| Canada | Unilever BCS Canada Inc. | NV 55.40 PLC 44.60 | No Par Value Common | 195 Belfield Road, Rexdale, Toronto, Ontario M9W 1G9 | ||||||
| Canada | 4012208 Canada Inc. | NV 64.54 PLC 35.46 | No Par Value Common | 1000 rue de la Gauchetière Ouest, Bureau 2500, Montreal H3B 0A2 | ||||||
| Canada | Unilever Canada Inc. | NV 64.54 PLC 35.46 | No Par Value Class A | 160 Bloor Street East, Suite 1400, Toronto ON M4W 3R2 | ||||||
| NV 64.54 PLC 35.46 | No Par Value Class B | |||||||||
| PLC 100 | No Par Value Class C | |||||||||
| NV 64.54 PLC 35.46 | No Par Value Class II | |||||||||
| Common | ||||||||||
| NV 64.54 PLC 35.46 | No Par Value Class III | |||||||||
| Common | ||||||||||
| Chile | Unilever Chile Limitada | NV 64.55 PLC 35.45 | Membership Interest | Av. Carrascal N°3351, Quinta Normal, Santiago | ||||||
| Chile | Unilever Chile SCC Limitada | NV 64.55 PLC 35.45 | Membership Interest | Av. Carrascal N°3351, Quinta Normal, Santiago | ||||||
| China | Blueair Shanghai Sales Co. Limited | NV 100 | RMB1,000,000 | Noreste de la Terminal de Contenedores Mariel, aproximadamente 1.6 km, en el Municipio Mariel, Provincia Artemisa | ||||||
| 67.71 | China | Ningbo Qinyuan Marketing Services Co. | NV 67.71 PLC 0 | CNY1.00 Ordinary | 298, Seaside Avenue, Hangzhou Bay New Zone | |||||
| Limited | ||||||||||
| 67.71 | China | Ningbo Qinyuan Water Equipment Co. | NV 67.71 PLC 0 | CNY1.00 Ordinary | 358, Ci Yi Road, Hangzhou Bay New Zone | |||||
| Limited | ||||||||||
| 67.71 | China | Qinyuan Group Co. Limited | NV 67.71 PLC 0 | CNY1.00 Ordinary | Seaside Avenue, Cixi Econimce and Technical Development Zone (Hangzhou Bay New Zone) | |||||
| 67.71 | China | Shanghai Qinyuan Environment Protection | NV 67.71 PLC 0 | CNY1.00 Ordinary | Room 23, Hall 5, No. 38, Lane 168, Xing Fu Li Road, Fenjing Town, | |||||
| Technology Co. Limited | Jinsham District, Shanghai 201100 | |||||||||
| China | Unilever (China) Investing Company Limited | NV 100 | USD1.00 Ordinary | No.33 North Fuquan Road, Shanghai, 200335, | ||||||
| China | Unilever (China) Limited | NV 100 | USD1.00 Ordinary | 88 Jinxiu Avenue, Hefei Economic and Technology Development | ||||||
| Zone, Hefei, 230601 | ||||||||||
| China | Unilever (Tianjin) Company Limited | NV 100 | USD1.00 Ordinary | Jingyi Road and Weiliu Road, Tianjin Airport Economic Area, Tianjin | ||||||
| China | Unilever Foods (China) Co. Limited | NV 100 | USD1.00 Ordinary | 1068 Ting Wei Road, Jinshanzui Industrial Region, Jinshan District, Shanghai | ||||||
| China | Unilever Services (Hefei) Co. Limited | NV 100 | CNY1.00 Ordinary | 88 Jinxiu Avenue, Hefei Economic and Technology Development Zone, Hefei, 230601 | ||||||
| China | Unilever (Sichuan) Company Limited | NV 100 | USD1.00 Ordinary | No. 1 Unilever Avenue, Pengshan Country, Sichuan Province 610016 | ||||||
| China | Walls (China) Co. Limited | NV 100 | USD1.00 Ordinary | No.16 Wanyuan Road, Beijing E&T Development, Beijing 100076 | ||||||
| 67.71 | China | Zhejiang Qinyuan Water Treatment | NV 67.71 PLC 0 | CNY1.00 Ordinary | 358, Ci Yi Road, Hangzhou Bay New Zone | |||||
| Technology Co. Limited | ||||||||||
| Colombia | Unilever Colombia SCC S.A.S. | NV 100 | COP100.00 Ordinary | Av. El Dorado, No. 69B-45. Bogota Corporate Center Piso 7, Bogotá | ||||||
| Colombia | Unilever Andina Colombia Limitada | NV 100 | COP100.00 Ordinary | Av. El Dorado, No. 69B-45. Bogota Corporate Center Piso 7, Bogotá | ||||||
| Costa Rica | Unilever de Centroamerica S.A. | NV 100 | CRC1.00 Ordinary | La Asunción de Belén, Planta Industrial Lizano, Autopista Bernardo Soto | ||||||
| Costa Rica | Unilever Costa Rica SCC S.A. | NV 100 | CRC1000.00 Ordinary | Provincia de Heredia, Cantón Belén, Distrito de la Asunción, | ||||||
| de la intersección Cariari- Belén, 400 Mts. Oeste, 800 Mts., al Norte | ||||||||||
| 89.98 | Cote D’Ivoire | Unilever-Cote D’Ivoire | NV 0 PLC 89.98 | XOF5,000.00 Ordinary | 01 BP 1751 Abidjan 01, Boulevard de Vridi | |||||
| Cote D’Ivoire | Unilever Afrique de l’Ouest | PLC 100 | CFA 10,000.00 Ordinary | Abidjan-Marcory, Boulevard Valery Giscard d’Estaing, | ||||||
| Immeuble Plein Ciel, Business Center, 26 BP 1377, Abidjan 26 | ||||||||||
| Croatia | Unilever Hrvatska d.o.o. | NV 100 | HRK1.00 Ordinary | Strojarska cesta 20, 10000 Zagreb | ||||||
| 84 | Cyprus | Unilever Tseriotis Cyprus Limited | NV 0 PLC 84 | EUR1.00 Ordinary | Head Offices, 195C Old Road Nicosia Limassol, CY-2540 Idalion | |||||
| Industrial Zone – Nicosia | ||||||||||
| Czech | Unilever BCS ČR, spol. s r.o. | NV 55.40 PLC 44.60 | CZK100,000.00 Ordinary | Rohanské nábřeží 670/17, Karlín, Praha 8, 186 00 | ||||||
| Republic | ||||||||||
| Czech | Unilever ČR, spol. s r.o. | PLC 100 | CZK210,000.00 Ordinary | Rohanské nábřeží 670/17, Karlín, Praha 8, 186 00 | ||||||
| Republic | ||||||||||
| Denmark | Unilever BCS Danmark A/S | NV 55.40 PLC 44.60 | DKK1,000.00 Ordinary | Ørestads Boulevard 73, 2300 København S | ||||||
| Denmark | Unilever Danmark A/S | NV 100 | DKK1,000.00 Ordinary | Ørestads Boulevard 73, 2300 København S | ||||||
| Denmark | Unilever Production ApS | NV 100 | DKK100.00 Ordinary | Petersmindevej 30, 5000 Odense C | ||||||
| 73.64 | Denmark | Froosh ApS | NV 0 PLC 73.64 | DKK1,000.00 Ordinary | Lindgreens Alle 12, 3 Sal, 2300 København S | |||||
| Dominican | Unilever Caribe, S.A. | NV 100 | DOP1,000.00 Ordinary | Ave. Winston Churchill, Torre Acrópolis Piso 17, Santo Domingo | ||||||
| Republic | ||||||||||
| Ecuador | Unilever Andina Ecuador S.A. | NV 100 | USD1.00 Ordinary | Km 25 Vía a Daule, Guayaquil | ||||||
| Egypt | Fine Tea Co (SAE) | PLC 100 | EGP2.00 Ordinary | Bourg El-Arab City, Alexandria | ||||||
| Egypt | Unilever Mashreq – Foods (SAE) | PLC 100 | EGP20.00 Ordinary | Bourg El-Arab City, Alexandria | ||||||
| Egypt | Unilever Mashreq – Home Care (SAE) | PLC 100 | EGP2.00 Ordinary | 6th of October City, 4th Industrial Zone, Piece Number 68, Giza | ||||||
| Egypt | Unilever Mashreq International Company | PLC 100 | USD1000.00 Ordinary | 14th May Bridge, Ezbet Hegazy, Alexandria | ||||||
| 60 | Egypt | Unilever Mashreq Trading LLC | NV 0 PLC 60 | EGP10.00 Ordinary | Industrial Zone – 14th May Bridge, Smouha, Alexandria | |||||
| Egypt | Unilever Mashreq – Personal Care (SAE) | PLC 100 | EGP10.00 Ordinary | 6th of October City, 4th Industrial Zone, Piece Number 68, Giza | ||||||
| Egypt | Unilever Mashreq – Tea (SAE) | PLC 100 | EGP100.00 Ordinary | Bourg El-Arab City, 1st Industrial Zone, Block 11, Piece Number 5, | ||||||
| Alexandria | ||||||||||
| El Salvador | Unilever El Salvador SCC S.A. de C.V. | NV 100 | USD1.00 Ordinary | Boulevard del Ejercito Nacional, Km. 3 1/2, San Salvador | ||||||
| El Salvador | Unilever de Centro America S.A. | NV 100 | USD100.00 Ordinary | Boulevard del Ejercito Nacional, Km. 3 1/2, San Salvador | ||||||
| England | Accantia Group Holdings | NV 5.61 PLC 94.39 | GBP0.01 Ordinary | Unilever House, 100 Victoria Embankment, London, EC4Y 0DY | ||||||
| and Wales | (unlimited company) | |||||||||
| England | Alberto-Culver (Europe) Limited | NV 55.40 PLC 44.60 | GBP1.00 Ordinary | Unilever House, 100 Victoria Embankment, London, EC4Y 0DY | ||||||
| and Wales | ||||||||||
| 132 | Financial Statements | Annual Report on Form 20-F 2016 |
Table of Contents
27. GROUP COMPANIES CONTINUED
|
%
|
Country of
|
Name of Undertaking
|
% holding as between NV/PLC
|
Class of share held in subsidiary undertaking
|
Registered address
|
|||||
| England and Wales | Alberto-Culver Company (U.K.) Limited | NV 5.61 PLC 94.39 | GBP1.00 Ordinary | Unilever House, Springfield Drive, Leatherhead, KT22 7GR | ||||||
| England and Wales | Alberto-Culver Group Limited | NV 55.40 PLC 44.60 | GBP1.00 Ordinary | Unilever House, 100 Victoria Embankment, London, EC4Y 0DY | ||||||
| England and Wales | Alberto-Culver UK Holdings Limited | NV 55.40 PLC 44.60 | GBP1.00 Ordinary | Unilever House, 100 Victoria Embankment, London, EC4Y 0DY | ||||||
| England and | Alberto-Culver UK Products Limited | NV 55.40 PLC 44.60 | GBP1.00 Ordinary | Unilever House, 100 Victoria Embankment, London, EC4Y 0DY | ||||||
| Wales | NV 55.40 PLC 44.60 |
GBP5.00 Preference |
||||||||
| England and Wales | Associated Enterprises Limited° | PLC 100 | GBP1.00 Ordinary | Unilever House, 100 Victoria Embankment, London, EC4Y 0DY | ||||||
| England and Wales | BBG Investments (France) Limited | PLC 100 | GBP1.00 Ordinary | Unilever House, 100 Victoria Embankment, London, EC4Y 0DY | ||||||
| England and Wales | Brooke Bond Assam Estates Limited | PLC 100 | GBP1.00 Ordinary | Unilever House, 100 Victoria Embankment, London, EC4Y 0DY | ||||||
| England and Wales | Brooke Bond Group Limited° | PLC 100 | GBP0.25 Ordinary | Unilever House, 100 Victoria Embankment, London, EC4Y 0DY | ||||||
| England and | Brooke Bond South India Estates Limited° | PLC 100 | GBP1.00 Ordinary | Unilever House, 100 Victoria Embankment, London, EC4Y 0DY | ||||||
| Wales | PLC 100 | GBP1.00 Redeemable Preference | ||||||||
| England and Wales | CPC (UK) Pension Trust Limited | PLC 100 | Limited by Guarantee | Unilever House, 100 Victoria Embankment, London, EC4Y 0DY | ||||||
| England and Wales | Dermalogica (UK) Limited | PLC 100 | GBP1.00 Ordinary | The Manser Building, Thorncroft Manor, Thorncroft Drive, Dorking, KT22 8JB | ||||||
| England and Wales | Intuiskin Limited | NV 100 | GBP1.00 Ordinary | 16 Great Queen Street, Covent Garden, London, WC2B 5AH | ||||||
| England and | Margarine Union (1930) Limited° | PLC 100 | GBP0.01 Estate | Unilever House, 100 Victoria Embankment, London, EC4Y 0DY | ||||||
| Wales | PLC 100 | GBP1.00 Ordinary | ||||||||
| PLC 100 | GBP1.00 Viscountcy | |||||||||
| England and Wales | MBUK Trading Limited | PLC 100 | GBP1.00 Ordinary | Unilever House, 100 Victoria Embankment, London, EC4Y 0DY | ||||||
| England and Wales | Mixhold Investments Limited | PLC 100 | GBP1.00 Ordinary | Unilever House, 100 Victoria Embankment, London, EC4Y 0DY | ||||||
| England and Wales | Murad Europe Limited | PLC 100 | GBP1.00 Ordinary | Unilever House, 100 Victoria Embankment, London, EC4Y 0DY | ||||||
| England and Wales | Ren Limited | PLC 100 | GBP1.00 Ordinary | 1st Floor, 16 Charles II Street, London, SW1Y 4QU | ||||||
| England and Wales | Ren Skincare Limited | PLC 100 | GBP1.00 Ordinary | The Edison, 223 – 231 Old Marylebone Road, London, NW1 5QT | ||||||
| England and Wales | T2 Tea (UK) Limited | PLC 100 | GBP1.00 Ordinary | Unilever House, 100 Victoria Embankment, London, EC4Y 0DY | ||||||
| England and Wales | TIGI Holdings Limited | PLC 100 | GBP1.00 Ordinary | Unilever House, 100 Victoria Embankment, London, EC4Y 0DY | ||||||
| England and Wales | TIGI International Limited | PLC 100 | GBP1.00 Ordinary | Unilever House, Springfield Drive, Leatherhead, KT22 7GR | ||||||
| England and Wales | TIGI Limited | PLC 100 | GBP1.00 Ordinary | Unilever House, 100 Victoria Embankment, London, EC4Y 0DY | ||||||
| England and Wales | Toni & Guy Products Limited° | PLC 100 | GBP0.001 Ordinary | Unilever House, 100 Victoria Embankment, London, EC4Y 0DY | ||||||
| England and Wales | UAC International Limited | PLC 100 | GBP1.00 Ordinary | Unilever House, 100 Victoria Embankment, London, EC4Y 0DY | ||||||
| England and Wales | UML Limited | PLC 100 | GBP1.00 Ordinary | Unilever House, 100 Victoria Embankment, London, EC4Y 0DY | ||||||
| England and Wales | Unidis Forty Nine Limited | PLC 100 | GBP1.00 Ordinary | Unilever House, 100 Victoria Embankment, London, EC4Y 0DY | ||||||
| England and | Unilever Australia Investments Limited | PLC 100 | AUD10.00 Ordinary-A | Unilever House, 100 Victoria Embankment, London, EC4Y 0DY | ||||||
| Wales | PLC 100 | GBP1.00 Ordinary | ||||||||
| England and | Unilever Australia Partnership Limited | PLC 100 | AUD10.00 Ordinary-A | Unilever House, 100 Victoria Embankment, London, EC4Y 0DY | ||||||
| Wales | PLC 100 | GBP1.00 Ordinary | ||||||||
| England and | Unilever Australia Services Limited | PLC 100 | AUD10.00 Ordinary-A | Unilever House, 100 Victoria Embankment, London, EC4Y 0DY | ||||||
| Wales | PLC 100 | GBP1.00 Ordinary | ||||||||
| England and Wales | Unilever BCS Limited | NV 55.40 PLC 44.60 | GBP1.00 Ordinary | Unilever House, 100 Victoria Embankment, London, EC4Y 0DY | ||||||
| England and | Unilever BCS UK Limited° | NV 55.40 PLC 44.60 | GBP1.00 Ordinary | Unilever House, 100 Victoria Embankment, London, EC4Y 0DY | ||||||
| Wales | PLC 100 |
GBP1.00 Redeemable Golden Share |
||||||||
| England and Wales | Unilever BCS UK Services Limited° | NV 55.40 PLC 44.60 PLC 100 |
GBP1.00 Ordinary GBP1.00 Redeemable Golden Share |
Unilever House, 100 Victoria Embankment, London, EC4Y 0DY | ||||||
| England and Wales | Unilever Company for Industrial Development Limited | PLC 100 | GBP1.00 Ordinary | Unilever House, 100 Victoria Embankment, London, EC4Y 0DY | ||||||
| England and Wales | Unilever Company for Regional Marketing and Research Limited | PLC 100 | GBP1.00 Ordinary | Unilever House, 100 Victoria Embankment, London, EC4Y 0DY | ||||||
| England and Wales | Unilever Corporate Holdings Limited° | PLC 100 | GBP1.00 Ordinary | Unilever House, 100 Victoria Embankment, London, EC4Y 0DY | ||||||
| England and Wales | Unilever Employee Benefit Trustees Limited | PLC 100 | GBP1.00 Ordinary | Unilever House, 100 Victoria Embankment, London, EC4Y 0DY | ||||||
| England and Wales | Unilever General Partner (Colworth Park) Limited | PLC 100 | GBP1.00 Ordinary | Unilever House, 100 Victoria Embankment, London, EC4Y 0DY | ||||||
| Annual Report on Form 20-F 2016 | Financial Statements | 133 |
Table of Contents
NOTES TO THE CONSOLIDATED FINANCIAL STATEMENTS
UNILEVER GROUP CONTINUED
27. GROUP COMPANIES CONTINUED
|
%
|
Country of
|
Name of Undertaking
|
% holding as between NV/PLC
|
Class of share held in subsidiary undertaking
|
Registered address
|
|||||
| England | Unilever Innovations Limited | PLC 100 | GBP1.00 Deferred | Unilever House, 100 Victoria Embankment, London, EC4Y 0DY | ||||||
| and Wales | PLC 100 | GBP0.10 Ordinary | ||||||||
| England and Wales | Unilever Overseas Holdings Limited° | PLC 100 | GBP1.00 Ordinary | Unilever House, 100 Victoria Embankment, London, EC4Y 0DY | ||||||
| England | Unilever Pension Trust Limited | PLC 100 | GBP1.00 Ordinary | Unilever House, Springfield Drive, Leatherhead, KT22 7GR | ||||||
| and Wales | ||||||||||
| England and Wales | Unilever Superannuation Trustees Limited | PLC 100 | GBP1.00 Ordinary | Unilever House, 100 Victoria Embankment, London, EC4Y 0DY | ||||||
| England and Wales | Unilever U.K. Central Resources Limited | PLC 100 | GBP1.00 Ordinary | Unilever House, 100 Victoria Embankment, London, EC4Y 0DY | ||||||
| England and Wales | Unilever U.K. Holdings Limited° | PLC 100 | GBP1.00 Ordinary | Unilever House, 100 Victoria Embankment, London, EC4Y 0DY | ||||||
| England | Unilever UK & CN Holdings Limited | PLC 100 | GBP10.00 Class A | Unilever House, 100 Victoria Embankment, London, EC4Y 0DY | ||||||
| and Wales | Redeemable Preference | |||||||||
| PLC 100 | GBP10.00 Class B | |||||||||
| Redeemable Preference | ||||||||||
| PLC 100 | GBP1.00 Ordinary-A | |||||||||
| PLC 100 | GBP1.00 Ordinary-B | |||||||||
| England | Unilever UK Group Limited | NV 49.86 PLC 50.14 | GBP1.00 Ordinary-A | Unilever House, 100 Victoria Embankment, London, EC4Y 0DY | ||||||
| and Wales | NV 1.67 PLC 98.33 | GBP1.00 Ordinary-B | ||||||||
| NV 5.61 PLC 94.39 | GBP1.00 Ordinary-C | |||||||||
| England and Wales | Unilever UK Limited | NV 5.61 PLC 94.39 | GBP1.00 Ordinary | Unilever House, Springfield Drive, Leatherhead, KT22 7GR | ||||||
| England and Wales | Unilever UK Pension Fund Trustees Limited | PLC 100 | GBP1.00 Ordinary | Unilever House, Springfield Drive, Leatherhead, KT22 7GR | ||||||
| England and Wales | Unilever US Investments Limited° | PLC 100 | GBP1.00 Ordinary | Unilever House, 100 Victoria Embankment, London, EC4Y 0DY | ||||||
| 86.25 | England and Wales | Unilever Ventures III Limited Partnership | NV 57.50 PLC 28.75 | Partnership Interest | 1st Floor, 16 Charles II Street, London, SW1Y 4QU | |||||
| England and Wales | Unilever Ventures Limited | PLC 100 | GBP1.00 Ordinary | Unilever House, 100 Victoria Embankment, London, EC4Y 0DY | ||||||
| England | United Holdings Limited° | PLC 100 | GBP1.00 Ordinary | Unilever House, 100 Victoria Embankment, London, EC4Y 0DY | ||||||
| and Wales | NV 99.67 PLC 0.33 | GBP500.00 Preferred | ||||||||
| England and Wales | USF Nominees Limited | PLC 100 | GBP1.00 Ordinary | Unilever House, Springfield Drive, Leatherhead, KT22 7GR | ||||||
| Estonia | Unilever Eesti AS | NV 100 | EUR6.30 Ordinary | Kalmistu tee 28a, Tallinna linn, Harju maakond, 11216 | ||||||
| Ethiopia | Unilever Manufacturing PLC | PLC 100 | ETB1,000.00 Ordinary | Bole Sub City, Kebele 03/05, Lidiya Building, Addis Ababa | ||||||
| Finland | Unilever Finland Oy | NV 100 | EUR16.82 Ordinary | Post Box 254, 00101 Helsinki | ||||||
| Finland | Unilever Ingman Production Oy | NV 100 | EUR1.00 Ordinary | Post Box 254, 00101 Helsinki | ||||||
| Finland | Unilever Spreads Finland Oy | NV 55.40 PLC 44.60 | EUR1,250.00 Ordinary | Roineentie 10, 00510 Helsinki | ||||||
| 73.64 | Finland | Froosh OY | NV 0 PLC 73.64 | EUR25.00 Ordinary | Energiataku 3, 00180 Helsinki | |||||
| 99.99 | France | Alsa France S.A.S. | NV 64.54 PLC 35.45 | No Par Value Ordinary | 20, rue des Deux Gares, 92500, Ruiel-Malmaison | |||||
| 99.99 | France | Amora Maille Societe Industrielle S.A.S. | NV 64.54 PLC 35.45 | No Par Value Ordinary | ZI de la Norge – Chevigny Saint-Sauveur, 21800 Quetigny | |||||
| 99.99 | France | Bestfoods France Industries S.A.S. | NV 64.54 PLC 35.45 | No Par Value Ordinary | 20, rue des Deux Gares, 92500, Rueil-Malmaison | |||||
| 99.99 | France | Cogesal-Miko S.A.S. | NV 64.54 PLC 35.45 | No Par Value Ordinary | 20, rue des Deux Gares, 92500, Rueil-Malmaison | |||||
| 99.99 | France | Fralib Sourcing Unit S.A.S. | NV 64.54 PLC 35.45 | No Par Value Ordinary | 20, rue des Deux Gares, 92500, Rueil-Malmaison | |||||
| France | Grom France S.a.r.l | NV 100 | EUR10,000.00 Ordinary | 81 Rue De Seine, 75006 Paris | ||||||
| France | Intuiskin S.A.S. | NV 100 | EUR1.00 Ordinary | Parc activillage des Fontaines 38926 Crolles Cedex | ||||||
| France | Pégase S.A.S. | NV 64.54 PLC 35.45 | EUR50.00 Ordinary | 6 rue des Frères Caudron, 78 140 Velizy Villacoublay | ||||||
| 99.99 | France | Relai D’or Centrale S.A.S | NV 64.54 PLC 35.45 | No Par Value Ordinary | 7, rue Armand Peugeot 92500 Rueil-Malmaison | |||||
| 99.99 | France | Saphir S.A.S. | NV 64.54 PLC 35.45 | EUR1.00 Ordinary | 20, rue des Deux Gares, 92500, Rueil-Malmaison | |||||
| 99.99 | France | Sfejer S.A.S. | NV 64.54 PLC 35.45 | No Par Value Ordinary | 20, rue des Deux Gares, 92500, Rueil-Malmaison | |||||
| 99.99 | France | Tigi Services France S.A.S. | NV 64.54 PLC 35.45 | No Par Value Ordinary | 20, rue des Deux Gares, 92500, Rueil-Malmaison | |||||
| France | Unilever BCS France S.A.S. | NV 55.40 PLC 44.60 | No Par Value Ordinary | 20, rue des Deux Gares, 92500, Rueil-Malmaison | ||||||
| 99.99 | France | Unilever France S.A.S. | NV 64.54 PLC 35.45 | No Par Value Ordinary | 20, rue des Deux Gares, 92500, Rueil-Malmaison | |||||
| 99.99 | France | Unilever France Holdings S.A.S. | NV 64.54 PLC 35.45 | EUR1.00 Ordinary | 20, rue des Deux Gares, 92500, Rueil-Malmaison | |||||
| 99.99 | France | Unilever France HPC Industries S.A.S. | NV 64.54 PLC 35.45 | EUR1.00 Ordinary | 20, rue des Deux Gares, 92500, Rueil-Malmaison | |||||
| 99.99 | France | Unilever Retail Organization France | NV 64.54 PLC 35.45 | No Par Value Ordinary | 20, rue des Deux Gares, 92500, Rueil-Malmaison | |||||
| Germany | Dermalogica GmbH | NV 100 | EUR25,000.00 Ordinary | Gerresheimer Landstraße 71, 40627 Düsseldorf | ||||||
| 99.99 | Germany | DU Gesellschaft für | NV 64.54 PLC 35.45 | DEM50,000.00 Ordinary | Am Strandkai 1, 20457 Hamburg | |||||
| Arbeitnehmerüberlassung mbH | ||||||||||
| 99.99 | Germany | Maizena Grundstücksverwaltung GmbH | NV 63.60 PLC 36.39 | Partnership Interest | Schultetusstraße 37, 17153 Stavenhagen | |||||
& Co. OHG

|
||||||||||
| 99.99 | Germany |
Pfanni GmbH & Co. OHG
|
NV 64.54 PLC 35.45 | Partnership Interest | Schultetusstraße 37, 17153 Stavenhagen | |||||
| Germany | Rizofoor GmbH | NV 96.45 PLC 3.55 | EUR15,350.00 Ordinary | Schultetusstraße 37, 17153 Stavenhagen | ||||||
| NV 100 | EUR138,150.00 Ordinary | |||||||||
| Germany | Schafft GmbH | NV 64.55 PLC 35.45 | EUR63,920.00 Ordinary | Schultetusstraße 37, 17153 Stavenhagen | ||||||
| NV 64.55 PLC 35.45 | EUR100,000.00 Ordinary | |||||||||
| Germany | TIGI Eurologistic GmbH | PLC 100 | EUR100.00 Ordinary | Hertzstraße 6, 71083 Herrenberg-Gülstein | ||||||
| PLC 100 | EUR24.900.00 Ordinary | |||||||||
| Germany | TIGI Haircare GmbH | PLC 100 | EUR25,600.00 Ordinary | Hertzstraße 6, 71083 Herrenberg-Gülstein | ||||||
| Germany | UBG Vermietungs GmbH | NV 64.74 PLC 35.26 | EUR136,377,489.00 | Schultetusstraße 37, 17153 Stavenhagen | ||||||
| Ordinary | ||||||||||
| Germany | Unilever BCS Deutschland GmbH | NV 55.40 PLC 44.60 | EUR25,000.00 Ordinary | Am Strandkai 1, 20457 Hamburg | ||||||
| Germany | Unilever BCS Deutschland Immobilien | NV 66.22 PLC 33.78 | Partnership Interest | Am Strandkai 1, 20457 Hamburg | ||||||
|
Leasing GmbH & Co. OHG
|
||||||||||
| 134 | Financial Statements | Annual Report on Form 20-F 2016 |
Table of Contents
27. GROUP COMPANIES CONTINUED
|
%
|
Country of
|
Name of Undertaking
|
% holding as between NV/PLC
|
Class of share held in subsidiary undertaking
|
Registered address
|
|||||
| Germany |
Unilever BCS IP Deutschland GmbH & Co. OHG
|
NV 64.45 PLC 35.55 | Partnership Interest | Am Strandkai 1, 20457 Hamburg | ||||||
| Germany |
Unilever BCS Sourcing Deutschland GmbH & Co. OHG
|
NV 64.45 PLC 35.55 | Partnership Interest | Am Strandkai 1, 20457 Hamburg | ||||||
| Germany | Unilever BCS Verwaltungs GmbH | NV 55.40 PLC 44.60 | EUR25.000,00 Ordinary | Am Strandkai 1, 20457 Hamburg | ||||||
| Germany | Unilever Deutschland GmbH | NV 64.55 PLC 35.45 | EUR90,000,000.00 Ordinary | Am Strandkai 1, 20457 Hamburg | ||||||
| NV 64.55 PLC 35.45 | EUR2,000,000.00 Ordinary | |||||||||
| NV 64.55 PLC 35.45 | EUR1,000,000.00 Ordinary | |||||||||
| Germany | Unilever Deutschland Holding GmbH | NV 64.55 PLC 35.45 | EUR39,000.00 Ordinary | Am Strandkai 1, 20457 Hamburg | ||||||
| NV 64.55 PLC 35.45 | EUR18,000.00 Ordinary | |||||||||
| NV 64.55 PLC 35.45 | EUR14,300.00 Ordinary | |||||||||
| NV 64.55 PLC 35.45 | EUR5.200.00 Ordinary | |||||||||
| NV 64.55 PLC 35.45 | EUR6,500.00 Ordinary | |||||||||
| Germany |
Unilever Deutschland Immobilien Leasing GmbH & Co. OHG
|
NV 66.33 PLC 33.67 | Partnership Interest | Schultetusstraße 37, 17153 Stavenhagen | ||||||
| Germany |
Unilever Deutschland IPR GmbH & Co. OHG
|
NV 64.55 PLC 35.45 | Partnership Interest | Schultetusstraße 37, 17153 Stavenhagen | ||||||
| Germany |
Unilever Deutschland Produktions GmbH & Co. OHG
|
NV 64.55 PLC 35.45 | Partnership Interest | Am Strandkai 1, 20457 Hamburg | ||||||
| Germany | Unilever Deutschland Produktions Verwaltungs GmbH | NV 64.55 PLC 35.45 | EUR179,000.00 Ordinary | Am Strandkai 1, 20457 Hamburg | ||||||
| Germany | Unilever Deutschland Supply Chain Services GmbH | NV 64.55 PLC 35.45 | EUR51,150.00 Ordinary | Am Strandkai 1, 20457 Hamburg | ||||||
| Ghana | Millers Swanzy (Ghana) Limited | PLC 100 | GHC1.00 Ordinary | Swanmill, Kwame Nkrumah Avenue, Accra | ||||||
| 66.56 | Ghana | Unilever Ghana Investments Limited | NV 0 PLC 66.56 | GHC10.00 Ordinary | Plot No. Ind/A/3A-4, Heavy Industrial Area, Tema | |||||
| 66.56 | Ghana | Unilever Ghana Limited | NV 0 PLC 66.56 | GHC0.0192 Ordinary | Plot No. Ind/A/3A-4, Heavy Industrial Area, Tema | |||||
| Greece | Elais Unilever Hellas SA | NV 100 | EUR10.00 Ordinary | Kymis ave & 10, Seneka str. GR-145 64 Kifissia | ||||||
| Greece | Elanthi SA | NV 100 | EUR10.00 Ordinary | Kymis ave & 10, Seneka str. GR-145 64 Kifissia | ||||||
| Greece | Unilever Knorr SA | NV 100 | EUR10.00 Ordinary | Kymis ave & 10, Seneka str. GR-145 64 Kifissia | ||||||
| Greece | UL BCS Logistics Consulting SA | NV 100 | EUR10.00 Ordinary | Kymis ave & 10, Seneka str. GR-145 64 Kifissia | ||||||
| Greece | Unilever Logistics SA | NV 100 | EUR10.00 Ordinary | Kymis ave & 10, Seneka str. GR-145 64 Kifissia | ||||||
| Guatemala | Unilever de Centroamerica S.A. Guatemala | NV 100 | GTQ60.00 Ordinary | Diagonal 6. 10-50 zona 10, Ciudad de Guatemala. Nivel 17 Torre Norte Ed. Interamericas World Financial Center | ||||||
| Guatemala | Unilever Guatemala SCC S.A. | NV 100 | GTQ100.00 Ordinary | 24 Avenida , Calzada Atanacio Tzul, 35-87 Zona 12 Ciudad de Guatemala | ||||||
| Honduras | Unilever de Centroamerica S.A. Honduras | NV 100 | HNL10.00 Ordinary | Anillo Periférico 600 metros después de la colonia, Residencial Las Uvas contigua acceso de colonia residencial, Tegucigalpa | ||||||
| Hong Kong | Blueair Asia Limited | NV 100 | HKD0.01 Ordinary | Suite 1106-8, 11/F, Tai Yau Building, 181 Johnston Road, Wanchai | ||||||
| Hong Kong | Kate Somerville Skincare, Hong Kong Limited | NV 100 | HKD1.00 Ordinary | Room 1505, Wheelock House, 20 Pedder Street, Central | ||||||
| Hong Kong | Unilever Hong Kong Limited | NV 64.55 PLC 35.45 | HKD0.10 Ordinary | 6 Dai Fu Street, Tai Po Industrial Estate, N.T. | ||||||
| Hungary | Multifrozen Kereskedelmi Kft | PLC 100 | HUF1.00 Ordinary | 1138-Budapest, Váci u. 182 | ||||||
| Hungary | Unilever BCS Hungary Kft | NV 55.40 PLC 44.60 | HUF1.00 Ordinary | 1138-Budapest, Váci u. 182 | ||||||
| Hungary | Unilever Magyarország Kft | PLC 100 | HUF1.00 Ordinary | 1138-Budapest, Váci u. 182 | ||||||
| 67.20 | India | Bhavishya Alliance Child Nutrition Initiatives | NV 0 PLC 67.20 | INR10.00 Ordinary | Unilever House, B. D. Sawant Marg, Chakala, Andheri (E), Mumbai 400 099 | |||||
| India | Blueair Limited | NV 99.98 PLC 0.02 | INR10. 00 Ordinary | S-327, Greater Kailash – II, New Delhi – 110048, Delhi | ||||||
| 67.20 | India | Daverashola Estates Private Limited | NV 0 PLC 67.20 | INR10.00 Ordinary | Unilever House, B. D. Sawant Marg, Chakala, Andheri (E), Mumbai 400 099 | |||||
| 67.20 | India | Hindlever Trust Limited | NV 0 PLC 67.20 | INR10.00 Ordinary | Unilever House, B. D. Sawant Marg, Chakala, Andheri (E), Mumbai 400 099 | |||||
| 67.20 | India | Hindustan Unilever Limited° | NV 0 PLC 67.20 | INR1.00 Ordinary | Unilever House, B. D. Sawant Marg, Chakala, Andheri (E), Mumbai 400 099 | |||||
| 67.20 | India | Jamnagar Properties Private Limited | NV 0 PLC 67.20 | INR10.00 Ordinary | Unilever House, B. D. Sawant Marg, Chakala, Andheri (E), Mumbai 400 099 | |||||
| 67.20 | India | Lakme Lever Private Limited | NV 0 PLC 67.20 | INR10.00 Ordinary | 1st Floor, Shreeniwas House, H. Somani Marg, (behind Bombay Gymkhana) Fort, Mumbai 40001 | |||||
| 67.20 | India | Levers Associated Trust Limited | NV 0 PLC 67.20 | INR10.00 Ordinary | Unilever House, B. D. Sawant Marg, Chakala, Andheri (E), Mumbai 400 099 | |||||
| 67.20 | India | Levindra Trust Limited | NV 0 PLC 67.20 | INR10.00 Ordinary | Unilever House, B. D. Sawant Marg, Chakala, Andheri (E), Mumbai 400 099 | |||||
| 67.20 | India | Pond’s Exports Limited | NV 0 PLC 67.20 | INR1.00 Ordinary | Unilever House, B. D. Sawant Marg, Chakala, Andheri (E), Mumbai 400 099 | |||||
| 67.20 | India | Unilever India Exports Limited | NV 0 PLC 67.20 | INR10.00 Ordinary | Unilever House, B. D. Sawant Marg, Chakala, Andheri (E), Mumbai 400 099 | |||||
| India | Unilever Industries Private Limited° | PLC 100 | INR10.00 Ordinary | Unilever House, B. D. Sawant Marg, Chakala, Andheri (E), Mumbai 400 099 | ||||||
| India | Unilever Ventures India Advisory Private Limited | PLC 100 | INR1.00 Ordinary | Unilever House, B. D. Sawant Marg, Chakala, Andheri (E), Mumbai 400 099 | ||||||
| 84.99 | Indonesia | PT Unilever Indonesia Tbk | NV 54.86 PLC 30.13 | IDR10.00 Ordinary | Grha Unilever, Green Office Park Kav 3, Jalan BSD Boulevard Barat, BSD City, Tangerang, 15345 | |||||
| 99.26 | Indonesia | PT Unilever Enterprises Indonesia | NV 64.07 PLC 35.19 | IDR1,000.00 Ordinary | Grha Unilever, Green Office Park Kav 3, Jalan BSD Boulevard Barat, BSD City, Tangerang, 15345 | |||||
| Indonesia | PT Unilever Oleochemical Indonesia | NV 100 | IDR1,000,000.00 Ordinary | KEK Sei Mangkei, Nagori Sei Mangkei, Kecamatan Bosar Maligas, Kabupaten Simalungun 21183, Sumatera Utara | ||||||
| 99.35 | Iran | Unilever Iran (Private Joint Stock Company) | NV 99.35 PLC 0 | IRR1,000,000.00 Ordinary | 137 Shiraz Building, Corner of the 21st Street, Khaled Eslamboli Ave, Tehran | |||||
| Ireland | Lipton Soft Drinks (Ireland) Limited | PLC 100 | EUR1.26 Ordinary | 20 Riverwalk, National Digital Park, Citywest Business Campus Dublin 24 | ||||||
| Annual Report on Form 20-F 2016 | Financial Statements | 135 |
Table of Contents
NOTES TO THE CONSOLIDATED FINANCIAL STATEMENTS
UNILEVER GROUP CONTINUED
27. GROUP COMPANIES CONTINUED
|
%
|
Country of
|
Name of Undertaking
|
% holding as between NV/PLC
|
Class of share held in subsidiary undertaking
|
Registered address
|
|||||
| Ireland | Unilever BCS Ireland Limited | NV 55.40 PLC 44.60 | EUR1.00 Ordinary | 20 Riverwalk, National Digital Park, Citywest Business Campus Dublin 24 | ||||||
| Ireland | Unilever Ireland (Holdings) Limited | PLC 100 | EUR1.26 Ordinary | 20 Riverwalk, National Digital Park, Citywest Business Campus Dublin 24 | ||||||
| Ireland | Unilever Ireland Limited | PLC 100 | EUR1.26 Ordinary | 20 Riverwalk, National Digital Park, Citywest Business Campus Dublin 24 | ||||||
| Ireland | Unilever Superannuation (Ireland) Trust Limited | PLC 100 | EUR1.26 Ordinary | 20 Riverwalk, National Digital Park, Citywest Business Campus Dublin 24 | ||||||
| Isle of Man | Rational International Enterprises Limited | PLC 100 | USD1.00 Ordinary | Bridge Chambers, West Quay, Ramsey, Isle of Man, IM8 1DL | ||||||
| Israel | Beigel & Beigel Mazon (1985) Limited | NV 12.8 PLC 87.2 | ILS1.00 Ordinary | 3 Gilboa St. Airport City, Ben Gurion Airport | ||||||
| Israel | Bestfoods TAMI Holdings Limited | NV 25.11 PLC 74.89 | ILS0.001 Ordinary | 52 Julius Simon Street, Haifa | ||||||
| Israel | Glidat Strauss Limited | PLC 100 | ILS1.00 Management | Haharoshet 1, PO Box 2288, Akko, 24122 | ||||||
| PLC 100 | ILS1.00 Ordinary | |||||||||
| NV 0 PLC 0 | ILS1.00 Dormant† | |||||||||
| Israel | Israel Vegetable Oil Company Limited | NV 25.11 PLC 74.89 | ILS0.0001 Ordinary | 52 Julius Simon Street, Haifa | ||||||
| Israel | Lever Distribution of Personal and | PLC 100 | ILS0.0001 Ordinary | 52 Julius Simon Street, Haifa | ||||||
| Cleaning Products Limited | ||||||||||
| Israel | Unilever Israel Foods Limited | NV 25.10 PLC 74.90 | ILS0.10 Class A | 52 Julius Simon Street, Haifa | ||||||
| NV 25.10 PLC 74.90 | ILS0.10 Class B | |||||||||
| NV 25.10 PLC 74.90 | ILS0.10 Class C | |||||||||
| NV 25.10 PLC 74.90 | ILS0.0002 Special | |||||||||
| Israel | Unilever Israel Home and Personal Care | PLC 100 | ILS1.00 Ordinary | 52 Julius Simon Street, Haifa | ||||||
| Limited | ||||||||||
| Israel | Unilever Israel Marketing Limited | NV 25.11 PLC 74.89 | ILS0.0001 Ordinary | 52 Julius Simon Street, Haifa | ||||||
| Israel | Unilever Shefa Israel Limited | NV 25.11 PLC 74.89 | ILS1.00 Ordinary | 52 Julius Simon Street, Haifa | ||||||
| Italy | Gromart S.R.L. | NV 100 | EUR1,815,800.00 Ordinary | Piazza Paleocapa 1/D, 10100, Torino | ||||||
| 51 | Italy | G.L.L. S.R.L. | NV 51 PLC 0 | EUR40,000.00 Common | Via Crea 10, 10095, Grugliasco | |||||
| Italy | Grom-PD S.R.L. | NV 100 | EUR40,000.00 Common | Via Roma 101, 35122, Padova | ||||||
| Italy | Intuiskin S.R.L. | NV 100 | EUR10,000.00 Ordinary | Via Tortona 25, cap 20144 – Milano | ||||||
| Italy | Unilever BCS Italia S.R.L. | NV 55.40 PLC 44.60 | EUR10,000.00 Ordinary | Via Paolo di Dono 3/A 00142 Roma | ||||||
| Italy | Unilever Italia Administrative Services S.R.L. | NV 100 | EUR70,000.00 Ordinary | Piazzale Biancamano n.8, 20121, Milano | ||||||
| Italy | Unilever Italia Logistics S.R.L. | NV 100 | EUR600,000.00 Ordinary | Via Paolo di Dono 3/A 00142 Roma | ||||||
| Italy | Unilever Italia Manufacturing S.R.L. | NV 100 | EUR10,000,000.00 Ordinary | Via Paolo di Dono 3/A 00142 Roma | ||||||
| Italy | Unilever Italia Mkt Operations S.R.L. | NV 100 | EUR25,000,000.00 Ordinary | Via Paolo di Dono 3/A 00142 Roma | ||||||
| Italy | Unilever Italy Holdings S.R.L. | NV 100 | EUR200,000,000.00 | Via Paolo di Dono 3/A 00142 Roma | ||||||
| Ordinary | ||||||||||
| Japan | Unilever Japan Beverage K.K. | NV 100 | JPY50,000.00 Ordinary | 2-1-1, Kamimeguro, Meguro-ku, Tokyo 153-8578 | ||||||
| Japan | Unilever Japan Customer Marketing K.K. | NV 100 | JPY50,000.00 Ordinary | 2-1-1, Kamimeguro, Meguro-ku, Tokyo 153-8578 | ||||||
| Japan | Unilever Japan Holdings K.K. | NV 100 | JPY10,000.00 Ordinary | 2-1-1, Kamimeguro, Meguro-ku, Tokyo 153-8578 | ||||||
| Japan | Unilever Japan K.K. | NV 100 | JPY50,000.00 Ordinary | 2-1-1, Kamimeguro, Meguro-ku, Tokyo 153-8578 | ||||||
| 73.64 | Japan | Froosh K.K. | NV 0 PLC 73.64 | JPY50,000.00 Ordinary | 1–10–3–901 Roppongi, Minatu–ku, Tokyo 106–0032 | |||||
| Japan | Unilever Japan Service K.K. | NV 100 | JPY50,000.00 Ordinary | 2-1-1, Kamimeguro, Meguro-ku, Tokyo 153-8578 | ||||||
| Jersey | Unilever Chile Investments Limited | NV 64.55 PLC 35.45 | GBP1.00 Ordinary | 13 Castle Street, St Helier, Jersey , JE4 5UT | ||||||
| 98.19 | Kenya | Brooke Bond Mombasa Limited | NV 0 PLC 98.19 | KES1.00 Ordinary | Head Office, Kericho-Nakuru Road, P.O. BOX 20, 20200, Kericho | |||||
| 98.19 | Kenya | Mabroukie Tea & Coffee Estates Limited | NV 0 PLC 98.19 | KES1.00 Ordinary | Head Office, Kericho-Nakuru Road, P.O. BOX 20, 20200, Kericho | |||||
| 51.08 | Kenya | The Limuru Tea Company Limited | NV 0 PLC 51.08 | KES20.00 Ordinary | Head Office, Kericho-Nakuru Road, P.O. BOX 20, 20200, Kericho | |||||
| Kenya | Unilever Kenya Limited° | PLC 100 | KES20.00 Ordinary | Commercial Street, Industrial Area, P.O. BOX 30062-00100, Nairobi | ||||||
| 98.20 | Kenya | Unilever Tea Kenya Limited | NV 0 PLC 98.20 | KES1.00 Ordinary | Head Office, Kericho-Nakuru Road, P.O. BOX 20, 20200, Kericho | |||||
| Korea | Unilever Korea Chusik Hoesa | NV 100 | KRW10,000.00 Ordinary | 443 Taeheran-ro, Samsung-dong, Kangnam-gu, Seoul | ||||||
| NV 100 | KRW10,000.00 Preference | |||||||||
| Laos | Unilever Services (Lao) Sole Co Limited | NV 100 | LAK80,0000.00 Ordinary | Viengvang Tower, 4th Floor, Room no. 402A, Boulichan Road, | ||||||
| Dongpalan Thong Village, Sisattanak District, Vientiane Capital | ||||||||||
| Latvia | Unilever Baltic LLC | NV 100 | EUR1.00 Ordinary | Kronvalda bulvāris 3-10, Rīga, LV-1010 | ||||||
| Lebanon | Unilever Levant s.a.r.l. | NV 100 | LBP1,000,000.00 Ordinary | Sin El Fil, Zakher Building, Floor 4, Beirut | ||||||
| Lithuania | UAB Unilever Lietuva distribucija | NV 100 | EUR3,620.25 Ordinary | Skuodo st. 28, Mazeikiai, LT-89100 | ||||||
| Lithuania | UAB Unilever Lietuva ledu gamyba | NV 100 | EUR3,620.25 Ordinary | Skuodo st. 28, Mazeikiai, LT-89100 | ||||||
| Malawi | Unilever South East Africa (Private) | PLC 100 | MWK2.00 Ordinary | Abdul Majid Motor City, Chipembere Highway, Ginnery Corner, | ||||||
| Limited | Blantyre | |||||||||
| 70 | Malaysia | Unilever (Malaysia) Holdings Sdn. Bhd. | NV 0 PLC 70 | RM1.00 Ordinary | Level 34, Menara TM, Jalan Pantai Baru, 59200 Kuala Lumpur | |||||
| 70 | Malaysia | Unilever (Malaysia) Services Sdn. Bhd. | NV 0 PLC 70 | RM1.00 Ordinary | Level 34, Menara TM, Jalan Pantai Baru, 59200 Kuala Lumpur | |||||
| Malaysia | Unilever Foods (Malaysia) Sdn. Bhd. | PLC 100 | RM75.00 Ordinary | Level 34, Menara TM, Jalan Pantai Baru, 59200 Kuala Lumpur | ||||||
| Malaysia | Unilever Malaysia Aviance Sdn. Bhd. | PLC 100 | RM1.00 Ordinary | Level 34, Menara TM, Jalan Pantai Baru, 59200 Kuala Lumpur | ||||||
| Mexico | Unilever de Mexico S.de R.L. de C.V. | NV 64.55 PLC 35.45 | Partnership Interest | Av. Tepalcapa No.2, Col. Rancho Santo Domingo, C.P. 54900 Tultitlán, Estado de México | ||||||
| Mexico | Unilever Holding Mexico S.de R.L. de C.V. | NV 64.55 PLC 35.45 | Partnership Interest | Av. Tepalcapa No.2, Col. Rancho Santo Domingo, C.P. 54900 Tultitlán, Estado de México | ||||||
| Mexico | Unilever Manufacturera S.de R.L. de C.V. | NV 64.55 PLC 35.45 | Partnership Interest | Av. Tepalcapa No.2, Col. Rancho Santo Domingo, C.P. 54900 Tultitlán, Estado de México | ||||||
| Mexico | Servicios Professionales Unilever S.de R.L. de C.V. | NV 64.55 PLC 35.45 | Partnership Interest | Av. Tepalcapa No.2, Col. Rancho Santo Domingo, C.P. 54900 Tultitlán, Estado de México | ||||||
| Mexico | Unilever Mexicana S.de R.L. de C.V. | NV 64.55 PLC 35.45 | Partnership Interest | Av. Tepalcapa No.2, Col. Rancho Santo Domingo, C.P. 54900 Tultitlán, Estado de México | ||||||
| Mexico | Unilever Real Estate Mexico S.de R.L. de C.V. | NV 64.55 PLC 35.45 | Partnership Interest | Av. Tepalcapa No.2, Col. Rancho Santo Domingo, C.P. 54900 Tultitlán, Estado de México | ||||||
| Mexico | Unilever Servicios de Promotoria, S.de R.L. de C.V. | NV 64.55 PLC 35.45 | Partnership Interest | Av. Tepalcapa No.2, Col. Rancho Santo Domingo, C.P. 54900 Tultitlán, Estado de México | ||||||
| 136 | Financial Statements | Annual Report on Form 20-F 2016 |
Table of Contents
27. GROUP COMPANIES CONTINUED
|
%
|
Country of
|
Name of Undertaking
|
% holding as between NV/PLC
|
Class of share held in subsidiary undertaking
|
Registered address
|
|||||
| 99.98 | Morocco | Unilever Maghreb S.A. | NV 99.98 PLC 0 | MAD100.00 Ordinary | Km 10, Route Cotiere, Ain Sebaa, Casablanca | |||||
| Mozambique | Unilever Mocambique Limitada | NV 100 | USD0.01 Ordinary | Avenida 24 de Julho, Edifício 24, nº 1097, 4º andar, Maputo | ||||||
| Myanmar | Unilever (Myanmar) Limited | NV 100 | MMK8,200.00 Ordinary | 40,41,47, Mintheidie Kyaw Swar Street, Shwe Pyi Thar Industrial Zone (2), Yangon | ||||||
| Myanmar | Unilever (Myanmar) Services Limited | NV 100 | USD10.00 Ordinary | 150, Kabar Aye Pagoda Road, Bahn Township, Yangon | ||||||
| 53.76 | Nepal | Unilever Nepal Limited | NV 0 PLC 53.76 | NPR100.00 Ordinary | Basamadi V.D.C. – 5, P.O. Box-11, Hetauda, Dist. Makwanpur | |||||
| Netherlands | Alberto-Culver Netherlands B.V.* | NV 55.40 PLC 44.60 | EUR1.00 Ordinary-A | Weena 455, 3013 AL Rotterdam | ||||||
| NV 55.40 PLC 44.60 | EUR1.00 Ordinary-B | |||||||||
| Netherlands | Argentina Investments B.V.* | NV 64.55 PLC 35.45 | EUR454.00 Ordinary | Weena 455, 3013 AL Rotterdam | ||||||
| Netherlands | Ben en Jerry’s Hellendoorn B.V.* | NV 100 | EUR453.78 Ordinary | Reggeweg 15, 7447 AN Hellendoorn | ||||||
| Netherlands | BFO Holdings B.V.* | NV 64.55 PLC 35.45 | EUR1.00 Ordinary | Weena 455, 3013 AL Rotterdam | ||||||
| Netherlands | BFO TWO B.V.* | NV 55.40 PLC 44.60 | EUR1.00 Ordinary | Weena 455, 3013 AL Rotterdam | ||||||
| Netherlands | BrazH1 B.V.* | NV 64.55 PLC 35.45 | EUR1.00 Ordinary | Weena 455, 3013 AL Rotterdam | ||||||
| Netherlands | BrazH2 B.V.* | NV 64.55 PLC 35.45 | EUR1.00 Ordinary | Weena 455, 3013 AL Rotterdam | ||||||
| Netherlands | Brazinvest B.V.* | NV 64.55 PLC 35.45 | EUR1.00 Ordinary | Weena 455, 3013 AL Rotterdam | ||||||
| Netherlands | Brazinvestee B.V.* | NV 64.55 PLC 35.45 | EUR1.00 Ordinary | Weena 455, 3013 AL Rotterdam | ||||||
| Netherlands | Chico-invest B.V.* | NV 64.55 PLC 35.45 | EUR455.00 Ordinary | Weena 455, 3013 AL Rotterdam | ||||||
| Netherlands | Doma B.V.* | NV 100 | NLG1,000.00 Ordinary | Weena 455, 3013 AL Rotterdam | ||||||
| Netherlands | Handelmaatschappij Noorda B.V.°* | NV 100 | NLG1,000.00 Ordinary | Weena 455, 3013 AL Rotterdam | ||||||
| Netherlands | Immobilia Transhome B.V.* | NV 100 | NLG1,000.00 Ordinary | Weena 455, 3013 AL Rotterdam | ||||||
| Netherlands | Itaho B.V.* | NV 100 | EUR1.00 Ordinary | Weena 455, 3013 AL Rotterdam | ||||||
| Netherlands | Lever Faberge Europe-Sourcing Unit | NV 100 | NLG1,000.00 Ordinary | Deltaweg 150, 3133 KM Vlaardingen | ||||||
| Vlaardingen B.V.* | ||||||||||
| Netherlands | Lipoma B.V.°* | NV 100 | NLG1,000.00 Ordinary | Weena 455, 3013 AL Rotterdam | ||||||
| Netherlands | Marga B.V.°* | NV 100 | EUR1.00 Ordinary | Weena 455, 3013 AL Rotterdam | ||||||
| Netherlands | Mavibel (Maatschappij voor Internationale | NV 100 | EUR1.00 Ordinary | Weena 455, 3013 AL Rotterdam | ||||||
| Beleggingen) B.V.°* | ||||||||||
| Netherlands | Mexinvest B.V.* | NV 64.55 PLC 35.45 | EUR1.00 Ordinary | Weena 455, 3013 AL Rotterdam | ||||||
| Netherlands | Mixhold B.V.* | NV 100 | EUR1.00 Ordinary-A | Weena 455, 3013 AL Rotterdam | ||||||
| PLC 100 | EUR1.00 Ordinary-B | |||||||||
| NV 55.40 PLC 44.60 | EUR1.00 cumulative | |||||||||
| preference shares | ||||||||||
| Netherlands | Naamlooze Vennootschap Elma°*† | NV 100 | NLG1,000.00 Ordinary | Weena 455, 3013 AL Rotterdam | ||||||
| NV 0.25 PLC 99.75 | NLG1,000.00 5% | |||||||||
| Cumulative Preference | ||||||||||
| Netherlands | New Asia B.V.* | NV 64.55 PLC 35.45 | EUR1.00 Ordinary | Weena 455, 3013 AL Rotterdam | ||||||
| Netherlands | Nommexar B.V.* | NV 64.55 PLC 35.45 | EUR1.00 Ordinary | Weena 455, 3013 AL Rotterdam | ||||||
| Netherlands | Oprichting Tessa BV | NV 100 | EUR1.00 Ordinary | Nassaukade 5, Rotterdam | ||||||
| Netherlands | Ortiz Finance B.V.* | NV 64.55 PLC 35.45 | NLG100.00 Ordinary | Weena 455, 3013 AL Rotterdam | ||||||
| Netherlands | Pabulum B.V.* | NV 100 | NLG1,000.00 Ordinary | Weena 455, 3013 AL Rotterdam | ||||||
| Netherlands | Rizofoor B.V.* | PLC 100 | NLG1,000.00 Ordinary | Weena 455, 3013 AL Rotterdam | ||||||
| Netherlands | Rolf von den Baumen’s Vetsmelterij B.V.* | NV 100 | EUR454.00 Ordinary | Weena 455, 3013 AL Rotterdam | ||||||
| Netherlands | Rolon B.V.* | NV 64.55 PLC 35.45 | NLG1,000.00 Ordinary | Weena 455, 3013 AL Rotterdam | ||||||
| Netherlands | Saponia B.V.°* | NV 100 | NLG1,000.00 Ordinary | Weena 455, 3013 AL Rotterdam | ||||||
| Netherlands | ThaiB1 B.V.* | NV 64.55 PLC 35.45 | NLG1,000.00 Ordinary | Weena 455, 3013 AL Rotterdam | ||||||
| Netherlands | ThaiB2 B.V. | NV 64.55 PLC 35.45 | NLG1,000.00 Ordinary | Weena 455, 3013 AL Rotterdam | ||||||
| Netherlands | Unilever Administration Centre B.V.* | NV 100 | EUR1.00 Ordinary | Weena 455, 3013 AL Rotterdam | ||||||
| Netherlands | Unilever Alser B.V.* | NV 100 | EUR1.00 Ordinary | Weena 455, 3013 AL Rotterdam | ||||||
| Netherlands | Unilever BCS Europe B.V.* | NV 55.40 PLC 44.60 | EUR1.00 Ordinary | Weena 455, 3013 AL Rotterdam | ||||||
| Netherlands | Unilever BCS Holdings B.V.* | NV 55.40 PLC 44.60 | EUR1.00 Ordinary | Weena 455, 3013 AL Rotterdam | ||||||
| Netherlands | Unilever BCS NL Holdings Two B.V.* | NV 55.40 PLC 44.60 | EUR1.00 Ordinary | Weena 455, 3013 AL Rotterdam | ||||||
| Netherlands | Unilever BCS Nederland B.V.* | NV 55.40 PLC 44.60 | EUR1.00 Ordinary | Nassaukade 5, 3071 JL Rotterdam | ||||||
| Netherlands | Unilever BCS Research and Development | NV 55.40 PLC 44.60 | EUR1.00 Ordinary | Olivier van Noortlaan 120, 3133 AT Vlaardingen | ||||||
| B.V.* | ||||||||||
| Netherlands | Unilever BCS Sourcing Nederland B.V.* | NV 55.40 PLC 44.60 | EUR1.00 Ordinary | Nassaukade 3, 3071 JL Rotterdam | ||||||
| Netherlands | Unilever Berran B.V.* | NV 100 | EUR1.00 Ordinary | Weena 455, 3013 AL Rotterdam | ||||||
| Netherlands | Unilever Canada Investments B.V.* | NV 64.55 PLC 35.45 | EUR1.00 Ordinary | Weena 455, 3013 AL Rotterdam | ||||||
| Netherlands | Unilever Caribbean Holdings B.V.* | NV 100 | EUR1,800.00 Ordinary | Weena 455, 3013 AL Rotterdam | ||||||
| Netherlands | Unilever Employee Benefits Management | PLC 100 | NLG1,000.00 Ordinary | Weena 455, 3013 AL Rotterdam | ||||||
| B.V.* | ||||||||||
| Netherlands | Unilever Employment Services B.V.* | NV 100 | NLG1,000.00 Ordinary | Weena 455, 3013 AL Rotterdam | ||||||
| Netherlands | Unilever Europe Business Center B.V.* | NV 100 | EUR454.00 Ordinary | Weena 455, 3013 AL Rotterdam | ||||||
| Netherlands | Unilever Finance International B.V.°* | NV 100 | EUR1.00 Ordinary | Weena 455, 3013 AL Rotterdam | ||||||
| Netherlands | Unilever Foodsolutions B.V.* | NV 100 | EUR1.00 Ordinary | Weena 455, 3013 AL Rotterdam | ||||||
| Netherlands | Unilever Global Services B.V.* | NV 100 | EUR1.00 Ordinary | Weena 455, 3013 AL Rotterdam | ||||||
| Netherlands | Unilever Holdings B.V.* | NV 100 | EUR454.00 Ordinary | Weena 455, 3013 AL Rotterdam | ||||||
| Netherlands | Unilever Home & Personal Care Nederland | NV 100 | EUR100.00 Ordinary | Weena 455, 3013 AL Rotterdam | ||||||
| B.V.* | ||||||||||
| Netherlands | Unilever Indonesia Holding B.V.* | NV 64.55 PLC 35.45 | EUR1.00 Ordinary | Weena 455, 3013 AL Rotterdam | ||||||
| Netherlands | Unilever Insurances N.V. | NV 100 | EUR454.00 Ordinary | Weena 455, 3013 AL Rotterdam | ||||||
| Netherlands | Unilever Nederland B.V.* | NV 100 | EUR454.00 Ordinary | Nassaukade 5, 3071 JL Rotterdam | ||||||
| Netherlands | Unilever Nederland Foods Factories B.V.* | NV 100 | EUR46.00 ordinary | Nassaukade 5, 3071 JL Rotterdam | ||||||
| Netherlands | Unilever Netherlands Retail Operations B.V.* | NV 100 | EUR1.00 Ordinary | Weena 455, 3013 AL Rotterdam | ||||||
| Netherlands | Unilever Nederland Holdings B.V.°* | NV 100 | EUR454.00 Ordinary | Weena 455, 3013 AL Rotterdam | ||||||
| Netherlands | Unilever Nederland Services B.V.* | NV 100 | EUR460.00 Ordinary | Nassaukade 3, 3071 JL Rotterdam | ||||||
| Annual Report on Form 20-F 2016 | Financial Statements | 137 |
Table of Contents
NOTES TO THE CONSOLIDATED FINANCIAL STATEMENTS
UNILEVER GROUP CONTINUED
27. GROUP COMPANIES CONTINUED
|
%
|
Country of
|
Name of Undertaking
|
% holding as between NV/PLC
|
Class of share held in subsidiary undertaking
|
Registered address
|
|||||
| Netherlands | Unilever Overseas Holdings B.V.* | PLC 100 | NLG1,000.00 Ordinary | Unilever House , 100 Victoria Embankment, London, EC4Y 0DY (Registered Seat: Rotterdam) | ||||||
| Netherlands | Unilever Research and Development | NV 100 | EUR460.00 Ordinary | Olivier van Noortlaan 120, 3133 AT Vlaardingen | ||||||
| Vlaardingen B.V.* | ||||||||||
| Netherlands | Unilever Turkey Holdings B.V.* | NV 64.55 PLC 35.45 | EUR1.00 Ordinary | Weena 455, 3013 AL Rotterdam | ||||||
| Netherlands | Unilever US Investments B.V.°* | NV 100 | EUR1.00 Ordinary | Weena 455, 3013 AL Rotterdam | ||||||
| Netherlands | Unilever Ventures Holdings B.V. | NV 100 | EUR453.79 Ordinary | Weena 455, 3013 AL Rotterdam | ||||||
| Netherlands | Univest Company B.V. | NV 100 | EUR1.00 Ordinary | Weena 455, 3013 AL Rotterdam | ||||||
| Netherlands | UNUS Holding B.V.*† | NV 100 | EUR0.10 Ordinary-A | Weena 455, 3013 AL Rotterdam | ||||||
| PLC 100 | EUR0.10 Ordinary-B | |||||||||
| NV 0 PLC 0 | EUR0.10 Ordinary–B | |||||||||
| Non-voting† | ||||||||||
| Netherlands | Verenigde Zeepfabrieken B.V.* | NV 100 | NLG1,000.00 Ordinary | Weena 455, 3013 AL Rotterdam | ||||||
| Netherlands | Wemado B.V.°* | NV 100 | NLG1,000.00 Ordinary | Weena 455, 3013 AL Rotterdam | ||||||
| New Zealand | T2 NZ Limited | PLC 100 | NZD1.00 Ordinary | Level 4, 103 Carlton Gore Rd, Newmarket, Auckland 1023 | ||||||
| New Zealand | Unilever New Zealand Limited | PLC 100 | NZD2.00 Ordinary | Level 4, 103 Carlton Gore Rd, Newmarket, Auckland 1023 | ||||||
| New Zealand | Unilever New Zealand Superannuation | PLC 100 | NZD1.00 Ordinary | Level 4, 103 Carlton Gore Rd, Newmarket, Auckland 1023 | ||||||
| Trustee Limited | ||||||||||
| New Zealand | Unilever New Zealand Trading Limited | PLC 100 | NZD1.00 Ordinary | Level 4, 103 Carlton Gore Rd, Newmarket, Auckland 1023 | ||||||
| New Zealand | Ben & Jerry’s Franchising New Zealand Limited | PLC 100 | NZD1.00 Ordinary | Level 4, 103 Carlton Gore Rd, Newmarket, Auckland 1023 | ||||||
| Nicaragua | Unilever de Centroamerica S.A. Nicaragua | NV 100 | NIC50.00 Ordinary | Km 11.5, Carretera Vieja a León, 800 Mts Norte, 100 Mts Este, 300 Mts Norte, Managua | ||||||
| 56.27 | Niger | Unilever Niger S.A. | NV 0 PLC 56.27 | XOF10,000.00 Ordinary | BP 10272 Niamey | |||||
| 60.06 | Nigeria | Unilever Nigeria Plc | NV 0 PLC 60.06 | NGN0.50 Ordinary | 1 Billings Way, Oregun, Ikeja, Lagos | |||||
| 51 | Nigeria | West Africa Popular Foods Nigeria Limited | NV 0 PLC 51 | NGN1.00 Ordinary | 1 Billings Way, Oregun, Ikeja, Lagos | |||||
| Norway | Unilever Norge AS | NV 100 | NOK100.00 Ordinary | Martin Linges vei 25, Postbox 1, 1331 Fornebu | ||||||
| 73.64 | Norway | Froosh AS | NV 0 PLC 73.64 | NOK100.00 Ordinary | Karl Johans Gate 2, Oslo, 0154 | |||||
| 99.09 | Pakistan | Lever Associated Pakistan Trust (Private) Limited | PLC 99.09 | PKR10.00 Ordinary | Avari Plaza, Fatima Jinnah Road, Karachi – 75530 | |||||
| 99.09 | Pakistan | Lever Chemicals (Private) Limited | NV 0 PLC 99.09 | PKR10.00 Ordinary | Avari Plaza, Fatima Jinnah Road, Karachi – 75530 | |||||
| 99.09 | Pakistan | Sadiq (Private) Limited | NV 0 PLC 99.09 | PKR10.00 Ordinary | Avari Plaza, Fatima Jinnah Road, Karachi – 75530 | |||||
| Pakistan | Unilever Birds Eye Foods Pakistan (Private) Limited | PLC 100 | PKR10.00 Ordinary | Avari Plaza, Fatima Jinnah Road, Karachi – 75530 | ||||||
| 75.85 | Pakistan | Unilever Pakistan Foods Limited | NV 42.02 PLC 33.83 | PKR10.00 Ordinary | Avari Plaza, Fatima Jinnah Road, Karachi – 75530 | |||||
| 99.09 | Pakistan | Unilever Pakistan Limited | NV 0 PLC 99.09 | PKR50.00 Ordinary | Avari Plaza, Fatima Jinnah Road, Karachi – 75530 | |||||
| 70.52 | NV 0 PLC 70.52 | PKR100.00 Preference | ||||||||
| Palestine | Unilever Market Development Company | PLC 100 | ILS1.00 Ordinary | Ersal St. Awad Center P.O.B 3801 Al-Beireh, Ramallah | ||||||
| Panama | Unilever Regional Services Panama S.A. | NV 100 | USD1.00 Ordinary | Punta Pacífica, Calle Isaac Hanono Missri, P.H. Torre de las Américas, Torre C, Oficina 32, corregimiento de San Francisco, Distrito y Provincia de Panamá, | ||||||
| Panama | Unilever de Centroamerica S.A. Panama | NV 100 | No Nominal Value | Calle Isaac Hanoro, Torre de las Americas, torre C, piso 32, corregimiento de San Francisco, distrito y provincia de Panamá | ||||||
| Paraguay | Unilever de Paraguay S.A. | NV 100 | PYG1,000,000.00 Ordinary | 4544 Roque Centurión Miranda N° 1635 casi San Martin. Edificio Aymac II, Asunción | ||||||
| Peru | Unilever Andina Perú S.A. | NV 100 | PEN1.00 Ordinary | Av. Paseo de la Republica 5895 OF. 401, Miraflores, Lima 18 | ||||||
| Philippines | Metrolab Industries, Inc. | NV 64.55 PLC 35.45 | PHP1.00 Common | Linares Road, Gateway Business Park, Gen. Trias, Cavite | ||||||
| NV 64.55 PLC 35.45 | PHP10.00 Preference | |||||||||
| Philippines | Unilever Philippines, Inc. | NV 64.55 PLC 35.45 | PHP50.00 Common |
7th Floor, Bonifacio Stopover Corporate Center, 31st Street corner 2nd Avenue, Bonifacio Global City, Taguig City |
||||||
| Philippines | Unilever Philippines Body Care, Inc. | NV 64.55 PLC 35.45 | PHP100.00 Common | 11th Avenue corner 39th Street, Bonifacio Triangle, Bonifacio Global City, Taguig City | ||||||
| Philippines | Unilever Philippines Manufacturing, Inc. | NV 64.55 PLC 35.45 | PHP1.00 Common | 11th Avenue corner 39th Street, Bonifacio Triangle, Bonifacio Global City, Taguig City | ||||||
| 50 | Philippines | Unilever RFM Ice Cream, Inc. | NV 32.28 PLC 17.72 | PHP1.00 Common-B | Manggahan Light Industrial Compound, A. Rodriguez Avenue, Bo. Manggahan, Pasig City | |||||
| Poland | Unilever Polska Sp. z o.o. | PLC 100 | PLN50.00 Ordinary | Jerozolimskie 134, 02-305, Warszawa | ||||||
| Poland | Unilever Poland Services Sp. z o.o. | PLC 100 | PLN50.00 Ordinary | Jerozolimskie 134, 02-305, Warszawa | ||||||
| Poland | Unilever Polska S.A. | PLC 100 | PLN10.00 Ordinary | Jerozolimskie 134, 02-305, Warszawa | ||||||
| Poland | Unilever BCS Polska Sp. z o.o. | NV 55.40 PLC 44.60 | PLN50.00 Ordinary | Jerozolimskie 134, 02-305, Warszawa | ||||||
| Poland | Unilever BCS Polska Holding Sp. z o.o. | PLC 100 | PLN50.00 Ordinary | Jerozolimskie 134, 02-305, Warszawa | ||||||
| Puerto Rico | Unilever de Puerto Rico, Inc° | NV 100 | USD100.00 Ordinary | Professional Services Park 997, San Roverta St., Suite 7, San Juan | ||||||
| 99 | Romania | Unilever Romania S.A. | NV 99 PLC 0 | ROL0.10 Ordinary | Ploiesti, 291 Republicii Avenue, Prahova County | |||||
| Romania | Unilever Distribution SRL | NV 100 | ROL20.00 Ordinary | Ploiesti, 291 Republicii Avenue, Prahova County | ||||||
| Romania | Unilever BCS SCE SRL | NV 55.40 PLC 44.60 | ROL10.00 Ordinary | Ploiesti, 291 Republicii Avenue, Prahova County | ||||||
| Romania | Unilever South Central Europe S.A. | NV 100 | ROL260.50 Ordinary | Ploiesti, 291 Republicii Avenue, Prahova County | ||||||
| Russia | Concern Kalina LLC | NV 7.12 PLC 92.88 | Membership Interest | 620138, 80, Komsomol’skaya, Ekaterinburg | ||||||
| Russia | Inmarko Trade LLC | NV 7.12 PLC 92.88 | Membership Interest | 644031, 205, 10 let Oktyabrya, Omsk | ||||||
| 98.29 | Russia | JLLC Tulskiy Khladokombinat | NV 6.99 PLC 91.29 | RUR1.00 Ordinary | 300016, 78, Ostrovskogo Street, Tula | |||||
| Russia | OOO Unilever Rus | NV 7.12 PLC 92.88 | Membership Interest | 123022, 13, Sergeya Makeeva Street, Moscow | ||||||
| 49 | Saudi Arabia | Binzagr Unilever Limitedx | NV 0 PLC 49 | SAR1,000.00 Ordinary | P.O.Box 5694, Jeddah 21432 | |||||
| Serbia | Unilever Beograd d.o.o. | NV 100 | Membership Interest | Belgrade, Serbia, Omladinskih brigada 90b – Novi Beograd | ||||||
| Singapore | T2 Singapore PTE Limited | PLC 100 | SGD1.00 Ordinary | 20E Pasir Panjang Road, #06-22 Mapletree Business City, 117439 | ||||||
| Singapore | Unilever Asia Private Limited | NV 100 | SGD1.00 Ordinary | 20 Pasir Panjang Road, #06-22 Mapletree Business City, 117439 | ||||||
| Singapore | Unilever Singapore Pte. Limited | PLC 100 | SGD1.00 Ordinary | 20 Pasir Panjang Road, #06-22 Mapletree Business City, 117439 | ||||||
| 138 | Financial Statements | Annual Report on Form 20-F 2016 |
Table of Contents
27. GROUP COMPANIES CONTINUED
|
%
|
Country of
|
Name of Undertaking
|
% holding as between NV/PLC
|
Class of share held in subsidiary undertaking
|
Registered address
|
|||||
| Slovakia | Unilever BCS Slovensko, spol. s r.o. | NV 55.40 PLC 44.60 | EUR1.00 Ordinary | Karadzicova 10, 821 08 Bratislava | ||||||
| Slovakia | Unilever Slovensko spol. s r.o. | NV 100 | EUR1.00 Ordinary | Karadzicova 10, 821 08 Bratislava | ||||||
| 74.25 | South Africa | Nollsworth Park Properties (Pty) Limited | NV 11.21 PLC 63.04 | ZAR2.00 Ordinary | 15 Nollsworth Crescent, Nollsworth Park, La Lucia Ridge Office Estate, La Lucia, 4051 | |||||
| South Africa | Unilever Market Development (Pty) Limited | PLC 100 | ZAR1.00 Ordinary | 15 Nollsworth Crescent, Nollsworth Park, La Lucia Ridge Office Estate, La Lucia, 4051 | ||||||
| 74.25 | South Africa | Unilever South Africa (Pty) Limited | NV 11.21 PLC 63.04 | ZAR2.00 Ordinary | 15 Nollsworth Crescent, Nollsworth Park, La Lucia Ridge Office Estate, La Lucia, 4051 | |||||
| 74.25 | South Africa | Unilever South Africa Holdings (Pty) | NV 11.21 PLC 63.04 | ZAR1.00 Ordinary | 15 Nollsworth Crescent, Nollsworth Park, La Lucia Ridge Office | |||||
| 0.02 | Limited r | NV 0.005 PLC 0.015 | ZAR1.00 Ordinary-A | Estate, La Lucia, 4051 | ||||||
| 0.009 | NV 0.002 PLC 0.007 | ZAR1.00 Ordinary-B | ||||||||
| Spain | Intuiskin S.L.U. | NV 100 | EUR1.00 Ordinary | PA / Reding, 43, Izda 1, 29016 Malaga | ||||||
| Spain | Unilever BCS Spain, S.L.U. | NV 55.40 PLC 44.60 | EUR1.00 Ordinary | C/ Tecnología 19, 08840 Viladecans | ||||||
| Spain | Unilever Espana S.A. | NV 100 | EUR48.00 Ordinary | C/ Tecnología 19, 08840 Viladecans | ||||||
| Spain | Unilever HPC Industrial Espana S.L.U. | NV 100 | EUR1.00 Ordinary | C/ Fuente de la Mora, 3-5-7-Edificio A, 3ª planta, 28050 Madrid | ||||||
| Spain | Unilever Services Espana S.A. | NV 100 | EUR60.00 Ordinary | C/ Tecnología 19, 08840 Viladecans | ||||||
| Spain | Unilever Foods Industrial Espana, S.L.U. | NV 100 | EUR1.00 Ordinary | C/ Felipe del Río, 14 – 48940 Leioa | ||||||
| Sri Lanka | Brooke Bond Ceylon Limited | PLC 100 | LKR100.00 Ordinary | 258 M Vincent Perera Mawatha, Colombo 14 | ||||||
| Sri Lanka | Ceytea Limited | PLC 100 | LKR10.00 Ordinary | 258 M Vincent Perera Mawatha, Colombo 14 | ||||||
| Sri Lanka | Lever Brothers (Exports and Marketing) | PLC 100 | LKR2.00 Ordinary | 258 M Vincent Perera Mawatha, Colombo 14 | ||||||
| Limited° | ||||||||||
| Sri Lanka | Maddema Trading Co. Limited | PLC 100 | LKR10.00 Ordinary | 258 M Vincent Perera Mawatha, Colombo 14 | ||||||
| Sri Lanka | Premium Exports Ceylon (Pvt) Limited | PLC 100 | LKR10.00 Ordinary | 258 M Vincent Perera Mawatha, Colombo 14 | ||||||
| Sri Lanka | R.O. Mennell & Co. (Ceylon) Limited | PLC 100 | LKR10.00 Ordinary | 258 M Vincent Perera Mawatha, Colombo 14 | ||||||
| Sri Lanka | Tea Estates Ceylon Limited | PLC 100 | LKR100.00 Ordinary | 258 M Vincent Perera Mawatha, Colombo 14 | ||||||
| Sri Lanka | Unilever Ceylon Services Limited | PLC 100 | LKR10.00 Ordinary | 258 M Vincent Perera Mawatha, Colombo 14 | ||||||
| Sri Lanka | Unilever Ceylon Marketing Limited | PLC 100 | LKR10.00 Ordinary | 258 M Vincent Perera Mawatha, Colombo 14 | ||||||
| Sri Lanka | Unilever Lipton Ceylon Limited | PLC 100 | LKR10.00 Ordinary | 258 M Vincent Perera Mawatha, Colombo 14 | ||||||
| Sri Lanka | Unilever Sri Lanka Limited° | PLC 100 | LKR10.00 Ordinary | 258 M Vincent Perera Mawatha, Colombo 14 | ||||||
| Sweden | Alberto Culver AB | NV 55.40 PLC 44.60 | SEK100.00 Ordinary | Box 1056, Svetsarevaegen 15, 17122, Solna | ||||||
| Sweden | Blueair AB | NV 100 | SEK100.00 Ordinary | Danderydsgatan 11, 114 26, Stockholm | ||||||
| Sweden | Blueair Cabin Air AB | NV 100 | SEK100.00 Ordinary | Danderydsgatan 11, 114 26, Stockholm | ||||||
| Sweden | Unilever BCS Sourcing Sweden AB | NV 55.40 PLC 44.60 | SEK1.00 Ordinary | Box 1056, Svetsarevaegen 15, 17122, Solna | ||||||
| Sweden | Unilever BCS Sweden AB | NV 55.40 PLC 44.60 | SEK1.00 Ordinary | Box 1056, Svetsarevaegen 15, 17122, Solna | ||||||
| Sweden | Unilever Holding AB | NV 100 | SEK100.00 Ordinary | Box 1056, Svetsarevaegen 15, 17122, Solna | ||||||
| Sweden | Unilever Produktion AB | NV 100 | SEK50.00 Ordinary | Box 1056, Svetsarevaegen 15, 17122, Solna | ||||||
| Sweden | Unilever Sverige AB | NV 100 | SEK100.00 Ordinary | Box 1056, Svetsarevaegen 15, 17122, Solna | ||||||
| 74.72 | Sweden | Froosh AB | NV 0 PLC 74.72 | SEK0.10–A | Hammarby Kaj 24, Stockholm, 120 62 | |||||
| 24.90 | NV 0 PLC 24.90 | SEK0.10–B | ||||||||
| 73.64 | Sweden | Froosh Sverige AB | NV 0 PLC 73.64 | SEK100.00–A | Hammarby Kaj 24, Stockholm, 120 62 | |||||
| Sweden | Jonborsten AB | NV 100 | SEK1.00 Ordinary | Karlavagen 108, 115 26, Stockholm | ||||||
| Switzerland | Intuiskin SARL | NV 100 | CHF100.00 Ordinary | Chemin Frank-Thomas 34, 1208 Genève | ||||||
| Switzerland | Knorr-Nährmittel AG | NV 100 | CHF1,000.00 Ordinary | Bahnhofstrasse 19, CH 8240 Thayngen | ||||||
| Switzerland | Oswald Nahrungsmittel GmbH | NV 100 | CHF800,000.00 Ordinary | Hinterbergstr. 30, CH-6312 Steinhausen | ||||||
| Switzerland | Unilever ASCC AG | NV 100 | CHF1,000.00 Ordinary | Spitalstrasse 5, 8200, Schaffhausen | ||||||
| Switzerland | Unilever BCS Schweiz GmbH | NV 55.40 PLC 44.60 | CHF100.00 Ordinary | Bahnhofstrasse 19, CH-8240 , Thayngen | ||||||
| Switzerland | Unilever Business and Marketing Support | NV 100 | CHF1,000.00 Ordinary | Spitalstrasse 5, 8200 Schaffhausen | ||||||
| AG | ||||||||||
| Switzerland | Unilever Finance International AG | NV 100 | CHF1,000.00 Ordinary | Spitalstrasse 5, 8200, Schaffhausen | ||||||
| Switzerland | Unilever Overseas Holdings AG | PLC 100 | CHF1,000.00 Ordinary | Spitalstrasse 5, 8200, Schaffhausen | ||||||
| Switzerland | Unilever Reinsurance AG | NV 100 | CHF1,000.00 Ordinary | Baarerstrasse 75, CH-6302 Zug | ||||||
| Switzerland | Unilever Schaffhausen Service AG | NV 100 | CHF1,000.00 Ordinary | Spitalstrasse 5, 8200, Schaffhausen | ||||||
| Switzerland | Unilever Schweiz GmbH | NV 100 | CHF100,000.00 Ordinary | Bahnhofstrasse 19, CH-8240 Thayngen | ||||||
| Switzerland | Unilever Supply Chain Company AG | NV 100 | CHF1,000.00 Ordinary | Spitalstrasse 5, 8201, Schaffhausen | ||||||
| Switzerland | Unilever Swiss Holdings AG | NV 100 | CHF1,000.00 Ordinary | Spitalstrasse 5, 8200, Schaffhausen | ||||||
| 99.92 | Taiwan | Unilever Taiwan Limited | NV 64.50 PLC 35.42 | TWD10.00 Ordinary | 3F., No. 550, Sec. 4, Zhongxiao East Rd., Xinyi District, Taipei City | |||||
| Tanzania | Distan Limited | PLC 100 | TZS20.00 Ordinary | Plot No.4A Pugu Road, Dar Es Salaam | ||||||
| Tanzania | UAC of Tanzania Limited | PLC 100 | TZS20.00 Ordinary | Plot No.4A Pugu Road, Dar Es Salaam | ||||||
| Tanzania | Uniafric Trust Tanzania Limited | PLC 100 | TZS20.00 Ordinary | Plot No.4A Pugu Road, Dar Es Salaam | ||||||
| Tanzania | Unilever Tanzania Limited | PLC 100 | TZS20.00 Ordinary | Plot 4A Nyerere Road, Dar Es Salaam | ||||||
| Tanzania | Unilever Tea Tanzania Limited | PLC 100 | TZS20.00 Ordinary | P.O. Box 40, Mufindi | ||||||
| Thailand | Unilever Thai Holdings Limited | NV 64.55 PLC 35.45 | THB100.00 Ordinary | 161 Rama 9 Road, Huay Kwang, Bangkok 10310 | ||||||
| Thailand | Unilever Thai Services Limited | NV 64.55 PLC 35.45 | THB100.00 Ordinary | 161 Rama 9 Road, Huay Kwang, Bangkok 10310 | ||||||
| Thailand | Unilever Thai Trading Limited | NV 64.55 PLC 35.45 | THB100.00 Ordinary | 161 Rama 9 Road, Huay Kwang, Bangkok 10310 | ||||||
| 50.01 | Trinidad & Tobago | Unilever Caribbean Limited | NV 0 PLC 50.01 | TTD1.00 Ordinary | Eastern Main Road, Champs Fleurs | |||||
| 97.61 | Tunisia | Unilever Tunisia S.A. | NV 97.61 PLC 0 | TND6.00 Ordinary | Z.I. Voie Z4-2014 Mégrine Erriadh – Tunis | |||||
| 97.59 | Tunisia | Unilever Maghreb Export S.A. | NV 97.59 PLC 0 | TND5.00 Ordinary | Voie Z4-2014 Mégrine Erriadh – Tunis | |||||
| 47.82 | Tunisia | UTIC Distribution S.A. x | NV 47.82 PLC 0 | TND10.00 Ordinary | Z.I. Voie Z4 , Megrine Riadh, Tunis, 2014 | |||||
| 99.98 | Turkey | Unilever Gida Sanayi ve Ticaret AŞ° | NV 0.05 PLC 99.93 | TRY0.01 Ordinary | Saray Mahallesi Dr. Adnan Büyükdeniz Cad. No.13 34768 Ümraniye – İstanbul | |||||
| 99.98 | Turkey | Unilever Sanayi ve Ticaret Türk AŞ° | NV 64.54 PLC 35.44 | TRY0.01 Ordinary |
Saray Mahallesi Dr. Adnan Büyükdeniz Cad. No.13 34768 Ümraniye – İstanbul |
|||||
| 99.99 | Turkey | Besan Besin Sanayi ve Ticaret AŞ | NV 64.55 PLC 35.44 | TRY0.01 Ordinary | Saray Mahallesi Dr. Adnan Büyükdeniz Cad. No.13 34768 Ümraniye – İstanbul | |||||
| Annual Report on Form 20-F 2016 | Financial Statements | 139 |
Table of Contents
NOTES TO THE CONSOLIDATED FINANCIAL STATEMENTS
UNILEVER GROUP CONTINUED
27. GROUP COMPANIES CONTINUED
|
%
|
Country of
|
Name of Undertaking
|
% holding as between NV/PLC
|
Class of share held in subsidiary undertaking
|
Registered address
|
|||||
| 99.64 | Turkey | Dosan Konserve Sanayi ve Ticaret AŞ | NV 64.32 PLC 35.32 | TRY0.01 Ordinary | Saray Mahallesi Dr. Adnan Büyükdeniz Cad. No.13 34768 Ümraniye – İstanbul | |||||
| Uganda | Unilever Uganda Limited | PLC 100 | UGX20.00 Ordinary | Plot 10/12 Nyondo Close, Industrial Area, P.O. Box 3515 Kampala | ||||||
| Ukraine | Pallada Ukraine LLC | NV 7.12 PLC 92.88 | Membership Interest | 04119, 27-T, Dehtyarivska Str., Kyiv | ||||||
| Ukraine | Unilever Ukraine LLC | NV 100 | Membership Interest | 04119, 27-T, Dehtyarivska Str., Kyiv | ||||||
| 50 | United Arab Emirates | Severn Gulf FZCO x | NV 50 PLC 0 | AED100,000.00 Ordinary | PO Box 17053, Jebel Ali, Dubai | |||||
| 49 | United Arab Emirates | Unilever General Trading LLC x | NV 0 PLC 49 | AED1,000.00 Ordinary | Parcel ID 598633, German Emarati Business Centre, Dubai Complex for Investment First, Office BC6, Dubai | |||||
| United Arab Emirates | Unilever Gulf FZE | PLC 100 | AED1,000.00 Ordinary | P.O.Box 17055, Jebel Ali, Dubai | ||||||
| 49 | United Arab Emirates | Unilever Trading LLC x | NV 49 PLC 0 | AED1,000.00 Ordinary | P.O.Box 18221 European Business Center Dubai Investments Park 1 | |||||
| United States | ACI Brazil Holdings, LLC | NV 55.40 PLC 44.60 | Membership Interest | 700 Sylvan Avenue, Englewood Cliffs, New Jersey 07632-3201 | ||||||
| United States | ACUSA Brazil Holdings, LLC | NV 55.40 PLC 44.60 | Membership Interest | 700 Sylvan Avenue, Englewood Cliffs, New Jersey 07632-3201 | ||||||
| United States | Alberto Share Holdings, LLC | NV 55.40 PLC 44.60 | Membership Interest | 700 Sylvan Avenue, Englewood Cliffs, New Jersey 07632-3201 | ||||||
| United States | Alberto-Culver Company | NV 55.40 PLC 44.60 | No Par Value Ordinary | 700 Sylvan Avenue, Englewood Cliffs, New Jersey 07632-3201 | ||||||
| United States | Alberto-Culver International, Inc | NV 55.40 PLC 44.60 | USD1.00 Ordinary | 700 Sylvan Avenue, Englewood Cliffs, New Jersey 07632-3201 | ||||||
| United States | Alberto-Culver (P.R.), Inc | NV 55.40 PLC 44.60 | USD1.00 Ordinary | 700 Sylvan Avenue, Englewood Cliffs, New Jersey 07632-3201 | ||||||
| United States | Alberto-Culver USA, Inc | NV 55.40 PLC 44.60 | No Par Value Ordinary | 700 Sylvan Avenue, Englewood Cliffs, New Jersey 07632-3201 | ||||||
| United States | Ben & Jerry’s Franchising, Inc | NV 55.40 PLC 44.60 | USD1.00 Common | 700 Sylvan Avenue, Englewood Cliffs, New Jersey 07632-3201 | ||||||
| United States | Ben & Jerry’s Gift Card, LLC | NV 55.40 PLC 44.60 | Membership Interest | 700 Sylvan Avenue, Englewood Cliffs, New Jersey 07632-3201 | ||||||
| United States | Ben & Jerry’s Homemade, Inc | NV 55.40 PLC 44.60 | USD0.01 Common | 700 Sylvan Avenue, Englewood Cliffs, New Jersey 07632-3201 | ||||||
| United States | Bestfoods International (Holdings) Inc | NV 55.40 PLC 44.60 | USD100.00 Common | 700 Sylvan Avenue, Englewood Cliffs, New Jersey 07632-3201 | ||||||
| United States | Blueair Inc. | NV 100 | No Par Value Ordinary | 1013 Centre Road, City of Wilmington 19805, County of New Castle, Delaware | ||||||
| United States | Carapina LLC | NV 100 | Membership Interest | 233 Bleecker Street, New York, 10014 | ||||||
| United States | Chesebrough-Pond’s Manufacturing | NV 55.40 PLC 44.60 | No Par Value Ordinary | 700 Sylvan Avenue, Englewood Cliffs, New Jersey 07632-3201 | ||||||
| Company | ||||||||||
| United States | Conopco, Inc | NV 55.40 PLC 44.60 | USD1.00 Common | 700 Sylvan Avenue, Englewood Cliffs, New Jersey 07632-3201 | ||||||
| United States | Dermalogica, LLC | NV 55.40 PLC 44.60 | Membership Interest | 700 Sylvan Avenue, Englewood Cliffs, New Jersey 07632-3201 | ||||||
| United States | Dollar Shave Club, Inc. | NV 55.40 PLC 44.60 | Membership Interest | 13335 Maxella Ave. Marina del Rey, CA 90292 | ||||||
| United States | DTJJS, LLC | NV 55.40 PLC 44.60 | Membership Interest | 700 Sylvan Avenue, Englewood Cliffs, New Jersey 07632-3201 | ||||||
| United States | Grom Columbus LLC | NV 100 | Membership Interest | 233 Bleecker Street, New York, 10014 | ||||||
| United States | Grom Franchising LLC | NV 100 | Membership Interest | 2711 Centerville Road, Suite 400, Wilmington, Delaware | ||||||
| United States | Grom Malibu LLC | NV 100 | Membership Interest | 233 Bleecker Street, New York, 10014 | ||||||
| United States | Grom USA LLC | NV 100 | Membership Interest | 233 Bleecker Street, New York, 10014 | ||||||
| United States | Hollywood LLC | NV 100 | Membership Interest | 233 Bleecker Street, New York, 10014 | ||||||
| United States | Intuiskin Inc | NV 100 | No Par Value Ordinary | 55 East 59th Street, New York, 10022 | ||||||
| United States | Kate Somerville Holdings, LLC | NV 55.40 PLC 44.60 | Membership Interest | 700 Sylvan Avenue, Englewood Cliffs, New Jersey 07632-3201 | ||||||
| United States | Kate Somerville Skincare LLC | NV 55.40 PLC 44.60 | Membership Interest | 700 Sylvan Avenue, Englewood Cliffs, New Jersey 07632-3201 | ||||||
| United States | Lipton Industries, Inc | NV 55.40 PLC 44.60 | USD1.00 Ordinary | 700 Sylvan Avenue, Englewood Cliffs, New Jersey 07632-3201 | ||||||
| United States | Murad LLC | NV 55.40 PLC 44.60 | Membership Interest | 700 Sylvan Avenue, Englewood Cliffs, New Jersey 07632-3201 | ||||||
| United States | Pantresse, Inc | NV 55.40 PLC 44.60 | USD120.00 Ordinary | 700 Sylvan Avenue, Englewood Cliffs, New Jersey 07632-3201 | ||||||
| United States | Personal Care Marketing & Research Inc | NV 55.40 PLC 44.60 | USD 1.00 Common | 420 South Robertson Dr., #260, Beverly Hills, CA 90212 | ||||||
| United States | Ren USA Inc | PLC 100 | No Par Value Common | 700 Sylvan Avenue, Englewood Cliffs, New Jersey 07632-3201 | ||||||
| United States | Seventh Generation Canada, Inc. | NV 55.40 PLC 44.60 | No Par Value Common | 60 Lake Street, Suite 3N, Burlington, VT 05401 | ||||||
| United States | Seventh Generation, Inc. | NV 55.40 PLC 44.60 | USD.001 Common Shares | 60 Lake Street, Suite 3N, Burlington, VT 05401 | ||||||
| United States | Seventh Generation Ventures, Inc. | NV 55.40 PLC 44.60 | USD.001 Common Shares | 60 Lake Street, Suite 3N, Burlington, VT 05401 | ||||||
| United States | Skin Health Experts, LLC | NV 55.40 PLC 44.60 | Membership Interest | 700 Sylvan Avenue, Englewood Cliffs, New Jersey 07632-3201 | ||||||
| United States | Spatula LLC | NV 100 | Membership Interest | 233 Bleecker Street, New York, 10014 | ||||||
| United States | St. Ives Laboratories, Inc | NV 55.40 PLC 44.60 | USD0.01 Ordinary | 700 Sylvan Avenue, Englewood Cliffs, New Jersey 07632-3201 | ||||||
| United States | T2 US LLC | NV 55.40 PLC 44.60 | Membership Interest | 700 Sylvan Avenue, Englewood Cliffs, New Jersey 07632-3201 | ||||||
| United States | Talenti Gelato, LLC | NV 55.40 PLC 44.60 | Membership Interest | 700 Sylvan Avenue, Englewood Cliffs, New Jersey 07632-3201 | ||||||
| United States | Talenti Holdings, LLC | NV 55.40 PLC 44.60 | Membership Interest | 700 Sylvan Avenue, Englewood Cliffs, New Jersey 07632-3201 | ||||||
| United States | TIGI Linea Corp | NV 55.40 PLC 44.60 | No Par Value Ordinary | 700 Sylvan Avenue, Englewood Cliffs, New Jersey 07632-3201 | ||||||
| United States | Unilever AC Canada Holding, Inc | NV 55.40 PLC 44.60 | USD10.00 Ordinary | 700 Sylvan Avenue, Englewood Cliffs, New Jersey 07632-3201 | ||||||
| United States | Unilever BCS Sourcing US Inc | NV 55.40 PLC 44.60 | USD1.00 Ordinary | 700 Sylvan Avenue, Englewood Cliffs, New Jersey 07632-3201 | ||||||
| United States | Unilever BCS US Inc | NV 55.40 PLC 44.60 | USD1.00 Ordinary | 700 Sylvan Avenue, Englewood Cliffs, New Jersey 07632-3201 | ||||||
| United States | Unilever Bestfoods (Holdings) LLC | NV 25.10 PLC 74.90 | Membership Interest | 700 Sylvan Avenue, Englewood Cliffs, New Jersey 07632-3201 | ||||||
| United States | Unilever Capital Corporation | NV 55.40 PLC 44.60 | USD1.00 Ordinary | 700 Sylvan Avenue, Englewood Cliffs, New Jersey 07632-3201 | ||||||
| United States | Unilever Illinois Manufacturing, LLC | NV 55.40 PLC 44.60 | Membership Interest | 700 Sylvan Avenue, Englewood Cliffs, New Jersey 07632-3201 | ||||||
| United States | Unilever Manufacturing (US), Inc | NV 55.40 PLC 44.60 | USD1.00 Ordinary | 700 Sylvan Avenue, Englewood Cliffs, New Jersey 07632-3201 | ||||||
| United States | Unilever Trumbull Holdings, Inc | NV 42.54 PLC 57.46 | USD1.00 Common | 700 Sylvan Avenue, Englewood Cliffs, New Jersey 07632-3201 | ||||||
| United States | Unilever Trumbull Research Services, Inc | NV 55.40 PLC 44.60 | USD1.00 Ordinary | 700 Sylvan Avenue, Englewood Cliffs, New Jersey 07632-3201 | ||||||
| NV 55.40 PLC 44.60 | USD1.00 Cumulative | |||||||||
| Redeemable Preference | ||||||||||
| United States | Unilever United States Foundation, Inc | NV 55.40 PLC 44.60 | Membership Interest | 700 Sylvan Avenue, Englewood Cliffs, New Jersey 07632-3201 | ||||||
| United States | Unilever United States, Inc | NV 55.40 PLC 44.60 | USD0.3333 Common | 700 Sylvan Avenue, Englewood Cliffs, New Jersey 07632-3201 | ||||||
| United States | Unilever Ventures Advisory LLC | NV 55.40 PLC 44.60 | Membership Interest | 700 Sylvan Avenue, Englewood Cliffs, New Jersey 07632-3201 | ||||||
| Uruguay | Unilever del Uruguay S.R.L. | NV 100 | UYU1.00 Ordinary | Camino Carrasco 5975, Montevideu | ||||||
| Uruguay | Unilever Uruguay SCC S.A. | NV 100 | UYU1.00 Ordinary | Camino Carrasco 5976, Montevideu | ||||||
| Uruguay | Lever S.A. | NV 100 | UYP0.10 Ordinary | Camino Carrasco 5977, Montevideu | ||||||
| Uruguay | Arisco Productos Alimenticios Uruguay S.A. | NV 64.55 PLC 35.45 | UYP1.00 Ordinary | Camino Carrasco 5978, Montevideu | ||||||
| 140 | Financial Statements | Annual Report on Form 20-F 2016 |
Table of Contents
27. GROUP COMPANIES CONTINUED
|
%
|
Country of
|
Name of Undertaking
|
% holding as between NV/PLC
|
Class of share held in subsidiary undertaking
|
Registered address
|
|||||
| Venezuela | Unilever Andina Venezuela S.A. | NV 100 | VEB1,000.00 Ordinary | Edificio Torre Corp Banca, Piso 15, entre Avenidas Blandín y Los Chaguaramos, Urbanización La Castellana, Caracas | ||||||
| Vietnam | Unilever Vietnam International Company Limited | NV 100 | Membership Interest | Lot A2-3, Tay Bac Cu Chi Industry Zone, Tan An Hoi Ward, Cu Chi District, Ho Chi Minh City | ||||||
| Zambia | Unilever South East Africa Zambia Limited | PLC 100 | ZMK2.00 Cumulative Redeemable Preference | Stand No. 7136, Mwembeshi Road, P.O.Box 31953 Lusaka | ||||||
| PLC 100 | ZMK2.00 Ordinary | |||||||||
| Zimbabwe | Unilever – Zimbabwe (Pvt) Limited r | PLC 100 | ZWD2.00 Ordinary | Box 950 Harare | ||||||
SUBSIDIARY UNDERTAKINGS NOT INCLUDED IN THE CONSOLIDATION
|
%
|
Country of
|
Name of Undertaking
|
% holding as between NV/PLC
|
Class of share held in subsidiary undertaking
|
Registered address
|
|||||
| Cayman Islands | Personal Care Marketing & Technology Inc | NV 55.40 PLC 44.60 | KYD1.00 Ordinary | Walker Nominees Limited, 190 Elgin Ave, Georgetown, GC KY1-9001 | ||||||
| China | Blueair Technology (Shenzen) Co. Limited | NV 100 | Membership Interest | Unit 1A, Building B5, Zhaoshangju Guangming Science and Technology Park, Guanguang Road, Guangming New District, Shenzhen City | ||||||
| 60 | Cuba | Unilever Suchel, S.A. | NV 60 PLC 0 | USD1,000.00 Ordinary | Zona Especial de Desarrollo Mariel, Provincia Artemisa | |||||
| Djibouti | Unilever Djibouti FZCO Limited | PLC 100 | USD20.00 Ordinary | Haramous, BP 169 | ||||||
| Ecuador | Visanuasa S.A. | NV 100 | USD1.00 Ordinary | Km 25 Vía a Daule, Guayaquil | ||||||
| 67.39 | England | Big Sync Music Limited r ◇ | NV 67.39 PLC 0 | GBP0.001 A Ordinary | 5th Floor, 6 St Andrew Street, London, EC4A 3AE | |||||
| and Wales | NV 100 | GBP1.00 Preferred Ordinary | ||||||||
| 97.67 | England | Catexel Limited r ◇ | NV 0 PLC 97.67 | GBP0.01 Ordinary-A | 5th Floor, 6 St Andrew Street, London, EC4A 3AE | |||||
| 45.25 | and Wales | NV 0 PLC 45.25 | GBP0.01 Ordinary-G | |||||||
| 96.67 | NV 0 PLC 96.67 | GBP0.01 Preference | ||||||||
| 79.52 | England | Catexel Technologies Limited r ◇ | NV 0 PLC 79.52 | GBP0.001 A Ordinary | 5th Floor, 6 St Andrew Street, London, EC4A 3AE | |||||
| and Wales | ||||||||||
| 80.27 | England | Catexel Cellulosics Limited r ◇ | NV 0 PLC 80.27 | GBP0.001 A Ordinary | 5th Floor, 6 St Andrew Street, London, EC4A 3AE | |||||
| and Wales | ||||||||||
| England | Unilever Ventures General Partner | PLC 100 | GBP1.00 Ordinary | 5th Floor, 6 St Andrew Street, London, EC4A 3AE | ||||||
| and Wales | Limited ◇ | |||||||||
| Ghana | United Africa Trust Limited | PLC 100 | GHC10.00 Ordinary | Plot No. Ind/A/3A–4, Heavy Industrial Area, Tema | ||||||
| Greece | Lipoma Management Consulting SA | NV 100 | EUR10.00 Ordinary | Kymis ave & 10, Seneka str. GR-145 64 Kifissia | ||||||
| 67.21 | India | Hindustan Unilever Foundation | NV 0 PLC 67.21 | INR10.00 Ordinary | Unilever House, B. D. Sawant Marg, Chakala, Andheri (E), Mumbai 400 099 | |||||
| Indonesia | Unilever Trading Indonesia | NV 100 | IDR1,000.00 Ordinary |
Graha Unilever, Jalan Jenderal Gatot Subroto Kav 15, Jakarata 12930 |
||||||
| Israel | PCMR International Limited | NV 55.40 PLC 44.60 | NIS0.10 Ordinary | 3 Daniel Fisch St., Tel Aviv, 6473104, Israel | ||||||
| Jamaica | Unilever Jamaica Limited | PLC 100 | JMD1.00 Ordinary | White Marl Street, Spanish Town, PO Box 809, Parish Saint Catherine | ||||||
| Jordan | Unilever Jordan LLC | NV 100 | JOD10.00 Ordinary | Amman, Jordan | ||||||
| Kenya | Union East African Trust Limited* | PLC 100 | KES20.00 Ordinary | Commercial Street, P.O. BOX 40592-00100, Nairobi | ||||||
| Morocco | Societe Commerciale du Rif | PLC 100 | MAD50.00 Ordinary | Km 10, Route Cotiere, Ain Sebaa, Casablanca | ||||||
| Morocco | Societe Tangeroise de Parfumerie et d’Hygiene S.A.R.L. | PLC 100 | MAD50.00 Ordinary | Km 10, Route Cotiere, Ain Sebaa, Casablanca | ||||||
| 79.52 | Netherlands | Chemsenti B.V. | NV 0 PLC 79.52 | EUR1.00 Ordinary | Wassenaarseweg 72, 2333 AL Leiden | |||||
| Netherlands | Unilever Europe B.V.* | NV 100 | EUR1.00 Ordinary | Weena 455, 3013 AL Rotterdam | ||||||
| Rwanda | Unilever Tea Rwanda Limited | PLC 100 | RWF4270.00 Ordinary |
Nyarugenge, Nyarungenge, Umujyi wa Kigali, Rwanda, P O BOX 6428 KIgali |
||||||
| Scotland | Unilever Ventures (SLP) General Partner Limited | PLC 100 | GBP1.00 Ordinary | 15 Atholl Crescent, Edinburgh, EH3 8HA | ||||||
| 49 | United Arab Emirates | Unilever Home & Personal Care Products Manufacturing LLC x | NV 0 PLC 49 | AED1,000.00 Ordinary | P.O.Box 18221 European Business Center Dubai Investments Park 1 | |||||
| United States | DSC Distribution, Inc. | NV 55.40 PLC 44.60 | Membership Interest | 13335 Maxella Ave. Marina del Rey, CA 90292 | ||||||
| United States | Grom WTC LLC | NV 100 | Membership Interest | 233 Bleecker Street, New York, 10014 | ||||||
| United States | Grom Century City LLC | NV 100 | Membership Interest | 233 Bleecker Street, New York, 10014 | ||||||
| Zimbabwe | Birds Eye Foods (Private) Limited | PLC 100 | ZWD2.00 Ordinary | Box 950 Harare | ||||||
| Zimbabwe | Hudson and Knight (Private) Limited | PLC 100 | ZWD2.00 Ordinary | Box 950 Harare | ||||||
| Zimbabwe | Van den Berghs and Jurgens (Private) | PLC 100 | ZWD2.00 Ordinary | Box 950 Harare | ||||||
| Limited | ||||||||||
| Annual Report on Form 20-F 2016 | Financial Statements | 141 |
Table of Contents
NOTES TO THE CONSOLIDATED FINANCIAL STATEMENTS
UNILEVER GROUP CONTINUED
27. GROUP COMPANIES CONTINUED
ASSOCIATED UNDERTAKINGS
|
%
|
Country of
|
Name of Undertaking
|
% holding as between NV/PLC
|
Class of share held in subsidiary undertaking
|
Registered address
|
|||||
| 49 | Bahrain | Unilever Bahrain Co. W.L.L. | NV 0 PLC 49 | BHD50.00 Ordinary | 161, Road 328, Block 358, Zinj, Manama | |||||
| 50 | Brazil | ITB Ice Tea do Brazil Limitada | NV 32.28 PLC 17.72 | BRL1.00 Quotas | Rod. Dom Gabriel Paulino Bueno Couto, km. 66 – Part | |||||
| 40 | Canada | A&W Root Beer Beverages Canada Inc. | NV 25.82 PLC 14.18 | No Par Value Class B Common |
171 West Esplanade, Suite 300, North Vancouver, British Colombia V7M 3K9 |
|||||
| 49 | Cyprus | Unilever PMT Limited r | NV 0 PLC 49 | EUR1.71 Ordinary-B | 2 Marcou Dracou str., Engomi Industrial Estate, 2409 Nicosia | |||||
| 24.22 | England | Arecor Limited r ◇ | NV 0 PLC 24.22 | GBP0.01 Ordinary | Chesterford Research Park, Little Chesterford, Saffron, | |||||
| 35.72 | and Wales | NV 0 PLC 35.72 | GBP0.01 A Ordinary | Waldon CB10 1XL | ||||||
| 30.11 | England and Wales | Blis Media Limited r ◇ | NV 30.11 PLC 0 | GBP0.00001 Series A Participating Preference | 3rd Floor, 101 New Cavendish Street, London W1W 6XH | |||||
| 49.53 | England and Wales | CDDM Technology Limited r ◇ | NV 0 PLC 49.53 | GBP0.01 Preferred Ordinary | First Floor, 59-61 High Street West, Glossop SK13 8AZ | |||||
| 46.30 | England and Wales | Langholm Capital II L.P. | NV 46.30 PLC 0 | Partnership Interest | 1st Floor, Charles House, 5-11 Regent Street, London SW1Y 4LR | |||||
| 24.93 | England and Wales | Limitless Technology Limited r ◇ | NV 24.93 PLC 0 | GBP0.001 A Ordinary | Ashton, Hillbrow Road, Esher KT10 9UD | |||||
| 5.98 |
England and Wales |
SCA Investments Limited r ◇ | NV 5.98 PLC 0 | GBP0.001 A Ordinary | Unit 3 Morris House, Swainson Road, London W3 7UP | |||||
| 74.60 | NV 74.60 PLC 0 | GBP0.001 H Ordinary | ||||||||
| 25.19 | NV 25.19 PLC 0 | GBP0.001 I Ordinary | ||||||||
| 29.84 | NV 29.84 PLC 0 | GBP0.001 J Ordinary | ||||||||
| 64.22 | England and Wales | Trinny London Limited r ◇ | NV 64.22 PLC 0 | GBP0.01 Series A Preferred | Cambridge House, 16 High Street, Saffron Walden, Essex CB10 1AX | |||||
| 22.22 |
England and Wales |
Voltea Limited r ◇ | NV 0 PLC 22.22 | EUR0.10 A Ordinary | 5th Floor, 6 St Andrew Street, London EC4A 3AE | |||||
| 58.32 | NV 0 PLC 58.32 | EUR0.10 A Preferred | ||||||||
| 25.41 | NV 0 PLC 25.41 | EUR0.10 A1 Preferred | ||||||||
| 17.71 | NV 0 PLC 17.71 | EUR0.10 B Preferred | ||||||||
| 49.99 | France | Relais D’or Centrale S.A.S. | NV 32.27 PLC 17.72 | No Par Value Ordinary | 7 rue Armand Peugeot, 92500 Rueil-Malmaison | |||||
| 50 | Germany | Hans Henglein & Sohn GmbH | NV 32.78 PLC 17.22 | EUR100,000.00 Ordinary | Beerbachstraße 19, 91183 Abenberg | |||||
| 50 | Germany | Henglein & Co. Handels-und Beteiligungs GmbH & Co. KG ◇ | NV 32 PLC 18 | Partnership Interest | Beerbachstraße 19, 91183 Abenberg | |||||
| 50 | Germany | Henglein Geschäftsführungs GmbH ◇ | NV 32 PLC 18 | DEM 50,000.00 Ordinary | Beerbachstraße 19, 91183 Abenberg | |||||
| 50 | Germany | Henglein GmbH ◇ | NV 32 PLC 18 | DEM 50,000.00 Ordinary | Bad Bribaer Straße, 06647 Klosterhäseler | |||||
| 50 | Germany | Hochreiter Frischteigwaren GmbH | NV 32.78 PLC 17.22 | DEM250,000.00 Ordinary | Beerbachstruße 37, 17153 Stavenhagen | |||||
| 50 | Germany | Nürnberger Kloßteig NK GmbH & Co. KG ◇ | NV 32 PLC 18 | Partnership Interest | Beerbachstraße 19, 91183 Abenberg | |||||
| 33.61 | India | Kimberly Clark Lever Private Limited ◇ | NV 0 PLC 33.61 | INR10.00 Ordinary | GAT No. 934-937, Village Sanaswadi | |||||
| 40 | Indonesia | PT Anugrah Mutu Bersama | NV 26.22 PLC 13.78 | IDR1,000,000.00 Ordinary | Wisma Bango Lt.05, Jl.Sulaiman No.32, Jakarta Barat 11540 | |||||
| 51.78 | Ireland | Brandtone Holdings Limited r ◇ | NV 51.78 PLC 0 | EUR0.001 A Ordinary | 51-54 Pearse Street, Dublin 2 | |||||
| 70.38 | NV 70.38 PLC 0 | EUR0.001 Preferred Ordinary | ||||||||
| 21.58 | NV 21.58 PLC 0 | EUR0.001 Series 2 Preferred | ||||||||
| 19.99 | NV 19.99 PLC 0 | EUR0.001 Series 3 Preferred | ||||||||
| 23.70 | Ireland | Clavis Technology Limited r ◇ | NV 23.70 PLC 0 | EUR0.0025 Series A2 Convertible Redeemable Preference | 7th Floor, O’Connell Bridge House, D’Olier Street, Dublin 2 | |||||
| 9.95 | NV 9.95 PLC 0 | EUR0.0025 Series Convertible Redeemable Preference | ||||||||
| Ireland | Pepsi Lipton International Limited r | NV 100 | EUR1.00 B Ordinary | 70 Sir John Rogersons Quay, Dublin 2 | ||||||
| NV 100 | EUR1.00 C Preferred | |||||||||
| NV 100 | EUR1.00 E Ordinary | |||||||||
| NV 100 | EUR1.00 G Preferred | |||||||||
| 99.74 | Israel | Iluminage Beauty Limited r | NV 99.74 PLC 0 | ILS1.00 Preference |
Kochav Yokneam Building, 4th Floor, P.O Box 14, Yokneam Illit 20692 |
|||||
| 34 | Japan | Grom Japan K.K ◇ | NV 34 PLC 0 | JPY50,000.00 Ordinary | #308, 5–4–1, Minami Azabu, Tokyo | |||||
| 40.40 | Mauritius | Capvent Asia Consumer Fund Limited r | NV 40.40 PLC 0 | USD0.01 Class A |
3rd Floor, Harbour Front Building, President John Kennedy Street, Port Louis |
|||||
| 49 | Oman | Towell Unilever LLC | NV 0 PLC 49 | OMR10.00 Ordinary | Po Box 1711, Ruwi, Postal code 112 | |||||
| Philippines | Sto Tomas Paco Land Corp r ◇ | NV 64.55 PLC 35.45 | PHP1.00 Common |
11th Avenue corner 39th Street, Bonifacio Triangle, Bonifacio Global City, Taguig City, M.M |
||||||
| Philippines | WS Holdings Inc. r ◇ | NV 64.55 PLC 35.45 | PHP1.00 Common B |
Manggahan Light Industrial Compound, A. Rodriguez Avenue, Bo. Manggahan, Pasig City |
||||||
| Philippines | Selecta Walls Land Corp r ◇ | NV 64.55 PLC 35.45 | PHP10.00 Common B |
Manggahan Light Industrial Compound, A. Rodriguez Avenue, Bo. Manggahan, Pasig City |
||||||
| Philippines | Paco Platform 7.5 Inc. r ◇ | NV 64.55 PLC 35.45 | PHP1.00 Common |
11th Avenue corner 39th Street, Bonifacio Triangle, Bonifacio Global City, Taguig City, M.M |
||||||
| 35.10 | Philippines | Cavite Horizons Land, Inc. ◇ | NV 22.66 PLC 12.44 | PHP1.00 Common | 11th Avenue corner 39th Street, Bonifacio Triangle, | |||||
| NV 64.55 PLC 35.45 | PHP10,000.00 Preference | Bonifacio Global City, Taguig City | ||||||||
| 45.40 | Philippines | Industrial Realties, Inc. ◇ | NV 29.30 PLC 16.1 | PHP1.00 Common |
11th Avenue corner 39th Street, Bonifacio Triangle, Bonifacio Global City, Taguig City |
|||||
| 55 | Portugal | Fima Ola – Produtos Alimentares, S.A. | NV 0 PLC 55 | EUR500.00 Ordinary | Largo Monterroio Mascarenhas, 1,1099–081 Lisboa | |||||
| 55 | Portugal | Gallo Worldwide, Limitada | NV 0 PLC 55 | EUR1,000,000.00 Quotas | Largo Monterroio Mascarenhas, 1,1099–081 Lisboa | |||||
| 54 | Portugal | Transportadora Central do Infante, Limitada | NV 0 PLC 54 | EUR1.00 Ordinary | Largo Monterroio Mascarenhas, 1,1099–081 Lisboa | |||||
| 55 | Portugal | Unilever Jerónimo Martins, Limitada | NV 0 PLC 55 | EUR26,295,157.00 Quotas | Largo Monterroio Mascarenhas, 1,1099–081 Lisboa | |||||
| 55 | Portugal | Victor Guedes – Industria e Comercio, S.A. | NV 0 PLC 55 | EUR5.00 Ordinary | Largo Monterroio Mascarenhas, 1,1070-184 Lisboa | |||||
| 142 | Financial Statements | Annual Report on Form 20-F 2016 |
Table of Contents
27. GROUP COMPANIES CONTINUED
|
%
|
Country of
|
Name of Undertaking
|
% holding as between NV/PLC
|
Class of share held in subsidiary undertaking
|
Registered address
|
|||||
| 99.50 | Sweden | SachaJuan Haircare AB r ◇ | NV 99.50 PLC 0 | SEK1.00 Class B Shares | No 18 Office & Lounge, Briger Jarlsgatan 18,114 34 Stockholm | |||||
| 49 | United Arab Emirates | Al Gurg Unilever LLC | NV 0 PLC 49 | AED1,000.00 Ordinary | P.O.Box 49, Dubai | |||||
| 49 | United Arab Emirates | Al Gurg Unilever LLC | NV 0 PLC 49 | AED1,000.00 Ordinary | P.O.Box 49, Dubai | |||||
| 49 | United Arab Emirates | Thani Murshid Unilever LLC | NV 49 PLC 0 | AED1,000.00 Ordinary | Po Box 49, Abu Dhabi | |||||
| 8.30 | United States | Discuss.io Inc r ◇ | NV 8.30 PLC 0 | USD0.0001 Common Stock | C/O National Registered Agents, Inc.160 Green Tree Drive, | |||||
| 15.36 | NV 15.36 PLC 0 | USD0.0001 Series Seed | Suite 101, Dover, Delaware 19904 | |||||||
| 50 | United States | Pepsi Lipton Tea Partnership | NV 27.70 PLC 22.30 | Partnership Interest | 700 Sylvan Avenue, Englewood Cliffs, New Jersey 07632-3201 | |||||
| 57.27 | United States | Physic Ventures L.P. ◇ | NV 57.27 PLC 0 | Partnership Interest | 2711 Centerville Road, Suite 400, Wilmington, Delaware | |||||
Notes:
| * | Indicates an undertaking for which Unilever N.V. has issued a declaration of assumption of liability in accordance with section 403, Book 2, Dutch Civil Code. |
| o | Indicates an undertaking directly held by N.V. or PLC. All other undertakings are indirectly held. In the case of Hindustan Unilever Limited 51.50% is directly held and the remainder of 15.70% is indirectly held. In the case of Unilever Kenya Limited 39.13% is directly held and the remainder of 60.87% is indirectly held. In the case of Unilever Sri Lanka Limited 5.49% is directly held and the remainder of 94.51% is indirectly held. In the cases of each of Unilever BCS UK Services Limited and Unilever BCS UK Limited the ordinary shares are indirectly held and the redeemable golden share is directly held. In the case of Mixhold B.V. 27.71% is directly held and the remainder of 72.29% is indirectly held. In the cases of each of Unilever Gida Sarayi ve Ticaret A.Ş. and Unilever Sarayi ve Ticaret Turk A.Ş. a fractional amount is directly held and the remainder is indirectly held. In the case of United Holdings Limited, the ordinary shares are directly held and the preferred shares are indirectly held. In the case of Mixhold N.V., 55.37% of the ordinary – A shares are directly held, the remainder of 44.63% are indirectly held and the other share classes are indirectly held. In the case of Naamlooze Vernootschap Elma the ordinary shares are directly held and the cumulative preference shares are indirectly held. |
| † | Shares the undertaking holds in itself. |
| r | Denotes an undertaking where other classes of shares are held by a third party. |
| X | Unilever Trading LLC, Binzagr Unilever Limited, Unilever Home and Personal Care Products Manufacturing LLC and UTIC Distribution S.A. are subsidiary undertakings pursuant to section 1162(2)(b) Companies Act 2006. Servern Gulf FZCO is a subsidiary undertaking pursuant to section 1162(4)(a) Companies Act 2006. The Unilever Group is entitled to 50% of the profits made by Binzagr Unilever Limited. The Unilever Group is entitled to 80% of the profits made by Unilever Trading LLC, Unilever Home and Personal Care Products Manufacturing LLC and Unilever General Trading LLC. |
| ◇ | Accounted for as non-current investments within non-current financial assets. |
|
|
Exemption pursuant to Section 264b German Commercial Code. |
Further to the above disclosures (1) due to the unified board of Unilever N.V. and Unilever PLC, Unilever N.V. and Unilever PLC are each considered to be a subsidiary undertaking of the other in accordance with section 1162 (4) (b) of the Companies Act 2006 and (2) details of holdings of subsidiary undertakings in the share capitals of Unilever N.V. and Unilever PLC are given under the heading Our Shares on pages 30 to 32.
In addition, we have revenues either from our own operations or otherwise in the following locations: Afghanistan, Albania, Andorra, Angola, Antartica, Antigua, Armenia, Azerbaijan, Bahamas, Barbados, Belarus, Belize, Benin, Bhutan, Botswana, Brunei Darussalam, Burkina Faso, Burundi, Cameroon, Cape Verde, Central African Republic, Chad, Comoros, Congo, Democratic Republic of Congo, Dominica, Equatorial Guinea, Eritrea, Fiji, French Guiana, Gabon, Gambia, Georgia, Grenada, Guadeloupe, Guinea, Guinea-Bissau, Guyana, Haiti, Iceland, Iraq, Kiribati, Kuwait, Kyrgyzstan, Lesotho, Liberia, Libya, Liechtenstein, Luxembourg, Macao, Macedonia, Madagascar, Maldives, Mali, Malta, Marshall Islands, Martinique, Mauritania, Mauritius, Micronesia (federated states of), Moldova (Republic of), Monaco, Mongolia, Montenegro, Namibia, Nauru, Palau, Papua New Guinea, Qatar, Saint Kitts and Nevis, Saint Lucia, Saint Vincent and the Grenadines, Samoa, San Marino, Senegal, Seychelles, Sierra Leone, Solomon Islands, Somalia, South Sudan, Sudan, Suriname, Swaziland, Syrian Arab Republic, Tajikistan, Timor Leste, Togo, Tonga, Turkmenistan, Tuvalu, Uzbekistan, Vanuatu and Yemen.
The Group has established branches in Argentina, Azerbaijan, Cuba, the Dominican Republic, Kazakhstan, Moldova, the Netherlands, the Philippines, Rwanda, Russia, Saudi Arabia, Slovenia and Turkey.
| Annual Report on Form 20-F 2016 | Financial Statements | 143 |
Table of Contents
THIS PAGE IS INTENTIONALLY LEFT BLANK
| 144 | Financial Statements | Annual Report on Form 20-F 2016 |
Table of Contents
THIS PAGE IS INTENTIONALLY LEFT BLANK
| Annual Report on Form 20-F 2016 | Financial Statements | 145 |
Table of Contents
THIS PAGE IS INTENTIONALLY LEFT BLANK
| 146 | Financial Statements | Annual Report on Form 20-F 2016 |
Table of Contents
THIS PAGE IS INTENTIONALLY LEFT BLANK
| Annual Report on Form 20-F 2016 | Financial Statements | 147 |
Table of Contents
THIS PAGE IS INTENTIONALLY LEFT BLANK
| 148 | Financial Statements | Annual Report on Form 20-F 2016 |
Table of Contents
THIS PAGE IS INTENTIONALLY LEFT BLANK
| Annual Report on Form 20-F 2016 | Financial Statements | 149 |
Table of Contents
THIS PAGE IS INTENTIONALLY LEFT BLANK
| 150 | Financial Statements | Annual Report on Form 20-F 2016 |
Table of Contents
THIS PAGE IS INTENTIONALLY LEFT BLANK
| Annual Report on Form 20-F 2016 | Financial Statements | 151 |
Table of Contents
THIS PAGE IS INTENTIONALLY LEFT BLANK
| 152 | Financial Statements | Annual Report on Form 20-F 2016 |
Table of Contents
THIS PAGE IS INTENTIONALLY LEFT BLANK
| Annual Report on Form 20-F 2016 | Financial Statements | 153 |
Table of Contents
THIS PAGE IS INTENTIONALLY LEFT BLANK
| 154 | Financial Statements | Annual Report on Form 20-F 2016 |
Table of Contents
FINANCIAL CALENDAR
ANNUAL GENERAL MEETINGS
| Date | Voting Record date | Voting and Registration date | ||||
|
NV |
1.30pm 26 April 2017 | 29 March 2017 | 19 April 2017 | |||
|
PLC |
1.30pm 27 April 2017 | – | 25 April 2017 |
QUARTERLY DIVIDENDS
Dates listed below are applicable to all four Unilever listings (NV ordinary shares, PLC ordinary shares, NV New York shares, and PLC ADRs).
| Announced |
NV NY and PLC ADR
ex-dividend date |
NV and PLC | Record date | Payment date | ||||||
|
Quarterly dividend announced with the Q4 2016 results |
26 January 2017 | 8 February 2017 | 9 February 2017 | 10 February 2017 | 15 March 2017 | |||||
|
Quarterly dividend announced with the Q1 2017 results |
20 April 2017 | 3 May 2017 | 4 May 2017 | 5 May 2017 | 7 June 2017 | |||||
|
Quarterly dividend announced with the Q2 2017 results* |
20 July 2017 | 2 August 2017 | 3 August 2017 | 4 August 2017 | 6 September 2017 | |||||
|
Quarterly dividend announced with the Q3 2017 results |
19 October 2017 | 1 November 2017 | 2 November 2017 | 3 November 2017 | 13 December 2017 | |||||
| * | Also applicable for preferential dividends NV. |
| Annual Report on Form 20-F 2016 | Shareholder information | 155 |
Table of Contents
| 156 | Annual Report on Form 20-F 2016 |
Table of Contents
ADDITIONAL INFORMATION FOR US LISTING PURPOSES
FORM 20-F REFERENCES
| Item 1 | Identity of Directors, Senior Management and Advisers | n/a | ||||
| Item 2 | Offer Statistics and Expected Timetable | n/a | ||||
| Item 3 | Key Information | |||||
| A. | Selected Financial Data | 111, 162, 168 – 170 | ||||
| B. | Capitalisation and Indebtedness | n/a | ||||
| C. | Reasons for the offer and use of proceeds | n/a | ||||
| D. | Risk factors | 36 – 41 | ||||
| Item 4 | Information on the Company | |||||
| A. | History and development of the company | 17 – 18, 22 – 35, 87, 106 –107, 126 –128, 155, 175 – 178 | ||||
| B. | Business overview | 1, 6 – 11, 14 – 29, 41, 90 – 92, 175 – 178 | ||||
| C. | Organisational structure | 29, 131 – 143 | ||||
| D. | Property, plant and equipment | 106 – 107, 178 | ||||
| Item 4A | Unresolved Staff Comments | n/a | ||||
| Item 5 | Operating and Financial Review and Prospects | |||||
| A. | Operating results | 4, 6 – 7, 12, 21 – 22, 23 – 28, 41, 117 – 118, 175 – 178 | ||||
| B. | Liquidity and capital resources | 25, 36, 78, 87, 106 – 107, 110 – 111, 114 – 126, 177 – 178 | ||||
| C. | Research and development, patents and licences, etc. | 8 – 9, 92 – 93 | ||||
| D. | Trend information | 4, 6 – 7, 23 – 28, 37 – 41, 175 – 178 | ||||
| E. | Off-balance sheet arrangements | 115 – 120, 122 – 126 | ||||
| F. | Tabular disclosure of contractual obligations | 26, 106 – 107, 114, 125 – 126 | ||||
| G. | Safe harbour | Inside back cover | ||||
| Item 6 | Directors, Senior Management and Employees | |||||
| A. | Directors and senior management | 3, 29, 159 | ||||
| B. | Compensation | 25, 41, 48, 63, 94 – 100 | ||||
| C. | Board practices | 3, 5, 29, 30, 42 – 47, 62 – 63, 73, 75 | ||||
| D. | Employees | 94, 159 | ||||
| E. | Share ownership | 67, 70 – 74, 99 – 100, 159 | ||||
| Item 7 | Major Shareholders and Related Party Transactions | |||||
| A, | Major shareholders | 29, 31 – 33, 160 | ||||
| B. | Related party transactions | 129, 160 | ||||
| C. | Interest of experts and counsel | n/a | ||||
| Item 8 | Financial Information | |||||
| A. | Consolidated statements and other financial information | 78, 79, 84 – 143, 155, 162, 170 – 174 | ||||
| B. | Significant changes | 130 | ||||
| Item 9 | The Offer and Listing | |||||
| A. | Offer and listing details | 160 – 161 | ||||
| B. | Plan of distribution | n/a | ||||
| C. | Markets | 30 – 32 | ||||
| D. | Selling shareholders | n/a | ||||
| E. | Dilution | n/a | ||||
| F. | Expenses of the issue | n/a | ||||
| Item 10 | Additional Information | |||||
| A. | Share capital | n/a | ||||
| B. | Articles of association | 29 – 35, 46 – 47, 71, 111, 163 | ||||
| C. | Material contracts | 29, 33, 163 | ||||
| D. | Exchange controls | 163 | ||||
| E. | Taxation | 164 – 165 | ||||
| F. | Dividends and paying agents | n/a | ||||
| G. | Statement by experts | n/a | ||||
| H. | Documents on display | 155, 163 | ||||
| I. | Subsidiary information | n/a | ||||
| Annual Report on Form 20-F 2016 | 157 |
Table of Contents
ADDITIONAL INFORMATION FOR US LISTING PURPOSES CONTINUED
| Item 11 | Quantitative and Qualitative Disclosures About Market Risk | 94 – 99, 108 – 111, 115 – 124, 178 | ||||||
| Item 12 | Description of Securities Other than Equity Securities | |||||||
| A. | Description of debt securities | n/a | ||||||
| B. | Description of warrants and rights | n/a | ||||||
| C. | Description of other securities | n/a | ||||||
| D.1 | Name of depositary and address of principal executive | n/a | ||||||
| D.2 | Title of ADRS and brief description of provisions | n/a | ||||||
| D.3 | Transfer agent fees and charges | 166 | ||||||
| D.4 | Transfer agent payments – fiscal year 2016 | 166 | ||||||
| Item 13 | Defaults, Dividend Arrearages and Delinquencies | |||||||
| A. | Defaults | 166 | ||||||
| B. | Dividend arrearages and delinquencies | 166 | ||||||
| Item 14 | Material Modifications to the Rights of Security Holders and Use of Proceeds | n/a | ||||||
| Item 15 | Controls and Procedures | 35 – 36, 43, 79, 167 | ||||||
| Item 16 | Reserved | n/a | ||||||
| Item 16A | Audit Committee Financial Expert | 30, 42 | ||||||
| Item 16B | Code of Ethics | 35, 36, 44 | ||||||
| Item 16C | Principal Accountant Fees and Services | 42 – 43, 167 | ||||||
| Item 16D | Exemptions From The Listing Standards For Audit Committees | n/a | ||||||
| Item 16E | Purchases Of Equity Securities By The Issuer and Affiliated Purchasers | 30 – 32, 167 | ||||||
| Item 16F | Change in Registrant’s Certifying Accountant | n/a | ||||||
| Item 16G | Corporate Governance | 29 – 35 | ||||||
| Item 16H | Mine Safety Disclosures | n/a | ||||||
| Item 17 | Financial Statements | 78, 79, 84 – 143, 170 – 174 | ||||||
| Item 18 | Financial Statements | 78, 79, 84 – 143, 170 – 174 | ||||||
| Item 19 | Exhibits |
Please refer to the Exhibit list located immediately following the signature page for this document as filed with the SEC. |
||||||
| 158 | Annual Report on Form 20-F 2016 |
Table of Contents
DIRECTORS, SENIOR MANAGEMENT AND EMPLOYEES
EMPLOYEES
The average number of employees for the last three years is provided in note 4A on page 94. The average number of employees during 2016 included 9,297 seasonal workers. We believe our relationship with our employees and any labour unions of which they may be part is satisfactory in all material respects.
GLOBAL EMPLOYEE SHARE PLANS (SHARES)
In November 2014, Unilever’s new global employee plan ‘SHARES’ was launched in 17 countries. SHARES gives eligible Unilever employees below senior management level the opportunity to invest between € 25 and € 200 per month from their net salary in Unilever shares. For every three shares our employees buy (Investment Shares), Unilever will give them one free Matching Share, which will vest if employees hold their Investment Shares for at least three years. The Matching Shares are not subject to any performance conditions. In 2015, SHARES was rolled out globally and is now offered in more than 100 countries. Executive Directors are not eligible to participate in SHARES. As of 21 February 2017, awards for 182,558 NV and 130,942 PLC shares were outstanding under SHARES.
NORTH AMERICAN SHARE PLANS
Unilever also maintains share plans for its North American employees that are governed by an umbrella plan referred to as the Unilever North America Omnibus Equity Compensation Plan. These plans are the North American equivalents of the GSIP, MCIP and SHARES plans. The rules governing these share plans are materially the same as the rules governing the GSIP, MCIP and SHARES plans, respectively. However, the plans contain non-competition and non-solicitation covenants and they are subject to US and Canadian employment and tax laws. The plans are administered by the North America Compensation Committee of Unilever United States Inc. and they are governed by New York law.
The foregoing description of the Unilever North America Omnibus Equity Compensation Plan does not purport to be complete and is qualified in its entirety by reference to the Unilever North America Omnibus Equity Compensation Plan, including all amendments thereto, filed as Exhibit 99.1 to the Form S-8 (File No. 333-185299) filed with the SEC on 6 December 2012, which is incorporated herein by reference.
COMPENSATION COMMITTEE
The Committee is concerned with the remuneration of the Executive and Non-Executive Directors and the tier of management directly below the Boards. It also has responsibility for the cash and executive and all employee share-based incentive plans, the Remuneration Policy and performance evaluation of the Unilever Leadership Executive and senior corporate executives.
DIRECTORS AND SENIOR MANAGEMENT
FAMILY RELATIONSHIP
There are no family relationships between any of our Executive Directors, members of the ULE or Non-Executive Directors.
OTHER ARRANGEMENTS
None of our Non-Executive Directors, Executive Directors or other key management personnel are elected or appointed under any arrangement or understanding with any major shareholder, customer, supplier or otherwise.
| Annual Report on Form 20-F 2016 | 159 |
Table of Contents
ADDITIONAL INFORMATION FOR US LISTING PURPOSES CONTINUED
MAJOR SHAREHOLDERS AND RELATED PARTY TRANSACTIONS
THE OFFER AND LISTING
SHARE PRICES AT 31 DECEMBER 2016
The share prices of the ordinary shares at the end of the year were as follows:
|
NV per € 0.16 ordinary share in Amsterdam
|
|
€
39.12
|
|
|
|
NV per € 0.16 ordinary share in New York
|
|
US$41.06
|
|
|
|
PLC per 3 1 / 9 p ordinary share in London
|
|
£32.93
|
|
|
|
PLC per 3 1 / 9 p ordinary share in New York
|
|
US$40.70
|
|
|
| 160 | Annual Report on Form 20-F 2016 |
Table of Contents
MONTHLY HIGH AND LOW PRICES FOR THE MOST RECENT SIX MONTHS
| August | September | October | November | December | January | February | ||||||||||||||||||||||||||
| 2016 | 2016 | 2016 | 2016 | 2016 | 2017 | 2017 | ||||||||||||||||||||||||||
|
NV per € 0.16 ordinary share in Amsterdam |
High | 41.89 | 42.94 | 41.79 | 38.30 | 39.28 | 39.37 | 44.80 (a) | ||||||||||||||||||||||||
|
(in € ) |
Low | 40.58 | 40.23 | 38.18 | 36.39 | 36.80 | 37.40 | 37.49 (a) | ||||||||||||||||||||||||
|
NV per € 0.16 ordinary share in New York |
High | 46.84 | 47.88 | 46.43 | 42.19 | 41.06 | 42.32 | 48.79 (a) | ||||||||||||||||||||||||
|
(in US$) |
Low | 44.93 | 44.94 | 41.67 | 38.66 | 39.12 | 40.27 | 40.56 (a) | ||||||||||||||||||||||||
|
PLC per 3 1 / 9 p ordinary share in London |
High | 36.42 | 36.63 | 37.64 | 34.44 | 32.93 | 34.03 | 37.97 (a) | ||||||||||||||||||||||||
|
(in £) |
Low | 34.78 | 35.05 | 34.18 | 31.07 | 30.92 | 31.91 | 32.04 (a) | ||||||||||||||||||||||||
|
PLC per 3 1 / 9 p ordinary share in New York |
High | 47.34 | 48.63 | 47.75 | 42.15 | 40.79 | 42.58 | 48.53 (a) | ||||||||||||||||||||||||
|
(in US$) |
Low | 45.86 | 46.02 | 41.67 | 38.78 | 39.14 | 40.51 | 41.11 (a) | ||||||||||||||||||||||||
| (a) | Through 21 February 2017 (the latest practicable date for inclusion in this report). |
QUARTERLY HIGH AND LOW PRICES FOR 2016 AND 2015
| 1st | 2nd | 3rd | 4th | |||||||||||||||||||||
| Quarter | Quarter | Quarter | Quarter | |||||||||||||||||||||
| 2016 | 2016 | 2016 | 2016 | |||||||||||||||||||||
|
NV per € 0.16 ordinary share in Amsterdam (in € ) |
High | 40.89 | 41.91 | 42.94 | 41.79 | |||||||||||||||||||
| Low | 36.69 | 38.15 | 40.23 | 36.39 | ||||||||||||||||||||
|
NV per € 0.16 ordinary share in New York (in US$) |
High | 45.52 | 47.05 | 47.88 | 46.43 | |||||||||||||||||||
| Low | 40.27 | 42.87 | 44.93 | 38.66 | ||||||||||||||||||||
|
PLC per 3 1 / 9 p ordinary share in London (in £) |
High | 31.90 | 35.79 | 36.79 | 37.64 | |||||||||||||||||||
| Low | 27.63 | 30.42 | 34.78 | 30.92 | ||||||||||||||||||||
|
PLC per 3 1 / 9 p ordinary share in New York (in US$) |
High | 45.77 | 47.91 | 48.63 | 47.75 | |||||||||||||||||||
| Low | 40.09 | 43.62 | 45.86 | 38.78 | ||||||||||||||||||||
| 1st | 2nd | 3rd | 4th | |||||||||||||||||||||
| Quarter | Quarter | Quarter | Quarter | |||||||||||||||||||||
| 2015 | 2015 | 2015 | 2015 | |||||||||||||||||||||
|
NV per € 0.16 ordinary share in Amsterdam (in € ) |
High | 40.52 | 41.88 | 42.32 | 42.48 | |||||||||||||||||||
| Low | 31.55 | 36.86 | 33.87 | 35.82 | ||||||||||||||||||||
|
NV per € 0.16 ordinary share in New York (in US$) |
High | 43.94 | 44.98 | 46.51 | 46.04 | |||||||||||||||||||
| Low | 37.64 | 41.40 | 38.43 | 40.25 | ||||||||||||||||||||
|
PLC per 3 1 / 9 p ordinary share in London (in £) |
High | 29.52 | 30.15 | 29.66 | 29.60 | |||||||||||||||||||
| Low | 25.73 | 27.30 | 25.24 | 26.82 | ||||||||||||||||||||
|
PLC per 3 1 / 9 p ordinary share in New York (in US$) |
High | 44.67 | 45.08 | 46.07 | 45.72 | |||||||||||||||||||
| Low | 39.03 | 41.83 | 39.08 | 40.84 | ||||||||||||||||||||
| ANNUAL HIGH AND LOW PRICES | ||||||||||||||||||||||||
| 2016 | 2015 | 2014 | 2013 | 2012 | ||||||||||||||||||||
|
NV per € 0.16 ordinary share in Amsterdam (in € ) |
High | 42.94 | 42.48 | 33.49 | 32.89 | 29.50 | ||||||||||||||||||
| Low | 36.39 | 31.55 | 27.16 | 27.50 | 24.56 | |||||||||||||||||||
|
NV per € 0.16 ordinary share in New York (in US $) |
High | 47.88 | 46.51 | 44.31 | 42.78 | 38.75 | ||||||||||||||||||
| Low | 38.66 | 37.64 | 36.72 | 37.27 | 30.79 | |||||||||||||||||||
|
PLC per 3 1 / 9 p ordinary share in London (in £) |
High | 37.64 | 30.15 | 27.29 | 28.85 | 24.29 | ||||||||||||||||||
| Low | 27.63 | 25.24 | 23.06 | 23.19 | 19.94 | |||||||||||||||||||
|
PLC per 3 1 / 9 p ordinary share in New York (in US $) |
High | 48.63 | 46.07 | 45.85 | 43.54 | 39.37 | ||||||||||||||||||
| Low | 38.78 | 39.03 | 37.85 | 37.67 | 31.04 | |||||||||||||||||||
There have not been any significant suspensions in the past three years.
| Annual Report on Form 20-F 2016 | 161 |
Table of Contents
ADDITIONAL INFORMATION FOR US LISTING PURPOSES CONTINUED
DIVIDEND RECORD
The following tables show the dividends declared and dividends paid by NV and PLC for the last five years, expressed in terms of the revised share denominations which became effective from 22 May 2006. Differences between the amounts ultimately received by US holders of NV and PLC shares are the result of changes in exchange rates between the equalisation of the dividends and the date of payment.
Following agreement at the 2009 Annual General Meetings (AGMs) and separate meetings of ordinary shareholders, the Equalisation Agreement was modified to facilitate the payment of quarterly dividends from 2010 onwards.
| 2016 | 2015 | 2014 | 2013 | 2012 | ||||||||||||||||
|
Dividends declared for the year |
||||||||||||||||||||
|
NV dividends |
||||||||||||||||||||
|
Dividend per € 0.16 |
€1.28 | € 1.21 | € 1.14 | € 1.08 | € 0.97 | |||||||||||||||
|
Dividend per € 0.16 (US Registry) |
US$1.42 | US$1.32 | US$1.47 | US$1.44 | US$1.25 | |||||||||||||||
|
PLC dividends |
||||||||||||||||||||
|
Dividend per 3 1 / 9 p |
£1.09 | £0.88 | £0.90 | £0.91 | £0.79 | |||||||||||||||
|
Dividend per 3 1 / 9 p (US Registry) |
US$1.42 | US$1.32 | US$1.47 | US$1.44 | US$1.25 | |||||||||||||||
|
Dividends paid during the year |
||||||||||||||||||||
|
NV dividends |
||||||||||||||||||||
|
Dividend per € 0.16 |
€1.26 | € 1.19 | € 1.12 | € 1.05 | € 0.95 | |||||||||||||||
|
Dividend per € 0.16 (US Registry) |
US$1.40 | US$1.32 | US$1.51 | US$1.40 | US$1.23 | |||||||||||||||
|
PLC dividends |
||||||||||||||||||||
|
Dividend per 3 1 / 9 p |
£1.04 | £0.87 | £0.91 | £0.89 | £0.77 | |||||||||||||||
|
Dividend per 3 1 / 9 p (US Registry) |
US$1.40 | US$1.32 | US$1.51 | US$1.40 | US$1.23 | |||||||||||||||
EXCHANGE RATES
Unilever reports its financial results and balance sheet position in euros. Other currencies which may significantly impact our financial statements are sterling and US dollars. Average and year-end exchange rates for these two currencies for the last five years are given below.
| 2016 | 2015 | 2014 | 2013 | 2012 | ||||||||||||||||
|
Year end |
||||||||||||||||||||
|
€ 1 = US$ |
1.049 | 1.092 | 1.215 | 1.378 | 1.318 | |||||||||||||||
|
€ 1 = £ |
0.857 | 0.736 | 0.781 | 0.833 | 0.816 | |||||||||||||||
|
Average |
||||||||||||||||||||
|
€ 1 = US$ |
1.111 | 1.111 | 1.334 | 1.325 | 1.283 | |||||||||||||||
|
€ 1 = £ |
0.815 | 0.725 | 0.807 | 0.849 | 0.811 | |||||||||||||||
On 21 February 2017 (the latest practicable date for inclusion in this report), the exchange rates between euros and US dollars and between euros and sterling as published in the Financial Times in London were as follows: € 1 = US$1.063 and € 1 = £0.855.
Noon Buying Rates in New York for cable transfers in foreign currencies as certified for customs purposes by the Federal Reserve Bank of New York were as follows:
| 2016 | 2015 | 2014 | 2013 | 2012 | ||||||||||||||||
|
Year end |
||||||||||||||||||||
|
€ 1 = US$ |
1.055 | 1.086 | 1.210 | 1.378 | 1.319 | |||||||||||||||
|
Average |
||||||||||||||||||||
|
€ 1 = US$ |
1.103 | 1.110 | 1.330 | 1.328 | 1.286 | |||||||||||||||
|
High |
||||||||||||||||||||
|
€ 1 = US$ |
1.152 | 1.202 | 1.393 | 1.382 | 1.346 | |||||||||||||||
|
Low |
||||||||||||||||||||
|
€ 1 = US$ |
1.038 | 1.052 | 1.210 | 1.277 | 1.206 | |||||||||||||||
On 17 February 2017 (the latest available data for inclusion in this report), the Noon buying rate was € 1 = US$1.061.
High and low exchange rate values for each of the last six months:
| August | September | October | November | December | January | February | ||||||||||||||||||||||
| 2016 | 2016 | 2016 | 2016 | 2016 | 2017 | 2017 (a) | ||||||||||||||||||||||
|
High € 1 = US $ |
1.133 | 1.127 | 1.121 | 1.112 | 1.076 | 1.079 | 1.080 | |||||||||||||||||||||
|
Low € 1 = US $ |
1.108 | 1.116 | 1.087 | 1.056 | 1.038 | 1.042 | 1.058 | |||||||||||||||||||||
| (a) | Through 17 February 2017 (the latest available data for inclusion in this report). |
| 162 | Annual Report on Form 20-F 2016 |
Table of Contents
| Annual Report on Form 20-F 2016 | 163 |
Table of Contents
ADDITIONAL INFORMATION FOR US LISTING PURPOSES CONTINUED
| 164 | Annual Report on Form 20-F 2016 |
Table of Contents
| Annual Report on Form 20-F 2016 | 165 |
Table of Contents
ADDITIONAL INFORMATION FOR US LISTING PURPOSES CONTINUED
| 166 | Annual Report on Form 20-F 2016 |
Table of Contents
PURCHASES OF EQUITY SECURITIES
SHARE PURCHASES DURING 2016
Please also refer to ‘Our shares’ section on pages 30 to 32.
| € million | ||||||||||||||||
| Of which, number of | Maximum value that | |||||||||||||||
| shares purchased | may yet be purchased | |||||||||||||||
| Total number of | Average price | as part of publicly | as part of publicly | |||||||||||||
| shares purchased | paid per share (€) | announced plans | announced plans | |||||||||||||
|
January |
- | - | - | - | ||||||||||||
|
February (a) |
13,434 | 38.82 | - | - | ||||||||||||
|
March |
- | - | - | - | ||||||||||||
|
April |
- | - | - | - | ||||||||||||
|
May (a) |
3,076,000 | 40.22 | - | - | ||||||||||||
|
June (a) |
3,081,750 | 40.45 | - | - | ||||||||||||
|
July |
- | - | - | - | ||||||||||||
|
August |
- | - | - | - | ||||||||||||
|
September |
- | - | - | - | ||||||||||||
|
October |
- | - | - | - | ||||||||||||
|
November |
- | - | - | - | ||||||||||||
|
December |
- | - | - | - | ||||||||||||
|
Total |
6,171,184 | 40.33 | - | - | ||||||||||||
| (a) | Shares were purchased to satisfy commitments to deliver shares under our share-based plans as described in note 4C ‘Share-based compensation plans’ on pages 99 and 100. |
Between 31 December 2016 and 21 February 2017 (the latest practicable date for inclusion in this report) neither NV or PLC conducted any share repurchases.
MANAGEMENT’S REPORT ON INTERNAL CONTROL OVER FINANCIAL REPORTING
In accordance with the requirements of Section 404 of the US Sarbanes-Oxley Act of 2002, the following report is provided by management in respect of the Group’s internal control over financial reporting (as defined in rule 13a–15(f) or rule 15d–15(f) under the US Securities Exchange Act of 1934):
| • | Unilever’s management is responsible for establishing and maintaining adequate internal control over financial reporting for the Group; |
| • | Unilever’s management has used the Committee of Sponsoring Organizations of the Treadway Commission (COSO) framework (2013) to evaluate the effectiveness of our internal control over financial reporting. Management believes that the COSO framework (2013) is a suitable framework for its evaluation of our internal control over financial reporting because it is free from bias, permits reasonably consistent qualitative and quantitative measurements of internal controls, is sufficiently complete so that those relevant factors that would alter a conclusion about the effectiveness of internal controls are not omitted and is relevant to an evaluation of internal control over financial reporting; |
| • | Management has assessed the effectiveness of internal control over financial reporting as of 31 December 2016, and has concluded that such internal control over financial reporting is effective; and |
| • | KPMG LLP and KPMG Accountants N.V., who have audited the consolidated financial statements of the Group for the year ended 31 December 2016, have also audited the effectiveness of internal control over financial reporting as at 31 December 2016 and have issued an attestation report on internal control over financial reporting. |
PRINCIPAL ACCOUNTANT FEES AND SERVICES
|
€ million
2016 |
€
million
2015 |
€
million
2014 |
||||||||||
|
Audit fees (a) |
14 | 14 | 14 | |||||||||
|
Audit-related fees (b) |
– (c) | – (c) | – (c) | |||||||||
|
Tax fees |
– (c) | – (c) | – (c) | |||||||||
|
All other fees |
– (c) | – (c) | – (c) | |||||||||
| (a) | Amount payable to KPMG in respect of services supplied to associated pension schemes was less than € 1 million individually and in aggregate (2015: less than € 1 million individually and in aggregate; 2014: less than € 1 million individually and in aggregate). |
| (b) | Includes other audit services which comprise audit and similar work that regulations or agreements with third parties require the auditors to undertake. |
| (c) | Amounts paid in relation to each type of service are individually less than € 1 million. In aggregate the fees paid were € 1 million (2015: € 1 million, 2014: less than € 1 million). |
| Annual Report on Form 20-F 2016 | 167 |
Table of Contents
ADDITIONAL INFORMATION FOR US LISTING PURPOSES CONTINUED
SELECTED FINANCIAL DATA
The schedules below provide the Group’s selected financial data for the five most recent financial years.
| € million | € million | € million | € million | € million | ||||||||||||||||
| Consolidated income statement | 2016 | 2015 | 2014 | 2013 | 2012 | |||||||||||||||
|
Turnover |
52,713 | 53,272 | 48,436 | 49,797 | 51,324 | |||||||||||||||
|
Operating profit |
7,801 | 7,515 | 7,980 | 7,517 | 6,977 | |||||||||||||||
|
Net finance costs |
(563 | ) | (493 | ) | (477 | ) | (530 | ) | (535 | ) | ||||||||||
| Share of net profit/(loss) of joint ventures and associates and other income/(loss) from non-current investments | 231 | 198 | 143 | 127 | 91 | |||||||||||||||
|
Profit before taxation |
7,469 | 7,220 | 7,646 | 7,114 | 6,533 | |||||||||||||||
|
Taxation |
(1,922 | ) | (1,961 | ) | (2,131 | ) | (1,851 | ) | (1,697 | ) | ||||||||||
|
Net profit |
5,547 | 5,259 | 5,515 | 5,263 | 4,836 | |||||||||||||||
|
Attributable to: |
||||||||||||||||||||
|
Non-controlling interests |
363 | 350 | 344 | 421 | 468 | |||||||||||||||
|
Shareholders’ equity |
5,184 | 4,909 | 5,171 | 4,842 | 4,368 | |||||||||||||||
| € million | € million | € million | € million | € million | ||||||||||||||||
| Combined earnings per share (a) | 2016 | 2015 | 2014 | 2013 | 2012 | |||||||||||||||
|
Basic earnings per share |
1.83 | 1.73 | 1.82 | 1.71 | 1.54 | |||||||||||||||
|
Diluted earnings per share |
1.82 | 1.72 | 1.79 | 1.66 | 1.50 | |||||||||||||||
|
(a) For the basis of the calculations of combined earnings per share see Note 7 ‘Combined earnings per share’ on page 103. |
|
|||||||||||||||||||
| € million | € million | € million | € million | € million | ||||||||||||||||
| Consolidated balance sheet | 2016 | 2015 | 2014 | 2013 | 2012 | |||||||||||||||
|
Non-current assets |
42,545 | 39,612 | 35,680 | 33,391 | 34,042 | |||||||||||||||
|
Current assets |
13,884 | 12,686 | 12,347 | 12,122 | 12,147 | |||||||||||||||
|
Total assets |
56,429 | 52,298 | 48,027 | 45,513 | 46,189 | |||||||||||||||
|
Current liabilities |
20,556 | 20,019 | 19,642 | 17,382 | 15,815 | |||||||||||||||
|
Non-current liabilities |
18,893 | 16,197 | 14,122 | 13,316 | 14,425 | |||||||||||||||
|
Total liabilities |
39,449 | 36,216 | 33,764 | 30,698 | 30,240 | |||||||||||||||
|
Shareholders’ equity |
16,354 | 15,439 | 13,651 | 14,344 | 15,392 | |||||||||||||||
|
Non-controlling interests |
626 | 643 | 612 | 471 | 557 | |||||||||||||||
|
Total equity |
16,980 | 16,082 | 14,263 | 14,815 | 15,949 | |||||||||||||||
|
Total liabilities and equity |
56,429 | 52,298 | 48,027 | 45,513 | 46,189 | |||||||||||||||
| € million | € million | € million | € million | € million | ||||||||||||||||
| Consolidated cash flow statement | 2016 | 2015 | 2014 | 2013 | 2012 | |||||||||||||||
|
Net cash flow from operating activities |
7,047 | 7,330 | 5,543 | 6,294 | 6,836 | |||||||||||||||
|
Net cash flow from/(used in) investing activities |
(3,188 | ) | (3,539 | ) | (341 | ) | (1,161 | ) | (755 | ) | ||||||||||
|
Net cash flow from/(used in) financing activities |
(3,073 | ) | (3,032 | ) | (5,190 | ) | (5,390 | ) | (6,622 | ) | ||||||||||
|
Net increase/(decrease) in cash and cash equivalents |
786 | 759 | 12 | (257 | ) | (541 | ) | |||||||||||||
|
Cash and cash equivalents at the beginning of the year |
2,128 | 1,910 | 2,044 | 2,217 | 2,978 | |||||||||||||||
|
Effect of foreign exchange rates |
284 | (541 | ) | (146 | ) | 84 | (220 | ) | ||||||||||||
|
Cash and cash equivalents at the end of the year |
3,198 | 2,128 | 1,910 | 2,044 | 2,217 | |||||||||||||||
| Key performance indicators | 2016 | 2015 | 2014 | 2013 | 2012 | |||||||||||||||
|
Underlying sales growth (%) (b) |
3.7 | 4.1 | 2.9 | 4.3 | 6.9 | |||||||||||||||
|
Underlying volume growth (%) (b) |
0.9 | 2.1 | 1.0 | 2.5 | 3.4 | |||||||||||||||
|
Core operating margin (%) (b) |
15.3 | 14.8 | 14.5 | 14.1 | 13.7 | |||||||||||||||
|
Free cash flow ( € million) (b) |
4,802 | 4,796 | 3,100 | 3,856 | 4,333 | |||||||||||||||
| (b) | Non–GAAP measures are defined and described on pages 26 to 28. Reconciliations of non-GAAP measures to relevant GAAP measures are also detailed on pages 26 to 28. |
| 168 | Annual Report on Form 20-F 2016 |
Table of Contents
| Ratios and other metrics | 2016 | 2015 | 2014 | 2013 | 2012 | |||||||||||||||
|
Operating margin (%) |
14.8 | 14.1 | 16.5 | 15.1 | 13.6 | |||||||||||||||
|
Net profit margin (%) (c) |
9.8 | 9.2 | 10.7 | 9.7 | 8.5 | |||||||||||||||
|
Net debt ( € million) (b) |
12,614 | 11,505 | 9,900 | 8,456 | 7,355 | |||||||||||||||
|
Ratio of earnings to fixed charges (times) (d) |
10.8 | 11.4 | 12.3 | 11.7 | 10.2 | |||||||||||||||
|
(b) Non–GAAP measures are defined and described on pages 26 to 28. Reconciliations of non-GAAP measures to relevant GAAP measures are also detailed on pages 26 to 28. (c) Net profit margin is expressed as net profit attributable to shareholders’ equity as a percentage of turnover. (d) In the ratio of earnings to fixed charges, earnings consist of net profit from continuing operations excluding net profit or loss of joint ventures and associates increased by fixed charges, income taxes and dividends received from joint ventures and associates. Fixed charges consist of interest payable on debt and a portion of lease costs determined to be representative of interest. This ratio takes no account of interest receivable although Unilever’s treasury operations involve both borrowing and depositing funds.
|
|
|||||||||||||||||||
| Underlying sales growth (%) |
2016
vs 2015 |
2015
vs 2014 |
2014
vs 2013 |
2013
vs 2012 |
2012
vs 2011 |
|||||||||||||||
|
Turnover growth (%) |
(1.0 | ) | 10.0 | (2.7 | ) | (3.0 | ) | 10.5 | ||||||||||||
|
Effect of acquisitions (%) |
0.8 | 0.7 | 0.4 | – | 1.8 | |||||||||||||||
|
Effect of disposals (%) |
(0.2 | ) | (0.8 | ) | (1.3 | ) | (1.1 | ) | (0.7 | ) | ||||||||||
|
Effect of exchange rates (%) |
(5.1 | ) | 5.9 | (4.6 | ) | (5.9 | ) | 2.2 | ||||||||||||
|
Underlying sales growth (%) |
3.7 | 4.1 | 2.9 | 4.3 | 6.9 | |||||||||||||||
| Underlying volume growth (%) |
2016
vs 2015 |
2015
vs 2014 |
2014
vs 2013 |
2013
vs 2012 |
2012
vs 2011 |
|||||||||||||||
|
Underlying volume growth (%) |
0.9 | 2.1 | 1.0 | 2.5 | 3.4 | |||||||||||||||
|
Effect of price changes (%) |
2.8 | 1.9 | 1.9 | 1.8 | 3.3 | |||||||||||||||
|
Underlying sales growth (%) |
3.7 | 4.1 | 2.9 | 4.3 | 6.9 | |||||||||||||||
| Core operating margin and core operating profit |
€ million
2016 |
€
million
2015 |
€
million
2014 |
€
million
2013 |
€
million
2012 |
|||||||||||||||
|
Operating profit |
7,801 | 7,515 | 7,980 | 7,517 | 6,977 | |||||||||||||||
|
Acquisition and disposal-related cost |
132 | 105 | 97 | 112 | 190 | |||||||||||||||
|
(Gain)/loss on disposal of group companies |
95 | 9 | (1,392 | ) | (733 | ) | (117 | ) | ||||||||||||
|
Impairments and other one-off items |
18 | 236 | 335 | 120 | - | |||||||||||||||
|
Core operating profit |
8,046 | 7,865 | 7,020 | 7,016 | 7,050 | |||||||||||||||
|
Turnover |
52,713 | 53,272 | 48,436 | 49,797 | 51,324 | |||||||||||||||
|
Operating margin (%) |
14.8 | 14.1 | 16.5 | 15.1 | 13.6 | |||||||||||||||
|
Core operating margin (%) |
15.3 | 14.8 | 14.5 | 14.1 | 13.7 | |||||||||||||||
| Net profit to free cash flow (FCF) |
€ million
2016 |
€
million
2015 |
€
million
2014 |
€
million
2013 |
€
million
2012 |
|||||||||||||||
|
Net profit |
5,547 | 5,259 | 5,515 | 5,263 | 4,836 | |||||||||||||||
|
Taxation |
1,922 | 1,961 | 2,131 | 1,851 | 1,697 | |||||||||||||||
|
Share of net profit of joint ventures/associates and other income from non-current investments |
(231 | ) | (198 | ) | (143 | ) | (127 | ) | (91 | ) | ||||||||||
|
Net finance costs |
563 | 493 | 477 | 530 | 535 | |||||||||||||||
|
Depreciation, amortisation and impairment |
1,464 | 1,370 | 1,432 | 1,151 | 1,199 | |||||||||||||||
|
Changes in working capital |
51 | 720 | 8 | 200 | 822 | |||||||||||||||
|
Pensions and similar obligations less payments |
(327 | ) | (385 | ) | (364 | ) | (383 | ) | (369 | ) | ||||||||||
|
Provisions less payments |
65 | (94 | ) | 32 | 126 | (43 | ) | |||||||||||||
|
Elimination of (profits)/losses on disposals |
127 | 26 | (1,460 | ) | (725 | ) | (236 | ) | ||||||||||||
|
Non-cash charge for share-based compensation |
198 | 150 | 188 | 228 | 153 | |||||||||||||||
|
Other adjustments |
(81 | ) | 49 | 38 | (15 | ) | 13 | |||||||||||||
|
Cash flow from operating activities |
9,298 | 9,351 | 7,854 | 8,099 | 8,516 | |||||||||||||||
|
Income tax paid |
(2,251 | ) | (2,021 | ) | (2,311 | ) | (1,805 | ) | (1,680 | ) | ||||||||||
|
Net capital expenditure |
(1,878 | ) | (2,074 | ) | (2,045 | ) | (2,027 | ) | (2,143 | ) | ||||||||||
|
Net interest and preference dividends paid |
(367 | ) | (460 | ) | (398 | ) | (411 | ) | (360 | ) | ||||||||||
|
Free cash flow |
4,802 | 4,796 | 3,100 | 3,856 | 4,333 | |||||||||||||||
|
Net cash flow (used in)/from investing activities |
(3,188 | ) | (3,539 | ) | (341 | ) | (1,161 | ) | (755 | ) | ||||||||||
|
Net cash flow (used in)/from financing activities |
(3,073 | ) | (3,032 | ) | (5,190 | ) | (5,390 | ) | (6,622 | ) | ||||||||||
| Annual Report on Form 20-F 2016 | 169 |
Table of Contents
ADDITIONAL INFORMATION FOR US LISTING PURPOSES CONTINUED
| Total financial liabilities to net debt |
€ million
2016 |
€
million
2015 |
€
million
2014 |
€
million
2013 |
€
million
2012 |
|||||||||||||||
|
Total financial liabilities |
(16,595 | ) | (14,643 | ) | (12,722 | ) | (11,501 | ) | (10,221 | ) | ||||||||||
|
Current financial liabilities |
(5,450 | ) | (4,789 | ) | (5,536 | ) | (4,010 | ) | (2,656 | ) | ||||||||||
|
Non-current financial liabilities |
(11,145 | ) | (9,854 | ) | (7,186 | ) | (7,491 | ) | (7,565 | ) | ||||||||||
|
Cash and cash equivalents as per balance sheet |
3,382 | 2,302 | 2,151 | 2,285 | 2,465 | |||||||||||||||
|
Cash and cash equivalents as per cash flow statement |
3,198 | 2,128 | 1,910 | 2,044 | 2,217 | |||||||||||||||
|
Add bank overdrafts deducted therein |
184 | 174 | 241 | 241 | 248 | |||||||||||||||
|
Other current financial assets |
599 | 836 | 671 | 760 | 401 | |||||||||||||||
|
Net debt |
(12,614 | ) | (11,505 | ) | (9,900 | ) | (8,456 | ) | (7,355 | ) | ||||||||||
GUARANTOR STATEMENTS (AUDITED)
On 30 September 2014, Unilever N.V. and Unilever Capital Corporation (UCC) filed a US Shelf registration, which is unconditionally and fully guaranteed, jointly and severally, by Unilever N.V., Unilever PLC and Unilever United States, Inc. (UNUS) and that superseded the NV and UCC US Shelf registration filed on 1 November 2011, which was unconditionally and fully guaranteed, jointly and severally, by NV, PLC and UNUS. UCC and UNUS are each indirectly 100% owned by the Unilever parent entities (as defined below). Of the US Shelf registration, US$6.3 billion of Notes were outstanding at 31 December 2016 (2015: US$5.6 billion; 2014: US$5.0 billion) with coupons ranging from 0.85% to 5.9%. These Notes are repayable between 2 August 2017 and 15 November 2032.
Provided below are the income statements, cash flow statements and balance sheets of each of the companies discussed above, together with the income statement, cash flow statement and balance sheet of non-guarantor subsidiaries. These have been prepared under the historical cost convention and, aside from the basis of accounting for investments at net asset value (equity accounting), comply in all material respects with International Financial Reporting Standards. The financial information in respect of NV, PLC and UNUS has been prepared with all subsidiaries accounted for on an equity basis. Information on NV and PLC is shown collectively as Unilever parent entities. The financial information in respect of the non-guarantor subsidiaries has been prepared on a consolidated basis.
| € million | € million | € million | € million | € million | € million | |||||||||||||||||||
|
Income statement for the year ended 31 December 2016 |
|
Unilever
Capital Corporation subsidiary issuer |
|
|
Unilever
parent
|
(a)
|
|
Unilever
United States Inc. subsidiary guarantor |
|
|
Non-
guarantor subsidiaries |
|
Eliminations |
|
Unilever
Group |
|
||||||||
|
Turnover |
- | - | - | 52,713 | - | 52,713 | ||||||||||||||||||
|
Operating profit |
- | 269 | (5 | ) | 7,537 | - | 7,801 | |||||||||||||||||
|
Net finance income/(costs) |
1 | (110 | ) | (331 | ) | (29 | ) | - | (469 | ) | ||||||||||||||
|
Pensions and similar obligations |
- | (3 | ) | (27 | ) | (64 | ) | - | (94 | ) | ||||||||||||||
|
Other income/(losses) |
- | - | - | 231 | - | 231 | ||||||||||||||||||
|
Profit before taxation |
1 | 156 | (363 | ) | 7,675 | - | 7,469 | |||||||||||||||||
|
Taxation |
- | (114 | ) | - | (1,808 | ) | - | (1,922 | ) | |||||||||||||||
|
Net profit before subsidiaries |
1 | 42 | (363 | ) | 5,867 | - | 5,547 | |||||||||||||||||
|
Equity earnings of subsidiaries |
- | 5,142 | 804 | (4,559 | ) | (1,387 | ) | - | ||||||||||||||||
|
Net profit |
1 | 5,184 | 441 | 1,308 | (1,387 | ) | 5,547 | |||||||||||||||||
|
Attributable to: |
||||||||||||||||||||||||
|
Non-controlling interests |
- | - | - | 363 | - | 363 | ||||||||||||||||||
|
Shareholders’ equity |
1 | 5,184 | 441 | 945 | (1,387 | ) | 5,184 | |||||||||||||||||
|
Total comprehensive income |
1 | 5,170 | 468 | 517 | (1,387 | ) | 4,769 | |||||||||||||||||
| (a) | The term ‘Unilever parent entities’ includes Unilever N.V. and Unilever PLC. Though Unilever N.V. and Unilever PLC are separate legal entities, with different shareholder constituencies and separate stock exchange listings, they operate as nearly as practicable as a single economic entity. Debt securities issued by entities in the Unilever Group are fully and unconditionally guaranteed by both Unilever N.V. and Unilever PLC. |
| 170 | Annual Report on Form 20-F 2016 |
Table of Contents
| € million | € million | € million | € million | € million | € million | |||||||||||||||||||
| Unilever | Unilever | |||||||||||||||||||||||
| Capital | United | |||||||||||||||||||||||
| Corporation | Unilever | (a) | States Inc. | Non- | ||||||||||||||||||||
| Income statement | subsidiary | parent | subsidiary | guarantor | Unilever | |||||||||||||||||||
| for the year ended 31 December 2015 | issuer | entities | guarantor | subsidiaries | Eliminations | Group | ||||||||||||||||||
|
Turnover |
- | - | - | 53,272 | - | 53,272 | ||||||||||||||||||
|
Operating profit |
- | 990 | (5 | ) | 6,530 | - | 7,515 | |||||||||||||||||
|
Net finance income/(costs) |
- | (103 | ) | (327 | ) | 58 | - | (372 | ) | |||||||||||||||
|
Pensions and similar obligations |
- | (3 | ) | (29 | ) | (89 | ) | - | (121 | ) | ||||||||||||||
|
Other income/(losses) |
- | 439 | - | (241 | ) | - | 198 | |||||||||||||||||
|
Profit before taxation |
- | 1,323 | (361 | ) | 6,258 | - | 7,220 | |||||||||||||||||
|
Taxation |
- | (461 | ) | (87 | ) | (1,413 | ) | - | (1,961 | ) | ||||||||||||||
|
Net profit before subsidiaries |
- | 862 | (448 | ) | 4,845 | - | 5,259 | |||||||||||||||||
|
Equity earnings of subsidiaries |
- | 4,047 | 690 | (9,408 | ) | 4,671 | - | |||||||||||||||||
|
Net profit |
- | 4,909 | 242 | (4,563 | ) | 4,671 | 5,259 | |||||||||||||||||
|
Attributable to: |
||||||||||||||||||||||||
|
Non-controlling interests |
- | - | - | 350 | - | 350 | ||||||||||||||||||
|
Shareholders’ equity |
- | 4,909 | 242 | (4,913 | ) | 4,671 | 4,909 | |||||||||||||||||
|
Total comprehensive income |
(1 | ) | 4,922 | 332 | (4,162 | ) | 4,671 | 5,762 | ||||||||||||||||
| € million | € million | € million | € million | € million | € million | |||||||||||||||||||
| Unilever | Unilever | |||||||||||||||||||||||
| Capital | United | |||||||||||||||||||||||
| Corporation | Unilever | (a) | States Inc. | Non- | ||||||||||||||||||||
| Income statement | subsidiary | parent | subsidiary | guarantor | Unilever | |||||||||||||||||||
| for the year ended 31 December 2014 | issuer | entities | guarantor | subsidiaries | Eliminations | Group | ||||||||||||||||||
|
Turnover |
- | - | - | 48,436 | - | 48,436 | ||||||||||||||||||
|
Operating profit |
- | 363 | (6 | ) | 7,623 | - | 7,980 | |||||||||||||||||
|
Net finance costs |
- | (97 | ) | (258 | ) | (28 | ) | - | (383 | ) | ||||||||||||||
|
Pensions and similar obligations |
- | (4 | ) | (26 | ) | (64 | ) | - | (94 | ) | ||||||||||||||
|
Other income |
- | - | - | 143 | - | 143 | ||||||||||||||||||
|
Profit before taxation |
- | 262 | (290 | ) | 7,674 | - | 7,646 | |||||||||||||||||
|
Taxation |
- | (93 | ) | (562 | ) | (1,476 | ) | - | (2,131 | ) | ||||||||||||||
|
Net profit before subsidiaries |
- | 169 | (852 | ) | 6,198 | - | 5,515 | |||||||||||||||||
|
Equity earnings of subsidiaries |
- | 5,002 | 1,713 | (5,269 | ) | (1,446 | ) | - | ||||||||||||||||
|
Net profit |
- | 5,171 | 861 | 929 | (1,446 | ) | 5,515 | |||||||||||||||||
|
Attributable to: |
||||||||||||||||||||||||
|
Non-controlling interests |
- | - | - | 344 | - | 344 | ||||||||||||||||||
|
Shareholders’ equity |
- | 5,171 | 861 | 585 | (1,446 | ) | 5,171 | |||||||||||||||||
|
Total comprehensive income |
(1 | ) | 5,165 | 754 | (317 | ) | (1,446 | ) | 4,155 | |||||||||||||||
| (a) | The term ‘Unilever parent entities’ includes Unilever N.V. and Unilever PLC. Though Unilever N.V. and Unilever PLC are separate legal entities, with different shareholder constituencies and separate stock exchange listings, they operate as nearly as practicable as a single economic entity. Debt securities issued by entities in the Unilever Group are fully and unconditionally guaranteed by both Unilever N.V. and Unilever PLC. |
| Annual Report on Form 20-F 2016 | 171 |
Table of Contents
ADDITIONAL INFORMATION FOR US LISTING PURPOSES CONTINUED
| € million | € million | € million | € million | € million | € million | |||||||||||||||||||
| Unilever | Unilever | |||||||||||||||||||||||
| Capital | United | |||||||||||||||||||||||
| Corporation | Unilever | (a) | States Inc. | Non- | ||||||||||||||||||||
| subsidiary | parent | subsidiary | guarantor | Unilever | ||||||||||||||||||||
| Balance sheet at 31 December 2016 | issuer | entities | guarantor | subsidiaries | Eliminations | Group | ||||||||||||||||||
|
Assets |
||||||||||||||||||||||||
|
Non-current assets |
||||||||||||||||||||||||
|
Goodwill and intangible assets |
- | 2,202 | - | 25,231 | - | 27,433 | ||||||||||||||||||
|
Deferred tax assets |
- | 86 | - | 1,268 | - | 1,354 | ||||||||||||||||||
|
Other non-current assets |
- | 70 | 2 | 13,686 | - | 13,758 | ||||||||||||||||||
|
Amounts due from group companies |
14,931 | 4,569 | - | - | (19,500 | ) | - | |||||||||||||||||
|
Net assets of subsidiaries (equity accounted) |
- | 39,676 | 20,052 | - | (59,728 | ) | - | |||||||||||||||||
| 14,931 | 46,603 | 20,054 | 40,185 | (79,228 | ) | 42,545 | ||||||||||||||||||
|
Current assets |
||||||||||||||||||||||||
|
Amounts due from group companies |
14 | 2,539 | 5,293 | 33,211 | (41,057 | ) | - | |||||||||||||||||
|
Trade and other current receivables |
- | 70 | 4 | 5,028 | - | 5,102 | ||||||||||||||||||
|
Current tax assets |
- | 90 | - | 227 | - | 317 | ||||||||||||||||||
|
Other current assets |
- | 6 | - | 8,459 | - | 8,465 | ||||||||||||||||||
| 14 | 2,705 | 5,297 | 46,925 | (41,057 | ) | 13,884 | ||||||||||||||||||
|
Total assets |
14,945 | 49,308 | 25,351 | 87,110 | (120,285 | ) | 56,429 | |||||||||||||||||
|
Liabilities |
||||||||||||||||||||||||
|
Current liabilities |
||||||||||||||||||||||||
|
Financial liabilities |
2,415 | 1,700 | 1 | 1,334 | - | 5,450 | ||||||||||||||||||
|
Amounts due to group companies |
6,682 | 26,514 | 15 | 7,846 | (41,057 | ) | - | |||||||||||||||||
|
Trade payables and other current liabilities |
63 | 193 | 18 | 13,597 | - | 13,871 | ||||||||||||||||||
|
Current tax liabilities |
- | - | 21 | 823 | - | 844 | ||||||||||||||||||
|
Other current liabilities |
- | 4 | - | 387 | - | 391 | ||||||||||||||||||
| 9,160 | 28,411 | 55 | 23,987 | (41,057 | ) | 20,556 | ||||||||||||||||||
|
Non-current liabilities |
||||||||||||||||||||||||
|
Financial liabilities |
5,437 | 4,577 | - | 1,131 | - | 11,145 | ||||||||||||||||||
|
Amounts due to group companies |
- | - | 14,925 | 4,575 | (19,500 | ) | - | |||||||||||||||||
|
Pensions and post-retirement healthcare liabilities: |
||||||||||||||||||||||||
|
Funded schemes in deficit |
- | 7 | 101 | 2,055 | - | 2,163 | ||||||||||||||||||
|
Unfunded schemes |
- | 96 | 513 | 1,095 | - | 1,704 | ||||||||||||||||||
|
Other non-current liabilities |
- | - | 46 | 3,835 | - | 3,881 | ||||||||||||||||||
| 5,437 | 4,680 | 15,585 | 12,691 | (19,500 | ) | 18,893 | ||||||||||||||||||
|
Total liabilities |
14,597 | 33,091 | 15,640 | 36,678 | (60,557 | ) | 39,449 | |||||||||||||||||
|
Shareholders’ equity |
348 | 16,217 | 9,711 | 49,806 | (59,728 | ) | 16,354 | |||||||||||||||||
|
Non-controlling interests |
- | - | - | 626 | - | 626 | ||||||||||||||||||
|
Total equity |
348 | 16,217 | 9,711 | 50,432 | (59,728 | ) | 16,980 | |||||||||||||||||
|
Total liabilities and equity |
14,945 | 49,308 | 25,351 | 87,110 | (120,285 | ) | 56,429 | |||||||||||||||||
| (a) | The term ‘Unilever parent entities’ includes Unilever N.V. and Unilever PLC. Though Unilever N.V. and Unilever PLC are separate legal entities, with different shareholder constituencies and separate stock exchange listings, they operate as nearly as practicable as a single economic entity. Debt securities issued by entities in the Unilever Group are fully and unconditionally guaranteed by both Unilever N.V. and Unilever PLC. |
| 172 | Annual Report on Form 20-F 2016 |
Table of Contents
| € million | € million | € million | € million | € million | € million | |||||||||||||||||||
| Unilever | Unilever | |||||||||||||||||||||||
| Capital | United | |||||||||||||||||||||||
| Corporation | Unilever | (a) | States Inc. | Non- | ||||||||||||||||||||
| subsidiary | parent | subsidiary | guarantor | Unilever | ||||||||||||||||||||
| Balance sheet at 31 December 2015 | issuer | entities | guarantor | subsidiaries | Eliminations | Group | ||||||||||||||||||
|
Assets |
||||||||||||||||||||||||
|
Non-current assets |
||||||||||||||||||||||||
|
Goodwill and intangible assets |
- | 2,429 | - | 22,630 | - | 25,059 | ||||||||||||||||||
|
Deferred tax assets |
- | 160 | 90 | 935 | - | 1,185 | ||||||||||||||||||
|
Other non-current assets |
- | 8 | 3 | 13,357 | - | 13,368 | ||||||||||||||||||
|
Amounts due from group companies |
12,961 | 2,763 | - | - | (15,724 | ) | - | |||||||||||||||||
|
Net assets of subsidiaries (equity accounted) |
- | 39,770 | 18,952 | - | (58,722 | ) | - | |||||||||||||||||
| 12,961 | 45,130 | 19,045 | 36,922 | (74,446 | ) | 39,612 | ||||||||||||||||||
|
Current assets |
||||||||||||||||||||||||
|
Amounts due from group companies |
86 | 2,917 | 4,290 | 33,450 | (40,743 | ) | - | |||||||||||||||||
|
Trade and other current receivables |
- | 69 | 5 | 4,730 | - | 4,804 | ||||||||||||||||||
|
Current tax assets |
- | 92 | - | 138 | - | 230 | ||||||||||||||||||
|
Other current assets |
- | 4 | 1 | 7,647 | - | 7,652 | ||||||||||||||||||
| 86 | 3,082 | 4,296 | 45,965 | (40,743 | ) | 12,686 | ||||||||||||||||||
|
Total assets |
13,047 | 48,212 | 23,341 | 82,887 | (115,189 | ) | 52,298 | |||||||||||||||||
|
Liabilities |
||||||||||||||||||||||||
|
Current liabilities |
||||||||||||||||||||||||
|
Financial liabilities |
1,990 | 1,551 | 4 | 1,244 | - | 4,789 | ||||||||||||||||||
|
Amounts due to group companies |
6,077 | 27,351 | 22 | 7,293 | (40,743 | ) | - | |||||||||||||||||
|
Trade payables and other current liabilities |
57 | 170 | 38 | 13,523 | - | 13,788 | ||||||||||||||||||
|
Current tax liabilities |
- | - | 10 | 1,117 | - | 1,127 | ||||||||||||||||||
|
Other current liabilities |
- | 5 | - | 310 | - | 315 | ||||||||||||||||||
| 8,124 | 29,077 | 74 | 23,487 | (40,743 | ) | 20,019 | ||||||||||||||||||
|
Non-current liabilities |
||||||||||||||||||||||||
|
Financial liabilities |
4,589 | 3,723 | - | 1,542 | - | 9,854 | ||||||||||||||||||
|
Amounts due to group companies |
- | - | 12,960 | 2,764 | (15,724 | ) | - | |||||||||||||||||
|
Pensions and post-retirement healthcare liabilities: |
||||||||||||||||||||||||
|
Funded schemes in deficit |
- | 9 | 92 | 1,468 | - | 1,569 | ||||||||||||||||||
|
Unfunded schemes |
- | 97 | 543 | 1,045 | - | 1,685 | ||||||||||||||||||
|
Other non-current liabilities |
- | 22 | 2 | 3,065 | - | 3,089 | ||||||||||||||||||
| 4,589 | 3,851 | 13,597 | 9,884 | (15,724 | ) | 16,197 | ||||||||||||||||||
|
Total liabilities |
12,713 | 32,928 | 13,671 | 33,371 | (56,467 | ) | 36,216 | |||||||||||||||||
|
Shareholders’ equity |
334 | 15,284 | 9,670 | 48,873 | (58,722 | ) | 15,439 | |||||||||||||||||
|
Non-controlling interests |
- | - | - | 643 | - | 643 | ||||||||||||||||||
|
Total equity |
334 | 15,284 | 9,670 | 49,516 | (58,722 | ) | 16,082 | |||||||||||||||||
|
Total liabilities and equity |
13,047 | 48,212 | 23,341 | 82,887 | (115,189 | ) | 52,298 | |||||||||||||||||
| (a) | The term ‘Unilever parent entities’ includes Unilever N.V. and Unilever PLC. Though Unilever N.V. and Unilever PLC are separate legal entities, with different shareholder constituencies and separate stock exchange listings, they operate as nearly as practicable as a single economic entity. Debt securities issued by entities in the Unilever Group are fully and unconditionally guaranteed by both Unilever N.V. and Unilever PLC. |
| Annual Report on Form 20-F 2016 | 173 |
Table of Contents
ADDITIONAL INFORMATION FOR US LISTING PURPOSES CONTINUED
| € million | € million | € million | € million | € million | € million | |||||||||||||||||||
| Unilever | Unilever | |||||||||||||||||||||||
| Capital | United | |||||||||||||||||||||||
| Corporation | Unilever | (a) | States Inc. | Non- | ||||||||||||||||||||
| Cash flow statement | subsidiary | parent | subsidiary | guarantor | Unilever | |||||||||||||||||||
| for the year ended 31 December 2016 | issuer | entities | guarantor | subsidiaries | Eliminations | Group | ||||||||||||||||||
|
Net cash flow from/(used in) operating activities |
- | 45 | (177 | ) | 7,179 | - | 7,047 | |||||||||||||||||
|
Net cash flow from/(used in)investing activities |
(1,053 | ) | (679 | ) | (783 | ) | (1,712 | ) | 1,039 | (3,188 | ) | |||||||||||||
|
Net cash flow from/(used in) financing activities |
1,048 | 621 | 959 | (4,662 | ) | (1,039 | ) | (3,073 | ) | |||||||||||||||
|
Net increase/(decrease) in cash and cash equivalents |
(5 | ) | (13 | ) | (1 | ) | 805 | - | 786 | |||||||||||||||
|
Cash and cash equivalents at beginning of year |
- | 3 | (1 | ) | 2,126 | - | 2,128 | |||||||||||||||||
|
Effect of foreign exchange rates |
5 | 15 | - | 264 | - | 284 | ||||||||||||||||||
|
Cash and cash equivalents at end of year |
- | 5 | (2 | ) | 3,195 | - | 3,198 | |||||||||||||||||
| € million | € million | € million | € million | € million | € million | |||||||||||||||||||
| Unilever | Unilever | |||||||||||||||||||||||
| Capital | United | |||||||||||||||||||||||
| Corporation | Unilever | (a) | States Inc. | Non- | ||||||||||||||||||||
| Cash flow statement | subsidiary | parent | subsidiary | guarantor | Unilever | |||||||||||||||||||
| for the year ended 31 December 2015 | issuer | entities | guarantor | subsidiaries | Eliminations | Group | ||||||||||||||||||
|
Net cash flow from/(used in) operating activities |
(1 | ) | (699 | ) | (140 | ) | 8,170 | - | 7,330 | |||||||||||||||
|
Net cash flow from/(used in) investing activities |
(1,005 | ) | 231 | (729 | ) | (2,955 | ) | 919 | (3,539 | ) | ||||||||||||||
|
Net cash flow from/(used in) financing activities |
1,000 | 558 | 871 | (4,542 | ) | (919 | ) | (3,032 | ) | |||||||||||||||
|
Net increase/(decrease) in cash and cash equivalents |
(6 | ) | 90 | 2 | 673 | - | 759 | |||||||||||||||||
|
Cash and cash equivalents at beginning of year |
- | 5 | (3 | ) | 1,908 | - | 1,910 | |||||||||||||||||
|
Effect of foreign exchange rates |
6 | (91 | ) | - | (456 | ) | - | (541 | ) | |||||||||||||||
|
Cash and cash equivalents at end of year |
- | 4 | (1 | ) | 2,125 | - | 2,128 | |||||||||||||||||
| € million | € million | € million | € million | € million | € million | |||||||||||||||||||
| Unilever | Unilever | |||||||||||||||||||||||
| Capital | United | |||||||||||||||||||||||
| Corporation | Unilever | (a) | States Inc. | Non- | ||||||||||||||||||||
| Cash flow statement | subsidiary | parent | subsidiary | guarantor | Unilever | |||||||||||||||||||
| for the year ended 31 December 2014 | issuer | entities | guarantor | subsidiaries | Eliminations | Group | ||||||||||||||||||
|
Net cash flow from/(used in) operating activities |
- | 579 | (764 | ) | 5,728 | - | 5,543 | |||||||||||||||||
|
Net cash flow from/(used in) investing activities |
(1,038 | ) | (2,284 | ) | (662 | ) | 2,606 | 1,037 | (341 | ) | ||||||||||||||
|
Net cash flow from/(used in) financing activities |
1,033 | 1,676 | 1,426 | (8,288 | ) | (1,037 | ) | (5,190 | ) | |||||||||||||||
|
Net increase/(decrease) in cash and cash equivalents |
(5 | ) | (29 | ) | - | 46 | - | 12 | ||||||||||||||||
|
Cash and cash equivalents at beginning of year |
- | 3 | (2 | ) | 2,043 | - | 2,044 | |||||||||||||||||
|
Effect of foreign exchange rates |
5 | 31 | - | (182 | ) | - | (146 | ) | ||||||||||||||||
|
Cash and cash equivalents at end of year |
- | 5 | (2 | ) | 1,907 | - | 1,910 | |||||||||||||||||
| (a) | The term ‘Unilever parent entities’ includes Unilever N.V. and Unilever PLC. Though Unilever N.V. and Unilever PLC are separate legal entities, with different shareholder constituencies and separate stock exchange listings, they operate as nearly as practicable as a single economic entity. Debt securities issued by entities in the Unilever Group are fully and unconditionally guaranteed by both Unilever N.V. and Unilever PLC. |
| 174 | Annual Report on Form 20-F 2016 |
Table of Contents
| Annual Report on Form 20-F 2016 | 175 |
Table of Contents
ADDITIONAL INFORMATION FOR US LISTING PURPOSES CONTINUED
| 176 | Annual Report on Form 20-F 2016 |
Table of Contents
| Annual Report on Form 20-F 2016 | 177 |
Table of Contents
ADDITIONAL INFORMATION FOR US LISTING PURPOSES CONTINUED
| 178 | Annual Report on Form 20-F 2016 |
Table of Contents
CAUTIONARY STATEMENT
This document may contain forward-looking statements, including ‘forward-looking statements’ within the meaning of the United States Private Securities Litigation Reform Act of 1995. Words such as ‘will’, ‘aim’, ‘expects’, ‘anticipates’, ‘intends’, ‘looks’, ‘believes’, ‘vision’, or the negative of these terms and other similar expressions of future performance or results, and their negatives, are intended to identify such forward-looking statements. These forward-looking statements are based upon current expectations and assumptions regarding anticipated developments and other factors affecting the Unilever Group (the ‘Group’). They are not historical facts, nor are they guarantees of future performance.
Because these forward-looking statements involve risks and uncertainties, there are important factors that could cause actual results to differ materially from those expressed or implied by these forward-looking statements. Among other risks and uncertainties, the material or principal factors which could cause actual results to differ materially are: Unilever’s global brands not meeting consumer preferences; Unilever’s ability to innovate and remain competitive; Unilever’s investment choices in its portfolio management; inability to find sustainable solutions to support long-term growth; customer relationships; the recruitment and retention of talented employees; disruptions in our supply chain; the cost of raw materials and commodities; the production of safe and high quality products; secure and reliable IT infrastructure; successful execution of acquisitions, divestitures and business transformation projects; economic and political risks and natural disasters; the effect of climate change on Unilever’s business; financial risks; failure to meet high and ethical standards; and managing regulatory, tax and legal matters.
These forward-looking statements speak only as of the date of this document. Except as required by any applicable law or regulation, the Group expressly disclaims any obligation or undertaking to release publicly any updates or revisions to any forward-looking statements contained herein to reflect any change in the Group’s expectations with regard thereto or any change in events, conditions or circumstances on which any such statement is based.
Further details of potential risks and uncertainties affecting the Group are described in the Group’s filings with the London Stock Exchange, Euronext Amsterdam and the US Securities and Exchange Commission, including in the Unilever Annual Report and Accounts 2016.
This document is not prepared in accordance with US GAAP and should not therefore be relied upon by readers as such.
In addition, a printed copy of the Annual Report on Form 20-F 2016 is available, free of charge, upon request to Unilever, Investor Relations Department, 100 Victoria Embankment, London EC4Y 0DY, United Kingdom.
This document comprises regulated information within the meaning of Sections 1:1 and 5:25c of the Act on Financial Supervision (‘Wet op het financieel toezicht (Wft)’) in the Netherlands.
The brand names shown in this report are trademarks owned by or licensed to companies within the Group.
References in this document to information on websites (and/or social media sites) are included as an aid to their location and such information is not incorporated in, and does not form part of, the Annual Report on Form 20-F 2016.
Designed and produced by Unilever Communications.
Printed at Pureprint Group, ISO 14001. FSC ® certified and CarbonNeutral ® .
This document is printed on Revive 100% Recycled Silk. These papers have been exclusively supplied by Denmaur Independent Papers which has offset the carbon produced by the production and delivery of them to the printer.
These papers are 100% recycled and manufactured using de-inked post-consumer waste. All the pulp is bleached using an elemental chlorine free process (ECF). Printed in the UK by Pureprint using its alcofree ® and pureprint ® environmental printing technology. Vegetable inks were used throughout. Pureprint is a CarbonNeutral ® company. Both the manufacturing mill and the printer are registered to the Environmental Management System ISO 14001 and are Forest Stewardship Council ® (FSC) chain-of-custody certified.
If you have finished with this document and no longer wish to retain it, please pass it on to other interested readers or dispose of it in your recycled paper waste. Thank you.
Table of Contents
Table of Contents
SIGNATURES
The registrant hereby certifies that it meets all of the requirements for filing on Form 20-F and that it has duly caused and authorised the undersigned to sign this Annual Report on its behalf.
Unilever PLC.
(Registrant)
|
/s/ T. E. Lovell |
| T. E. LOVELL, |
| Group Secretary |
Date: 28 February 2017
Table of Contents
UNILEVER PLC — 20-F EXHIBIT LIST
| Exhibit Number | Description of Exhibit | |
| 1.1 | Articles of Association of Unilever PLC 1 | |
| 2.1 | Trust Deed dated as of July 22, 1994, among Unilever N.V., Unilever PLC, Unilever Capital Corporation, Unilever United States, Inc. and The Law Debenture Trust Corporation p.l.c., relating to Guaranteed Debt Securities 2 | |
| 2.2 | Twenty-first Supplemental Trust Deed as of April 22, 2016, incorporating the Trust Deed as of July 22, 1994, as Amended and Restated on April 22, 2016 | |
| 2.3 | Amended and Restated Indenture as of September 22, 2014, among Unilever Capital Corporation, Unilever N,V. Unilever PLC, Unilever United States, Inc. and The Bank of New York Mellon, as Trustee, relating to Guaranteed Debt Securities 3 | |
| 2.4 | Second Amended and Restated Deposit Agreement dated as of July 1, 2014 by and among Unilever PLC and Deutsche Bank Trust Company Americas, as Depositary, and the Holders and Beneficial Owners of American Depositary Shares issued thereunder 4 | |
| 4.1(a) | Equalisation Agreement between Unilever N.V. and Unilever PLC 5 | |
| 4.1(b) | Deed of Mutual Covenants 6 | |
| 4.1(c) | Agreement for Mutual Guarantees of Borrowing 7 | |
| 4.2 | Service Contracts of the Executive Directors of Unilever PLC 8 | |
| 4.3 | Letters regarding compensation of Executive Directors of Unilever PLC | |
| 4.4 | Unilever North America 2002 Omnibus Equity Compensation Plan as Amended and Restated as of November 1, 2012 9 | |
| 4.5 | The Unilever PLC International 1997 Executive Share Option Scheme 10 | |
| 4.6 | The Unilever Long Term Incentive Plan 11 | |
| 4.7 | Global Share Incentive Plan 2007 12 | |
| 4.8 | The Management Co-Investment Plan 13 | |
| 7.1 | Calculation of Ratio of Earnings to Fixed Charges | |
| 8.1 | List of Subsidiaries 14 | |
| 12.1 | Certifications of the Chief Executive Officer and Financial Director/Chief Financial Officer pursuant to Section 302 of the Sarbanes-Oxley Act of 2002 | |
| 13.1 | Certifications of the Chief Executive Officer and Financial Director/Chief Financial Officer pursuant to Section 906 of the Sarbanes-Oxley Act of 2002 | |
| 15.1 | Consent of KPMG LLP and KPMG Accountants N.V. | |
Table of Contents
Certain instruments which define rights of holders of long-term debt of the Company and its subsidiaries are not being filed because the total amount of securities authorized under each such instrument does not exceed 10% of the total consolidated assets of the Company and its subsidiaries. The Company and its subsidiaries hereby agree to furnish a copy of each such instrument to the Securities and Exchange Commission upon request.
| 1 | Incorporated by reference to Exhibit 1.1 of Form 20-F (File No: 001-04546) filed with the SEC on March 08, 2013. | |
| 2 | Incorporated by reference to Exhibit 2.2 of Form 20-F (File No: 001-04546) filed with the SEC on March 28, 2002. | |
| 3 |
Incorporated by reference to Exhibit 2.3 of Form 20-F (File No: 333-196985) filed with the SEC on March 6, 2015. |
|
| 4 | Incorporated by reference to Exhibit 99(A) of Form F-6 (File No: 001-04546) filed with the SEC on June 24, 2014. | |
| 5 |
Incorporated by reference to Exhibit 4.1 of Form 20-F (File No: 001-04546) filed with the SEC on March 5, 2010. |
|
| 6 | Incorporated by reference to Exhibit 4.1(b) of Form 20-F (File No: 001-04546) filed with the SEC on March 6, 2015. | |
| 7 |
Incorporated by reference to Exhibit 4.1(c) of Form 20-F (File No: 001-04546) filed with the SEC on March 6, 2015. |
|
| 8 | Incorporated by reference to Exhibit 4.2 of Form 20-F (File No: 001-04546) filed with the SEC on March 4, 2011. | |
| 9 | Incorporated by reference to Exhibit 99.1 of Form S-8 (File No: 333-185299) filed with the SEC on December 6, 2012. | |
| 10 | Incorporated by reference to Exhibit 4.5 of Form 20-F (File No: 001-04546) filed with the SEC on March 28, 2002. | |
| 11 | Incorporated by reference to Exhibit 4.7 of Form 20-F (File No: 001-04546) filed with the SEC on March 28, 2002. | |
| 12 | Incorporated by reference to Exhibit 4.7 of Form 20-F (File No: 001-04546) filed with the SEC on March 26, 2008. | |
| 13 | Incorporated by reference to Exhibit 4.8 of Form 20-F (File No: 001-04546) filed with the SEC on March 4, 2011. | |
| 14 | The required information is set forth on pages 131 to 143 of the Annual Report on Form 20-F 2016. | |