UNION BANKSHARES INC
10-Ks and 10-Qs
|
|
|
|
|
|
|
|
|
|
|
|
|
|
|
|
|
|
|
|
|
|
|
|
|
|
|
|
|
|
|
|
|
|
|
|
|
|
|
|
|
|
|
|
|
|
|
|
|
|
|
|
|
UNITED STATES
SECURITIES AND EXCHANGE COMMISSION
Washington, D.C. 20549
FORM 10-K
(X) ANNUAL REPORT PURSUANT TO SECTION 13 OR 15 (d) OF THE
SECURITIES EXCHANGE ACT OF 1934
( ) TRANSITION REPORT UNDER SECTION 13 OR 15(d) OF THE
SECURITIES EXCHANGE ACT OF 1934
|
For the fiscal year ended
|
December 31, 2017
|
Commission file number
|
001-15985
|
UNION BANKSHARES, INC.
|
|
VERMONT
|
|
03-0283552
|
|
P.O. BOX 667
20 LOWER MAIN STREET
MORRISVILLE, VT 05661-0667
Registrant's telephone number: 802-888-6600
Former name, former address and former fiscal year, if changed since last report: Not applicable
Securities registered pursuant to section 12(b) of the Act:
|
|
Common Stock, $2.00 par value
|
|
The NASDAQ Stock Market LLC
|
|
|
|
(Title of class)
|
|
(Exchanges registered on)
|
|
Securities registered pursuant to Sections 12(g) of the Act:
None
Indicate by check mark if the registrant is a well-known seasoned issuer, as defined in Rule 405 of the Securities Act.
Yes [ ] No [X]
Indicate by check mark if the registrant is not required to file reports pursuant to Section 13 or Section 15(d) of the Act.
Yes [ ] No [X]
Indicate by check mark whether the registrant (1) has filed all reports required to be filed by Section 13 or 15(d) of the Securities Exchange Act of 1934 during the preceding 12 months (or for such shorter period that the Registrant was required to file such reports), and (2) has been subject to such filing requirements for the past 90 days.
Yes [X ] No [ ]
Indicate by check mark whether the registrant has submitted electronically and posted on its corporate Web site, if any, every Interactive Data File required to be submitted and posted pursuant to Rule 405 of Regulation S-T (§ 232.405 of this chapter) during the preceding 12 months (or for such shorter period that the registrant was required to submit and post such files). YES [X] NO [ ]
Indicate by check mark if disclosure of delinquent filers pursuant to Item 405 of Regulation S-K is not contained herein, and will not be contained, to the best of registrant's knowledge, in definitive proxy or information statements incorporated by reference in Part III of this Form 10-K or any amendment to this Form 10-K. [ ]
Indicate by check mark whether the registrant is a large accelerated filer, an accelerated filer, a non-accelerated filer or a smaller reporting company. See definitions of “large accelerated filer,” ”accelerated filer” and “smaller reporting company” in Rule 12b-2 of the Exchange Act. (Check one):
|
Large accelerated filer [ ]
|
Accelerated filer [X]
|
|
Non-accelerated filer [ ] (Do not check if a smaller reporting company)
|
Smaller reporting company [ ]
|
Indicate by check mark whether the registrant is a shell company (as defined in Rule 12b-2 of the Act).
Yes [ ] No [X]
The aggregate market value of the common stock held by non-affiliates of the registrant on June 30,
2017
was $183,447,500 based on the closing price on the NASDAQ Stock Market LLC on such date of $47.50 per share. For purposes of this calculation, all directors, executive officers, and named executives of the Registrant are assumed to be affiliates. Such assumption, however, shall not be deemed to be an admission of such status as to any such individual.
DOCUMENTS INCORPORATED BY REFERENCE
Specifically designated portions of the following documents are incorporated by reference in the indicated Part of this Annual Report on Form 10-K:
|
Document
|
Part
|
|
|
Proxy Statement for the 2018 Annual Meeting of Shareholders
|
III
|
|
UNION BANKSHARES, INC.
Table of Contents
|
Part I
|
||
|
Item 1 -
|
Description of Business
|
|
|
Item 1A -
|
Risk Factors
|
|
|
Item 1B -
|
Unresolved Staff Comments
|
|
|
Item 2 -
|
Properties
|
|
|
Item 3 -
|
Legal Proceedings
|
|
|
Item 4 -
|
Mine Safety Disclosures
|
|
|
|
|
|
|
Part II
|
||
|
Item 5 -
|
Market for Registrant's Common Equity, Related Stockholder Matters, and Issuer Purchases of Equity Securities
|
|
|
Item 6 -
|
Selected Financial Data
|
|
|
Item 7 -
|
Management's Discussion and Analysis of Financial Condition and Results of Operations
|
|
|
Item 7A -
|
Quantitative and Qualitative Disclosures about Market Risk
|
|
|
Item 8 -
|
Financial Statements and Supplementary Data
|
|
|
Item 9 -
|
Changes in and Disagreements with Accountants on Accounting and Financial Disclosures
|
|
|
Item 9A -
|
Controls and Procedures
|
|
|
Item 9B -
|
Other Information
|
|
|
|
|
|
|
Part III
|
||
|
Item 10 -
|
Directors, Executive Officers and Corporate Governance (a)
|
|
|
Item 11 -
|
Executive Compensation (a)
|
|
|
Item 12 -
|
Security Ownership of Certain Beneficial Owners and Management and Related Stockholder Matters (a)
|
|
|
Item 13 -
|
Certain Relationships and Related Transactions, and Director Independence (a)
|
|
|
Item 14 -
|
Principal Accountant Fees and Services (a)
|
|
|
|
|
|
|
Part IV
|
||
|
Item 15 -
|
Exhibits, Financial Statement Schedules and Reports on Form 8-K
|
|
|
|
||
|
Signatures
|
||
|
Exhibit Index
|
||
____________________
|
(a)
|
The information required by Part III Items 10, 11, 12, 13 and 14 is incorporated herein by reference, in whole or in part, from the Company's Proxy Statement for the Annual Meeting of Shareholders to be held on May 16, 2018. The incorporation by reference herein of portions of the Proxy Statement shall not be deemed to specifically incorporate by reference the information referred to in Items 407(d)(1)-(3) of Regulation S-K. Incorporation by reference of this report into any registration statement filed by the Company under the Securities Act of 1933, as amended shall not be deemed to incorporate by reference the information referred to in Item 201(e) of Regulation S-K.
|
3
FORWARD-LOOKING STATEMENTS
The Company may from time to time make written or oral statements that are considered “forward-looking statements” within the meaning of the Private Securities Litigation Reform Act of 1995. Forward-looking statements may include financial projections, statements of plans and objectives for future operations, estimates of future economic performance or conditions and assumptions relating thereto. The Company may include forward-looking statements in its filings with the SEC, in its reports to stockholders, including this Annual Report, in press releases, other written materials, and in statements made by senior management to analysts, rating agencies, institutional investors, representatives of the media and others.
Forward-looking statements reflect management's current expectations and are subject to uncertainties, both general and specific, and risk exists that actual results will differ from those predictions, forecasts, projections and other estimates contained in forward-looking statements. These risks cannot be readily quantified. When management uses any of the terms “believes,” “expects,” “anticipates,” “intends,” "projects," "potential," “plans,” “seeks,” “estimates,” "targets," "goals," “may,” “could,” “would,” “should,” or similar expressions, they are making forward-looking statements. Many possible events or factors, including those beyond the control of management, could affect the future financial results and performance of the Company.
Factors that may cause results or performance to differ materially from those expressed in forward-looking statements include, but are not limited to:
|
•
|
General economic conditions and financial instability, either nationally, internationally, regionally or locally;
|
|
•
|
Increased competitive pressures from tax-advantaged credit unions and other financial service providers in the Company's northern Vermont and New Hampshire market area or in the financial services industry generally, from increasing consolidation and integration of financial service providers, and from changes in technology and delivery systems;
|
|
•
|
Interest rates change in such a way that continues to put pressure on the Company's margins, or result in lower fee income and lower gain on sale of real estate loans;
|
|
•
|
Changes in laws or government rules, or the way in which courts or government agencies interpret or implement those laws or rules, that increase our costs of doing business or otherwise adversely affect the Company's business;
|
|
•
|
Further changes in federal or state tax policy;
|
|
•
|
Changes in the level of nonperforming assets and charge-offs;
|
|
•
|
Changes in estimates of future reserve requirements based upon relevant regulatory and accounting requirements;
|
|
•
|
Changes in information technology that require increased capital spending;
|
|
•
|
Changes in consumer and business spending, borrowing and savings habits;
|
|
•
|
Changes in accounting principles, including those governing the manner of estimating our credit risk and calculating our loan loss reserve;
|
|
•
|
Changes affecting the calculation of the amount of the contribution that will be required to settle our obligations in connection with termination of our defined benefit pension plan and the impact of such termination on our net income in 2018.
|
|
•
|
Further changes to the regulations governing the calculation of the Company’s regulatory capital ratios; and
|
|
•
|
The effect of and changes in the United States monetary and fiscal policies, including interest rate policies and regulation of the money supply by the FRB.
|
Certain Definitions:
Capitalized terms used in the following discussion and not otherwise defined below have the meanings assigned to them in Note 1 to the Company's audited consolidated financial statements contained in Part II, item 8, page 53 of this Annual Report.
General:
Union Bankshares, Inc. (“Company”) is a one-bank holding company whose sole subsidiary is Union Bank (“Union”). It was incorporated in the State of Vermont in 1982. The Company's common stock is traded on the NASDAQ Global Select Market under the symbol "UNB". Union Bank was organized and chartered as a State bank in 1891 and became a wholly owned subsidiary of the Company in 1982 upon its formation. Both Union Bankshares, Inc. and Union Bank are headquartered in Morrisville, Vermont.
The Company's business is that of a community bank in the financial services industry. The Company has one definable business segment, Union Bank, which provides full retail, commercial, municipal banking, and asset management and trust services throughout its 17 banking offices, three loan centers, and several ATMs covering northern Vermont and New Hampshire. Also, many of Union's services are provided via the telephone, mobile devices, and through its website,
www.ublocal.com
. Union seeks to make a profit for the Company while providing quality retail banking services to individuals and commercial banking services
4
to small and medium sized corporations, partnerships, and sole proprietorships, as well as nonprofit organizations, local municipalities and school districts within its market area.
The Company's income is derived principally from interest and fees on loans and earnings on other investments. Its primary expenses arise from interest paid on deposits and borrowings, salaries and wages, health insurance and other employee benefits and other general overhead expenses. Our profitability depends primarily on net interest income, which is the difference between interest and dividend income on interest-earning assets and interest expense on interest-bearing liabilities. Interest-earning assets include loans, investment securities, and interest-earning deposits in banks. Interest-bearing liabilities primarily include customer deposit accounts and borrowings. Net interest income is dependent upon the level of interest rates and the extent to which such rates change, as well as changes in the volume of various categories of assets and liabilities. Our profitability is also dependent on the level of noninterest income (primarily gains on sale of real estate loans, loan servicing income, and service fees), provision for loan losses, noninterest expenses and income taxes. Our operations and profitability are subject to changes in interest rates, applicable statutes and regulations, changes in corporate tax rates, general economic conditions, the competitive environment, as well as other factors beyond our control.
Employees:
The Company itself does not have any paid employees. As of
December 31, 2017
, Union employed 194 full time equivalent employees. Union employees are not represented by any collective bargaining group. Union maintains comprehensive employee benefit programs for its employees, including medical and dental insurance, long-term and short-term disability insurance, life insurance and a 401(k) plan. Management considers its employee relations to be good.
Description of Services:
Services or products offered to our customers include, but are not limited to, the following:
|
•
|
Commercial loans for business purposes to business owners and investors for plant and equipment, working capital, real estate renovation and other sound business purposes;
|
|
•
|
Commercial real estate loans on income producing properties, including commercial construction loans;
|
|
•
|
SBA guaranteed loans;
|
|
•
|
Residential construction and mortgage loans;
|
|
•
|
Online cash management services, including account reconciliation, credit card depository, Automated Clearing House origination, wire transfers and night depository;
|
|
•
|
Merchant credit card services for the deposit and immediate credit of sales drafts,
|
|
•
|
Remote deposit capture for merchants;
|
|
•
|
Online mortgage applications;
|
|
•
|
Business checking accounts;
|
|
•
|
Standby letters of credit, bank checks or money orders, and safe deposit boxes;
|
|
•
|
ATM services;
|
|
•
|
Debit MasterCard and ATM cards;
|
|
•
|
Telephone, Internet, and mobile banking services, including bill pay;
|
|
•
|
Home improvement loans and overdraft checking privileges against preauthorized lines of credit;
|
|
•
|
Retail depository services including personal checking accounts, checking accounts with interest, savings accounts, money market accounts, certificates of deposit, IRA/SEP/KEOGH accounts and Health Savings accounts;
|
|
•
|
Customer repurchase agreement sweeps; and
|
|
•
|
Asset management and trust services to individuals and organizations.
|
Consistent with the objective of the Company to serve the needs of individuals, businesses and others within the communities served, the Company seeks to concentrate its assets in loans. For the year ended
December 31, 2017
, the Company's rate of average loans to average deposits was
93.8%
. To be consistent with the requirements of prudent banking practices, adequate levels of assets are invested in high-grade securities, FDIC insured certificates of deposits, or other prudent investment alternatives such as company-owned life insurance and investments in real estate limited partnerships for affordable housing. Deposits are the primary source of funds for use in lending, investing and for other general operating purposes. In addition we obtain funds from principal repayments, sales and prepayments of loans, securities and FDIC insured certificates of deposit. Other funding sources may include brokered deposits purchased through CDARS, ICS or through other deposit brokers, and borrowings from the FHLB, correspondent banks or the Federal Reserve discount window.
Competition:
The Company and Union face substantial competition for loans and deposits in northern Vermont and New Hampshire from local and regional commercial banks, savings banks, tax exempt credit unions, mortgage brokers, and financial services affiliates of bank holding companies, as well as from national financial service providers such as mutual funds, brokerage houses, insurance companies, consumer finance companies and internet banks. Within the Company's market area are branches of several commercial and savings banks that are substantially larger than Union. Union focuses on its community banking niche and on providing convenient locations, hours and modes of delivery to provide superior customer service. We have seen over the last few years, a trend by customers to turn to local community banks to fulfill their financial needs with organizations and people
5
they know and trust. We are hopeful that this trend will continue. The Company seeks to capitalize upon the extensive business and personal contacts and relationships of its directors, advisory board members and officers to continue to develop the Company's customer base, as well as relying on director and advisory board referrals, officer-originated calling programs and customer and shareholder referrals.
In order to compete with the larger financial institutions in its service area, Union capitalizes on the flexibility and local autonomy which is accorded by its independent status. This includes an emphasis on personal service, timely decision making, local promotional activity, and personal contacts and community service by Union's officers, directors and employees. The Company strives to inform the public about the strength of the Company, the variety and flexibility of services offered, as well as the strength of the local economy relative to the national economy and global problems in the real estate market and provides information on financial topics of interest. The Company also strives to educate future generations by helping them to cultivate sound personal financial habits through its "Save for Success" program for children.
The Company competes for deposit accounts by offering customers competitive products and rates, personal service, local area expertise, convenient locations and access, and an array of financial services and products. Higher interest rates and deposit “specials” offered by competitors as well as the variety of nonbanking investment avenues open to our customers and the public make deposit growth challenging.
The competition in originating real estate and other loans comes principally from commercial banks, savings banks, mortgage banking companies and tax exempt credit unions. The Company competes for loan originations primarily through the interest rates and loan fees it charges, the types of loans it offers, and the efficiency and quality of services it provides. In addition to residential mortgage lending and municipal loans, the Company also emphasizes commercial real estate, construction, and both conventional and SBA guaranteed commercial lending. Factors that affect the Company's ability to compete for loans include general and local economic conditions, prevailing interest rates including the “prime” rate, and pricing volatility of the secondary loan markets. The Company promotes an increased level of personal service and expertise within the community to position itself as a lender to small to middle market business and residential customers, which tend to be under-served by larger institutions.
The Company, through Union's Asset Management Group division, competes for personal and institutional asset management and trust business with trust companies, commercial banks having trust departments, investment advisory firms, brokerage firms, mutual funds and insurance companies.
Regulation and Supervision
General
As a bank holding company registered under the BHCA, the Company is subject to regulation and supervision by the Board of Governors of the FRB. As a state chartered commercial bank, Union Bank is subject to the regulation and supervision by the FDIC and the DFR. The regulatory framework is intended primarily for the protection of depositors, federal deposit insurance funds and the banking system as a whole, and not for the protection of security holders. This regulation and supervision establishes a comprehensive framework of activities in which a bank holding company or a bank can engage. The prior approval of the FDIC and DFR is required, among other things, for Union to establish or relocate a branch office, assume deposits or engage in any merger, consolidation, purchase or sale of all or substantially all of the assets of any bank. This regulatory structure also gives the regulatory authorities extensive discretion in connection with their supervisory and enforcement activities and examination policies, including policies with respect to classification of assets and establishment of adequate credit loss reserves for regulatory purposes. To the extent that this information describes statutory and regulatory provisions, it is qualified in its entirety by reference to those provisions.
The Company is also under the jurisdiction of the SEC for matters relating to the offer and sale of its securities as well as investor reporting requirements. The Company is subject to restrictions, reporting requirements, and review procedures under federal securities laws and regulations. The Company's common stock is listed on the NASDAQ Global Select Market under the trading symbol “UNB” and accordingly, the Company is subject to the rules of NASDAQ for listed companies.
Financial Regulatory Reform Legislation
The Dodd-Frank Act.
The Dodd-Frank Act, enacted in 2010, comprehensively reformed the regulation of financial institutions and the products and services they offer. Among other things, the Dodd-Frank Act:
|
•
|
granted the FRB increased supervisory authority and codified the source of strength doctrine,
|
|
•
|
provided new capital standards applicable to the Company,
|
|
•
|
modified the scope and costs associated with deposit insurance coverage,
|
6
|
•
|
permitted well capitalized and well managed banks to acquire other banks in any state subject to certain deposit concentration limits and other conditions,
|
|
•
|
permitted the payment of interest on business demand deposit accounts,
|
|
•
|
established the CFPB and transferred rulemaking authority to it under various consumer protection laws relating to financial products and services,
|
|
•
|
established new minimum mortgage underwriting standards for residential mortgages,
|
|
•
|
barred banking organizations, such as the Company, from engaging in proprietary trading and from sponsoring and investing in hedge funds and private equity funds, except as permitted under certain circumstances, and
|
|
•
|
established the Financial Stability Oversight Council to designate certain activities as posing a risk to the United States financial systems and recommended new or heightened standards and safeguards for financial institutions engaging in such activities.
|
While the Dodd-Frank Act is focused principally on changes to the financial regulatory system, it includes several corporate governance, disclosure and compensation provisions applicable to public companies. Those provisions include:
|
•
|
A requirement that public companies solicit an advisory vote on executive compensation ("Say-on-Pay"), an advisory vote on the frequency of Say-on-Pay votes and, in the event of a merger or other extraordinary transaction, an advisory vote on certain "golden parachute" payments. The Company's last Say-on-Pay vote was hel
d
at the 2016 annual meeting with shareholders approving the Company's executive compensation program by a wide margin,
|
|
•
|
Requirements that the SEC adopt rules directing the securities exchanges to adopt listing standards with respect to compensation committee independence and the use of consultants
,
|
|
•
|
Provisions calling for the SEC to adopt expanded disclosure requirements for annual proxy statements and other filings, particularly in the area of executive compensation, such as disclosure of pay versus performance, the ratio of CEO pay to the pay of a median employee and policies with regard to hedging transactions conducted by employees and directors,
|
|
•
|
Provisions requiring the adoption or revision of certain other corporate policies, such as compensation "clawback" policies providing for the recovery of executive compensation in the event of a financial restatement, and
|
|
•
|
A provision clarifying the SEC's authority to adopt rules requiring issuers to include in their proxy statements solicitations for shareholder nominations for directors.
|
Bank Holding Company Regulation
Source of Strength.
Under long-standing FRB policy and now codified in the Dodd-Frank Act, bank holding companies, such as Union Bankshares, are required to act as a source of financial and management strength to their subsidiary banks, such as Union, and to commit resources to support them. This support may be called for at times when a bank holding company may not have the required resources to do so.
Acquisitions and Activities.
Under the BHCA, the activities of bank holding companies, such as Union Bankshares Inc., and those of companies that they control, such as Union, or in which they hold more than 5% of the voting stock, are limited to banking, managing or controlling banks, furnishing services to or performing services for their subsidiaries, or certain activities that the FRB has determined to be so closely related to banking, managing or controlling banks as to be a proper incident thereto. Satisfactory capital ratios, CRA ratings and anti-money laundering policies are generally prerequisites to obtaining Federal regulatory approval to make acquisitions. Union Bankshares Inc. has not elected to become a financial holding company.
Enforcement Powers.
The FRB has the authority to issue cease and desist orders against bank holding companies to prevent or terminate unsafe or unsound banking practices, violations of law and regulations, or conditions imposed by, or violations of agreements with, or commitments to, the FRB. The FRB is also empowered to assess civil money penalties against companies or individuals who violate the BHCA or orders or regulations thereunder, to order termination of nonbanking activities of nonbanking subsidiaries of bank holding companies, and to order termination of ownership and control of a nonbanking subsidiary by a bank holding company. There are no enforcement actions currently in place against the Company.
The FRB has the power to prohibit dividends by bank holding companies if their actions constitute unsafe or unsound practices. The FRB has issued a policy statement on the payment of cash dividends by bank holding companies, which expresses the FRB's view that a bank holding company should pay cash dividends only to the extent that the company's net income for the past year is sufficient to cover both the cash dividends and rate of earnings retention that is consistent with the company's capital needs, asset quality and overall financial condition.
Regulation of Union Bank
Deposit Insurance.
As a member of the FDIC, the deposits of Union are permanently insured under the Deposit Insurance Fund (“DIF”) maintained by the FDIC up to $250,000 per ownership category. Under applicable federal laws and regulations, deposit insurance premium assessments to the DIF are based on a supervisory risk rating system, with the most favorably rated institutions paying the lowest premiums. Under this assessment system, risk is defined and measured using an institution's supervisory ratings,
7
combined with certain other risk measures, including certain financial ratios and long-term debt issuer ratings. For the year ended
December 31, 2017
, the Bank's total FDIC insurance assessment expense was
$337 thousand
.
Brokered Deposits
.
The FDICIA restricts the ability of an FDIC insured bank to accept brokered deposits unless it is a well capitalized institution under FDICIA's prompt corrective action guidelines. Union accepts brokered time and money market deposits primarily through its membership with the Promontory Interfinancial Network in CDARS and ICS, respectively. Additionally, Union has established an account with one of its approved investment brokers to accept brokered deposits as an approved liquidity source.
Community Reinvestment Act ("CRA").
Union is subject to the federal CRA, which requires banks to demonstrate their commitment to serving the credit needs of low and moderate income residents of their communities. Union participates in a variety of direct and indirect lending programs and other investments for the benefit of low and moderate income residents in its local communities. The FDIC conducts examinations of insured banks' compliance with CRA requirements and rates institutions as "Outstanding," "Satisfactory," "Needs to Improve," and "Substantial NonCompliance." Failure of an institution to receive at least a "Satisfactory" CRA rating could adversely affect its ability to undertake certain activities, such as branching and acquisitions of other financial institutions, which require regulatory approval based, in part, on the institution's record of CRA compliance. In addition, failure of a bank subsidiary to receive at least a "Satisfactory" rating would disqualify a bank holding company from eligibility to become or remain a financial holding company under the GLBA. Union has received at least a "Satisfactory" rating from all CRA compliance examinations by the FDIC.
Federal Reserve Board Policies and Reserve Requirements.
The monetary policies and regulations of the FRB have had a significant effect on the operating results of banks in the past and are expected to continue to do so in the future. FRB policies affect the levels of bank earnings on loans and investments and the levels of interest paid on bank deposits and borrowings through the Federal Reserve System's open-market operations in United States government securities, regulation of the discount rate and terms on bank borrowings from Federal Reserve Banks and regulation of nonearning reserve requirements. Regulation D promulgated by the FRB requires all depository institutions to maintain reserves against their transaction accounts (generally, demand deposits, NOW accounts and certain other types of accounts that permit payments or transfers to third parties) and nonpersonal nontime deposits (generally, money market deposit accounts or other savings deposits held by corporations or other depositors that are not natural persons, and certain types of time deposits), subject to certain exemptions. As of
December 31, 2017
, Union's reserve requirement was approximately
$1.4 million
, which was satisfied by vault cash.
Enforcement Powers.
The FDIC and the DFR have the authority to issue orders to banks under their supervision to cease and desist from unsafe or unsound banking practices, violations of law and regulation, or conditions imposed by, or violations of agreements with, or commitments to, the FDIC or DFR. The FDIC and the DFR are also empowered to assess civil money penalties against companies or individuals who violate banking laws, orders or regulations. There are no such enforcement actions currently in place against Union.
Capital Adequacy and Safety and Soundness
Capital Adequacy Guidelines.
The FDIC and other federal bank regulatory agencies adopted a final rule for leverage and risk-based capital requirements and the method for calculating risk-weighted assets which is consistent with agreements that were reached by the Basel Committee on Banking Supervision under the so-called Basel III framework and certain provisions of the Dodd-Frank Act. Among other things, the rule established a common equity Tier 1 capital ratio with a minimum requirement of 4.5%, increased the minimum Tier 1 risk based ratio from 4.0% to 6.0%, and assigned a higher risk weight of 150% to exposures that are more than 90 days past due or in nonaccrual status as well as certain commercial real estate loans that finance the acquisition, development or construction of real property. The final rule also required accumulated OCI be included for purposes of calculating regulatory capital unless a one time opt-out election was made during the first quarter of 2015. The Company and Union both made the election. The rule limits a banking organization's capital distributions and certain discretionary bonus payments if the banking organization does not hold a "capital conservation buffer" of 2.5% above the minimum capital ratio requirements. The 2.5% capital conservation buffer requirement will be phased in over a four-year period ending January 1, 2019. Please refer to Note 21(
Regulatory Capital Requirements)
to the Company's audited consolidated financial statements contained in Part II, Item 8 of this annual report on Form 10-K for the regulatory capital ratios for the Company and Union as of
December 31, 2017
and
December 31, 2016
.
A financial institution's failure to meet minimum regulatory capital standards can lead to other penalties, including termination of deposit insurance or appointment of a conservator or receiver for the financial institution. Risk based capital ratios are the primary measure of regulatory capital presently applicable to bank holding companies. Risk based capital guidelines are designed to make regulatory capital requirements more sensitive to differences in risk profiles among banks and bank holding companies, to account for off-balance-sheet exposure and to minimize disincentives for holding liquid assets.
8
Federal bank regulatory agencies require banking organizations that engage in significant trading activity to calculate a capital charge for market risk. Significant trading activity means trading activity of at least 10% of total assets or $1 billion, whichever is smaller, calculated on a consolidated basis for bank holding companies. Federal bank regulators may apply the market risk measure to other bank holding companies, as the agency deems necessary or appropriate for safe and sound banking practices. Each agency may exclude organizations that it supervises that otherwise meet the criteria under certain circumstances. The market risk charge will be included in the calculation of an organization's risk based capital ratio. Neither the Company nor Union is currently subject to this special capital charge.
Prompt Corrective Action.
FDICIA, among other things, identifies five capital categories for insured depository institutions (well capitalized, adequately capitalized, undercapitalized, significantly undercapitalized and critically undercapitalized) and requires the respective federal banking agencies to implement systems for “prompt corrective action” for insured depository institutions that do not meet minimum capital requirements. FDICIA imposes progressively more restrictive constraints on operations, management and capital distributions, depending on the category in which an institution is classified. Failure to meet the capital guidelines could also subject a banking institution to capital raising requirements. An “undercapitalized” bank must develop a capital restoration plan and its parent holding company must guarantee that bank's compliance with the plan. The liability of the parent holding company under any such guarantee is limited to the lesser of 5% of the bank's assets at the time it became undercapitalized or the amount needed to comply with the plan. Furthermore, in the event of the bankruptcy of the parent holding company, such guarantee would take priority over the parent's general unsecured creditors. In addition, FDICIA requires the various federal banking agencies to prescribe certain noncapital standards for safety and soundness related generally to operations and management, asset quality and executive compensation, and permits regulatory action against a financial institution that does not meet such standards.
Consistent with the revisions to the capital adequacy rules of the federal banking regulators, effective January 1, 2015, the FDIC adopted conforming changes to its prompt corrective action regulations. These changes include a new common equity Tier 1 ratio requirement, with a required minimum ratio of 6.5% for well-capitalized status. The new regulations also increase the minimum ratio of Tier 1 capital to risk weighted assets for well-capitalized status to 8.0%, from the previous 6.0%.
The various federal banking agencies have adopted substantially similar regulations that define the five capital categories identified by FDICIA, using the Tier 1 Capital, Common Equity Tier 1 Capital, Total Capital and Leverage Ratios as the relevant capital measures. Such regulations establish various degrees of corrective action to be taken when an institution is considered undercapitalized. Under the regulations as in effect during 2017, a “well capitalized” institution must have a Tier 1 capital ratio of at least 8.0%, a Common Equity Tier 1 ratio of 6.5%, a total capital ratio of at least 10% and a leverage ratio of at least 5% and not be subject to a capital directive order.
At
December 31, 2017
, Union's Tier I and Total Risk Based Capital Ratios were
12.5%
and
13.6%
respectively, and its Leverage Capital Ratio was
8.4%
, and it is considered well capitalized under applicable regulatory guidelines in effect as of such date. However, an increase in the amount of capital that the Company or Union must maintain in order to support a given level of assets would reduce the amount of leverage that our capital could support and increased volatility could be problematic. Our ability to increase our level of interest earning assets or to allocate those assets in the best manner to generate interest income may be adversely affected.
Safety and Soundness Standards.
FDICIA, as amended, directs each Federal banking agency to prescribe safety and soundness standards for depository institutions relating to internal controls, information systems, internal audit systems, loan documentation, credit underwriting, interest rate exposure, asset growth, compensation, asset quality, earnings and stock valuation. The Community Development and Regulatory Improvement Act of 1994 amended FDICIA by allowing Federal banking regulators to publish guidelines rather than regulations concerning safety and soundness.
FDICIA also contains a variety of other provisions that may affect Union's operations, including reporting requirements, regulatory guidelines for real estate lending, “truth in savings” disclosure provisions, and a requirement to provide 90 days prior notice to customers and regulatory authorities before closing any branch. Union is subject to §112 of FDICIA, which requires an additional annual reporting to the FDIC, FRB, and DFR regarding preparation of the annual financial statements, the maintenance of an internal control structure for financial reporting and compliance with certain designated banking laws, as well as imposition of increased responsibilities on the Company's external auditor and audit committee.
Dividend Restrictions
As a bank holding company, the Company's ability to pay dividends to its stockholders is largely dependent on the ability of its subsidiary to pay dividends to it. Payment of dividends by Vermont-chartered banks, such as Union, is subject to applicable state and federal laws. Under Vermont banking laws, a Vermont-chartered bank may not authorize dividends or other distributions that would reduce the bank's capital below the amount of capital required in the bank's Certificate of General Good or under any capital
9
or surplus standards established by the Commissioner of the DFR. Union does not have any capital restrictions in its Certificate of General Good and, to date, the Commissioner of the DFR has not adopted capital or surplus standards. Nevertheless, the capital standards established by the FDIC, described above under "Prompt Corrective Action" apply to Union, and the capital standards of the FRB apply to the Company on a consolidated basis. In addition, the FRB, the FDIC and the Commissioner of the DFR are authorized under applicable federal and state laws to prohibit payment of dividends that are determined to be an unsafe or unsound practice. Payment of dividends that significantly deplete the capital of a bank or a bank holding company, or render it illiquid, could be found to be an unsafe or unsound practice. Further, the Basel III capital standards limit a financial institution's ability to pay dividends if it does not maintain a required capital conservation buffer.
Consumer Protection Regulation
We are subject to a number of federal and state laws designed to protect consumers and prohibit unfair or deceptive business practices, including, but not limited to, the Equal Credit Opportunity Act, the Fair Housing Act, Home Ownership Protection Act, the Fair Credit Reporting Act, as amended by the Fair and Accurate Credit Transactions Act of 2003 (the “FACT Act”), GLBA, the Truth in Lending Act, CRA, the Home Mortgage Disclosure Act, the Real Estate Settlement Procedures Act, the National Flood Insurance Act and various state law counterparts. Union is also subject to laws and regulations to protect consumers in connection with their deposit or electronic transactions. These laws include the Truth in Savings Act, the Electronic Funds Transfer Act and the Expedited Funds Availability Act. These laws and regulations mandate certain disclosure requirements and regulate the manner in which financial institutions must interact with customers when taking deposits, making loans, collecting loans and providing other services. Further, the Dodd-Frank Act established the CFPB, which has the responsibility for making rules and regulations under the federal consumer protection laws relating to financial products and services. The CFPB also has a broad mandate to prohibit unfair or deceptive acts and practices and is specifically empowered to require certain disclosures to consumers and draft model disclosure forms under the various federal consumer protection laws. The CFPB is charged with examining banks with assets in excess of $10 billion, while community banks continue to be subject to the enforcement authority of their primary regulator. This supervisory structure may lead to conflicting regulatory guidance for community banks versus larger banks and increase regulatory costs and burdens. Failure to comply with consumer protection laws and regulations can subject financial institutions to enforcement actions, fines and other penalties.
Mortgage Reform.
The Dodd-Frank Act prescribes certain standards that mortgage lenders must consider before making a residential mortgage loan, including verifying a borrower’s ability to repay such mortgage loan, and allows borrowers to assert violations of certain provisions of the Truth-in-Lending Act as a defense to foreclosure proceedings. Under the Dodd-Frank Act, prepayment penalties are prohibited for certain mortgage transactions and creditors are prohibited from financing credit life/disability insurance policies in connection with a residential mortgage loan or home equity line of credit. In addition, the Dodd-Frank Act prohibits mortgage originators from receiving compensation based on the terms of residential mortgage loans and generally limits the ability of a mortgage originator to be compensated by others if compensation is received from a consumer. The Dodd-Frank Act requires mortgage lenders to make additional disclosures prior to the extension of credit, in each billing statement, and for negative amortization loans and hybrid adjustable rate mortgages. Additionally, the CFPB published rules and forms that combined certain disclosures that consumers receive in connection with applying for and closing on a residential mortgage loan under the Truth in Lending Act (Regulation Z) and the Real Estate Settlement Procedures Act (Regulation X), also known as the TILA and RESPA Integrated Disclosures, or TRID. TRID established new disclosure timing requirements and applies to most closed-end consumer credit transactions secured by real property.
Privacy and Customer Information Security.
The GLBA requires financial institutions to implement policies and procedures regarding the disclosure of nonpublic personal information about consumers to nonaffiliated third parties. In general, we must provide our customers with an annual disclosure that explains our policies and procedures regarding the disclosure of such nonpublic personal information or provide notice as to where our policies and procedures may be accessed. Except as otherwise required or permitted by law, we are prohibited from disclosing nonpublic personal information except as provided in such policies and procedures. The GLBA also requires that we develop, implement and maintain a comprehensive written information security program designed to ensure the security and confidentiality of customer information (as defined under the GLBA), to protect against anticipated threats or hazards to the security or integrity of such information; and to protect against unauthorized access to or use of such information that could result in substantial harm or inconvenience to any customer. We are also required to send a notice to customers whose “sensitive information” has been compromised if unauthorized use of this information is “reasonably possible.” Most of the states, including the states where we operate, have enacted legislation concerning breaches of data security and our duties in response to a data breach. Congress continues to consider federal legislation that would require consumer notice of data security breaches. Pursuant to the FACT Act, we have developed and implemented a written identity theft prevention program to detect, prevent, and mitigate identity theft in connection with the opening of certain accounts or certain existing accounts.
Additionally, the FACT Act amends the Fair Credit Reporting Act to generally prohibit a person from using information received from an affiliate to make a solicitation for marketing purposes to a consumer, unless the consumer is given notice and a reasonable opportunity and simple method to opt out of the making of such solicitations.
10
Home Mortgage Disclosure Act (“HMDA”).
HMDA makes information available to the public that helps to show whether financial institutions are serving the housing credit needs of their neighborhoods and communities. The Act requires institutions to gather and compile data about loan applications for home purchase, home improvement and refinances where both the old loan and new loan are secured by a dwelling. The information must be compiled each calendar year on a Loan/Application Register, and submitted to the FFIEC by March 1st of the following year and made available to the public no later than March 31st. The Federal Financial Institutions Examinations Council prepares a series of tables that comprise the disclosure statement for each reporting institution. HMDA applies to financial institutions that have their main office or any branch in a Metropolitan Statistical Area ("MSA"). Union is subject to HMDA as it has branch offices within the Burlington, Vermont MSA. In accordance with the Dodd-Frank Act, the CFPB adopted new regulations effective for covered loan applications with action taken dates on or after January 1, 2018. The new rules expand coverage to include the majority of loan applications secured by a dwelling, including many applications for open-end loans. Additionally, the CFPB has increased the number of data points that must be collected and reported upon, to include information regarding geographical data, loan terms, underwriting practices and loan pricing.
Regulation of Other Activities
Transactions with Related Parties.
The Company's and Union's authority to extend credit, purchase or sell an asset from or to their directors, executive officers and 10% or more stockholders, as well as to entities controlled by such persons, is governed by the requirements of the Federal Reserve Act and Regulation O of the FRB thereunder. Among other things, these provisions require that extensions of credit to insiders (i) be made on terms that are substantially the same as, and follow credit underwriting procedures that are not less stringent than those prevailing for comparable transactions with unaffiliated persons and that do not involve more than the normal risk of repayment or present other unfavorable features and (ii) not exceed certain limitations on the amount of credit extended to such persons, individually and in the aggregate, which limits are based in part, on the amount of the bank's capital. Under applicable guidelines, any related party transaction, including a loan, must be reviewed by the Company's Audit Committee. In addition, under the federal SOX Act (discussed below), the Company, itself, may not extend or arrange for any personal loans to its directors and executive officers. The Company has a Related Persons Transactions Approval Policy administered by the Company's Audit Committee which incorporates applicable regulatory guidelines and requirements.
Interstate Banking.
The Riegle-Neal Interstate Banking and Branching Efficiency Act of 1994 authorized an adequately capitalized and managed bank holding company to acquire banks based outside its home state, generally without regard to whether the state's law would permit the acquisition, and also authorized banks to merge across state lines thereby creating interstate branches. In addition, this Act authorized banks to acquire existing interstate branches (short of merger) or to establish new interstate branches. States were given the right, exercisable before June 1, 1997, to prohibit altogether or impose certain limitations on interstate mergers and the acquisition or establishment of interstate branches. The Dodd-Frank Act removed remaining state law impediments to de novo interstate branching. Although interstate banking and branching may result in increased competitive pressures in the markets in which the Company operates, interstate branching may also present competitive opportunities for locally-owned and managed banks, such as Union, that are familiar with the local markets and that emphasize personal service and prompt, local decision-making. The ability to branch interstate has also benefited Union, as it permitted the expansion of its banking operations into New Hampshire, with the conversion of its loan production office in Littleton to a full service branch in March of 2006, the May 2011 acquisition of three New Hampshire branches, and the opening of a full service branch in Lincoln, New Hampshire in 2014.
Affiliate Restrictions.
Bank holding companies and their affiliates are subject to certain restrictions under the Federal Reserve Act in their dealings with each other, such as in connection with extensions of credit, transfers of assets, and purchase of services among affiliated parties. The Dodd-Frank Act further tightened these restrictions. Generally, loans or extensions of credit, issuances of guarantees or letters of credit, investments or purchases of assets by a subsidiary bank from a bank holding company or its affiliates are limited to 10% of the bank's capital and surplus (as defined by federal regulations) with respect to each affiliate and to 20% in the aggregate for all affiliates, and borrowings are also subject to certain collateral requirements. These transactions, as well as other transactions between a subsidiary bank and its holding company or other affiliates must generally be on arms-length terms, that is, on terms comparable to those involving nonaffiliated companies. Further, under the Federal Reserve Act and FRB regulations, a bank holding company and its subsidiaries are prohibited from engaging in certain tie-in-arrangements in connection with extensions of credit or lease or sale of property, furnishing of property or services to third parties. The Company and Union are subject to these restrictions in their intercompany transactions.
Bank Secrecy Act
.
Union is subject to federal laws establishing record keeping, customer identification and reporting requirements pertaining to large or suspicious cash transactions, purchases of other monetary instruments and the international transfer of cash or monetary instruments that may signify money laundering. Provisions designed to help combat international terrorism, were added to the Bank Secrecy Act by the 2001 USA Patriot Act. These provisions require banks to avoid establishing or maintaining correspondent accounts of foreign off-shore banks and banks in jurisdictions that have been found to fall significantly below international anti-money laundering standards. U.S. banks are also prohibited from opening correspondent accounts for off-shore shell banks, defined as banks that have no physical presence and that are not part of a regulated and recognized banking company.
11
The USA Patriot Act requires all financial institutions to adopt an anti-money laundering program and to establish due diligence policies, procedures and controls that are reasonably designed to detect and report instances of money laundering in United States private banking accounts and correspondent accounts maintained for non-U.S. persons or their representatives. Effective May, 11, 2018, banks will be required to comply with enhanced customer due diligence regulations requiring collection of information on beneficial owners and control persons of legal entity customers.
The due diligence requirements issued by the Department of Treasury require minimum standards to verify customer identity and maintain accurate records, encourage information sharing cooperation among financial institutions, federal banking agencies and law enforcement authorities regarding possible money laundering or terrorist activities, prohibit the anonymous use of “concentration accounts” and require all covered financial institutions to have in place an anti-money laundering compliance program. In addition, the USA Patriot Act amended certain provisions of the federal Right to Financial Privacy Act to facilitate the access of law enforcement to bank customer records in connection with investigating international terrorism.
The USA Patriot Act also amends the BHC Act and the Bank Merger Act to require the federal banking agencies to consider the effectiveness of a financial institution's anti-money laundering program when reviewing applications under these acts for mergers, acquisitions, and certain other expansion activities.
SOX Act.
This far reaching federal legislation, enacted in 2002, was generally intended to protect investors by strengthening corporate governance and improving the accuracy and reliability of corporate disclosures made pursuant to federal securities laws. The SOX Act includes provisions addressing, among other matters, the duties, functions and qualifications of audit committees for all public companies; certification of financial statements by the chief executive officer and the chief financial officer; the forfeiture of bonuses or other incentive-based compensation and profits from the sale of an issuer’s securities by directors and senior officers in the twelve month period following initial publication of any financial statements that later require restatement; disclosure of off-balance sheet transactions; a prohibition on personal loans to directors and officers, except (in the case of banking companies) loans in the normal course of business; expedited filing requirements for reports of beneficial ownership of company stock by insiders; disclosure of a code of ethics for senior officers, and of any change or waiver of such code; the formation of a public accounting oversight board; auditor independence; disclosure of fees paid to the company's auditors for non-audit services and limitations on the provision of such services; attestation requirements for company management and external auditors, relating to internal controls and procedures; and various increased criminal penalties for violations of federal securities laws.
NASDAQ.
In response to the SOX Act, the NASDAQ Exchange on which the Company's common stock is listed, implemented new corporate governance listing standards, including rules strengthening director independence requirements for boards and committees of the board, the director nomination process and shareholder communication avenues. These rules require the Company to annually certify to the NASDAQ, after each annual meeting, that the Company is in compliance and will continue to comply with the NASDAQ corporate governance requirements.
Taxing Authorities
.
The Company and Union are subject to income taxes at the Federal level and are individually subject to state taxation based on the laws of each state in which they operate. The Company and Union file a consolidated federal tax return with a calendar year end. The Company and Union have filed separate tax returns for each state jurisdiction affected for
2016
and will do the same for
2017
. No tax return is currently being examined or audited by any taxing authority that the Company is aware of. The taxing authorities also regulate the information reporting requirements that Union is subject to which continue to increase and require resources to comply with.
Available Information
The Company files annual, quarterly, and current reports, proxy statements, and other documents with the SEC under the Securities Exchange Act of 1934 (the “Exchange Act”). The public may read and copy any materials that Union Bankshares, Inc. has filed with the SEC at the SEC's Public Reference Room at 100 F Street, NE, Washington, DC 20549-0213. The public may obtain information on the operation of the Public Reference Room by calling the SEC at 1-800-SEC-0330. Also, the SEC maintains an Internet website that contains reports, proxy and information statements, and other information regarding issuers, including Union Bankshares, that file electronically with the SEC. The public can obtain any documents that the Company has filed with the SEC at
www.sec.gov.
Our Internet website address is
www.ublocal.com
. Our annual reports on Form 10-K, quarterly reports on Form 10-Q, current reports on Form 8-K, including any amendments to those reports filed or furnished pursuant to section 13(a) or 15(d), proxy statements filed pursuant to Section 14(a) and reports filed pursuant to Section 16, 13(d) and 13(g) of the Exchange Act are available free of charge through the Investor Relations page of our website as soon as reasonably practicable after they are electronically filed with, or furnished to, the SEC. The information on our website is not incorporated by reference into this report.
12
The Company will also provide copies of its
2017
Annual Report on Form 10-K, free of charge, upon written request to its Treasurer at the Company's main address, PO Box 667, Morrisville, VT 05661-0667. Shareholder meeting materials for our
2018
Annual Meeting are available at
www.materials.proxyvote.com/905400
no later than the date on which they are mailed to shareholders.
Our loans are concentrated in certain areas of Vermont and New Hampshire and adverse conditions in those markets could adversely affect our operations.
We are exposed to real estate and economic factors throughout Vermont and New Hampshire. Further, because a substantial portion of our loan portfolio is secured by real estate in Vermont and New Hampshire, the value of the associated collateral is subject to real estate market conditions in those states and in the northern New England region more generally. Adverse economic, political and business developments or natural hazards may affect these areas and the ability of property owners in these areas to make payments of principal and interest on the underlying mortgages. If these areas experience adverse economic, political or business conditions, or significant natural hazards, we would likely experience higher rates of loss and delinquency on our loan portfolio than if the portfolio were more geographically diverse.
If our allowance for loan losses is not sufficient to cover actual loan losses, our earnings could decrease.
We make various assumptions and judgments about the collectability of our loan portfolio, including the creditworthiness of our borrowers and the value of the real estate and other assets serving as collateral for the repayment of many of our loans. On a quarterly basis the allowance for loan loss is presented to Union's Board of Directors for discussion, review, and approval. We rely on our loan reviews, our experience, and our evaluation of economic conditions, among other factors, in determining the amount of the allowance for loan losses. If our assumptions prove to be incorrect, our allowance for loan losses may not be sufficient to cover the losses we could experience, resulting in additions to our allowance and a related charge to our income. In addition, bank regulators periodically review our allowance for loan losses and may require us to increase our provision for loan losses or recognize further loan charge-offs, which may have a material adverse effect on our financial condition or results of operations.
Our commercial, commercial real estate and construction loan portfolio may expose us to increased credit risks.
At
December 31, 2017
, approximately
52%
of our loan portfolio was comprised of commercial and commercial real estate loans. In general, commercial and commercial real estate loans have historically posed greater credit risks than owner occupied residential mortgage loans. The repayment of commercial real estate loans depends on the business and financial condition of borrowers. Economic events and changes in government regulations, which we and our borrowers cannot control or reliably predict, could have an adverse impact on the cash flows generated by the businesses and properties securing our commercial and commercial real estate loans and on the values of the collateral securing those loans. Repayment of commercial loans depends substantially on the borrowers’ underlying business, financial condition and cash flows. Commercial loans are generally collateralized by equipment, inventory, accounts receivable and other fixed assets. Compared to real estate, that type of collateral is more difficult to monitor, its value is harder to ascertain, it may depreciate more rapidly and it may not be as readily saleable if repossessed.
Changes in interest rates and interest rate volatility may reduce our profitability.
Our consolidated earnings and financial condition are primarily dependent upon net interest income, which is the difference between interest earned from loans and investments and interest paid on deposits and borrowings. Net interest income can be affected significantly by changes in market interest rates. In particular, changes in relative interest rates may reduce our net interest income as the difference between interest income and interest expense decreases. As a result, we have adopted asset and liability management policies to minimize the potential adverse effects of changes in interest rates on net interest income, primarily by altering the mix and maturity of loans, investments and funding sources. However, there can be no assurance that a change in interest rates will not negatively impact our results of operations or financial condition. Because market interest rates may change by differing magnitudes and at different times, significant changes in interest rates over an extended period of time could reduce overall net interest income. An increase in interest rates could also have a negative impact on our results of operations by reducing the ability of borrowers to repay their current loan obligations, which could not only result in increased loan defaults, foreclosures and write-offs, but also necessitate further increases to our allowance for loan losses. Higher interest rates could also cause depositors to shift funds from accounts that have a comparatively lower cost, to accounts with a higher cost. If the cost of interest-bearing deposits increases at a rate greater than the yields on interest-earning assets, net interest income will be negatively affected.
We are subject to liquidity risk.
Liquidity risk is the risk of potential loss if we are unable to meet our funding requirements at a reasonable cost. Our liquidity could be impaired by an inability to access the capital markets or by unforeseen outflows of cash. This situation may arise due to circumstances that we may be unable to control, such as a general market disruption or an operational problem that affects third parties or us.
13
We operate in a highly regulated environment and may be adversely affected by changes in laws, regulations and monetary policy.
We are subject to regulation and supervision by the FRB and Union Bank is subject to regulation and supervision by the FDIC and the DFR. Federal and state laws and regulations govern numerous matters affecting us, including changes in the ownership or control of banks and bank holding companies, maintenance of adequate capital and sound financial condition, permissible types, amounts and terms of loans and investments, permissible nonbanking activities, the level of reserves against deposits and restrictions on dividend payments. The FDIC and the DFR possess the power to issue cease and desist orders against banks subject to their jurisdiction to prevent or remedy unsafe or unsound banking practices or violations of law, and the FRB possesses similar powers with respect to bank holding companies. These and other restrictions limit the manner in which we may conduct business and obtain financing.
We are also affected by the monetary policies of the FRB. Changes in monetary or legislative policies may affect the interest rates we must offer to attract deposits and the interest rates we must charge on our loans, as well as the manner in which we offer deposits and make loans. These monetary policies have had, and are expected to continue to have, significant effects on the operating results of depository institutions generally, including Union Bank.
The laws, rules, regulations, and supervisory guidance and policies applicable to us are subject to regular modification and change. It is impossible to predict the competitive impact that any such changes would have on the banking and financial services industry in general or on our business in particular. Such changes may, among other things, increase the cost of doing business, limit permissible activities, or affect the competitive balance between banks and other financial institutions. The Dodd-Frank Act instituted major changes to the banking and financial institutions regulatory regimes in light of government intervention in the financial services sector. Other changes to statutes, regulations, or regulatory policies, including changes in interpretation or implementation of statutes, regulations, or policies, could affect us in substantial and unpredictable ways. Such changes could subject us to additional costs, limit the types of financial services and products we may offer, and/or increase the ability of non-banks to offer competing financial services and products, among other things. Failure to comply with laws, regulations, or policies could result in sanctions by regulatory agencies, civil money penalties, and/or reputational damage, which could have a material adverse effect on our business, financial condition, or results of operations.
Additional requirements imposed by the Dodd-Frank Act could adversely affect us.
The Dodd-Frank Act comprehensively reformed the regulation of financial institutions, products and services. Among other things, the Dodd-Frank Act established the CFPB as an independent bureau of the FRB. The CFPB has the authority to prescribe rules for all depository institutions governing the provision of consumer financial products and services, which may result in rules and regulations that reduce the profitability of such products and services or impose greater costs and restrictions on us and our subsidiaries. The Dodd-Frank Act also established new minimum mortgage underwriting standards for residential mortgages, and the regulatory agencies have focused on the examination and supervision of mortgage lending and servicing activities.
The CFPB’s qualified mortgage rule, or “QM Rule,” became effective on January 10, 2014. The QM Rule requires mortgage lenders, prior to originating most residential mortgage loans, to make a determination of a borrower’s ability to repay the loan and establishes protections from liability under this requirement for so-called “qualified mortgages” that meet certain heightened criteria. If a mortgage lender does not appropriately establish a borrower’s ability to repay the loan, the borrower may be able to assert against the originator of the loan or any subsequent transferee, as a defense to foreclosure by way of recoupment or setoff, a violation of the ability-to-repay requirement. Loans that meet the definition of “qualified mortgage” will be presumed to have complied with the ability-to-repay standard. The QM Rule and related ability-to-repay requirements and similar rules could limit Union's ability to make certain types of loans or loans to certain borrowers, or could make it more expensive and time-consuming to make these loans, which could limit the Bank’s growth or profitability.
Current and future legal and regulatory requirements, restrictions, and regulations, including those imposed under the Dodd-Frank Act, may adversely impact our profitability and may have a material and adverse effect on our business, financial condition, or results of operations; may require us to invest significant management attention and resources to evaluate and make any changes required by the legislation and related regulations; and may make it more difficult for us to attract and retain qualified executive officers and employees.
We may become subject to more stringent capital requirements.
The federal banking agencies issued a joint final rule, or the “Final Capital Rule,” that implemented the Basel III capital standards and established the minimum capital levels required under the Dodd-Frank Act which became effective as of January 1, 2015. The Final Capital Rule established a minimum common equity Tier I capital ratio of 6.5% of risk-weighted assets for a “well capitalized” institution and increased the minimum Tier I capital ratio for a “well capitalized” institution from 6.0% to 8.0%. Additionally, subject to a transition period, the Final Capital Rule requires an institution to maintain a 2.5% common equity Tier I capital conservation buffer over the 6.5% minimum risk-based capital requirement for “adequately capitalized” institutions, or
14
face restrictions on the ability to pay dividends or discretionary bonuses, and engage in share repurchases. The Final Capital Rule increased the required capital for certain categories of assets, including high-volatility construction real estate loans and certain exposures related to securitizations; however, the Final Capital Rule retained the current capital treatment of residential mortgages. Under the Final Capital Rule, we made a one-time, permanent election to continue to exclude accumulated other comprehensive income from capital. If we had not made this election, unrealized gains and losses would be included in the calculation of our regulatory capital. Further increases in capital requirements may adversely affect our ability to pay dividends, or require us to reduce business levels or raise capital, including in ways that may adversely affect our results of operations or financial condition.
We may incur fines, penalties and other negative consequences from regulatory violations, possibly even inadvertent or unintentional violations.
We maintain systems and procedures designed to ensure that we comply with applicable laws and regulations. However, some legal/regulatory frameworks provide for the imposition of fines or penalties for noncompliance even though the noncompliance was inadvertent or unintentional and even though there was in place at the time systems and procedures designed to ensure compliance. For example, we are subject to regulations issued by the Office of Foreign Assets Control, or “OFAC,” that prohibit financial institutions from participating in the transfer of property belonging to the governments of certain foreign countries and designated nationals of those countries and certain other persons or entities whose interest in property is blocked by OFAC-administered sanctions. OFAC may impose penalties for inadvertent or unintentional violations even if reasonable processes are in place to prevent the violations. There may be other negative consequences resulting from a finding of noncompliance, including restrictions on certain activities. Such a finding may also damage our reputation and could restrict the ability of institutional investment managers to invest in our securities.
We face significant legal risks, both from regulatory investigations and proceedings and from private actions brought against us.
From time to time we are named as a defendant or are otherwise involved in various legal proceedings. There is no assurance that litigation with private parties will not increase in the future. Future actions against us may result in judgments, settlements, fines, penalties or other results adverse to us, which could materially adversely affect our business, financial condition or results of operations, or cause serious reputational harm to us. As a participant in the financial services industry, we are exposed to a high level of litigation related to our businesses and operations. Although we maintain insurance, the scope of this coverage may not provide us with full, or even partial, coverage in any particular case. As a result, a judgment against us in any such litigation could have a material adverse effect on our financial condition and results of operation.
Our businesses and operations are also subject to increasing regulatory oversight and scrutiny, which could lead to regulatory investigations or enforcement actions. These and other initiatives from federal and state officials could result in judgments, settlements, fines or penalties, or cause us to be required to restructure our operations and activities, all of which could lead to reputational issues, or higher operational costs, thereby reducing our revenue.
Our financial condition and results of operations have been adversely affected, and may continue to be adversely affected, by general market and economic conditions.
We have been, and continue to be, impacted by general business and economic conditions in the United States and, to a lesser extent, abroad. These conditions include short-term and long-term interest rates, inflation, money supply, political issues, legislative and regulatory changes, fluctuations in both debt and equity capital markets, broad trends in industry and finance, unemployment and the strength of the U.S. economy and the local economies in which we operate, all of which are beyond our control. Deterioration or continued weakness in any of these conditions could result in increases in loan delinquencies and nonperforming assets, decreases in loan collateral values, the value of our investment portfolio and demand for our products and services.
Competition in the local banking industry may impair our ability to attract and retain customers at current levels.
Competition in the markets in which we operate may limit our ability to attract and retain customers. In particular, we compete for loans, deposits and other financial products and services with local independent banks, thrift institutions, savings institutions, mortgage brokerage firms, credit unions, finance companies, trust companies, mutual funds, insurance companies and brokerage and investment banking firms operating locally as well as nationally. Additionally, banks and other financial institutions with larger capitalization, as well as financial intermediaries not subject to bank regulatory restrictions, have larger lending limits and are able to serve the credit and investment needs of larger customers. There is also increased competition by out-of-market competitors through the Internet. If we are unable to attract and retain customers, we may be unable to continue our loan growth and our results of operations and financial condition may otherwise be negatively impacted.
15
Prepayments of loans may negatively impact our business
.
Generally, our customers may prepay the principal amount of their outstanding loans at any time. The speed at which such prepayments occur, as well as the size of such prepayments, are within our customers’ discretion. If customers prepay the principal amount of their loans, and we are unable to lend those funds to other borrowers or invest the funds at the same or higher interest rates, our interest income will be reduced. A significant reduction in interest income could have a negative impact on our results of operations and financial condition.
We may incur significant losses as a result of ineffective risk management processes and strategies.
We seek to monitor and control our risk exposure through a risk and control framework encompassing a variety of separate but complementary financial, credit, operational, compliance and legal reporting systems, internal controls, management review processes and other mechanisms. While we employ a broad and diversified set of risk monitoring and risk mitigation techniques, those techniques and the judgments that accompany their application may not be effective and may not anticipate every economic and financial outcome in all market environments or the specifics and timing of such outcomes. Market conditions over the last several years have involved unprecedented dislocations and highlight the limitations inherent in using historical data to manage risk.
Environmental liability associated with our lending activities could result in losses.
In the course of business, we may acquire, through foreclosure, properties securing loans we have originated or purchased that are in default. Particularly in commercial real estate lending, there is a risk that material environmental violations could be discovered at these properties. In this event, we might be required to remedy these violations at the affected properties at our sole cost and expense. The cost of remedial action could substantially exceed the value of affected properties. We may not have adequate remedies against the prior owners or other responsible parties and could find it difficult or impossible to sell the affected properties. These events could have an adverse effect on our financial condition and results of operations.
A failure in or breach of our operational systems, information systems, or infrastructure, or those of our third party vendors and other service providers, may result in financial losses, loss of customers, or damage to our reputation.
We rely heavily on communications and information systems to conduct our business. In addition, we rely on third parties to provide key components of our infrastructure, including internet connections, and network access. These types of information and related systems are critical to the operation of our business and essential to our ability to perform day-to-day operations, and, in some cases, are critical to the operations of certain of our customers. These third parties with which we do business or that facilitate our business activities, including exchanges, clearing firms, financial intermediaries or vendors that provide services or security solutions for our operations, could also be sources of operational and information security risk to us, including breakdowns or failures of their own systems or capacity constraints. Although we have safeguards and business continuity plans in place, our business operations may be adversely affected by significant and widespread disruption to our physical infrastructure or operating systems that support our business and our customers, resulting in financial losses, loss of customers, or damage to our reputation.
An interruption or breach in security of our information systems or those related to merchants and third party vendors, including as a result of cyber attacks, could disrupt our business, result in the disclosure or misuse of confidential or proprietary information, damage our reputation, or result in financial losses.
Our technologies, systems, networks and software, and those of other financial institutions have been, and are likely to continue to be, the target of cybersecurity threats and attacks, which may range from uncoordinated individual attempts to sophisticated and targeted measures directed at us. These cybersecurity threats and attacks may include, but are not limited to, attempts to access information, including customer and company information, malicious code, computer viruses and denial of service attacks that could result in unauthorized access, misuse, loss or destruction of data (including confidential customer information), account takeovers, unavailability of service or other events. These types of threats may result from human error, fraud or malice on the part of external or internal parties, or from accidental technological failure. Further, to access our products and services our customers may use computers and mobile devices that are beyond our security control systems. The risk of a security breach or disruption, particularly through cyber-attack or cyber intrusion, including by computer hackers, has increased as the number, intensity and sophistication of attempted attacks and intrusions from around the world have increased.
Our business requires the collection and retention of large volumes of customer data, including payment card numbers and other personally identifiable information in various information systems that we maintain and in those maintained by third parties with whom we contract to provide data services. We also maintain important internal company data such as personally identifiable information about our employees and information relating to our operations. The integrity and protection of that customer and company data is important to us. As customer, public, legislative and regulatory expectations and requirements regarding operational and information security have increased, our operations systems and infrastructure must continue to be safeguarded and monitored for potential failures, disruptions and breakdowns.
16
Our customers and employees have been, and will continue to be, targeted by parties using fraudulent e-mails and other communications in attempts to misappropriate passwords, payment card numbers, bank account information or other personal information or to introduce viruses to our customers’ computers. These communications may appear to be legitimate messages sent by the Bank or other businesses, but direct recipients to fake websites operated by the sender of the e-mail or request that the recipient send a password or other confidential information via e-mail or download a program. Despite our efforts to mitigate these threats through product improvements, use of encryption and authentication technology to secure online transmission of confidential consumer information, and customer and employee education, such attempted frauds against us or our merchants and our third party service providers remain a serious issue. The pervasiveness of cyber security incidents in general and the risks of cyber-crime are complex and will continue to evolve.
Although we make significant efforts to maintain the security and integrity of our information systems and have implemented various measures to manage the risk of a security breach or disruption, there can be no assurance that our security efforts and measures will be effective or that attempted security breaches or disruptions would not be successful or damaging. Even the most well-protected information, networks, systems and facilities remain potentially vulnerable because attempted security breaches, particularly cyber-attacks and intrusions, or disruptions will occur in the future, and because the techniques used in such attempts are constantly evolving and generally are not recognized until launched against a target, and in some cases are designed not to be detected and, in fact, may not be detected. Accordingly, we may be unable to anticipate these techniques or to implement adequate security barriers or other preventative measures, and thus it is virtually impossible for us to entirely mitigate this risk. A security breach or other significant disruption could: 1) disrupt the proper functioning of our networks and systems and therefore our operations and/or those of certain of our customers; 2) result in the unauthorized access to, and destruction, loss, theft, misappropriation or release of confidential, sensitive or otherwise valuable information of ours or our customers, including account numbers and other financial information; 3) result in a violation of applicable privacy, data breach and other laws, subjecting the Bank to additional regulatory scrutiny and exposing the Bank to civil litigation, governmental fines and possible financial liability; 4) require significant management attention and resources to remedy the damages that result; or 5) harm our reputation or cause a decrease in the number of customers that choose to do business with us or reduce the level of business that our customers do with us. The occurrence of any such failures, disruptions or security breaches could have a negative impact on our results of operations, financial condition, and cash flows as well as damage our brand and reputation.
Although we maintain an insurance policy covering certain cybersecurity risks which we believe provides appropriate coverage for a financial institution of our size and business and technology profile, we cannot provide any assurance that such policy would be sufficient to cover all financial losses or damages we might suffer in the event that we or one of our third party vendors experiences a system failure or suffers a system intrusion or other cyberattack.
We may be unable to attract and retain key personnel.
Our success depends, in large part, on our ability to attract and retain key personnel. Competition for qualified personnel in the financial services industry can be intense and we may not be able to hire or retain the key personnel that we depend upon for success. The unexpected loss of services of one or more of our key personnel could have a material adverse impact on our business because of the loss of their skills, knowledge of the markets in which we operate and years of industry experience, and because of the difficulty of promptly finding qualified replacement personnel.
We are subject to reputational risk.
We are dependent on our reputation within our market area, as a trusted and responsible financial company, for all aspects of our relationships with customers, employees, vendors, third-party service providers, and others, with whom we conduct business or potential future business. Our actual or perceived failure to (a) identify and address potential conflicts of interest, ethical issues, money-laundering, or privacy issues; (b) meet legal and regulatory requirements applicable to the Bank and to the Company; (c) maintain the privacy of customer and accompanying personal information; or (d) maintain adequate record keeping; and (e) identify the legal, reputational, credit, liquidity and market risks inherent in our products, could give rise to reputational risk that could harm our business prospects and adversely affect our financial condition and results of operations. If we fail to address any of these issues in an appropriate manner, we could be subject to additional legal risks, which, in turn, could increase the size and number of litigation claims and damages asserted or subject us to enforcement actions, fines and penalties and cause us to incur related costs and expenses. Our ability to attract and retain customers and employees could be adversely affected to the extent our reputation is damaged.
We may suffer losses as a result of operational risk or technical system failures.
The potential for operational risk exposure exists throughout our organization. Integral to our performance is the continued efficacy of our internal processes, systems, relationships with third parties and the associates and executives in our day-to-day and ongoing operations. Operational risk also encompasses the failure to implement strategic objectives in a successful, timely and cost-effective manner. Failure to properly manage operational risk subjects us to risks of loss that may vary in size, scale and scope, including loss of customers, operational or technical failures, unlawful tampering with our technical systems, ineffectiveness or exposure due to interruption in third party support, as well as the loss of key individuals or failure on the part of key individuals to perform
17
properly. Although we seek to mitigate operational risk through a system of internal controls, losses from operational risk could take the form of explicit charges, increased operational costs, harm to our reputation or foregone opportunities.
We rely on other companies to provide key components of our business infrastructure.
Third party vendors provide key components of our business infrastructure such as internet connections, network access and core application processing. While we have selected these third party vendors carefully, we do not control their actions. Any problems caused by these third parties, including as a result of their not providing us their services for any reason or their performing their services poorly, could adversely affect our ability to deliver products and services to our customers or otherwise conduct our business efficiently and effectively. Replacing these third party vendors could also entail significant delay and expense.
We are a holding company and depend on Union Bank for dividends, distributions and other payments.
We are legal entity that is separate and distinct from Union Bank. Our revenue (on a parent company only basis) is derived primarily from interest and dividends paid to us by Union Bank. Our right, and consequently the right of our shareholders, to participate in any distribution of the assets or earnings of any subsidiary through the payment of such dividends or otherwise is necessarily subject to the prior claims of creditors of the subsidiary (including depositors, in the case of Union Bank), except to the extent that certain claims of Union in a creditor capacity may be recognized.
Our shareholders may not receive dividends on our common stock.
Holders of our common stock are entitled to receive dividends only when, as and if declared by our board of directors. Although we have historically declared cash dividends on our common stock, we are not required to do so and our board of directors may reduce or eliminate our common stock dividend in the future. The FRB has the authority to prohibit a bank holding company, such as us, from paying dividends if it deems such payment to be an unsafe or unsound practice. The FDIC has the authority to use its enforcement powers to prohibit a bank from paying dividends to us if, in its opinion, the payment of dividends would constitute an unsafe or unsound practice. Federal law also prohibits the payment of dividends by a bank that will result in the bank failing to meet its applicable capital requirements on a pro forma basis. Further, our ability to pay dividends would be restricted if we do not maintain a capital conservation buffer. A reduction or elimination of dividends could adversely affect the market price of our common stock.
Changes in accounting standards can be difficult to predict and can materially impact how we record and report our financial condition and results of operations.
Our accounting policies and methods are fundamental to how we record and report our financial condition and results of operations. From time to time, the FASB changes the financial accounting and reporting standards that govern the preparation of our financial statements. These changes can be hard to anticipate and implement and can materially impact how we record and report our financial condition and results of operations. For example, the FASB’s current financial instruments project could, among other things, significantly change the way loan loss provisions are determined from an incurred loss model to an expected loss model.
Our financial statements are based in part on assumptions and estimates, which, if wrong, could cause unexpected losses in the future.
Pursuant to GAAP, we are required to use certain assumptions and estimates in preparing our financial statements, including in determining credit loss reserves, reserves related to litigation and the fair value of certain assets and liabilities, among other items. If assumptions or estimates underlying our financial statements are incorrect, we may experience material losses.
We may need to raise additional capital in the future and such capital may not be available when needed.
As a bank holding company, we are required by regulatory authorities to maintain adequate levels of capital to support our operations. We may need to raise additional capital in the future to provide us with sufficient capital resources and liquidity to meet our commitments and business needs. Our ability to raise additional capital, if needed, will depend on, among other things, conditions in the capital markets at that time, which are outside of our control, and our financial performance. We cannot assure you that such capital will be available to us on acceptable terms or at all. Our inability to raise sufficient additional capital on acceptable terms when needed could subject us to certain activity restrictions or to a variety of enforcement remedies available to the regulatory authorities, including limitations on our ability to pay dividends or pursue acquisitions, the issuance by regulatory authorities of a capital directive to increase capital and the termination of deposit insurance by the FDIC.
Certain provisions of our articles of incorporation may have an anti-takeover effect.
Provisions of our certificate of incorporation and bylaws and regulations and federal banking laws, including regulatory approval requirements, could make it more difficult for a third party to acquire us, even if doing so would be perceived to be beneficial to our shareholders. The combination of these provisions may inhibit a non-negotiated merger or other business combination, which, in turn, could adversely affect the market price of our common stock.
18
Market volatility may impact our business and the value of our common stock.
Our business performance and the trading price of shares of our common stock may be affected by many factors affecting financial institutions, including volatility in the credit, mortgage and housing markets, the markets for securities relating to mortgages or housing, and the value of debt and mortgage-backed and other securities that we hold in our investment portfolio. Government action and legislation may also impact us and the value of our common stock. We cannot predict what impact, if any, market volatility will have on our business or share price and for these and other reasons our shares of common stock may trade at a price lower than that at which they were purchased.
We may be required to write down goodwill and other identifiable intangible assets.
When we acquire a business, a portion of the purchase price of the acquisition may be allocated to goodwill and other identifiable intangible assets. The excess of the purchase price over the fair value of the net identifiable tangible and intangible assets acquired determines the amount of the purchase price that is allocated to goodwill acquired. At
December 31, 2017
, our goodwill and other identifiable intangible assets were approximately
$2.8 million
. Under current accounting standards, if we determine goodwill or intangible assets are impaired, we would be required to write down the value of these assets to fair value. We conduct an annual review, or more frequently if events or circumstances warrant such, to determine whether goodwill is impaired. We recently completed our goodwill impairment analysis as of
December 31, 2017
and concluded goodwill was not impaired. We conduct a review of our other intangible assets for impairment should events or circumstances warrant such. We cannot provide assurance that we will not be required to take an impairment charge in the future. Any impairment charge would have a negative effect on our shareholders’ equity and financial results and may cause a decline in our stock price.
None
As of
December 31, 2017
, Union operated 12 community banking locations in Lamoille, Caledonia and Franklin counties of Vermont, five in Grafton and Coos counties of New Hampshire and loan centers in Barre, Newport, and South Burlington, Vermont. In addition as of such date, Union also operated several ATMs in northern Vermont and New Hampshire. Union owns, free of encumbrances, fifteen of its branch locations and its headquarters and leases two branch locations, all loan center locations and certain ATM premises from third parties under terms and conditions considered by management to be favorable to Union. Union also owns or leases certain properties contiguous to its branch locations for staff and customer parking convenience.
In addition to the bank premises described above, Union owned a building in Jeffersonville, Vermont previously utilized as a branch location which was sold on January 11, 2018.
Additional information relating to the Company's properties as of
December 31, 2017
, is set forth in Note 8 to the consolidated financial statements contained in Part II, Item 8 of this report.
There are no known pending legal proceedings to which the Company or its subsidiary is a party, or to which any of their properties is subject, other than ordinary litigation arising in the normal course of business activities. Although the amount of any ultimate liability with respect to such proceedings cannot be determined, in the opinion of management, any such liability will not have a material effect on the consolidated financial position or results of operations of the Company and its subsidiary.
Not applicable.
19
Common Stock and Dividends
The common stock of the Company is traded on the NASDAQ Global Select Market under the trading symbol "UNB". Quarterly stock prices and cash dividends per share paid for each quarterly period during the last two years were as follows:
|
2017
|
2016
|
||||||
|
High
|
Low
|
Dividends
|
High
|
Low
|
Dividends
|
||
|
First Quarter
|
$45.55
|
$40.25
|
$0.29
|
$29.10
|
$27.06
|
$0.27
|
|
|
Second Quarter
|
$48.70
|
$39.75
|
$0.29
|
$37.18
|
$28.26
|
$0.28
|
|
|
Third Quarter
|
$49.95
|
$41.00
|
$0.29
|
$36.92
|
$33.69
|
$0.28
|
|
|
Fourth Quarter
|
$55.00
|
$45.70
|
$0.29
|
$48.80
|
$32.75
|
$0.28
|
|
High and low stock prices are based upon closing price quotations as reported by NASDAQ. Prices of transactions between private parties may vary from the ranges quoted above.
On March 12, 2018, there were 4,465,647 shares of common stock outstanding held by 527 stockholders of record. The number of stockholders does not reflect the number of beneficial owners, including persons or entities who may hold the stock in nominee or “street name.” On
January 17, 2018
, Union Bankshares, Inc. declared a
$0.30
per share regular quarterly cash dividend payable
February 8, 2018
to stockholders of record on
January 27, 2018
, which represents a $0.01 increase over the quarterly cash dividend paid in
2017
. Although the Company currently pays quarterly cash dividends, future dividends will depend upon the financial condition and earnings of the Company and its subsidiary, its need for funds and other factors, including government regulations.
The Company normally pays regular quarterly cash dividends in February, May, August and November of each year. The Company has occasionally declared a special cash or stock dividend. The Company's Board will continue to manage dividends to be in line with long-term trends in earnings per share results and conservative earnings projections, while retaining sufficient profits to support capital strength, anticipated business growth, fund strategic investments and provide continued support for the Company's deposit taking and lending activities. Dividends paid by Union are the primary source of funds available to the Company for payment of dividends to its shareholders. Union is subject to certain requirements imposed by state and federal banking laws and regulations. These requirements, among other things, establish minimum levels of capital and restrict the amount of dividends that may be distributed by Union to the Company. Future dividends are subject to the discretion of the Company's Board, cash needs, general business conditions, dividends from Union, and applicable governmental regulations and policies.
Repurchase of Common Stock
The following table summarizes repurchases of the Company's equity securities during the quarter ended
December 31, 2017
:
|
Issuer Purchases of Equity Securities
|
||||||||
|
Period
|
Total Number of Shares Purchased
|
Average Price Paid per Share
|
Total Number of Shares Purchased as Part of Publicly Announced Plans or Programs (1)
|
Maximum Number of Shares that May Yet be Purchased Under the Plans or Program (1)
|
||||
|
October 2017
|
390
|
|
$43.97
|
390
|
|
2,110
|
|
|
|
November 2017
|
—
|
|
—
|
|
—
|
|
2,110
|
|
|
December 2017
|
—
|
|
—
|
|
—
|
|
—
|
|
__________________
|
(1)
|
All repurchases shown in the table were made pursuant to a discretionary stock repurchase program under which the Company may repurchase up to 2,500 shares of its common stock each calendar quarter, in open market or privately negotiated transactions. The repurchase authorization for a calendar quarter expires at the end of that quarter to the extent it has not been exercised, and is not carried forward into future quarters. The program was initially authorized in 2010 and was reauthorized most recently in January 2018. The program will expire on December 31, 2018, unless reauthorized.
|
20
Securities Authorized for Issuance Under Equity Compensation Plans
Information regarding equity securities authorized for issuance under the Company's equity compensation plans is included in Part III, Item 12 of this report under the caption “Security Ownership of Certain Beneficial Owners and Management and Related Stockholder Matters”, and is incorporated herein by reference.
Five Year Performance Graph:
The following graph illustrates the annual percentage change in the cumulative total shareholder return of the Company's common stock for the period December 31, 2012 through
December 31, 2017
. For purposes of comparison, the graph illustrates comparable shareholder returns of the SNL Bank $500M-$1B Index and the NASDAQ Composite Index. The graph assumes a $100 investment on December 31, 2012 in each case and measures the amount by which the market value, assuming reinvestment of dividends, has changed during the five year period ended
December 31, 2017
.
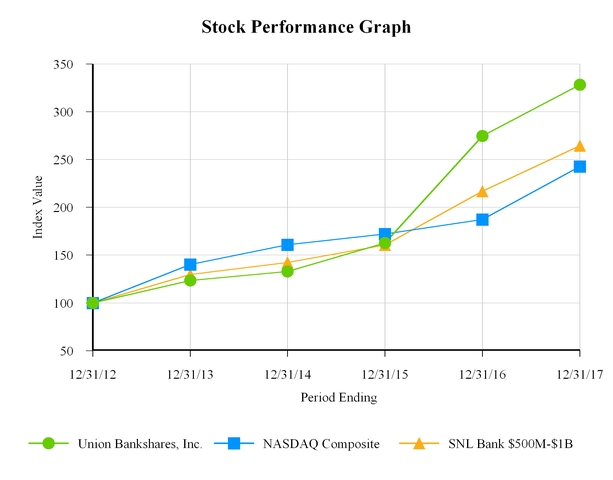
|
Period Ended
|
||||||||||||
|
Index
|
12/31/2012
|
|
12/31/2013
|
|
12/31/2014
|
|
12/31/2015
|
|
12/31/2016
|
|
12/31/2017
|
|
|
Union Bankshares, Inc.
|
100.00
|
|
123.38
|
|
132.90
|
|
162.63
|
|
274.56
|
|
328.32
|
|
|
NASDAQ Composite
|
100.00
|
|
140.12
|
|
160.78
|
|
171.97
|
|
187.22
|
|
242.71
|
|
|
SNL Bank $500M-$1B
|
100.00
|
|
129.67
|
|
142.26
|
|
160.57
|
|
216.81
|
|
264.51
|
|
The performance graph and related information furnished under Part II, Item 5 of this Annual Report on Form 10-K shall not be deemed to be “soliciting material” or “filed” with the SEC, nor subject to Exchange Act Regulations 14A or 14C, other than as provided in Item 201 of Regulation S-K, or to the liabilities of Section 18 of the Exchange Act. Such information shall not be deemed to be incorporated by reference into any filing under the Securities Act or Exchange Act except to the extent that the Company specifically incorporates it by reference into such filing.
21
The selected financial data presented in the table below depicts several measurements of performance or financial condition over a period of time. The following information should be read in conjunction with the consolidated financial statements and related notes and with other financial data in the Company's Annual Report on Form 10-K for the year ended
December 31, 2017
.
|
At or For The Years Ended December 31,
|
|||||||||||||||
|
|
2017
|
2016
|
2015
|
2014
|
2013
|
||||||||||
|
Financial Condition Data:
|
(Dollars in thousands, except per share data)
|
||||||||||||||
|
Investment securities
|
$
|
66,439
|
|
$
|
66,555
|
|
$
|
59,327
|
|
$
|
52,964
|
|
$
|
45,492
|
|
|
Loans and loans held for sale
|
594,562
|
|
541,093
|
|
506,141
|
|
490,721
|
|
464,953
|
|
|||||
|
Allowance for loan losses
|
5,408
|
|
5,247
|
|
5,201
|
|
4,694
|
|
4,647
|
|
|||||
|
Total assets
|
745,831
|
|
691,381
|
|
628,879
|
|
624,063
|
|
585,443
|
|
|||||
|
Deposits
|
647,574
|
|
597,660
|
|
560,408
|
|
552,064
|
|
518,354
|
|
|||||
|
Borrowed funds
|
31,581
|
|
31,595
|
|
9,564
|
|
15,118
|
|
13,216
|
|
|||||
|
Stockholders' equity
|
58,661
|
|
56,279
|
|
53,568
|
|
51,434
|
|
49,820
|
|
|||||
|
Operating Data:
|
|||||||||||||||
|
Interest and dividend income
|
$
|
29,017
|
|
$
|
26,836
|
|
$
|
25,144
|
|
$
|
24,852
|
|
$
|
24,481
|
|
|
Interest expense
|
2,255
|
|
2,061
|
|
2,025
|
|
2,155
|
|
2,459
|
|
|||||
|
Net interest income
|
26,762
|
|
24,775
|
|
23,119
|
|
22,697
|
|
22,022
|
|
|||||
|
Provision for loan losses
|
200
|
|
150
|
|
550
|
|
345
|
|
305
|
|
|||||
|
Net interest income after provision for loan losses
|
26,562
|
|
24,625
|
|
22,569
|
|
22,352
|
|
21,717
|
|
|||||
|
Noninterest income
|
9,395
|
|
10,140
|
|
9,792
|
|
8,909
|
|
8,509
|
|
|||||
|
Noninterest expenses
|
23,905
|
|
23,656
|
|
21,820
|
|
20,794
|
|
20,539
|
|
|||||
|
Income before provision for income taxes
|
12,052
|
|
11,109
|
|
10,541
|
|
10,467
|
|
9,687
|
|
|||||
|
Provision for income taxes
|
3,603
|
|
2,598
|
|
2,663
|
|
2,773
|
|
2,552
|
|
|||||
|
Net income
|
$
|
8,449
|
|
$
|
8,511
|
|
$
|
7,878
|
|
$
|
7,694
|
|
$
|
7,135
|
|
|
Ratios:
|
|||||||||||||||
|
Return on average assets
|
1.21
|
%
|
1.30
|
%
|
1.27
|
%
|
1.30
|
%
|
1.25
|
%
|
|||||
|
Return on average equity
|
14.53
|
%
|
15.25
|
%
|
14.80
|
%
|
14.88
|
%
|
15.46
|
%
|
|||||
|
Net interest margin (1)
|
4.22
|
%
|
4.17
|
%
|
4.10
|
%
|
4.17
|
%
|
4.21
|
%
|
|||||
|
Efficiency ratio (2)
|
64.52
|
%
|
67.97
|
%
|
66.25
|
%
|
67.40
|
%
|
68.04
|
%
|
|||||
|
Net interest spread (3)
|
4.13
|
%
|
4.09
|
%
|
4.02
|
%
|
4.08
|
%
|
4.10
|
%
|
|||||
|
Total loans to deposits ratio
|
91.81
|
%
|
90.54
|
%
|
90.32
|
%
|
88.89
|
%
|
89.70
|
%
|
|||||
|
Net loan charge-offs to average loans not held for sale
|
0.01
|
%
|
0.02
|
%
|
0.01
|
%
|
0.06
|
%
|
0.07
|
%
|
|||||
|
Allowance for loan losses to loans not held for sale (4)
|
0.92
|
%
|
0.98
|
%
|
1.04
|
%
|
0.98
|
%
|
1.01
|
%
|
|||||
|
Nonperforming assets to total assets (5)
|
0.23
|
%
|
0.63
|
%
|
0.53
|
%
|
0.78
|
%
|
0.39
|
%
|
|||||
|
Equity to assets
|
7.87
|
%
|
8.14
|
%
|
8.52
|
%
|
8.24
|
%
|
8.51
|
%
|
|||||
|
Total capital to risk weighted assets (6)
|
13.66
|
%
|
13.32
|
%
|
13.42
|
%
|
13.60
|
%
|
13.28
|
%
|
|||||
|
Per common share data:
|
|||||||||||||||
|
Book value per common share
|
$
|
13.14
|
|
$
|
12.61
|
|
$
|
12.02
|
|
$
|
11.54
|
|
$
|
11.17
|
|
|
Earnings per common share
|
$
|
1.89
|
|
$
|
1.91
|
|
$
|
1.77
|
|
$
|
1.73
|
|
$
|
1.60
|
|
|
Dividends paid per common share
|
$
|
1.16
|
|
$
|
1.11
|
|
$
|
1.08
|
|
$
|
1.04
|
|
$
|
1.01
|
|
|
Dividend payout ratio (7)
|
61.38
|
%
|
58.12
|
%
|
61.02
|
%
|
60.12
|
%
|
63.13
|
%
|
|||||
____________________
|
(1)
|
The ratio of tax equivalent net interest income to average earning assets. See page 27 for more information.
|
|
(2)
|
The ratio of noninterest expense to tax equivalent net interest income and noninterest income, excluding securities gains (losses).
|
|
(3)
|
The difference between the average rate earned on earning assets and the average rate paid on interest bearing liabilities. See page 27 for more information.
|
22
|
(4)
|
Calculation includes the net carrying amount of acquired loans recorded at fair value from the 2011 Branch Acquisition as of
December 31, 2014
(
$9.1 million
) and
December 31, 2013
(
$17.0 million
). Excluding such loans, the ALL to loans not purchased and not held for sale was
1.00%
at
December 31, 2014
and
1.05%
at
December 31, 2013
. The acquired loan portfolios were transferred to the Company's existing loan portfolios during the fourth quarter of 2015.
|
|
(5)
|
Nonperforming assets are loans or investment securities that are in nonaccrual or 90 or more days past due as well as OREO or OAO.
|
|
(6)
|
The
December 31, 2017
,
December 31, 2016
and
December 31, 2015
ratios are calculated under the Basel III capital rules that became effective for the Company and Union on January 1, 2015.
|
|
(7)
|
Cash dividends declared and paid per common share divided by consolidated net income per share.
|
GENERAL
The following discussion and analysis by management focuses on those factors that, in management's view, had a material effect on the consolidated financial position of Union Bankshares, Inc. ("the Company," "our," "we," "us") and its subsidiary, Union Bank ("Union"), as of
December 31, 2017
and
2016
, and its results of operations
for the years ended December 31, 2017, 2016 and 2015
. This discussion is being presented to provide a narrative explanation of the consolidated financial statements and should be read in conjunction with the consolidated financial statements and related notes and with other financial data in the Company's Annual Report on Form 10-K for the year ended
December 31, 2017
. The purpose of this presentation is to enhance overall financial disclosures and to provide information about historical financial performance and developing trends as a means to assess to what extent past performance can be used to evaluate the prospects for future performance. Management is not aware of the occurrence of any events after
December 31, 2017
which would materially affect the information presented.
CERTAIN DEFINITIONS
Capitalized terms used in the following discussion and not otherwise defined below have the meanings assigned to them in Note 1 to the Company's audited consolidated financial statements contained in Part II, item 8, page 53 of this Annual Report.
NON-GAAP FINANCIAL MEASURES
Under SEC Regulation G, public companies making disclosures containing financial measures that are not in accordance with GAAP must also disclose, along with each non-GAAP financial measure, certain additional information, including a reconciliation
of the non-GAAP financial measure to the closest comparable GAAP financial measure, as well as a statement of the company’s
reasons for utilizing the non-GAAP financial measure. The SEC has exempted from the definition of non-GAAP financial measures
certain commonly used financial measures that are not based on GAAP. However, two non-GAAP financial measures commonly
used by financial institutions, namely tax-equivalent net interest income and tax-equivalent net interest margin (as presented in the tables in the section labeled Yields Earned and Rates Paid), have not been specifically exempted by the SEC, and may therefore
constitute non-GAAP financial measures under Regulation G. We are unable to state with certainty whether the SEC would regard
those measures as subject to Regulation G. Management believes that these non-GAAP financial measures are useful in evaluating
the Company’s financial performance and facilitate comparisons with the performance of other financial institutions. However, that information should be considered supplemental in nature and not as a substitute for related financial information prepared in
accordance with GAAP.
CRITICAL ACCOUNTING POLICIES
The Company has established various accounting policies which govern the application of GAAP i
n the preparation of the Company's financial statements. Certain accounting policies involve significant judgments and assumptions by management which have a material impact on the reported amount of assets, liabilities, capital, revenues and expenses and related disclosures of contingent assets and liabilities in the consolidated financial statements and accompanying notes. The SEC has defined a company's critical accounting policies as the ones that are most important to the portrayal of the company's financial condition and results of operations, and which require management to make its most difficult and subjective judgments, often as a result of the need to make estimates on matters that are inherently uncertain. Based on this definition, management has identified the accounting policies and judgments most critical to the Company. The judgments and assumptions used by management are based on historical experience and other factors, which are believed to be reasonable under the circumstances. Nevertheless, because the nature of the judgments and assumptions made by management are inherently subject to a degree of uncertainty, actual results could differ from estimates and have a material impact on the carrying value of assets, liabilities, capital, or the results of operations of the Company.
23
Allowance for loan losses
The Company believes the ALL is a critical accounting policy that requires the most significant judgments and estimates used in the preparation of its consolidated financial statements. The amount of the ALL is based on management's periodic evaluation of the collectability of the loan portfolio, including the nature, volume and risk characteristics of the portfolio, credit concentrations, trends in historical loss experience, estimated value of any underlying collateral, specific impaired loans and economic conditions. Changes in these qualitative factors may cause management's estimate of the ALL to increase or decrease and result in adjustments to the Company's provision for loan losses in future periods. For additional information, see FINANCIAL CONDITION- Allowance for Loan Losses and Credit Quality below.
Other than temporary impairment of securities
The OTTI decision is a critical accounting policy for the Company. Accounting guidance requires a company to perform periodic reviews of individual securities in its investment portfolio to determine whether a decline in the value of a security is OTT. A review of OTTI requires management to make certain judgments regarding the cause and materiality of the decline, its effect on the financial statements and the probability, extent and timing of a valuation recovery, the Company's intent and ability to continue to hold the security, and, with respect to debt securities, the likelihood that the Company will have to sell the security before its value recovers. Pursuant to these requirements, management assesses valuation declines to determine the extent to which such changes are attributable to (1) fundamental factors specific to the issuer, such as the nature of the issuer and its financial condition, business prospects or other factors or (2) market-related factors, such as interest rates or equity market declines. Declines in the fair value of securities below their costs that are deemed by management to be OTT are (1) if equity securities, recorded in earnings as realized losses and (2) if debt securities, recorded in earnings as realized losses to the extent they are deemed credit losses, with noncredit losses recorded in OCI (loss). Once an OTT loss on a debt or equity security is realized, subsequent gains in the value of the security may not be recognized in income until the security is sold.
Intangible assets
The Company's intangible assets include goodwill, which represents the excess of the purchase price over the fair value of net assets acquired in the 2011 Branch Acquisition, as well as a core deposit intangible related to the deposits acquired. The core deposit intangible is amortized on a straight line basis over the estimated average life of the acquired core deposit base of 10 years. The Company evaluates the valuation and amortization of the core deposit intangible if events occur that could result in possible impairment. With respect to goodwill, in accordance with current authoritative guidance, the Company assesses qualitative factors to determine whether the existence of events or circumstances leads to a determination that it is more likely than not that the fair value of the Company is less than its carrying amount, which could result in goodwill impairment.
Pension liabilities
The Union Bank Pension Plan ("Plan") was closed to new participants on October 5, 2012. The accrual of retirement benefits for current participants was frozen as of that date. The benefit of the Plan, based on actuarial computations of current benefits for plan participants, is credited to Pension and other employee benefits.
The Company's defined benefit pension obligation and net periodic benefit costs are actuarially determined based on the following assumptions: discount rate, current and expected future return on plan assets, anticipated mortality rates, and Consumer Price Index rate. The determination of the defined benefit pension obligation and net periodic benefit cost is a critical accounting estimate as it requires the use of estimates and judgments related to the amount and timing of expected future cash outflows for benefit payments and cash inflows for maturities and returns on plan assets as well as Company contributions. Changes in estimates, assumptions and actual results could have a material impact on the Company's financial condition and/or results of operations.
On October 18, 2017, the Company's Board of Directors voted to terminate Union Bank’s Defined Benefit Pension Plan. In order to settle the liabilities under the Plan, the Company will offer participants the option to receive an annuity purchased from an insurance carrier, a lump-sum cash payment, or a direct rollover into a qualifying retirement plan. The amount of the final contribution required to settle all Plan liabilities is subject to a number of factors, including changes in interest rates and the exact proportion of the participants electing a lump-sum distribution versus an annuity. The Company anticipates completing the transfer of all liabilities and administrative responsibilities under the Plan by December 31, 2018. Once the process is complete, the Company will no longer have any remaining pension obligations and thus no periodic pension expense.
Other
The Company also has other key accounting policies, which involve the use of estimates, judgments and assumptions, that are significant to understanding the Company's financial condition and results of operations, including the valuation of deferred tax assets, investment securities and OREO. The most significant accounting policies followed by the Company are presented in Note 1 to the consolidated financial statements and in the section below under the caption “FINANCIAL CONDITION” and the subcaptions “Allowance for Loan Losses and Credit Quality”, ”Investment Activities” and “Liability for Pension Benefits”.
24
Although management believes that its estimates, assumptions and judgments are reasonable, they are based upon information presently available and can be impacted by events outside the control of the Company. Actual results may differ significantly from these estimates under different assumptions, judgments or conditions.
OVERVIEW
On December 22, 2017, the Tax Act was signed into law which reduced the Company's federal income tax rate from 34% to 21% effective January 1, 2018. During the fourth quarter of 2017, the Company's income tax provision increased by $447 thousand as a result of the federal income tax rate change, for the revaluation of the Company's deferred tax assets to reflect the 21% tax rate in effect for future periods.
After the initial revaluation of the deferred tax asset at December 31, 2017, the rate reduction is expected to have a positive impact on future earnings.
On October 18, 2017, the Company's Board of Directors voted to terminate Union Bank’s Defined Benefit Pension Plan. The Company anticipates completing the transfer of all liabilities and administrative responsibilities under the Plan by
December 31, 2018
. Once the process is complete, the Company will no longer have any remaining defined benefit pension plan obligations and thus no periodic pension expense.
The Company's net income was
$8.4 million
for
2017
compared to
$8.5 million
for
2016
, a decrease of
$62 thousand
, or
0.7%
. These results reflected the effect of an increase in net interest income of
$2.0 million
or
8.0%
, offset by a decrease in noninterest income of
$745 thousand
, or
7.3%
, an increase in the provision for loan losses of
$50 thousand
, or
33.3%
, an increase in noninterest expenses of
$249 thousand
, or
1.1%
, and an increase in the provision for income taxes of
$1.0 million
, or
38.7%
. The increase in the provision for income taxes includes the one-time adjustment of $447 thousand for the revaluation of the Company's deferred tax assets as mentioned above.
As of
December 31, 2017
, the Company had total consolidated assets of
$745.8 million
, an increase of
7.9%
compared to
December 31, 2016
. The growth year over year is attributable to strong loan demand, funded primarily with customer deposits and low rate funding options from the FHLB.
Net loans and loans held for sale increased
$53.5 million
or
10.0%
, to
$589.9 million
, or
79.1%
of total assets, at
December 31, 2017
, compared to
$536.5 million
, or
77.6%
of total assets, at
December 31, 2016
. The Company experienced growth in all loan classes except consumer loans which remained flat year over year.
The Company's primary source of funding, customer deposits, increased
$49.9 million
, or
8.4%
, to reach
$647.6 million
at
December 31, 2017
. During
2017
, management successfully focused on growing deposits by expanding its products and services to meet the needs of customers.
The Company's total capital
increased
from
$56.3 million
at
December 31, 2016
to
$58.7 million
at
December 31, 2017
. This increase primarily reflects net income of
$8.4 million
for
2017
, less regular cash dividends paid of
$5.2 million
. (See
Capital Resources
on page 43.)
Management had expected a single 25 bp increase in interest rates in July 2017; however, the Federal Reserve initiated three 25 bp increases during 2017, in March, June and December. Based on results of the Company's recent asset liability management reports, the Company is considered asset sensitive and is positioned to benefit in
2018
from potential future increases in interest rates.
RESULTS OF OPERATIONS
For the year ended December 31
,
2017
, we reported net income of
$8.4 million
compared to
$8.5 million
for the year ended December 31
,
2016
and
$7.9 million
for the year ended December 31
,
2015
. The primary components of these results, which include net interest income, provision for loan losses, noninterest income, noninterest expenses, and provision for income taxes, are discussed below:
Net Interest Income
.
The largest component of the Company’s operating income is net interest income, which is the difference between interest and dividend income received from interest earning assets and the interest paid on interest bearing liabilities. Net interest income is affected by various factors, including but not limited to: changes in interest rates, loan and deposit pricing strategies, the volume and mix of interest earning assets and interest bearing liabilities, and the level of nonperforming assets. The net interest margin is calculated as net interest income on a fully tax equivalent basis as a percentage of average interest earning assets. The net interest margin
for the years ended December 31, 2017, 2016 and 2015
was
4.22%
,
4.17%
, and
4.10%
, respectively.
2017 compared with 2016.
Net interest income was
$26.8 million
on a fully tax equivalent basis for
2017
, compared to
$24.8 million
for
2016
, an increase of
$2.0 million
, or
8.0%
. The increase in net interest income is reflective of growth in average earning assets of
$43.2 million
, or
7.1%
during
2017
coupled with a
5
bp increase in the average yield on average earning assets, partially offset by an increase of
$32.3 million
, or
6.6%
in average interest bearing liabilities. The net interest margin increased
5
bp to
25
4.22%
in
2017
compared to
4.17%
in
2016
. The increase in average interest earning assets was primarily driven by growth in average loans of
$38.6 million
, or
7.4%
, compared to
2016
and to a lesser extent the increases in short term interest rates initiated by the Federal Reserve during
2017
.
The average cost of funding, which is tied primarily to our customer deposits, increased
1
bp to
0.43%
for the
year ended December 31, 2017
, compared to
0.42%
for the year ended
December 31, 2016
. During
2017
, Union's municipal and commercial customers continued to utilize the fully FDIC insured money market account through Promontory, the Insured Cash Sweep account, contributing to the
$29.3 million
, or
14.35%
, increase in average balances in savings and money market accounts and a
$23.2 million
, or
18.40%
decrease in time deposits. Additionally, the average rate paid on savings and money market accounts increased
11
bps to
0.37%
for the
year ended December 31, 2017
, compared to
0.26%
for
the year ended December 31, 2016
. Conversely, the average rate paid on time deposits decreased
8
bps to
0.69%
for the
year ended December 31, 2017
, compared to
0.77%
for
the year ended December 31, 2016
. Average balances in borrowed funds increased
$7.6 million
, or
27.43%
, for the
year ended December 31, 2017
.
The additional borrowed funds were utilized to supplement Union's liquidity and to take advantage of lower rate borrowings, resulting in a decrease in the average rate paid by
21
bps, to
1.36%
for the
year ended December 31, 2017
, compared to
1.57%
for
the year ended December 31, 2016
. See the following tables for details.
2016 compared with 2015.
Net interest income was $24.8 million on a fully tax equivalent basis for 2016, compared to $23.1 million for 2015, an increase of $1.7 million, or 7.2%. The increase in net interest income is reflective of a 5.0% growth in average earning assets during 2016, coupled with a 6 bps increase in the average yield on average earning assets, which was partially offset by a 4.2% increase in average interest bearing liabilities. The net interest margin increased 7 bps to 4.17% in 2016 compared to 4.10% in 2015. The increase in average interest earning assets in 2016 was primarily driven by growth in average loans of $22.8 million, or 4.6%, compared to 2015 and to a lesser extent the increases in interest rates mentioned above.
The average cost of funding, which is tied primarily to our customer deposits, decreased 1 bp to 0.42% for the year ended December 31, 2016, compared to 0.43% for the year ended December 31, 2015. During 2016, Union began offering a fully FDIC insured money market account through Promontory, the Insured Cash Sweep account, to its municipal and commercial customers. Several municipal customers began utilizing this new deposit product and as monies in time deposits matured they were transferred to ICS money market accounts. As a result, an increase in the average balance and average rate paid on savings and money market accounts occurred for the year ended December 31, 2016, with corresponding decreases in time deposits. See the following tables for details.
26
The following table shows for the periods indicated the total amount of income recorded from average interest earning assets, the related average tax equivalent yields, the interest expense associated with average interest bearing liabilities, the related average rates paid, and the resulting tax equivalent net interest spread and margin:
|
Years Ended December 31,
|
||||||||||||||||||||||||
|
2017
|
2016
|
2015
|
||||||||||||||||||||||
|
Average
Balance
|
Interest
Earned/
Paid
|
Average
Yield/
Rate
|
Average
Balance
|
Interest
Earned/
Paid
|
Average
Yield/
Rate
|
Average
Balance
|
Interest
Earned/
Paid
|
Average
Yield/
Rate
|
||||||||||||||||
|
(Dollars in thousands)
|
||||||||||||||||||||||||
|
Average Assets:
|
||||||||||||||||||||||||
|
Federal funds sold and overnight deposits
|
$
|
17,700
|
|
$
|
114
|
|
0.64
|
%
|
$
|
16,953
|
|
$
|
51
|
|
0.30
|
%
|
$
|
11,530
|
|
$
|
15
|
|
0.13
|
%
|
|
Interest bearing deposits in banks
|
8,642
|
|
147
|
|
1.70
|
%
|
10,816
|
|
160
|
|
1.48
|
%
|
12,749
|
|
169
|
|
1.32
|
%
|
||||||
|
Investment securities (1), (2)
|
66,925
|
|
1,678
|
|
2.96
|
%
|
61,111
|
|
1,496
|
|
2.88
|
%
|
58,284
|
|
1,379
|
|
2.70
|
%
|
||||||
|
Loans, net (1), (3)
|
560,059
|
|
26,978
|
|
4.92
|
%
|
521,435
|
|
25,056
|
|
4.91
|
%
|
498,644
|
|
23,531
|
|
4.84
|
%
|
||||||
|
Nonmarketable equity securities
|
2,423
|
|
100
|
|
4.12
|
%
|
2,215
|
|
73
|
|
3.30
|
%
|
2,014
|
|
50
|
|
2.51
|
%
|
||||||
|
Total interest earning assets (1)
|
655,749
|
|
29,017
|
|
4.56
|
%
|
612,530
|
|
26,836
|
|
4.51
|
%
|
583,221
|
|
25,144
|
|
4.45
|
%
|
||||||
|
Cash and due from banks
|
4,217
|
|
4,565
|
|
4,600
|
|
||||||||||||||||||
|
Premises and equipment
|
13,286
|
|
13,189
|
|
12,657
|
|
||||||||||||||||||
|
Other assets
|
22,477
|
|
22,795
|
|
20,961
|
|
||||||||||||||||||
|
Total assets
|
$
|
695,729
|
|
$
|
653,079
|
|
$
|
621,439
|
|
|||||||||||||||
|
Average Liabilities and Stockholders' Equity:
|
||||||||||||||||||||||||
|
Interest bearing checking accounts
|
$
|
147,677
|
|
$
|
205
|
|
0.14
|
%
|
$
|
128,977
|
|
$
|
120
|
|
0.09
|
%
|
$
|
118,344
|
|
$
|
94
|
|
0.08
|
%
|
|
Savings/money market accounts
|
233,345
|
|
856
|
|
0.37
|
%
|
204,056
|
|
524
|
|
0.26
|
%
|
187,679
|
|
324
|
|
0.17
|
%
|
||||||
|
Time deposits
|
103,019
|
|
710
|
|
0.69
|
%
|
126,248
|
|
978
|
|
0.77
|
%
|
141,581
|
|
1,264
|
|
0.89
|
%
|
||||||
|
Borrowed funds
|
35,190
|
|
484
|
|
1.36
|
%
|
27,616
|
|
439
|
|
1.57
|
%
|
19,830
|
|
343
|
|
1.71
|
%
|
||||||
|
Total interest bearing liabilities
|
519,231
|
|
2,255
|
|
0.43
|
%
|
486,897
|
|
2,061
|
|
0.42
|
%
|
467,434
|
|
2,025
|
|
0.43
|
%
|
||||||
|
Noninterest bearing deposits
|
112,914
|
|
105,596
|
|
96,994
|
|
||||||||||||||||||
|
Other liabilities
|
5,446
|
|
4,761
|
|
3,765
|
|
||||||||||||||||||
|
Total liabilities
|
637,591
|
|
597,254
|
|
568,193
|
|
||||||||||||||||||
|
Stockholders' equity
|
58,138
|
|
55,825
|
|
53,246
|
|
||||||||||||||||||
|
Total liabilities and stockholders’ equity
|
$
|
695,729
|
|
$
|
653,079
|
|
$
|
621,439
|
|
|||||||||||||||
|
Net interest income
|
$
|
26,762
|
|
$
|
24,775
|
|
$
|
23,119
|
|
|||||||||||||||
|
Net interest spread (1)
|
4.13
|
%
|
4.09
|
%
|
4.02
|
%
|
||||||||||||||||||
|
Net interest margin (1)
|
4.22
|
%
|
4.17
|
%
|
4.10
|
%
|
||||||||||||||||||
____________________
|
(1)
|
Average yields reported on a tax equivalent basis using a marginal tax rate of 34%.
|
|
(2)
|
Average balances of investment securities are calculated on the amortized cost basis and include nonaccrual securities, if applicable.
|
|
(3)
|
Includes loans held for sale as well as nonaccrual loans, unamortized costs and premiums and is net of the ALL.
|
27
Tax exempt interest income amounted to
$1.9 million
for the year ended
December 31, 2017
and
$1.8 million
for each of the years ended
December 31, 2016
and
2015
. The following table presents the effect of tax exempt income on the calculation of net interest income, using a marginal tax rate of 34% for all years:
|
|
Years Ended December 31,
|
||||||||
|
|
2017
|
2016
|
2015
|
||||||
|
|
(Dollars in thousands)
|
||||||||
|
Net interest income as presented
|
$
|
26,762
|
|
$
|
24,775
|
|
$
|
23,119
|
|
|
Effect of tax-exempt interest
|
|||||||||
|
Investment securities
|
306
|
|
265
|
|
196
|
|
|||
|
Loans
|
605
|
|
524
|
|
615
|
|
|||
|
Net interest income, tax equivalent
|
$
|
27,673
|
|
$
|
25,564
|
|
$
|
23,930
|
|
Rate/Volume Analysis.
The following table describes the extent to which changes in average interest rates (on a fully tax equivalent basis) and changes in volume of average interest earning assets and interest bearing liabilities have affected the Company's interest income and interest expense during the periods indicated. For each category of interest earning assets and interest bearing liabilities, information is provided on changes attributable to:
|
•
|
changes in volume (change in volume multiplied by prior rate);
|
|
•
|
changes in rate (change in rate multiplied by prior volume); and
|
|
•
|
total change in rate and volume.
|
Changes attributable to both rate and volume have been allocated proportionately to the change due to volume and the change due to rate.
|
Year Ended December 31, 2017
Compared to Year Ended
December 31, 2016
Increase/(Decrease) Due to Change In
|
Year Ended December 31, 2016
Compared to Year Ended
December 31, 2015
Increase/(Decrease) Due to Change In
|
|||||||||||||||||
|
Volume
|
Rate
|
Net
|
Volume
|
Rate
|
Net
|
|||||||||||||
|
(Dollars in thousands)
|
||||||||||||||||||
|
Interest earning assets:
|
||||||||||||||||||
|
Federal funds sold and overnight deposits
|
$
|
2
|
|
$
|
61
|
|
$
|
63
|
|
$
|
9
|
|
$
|
27
|
|
$
|
36
|
|
|
Interest bearing deposits in banks
|
(35
|
)
|
22
|
|
(13
|
)
|
(28
|
)
|
19
|
|
(9
|
)
|
||||||
|
Investment securities
|
151
|
|
31
|
|
182
|
|
44
|
|
73
|
|
117
|
|
||||||
|
Loans, net
|
1,860
|
|
62
|
|
1,922
|
|
1,160
|
|
365
|
|
1,525
|
|
||||||
|
Nonmarketable equity securities
|
8
|
|
19
|
|
27
|
|
5
|
|
18
|
|
23
|
|
||||||
|
Total interest earning assets
|
$
|
1,986
|
|
$
|
195
|
|
$
|
2,181
|
|
$
|
1,190
|
|
$
|
502
|
|
$
|
1,692
|
|
|
Interest bearing liabilities:
|
||||||||||||||||||
|
Interest bearing checking accounts
|
$
|
19
|
|
$
|
66
|
|
$
|
85
|
|
$
|
8
|
|
$
|
18
|
|
$
|
26
|
|
|
Savings/money market accounts
|
83
|
|
249
|
|
332
|
|
30
|
|
170
|
|
200
|
|
||||||
|
Time deposits
|
(168
|
)
|
(100
|
)
|
(268
|
)
|
(129
|
)
|
(157
|
)
|
(286
|
)
|
||||||
|
Borrowed funds
|
107
|
|
(62
|
)
|
45
|
|
126
|
|
(30
|
)
|
96
|
|
||||||
|
Total interest bearing liabilities
|
$
|
41
|
|
$
|
153
|
|
$
|
194
|
|
$
|
35
|
|
$
|
1
|
|
$
|
36
|
|
|
Net change in net interest income
|
$
|
1,945
|
|
$
|
42
|
|
$
|
1,987
|
|
$
|
1,155
|
|
$
|
501
|
|
$
|
1,656
|
|
Provision for Loan Losses.
The provision for loan losses was
$200 thousand
,
$150 thousand
, and
$550 thousand
for the years ended December 31, 2017, 2016 and 2015
, respectively. The provision for
2017
was deemed appropriate by management based on the size and mix of the loan portfolio, the level of nonperforming loans, the results of the qualitative factor review and the outlook for future economic conditions. For further details, see FINANCIAL CONDITION
Asset Quality
and
Allowance for Loan Losses
below.
28
Noninterest Income.
The following table sets forth the components of noninterest income
for the years ended December 31, 2017, 2016 and 2015
:
|
|
For The Years Ended December 31,
|
||||||||||||||||||
|
Variance from
2017 to 2016
|
Variance from
2016 to 2015
|
||||||||||||||||||
|
|
2017
|
2016
|
$
|
%
|
2015
|
$
|
%
|
||||||||||||
|
|
(Dollars in thousands)
|
||||||||||||||||||
|
Trust income
|
$
|
739
|
|
$
|
737
|
|
$
|
2
|
|
0.3
|
|
$
|
719
|
|
$
|
18
|
|
2.5
|
|
|
Service fees
|
5,951
|
|
5,871
|
|
80
|
|
1.4
|
|
5,568
|
|
303
|
|
5.4
|
|
|||||
|
Net gains on sales of loans held for sale
|
2,303
|
|
2,898
|
|
(595
|
)
|
(20.5
|
)
|
2,871
|
|
27
|
|
0.9
|
|
|||||
|
Gain on sale of OREO
|
—
|
|
—
|
|
—
|
|
—
|
|
29
|
|
(29
|
)
|
(100.0
|
)
|
|||||
|
Income from Company-owned life insurance
|
244
|
|
339
|
|
(95
|
)
|
(28.0
|
)
|
282
|
|
57
|
|
20.2
|
|
|||||
|
Other income
|
141
|
|
224
|
|
(83
|
)
|
(37.1
|
)
|
270
|
|
(46
|
)
|
(17.0
|
)
|
|||||
|
Subtotal
|
9,378
|
|
10,069
|
|
(691
|
)
|
(6.9
|
)
|
9,739
|
|
330
|
|
3.4
|
|
|||||
|
Net gains on sales of investment securities AFS
|
17
|
|
71
|
|
(54
|
)
|
(76.1
|
)
|
53
|
|
18
|
|
34.0
|
|
|||||
|
Total noninterest income
|
$
|
9,395
|
|
$
|
10,140
|
|
$
|
(745
|
)
|
(7.3
|
)
|
$
|
9,792
|
|
$
|
348
|
|
3.6
|
|
The significant changes in noninterest income
for the year ended December 31
,
2017
compared to the
year ended December 31, 2016
are described below:
|
•
|
Service fees.
There was an
$80 thousand
increase in service fees for
2017
compared to
2016
. Loan servicing fees increased $92 thousand due to the increase in our serviced loan portfolio from
$452.0 million
at
December 31, 2016
to
$499.2 million
at
December 31, 2017
, or an increase of
10.5%
. Additionally, increases of $56 thousand and $28 thousand in overdraft fees and ATM network income, respectively were partially offset by a decrease of $62 thousand in service charge income on deposit accounts for the comparison periods.
|
|
•
|
Net gains on sales of loans held for sale.
Continuing the Company's strategy to mitigate long-term interest rate risk, residential and commercial loans totaling
$122.2 million
were sold to the secondary market during
2017
, versus residential and commercial loan sales of
$135.5 million
during
2016
, The decline in net gains on sales of real estate loans is due to a combination of lower volumes of loans sold and lower average premiums on sold loans for the comparison periods.
|
|
•
|
Income from Company-owned life insurance.
During the second quarter of
2016
, the Company received proceeds from the death benefit on an insurance policy on the life of a former director, resulting in $73 thousand of additional income and accounting for the majority of the
$95 thousand
variance year over year.
|
|
•
|
Other income.
Other income decreased
$83 thousand
for
2017
compared to
2016
primarily due to a decrease in income from MSR, net of amortization of $49 thousand and $34 thousand in other miscellaneous income for the comparison periods.
|
The significant changes in noninterest income for the year ended December 31, 2016 compared to the year ended December 31, 2015 are described below:
|
•
|
Service fees.
There was a $303 thousand increase in service fees for 2016 compared to 2015. Loan servicing fees increased $158 thousand due to the increase in our serviced loan portfolio from $422.3 million at December 31, 2015 to $452.0 million at December 31, 2016, or an increase of 7.0%. Additionally, overdraft fees and ATM network income increased $101 thousand and $34 thousand, respectively.
|
|
•
|
Net gains on sales of loans held for sale.
Continuing the Company's strategy to mitigate long-term interest rate risk, residential and commercial loans totaling $135.5 million were sold to the secondary market during 2016, versus residential loan sales of $131.7 million during 2015, resulting in an increase in the net gains on sales of loans held for sale of $27 thousand, or 0.9%.
|
|
•
|
Income from Company-owned life insurance.
During the second quarter of 2016, the administration of the Company's life insurance policies was moved to a single service provider. As a result, the earnings on the older policies are calculated evenly throughout a calendar year rather than as of the June 30th anniversary date of the policies, which was the practice in prior years. Additionally, during the second quarter of 2016, the Company received proceeds from the death benefit on an insurance policy on the life of a former director, resulting in $73 thousand of additional income. This increase was partially offset by the administrative change mentioned previously.
|
|
•
|
Other income.
Other income decreased $46 thousand for 2016 compared to 2015 primarily due to the decrease in income from MSR, net of amortization.
|
29
Noninterest Expense.
The following table sets forth the components of noninterest expenses
for the years ended December 31, 2017, 2016 and 2015
:
|
|
For The Years Ended December 31,
|
||||||||||||||||||
|
Variance from
2017 to 2016
|
Variance from
2016 to 2015
|
||||||||||||||||||
|
|
2017
|
2016
|
$
|
%
|
2015
|
$
|
%
|
||||||||||||
|
|
(Dollars in thousands)
|
||||||||||||||||||
|
Salaries and wages
|
$
|
10,257
|
|
$
|
10,203
|
|
$
|
54
|
|
0.5
|
|
$
|
9,517
|
|
$
|
686
|
|
7.2
|
|
|
Pension and employee benefits
|
3,708
|
|
3,525
|
|
183
|
|
5.2
|
|
2,977
|
|
548
|
|
18.4
|
|
|||||
|
Occupancy expense, net
|
1,415
|
|
1,263
|
|
152
|
|
12.0
|
|
1,279
|
|
(16
|
)
|
(1.3
|
)
|
|||||
|
Equipment expense
|
2,208
|
|
2,115
|
|
93
|
|
4.4
|
|
1,875
|
|
240
|
|
12.8
|
|
|||||
|
ATM and debit card expense
|
698
|
|
639
|
|
59
|
|
9.2
|
|
783
|
|
(144
|
)
|
(18.4
|
)
|
|||||
|
FDIC insurance assessment
|
337
|
|
307
|
|
30
|
|
9.8
|
|
345
|
|
(38
|
)
|
(11.0
|
)
|
|||||
|
Trust expenses
|
362
|
|
409
|
|
(47
|
)
|
(11.5
|
)
|
379
|
|
30
|
|
7.9
|
|
|||||
|
Professional fees
|
573
|
|
731
|
|
(158
|
)
|
(21.6
|
)
|
641
|
|
90
|
|
14.0
|
|
|||||
|
Supplies and printing
|
321
|
|
298
|
|
23
|
|
7.7
|
|
305
|
|
(7
|
)
|
(2.3
|
)
|
|||||
|
Director and advisory board fees
|
405
|
|
368
|
|
37
|
|
10.1
|
|
325
|
|
43
|
|
13.2
|
|
|||||
|
Other expenses
|
3,621
|
|
3,798
|
|
(177
|
)
|
(4.7
|
)
|
3,394
|
|
404
|
|
11.9
|
|
|||||
|
Total noninterest expense
|
$
|
23,905
|
|
$
|
23,656
|
|
$
|
249
|
|
1.1
|
|
$
|
21,820
|
|
$
|
1,836
|
|
8.4
|
|
The significant changes in noninterest expense
for the year ended December 31
,
2017
compared to the
year ended December 31, 2016
are described below:
|
•
|
Pension and employee benefits.
The actuarial calculation for the fiscal year ended
December 31, 2017
decreased the pension benefit by $89 thousand compared to
December 31, 2016
. Additionally, the cost of the Company's medical and dental plans increased $193 thousand, due to increases in premium rates and higher dental claims. The increase in premium rates was partially offset by a $130 thousand medical plan credit due to favorable claims experience in
2016
.
|
|
•
|
Occupancy expense, net.
The Company incurred an increase of $89 thousand in repairs and maintenance costs for the
year ended December 31, 2017
compared to
the year ended December 31, 2016
. The mild winter experienced in Vermont and New Hampshire during 2016 resulted in lower than normal plowing costs. Also, the Company's janitorial costs increased due to a change in vendor. Net lease expense increased $30 thousand during
2017
due to a reduction in rental income as a result of the sale of one of the Company's properties.
|
|
•
|
Equipment expense.
Increases in software license and maintenance costs of $114 thousand occurred during
2017
as compared to
2016
as a result of expected annual increases in existing contracts and the addition of software programs to facilitate bank operations.
|
|
•
|
ATM and debit card expense.
The
$59 thousand
increase between
2016
and
2017
reflects the increase in expense related to the anticipated redemption of reward points earned on customer debit cards.
|
|
•
|
Equity in losses of limited partnerships.
The increase is attributable to an additional investment in a limited partnership resulting in an increase in equity in losses of $91 thousand, partially offset by one limited partnership investment reaching the end of the compliance period.
|
|
•
|
Professional fees.
Professional fee expenses had increased during
2016
as a result of engaging consultants for advisory services related to a review of the Company's core operating system, a review of the Company's branch network and facilities, and additional outsourced internal audit services.
|
The significant changes in noninterest expense for the year ended December 31, 2016 compared to the year ended December 31, 2015 are described below:
|
•
|
Salaries and wages.
The $686 thousand increase reflects normal annual salary increases, an increase of $226 thousand for short term and long term incentive compensation for certain officers of Union and a $59 thousand increase in the amount of commissions paid to mortgage loan originators.
|
|
•
|
Pension and employee benefits.
The actuarial calculation for the fiscal year ended December 31, 2016 decreased the pension benefit by $238 thousand compared to December 31, 2015. Additionally, the cost of the Company's medical and dental plans increased $165 thousand, or 8.8%, due to increases in premium rates and higher dental claims. Also, as a result of higher
|
30
salaries and wages, payroll related taxes increased $50 thousand and 401k employer contribution expense increased $77 thousand between years.
|
•
|
Equipment expense.
Equipment depreciation increased $147 thousand year over year as a result of new technology equipment installed throughout the branch network as well as other infrastructure replacements. Additionally, increases in maintenance contracts of $140 thousand occurred as a result of the installation of the new equipment.
|
|
•
|
ATM and debit card expense.
The $144 thousand decrease between 2015 and 2016 reflects $98 thousand in expenses related to the issuance of EMV chip debit cards that did not recur in 2016 and $34 thousand of incentives received as a result of negotiation of a vendor contract utilized to offset expenses incurred in 2016.
|
|
•
|
Equity in losses of limited partnerships.
The increase is attributable to an additional investment in a limited partnership resulting in an increase in equity in losses of $91 thousand, partially offset by one limited partnership investment reaching the end of the compliance period.
|
|
•
|
Professional fees.
Professional fee expenses increased $90 thousand year over year as a result of engaging consultants for advisory services related to a review of the Company's core operating system, review the Company's branch network and facilities, and additional outsourced internal audit services.
|
Provision for Income Taxes.
The Company has provided for current and deferred federal income taxes for the current and all prior periods presented. The Company's net provision for income taxes was
$3.6 million
for
2017
,
$2.6 million
for
2016
, and
$2.7 million
for
2015
. The Company’s effective tax rate for
2017
increased to
29.9%
compared to
23.4%
for
2016
and
25.3%
for
2015
.
The increase in the Company's effective tax rate for
2017
was the result of a one-time charge to earnings of $447 thousand for the revaluation of the Company's deferred tax assets as required by the Tax Act signed into law on December 22, 2017. The Tax Act decreases the Company's federal income tax rate from 34% to 21% effective January 1, 2018.
The Company received benefits of income tax credits from its investments in affordable housing projects of
$660 thousand
for
2017
,
$881 thousand
for
2016
, and
$564 thousand
for
2015
.
FINANCIAL CONDITION
At
December 31, 2017
, the Company had total consolidated assets of
$745.8 million
, including gross loans and loans held for sale (total loans) of
$594.6 million
, deposits of
$647.6 million
and stockholders' equity of
$58.7 million
. The Company’s total assets increased
$54.5 million
, or
7.9%
, from
$691.4 million
at
December 31, 2016
.
Net loans and loans held for sale increased
$53.5 million
, or
10.0%
, to
$589.9 million
, or
79.1%
of total assets, at
December 31, 2017
, compared to
$536.5 million
, or
77.6%
of total assets, at
December 31, 2016
. (See
Loan Portfolio
below.)
Total deposits increased
$49.9 million
, or
8.4%
to
$647.6 million
at
December 31, 2017
, from
$597.7 million
at
December 31, 2016
. There were increases in interest bearing deposits of
$36.5 million
, or
9.6%
, and noninterest bearing deposits of
$15.4 million
, or
13.7%
, , which were partially offset by a decrease in time deposits of
$2.1 million
, or
2.0%
. (See average balances and rates in the
Yields Earned
and
Rates Paid
table on page 27.)
There was minimal change in borrowed funds which totaled
$31.6 million
at
December 31, 2017
and
2016
. There was a decrease in FHLB advances of
$280 thousand
, while customer overnight collateralized repurchase sweeps increased
$266 thousand
between
December 31, 2016
and
December 31, 2017
. (See
Borrowings
on page 39.)
Total stockholders’ equity increased
$2.4 million
, or
4.2%
, from
$56.3 million
at
December 31, 2016
to
$58.7 million
at
December 31, 2017
. (See
Capital Resources
on page 43.)
Loan Portfolio
. The Company's gross loan portfolio (including loans held for sale) increased
$53.5 million
, or
9.9%
, to
$594.6 million
, representing
79.7%
of assets at
December 31, 2017
, from
$541.1 million
, representing
78.3%
of assets at
December 31, 2016
. The Company's loans consist primarily of adjustable-rate and fixed-rate mortgage loans secured by one-to-four family, multi-family residential or commercial real estate. Real estate secured loans represented
$484.2 million
, or
81.4%
, of total loans at
December 31, 2017
compared to
$463.8 million
, or
85.7%
, of total loans at
December 31, 2016
. Although competition for good loans is strong, especially in the commercial sector, the Company has been able to originate loans to both current and new customers while maintaining credit quality. Other than the increase in the municipal portfolio reflecting the successful bid season for municipal lending opportunities, the composition of the Company's loan portfolio remained relatively unchanged from
December 31, 2016
. There was no material change in the Company's lending programs or terms during
2017
.
31
The composition of the Company's loan portfolio at year-end for each of the last five years was as follows:
|
|
2017
|
2016
|
2015
|
2014
|
2013
|
|||||||||||||||
|
$
|
%
|
$
|
%
|
$
|
%
|
$
|
%
|
$
|
%
|
|||||||||||
|
|
(Dollars in thousands)
|
|||||||||||||||||||
|
Residential real estate
|
$
|
178,999
|
|
30.1
|
$
|
172,727
|
|
31.9
|
$
|
165,396
|
|
32.7
|
$
|
165,475
|
|
33.7
|
$
|
159,441
|
|
34.3
|
|
Construction real estate
|
42,935
|
|
7.2
|
34,189
|
|
6.3
|
42,889
|
|
8.5
|
37,258
|
|
7.6
|
30,898
|
|
6.7
|
|||||
|
Commercial real estate
|
254,291
|
|
42.8
|
249,063
|
|
46.0
|
230,442
|
|
45.5
|
211,710
|
|
43.1
|
210,718
|
|
45.3
|
|||||
|
Commercial
|
50,719
|
|
8.5
|
41,999
|
|
7.8
|
21,397
|
|
4.2
|
20,620
|
|
4.2
|
20,569
|
|
4.4
|
|||||
|
Consumer
|
3,894
|
|
0.7
|
3,962
|
|
0.7
|
3,963
|
|
0.8
|
4,435
|
|
0.9
|
5,396
|
|
1.2
|
|||||
|
Municipal
|
55,777
|
|
9.4
|
31,350
|
|
5.8
|
36,419
|
|
7.2
|
40,480
|
|
8.3
|
34,091
|
|
7.3
|
|||||
|
Loans held for sale
|
7,947
|
|
1.3
|
7,803
|
|
1.5
|
5,635
|
|
1.1
|
10,743
|
|
2.2
|
3,840
|
|
0.8
|
|||||
|
Total loans
|
$
|
594,562
|
|
100.0
|
$
|
541,093
|
|
100.0
|
$
|
506,141
|
|
100.0
|
$
|
490,721
|
|
100.0
|
$
|
464,953
|
|
100.0
|
The Company originates and sells qualified residential mortgage loans in various secondary market avenues, with a majority of sales made to the FHLMC/Freddie Mac. At
December 31, 2017
, the Company serviced a
$670.8 million
residential real estate mortgage portfolio, of which
$7.9 million
was held for sale and approximately
$483.8 million
was serviced for unaffiliated third parties. This compares to a residential real estate mortgage serviced portfolio of
$616.1 million
at
December 31, 2016
, of which
$7.8 million
was held for sale and approximately
$435.6 million
was serviced for unaffiliated third parties. Loans held for sale are accounted for at the lower of cost or fair value and are reviewed by management at least quarterly based on current market pricing.
The Company sold
$122.0 million
of qualified residential real estate loans originated during
2017
to the secondary market to mitigate long-term interest rate risk and to generate fee income, compared to sales of
$135.3 million
during
2016
. The Company generally retains the servicing rights on sold residential mortgage loans. The Company originates and sells FHA, VA, and RD residential mortgage loans, and also has
an Unconditional Direct Endorsement Approval from HUD which allows the Company to approve FHA loans originated in any of its Vermont or New Hampshire locations without needing prior HUD underwriting approval. The Company sells VA and FHA loans as originated with servicing released. Some of the government backed loans qualify for zero down payments without geographic or income restrictions.
These loan products increase the Company's ability to serve the borrowing needs of residents in the communities we serve, including low and moderate income borrowers, while the government guaranty mitigates our exposure to credit risk.
The Company also originates commercial real estate and commercial loans under various SBA, USDA and State sponsored programs which provide a government agency guaranty for a portion of the loan amount. There was
$4.6 million
and
$5.2 million
guaranteed under these various programs at
December 31, 2017
and
2016
, respectively, on an aggregate balance of
$5.9 million
and
$6.5 million
in subject loans for the same time periods. The Company occasionally sells the guaranteed portion of a loan to other financial concerns and retains servicing rights, which generates fee income. There was
$226 thousand
and
$251 thousand
in commercial real estate and commercial loans sold during
2017
and
2016
, respectively. The Company recognizes gains and losses on the sale of the principal portion of these loans as they occur.
The Company serviced
$15.4 million
and
$16.4 million
of commercial and commercial real estate loans for unaffiliated third parties as of
December 31, 2017
and
2016
, respectively. This includes
$12.6 million
and
$12.9 million
of commercial or commercial real estate loans the Company had participated out to other financial institutions at
December 31, 2017
and
2016
, respectively. These loans were participated in the ordinary course of business on a nonrecourse basis, for liquidity or credit concentration management purposes.
As of
December 31, 2017
, total loans serviced had grown to
$1.1 billion
, which includes total loans on the balance sheet of
$594.6 million
as well as total loans sold with servicing retained of
$499.2 million
, compared to total loans serviced of
$993.1 million
as of
December 31, 2016
.
The Company capitalizes MSRs for all loans sold with servicing retained and recognizes gains and losses on the sale of the principal portion of these loans as they occur. The unamortized balance of MSRs on loans sold with servicing retained was
$1.7 million
as of
December 31, 2017
and
$1.6 million
as of
December 31, 2016
, with an estimated market value in excess of the carrying value at both year ends. Management periodically evaluates and measures the servicing assets for impairment.
32
The following table breaks down by classification the contractual maturities of the gross loans held in portfolio and for sale as of
December 31, 2017
:
|
|
Within 1
Year
|
2-5
Years
|
Over 5
Years
|
Total
|
||||||||
|
|
(Dollars in thousands)
|
|||||||||||
|
Fixed rate
|
||||||||||||
|
Residential real estate
|
$
|
922
|
|
$
|
2,008
|
|
$
|
91,316
|
|
$
|
94,246
|
|
|
Construction real estate
|
19,983
|
|
375
|
|
5,081
|
|
25,439
|
|
||||
|
Commercial real estate
|
1,114
|
|
16,205
|
|
16,891
|
|
34,210
|
|
||||
|
Commercial
|
1,132
|
|
8,665
|
|
19,828
|
|
29,625
|
|
||||
|
Consumer
|
2,168
|
|
1,526
|
|
160
|
|
3,854
|
|
||||
|
Municipal
|
39,399
|
|
4,468
|
|
11,910
|
|
55,777
|
|
||||
|
Total fixed rate
|
64,718
|
|
33,247
|
|
145,186
|
|
243,151
|
|
||||
|
Variable rate
|
||||||||||||
|
Residential real estate
|
1,855
|
|
2,016
|
|
88,829
|
|
92,700
|
|
||||
|
Construction real estate
|
2,905
|
|
1,991
|
|
12,600
|
|
17,496
|
|
||||
|
Commercial real estate
|
8,042
|
|
8,800
|
|
203,239
|
|
220,081
|
|
||||
|
Commercial
|
12,860
|
|
3,432
|
|
4,802
|
|
21,094
|
|
||||
|
Consumer
|
40
|
|
—
|
|
—
|
|
40
|
|
||||
|
Total variable rate
|
25,702
|
|
16,239
|
|
309,470
|
|
351,411
|
|
||||
|
$
|
90,420
|
|
$
|
49,486
|
|
$
|
454,656
|
|
$
|
594,562
|
|
|
Asset Quality.
The Company, like all financial institutions, is exposed to certain credit risks, including those related to the value of the collateral that secures its loans and the ability of borrowers to repay their loans. Consistent application of the Company’s conservative loan policies has helped to mitigate this risk and has been prudent for both the Company and its customers. The Company's Board has set forth well-defined lending policies (which are periodically reviewed and revised as appropriate) that include conservative individual lending limits for officers, aggregate and advisory board approval levels, Board approval for large credit relationships, a quality control program, a loan review program and other limits or standards deemed necessary and prudent. The Company's loan review program encompasses a review process for loan documentation and underwriting for select loans as well as a monitoring process for credit extensions to assess the credit quality and degree of risk in the loan portfolio. Management performs, and shares with the Board, periodic concentration analyses based on various factors such as industries, collateral types, location, large credit sizes and officer portfolio loads. Board approved policies set forth portfolio diversification levels to mitigate concentration risk and the Company participates large credits out to other financial institutions to further mitigate that risk. The Company has established underwriting guidelines to be followed by its officers; material exceptions are required to be approved by a senior loan officer, the President or the Board.
The Company does not make loans that are interest only, have teaser rates or that result in negative amortization of the principal, except for construction, lines of credit and other short-term loans for either commercial or consumer purposes where the credit risk is evaluated on a borrower-by-borrower basis. The Company evaluates the borrower's ability to pay on variable-rate loans over a variety of interest rate scenarios, not only the rate at origination.
The majority of the Company's loan portfolio is secured by real estate located throughout the Company's primary market area of northern Vermont and New Hampshire. For residential loans, the Company generally does not lend more than 80% of the appraised value of the home without a government guaranty or the borrower purchasing private mortgage insurance. Although the Company lends up to 80% of the collateral value on commercial real estate loans to strong borrowers, the majority of commercial real estate loans do not exceed 75% of the appraised collateral value. Rarely, the loan to value may go up to 100% on loans with government guarantees or other mitigating circumstances. Although the Company's loan portfolio consists of different business segments, there is a portion of the loan portfolio centered in tourism related loans. The Company has implemented risk management strategies to mitigate exposure in this industry through utilizing government guaranty programs as well as participations with other financial institutions as discussed above. Additionally, the loan portfolio contains many loans to seasoned and well established businesses and/or well secured loans which further reduce the Company's risk. Management closely follows the local and national economies and their impact on the local businesses, especially on the tourism industry, as part of the Company's risk management program.
The Company also monitors its delinquency levels for any adverse trends. There can be no assurance that the Company's loan portfolio will not become subject to increasing pressures from deteriorating borrower financial strength or declining collateral values due to general or local economic conditions. Renewed market volatility, high unemployment rates or weakness in the general economic condition of the country or our market area, may have a negative effect on our customers’ ability to make their
33
loan payments on a timely basis and/or on underlying collateral values. Management closely monitors the Company’s loan and investment portfolios, OREO and OAO for potential problems and reports to the Company’s and Union's Board at regularly scheduled meetings. Repossessed assets and loans or investments that are 90 days or more past due are considered to be nonperforming assets.
TDR loans involve one or more of the following: forgiving a portion of interest or principal, refinancing at a rate materially less than the market rate, rescheduling loan payments, or granting other concessions to a borrower due to financial or economic reasons related to the debtor's financial difficulties that the Company would not ordinarily grant. When evaluating the ALL, management makes a specific allocation for TDR loans as they are considered impaired.
The following table details the composition of the Company's nonperforming assets as of December 31:
|
2017
|
2016
|
2015
|
2014
|
2013
|
|||||||||||
|
|
(Dollars in thousands)
|
||||||||||||||
|
Nonaccrual loans
|
$
|
1,191
|
|
$
|
3,545
|
|
$
|
2,521
|
|
$
|
2,235
|
|
$
|
1,434
|
|
|
Loans past due 90 days or more and still accruing interest
|
494
|
|
840
|
|
836
|
|
2,344
|
|
263
|
|
|||||
|
Total nonperforming loans
|
1,685
|
|
4,385
|
|
3,357
|
|
4,579
|
|
1,697
|
|
|||||
|
OREO
|
36
|
|
—
|
|
—
|
|
297
|
|
559
|
|
|||||
|
Total nonperforming assets
|
$
|
1,721
|
|
$
|
4,385
|
|
$
|
3,357
|
|
$
|
4,876
|
|
$
|
2,256
|
|
|
Guarantees of U.S. or state government agencies on the above nonperforming loans
|
$
|
131
|
|
$
|
599
|
|
$
|
291
|
|
$
|
259
|
|
$
|
19
|
|
|
TDR loans
|
$
|
3,252
|
|
$
|
3,419
|
|
$
|
2,732
|
|
$
|
1,691
|
|
$
|
1,240
|
|
The following table shows trends of certain asset quality ratios monitored by Company's management at December 31:
|
|
2017
|
2016
|
2015
|
2014
|
2013
|
|||||
|
Allowance for loan losses to loans not held for sale (1)
|
0.92
|
%
|
0.98
|
%
|
1.04
|
%
|
0.98
|
%
|
1.01
|
%
|
|
Allowance for loan losses to nonperforming loans
|
320.95
|
%
|
119.66
|
%
|
154.93
|
%
|
102.51
|
%
|
273.84
|
%
|
|
Nonperforming loans to total loans
|
0.28
|
%
|
0.81
|
%
|
0.66
|
%
|
0.93
|
%
|
0.36
|
%
|
|
Nonperforming assets to total assets
|
0.23
|
%
|
0.63
|
%
|
0.53
|
%
|
0.78
|
%
|
0.39
|
%
|
|
Delinquent loans (30 days to nonaccruing) to total loans
|
1.05
|
%
|
1.55
|
%
|
1.61
|
%
|
2.20
|
%
|
2.15
|
%
|
|
Net charge-offs to average loans not held for sale
|
0.01
|
%
|
0.02
|
%
|
0.01
|
%
|
0.06
|
%
|
0.07
|
%
|
____________________
|
(1)
|
Calculation includes the net carrying amount of loans recorded at fair value from the 2011 Branch Acquisition as of
December 31, 2014
(
$9.1 million
) and
December 31, 2013
(
$17.0 million
). Excluding such loans, the ALL to loans not purchased and not held for sale was 1.00% at
December 31, 2014
and 1.05% at
December 31, 2013
. The acquired loan portfolios from the 2011 Branch Acquisition were transferred to the Company's existing loan portfolios during the fourth quarter of 2015.
|
Nonperforming loans at
December 31, 2017
decreased
$2.7 million
, or
61.6%
, and decreased as a percentage of assets from
December 31, 2016
, with the ALL as a percentage of nonperforming loans increasing from
119.66%
to
320.95%
. All other asset quality ratios have improved in comparison to
December 31, 2016
and management considers the ratios to be at favorable levels. The Company's success at keeping the ratios at favorable levels is the result of continued focus on maintaining strict underwriting standards, as well as our practice, as a community bank, of actively working with troubled borrowers to resolve the borrower's delinquency, while maintaining the safe and sound credit practices of Union and safeguarding our strong capital position. There were
no
residential real estate loans in process of foreclosure at
December 31, 2017
. The aggregate interest on nonaccrual loans not recognized was
$1.2 million
for the year ended December 31
,
2017
,
$1.3 million
for the year ended December 31
,
2016
and
$1.2 million
for the year ended December 31
,
2015
.
The Company had loans rated substandard that were on a performing status totaling
$3.0 million
at
December 31, 2017
and
$1.8 million
at
December 31, 2016
. In management's view, such loans represent a higher degree of risk of becoming nonperforming loans in the future. While still on a performing status, in accordance with the Company's credit policy, loans are internally classified when a review indicates the existence of any of the following conditions, making the likelihood of collection questionable:
|
•
|
the financial condition of the borrower is unsatisfactory;
|
|
•
|
repayment terms have not been met;
|
|
•
|
the borrower has sustained losses that are sizable, either in absolute terms or relative to net worth;
|
34
|
•
|
confidence in the borrower's ability to repay is diminished;
|
|
•
|
loan covenants have been violated;
|
|
•
|
collateral is inadequate; or
|
|
•
|
other unfavorable factors are present.
|
Although management believes that the Company's nonperforming and internally classified loans are generally well-secured and that probable credit losses inherent in the loan portfolio are provided for in the Company's ALL, there can be no assurance that future deterioration in economic conditions and/or collateral values, or changes in other relevant factors will not result in future credit losses. The Company’s management is focused on the impact that the economy may have on its borrowers and closely monitors industry and geographic concentrations for evidence of financial problems. The past two winter seasons have brought cold temperatures and snowfall to the area, which appears to have had a positive impact after getting through a difficult 2015/2016 winter season. Improvement in local economic indicators have also been identified over the past year. The unemployment rate has stabilized in Vermont and was
2.8%
for
December 31, 2017
compared to
3.1%
for
December 31, 2016
. The New Hampshire unemployment rate was
2.6%
for
December 31, 2017
and for
December 31, 2016
. These rates compare favorably with the nationwide rate of
4.1%
and
4.7%
for the comparable periods. Management will continue to monitor the national, regional and local economic environment and its impact on unemployment, business failures and real estate values in the Company’s market area.
On occasion, the Company acquires residential or commercial real estate properties through or in lieu of loan foreclosure. These properties are held for sale and are initially recorded as OREO at fair value less estimated selling costs at the date of the Company’s acquisition of the property, with fair value based on an appraisal for more significant properties and on a broker’s price opinion for less significant properties. Holding costs and declines in fair value of properties acquired are expensed as incurred. Declines in the fair value after acquisition of the property result in charges against income before tax. There were
no
such declines during
2017
and
2016
. The Company evaluates each OREO property at least quarterly for changes in the fair value. The Company had one residential real estate property valued at
$36 thousand
classified as OREO at
December 31, 2017
and
no
properties classified as OREO at
December 31, 2016
.
Allowance for Loan Losses
.
Some of the Company’s loan customers ultimately do not make all of their contractually scheduled payments, requiring the Company to charge off a portion or all of the remaining principal balance due. The Company maintains an ALL to absorb such losses. The ALL is maintained at a level believed by management to be appropriate to absorb probable credit losses inherent in the loan portfolio as of the evaluation date; however, actual loan losses may vary from management's current estimates.
The ALL is evaluated quarterly using a consistent, systematic methodology, which analyzes the risk inherent in the loan portfolio. In addition to evaluating the collectability of specific loans when determining the appropriate level of the ALL, management also takes into consideration other qualitative factors such as changes in the mix and size of the loan portfolio, credit concentrations, historic loss experience, the amount of delinquencies and loans adversely classified, industry trends, and the impact of the local and regional economy on the Company's borrowers as well as the estimated value of any underlying collateral. The appropriate level of the ALL is assessed by an allocation process whereby specific loss allocations are made against impaired loans and general loss allocations are made against segments of the loan portfolio that have similar attributes. Although the ALL is assessed by allocating reserves by loan category, the total ALL is available to absorb losses that may occur within any loan category.
The ALL is increased by a provision for loan losses charged to earnings, and reduced by charge-offs, net of recoveries. The provision for loan losses represents management's estimate of the current period credit cost associated with maintaining an appropriate ALL. Based on an evaluation of the loan portfolio and other relevant qualitative factors, management presents a quarterly analysis of the appropriate level of the ALL to the Board, indicating any changes in the ALL since the last review and any recommendations as to adjustments in the ALL and the level of future provisions.
Credit quality of the commercial portfolio is quantified by a credit rating system designed to parallel regulatory criteria and categories of loan risk and has historically been well received by the various regulatory authorities. Individual loan officers monitor their loans to ensure appropriate rating assignments are made on a timely basis. Risk ratings and quality of commercial and retail credit portfolios are also assessed on a regular basis by an independent loan review function.
The level of ALL allocable to each loan portfolio category with similar risk characteristics is determined based on historical charge-offs, adjusted for qualitative risk factors. A quarterly analysis of various qualitative factors, including portfolio characteristics, national and local economic trends, overall market conditions, and levels of, and trends in, delinquencies and nonperforming loans, helps to ensure that areas with the potential risk for loss are considered in management's ALL estimate. In addition, loans are also evaluated for specific impairment and may be classified as impaired when management believes it is probable that the Company will not collect all the contractual interest and principal payments as scheduled in the loan agreement. Commercial loans with balances greater than $500 thousand was established by management as the threshold for individual impairment evaluation with
35
a specific reserve allocated when warranted. Large groups of smaller balance homogeneous loans are collectively evaluated for impairment. Accordingly, the Company does not separately identify individual consumer, real estate or small balance commercial loans for impairment evaluation, unless such loans are subject to a restructuring agreement or have been identified as impaired as part of a larger customer relationship. A specific reserve amount is allocated to the ALL for individual loans that have been classified as impaired on the basis of the fair value of the collateral for collateral dependent loans, an observable market price, or the present value of anticipated future cash flows.
The following table reflects activity in the ALL
for the years ended
December 31
:
|
|
2017
|
2016
|
2015
|
2014
|
2013
|
||||||||||
|
|
(Dollars in thousands)
|
||||||||||||||
|
Balance at the beginning of year
|
$
|
5,247
|
|
$
|
5,201
|
|
$
|
4,694
|
|
$
|
4,647
|
|
$
|
4,657
|
|
|
Charge-offs
|
207
|
|
163
|
|
126
|
|
340
|
|
402
|
|
|||||
|
Recoveries
|
168
|
|
59
|
|
83
|
|
42
|
|
87
|
|
|||||
|
Net charge-offs
|
(39
|
)
|
(104
|
)
|
(43
|
)
|
(298
|
)
|
(315
|
)
|
|||||
|
Provision for loan losses
|
200
|
|
150
|
|
550
|
|
345
|
|
305
|
|
|||||
|
Balance at the end of year
|
$
|
5,408
|
|
$
|
5,247
|
|
$
|
5,201
|
|
$
|
4,694
|
|
$
|
4,647
|
|
|
Provision charged to income as a
percent of average loans
|
0.04
|
%
|
0.03
|
%
|
0.11
|
%
|
0.07
|
%
|
0.07
|
%
|
|||||
The following table (net of loans held for sale) shows the internal breakdown by risk component of the Company's ALL and the percentage of loans in each category to total loans in the respective portfolios at
December 31
:
|
|
2017
|
2016
|
2015
|
2014
|
2013
|
|||||||||||||||
|
|
$
|
%
|
$
|
%
|
$
|
%
|
$
|
%
|
$
|
%
|
||||||||||
|
|
(Dollars in thousands)
|
|||||||||||||||||||
|
Residential real estate
|
$
|
1,361
|
|
30.5
|
$
|
1,399
|
|
32.4
|
$
|
1,419
|
|
33.0
|
$
|
1,330
|
|
34.5
|
$
|
1,251
|
|
34.6
|
|
Construction real estate
|
488
|
|
7.3
|
391
|
|
6.4
|
514
|
|
8.6
|
439
|
|
7.8
|
390
|
|
6.7
|
|||||
|
Commercial real estate
|
2,707
|
|
43.4
|
2,687
|
|
46.7
|
2,792
|
|
46.0
|
2,417
|
|
44.1
|
2,644
|
|
45.7
|
|||||
|
Commercial
|
395
|
|
8.6
|
342
|
|
7.9
|
209
|
|
4.3
|
176
|
|
4.3
|
163
|
|
4.4
|
|||||
|
Consumer
|
30
|
|
0.7
|
26
|
|
0.7
|
28
|
|
0.8
|
27
|
|
0.9
|
23
|
|
1.2
|
|||||
|
Municipal
|
64
|
|
9.5
|
40
|
|
5.9
|
38
|
|
7.3
|
42
|
|
8.4
|
35
|
|
7.4
|
|||||
|
Unallocated
|
363
|
|
—
|
362
|
|
—
|
201
|
|
—
|
263
|
|
—
|
141
|
|
—
|
|||||
|
Total
|
$
|
5,408
|
|
100.0
|
5,247
|
|
100.0
|
$
|
5,201
|
|
100.0
|
$
|
4,694
|
|
100.0
|
$
|
4,647
|
|
100.0
|
|
There were no changes to the reserve factors assigned to any of the loan portfolios based on the qualitative factor reviews performed during
2017
. Management of the Company believes, in its best estimate, that the ALL at
December 31, 2017
is appropriate to cover probable credit losses inherent in the Company’s loan portfolio as of such date. However, there can be no assurance that the Company will not sustain losses in future periods which could be greater than the size of the ALL at
December 31, 2017
. In addition, our banking regulators, as an integral part of their examination process, periodically review our ALL. Such agencies may require us to recognize adjustments to the ALL based on their judgments about information available to them at the time of their examination. A large adjustment to the ALL for losses in future periods may require increased provisions to replenish the ALL, which could negatively affect earnings. While the Company recognizes that economic slowdowns or financial and credit market turmoil may adversely impact its borrowers' financial performance and ultimately their ability to repay their loans, management continues to be cautiously optimistic about the collectability of the Company's loan portfolio.
Investment Activities
. The investment portfolio is used to generate interest and dividend income, manage liquidity and mitigate interest rate sensitivity. At
December 31, 2017
, the fair value of investment securities AFS was
$65.4 million
, or
8.8%
of total assets, compared to
$65.6 million
, or
9.5%
of total assets at
December 31, 2016
. There were
$1.0 million
of investment securities classified as HTM at
December 31, 2017
and
2016
. The Company had no investments classified as trading as of either date. Investment securities classified as AFS are marked-to-market, with any unrealized gain or loss after estimated taxes charged to the equity portion of the balance sheet through the accumulated OCI component of stockholders' equity. The fair value of investment securities AFS at
December 31, 2017
reflects a net unrealized loss of
$381 thousand
, compared to a net unrealized loss of
$1.0 million
at
December 31, 2016
.
At
December 31, 2017
,
75
debt securities had unrealized losses of
$703 thousand
, with aggregate depreciation of
1.05%
from the Company's amortized cost basis. Securities are evaluated at least quarterly for OTTI and at
December 31, 2017
, in management's
36
estimation no security was OTTI. Management's evaluation of OTTI is subject to risks and uncertainties and is intended to determine the appropriate amount and timing of recognition of any impairment charge. The assessment of whether such impairment for debt securities has occurred is based on management's best estimate of the cash flows expected to be collected at the individual security level. We regularly monitor our investment portfolio to ensure securities that may be OTTI are identified in a timely manner and that any impairment charge is recognized in the proper period and, with respect to debt securities, that the impairment is properly allocated between credit losses recognized in earnings and noncredit unrealized losses recognized in OCI. Further deterioration in credit quality, imbalances in liquidity in the financial marketplace or a quick rise in interest rates might adversely affect the fair value of the Company's investment portfolio and may increase the potential that certain unrealized losses will be designated as OTT in future periods, resulting in write-downs and related charges to earnings.
At
December 31, 2017
, the Company had no investments in a single company or entity (other than U.S. Government-sponsored enterprise securities) that had an aggregate book value in excess of 2% of our stockholders' equity. As of
December 31, 2017
, all MBS the Company owned were issued by the Government National Mortgage Association, Fannie Mae or the FHLMC/Freddie Mac. Although the Fannie Mae and Freddie Mac debt securities are not explicitly guaranteed by the federal government, one of the stated purposes of the U.S. Treasury's September, 2008 conservatorship and capital support of the two institutions was to stabilize the market in their debt securities, and that purpose was again evident in legislation passed by Congress in late 2009 which effectively lifted any dollar ceiling on the implicit U.S. Treasury guaranty of Fannie Mae and Freddie Mac debt securities.
The following tables show as of
December 31
, the amortized cost, fair value and weighted average yield on a tax equivalent basis of the Company's investment debt securities portfolio maturing within the stated periods:
|
December 31, 2017
|
Maturities
|
||||||||||||||||
|
|
Within
One Year
|
One to
Five Years
|
Five to
Ten Years
|
Over
Ten Years
|
Amortized
Cost
|
Weighted
Average
Yield
|
|||||||||||
|
Investment securities available-for-sale:
|
(Dollars in thousands)
|
||||||||||||||||
|
U.S. Government-sponsored enterprises
|
$
|
—
|
|
$
|
—
|
|
$
|
2,756
|
|
$
|
5,049
|
|
$
|
7,805
|
|
2.33
|
%
|
|
Agency MBS
|
—
|
|
907
|
|
737
|
|
26,734
|
|
28,378
|
|
2.57
|
%
|
|||||
|
State and political subdivisions
|
—
|
|
3,818
|
|
9,690
|
|
11,196
|
|
24,704
|
|
2.48
|
%
|
|||||
|
Corporate debt
|
—
|
|
—
|
|
4,412
|
|
—
|
|
4,412
|
|
3.27
|
%
|
|||||
|
Investment securities held-to-maturity:
|
|||||||||||||||||
|
U.S. Government-sponsored enterprises
|
1,000
|
|
—
|
|
—
|
|
—
|
|
1,000
|
|
0.95
|
%
|
|||||
|
Total investment debt securities
|
$
|
1,000
|
|
$
|
4,725
|
|
$
|
17,595
|
|
$
|
42,979
|
|
$
|
66,299
|
|
2.53
|
%
|
|
|
|
|
|
|
|
|
|
||||||||||
|
Fair value
|
$
|
999
|
|
$
|
4,777
|
|
$
|
17,571
|
|
$
|
42,570
|
|
$
|
65,917
|
|
|
|
|
|
|
|
|
|
|
||||||||||||
|
Weighted average yield
|
1.00
|
%
|
2.64
|
%
|
2.63
|
%
|
2.52
|
%
|
2.53
|
%
|
|
||||||
|
December 31, 2016
|
Maturities
|
||||||||||||||||
|
|
Within
One Year
|
One to
Five Years
|
Five to
Ten Years
|
Over
Ten Years
|
Amortized
Cost
|
Weighted
Average
Yield
|
|||||||||||
|
Investment securities available-for-sale:
|
(Dollars in thousands)
|
||||||||||||||||
|
U.S. Government-sponsored enterprises
|
$
|
—
|
|
$
|
500
|
|
$
|
3,290
|
|
$
|
6,431
|
|
$
|
10,221
|
|
1.94
|
%
|
|
Agency MBS
|
—
|
|
1,836
|
|
498
|
|
15,949
|
|
18,283
|
|
1.97
|
%
|
|||||
|
State and political subdivisions
|
627
|
|
3,298
|
|
13,064
|
|
10,920
|
|
27,909
|
|
2.54
|
%
|
|||||
|
Corporate debt
|
—
|
|
2,036
|
|
7,709
|
|
—
|
|
9,745
|
|
3.02
|
%
|
|||||
|
Investment securities held-to-maturity:
|
|||||||||||||||||
|
U.S. Government-sponsored enterprises
|
—
|
|
999
|
|
—
|
|
—
|
|
999
|
|
0.95
|
%
|
|||||
|
Total investment debt securities
|
$
|
627
|
|
$
|
8,669
|
|
$
|
24,561
|
|
$
|
33,300
|
|
$
|
67,157
|
|
2.34
|
%
|
|
|
|
|
|
|
|
|
|
||||||||||
|
Fair value
|
$
|
631
|
|
$
|
8,738
|
|
$
|
24,262
|
|
$
|
32,521
|
|
$
|
66,152
|
|
|
|
|
|
|
|
|
|
|
||||||||||||
|
Weighted average yield
|
3.63
|
%
|
2.34
|
%
|
2.65
|
%
|
2.09
|
%
|
2.34
|
%
|
|
||||||
37
|
December 31, 2015
|
Maturities
|
||||||||||||||||
|
Within
One Year
|
One to
Five Years
|
Five to
Ten Years
|
Over
Ten Years
|
Amortized
Cost
|
Weighted
Average
Yield
|
||||||||||||
|
Investment securities available-for-sale:
|
(Dollars in thousands)
|
||||||||||||||||
|
U.S. Government-sponsored enterprises
|
$
|
—
|
|
$
|
—
|
|
$
|
2,803
|
|
$
|
8,002
|
|
$
|
10,805
|
|
2.14
|
%
|
|
Agency MBS
|
—
|
|
1,875
|
|
498
|
|
8,710
|
|
11,083
|
|
2.17
|
%
|
|||||
|
State and political subdivisions
|
360
|
|
3,014
|
|
10,980
|
|
5,299
|
|
19,653
|
|
2.81
|
%
|
|||||
|
Corporate debt
|
—
|
|
1,508
|
|
10,758
|
|
—
|
|
12,266
|
|
2.83
|
%
|
|||||
|
Investment securities held-to-maturity:
|
|||||||||||||||||
|
U.S. Government-sponsored enterprises
|
—
|
|
998
|
|
1,000
|
|
3,219
|
|
5,217
|
|
1.95
|
%
|
|||||
|
Total investment debt securities
|
$
|
360
|
|
$
|
7,395
|
|
$
|
26,039
|
|
$
|
25,230
|
|
$
|
59,024
|
|
2.32
|
%
|
|
Fair value
|
$
|
360
|
|
$
|
7,444
|
|
$
|
26,017
|
|
$
|
25,060
|
|
$
|
58,881
|
|
||
|
Weighted average yield
|
3.71
|
%
|
2.25
|
%
|
2.69
|
%
|
2.35
|
%
|
2.50
|
%
|
|||||||
The tables above exclude mutual fund securities with a book and fair value of
$521 thousand
at
December 31, 2017
,
$403 thousand
at
December 31, 2016
and
$345 thousand
at
December 31, 2015
.
Federal Home Loan Bank of Boston Stock.
Union is a member of the FHLB, with an investment of
$2.3 million
in its Class B common stock at
December 31, 2017
and
December 31, 2016
. The Class B common stock has a five year notice requirement for redemption and there is no guarantee of future redemption. Also, there is the possibility of future capital calls by the FHLB on member banks to ensure compliance with its capital plan. Union's investment in FHLB stock is carried in Other assets at cost and is nonmarketable. Similar to evaluating investment securities for OTTI, the Company has evaluated its investment in the FHLB. The FHLB remains in compliance with all regulatory capital ratios as of
December 31, 2017
and
2016
. Management's most recent evaluation of the Company's holdings of FHLB common stock concluded that the investment was not impaired at
December 31, 2017
.
Deposits.
The following table shows information concerning the Company's average deposits by account type and the weighted average nominal rates at which interest was paid on such deposits for the years ended
December 31
:
|
|
2017
|
2016
|
2015
|
|||||||||||||||
|
|
Average
Balance
|
Percent
of Total
Deposits
|
Average
Rate Paid
|
Average
Balance
|
Percent
of Total
Deposits
|
Average
Rate Paid
|
Average
Balance
|
Percent
of Total
Deposits
|
Average
Rate Paid
|
|||||||||
|
|
(Dollars in thousands)
|
|||||||||||||||||
|
Nontime deposits:
|
|
|
|
|
|
|
||||||||||||
|
Noninterest bearing deposits
|
$
|
112,914
|
|
19.0
|
—
|
|
$
|
105,596
|
|
18.7
|
—
|
|
$
|
96,994
|
|
17.8
|
—
|
|
|
Interest bearing checking accounts
|
147,677
|
|
24.9
|
0.14
|
%
|
128,977
|
|
22.8
|
0.09
|
%
|
118,344
|
|
21.7
|
0.08
|
%
|
|||
|
Money market accounts
|
131,008
|
|
22.0
|
0.53
|
%
|
110,938
|
|
19.6
|
0.35
|
%
|
100,128
|
|
18.4
|
0.19
|
%
|
|||
|
Savings accounts
|
98,930
|
|
16.6
|
0.15
|
%
|
93,118
|
|
16.5
|
0.15
|
%
|
87,551
|
|
16.1
|
0.15
|
%
|
|||
|
Total nontime deposits
|
490,529
|
|
82.5
|
0.21
|
%
|
438,629
|
|
77.6
|
0.15
|
%
|
403,017
|
|
74.0
|
0.10
|
%
|
|||
|
Time deposits:
|
||||||||||||||||||
|
Less than $100,000
|
61,787
|
|
10.4
|
0.65
|
%
|
63,720
|
|
11.3
|
0.66
|
%
|
64,254
|
|
11.8
|
0.67
|
%
|
|||
|
$100,000 and over
|
41,976
|
|
7.1
|
0.72
|
%
|
62,528
|
|
11.1
|
0.90
|
%
|
77,327
|
|
14.2
|
1.08
|
%
|
|||
|
Total time deposits
|
103,763
|
|
17.5
|
0.69
|
%
|
126,248
|
|
22.4
|
0.77
|
%
|
141,581
|
|
26.0
|
0.89
|
%
|
|||
|
Total deposits
|
$
|
594,292
|
|
100.0
|
0.30
|
%
|
$
|
564,877
|
|
100.0
|
0.29
|
%
|
$
|
544,598
|
|
100.0
|
0.31
|
%
|
The Company participates in CDARS, which permits the Company to offer full deposit insurance coverage to its customers by exchanging deposit balances with other CDARS participants. CDARS also provides the Company with an additional source of funding and liquidity through the purchase of deposits. There were
$11.5 million
of time deposits of $250,000 or less on the balance
38
sheet at
December 31, 2017
,
$10.9 million
at
December 31, 2016
and
$11.2 million
at
December 31, 2015
, which were exchanged with other CDARS participants and are therefore considered for certain regulatory purposes to be “brokered” deposits. There were
no
purchased CDARS deposits at
December 31, 2017
or
December 31, 2016
.
The Company also participates in the ICS program, a service through which Union can offer its customers a savings product with access to unlimited FDIC insurance, while receiving reciprocal deposits from other banks. Like the exchange of certificate of deposit accounts through CDARS, exchange of savings deposits through ICS provides full deposit insurance coverage for the customer, thereby helping Union to retain the full amount of the deposit on its balance sheet. As with the CDARS program, in addition to reciprocal deposits, participating banks may also purchase one-way ICS deposits. During the third quarter of 2016, Union began offering an ICS money market account to its municipal and commercial customers. Several municipal customers began utilizing this account and as monies in time deposits matured they were placed into these money market accounts. There were
$67.0 million
in ICS money market deposits on the balance sheet at
December 31, 2017
,
$52.6 million
at
December 31, 2016
and
$2.1 million
at
December 31, 2015
. As a result, an increase in the average balance and rate paid on total non-time deposit accounts occurred during the
year ended December 31, 2017
with corresponding decreases in time deposits $100,000 and over. There were
no
purchased ICS deposits at
December 31, 2017
or
December 31, 2016
.
At
December 31, 2017
, there was
$2.0 million
in retail brokered deposits issued under master certificates of deposit to a deposit broker for the purpose of providing a supplemental source of funding and liquidity. These deposits will mature in $1.0 million increments in each of the next two years. There were
$3.0 million
of retail brokered deposits at
December 31, 2016
.
Deposits grew
$49.9 million
, or
8.4%
, from
$597.7 million
at
December 31, 2016
to
$647.6 million
at
December 31, 2017
. Total average deposits grew
$29.4 million
, or
5.2%
, between years with average nontime deposits growing
$51.9 million
, or
11.8%
, and average time deposits decreasing
$22.5 million
, or
17.8%
, during the same time frame. These changes are primarily the result of the third quarter 2016 shift in municipal deposit funds from time deposits to the fully insured ICS money market product.
A provision of the Dodd-Frank Act permanently raised FDIC deposit insurance coverage to $250 thousand per depositor per insured depository institution for each account ownership category. At
December 31, 2017
, the Company had deposit accounts with less than $250 thousand totaling
$478.8 million
, or
73.9%
of its deposits, with FDIC insurance protection. An additional
$3.1 million
of municipal deposits were over the FDIC insurance coverage limit at
December 31, 2017
and were collateralized by Union under applicable state regulations by investment securities or loans.
The following table provides a maturity distribution of the Company’s time deposits in denominations of $100 thousand or more at
December 31
:
|
2017
|
2016
|
|||||||
|
|
(Dollars in thousands)
|
|||||||
|
Three months or less
|
$
|
5,345
|
|
$
|
5,202
|
|
||
|
Over three months through six months
|
9,752
|
|
9,927
|
|
||||
|
Over six months through twelve months
|
13,737
|
|
12,051
|
|
||||
|
Over twelve months
|
12,348
|
|
13,401
|
|
||||
|
|
$
|
41,182
|
|
$
|
40,581
|
|
||
Borrowings.
Advances from the FHLB are another key source of funds to support earning assets. These funds are also used to manage the Bank's interest rate and liquidity risk exposures. The Company's borrowed funds at
December 31, 2017
were comprised of borrowings from the FHLB of
$30.2 million
, at a weighted average rate of
1.42%
, and overnight secured customer repurchase agreement sweeps of
$1.4 million
, at a weighted average rate of
0.25%
. At
December 31, 2016
, borrowed funds were comprised of FHLB advances of
$30.5 million
, at a weighted average rate of 1.42%, and overnight secured customer repurchase agreement sweeps of
$1.1 million
, at a weighted average rate of
0.23%
. The maximum borrowings outstanding on overnight secured customer repurchase agreement sweeps was
$4.9 million
and
$4.4 million
during
2017
and
2016
, respectively. The Company had
no
overnight federal funds purchased on
December 31, 2017
or
2016
. Average borrowings outstanding for
2017
were
$35.2 million
, compared to average borrowings outstanding for
2016
of
$27.6 million
, with the weighted average interest rate on the Company's borrowings dropping from
1.57%
for
2016
to
1.36%
for
2017
.
During 2017, a separate agreement was established with the FHLB where the Company has the authority, up to its available borrowing capacity, to collateralize public unit deposits with letters of credit issued by the FHLB. At
December 31, 2017
, FHLB letters of credit in the amount of
$29.6 million
were utilized as collateral for these deposits. There were
no
FHLB letters of credit utilized as collateral for public unit deposits at
December 31, 2016
.
39
Liability for Pension Benefits.
On October 5, 2012, the Company closed its defined benefit Pension Plan to new participants and froze the accrual of additional retirement benefits for current participants. On October 18, 2017, the Company's Board of Directors voted to terminate Union Bank’s Defined Benefit Pension Plan. In order to settle the liabilities under the Plan, the Company will offer participants the option to receive an annuity purchased from an insurance carrier, a lump-sum cash payment, or a direct rollover into a qualifying retirement plan. An estimated $1.1 million will be contributed to the Plan by the Company during 2018 to cover the lump-sum payments and annuity purchases. The final contribution is subject to a number of factors, including changes in interest rates and the exact proportion of the participants electing a lump-sum distribution versus an annuity. At this time, the Company estimates a $3.2 million reduction in net income will be recorded in the fourth quarter of
2018
as a result of the settlement of Plan assets and liabilities. The Company anticipates completing the transfer of all liabilities and administrative responsibilities under the Plan by December 31, 2018. Once the process is complete, the Company will no longer have any remaining defined benefit pension plan obligations and thus no periodic pension expense.
The Plan net liability increased from
$1.1 million
as of
December 31, 2016
to
$2.3 million
as of
December 31, 2017
, which reflected a $750 thousand contribution to the Plan during
2017
, partially offset by the negative effects of the decrease in the discount rate from
3.99%
in
2016
to
3.52%
in
2017
and to a lesser extent, poorer than expected investment performance experienced during
2017
. Offsetting the pension liability at
December 31, 2017
, the Company had deferred tax assets of $1.3 million, and Accumulated other comprehensive loss, net of tax, of
$4.8 million
. The Accumulated other comprehensive loss has no impact on regulatory capital amounts or ratios or the Company's legal lending limit.
Weighted average assumptions used to determine net periodic pension benefit for the years ended
December 31, 2017
and
2016
were a discount rate of
3.99%
and
4.17%
, respectively, no rate of compensation increase for
2017
or
2016
and an expected long-term rate of return on plan assets of
6.75%
for both years. Note 14 to the consolidated financial statements includes further discussion and information on the Company's employee benefits.
There was no minimum required contribution to the Plan under the ERISA guidelines for
2017
or
2016
.
The Company's defined pension benefit obligation and net periodic benefit cost are actuarially determined based on assumptions regarding the appropriate discount rate, current and expected future return on Plan assets, and anticipated mortality rates. While a change in any of the assumptions would have an impact on the Company's financial condition and future results of operations, a change in the discount rate and future rate of return on Plan assets could be material. A discount rate is used both to determine the present value of future benefit obligations and the net periodic benefit. The expected rate of return on Plan assets is only used to determine net periodic benefit. Termination of the Plan and final settlement of Plan obligations during 2018 will eliminate these inherent uncertainties of pension plan accounting for the Company beginning in 2019.
The
2017
pension benefit obligation discount rate utilized is based on the Plan's expected benefit payment stream utilizing December
2017
benchmark pension liability index yield curve spot rates. The discount rate at
December 31, 2017
was
3.52%
, down from
3.99%
at
December 31, 2016
and reflecting the increase in long-term rates between years.
The investment philosophy for the Plan is to prudently invest Plan assets and future contributions received in a diversified manner that will increase the value of assets to equal or exceed the present value of the liabilities, while controlling volatility within asset allocation guidelines, to grow the Plan funding level such that investment risk can be progressively reduced, and to provide sufficient liquidity to meet anticipated cash needs. The allocation of Plan assets has changed as a result of terminating the Plan. In order to target the termination liability, the plan assets have been redistributed between liability matching assets and cash and cash equivalents. The expected rate of return on plan assets is 6.00% return balanced by our discount rate of
3.52%
.
Commitments, Contingent Liabilities, and Off-Balance-Sheet Arrangements.
The Company is a party to financial instruments with off-balance-sheet risk in the normal course of business to meet the financing needs of its customers, to reduce its own exposure to fluctuations in interest rates, and to implement its strategic objectives. These financial instruments include commitments to extend credit, standby letters of credit, interest rate caps and floors written on adjustable-rate loans, commitments to participate in or sell loans, commitments to buy or sell securities, certificates of deposit or other investment instruments and risk-sharing commitments or guarantees on certain sold loans. Such instruments involve, to varying degrees, elements of credit and interest rate risk in excess of the amount recognized on the balance sheet. The contractual or notional amounts of these instruments reflect the extent of involvement the Company has in a particular class of financial instrument.
The Company's maximum exposure to credit loss in the event of nonperformance by the other party to the financial instrument for commitments to extend credit and standby letters of credit is represented by the contractual notional amount of those instruments. The Company uses the same credit policies in making commitments and conditional obligations as it does for on-balance sheet instruments. For interest rate caps and floors written on adjustable-rate loans, the contractual or notional amounts do not represent the Company’s exposure to credit loss. The Company controls the risk of interest rate cap agreements through credit approvals, limits and monitoring procedures. The Company generally requires collateral or other security to support financial instruments with credit risk.
40
The following table details the contractual or notional amount of financial instruments that represented credit risk at
December 31, 2017
:
|
Contract or Notional Amount
|
|||||||||||||||||||||
|
2018
|
2019
|
2020
|
2021
|
2022
|
Thereafter
|
Total
|
|||||||||||||||
|
|
(Dollars in thousands)
|
||||||||||||||||||||
|
Commitments to originate loans
|
$
|
25,394
|
|
$
|
—
|
|
$
|
—
|
|
$
|
—
|
|
$
|
—
|
|
$
|
—
|
|
$
|
25,394
|
|
|
Unused lines of credit
|
77,837
|
|
7,252
|
|
509
|
|
93
|
|
182
|
|
33
|
|
85,906
|
|
|||||||
|
Standby letters of credit
|
1,780
|
|
205
|
|
54
|
|
—
|
|
25
|
|
—
|
|
2,064
|
|
|||||||
|
Credit card arrangement
|
1,326
|
|
—
|
|
—
|
|
—
|
|
—
|
|
—
|
|
1,326
|
|
|||||||
|
FHLB MPF credit
enhancement obligation, net
|
640
|
|
—
|
|
—
|
|
—
|
|
—
|
|
—
|
|
640
|
|
|||||||
|
Commitment to purchase
investment in a real estate
limited partnership
|
1,068
|
|
402
|
|
—
|
|
—
|
|
—
|
|
—
|
|
1,470
|
|
|||||||
|
Contract commitment for renovation
project
|
662
|
|
—
|
|
—
|
|
—
|
|
—
|
|
—
|
|
662
|
|
|||||||
|
Total
|
$
|
108,707
|
|
$
|
7,859
|
|
$
|
563
|
|
$
|
93
|
|
$
|
207
|
|
$
|
33
|
|
$
|
117,462
|
|
Commitments to originate loans are agreements to lend to a customer as long as there is no violation of any condition established in the contract. Commitments generally have a fixed expiration date or other termination clause and may require payment of a fee. The unused lines of credit total includes
$11.1 million
of lines available under the overdraft privilege program and is included in the 2018 funding period. Approximately
$20.5 million
of the unused lines of credit relate to real estate construction loans that are expected to fund within the next twelve months. The remaining lines primarily relate to revolving lines of credit for other real estate or commercial loans. Since many of the loan commitments are expected to expire without being drawn upon and not all credit lines will be utilized, the total commitment amounts do not necessarily represent future cash requirements. Lines of credit incur seasonal volume fluctuations due to the nature of some customers' businesses, such as tourism and maple syrup products production.
Unused lines of credit
increased
$9.4 million
, or
12.2%
, from
$76.5 million
at
December 31, 2016
to
$85.9 million
at
December 31, 2017
. Some of the larger lines have underlying participation agreements in place with other financial institutions in order to permit the Company to support the credit needs of larger dollar borrowers without bearing all the credit risk in the Company's balance sheet. Commitments to originate loans
decreased
$6.0 million
, or
19.1%
, from
$31.4 million
at
December 31, 2016
to
$25.4 million
at
December 31, 2017
.
The Company may, from time-to-time, enter into commitments to purchase, participate or sell loans, securities, certificates of deposit, or other investment instruments which involve market and interest rate risk. At
December 31, 2017
, the Company had binding loan commitments to sell residential mortgage loans at fixed rates totaling
$4.2 million
.
The Company sells 1-4 family residential mortgage loans under the MPF loss-sharing program with FHLB, when management believes it is economically advantageous to do so. Under this program the Company shares in the credit risk of each mortgage, while receiving fee income in return. The Company is responsible for a Credit Enhancement Obligation based on the credit quality of these loans. FHLB funds a first loss account based on the Company's outstanding MPF mortgage balances. This creates a laddered approach to sharing in any losses. In the event of default, homeowner's equity and private mortgage insurance, if any, are the first sources of repayment; the FHLB first loss account funds are then utilized, followed by the member's Credit Enhancement Obligation, with the balance the responsibility of FHLB. These loans must meet specific underwriting standards of the FHLB. As of
December 31, 2017
, the Company had
$28.1 million
in loans sold through the MPF program with an outstanding balance of
$14.7 million
and a contract for the potential delivery of an additional $8.9 million of future loan sales. The volume of loans sold to the MPF program and the corresponding Credit Enhancement Obligation are closely monitored by management. As of
December 31, 2017
, the notional amount of the maximum contingent contractual liability related to this program was
$665 thousand
, of which
$25 thousand
was recorded as a reserve through Other liabilities. Since inception of the Company's MPF participation in 2015, the Company has not experienced any losses under this program.
41
Contractual Obligations.
The Company and Union have various financial obligations, including contractual obligations that may require future cash payments. The following table presents, as of
December 31, 2017
, significant fixed and determinable contractual obligations to third parties by payment date:
|
|
Payments Due By Period
|
||||||||||||||
|
|
Less than
1 year
|
2 & 3 years
|
4 & 5 years
|
Thereafter
|
Total
|
||||||||||
|
|
(Dollars in thousands)
|
||||||||||||||
|
Operating lease commitments
|
$
|
134
|
|
$
|
151
|
|
$
|
64
|
|
$
|
—
|
|
$
|
349
|
|
|
Contractual payments on borrowed funds (1)
|
21,130
|
|
10,287
|
|
164
|
|
—
|
|
31,581
|
|
|||||
|
Deposits without stated maturity (1) (2)
|
546,445
|
|
—
|
|
—
|
|
—
|
|
546,445
|
|
|||||
|
Certificates of deposit (1) (2) (3)
|
62,544
|
|
28,419
|
|
10,166
|
|
—
|
|
101,129
|
|
|||||
|
Deferred compensation payouts (4)
|
194
|
|
83
|
|
90
|
|
227
|
|
594
|
|
|||||
|
Total
|
$
|
630,447
|
|
$
|
38,940
|
|
$
|
10,484
|
|
$
|
227
|
|
$
|
680,098
|
|
____________________
|
(1)
|
The amounts exclude interest payable, as such amounts other than
$97 thousand
in accrued interest payable at
December 31, 2017
are not able to be estimated at this time.
|
|
(2)
|
While Union has a contractual obligation to depositors should they wish to withdraw all or some of the funds on deposit, management believes, based on historical analysis as well as current conditions in the financial markets, that the majority of these deposits will remain on deposit for the foreseeable future.
|
|
(3)
|
The amounts include
$2.0 million
in retail brokered deposits issued under master certificates of deposit to a deposit broker. These deposits mature in $1.0 million increments in each of the next two years.
|
|
(4)
|
The amounts exclude $456 thousand in benefit payments, where the payment period begins at the individual's retirement which is not determinable at this time.
|
Union is required (as are all banks) to maintain vault cash or a noninterest bearing reserve balance as established by Federal Reserve regulations. The Bank’s average total required reserve for the 14 day maintenance period that included
December 31, 2017
was
$1.4 million
, which was satisfied by vault cash.
Liquidity
.
Liquidity is a measurement of the Company’s ability to meet potential cash requirements, including ongoing commitments to fund deposit withdrawals, repay borrowings, fund investment and lending activities, and for other general business
purposes. The primary objective of liquidity management is to maintain a balance between sources and uses of funds to meet our
cash flow needs in the most economical and expedient manner. The Company’s principal sources of funds are deposits; amortization,
prepayment and maturity of loans, investment securities, interest bearing deposits and other short-term investments; sales of securities and loans AFS; earnings; and funds provided from operations. Contractual principal repayments on loans are a relatively predictable source of funds; however, deposit flows and loan and investment prepayments can be significantly influenced by market interest rates, economic conditions, and rates offered by our competitors. Managing liquidity risk is essential to maintaining both depositor confidence and earnings stability.
At
December 31, 2017
, Union, as a member of FHLB, had access to unused lines of credit of
$39.8 million
, over and above the
$60.8 million
in borrowings and other credit subject to collateralization, with the purchase of required FHLB Class B common stock and evaluation by the FHLB of the underlying collateral available. This line of credit can be used for either short or long-term liquidity or other needs.
Union also maintains an IDEAL Way Line of Credit with the FHLB. The total line available was $551 thousand at
December 31, 2017
. There were no borrowings against this line of credit as of such date. Interest on these borrowings is chargeable at a rate determined by the FHLB and payable monthly. Should Union utilize this line of credit, qualified portions of the loan and investment portfolios would collateralize these borrowings.
In addition to its borrowing arrangements with the FHLB, Union maintains a pre-approved federal funds line of credit totaling $10.0 million with an upstream correspondent bank and one-way buy options with CDARS and ICS as well as access to the FRB discount window, which would require pledging of qualified assets. Core deposits are the lowest cost of funds the Company has access to but these deposits may not be sufficient to cover the on balance sheet liquidity needs which makes using these other sources necessary. In an attempt to control the cost of these other funding sources, an agreement was entered into with Promontory Interfinancial Network that locks in the cost of funds on purchased ICS deposits at 10 basis points over the federal funds rate for a period of one year. At
December 31, 2017
there were
no
purchased ICS deposits under this agreement,
no
purchased CDARS deposits, and no outstanding advances on the federal funds line or at the discount window.
Union's investment and residential loan portfolios provide a significant amount of contingent liquidity that could be accessed in a reasonable time period through sales of those portfolios. We also have additional contingent liquidity sources with access to the
42
brokered deposit market and the FRB discount window. These sources are considered as liquidity alternatives in our contingent liquidity plan. At
December 31, 2017
, there was
$2.0 million
in retail brokered deposits issued under master certificates of deposit to a deposit broker. Management believes the Company has sufficient liquidity to meet all reasonable borrower, depositor, and creditor needs in the present economic environment. However, any projections of future cash needs and flows are subject to substantial uncertainty, including factors outside the Company's control.
Capital Resources
.
Capital management is designed to maintain an optimum level of capital in a cost-effective structure that meets target regulatory ratios, supports management’s internal assessment of economic capital, funds the Company’s business strategies and builds long-term stockholder value. Dividends are generally in line with long-term trends in earnings per share and conservative earnings projections, while sufficient profits are retained to support anticipated business growth, fund strategic investments, maintain required regulatory capital levels and provide continued support for deposits. The Company and Union continue to satisfy all capital adequacy requirements to which they are subject and Union is considered well capitalized under the Prompt Corrective Action framework. The Company continues to evaluate growth opportunities both through internal growth or potential acquisitions. The dividend payouts and stock repurchases during the last few years reflect the Board’s desire to utilize our capital for the benefit of the stockholders.
Stockholders’ equity increased from
$56.3 million
at
December 31, 2016
to
$58.7 million
at
December 31, 2017
, reflecting net income of
$8.4 million
for
2017
, an increase of
$104 thousand
from stock based compensation, a
$25 thousand
increase due to the issuance of common stock under the DRIP and a
$19 thousand
increase due to the issuance of
1,000
shares of common stock resulting from the exercise of incentive stock options. These increases were partially offset by cash dividends paid of
$5.2 million
, a net decrease in accumulated OCI of
$979 thousand
attributable to the unfunded pension liability and investment securities AFS, and stock repurchases of
$60 thousand
.
The Company has 7,500,000 shares of $2.00 par value common stock authorized. As of
December 31, 2017
, the Company had
4,940,961
shares issued, of which
4,465,576
were outstanding and
475,385
were held in treasury. Effective May 21, 2014 upon approval by the stockholders, the Company adopted the 2014 Equity Plan which replaced the 2008 ISO Plan. As of
December 31, 2017
, there were outstanding employee incentive stock options with respect to
3,000
shares granted under the 2008 ISO Plan, all of which were exercisable, and outstanding employee incentive stock options with respect to
4,500
shares granted under the 2014 Equity Plan, all of which were exercisable. Also, as of
December 31, 2017
, there were outstanding RSUs with respect to 730 shares granted in
2015
and RSUs with respect to 2,026 shares granted in
2016
as to which vesting requirements had not yet been met.
In January 2018, the Company's Board reauthorized the limited stock repurchase plan that was established in May of 2010. The limited stock repurchase plan allows the repurchase of up to a fixed number of shares of the Company's common stock each calendar quarter in open market purchases or privately negotiated transactions, as management may deem advisable and as market conditions may warrant. The repurchase authorization for a calendar quarter expires at the end of that quarter to the extent it has not been exercised, and is not carried forward into future quarters. The quarterly repurchase program expired on
December 31, 2017
, and was reauthorized in January 2018 for another year, with
2,500
shares authorized for repurchase per quarter. During
2017
, the Company repurchased
1,430
shares under the program at a total cost of
$60 thousand
. Since inception, as of
December 31, 2017
, the Company had repurchased
15,184
shares under this program, for a total cost of
$351 thousand
.
During 2016, the Company adopted the DRIP whereby registered stockholders may elect to reinvest cash dividends and optional cash contributions to purchase additional shares of the Company's common stock. The Company has reserved 200,000 shares of its common stock for issuance and sale under the DRIP. As of
December 31, 2017
,
877
shares of stock had been issued from treasury stock since inception of the DRIP, including
562
shares in
2017
.
The Company's total capital to risk weighted assets increased to
13.7%
at
December 31, 2017
, from
13.3%
at
December 31, 2016
. Tier I capital to risk weighted assets increased to
12.6%
at
December 31, 2017
, from
12.2%
at
December 31, 2016
and Tier I capital to average assets increased to
8.5%
at
December 31, 2017
from
8.4%
at
December 31, 2016
. Union is categorized as well capitalized under the Prompt Corrective Action regulatory framework and the Company is well over the minimum capital adequacy requirements. The Company's
December 31, 2017
capital adequacy was determined based on the BASEL III requirements, which took effect on January 1, 2015 and will be fully phased in on January 1, 2019. The Company's evaluation indicates it would satisfy all capital adequacy requirements as fully phased in. See Note 21 for additional discussion of BASEL III. The Company remains focused on long-term growth and above-average shareholder return. It has become more important than ever in today's economic environment for banks to ensure and plan ahead to maintain strong capital reserves.
Regulatory Matters.
The Company and Union are subject to periodic examinations by the various regulatory agencies. These examinations include, but are not limited to, procedures designed to review lending practices, risk management, credit quality, liquidity, compliance and capital adequacy. In May of 2017, the FDIC performed its regular, periodic safety and soundness examination of Union. In February of 2017, the FDIC performed its regular periodic compliance examination of Union. In September of 2017, the FRB performed its regular, periodic examination of the Company. During 2015, the Vermont Department
43
of Financial Regulation performed a regular safety and soundness examination of Union. No comments were received that would have a material adverse effect on the Company’s or Union’s liquidity, financial position, capital resources, or results of operations.
Market Risk and Interest Rate Risk
.
Market risk is the potential of loss in a financial instrument arising from adverse changes in market prices, interest rates, foreign currency exchange rates, commodity prices, and equity prices. The Company did not have any trading securities during
2017
and
2016
. The Company’s market risk arises primarily from interest rate risk inherent in its lending, investing, deposit taking and borrowing activities. Management of interest rate risk is an important component of our asset and liability management process, which is governed by established policies that are reviewed and approved annually. Our investment policy details the types of securities that may be purchased, and establishes portfolio limits and maturity limits for the various sectors. Our investment policy also establishes specific investment quality limits. The ALCO develops guidelines and strategies impacting our asset and liability management-related activities based upon estimated market risk sensitivity, policy limits and overall market interest rate levels and trends. Members of the ALCO also manage the investment portfolio to maximize net interest income while mitigating market and interest rate risk.
Interest rate risk arises naturally from imbalances in repricing, maturity and cash flow characteristics of our assets and liabilities. The ALCO takes into consideration the cash flow and repricing attributes of balance sheet and off-balance sheet items and their relation to possible changes in interest rates. The ALCO manages interest rate exposure primarily by using on-balance sheet strategies, generally accomplished through the management of the duration, rate sensitivity and average lives of our various investments, and by extending or shortening maturities of borrowed funds, as well as carefully managing and monitoring the maturities and pricing of loans and deposits.
An outside consultant is utilized to perform rate shocks of our balance sheet to assess our risk to earnings in different interest rate
environments, and to perform a variety of other analyses. The consultant’s most recent analysis was as of
December 31, 2017
. The base simulation assumed no changes in rates, as well as 200 and 300 basis point rising interest rate scenarios which assume a parallel shift of the yield curve over a one-year period, and no growth assumptions. A summary of the results is as follows:
|
•
|
Current/Flat Rates: If rates remain at current levels net interest income is projected to trend sideways for the entire simulation as declining asset yields are similarly offset by reductions to funding costs.
|
|
•
|
Rising Rates: Higher rates indicate positive results under all scenarios. Under the rising rate scenarios if rates rise in a parallel fashion, net interest income is expected to trend close to the base case scenario over the near term as higher funding costs match increasing asset yields. Once funding cost increases stabilize, net interest income is projected to increase for the duration of the simulation as assets reprice at higher rates and investment and loan cash flow continues to cycle into the elevated environment. The timing of recovery will depend on the slope and shape of the yield curve as rates rise.
|
The net interest income simulation as of
December 31, 2017
showed that the change in net interest income for the next 12 months from our expected or “most likely” forecast was as follows:
|
Rate Change
|
Percent Change in Net Interest Income Limit
|
Percent Change in Net Interest Income
|
|||||
|
Up 300 basis points
|
(21.00
|
)%
|
13.30
|
%
|
|||
|
Up 200 basis points
|
(14.00
|
)%
|
9.50
|
%
|
|||
The preceding sensitivity analysis does not represent our forecast and should not be relied upon as being indicative of expected
operating results. These estimates are based upon numerous assumptions including, among others, the nature and timing of interest rate levels including yield curve shape, prepayments on loans and securities, deposit run-off rates, pricing decisions on loans and deposits and reinvestment/replacement of asset and liability cash flows. While assumptions are developed based upon current economic and local market conditions, we cannot make any assurances as to the predictive nature of these assumptions including how customer preferences or competitor influences might change.
The model used to perform the base case balance sheet simulation assumes a parallel shift of the yield curve over twelve months
and reprices every interest earning asset and interest bearing liability on our balance sheet, simultaneously. The use of pricing betas help simulate the expected pricing behavior regarding non-maturing deposits, limiting the rate increases that occur when market rates rise. Investment securities with call provisions are examined on an individual basis to estimate the likelihood of a call.
As market conditions vary from those assumed in the sensitivity analysis, actual results will likely differ due to: the varying impact
of changes in the balances and mix of loans and deposits differing from those assumed, the impact of possible off balance sheet commitments, and other internal/external variables. Furthermore, the sensitivity analysis does not reflect all actions that the ALCO
might take in responding to or anticipating changes in interest rates.
44
Interest Rate Sensitivity "Gap" Analysis
.
An interest rate sensitivity "gap" is defined as the difference between interest earning assets and interest bearing liabilities maturing or repricing within a given time period. A gap is considered positive when the amount of interest rate sensitive assets exceeds the amount of interest rate sensitive liabilities. A gap is considered negative when the amount of interest rate sensitive liabilities exceeds the amount of interest rate sensitive assets. During a period of rising interest rates, a negative gap would tend to adversely affect net interest income, while a positive gap would tend to result in an increase in net interest income. During a period of falling interest rates, a negative gap would tend to result in an increase in net interest income, while a positive gap would tend to affect net interest income adversely. Because different types of assets and liabilities with the same or similar maturities may react differently to changes in overall market interest rates or conditions, changes in interest rates may affect net interest income positively or negatively even if an institution were perfectly matched in each maturity category.
The Company prepares its interest rate sensitivity “gap” analysis by scheduling interest earning assets and interest bearing liabilities into periods based upon the next date on which such assets and liabilities could mature or reprice. The amount of assets and liabilities shown within a particular period was determined in accordance with the contractual terms of the assets and liabilities, except that:
|
•
|
adjustable-rate loans, investment securities, variable rate interest bearing deposits in banks, variable-rate time deposits, FHLB advances and other secured borrowings are included in the period when they are first scheduled to adjust and not in the period in which they mature;
|
|
•
|
fixed-rate mortgage-related securities and residential loans reflect estimated prepayments, which were estimated based on analyses of broker estimates, the results of a prepayment model utilized by the Company, and empirical data;
|
|
•
|
other nonmortgage related fixed-rate loans reflect scheduled contractual amortization, with no estimated prepayments; and
|
|
•
|
interest bearing checking, money market and savings deposits, which do not have contractual maturities, reflect estimated levels of attrition, which are based on detailed studies by the Company of the sensitivity of each such category of deposit to changes in interest rates.
|
Management believes that these assumptions approximate actual experience and considers them reasonable. However, the interest rate sensitivity of the Company’s assets and liabilities in the following table could vary substantially if different assumptions were used, callable investment options were modeled, prepayment speeds changed or actual experience differs from the historical experience on which the assumptions are based.
The following table shows the Company's rate sensitivity analysis as of
December 31, 2017
:
|
|
Cumulative repriced within
|
|||||||||||||||||
|
|
3 Months
or Less
|
4 to 12
Months
|
1 to 3
Years
|
3 to 5
Years
|
Over 5
Years
|
Total
|
||||||||||||
|
Interest sensitive assets:
|
(Dollars in thousands, by repricing date)
|
|||||||||||||||||
|
Overnight deposits
|
$
|
34,651
|
|
$
|
—
|
|
$
|
—
|
|
$
|
—
|
|
$
|
—
|
|
$
|
34,651
|
|
|
Interest bearing deposits in banks
|
1,494
|
|
1,543
|
|
3,485
|
|
2,490
|
|
340
|
|
9,352
|
|
||||||
|
Investment securities (1)(3)
|
8,777
|
|
3,122
|
|
13,020
|
|
11,760
|
|
29,239
|
|
65,918
|
|
||||||
|
Nonmarketable securities
|
—
|
|
—
|
|
—
|
|
—
|
|
2,331
|
|
2,331
|
|
||||||
|
Loans and loans held for sale (2)(3)
|
159,036
|
|
141,092
|
|
148,187
|
|
79,355
|
|
67,687
|
|
595,357
|
|
||||||
|
Total interest sensitive assets
|
$
|
203,958
|
|
$
|
145,757
|
|
$
|
164,692
|
|
$
|
93,605
|
|
$
|
99,597
|
|
$
|
707,609
|
|
|
Interest sensitive liabilities:
|
||||||||||||||||||
|
Time deposits
|
$
|
14,918
|
|
$
|
47,860
|
|
$
|
28,184
|
|
$
|
10,167
|
|
$
|
—
|
|
$
|
101,129
|
|
|
Money markets
|
154,256
|
|
—
|
|
—
|
|
—
|
|
—
|
|
154,256
|
|
||||||
|
Regular savings
|
—
|
|
—
|
|
—
|
|
—
|
|
101,369
|
|
101,369
|
|
||||||
|
Interest bearing checking
|
50,440
|
|
—
|
|
—
|
|
—
|
|
112,556
|
|
162,996
|
|
||||||
|
Borrowed funds
|
20,182
|
|
947
|
|
10,288
|
|
164
|
|
—
|
|
31,581
|
|
||||||
|
Total interest sensitive liabilities
|
$
|
239,796
|
|
$
|
48,807
|
|
$
|
38,472
|
|
$
|
10,331
|
|
$
|
213,925
|
|
$
|
551,331
|
|
|
Net interest rate sensitivity gap
|
$
|
(35,838
|
)
|
$
|
96,950
|
|
$
|
126,220
|
|
$
|
83,274
|
|
$
|
(114,328
|
)
|
$
|
156,278
|
|
|
Cumulative net interest rate sensitivity gap
|
$
|
(35,838
|
)
|
$
|
61,112
|
|
$
|
187,332
|
|
$
|
270,606
|
|
$
|
156,278
|
|
|||
|
Cumulative net interest rate sensitivity gap as
a percentage of total assets
|
(4.8
|
)%
|
8.2
|
%
|
25.1
|
%
|
36.3
|
%
|
21.0
|
%
|
||||||||
|
Cumulative net interest rate sensitivity gap as
a percentage of total interest sensitive assets
|
(5.1
|
)%
|
8.6
|
%
|
26.5
|
%
|
38.2
|
%
|
22.1
|
%
|
||||||||
|
Cumulative net interest rate sensitivity gap as
a percentage of total interest sensitive liabilities
|
(6.5
|
)%
|
11.1
|
%
|
34.0
|
%
|
49.1
|
%
|
28.3
|
%
|
||||||||
45
____________________
|
(1)
|
Investment securities exclude mutual funds with a fair value of
$521 thousand
at
December 31, 2017
that may be sold by the Company at any time.
|
|
(2)
|
Balances shown include deferred unamortized loan costs of
$795 thousand
.
|
|
(3)
|
Reflects estimated repayment assumptions considered in Asset/Liability model.
|
Impact of Inflation and Changing Prices.
The Company's consolidated financial statements have been prepared in accordance with GAAP, which allows for the measurement of financial position and results of operations in terms of historical dollars, without considering changes in the relative purchasing power of money over time due to inflation. Banks have asset and liability structures that are essentially monetary in nature, and their general and administrative costs constitute relatively small percentages of total expenses. Thus, increases in the general price levels for goods and services have a relatively minor effect on the Company's total expenses but could have an impact on our loan customers' financial condition. Interest rates have a more significant impact on the Company's financial performance than the effect of general inflation. The target federal funds rate has increased five times since December 2015, which has resulted in an increase in the U.S prime rate to 4.50% as of
December 31, 2017
. These increases in rates have had a positive impact on the Company's net interest income
for the years ended December 31, 2017
. The FRB has not stated rates would increase in 2018 but comments suggest increases throughout 2018 could occur. Through
December 31, 2017
the increase in the target federal funds rate have not had a direct impact on the rates paid on customer deposit accounts. Further increases in the target federal funds rate in 2018 may result in the need to increase rates paid on deposit accounts in order to remain competitive in the market place. These market rates are out of the Company's control but have a dramatic impact on net interest income. For further details on the impact rising rates could have on the Company's net interest income see
Market Risk and Interest Rate Risk
above.
Interest rates do not necessarily move in the same direction or change in the same magnitude as the prices of goods and services, although periods of increased inflation may accompany a rising interest rate environment. Inflation in the price of goods and services, while not having a substantial impact on the operating results of the Company, does affect all customers and therefore may impact their ability to keep funds on deposit or make timely loan payments. The Company is aware of and evaluates this risk along with others in making business decisions. Unprecedented deficit spending by federal, state and local governments and control of the money supply by the FRB including further quantitative easing of the money supply, may have unanticipated impacts on interest rates or inflation in future periods that could have an unfavorable impact on the future operating results of the Company.
46
UNIO
N B
ANKSHARES, INC. AND SUBSIDIARY
December 31, 2017
and
2016
|
2017
|
2016
|
|||||
|
Assets
|
(Dollars in thousands)
|
|||||
|
Cash and due from banks
|
$
|
3,857
|
|
$
|
4,272
|
|
|
Federal funds sold and overnight deposits
|
34,651
|
|
35,003
|
|
||
|
Cash and cash equivalents
|
38,508
|
|
39,275
|
|
||
|
Interest bearing deposits in banks
|
9,352
|
|
9,504
|
|
||
|
Investment securities available-for-sale
|
65,439
|
|
65,556
|
|
||
|
Investment securities held-to-maturity (fair value $999 thousand at December 31, 2017 and December 31, 2016)
|
1,000
|
|
999
|
|
||
|
Loans held for sale
|
7,947
|
|
7,803
|
|
||
|
Loans
|
586,615
|
|
533,290
|
|
||
|
Allowance for loan losses
|
(5,408
|
)
|
(5,247
|
)
|
||
|
Net deferred loan costs
|
795
|
|
649
|
|
||
|
Net loans
|
582,002
|
|
528,692
|
|
||
|
Accrued interest receivable
|
2,500
|
|
2,259
|
|
||
|
Premises and equipment, net
|
14,255
|
|
13,525
|
|
||
|
Core deposit intangible
|
583
|
|
754
|
|
||
|
Goodwill
|
2,223
|
|
2,223
|
|
||
|
Investment in real estate limited partnerships
|
3,166
|
|
2,783
|
|
||
|
Company-owned life insurance
|
8,861
|
|
8,617
|
|
||
|
Other assets
|
9,995
|
|
9,391
|
|
||
|
Total assets
|
$
|
745,831
|
|
$
|
691,381
|
|
|
Liabilities and Stockholders’ Equity
|
||||||
|
Liabilities
|
|
|||||
|
Deposits
|
|
|||||
|
Noninterest bearing
|
$
|
127,824
|
|
$
|
112,384
|
|
|
Interest bearing
|
418,621
|
|
382,083
|
|
||
|
Time
|
101,129
|
|
103,193
|
|
||
|
Total deposits
|
647,574
|
|
597,660
|
|
||
|
Borrowed funds
|
31,581
|
|
31,595
|
|
||
|
Accrued interest and other liabilities
|
8,015
|
|
5,847
|
|
||
|
Total liabilities
|
687,170
|
|
635,102
|
|
||
|
Commitments and Contingencies (Notes 8, 14, 15, 17, 18 and 21)
|
|
|
||||
|
Stockholders’ Equity
|
||||||
|
Common stock, $2.00 par value; 7,500,000 shares authorized; 4,940,961 shares
issued at December 31, 2017 and 4,936,652 shares issued at December 31, 2016
|
9,882
|
|
9,874
|
|
||
|
Additional-paid-in capital
|
755
|
|
620
|
|
||
|
Retained earnings
|
57,197
|
|
53,086
|
|
||
|
Treasury stock at cost; 475,385 shares at December 31, 2017
and 474,517 shares at December 31, 2016
|
(4,077
|
)
|
(4,022
|
)
|
||
|
Accumulated other comprehensive loss
|
(5,096
|
)
|
(3,279
|
)
|
||
|
Total stockholders' equity
|
58,661
|
|
56,279
|
|
||
|
Total liabilities and stockholders' equity
|
$
|
745,831
|
|
$
|
691,381
|
|
See accompanying notes to consolidated financial statements.
47
UNION BANKSHARES, INC. AND SUBSIDIARY
Years Ended
December 31, 2017
,
2016
and
2015
|
|
2017
|
2016
|
2015
|
||||||
|
Interest and dividend income
|
(Dollars in thousands, except per share data)
|
||||||||
|
Interest and fees on loans
|
$
|
26,978
|
|
$
|
25,056
|
|
$
|
23,531
|
|
|
Interest on debt securities:
|
|||||||||
|
Taxable
|
977
|
|
885
|
|
950
|
|
|||
|
Tax exempt
|
634
|
|
589
|
|
436
|
|
|||
|
Dividends
|
167
|
|
95
|
|
43
|
|
|||
|
Interest on federal funds sold and overnight deposits
|
114
|
|
51
|
|
15
|
|
|||
|
Interest on interest bearing deposits in banks
|
147
|
|
160
|
|
169
|
|
|||
|
Total interest and dividend income
|
29,017
|
|
26,836
|
|
25,144
|
|
|||
|
Interest expense
|
|||||||||
|
Interest on deposits
|
1,771
|
|
1,622
|
|
1,682
|
|
|||
|
Interest on short-term borrowed funds
|
12
|
|
8
|
|
9
|
|
|||
|
Interest on long-term borrowed funds
|
472
|
|
431
|
|
334
|
|
|||
|
Total interest expense
|
2,255
|
|
2,061
|
|
2,025
|
|
|||
|
Net interest income
|
26,762
|
|
24,775
|
|
23,119
|
|
|||
|
Provision for loan losses
|
200
|
|
150
|
|
550
|
|
|||
|
Net interest income after provision for loan losses
|
26,562
|
|
24,625
|
|
22,569
|
|
|||
|
Noninterest income
|
|||||||||
|
Trust income
|
739
|
|
737
|
|
719
|
|
|||
|
Service fees
|
5,951
|
|
5,871
|
|
5,568
|
|
|||
|
Net gains on sales of investment securities available-for-sale
|
17
|
|
71
|
|
53
|
|
|||
|
Net gains on sales of loans held for sale
|
2,303
|
|
2,898
|
|
2,871
|
|
|||
|
Other income
|
385
|
|
563
|
|
581
|
|
|||
|
Total noninterest income
|
9,395
|
|
10,140
|
|
9,792
|
|
|||
|
Noninterest expenses
|
|||||||||
|
Salaries and wages
|
10,257
|
|
10,203
|
|
9,517
|
|
|||
|
Pension and other employee benefits
|
3,708
|
|
3,525
|
|
2,977
|
|
|||
|
Occupancy expense, net
|
1,415
|
|
1,263
|
|
1,279
|
|
|||
|
Equipment expense
|
2,208
|
|
2,115
|
|
1,875
|
|
|||
|
Other expenses
|
6,317
|
|
6,550
|
|
6,172
|
|
|||
|
Total noninterest expenses
|
23,905
|
|
23,656
|
|
21,820
|
|
|||
|
Income before provision for income taxes
|
12,052
|
|
11,109
|
|
10,541
|
|
|||
|
Provision for income taxes
|
3,603
|
|
2,598
|
|
2,663
|
|
|||
|
Net income
|
$
|
8,449
|
|
$
|
8,511
|
|
$
|
7,878
|
|
|
Earnings per common share
|
$
|
1.89
|
|
$
|
1.91
|
|
$
|
1.77
|
|
|
Dividends per common share
|
$
|
1.16
|
|
$
|
1.11
|
|
$
|
1.08
|
|
See accompanying notes to consolidated financial statements.
48
UNION BANKSHARES, INC. AND SUBSIDIARY
CONSOLIDATED STATEMENTS OF COMPREHENSIVE INCOME
Years Ended
December 31, 2017
,
2016
and
2015
|
2017
|
2016
|
2015
|
|||||||
|
(Dollars in thousands)
|
|||||||||
|
Net income
|
$
|
8,449
|
|
$
|
8,511
|
|
$
|
7,878
|
|
|
Other comprehensive loss, net of tax:
|
|||||||||
|
Investment securities available-for-sale:
|
|||||||||
|
Net unrealized holding gains (losses) arising during the year on investment securities available-for-sale
|
423
|
|
(590
|
)
|
(184
|
)
|
|||
|
Reclassification adjustment for net gains on investment securities available-for-sale realized in net income
|
(11
|
)
|
(47
|
)
|
(35
|
)
|
|||
|
Total
|
412
|
|
(637
|
)
|
(219
|
)
|
|||
|
Defined benefit pension plan:
|
|||||||||
|
Net actuarial loss arising during the year
|
(1,525
|
)
|
(449
|
)
|
(740
|
)
|
|||
|
Reclassification adjustment for amortization of net actuarial loss realized in net income
|
134
|
|
109
|
|
37
|
|
|||
|
Total
|
(1,391
|
)
|
(340
|
)
|
(703
|
)
|
|||
|
Total other comprehensive loss
|
(979
|
)
|
(977
|
)
|
(922
|
)
|
|||
|
Total comprehensive income
|
$
|
7,470
|
|
$
|
7,534
|
|
$
|
6,956
|
|
See accompanying notes to consolidated financial statements.
49
UNION BANKSHARES, INC. AND SUBSIDIARY
CONSOLIDATED STATEMENTS OF CHANGES IN STOCKHOLDERS' EQUITY
Years Ended
December 31, 2017
,
2016
and
2015
|
|
Common Stock
|
|
|
|
|
|||||||||||||||
|
|
Shares,
net of
treasury
|
Amount
|
Additional
paid-in
capital
|
Retained
earnings
|
Treasury
stock
|
Accumulated
other
comprehensive
loss
|
Total
stockholders’
equity
|
|||||||||||||
|
|
(Dollars in thousands, except per share data)
|
|||||||||||||||||||
|
Balances, December 31, 2014
|
4,458,430
|
|
$
|
9,859
|
|
$
|
418
|
|
$
|
46,462
|
|
$
|
(3,925
|
)
|
$
|
(1,380
|
)
|
$
|
51,434
|
|
|
Net income
|
—
|
|
—
|
|
—
|
|
7,878
|
|
—
|
|
—
|
|
7,878
|
|
||||||
|
Other comprehensive loss
|
—
|
|
—
|
|
—
|
|
—
|
|
—
|
|
(922
|
)
|
(922
|
)
|
||||||
|
Cash dividends declared
($1.08 per share)
|
—
|
|
—
|
|
—
|
|
(4,816
|
)
|
—
|
|
—
|
|
(4,816
|
)
|
||||||
|
Stock based compensation
expense
|
—
|
|
—
|
|
35
|
|
—
|
|
—
|
|
—
|
|
35
|
|
||||||
|
Exercise of stock options
|
2,500
|
|
5
|
|
48
|
|
—
|
|
—
|
|
—
|
|
53
|
|
||||||
|
Purchase of treasury stock
|
(3,753
|
)
|
—
|
|
—
|
|
—
|
|
(94
|
)
|
—
|
|
(94
|
)
|
||||||
|
Balances, December 31, 2015
|
4,457,177
|
|
9,864
|
|
501
|
|
49,524
|
|
(4,019
|
)
|
(2,302
|
)
|
53,568
|
|
||||||
|
Net income
|
—
|
|
—
|
|
—
|
|
8,511
|
|
—
|
|
—
|
|
8,511
|
|
||||||
|
Other comprehensive loss
|
—
|
|
—
|
|
—
|
|
—
|
|
—
|
|
(977
|
)
|
(977
|
)
|
||||||
|
Dividend reinvestment plan
|
315
|
|
—
|
|
7
|
|
—
|
|
3
|
|
—
|
|
10
|
|
||||||
|
Cash dividends declared
($1.11 per share)
|
—
|
|
—
|
|
—
|
|
(4,949
|
)
|
—
|
|
—
|
|
(4,949
|
)
|
||||||
|
Stock based compensation
expense
|
2,356
|
|
5
|
|
61
|
|
—
|
|
—
|
|
—
|
|
66
|
|
||||||
|
Exercise of stock options
|
2,500
|
|
5
|
|
51
|
|
—
|
|
—
|
|
—
|
|
56
|
|
||||||
|
Purchase of treasury stock
|
(213
|
)
|
—
|
|
—
|
|
—
|
|
(6
|
)
|
—
|
|
(6
|
)
|
||||||
|
Balances, December 31, 2016
|
4,462,135
|
|
9,874
|
|
620
|
|
53,086
|
|
(4,022
|
)
|
(3,279
|
)
|
56,279
|
|
||||||
|
Net income
|
—
|
|
—
|
|
—
|
|
8,449
|
|
—
|
|
—
|
|
8,449
|
|
||||||
|
Other comprehensive loss
|
—
|
|
—
|
|
—
|
|
—
|
|
—
|
|
(979
|
)
|
(979
|
)
|
||||||
|
Reclassification adjustment for effect of enacted tax law changes
|
—
|
|
—
|
|
—
|
|
838
|
|
—
|
|
(838
|
)
|
—
|
|
||||||
|
Dividend reinvestment plan
|
562
|
|
—
|
|
20
|
|
—
|
|
5
|
|
—
|
|
25
|
|
||||||
|
Cash dividends declared
($1.16 per share)
|
—
|
|
—
|
|
—
|
|
(5,176
|
)
|
—
|
|
—
|
|
(5,176
|
)
|
||||||
|
Stock based compensation
expense |
3,309
|
|
6
|
|
98
|
|
—
|
|
—
|
|
—
|
|
104
|
|
||||||
|
Exercise of stock options
|
1,000
|
|
2
|
|
17
|
|
—
|
|
—
|
|
—
|
|
19
|
|
||||||
|
Purchase of treasury stock
|
(1,430
|
)
|
—
|
|
—
|
|
—
|
|
(60
|
)
|
—
|
|
(60
|
)
|
||||||
|
Balances, December 31, 2017
|
4,465,576
|
|
$
|
9,882
|
|
$
|
755
|
|
$
|
57,197
|
|
$
|
(4,077
|
)
|
$
|
(5,096
|
)
|
$
|
58,661
|
|
See accompanying notes to consolidated financial statements.
50
UNION BANKSHARES, INC. AND SUBSIDIARY
Years Ended
December 31, 2017
,
2016
and
2015
|
|
2017
|
2016
|
2015
|
||||||
|
Cash Flows From Operating Activities
|
(Dollars in thousands)
|
||||||||
|
Net income
|
$
|
8,449
|
|
$
|
8,511
|
|
$
|
7,878
|
|
|
Adjustments to reconcile net income to net cash provided by operating activities:
|
|
||||||||
|
Depreciation
|
1,223
|
|
1,255
|
|
1,080
|
|
|||
|
Provision for loan losses
|
200
|
|
150
|
|
550
|
|
|||
|
Deferred income tax provision
|
993
|
|
566
|
|
341
|
|
|||
|
Net amortization of investment securities
|
423
|
|
384
|
|
214
|
|
|||
|
Equity in losses of limited partnerships
|
627
|
|
565
|
|
484
|
|
|||
|
Stock based compensation expense
|
104
|
|
66
|
|
35
|
|
|||
|
Net increase in unamortized loan costs
|
(146
|
)
|
(134
|
)
|
(160
|
)
|
|||
|
Proceeds from sales of loans held for sale
|
124,514
|
|
138,443
|
|
134,578
|
|
|||
|
Origination of loans held for sale
|
(122,355
|
)
|
(137,713
|
)
|
(126,599
|
)
|
|||
|
Net gains on sales of loans held for sale
|
(2,303
|
)
|
(2,898
|
)
|
(2,871
|
)
|
|||
|
Net loss on disposals of premises and equipment
|
34
|
|
13
|
|
7
|
|
|||
|
Net gains on sales of investment securities available-for-sale
|
(17
|
)
|
(71
|
)
|
(53
|
)
|
|||
|
Write-downs of impaired assets
|
—
|
|
—
|
|
42
|
|
|||
|
Net gains on sales of other real estate owned
|
—
|
|
—
|
|
(29
|
)
|
|||
|
(Increase) decrease in accrued interest receivable
|
(241
|
)
|
(427
|
)
|
22
|
|
|||
|
Amortization of core deposit intangible
|
171
|
|
171
|
|
171
|
|
|||
|
Increase in other assets
|
(1,323
|
)
|
(1,202
|
)
|
(1,387
|
)
|
|||
|
Contribution to defined benefit pension plan
|
(750
|
)
|
(750
|
)
|
—
|
|
|||
|
Increase (decrease) in other liabilities
|
265
|
|
715
|
|
(1,173
|
)
|
|||
|
Net cash provided by operating activities
|
9,868
|
|
7,644
|
|
13,130
|
|
|||
|
Cash Flows From Investing Activities
|
|
||||||||
|
Interest bearing deposits in banks
|
|
||||||||
|
Proceeds from maturities and redemptions
|
4,882
|
|
4,244
|
|
3,579
|
|
|||
|
Purchases
|
(4,730
|
)
|
(996
|
)
|
(4,080
|
)
|
|||
|
Investment securities held-to-maturity
|
|||||||||
|
Proceeds from maturities, calls and paydowns
|
—
|
|
4,220
|
|
2,000
|
|
|||
|
Investment securities available-for-sale
|
|||||||||
|
Proceeds from sales
|
14,409
|
|
6,620
|
|
11,540
|
|
|||
|
Proceeds from maturities, calls and paydowns
|
6,926
|
|
9,754
|
|
7,020
|
|
|||
|
Purchases
|
(21,001
|
)
|
(29,098
|
)
|
(27,416
|
)
|
|||
|
Purchase of nonmarketable stock
|
(518
|
)
|
(1,143
|
)
|
(269
|
)
|
|||
|
Redemption of nonmarketable stock
|
541
|
|
722
|
|
389
|
|
|||
|
Net increase in loans
|
(53,568
|
)
|
(32,947
|
)
|
(20,713
|
)
|
|||
|
Recoveries of loans charged off
|
168
|
|
59
|
|
83
|
|
|||
|
Purchases of premises and equipment
|
(1,987
|
)
|
(1,938
|
)
|
(2,289
|
)
|
|||
|
Investments in limited partnerships
|
(465
|
)
|
(948
|
)
|
(32
|
)
|
|||
|
Purchase of Company-owned life insurance
|
—
|
|
—
|
|
(5,000
|
)
|
|||
|
Proceeds of Company-owned life insurance death benefit
|
—
|
|
527
|
|
—
|
|
|||
|
Proceeds from sales of other real estate owned
|
—
|
|
—
|
|
342
|
|
|||
|
Proceeds from sales of premises and equipment
|
—
|
|
200
|
|
—
|
|
|||
|
Net cash
used in investi
ng activities
|
(55,343
|
)
|
(40,724
|
)
|
(34,846
|
)
|
|||
51
|
Cash Flows From Financing Activities
|
|||||||||
|
Advances on long-term borrowings
|
10,000
|
|
25,451
|
|
—
|
|
|||
|
Repayment of long-term debt
|
(10,279
|
)
|
(2,898
|
)
|
(294
|
)
|
|||
|
Net increase (decrease) in short-term borrowings outstanding
|
265
|
|
(522
|
)
|
(5,260
|
)
|
|||
|
Net increase in noninterest bearing deposits
|
15,440
|
|
12,558
|
|
9,441
|
|
|||
|
Net increase in interest bearing deposits
|
36,538
|
|
71,880
|
|
7,481
|
|
|||
|
Net decrease in time deposits
|
(2,064
|
)
|
(47,186
|
)
|
(8,578
|
)
|
|||
|
Issuance of common stock
|
19
|
|
56
|
|
53
|
|
|||
|
Purchase of treasury stock
|
(60
|
)
|
(6
|
)
|
(94
|
)
|
|||
|
Dividends paid
|
(5,151
|
)
|
(4,939
|
)
|
(4,816
|
)
|
|||
|
Net cash provided by (used in) financing activities
|
44,708
|
|
54,394
|
|
(2,067
|
)
|
|||
|
Net (decrease) increase in cash and cash equivalents
|
(767
|
)
|
21,314
|
|
(23,783
|
)
|
|||
|
Cash and cash equivalents
|
|||||||||
|
Beginning of year
|
39,275
|
|
17,961
|
|
41,744
|
|
|||
|
End of year
|
$
|
38,508
|
|
$
|
39,275
|
|
$
|
17,961
|
|
|
Supplemental Disclosures of Cash Flow Information
|
|||||||||
|
Interest paid
|
$
|
2,249
|
|
$
|
2,239
|
|
$
|
2,060
|
|
|
Income taxes paid
|
$
|
1,520
|
|
$
|
1,505
|
|
$
|
2,040
|
|
|
Supplemental Schedule of Noncash Investing and Financing Activities
|
|||||||||
|
Other real estate acquired in settlement of loans
|
$
|
36
|
|
$
|
—
|
|
$
|
59
|
|
|
Investment in limited partnerships acquired by capital contributions payable
|
$
|
546
|
|
$
|
27
|
|
$
|
—
|
|
|
Dividends paid on Common Stock:
|
|||||||||
|
Dividends declared
|
$
|
5,176
|
|
$
|
4,949
|
|
$
|
4,816
|
|
|
Dividends reinvested
|
(25
|
)
|
(10
|
)
|
—
|
|
|||
|
$
|
5,151
|
|
$
|
4,939
|
|
$
|
4,816
|
|
|
See accompanying notes to consolidated financial statements.
52
UNION BANKSHARES, INC. AND SUBSIDIARY
NOTES TO CONSOLIDATED FINANCIAL STATEMENTS
Basis of financial statement presentation
The accounting and reporting policies of Union Bankshares, Inc. and the Subsidiary (the Company) are in conformity with GAAP and general practices within the banking industry. The following is a description of the more significant policies.
The consolidated financial statements include the accounts of Union Bankshares, Inc., and its wholly owned subsidiary, Union Bank headquartered in Morrisville, Vermont. All significant intercompany transactions and balances have been eliminated. The Company utilizes the accrual method of accounting for financial reporting purposes.
Certain amounts in the
2016
and
2015
consolidated financial statements have been reclassified to conform to the current year presentation.
The acronyms, abbreviations and capitalized terms identified below are used throughout this Form 10-K, including Part I, Part II and III. The following is provided to aid the reader and provide a reference page when reviewing this Form 10-K:
|
AFS:
|
Available-for-sale
|
ICS:
|
Insured Cash Sweeps of the Promontory Interfinancial Network
|
|
ALCO:
|
Asset Liability Management Committee
|
IRS:
|
Internal Revenue Service
|
|
ALL:
|
Allowance for loan losses
|
MBS:
|
Mortgage-backed security
|
|
ASC:
|
Accounting Standards Codification
|
MPF:
|
Mortgage Partnership Finance Program
|
|
ASU:
|
Accounting Standards Update
|
MSRs:
|
Mortgage Servicing rights
|
|
BHCA:
|
Bank Holding Company Act of 1956
|
NASDAQ:
|
NASDAQ Global Security Market
|
|
Board:
|
Board of Directors
|
OAO:
|
Other assets owned
|
|
bp or bps:
|
Basis point(s)
|
OCI:
|
Other comprehensive income (loss)
|
|
Branch Acquisition:
|
The acquisition of three New Hampshire branches in May 2011
|
OFAC:
|
U.S. Office of Foreign Assets Control
|
|
CDARS:
|
Certificate of Deposit Accounts Registry Service of the Promontory Interfinancial Network
|
OREO:
|
Other real estate owned
|
|
CFPB:
|
Consumer Financial Protection Bureau
|
OTTI:
|
Other-than-temporary impairment
|
|
COLI:
|
Company-Owned Life Insurance
|
OTT:
|
Other-than-temporary
|
|
Company:
|
Union Bankshares, Inc. and Subsidiary
|
Plan:
|
The Union Bank Pension Plan
|
|
DFR:
|
Vermont Department of Financial Regulation
|
RD:
|
USDA Rural Development
|
|
Dodd-Frank Act:
|
The Dodd-Frank Wall Street Reform and Consumer Protection Act of 2010
|
RSU:
|
Restricted Stock Units
|
|
DRIP:
|
Dividend Reinvestment and Stock Purchase Plan
|
SBA:
|
U.S. Small Business Administration
|
|
FASB:
|
Financial Accounting Standards Board
|
SEC:
|
U.S. Securities and Exchange Commission
|
|
FDIC:
|
Federal Deposit Insurance Corporation
|
SOX Act:
|
Sarbanes Oxley Act of 2002
|
|
FDICIA:
|
The Federal Deposit Insurance Corporation Improvement Act of 1991
|
Tax Act:
|
Tax Cut and Jobs Act
|
|
FHA:
|
U.S. Federal Housing Administration
|
TDR:
|
Troubled-debt restructuring
|
|
FHLB:
|
Federal Home Loan Bank of Boston
|
Union:
|
Union Bank, the sole subsidiary of Union Bankshares, Inc
|
|
FRB:
|
Federal Reserve Board
|
USDA:
|
U.S. Department of Agriculture
|
|
Fannie Mae:
|
Federal National Mortgage Association
|
VA:
|
U.S. Veterans Administration
|
|
FHLMC/Freddie Mac:
|
Federal Home Loan Mortgage Corporation
|
2006 Plan:
|
Executive Nonqualified Excess Plan
|
|
GAAP:
|
Generally accepted accounting principles in the United States
|
2008 Plan:
|
2008 Amended and Restated Nonqualified Deferred Compensation Plan
|
|
GLBA:
|
Gramm-Leach-Bliley Financial Modernization Act of 1999
|
2008 ISO Plan:
|
2008 Incentive Stock Option Plan of the Company
|
|
HTM:
|
Held-to-maturity
|
2014 Equity Plan:
|
2014 Equity Incentive Plan
|
|
HUD:
|
U.S. Department of Housing and Urban Development
|
||
53
Nature of operations
The Company provides a variety of financial services to individuals, municipalities, commercial businesses and nonprofit customers through its branches, ATMs, telebanking, mobile and internet banking systems in northern Vermont and New Hampshire. This market area encompasses primarily retail consumers, small businesses, municipalities, agricultural producers and the tourism industry. The Company's primary deposit products are checking accounts, savings accounts, money market accounts, certificates of deposit and individual retirement accounts and its primary lending products are commercial, real estate, municipal and consumer loans. The Company also offers fiduciary and asset management services through its Asset Management Group, an unincorporated division of Union.
Significant concentration of credit risk
The Bank grants loans primarily to customers in Vermont and New Hampshire. Although the Bank has a diversified loan portfolio, a large portion of Bank's loans are secured by commercial or residential real estate located in Vermont and New Hampshire and is subject to volatility with each state's real estate market. Additionally, the borrower's ability to repay loans is highly dependent upon other economic factors throughout Vermont and New Hampshire. The Bank typically will require the principals of any commercial borrower to obligate themselves personally on the loan.
Use of estimates in preparation of consolidated financial statements
The preparation of consolidated financial statements in conformity with GAAP requires management to make estimates and assumptions that affect the reported amounts of assets and liabilities and disclosures of contingent assets and liabilities at the date of the consolidated financial statements and the reported amounts of revenues and expenses during the reporting period. Actual results could differ materially from those estimates. Material estimates that are particularly susceptible to significant change in the near term and involve inherent uncertainties relate to the determination of the ALL on loans, the valuation of real estate acquired in connection with foreclosures or in satisfaction of loans, valuation of deferred tax assets, judgments regarding valuation and impairment of investment securities and other assets as well as pension plan accounting. These estimates involve a significant degree of complexity and subjectivity and the amount of the change that is reasonably possible, should any of these estimates prove inaccurate, cannot be estimated.
Presentation of cash flows
For purposes of presentation in the consolidated statements of cash flows, cash and cash equivalents includes cash on hand, amounts due from banks (including cash items in process of clearing), federal funds sold (generally purchased and sold for one day periods) and overnight deposits.
Asset management operations
Assets held by Union's Asset Management Group in a fiduciary or agency capacity, other than trust cash on deposit with Union, are not included in these consolidated financial statements because they are not assets of Union or the Company.
Fair value measurement
The Company utilizes FASB ASC Topic 820,
Fair Value Measurement
, as guidance for accounting for assets and liabilities carried at fair value. This standard defines fair value as the price that would be received, without adjustment for transaction costs, to sell an asset or paid to transfer a liability in an orderly transaction between market participants at the measurement date. Fair value is a market based measurement that should be determined based on assumptions that market participants would use in pricing an asset or liability. The guidance in FASB ASC Topic 820 establishes a three-level fair value hierarchy, which prioritizes the inputs used in measuring fair value. A financial instrument's level within the fair value hierarchy is based on the lowest level of input that is significant to the fair value measurement.
The three levels of the fair value hierarchy are:
|
•
|
Level 1 - Unadjusted quoted prices in active markets that are accessible at the measurement date for identical, unrestricted assets or liabilities;
|
|
•
|
Level 2 - Quoted prices for similar assets or liabilities in active markets, quoted prices in markets that are not active, or inputs that are observable, either directly or indirectly, for substantially the full term of the asset or liability; and
|
|
•
|
Level 3 - Prices or valuation techniques that require inputs that are both significant to the fair value measurement and unobservable (i.e., supported by little or no market activity).
|
54
The following is a description of the valuation methodologies used for the Company’s assets that are measured on a recurring basis at estimated fair value:
AFS securities: Marketable equity securities and mutual funds have been valued using unadjusted quoted prices from active markets and therefore have been classified as Level 1. However, the majority of the Company’s AFS securities have been valued utilizing Level 2 inputs. For these securities, the Company obtains fair value measurements from an independent pricing service. The fair value measurements consider observable data that may include market maker bids, quotes and pricing models. Inputs to the pricing models include recent trades, benchmark interest rates, spreads and actual and projected cash flows.
Investment securities
Debt securities the Company has the positive intent and ability to hold to maturity are classified as HTM and reported at amortized cost. Debt and equity securities not classified as either HTM or trading are classified as AFS. Investments classified as AFS are reported at fair value. Investment securities purchased and held primarily for resale in the near future are classified as trading securities and are reported at fair value with unrealized gains and losses included in earnings. The Company does not generally hold any securities classified as trading.
Accretion of discounts and amortization of premiums arising at acquisition on investment securities are included in income using the effective interest method over the life of the securities to the call date. Unrealized gains and losses on investment securities AFS are excluded from earnings and reported in Accumulated OCI, net of tax and reclassification adjustment, as a separate component of stockholders' equity. The specific identification method is used to determine realized gains and losses on sales of AFS or trading securities.
The Company evaluates all investment securities on a quarterly basis, and more frequently when economic conditions warrant, to determine if an OTTI exists
.
A security is considered impaired if the fair value is lower than its amortized cost basis at the report date. If impaired, management then assesses whether the unrealized loss is OTT.
An unrealized loss on a debt security is generally deemed to be OTT and a credit loss is deemed to exist if the present value of the expected future cash flows is less than the amortized cost basis of the debt security. The credit loss component of an OTTI write-down is recorded, net of tax effect, through net income as a component of net OTTI losses in the consolidated statement of income, while the remaining portion of the impairment loss is recognized in OCI, provided the Company does not intend to sell the underlying debt security and it is "more likely than not" that the Company will not have to sell the debt security prior to recovery. Declines in the fair values of individual equity securities that are deemed by management to be OTT are reflected in noninterest income when identified.
Management considers the following factors in determining whether an OTTI exists and the period over which the security is expected to recover:
|
•
|
The length of time, and extent to which, the fair value has been less than the amortized cost;
|
|
•
|
Adverse conditions specifically related to the security, industry, or geographic area;
|
|
•
|
The historical and implied volatility of the fair value of the security;
|
|
•
|
The payment structure of the debt security and the likelihood of the issuer being able to make payments that may increase in the future;
|
|
•
|
Failure of the issuer of the security to make scheduled interest or principal payments;
|
|
•
|
Any changes to the rating of the security by a rating agency;
|
|
•
|
Recoveries or additional declines in fair value subsequent to the balance sheet date; and
|
|
•
|
The nature of the issuer, including whether it is a private company, public entity or government-sponsored enterprise, and the existence or likelihood of any government or third party guaranty.
|
Loans held for sale
Loans originated and intended for sale in the secondary market are carried at the lower of cost or estimated fair value in the aggregate. The estimated fair value of loans held for sale is based on current price quotes that determine the amount that the loans could be sold for in the secondary market. Loans transferred from held for sale to portfolio are transferred at the lower of cost or fair value in the aggregate. Sales are normally made without recourse. Gains and losses on the disposition of loans held for sale are determined on the specific identification basis. Net unrealized losses are recognized through a valuation allowance by charges to income.
55
Loans
Loans receivable that management has the intent and ability to hold for the foreseeable future or until maturity or payoff are reported at their unpaid principal balances, adjusted for any charge-offs, the ALL, and any deferred fees or costs on originated loans and unamortized premiums or discounts on purchased loans.
Loan interest income is accrued daily on outstanding balances. The following accounting policies, related to accrual and nonaccrual loans, apply to all portfolio segments and loan classes, which the Company considers to be the same. The accrual of interest is normally discontinued when a loan is specifically determined to be impaired and/or management believes, after considering collection efforts and other factors, that the borrower's financial condition is such that collection of interest is doubtful. Generally, any unpaid interest previously accrued on those loans is reversed against current period interest income. A loan may be restored to accrual status when its financial status has significantly improved and there is no principal or interest past due. A loan may also be restored to accrual status if the borrower makes six consecutive monthly payments or the lump sum equivalent. Income on nonaccrual loans is generally not recognized unless a loan is returned to accrual status or after all principal has been collected. Interest income generally is not recognized on impaired loans unless the likelihood of further loss is remote. Interest payments received on such loans are generally applied as a reduction of the loan principal balance. Delinquency status is determined based on contractual terms for all portfolio segments and loan classes. Loans past due 30 days or more are considered delinquent. Loans are considered in process of foreclosure when a judgment of foreclosure has been issued by the court.
Loan origination fees and direct loan origination costs are deferred and amortized as an adjustment of the related loan's yield using methods that approximate the interest method. The Company generally amortizes these amounts over the estimated average life of the related loans.
Allowance for loan losses
The ALL is established for estimated losses in the loan portfolio through a provision for loan losses charged to earnings. For all loan classes, loan losses are charged against the ALL when management believes the loan balance is uncollectible or in accordance with federal guidelines. Subsequent recoveries, if any, are credited to the ALL.
The ALL is maintained at a level believed by management to be appropriate to absorb probable credit losses inherent in the loan portfolio as of the balance sheet date. The amount of the ALL is based on management's periodic evaluation of the collectability of the loan portfolio, including the nature, volume and risk characteristics of the portfolio, credit concentrations, trends in historical loss experience, estimated value of any underlying collateral, specific impaired loans and economic conditions. While management uses available information to recognize losses on loans, future additions to the ALL may be necessary based on changes in economic conditions or other relevant factors.
In addition, various regulatory agencies, as an integral part of their examination process, regularly review the Company's ALL. Such agencies may require the Company to recognize additions to the ALL, with a corresponding charge to earnings, based on their judgments about information available to them at the time of their examination, which may not be currently available to management.
The ALL consists of specific, general and unallocated components. The specific component relates to loans that are classified as impaired. Loans are evaluated for impairment and may be classified as impaired when management believes it is probable that the Company will not collect all the contractual interest and principal payments as scheduled in the loan agreement. Impaired loans may also include troubled loans that are restructured. A TDR occurs when the Company, for economic or legal reasons related to the borrower's financial difficulties, grants a concession to the borrower that would otherwise not be granted. A TDR classification may result from the transfer of assets to the Company in partial satisfaction of a troubled loan, a modification of a loan's terms (such as reduction of stated interest rates below market rates, extension of maturity that does not conform to the Company's policies, reduction of the face amount of the loan, reduction of accrued interest, or reduction or deferment of loan payments), or a combination. A specific reserve amount is allocated to the ALL for individual loans that have been classified as impaired based on management's estimate of the fair value of the collateral for collateral dependent loans, an observable market price, or the present value of anticipated future cash flows. The Company accounts for the change in present value attributable to the passage of time in the loan loss reserve. Large groups of smaller balance homogeneous loans are collectively evaluated for impairment. Accordingly, the Company does not separately identify individual consumer, real estate or small balance commercial loans for impairment evaluation, unless such loans are subject to a restructuring agreement or have been identified as impaired as part of a larger customer relationship. Management has established the threshold for individual impairment evaluation for commercial loans with balances greater than $500 thousand, based on an evaluation of the Company's historical loss experience on substandard commercial loans.
The general component represents the level of ALL allocable to each loan portfolio segment with similar risk characteristics and is determined based on historical loss experience, adjusted for qualitative factors, for each class of loan. Management deems a five year average to be an appropriate time frame on which to base historical losses for each portfolio segment. Qualitative factors
56
considered include underwriting, economic and market conditions, portfolio composition, collateral values, delinquencies, lender experience and legal issues. The qualitative factors are determined based on the various risk characteristics of each portfolio segment. Risk characteristics relevant to each portfolio segment are as follows:
|
•
|
Residential real estate
- Loans in this segment are collateralized by owner-occupied 1-4 family residential real estate, second and vacation homes, 1-4 family investment properties, home equity and second mortgage loans. Repayment is dependent on the credit quality of the individual borrower. The overall health of the economy, including unemployment rates and housing prices, could have an effect on the credit quality of this segment.
|
|
•
|
Construction real estate
- Loans in this segment include residential and commercial construction properties, commercial real estate development loans (while in the construction phase of the projects), land and land development loans. Repayment is dependent on the credit quality of the individual borrower and/or the underlying cash flows generated by the properties being constructed. The overall health of the economy, including unemployment rates, housing prices, vacancy rates and material costs, could have an effect on the credit quality of this segment.
|
|
•
|
Commercial real estate
- Loans in this segment are primarily properties occupied by businesses or income-producing properties. The underlying cash flows generated by the properties may be adversely impacted by a downturn in the economy as evidenced by a general slowdown in business or increased vacancy rates which, in turn, could have an effect on the credit quality of this segment. Management requests business financial statements at least annually and monitors the cash flows of these loans.
|
|
•
|
Commercial
- Loans in this segment are made to businesses and are generally secured by non-real estate assets of the business. Repayment is expected from the cash flows of the business. A weakened economy, and resultant decreased consumer or business spending, could have an effect on credit quality of this segment.
|
|
•
|
Consumer
- Loans in this segment are made to individuals for personal expenditures, such as an automobile purchase, and include unsecured loans. Repayment is primarily dependent on the credit quality of the individual borrower. The overall health of the economy, including unemployment, could have an effect on the credit quality of this segment.
|
|
•
|
Municipal
- Loans in this segment are made to municipalities located within the Company's service area. Repayment is primarily dependent on taxes or other funds collected by the municipalities. Management considers there to be minimal risk surrounding the credit quality of this segment.
|
An unallocated component is maintained to cover uncertainties that could affect management's estimate of probable losses. The unallocated component of the ALL reflects the margin of imprecision inherent in the underlying assumptions used in the methodologies for estimating specific and general losses in the portfolio.
All evaluations are inherently subjective as they require estimates that are susceptible to significant revision as more information becomes available or as changes occur in economic conditions or other relevant factors.
Other real estate owned
Real estate properties acquired through or in lieu of loan foreclosure are to be sold and are initially recorded based on an independent appraisal or a broker price opinion at the estimated fair value less estimated selling costs at the date of acquisition, establishing a new carrying basis. Thereafter, valuations are periodically performed by management, and the real estate is carried in Other assets at the lower of carrying amount or fair value, less estimated cost to sell. Costs of significant property improvements are capitalized, if deemed recoverable, whereas revenue and expenses from operations and changes in valuation are charged to Other expenses on the Company's consolidated statements of income. There was one property in OREO at
December 31, 2017
valued at
$36 thousand
. There were
no
OREO properties at
December 31, 2016
.
Premises and equipment
Premises and equipment are stated at cost, less accumulated depreciation. Depreciation is computed principally by the straight line method over the estimated useful lives of the assets. The cost of assets sold or otherwise disposed of and the related accumulated depreciation are eliminated from the accounts and the resulting gains or losses are reflected in the consolidated statement of income. Maintenance and repairs are charged to current expense as incurred and the costs of major renovations and betterments are capitalized. Construction in progress is stated at cost, which includes the cost of construction and other direct costs attributable to the construction. No provision for depreciation is made on construction in progress until such time as the relevant assets are completed and put into use.
Intangible assets
Intangible assets include goodwill, which represents the excess of the purchase price over the fair value of net assets acquired in the 2011 Branch Acquisition , as well as a core deposit intangible related to the deposits acquired (see Note 9). The core deposit
57
intangible is amortized on a straight line basis over the estimated average life of the acquired core deposit base of 10 years. The Company evaluates the valuation and amortization of the core deposit intangible if events occur that could result in possible impairment. With respect to goodwill, in accordance with current authoritative guidance, the Company assesses qualitative factors to determine whether the existence of events or circumstances leads to a determination that it is more likely than not that the fair value of the Company is less than its carrying amount, which could result in goodwill impairment.
Federal Home Loan Bank stock
As a member of the FHLB, Union is required to invest in Class B common stock of the FHLB. The Class B common stock has a five year notice requirement for redemption and there is no guarantee of future redemption. Also, there is the possibility of future capital calls by the FHLB on member banks to ensure compliance with its capital plan. FHLB stock is reported in Other assets at its par value of
$2.3 million
at
December 31, 2017
and
December 31, 2016
. The stock is nonmarketable, and is redeemable by the FHLB at par value.
Company-owned life insurance
COLI represents life insurance on the lives of certain current or former directors or employees who have provided positive consent allowing the Company to be the beneficiary of such policies. The Company utilizes COLI as tax-efficient funding for certain benefit obligations to its employees and directors, including obligations under one of the Company's nonqualified deferred compensation plans. (See Note 14.) The Company is the primary beneficiary of the insurance policies. Increases in the cash value of the policies, as well as any gain on insurance proceeds received, are recorded in Other income, and are not currently subject to income taxes. COLI is recorded at the cash value of the policies, less any applicable cash surrender charges (of which there are currently none). The Company reviews the financial strength of the insurance carriers prior to the purchase of COLI to ensure minimum credit ratings of at least investment grade. The financial strength of the carriers is reviewed annually and COLI with any individual carrier is limited by Company policy to 15% of the sum of Tier 1 Capital and allowable Tier 2 capital.
Servicing assets
Servicing assets are recognized as separate assets when servicing rights are acquired through purchase or through sale of loans with servicing rights retained. Capitalized servicing rights are reported in Other assets, are initially recorded at estimated fair market value and are amortized against noninterest income in proportion to, and over the period of, the estimated future net servicing income of the underlying loans. The estimated fair value of capitalized servicing rights represents the present value of the future servicing fees arising from the right to service loans that have been previously sold. Servicing assets are evaluated regularly for impairment based upon the fair value of the rights as compared to amortized cost. Impairment is determined by stratifying rights by predominant characteristics, such as interest rates and terms. Fair value of a stratum is determined using prices for similar assets with similar characteristics, when available, or based upon discounted cash flows using market-based assumptions.
Impairment is recognized through a valuation allowance for an individual stratum, to the extent that estimated fair value is less than the capitalized amount for the stratum.
Investment in real estate limited partnerships
The Company has purchased various limited partnership interests in affordable housing partnerships. These partnerships were established to acquire, own and rent residential housing for elderly, low or moderate income residents in northern Vermont or in New Hampshire. Effective January 1, 2014, the Company adopted ASU 2014-01,
“Investments – Equity Method and Joint Ventures (Topic 323): Accounting for Investments in Qualified Affordable Housing Projects.”
The amendment permits an entity to amortize the initial cost of the investment in proportion to the amount of the tax credits and other tax benefits received and recognize the net investment performance in the income statement as a component of income tax expense. There were no impairment losses during the year resulting from the forfeiture or ineligibility of tax credits related to qualified affordable housing project investments. See Note 10.
Defined benefit pension plan
On October 18, 2017, the Company's Board of Directors voted to terminate Union Bank’s Defined Benefit Pension Plan. Benefit accruals have been frozen and the Plan closed to new participants since October 5, 2012. The Company anticipates completing the transfer of all liabilities and administrative responsibilities under the Plan by December 31, 2018. See Note 14.
58
Advertising costs
The Company expenses advertising costs as incurred and they are included in Other expenses in the Company's consolidated statement of income.
Earnings per common share
Earnings per common share for the period are computed based on the weighted average number of shares of common stock issued during the period, including DRIP shares issuable upon reinvestment of dividends, retroactively adjusted for stock splits and stock dividends, if any, and reduced for shares held in treasury. See Note 16.
Income taxes
The Company prepares its federal income tax return on a consolidated basis. Federal income taxes are allocated to members of the consolidated group based on taxable income. The Company recognizes income taxes under the asset and liability method. This involves estimating the Company's actual current tax exposure as well as assessing temporary differences resulting from differing treatment of items, such as timing of the deduction of expenses, for tax and GAAP purposes. These differences result in deferred tax assets and liabilities, which are netted and included in Other assets. Deferred tax assets and liabilities are measured using enacted tax rates expected to apply to taxable income in the years in which those temporary differences are expected to be recovered or settled. The Company must also assess the likelihood that any deferred tax assets will be recovered from future taxable income and to the extent that recovery is not likely, a valuation allowance must be established. A change in enacted federal income tax rates for future periods, such as occurred with enactment of the Tax Cuts and Jobs Act in December, 2017, requires revaluation of deferred taxes. Significant management judgment is required in determining the provision for income taxes and deferred tax assets and liabilities. Affordable housing tax credits are recognized as a reduction of the Provision for income taxes in the year they are earned. See Note 13.
Off-balance-sheet financial instruments
In the ordinary course of business, the Company is a party to off-balance-sheet financial instruments consisting of commitments to originate credit, unused lines of credit including commitments under credit card arrangements, commitments to purchase investment securities, commitments to invest in real estate limited partnerships, commercial letters of credit, standby letters of credit and risk-sharing commitments on certain sold loans. Such financial instruments are recorded in the financial statements when they become fixed and certain.
Comprehensive income (loss)
Accounting principles generally require that recognized revenue, expenses, gains and losses be included in net income or loss. Certain changes in assets and liabilities, such as the after tax effect of unrealized gains and losses on investment securities AFS that are not OTTI and the unfunded liability for the defined benefit pension plan, are not reflected in the consolidated statement of income. The cumulative effect of such items, net of tax effect, is reported as a separate component of the equity section of the consolidated balance sheet (Accumulated OCI) (See Note 23). OCI, along with net income, comprises the Company's total comprehensive income or loss.
Transfers of financial assets
Transfers of financial assets are accounted for as sales when control over the assets has been surrendered. Control over transferred assets is deemed to be surrendered when the assets have been isolated from the Company, the transferee obtains the right (free of conditions that constrain it from taking advantage of that right) to pledge or exchange the transferred assets, and the Company does not maintain effective control over the transferred assets through an agreement to repurchase them before their maturity.
Stock Based Compensation
Effective May 21, 2014 upon approval by the stockholders, the Company adopted the 2014 Equity Plan. Under the 2014 Equity Plan,
50,000
shares of the Company’s common stock (including approximately
25,000
unused shares from the 2008 ISO Plan) are available for equity awards of incentive stock options, nonqualified stock options, restricted stock and restricted stock units to eligible officers and (except for awards of incentive stock options) nonemployee directors. See Note 15.
59
Recent accounting pronouncements
In May 2014, the FASB issued ASU No. 2014-09,
Revenue from Contracts with Customers (Topic 606).
The ASU requires an entity to recognize the amount of revenue to which it expects to be entitled for the transfer of promised goods or services to customers. The Company will adopt the guidance as of January 1, 2018 using a modified retrospective method with a cumulative-effect adjustment to opening retained earnings. While the guidance will replace most existing revenue recognition guidance in GAAP, the ASU is not applicable to financial instruments and, therefore, will not impact a majority of the Company’s revenues, including net interest income. While in scope of the new guidance, the Company does not expect a material change in the timing or measurement of revenues related to deposit fees. Mortgage servicing fees have been concluded to be out of scope of the standard and therefore will not be impacted by the issuance of this guidance. The Company continues to evaluate the effect that the guidance will have on other revenue streams within its scope, as well as changes in disclosures required by the new guidance. Based on the Company’s current interpretations of the new guidance, the overall impact to net income is expected to be immaterial.
In February 2016, the FASB issued ASU No. 2016-02,
Leases (Topic 842)
. The ASU was issued to increase transparency and comparability among organizations by recognizing lease assets and liabilities (including operating leases) on the balance sheet and disclosing key information about leasing arrangements. Previous lease accounting did not require the inclusion of operating leases in the balance sheet. The ASU is effective for fiscal years beginning after December 15, 2018, including interim periods within those fiscal years. Early application is permitted. The Company is evaluating the potential impact of the ASU on its consolidated financial statements by reviewing its existing lease contracts.
In June 2016, the FASB issued ASU No. 2016-13,
Financial Instruments-Credit Losses (Topic 326): Measurement of Credit Losses on Financial Instruments
. Under the new guidance, which will replace the existing incurred loss model for recognizing credit losses, banks and other lending institutions will be required to recognize the full amount of expected
credit losses. The new guidance, which is referred to as the current expected credit loss model ("CECL"), requires that expected credit losses for financial assets held at the reporting date that are accounted for at amortized cost be measured and recognized based on historical experience and current and reasonably supportable forecasted conditions to reflect the full amount of expected credit losses.
A modified version of these requirements also applies to debt securities classified as available for sale. T
h
e ASU
i
s effec
ti
ve for
fisca
l years be
g
inn
i
n
g aft
er De
c
ember 15, 2019, in
c
lu
d
ing in
teri
m p
e
rio
ds w
i
t
hin
t
ho
se
fiscal
years.
Early adoption is permitted for fiscal years beginning after December 15, 2018, including interim periods within such years. The Company has established a CECL implementation team and developed a transition project plan. The team members have evaluated software providers and have entered into an agreement with Sageworks. Management intends to run parallel calculations during 2018 using the Sageworks software that will facilitate the implementation process and evaluation of the potential impact
of the ASU on the Company's consolidated financial statements.
In January 2017, the FASB issued ASU No. 2017-04,
Intangibles - Goodwill and Other (Topic 350): Simplifying the Test for Goodwill Impairment.
The ASU was issued to reduce the cost and complexity of the goodwill impairment test. To simplify the subsequent measurement of goodwill, step two of the goodwill impairment test was eliminated. Instead, in accordance with the ASU, a Company will recognize an impairment of goodwill should the carrying value of a reporting unit exceed its fair value (i.e. step one). The ASU will be effective for the Company on January 1, 2020 and will be applied prospectively.
In May 2017, the FASB issued ASU No. 2017-09,
Compensation - Stock Compensation , Scope of Modification Accounting (Topic 718).
The ASU was issued to provide clarity and reduce both 1) diversity in practice and 2) cost and complexity when applying the guidance in Topic 718, Compensation-Stock Compensation, to a change to the terms or conditions of a share-based payment award. The ASU includes guidance on determining which changes to the terms and conditions of share-based payment awards require an entity to apply modification accounting under Topic 718. The ASU is effective for public companies for fiscal years beginning after December 15, 2017, including interim periods within those fiscal years. The amendments should be applied on a prospective basis to an award modified on or after the adoption date. The ASU will not have a material effect on the Company's consolidated financial statements.
In August 2017, the FASB issued ASU No. 2017-12,
Derivatives and Hedging (Topic 815): Targeted Improvements to Accounting for Hedging Activities.
The ASU was issued to make certain specific improvements to hedge accounting to better align hedge accounting with risk management activities, eliminate the separate measurement and recording of hedge ineffectiveness, improve presentation and disclosure, and other simplifications. The ASU is effective for public companies for fiscal years, and interim periods within those fiscal years, beginning after December 15, 2018. Early adoption is permitted, including adoption in an interim period. All transition requirements and elections are to be applied to existing hedging relationships upon adoption. While the Company continues to assess the impact of ASU 2017-12, it does not believe it will have a material impact on the Company's consolidated financial statements upon adoption.
60
In February 2018, FASB issued AU No. 2018-02,
Income Statement - Reporting Comprehensive Income (Topic 220): Reclassification of Certain Tax Effects from Accumulated Other Comprehensive Income.
This ASU was issued to allow a reclassification from accumulated other comprehensive income to undivided profits for stranded tax effects resulting from the Tax Cuts and Jobs Act and will improve the usefulness of information reported to financial statement users. The ASU is effective for fiscal years beginning after December 15, 2018, with early adoption permitted for financial statements which have not yet been issued. The Company adopted the ASU for the December 31, 2017 consolidated financial statements.
The nature of the Company's business requires that it maintain amounts due from correspondent banks which, at times, may exceed federally insured limits. The balances in these accounts at December 31, were as follows:
|
|
2017
|
2016
|
||||
|
(Dollars in thousands)
|
||||||
|
Noninterest bearing accounts
|
$
|
210
|
|
$
|
289
|
|
|
Federal Reserve Bank of Boston
|
34,344
|
|
34,777
|
|
||
|
FHLB of Boston
|
310
|
|
572
|
|
||
No losses have been experienced in these accounts and the Company believes it is not exposed to any significant risk with respect to the accounts.
The Company had
no
requirement to maintain contracted clearing balances at
December 31, 2017
or
2016
. Balances at the Federal Reserve Bank of Boston and a portion of the funds at the FHLB are classified as overnight deposits as they earn interest. The Company is required to maintain vault cash or noninterest bearing reserve balances with Federal Reserve Bank of Boston. Total reserve balances required at
December 31, 2017
and
2016
were
$1.4 million
and
$891 thousand
, respectively, which were both satisfied by vault cash.
Interest bearing deposits in banks consist of certificates of deposit purchased from various financial institutions. Deposits at each institution are generally maintained at or below the FDIC insurable limit of $250 thousand. As of
December 31, 2017
, the Company held certificates with rates ranging from
0.55%
to
2.55%
and various maturity dates through 2028, with
$2.5 million
scheduled to mature in
2018
.
Investment securities as of the balance sheet dates consisted of the following:
|
December 31, 2017
|
Amortized
Cost
|
Gross
Unrealized
Gains
|
Gross
Unrealized
Losses
|
Fair
Value
|
||||||||
|
(Dollars in thousands)
|
||||||||||||
|
Available-for-sale
|
|
|
|
|
||||||||
|
Debt securities:
|
|
|
|
|
||||||||
|
U.S. Government-sponsored enterprises
|
$
|
7,805
|
|
$
|
12
|
|
$
|
(122
|
)
|
$
|
7,695
|
|
|
Agency MBS
|
28,378
|
|
12
|
|
(274
|
)
|
28,116
|
|
||||
|
State and political subdivisions
|
24,704
|
|
249
|
|
(239
|
)
|
24,714
|
|
||||
|
Corporate
|
4,412
|
|
48
|
|
(67
|
)
|
4,393
|
|
||||
|
Total debt securities
|
65,299
|
|
321
|
|
(702
|
)
|
64,918
|
|
||||
|
Mutual funds
|
521
|
|
—
|
|
—
|
|
521
|
|
||||
|
Total
|
$
|
65,820
|
|
$
|
321
|
|
$
|
(702
|
)
|
$
|
65,439
|
|
|
Held-to-maturity
|
|
|
|
|
||||||||
|
U.S. Government-sponsored enterprises
|
$
|
1,000
|
|
$
|
—
|
|
$
|
(1
|
)
|
$
|
999
|
|
61
|
December 31, 2016
|
Amortized
Cost
|
Gross
Unrealized
Gains
|
Gross
Unrealized
Losses
|
Fair
Value
|
||||||||
|
(Dollars in thousands)
|
||||||||||||
|
Available-for-sale
|
|
|
|
|
||||||||
|
Debt securities:
|
|
|
|
|
||||||||
|
U.S. Government-sponsored enterprises
|
$
|
10,221
|
|
$
|
15
|
|
$
|
(196
|
)
|
$
|
10,040
|
|
|
Agency MBS
|
18,283
|
|
27
|
|
(269
|
)
|
18,041
|
|
||||
|
State and political subdivisions
|
27,909
|
|
113
|
|
(650
|
)
|
27,372
|
|
||||
|
Corporate
|
9,745
|
|
84
|
|
(129
|
)
|
9,700
|
|
||||
|
Total debt securities
|
66,158
|
|
239
|
|
(1,244
|
)
|
65,153
|
|
||||
|
Mutual funds
|
403
|
|
—
|
|
—
|
|
403
|
|
||||
|
Total
|
$
|
66,561
|
|
$
|
239
|
|
$
|
(1,244
|
)
|
$
|
65,556
|
|
|
Held-to-maturity
|
||||||||||||
|
U.S. Government-sponsored enterprises
|
$
|
999
|
|
$
|
—
|
|
$
|
—
|
|
$
|
999
|
|
Investment securities with a carrying amount of
$4.6 million
and
$8.4 million
at
December 31, 2017
and
2016
, respectively, were pledged as collateral for public deposits, customer repurchase agreements and for other purposes as required or permitted by law.
Information pertaining to all investment securities with gross unrealized losses as of the balance sheet dates, aggregated by investment category and length of time that individual securities have been in a continuous loss position, follows:
|
December 31, 2017
|
Less Than 12 Months
|
12 Months and Over
|
Total
|
|||||||||||||||||||||
|
|
Number of Securities
|
Fair
Value
|
Gross
Unrealized
Loss
|
Number of Securities
|
Fair
Value
|
Gross
Unrealized
Loss
|
Number of Securities
|
Fair
Value
|
Gross
Unrealized
Loss
|
|||||||||||||||
|
(Dollars in thousands)
|
||||||||||||||||||||||||
|
Debt securities:
|
|
|
|
|
|
|
||||||||||||||||||
|
U.S. Government-
sponsored enterprises
|
3
|
|
$
|
1,824
|
|
$
|
(7
|
)
|
9
|
|
$
|
4,374
|
|
$
|
(116
|
)
|
12
|
|
$
|
6,198
|
|
$
|
(123
|
)
|
|
Agency MBS
|
26
|
|
19,315
|
|
(143
|
)
|
7
|
|
5,222
|
|
(131
|
)
|
33
|
|
24,537
|
|
(274
|
)
|
||||||
|
State and political
subdivisions
|
8
|
|
3,803
|
|
(22
|
)
|
18
|
|
7,899
|
|
(217
|
)
|
26
|
|
11,702
|
|
(239
|
)
|
||||||
|
Corporate
|
2
|
|
870
|
|
(31
|
)
|
2
|
|
964
|
|
(36
|
)
|
4
|
|
1,834
|
|
(67
|
)
|
||||||
|
Total
|
39
|
|
$
|
25,812
|
|
$
|
(203
|
)
|
36
|
|
$
|
18,459
|
|
$
|
(500
|
)
|
75
|
|
$
|
44,271
|
|
$
|
(703
|
)
|
|
December 31, 2016
|
Less Than 12 Months
|
12 Months and Over
|
Total
|
|||||||||||||||||||||
|
|
Number of Securities
|
Fair
Value
|
Gross
Unrealized
Loss
|
Number of Securities
|
Fair
Value
|
Gross
Unrealized
Loss
|
Number of Securities
|
Fair
Value
|
Gross
Unrealized
Loss
|
|||||||||||||||
|
(Dollars in thousands)
|
||||||||||||||||||||||||
|
Debt securities:
|
|
|
|
|
|
|
||||||||||||||||||
|
U.S. Government-
sponsored enterprises
|
13
|
|
$
|
8,351
|
|
$
|
(180
|
)
|
3
|
|
$
|
1,172
|
|
$
|
(16
|
)
|
16
|
|
$
|
9,523
|
|
$
|
(196
|
)
|
|
Agency MBS
|
22
|
|
15,141
|
|
(261
|
)
|
1
|
|
344
|
|
(8
|
)
|
23
|
|
15,485
|
|
(269
|
)
|
||||||
|
State and political
subdivisions
|
40
|
|
16,481
|
|
(650
|
)
|
—
|
|
—
|
|
—
|
|
40
|
|
16,481
|
|
(650
|
)
|
||||||
|
Corporate
|
8
|
|
3,973
|
|
(56
|
)
|
4
|
|
1,627
|
|
(73
|
)
|
12
|
|
5,600
|
|
(129
|
)
|
||||||
|
Total
|
83
|
|
$
|
43,946
|
|
$
|
(1,147
|
)
|
8
|
|
$
|
3,143
|
|
$
|
(97
|
)
|
91
|
|
$
|
47,089
|
|
$
|
(1,244
|
)
|
The Company has the ability to hold the investment securities that had unrealized losses at
December 31, 2017
for the foreseeable future and
no
declines were deemed by management to be OTT.
62
The following table presents the proceeds, gross gains and gross losses from sales of available-for-sale securities:
|
For The Years Ended December 31,
|
|||||||||
|
2017
|
2016
|
2015
|
|||||||
|
(Dollars in thousands)
|
|||||||||
|
Proceeds
|
$
|
14,409
|
|
$
|
6,620
|
|
$
|
11,540
|
|
|
Gross gains
|
147
|
|
131
|
|
66
|
|
|||
|
Gross losses
|
(130
|
)
|
(60
|
)
|
(13
|
)
|
|||
|
Net gains
|
$
|
17
|
|
$
|
71
|
|
$
|
53
|
|
The amortized cost and estimated fair value of debt securities by contractual scheduled maturity as of
December 31, 2017
, were as follows:
|
Amortized
Cost
|
Fair
Value
|
|||||
|
(Dollars in thousands)
|
||||||
|
Available-for-sale
|
|
|
||||
|
Due from one to five years
|
$
|
3,818
|
|
$
|
3,871
|
|
|
Due from five to ten years
|
16,858
|
|
16,834
|
|
||
|
Due after ten years
|
16,245
|
|
16,097
|
|
||
|
|
36,921
|
|
36,802
|
|
||
|
Agency MBS
|
28,378
|
|
28,116
|
|
||
|
Total debt securities available-for-sale
|
$
|
65,299
|
|
$
|
64,918
|
|
|
Held-to-maturity
|
||||||
|
Due in one year or less
|
$
|
1,000
|
|
$
|
999
|
|
|
Total debt securities held-to-maturity
|
$
|
1,000
|
|
$
|
999
|
|
Actual maturities may differ for certain debt securities that may be called by the issuer prior to the contractual maturity. Actual maturities may differ from contractual maturities on agency MBS because the mortgages underlying the securities may be prepaid, usually without any penalties. Therefore, these agency MBS are shown separately and not included in the contractual maturity categories in the above maturity summary.
At
December 31, 2017
and
2016
, loans held for sale consisted of conventional residential mortgages originated for subsequent sale. At
December 31, 2017
and
2016
, the estimated fair value of these loans was in excess of their carrying value, and therefore no valuation reserve was necessary for loans held for sale.
Commercial and residential mortgage loans serviced for others are not included in the accompanying balance sheets. The unpaid principal balance of commercial and residential mortgage loans serviced for others was
$499.2 million
and
$452.0 million
at
December 31, 2017
and
2016
, respectively.
Loans sold consisted of the following during the years ended December 31:
|
2017
|
2016
|
2015
|
||||||||||||||||
|
Loans Sold
|
Net Gains on Sale
|
Loans Sold
|
Net Gains on Sale
|
Loans Sold
|
Net Gains on Sale
|
|||||||||||||
|
(Dollars in thousands)
|
||||||||||||||||||
|
Residential loans
|
$
|
121,985
|
|
$
|
2,279
|
|
$
|
135,294
|
|
$
|
2,880
|
|
$
|
131,706
|
|
$
|
2,871
|
|
|
Commercial loans
|
226
|
|
24
|
|
251
|
|
18
|
|
—
|
|
—
|
|
||||||
|
Total
|
$
|
122,211
|
|
$
|
2,303
|
|
$
|
135,545
|
|
$
|
2,898
|
|
$
|
131,706
|
|
$
|
2,871
|
|
There were no obligations to repurchase loans for any amount at
December 31, 2017
, but there were contractual risk sharing commitments on certain sold loans totaling
$665 thousand
as of such date.
63
The Company generally retains the servicing rights on loans sold. At
December 31, 2017
and
2016
, the unamortized balance of servicing rights on loans sold with servicing retained was
$1.7 million
and
$1.6 million
, respectively, and is included in Other assets. The estimated fair value of these servicing rights was in excess of their carrying value at
December 31, 2017
and
2016
, and therefore
no
impairment reserve was necessary. The net capitalization and amortization of MSRs is included in Other income.
The following table presents the capitalization and amortization of loan servicing rights:
|
For The Years Ended December 31,
|
|||||||||
|
2017
|
2016
|
2015
|
|||||||
|
(Dollars in thousands)
|
|||||||||
|
Capitalization of servicing rights
|
$
|
770
|
|
$
|
823
|
|
$
|
839
|
|
|
Amortization of servicing rights
|
716
|
|
720
|
|
670
|
|
|||
|
Net capitalization of servicing rights
|
$
|
54
|
|
$
|
103
|
|
$
|
169
|
|
The composition of Net loans at
December 31,
was as follows:
|
2017
|
2016
|
|||||
|
(Dollars in thousands)
|
||||||
|
Residential real estate
|
$
|
178,999
|
|
$
|
172,727
|
|
|
Construction real estate
|
42,935
|
|
34,189
|
|
||
|
Commercial real estate
|
254,291
|
|
249,063
|
|
||
|
Commercial
|
50,719
|
|
41,999
|
|
||
|
Consumer
|
3,894
|
|
3,962
|
|
||
|
Municipal
|
55,777
|
|
31,350
|
|
||
|
Gross loans
|
586,615
|
|
533,290
|
|
||
|
Allowance for loan losses
|
(5,408
|
)
|
(5,247
|
)
|
||
|
Net deferred loan costs
|
795
|
|
649
|
|
||
|
Net loans
|
$
|
582,002
|
|
$
|
528,692
|
|
Qualifying residential first mortgage loans and certain commercial real estate loans held by Union may also be pledged as collateral for borrowings from the FHLB under a blanket lien. During 2017, a separate agreement was established with the FHLB pursuant to which the Company has the authority to collateralize deposits of municipalities, up to its available FHLB borrowing capacity, with letters of credit issued by the FHLB. At
December 31, 2017
,
$29.6 million
of qualifying loans were pledged as collateral to FHLB for these deposits. There were
no
loans pledged as collateral on deposits of municipalities at
December 31, 2016
.
A summary of current, past due and nonaccrual loans as of the balance sheet dates follows:
|
December 31, 2017
|
Current
|
30-59 Days
|
60-89 Days
|
90 Days and over and accruing
|
Nonaccrual
|
Total
|
||||||||||||
|
(Dollars in thousands)
|
||||||||||||||||||
|
Residential real estate
|
$
|
173,914
|
|
$
|
3,047
|
|
$
|
750
|
|
$
|
472
|
|
$
|
816
|
|
$
|
178,999
|
|
|
Construction real estate
|
42,857
|
|
—
|
|
—
|
|
22
|
|
56
|
|
42,935
|
|
||||||
|
Commercial real estate
|
253,266
|
|
357
|
|
361
|
|
—
|
|
307
|
|
254,291
|
|
||||||
|
Commercial
|
50,675
|
|
21
|
|
11
|
|
—
|
|
12
|
|
50,719
|
|
||||||
|
Consumer
|
3,884
|
|
7
|
|
3
|
|
—
|
|
—
|
|
3,894
|
|
||||||
|
Municipal
|
55,777
|
|
—
|
|
—
|
|
—
|
|
—
|
|
55,777
|
|
||||||
|
Total
|
$
|
580,373
|
|
$
|
3,432
|
|
$
|
1,125
|
|
$
|
494
|
|
$
|
1,191
|
|
$
|
586,615
|
|
64
|
December 31, 2016
|
Current
|
30-59 Days
|
60-89 Days
|
90 Days and over and accruing
|
Nonaccrual
|
Total
|
||||||||||||
|
(Dollars in thousands)
|
||||||||||||||||||
|
Residential real estate
|
$
|
168,125
|
|
$
|
1,661
|
|
$
|
472
|
|
$
|
672
|
|
$
|
1,797
|
|
$
|
172,727
|
|
|
Construction real estate
|
34,148
|
|
17
|
|
—
|
|
—
|
|
24
|
|
34,189
|
|
||||||
|
Commercial real estate
|
245,402
|
|
1,642
|
|
153
|
|
157
|
|
1,709
|
|
249,063
|
|
||||||
|
Commercial
|
41,920
|
|
12
|
|
42
|
|
10
|
|
15
|
|
41,999
|
|
||||||
|
Consumer
|
3,946
|
|
12
|
|
3
|
|
1
|
|
—
|
|
3,962
|
|
||||||
|
Municipal
|
31,350
|
|
—
|
|
—
|
|
—
|
|
—
|
|
31,350
|
|
||||||
|
Total
|
$
|
524,891
|
|
$
|
3,344
|
|
$
|
670
|
|
$
|
840
|
|
$
|
3,545
|
|
$
|
533,290
|
|
There were
no
residential real estate loans in process of foreclosure at
December 31, 2017
. Aggregate interest on nonaccrual loans not recognized was
$1.2 million
for the year ended December 31
,
2017
,
$1.3 million
for the year ended December 31
,
2016
and
$1.2 million
for the year ended December 31
,
2015
.
Changes in the ALL, by class of loans, were as follows
for the years ended
:
|
December 31, 2017
|
Residential Real Estate
|
Construction Real Estate
|
Commercial Real Estate
|
Commercial
|
Consumer
|
Municipal
|
Unallocated
|
Total
|
||||||||||||||||
|
(Dollars in thousands)
|
||||||||||||||||||||||||
|
Balance, December 31, 2016
|
$
|
1,399
|
|
$
|
391
|
|
$
|
2,687
|
|
$
|
342
|
|
$
|
26
|
|
$
|
40
|
|
$
|
362
|
|
$
|
5,247
|
|
|
Provision for loan losses
|
17
|
|
73
|
|
20
|
|
49
|
|
16
|
|
24
|
|
1
|
|
200
|
|
||||||||
|
Recoveries of amounts
charged off
|
138
|
|
24
|
|
—
|
|
4
|
|
2
|
|
—
|
|
—
|
|
168
|
|
||||||||
|
1,554
|
|
488
|
|
2,707
|
|
395
|
|
44
|
|
64
|
|
363
|
|
5,615
|
|
|||||||||
|
Amounts charged off
|
(193
|
)
|
—
|
|
—
|
|
—
|
|
(14
|
)
|
—
|
|
—
|
|
(207
|
)
|
||||||||
|
Balance, December 31, 2017
|
$
|
1,361
|
|
$
|
488
|
|
$
|
2,707
|
|
$
|
395
|
|
$
|
30
|
|
$
|
64
|
|
$
|
363
|
|
$
|
5,408
|
|
|
December 31, 2016
|
Residential Real Estate
|
Construction Real Estate
|
Commercial Real Estate
|
Commercial
|
Consumer
|
Municipal
|
Unallocated
|
Total
|
||||||||||||||||
|
(Dollars in thousands)
|
||||||||||||||||||||||||
|
Balance, December 31, 2015
|
$
|
1,419
|
|
$
|
514
|
|
$
|
2,792
|
|
$
|
209
|
|
$
|
28
|
|
$
|
38
|
|
$
|
201
|
|
$
|
5,201
|
|
|
Provision (credit) for loan
losses
|
64
|
|
(135
|
)
|
(105
|
)
|
158
|
|
5
|
|
2
|
|
161
|
|
150
|
|
||||||||
|
Recoveries of amounts
charged off
|
36
|
|
12
|
|
—
|
|
8
|
|
3
|
|
—
|
|
—
|
|
59
|
|
||||||||
|
1,519
|
|
391
|
|
2,687
|
|
375
|
|
36
|
|
40
|
|
362
|
|
5,410
|
|
|||||||||
|
Amounts charged off
|
(120
|
)
|
—
|
|
—
|
|
(33
|
)
|
(10
|
)
|
—
|
|
—
|
|
(163
|
)
|
||||||||
|
Balance, December 31, 2016
|
$
|
1,399
|
|
$
|
391
|
|
$
|
2,687
|
|
$
|
342
|
|
$
|
26
|
|
$
|
40
|
|
$
|
362
|
|
$
|
5,247
|
|
|
December 31, 2015
|
Residential Real Estate
|
Construction Real Estate
|
Commercial Real Estate
|
Commercial
|
Consumer
|
Municipal
|
Unallocated
|
Total
|
||||||||||||||||
|
(Dollars in thousands)
|
||||||||||||||||||||||||
|
Balance, December 31, 2014
|
$
|
1,330
|
|
$
|
439
|
|
$
|
2,417
|
|
$
|
176
|
|
$
|
27
|
|
$
|
42
|
|
$
|
263
|
|
$
|
4,694
|
|
|
Provision (credit) for loan
losses
|
136
|
|
47
|
|
375
|
|
46
|
|
12
|
|
(4
|
)
|
(62
|
)
|
550
|
|
||||||||
|
Recoveries of amounts
charged off
|
36
|
|
28
|
|
—
|
|
16
|
|
3
|
|
—
|
|
—
|
|
83
|
|
||||||||
|
1,502
|
|
514
|
|
2,792
|
|
238
|
|
42
|
|
38
|
|
201
|
|
5,327
|
|
|||||||||
|
Amounts charged off
|
(83
|
)
|
—
|
|
—
|
|
(29
|
)
|
(14
|
)
|
—
|
|
—
|
|
(126
|
)
|
||||||||
|
Balance, December 31, 2015
|
$
|
1,419
|
|
$
|
514
|
|
$
|
2,792
|
|
$
|
209
|
|
$
|
28
|
|
$
|
38
|
|
$
|
201
|
|
$
|
5,201
|
|
65
The allocation of the ALL, summarized on the basis of the Company's impairment methodology by class of loan, as of the balance sheet dates, was as follows:
|
December 31, 2017
|
Residential Real Estate
|
Construction Real Estate
|
Commercial Real Estate
|
Commercial
|
Consumer
|
Municipal
|
Unallocated
|
Total
|
||||||||||||||||
|
(Dollars in thousands)
|
||||||||||||||||||||||||
|
Individually evaluated
for impairment
|
$
|
47
|
|
$
|
—
|
|
$
|
1
|
|
$
|
—
|
|
$
|
—
|
|
$
|
—
|
|
$
|
—
|
|
$
|
48
|
|
|
Collectively evaluated
for impairment
|
1,314
|
|
488
|
|
2,706
|
|
395
|
|
30
|
|
64
|
|
363
|
|
5,360
|
|
||||||||
|
Total allocated
|
$
|
1,361
|
|
$
|
488
|
|
$
|
2,707
|
|
$
|
395
|
|
$
|
30
|
|
$
|
64
|
|
$
|
363
|
|
$
|
5,408
|
|
|
December 31, 2016
|
Residential Real Estate
|
Construction Real Estate
|
Commercial Real Estate
|
Commercial
|
Consumer
|
Municipal
|
Unallocated
|
Total
|
||||||||||||||||
|
(Dollars in thousands)
|
||||||||||||||||||||||||
|
Individually evaluated
for impairment
|
$
|
63
|
|
$
|
—
|
|
$
|
40
|
|
$
|
—
|
|
$
|
—
|
|
$
|
—
|
|
$
|
—
|
|
$
|
103
|
|
|
Collectively evaluated
for impairment
|
1,336
|
|
391
|
|
2,647
|
|
342
|
|
26
|
|
40
|
|
362
|
|
5,144
|
|
||||||||
|
Total allocated
|
$
|
1,399
|
|
$
|
391
|
|
$
|
2,687
|
|
$
|
342
|
|
$
|
26
|
|
$
|
40
|
|
$
|
362
|
|
$
|
5,247
|
|
Despite the allocation shown in the tables above, the ALL is general in nature and is available to absorb losses from any class of loan.
The recorded investment in loans, summarized on the basis of the Company's impairment methodology by class of loan, as of the balance sheet dates, was as follows:
|
December 31, 2017
|
Residential Real Estate
|
Construction Real Estate
|
Commercial Real Estate
|
Commercial
|
Consumer
|
Municipal
|
Total
|
||||||||||||||
|
(Dollars in thousands)
|
|||||||||||||||||||||
|
Individually evaluated
for impairment
|
$
|
1,718
|
|
$
|
82
|
|
$
|
1,074
|
|
$
|
378
|
|
$
|
—
|
|
$
|
—
|
|
$
|
3,252
|
|
|
Collectively evaluated
for impairment
|
177,281
|
|
42,853
|
|
253,217
|
|
50,341
|
|
3,894
|
|
55,777
|
|
583,363
|
|
|||||||
|
Total
|
$
|
178,999
|
|
$
|
42,935
|
|
$
|
254,291
|
|
$
|
50,719
|
|
$
|
3,894
|
|
$
|
55,777
|
|
$
|
586,615
|
|
|
December 31, 2016
|
Residential Real Estate
|
Construction Real Estate
|
Commercial Real Estate
|
Commercial
|
Consumer
|
Municipal
|
Total
|
||||||||||||||
|
(Dollars in thousands)
|
|||||||||||||||||||||
|
Individually evaluated
for impairment
|
$
|
1,448
|
|
$
|
88
|
|
$
|
3,328
|
|
$
|
432
|
|
$
|
—
|
|
$
|
—
|
|
$
|
5,296
|
|
|
Collectively evaluated
for impairment
|
171,279
|
|
34,101
|
|
245,735
|
|
41,567
|
|
3,962
|
|
31,350
|
|
527,994
|
|
|||||||
|
Total
|
$
|
172,727
|
|
$
|
34,189
|
|
$
|
249,063
|
|
$
|
41,999
|
|
$
|
3,962
|
|
$
|
31,350
|
|
$
|
533,290
|
|
Risk and collateral ratings are assigned to loans and are subject to ongoing monitoring by lending and credit personnel with such ratings updated annually or more frequently if warranted. The following is an overview of the Company's loan rating system:
1-3 Rating - Pass
Risk-rating grades "1" through "3" comprise loans ranging from those with lower than average credit risk, defined as borrowers with high liquidity, excellent financial condition, strong management, favorable industry trends or loans secured by highly liquid assets, through those with marginal credit risk, defined as borrowers that, while creditworthy, exhibit some characteristics requiring special attention by the account officer.
66
4/M Rating - Satisfactory/Monitor
Borrowers exhibit potential credit weaknesses or downward trends warranting management's attention. While potentially weak, these borrowers are currently marginally acceptable; no loss of principal or interest is envisioned. When warranted, these credits may be monitored on the watch list.
5-7 Rating - Substandard
Borrowers exhibit well defined weaknesses that jeopardize the orderly liquidation of debt. The loan may be inadequately protected by the net worth and paying capacity of the obligor and/or the underlying collateral is inadequate.
The following tables summarize the loan ratings applied to the Company's loans by class as of the balance sheet dates:
|
December 31, 2017
|
Residential Real Estate
|
Construction Real Estate
|
Commercial Real Estate
|
Commercial
|
Consumer
|
Municipal
|
Total
|
||||||||||||||
|
(Dollars in thousands)
|
|||||||||||||||||||||
|
Pass
|
$
|
164,733
|
|
$
|
33,401
|
|
$
|
177,388
|
|
$
|
38,877
|
|
$
|
3,859
|
|
$
|
55,777
|
|
$
|
474,035
|
|
|
Satisfactory/Monitor
|
11,296
|
|
9,374
|
|
73,772
|
|
11,165
|
|
30
|
|
—
|
|
105,637
|
|
|||||||
|
Substandard
|
2,970
|
|
160
|
|
3,131
|
|
677
|
|
5
|
|
—
|
|
6,943
|
|
|||||||
|
Total
|
$
|
178,999
|
|
$
|
42,935
|
|
$
|
254,291
|
|
$
|
50,719
|
|
$
|
3,894
|
|
$
|
55,777
|
|
$
|
586,615
|
|
|
December 31, 2016
|
Residential Real Estate
|
Construction Real Estate
|
Commercial Real Estate
|
Commercial
|
Consumer
|
Municipal
|
Total
|
||||||||||||||
|
(Dollars in thousands)
|
|||||||||||||||||||||
|
Pass
|
$
|
158,140
|
|
$
|
29,248
|
|
$
|
182,247
|
|
$
|
38,219
|
|
$
|
3,928
|
|
$
|
31,350
|
|
$
|
443,132
|
|
|
Satisfactory/Monitor
|
10,641
|
|
4,830
|
|
62,193
|
|
3,109
|
|
34
|
|
—
|
|
80,807
|
|
|||||||
|
Substandard
|
3,946
|
|
111
|
|
4,623
|
|
671
|
|
—
|
|
—
|
|
9,351
|
|
|||||||
|
Total
|
$
|
172,727
|
|
$
|
34,189
|
|
$
|
249,063
|
|
$
|
41,999
|
|
$
|
3,962
|
|
$
|
31,350
|
|
$
|
533,290
|
|
The following tables provide information with respect to impaired loans by class of loan as of and
for the years ended
December 31, 2017
,
2016
and
2015
:
|
December 31, 2017
|
For The Year Ended December 31, 2017
|
||||||||||||||
|
Recorded Investment
(1)
|
Principal Balance
(1)
|
Related Allowance
|
Average Recorded Investment
|
Interest Income Recognized
|
|||||||||||
|
(Dollars in thousands)
|
|||||||||||||||
|
Residential real estate
|
$
|
238
|
|
$
|
247
|
|
$
|
47
|
|
||||||
|
Commercial real estate
|
137
|
|
141
|
|
1
|
|
|||||||||
|
With an allowance recorded
|
375
|
|
388
|
|
48
|
|
|||||||||
|
Residential real estate
|
1,480
|
|
1,983
|
|
—
|
|
|||||||||
|
Construction real estate
|
82
|
|
82
|
|
—
|
|
|||||||||
|
Commercial real estate
|
937
|
|
1,011
|
|
—
|
|
|||||||||
|
Commercial
|
378
|
|
378
|
|
—
|
|
|||||||||
|
With no allowance recorded
|
2,877
|
|
3,454
|
|
—
|
|
|||||||||
|
Residential real estate
|
1,718
|
|
2,230
|
|
47
|
|
$
|
1,691
|
|
$
|
67
|
|
|||
|
Construction real estate
|
82
|
|
82
|
|
—
|
|
85
|
|
4
|
|
|||||
|
Commercial real estate
|
1,074
|
|
1,152
|
|
1
|
|
1,975
|
|
86
|
|
|||||
|
Commercial
|
378
|
|
378
|
|
—
|
|
405
|
|
26
|
|
|||||
|
Total
|
$
|
3,252
|
|
$
|
3,842
|
|
$
|
48
|
|
$
|
4,156
|
|
$
|
183
|
|
67
|
December 31, 2016
|
For The Year Ended December 31, 2016
|
||||||||||||||
|
Recorded Investment
(1)
|
Principal Balance
(1)
|
Related Allowance
|
Average Recorded Investment
|
Interest Income Recognized
|
|||||||||||
|
(Dollars in thousands)
|
|||||||||||||||
|
Residential real estate
|
$
|
308
|
|
$
|
317
|
|
$
|
63
|
|
||||||
|
Commercial real estate
|
488
|
|
520
|
|
40
|
|
|||||||||
|
With an allowance recorded
|
796
|
|
837
|
|
103
|
|
|||||||||
|
Residential real estate
|
1,140
|
|
1,561
|
|
—
|
|
|||||||||
|
Construction real estate
|
88
|
|
88
|
|
—
|
|
|||||||||
|
Commercial real estate
|
2,840
|
|
2,910
|
|
—
|
|
|||||||||
|
Commercial
|
432
|
|
432
|
|
—
|
|
|||||||||
|
With no allowance recorded
|
4,500
|
|
4,991
|
|
—
|
|
|||||||||
|
Residential real estate
|
1,448
|
|
1,878
|
|
63
|
|
$
|
1,303
|
|
$
|
50
|
|
|||
|
Construction real estate
|
88
|
|
88
|
|
—
|
|
90
|
|
4
|
|
|||||
|
Commercial real estate
|
3,328
|
|
3,430
|
|
40
|
|
3,113
|
|
107
|
|
|||||
|
Commercial
|
432
|
|
432
|
|
—
|
|
462
|
|
33
|
|
|||||
|
Total
|
$
|
5,296
|
|
$
|
5,828
|
|
$
|
103
|
|
$
|
4,968
|
|
$
|
194
|
|
|
December 31, 2015
|
For The Year Ended December 31, 2015
|
||||||||||||||
|
Recorded Investment
(1)
|
Principal Balance
(1)
|
Related Allowance
|
Average Recorded Investment
|
Interest Income Recognized
|
|||||||||||
|
(Dollars in thousands)
|
|||||||||||||||
|
Residential real estate
|
$
|
659
|
|
$
|
668
|
|
$
|
109
|
|
||||||
|
Commercial real estate
|
2,142
|
|
2,161
|
|
227
|
|
|||||||||
|
Commercial
|
493
|
|
493
|
|
21
|
|
|||||||||
|
With an allowance recorded
|
3,294
|
|
3,322
|
|
357
|
|
|||||||||
|
Residential real estate
|
538
|
|
697
|
|
—
|
|
|||||||||
|
Construction real estate
|
92
|
|
92
|
|
—
|
|
|||||||||
|
Commercial real estate
|
952
|
|
1,015
|
|
—
|
|
|||||||||
|
With no allowance recorded
|
1,582
|
|
1,804
|
|
—
|
|
|||||||||
|
Residential real estate
|
1,197
|
|
1,365
|
|
109
|
|
$
|
942
|
|
$
|
34
|
|
|||
|
Construction real estate
|
92
|
|
92
|
|
—
|
|
162
|
|
19
|
|
|||||
|
Commercial real estate
|
3,094
|
|
3,176
|
|
227
|
|
3,523
|
|
219
|
|
|||||
|
Commercial
|
493
|
|
493
|
|
21
|
|
123
|
|
—
|
|
|||||
|
Total
|
$
|
4,876
|
|
$
|
5,126
|
|
$
|
357
|
|
$
|
4,750
|
|
$
|
272
|
|
____________________
|
(1)
|
Does not reflect government guaranties on impaired loans as of
December 31, 2017
,
2016
and
2015
totaling
$550 thousand
,
$637 thousand
and
$606 thousand
, respectively.
|
68
The following is a summary of TDR loans by class of loan as of the balance sheet dates:
|
December 31, 2017
|
December 31, 2016
|
|||||||||
|
Number of Loans
|
Principal Balance
|
Number of Loans
|
Principal Balance
|
|||||||
|
(Dollars in thousands)
|
||||||||||
|
Residential real estate
|
24
|
|
$
|
1,718
|
|
20
|
|
$
|
1,448
|
|
|
Construction real estate
|
1
|
|
82
|
|
1
|
|
88
|
|
||
|
Commercial real estate
|
10
|
|
1,074
|
|
10
|
|
1,452
|
|
||
|
Commercial
|
2
|
|
378
|
|
2
|
|
431
|
|
||
|
Total
|
37
|
|
$
|
3,252
|
|
33
|
|
$
|
3,419
|
|
The TDR loans above represent loan modifications in which a concession was provided to the borrower, including due date extensions, maturity date extensions, interest rate reductions or the forgiveness of accrued interest. Troubled loans that are restructured and meet established thresholds are classified as impaired and a specific reserve amount is allocated to the ALL on the basis of the fair value of the collateral for collateral dependent loans, an observable market price, or the present value of anticipated future cash flows.
The following table provides new TDR activity by class of loan
for the years ended December 31, 2017 and 2016
:
|
New TDRs During the
|
New TDRs During the
|
|||||||||||||||
|
Year Ended December 31, 2017
|
Year Ended December 31, 2016
|
|||||||||||||||
|
Number of Contracts
|
Pre-Modification Outstanding Recorded Investment
|
Post-Modification Outstanding Recorded Investment
|
Number of Contracts
|
Pre-Modification Outstanding Recorded Investment
|
Post-Modification Outstanding Recorded Investment
|
|||||||||||
|
(Dollars in thousands)
|
||||||||||||||||
|
Residential real estate
|
9
|
|
$
|
649
|
|
$
|
673
|
|
9
|
|
$
|
349
|
|
$
|
371
|
|
|
Commercial real estate
|
2
|
|
293
|
|
293
|
|
6
|
|
803
|
|
807
|
|
||||
At
December 31, 2017
, there was
one
residential TDR loan with a recorded investment balance of
$62 thousand
that defaulted during the year ended
December 31, 2017
and had been modified within the previous twelve months. At
December 31, 2016
, there were
no
TDR loans modified within the previous twelve months that had subsequently defaulted during the year end. TDR loans are considered defaulted at 90 days past due.
At
December 31, 2017
and
2016
, the Company was not committed to lend any additional funds to borrowers whose loans were nonperforming, impaired or restructured.
The major classes of premises and equipment and accumulated depreciation at
December 31
, were as follows:
|
|
2017
|
2016
|
||||
|
(Dollars in thousands)
|
||||||
|
Land and land improvements
|
$
|
2,975
|
|
$
|
2,930
|
|
|
Building and improvements
|
14,261
|
|
13,057
|
|
||
|
Furniture and equipment
|
7,450
|
|
8,833
|
|
||
|
Construction in progress and deposits on equipment
|
438
|
|
34
|
|
||
|
|
25,124
|
|
24,854
|
|
||
|
Less accumulated depreciation
|
(10,869
|
)
|
(11,329
|
)
|
||
|
|
$
|
14,255
|
|
$
|
13,525
|
|
Depreciation included in Occupancy and Equipment expenses amounted to
$1.2 million
,
$1.3 million
and
$1.1 million
for the years ended December 31, 2017, 2016 and 2015
, respectively.
69
The Company is obligated under noncancelable operating leases for premises that expire in various years through the year 2022. Options to renew for additional periods are available with these leases. Future minimum rental commitments for these leases with original or remaining terms of one year or more at
December 31, 2017
were as follows:
|
(Dollars in thousands)
|
|
||||
|
2018
|
$
|
134
|
|
||
|
2019
|
91
|
|
|||
|
2020
|
60
|
|
|||
|
2021
|
52
|
|
|||
|
2022
|
12
|
|
|||
|
|
$
|
349
|
|
||
Rent expense for
2017
,
2016
and
2015
amounted to
$148 thousand
,
$144 thousand
and
$138 thousand
, respectively. Occupancy expense is shown in the consolidated statements of income, net of rental income of
$194 thousand
,
$220 thousand
and
$227 thousand
in
2017
,
2016
and
2015
, respectively.
As a result of the 2011 Branch Acquisition, the Company recorded goodwill amounting to
$2.2 million
. The goodwill is not amortizable. Goodwill is evaluated for impairment annually, in accordance with current authoritative accounting guidance. Management assesses qualitative factors to determine whether the existence of events or circumstances leads to a determination that it is more likely than not that the fair value of the Company, in total, is less than its carrying amount. Management is not aware of any such events or circumstances that would cause it to conclude that the fair value of the Company is less than its carrying amount.
The Company also recorded
$1.7 million
of acquired identifiable intangible assets in connection with the 2011 Branch Acquisition, representing the core deposit intangible which is subject to straight-line amortization over the estimated 10 year average life of the acquired core deposit base, absent any future impairment. Management will evaluate the core deposit intangible for impairment if conditions warrant.
Amortization expense for the core deposit intangible was
$171 thousand
for
2017
,
2016
and
2015
. The amortization expense is included in Other expenses on the consolidated statements of income and is deductible for tax purposes. As of
December 31, 2017
, the remaining amortization expense related to the core deposit intangible, absent any future impairment, is expected to be as follows:
|
(Dollars in thousands)
|
|||||
|
2018
|
171
|
|
|||
|
2019
|
171
|
|
|||
|
2020
|
171
|
|
|||
|
2021
|
70
|
|
|||
|
Total
|
$
|
583
|
|
||
The Company has purchased from time to time various interests in limited partnerships established to acquire, own and rent residential housing for elderly, low or moderate income individuals in northern Vermont and New Hampshire. The carrying values of investments carried at equity were
$3.2 million
and
$2.8 million
at
December 31, 2017
and
2016
, respectively. The capital contribution payable related to these investments was
$546 thousand
and
$27 thousand
at
December 31, 2017
and
2016
, respectively. The provision for undistributed net losses of the partnerships charged to earnings was
$627 thousand
for
2017
,
$565 thousand
for
2016
, and
$484 thousand
for
2015
. The federal income tax credits related to limited partnership investments were
$660 thousand
,
$881 thousand
, and
$564 thousand
for the years ended
December 31, 2017
,
2016
and
2015
, respectively, and are recorded as a reduction of the Provision for income taxes. See Note 13.
70
The following is a summary of interest bearing deposits at
December 31
:
|
|
2017
|
2016
|
||||
|
(Dollars in thousands)
|
||||||
|
Interest bearing checking accounts
|
$
|
162,996
|
|
$
|
143,037
|
|
|
Savings and money market accounts
|
255,625
|
|
239,046
|
|
||
|
Time deposits, $100,000 and over
|
41,182
|
|
40,581
|
|
||
|
Other time deposits
|
59,947
|
|
62,612
|
|
||
|
|
$
|
519,750
|
|
$
|
485,276
|
|
The following is a summary of time deposits by maturity at
December 31, 2017
:
|
(Dollars in thousands)
|
|||||
|
2018
|
$
|
62,544
|
|
||
|
2019
|
21,951
|
|
|||
|
2020
|
6,468
|
|
|||
|
2021
|
5,020
|
|
|||
|
2022
|
5,146
|
|
|||
|
|
$
|
101,129
|
|
||
Time deposits of
$9.9 million
and
$8.7 million
equal or exceed the FDIC insurance limit of $250 thousand at
December 31, 2017
and
2016
, respectively.
Borrowed funds were comprised of option advance borrowings from the FHLB of
$30.2 million
and
$30.5 million
at
December 31, 2017
and
2016
, respectively, and secured customer repurchase agreement sweeps of
$1.4 million
and
$1.1 million
at
December 31, 2017
and
2016
, respectively.
The FHLB option advance borrowings are a mix of straight bullets, balloons and amortizers with maturities through 2021. All of the FHLB borrowings had fixed interest rates ranging from
0.00%
to
4.31%
at
December 31, 2017
and
December 31, 2016
. The weighted average interest rates on the borrowings were
1.42%
at
December 31, 2017
and
2016
.
The contractual payments due for FHLB option advance borrowings, as of
December 31, 2017
, were as follows:
|
(Dollars in thousands)
|
|||||
|
2018
|
$
|
19,765
|
|
||
|
2019
|
10,287
|
|
|||
|
2020
|
—
|
|
|||
|
2021
|
164
|
|
|||
|
|
$
|
30,216
|
|
||
The Company has established both overnight and longer term lines of credit with the FHLB. These borrowings are secured by a blanket lien on qualified collateral consisting primarily of loans with first mortgages secured by one-to-four family properties and certain commercial real estate loans. At
December 31, 2017
, pledged loans with a carrying value of
$164.5 million
provided a borrowing capacity of
$100.6 million
at the FHLB, less borrowings and other credit subject to collateralization of
$60.8 million
, resulting in remaining year-end capacity of
$39.8 million
. At
December 31, 2016
, pledged loans with a carrying value of
$161.3 million
provided a borrowing capacity of
$91.5 million
at the FHLB, less borrowings and other credit subject to collateralization of
$31.7 million
, resulting in remaining year-end capacity of
$59.8 million
.
During 2017, a separate agreement was established with the FHLB where the Company has the authority, up to its available borrowing capacity, to collateralize public unit deposits with letters of credit issued by the FHLB. At
December 31, 2017
, FHLB letters of credit in the amount of
$29.6 million
were utilized as collateral for these deposits. There were
no
FHLB letters of credit utilized as collateral for public unit deposits at
December 31, 2016
.
71
In addition to its borrowing arrangements with the FHLB, Union maintains preapproved Federal Funds lines of credit with correspondent banks totaling
$10.0 million
. Interest on these borrowings is payable daily and charged at the federal funds rate at the time of the borrowing. Union also maintains a repurchase agreement line of credit and has access to the Federal Reserve discount window. There were
no
outstanding borrowings on the Federal Funds purchase lines, repurchase agreement line, or at the discount window at
December 31, 2017
or
2016
.
Secured customer repurchase agreement sweeps are collateralized by U.S. Government-sponsored enterprise securities with a carrying value of
$2.0 million
at
December 31, 2017
and
$1.8 million
at
December 31, 2016
. The average daily balance of these repurchase agreement sweeps was
$1.6 million
during
2017
and
2016
with weighted average interest rates of
0.26%
during
2017
and
2016
. The maximum borrowings outstanding on these agreements during
2017
and
2016
were
$4.9 million
and
$4.4 million
, respectively. These repurchase agreements mature the next business day and carried weighted average interest rates of
0.25%
at
December 31, 2017
and
0.23%
as of December 31,
2016
.
The components of the Provision for income taxes for the years ended
December 31
, were as follows:
|
|
2017
|
2016
|
2015
|
||||||
|
(Dollars in thousands)
|
|||||||||
|
Current tax provision
|
$
|
2,610
|
|
$
|
2,032
|
|
$
|
2,322
|
|
|
Deferred tax provision
|
993
|
|
566
|
|
341
|
|
|||
|
|
$
|
3,603
|
|
$
|
2,598
|
|
$
|
2,663
|
|
As a result of the Tax Cuts and Jobs Act signed into law on December 22, 2017, the federal tax rate decreased from 34% to 21% effective January 1, 2018. The deferred tax provision and Provision for income taxes shown above were impacted by a one-time charge of
$447 thousand
for the revaluation of the Company's deferred tax assets to reflect the 21% tax rate for future periods.
The total Provision for income taxes differs from the amounts computed at the statutory federal income tax rate of
34%
primarily due to the following for the years ended
December 31
:
|
|
2017
|
2016
|
2015
|
||||||
|
(Dollars in thousands)
|
|||||||||
|
Computed “expected” tax expense
|
$
|
3,884
|
|
$
|
3,585
|
|
$
|
3,419
|
|
|
Tax exempt interest
|
(642
|
)
|
(596
|
)
|
(613
|
)
|
|||
|
Increase in cash surrender value of COLI
|
(83
|
)
|
(115
|
)
|
(96
|
)
|
|||
|
Tax credits
|
(694
|
)
|
(896
|
)
|
(564
|
)
|
|||
|
Equity in losses of limited partnerships
|
627
|
|
565
|
|
484
|
|
|||
|
Adjustment for effect of enacted tax law changes
|
447
|
|
—
|
|
—
|
|
|||
|
Other
|
64
|
|
55
|
|
33
|
|
|||
|
|
$
|
3,603
|
|
$
|
2,598
|
|
$
|
2,663
|
|
72
Listed below are the significant components of the net deferred tax asset at
December 31
:
|
|
2017
|
2016
|
||||
|
(Dollars in thousands)
|
||||||
|
Components of the deferred tax asset
|
|
|
||||
|
Bad debts
|
$
|
1,171
|
|
$
|
1,813
|
|
|
Deferred compensation
|
227
|
|
334
|
|
||
|
Net pension liability
|
339
|
|
316
|
|
||
|
Core deposit intangible
|
81
|
|
110
|
|
||
|
Limited partnership investments
|
23
|
|
—
|
|
||
|
Unrealized loss on investment securities available-for-sale
|
80
|
|
342
|
|
||
|
Other
|
90
|
|
146
|
|
||
|
Total deferred tax asset
|
2,011
|
|
3,061
|
|
||
|
|
|
|
||||
|
Components of the deferred tax liability
|
|
|
||||
|
Depreciation
|
(493
|
)
|
(893
|
)
|
||
|
Mortgage servicing rights
|
(364
|
)
|
(563
|
)
|
||
|
Limited partnership investments
|
—
|
|
(17
|
)
|
||
|
Goodwill
|
(211
|
)
|
(286
|
)
|
||
|
Prepaid expenses
|
(130
|
)
|
—
|
|
||
|
Total deferred tax liability
|
(1,198
|
)
|
(1,759
|
)
|
||
|
Net deferred tax asset
|
$
|
813
|
|
$
|
1,302
|
|
Deferred tax assets are recognized subject to management's judgment that it is more likely than not that the deferred tax asset will be realized. Based on the temporary taxable items, historical taxable income and estimates of future taxable income, the Company believes that it is more likely than not that the deferred tax assets at
December 31, 2017
will be realized and therefore
no
valuation allowance is warranted.
Net deferred income tax assets are included in Other assets in the consolidated balance sheets at
December 31, 2017
and
2016
.
Based on management's evaluation, management has concluded that there were no significant uncertain tax positions requiring recognition in the Company's financial statements at
December 31, 2017
and
2016
. Although the Company is not currently the subject of a tax examination by the IRS, the Company's tax years ended December 31, 2014 through 2016 are open to examination by the IRS under the applicable statute of limitations. The
2017
tax return has not yet been filed.
The Company may from time to time be assessed interest and/or penalties by federal or state tax jurisdictions, although any such assessments historically have been minimal and immaterial to the Company's financial results. In the event that the Company receives an assessment for interest and/or penalties, it will be classified in the financial statements as Other expenses.
Defined Benefit Pension Plan:
Union sponsors a noncontributory defined benefit pension plan covering all eligible employees employed prior to October 5, 2012. On that date, the Company closed the Plan to new participants and froze the accrual of retirement benefits for current participants.
On October 18, 2017, the Company's Board of Directors voted to terminate Union Bank’s Defined Benefit Pension Plan. In order to settle the liabilities under the Plan, the Company will offer participants the option to receive an annuity purchased from an insurance carrier, a lump-sum cash payment, or a direct rollover into a qualifying retirement plan. An estimated
$1.1 million
will be contributed to the Plan by the Company in
2018
to cover the lump-sum payments and annuity purchases. The amount of the final contribution is subject to a number of factors, including changes in interest rates and the exact proportion of the participants electing a lump-sum distribution versus an annuity. At this time, the Company estimates that a
$3.2 million
reduction in net income will be recorded in the fourth quarter of
2018
as a result of the Plan termination and settlement of Plan assets and liabilities. The Company anticipates completing the transfer of all liabilities and administrative responsibilities under the Plan by
December 31, 2018
. Once the process is complete, the Company will no longer have any remaining defined benefit pension plan obligations and thus no periodic pension expense.
73
The following table sets forth the Plan's obligations and funded status at
December 31
:
|
|
2017
|
2016
|
||||
|
(Dollars in thousands)
|
||||||
|
Change in projected benefit obligation
|
|
|
||||
|
Projected benefit obligation at beginning of year
|
$
|
17,687
|
|
$
|
17,177
|
|
|
Interest cost
|
688
|
|
701
|
|
||
|
Actuarial loss
|
3,150
|
|
544
|
|
||
|
Benefits paid
|
(693
|
)
|
(735
|
)
|
||
|
Projected benefit obligation at end of year
|
20,832
|
|
17,687
|
|
||
|
|
|
|
||||
|
Change in fair value of plan assets
|
|
|
||||
|
Fair value of plan assets at beginning of year
|
16,631
|
|
15,717
|
|
||
|
Actuarial gain on plan assets
|
1,811
|
|
899
|
|
||
|
Employer contributions
|
750
|
|
750
|
|
||
|
Benefits paid
|
(693
|
)
|
(735
|
)
|
||
|
Fair value of plan assets at end of year
|
18,499
|
|
16,631
|
|
||
|
Net liability for pension benefits
|
$
|
(2,333
|
)
|
$
|
(1,056
|
)
|
|
|
|
|
||||
|
|
2017
|
2016
|
||||
|
(Dollars in thousands)
|
||||||
|
Accumulated benefit obligation at December 31
|
$
|
20,832
|
|
$
|
17,687
|
|
The impact of the Plan activity for
2017
and
2016
on OCI is detailed in Note 23.
The Company uses the alternate amortization method for prior service costs, as provided in FASB ASC Topic 715,
Employers' Accounting for Pensions.
Net periodic pension benefit for
2017
,
2016
and
2015
consisted of the following components:
|
|
2017
|
2016
|
2015
|
||||||
|
|
(Dollars in thousands)
|
||||||||
|
Interest cost on projected benefit obligation
|
$
|
688
|
|
$
|
701
|
|
$
|
680
|
|
|
Expected return on plan assets
|
(972
|
)
|
(1,036
|
)
|
(1,144
|
)
|
|||
|
Amortization of net actuarial loss
|
204
|
|
165
|
|
56
|
|
|||
|
Net periodic pension benefit
|
$
|
(80
|
)
|
$
|
(170
|
)
|
$
|
(408
|
)
|
Weighted average assumptions used to determine pension benefit obligation were a discount rate of
3.52%
,
3.99%
and
4.17%
at
December 31, 2017
,
2016
and
2015
, respectively. There was
no
assumed rate of compensation increase for
2017
,
2016
or
2015
due to the freeze on benefit accruals in 2012.
Weighted average assumptions used to determine net periodic pension benefit for the years ended
December 31, 2017
,
2016
and
2015
were a discount rate of
3.99%
,
4.17%
and
3.83%
, respectively,
no
rate of compensation increase for
2017
,
2016
or
2015
, and an expected long-term rate of return on plan assets of
6.00%
for
2017
and
6.75%
for
2016
and
2015
.
Union's Plan asset allocations at
December 31, 2017
and
2016
, by asset category based on their fair values, were as follows:
|
Asset Category
|
2017
|
2016
|
||
|
Cash and cash equivalents
|
5.4
|
%
|
3.4
|
%
|
|
Debt securities
|
33.2
|
%
|
49.7
|
%
|
|
Equity securities
|
—
|
%
|
46.9
|
%
|
|
Mutual and exchange traded funds
|
61.4
|
%
|
—
|
%
|
|
Total
|
100.0
|
%
|
100.0
|
%
|
74
The investment philosophy for the Plan has historically been to prudently invest Plan assets and future contributions received in a diversified manner that will increase the value of assets to equal or exceed the present value of the liabilities, while controlling volatility within asset allocation guidelines, to grow the Plan funding level such that investment risk can be progressively reduced, and to provide sufficient liquidity to meet anticipated cash needs. The allocation of Plan assets has changed as a result of terminating the Plan. In order to target the termination liability, the plan assets have been redistributed between liability matching assets and cash and cash equivalents.
In order to achieve the liability matching goal the following asset allocation has been approved:
|
U.S. Treasury or Agency bonds
|
0-50%
|
|
Other debt securities
|
0-50%
|
|
Cash and cash equivalents
|
0-5%
|
There are no securities of the Company or Union held by the Plan. The equity securities of the Plan are managed by Union's Asset Management Group with the advice of the registered investment adviser engaged by Union's Asset Management Group, under the guidance of the Plan's Trustees. There is
no
minimum required employer contribution for
2018
, however the Company may decide to make a discretionary contribution.
The fair values of the Plan's investments at
December 31, 2017
and
2016
, segregated by fair value hierarchy level, are summarized below:
|
|
|
Fair Value Measurement
|
||||||||||
|
December 31, 2017
|
||||||||||||
|
|
Fair Value
|
Quoted Prices in
Active Markets for Identical Assets (Level 1) |
Significant Other
Observable Inputs (Level 2) |
Significant
Unobservable Inputs (Level 3) |
||||||||
|
(Dollars in thousands)
|
||||||||||||
|
U.S. Government
|
$
|
7,131
|
|
$
|
—
|
|
$
|
7,131
|
|
$
|
—
|
|
|
Mutual and exchange traded funds
|
11,368
|
|
11,368
|
|
—
|
|
—
|
|
||||
|
Total
|
$
|
18,499
|
|
$
|
11,368
|
|
$
|
7,131
|
|
$
|
—
|
|
|
|
|
Fair Value Measurement
|
||||||||||
|
December 31, 2016
|
||||||||||||
|
|
Fair Value
|
Quoted Prices in
Active Markets for
Identical Assets
(Level 1)
|
Significant Other
Observable Inputs
(Level 2)
|
Significant
Unobservable
Inputs
(Level 3)
|
||||||||
|
(Dollars in thousands)
|
||||||||||||
|
U.S. Government
|
$
|
1,826
|
|
$
|
—
|
|
$
|
1,826
|
|
$
|
—
|
|
|
Common trust funds
|
5,207
|
|
5,207
|
|
—
|
|
—
|
|
||||
|
Marketable equity securities:
|
||||||||||||
|
Information technology
|
976
|
|
976
|
|
—
|
|
—
|
|
||||
|
Financial
|
813
|
|
813
|
|
—
|
|
—
|
|
||||
|
Industrials
|
1,212
|
|
1,212
|
|
—
|
|
—
|
|
||||
|
Healthcare
|
1,393
|
|
1,393
|
|
—
|
|
—
|
|
||||
|
Consumer
|
2,131
|
|
2,131
|
|
—
|
|
—
|
|
||||
|
Energy
|
1,275
|
|
1,275
|
|
—
|
|
—
|
|
||||
|
Mutual and exchange traded funds
|
1,798
|
|
1,798
|
|
—
|
|
—
|
|
||||
|
Total
|
$
|
16,631
|
|
$
|
14,805
|
|
$
|
1,826
|
|
$
|
—
|
|
The fair values of the Plan assets are determined by an independent pricing service which, given the nature of the assets within the portfolio, is able to utilize quoted prices in an active market to value the majority of the assets held. The market inputs sought for assets without a specific quote listed, in approximate order of priority, include benchmark yields, reported trades, broker/dealer quotes, issuer spreads, two-sided markets, benchmark securities, bids, offers and reference data including market research
75
publications that vary by asset class. For certain security types, additional inputs may be used, or some standard inputs may not be applicable. There were no Level 3 assets held at any time during the year.
Nonqualified Deferred Compensation Plans:
The Company and Union have two nonqualified deferred compensation plans for directors and certain key officers. The 2008 Plan replaced a 1990 Plan that was not compliant with section 409A of the Internal Revenue Code. The Company accrued an expense of
$8 thousand
,
$9 thousand
, and
$8 thousand
in
2017
,
2016
and
2015
, respectively under the 2008 Plan. The benefit obligations under the 2008 Plan represent general unsecured obligations of the Company and no assets are segregated for such payments. However, the Company and Union have purchased life insurance contracts on the lives of each participant in order to recoup the funding costs of these benefits. The benefits accrued under the 2008 Plan aggregated
$525 thousand
and
$613 thousand
at
December 31, 2017
and
2016
, respectively, and are included in Accrued interest and other liabilities. The cash surrender value of the life insurance policies purchased to recoup the funding costs under the 2008 Plan aggregated
$986 thousand
and
$945 thousand
at
December 31, 2017
and
2016
, respectively, and are included in Company-owned life insurance in the Company's consolidated balance sheets.
The 2006 Plan was adopted for directors and certain key officers. The 2006 Plan is a defined contribution plan that provides a means by which participants may elect to defer receipt of current compensation from the Company or its subsidiary in order to provide retirement or other benefits as selected in the individual adoption agreements. Participants may select among designated reference investments consisting of investment funds, with the performance of the participant's account mirroring the selected reference investment. Distributions are made only upon a qualifying distribution event, which may include a separation from service, death, disability or unforeseeable emergency, or upon a date specified in the participant's deferral election form. The 2006 Plan is intended to comply with the provisions of Section 409A of the Internal Revenue Code. The 2006 Plan is unfunded, representing a general unsecured obligation of the Company of
$522 thousand
and
$353 thousand
as of
December 31, 2017
and
2016
, respectively.
401(k) Plan:
Union maintains a defined contribution 401(k) plan under which employees may elect to make tax deferred contributions of up to the IRS maximum from their annual salary. All employees meeting service requirements are eligible to participate in the plan. Union may make employer matching and profit-sharing contributions to the 401(k) plan at the discretion of the Board. Company contributions are fully vested after three years of service. The 401(k) plan includes "Safe Harbor" provisions requiring annual nondiscretionary minimum contributions to the plan for all eligible participants in an amount equal to 3% of eligible earnings of each eligible participant. Additionally, in
2017
,
2016
and
2015
a discretionary profit-sharing contribution was made to the plan in an amount equal to 3% percent of each employee's eligible earnings, as defined by the plan. The following table summarizes employer contributions
for the years ended December 31, 2017, 2016 and 2015
:
|
2017
|
2016
|
2015
|
|||||||
|
(Dollars in thousands)
|
|||||||||
|
Employer matching
|
$
|
223
|
|
$
|
221
|
|
$
|
200
|
|
|
Profit sharing
|
281
|
|
301
|
|
274
|
|
|||
|
Safe harbor
|
296
|
|
294
|
|
264
|
|
|||
|
Total
|
$
|
800
|
|
$
|
816
|
|
$
|
738
|
|
The Company's current stock-based compensation plan is the Union Bankshares, Inc. 2014 Equity Incentive Plan. Under the 2014 Equity Plan,
50,000
shares of the Company’s common stock are available for equity awards of incentive stock options, nonqualified stock options, restricted stock and RSUs to eligible officers and (except for awards of incentive stock options) nonemployee directors. Shares available for issuance of awards under the 2014 Equity Plan consist of unissued shares of the Company’s common stock and/or shares held in treasury.
As of December 31, 2017
, there were outstanding grants under the plan of RSUs and incentive stock options.
RSUs.
Each RSU represents the right to receive one share of the Company's common stock upon satisfaction of applicable vesting conditions. For each of the awards granted in
2017
,
2016
, and
2015
, 50% of the RSUs awarded were in the form of Time-Based RSUs, which vest over
three
years, approximately one-third per year on the anniversary of the earned date; and 50% of the RSUs awarded were in the form of Performance-Based RSUs, which are subject to both performance and time based vesting conditions, which occurs over
two
years, approximately one-half per year on the anniversary of the earned date. Prior to vesting, the RSUs do not earn dividends or dividend equivalents, nor do they bear any voting rights.
76
The following table presents a summary of RSUs from the 2015, 2016, and 2017 Award Plan Summaries as of
December 31, 2017:
|
Number of RSUs Granted
|
Weighted-Average Grant Date Fair Value
|
Number of Unvested RSUs
|
|||||
|
2015 Award
|
5,445
|
|
$
|
27.91
|
|
730
|
|
|
2016 Award
|
3,569
|
|
45.45
|
|
2,026
|
|
|
|
2017 Award
|
3,225
|
|
52.95
|
|
3,225
|
||
|
Total
|
12,239
|
5,981
|
|||||
Unrecognized compensation expense related to the unvested RSUs was
$283 thousand
as of
December 31, 2017
and
$248 thousand
as of
December 31, 2016
.
The 2014 Equity Plan replaced the Company's 2008 ISO Plan. There were
no
options granted in
2017
or
2016
, and
6,000
options granted in
2015
under the 2014 Equity Plan, of which
4,500
remained outstanding and exercisable as of
December 31, 2017
. As of
December 31, 2017
,
3,000
incentive stock options granted under the 2008 ISO Plan remained outstanding and exercisable, with the last of such options expiring in December 2020.
The exercise price of outstanding options under both plans is equal to the market price of the stock at the date of grant; therefore, the intrinsic value of the options at the date of the grant is
$0
. All outstanding options have a
one
year requisite service period, vest after
one
year, and have a
seven
year contractual term. The compensation cost charged against income for stock options issued under the plans was
$0
for
2017
and
2016
, and
$35 thousand
for
2015
.
The following summarizes the option activity under the 2014 Equity Plan for the year ended
December 31, 2017
:
|
|
Shares
|
Weighted
Average
Exercise
Price
|
Weighted
Average
Remaining
Contractual
Term
|
Period
End
Aggregate
Intrinsic
Value
|
||||
|
(Dollars in thousands, except per share data)
|
||||||||
|
Outstanding at January 1, 2017
|
4,500
|
|
$
|
24.00
|
|
|
|
|
|
Exercised
|
—
|
|
—
|
|
|
|
||
|
Forfeited/expired
|
—
|
|
—
|
|
|
|||
|
Outstanding at December 31, 2017
|
4,500
|
|
$
|
24.00
|
|
3.96
|
130
|
|
|
Exercisable at December 31, 2017
|
4,500
|
|
$
|
24.00
|
|
3.96
|
130
|
|
The following summarizes the option activity under the 2008 ISO Plan for the year ended
December 31, 2017
:
|
|
Shares
|
Weighted
Average
Exercise
Price
|
Weighted
Average
Remaining
Contractual
Term
|
Period
End
Aggregate
Intrinsic
Value
|
||||
|
(Dollars in thousands, except per share data)
|
||||||||
|
Outstanding at January 1, 2017
|
4,000
|
|
$
|
21.40
|
|
|
|
|
|
Exercised
|
(1,000
|
)
|
19.60
|
|
|
|
||
|
Forfeited/expired
|
—
|
|
—
|
|
|
|||
|
Outstanding at December 31, 2017
|
3,000
|
|
$
|
22.00
|
|
2.96
|
93
|
|
|
Exercisable at December 31, 2017
|
3,000
|
|
$
|
22.00
|
|
2.96
|
93
|
|
77
The following summarizes information regarding the proceeds received by the Company from the exercise of options during each of the last three years:
|
|
2017
|
2016
|
2015
|
||||||
|
(Dollars in thousands, except per share data)
|
|||||||||
|
Proceeds received
|
$
|
19
|
|
$
|
56
|
|
$
|
53
|
|
|
Number of shares exercised
|
1,000
|
|
2,500
|
|
2,500
|
|
|||
|
Weighted average price per share
|
$
|
19.60
|
|
$
|
22.24
|
|
$
|
21.04
|
|
|
Total intrinsic value of options exercised
|
$
|
25
|
|
$
|
21
|
|
$
|
9
|
|
As of
December 31, 2017
, there was
no
unrecognized compensation cost as all options under both plans were fully vested and exercisable.
The following table presents the reconciliation of the calculation of basic earnings per share
for the years ended December 31, 2017
,
2016
and
2015
:
|
2017
|
2016
|
2015
|
|||||||
|
(Dollars in thousands, except per share data)
|
|||||||||
|
Net income
|
$
|
8,449
|
|
$
|
8,511
|
|
$
|
7,878
|
|
|
Weighted average common shares outstanding
|
4,462,192
|
|
4,459,001
|
|
4,458,037
|
|
|||
|
Basic earnings per share
|
$
|
1.89
|
|
$
|
1.91
|
|
$
|
1.77
|
|
Basic earnings per share were computed by dividing net income by the weighted average number of shares outstanding during the year. There were incentive stock options with respect to
7,500
shares,
8,500
shares, and
11,000
shares outstanding at
December 31, 2017
,
2016
and
2015
, respectively, excluded from the computation of diluted earnings per share since dilution resulting from these stock options is immaterial.
The Company is a party to financial instruments with off-balance-sheet risk in the normal course of business to meet the financing needs of its customers and to reduce its own exposure to fluctuations in interest rates. These financial instruments include commitments to extend credit, standby letters of credit, interest rate caps and floors written on adjustable-rate loans, commitments to participate in or sell loans, commitments to buy or sell securities, guarantees on certain sold loans and risk-sharing commitments on certain sold loans under the MPF program with the FHLB. At
December 31, 2017
and
2016
, the Company had binding loan commitments to sell residential mortgage loans at fixed rates totaling
$4.2 million
and
$7.3 million
, respectively. The fair value of these commitments is not material to the Company's financial statements.
Such instruments involve, to varying degrees, elements of credit and interest rate risk in excess of the amount recognized in the balance sheet. The contract or notional amounts of those instruments reflect the extent of involvement the Company has in particular classes of financial instruments and the potential impact on the Company's future financial position, financial performance and cash flow.
The Company's exposure to credit loss in the event of nonperformance by the other party to the financial instrument for commitments to extend credit and standby letters of credit is represented by the contractual notional amount of those instruments. The Company uses the same credit policies in making commitments and conditional obligations as it does for on-balance-sheet instruments. For interest rate caps and floors embedded in adjustable-rate loans, the contract or notional amounts do not represent exposure to credit loss. The Company controls the risk of interest rate cap agreements through credit approvals, limits and monitoring procedures. Interest rate caps and floors on adjustable rate loans permit the Company to manage its interest rate risk and cash flow risk on these loans within parameters established by Company policy.
78
The Company generally requires collateral or other security to support financial instruments with credit risk. The following table shows financial instruments outstanding whose contract amount represents credit risk at
December 31
:
|
|
Contract or
Notional Amount
|
|||||
|
|
2017
|
2016
|
||||
|
(Dollars in thousands)
|
||||||
|
Commitments to originate loans
|
$
|
25,394
|
|
$
|
31,404
|
|
|
Unused lines of credit
|
85,906
|
|
76,544
|
|
||
|
Standby and commercial letters of credit
|
2,064
|
|
1,624
|
|
||
|
Credit card arrangement
|
1,326
|
|
1,341
|
|
||
|
MPF credit enhancement obligation, net (See Note 18)
|
640
|
|
610
|
|
||
|
Commitment to purchase investment in a real estate limited partnership
|
1,470
|
|
980
|
|
||
|
Contract commitment for renovation project
|
662
|
|
—
|
|
||
|
Total
|
$
|
117,462
|
|
$
|
112,503
|
|
Commitments to extend credit are agreements to lend to a customer at either a fixed or variable interest rate as long as there is no violation of any condition established in the contract. Commitments generally have fixed expiration dates within 90 days of the commitment. Unused lines of credit are generally renewable at least annually except for home equity lines which usually have a specified draw period followed by a specified repayment period. Unused lines may have other termination clauses and may require payment of a fee.
Since many of the commitments and lines are expected to expire without being drawn upon, the total commitment amounts do not necessarily represent future cash requirements. The Company evaluates each customer's credit worthiness on a case-by-case basis. The amount of collateral obtained, if deemed necessary by the Company, upon issuance of a commitment to extend credit is based on management's credit evaluation of the customer. Collateral held varies but may include real estate, accounts receivable, inventory, property, plant and equipment and income-producing commercial properties.
Standby letters of credit are conditional commitments issued by the Company to guarantee the performance of a customer to a third party. Those guarantees are issued to support the customer's private borrowing arrangements or guarantee the customer's contractual performance on behalf of a third party. The credit risk involved in issuing letters of credit is essentially the same as that involved in extending loans to customers and the Company evaluates each customer's creditworthiness on a case-by-case basis. The fair value of standby letters of credit has not been included in the Company's consolidated balance sheet for either year as the fair value is immaterial.
The Company did not hold or issue derivative instruments or hedging instruments during the years ended
December 31, 2017
and
2016
.
Contingent Liabilities:
The Company sells 1-4 family residential mortgage loans under the MPF program with FHLB (See Note 17). Under this program the Company shares in the credit risk of each mortgage loan, while receiving fee income in return. The Company is responsible for a Credit Enhancement Obligation based on the credit quality of these loans. FHLB funds a First Loss Account based on the Company's outstanding MPF mortgage loan balances. This creates a laddered approach to sharing in any losses. In the event of default, homeowner's equity and private mortgage insurance, if any, are the first sources of repayment; the FHLB First Loss Account funds are then utilized, followed by the member's Credit Enhancement Obligation, with the balance the responsibility of FHLB. These loans meet specific underwriting standards of the FHLB. As of
December 31, 2017
, the Company had sold
$28.1 million
in loans through the MPF program since inception of its participation in the program, with an outstanding balance of
$14.7 million
as of such date.
The volume of loans sold to the MPF program and the corresponding credit obligation are closely monitored by management. As of
December 31, 2017
and
2016
, the notional amount of the maximum contingent contractual liability related to this program was
$665 thousand
and
$634 thousand
, respectively, of which
$25 thousand
and
$24 thousand
had been recorded as a reserve through Accrued interest and other liabilities at
December 31, 2017
and
2016
, respectively.
Legal Contingencies:
In the normal course of business, the Company is involved in various legal and other proceedings. In the opinion of management, any liability resulting from such proceedings is not expected to have a material adverse effect on the Company’s consolidated financial statements.
79
The following is a description of the valuation methodologies used for the Company’s assets that are measured on a recurring basis at estimated fair value:
Investment securities available-for-sale
: Marketable equity securities and mutual funds have been valued using unadjusted quoted prices from active markets and therefore have been classified as Level 1. However, the majority of the Company’s AFS investment securities have been valued utilizing Level 2 inputs. For these securities, the Company obtains fair value measurements from an independent pricing service. The fair value measurements consider observable data that may include market maker bids, quotes and pricing models. Inputs to the pricing models include recent trades, benchmark interest rates, spreads and actual and projected cash flows.
Assets measured at fair value on a recurring basis at
December 31, 2017
and
2016
, segregated by fair value hierarchy level, are summarized below:
|
|
Fair Value Measurement
|
|||||||||||
|
|
Fair
Value
|
Quoted Prices in Active Markets for
Identical Assets
(Level 1)
|
Significant Other Observable Inputs
(Level 2)
|
Significant
Unobservable
Inputs
(Level 3)
|
||||||||
|
|
(Dollars in thousands)
|
|||||||||||
|
December 31, 2017:
|
|
|
|
|
||||||||
|
Investment securities available-for-sale
|
|
|
|
|
||||||||
|
Debt securities:
|
||||||||||||
|
U.S. Government-sponsored enterprises
|
$
|
7,695
|
|
$
|
—
|
|
$
|
7,695
|
|
$
|
—
|
|
|
Agency MBS
|
28,116
|
|
—
|
|
28,116
|
|
—
|
|
||||
|
State and political subdivisions
|
24,714
|
|
—
|
|
24,714
|
|
—
|
|
||||
|
Corporate
|
4,393
|
|
—
|
|
4,393
|
|
—
|
|
||||
|
Total debt securities
|
64,918
|
|
—
|
|
64,918
|
|
—
|
|
||||
|
Mutual funds
|
521
|
|
521
|
|
—
|
|
—
|
|
||||
|
Total
|
$
|
65,439
|
|
$
|
521
|
|
$
|
64,918
|
|
$
|
—
|
|
|
December 31, 2016:
|
||||||||||||
|
Investment securities available-for-sale
|
||||||||||||
|
Debt securities:
|
||||||||||||
|
U.S. Government-sponsored enterprises
|
$
|
10,040
|
|
$
|
—
|
|
$
|
10,040
|
|
$
|
—
|
|
|
Agency MBS
|
18,041
|
|
—
|
|
18,041
|
|
—
|
|
||||
|
State and political subdivisions
|
27,372
|
|
—
|
|
27,372
|
|
—
|
|
||||
|
Corporate
|
9,700
|
|
—
|
|
9,700
|
|
—
|
|
||||
|
Total debt securities
|
65,153
|
|
—
|
|
65,153
|
|
—
|
|
||||
|
Mutual funds
|
403
|
|
403
|
|
—
|
|
—
|
|
||||
|
Total
|
$
|
65,556
|
|
$
|
403
|
|
$
|
65,153
|
|
$
|
—
|
|
There were no significant transfers in or out of Levels 1 and 2
for the year ended December 31
,
2017
, nor were there any Level 3 assets at any time during the period. Certain other assets and liabilities are measured at fair value on a nonrecurring basis, that is, the instruments are not measured at fair value on an ongoing basis but are subject to fair value adjustments in certain circumstances (for example, when there is evidence of impairment). Assets and liabilities measured at fair value on a nonrecurring basis in periods after initial recognition, such as impaired loans, HTM investment securities, MSRs and OREO, were not considered material at
December 31, 2017
or
2016
. The Company has not elected to apply the fair value method to any financial assets or liabilities other than those situations where other accounting pronouncements require fair value measurements.
FASB ASC Topic 825
, Financial Instruments,
requires disclosure of the estimated fair value of financial instruments. Fair value is best determined based upon quoted market prices. However, in many instances, there are no quoted market prices for the Company’s various financial instruments. In cases where quoted market prices are not available, fair values are based on estimates
80
using present value or other valuation techniques. Those techniques are significantly affected by the assumptions used, including the discount rate and estimates of future cash flows. Management’s estimates and assumptions are inherently subjective and involve uncertainties and matters of significant judgment. Changes in assumptions could dramatically affect the estimated fair values.
Accordingly, the fair value estimates may not be realized in an immediate settlement of the instrument. Certain financial instruments and all nonfinancial instruments may be excluded from disclosure requirements. Thus, the aggregate fair value amounts presented may not necessarily represent the actual underlying fair value of such instruments of the Company.
The following methods and assumptions were used by the Company in estimating the fair value of its significant financial instruments:
Cash and cash equivalents
: The carrying amounts reported in the consolidated balance sheet for cash and cash equivalents approximate those assets' fair values and are classified as Level 1.
Interest bearing deposits in banks:
Fair values for interest bearing deposits in banks are based on discounted present values of cash flows and are classified as Level 2.
Investment securities:
Fair values for investment securities are based on quoted market prices, where available. If quoted market prices are not available, fair value measurements consider observable data which may include market maker bids, quotes and pricing models. Inputs to the pricing models include recent trades, benchmark interest rates, spreads and actual and projected cash flows. Investment securities are classified as Level 1 or Level 2 depending on availability of recent trade information.
Loans held for sale:
The fair value of loans held for sale is estimated based on quotes from third party vendors, resulting in a Level 2 classification.
Loans
: The fair values of loans are estimated for portfolios of loans with similar financial characteristics and segregated by loan class or segment. For variable-rate loan categories that reprice frequently and with no significant change in credit risk, fair values are based on carrying amounts adjusted for credit risk. The fair values for other loans (for example, fixed-rate residential, commercial real estate, and rental property mortgage loans as well as commercial and industrial loans) are estimated using discounted cash flow analysis, based on interest rates currently being offered for loans with similar terms to borrowers of similar credit quality. Loan fair value estimates include judgments regarding future cash flows, future expected loss experience and risk characteristics. Fair values for impaired loans are estimated using discounted cash flow analysis or underlying collateral values, where applicable. The fair value methods and assumptions that utilize unobservable inputs as defined by current accounting standards are classified as Level 3.
Accrued interest receivable and payable:
The carrying amounts of accrued interest approximate their fair values and are classified as Level 1, 2 or 3 in accordance with the classification of the related principal's valuation.
Nonmarketable equity securities:
It is not practical to determine the fair value of the nonmarketable securities, such as FHLB stock, due to restrictions placed on their transferability.
Deposits
: The fair values disclosed for noninterest bearing deposits and other interest bearing nontime deposits are, by definition, equal to the amount payable on demand at the reporting date, resulting in a Level 1 classification. The fair values for time deposits are estimated using a discounted cash flow calculation that applies interest rates currently being offered on similar deposits to a schedule of aggregated expected maturities on such deposits, resulting in a Level 2 classification.
Borrowed funds
: The fair values of the Company’s short-term debt approximate the carrying amounts reported in the consolidated balance sheet, resulting in a Level 1 classification. The fair values of the Company’s long-term debt are estimated using discounted cash flow analysis based on interest rates currently being offered on similar debt instruments, resulting in a Level 2 classification.
Off-balance-sheet financial instruments
: Fair values for off-balance-sheet, credit-related financial instruments are based on fees currently charged to enter into similar agreements, taking into account the remaining terms of the agreements and the counterparties’ credit standing. The only commitments to extend credit that are normally longer than one year in duration are the home equity lines whose interest rates are variable quarterly. The only fees collected for commitments are an annual fee on credit card arrangements and often a flat fee on commercial lines of credit and standby letters of credit. The fair value of off-balance-sheet financial instruments as of the balance sheet dates was not significant.
81
As of the balance sheet dates, the estimated fair values and related carrying amounts of the Company's significant financial instruments were as follows:
|
December 31, 2017
|
|||||||||||||||
|
Fair Value Measurement
|
|||||||||||||||
|
Carrying
Amount
|
Estimated Fair
Value
|
Quoted Prices
in Active
Markets for
Identical
Assets
(Level 1)
|
Significant
Other
Observable
Inputs
(Level 2)
|
Significant
Unobservable
Inputs
(Level 3)
|
|||||||||||
|
(Dollars in thousands)
|
|||||||||||||||
|
Financial assets
|
|||||||||||||||
|
Cash and cash equivalents
|
$
|
38,508
|
|
$
|
38,508
|
|
$
|
38,508
|
|
$
|
—
|
|
$
|
—
|
|
|
Interest bearing deposits in banks
|
9,352
|
|
9,333
|
|
—
|
|
9,333
|
|
—
|
|
|||||
|
Investment securities
|
66,439
|
|
66,438
|
|
521
|
|
65,917
|
|
—
|
|
|||||
|
Loans held for sale
|
7,947
|
|
8,111
|
|
—
|
|
8,111
|
|
—
|
|
|||||
|
Loans, net
|
|||||||||||||||
|
Residential real estate
|
177,880
|
|
178,818
|
|
—
|
|
—
|
|
178,818
|
|
|||||
|
Construction real estate
|
42,505
|
|
42,069
|
|
—
|
|
—
|
|
42,069
|
|
|||||
|
Commercial real estate
|
251,566
|
|
248,746
|
|
—
|
|
—
|
|
248,746
|
|
|||||
|
Commercial
|
50,393
|
|
49,132
|
|
—
|
|
—
|
|
49,132
|
|
|||||
|
Consumer
|
3,869
|
|
3,919
|
|
—
|
|
—
|
|
3,919
|
|
|||||
|
Municipal
|
55,789
|
|
55,778
|
|
—
|
|
—
|
|
55,778
|
|
|||||
|
Accrued interest receivable
|
2,500
|
|
2,500
|
|
—
|
|
395
|
|
2,105
|
|
|||||
|
Nonmarketable equity securities
|
2,331
|
|
N/A
|
|
N/A
|
|
N/A
|
|
N/A
|
|
|||||
|
Financial liabilities
|
|||||||||||||||
|
Deposits
|
|||||||||||||||
|
Noninterest bearing
|
127,824
|
|
127,824
|
|
127,824
|
|
—
|
|
—
|
|
|||||
|
Interest bearing
|
418,621
|
|
418,621
|
|
418,621
|
|
—
|
|
—
|
|
|||||
|
Time
|
101,129
|
|
99,967
|
|
—
|
|
99,967
|
|
—
|
|
|||||
|
Borrowed funds
|
|||||||||||||||
|
Short-term
|
1,365
|
|
1,364
|
|
1,364
|
|
—
|
|
—
|
|
|||||
|
Long-term
|
30,216
|
|
29,039
|
|
—
|
|
29,039
|
|
—
|
|
|||||
|
Accrued interest payable
|
97
|
|
97
|
|
—
|
|
97
|
|
—
|
|
|||||
82
|
December 31, 2016
|
|||||||||||||||
|
Fair Value Measurement
|
|||||||||||||||
|
Carrying
Amount
|
Estimated Fair
Value
|
Quoted Prices
in Active
Markets for
Identical
Assets
(Level 1)
|
Significant
Other
Observable
Inputs
(Level 2)
|
Significant
Unobservable
Inputs
(Level 3)
|
|||||||||||
|
(Dollars in thousands)
|
|||||||||||||||
|
Financial assets
|
|||||||||||||||
|
Cash and cash equivalents
|
$
|
39,275
|
|
$
|
39,275
|
|
$
|
39,275
|
|
$
|
—
|
|
$
|
—
|
|
|
Interest bearing deposits in banks
|
9,504
|
|
9,528
|
|
—
|
|
9,528
|
|
—
|
|
|||||
|
Investment securities
|
66,555
|
|
66,555
|
|
403
|
|
66,152
|
|
—
|
|
|||||
|
Loans held for sale
|
7,803
|
|
7,958
|
|
—
|
|
7,958
|
|
—
|
|
|||||
|
Loans, net
|
|||||||||||||||
|
Residential real estate
|
171,538
|
|
173,024
|
|
—
|
|
—
|
|
173,024
|
|
|||||
|
Construction real estate
|
33,840
|
|
33,963
|
|
—
|
|
—
|
|
33,963
|
|
|||||
|
Commercial real estate
|
246,317
|
|
245,979
|
|
—
|
|
—
|
|
245,979
|
|
|||||
|
Commercial
|
41,708
|
|
41,491
|
|
—
|
|
—
|
|
41,491
|
|
|||||
|
Consumer
|
3,941
|
|
4,014
|
|
—
|
|
—
|
|
4,014
|
|
|||||
|
Municipal
|
31,348
|
|
31,749
|
|
—
|
|
—
|
|
31,749
|
|
|||||
|
Accrued interest receivable
|
2,259
|
|
2,259
|
|
—
|
|
414
|
|
1,845
|
|
|||||
|
Nonmarketable equity securities
|
2,354
|
|
N/A
|
|
N/A
|
|
N/A
|
|
N/A
|
|
|||||
|
Financial liabilities
|
|||||||||||||||
|
Deposits
|
|||||||||||||||
|
Noninterest bearing
|
112,384
|
|
112,384
|
|
112,384
|
|
—
|
|
—
|
|
|||||
|
Interest bearing
|
382,083
|
|
382,083
|
|
382,083
|
|
—
|
|
—
|
|
|||||
|
Time
|
103,193
|
|
102,594
|
|
—
|
|
102,594
|
|
—
|
|
|||||
|
Borrowed funds
|
|||||||||||||||
|
Short-term
|
1,099
|
|
1,099
|
|
1,099
|
|
—
|
|
—
|
|
|||||
|
Long-term
|
30,496
|
|
30,423
|
|
—
|
|
30,423
|
|
—
|
|
|||||
|
Accrued interest payable
|
92
|
|
92
|
|
—
|
|
92
|
|
—
|
|
|||||
The carrying amounts in the preceding tables are included in the consolidated balance sheets under the applicable captions.
The Company has had, and may be expected to have in the future, banking transactions in the ordinary course of business with principal stockholders, directors, principal officers, their immediate families and affiliated companies in which they are principal stockholders (commonly referred to as related parties), all of which have been, in the opinion of management, on the same terms, including interest rates and collateral, as those prevailing at the time for comparable transactions with unrelated parties and which do not represent more than the normal risk of collectability or present other unfavorable features.
Aggregate loan transactions with related parties for the years ended
December 31
were as follows:
|
|
2017
|
2016
|
||||
|
(Dollars in thousands)
|
||||||
|
Balance, January 1,
|
$
|
475
|
|
$
|
507
|
|
|
New loans and advances on lines
|
945
|
|
263
|
|
||
|
Repayments
|
(459
|
)
|
(295
|
)
|
||
|
Balance, December 31,
|
$
|
961
|
|
$
|
475
|
|
|
Balance available on lines of credit or loan commitments
|
$
|
669
|
|
$
|
691
|
|
83
There were no loans to related parties that were past due, in nonaccrual status or that had been restructured to provide a reduction or deferral of interest or principal because of deterioration in the financial position of the borrower, or that were considered classified at
December 31, 2017
or
2016
.
Deposit accounts with related parties were
$969 thousand
and
$1.1 million
at
December 31, 2017
and
2016
, respectively. Union's Asset Management Group also invested
$472 thousand
and
$595 thousand
in certificates of deposit with Union at
December 31, 2017
and
2016
, respectively.
The Company (on a consolidated basis) and Union are subject to various regulatory capital requirements administered by the federal banking agencies. Failure to meet minimum capital requirements can initiate certain mandatory, and possibly additional discretionary, actions by regulators that, if undertaken, could have a direct material effect on the Company's and Union's financial statements. Under capital adequacy guidelines and the regulatory framework for prompt corrective action, the Company and Union must meet specific capital guidelines that involve quantitative measures of assets, liabilities and certain off-balance-sheet items as calculated under regulatory accounting practices. The Company's and Union's capital amounts and classification are also subject to qualitative judgments by the regulators about components, risk weightings and other factors.
Under the current guidelines, banking organizations must have a minimum total risk-based capital ratio of 8.0%, a minimum Tier I risk-based capital ratio of 6.0%, a minimum common equity Tier I risk-based capital ratio of 4.5%, and a minimum leverage ratio of 4.0% in order to be "adequately capitalized." In addition to these requirements, banking organizations must maintain a 2.5% capital conservation buffer consisting of common Tier I equity, subject to a transition schedule with a full phase-in by 2019. Effective January 1, 2017, the Company and the Bank were required to establish a capital conservation buffer of 1.25%, increasing the minimum required total risk-based capital, Tier I risk-based and common equity Tier I capital to risk-weighted assets they must maintain to avoid limits on capital distributions and certain bonus payments to executive officers and similar employees.
The Company and Bank's risk-based capital ratios exceeded regulatory guidelines at
December 31, 2017
and
December 31, 2016
, and, specifically, the Bank was "well capitalized" under prompt correct action provisions for each period. There were no conditions or events that occurred subsequent to
December 31, 2017
that would change the Company or Bank's regulatory capital categorization.
Union's and the Company's regulatory capital amounts and ratios as of the balance sheet dates are presented in the following tables:
|
|
Actual
|
For Capital
Adequacy
Purposes
|
To Be Well
Capitalized Under
Prompt Corrective
Action Provisions
|
||||||||||||
|
As of December 31, 2017
|
Amount
|
Ratio
|
Amount
|
Ratio
|
Amount
|
Ratio
|
|||||||||
|
Company:
|
(Dollars in thousands)
|
||||||||||||||
|
Total capital to risk weighted assets
|
$
|
66,472
|
|
13.66
|
%
|
$
|
38,929
|
|
8.00
|
%
|
N/A
|
|
N/A
|
|
|
|
Tier 1 capital to risk weighted assets
|
61,064
|
|
12.55
|
%
|
29,194
|
|
6.00
|
%
|
N/A
|
|
N/A
|
|
|||
|
Common Equity Tier 1 to risk weighted assets
|
61,064
|
|
12.55
|
%
|
21,895
|
|
4.50
|
%
|
N/A
|
|
N/A
|
|
|||
|
Tier 1 capital to average assets
|
61,064
|
|
8.46
|
%
|
28,872
|
|
4.00
|
%
|
N/A
|
|
N/A
|
|
|||
|
|
|
|
|
|
|
||||||||||
|
Union:
|
|||||||||||||||
|
Total capital to risk weighted assets
|
$
|
66,212
|
|
13.64
|
%
|
$
|
38,834
|
|
8.00
|
%
|
$
|
48,543
|
|
10.00
|
%
|
|
Tier 1 capital to risk weighted assets
|
60,804
|
|
12.52
|
%
|
29,139
|
|
6.00
|
%
|
38,852
|
|
8.00
|
%
|
|||
|
Common Equity Tier 1 to risk weighted assets
|
60,804
|
|
12.52
|
%
|
21,854
|
|
4.50
|
%
|
31,568
|
|
6.50
|
%
|
|||
|
Tier 1 capital to average assets
|
60,804
|
|
8.43
|
%
|
28,851
|
|
4.00
|
%
|
36,064
|
|
5.00
|
%
|
|||
84
|
|
Actual
|
For Capital
Adequacy
Purposes
|
To be Well
Capitalized Under
Prompt Corrective
Action Provisions
|
||||||||||||
|
As of December 31, 2016
|
Amount
|
Ratio
|
Amount
|
Ratio
|
Amount
|
Ratio
|
|||||||||
|
Company:
|
(Dollars in thousands)
|
||||||||||||||
|
Total capital to risk weighted assets
|
$
|
62,128
|
|
13.32
|
%
|
$
|
37,314
|
|
8.00
|
%
|
N/A
|
|
N/A
|
|
|
|
Tier 1 capital to risk weighted assets
|
56,881
|
|
12.20
|
%
|
27,974
|
|
6.00
|
%
|
N/A
|
|
N/A
|
|
|||
|
Common Equity Tier 1 to risk weighted assets
|
56,881
|
|
12.20
|
%
|
20,981
|
|
4.50
|
%
|
N/A
|
|
N/A
|
|
|||
|
Tier 1 capital to average assets
|
56,881
|
|
8.40
|
%
|
27,086
|
|
4.00
|
%
|
N/A
|
|
N/A
|
|
|||
|
|
|
|
|
|
|
|
|
|
|
|
|
||||
|
Union:
|
|
|
|
|
|
|
|||||||||
|
Total capital to risk weighted assets
|
$
|
61,856
|
|
13.29
|
%
|
$
|
37,325
|
|
8.00
|
%
|
$
|
46,543
|
|
10.00
|
%
|
|
Tier 1 capital to risk weighted assets
|
56,609
|
|
12.16
|
%
|
27,932
|
|
6.00
|
%
|
37,243
|
|
8.00
|
%
|
|||
|
Common Equity Tier 1 to risk weighted assets
|
56,609
|
|
12.16
|
%
|
20,949
|
|
4.50
|
%
|
30,260
|
|
6.50
|
%
|
|||
|
Tier 1 capital to average assets
|
56,609
|
|
8.37
|
%
|
27,053
|
|
4.00
|
%
|
33,817
|
|
5.00
|
%
|
|||
Dividends paid by Union are the primary source of funds available to the Company for payment of dividends to its stockholders. Union is subject to certain requirements imposed by federal banking laws and regulations, which among other things, establish minimum levels of capital and restrict the amount of dividends that may be distributed by Union to the Company.
The basis for the carrying value of the Company's treasury stock is the purchase price of the shares at the time of purchase. The Company maintains a limited stock repurchase plan which authorizes the repurchase of up to
2,500
shares of its common stock each calendar quarter in open market purchases or privately negotiated transactions, as management may deem advisable and as market conditions may warrant. The repurchase authorization for a calendar quarter expires at the end of that quarter to the extent it has not been exercised, and is not carried forward into future quarters. The quarterly repurchase program, which was initially adopted in 2010, was most recently reauthorized in January
2018
and will expire on
December 31, 2018
unless reauthorized. The Company repurchased
1,430
shares under this program, at a total cost of
$60 thousand
during
2017
, while
213
shares, at a total cost of
$6 thousand
were repurchased under the program during
2016
. Since inception, the Company had repurchased
15,184
shares of its common stock as of
December 31, 2017
, at prices ranging from
$17.86
to
$43.97
per share and at a total cost of
$351 thousand
.
During the first quarter of 2016, the Company adopted a Dividend Reinvestment and Stock Purchase Plan (DRIP) whereby registered stockholders may elect to reinvest cash dividends and optional cash contributions to purchase additional shares of the Company's common stock. The Company has reserved
200,000
shares of its common stock for issuance and sale under the DRIP. As of
December 31, 2017
,
877
shares of stock had been issued from treasury stock under the DRIP.
The components of Accumulated OCI, net of tax, at
December 31
were:
|
2017
|
2016
|
|||||
|
|
(Dollars in thousands)
|
|||||
|
Net unrealized loss on investment securities available-for-sale
|
$
|
(301
|
)
|
$
|
(664
|
)
|
|
Defined benefit pension plan net unrealized actuarial loss
|
(4,795
|
)
|
(2,615
|
)
|
||
|
Total
|
$
|
(5,096
|
)
|
$
|
(3,279
|
)
|
85
The following table discloses the tax effects allocated to each component of OCI
for the years ended
:
|
|
December 31, 2017
|
December 31, 2016
|
December 31, 2015
|
||||||||||||||||||||||||
|
Before-Tax Amount
|
Tax (Expense) or Benefit
|
Net-of-Tax Amount
|
Before-Tax Amount
|
Tax (Expense) or Benefit
|
Net-of-Tax Amount
|
Before-Tax Amount
|
Tax (Expense) or Benefit
|
Net-of-Tax Amount
|
|||||||||||||||||||
|
|
(Dollars in thousands)
|
||||||||||||||||||||||||||
|
Investment securities available-for-sale:
|
|||||||||||||||||||||||||||
|
Net unrealized holding gains (losses) arising during the year on investment securities available-for-sale
|
$
|
641
|
|
$
|
(218
|
)
|
$
|
423
|
|
$
|
(894
|
)
|
$
|
304
|
|
$
|
(590
|
)
|
$
|
(279
|
)
|
$
|
95
|
|
$
|
(184
|
)
|
|
Reclassification adjustment for net gains on investment securities available-for-sale realized in net income
|
(17
|
)
|
6
|
|
(11
|
)
|
(71
|
)
|
24
|
|
(47
|
)
|
(53
|
)
|
18
|
|
(35
|
)
|
|||||||||
|
Total
|
624
|
|
(212
|
)
|
412
|
|
(965
|
)
|
328
|
|
(637
|
)
|
(332
|
)
|
113
|
|
(219
|
)
|
|||||||||
|
Defined benefit pension plan:
|
|||||||||||||||||||||||||||
|
Net actuarial loss arising during the year
|
(2,311
|
)
|
786
|
|
(1,525
|
)
|
(680
|
)
|
231
|
|
(449
|
)
|
(1,121
|
)
|
381
|
|
(740
|
)
|
|||||||||
|
Reclassification adjustment for amortization of net actuarial loss realized in net income
|
203
|
|
(69
|
)
|
134
|
|
165
|
|
(56
|
)
|
109
|
|
56
|
|
(19
|
)
|
37
|
|
|||||||||
|
Total
|
(2,108
|
)
|
717
|
|
(1,391
|
)
|
(515
|
)
|
175
|
|
(340
|
)
|
(1,065
|
)
|
362
|
|
(703
|
)
|
|||||||||
|
Total other comprehensive loss
|
$
|
(1,484
|
)
|
$
|
505
|
|
$
|
(979
|
)
|
$
|
(1,480
|
)
|
$
|
503
|
|
$
|
(977
|
)
|
$
|
(1,397
|
)
|
$
|
475
|
|
$
|
(922
|
)
|
The following table discloses information concerning the reclassification adjustments from OCI
for the years ended December 31
:
|
Reclassification Adjustment Description
|
2017
|
2016
|
2015
|
Affected Line Item in
Consolidated Statements of Income
|
||||||
|
(Dollars in thousands)
|
||||||||||
|
Investment securities available-for-sale:
|
||||||||||
|
Net gains on investment securities available-for-sale
|
$
|
(17
|
)
|
$
|
(71
|
)
|
$
|
(53
|
)
|
Net gains on sales of investment securities available-for-sale
|
|
Tax benefit
|
6
|
|
24
|
|
18
|
|
Provision for income taxes
|
|||
|
(11
|
)
|
(47
|
)
|
(35
|
)
|
Net income
|
||||
|
Defined benefit pension plan:
|
||||||||||
|
Net actuarial loss
|
203
|
|
165
|
|
56
|
|
Pension and other employee benefits
|
|||
|
Tax expense
|
(69
|
)
|
(56
|
)
|
(19
|
)
|
Provision for income taxes
|
|||
|
134
|
|
109
|
|
37
|
|
Net income
|
||||
|
Total reclassifications
|
$
|
123
|
|
$
|
62
|
|
$
|
2
|
|
Net income
|
Events occurring subsequent to
December 31, 2017
have been evaluated as to their potential impact to the consolidated financial statements.
On October 18, 2017, the Company's Board of Directors voted to terminate Union Bank’s Defined Benefit Pension Plan. The Company anticipates completing the transfer of all liabilities and administrative responsibilities under the Plan by December 31, 2018. Once the process is complete, the Company will no longer have any remaining pension obligations and thus no periodic pension expense. See Note 14.
On December 22, 2017 the
Tax Cut and Jobs Act
was enacted. Among the significant changes to the U. S. Internal Revenue Code, the Tax Act lowers the U. S. federal corporate income tax rate for the Company from 34% to 21% effective January 1, 2018. See Note 13.
On
January 17, 2018
, Union Bankshares, Inc. declared a
$0.30
per share regular quarterly cash dividend payable
February 8, 2018
to stockholders of record on
January 27, 2018
.
86
The following condensed financial statements are for Union Bankshares, Inc. (Parent Company Only), and should be read in conjunction with the consolidated financial statements of Union Bankshares, Inc. and Subsidiary.
UNION BANKSHARES, INC. (PARENT COMPANY ONLY)
CONDENSED BALANCE SHEETS
December 31, 2017
and
2016
|
|
2017
|
2016
|
||||
|
(Dollars in thousands)
|
||||||
|
ASSETS
|
|
|
||||
|
Cash
|
$
|
77
|
|
$
|
49
|
|
|
Investment securities available-for-sale
|
99
|
|
97
|
|
||
|
Investment in subsidiary - Union
|
58,401
|
|
56,007
|
|
||
|
Other assets
|
843
|
|
805
|
|
||
|
Total assets
|
$
|
59,420
|
|
$
|
56,958
|
|
|
LIABILITIES AND STOCKHOLDERS' EQUITY
|
|
|
||||
|
LIABILITIES
|
|
|
||||
|
Other liabilities
|
$
|
759
|
|
$
|
679
|
|
|
Total liabilities
|
759
|
|
679
|
|
||
|
STOCKHOLDERS' EQUITY
|
|
|
||||
|
Common stock, $2.00 par value; 7,500,000 shares authorized; 4,940,961 shares
issued at December 31, 2017 and 4,936,652 shares issued at December 31, 2016 |
9,882
|
|
9,874
|
|
||
|
Additional paid-in capital
|
755
|
|
620
|
|
||
|
Retained earnings
|
57,197
|
|
53,086
|
|
||
|
Treasury stock at cost; 475,385 shares at December 31, 2017
and 474,517 shares at December 31, 2016 |
(4,077
|
)
|
(4,022
|
)
|
||
|
Accumulated other comprehensive loss
|
(5,096
|
)
|
(3,279
|
)
|
||
|
Total stockholders' equity
|
58,661
|
|
56,279
|
|
||
|
Total liabilities and stockholders' equity
|
$
|
59,420
|
|
$
|
56,958
|
|
The investment in subsidiary is carried under the equity method of accounting. The investment in subsidiary and cash, which is on deposit with Union, have been eliminated in consolidation.
UNION BANKSHARES, INC. (PARENT COMPANY ONLY)
CONDENSED STATEMENTS OF INCOME
Years Ended
December 31, 2017
,
2016
and
2015
|
|
2017
|
2016
|
2015
|
||||||
|
Revenues
|
(Dollars in thousands)
|
||||||||
|
Dividends - bank subsidiary - Union
|
$
|
5,550
|
|
$
|
5,050
|
|
$
|
5,100
|
|
|
Other income
|
30
|
|
40
|
|
25
|
|
|||
|
Total revenues
|
5,580
|
|
5,090
|
|
5,125
|
|
|||
|
Expenses
|
|
|
|||||||
|
Interest
|
27
|
|
25
|
|
23
|
|
|||
|
Stock based compensation expense
|
—
|
|
—
|
|
35
|
|
|||
|
Administrative and other
|
400
|
|
441
|
|
351
|
|
|||
|
Total expenses
|
427
|
|
466
|
|
409
|
|
|||
|
Income before applicable income tax benefit and equity in undistributed
net income of subsidiary
|
5,153
|
|
4,624
|
|
4,716
|
|
|||
|
Applicable income tax benefit
|
(59
|
)
|
(153
|
)
|
(124
|
)
|
|||
|
Income before equity in undistributed net income of subsidiary
|
5,212
|
|
4,777
|
|
4,840
|
|
|||
|
Equity in undistributed net income - Union
|
3,237
|
|
3,734
|
|
3,038
|
|
|||
|
Net income
|
$
|
8,449
|
|
$
|
8,511
|
|
$
|
7,878
|
|
87
UNION BANKSHARES, INC. (PARENT COMPANY ONLY)
CONDENSED STATEMENTS OF CASH FLOWS
Years Ended
December 31, 2017
,
2016
and
2015
|
|
2017
|
2016
|
2015
|
||||||
|
CASH FLOWS FROM OPERATING ACTIVITIES
|
(Dollars in thousands)
|
||||||||
|
Net income
|
$
|
8,449
|
|
$
|
8,511
|
|
$
|
7,878
|
|
|
Adjustments to reconcile net income to net cash provided by operating activities:
|
|
|
|||||||
|
Equity in undistributed net income of Union
|
(3,237
|
)
|
(3,734
|
)
|
(3,038
|
)
|
|||
|
Stock based compensation expense
|
—
|
|
—
|
|
35
|
|
|||
|
(Increase) decrease in other assets
|
(70
|
)
|
38
|
|
50
|
|
|||
|
Increase (decrease) in other liabilities
|
80
|
|
(45
|
)
|
(67
|
)
|
|||
|
Net cash provided by operating activities
|
5,222
|
|
4,770
|
|
4,858
|
|
|||
|
CASH FLOWS FROM INVESTING ACTIVITIES
|
|
|
|||||||
|
Proceeds from sale of investment securities available-for-sale
|
17
|
|
16
|
|
16
|
|
|||
|
Purchases of investment securities available-for-sale
|
(19
|
)
|
(4
|
)
|
(1
|
)
|
|||
|
Proceeds of Company-owned life insurance death benefit
|
—
|
|
99
|
|
—
|
|
|||
|
Net cash (used in) provided by investing activities
|
(2
|
)
|
111
|
|
15
|
|
|||
|
CASH FLOWS FROM FINANCING ACTIVITIES
|
|
|
|||||||
|
Dividends paid
|
(5,151
|
)
|
(4,939
|
)
|
(4,816
|
)
|
|||
|
Issuance of common stock
|
19
|
|
56
|
|
53
|
|
|||
|
Purchase of treasury stock
|
(60
|
)
|
(6
|
)
|
(94
|
)
|
|||
|
Net cash used in financing activities
|
(5,192
|
)
|
(4,889
|
)
|
(4,857
|
)
|
|||
|
Net increase (decrease) in cash
|
28
|
|
(8
|
)
|
16
|
|
|||
|
Cash, beginning of year
|
49
|
|
57
|
|
41
|
|
|||
|
Cash, end of year
|
$
|
77
|
|
$
|
49
|
|
$
|
57
|
|
|
Supplemental Disclosures of Cash Flow Information
|
|
|
|||||||
|
Interest paid
|
$
|
27
|
|
$
|
25
|
|
$
|
23
|
|
|
Dividends paid on Common Stock:
|
|||||||||
|
Dividends declared
|
$
|
5,176
|
|
$
|
4,949
|
|
$
|
4,816
|
|
|
Dividends reinvested
|
(25
|
)
|
(10
|
)
|
—
|
|
|||
|
$
|
5,151
|
|
$
|
4,939
|
|
$
|
4,816
|
|
|
A summary of consolidated financial data for each of the four quarters of
2017
,
2016
and
2015
is presented below:
|
|
Quarters in 2017 Ended
|
|||||||||||
|
|
March 31,
|
June 30,
|
Sept. 30,
|
Dec 31,
|
||||||||
|
(Dollars in thousands, except per share data)
|
||||||||||||
|
Interest and dividend income
|
$
|
6,839
|
|
$
|
7,101
|
|
$
|
7,397
|
|
$
|
7,680
|
|
|
Interest expense
|
537
|
|
516
|
|
587
|
|
615
|
|
||||
|
Net interest income
|
6,302
|
|
6,585
|
|
6,810
|
|
7,065
|
|
||||
|
Provision for loan losses
|
—
|
|
—
|
|
150
|
|
50
|
|
||||
|
Noninterest income
|
2,233
|
|
2,333
|
|
2,506
|
|
2,323
|
|
||||
|
Noninterest expenses
|
5,941
|
|
5,871
|
|
5,941
|
|
6,152
|
|
||||
|
Net income
|
1,930
|
|
2,227
|
|
2,370
|
|
1,922
|
|
||||
|
Earnings per common share
|
$
|
0.43
|
|
$
|
0.50
|
|
$
|
0.53
|
|
$
|
0.43
|
|
88
|
|
Quarters in 2016 Ended
|
|||||||||||
|
|
March 31,
|
June 30,
|
Sept. 30,
|
Dec 31,
|
||||||||
|
(Dollars in thousands, except per share data)
|
||||||||||||
|
Interest and dividend income
|
$
|
6,448
|
|
$
|
6,688
|
|
$
|
6,786
|
|
$
|
6,914
|
|
|
Interest expense
|
513
|
|
519
|
|
471
|
|
558
|
|
||||
|
Net interest income
|
5,935
|
|
6,169
|
|
6,315
|
|
6,356
|
|
||||
|
Provision for loan losses
|
75
|
|
75
|
|
—
|
|
—
|
|
||||
|
Noninterest income
|
2,186
|
|
2,597
|
|
2,804
|
|
2,553
|
|
||||
|
Noninterest expenses
|
5,703
|
|
5,808
|
|
6,024
|
|
6,121
|
|
||||
|
Net income
|
1,759
|
|
2,139
|
|
2,268
|
|
2,345
|
|
||||
|
Earnings per common share
|
$
|
0.39
|
|
$
|
0.48
|
|
$
|
0.51
|
|
$
|
0.53
|
|
|
|
Quarters in 2015 Ended
|
|||||||||||
|
|
March 31,
|
June 30,
|
Sept. 30,
|
Dec 31,
|
||||||||
|
(Dollars in thousands, except per share data)
|
||||||||||||
|
Interest and dividend income
|
$
|
6,117
|
|
$
|
6,276
|
|
$
|
6,373
|
|
$
|
6,378
|
|
|
Interest expense
|
565
|
|
521
|
|
461
|
|
478
|
|
||||
|
Net interest income
|
5,552
|
|
5,755
|
|
5,912
|
|
5,900
|
|
||||
|
Provision for loan losses
|
100
|
|
150
|
|
150
|
|
150
|
|
||||
|
Noninterest income
|
2,335
|
|
2,526
|
|
2,533
|
|
2,398
|
|
||||
|
Noninterest expenses
|
5,268
|
|
5,431
|
|
5,556
|
|
5,565
|
|
||||
|
Net income
|
1,884
|
|
2,017
|
|
2,050
|
|
1,927
|
|
||||
|
Earnings per common share
|
$
|
0.42
|
|
$
|
0.46
|
|
$
|
0.45
|
|
$
|
0.44
|
|
There are no components of other noninterest income that were in excess of one percent of total revenues
for the years ended December 31, 2017, 2016 or 2015
. The components of other noninterest expenses which are in excess of one percent of total revenues
for the years ended December 31, 2017, 2016 and 2015
were as follows:
|
2017
|
2016
|
2015
|
|||||||
|
(Dollars in thousands)
|
|||||||||
|
Expenses
|
|||||||||
|
ATM and debit card expense
|
$
|
698
|
|
$
|
639
|
|
$
|
783
|
|
|
Advertising and public relations
|
469
|
|
507
|
|
456
|
|
|||
|
Vermont franchise tax
|
582
|
|
555
|
|
538
|
|
|||
|
Professional fees
|
573
|
|
731
|
|
641
|
|
|||
|
Trust expenses
|
362
|
|
409
|
|
379
|
|
|||
|
Director and advisory board fees
|
405
|
|
368
|
|
325
|
|
|||
|
Other expenses
|
3,228
|
|
3,341
|
|
3,050
|
|
|||
|
Total other expenses
|
$
|
6,317
|
|
$
|
6,550
|
|
$
|
6,172
|
|
89

|
|
REPORT OF INDEPENDENT REGISTERED PUBLIC ACCOUNTING FIRM
Board of Directors and Stockholders
Union Bankshares, Inc. and Subsidiary
Opinions on the Financial Statements and Internal Control over Financial Reporting
We have audited the accompanying consolidated balance sheets of Union Bankshares, Inc. and Subsidiary (the Company) as of
December 31, 2017
and
2016
, and the related consolidated statements of income, comprehensive income, changes in stockholders' equity, and cash flows for each of the years in the three-year period ended
December 31, 2017
, and the related notes (collectively referred to as the "financial statements"). We also have audited the Company's internal control over financial reporting as of
December 31, 2017
, based on criteria established in the
Internal Control — Integrated Framework (2013)
issued by the Committee of Sponsoring Organizations of the Treadway Commission (COSO).
In our opinion, the financial statements referred to above present fairly, in all material respects, the consolidated financial position of the Company as of
December 31, 2017
and
2016
, and the consolidated results of their operations and their cash flows for each of the years in the three-year period ended
December 31, 2017
, in conformity with accounting principles generally accepted in the United States of America. Also, in our opinion, the Company maintained, in all material respects, effective internal control over financial reporting as of
December 31, 2017
, based on criteria established in
Internal Control — Integrated Framework (2013)
issued by COSO.
Basis for Opinion
The Company's management is responsible for these financial statements, for maintaining effective internal control over financial reporting, and for its assessment of the effectiveness of internal control over financial reporting included in the accompanying Management’s Annual Report over Internal Control over Financial Reporting. Our responsibility is to express an opinion on the Company's financial statements and an opinion on the Company's internal control over financial reporting based on our audits. We are a public accounting firm registered with the Public Company Accounting Oversight Board (United States) ("PCAOB") and are required to be independent with respect to the Company in accordance with the U.S. federal securities laws and the applicable rules and regulations of the Securities and Exchange Commission and the PCAOB.
We conducted our audits in accordance with the standards of the PCAOB. Those standards require that we plan and perform the audits to obtain reasonable assurance about whether the financial statements are free of material misstatement, whether due to error or fraud, and whether effective internal control over financial reporting was maintained in all material respects.
Our audits of the financial statements included performing procedures to assess the risks of material misstatement of the financial statements, whether due to error or fraud, and performing procedures that respond to those risks. Such procedures included examining, on a test basis, evidence regarding the amounts and disclosures in the financial statements. Our audits also included evaluating the accounting principles used and significant estimates made by management, as well as evaluating the overall

|
||
90
Board of Directors and Stockholders
Union Bankshares, Inc. and Subsidiary
Page 2
presentation of the financial statements. Our audit of internal control over financial reporting included obtaining an understanding of internal control over financial reporting, assessing the risk that a material weakness exists, and testing and evaluating the design and operating effectiveness of internal control based on the assessed risk. Our audits also included performing such other procedures as we considered necessary in the circumstances. We believe that our audits provide a reasonable basis for our opinions.
Definition and Limitations of Internal Control Over Financial Reporting
A company's internal control over financial reporting is a process designed to provide reasonable assurance regarding the reliability of financial reporting and the preparation of financial statements for external purposes in accordance with generally accepted accounting principles. A company's internal control over financial reporting includes those policies and procedures that (1) pertain to the maintenance of records that, in reasonable detail, accurately and fairly reflect the transactions and dispositions of the assets of the company; (2) provide reasonable assurance that transactions are recorded as necessary to permit preparation of financial statements in accordance with generally accepted accounting principles, and that receipts and expenditures of the company are being made only in accordance with authorizations of management and directors of the company; and (3) provide reasonable assurance regarding prevention or timely detection of unauthorized acquisition, use, or disposition of the company's assets that could have a material effect on the financial statements.
Because of its inherent limitations, internal control over financial reporting may not prevent or detect misstatements. Also, projections of any evaluation of effectiveness to future periods are subject to the risk that controls may become inadequate because of changes in conditions, or that the degree of compliance with the policies or procedures may deteriorate.

|
|
We have served as the Company's auditor since 2009.
Portland, Maine
March 16, 2018
Vermont Registration No. 92-0000278
91
None.
Evaluation of Disclosure Controls and Procedures.
The Company's Chief Executive Officer and Chief Financial Officer, with the assistance of the Disclosure Control Committee, evaluated the effectiveness of the design and operation of the Company's disclosure controls and procedures (as defined in Rule 13a-15(e) under the Exchange Act) as of
December 31, 2017
. Based on this evaluation they concluded that those disclosure controls and procedures are effective to ensure that information required to be disclosed by the Company in the reports that it files or submits under the Securities Exchange Act is recorded, processed, summarized and reported within the time periods specified in the SEC's rules and forms. Disclosure controls and procedures include, without limitation, controls and procedures designed to ensure that information required to be disclosed by the Company in the reports that it files with the Commission is accumulated and communicated to the Company's management, including its principal executive and principal financial officer, or persons performing similar functions, as appropriate to allow timely decisions regarding required information.
Management's Report on Internal Control Over Financial Reporting.
The Company's management is responsible for establishing and maintaining adequate internal controls over financial reporting, as such term is defined in the Securities Exchange Act Rule 13a-15(f). The Company's management, including the Chief Executive Officer and Chief Financial Officer, conducted an evaluation of the effectiveness of the Company's internal control over financial reporting based on the
Internal Control - Integrated Framework
issued by the Committee of Sponsoring Organizations of the Treadway Commission (2013 Framework). Based on the evaluation, the Company's management concluded that the Company's internal control over financial reporting was effective as of
December 31, 2017
.
Berry Dunn McNeil & Parker, LLC, an independent registered public accounting firm, which has audited and reported on the consolidated financial statements contained in this Form 10-K, has issued its written audit report on the Company’s internal control over financial reporting. This report can be found on page 90.
There have been no changes in the Company's internal controls over financial reporting during the fourth quarter of
2017
that have materially affected, or that are reasonably likely to materially affect, the Company's internal controls over financial reporting. While the Company believes that its existing disclosure controls and procedures have been effective to accomplish these objectives, the Company intends to continue to examine, refine and formalize its disclosure controls and procedures and to monitor ongoing developments in this area.
None
The following information from the Company's Proxy Statement for the
2018
Annual Meeting of Shareholders is hereby incorporated by reference:
Listing of the names, ages, principal occupations, business experience and specific qualifications of the directors under the caption “PROPOSAL I: TO ELECT DIRECTORS”.
Listing of the names, ages, titles and business experience of the executive officers and named executives under the caption “EXECUTIVE OFFICERS” and, with respect to the named executive officers who are also directors, under the caption "PROPOSAL I: TO ELECT DIRECTORS".
Information regarding compliance with Section 16(a) of the Securities Exchange Act of 1934 under the caption “SHARE OWNERSHIP INFORMATION - Section 16(a) Beneficial Ownership Reporting Compliance”.
Information regarding the composition and meetings of the Audit Committee under the caption "PROPOSAL I: TO ELECT DIRECTORS - Board Committees and Corporate Governance - Audit Committee."
92
The Company has adopted a Code of Ethics for Senior Financial Officers and the Chief Executive Officer and a Code of Ethics for all directors, officers and employees. A request for either of the Company's Code of Ethics can be made either in writing to Kristy Adams Alfieri, Union Bankshares, Inc., PO Box 667, Morrisville, VT 05661, by email at
ubexec@unionbankvt.com
or a copy can be found on the Company's investor relations page accessed via Union Bank's website at
www.ublocal.com
. The Company will make any legally required disclosures regarding amendments to, or waivers of provisions of its Codes of Ethics in accordance with the rules and regulations of the SEC including posting the codes on the Company's investor relations page accessed via Union Bank's website at
www.ublocal.com
.
The following information from the Company's Proxy Statement for the
2018
Annual Meeting of Shareholders is hereby incorporated by reference:
Information regarding compensation of directors under the caption “PROPOSAL I: TO ELECT DIRECTORS - Directors' Compensation”.
Information regarding executive officer and named executive compensation and benefit plans under the captions - "COMPENSATION DISCUSSION AND ANALYSIS," “EXECUTIVE COMPENSATION” and "COMPENSATION COMMITTEE REPORT".
Information regarding management interlocks and certain transactions under the caption “PROPOSAL I: TO ELECT DIRECTORS - Compensation Committee Interlocks and Insider Participation”.
The following information from the Company's Proxy Statement for the
2018
Annual Meeting of Shareholders is hereby incorporated by reference:
Information regarding the share ownership of management and principal shareholders under the caption “SHARE OWNERSHIP INFORMATION - Share Ownership of Management and Principal Holders”.
The following table summarizes certain information regarding securities available for issuance under the Company's equity compensation plans as of
December 31, 2017:
Equity Compensation Plan Information as of
December 31, 2017
:
|
Plan Category
|
Number of securities to be issued upon exercise of outstanding options, warrants and rights
|
Weighted average exercise price of outstanding options, warrants and rights
|
Number of securities remaining available for future issuance under equity compensation plans (excluding securities reflected in column (a))
|
||||||||||
|
|
(a) (1)
|
(b) (2)
|
(c) (3)
|
||||||||||
|
|
|
|
|
|
|
|
|
|
|||||
|
Equity compensation plans approved by security holders
|
13,481
|
|
$
|
23.20
|
|
26,354
|
|
||||||
|
Equity compensation plans not approved by security holders
|
|
—
|
|
|
|
—
|
|
|
|
—
|
|
|
|
|
|
|
|
|
|
|
|
|
|
|
||||
|
Total
|
|
13,481
|
|
|
|
$
|
23.20
|
|
|
|
26,354
|
|
|
____________________
|
(1)
|
Includes 3,000 shares issuable upon exercise of incentive stock options granted under the 2008 ISO Plan, 4,500 shares issuable upon exercise of incentive stock options granted under the 2014 Equity Plan, and 5,981 shares issuable upon vesting of restricted stock units (“RSUs”) granted under the 2014 Equity Plan for which 2017, 2016 and 2015 performance conditions have been satisfied but which are also subject to time-based vesting conditions.
|
|
(2)
|
Calculated solely with respect to outstanding stock options; RSUs not included in calculation.
|
|
(3)
|
All of such shares are available for issuance pursuant to future awards under the 2014 Equity Plan.
|
93
The following information from the Company's Proxy Statement for the
2018
Annual Meeting of Shareholders is hereby incorporated by reference:
Information regarding transactions with management and directors under the caption “PROPOSAL I: TO ELECT DIRECTORS - Transactions with Management and Directors”.
Information regarding Director independence under the caption "PROPOSAL I: TO ELECT DIRECTORS - Director Independence."
The following information from the Company's Proxy Statement for the
2018
Annual Meeting of Shareholders is hereby incorporated by reference:
Information on fees paid to the Independent Auditors set forth under the caption “PROPOSAL 2: RATIFICATION OF APPOINTMENT OF INDEPENDENT AUDITORS - Fees Paid to Independent Auditors”.
Description of Audit Committee pre-approval guidelines set forth under the caption “PROPOSAL 2: RATIFICATION OF APPOINTMENT OF INDEPENDENT AUDITORS - Fees Paid to Independent Auditors”.
94
Documents Filed as Part of this Report:
|
(1)
|
The following consolidated financial statements are included:
|
|
1)
|
Consolidated Balance S
|
|
2)
|
heets at
December 31, 2017
and
2016
|
|
3)
|
Consolidated Statements of Income for the years ended
December 31, 2017
,
2016
and
2015
|
|
4)
|
Consolidated Statements of Comprehensive Income for the years ended
December 31, 2017
,
2016
and
2015
|
|
5)
|
Consolidated Statements of Changes in Stockholders' Equity for the years ended
December 31, 2017
,
2016
and
2015
|
|
6)
|
Consolidated Statements of Cash Flows for the years ended
December 31, 2017
,
2016
and
2015
|
|
7)
|
Notes to the Consolidated Financial Statements
|
|
8)
|
Report of Independent Registered Public Accounting Firm
|
|
(2)
|
The following exhibits are either filed herewith as part of this report, or are incorporated herein by reference:
|
|
Item No:
|
|
|
Amended and Restated Articles of Incorporation of Union Bankshares, Inc. (as of August 1, 2007), previously filed with the Commission as Exhibit 3.1 to the Company's June 30, 2007 Form 10-Q and incorporated herein by reference.
|
|
|
Bylaws of Union Bankshares, Inc., as amended, previously filed with the Commission as Exhibit 3.1 to the Company's September 30, 2007 Form 10-Q and incorporated herein by reference.
|
|
|
2008 Amended and Restated Nonqualified Deferred Compensation Plan of Union Bankshares, previously filed with the Commission as Exhibit 10.3 to the Company's 2008 Form 10-K and incorporated herein by reference.*
|
|
|
Union Bankshares, Inc. Executive Nonqualified Excess Plan, previously filed with the Commission as Exhibit 10.4 to the Company's 2006 Form 10-K and incorporated herein by reference.*
|
|
|
First Amendment to the Union Bankshares, Inc. Executive Nonqualified Excess Plan, previously filed with the Commission as Exhibit 10.5 to the Company's 2008 Form 10-K and incorporated herein by reference.*
|
|
|
2008 Incentive Stock Option Plan of Union Bankshares Inc. and Subsidiary, previously filed on April 10, 2008 with the Commission as Exhibit 10.1 to Form 8-K and incorporated herein by reference.*
|
|
|
Short Term Incentive Performance Plan, previously filed with the Commission on February 9, 2012 as Exhibit 10.1 to Form 8-K and incorporated herein by reference.*
|
|
|
Union Bankshares, Inc. 2014 Equity Incentive Plan, previously filed with the Commission on April 15, 2014 as Appendix A to the Definitive Proxy Statement for the 2014 Annual Meeting of Shareholders and incorporated herein by reference.*
|
|
|
Change in Control Agreement dated June 2, 2014, between Union Bank and David S. Silverman, previously filed with the Commission on June 4, 2014 as Exhibit 10.1 to Form 8-K and incorporated herein by reference.*
|
|
|
Change in Control Agreement dated June 2, 2014, between Union Bank and Karyn J. Hale, previously filed with the Commission on June 4, 2014 as Exhibit 10.2 to Form 8-K and incorporated herein by reference.*
|
|
|
Change in Control Agreement date June 2, 2014, between Union Bank and Jeffery G. Coslett, previously filed with the Commission as Exhibit 10.10 to the Company's 2014 Form 10-K and incorporated herein by reference.*
|
|
|
Form of Stock Option Agreement for 2008 Incentive Stock Option Plan of Union Bankshares, Inc. and Subsidiary, previously filed with the Commission as Exhibit 10.11 to the Company's 2014 Form 10-K and incorporated herein by reference.*
|
|
|
Form of Stock Option Agreement for 2014 Equity Incentive Plan of Union Bankshares, Inc. and Subsidiary, previously filed with the Commission as Exhibit 10.12 to the Company's 2014 Form 10-K and incorporated herein by reference.*
|
|
|
Subsidiaries of the Company.
|
|
|
Certification of Chief Executive Officer pursuant to Section 302 of the Sarbanes-Oxley Act of 2002.
|
|
|
Certification of Chief Financial Officer pursuant to Section 302 of the Sarbanes-Oxley Act of 2002.
|
|
|
Certification of the Chief Executive Officer pursuant to Section 906 of the Sarbanes-Oxley Act of 2002.**
|
|
|
Certification of the Chief Financial Officer pursuant to Section 906 of the Sarbanes-Oxley Act of 2002.**
|
|
|
101
|
The following materials from the Company's Annual Report on Form 10-K for the year ended December 31, 2017 formatted in eXtensible Business Reporting Language (XBRL): (i) the audited consolidated balance sheets, (ii) the audited consolidated statements of income for the years ended December 31, 2017, 2016 and 2015, (iii) the audited consolidated statements of comprehensive income, (iv) the audited consolidated statement of changes in stockholders' equity, (v) the audited consolidated statements of cash flows and (vi) related notes.
|
____________________
|
*
|
denotes compensatory plan or agreement
|
95
|
**
|
This exhibit shall not be deemed “filed” for purposes of Section 18 of the Securities Exchange Act of 1934, or otherwise subject to the liability of that section, and shall not be deemed to be incorporated by reference into any filing under the Securities Act of 1933 or the Securities Exchange Act of 1934.
|
SIGNATURES
Pursuant to the requirements of Section 13 or 15(d) of the Securities Exchange Act of 1934, the registrant has duly caused this report to be signed on its behalf by the undersigned thereunto duly authorized, as of
March 16, 2018
.
Union Bankshares, Inc.
|
By:
|
/s/ David S. Silverman
|
|
By:
|
/s/ Karyn J. Hale
|
|
|
David S. Silverman
|
|
|
Karyn J. Hale
|
|
|
Chief Executive Officer and President
|
|
|
Chief Financial Officer
|
Pursuant to the requirements of the Securities Exchange Act of 1934, this report has been signed below by the following persons on behalf of the registrant and in the capacities indicated as of
March 16, 2018
.
|
Name
|
Title
|
|
|
/s/ David S. Silverman
|
Director, Chief Executive Officer and President
|
|
|
David S. Silverman
|
(Principal Executive Officer)
|
|
|
/s/ Karyn J. Hale
|
Chief Financial Officer
|
|
|
Karyn J. Hale
|
(Principal Financial/Accounting Officer)
|
|
|
/s/ Kenneth D. Gibbons
|
Director, Chairman of the Board
|
|
|
Kenneth D. Gibbons
|
||
|
/s/ Cornelius J. Van Dyke
|
Director, Vice Chairman of the Board
|
|
|
Cornelius J. Van Dyke
|
||
|
/s/ Steven J. Bourgeois
|
Director
|
|
|
Steven J. Bourgeois
|
||
|
/s/ Dawn D. Bugbee
|
Director
|
|
|
Dawn D. Bugbee
|
||
|
/s/ John M. Goodrich
|
Director
|
|
|
John M. Goodrich
|
||
|
/s/ Timothy W. Sargent
|
Director
|
|
|
Timothy W. Sargent
|
||
|
/s/ John H. Steel
|
Director
|
|
|
John H. Steel
|
||
|
/s/ Schuyler W. Sweet
|
Director
|
|
|
Schuyler W. Sweet
|
||
96
EXHIBIT INDEX *
|
Subsidiaries of the Company.
|
|
|
Certifications of Chief Executive Officer pursuant to Section 302 of the Sarbanes-Oxley Act of 2002.
|
|
|
|
|
|
Certifications of Chief Financial Officer pursuant to Section 302 of the Sarbanes-Oxley Act of 2002.
|
|
|
|
|
|
Certification of the Chief Executive Officer pursuant to Section 906 of the Sarbanes-Oxley Act of 2002.**
|
|
|
|
|
|
Certification of the Chief Financial Officer pursuant to Section 906 of the Sarbanes-Oxley Act of 2002.**
|
|
|
101
|
The following materials from the Company's Annual Report on Form 10-K for the year ended December 31, 2017 formatted in eXtensible Business Reporting Language (XBRL): (i) the audited consolidated balance sheets, (ii) the audited consolidated statements of income for the years ended December 31, 2017, 2016 and 2015, (iii) the audited consolidated statements of comprehensive income, (iv) the audited consolidated statements of changes in stockholders' equity, (v) the audited consolidated statements of cash flows and (vi) related notes.
|
____________________
|
*
|
other than exhibits incorporated by reference to prior filings.
|
|
**
|
This exhibit shall not be deemed “filed” for purposes of Section 18 of the Securities Exchange Act of 1934, or otherwise subject to the liability of that section, and shall not be deemed to be incorporated by reference into any filing under the Securities Act of 1933 or the Securities Exchange Act of 1934.
|
97
TABLE OF CONTENTS
Part IItem 1. Description Of BusinessItem 1A. Risk FactorsItem 1B. Unresolved Staff CommentsItem 2. PropertiesItem 3. Legal ProceedingsItem 4. Mine Safety DisclosuresPart IIItem 5. Market For Registrant's Common Equity, Related Stockholder Matters and Issuer Purchases Of Equity SecuritiesItem 6. Selected Financial DataItem 7. Management's Discussion and Analysis Of Financial Condition and Results Of OperationsItem 7A. Quantitative and Qualitative Disclosures About Market RiskItem 8. Financial Statements and Supplementary DataNote 1. Significant Accounting PoliciesNote 2. Restrictions on Cash and Cash EquivalentsNote 3. Interest Bearing Deposits in BanksNote 4. Investment SecuritiesNote 5. Loans Held For Sale and Loan ServicingNote 6. LoansNote 7. Allowance For Loan Losses and Credit QualityNote 8. Premises and EquipmentNote 9. Goodwill and Other Intangible AssetsNote 10. Investment in Real Estate Limited PartnershipsNote 11. DepositsNote 12. Borrowed FundsNote 13. Income TaxesNote 14. Employee Benefit PlansNote 15. Stock Based CompensationNote 16. Earnings Per ShareNote 17. Financial Instruments with Off-balance-sheet RiskNote 18. Commitments and ContingenciesNote 19. Fair Value MeasurementNote 20. Transactions with Related PartiesNote 21. Regulatory Capital RequirementsNote 22. Treasury StockNote 23. Other Comprehensive LossNote 24. Subsequent EventsNote 25. Condensed Financial Information (parent Company Only)Note 26. Quarterly Financial Data (unaudited)Note 27. Other Noninterest Income and Other Noninterest ExpensesItem 9. Changes in and Disagreements with Accountants on Accounting and Financial DisclosureItem 9A. Controls and ProceduresItem 9B. Other InformationPart IIIItem 10. Directors, Executive Officers and Corporate GovernanceItem 11. Executive CompensationItem 12. Security Ownership Of Certain Beneficial Owners and Management and Related Stockholder MattersItem 13. Certain Relationships and Related Party Transactions, and Director IndependenceItem 14. Principal Accountant Fees and ServicesPart IVItem 15. Exhibits, Financial Statement Schedules