UNITED NATURAL FOODS INC
10-Ks and 10-Qs
|
|
|
|
|
|
|
|
|
|
|
|
|
|
|
|
|
|
|
|
|
|
|
|
|
|
|
|
|
|
|
|
|
|
|
|
|
|
|
|
|
|
|
|
|
|
|
|
|
|
|
|
|
|
|
|
UNITED STATES
SECURITIES AND EXCHANGE COMMISSION
Washington, D.C. 20549
FORM 10-K
Commission File Number: 001-15723
|
x
|
ANNUAL REPORT PURSUANT TO SECTION 13 OR 15(d) OF THE SECURITIES EXCHANGE ACT OF 1934
|
|
|
For the fiscal year ended August 3, 2019
|
||
|
or
|
||
|
¨
|
TRANSITION REPORT PURSUANT TO SECTION 13 OR 15(d) OF THE SECURITIES EXCHANGE ACT OF 1934
|
|
|
For the transition period from _______ to _______
|
||
UNITED NATURAL FOODS, INC.
(Exact name of registrant as specified in its charter)
|
Delaware
|
|
05-0376157
|
|
(State or other jurisdiction of
incorporation or organization)
|
|
(I.R.S. Employer
Identification No.)
|
|
313 Iron Horse Way, Providence, RI 0290
8
(Address of principal executive offices) (Zip Code)
|
||
|
Registrant’s telephone number, including area code:
(401) 528-8634
|
||
Securities registered pursuant to Section 12(b) of the Act:
|
Title of each class
|
Trading Symbol
|
Name of each exchange on which registered
|
|
Common Stock, par value $0.01 per share
|
UNFI
|
New York Stock Exchange
|
Securities registered pursuant to Section 12(g) of the Act:
None
Indicate by check mark if the registrant is a well-known seasoned issuer, as defined in Rule 405 of the Securities Act. Yes
¨
No
x
Indicate by check mark if the registrant is not required to file reports pursuant to Section 13 or Section 15(d) of the Act. Yes
¨
No
x
Indicate by check mark whether the registrant (1) has filed all reports required to be filed by Section 13 or 15(d) of the Securities Exchange Act of 1934 during the preceding 12 months (or for such shorter period that the registrant was required to file such reports), and (2) has been subject to such filing requirements for the past 90 days. Yes
x
No
¨
Indicate by check mark whether the registrant has submitted electronically every Interactive Data File required to be submitted pursuant to Rule 405 of Regulation S-T during the preceding 12 months (or for such shorter period that the registrant was required to submit such files). Yes
x
No
¨
Indicate by check mark whether the registrant is a large accelerated filer, an accelerated filer, a non-accelerated filer, a smaller reporting company, or an emerging growth company. See the definitions of “large accelerated filer,” “accelerated filer,” “smaller reporting company” and “emerging growth company” in Rule 12b-2 of the Exchange Act.
|
Large Accelerated Filer
x
|
Accelerated Filer
¨
|
|
|
Non-accelerated Filer
¨
|
Smaller Reporting Company
¨
|
|
|
|
Emerging growth company
¨
|
|
|
If an emerging growth company, indicate by check mark if the registrant has elected not to use the extended transition period for complying with any new or revised financial accounting standards provided pursuant to Section 13(a) of the Exchange Act. __
|
||
Indicate by check mark whether the registrant is a shell company (as defined in Rule 12b-2 of the Act). Yes
¨
No
x
The aggregate market value of the common stock held by non-affiliates of the registrant was approximately
$660.9 million
based upon the closing price of the registrant’s common stock on the New York Stock Exchange on
January 25, 2019
. The number of shares of the registrant’s common stock, par value $0.01 per share, outstanding as of
September 26, 2019
was
53,434,241
.
DOCUMENTS INCORPORATED BY REFERENCE
Portions of the registrant’s definitive Proxy Statement for the Annual Meeting of Stockholders to be held on
December 18, 2019
are incorporated herein by reference into Part III of this Annual Report on Form 10-K.
UNITED NATURAL FOODS, INC.
FORM 10-K
TABLE OF CONTENTS
|
Section
|
Page
|
|||
|
|
||||
PART I.
ITEM 1. BUSINESS
In this Annual Report on Form 10-K (“Annual Report” or “Report”), unless otherwise specified, references to “United Natural Foods”, “UNFI”, “we”, “us”, “our” or the “Company” mean United Natural Foods, Inc. together with its consolidated subsidiaries. We are a Delaware corporation based in Providence, Rhode Island and Eden Prairie, Minnesota. We conduct our business through various subsidiaries. Since the formation of our predecessor in 1976, we have grown our business both organically and through acquisitions, which have expanded our distribution network, product selection and customer base.
Overview
As a leading distributor of
natural, organic, specialty, produce, and conventional grocery and non-food products, and provider of support services in the United States and Canada
, we believe we are uniquely positioned to provide the broadest array of products and services to customers throughout North America. We offer more than
250,000
products consisting of national, regional and private label brands grouped into six product categories: grocery and general merchandise; produce; perishables and frozen foods; nutritional supplements and sports nutrition; bulk and food service products and personal care items. Through our October 2018 acquisition of SUPERVALU INC. (“Supervalu”), we are transforming into North America’s premier wholesaler with
63
distribution centers and warehouses representing approximately
32
million square feet of warehouse space. We believe our total product assortment and service offerings are unmatched by our wholesale competitors. We plan to aggressively pursue new business opportunities to independent retailers who operate diverse formats, regional and national chains, military commissaries, as well as international customers with wide-ranging needs.
Our Values and Impact
We believe that better food comes from a healthy planet. We are focused on doing our part to protect the environment, conserve natural resources and promote sustainability. We invest in the efficiency of our transportation fleet and warehouses, generate on-site solar power for operational use, and focus on diverting waste from landfills. The communities where we live and work are part of who we are as a company. We believe that part of doing the right thing includes supporting these communities and helping those in need where we can. The UNFI Foundation makes grants to nonprofits to inspire better food systems and nurture everyday health. We also encourage our associates to make a difference by volunteering their time in their communities.
We believe that freedom of food choice matters, and every day we strive to deliver better food options to more tables across North America. We are a pioneer in the distribution of high-quality natural and organic and specialty food products. We believe that through the acquisition of Supervalu, we have increased opportunities to deliver better food options to new communities and customers. Social and environmental responsibility is integral to our overall business strategy, and we believe these practices deliver significant value to our stakeholders, including our shareholders, associates, customers, suppliers and communities. In addition, we focus on developing and maintaining practices and procedures to keep our workplaces safe.
Our Strategic Priorities
We are focused on five strategic priorities that we believe will contribute to our future success:
|
1)
|
Embracing our core mission to transform the world of food and recognizing that our culture of safety and integrity is at the forefront of everything we do.
|
|
2)
|
Delivering on our financial commitments, driving performance to achieve financial targets. Financially, we are focused on the successful integration of Supervalu into UNFI, realizing cost synergies, optimizing our distribution center network, driving cross-selling of products and services across our businesses, and generating cash to pay down debt.
|
|
3)
|
Building out the store through effectively selling our entire portfolio of products and services, which provide differentiated solutions for our customers.
|
|
4)
|
Deploying Thrive2, our project to drive integrated work streams, which provide better experiences for our customers, associates and suppliers and allow us to realize synergy benefits from simplification. The implementation of an efficient, standardized operating model powers better experiences for associates, customers and suppliers.
|
|
5)
|
Divesting our retail assets in a thoughtful and economic manner.
|
1
Our Customers
We maintain long-standing relationships with our customers. We serve approximately
30,000
unique customer locations, including customers acquired from the Supervalu acquisition, primarily located across the United States and Canada, which we classify into four customer types:
|
•
|
Supermarkets, which include accounts that also carry conventional products, and include chain accounts, supermarket independents, and gourmet and ethnic specialty stores.
|
|
•
|
Supernatural, which consists of chain accounts that are national in scope and carry primarily natural products, and currently consists solely of Whole Foods Market.
|
|
•
|
Independents, which include single store and chain accounts (excluding supernatural, as defined above), which carry primarily natural products and buying clubs of consumer groups joined to buy products.
|
|
•
|
Other, which includes foodservice, e-commerce and international customers outside of Canada, as well as sales to Amazon.com, Inc.
|
We have been the primary distributor to Whole Foods Market for more than
twenty
years. Under the terms of our agreement with Whole Foods Market, we serve as the primary distributor to Whole Foods Market in all of its regions in the United States. Our agreement with Whole Foods Market expires on September 28, 2025. Whole Foods Market is our only customer that represented more than
10%
of total net sales in fiscal
2019
. Our customers include single and multiple store independent grocery store retailers, regional chains and the military, many of which are long tenured customers.
The following were included among our wholesale customers for fiscal
2019
:
|
•
|
Whole Foods Market, the largest supernatural chain in the United States and Canada; and
|
|
•
|
Cash and Carry Stores, The Fresh Market, Coborn’s, Natural Grocers, Jerry’s Foods, Vitamin Cottage, Festival Foods, All American Quality Foods, Ahold Delhaize banners (Giant-Carlisle, Stop & Shop, Giant-Landover, and Hannaford), Superior Grocers, Vallarta Supermarkets, Wegmans, Raley’s, Redner’s Markets, Neiman's Family Market, Dierberg’s, El Super Supermarkets, Earth Fare, Sprouts Farmers Market, Lucky’s, Kroger, Harris Teeter, Giant Eagle, Market Basket, Shop-Rite, Publix, Raley’s, and Loblaws.
|
Our total international net sales, including those by UNFI Canada, Inc. (“UNFI Canada”) and excluding sales transacted in U.S. dollars and shipped internationally, represented approximately
one
percent of our net sales in fiscal
2019
,
three
percent in fiscal
2018
and
four
percent in fiscal
2017
. We believe that our sales outside the United States will expand as we seek to continue to grow our Canadian operations.
Recent Acquisitions
A key component of our business and growth strategy has been to acquire wholesalers differentiated by product offerings, service offerings and market area.
We believe the expanded product and service offerings from these acquisitions has enhanced and will continue to enhance our ability to acquire new customers and present opportunities for cross-selling complementary product lines. The Supervalu acquisition advanced our “Build Out The Store” strategy and brought incremental capabilities to the Company in these areas. We now carry an unmatched product assortment that allows us to cross-sell natural products to conventional customers and conventional products to natural customers, all while reducing the number of weekly deliveries that each receives. Supervalu also brings a robust suite of services that are now available to our natural customer base, services necessary to run their business and provide opportunities to simplify and focus on their operations. We also believe the Supervalu acquisition will provide additional scale to lower our overall costs. Finally, we are now a coast-to-coast distributor with customers in all fifty states as well as all ten provinces in Canada, making us a desirable partner for consumer product manufacturers.
Our recent business acquisitions include:
|
•
|
Supervalu
. On October 22, 2018, we acquired Supervalu for an aggregate purchase price of approximately
$2.3 billion
, which included the assumption of outstanding debt and liabilities. The acquisition of Supervalu accelerates our build out the store strategy, diversifies the Company’s customer base, enables cross-selling opportunities, expands market reach and scale, enhances technology, capacity and systems, and is expected to deliver significant cost synergies and accelerate potential growth.
|
2
|
•
|
Gourmet Guru.
In August 2016, the Company acquired all of the outstanding equity securities of Gourmet Guru Inc. (“Gourmet Guru”) in a cash transaction for approximately
$10.0 million
. Gourmet Guru is a distributor and merchandiser of fresh and organic food focusing on new and emerging brands. We believe that our acquisition of Gourmet Guru enhances our strength in finding and cultivating emerging fresh and organic brands and further expands our presence in key urban markets. Gourmet Guru’s operations have been combined with the Company’s existing broadline natural, organic and specialty distribution business in the United States.
|
|
•
|
Haddon House.
In May 2016, the Company acquired Haddon House Food Products Inc. (“Haddon”) and certain affiliated entities and real estate for total cash consideration of approximately
$217.5 million
. Haddon is a distributor and merchandiser of natural and organic and gourmet ethnic products throughout the Eastern United States. Haddon has a diverse, multi-channel customer base including supermarkets, gourmet food stores and independent retailers. Our acquisition of Haddon has expanded our gourmet and ethnic product and service offering which continues to play an important role in our ongoing strategy to build out these product categories. Haddon’s operations have been combined with the Company’s existing broadline natural, organic and specialty distribution business in the United States.
|
|
•
|
Nor-Cal Produce.
In March 2016, the Company acquired Nor-Cal Produce, Inc. (“Nor-Cal”) and an affiliated entity as well as certain real estate, in a cash transaction for approximately
$67.8 million
. Nor-Cal is a distributor of conventional and organic produce and other fresh products primarily to independent retailers in Northern California, with primary operations located in West Sacramento, California. Our acquisition of Nor-Cal has aided in our efforts to expand our fresh offering, particularly with conventional produce. Nor-Cal’s operations have been combined with the existing Albert’s Organics, Inc. (“Albert’s”) business.
|
|
•
|
Albert’s Organics
. In March 2016, the Company acquired certain assets of Global Organic/Specialty Source, Inc. and related affiliates (collectively “Global Organic”) through our wholly owned subsidiary Albert’s Organics, Inc. (“Albert’s”), in a cash transaction for approximately
$20.6 million
. Global Organic is a distributor of organic fruits, vegetables, juices, milk, eggs, nuts, and coffee located in Sarasota, Florida serving customer locations across the Southeastern United States. Global Organic’s operations have been fully integrated into the existing Albert’s business in the Southeastern United States.
|
|
•
|
Tony’s.
In July 2014, we completed the acquisition of all of the outstanding capital stock of Tony’s Fine Foods (“Tony’s”), through our wholly-owned subsidiary UNFI West, Inc. (“UNFI West”). With the completion of the transaction, Tony’s became a wholly-owned subsidiary and continues to operate as Tony’s Fine Foods. Tony’s is headquartered in West Sacramento, California and is a leading distributor of perishable food products, including a wide array of specialty protein, cheese, deli, food service and bakery goods to retail and specialty grocers, food service customers and other distribution companies principally located throughout the Western United States, as well as Alaska and Hawaii.
|
During fiscal 2015, we began shipping customers both center of the store products and an enhanced selection of fresh, perishable products typically located in the perimeter of the store. Our customers utilized both UNFI’s broadline and Tony’s perishable offerings, including grocery, refrigerated, protein, specialty cheese and prepared foods. Our customers seek a full spectrum of offerings and we believe that there is significant value in UNFI’s position as a leading provider of logistics, distribution and category management for both center of the store and perimeter products.
Our Operating Structure
Our continuing operations are organized as follows:
|
•
|
our Wholesale
reportable segment includes:
|
|
◦
|
our broadline natural, organic and specialty distribution business in the United States, including our Select Nutrition business which distributes vitamins, minerals and supplements;
|
|
◦
|
our Supervalu conventional business, which distributes conventional grocery and other products, and includes a private brands business with the Essential Everyday®, Wild Harvest®, and Culinary Circle® brands, and provides logistics and professional service solutions to retailers across the United States and internationally;
|
|
◦
|
Tony’s, which distributes a wide array of specialty protein, cheese, deli, foodservice and bakery goods, principally throughout the Western United States;
|
|
◦
|
Albert’s, which distributes organically grown produce and non-produce perishable items within the United States, and includes the operations of Nor-Cal, a distributor of organic and conventional produce and non-produce perishable items principally in Northern California; and
|
|
◦
|
UNFI Canada, which is our natural, organic and specialty distribution business in Canada.
|
|
•
|
our manufacturing and branded products businesses include the following operating segments that do not meet the quantitative disclosure thresholds of a reportable segment:
|
|
◦
|
our Blue Marble Brands branded product lines; and
|
|
◦
|
Woodstock Farms Manufacturing.
|
3
In recent years, our sales to existing and new customers have increased through:
|
•
|
the continued growth of the natural and organic products industry in general;
|
|
•
|
increased market share as a result of our high quality service and a broader product selection, including specialty products;
|
|
•
|
the acquisition of, or merger with, natural and specialty products distributors and most recently the largest publicly traded conventional distributor, Supervalu;
|
|
•
|
the expansion of our existing distribution centers;
|
|
•
|
the construction of new distribution centers;
|
|
•
|
the introduction of new products and the development of our own line of natural, organic and conventional branded products.
|
Through these efforts, we believe that we have been able to broaden our geographic penetration, expand our customer base, enhance and diversify our product selections, increase our market share, increase operating efficiencies in existing facilities and open new facilities. Our strategic plan includes increasing the type of products we distribute to our customers, including perishable products and conventional produce to “build out the store” and cover center of the store, as well as perimeter offerings.
Wholesale
Subsequent to August 3,
2019
, we reorganized our sales organization into four regions led by four region presidents. The regions consist of Atlantic, South, Central and Pacific. The region president in each region is responsible for product and service strategy, execution, and financial results. Product and service categories include, grocery, fresh, wellness, private brands, e-commerce, food service and multi-cultural. This new structure combines our legacy natural sales organization and distribution center network with our legacy conventional sales organization and distribution network offering our customers a consolidated supply solution. Territory managers in these regions now sell across our complete lines of products. This change brings us to our customers more frequently with all of our service offerings and we anticipate identifying and taking advantage of sales opportunities that result from our customers having a single point of contact for all of our products and services.
Certain of our distribution centers are shared across business components.
Tony’s operates out of four distribution centers located in California and Washington. In addition to the four Tony’s facilities, the Company distributes Tony’s perishable products from certain of our other broadline distribution centers, including our Aurora, Colorado facility.
Albert’s operates out of eight distribution centers located throughout the United States. Four of the eight distribution centers are co-located with other wholesale operations.
UNFI Canada distributes natural, organic and specialty products to our Canada customers. As of our
2019
fiscal year end, UNFI Canada operated four distribution centers.
Through Select Nutrition, we distribute more than
12,000
health and beauty aids, vitamins, minerals and supplements from distribution centers in Pennsylvania and California.
As a result of the Supervalu acquisition we’ve added
11
brands with over
4,000
stock-keeping units (“SKUs”) sold exclusively and reported as sales through our Wholesale segment. These brands span the value, national brand equivalent, organic and premium quality tiers.
Manufacturing and Natural Branded Products Businesses
Our Blue Marble Brands portfolio is a collection of
17
organic, non-GMO, clean and specialty food brands representing more than
700
unique retail and food service products sourced from over
30
countries around the globe. Blue Marble Brands defines clean ingredients to be minimally processed foods, using only essential ingredients that contain no artificial colors or flavors. Our Blue Marble Brands products are sold through our Wholesale segment, third-party distributors and directly to retailers. Our Field Day® brand is primarily sold to customers in our independent channel and is meant to serve as a private label brand for retailers to allow them to compete with supermarket and supernatural chains which often have their own private label store brands.
Our subsidiary doing business as Woodstock Farms Manufacturing specializes in importing, roasting, packaging and the distribution of nuts, dried fruit, seeds, trail mixes, granola, natural and organic snack items and confections for our customers and in the Company’s branded products. Woodstock Farms Manufacturing sells items manufactured in bulk and through private label packaging arrangements with large health food, supermarket and convenience store chains and independent retailers.
4
We operate an organic (United States Department of Agriculture (“USDA”) and Quality Assurance International (“QAI”)) and kosher (Circle K) certified packaging, roasting, and processing facility in New Jersey that is SQF (Safety Quality Food) level 2 certified.
To maintain our market position and improve our operating efficiencies, we seek to continually:
|
•
|
expand our marketing and customer service programs across regions;
|
|
•
|
expand our national purchasing opportunities;
|
|
•
|
offer a broader product selection than our competitors;
|
|
•
|
offer operational excellence with high service levels and a higher percentage of on-time deliveries than our competitors;
|
|
•
|
centralize general and administrative functions to reduce expenses;
|
|
•
|
consolidate systems applications among physical locations and regions;
|
|
•
|
increase our investment in people, facilities, equipment and technology;
|
|
•
|
integrate administrative and accounting functions; and
|
|
•
|
reduce the geographic overlap between regions.
|
Our continued growth has allowed us to expand our existing facilities and open new facilities in an effort to achieve increasing operating efficiencies.
Retail
In fiscal 2019, we acquired retail operations that are classified as discontinued operations in our Consolidated Financial Statements included in this Annual Report. As of
August 3, 2019
, our discontinued operations include
96
retail grocery stores acquired in the Supervalu acquisition. Our intent is to thoughtfully and economically divest these stores. For financial reporting purposes, sales from our distribution centers to our Shopper’s retail banner are eliminated within the Wholesale segment, as we do not expect to dispose of the business with a supply agreement. Wholesale segment sales to our Cub Foods retail banner are not eliminated within the Wholesale segment or total net sales, as we expect and are marketing the business for sale with a supply agreement. In addition, Wholesale segment sales to our Hornbacher’s retail banner disposed during fiscal 2019 were not eliminated through the closing date, and now continue to be recognized as sales to a third-party.
We disposed of our Earth Origins Market (“Earth Origins”) retail business during fiscal 2018, which was not classified in discontinued operations.
Our Products and Services
Our Product Offering
Our extensive selection of products includes natural, organic and specialty foods and non-food products and includes nationally advertised brand name and private-label products, including grocery (both perishable and nonperishable), general merchandise, home, health and beauty care, and pharmacy, which are sold through our Wholesale segment to wholesale customers and through Supervalu-operated retail stores to shoppers. We offer natural, organic and specialty foods and non-food products, consisting of national, regional and private label brands grouped into six product categories: grocery and general merchandise; produce; perishables and frozen foods; nutritional supplements and sports nutrition; bulk and foodservice products; and personal care items. Our branded product lines address certain needs of our customers, including providing a lower-cost label known as Field Day®.
Our private-label products include: the premium brands CULINARY CIRCLE® and STOCKMAN AND DAKOTA®, which offer unique, premium quality products in highly competitive areas; WILD HARVEST®, which is free from over 150 undesirable ingredients; core brands ESSENTIAL EVERYDAY®, EQUALINE®, SPRINGFIELD®, and category-specific brands ARCTIC SHORES SEAFOOD COMPANY®, BABY BASICS®, STONE RIDGE CREAMERY® and SUPER CHILL®, which provide shoppers quality national brand equivalent products at a competitive price; and the value brand SHOPPER’S VALUE®, which offers budget conscious consumer quality alternatives to national brands at substantial savings.
Our Professional Services Offerings
We offer a broad array of professional services that provide Wholesale customers with cost-effective and scalable solutions. These services include pass-through programs in which vendors provide services directly to our Wholesale customers, as well as services and solutions we develop and provide directly. Our services include retail store support, advertising, couponing, e-commerce, network and data hosting solutions, training and certifications classes, and administrative back-office solutions. The sales and operating results for these services are included within Wholesale.
5
Our Marketing Services
We offer a variety of marketing services designed to increase sales for our customers and suppliers, including consumer and trade marketing programs, as well as programs to support suppliers in understanding our markets. Trade and consumer marketing programs are supplier-sponsored programs that cater to a broad range of retail formats. These programs are designed to educate consumers, profile suppliers and increase sales for retailers, many of which do not have the resources necessary to conduct such marketing programs independently. Set forth below are the services offered by each to these programs:
Consumer Marketing Programs
|
•
|
Monthly, region-specific, consumer circular programs, with the participating retailers’ imprint featuring products sold by the retailer to its customers. We offer circular programs to our customers and vendors through negotiated pricing for the retailer, and also provide retailers with a physical flyer and shelf tags corresponding to each month’s promotions. We also offer a web-based tool, which retailers can use to produce highly customized circulars and other marketing materials for their stores called the Customized Marketing Program.
|
|
•
|
Truck advertising programs allow our suppliers to purchase advertising space on the sides of our hundreds of trailers traveling throughout the United States and Canada, increasing brand exposure to consumers.
|
|
•
|
Web and digital marketing services including websites, mobile apps, and e-Commerce capabilities.
|
Trade Marketing Programs
|
•
|
New item introduction programs showcase a supplier’s new items to retailers through trials and discounts.
|
|
•
|
Customer Portal Advertising allows our suppliers to advertise directly to retailers using the portal that many retailers use to order product and/or gather product information.
|
|
•
|
Foodservice options designed to support accounts in that category.
|
|
•
|
Monthly specials catalogs that highlight promotions and new product introductions.
|
|
•
|
Specialized catalogs for holiday and seasonal products.
|
Supplier Marketing Programs
|
•
|
ClearVue®, an information sharing program offered to a select group of suppliers designed to improve the transparency of information and drive efficiency within the supply chain. With the availability of in-depth data and tailored reporting tools, participants are able to reduce inventory balances while improving service levels.
|
|
•
|
Supply Chain by ClearVue®, an information sharing program designed to provide heightened transparency to suppliers through demand planning, forecasting and procurement insights. This program offers weekly and monthly reporting enabling suppliers to identify areas of sales growth while pinpointing specific opportunities for achieving greater profits.
|
|
•
|
Supplier-In-Site (SIS), an information-sharing website that helps our suppliers better understand the independents channel in order to generate mutually beneficial incremental sales in an efficient manner.
|
|
•
|
Growth incentive programs, supplier-focused high-level sales and marketing support for selected brands, which foster our partnership by building incremental, mutually profitable sales for suppliers and us.
|
Periodically, we conduct focus group sessions with certain key retailers and suppliers to ascertain their needs and allow us to better service them. We also provide our customers with:
|
•
|
trends reports in the natural and organic industry;
|
|
•
|
product data information such as best seller lists, store usage reports and catalogs;
|
|
•
|
assistance with store layout designs, new store design and equipment procurement;
|
|
•
|
planogramming, shelf and category management support;
|
|
•
|
in-store signage and promotional materials, and assistance with planning and setting up product displays;
|
|
•
|
shelf tags for products; and
|
|
•
|
a robust customer portal with product information, search and ordering capabilities, reports and publications.
|
Organic Certification
Our “Certified Organic Distributor” certification covers all of our broadline distribution centers in the United States, except for facilities acquired in connection with the acquisitions of Tony’s, Haddon, and Nor-Cal. Although not designated as a “Certified Organic Distributor” by QAI, the three Tony’s California locations are certified as Organic by the State of California Department of Public Health Food and Drug Branch, and Nor-Cal is currently registered with the California Department of Food and Agriculture Organic Program as an organic handler. In addition, our Canadian distribution centers in British Columbia and Ontario both hold one of the following organic distributor certifications: QAI, EcoCert Canada or ProCert Canada.
6
We maintain a comprehensive quality assurance program. All of the products we sell that are represented as “organic” are required to be certified as such by an independent third-party agency. We maintain current certification affidavits on most organic commodities and produce in order to verify the authenticity of the product. Most potential suppliers of organic products are required to provide such third-party certifications to us before they are approved as suppliers.
Working Capital
Normal operating fluctuations in working capital balances can result in changes to cash flow from operations presented in our Consolidated Statements of Cash Flows that are not necessarily indicative of long-term operating trends. Our working capital needs are generally greater during the months leading up to high sales periods, such as the build up in inventory during the time period leading to the calendar year-end holidays. We typically finance these working capital needs with funds provided by operating activities and available credit through our revolving credit facility.
Our Suppliers
We purchase our products from more than
9,000
suppliers. The majority of our suppliers are based in the United States and Canada, but we also source products from suppliers throughout Europe, Asia, Central America, South America, Africa and Australia. We believe suppliers of conventional, natural and organic products seek to distribute their products through us because we provide access to a large customer base across the United States and Canada, distribute the majority of the suppliers’ products and offer a wide variety of marketing programs to our customers to help sell the suppliers’ products. Substantially all product categories that we distribute are available from a number of suppliers and, therefore, we are not dependent on any single source of supply for any product category. In addition, although we have exclusive distribution arrangements and support programs with several suppliers, none of our suppliers accounted for more than
5%
of our total purchases in fiscal
2019
.
We have positioned ourselves as one of the largest purchasers of organically grown bulk products in the natural and organic products industry by centralizing our purchase of nuts, seeds, grains, flours and dried foods. As a result, we are able to negotiate purchases from suppliers on the basis of volume and other considerations that may include discounted pricing or prompt payment discounts. Furthermore, some of our purchase arrangements include the right of return to the supplier with respect to products that we do not sell in a certain period of time. Each region is responsible for placing its own orders and can select the products that it believes will most appeal to its customers, although each region is able to participate in our company-wide purchasing programs.
Our Distribution Systems
The sites for our distribution centers are chosen to provide direct access to our regional markets. This proximity allows us to reduce our transportation costs relative to those of our competitors that seek to service these customers from locations that are often several hundred miles away. We believe that we incur lower inbound freight expense than our regional competitors because our scale allows us to buy full and partial truckloads of products. Products are delivered to our distribution centers primarily by our fleet of leased trucks, contract carriers and the suppliers themselves. When financially advantageous, we pick up product from suppliers or satellite staging facilities and return it to our distribution centers using our own trucks. Additionally, we generally can redistribute overstocks and inventory imbalances between our distribution centers if needed, which helps to reduce out-of-stocks and to sell perishable products prior to their expiration date.
The majority of our trucks are leased from a variety of national banks and are maintained by third-party national leasing companies, which in some cases maintain facilities on our premises for the maintenance and service of these vehicles. We also have facilities where we operate our own maintenance shops.
We ship certain orders for supplements or for items that are destined for areas outside of regular delivery routes through independent carriers. Deliveries to areas outside the continental United States and Canada are typically shipped by ocean-going containers on a weekly basis.
7
Our Focus on Technology
We have made significant investments in distribution, financial, information and warehouse management systems. We continually evaluate and upgrade our management information systems at our regional operations in an effort to make the systems more efficient, cost-effective and responsive to customer needs. These systems include functionality in radio frequency inventory control, pick-to-voice systems, pick-to-light systems, computer-assisted order processing and slot locater/retrieval assignment systems. At most of our receiving docks, warehouse associates attach computer-generated, preprinted locater tags to inbound products. These tags contain the expiration date, locations, quantity, lot number and other information about the products in bar code format. Customer returns are processed by scanning the UPC bar codes. We also employ a management information system that enables us to lower our inbound transportation costs by making optimum use of our own fleet of trucks or by consolidating deliveries into full truckloads. Orders from multiple suppliers and multiple distribution centers are consolidated into single truckloads for efficient use of available vehicle capacity. In addition, we utilize route efficiency software that assists us in developing the most efficient routes for our outbound trucks.
As part of our “one company” approach, we are in the process of converting to a single national warehouse management and procurement system to integrate our existing facilities, including acquired Supervalu facilities, onto one nationalized platform across the organization. We continue to be focused on the automation of our new or expanded distribution centers that are at different stages of construction and implementation. These steps and others are intended to promote operational efficiencies and improve operating expenses as a percentage of net sales.
Competition
The food distribution industry is highly competitive. Our largest competition comes from direct distribution, whereby a customer reaches a product volume level that justifies distribution directly from the manufacturer in order to obtain a lower price. We compete on the basis of price, quality, assortment, schedule and reliability of deliveries and services, value-added services, service fees and distribution facility locations. We also compete in the United States and Canada with numerous national, regional, and local distributors of grocery and non-grocery consumable products. The strategic acquisition of Supervalu provided us with greater scale, a broader product assortment, and a suite of professional services that enhance our ability to compete. Our customers also compete with online retailers and distributors that seek to sell products directly to customers. Recent and ongoing consolidation within the grocery industry has resulted in, and is expected to continue to result in, increased competition, including from some competitors that have greater financial, marketing and other resources than us.
Government Regulation
Our operations and many of the products that we distribute in the United States are subject to regulation by state and local health departments, the USDA and the United States Food and Drug Administration (the “FDA”), which generally impose standards for product quality and sanitation and are responsible for the administration of bioterrorism legislation. In the United States, our facilities generally are inspected at least once annually by state or federal authorities. For certain product lines, we are also subject to the Federal Meat Inspection Act, the Poultry Products Inspection Act, the Perishable Agricultural Commodities Act, the Packers and Stockyard Act and regulations promulgated by the USDA to interpret and implement these statutory provisions. The USDA imposes standards for product safety, quality and sanitation through the federal meat and poultry inspection program.
The FDA Food Safety Modernization Act (“FSMA”), expanded food safety requirements and FDA food safety authorities and, among other things, requires that the FDA impose comprehensive, prevention-based controls across the food supply chain, further regulates food products imported into the United States, and provides the FDA with mandatory recall authority. The FSMA requires the FDA to undertake numerous rulemakings and to issue numerous guidance documents, as well as reports, plans, standards, notices, and other tasks.
The Surface Transportation Board and the Federal Highway Administration regulate our trucking operations. In addition, interstate motor carrier operations are subject to safety requirements prescribed by the United States Department of Transportation and other relevant federal and state agencies. Such matters as weight and dimension of equipment are also subject to federal and state regulations.
Many of our facilities in the United States and in Canada are subject to various environmental protection statutes and regulations, including those relating to the use of water resources and the discharge of wastewater. Further, many of our distribution facilities have ammonia-based refrigeration systems and tanks for the storage of diesel fuel, hydrogen fuel and other petroleum products which are subject to laws regulating such systems and storage tanks. Moreover, in some of our facilities we, or third parties with whom we contract, perform vehicle maintenance. Our policy is to comply with all applicable environmental and safety legal requirements. We are subject to other federal, state, provincial and local provisions relating to the protection of the environment or the discharge of materials; however, these provisions do not materially impact the use or operation of our facilities.
8
Employees
As of
August 3, 2019
, we had approximately
19,000
full and part-time employees within continuing operations,
4,800
of whom (approximately
25%
) are covered by
46
collective bargaining agreements, including agreements under renegotiation. We have in the past been the focus of union-organizing efforts, and we believe it is likely that we will be the focus of similar efforts in the future.
In December 2018, the National Labor Relations Board certified the election results of our driver and warehouse employees in Vernon, California to be represented by the Teamsters union. We are in the process of negotiating collective bargaining agreements with these employees.
Seasonality
Generally, we do not experience any material seasonality. However, our sales and operating results may vary significantly from quarter to quarter due to factors such as changes in our operating expenses, management’s ability to execute our operating and growth strategies, personnel changes, demand for our products, supply shortages and general economic conditions.
Available Information
Our internet address is http://www.unfi.com. The contents of our website are not part of this Annual Report, and our internet address is included in this document as an inactive textual reference only. We make our Annual Report, Quarterly Reports on Form 10-Q, Current Reports on Form 8-K and all amendments to those reports filed or furnished pursuant to Section 13(a) or 15(d) of the Securities Exchange Act of 1934, as amended (the “Exchange Act”) available free of charge through our website as soon as reasonably practicable after we file such reports with, or furnish such reports to, the Securities and Exchange Commission.
ITEM 1A. RISK FACTORS
Our business, financial condition and results of operations are subject to various risks and uncertainties, including those described below and elsewhere in this Annual Report. This section discusses factors that, individually or in the aggregate, we think could cause our actual results to differ materially from expected and historical results. If any of the events described below occurs, our business, financial condition or results of operations could be materially adversely affected and our stock price could decline.
We provide these factors for investors as permitted by and to obtain the rights and protections under the Private Securities Litigation Reform Act of 1995. You should understand that it is not possible to predict or identify all such factors. Consequently, you should not consider the following to be a complete discussion of all potential risks or uncertainties applicable to our business. See “Item 7. Management’s Discussion and Analysis of Financial Condition and Results of Operations—Forward-Looking Statements” for more information on our business and the forward-looking statements included in this Annual Report.
Strategic and Operational Risks
We depend heavily on our principal customers and our success is heavily dependent on our principal customers’ ability to grow their business.
Whole Foods Market accounted for a substantial percentage of our net sales in fiscal
2019
. We serve as the primary distributor of natural, organic, and specialty non-perishable products, and also distribute certain specialty protein, cheese, deli items, and products from health, beauty, and supplement categories to Whole Foods Market in all of its regions in the United States under the terms of our distribution agreement, which expires on September 28, 2025. Our ability to maintain a close, mutually beneficial relationship with Whole Foods Market, which was acquired by Amazon.com, Inc. in August 2017, is an important element to our continued growth.
The loss or cancellation of business from Whole Foods Market, including from increased self-distribution to its own facilities, closures of its stores, reductions in the amount of products that Whole Foods Market sells to its customers, or our failure to comply with the terms of our distribution agreement with Whole Foods Market could materially and adversely affect our business, financial condition, or results of operations. Similarly, if Whole Foods Market is not able to grow its business, including as a result of a reduction in the level of discretionary spending by its customers or competition from other retailers, or if Whole Foods Market diverts purchases from us beyond minimum amounts it is required to purchase under our distribution agreement, our business, financial condition, or results of operations may be materially and adversely affected. Additionally, given the growth acceleration we experienced in fiscal 2018, if Whole Foods Market were to only purchase the minimum purchase amounts under our agreement with them, it would negatively impact our financial results.
9
In addition to our dependence on Whole Foods Market, we are also dependent upon sales to our supermarket customers for both natural and conventional products. To the extent that customers in this group make decisions to utilize alternative sources of products, whether through other distributors or through self-distribution, our business, financial condition or results of operations may be materially and adversely affected.
Our business is a low margin business and our profit margins may decrease due to intense competition and consolidation in the grocery industry.
The grocery industry is characterized by relatively high volume of sales with relatively low profit margins, and as competition in certain areas intensifies and the industry continues to consolidate, our results of operations may be negatively impacted through a loss of sales and reductions in gross margins. The grocery business is intensely competitive, and the recent and ongoing consolidation within the grocery industry is expected to result in increased competition, including from some competitors that have greater financial, marketing, and other resources than we do. Consumers also have more choices than conventional grocery purchases, including independent retailers we do not supply and e-commerce solutions, which reduces the demand for products supplied by our wholesale customers. We cannot provide assurance that we will be able to compete effectively against current and future competitors.
Our ability to compete successfully will be largely dependent on our ability to provide quality products and services at competitive prices. Bidding for contracts or arrangements with customers, particularly within the supernatural and supermarkets channels, is highly competitive. Our competition comes from a variety of sources, including other distributors of natural and conventional products, as well as specialty or independent grocery and mass market grocery distributors and retail customers that have their own distribution channels. Mass market grocery distributors in recent years have increased their emphasis on natural and organic products and are now competing more directly with our natural and organic product offerings, which are higher margin than conventional product offerings. The higher margin on natural and organic product offerings could be affected by changes in the public’s perception of the benefits of natural and organic products compared to similar conventional products.
In addition, many supermarket chains have increased self-distribution of particular items that we sell or have increased their purchases of particular items that we sell directly from suppliers. New competitors are also entering our markets as barriers to entry for new competitors are relatively low. For example, more natural and organic products are being sold in convenience stores and other mass market retailers and online through e-commerce than was the case a few years ago, and many of these customers are being serviced by other conventional distributors or are self-distributing. Some of the mass market grocery distributors with whom we compete may have substantially greater financial and other resources than we have and may be better established in their markets. We also face indirect competition as a result of the fact that our customers with physical locations face competition from online retailers and distributors that seek to sell certain of the type of products we sell to our customers directly to consumers. We cannot assure you that our current or potential competitors will not provide products or services comparable or superior to those provided by us or adapt more quickly than we do to evolving industry trends or changing market requirements. It is also possible that alliances among competitors may develop and that competitors may rapidly acquire significant market share or that certain of our customers will increase distribution to their own retail facilities. Increased competition may result in price reductions, reduced gross margins, lost business and loss of market share, any of which could materially and adversely affect our business, financial condition, or results of operations.
The continuing consolidation of retailers in the natural products industry, the growth of supernatural chains, and increased closures of conventional grocery locations may reduce our profit margins in the future as more customers qualify for greater volume discounts, and as we experience pricing pressures from suppliers and retailers. Sales to customers within our supernatural and supermarkets channels generate a lower gross margin than do sales to our independents channel customers. Many of these customers, including our largest customer, have agreements with us that include volume discounts. As the amounts these customers purchase from us increase, the price that they pay for the products they purchase is reduced, putting downward pressure on our gross margins on these sales. To compensate for these lower gross margins, we must increase the amount of products we sell or reduce the expenses we incur to service these customers. If we are unable to reduce our expenses as a percentage of net sales, including our expenses related to servicing this lower gross margin business, our business, financial condition, or results of operations could be materially and adversely impacted.
10
We are transforming our business and have engaged, and may continue to engage in, acquisitions and divestitures and other strategic initiatives, and may encounter difficulties integrating acquired businesses or divesting businesses or assets and may not realize the anticipated benefits of our acquisitions and divestitures, including, in particular, our recent acquisition of Supervalu.
We have engaged in, and could potentially continue to pursue, strategic transactions and initiatives as we transform our business. Acquisitions and divestitures present significant challenges and risks relating to the integration of acquired businesses and the separation of divested businesses.
On October 22, 2018, we acquired Supervalu, a complex business that was in the process of integrating two recently acquired substantial businesses. On June 23, 2017, Supervalu acquired Unified Grocers, Inc. (“Unified”), a retailer-owned cooperative focused on wholesale grocery and specialty distribution on the West Coast of the United States. On December 8, 2017, Supervalu acquired Associated Grocers of Florida, Inc. (“AG Florida”), a retailer-owned cooperative that distributes full lines of grocery and general merchandise to independent retailers, located primarily in South Florida, the Caribbean, Central and South America and Asia. The processes of integrating Supervalu, Unified and AG Florida may be disruptive to our business operations and may distract our management team from their day-to-day responsibilities. There can also be no assurance that we will be able to successfully integrate Supervalu, Unified, and AG Florida to achieve the operational efficiencies, including synergistic and other benefits of the acquisitions.
Our ability to achieve the expected benefits of these acquisitions, and in particular the Supervalu acquisition, will depend on, among other things, our ability to effectively execute on our business strategies, retain customers and suppliers on terms similar to those in place with the acquired businesses, achieve desired operating efficiencies and sales growth, optimize delivery routes, coordinate administrative and distribution functions, integrate management information systems, expand into new markets to include markets of the acquired business, retain and assimilate the acquired businesses’ employees, and maintain our financial
and internal controls and systems as we expand our operations. Achieving the anticipated benefits of acquisitions also depends on the adequacy of our implementation plans and the ability of management to oversee and operate effectively the combined operations.
To realize the anticipated benefits of the Supervalu acquisition, our business must be successfully combined with Supervalu. We could fail to realize the anticipated benefits for a variety of reasons, including failure to manage relationships with Supervalu’s customers and suppliers, revenue attrition in excess of anticipated levels, potential incompatibility of distribution and logistics operations and systems, failure to leverage the increased scale of the combined company quickly and effectively, difficulties integrating and harmonizing financial reporting systems, loss of key employees, failure to effectively coordinate sales and marketing efforts to communicate the capabilities of the combined company, and failure to execute efficient distribution of our spectrum of product offerings.
The integration of the businesses that we acquired, and in particular Supervalu, might also cause us to incur unforeseen costs, which would lower our future earnings and would prevent us from realizing the expected benefits of these acquisitions. Any of the businesses we acquired may also have liabilities or adverse operating issues, including some that were not discovered before the acquisition, and our indemnity for such liabilities may also be limited or nonexistent. The integration process could divert the attention of management and temporarily redirect resources primarily focused on reducing product cost and operating expenses, resulting in lower gross profits in relation to sales. In addition, the process of combining our company with Supervalu could cause interruption or loss of momentum in the activities of the respective businesses, which could have a material adverse effect on the combined operations.
Additionally, our ability to make any future acquisitions may depend upon obtaining additional financing. We may not be able to obtain additional financing on acceptable terms or at all. To the extent that we seek to acquire other businesses in exchange for our common stock, fluctuations in our stock price could have a material adverse effect on our ability to complete acquisitions. Failure to achieve the anticipated benefits of acquisitions could result in decreases in the amount of expected revenues and diversion of management’s time and energy. Therefore, future acquisitions, if any, could materially and adversely impact our business, financial condition, or operating results including, ultimately, a reduction in our stock price, particularly in periods immediately following the consummation of those transactions while the operations of the acquired business are being integrated with our operations.
We have announced our intention to divest Supervalu’s retail grocery businesses in an efficient and economic manner. There can be no assurance that we will be able to (i) identify buyers for the retail business of Supervalu on favorable terms or at all, (ii) effectively retain employees and conduct business at the stores within the retail business while we seek to identify buyers for these operations, or (iii) effectively minimize liabilities and stranded costs associated with the disposal of these operations, including surplus property and management of remaining obligations under real estate leases. If we are unable to divest Supervalu’s retail grocery business, or realize less net proceeds from the divesture than we anticipate, we may not be able to reduce our indebtedness
11
as planned and will incur higher interests costs as a result. Our inability to complete or realize the projected benefits of planned and/or future divestitures could have a material adverse effect on our business, financial condition, or results of operations.
We may have difficulty managing our growth.
The growth in the size of our business and operations has placed, and is expected to continue to place, a significant strain on our management. Our future growth may be limited by strong growth by certain of our largest customers or our inability to optimize our network of distribution centers to serve our customers, retain existing customers, successfully integrate acquired entities or significant new customers, implement information systems initiatives, or adequately manage our personnel.
We have substantially expanded our distribution center network through the acquisition of Supervalu. If we fail to optimize the volume of supply operations in our distribution center network or do not retain existing business, excess capacity may be created. Any excess capacity may create inefficiencies and adversely affect our business, financial condition, or results of operations, including as a result of incurring operating costs for these facilities while the volume of products supplied from these facilities is insufficient to cover these costs.
We cannot assure you that we will be able to successfully optimize our distribution center network or open new distribution centers in new or existing markets if needed to accommodate or facilitate growth or that certain of our distribution centers will not have, or continue to have, operational challenges. Our ability to compete effectively and to manage future growth, if any, will depend on our ability to maximize operational efficiencies across our distribution center network, to implement and improve on a timely basis operational, financial and management information systems, including our warehouse management systems, and to expand, train, motivate and manage our work force. We cannot assure you that our existing personnel, systems, procedures and controls will be adequate to support the future growth of our operations. Our inability to manage our growth effectively could have a material adverse effect on our business, financial condition, or results of operations, or other operational challenges are addressed in a timely manner.
Our future growth is limited in part by the size and location of our distribution centers. As we near maximum utilization of a given facility or maximize our processing capacity, operations may be constrained and inefficiencies have been and may be created, which could adversely affect our business, financial condition or results of operations unless the facility is expanded, volume is shifted to another facility, or additional processing capacity is added.
Our inability to maintain or increase our operating margins could adversely affect our results of operations and the price of our stock.
As competition increases, the grocery industry consolidates, macro challenges in grocery demand become more pronounced, and we attempt to affiliate larger wholesale customers, we expect to continue to face pressure on our operating margins. If we are not able to continue to capture scale efficiencies and enhance our merchandise offerings, if we are not able to achieve our targeted synergies for our acquisition of Supervalu and Supervalu’s acquisitions of Unified and AG Florida, or if we are not able to reduce our costs as we divest certain of our retail operations, we may not be able to achieve our goals with respect to operating margins. In addition, if we do not refine and improve our systems continually or if we are unable to effectively improve our systems without disruption including any information technology migration to a cloud environment, we may not be able to reduce costs, increase sales and services, effectively manage inventory and procurement processes, or effectively manage customer pricing plans. As a result, our operating margins may stagnate or decline, which could adversely affect the price of our stock.
Our wholesale distribution business could be adversely affected if we are not able to affiliate new customers, increase sales to existing customers or retain existing customers, or if our wholesale customers fail to perform.
The profitability of our wholesale segment is dependent upon sufficient volume to support our operating infrastructure, which is dependent on our ability to attract new customers, increase sales to existing customers, and retain existing customers. The inability to attract new customers or the loss of existing customers to a competing wholesaler or due to retail closure, vertical integration by an existing customer converting to self-distribution, or industry consolidation may negatively impact our sales and operating margins.
12
Our success also relies in part on the financial success and cooperation of our wholesale customers. These wholesale customers manage their businesses independently and, therefore, are responsible for the day-to-day operation of their stores. They may not experience an acceptable level of sales or profitability, and our revenues and gross margins could be negatively affected as a result. We may also need to extend credit to our wholesale customers, including through loans, market support or guarantees. While we seek to obtain security interests and other credit support in connection with the financial accommodations we extend, such collateral may not be sufficient to cover our exposure. Additionally, we sometimes enter into wholesale customer support arrangements to guaranty or subsidize real estate obligations, which make us contingently liable in the event our wholesale customers default. If sales trends or profitability worsen for wholesale customers, their financial results may deteriorate, which could result in, among other things, lost business for us, delayed or reduced payments to us or defaults on payments or other liabilities owed by wholesale customers to us, any of which could adversely impact our financial condition and results of operations, as well as our ability to grow our wholesale business. In this regard, our wholesale customers are affected by the same economic conditions, including food inflation and deflation, and competition that our retail segment faces. The magnitude of these risks increases as the size of our wholesale customers increases.
Many of our customers are not obligated to continue purchasing products from us and larger customers that do have multiyear contracts with us may terminate these contracts early in certain situations or choose not to renew or extend the contract at its expiration.
Many of our wholesale customers buy from us under purchase orders, and we generally do not have written agreements with or long-term commitments from these customers for the purchase of products. We cannot assure you that these customers will maintain or increase their sales volumes or orders for the products supplied by us or that we will be able to maintain or add to our existing customer base. Decreases in our volumes or orders for products supplied by us for these customers with whom we do not have a long-term contract may have a material adverse effect on our business, financial condition, or results of operations.
We may have contracts with certain of our customers (as is the case with many of our conventional supermarket customers and our supernatural chain customer) that obligate the customer to buy products from us for a particular period of time. Even in this case, the contracts may not require the customer to purchase a minimum amount of products from us or the contracts may afford the customer better pricing in the event that the volume of the customer’s purchases exceeds certain levels. If these customers were to terminate or fail to perform under these contracts prior to their scheduled termination, or if we or the customer elected not to renew or extend the term of the contract at its expiration at historical purchase levels, it may have a material adverse effect on our business, financial condition, or results of operations, including additional operational expenses to transition out of the business or to adjust our facilities and staffing costs to cover the reduction in net sales.
Changes in relationships with our suppliers may adversely affect our profitability, and conditions beyond our control can interrupt our supplies and alter our product costs.
We cooperatively engage in a variety of promotional programs with our suppliers. We manage these programs to maintain or improve our margins and increase sales. A reduction or change in promotional spending by our suppliers (including as a result of increased demand for natural and organic products) could have a significant impact on our profitability. We depend heavily on our ability to purchase merchandise in sufficient quantities at competitive prices, and recently we have experienced a higher than anticipated level of vendor out-of-stocks, which may expose us to reduced fill rates with our customers, resulting in higher costs, fees, or penalties, and therefore lower margins. We have no assurances of continued supply, pricing, or access to new products and any supplier could at any time change the terms upon which it sells to us or discontinue selling to us.
The majority of our suppliers are based in the United States and Canada, but we also source products from suppliers throughout Europe, Asia, Central America, South America, Africa and Australia. For the most part, we do not have long-term contracts with our suppliers committing them to provide products to us. Although our purchasing volume can provide benefits when dealing with suppliers, suppliers may not provide the products needed by us in the quantities and at the prices requested. We are also subject to delays caused by interruption in production and increases in product costs based on conditions outside of our control. These conditions include work slowdowns, work interruptions, strikes or other job actions by employees of suppliers, short-term weather conditions or more prolonged climate change, crop conditions, product recalls, water shortages, transportation interruptions, unavailability of fuel or increases in fuel costs, competitive demands, raw material shortages, and natural disasters or other catastrophic events (including, but not limited to food-borne illnesses). As demand for natural and organic products has increased and the distribution channels into which these products are sold have expanded, we have continued to experience higher levels of manufacturer out-of-stocks, and to a lesser degree, we also experience out-of-stocks on certain conventional products. These shortages have caused us to incur higher operating expenses due to the cost of moving products around and between our distribution facilities in order to keep our service level high. We cannot be sure when this trend will end or whether it will recur during future years. As the consumer demand for natural and organic products has increased, certain retailers and other producers have entered the market and attempted to buy certain raw materials directly, limiting their availability to be used in certain supplier products.
13
In addition, increased tariffs on imported goods, and any retaliatory actions by affected countries, may result in an increased in our costs for goods imported into the United States, and may reduce customer demand for affected products if the parties having to pay those tariffs increase their prices.
Further, increased frequency or duration of extreme weather conditions could also impair production capabilities, disrupt our supply chain or impact demand for our products, including the specialty protein and cheese products sold by Tony’s. For example, in the past, weather patterns have at times resulted in lower than normal levels of precipitation in key agricultural states such as California, impacting the price of water and corresponding prices of food products grown in states facing drought conditions. The impact of sustained droughts is uncertain and could result in volatile input costs. Input costs could increase at any point in time for a large portion of the products that we sell for a prolonged period. Conversely, in years where rainfall levels are abundant product costs, particularly in our perishable and produce businesses, may decline and the results of this product cost deflation could negatively impact our results of operations. Our inability to obtain adequate products as a result of any of the foregoing factors or otherwise could prevent us from fulfilling our obligations to customers, and customers may turn to other distributors. In that case, our business, financial condition or results of operations could be materially and adversely affected.
We have experienced losses due to the uncollectability of accounts receivable in the past and could experience increases in such losses in the future if our customers are unable to timely pay their debts to us.
Certain of our customers have from time to time experienced bankruptcy, insolvency, or an inability to pay their debts to us as they come due. If our customers suffer significant financial difficulty, they may be unable to pay their debts to us timely or at all, which could have a material adverse effect on our business, financial condition, or results of operations. It is possible that customers may reject their contractual obligations to us under bankruptcy laws or otherwise. Significant customer bankruptcies could further adversely affect our revenues and increase our operating expenses by requiring larger provisions for bad debt. In addition, even when our contracts with these customers are not rejected, if customers are unable to meet their obligations on a timely basis, it could adversely affect our ability to collect receivables. Further, we may have to negotiate significant discounts and/or extended financing terms with these customers in such a situation, each of which could have a material adverse effect on our business, financial condition, or results of operations.
During periods of economic weakness, small to medium-sized businesses, like many of our independents channel customers, may be impacted more severely and more quickly than larger businesses. Similarly, these smaller businesses may be more likely to be more severely impacted by events outside of their control, like significant weather events. Consequently, the ability of such businesses to repay their obligations to us may deteriorate, and in some cases this deterioration may occur quickly, which could materially and adversely impact our business, financial condition, or results of operations.
Our business strategy of increasing our sales of fresh, perishable items, which we accelerated with our acquisitions of Tony’s, Global Organic and Nor-Cal and which should be facilitated by the Supervalu acquisition, may not produce the results that we expect.
A key element of our current growth strategy is to increase the amount of fresh, perishable products that we distribute. We believe that the ability to distribute these products that are typically found in the perimeter of our customers’ stores, in addition to the products we have historically distributed, will differentiate us from our competitors and increase demand for our products. We accelerated this strategy with our acquisitions of Tony’s, Global Organic/Specialty Source, Inc. and related affiliates, and Nor-Cal, and most importantly Supervalu. If we are unable to grow this portion of our business and manage that growth effectively, our business, financial condition, or results of operations may be materially and adversely affected, or we may not be able to fully realize the benefits of the Supervalu acquisition.
We face risks related to labor relations, labor costs, and the availability of qualified labor.
As of August 3, 2019, approximately
4,800
of our
19,000
employees (approximately
25.3%
) were covered by 46 collective bargaining agreements, including agreements under negotiation, which expire through April 2023, including 37 collective bargaining agreements assumed in our acquisition of Supervalu. If we are not able to renew these agreements or are required to make significant changes to these agreements that are unfavorable to us, our relationship with these employees may become fractured, work stoppages could occur or we may incur additional expenses which could have a material adverse effect on our business, financial condition, or results of operations. We have in the past been the focus of union-organizing efforts, and we believe it is likely that we will be the focus of similar efforts in the future. Additionally, the terms of some legacy Supervalu collective bargaining agreements may limit our ability to increase efficiencies, while the threat of labor disruption is greater due to the larger number of represented locations.
14
As we increase our employee base and broaden our distribution operations to new geographic markets, our increased visibility could result in increased or expanded union-organizing efforts. New contracts with existing unions could have substantially less favorable terms than prior to such expanded union-organizing efforts. In the event we are unable to negotiate contract renewals with our union associates, we could be subject to work stoppages. In that event, it would be necessary for us to hire replacement workers to continue to meet our obligations to our customers. The costs to hire replacement workers and employ effective security measures could negatively impact the profitability of any affected facility. Depending on the length of time that we are required to employ replacement workers and security measures these costs could be significant and could have a material adverse effect on our business, financial condition, or results of operations.
We are subject to a wide range of labor costs. Because our labor costs are, as a percentage of net sales, higher than in many other industries, we may be significantly harmed by labor cost increases. In addition, labor is a significant cost of many of our wholesale customers. Any increase in their labor costs, including any increases in costs as a result of increases in minimum wage requirements, could reduce the profitability of our customers and reduce demand for the products we supply.
Additionally, we risk a shortage of qualified labor. Recruiting and retention efforts, and actions to increase productivity, may not be successful, and we could encounter a shortage of qualified labor in the future. Such a shortage could potentially increase labor costs, reduce profitability or decrease our ability to effectively serve customers. We are undertaking efforts to automate certain functions of our business. If we are unable to realize our efforts to improve labor efficiency through automation, or increase productivity and efficiency through other methods, including as a result of delays in executing our business transformation and integration efforts, we may be more susceptible to labor shortages than our competitors.
Increases in healthcare, pension, and other costs under the Company’s and multiemployer benefit plans could adversely affect our financial condition and results of operations.
We provide health, defined benefit pension, defined contribution, and, in certain cases, postretirement benefits to many of our employees and, in some cases, former employees and the costs of such benefits continue to increase. The amount of any increase depends on a number of different factors, many of which are beyond our control. These factors include governmental regulations such as The Patient Protection and Affordable Care Act, which has resulted in changes to the U.S. healthcare system and imposes mandatory types of coverage, reporting and other requirements; return on assets held in plans; changes in actuarial valuations, estimates, assumptions or calculations used to determine our benefit obligations for certain benefit plans, which require the use of significant estimates, including the discount rate, expected long-term rate of return on plan assets, mortality rates and the rates of increase in compensation and healthcare costs; for multiemployer plans, the outcome of collective bargaining and actions taken by trustees who manage the plans; and potential changes to applicable legislation or regulation. If we are unable to control these benefits and costs, we may experience increased operating costs, which may adversely affect our financial condition and results of operations.
Additionally, Company-sponsored plans and multiemployer pension plans are underfunded with the projected benefit obligations exceeding the fair value of those plans’ assets, in certain cases (for example, Central States Pension Plan), by a wide margin. Withdrawal liabilities from multiemployer plans could be material, and potential exposure to withdrawal liabilities could cause us to forgo or negatively impact our ability to enter into other business opportunities. Some of these plans have required rehabilitation plans or funding improvement plans, and we can give no assurances of the extent to which a rehabilitation plan or a funding improvement plan will improve the funded status of the plan. We expect that increases of unfunded liabilities of these plans would result in increased future payments by us and the other participating employers over the next few years. A significant increase to funding requirements could adversely affect our financial condition, results of operations, or cash flows. The financial condition of these pension plans may also negatively impact our debt ratings, which may increase the cost of borrowing or adversely affect our ability to access financial markets.
Failure by us to develop and operate a reliable technology platform and the costs of maintaining secure and effective information technology systems could negatively impact our business, and we may not realize the anticipated benefits of our recent investments in information technology.
Our ability to decrease costs and increase profits, as well as our ability to serve customers most effectively, depends on the reliability of our technology platform. We use software and other technology systems, among other things, to generate and select orders, to load and route trucks and to monitor and manage our business on a day-to-day basis. Failure to have adequate computer systems across the enterprise and any disruption to these computer systems could adversely impact our customer service, decrease the volume of our business, and result in increased costs negatively affecting our business, financial condition, or results of operations.
15
In our attempt to reduce operating expenses and increase operating efficiencies, we have invested in the development and implementation of new information technology. We are in the process of rolling out a national warehouse management and procurement system to convert our existing facilities into a single warehouse management and supply chain platform. In light of the acquisition of Supervalu, we are reevaluating our warehouse management system strategy. However, we currently plan to remain focused on the automation of our new or expanded distribution centers that are at different stages of construction. We may not be able to implement these technological changes in the time frame that we have planned and delays in implementation (including delays resulting from the integration of Supervalu) could negatively impact our business, financial condition or results of operations. In addition, the costs to make these changes may exceed our estimates and will exceed the benefits during the early stages of implementation. Even if we are able to implement the changes in accordance with our current plans, and within our current cost estimates, we may not be able to achieve the expected efficiencies and cost savings from this investment, which could have a material adverse effect on our business, financial condition, or results of operations. Moreover, as we implement information technology enhancements, disruptions in our business may be created (including disruption with our customers), which may have a material adverse effect on our business, financial condition, or results of operations.
Disruptions to our or third-party information technology systems, including cyber-attacks and security breaches, and the costs of maintaining secure and effective information technology systems could negatively affect our business and results of operations.
The efficient operation of our businesses is highly dependent on computer hardware and software systems, including customized information technology systems. Additionally, our businesses increasingly involve the receipt, storage and transmission of sensitive data, including personal information about our customers, employees, and vendors and our proprietary business information. We also share information with vendors. Information systems are vulnerable to not functioning as designed and to disruptions and security breaches by computer hackers and cyber terrorists.
Although we continue to take actions to strengthen the security of our information technology systems, these measures and technology may not adequately anticipate or prevent security breaches in the future or we may not be able to timely implement these measures and technology. Cyber-attacks are rapidly evolving and becoming increasingly sophisticated and difficult to detect. The failure to promptly detect, determine the extent of, appropriately respond to, and contain a significant data security attack or breach of our systems or any third-party systems used by us could have a material adverse impact on our business, financial condition, or results of operations. We could also lose credibility with our customers and suffer damage to our reputation and future sales, including through negative publicity and social media. In addition, the unavailability of the information systems or failure of these systems or software to perform as anticipated for any reason and any inability to respond to, or recover from, such an event, could disrupt our business, impact our customers and could result in decreased performance, increased overhead costs and increased risk for liability, causing our business and results of operations to suffer.
As a merchant that accepts debit and credit cards for payment, we are subject to the Payment Card Industry Data Security Standard (“PCI DSS”), issued by the PCI Council. Additionally, we are subject to PCI DSS as a service provider, which is a business entity that is not a payment brand directly involved in the processing, storage or transmission of cardholder data. PCI DSS contains compliance guidelines and standards with regard to our security surrounding the physical and electronic storage, processing and transmission of individual cardholder data. By accepting debit cards for payment, we are also subject to compliance with American National Standards Institute data encryption standards and payment network security operating guidelines. The cost of complying with stricter privacy and information security laws, standards and guidelines, including evolving PCI DSS standards, and developing, maintaining, and upgrading technology systems to address future advances in technology, could be significant and we could experience problems and interruptions associated with the implementation of new or upgraded systems and technology or with maintenance or adequate support of existing systems. Failure to comply with such laws, standards, and guidelines, or payment card industry standards such as accepting Europay, MasterCard and Visa (EMV) transactions, could have a material adverse impact on our business, financial condition, or results of operations.
We have a significant service relationship with Save-A-Lot, and the wind-down of our relationship with Save-A-Lot could adversely impact our results of operations.
We have provided significant support services to Save-A-Lot since we divested it in December 2016. We will lose a significant amount of revenue and corresponding operating earnings as a result of this wind down. We have been executing on our plan to reduce costs, grow our sales and enhance our margins over the past several years, but we may not be able to grow sales quickly enough, further eliminate costs or enhance margins to fully mitigate the lost revenue as the services agreement unwinds. Failure to execute on our services offering and growth strategy, including making the necessary capital investments for that growth while managing additional cost reductions, could further adversely impact our results of operations. Our large professional services agreement with Save-A-Lot provides certain rights for the customers. The services agreement will typically include a fixed term but provide the customer certain termination rights, including in the event of our material breach, and may give the customer certain termination and monetary rights with respect to specified services or service categories in the event we do not perform to
16
agreed-upon minimum levels of service. The services agreement will also generally require us to indemnify the customer against third-party claims arising out of the performance of the services under the agreement. Termination of services agreements, in whole or in part, and in particular the services agreement with Save-A-Lot, could adversely affect our business or results of operations.
Changes in the military commissary system or decreases in governmental funding could negatively impact the sales and operating performance of our military business.
Our wholesale segment sells and distributes grocery products to military commissaries and exchanges in the United States. The commissary system has experienced material changes as the Defense Commissary Agency has looked to reduce the level of governmental funding required for the system, including to lower prices from suppliers and to offer its own private-label products. The military food distribution industry already has narrow operating margins making economies of scale critical for distributors. These changes could have an adverse impact on the sales and operating performance of our military business. Additionally, our military business faces competition from large national and regional food distributors, as well as smaller food distributors, and the military commissaries and exchanges face competition from low-cost retailers.
Our insurance and self-insurance programs may not be adequate to cover future claims.
We use a combination of insurance and self-insurance to provide for potential liabilities, including workers’ compensation, general and auto liability, director and officer liability, property risk, cyber and privacy risks and employee healthcare benefits. We believe that our insurance coverage is customary for businesses of our size and type. However, there are types of losses we may incur that cannot be insured against or that we believe are not commercially reasonable to insure. These losses, should they occur, could have a material adverse effect on our business, financial condition or results of operations. In addition, the cost of insurance fluctuates based upon our historical trends, market conditions, and availability.
We estimate the liabilities and required reserves associated with the risks we retain. Any such estimates and actuarial projection of losses is subject to a considerable degree of variability. Among the causes of this variability are changes in benefit levels, medical fee schedules, medical utilization guidelines, severity of injuries and accidents, vocation rehabilitation and apportionment and unpredictable external factors affecting inflation rates, discount rates, rising healthcare costs, litigation trends, legal interpretations, benefit level changes, and actual claim settlement patterns. If actual losses incurred are greater than those anticipated, our reserves may be insufficient and additional costs could be recorded in our consolidated financial statements. If we suffer a substantial loss that exceeds our self-insurance reserves, and any excess insurance coverage, the loss and attendant expenses could harm our business, financial condition, or results of operations. We have purchased stop-loss coverage from third parties for certain employee healthcare plans, which limits our exposure above the amounts we have self-insured.
Impairment charges for goodwill or other long-lived assets could adversely affect the Company’s financial condition and results of operations.
We monitor the recoverability of our long-lived assets, such as buildings and equipment, and evaluate their carrying value for impairment whenever events or changes in circumstances indicate that the carrying amount of such assets may not be fully recoverable. We annually review goodwill to determine if impairment has occurred. Additionally, interim reviews are performed whenever events or changes in circumstances indicate that impairment may have occurred. If the testing performed indicates that impairment has occurred, we are required to record a non-cash impairment charge for the difference between the carrying value and fair value of the long-lived assets or the carrying value and fair value of the reporting unit, in the period the determination is made. The testing of long-lived assets and goodwill for impairment requires us to make estimates that are subject to significant assumptions about our future revenue, profitability, cash flows, fair value of assets and liabilities, weighted average cost of capital, as well as other assumptions. Changes in these estimates, or changes in actual performance compared with these estimates, may affect the fair value of long-lived assets or reporting unit, which may result in an impairment charge.
We cannot accurately predict the amount or timing of any impairment of assets. Should the value of long-lived assets or goodwill become impaired, our financial condition and results of operations may be adversely affected.
Our debt agreements contain restrictive covenants that may limit our operating flexibility.
Our debt agreements, including the loan agreement (the “ABL Loan Agreement”) related to our $2,100 million asset-based revolving credit facility (the “ABL Credit Facility”) entered into on August 30, 2018 and the term loan agreement (the “Term Loan Agreement”) related to our $1,950.0 million term loan facility (the “Term Loan Facility”) entered into in October 2018, contain financial covenants and other restrictions that limit our operating flexibility, limit our flexibility in planning for or reacting to changes in our business. These restrictions may prevent us from taking actions that we believe would be in the best interest of our
17
business if we were not subject to these limitations and may make it difficult for us to successfully execute our business strategy or effectively compete with companies that are not similarly restricted.
In addition, our ABL Loan Agreement and Term Loan Agreement require that we comply with various financial tests and impose certain restrictions on us, including among other things, restrictions on our ability to incur additional indebtedness, create liens on assets, make loans or investments, or pay dividends. Failure to comply with these covenants could have a material adverse effect on our business, financial condition, or results of operations.
The cost of the capital available to us and limitations on our ability to access additional capital may have a material adverse effect on our business, financial condition, or results of operations.
Historically, acquisitions and capital expenditures have been a large component of our growth. We anticipate that capital expenditures will continue to be, and acquisitions may be, important to our growth in the future. As a result, increases in the cost of capital available to us, which could result from volatility in the credit markets, downgrades of our credit ratings, or the Company not being in compliance with restrictive covenants under our debt agreements, or our inability to access additional capital to finance acquisitions and capital expenditures through borrowed funds could restrict our ability to grow our business organically or through acquisitions, which could have a material adverse effect on our business, financial condition, or results of operations.
In addition, our profit margins depend on strategic investment buying initiatives, such as discounted bulk purchases, which require spending significant amounts of working capital up-front to purchase products that we then sell over a multi-month time period. Therefore, increases in the cost of capital available to us or our inability to access additional capital through borrowed funds at economic terms could restrict our ability to engage in strategic investment buying initiatives, which could reduce our profit margins and have a material adverse effect on our business, financial condition, or results of operations.
Economic Risks
Our high level of debt makes us more sensitive to the effects of economic downturns and could adversely affect our business.
To finance the acquisition of Supervalu, we incurred or assumed approximately $3.5 billion of indebtedness, including indebtedness incurred to refinance Supervalu’s and our then existing debt. Our leverage, and any increase therein, could have important potential consequences, including, but not limited to:
|
•
|
increasing our vulnerability to, and reducing our flexibility to plan for and respond to, general adverse economic and industry condition and changes in our business and the competitive environment;
|
|
•
|
requiring the dedication of a substantial portion of our cash flow from operations to the payment of principal of, and interest on, indebtedness, thereby reducing the availability of such cash flow to fund working capital, capital expenditures, acquisitions, share repurchases, or other corporate purposes;
|
|
•
|
increasing our vulnerability to a downgrade of our credit rating, which could adversely affect our cost of funds, liquidity, and access to capital markets;
|
|
•
|
restricting us from making desired strategic acquisitions in the future or causing us to make non-strategic divestitures;
|
|
•
|
increasing our exposure to the risk of increased interest rates insofar as current and future borrowings are subject to variable rates of interest;
|
|
•
|
making it more difficult for us to repay, refinance, or satisfy our obligations with respect to our debt;
|
|
•
|
limiting our ability to borrow additional funds in the future and increasing the cost of any such borrowing;
|
|
•
|
placing us at a competitive disadvantage compared to competitors with less leverage or better access to capital resources; and
|
|
•
|
imposing restrictive covenants on our operations, which, if not complied with, could result in an event of default, which in turn, if not cured or waived, could result in the acceleration of the applicable debt, and may result in the acceleration of any other debt to which a cross-acceleration or cross-default provision applies.
|
There is no assurance that we will generate cash flow from operations or that future debt or equity financings will be available to us to enable us to pay our indebtedness or to fund other needs. As a result, we may need to refinance all or a portion of our indebtedness on or before maturity. There is no assurance that we will be able to refinance any of our indebtedness on favorable terms, or at all. Any inability to generate sufficient cash flow or refinance our indebtedness on favorable terms could have a material adverse effect on our business, financial condition, or results of operations. In addition, potential changes to, or the elimination of, the London Interbank Offered Rate (“LIBOR”), may adversely affect interest expense related to borrowings under our credit facilities and interest rate swaps, which could potentially negatively impact our financial condition.
18
Our operations are sensitive to macroeconomic conditions.
The grocery industry is sensitive to national and regional economic conditions and the demand for the products that we distribute may be adversely affected from time to time by economic downturns that impact consumer spending, including discretionary spending, as well as general trends impacting the grocery retail business. Future economic conditions such as employment levels, business conditions, housing starts, interest rates, inflation rates, energy and fuel costs, and tax rates could reduce consumer spending or change consumer purchasing habits. Among these changes could be a reduction in the number of our higher margin natural and organic products that consumers purchase where there are conventional lower margin alternatives given that many natural and organic products, and particularly natural and organic foods, often have higher retail prices than do their conventional counterparts.
Our business may be sensitive to inflationary and deflationary pressures.
Many of our sales are at prices that are based on our product cost plus a percentage markup. As a result, volatile food costs have a direct impact upon our profitability. Prolonged periods of product cost inflation and periods of rapidly increasing inflation may have a negative impact on our profit margins and results of operations to the extent that we are unable to pass on all or a portion of such product cost increases to our customers. In addition, product cost inflation may negatively impact the consumer discretionary spending trends and reduce the demand for higher-margin natural and organic products, which could adversely affect profitability. Conversely, because many of our sales are at prices that are based upon product cost plus a percentage markup, our profit levels may be negatively impacted during periods of product cost deflation even though our gross profit as a percentage of net sales may remain relatively constant. To compensate for lower gross margins, we, in turn, must reduce expenses that we incur to service our customers. If we are unable to reduce our expenses as a percentage of net sales, our business, financial condition, or results of operations could be materially and adversely impacted.
Changes in consumer eating habits could materially and adversely affect our business, financial condition, or results of operations.
Changes in consumer eating habits away from natural, organic, or specialty products could reduce demand for our higher margin natural and organic products. Consumer eating habits could be affected by a number of factors, including changes in attitudes regarding benefits of natural and organic products when compared to similar lower margin conventional products or new information regarding the health effects of consuming certain foods. Although there is a growing consumer preference for sustainable, organic and locally grown products, there can be no assurance that such trend will continue. Changing consumer eating habits also occur due to generational shifts. Millennials, the largest demographic group in the U.S. in terms of spend, seek new and different as well as more ethnic menu options and menu innovation. However, there can be no assurance that such trend will continue. If consumer eating habits change significantly, we may be required to modify or discontinue sales of certain items in our product portfolio, and we may experience higher costs associated with the implementation of those changes. Additionally, if we are not able to effectively respond to changes in consumer perceptions or adapt our product offerings to trends in eating habits, our business, financial condition, or results of operations could suffer.
Increased fuel costs may adversely affect our results of operations.
Increased fuel costs may have a negative impact on our results of operations. The high cost of diesel fuel can increase the price we pay for products as well as the costs we incur to deliver products to our customers, including costs of inbound goods from our suppliers. These factors, in turn, may negatively impact our net sales, margins, operating expenses, and operating results. To manage this risk, we have in the past periodically entered, and may in the future periodically enter, into commodity derivative contracts to hedge a portion of our projected diesel fuel requirements. To the extent we do not enter into commodity swap agreements, our exposure to volatility in the price of diesel fuel would increase relative to our exposure to volatility in periods in which we had outstanding commodity derivative contracts. We do not enter into fuel hedge contracts for speculative purposes. We have in the past, and may in the future, periodically enter into forward purchase commitments for a portion of our projected monthly diesel fuel requirements at fixed prices. As of August 3, 2019, we had no forward diesel fuel commitments. We also maintain a fuel surcharge program which allows us to pass some of our higher fuel costs through to our customers. We cannot guarantee that we will continue to be able to pass a comparable proportion or any of our higher fuel costs to our customers in the future, which may adversely affect our business, financial condition or results of operations.
Disruption of our distribution network or to the operations of our customers could adversely affect our business.
Damage or disruption to our distribution capabilities due to weather, including extreme or prolonged weather conditions, natural disaster, fire, terrorism, pandemic, strikes, product recalls or safety concerns generally, crop conditions, availability of key commodities, regulatory actions, disruptions in technology, the financial and/or operational instability of key suppliers, performance by outsourced service providers, transportation interruptions, labor supply or stoppages or vendor defaults or disputes, or other
19
reasons could impair our ability to distribute our products. To the extent that we are unable, or it is not financially feasible, to mitigate the likelihood or potential impact of such events, or to manage effectively such events if they occur, there could be an adverse effect on our business, financial condition or results of operations.
In addition, such disruptions may reduce the number of consumers who visit our customers’ facilities in any affected areas. Furthermore, such disruption may interrupt or impede access to our customers’ facilities, all of which could have a material adverse effect on our business, financial condition, or results of operations.
Legal and Regulatory Risks
We are subject to significant governmental regulation.
Our business is highly regulated at the federal, state, and local levels and our products and distribution operations require various licenses, permits, and approvals. In particular:
|
•
|
the products that we distribute in the United States are subject to inspection by the United States Food and Drug Administration;
|
|
•
|
our warehouse and distribution centers are subject to inspection by the United States Department of Agriculture, the United States Department of Labor Occupational and Health Administration, and various state health and workplace safety authorities; and
|
|
•
|
the United States Department of Transportation and the United States Federal Highway Administration regulate our United States trucking operations.
|
In addition, the various federal, state and local laws, regulations and administrative practices to which we are subject require us to comply with numerous provisions regulating areas such as environmental, health and sanitation standards, food safety, marketing of natural or organically produced food, facilities, pharmacies, equal employment opportunity, public accessibility, employee benefits, wages and hours worked and licensing for the sale of food, drugs, tobacco and alcoholic beverages, among others. For example:
Environmental, Health and Safety
: Our operations are subject to extensive and increasingly stringent laws and regulations pertaining to the protection of the environment, including those relating to the discharge of materials into the environment, the disposal of food by-products, the handling, treatment, and disposal of wastes, maintenance of refrigeration systems, and remediation of soil and groundwater contamination. Compliance with existing or changing environmental and safety requirements, including more stringent limitations imposed or expected to be imposed in recently renewed or soon-to-be renewed environmental permits, may require capital expenditures. Additionally, concern over climate change, including the impact of global warming, has led to significant United States and international legislative and regulatory efforts to limit greenhouse gas emissions. Increased regulation regarding greenhouse gas emissions, especially diesel engine emissions, could impose substantial costs on us. These costs include an increase in the cost of the fuel and other energy we purchase and capital costs associated with updating or replacing our vehicles prematurely. Until the timing, scope, and extent of such regulation becomes known, we cannot predict its effect on our results of operations. It is reasonably possible, however, that it could impose material costs on us which we may be unable to pass on to our customers.
Food Safety and Marketing
: There is increasing governmental scrutiny, regulations and public awareness regarding food quality and food and drug safety. We may be adversely affected if consumers lose confidence in the safety and quality of our food and drug products. In addition, as a distributor and manufacturer of natural, organic, and specialty foods (along with conventional foods products), we are subject to increasing governmental scrutiny of and public awareness regarding food safety and the sale, packaging, and marketing of natural and organic products. Compliance with these laws may impose a significant burden on our operations.
Wage Rates and Paid Leave
: Changes in federal, state or local minimum wage and overtime laws or employee paid leave laws could cause us to incur additional wage costs, which could adversely affect our operating margins. Failure to comply with existing or new laws or regulations could result in significant damages or penalties
Foreign Operations
: Our supplier base includes domestic and foreign suppliers. In addition, we have customers located outside the United States and the acquisition of Supervalu, in particular its AG Florida business, expanded our wholesale business to additional international customers. Accordingly, laws and regulations affecting the importation and taxation of goods, including duties, tariffs and quotas, or changes in the enforcement of those laws and regulations could adversely impact our financial condition and results of operations. In addition, we are required to comply with laws and regulations governing export controls, and ethical, anti-bribery and similar business practices such as the Foreign Corrupt Practices Act. Our Canadian operations are similarly subject
20
to extensive regulation, including the English and French dual labeling requirements applicable to products that we distribute in Canada. The loss or revocation of any existing licenses, permits, or approvals or the failure to obtain any additional licenses, permits, or approvals in new jurisdictions where we intend to do business could have a material adverse effect on our business, financial condition, or results of operations.
Pharmacy
: We are required to meet various security and operating standards and comply with the Controlled Substances Act and its accompanying regulations governing the sale, marketing, packaging, holding, record keeping, and distribution of controlled substances. During the past several years, the United States healthcare industry has been subject to an increase in governmental regulation and audits at both the federal and state levels. For example, Supervalu received an administrative subpoena issued by the Drug Enforcement Administration requesting, among other things, information on the company’s pharmacy policies and procedures generally, as well as the production of documents that are required to be kept and maintained pursuant to the Controlled Substances Act and its implementing regulations. Additionally, the Patient Protection and Affordable Care Act made several significant changes to Medicaid rebates and to reimbursement. One of these changes was to revise the definition of the Average Manufacturer Price, a pricing element common to most payment formulas, and the reimbursement formula for multi-source (i.e., generic) drugs. This change will affect our reimbursement. In addition, the Patient Protection and Affordable Care Act made other changes that affect the coverage and plan designs that are or will be provided by many of our health plan clients, including the requirement for health insurers to meet a minimum medical loss ratio to avoid having to pay rebates to enrollees. These Patient Protection and Affordable Care Act changes may not affect our business directly, but they could indirectly impact our services and/or business practices.
The failure to comply with applicable regulatory requirements, or make capital expenditures required to maintain compliance with governmental laws and regulations, including those referred to above and in Item 1. Business-Government Regulation of our Annual Report, could result in, among other things, administrative, civil, or criminal penalties or fines; mandatory or voluntary product recalls; warning or other letters; cease and desist orders against operations that are not in compliance; closure of facilities or operations; the loss, revocation, or modification of any existing licenses, permits, registrations, or approvals; the failure to obtain additional licenses, permits, registrations, or approvals in new jurisdictions where we intend to do business; or the loss of our ability to participate in federal and state healthcare programs, any of which could have a material adverse effect on our business, financial condition, or results of operations. These laws and regulations may change in the future. We cannot predict the nature of future laws, regulations, interpretations, or applications, nor can we determine the effect that additional governmental regulations or administrative orders, when and if promulgated, or disparate federal, state and local regulatory schemes would have on our future business. We may incur material costs in our efforts to comply with current or future laws and regulations or due to any required product recalls.
In addition, if we fail to comply with applicable laws and regulations or encounter disagreements with respect to our contracts subject to governmental regulations, including those referred to above, we may be subject to investigations, criminal sanctions or civil remedies, including fines, injunctions, prohibitions on exporting, seizures, or debarments from contracting with the U.S. or Canadian governments. The cost of compliance or the consequences of non-compliance, including debarments, could have a material adverse effect on our business, financial condition, or results of operations. In addition, governmental units may make changes in the regulatory frameworks within which we operate that may require either the corporation as a whole or individual businesses to incur substantial increases in costs in order to comply with such laws and regulations.
Product liability claims could have an adverse effect on our business.
We face an inherent risk of exposure to product liability claims if the products we manufacture or sell cause injury or illness. In addition, meat, seafood, cheese, poultry, and other products that we distribute could be subject to recall because they are, or are alleged to be, contaminated, spoiled or inappropriately labeled. Our meat and poultry products may be subject to contamination by disease-producing organisms, or pathogens, such as Listeria monocytogenes, Salmonella and generic E.coli. These pathogens are generally found in the environment, and as a result, there is a risk that they, as a result of food processing, could be present in the meat and poultry products we distribute. These pathogens can also be introduced as a result of improper handling at the consumer level. These risks may be controlled, although not eliminated, by adherence to good manufacturing practices and finished product testing. We have little, if any, control over proper handling before we receive the product or once the product has been shipped to our customers. Any events that give rise to actual or potential food contamination, drug contamination or food-borne illness or injury, or events that give rise to claims that our products are not of the quality or composition claimed to be, may result in product liability claims from individuals, consumers and governmental agencies, penalties and enforcement actions from government agencies, a loss of consumer confidence, harm to our reputation and could cause production and delivery disruptions, which may adversely affect our financial condition or results of operations. While we generally seek contractual indemnification and insurance coverage from our suppliers, we might not be able to recover these significant costs from our suppliers.
We may be subject to liability, which could be substantial, because of actual or alleged contamination in products manufactured or sold by us, including products sold by companies before we acquired them.
21
In addition, if we were to manufacture or distribute foods that are or are perceived to be unsafe, contaminated, or defective, it may be necessary for us to recall such products, or we may recall products that we determine do not satisfy our quality standards. Any resulting product recalls could have an adverse effect on our business, financial condition, or results of operations. We have, and the companies we have acquired have had, liability insurance with respect to product liability claims. This insurance may not continue to be available at a reasonable cost or at all, and may not be adequate to cover product liability claims against us or against companies we have acquired. We generally seek contractual indemnification from manufacturers, but any such indemnification is limited, as a practical matter, to the creditworthiness of the indemnifying party. If we or any of our acquired companies do not have adequate insurance or contractual indemnification available, product liability claims and costs associated with product recalls, including a loss of business, could have a material adverse effect on our business, financial condition, or results of operations.
We may be unable to adequately protect our intellectual property rights, which could harm our business.
We rely on a combination of trademark, service mark trade secret, copyright, and domain name law and internal procedures and nondisclosure agreements to protect our intellectual property. We believe our trademarks, private-label products, and domain names are valuable assets. However, our intellectual property rights may not be sufficient to distinguish our products and services from those of our competitors and to provide us with a competitive advantage. From time to time, third parties may use names, logos, and slogans similar to ours, may apply to register trademarks or domain names similar to ours, and may infringe or otherwise violate our intellectual property rights. Our intellectual property rights may not be successfully asserted against such third parties or may be invalidated, circumvented, or challenged. Asserting or defending our intellectual property rights could be time consuming and costly and could distract management’s attention and resources. If we are unable to prevent our competitors from using names, logos, slogans, and domain names similar to ours, consumer confusion could result, the perception of our brands and products could be negatively affected, and our sales and profitability could suffer as a result. In addition, if our wholesale customers receive negative publicity or fail to maintain the quality of the goods and services used in connection with our trademarks, our rights to, and the value of, our trademarks could potentially be harmed. Failure to protect our proprietary information could also have an adverse effect on our business.
We may also be subject to claims that our activities or the products we sell infringe, misappropriate, or otherwise violate the intellectual property rights of others. Any such claims can be time consuming and costly to defend and may distract management’s attention and resources, even if the claims are without merit, and may prevent us from using our trademarks in certain geographies or in connection with certain products and services, any of which could adversely affect our business.
ITEM 1B. UNRESOLVED STAFF COMMENTS
None.
ITEM 2. PROPERTIES
We maintained
63
distribution centers and warehouses at
August 3, 2019
, which were utilized by our Wholesale segment and our other operating segments. These facilities, including off-site storage space, consisted of an aggregate of approximately
32.2 million
square feet of storage space.
Distribution Centers
The following table shows our dry and cold storage distribution and warehouse facilities and the owned and leased square footage we occupied as of
August 3, 2019
:
|
Location
|
Owned Square Footage
|
Leased Square Footage
|
Total Square Footage
|
||||||
|
|
(in thousands)
|
||||||||
|
Hopkins, Minnesota
(1)(2)
|
1,866
|
|
—
|
|
1,866
|
|
|||
|
Riverside, California
|
—
|
|
1,858
|
|
1,858
|
|
|||
|
Stockton, California
(1)
|
—
|
|
1,290
|
|
1,290
|
|
|||
|
Mechanicsville, Virginia
(1)(2)
|
1,249
|
|
—
|
|
1,249
|
|
|||
|
Centralia, Washington
|
—
|
|
1,155
|
|
1,155
|
|
|||
|
York, Pennsylvania
|
—
|
|
1,039
|
|
1,039
|
|
|||
|
Joliet, Illinois
(1)
|
—
|
|
988
|
|
988
|
|
|||
22
|
Location
|
Owned Square Footage
|
Leased Square Footage
|
Total Square Footage
|
||||||
|
|
(in thousands)
|
||||||||
|
Tacoma, Washington
(1)
|
654
|
|
305
|
|
960
|
|
|||
|
Milwaukie, Oregon
(1)
|
—
|
|
939
|
|
939
|
|
|||
|
Champaign, Illinois
(1)
|
—
|
|
910
|
|
910
|
|
|||
|
Harrisburg, Pennsylvania
(1)
|
—
|
|
883
|
|
883
|
|
|||
|
Green Bay, Wisconsin
(1)
|
—
|
|
880
|
|
880
|
|
|||
|
Fort Wayne, Indiana
(1)
|
871
|
|
—
|
|
871
|
|
|||
|
Commerce, California
(1)
|
695
|
|
163
|
|
858
|
|
|||
|
Sarasota, Florida
|
—
|
|
847
|
|
847
|
|
|||
|
Pompano Beach, Florida
(1)
|
—
|
|
799
|
|
799
|
|
|||
|
Quincy, Florida
(1)
|
758
|
|
—
|
|
758
|
|
|||
|
Pittsburgh, Pennsylvania
(1)
|
679
|
|
—
|
|
679
|
|
|||
|
Ocala, Florida
(1)(2)
|
670
|
|
—
|
|
670
|
|
|||
|
Moreno Valley, California
|
—
|
|
613
|
|
613
|
|
|||
|
Lancaster, Texas
|
—
|
|
590
|
|
590
|
|
|||
|
Indianola, Missouri
(1)
|
543
|
|
40
|
|
583
|
|
|||
|
Atlanta, Georgia
(2)
|
389
|
|
259
|
|
648
|
|
|||
|
Anniston, Alabama
(1)
|
465
|
|
105
|
|
570
|
|
|||
|
Aurora, Colorado
|
—
|
|
529
|
|
529
|
|
|||
|
Montgomery, New York
(2)
|
500
|
|
—
|
|
500
|
|
|||
|
Rocklin, California
(2)
|
469
|
|
—
|
|
469
|
|
|||
|
Stevens Point, Wisconsin
(1)
|
314
|
|
146
|
|
460
|
|
|||
|
Gilroy, California
(2)
|
447
|
|
447
|
|
|||||
|
Sturtevant, Wisconsin
(2)
|
442
|
|
—
|
|
442
|
|
|||
|
Carlisle, Pennsylvania
(1)
|
—
|
|
423
|
|
423
|
|
|||
|
Howell Township, New Jersey
(2)
|
—
|
|
397
|
|
397
|
|
|||
|
Ridgefield, Washington
(2)
|
237
|
|
103
|
|
340
|
|
|||
|
Chesterfield, New Hampshire
(2)
|
300
|
|
300
|
|
|||||
|
Iowa City, Iowa
|
260
|
|
31
|
|
291
|
|
|||
|
Auburn, Washington
(1)
|
—
|
|
359
|
|
359
|
|
|||
|
Richburg, South Carolina
(2)
|
342
|
|
—
|
|
342
|
|
|||
|
Fargo, North Dakota
(1)
|
336
|
|
—
|
|
336
|
|
|||
|
Oglesby, Illinois
(1)
|
—
|
|
325
|
|
325
|
|
|||
|
Dayville, Connecticut
(2)
|
317
|
|
—
|
|
317
|
|
|||
|
Greenwood, Indiana
(2)
|
308
|
|
—
|
|
308
|
|
|||
|
Santa Fe Springs, California
(1)(2)
|
298
|
|
—
|
|
298
|
|
|||
|
Prescott, Wisconsin
(2)
|
307
|
|
—
|
|
307
|
|
|||
|
West Sacramento, California
(2)
|
251
|
|
—
|
|
251
|
|
|||
|
Bismarck, North Dakota
(1)
|
244
|
|
—
|
|
244
|
|
|||
|
Anniston, Alabama
(1)
|
—
|
|
231
|
|
231
|
|
|||
|
Yuba City, California
|
—
|
|
224
|
|
224
|
|
|||
|
Billings, Montana
(1)
|
220
|
|
—
|
|
220
|
|
|||
|
Vaughan, Ontario
|
—
|
|
180
|
|
180
|
|
|||
|
Edison, New Jersey
|
—
|
|
178
|
|
178
|
|
|||
|
West Newell, Illinois
(1)
|
155
|
|
—
|
|
155
|
|
|||
|
Auburn, California
|
126
|
|
—
|
|
126
|
|
|||
|
De Pere, Wisconsin
|
—
|
|
100
|
|
100
|
|
|||
|
Philadelphia, Pennsylvania
|
—
|
|
100
|
|
100
|
|
|||
23
|
Location
|
Owned Square Footage
|
Leased Square Footage
|
Total Square Footage
|
||||||
|
|
(in thousands)
|
||||||||
|
Richmond, British Columbia
|
—
|
|
96
|
|
96
|
|
|||
|
Roseville, California
|
—
|
|
86
|
|
86
|
|
|||
|
West Sacramento, California
(2)
|
85
|
|
—
|
|
85
|
|
|||
|
Logan Township, New Jersey
|
—
|
|
70
|
|
70
|
|
|||
|
Charlotte, North Carolina
|
—
|
|
43
|
|
43
|
|
|||
|
Burnaby, British Columbia
|
—
|
|
41
|
|
41
|
|
|||
|
Montreal, Quebec
|
—
|
|
31
|
|
31
|
|
|||
|
Vernon, California
|
30
|
|
—
|
|
30
|
|
|||
|
Truckee, California
|
—
|
|
6
|
|
6
|
|
|||
|
14,827
|
|
|
17,362
|
|
|
32,189
|
|
||
|
(1)
|
These distribution centers were acquired as part of the Supervalu acquisition on October 22, 2018.
|
|
(2)
|
These distribution centers were mortgaged under and encumbered by our Term Loan Facility entered into on October 22, 2018. We expect additional distribution centers will become mortgaged under and encumbered by our Term Loan Facility once our collateral under the facility is finalized.
|
Retail Stores
The following table summarizes retail stores classified within discontinued operations as of
August 3, 2019
:
|
Retail Banner
|
Number of Stores
|
Owned Square Footage
|
Leased Square Footage
|
Total Square Footage
|
||||||||
|
(in thousands)
|
||||||||||||
|
Cub Foods
(1)(2)
|
52
|
|
1,132
|
|
2,382
|
|
3,514
|
|
||||
|
Shoppers
(2)
|
44
|
|
—
|
|
2,427
|
|
2,427
|
|
||||
|
Total
|
96
|
|
1,132
|
|
4,809
|
|
5,941
|
|
||||
|
(1)
|
Cub Foods stores include stores in which we have a controlling ownership interest, and excludes 29 franchised Cub Foods stores in which we have a minority interest or no interest.
|
|
(2)
|
These retail banners have been classified as held for sale and are reported within discontinued operations in the Consolidated Financial Statements.
|
Corporate
We had approximately
5 million
square feet of surplus retail stores and warehouses, including assigned leases, 84 percent of which was leased, and approximately
6.9 million
square feet of owned vacant land as of
August 3, 2019
.
We lease our principal executive offices in Providence, Rhode Island. In addition, we lease other smaller administrative offices across the United States. We lease approximately
608 thousand
building square feet related to our administrative offices
We own approximately
240 thousand
square feet of building square feet primarily related to our executive office in Eden Prairie, Minnesota.
ITEM 3. LEGAL PROCEEDINGS
From time to time, we are involved in routine litigation or other legal proceedings that arise in the ordinary course of our business, including investigations and claims regarding employment law, pension plans, ULP, labor union disputes, supplier, customer and service provider contract terms, real estate, and antitrust. Other than as described in
Note 18—Commitments, Contingencies and Off-Balance Sheet Arrangements
in Part II, Item 8 of this Annual Report, and as set forth below, there are no pending material legal proceedings to which we are a party or to which our property is subject.
In August and November 2014, four class action complaints were filed against Supervalu relating to the criminal intrusion into Supervalu’s computer network that were previously announced by Supervalu in its fiscal 2015. The cases were centralized in the Federal District Court for the District of Minnesota under the caption In Re: SUPERVALU Inc. Customer Data Security Breach Litigation. On June 26, 2015, the plaintiffs filed a Consolidated Class Action Complaint. Supervalu filed a Motion to Dismiss the Consolidated Class Action Complaint and the hearing took place on November 3, 2015. On January 7, 2016, the District Court granted the Motion to Dismiss and dismissed the case without prejudice, holding that the plaintiffs did not have standing to sue as they had not met their burden of showing any compensable damages. On February 4, 2016, the plaintiffs
24
filed a motion to vacate the District Court’s dismissal of the complaint or in the alternative to conduct discovery and file an amended complaint, and Supervalu filed its response in opposition on March 4, 2016. On April 20, 2016, the District Court denied plaintiffs’ motion to vacate the District Court’s dismissal or in the alternative to amend the complaint. On May 18, 2016, plaintiffs appealed to the 8th Circuit and on May 31, 2016, Supervalu filed a cross-appeal to preserve its additional arguments for dismissal of the plaintiffs’ complaint. On August 30, 2017, the 8th Circuit affirmed the dismissal for 14 out of the 15 plaintiffs finding they had no standing. The 8th Circuit did not consider Supervalu’s cross-appeal and remanded the case back for consideration of Supervalu’s additional arguments for dismissal against the one remaining plaintiff. On October 30, 2017, Supervalu filed a motion to dismiss the remaining plaintiff and on November 7, 2017, the plaintiff filed a motion to amend its complaint. The court held a hearing on the motions on December 14, 2017, and on March 7, 2018, the District Court denied plaintiff’s motion to amend and granted Supervalu’s motion to dismiss. On March 14, 2018, plaintiff appealed to the 8th Circuit and on May 31, 2019, the 8th Circuit denied plaintiff’s appeal affirming the District Court’s dismissal of the case. We do not expect any further action on this case. Supervalu had $50 million of cyber threat insurance above a per incident deductible of $1 million at the time of the criminal intrusion, which the Company believes should cover any potential loss related to this litigation.
ITEM 4. MINE SAFETY DISCLOSURES
Not applicable.
PART II.
ITEM 5. MARKET FOR THE REGISTRANT’S COMMON EQUITY, RELATED STOCKHOLDER MATTERS AND ISSUER PURCHASES OF EQUITY SECURITIES
Our common stock is traded on the New York Stock Exchange (“NYSE”) under the symbol “UNFI.”
On
August 3, 2019
, we had
76
stockholders of record. The number of record holders is not representative of the number of beneficial holders of our common stock because depositories, brokers or other nominees hold many shares.
We have never declared or paid any cash dividends on our capital stock. We anticipate that all of our earnings in the foreseeable future will be retained to finance the continued growth and development of our business and repay our outstanding indebtedness, and we have no current intention to pay cash dividends. Our future dividend policy will depend on our earnings, capital requirements and financial condition, requirements of the financing agreements to which we are then a party and other factors considered relevant by our Board of Directors. Additionally, our ABL Credit Facility and Term Loan Facility contain terms that limit our ability to make any cash dividends unless certain conditions and financial tests are met.
Comparative Stock Performance
The following graph compares the yearly change in cumulative total stockholder returns on our common stock for the last five fiscal years with the cumulative return on the Standard & Poor’s (“S&P”)
S&P SmallCap 600 Index
, the
S&P SmallCap 600 Food Distributors Index
, the
Fiscal 2018 Industry Peer Group
, and the
Fiscal 2018 NASDAQ Composite Index
. The comparison assumes the investment of $100 on
August 2, 2014
in our common stock and in each of the indices and, in each case, assumes reinvestment of all dividends. The stock price performance shown below is not necessarily indicative of future performance.
25
This performance graph shall not be deemed “soliciting material” or be deemed to be “filed” for purposes of Section 18 of the Exchange Act or otherwise subject to the liabilities under that Section and shall not be deemed to be incorporated by reference into any of our filings under the Securities Act of 1933, as amended (the “Securities Act”), or the Exchange Act.
COMPARISON OF 5 YEAR CUMULATIVE TOTAL RETURN
Among United Natural Foods, Inc., the S&P SmallCap 600
(1)
, the S&P SmallCap 600 Food Distributors
(2)
, the Fiscal 2018 NASDAQ Composite Index
(1)
, and the Fiscal 2018 Industry Peer Group
(2)
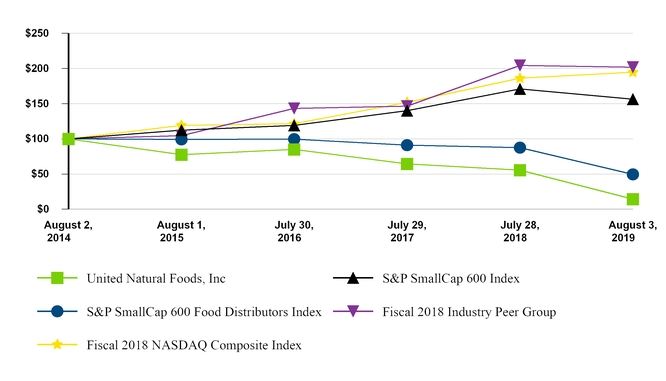
|
(1)
|
In fiscal 2019, we transferred the trading of our common stock to the NYSE from the NASDAQ, and determined that the performance of our common stock should be compared against a broad market index that includes our common stock and companies traded on the same stock exchange. Accordingly, we provide a comparison of our performance against the S&P SmallCap 600, in addition to the NASDAQ Composite, the broad equity market index against which our performance had been compared in prior years.
|
|
(2)
|
In fiscal 2019, we acquired Supervalu, one of two companies (Supervalu and SYSCO Corporation) within our selected fiscal 2018 Industry Peer Group. We determined it was more representative to compare our performance against the S&P SmallCap 600 Food Distributors Index, which includes SpartanNash Company, The Andersons, Inc., The Chef’s Warehouse, Inc. and UNFI.
|
|
August 2, 2014
|
August 1, 2015
|
July 30, 2016
|
July 29, 2017
|
July 28, 2018
|
August 3, 2019
|
||||||||||||||||||
|
United Natural Foods, Inc
|
$
|
100.00
|
|
$
|
77.55
|
|
$
|
85.13
|
|
$
|
64.52
|
|
$
|
55.37
|
|
$
|
14.34
|
|
|||||
|
S&P SmallCap 600 Index
|
$
|
100.00
|
|
$
|
112.26
|
|
$
|
118.94
|
|
$
|
140.17
|
|
$
|
171.04
|
|
$
|
156.47
|
|
|||||
|
S&P SmallCap 600 Food Distributors Index
|
$
|
100.00
|
|
$
|
99.16
|
|
$
|
99.69
|
|
$
|
91.09
|
|
$
|
87.30
|
|
$
|
49.59
|
|
|||||
|
Fiscal 2018 Industry Peer Group
|
$
|
100.00
|
|
$
|
104.38
|
|
$
|
143.20
|
|
$
|
146.31
|
|
$
|
204.35
|
|
$
|
201.66
|
|
|||||
|
Fiscal 2018 NASDAQ Composite Index
|
$
|
100.00
|
|
$
|
119.17
|
|
$
|
121.46
|
|
$
|
151.75
|
|
$
|
186.12
|
|
$
|
194.68
|
|
|||||
ITEM 6. SELECTED FINANCIAL DATA
The following table sets forth our selected historical financial data for the past five years derived from our Consolidated Financial Statements presented in this Annual Report and historical financial data derived from previously audited consolidated financial statements. The historical results are not necessarily indicative of results to be expected for any future period. The following selected consolidated financial data should be read in conjunction with and is qualified by reference to “Item 7. Management’s Discussion and Analysis of Financial Condition and Results of Operations”, “Item 1A. Risk Factors” and our Consolidated Financial Statements and Notes thereto included elsewhere in this Annual Report. We have not declared or paid cash dividends in any of the following fiscal periods.
26
Year-over-year comparisons are significantly affected by material acquisitions. Our acquisition of Supervalu, which closed on October 22, 2018, and the acquisitions discussed in Part I. Item 1. of this Annual Report, significantly impacts the comparability of reported results between periods.
|
Fiscal Year
|
||||||||||||||||||||
|
Consolidated Statements of Operations Data:
|
2019
(53 weeks)
|
2018
(52 weeks) |
2017
(52 weeks) |
2016
(52 weeks) |
2015
(52 weeks) |
|||||||||||||||
|
|
(In thousands, except per share data)
|
|||||||||||||||||||
|
Net sales
|
$
|
21,387,068
|
|
$
|
10,226,683
|
|
$
|
9,274,471
|
|
$
|
8,470,286
|
|
$
|
8,184,978
|
|
|||||
|
Cost of sales
|
18,602,058
|
|
8,703,916
|
|
7,845,550
|
|
7,190,935
|
|
6,924,463
|
|
||||||||||
|
Gross profit
|
2,785,010
|
|
1,522,767
|
|
1,428,921
|
|
1,279,351
|
|
1,260,515
|
|
||||||||||
|
Operating expenses
|
2,629,713
|
|
1,274,562
|
|
1,196,032
|
|
1,049,690
|
|
1,017,755
|
|
||||||||||
|
Goodwill and asset impairment charges
(1)
|
292,770
|
|
11,242
|
|
—
|
|
1,012
|
|
555
|
|
||||||||||
|
Restructuring, acquisition and integration related expenses
|
153,539
|
|
9,738
|
|
6,864
|
|
4,540
|
|
248
|
|
||||||||||
|
Operating (loss) income
|
(291,012
|
)
|
227,225
|
|
226,025
|
|
224,109
|
|
241,957
|
|
||||||||||
|
Other expense (income):
|
|
|
|
|
||||||||||||||||
|
Net periodic benefit income, excluding service cost
|
(34,726
|
)
|
—
|
|
—
|
|
—
|
|
—
|
|
||||||||||
|
Interest expense, net
|
179,963
|
|
16,025
|
|
16,754
|
|
15,144
|
|
14,142
|
|
||||||||||
|
Other, net
|
(957
|
)
|
(1,545
|
)
|
(5,152
|
)
|
743
|
|
(1,954
|
)
|
||||||||||
|
Total other expense, net
|
144,280
|
|
14,480
|
|
11,602
|
|
15,887
|
|
12,188
|
|
||||||||||
|
(Loss) income from continuing operations before income taxes
|
(435,292
|
)
|
212,745
|
|
214,423
|
|
208,222
|
|
229,769
|
|
||||||||||
|
(Benefit) provision for income taxes
|
(84,609
|
)
|
47,075
|
|
84,268
|
|
82,456
|
|
91,035
|
|
||||||||||
|
Net (loss) income from continuing operations
|
$
|
(350,683
|
)
|
$
|
165,670
|
|
$
|
130,155
|
|
$
|
125,766
|
|
$
|
138,734
|
|
|||||
|
Net (loss) income from continuing operations per common share—Basic
|
$
|
(6.84
|
)
|
$
|
3.28
|
|
$
|
2.57
|
|
$
|
2.50
|
|
$
|
2.77
|
|
|||||
|
Net (loss) income from continuing operations per common share—Diluted
|
$
|
(6.84
|
)
|
$
|
3.26
|
|
$
|
2.56
|
|
$
|
2.50
|
|
$
|
2.76
|
|
|||||
|
As of the Fiscal Year Ended
|
||||||||||||||||||||
|
Consolidated Balance Sheets Data:
|
August 3,
2019 |
July 28,
2018 |
July 29,
2017 |
July 30,
2016 |
August 1,
2015 |
|||||||||||||||
|
Working capital
|
$
|
1,458,974
|
|
$
|
1,089,690
|
|
$
|
958,683
|
|
$
|
991,468
|
|
$
|
1,018,437
|
|
|||||
|
Total assets
|
$
|
7,180,965
|
|
$
|
2,964,472
|
|
$
|
2,886,563
|
|
$
|
2,852,155
|
|
$
|
2,540,994
|
|
|||||
|
Total long-term debt and capital leases, excluding current portion
(2)
|
$
|
2,927,258
|
|
$
|
340,323
|
|
$
|
366,089
|
|
$
|
580,872
|
|
$
|
528,556
|
|
|||||
|
Total stockholders’ equity
|
$
|
1,510,934
|
|
$
|
1,845,955
|
|
$
|
1,681,292
|
|
$
|
1,519,507
|
|
$
|
1,381,088
|
|
|||||
|
(1)
|
The line item presentation of Goodwill and asset impairment charges and Restructuring, acquisition and integration related expenses incurred in fiscal years 2018 and prior have been recast to conform with the current period presentation.
|
|
(2)
|
The line item presentation of total long-term debt and capital leases, excluding current portion has been recast for fiscal years 2018 and prior to conform with the current period presentation and to include the long-term portion of our revolving credit facility.
|
ITEM 7. MANAGEMENT’S DISCUSSION AND ANALYSIS OF FINANCIAL CONDITION AND RESULTS OF OPERATIONS
27
The following discussion and analysis should be read in conjunction with our Consolidated Financial Statements and the notes thereto appearing elsewhere in this Annual Report.
FORWARD-LOOKING STATEMENTS
This Annual Report and the documents incorporated by reference in this Annual Report contain forward-looking statements within the meaning of Section 27A of the Securities Act, and Section 21E of the Exchange Act, that involve substantial risks and uncertainties. In some cases you can identify these statements by forward-looking words such as “anticipate,” “believe,” “could,” “estimate,” “expect,” “intend,” “may,” “plan,” “seek,” “should,” “will,” and “would,” or similar words. Statements that contain these words and other statements that are forward-looking in nature should be read carefully because they discuss future expectations, contain projections of future results of operations or of financial positions or state other “forward-looking” information.
Forward-looking statements involve inherent uncertainty and may ultimately prove to be incorrect or false. These statements are based on our management’s beliefs and assumptions, which are based on currently available information. These assumptions could prove inaccurate. You are cautioned not to place undue reliance on forward-looking statements. Except as otherwise may be required by law, we undertake no obligation to update or revise forward-looking statements to reflect changed assumptions, the occurrence of unanticipated events or actual operating results. Our actual results could differ materially from those anticipated in these forward-looking statements as a result of various factors, including, but not limited to:
|
•
|
our dependence on principal customers;
|
|
•
|
the potential for additional goodwill impairment charges as a result of purchase accounting adjustments or otherwise;
|
|
•
|
our sensitivity to general economic conditions including changes in disposable income levels and consumer spending trends;
|
|
•
|
our ability to realize anticipated benefits of our acquisitions and dispositions, in particular, our acquisition of Supervalu;
|
|
•
|
the possibility that restructuring, asset impairment, and other charges and costs we may incur in connection with the sale or closure of our retail operations exceed our current expectations;
|
|
•
|
our reliance on the continued growth in sales of our higher margin natural and organic foods and non-food products in comparison to lower margin conventional grocery products;
|
|
•
|
increased competition in our industry as a result of increased distribution of natural, organic and specialty products by conventional grocery distributors and direct distribution of those products by large retailers and online distributors;
|
|
•
|
increased competition as a result of continuing consolidation of retailers in the natural product industry and the growth of supernatural chains;
|
|
•
|
our ability to timely and successfully deploy our warehouse management system throughout our distribution centers and our transportation management system across the Company and to achieve efficiencies and cost savings from these efforts;
|
|
•
|
the addition or loss of significant customers or material changes to our relationships with these customers;
|
|
•
|
volatility in fuel costs;
|
|
•
|
volatility in foreign exchange rates;
|
|
•
|
our sensitivity to inflationary and deflationary pressures;
|
|
•
|
the relatively low margins and economic sensitivity of our business;
|
|
•
|
the potential for disruptions in our supply chain by circumstances beyond our control;
|
|
•
|
the risk of interruption of supplies due to lack of long-term contracts, severe weather, work stoppages or otherwise;
|
|
•
|
moderated supplier promotional activity, including decreased forward buying opportunities;
|
|
•
|
union-organizing activities that could cause labor relations difficulties and increased costs; and
|
|
•
|
our ability to identify and successfully complete asset or business acquisitions.
|
You should carefully review the risks described under “Part I. Item 1A. Risk Factors,” as well as any other cautionary language in this Annual Report, as the occurrence of any of these events could have an adverse effect, which may be material, on our business, results of operations, financial condition or cash flows.
28
EXECUTIVE OVERVIEW
Business Overview
As a leading distributor of
natural, organic, specialty, produce, and conventional grocery and non-food products, and provider of support services in the United States and Canada
, we believe we are uniquely positioned to provide the broadest array of products and services to customers throughout North America. We offer more than 250,000 products consisting of national, regional and private label brands grouped into six product categories: grocery and general merchandise; produce; perishables and frozen foods; nutritional supplements and sports nutrition; bulk and food service products; and personal care items. Through our October 2018 acquisition of Supervalu, we are transforming into North America’s premier wholesaler with
63
distribution centers and warehouses representing approximately
32
million square feet of warehouse space. We believe our total product assortment and service offerings are unmatched by our wholesale competitors. We plan to aggressively pursue new business opportunities to independent retailers who operate diverse formats, regional and national chains, military commissaries, as well as international customers with wide-ranging needs.
Fiscal 2019 and 2020
Fiscal 2019 was an historic year for UNFI as we completed the acquisition of Supervalu on October 22, 2018 and began to transform into North America’s leading wholesale distributor. By the end of fiscal 2019, we had combined our natural and conventional businesses, operating with a single executive leadership team. We neared completion of our Pacific Northwest distribution center consolidation whereby we will operate out of two distribution centers in the future compared to five previously, a move which will provide significant operating benefits. We realized significant cost synergies, which were partially reinvested into the business. In fiscal 2020, we successfully created a four-region operating structure with a sales organization aligned in a similar fashion. We believe these changes will advance the execution of our long-term strategic and growth objectives. We expect the competitive environment to remain challenging as other wholesalers look to capture new business, which is expected to lead to margin compression. We believe we have cost savings opportunities that will more than offset the impact to gross margin as well as cross-selling opportunities that will increase sales.
Our Strategy
A key component of our business and growth strategy has been to acquire wholesalers differentiated by product offerings, service offerings and market area.
On July 25, 2018, we entered into an Agreement and Plan of Merger pursuant to which we agreed to acquire Supervalu for an aggregate purchase price of approximately $2.3 billion, including the assumption of outstanding debt and liabilities. The transaction closed on October 22, 2018. Included in the liabilities assumed in the Supervalu acquisition were the Supervalu Senior Notes with a fair value of
$546.6 million
. These Senior Notes were redeemed in the second quarter of fiscal 2019 following the required 30-day notice period, resulting in their satisfaction and discharge. The redemption of the Senior Notes was financed by borrowings under our Term Loan Facility. The acquisition of Supervalu accelerates our build out the store strategy, diversifies our customer base, enables cross-selling opportunities, expands market reach and scale, enhances technology, capacity and systems, and is expected to deliver significant synergies and accelerate potential growth.
We believe our significant scale and footprint will generate long-term shareholder value by positioning us to continue to grow sales of natural, organic, specialty, produce, and conventional grocery and non-food products across our network. We believe we will realize significant cost and revenue synergies from the acquisition of Supervalu by leveraging the scale and resources of the combined company, cross-selling to our customers, integrating our merchandising offerings into existing warehouses, optimizing our network footprint to lower our cost structure, and eliminating redundant administrative costs.
We maintain long-standing customer relationships with customers in our supernatural, supermarket, independent and other channels. Some of these long-standing customer relationships are established through contracts with our customers in the form of distribution agreements.
We currently operate approximately
96
retail grocery stores acquired in the Supervalu acquisition. We intend to thoughtfully and economically divest these stores. These stores are reported within discontinued operations in our Consolidated Financial Statements included in this Annual Report.
We have been the primary distributor to Whole Foods Market for more than
20
years. We continue to serve as the primary distributor to Whole Foods Market in all of its regions in the United States pursuant to a distribution agreement that expires on September 28, 2025.
29
Distribution Center Network
Network Optimization and Construction
With the Supervalu acquisition, we acquired the Unified and AG Florida subsidiaries, which were previously acquired by Supervalu in June 2017 and December 2017, respectively, as well as the recently opened new distribution centers in Harrisburg, Pennsylvania and Joliet, Illinois. As we integrate the distribution networks of Supervalu, Unified and AG Florida with our distribution network, expand our capacity and take steps to improve the efficiency of our warehouse capabilities including with our Joliet distribution center, we expect to incur start-up and transition costs including higher employee, trucking and inventory shrink costs. During fiscal 2019, we incurred higher than expected distribution expenses from our distribution network realignment due to the following:
|
•
|
We incurred higher operating and shrink costs resulting from our transition from the Lancaster distribution center to our Harrisburg distribution center. These transition costs sequentially improved in the third and fourth quarters of fiscal 2019, but we will incur higher operating costs on an ongoing basis in the Harrisburg facility than were historically incurred at Lancaster, which incorporated warehouse automation.
|
|
•
|
Within the Pacific Northwest, we are transferring the volume of five distribution centers and the related supporting off-site storage facilities into two distribution centers. This transition and operational consolidation is expected to be completed during fiscal 2020, after which we expect to achieve synergies and cost savings by eliminating inefficiencies, including incurring lower operating, shrink and off-site storage expenses. This plan includes expanding the Ridgefield distribution center to enhance customer product offerings, create more efficient inventory management, streamline operations and incorporate greater technology to deliver a better customer experience. The optimization of the Pacific Northwest distribution network will also help deliver meaningful synergies contemplated in the acquisition of Supervalu in October 2018. We accelerated the Pacific Northwest consolidation timeline to accelerate the realization of synergies from the Pacific Northwest consolidation through the operational start-up of Centralia and have not yet completed the consolidation or closure of any distribution centers as of August 3, 2019, but had completed the closure of an off-site storage facility.
|
Certain of these costs are expected to subside as we complete this work to realign our network, and we are working to both minimize these costs and obtain new business to further improve the efficiency of our transforming distribution network.
The construction of the new Centralia distribution center has been completed, and we are working on completing the expansion of the Ridgefield distribution center. As a result, we plan to close and sell our Tacoma, Portland and Auburn warehouses, as well as reduce our dependency on outside storage and third-party logistics services.
Our Ridgefield, Washington facility expansion will add
541 thousand
square feet (to a total of nearly
800 thousand
square feet) to provide capacity for our growing customer base in the natural, organic and specialty channel. This facility will deploy a warehouse automation solution that supports our slow-moving SKU portfolio.
Distribution Center Sales
We received aggregate proceeds of
$172.5 million
in fiscal 2019 from the sale of operating and surplus distribution centers. We closed on the sale and leaseback of two acquired Supervalu distribution centers and received aggregate proceeds of approximately
$149.5 million
. One of these distribution centers was the last remaining distribution center Supervalu sold and leased back as part of a previous portfolio transaction, which contained a longer-term lease. The other distribution center was a Pacific Northwest distribution center related to our consolidation strategy, which was subject to a short-term lease. In addition, we sold two surplus facilities and received aggregate proceeds of approximately
$23.0 million
.
In the fourth quarter of fiscal 2019, we entered into an agreement to sell a distribution center for $43.2 million related to our Pacific Northwest consolidation strategy, which we expect to close in the first quarter of fiscal 2020. This facility is classified as held for sale within
Prepaid expenses and other current assets
of continuing operations on our Consolidated Balance Sheets. As we consolidate our distribution networks, we may sell additional owned facilities or exit leased facilities.
Operating Efficiency
As part of our “one company” approach, we are in the process of converting to a single national warehouse management and procurement system to integrate our existing facilities, including acquired Supervalu facilities, onto one nationalized platform across the organization. We continue to be focused on the automation of our new or expanded distribution centers that are at different stages of construction and implementation. These steps and others are intended to promote operational efficiencies and improve operating expenses as a percentage of net sales.
30
Goodwill Impairment Review
During the first quarter of fiscal 2019, the Company experienced a decline in its stock price and market capitalization. During the second quarter of fiscal 2019, the stock price continued to decline, and the decline in the stock price and market capitalization became significant and sustained. Due to this sustained decline in stock price, the Company determined that it was more likely than not that the carrying value of the Supervalu Wholesale reporting unit exceeded its fair value and performed an interim quantitative impairment test of goodwill.
The Company estimated the fair values of all reporting units using both the market approach, applying a multiple of earnings based on guidelines for publicly traded companies, and the income approach, discounting projected future cash flows based on management’s expectations of the current and future operating environment for each reporting unit. The calculation of the impairment charge includes substantial fact-based determinations and estimates including weighted average cost of capital, future revenue, profitability, cash flows and fair values of assets and liabilities. The rates used to discount projected future cash flows under the income approach reflect a weighted average cost of capital of
10%
, which considered guidelines for publicly traded companies, capital structure and risk premiums, including those reflected in the Company’s then-current market capitalization. The Company corroborated the reasonableness of the estimated reporting unit fair values by reconciling those fair values to its enterprise value and market capitalization. Based on this analysis, the Company determined that the carrying value of its Supervalu Wholesale reporting unit exceeded its fair value by an amount that exceeded the assigned goodwill as of the acquisition date. As a result, the Company recorded a goodwill impairment charge of
$292.8 million
in fiscal 2019, which reflects the preliminary goodwill impairment charge recorded in the second quarter of fiscal 2019
and adjustments to the charge
recorded in the third and fourth quarters of fiscal 2019.
The goodwill impairment charge adjustments recorded in the third and fourth quarters of fiscal 2019 were attributable to changes in the preliminary fair value of net assets, most notably changes in tax assets and liabilities, intangible assets and property and equipment, which affected the initial goodwill resulting from the Supervalu acquisition. The goodwill impairment charge is reflected in Goodwill and asset impairment charges in the Consolidated Statements of Operations. The goodwill impairment charge reflects all of Supervalu Wholesale’s reporting unit goodwill, based on preliminary acquisition date assigned fair values.
The goodwill impairment charge recorded in fiscal 2019 is subject to change based upon the final purchase price allocation during the measurement period for estimated fair values of assets acquired and liabilities assumed from the Supervalu acquisition. There can be no assurance that such final assessments will not result in material increases or decreases to the recorded goodwill impairment charge based upon the preliminary purchase price allocations, due to changes in the provisional opening balance sheet estimates of goodwill. The Company’s estimates and assumptions are subject to change during the measurement period (up to one year from the acquisition date).
Refer to
Note 4—Acquisitions
in Part II, Item 8 of this Annual Report on Form 10-K for further information about the preliminary purchase price allocation and provisional goodwill estimated as of the acquisition date.
The estimated fair value of the Supervalu Wholesale reporting unit was below its estimated carrying value by approximately
20%
. The goodwill impairment review indicated that the estimated fair value of the legacy Company Wholesale and Canada Wholesale reporting units were in excess of their carrying values by over
20%
. Other continuing operations reporting units were substantially in excess of their carrying value. If the estimated fair value of the Company were to decrease further, or other circumstances were to arise that indicate the value of one of these other reporting units have decreased, the Company may incur additional impairment charges for other reporting units based on additional impairment reviews. The Company’s goodwill impairment review included a reconciliation of all of the reporting units’ fair value of to the Company’s market capitalization and enterprise value.
If the Company were to determine that a change in the composition of its goodwill reporting units was necessary in fiscal 2020, or in the future as a result of the change in the structure of management and financial reporting, the Company would perform a reallocation of goodwill based on the relative fair values to its new reporting units. If this were to occur, the Company would consider whether an impairment exists based on the composition and measurement of the new reporting units’ fair values, which may result in additional goodwill impairment charges based on a number of factors, including the relative fair value allocation at the time that a change could occur, the fair value of the individual reporting units at that time, and the fair value of the Company at the time of the change in the composition of the goodwill reporting units.
31
Divestiture of Retail Operations
We have announced our intention to divest our retail businesses acquired as part of the Supervalu acquisition as soon as practical in an efficient and economic manner in order to focus on our core wholesale distribution business. We plan to minimize liabilities and stranded costs associated with these divestitures. We expect to obtain ongoing supply relationships with the purchasers of some of these retail operations, but we anticipate some reductions in supply volume will result from the divestiture of certain of these retail operations. Actions associated with retail divestitures and adjustments to our core cost structure for our wholesale food distribution business are expected to result in headcount reductions and other costs and charges. These costs and charges, which may be material, include multiemployer plan charges, severance costs, store closure charges, and related costs. A withdrawal from a multiemployer pension plan may result in a material obligation to make payments over an extended period of time. The extent of these costs and charges will be determined based on outcomes achieved under the divestiture process. At this time, however, we are unable to make an estimate with reasonable certainty of the amount or type of costs and charges expected to be incurred in connection with the foregoing actions.
Our discontinued operations as of the end of fourth quarter of fiscal 2019 include Cub Foods and Shopper’s and our historical results of discontinued operations include Hornbacher’s and Shop ‘n Save, which were divested in the second and third quarters of fiscal 2019, respectively. In addition, discontinued operations includes certain real estate related to historical retail operations. These retail assets have been classified as held for sale as of the Supervalu acquisition date, and the results of operations, financial position and cash flows directly attributable to these operations are reported within discontinued operations in our Consolidated Financial Statements for all periods presented. The assets of these retail operations were recorded at what we believe to be their estimated fair value less costs to sell.
Prior to the Supervalu acquisition date,
19
St. Louis-based Shop ‘n Save stores,
15
in-store pharmacies,
one
stand-alone pharmacy,
four
fuel centers and all remaining prescription files were sold to Schnuck Markets, Inc. (“Schnucks”). Schnucks agreed to assume the multi-employer pension obligations related to the Shop ‘n Save stores it acquired. The sale of the stores was completed in the first quarter of fiscal 2019, and we closed the remaining Shop ‘n Save St. Louis-based retail stores and the dedicated distribution center in the second quarter of fiscal 2019, and we continue to hold the owned real estate assets related to these locations for sale. In addition, we entered into a supply agreement to serve as the primary supplier to nine Schnucks stores across northern Illinois, Iowa and Wisconsin. In connection with the closure of the Shop ‘n Save locations and the acquisition of Supervalu, we assumed a
$35.7 million
multiemployer pension plan withdrawal liability, and recorded a closed stores’ reserve charge of approximately
$17.1 million
in the second quarter of fiscal 2019 based on the retail stores’ November cease-use date.
In fiscal 2019, the Company closed
three
of its
eight
Shop ‘n Save East stores and sold the remaining
five
Shop ‘n Save East stores to GIANT Food Store, LLC, and did not incur a gain or loss on the sale of this disposal group. The Company closed the remaining Shop ‘n Save St. Louis retail stores and the distribution center that were not sold prior to the Supervalu acquisition date.
In fiscal 2019, the Company completed the sale of
seven
of its
eight
Hornbacher's locations, as well as Hornbacher’s newest store currently under development in West Fargo, North Dakota, to Coborn's Inc. (“Coborn’s”). The Company did not incur a gain or loss on the sale of this disposal group. The Hornbacher’s store in Grand Forks, North Dakota was not included in the sale to Coborn’s and has closed pursuant to the terms of the definitive agreement. As part of the sale, Coborn's entered into a long-term agreement for the Company to serve as the primary supplier of the Hornbacher's locations and expand its existing supply arrangements for other Coborn’s locations.
In the fourth quarter of fiscal 2019, the Company completed the sale of the pharmacy prescription files and inventory of the Shoppers disposal group. As of August 3, 2019, only the Cub Foods and Shoppers disposal groups continue to be classified as operations held for sale as discontinued operations.
We disposed of our retail business, Earth Origins Market (“Earth Origins”), during fiscal 2018.
Supervalu Professional Services Agreements
In connection with the sale of Save-A-Lot on December 5, 2016, Supervalu entered into a services agreement (the “Services Agreement”) with Moran Foods, LLC (“Moran Foods”), the entity that operates the Save-A-Lot business. Pursuant to the Services Agreement, we provide certain technical, human resources, finance and other operational services to Save-A-Lot for a term of
five
years, on the terms and subject to the conditions set forth therein. The initial annual base charge under the Services Agreement is
$30 million
, subject to adjustments.
32
Impact of Inflation or Deflation
We monitor product cost inflation and deflation and evaluate whether to absorb cost increases or decreases or pass on pricing changes. We experienced a mix of inflation and deflation across product categories during fiscal 2019 and 2018. In aggregate across all of our legacy businesses, excluding Supervalu, and taking into account the mix of products, management estimates our businesses experienced cost inflation of approximately one percent in fiscal 2019. Cost inflation and deflation estimates are based on individual like items sold during the periods being compared. Changes in merchandising, customer buying habits and competitive pressures create inherent difficulties in measuring the impact of inflation and deflation on Net sales and Gross profit. Absent any changes in units sold or the mix of units sold, deflation has the effect of decreasing sales. Inflation also impacts our measurement of the last-in, first-out (“LIFO”) inventory charge.
Other Factors Affecting our Business
We are also impacted by macroeconomic and demographic trends, and changes in the food distribution market structure. Over the past several decades, total food expenditures on a constant dollar basis within the United States has continued to increase in total, and the focus in recent decades on natural, organic and specialty foods have benefited the Company; however, consumer spending in the food-away-from-home industry has increased steadily as a percentage of total food expenditures. This trend paused during the 2008 recession, and then continued to increase. We are also impacted by changes in food distribution trends to our wholesale customers, such as direct store deliveries and other methods of distribution.
Business Performance Assessment and Composition of Consolidated Statements of Operations
Net sales
Our net sales consist primarily of sales of conventional, natural, organic, specialty, and produce grocery and non-food products, and support services to retailers,
adjusted for customer volume discounts, vendor incentives when applicable, returns and allowances, and professional services revenue
. Net sales also include amounts charged by us to customers for shipping and handling and fuel surcharges.
Cost of sales and Gross profit
The principal components of our cost of sales include the amounts paid to suppliers for product sold, plus the cost of transportation necessary to bring the product to, or move product between, our various distribution centers, offset by consideration received from suppliers in connection with the purchase or promotion of the suppliers’ products. Cost of sales also includes amounts incurred by us at our manufacturing subsidiary, Woodstock Farms Manufacturing, for inbound transportation costs offset by consideration received from suppliers in connection with the purchase or promotion of the suppliers’ products. Our gross margin may not be comparable to other similar companies within our industry that may include all costs related to their distribution network in their costs of sales rather than as operating expenses.
Operating expenses
Operating expenses include salaries and wages, employee benefits, warehousing and delivery, selling, occupancy, insurance, administrative, share-based compensation, depreciation, and amortization expense.
These expenses relate to warehousing and delivery expenses including purchasing, receiving, selecting and outbound transportation expenses.
Restructuring, acquisition and integration expenses
Restructuring, acquisition and integration expenses reflect expenses resulting from restructuring activities, including severance costs, change-in-control related charges, stock-based compensation acceleration charges, store closure charges, and acquisition and integration expenses. For fiscal 2019, these expenses are primarily a result of the Supervalu acquisition. Fiscal 2018 primarily reflects Supervalu acquisition costs and Earth Origins exit and disposal costs.
Other expenses
Other expense (income), net includes interest on outstanding indebtedness, including direct financing and capital lease obligations, net periodic benefit plan income, excluding service costs, interest income and miscellaneous income and expenses.
33
Adjusted EBITDA
Our Consolidated Financial Statements are prepared and presented in accordance with generally accepted accounting principles in the United States (“GAAP”). In addition to the GAAP results, we consider certain non-GAAP financial measures to assess the performance of our business and understand underlying operating performance and core business trends, which we use to facilitate operating performance comparisons of our business on a consistent basis over time. Adjusted EBITDA is provided as a supplement to our results of operations and related analysis, and should not be considered superior to, a substitute for or an alternative to any financial measure of performance prepared and presented in accordance with GAAP. Adjusted EBITDA excludes certain items because they are non-cash items or are items that are not considered in our supplemental assessment of on-going business performance.
We believe Adjusted EBITDA is useful to investors and financial institutions because it provides additional understanding of other factors and trends affecting our business, which are used in the business planning process to understand expected performance, to evaluate results against those expectations, and as one of the compensation performance measures under certain compensation programs and plans. We believe Adjusted EBITDA is more reflective of factors that affect our underlying operating performance and facilitate operating performance comparisons of our business on a consistent basis over time. Investors are cautioned that there are material limitations associated with the use of non-GAAP financial measures as an analytical tool. Certain adjustments to our GAAP financial measures reflected below exclude items that may be considered recurring in nature and may be reflected in our financial results for the foreseeable future. These measurements and items may be different from non-GAAP financial measures used by other companies. Adjusted EBITDA should be reviewed in conjunction with our results reported in accordance with GAAP in this Annual Report.
There are significant limitations to using Adjusted EBITDA as a financial measure including, but not limited to, it not reflecting the cost of cash expenditures for capital assets or certain other contractual commitments, capital lease obligation and debt service expenses, income taxes, and any impacts from changes in working capital.
We define Adjusted EBITDA as a consolidated measure inclusive of continuing and discontinued operations results, which we reconcile by adding Net (loss) income from continuing operations, plus
Total other expense, net
and
(Benefit) provision for income taxes
, plus
Depreciation and amortization
calculated in accordance with GAAP, plus non-GAAP adjustments for
Share-based compensation
, Restructuring, acquisition and integration related expenses, goodwill and asset impairment charges, certain legal charges and gains, certain other non-cash charges or items, as determined by management, plus Adjusted EBITDA of discontinued calculated in manner consistent with the results of continuing operations outlined above.
34
Assessment of Our Business Results
The following table sets forth a summary of our results of operations and Adjusted EBITDA for the periods indicated:
|
(in thousands)
|
2019
(53 weeks)
|
2018
(52 weeks)
|
2017
(52 weeks)
|
2019
Change
|
2018
Change
|
||||||||||||||
|
Net sales
|
$
|
21,387,068
|
|
$
|
10,226,683
|
|
$
|
9,274,471
|
|
$
|
11,160,385
|
|
$
|
952,212
|
|
||||
|
Cost of sales
|
18,602,058
|
|
8,703,916
|
|
7,845,550
|
|
9,898,142
|
|
858,366
|
|
|||||||||
|
Gross profit
|
2,785,010
|
|
1,522,767
|
|
1,428,921
|
|
1,262,243
|
|
93,846
|
|
|||||||||
|
Operating expenses
|
2,629,713
|
|
1,274,562
|
|
1,196,032
|
|
1,355,151
|
|
78,530
|
|
|||||||||
|
Goodwill and asset impairment charges
|
292,770
|
|
11,242
|
|
—
|
|
281,528
|
|
11,242
|
|
|||||||||
|
Restructuring, acquisition and integration related expenses
|
153,539
|
|
9,738
|
|
6,864
|
|
143,801
|
|
2,874
|
|
|||||||||
|
Operating (loss) income
|
(291,012
|
)
|
227,225
|
|
226,025
|
|
(518,237
|
)
|
1,200
|
|
|||||||||
|
Other expense (income):
|
|
|
|
||||||||||||||||
|
Net periodic benefit income, excluding service cost
|
(34,726
|
)
|
—
|
|
—
|
|
(34,726
|
)
|
—
|
|
|||||||||
|
Interest expense, net
|
179,963
|
|
16,025
|
|
16,754
|
|
163,938
|
|
(729
|
)
|
|||||||||
|
Other, net
|
(957
|
)
|
(1,545
|
)
|
(5,152
|
)
|
588
|
|
3,607
|
|
|||||||||
|
Total other expense, net
|
144,280
|
|
14,480
|
|
11,602
|
|
129,800
|
|
2,878
|
|
|||||||||
|
(Loss) income from continuing operations before income taxes
|
(435,292
|
)
|
212,745
|
|
214,423
|
|
(648,037
|
)
|
(1,678
|
)
|
|||||||||
|
(Benefit) provision for income taxes
|
(84,609
|
)
|
47,075
|
|
84,268
|
|
(131,684
|
)
|
(37,193
|
)
|
|||||||||
|
Net (loss) income from continuing operations
|
(350,683
|
)
|
165,670
|
|
130,155
|
|
(516,353
|
)
|
35,515
|
|
|||||||||
|
Income from discontinued operations, net of tax
|
65,800
|
|
—
|
|
—
|
|
65,800
|
|
—
|
|
|||||||||
|
Net (loss) income including noncontrolling interests
|
(284,883
|
)
|
165,670
|
|
130,155
|
|
(450,553
|
)
|
35,515
|
|
|||||||||
|
Less net (income) loss attributable to noncontrolling interests
|
(107
|
)
|
—
|
|
—
|
|
(107
|
)
|
—
|
|
|||||||||
|
Net (loss) income attributable to United Natural Foods, Inc.
|
$
|
(284,990
|
)
|
$
|
165,670
|
|
$
|
130,155
|
|
$
|
(450,660
|
)
|
$
|
35,515
|
|
||||
|
Adjusted EBITDA
|
$
|
562,484
|
|
$
|
361,619
|
|
$
|
344,615
|
|
$
|
200,865
|
|
$
|
17,004
|
|
||||
The following table reconciles Adjusted EBITDA to Net (loss) income from continuing operations and to Income from discontinued operations, net of tax.
35
|
(in thousands)
|
2019
(53 weeks) |
2018
(52 weeks) |
2017
(52 weeks) |
||||||||
|
Net (loss) income from continuing operations
|
$
|
(350,683
|
)
|
$
|
165,670
|
|
$
|
130,155
|
|
||
|
Adjustments to continuing operations net (loss) income:
|
|||||||||||
|
Total other expense, net
|
144,280
|
|
14,480
|
|
11,602
|
|
|||||
|
(Benefit) provision for income taxes
|
(84,609
|
)
|
47,075
|
|
84,268
|
|
|||||
|
Depreciation and amortization
|
246,825
|
|
87,631
|
|
86,051
|
|
|||||
|
Share-based compensation
|
38,879
|
|
25,783
|
|
25,675
|
|
|||||
|
Restructuring, acquisition and integration related expenses
(1)
|
153,539
|
|
9,738
|
|
6,864
|
|
|||||
|
Goodwill and asset impairment charges
(2)
|
292,770
|
|
11,242
|
|
—
|
|
|||||
|
Inventory fair value adjustment
(3)
|
10,463
|
|
—
|
|
—
|
|
|||||
|
Legal settlement income, net of reserve adjustment
(4)
|
(1,390
|
)
|
—
|
|
—
|
|
|||||
|
Adjusted EBITDA of discontinued operations
(5)
|
112,410
|
|
—
|
|
—
|
|
|||||
|
Adjusted EBITDA
|
$
|
562,484
|
|
$
|
361,619
|
|
$
|
344,615
|
|
||
|
Income from discontinued operations, net of tax
|
$
|
65,800
|
|
$
|
—
|
|
$
|
—
|
|
||
|
Adjustments to discontinued operations net income:
|
|||||||||||
|
Less net (income) loss attributable to noncontrolling interests
|
(107
|
)
|
—
|
|
—
|
|
|||||
|
Total other expense, net
|
2,378
|
|
—
|
|
—
|
|
|||||
|
Provision for income taxes
|
21,840
|
|
—
|
|
—
|
|
|||||
|
Other expense
|
860
|
|
—
|
|
—
|
|
|||||
|
Share-based compensation
|
1,616
|
|
—
|
|
—
|
|
|||||
|
Restructuring, store closure and other charges, net
(6)
|
20,023
|
|
—
|
|
—
|
|
|||||
|
Adjusted EBITDA of discontinued operations
(5)
|
$
|
112,410
|
|
$
|
—
|
|
$
|
—
|
|
||
|
(1)
|
Primarily reflects expenses resulting from the acquisition of Supervalu, including severance costs, store closure charges, and acquisition and integration expenses. Refer to
Note 5—Restructuring, Acquisition and Integration Related Expenses
in Part II, Item 8 of this Annual Report on Form 10-K for additional information.
|
|
(2)
|
Fiscal 2019 reflects a goodwill impairment charge attributable to the Supervalu acquisition. Fiscal 2018 reflects goodwill and asset impairment charges recorded related to the previously disposed Earth Origin’s Market retail business. Refer to
Note 7—Goodwill and Intangible Assets
in Part II, Item 8 of this Annual Report on Form 10-K for additional information.
|
|
(3)
|
Reflects a non-cash charge related to the step-up of acquired Supervalu inventory from purchase accounting.
|
|
(4)
|
Reflects income received to settle a legal proceeding and a charge related to our assessment of legal proceedings, which are more fully described in
Note 18—Commitments, Contingencies and Off-Balance Sheet Arrangements
in Part II, Item 8 of this Annual Report on Form 10-K.
|
|
(5)
|
Fiscal 2019 Adjusted EBITDA of discontinued operations excludes rent expense of
$32.2 million
of operating lease rent expense related to stores within discontinued operations, but for which GAAP requires the expense to be included within continuing operations, as we expect to remain primarily obligated under these leases. Due to these GAAP requirements to show rent expense, along with other administrative expenses of discontinued operations within continuing operations, we believe the inclusion of discontinued operations results within Adjusted EBITDA provides investors a meaningful measure of total performance.
|
|
(6)
|
Amounts represent store closure charges and costs, and an inventory charges related to discontinued operations, net of the effect of fees received from credit card companies related to a settlement.
|
RESULTS OF OPERATIONS
Fiscal year ended
August 3, 2019
(fiscal 2019) compared to fiscal year ended
July 28, 2018
(fiscal 2018)
Within our results of operations we have estimated the impact of the additional week and the acquisition of Supervalu, where applicable and estimable, to provide more comparable financial results on a year-over-year basis. The impact of the 53rd week discussed below represents an estimate of the contribution from the additional week in fiscal 2019 and is calculated by taking one-fifth of the respective metrics for the last five-week period, within the 14-week fourth quarter of fiscal 2019. Our analysis within the Results of Operations section below of Net sales, Gross profit, Operating expenses and Operating (loss) income is presented on a consolidated basis, as our single reportable segment principally comprises the entire operations of our business. The quantification of Supervalu’s impact on our results of operations presented below is to discuss the incremental impact of Supervalu, and provide analysis of our underlying business for year-over-year comparability purposes. Our analysis of Net sales is presented on a customer channel basis inclusive of all segments. References to legacy company results are presented to provide a comparative results analysis excluding the Supervalu acquired business impacts.
36
Net Sales
Our net sales by customer channel was as follows (in millions):
|
Increase (Decrease)
|
|||||||||||||||||||||
|
Customer Type
|
2019
(53 weeks) |
% of Total
Net Sales |
2018
(1)
(52 weeks)
|
% of Total
Net Sales |
$
|
% Total Net Sales
|
|||||||||||||||
|
Supermarkets
|
$
|
12,505
|
|
58
|
%
|
$
|
2,820
|
|
28
|
%
|
$
|
9,685
|
|
30
|
%
|
||||||
|
Supernatural
|
4,393
|
|
21
|
%
|
3,758
|
|
37
|
%
|
635
|
|
(16
|
)%
|
|||||||||
|
Independents
|
3,179
|
|
15
|
%
|
2,668
|
|
26
|
%
|
511
|
|
(11
|
)%
|
|||||||||
|
Other
|
1,310
|
|
6
|
%
|
981
|
|
9
|
%
|
329
|
|
(3
|
)%
|
|||||||||
|
Total net sales
|
$
|
21,387
|
|
100
|
%
|
$
|
10,227
|
|
100
|
%
|
$
|
11,160
|
|
—
|
%
|
||||||
|
(1)
|
During fiscal 2019, the presentation of net sales by customer channel was adjusted to reflect changes in the classification of customer types as a result of a detailed review of customer channel definitions. There was no impact to the Consolidated Statements of Operations as a result of revising the classification of customer types. As a result of this adjustment, net sales to our supermarkets channel and to our other channel for
fiscal 2018
decreased approximately
$36 million
and
$58 million
, respectively, compared to the previously reported amounts, while net sales to the independents channel for
fiscal 2018
increased approximately
$95 million
compared to the previously reported amounts.
|
Our net sales for fiscal 2019
increased
approximately
$11.16 billion
, or
109%
, to
$21.39 billion
, from
$10.23 billion
for fiscal 2018. The increase in fiscal 2019 net sales was driven by Supervalu net sales of approximately
$10.47 billion
, which included $247.9 million from the 53rd week in fiscal 2019, the increase in net sales of our supernatural channel, the remaining company estimated impact from the 53rd week of approximately
$203.4 million
and an increase in independents channel net sales, which were partially offset by decreases in other and supermarket sales.
Net sales to our supermarkets channel
increased
by approximately
$9,685 million
, or
343%
, in fiscal 2019 compared to fiscal 2018, and represented approximately
58%
and
28%
of total net sales for fiscal 2019 and 2018, respectively. The increase in supermarkets net sales is primarily due to
$9,655 million
of net sales from the acquired Supervalu business and the estimated impact from the 53rd week in fiscal 2019 of
$53 million
, with the remaining decrease of
$23 million
primarily due to net sales decreases to existing customers and lost customers.
Whole Foods Market is our only supernatural customer, and net sales to Whole Foods Market for fiscal 2019
increased
by approximately
$635 million
, or
17%
, in fiscal 2019 as compared to fiscal 2018, and accounted for approximately
21%
and
37%
of our total net sales for fiscal 2019 and 2018, respectively. The increase in net sales to Whole Foods Market is primarily due to an increase in same store sales, which have continued following its acquisition by Amazon.com, Inc. in August 2017, coupled with growth in new product categories, most notably the health, beauty and supplement categories, the estimated impact from the 53rd week in fiscal 2019 of
$84 million
, and increased sales from new stores.
Net sales to our independents channel
increased
by approximately
$511 million
, or
19%
, in fiscal 2019 compared to fiscal 2018, and accounted for
15%
and
26%
of our total net sales for fiscal 2019 and 2018, respectively. The increase in independents net sales is primarily due to
$391 million
of net sales from the acquired Supervalu business and the estimated impact from the 53rd week in fiscal 2019 of
$50 million
, with the remaining increase of
$70 million
primarily due to sales growth to existing customers.
Net sales to our other channel
increased
by approximately
$329 million
, or
34%
, in fiscal 2019 compared to fiscal 2018, and accounted for approximately
6%
and
9%
of total net sales for fiscal 2019 and 2018, respectively. The increase in other net sales is primarily due to
$429 million
of net sales from the acquired Supervalu business and the estimated impact from the 53rd week in fiscal 2019 of
$16 million
, partially offset by
$116 million
due to sales declines driven by our e-commerce business and lack of sales from our retail business, Earth Origins, which was disposed in the fourth quarter of fiscal 2018.
Cost of Sales and Gross Profit
Our gross profit
increased
$1,262.2 million
, or
82.9%
, to
$2,785.0 million
in fiscal 2019, from
$1,522.8 million
in fiscal 2018. Our gross profit as a percentage of net sales decreased to
13.02%
in fiscal 2019 compared to
14.89%
in fiscal 2018. Our gross profit for fiscal 2019 included 41 weeks of gross profit from the acquired Supervalu business of approximately
$1,206.2 million
, net of its related LIFO inventory charge, and an estimated increase in gross profit from the 53rd week of $28.0 million on the legacy company results. In addition, our legacy company Wholesale business gross profit decreased from a LIFO charge of
$15.0 million
in fiscal 2019, and from cycling the fiscal 2018 gross profit from a change in accounting estimate benefit of
$20.9 million
. The remaining increase in gross profit of
$63.9 million
, which reflects a gross profit decrease of approximately 10 basis points,
37
was driven by the faster growth of the supernatural channel relative to the other customer channels, offset in part by lower inbound freight expense.
Total Gross profit increased by $58.4 million from the impact of the additional 53rd week. The adoption of the LIFO inventory costing method decreased our fiscal 2019 Gross profit by
$24.1 million
or
11 basis points
.
Refer to
Note 1—Significant Accounting Policies
in Part II, Item 8 of this Annual Report on Form 10-K and below under the heading Net (Loss) Income Attributable to United Natural Foods, Inc. for additional information regarding the impact of a change in estimate for the gross profit impact of
$20.9 million
recorded during fiscal 2018.
Operating Expenses
Operating expenses
increased
$1,355.2 million
, or
106.3%
, to
$2,629.7 million
, or
12.30%
of net sales, in fiscal 2019 compared to
$1,274.6 million
, or
12.46%
of net sales, in fiscal 2018. The decrease in operating expenses as a percent of net sales was driven by the mix impact from the acquired Supervalu business, lower employee costs, including the impact of cost synergies and lower incentive compensation costs, partially offset by higher depreciation and amortization expense of approximately 30 basis points. Operating expenses increased by $55.6 million from the impact of the additional 53rd week in fiscal 2019.
Goodwill and Asset Impairment Charges
During fiscal 2019 we recorded a
$292.8 million
goodwill impairment charge, which reflects the preliminary goodwill impairment charge of
$292.8 million
based on the preliminary fair value of net assets assigned. The goodwill impairment charge recorded in fiscal 2019 is subject to further change based upon the final purchase price allocation during the measurement period for estimated fair values of assets acquired and liabilities assumed from the Supervalu acquisition. The estimates and assumptions are subject to change during the measurement period (up to one year from the acquisition date). Refer to the section above Executive Overview—
Goodwill Impairment Review
and
Note 7—Goodwill and Intangible Assets
in Part II, Item 8 of this Annual Report on Form 10-K for additional information.
During fiscal 2018, the Company made the decision to close
three
non-core, under-performing stores of its total of twelve Earth Origins stores. Based on this decision, coupled with the decline in results in the first half of fiscal 2018 and the future outlook as a result of competitive pressure, the Company determined that both a test for recoverability of long-lived assets and a goodwill impairment analysis should be performed. The determination of the need for a goodwill analysis was based on the assertion that it was more likely than not that the fair value of the reporting unit was below its carrying amount. As a result of both these analyses, the Company recorded a total impairment charge of
$3.4 million
on long-lived assets and
$7.9 million
to goodwill, respectively, during the second quarter of fiscal 2018. During the fourth quarter of fiscal 2018 the Company disposed of its Earth Origins retail business.
Restructuring, Acquisition and Integration Related Expenses
Restructuring, acquisition and integration related expenses were
$153.5 million
for fiscal 2019 and primarily included
$74.4 million
of employee related costs and charges due to severance, settlement of outstanding equity awards and benefits costs,
$56.6 million
of other acquisition and integration related costs and
$22.5 million
of closed property reserve charges related to the divestiture of retail banners. Expenses incurred in fiscal 2018 primarily related to
$5.0 million
of acquisition related costs associated with the Supervalu acquisition and
$4.8 million
charges related to the exit of our Earth Origins Market business.
We expect to incur additional integration and restructuring costs throughout fiscal 2020 related to our operational and administrative restructuring to achieve cost synergies and supply chain efficiencies of continuing operations. In addition, further restructuring costs may be incurred related to the divestiture of retail operations.
Operating (Loss) Income
Reflecting the factors described above, operating income
decreased
$518.2 million
to an operating loss of
$291.0 million
for fiscal 2019, from operating income of
$227.2 million
for fiscal 2018. As a percentage of net sales, operating loss was
1.36%
for fiscal 2019, compared to operating income of
2.22%
for fiscal 2018. The decrease in operating income was driven by higher goodwill and asset impairment charges, higher restructuring, acquisition and integration related expenses, higher Operating expenses, including higher depreciation and amortization expense, and the change in accounting estimate benefit from last year, which were offset in part by higher Gross profit, excluding the change in accounting estimate discussed above.
38
The fiscal 2019 operating loss includes
$32.2 million
of operating lease rent expense and $10.2 million of depreciation and amortization expenses related to stores within discontinued operations, but for which GAAP requires the expense to be included within continuing operations, as we expect to remain primarily obligated under these leases. In addition, continuing operations operating loss includes certain retail related overhead costs that are related to retail but are required to be presented within continuing operations.
Total Other Expense, Net
|
(in thousands)
|
2019
(53 weeks) |
2018
(52 weeks)
|
Increase (Decrease)
|
|||||||||
|
Net periodic benefit income, excluding service cost
|
$
|
(34,726
|
)
|
$
|
—
|
|
$
|
(34,726
|
)
|
|||
|
Interest expense on long-term debt, net of capitalized interest
|
136,284
|
|
14,016
|
|
122,268
|
|
||||||
|
Interest expense on capital and direct financing lease obligations
|
26,910
|
|
2,455
|
|
24,455
|
|
||||||
|
Amortization of financing costs and discounts
|
12,640
|
|
—
|
|
12,640
|
|
||||||
|
Debt refinancing costs and unamortized financing charges
|
4,903
|
|
—
|
|
4,903
|
|
||||||
|
Interest income
|
(774
|
)
|
(446
|
)
|
(328
|
)
|
||||||
|
Interest expense, net
|
179,963
|
|
16,025
|
|
163,938
|
|
||||||
|
Other, net
|
(957
|
)
|
(1,545
|
)
|
588
|
|
||||||
|
Total other expense, net
|
$
|
144,280
|
|
$
|
14,480
|
|
$
|
129,800
|
|
|||
Net periodic benefit income, excluding service cost reflects the recognition of expected returns on benefit plan assets in excess of interest costs. The
increase
in interest expense on long-term debt was primarily due to an increase in outstanding debt year-over-year driven by Supervalu acquisition financing. The increase in interest on capital and direct financing leases primarily reflects lease obligations related to retail stores of discontinued operations acquired in the Supervalu acquisition, but for which GAAP requires the expense to be included within continuing operations, as we expect to remain primarily obligated under these leases.
We expect interest expense to increase in future periods as compared to periods prior to the Supervalu acquisition due to the increased indebtedness incurred to finance the acquisition of Supervalu. As a result of the Supervalu acquisition, we assumed defined benefit pension and other postretirement benefit obligations.
(Benefit) Provision for Income Taxes
Our effective income tax rate for continuing operations was
19.4%
and
22.1%
for fiscal 2019 and 2018, respectively. The fiscal 2019 effective tax rate reflects a tax benefit based on a consolidated pre-tax loss from continuing operations while fiscal 2018 reflected a tax expense on pre-tax income. The fiscal 2018 effective income tax rate was primarily driven by a non-cash net tax benefit of $21.7 million related to the impact of the re-measurement of the U.S. net deferred tax liabilities due to tax reform. For fiscal 2019, the effective income tax rate captures the full impact of the reduced federal tax rate, as well as tax cost associated with stock compensation payments not expected to be deductible in under the Section 162(m) tax reform rules and the impact of non-deductible goodwill impairment charges recorded in fiscal 2019.
Income from Discontinued Operations, Net of Tax
The results of operations for fiscal 2019 reflect net sales of
$2,094.0 million
for which we recognized
$570.3 million
of gross profit and Income from discontinued operations, net of tax of
$65.8 million
. As noted above, pre-tax income from discontinued operations excludes
$32.2 million
of operating lease rent expense related to stores within discontinued operations, but for which GAAP requires the expense to be included within continuing operations. In addition, store closure charges related to leases are recorded within continuing operations. Discontinued operations included
$16.9 million
of restructuring expenses primarily related to employee severance and store closure charges. In addition, gross profit of discontinued operations included inventory charges from store closures.
Refer to the section above Executive Overview—
Divestiture of Retail Operations
and to
Note 19—Discontinued Operations
in Part II, Item 8 of this Annual Report on Form 10-K for additional financial information regarding these discontinued operations.
Net (Loss) Income Attributable to United Natural Foods, Inc.
Reflecting the factors described in more detail above, we incurred a net loss attributable to United Natural Foods, Inc. of
$285.0 million
(
$5.56
per diluted common share) for fiscal 2019, compared to net income of
$165.7 million
, or
$3.26
per diluted common share, for fiscal 2018.
39
As described in more detail in
Note 1—Significant Accounting Policies
in Part II, Item 8 of this Annual Report on Form 10-K, during fiscal 2018 we experienced an increased volume in our accrual for inventory purchases as a result of increasing volumes of inventory purchases and work flow changes to our practices resulting from the establishment of a centralized processing function for supplier payables. In the third quarter of fiscal 2018, we changed our estimate for the accrual for inventory purchases as a result of our review of the criteria for determining amounts where a liability is no longer considered probable as well as a review of historical data and data relating to fiscal 2018 purchases of inventory. As a result of this change in estimate, accounts payable was reduced by
$20.9 million
, resulting in an increase to net income of
$13.9 million
, or
$0.27
per diluted share, for fiscal 2018. Absent the change in accounting estimate, we would have expected to recognize the benefit to operating income of the change in estimate within the following four quarters, as the accrual would be expected to be reduced in accordance with our prior estimate methodology.
As described in more detail within
Note 13—Share-Based Awards
, in fiscal 2019 we issued approximately
2.0 million
shares of common stock to fund the settlement of time-vesting replacement award obligations from the Supervalu acquisition. We have approximately 3.0 million additional shares authorized for issuance and registered on a Registration Statement on Form S-8 filed with the SEC for the issuance in order to satisfy replacement award and option issuance obligations. In fiscal 2020, we may issue additional shares to fund replacement award obligations in full, issue shares to partially fund the obligations, or utilize cash on hand to fund the obligations.
Fiscal year ended
July 28, 2018
(fiscal 2018) compared to fiscal year ended
July 29, 2017
(fiscal 2017)
Net Sales
Our net sales for the fiscal year ended
July 28, 2018
increased approximately
10.3%
, or
$952.2 million
, to
$10.23 billion
from
$9.27 billion
for the fiscal year ended
July 29, 2017
. Our net sales by customer type for the fiscal years ended
July 28, 2018
and
July 29, 2017
were as follows (in millions):
|
Increase (Decrease)
|
|||||||||||||||||||||
|
Customer Type
|
2018
(52 weeks) (1) |
% of Total
Net Sales |
2017
(52 weeks) (1) |
% of Total
Net Sales |
$
|
% Total Net Sales
|
|||||||||||||||
|
Supernatural
|
$
|
3,758
|
|
37
|
%
|
$
|
3,096
|
|
33
|
%
|
$
|
662
|
|
4
|
%
|
||||||
|
Supermarkets
|
2,820
|
|
28
|
%
|
2,731
|
|
30
|
%
|
89
|
|
(2
|
)%
|
|||||||||
|
Independents
|
2,668
|
|
26
|
%
|
2,490
|
|
27
|
%
|
178
|
|
(1
|
)%
|
|||||||||
|
Other
|
981
|
|
9
|
%
|
957
|
|
10
|
%
|
24
|
|
(1
|
)%
|
|||||||||
|
Total net sales
|
$
|
10,227
|
|
100
|
%
|
$
|
9,274
|
|
100
|
%
|
$
|
953
|
|
—
|
%
|
||||||
|
(1)
|
During the second quarter of fiscal 2019, the presentation of net sales by customer channel was adjusted to reflect changes in the classification of customer types as a result of a detailed review of customer channel definitions. There was no impact to the Consolidated Statements of Operations as a result of revising the classification of customer types. As a result of this adjustment, net sales to our supermarkets channel and to our other channel for
fiscal 2018
decreased approximately
$36 million
and
$58 million
, respectively, compared to the previously reported amounts, while net sales to the independents channel for
fiscal 2018
increased approximately
$95 million
compared to the previously reported amounts. In addition, net sales to our supermarkets channel and to our other channel for
fiscal 2017
decreased approximately
$16 million
and
$47 million
, respectively, compared to the previously reported amounts, while net sales to the independents channel for
fiscal 2017
increased approximately
$63 million
compared to the previously reported amounts.
|
Whole Foods Market is our only supernatural customer, and net sales to Whole Foods Market for the fiscal year ended
July 28, 2018
increased
by approximately
$662 million
or
21.4%
over the prior year and accounted for approximately
37%
and
33%
of our total net sales for the fiscal years ended
July 28, 2018
and
July 29, 2017
, respectively. The increase in net sales to Whole Foods Market was primarily due to an increase in same store sales following its acquisition by Amazon.com, Inc. in August 2017 coupled with growth in new product categories, most notably the health, beauty and supplement categories. Net sales within our supernatural channel do not include net sales to Amazon.com, Inc. in either the current period or the prior period, as these net sales are reported in our other channel.
Net sales to our supermarkets channel for the fiscal year ended
July 28, 2018
increased
by approximately
$89 million
, or
3.3%
from fiscal
2017
and represented approximately
28%
and
30%
of total net sales in fiscal
2018
and fiscal
2017
, respectively. The increase in net sales to supermarkets was primarily driven by growth in our wholesale division, which includes our broadline distribution business.
Net sales to our independents channel
increased
by approximately
$178 million
, or
7.1%
during the fiscal year ended
July 28, 2018
compared to the fiscal year ended
July 29, 2017
, and accounted for
26%
and
27%
of our total net sales in fiscal
2018
and
40
fiscal
2017
, respectively. The increase in net sales in this channel was primarily due to growth in our wholesale division, which includes our broadline distribution business.
Other net sales, which included sales to foodservice customers and sales from the United States to other countries, as well as sales through our e-commerce business, branded product lines, retail division, manufacturing division, and our brokerage business,
increased
by approximately
$24 million
or
2.5%
for the fiscal year ended
July 28, 2018
over the prior fiscal year and accounted for approximately
9%
and
10%
of total net sales in fiscal
2018
and fiscal
2017
, respectively. The increase in other net sales was primarily driven by growth in our e-commerce business.
Cost of Sales and Gross Profit
Our gross profit
increased
approximately
6.6%
, or
$93.8 million
, to
$1.52 billion
for the fiscal year ended
July 28, 2018
, from
$1.43 billion
for the fiscal year ended
July 29, 2017
. Our gross profit as a percentage of net sales was
14.9%
for the fiscal year ended
July 28, 2018
and
15.4%
for the fiscal year ended
July 29, 2017
. The decrease in gross profit as a percentage of net sales was primarily driven by a shift in customer mix where net sales growth of our largest customer outpaced growth of other customers with higher margin and by an increase in inbound freight costs.
Operating Expenses
Our total operating expenses
increased
approximately
7.7%
, or
$92.6 million
, to
$1.30 billion
for the fiscal year ended
July 28, 2018
, from
$1.20 billion
for the fiscal year ended
July 29, 2017
. As a percentage of net sales, total operating expenses
decreased
to approximately
12.7%
for the fiscal year ended
July 28, 2018
, from approximately
13.0%
for the fiscal year ended
July 29, 2017
. The decrease in operating expenses as a percentage of net sales was primarily driven by leveraging of fixed costs on increased net sales. This was partially offset by increased costs incurred to fulfill the increased demand for our products. Total operating expenses also included share-based compensation expense of
$25.8 million
and
$25.7 million
for fiscal 2018 and 2017, respectively. For more information, refer to
Note 13—Share-Based Awards
to our Consolidated Financial Statements included in “Item 8. Financial Statements and Supplementary Data” of this Annual Report.
Goodwill and Asset Impairment Charges
Fiscal 2018 goodwill and asset impairment charges reflects a goodwill impairment charge of $7.8 million and
$3.4 million
of asset impairment charges recorded for our Earth Origins retail business, which was disposed in the fourth quarter of fiscal 2018.
Restructuring, Acquisition and Integration Related Expenses
Fiscal 2018 restructuring, acquisition and integration related expense reflects
$5.0 million
of Supervalu-related acquisition costs, and
$4.8 million
of restructuring costs and a loss on disposal for our Earth Origins retail business.
Operating Income
Reflecting the factors described above, operating income
increased
approximately
0.5%
, or
$1.2 million
, to
$227.2 million
for the fiscal year ended
July 28, 2018
, from
$226.0 million
for the fiscal year ended
July 29, 2017
. As a percentage of net sales, operating income was
2.2%
and
2.4%
for the fiscal years ended
July 28, 2018
and
July 29, 2017
, respectively.
Other Expense (Income)
Other expense, net
increased
$2.9 million
to
$14.5 million
for the fiscal year ended
July 28, 2018
, from
$11.6 million
for the fiscal year ended
July 29, 2017
. Interest expense for the fiscal year ended
July 28, 2018
decreased
to
$16.5 million
from
$17.1 million
for the fiscal year ended
July 29, 2017
. The decrease in interest expense was primarily due to a reduction in outstanding debt year over year. Interest income was
$0.4 million
for the fiscal years ended
July 28, 2018
and
July 29, 2017
. Other income for the fiscal year ended
July 28, 2018
was
$1.5 million
, compared to other income of
$5.2 million
for the fiscal year ended
July 29, 2017
. Other income for fiscal 2018 was primarily related to positive returns on the Company's equity method investment. Other income for fiscal 2017 was primarily related to a $6.1 million gain recorded during the fourth quarter of fiscal 2017 related to the sale of the Company's stake in Kicking Horse Coffee.
41
Provision for Income Taxes
Our effective income tax rate was
22.1%
and
39.3%
for the fiscal years ended
July 28, 2018
and
July 29, 2017
, respectively. The decrease in the effective income tax rate for the fiscal year ended
July 28, 2018
was driven by a
$15.5 million
tax benefit which was recorded as result of the new lower federal tax rate, as well as a net tax benefit of approximately
$21.7 million
as a result of the impact of the re-measurement of U.S. net deferred tax liabilities at the new lower corporate income tax rate resulting from the Tax Cuts and Jobs Act of 2017 (“TCJA”).
Net Income
Reflecting the factors described in more detail above, net income
increased
$35.5 million
to
$165.7 million
, or
$3.26
per diluted share, for the fiscal year ended
July 28, 2018
, compared to
$130.2 million
, or
$2.56
per diluted share for the fiscal year ended
July 29, 2017
.
LIQUIDITY AND CAPITAL RESOURCES
Highlights
|
•
|
Our total debt increased
$2,587.6 million
to
$2,906.5 million
as of
August 3, 2019
from
$318.8 million
as of
July 28, 2018
, primarily related to the additional borrowings under the Term Loan Facility and ABL Credit Facility to finance the Supervalu acquisition, and loans to finance equipment and improvements to the Harrisburg, PA and Centralia, WA distribution centers. These increases in debt were partially offset by payments made from free cash flow generated from operations and distribution center property sales and proceeds from retail store sales, both discussed above.
|
|
•
|
Scheduled debt maturities are expected to be
$102.7 million
in fiscal 2020 and payments to reduce capital lease obligations are expected to be approximately
$24.7 million
in fiscal 2020. Proceeds from the sale of properties mortgaged and encumbered under our Term Loan Facility are required and will be used to make additional Term Loan Facility payments.
|
|
•
|
We expect to be able to fund fiscal 2020 debt maturities of
$102.7 million
through internally generated funds, proceeds from the asset sales, borrowings under the ABL Credit Facility or new debt issuances.
|
|
•
|
Unused available credit under our revolving line of credit increased
$269.0 million
to
$919.2 million
as of
August 3, 2019
from
$650.2 million
as of
July 28, 2018
, due to the larger borrowing capacity supported by the larger borrowing base under the ABL Credit Facility put in place in conjunction with the Supervalu acquisition, partially offset by higher levels of outstanding borrowings under the facility resulting from the Supervalu acquisition.
|
|
•
|
Cash and cash equivalents
increased
$19.0 million
to
$42.4 million
as of
August 3, 2019
from
$23.3 million
as of
July 28, 2018
, primarily due to cash from the acquired Supervalu business.
|
|
•
|
Working capital increased
$369.3 million
to
$1,459.0 million
as of
August 3, 2019
from
$1,089.7 million
as of
July 28, 2018
, primarily due to the acquisition of Supervalu’s working capital, offset in part by a larger current maturity under the Term Loan Facility than the prior term loan facility, which it replaced.
|
Sources and Uses of Cash
We expect to continue to replenish operating assets and pay down debt obligations with internally generated funds and sale of surplus and/or non-core assets. A significant reduction in operating earnings or the incurrence of operating losses could have a negative impact on our operating cash flow, which may limit our ability to pay down our outstanding indebtedness as planned. Our credit facilities are secured by a substantial portion of our total assets.
Our primary sources of liquidity are from internally generated funds and from borrowing capacity under our credit facilities. Our short-term and long-term financing abilities are believed to be adequate as a supplement to internally generated cash flows to satisfy debt obligations and fund capital expenditures as opportunities arise. Our continued access to short-term and long-term financing through credit markets depends on numerous factors including the condition of the credit markets and our results of operations, cash flows, financial position and credit ratings.
Primary uses of cash include debt service, capital expenditures, working capital maintenance and income tax payments. We typically finance working capital needs with cash provided from operating activities and short-term borrowings. Inventories are managed primarily through demand forecasting and replenishing depleted inventories.
We currently do not pay a dividend on our common stock, and have no current plans to do so. In addition, we are limited in the aggregate amount of dividends that we may pay under the terms of our Term Loan Facility and our ABL Credit Facility.
42
Long-Term Debt
During fiscal 2019, our capital structure materially changed in connection with the Supervalu acquisition. We repaid all amounts outstanding under our prior asset-based revolving credit facility and term loan facility entered into in August 2014, as amended with proceeds from the ABL Credit Facility and the Term Loan Facility.
In fiscal 2019, we borrowed
$1,475.0 million
under the ABL Credit Facility and
$1,950.0 million
under the Term Loan Facility to finance the Supervalu acquisition. During the second quarter of fiscal 2019, we paid
$566.4 million
to extinguish the remaining
$350.0 million
of 7.75% Supervalu Senior Notes and the remaining
$180.0 million
of 6.75% Supervalu Senior Notes (together with the 7.75% Supervalu Senior Notes, the “Supervalu Senior Notes”) assumed in conjunction with the Supervalu acquisition and paid the related prepayment premiums and accrued interest with restricted cash set aside on the closing date of the acquisition for this purpose. In addition, during fiscal 2019 we made mandatory prepayments of
$85.1 million
under the Term Loan Facility with asset sale proceeds. Refer to
Note 10—Long-Term Debt
in Part II, Item 8 of this Annual Report on Form 10-K for a detailed discussion of the provisions of our credit facilities and certain long-term debt agreements and additional information.
Our Term Loan Agreement does not include any financial maintenance covenants. Our ABL Loan Agreement subjects us to a fixed charge coverage ratio (as defined in the ABL Loan Agreement) of at least
1.0
to
1.0
calculated at the end of each of our fiscal quarters on a rolling four quarter basis when the adjusted aggregate availability (as defined in the ABL Loan Agreement) is less than the greater of (i)
$235.0 million
and (ii)
10%
of the aggregate borrowing base. We were not subject to the fixed charge coverage ratio covenant under the ABL Loan Agreement during fiscal 2019. The ABL Loan Agreement and the Term Loan Agreement contain certain customary operational and informational covenants. If we fail to comply with any of these covenants, we may be in default under the applicable loan agreement, and all amounts due thereunder may become immediately due and payable.
The following chart outlines our scheduled debt maturities by fiscal year, which excludes debt prepayments, which may be required from Excess Cash Flow (as defined in the Term Loan Agreement) or proceeds from sales of mortgaged properties.
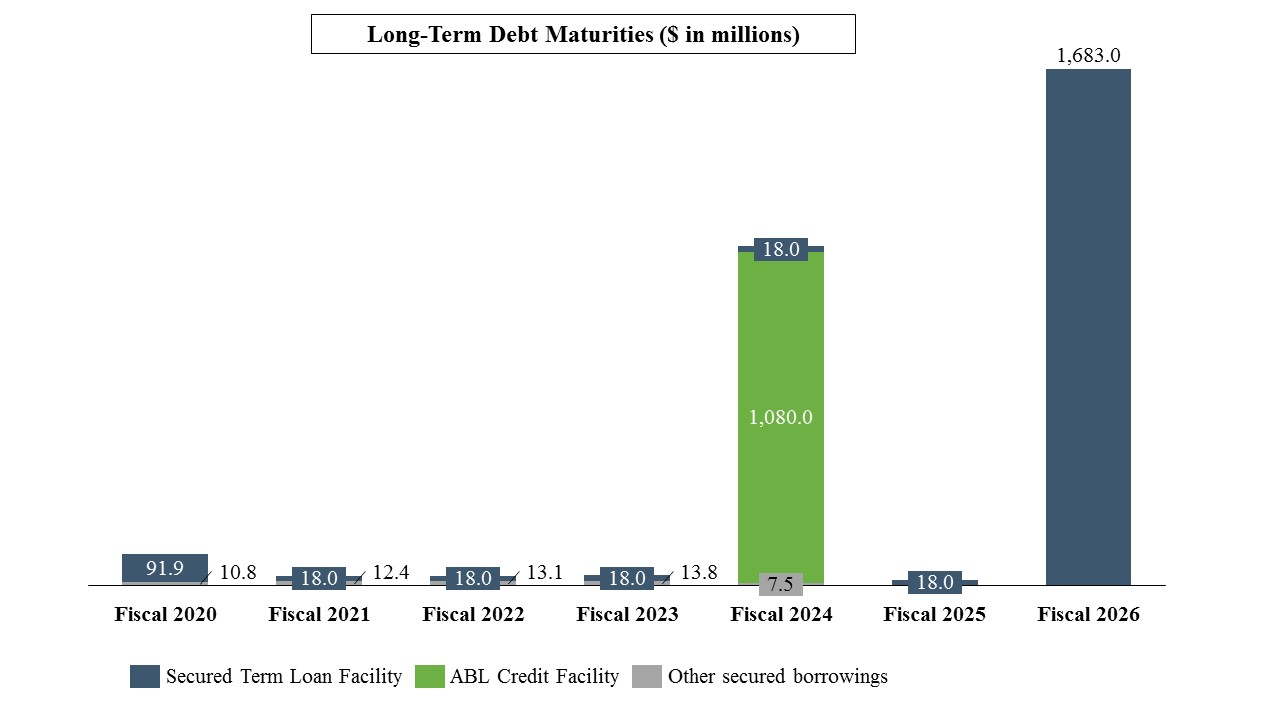
Derivatives and Hedging Activity
We enter into interest rate swap contracts from time to time to mitigate our exposure to changes in market interest rates as part of our overall strategy to manage our debt portfolio to achieve an overall desired position of notional debt amounts subject to fixed and floating interest rates. Interest rate swap contracts are entered into for periods consistent with related underlying exposures and do not constitute positions independent of those exposures.
43
As of
August 3, 2019
, we had an aggregate of
$2.20 billion
of notional debt hedged through pay fixed and receive floating interest rate swap contracts to effectively fix the LIBOR component of our floating LIBOR based debt at fixed rates ranging from
0.926%
to
2.959%
, with maturities between December 2019 and October 2025. The fair value of these interest rate derivatives represents a total net liability of
$76.6 million
and are subject to volatility based on changes in market interest rates. See
Note 9—Derivatives
in Part II, Item 8 and —Interest Rate Risk within Item 7A of this Annual Report on Form 10-K for additional information.
From time-to-time, we enter into fixed price fuel supply agreements. As of
August 3, 2019
and
July 28, 2018
, we were not a party to any such agreements.
Capital Expenditures
Our capital expenditures for fiscal 2019 were
$207.8 million
, compared to
$44.6 million
for fiscal 2018, an increase of
$163.2 million
driven primarily by distribution center expansions, new distribution centers, and higher capital expenditures attributable to Supervalu. Fiscal 2019 capital spending included the Ridgefield expansion, and construction of the new Centralia and Moreno Valley distribution centers. Fiscal 2020 capital spending is expected to include projects that optimize and expand our distribution network and technology platform. Longer term, capital spending is expected to be approximately 1.0% of net sales. We expect to finance requirements with cash generated from operations and borrowings under our ABL Credit Facility. Future investments may be financed through long-term debt or borrowings under our ABL Credit Facility.
The following chart outlines our capital expenditures by type over the last three fiscal years.
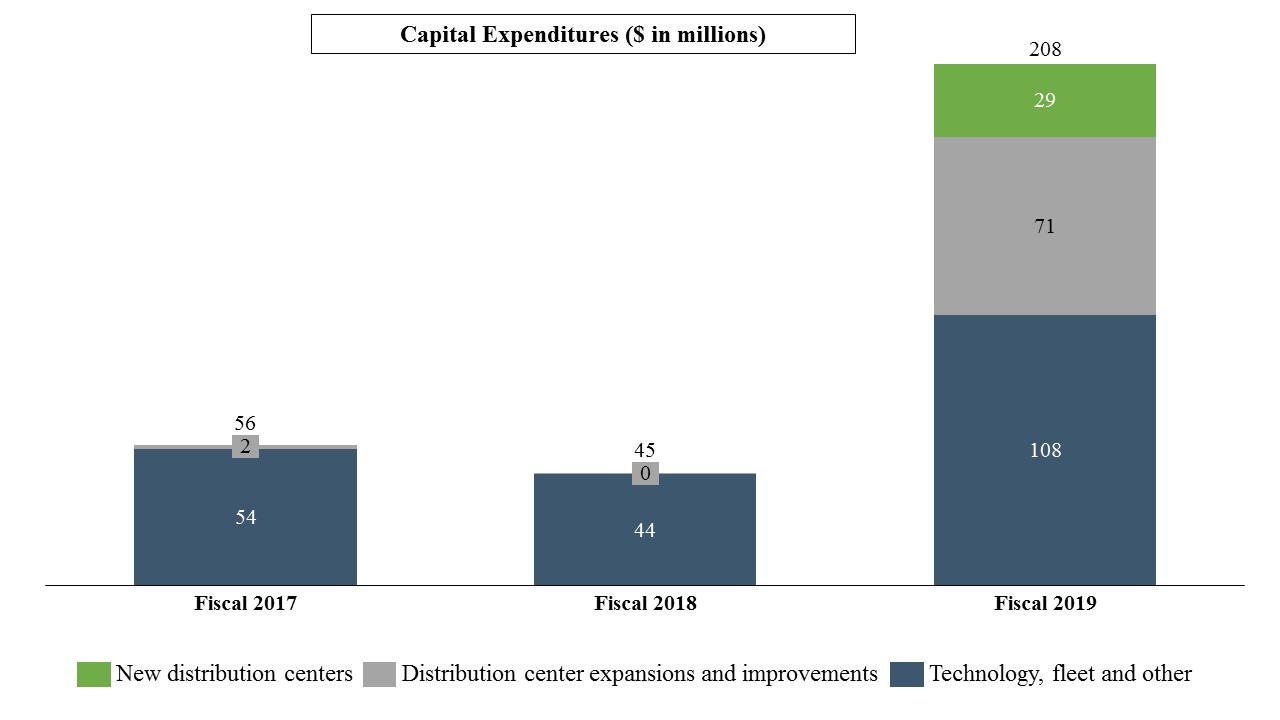
Cash Flow Information
The following summarizes our Consolidated Statements of Cash Flows:
|
(in thousands)
|
2019
(53 weeks) |
2018
(52 weeks) |
2017
(52 weeks) |
2019
Change |
2018
Change |
||||||||||||||
|
Net cash provided by operating activities of continuing operations
|
$
|
175,122
|
|
$
|
109,038
|
|
$
|
273,331
|
|
$
|
66,084
|
|
$
|
(164,293
|
)
|
||||
|
Net cash used in investing activities of continuing operations
|
(2,326,785
|
)
|
(47,005
|
)
|
(59,959
|
)
|
(2,279,780
|
)
|
12,954
|
|
|||||||||
|
Net cash provided by (used in) financing activities of continuing operations
|
1,997,564
|
|
(53,557
|
)
|
(217,116
|
)
|
2,051,121
|
|
163,559
|
|
|||||||||
|
Net cash flows from discontinued operations
|
176,194
|
|
—
|
|
—
|
|
176,194
|
|
—
|
|
|||||||||
|
Effect of exchange rate on cash
|
(143
|
)
|
(575
|
)
|
565
|
|
432
|
|
(1,140
|
)
|
|||||||||
|
Net increase (decrease) in cash and cash equivalents
|
21,952
|
|
7,901
|
|
(3,179
|
)
|
14,051
|
|
11,080
|
|
|||||||||
|
Cash and cash equivalents at beginning of period
|
23,315
|
|
15,414
|
|
18,593
|
|
7,901
|
|
(3,179
|
)
|
|||||||||
|
Cash and cash equivalents at end of period, including discontinued operations
|
$
|
45,267
|
|
$
|
23,315
|
|
$
|
15,414
|
|
$
|
21,952
|
|
$
|
7,901
|
|
||||
44
Fiscal 2019 compared to Fiscal 2018
The increase in net cash provided by operating activities of continuing operations was primarily due to higher amounts of cash utilized in fiscal 2018 in inventory acquisition and credit extension to meet increased product demand and our service level agreements and cash provided in fiscal 2019 by the reduction of inventory, including cash inflows from the reduction of Supervalu inventory since the acquisition date, as the acquisition occurred at a time when inventories were seasonally high. These increases were offset in part by cash utilized in payments of assumed liabilities from the Supervalu acquisition, including transaction-related expenses, accrued employee costs, and restructuring costs associated with reductions in force, higher cash paid for interest expense, higher cash utilized to reduce accounts payable primarily related to inventory reductions, and higher cash paid for taxes including a $59 million cash tax payment related to the Supervalu acquisition.
The increase in net cash used in investing activities of continuing operations was primarily due to
$2,292.4 million
paid for the Supervalu acquisition and an increase of
$163.2 million
in cash utilized for capital expenditures, partially offset by cash received from the sale and leaseback of two distribution centers, and the sale of two surplus facilities, for aggregate proceeds of
$172.5 million
, as discussed above.
The increase in net cash provided by financing activities of continuing operations was primarily due to borrowings on long-term debt of
$1,926.6 million
to finance the Supervalu acquisition, a net increase in revolving credit facility borrowings of
$883.4 million
, including payments to finance the Supervalu acquisition, the absence of cash utilized to repurchase common stock in fiscal 2019 compared to
$24.2 million
in fiscal 2018, an increase in proceeds from the issuance of common stock in fiscal 2019 of
$23.0 million
, and other borrowings of
$22.4 million
in fiscal 2019, partially offset by an increase in repayments of long-term debt and capital lease obligations of
$767.8 million
, including the repayment of the Supervalu Senior Notes, payments for debt financing costs of
$62.6 million
.
Net cash flows from discontinued operations primarily include operating activity cash flow from operating income and investing activity cash inflows from the sale of Hornbacher’s, a surplus distribution center, and surplus retail stores, partially offset by capital expenditures of discontinued operations.
Fiscal 2018 compared to Fiscal 2017
Net cash provided by operations was
$109.0 million
for the fiscal year ended July 28, 2018, a decrease of
$164.3 million
from the
$273.3 million
provided by operations for the year ended July 29, 2017. The primary reasons for the net cash provided by operating activities for fiscal 2018 were net income for the year of
$165.7 million
, which included depreciation and amortization of
$87.6 million
, and share based compensation expense of
$25.8 million
, offset by increases in inventory and accounts receivable of
$108.8 million
and
$67.3 million
, respectively. Net cash provided by operations of
$273.3 million
for the year ended July 29, 2017 was primarily due to net income for the year of
$130.2 million
, which included depreciation and amortization of
$86.1 million
, and an increase in accounts payable of
$82.8 million
, offset by an increase in accounts receivable of
$38.8 million
.
Working capital increased by
$131.0 million
, or
13.7%
, to
$1.09 billion
at July 28, 2018, compared to working capital of
$958.7 million
at July 29, 2017. This increase was primarily as a result of an increase in inventory to support increased demand for our products.
Net cash used in investing activities decreased approximately
$13.0 million
to
$47.0 million
for the fiscal year ended July 28, 2018, compared to
$60.0 million
for the fiscal year ended July 29, 2017. This decrease was primarily due to a decrease in cash paid for acquisitions of
$9.2 million
and a
$11.5 million
decrease in capital spending.
Net cash used in financing activities was
$53.6 million
for the fiscal year ended July 28, 2018. The net cash used in financing activities was primarily due to repayments of borrowings under our prior asset-backed revolving credit facility of
$569.7 million
, share repurchases of
$24.2 million
and repayments of long-term debt of
$12.1 million
, partially offset by proceeds from borrowings under our prior asset-backed revolving credit facility of
$556.1 million
. Net cash used in financing activities was
$217.1 million
for the fiscal year ended July 29, 2017 and was primarily due to repayments of borrowings under our prior asset-backed revolving credit facility and long term debt of
$418.7 million
and
$11.5 million
, respectively, partially offset by proceeds from borrowings under our prior asset-backed revolving credit facility of
$215.7 million
.
45
Other
On October 6, 2017, we announced that our Board of Directors authorized a share repurchase program for up to
$200.0 million
of our outstanding common stock. The repurchase program is scheduled to expire upon our repurchase of shares of our common stock having an aggregate purchase price of
$200.0 million
. We repurchased
614,660
shares of our common stock at an aggregate cost of
$24.2 million
in fiscal 2018. We did not purchase any shares of the Company’s common stock under the share repurchase program in the fiscal 2019. As of August 3, 2019, we have $175.8 million remaining authorized under the share repurchase program.
We no longer intend to indefinitely reinvest accumulated earnings in our Canada operations. Accordingly, we have recorded the tax impacts of this treatment (a tax benefit of
$0.6 million
due to the foreign exchange loss on previously taxed income) in fiscal 2019.
Pension and Other Postretirement Benefit Obligations
We contributed
$4.1 million
and
$1.6 million
to our defined benefit pension and other postretirement benefit plans, respectively, in fiscal 2019. In fiscal 2020,
$8.3 million
of minimum pension contributions are required to be made under the Unified Grocers, Inc. Cash Balance Plan under Employee Retirement Income Security Act of 1974, as amended (“ERISA”). No minimum pension contributions are required to be made to the SUPERVALU Retirement Plan under ERISA in fiscal 2020. We anticipate fiscal 2020 discretionary pension contributions and required minimum other postretirement benefit plan contributions to be approximately $0 million to $6 million. We fund our defined benefit pension plans based on the minimum contribution amount required under ERISA, the Pension Protection Act of 2006 and other applicable laws, as determined by us, including our external actuarial consultant, and additional contributions made at our discretion. We may accelerate contributions or undertake contributions in excess of the minimum requirements from time to time subject to the availability of cash in excess of operating and financing needs or other factors as may be applicable. We assess the relative attractiveness of the use of cash to accelerate contributions considering such factors as expected return on assets, discount rates, cost of debt, reducing or eliminating required Pension Benefit Guaranty Corporation variable rate premiums or in order to achieve exemption from participant notices of underfunding.
Lump Sum Pension Settlement Offering
On August 1, 2019, we amended the SUPERVALU Retirement Plan to provide for a lump sum settlement window. On August 2, 2019, we sent plan participants lump sum settlement election offerings that committed the SUPERVALU Retirement Plan to pay certain deferred vested pension plan participants and retirees, that make such an election, a lump sum payment in exchange for their rights to receive ongoing payments from the plan. The lump sum payment amounts are equal to the present value of the participant’s pension benefits, and will be made to certain former (i) retired associates and beneficiaries who are receiving their monthly pension benefit payment and (ii) terminated associates who are deferred vested in the Plan, had not yet begun receiving monthly pension benefit payments and who are not eligible for any prior lump sum offerings under the plan. Benefit obligations associated with the lump sum offering have been incorporated into the funded status utilizing the actuarially determined lump sum payments based on estimated offer acceptances. The Company expects the Plan to make lump sum settlement payments to Plan participants on or around November 1, 2019, which we anticipate will result in a required remeasurement of the defined benefit pension obligations under the plan at that time.
CRITICAL ACCOUNTING POLICIES AND ESTIMATES
The preparation of our Consolidated Financial Statements requires us to make estimates and judgments that affect the reported amounts of assets, liabilities, revenues and expenses, and the related disclosure of contingent assets and liabilities. Management believes the following critical accounting policies reflect our more subjective or complex judgments and estimates used in the preparation of our Consolidated Financial Statements.
Inventories
Inventories are valued at the lower of cost or market. Substantially all of our inventory consists of finished goods. Inventories are recorded net of vendor allowances and cash discounts. We evaluate inventory shortages (shrink) throughout each fiscal year based on actual physical counts in our facilities.
46
Prior to fiscal 2019, we determined inventory cost using the first-in, first-out (“FIFO”) method. For a substantial portion of legacy Supervalu inventory, cost was determined using the LIFO method, with the rest primarily determined using FIFO. Inventories acquired as part of the Supervalu acquisition were recorded at their fair market values as of the acquisition date. During the second quarter of fiscal 2019, we completed our evaluation of our combined inventory accounting policies and changed our method of inventory costing for certain historical United Natural Foods, Inc. inventory from the FIFO accounting method to the LIFO accounting method. We concluded that the LIFO method of inventory costing is preferable because it allows for better matching of costs and revenues, as historical inflationary inventory acquisition prices are expected to continue in the future and the LIFO method uses the current acquisition cost to value cost of goods sold as inventory is sold. Additionally, LIFO allows for better comparability of the results of our operations with those of similar companies in its peer group. As a result of the change to the LIFO method, certain Company inventories, excluding Supervalu inventories, were reduced by
$15.0 million
for fiscal 2019, which resulted in increases to Cost of sales and Loss from continuing operations before income taxes of the same amount in the Consolidated Statements of Operations for fiscal 2019. As of August 3, 2019, approximately
$1.6 billion
inventory was valued under the LIFO method and primarily included grocery, frozen food and general merchandise products, with the remaining inventory valued under the FIFO method and primarily included meat, dairy and deli products.
Vendor funds
We receive funds from many of the vendors whose products we buy for resale. These vendor funds are generally provided to increase the sell-through of the related products. We receive vendor funds for a variety of merchandising activities: placement of the vendors’ products in our advertising; display of the vendors’ products in prominent locations in our stores; supporting the introduction of new products into our stores and distribution centers; exclusivity rights in certain categories; and to compensate for temporary price reductions offered to customers on products held for sale. We also receive vendor funds for buying activities such as volume commitment rebates, credits for purchasing products in advance of their need and cash discounts for the early payment of merchandise purchases. The majority of the vendor fund contracts have terms of less than a year, although some of the contracts have terms of longer than one year.
We recognize vendor funds for merchandising activities as a reduction of Cost of sales when the related products are sold, unless it has been determined that a discrete identifiable benefit has been provided to the vendor, in which case the related amounts are recognized within Net sales and represent less than one half of one percent of total Net sales. Vendor funds that have been earned as a result of completing the required performance under the terms of the underlying agreements but for which the product has not yet been sold are recognized as reductions to the value of on-hand inventory.
The amount and timing of recognition of vendor funds as well as the amount of vendor funds to be recognized as a reduction to ending inventory requires management judgment and estimates. Management determines these amounts based on estimates of current year purchase volume using forecast and historical data, and a review of average inventory turnover data. These judgments and estimates impact our reported gross profit, operating income and inventory amounts. The historical estimates have been reliable in the past, and we believe our methodology will continue to be reliable in the future. Based on previous experience, we do not expect significant changes in the level of vendor support. However, if such changes were to occur, cost of sales and net sales could change, depending on the specific vendors involved. If vendor advertising allowances were substantially reduced or eliminated, we would consider changing the volume, type and frequency of the advertising, which could increase or decrease our advertising expense.
Benefit plans
We sponsor pension and other postretirement plans in various forms covering substantially all employees who meet eligibility requirements. Pension benefits associated with these plans are generally based on each participant’s years of service, compensation, and age at retirement or termination. Our defined benefit pension plans and certain supplemental executive retirement plans were closed to new participants and service crediting.
While we believe the valuation methods used to determine the fair value of plan assets are appropriate and consistent with other market participants, the use of different methodologies or assumptions to determine the fair value of certain financial instruments could result in a different estimate of fair value at the reporting date.
The determination of our obligation and related expense for Company-sponsored pension and other postretirement benefits is dependent, in part, on management’s selection of certain actuarial assumptions used in calculating these amounts. These assumptions include, among other things, the discount rate, the expected long-term rate of return on plan assets and the rates of increase in compensation and healthcare costs. We measure our defined benefit pension and other postretirement plan obligations as of the nearest calendar month end. Refer to
Note 14—Benefit Plans
in Part II, Item 8 of this Annual Report on Form 10-K for information related to the actuarial assumptions used in determining pension and postretirement healthcare liabilities and expenses.
47
We review and select the discount rate to be used in connection with our pension and other postretirement obligations annually. The discount rate reflects the current rate at which the associated liabilities could be effectively settled at the end of the year. We set our rate to reflect the yield of a portfolio of high quality, fixed-income debt instruments that would produce cash flows sufficient in timing and amount to settle projected future benefits.
Our expected long-term rate of return on plan assets assumption is determined based on the portfolio’s actual and target composition, current market conditions, forward-looking return and risk assumptions by asset class, and historical long-term investment performance. The assumed long-term rate of return on pension assets ranged from
6.25 percent
to
6.5 percent
for fiscal 2019. The 10-year rolling average annualized return for a portfolio of investments applied in a manner consistent with our target allocations have generated average returns of approximately
8.04 percent
based on returns from 1990 to 2017. In accordance with GAAP, actual results that differ from our assumptions are accumulated and amortized over future periods and, therefore, affect expense and obligations in future periods.
Each
25 basis point
reduction in the discount rate would increase the postretirement benefit obligation by $65 million, as of August 3, 2019, and for fiscal 2019 would decrease pension expense by approximately
$3.5 million
and each
25 basis point reduction
in expected return on plan assets would increase pension expense by approximately
$5.6 million
. Similarly, for postretirement benefits, a
100 basis point
increase in the healthcare cost trend rate would increase the accumulated postretirement benefit obligation by approximately
$3.2 million
as of the end of fiscal 2019 and would increase service and interest cost by less than
$0.1 million
. Conversely, a
100 basis point
decrease in the healthcare cost trend rate would decrease the accumulated postretirement benefit obligation as of the end of fiscal 2019 by approximately
$2.6 million
and would decrease service and interest cost by less than
$0.1 million
. Although we believe our assumptions are appropriate, the actuarial assumptions may differ from actual results due to changing market and economic conditions, higher or lower withdrawal rates and longer or shorter life spans of participants.
We recognize the amortization of net actuarial loss on the SUPERVALU Retirement Plan and the Unified Grocers Inc. Cash Balance Plan over the remaining life expectancy of inactive participants based on our determination that almost all of the defined benefit pension plan participants are inactive and the plan is frozen to new participants. For the purposes of inactive participants, we utilized an over approximately
90 percent
threshold established under our policy.
We utilize the “full yield curve” approach for determining the interest and service cost components of net periodic benefit cost for defined benefit pension and other postretirement benefit plans. Under this method, the discount rate assumption used in the interest and service cost components of net periodic benefit cost is built through applying the specific spot rates along the yield curve used in the determination of the benefit obligation described above, to the relevant projected future cash flows of our pension and other postretirement benefit plans. We believe the “full yield curve” approach reflects a greater correlation between projected benefit cash flows and the corresponding yield curve spot rates and provides a more precise measurement of interest and service costs.
Business dispositions
The Company reviews the presentation of planned business dispositions in the Consolidated Financial Statements based on the available information and events that have occurred. The review consists of evaluating whether the business meets the definition of a component for which the operations and cash flows are clearly distinguishable from the other components of the business, and if so, whether it is anticipated that after the disposal the cash flows of the component would be eliminated from continuing operations and whether the disposition represents a strategic shift that has a major effect on operations and financial results. In addition, the Company evaluates whether the business has met the criteria as a business held for sale. In order for a planned disposition to be classified as a business held for sale, the established criteria must be met as of the reporting date, including an active program to market the business and the expected disposition of the business within one year.
Planned business dispositions are presented as discontinued operations when all the criteria described above are met. Operations of the business components meeting the discontinued operations requirements are presented within Income from discontinued operations, net of tax in the Consolidated Statements of Operations, and assets and liabilities of the business component planned to be disposed of are presented as separate lines within the Consolidated Balance Sheets.
48
The carrying value of the business held for sale is reviewed for recoverability upon meeting the classification requirements. Evaluating the recoverability of the assets of a business classified as held for sale follows a defined order in which property and intangible assets subject to amortization are considered only after the recoverability of goodwill, indefinite lived intangible assets and other assets are assessed. After the valuation process is completed, the held for sale business is reported at the lower of its carrying value or fair value less cost to sell, and no additional depreciation or amortization expense is recognized. Acquired businesses are evaluated for certain criteria to be classified as held for sale, and if so, are reported at their fair value less costs to sell as of the acquisition date and subsequently adjusted each reporting period.
Judgments and estimates utilized to determine whether impairment charges exist include the review of the business units fair value, which may occur under the income and market approaches and include forecasted revenues, operating expenses, income tax expenses, depreciation and amortization expenses and discount rates. In addition, we evaluate the recognition of other charges and costs, including potential multiemployer plan withdrawal charges. The sale of a business can result in the recognition of a gain or loss that differs from that anticipated prior to closing. See
Note 19—Discontinued Operations
in Part II, Item 8 of this Annual Report on Form 10-K for the carrying value of discontinued operations held for sale assets and liabilities and additional information.
Self-Insurance liabilities
We are primarily self-insured for workers’ compensation, general and automobile liability insurance. It is our policy to record the self-insured portions of our workers’ compensation, general and automobile liabilities based upon actuarial methods of estimating the future cost of claims and related expenses that have been reported but not settled, and that have been incurred but not yet reported. Any projection of losses concerning these liabilities is subject to a considerable degree of variability. Among the causes of this variability are unpredictable external factors affecting litigation trends, benefit level changes and claim settlement patterns. If actual claims incurred are greater than those anticipated, our reserves may be insufficient and additional costs could be recorded in our Consolidated Financial Statements. Accruals for workers’ compensation, general and automobile liabilities totaled
$88.8 million
and
$24.7 million
as of
August 3, 2019
and
July 28, 2018
, respectively.
Valuation of assets and liabilities acquired in a business combination
We account for acquired businesses using the purchase method of accounting which requires that the assets acquired and liabilities assumed be recorded at the date of the acquisition at their respective estimated fair values. Goodwill represents the excess of consideration transferred over the fair value of net assets acquired in a business combination. The judgments made in determining the estimated fair value assigned to each class of assets acquired and liabilities assumed, as well as the estimated useful life of each asset, can materially impact the net income of the periods subsequent to the acquisition through depreciation and amortization, and in certain instances through impairment charges, if the asset becomes impaired in the future. During the measurement period, purchase price allocation changes that impact the carrying value of goodwill effects any measurement of goodwill impairment that was taken during the time period. In fiscal 2019, we recorded a goodwill impairment charge related to the Supervalu distribution reporting unit in a period in which the purchase price allocation had not been completed. Estimates that are sensitive include judgments as to whether information gathered during the measurement period relate to information that was not yet available or whether subsequent developments have occurred that indicate the recognition of other asset and liabilities should be recorded within net income.
In determining the estimated fair value for intangible assets, we typically utilize the income approach, which discounts the projected future net cash flow using an appropriate discount rate that reflects the risks associated with such projected future cash flow. Estimates that are sensitive to the determination of the fair value of acquired customer intangibles, include forecasted revenues, operating expenses, income tax expenses, depreciation and amortization expenses, and attrition and discount rates, all of which can have a material impact on the estimated fair values of customer relationship intangible assets.
Other significant judgments include the estimated fair value of real and personal property that utilizes significant inputs such as rental and discount rates to determine the fair value of the acquired assets, and the market approach that utilizes significant inputs such as market rental rates and sales comparisons. Fair value estimates are based on available historical information, future expectations and assumptions determined to be reasonable but are inherently uncertain with respect to future events, including economic conditions, competition, the useful life of the acquired assets and other factors. Estimates that are sensitive to the determination of the fair value of real and personal property include external transactions and other comparable transactions, estimated replacement and reproduction costs, and estimated useful lives and salvage values.
49
Determining the useful life of an intangible asset also requires judgment, as different types of intangible assets will have different useful lives and certain assets may even be considered to have indefinite useful lives. Intangible assets determined to have an indefinite useful life are reassessed periodically based on the expected use of the asset by us, legal or contractual provisions that may affect the useful life or renewal or extension of the asset’s contractual life without substantial cost, and the effects of demand, competition and other economic factors
.
Recoverability of goodwill and intangible assets
Goodwill
We review goodwill for impairment at least annually, and on an interim basis if events occur or circumstances indicate that it is more likely than not that a reporting units’ fair value is below its carrying amount. We have elected to perform our annual tests for indications of goodwill impairment as of the first day of the fourth quarter of each fiscal year. We test for goodwill impairment at the reporting unit level, which is at or one level below the operating segment level, unless components are determined to be economically similar, in which case components would be aggregated into goodwill reporting units that are at the same level as an operating segment. The determination of reporting units considers the quantitative and qualitative characteristics of aggregation of each of the components within the operating segments. The significant qualitative and economic characteristics used in determining our components to support their aggregation include types of businesses and the manner in which the components operate, consideration of key impacts to net sales, cost of sales, competitive risks and the extent to which components share assets and other resources. Based an interim fiscal 2019 quantitative assessment, the Supervalu distribution reporting unit’s fair value was substantially less than its carrying value and the entire amount of goodwill from the acquisition that was attributed to the reporting unit was impaired. If we were to change the composition of our reporting units, such that the unrealized fair value deficit over the carrying value was subject to measurement as part of the recoverability of other reporting units, under a new basis of reporting units, we may incur additional impairment charges. Goodwill has been assigned as of the acquisition date of the respective components. Goodwill has only been allocated upon a business’s disposal or upon achievement of criterion to classify an existing component as a new reporting unit.
Total goodwill by reporting unit is as follows:
|
(in thousands)
|
August 3, 2019
|
|||
|
Legacy Company distribution
|
$
|
423,534
|
|
|
|
UNFI Canada
|
8,862
|
|
||
|
Blue Marble Brands
|
5,436
|
|
||
|
Woodstock Farms
|
4,424
|
|
||
|
Supervalu distribution
|
—
|
|
||
|
Total Goodwill
|
$
|
442,256
|
|
|
A qualitative review may be conducted to determine whether it is more likely than not that the fair value of a reporting unit is less than its carrying amount. If the qualitative review is bypassed or it is determined that it is more likely than not that the carrying value is greater than the fair value of the reporting unit, a quantitative impairment test must be performed. The quantitative impairment test determines the fair value of each reporting unit, which is then compared against the carrying amount of the reporting unit, including goodwill, to determine if an impairment exists. In fiscal 2019, we performed two qualitative reviews, and as a result of one of the qualitative reviews a quantitative review of goodwill was conducted in the second quarter of fiscal 2019. During fiscal 2019, we recorded a total impairment charge of
$292.8 million
to goodwill related to the acquired Supervalu distribution business.
For the fiscal 2019 quantitative assessment, we estimated the fair value for our reporting units, utilizing the income and market approaches, which were weighted on a 50:50 basis to determine each reporting unit’s fair value. Estimates that were sensitive to the fair value determination under income and market approach, include forecasted revenues, operating expenses, income tax expenses, depreciation and amortization expenses and discount rates. In addition, the market approach quantifications included comparable company market multiples relative to each reporting unit. Refer to
Note 7—Goodwill and Intangible Assets
in Part II, Item 8 of this Annual Report on Form 10-K for additional information.
50
Intangible Assets
We review indefinite lived intangible assets and other long lived assets with finite lives at least annually, and on an interim basis if events occur or circumstances indicate that the carrying value of the respective asset may not be recoverable. If the evaluation indicates that the carrying amount of the asset may not be recoverable, the potential impairment is measured based on a projected discounted cash flow model. Impairment is measured as the difference between the fair value of the asset and its carrying value. Cash flows expected to be generated by the related assets are estimated over the asset’s useful life based on projected cash flows.
Indefinite-lived intangible assets are reviewed for impairment at least annually as of the first day of the fourth fiscal quarter and if events occur or circumstances change that would indicate that the value of the asset may be impaired. We perform qualitative assessments of goodwill and indefinite lived intangibles assets for impairment, unless we believe it is more likely than not that an intangible asset’s fair value is less than the carrying value, in which case a quantitative assessment would be performed.
Our fiscal 2019 annual indefinite lived impairment assessment indicated that no impairment existed. Refer to
Note 7—Goodwill and Intangible Assets
in Part II, Item 8 of this Annual Report on Form 10-K for the carrying values reviewed and additional information.
We review long-lived assets, including definite-lived intangible assets, for indicators of impairment whenever events or changes in circumstances indicate that the carrying value of the assets may not be recoverable. Cash flows expected to be generated by the related assets are estimated over the assets’ useful lives based on updated projections. If the evaluation indicates that the carrying amount of an asset may not be recoverable, the potential impairment is measured based using the income approach. We group long-lived assets with other assets at the lowest level for which identifiable cash flows are largely independent of the cash flows of other assets.
Income taxes
The Company accounts for income taxes under the asset and liability method. Under the asset and liability method, deferred tax assets and liabilities are recognized for the future tax consequences attributable to differences between the financial statement carrying amounts of existing assets and liabilities and their respective tax bases. Deferred tax assets and liabilities are measured using enacted tax rates expected to apply to taxable income in the years in which those temporary differences are expected to be recovered or settled. The effect on deferred tax assets and liabilities of a change in tax rates is recognized in income in the period that includes the enactment date.
The calculation of the Company’s tax liabilities includes addressing uncertainties in the application of complex tax regulations and is based on the financial statement recognition and measurement of a tax position taken or expected to be taken in a tax return. Addressing these uncertainties requires judgment and estimates; however, actual results could differ, and we may be exposed to losses or gains. Our effective tax rate in a given financial statement period could be affected based on favorable or unfavorable tax settlements. Unfavorable tax settlements will generally require the use of cash and may result in an increase to our effective tax rate in the period of resolution. Favorable tax settlements may be recognized as a reduction to our effective tax rate in the period of resolution.
The Company regularly reviews its deferred tax assets for recoverability to evaluate whether it is more likely than not that they will be realized. In making this evaluation, the Company considers the statutory recovery periods for the assets, along with available sources of future taxable income, including reversals of existing taxable temporary differences, tax planning strategies, history of taxable income, and projections of future income. The Company gives more significance to objectively verifiable evidence, such as the existence of deferred tax liabilities that are forecast to generate taxable income within the relevant carryover periods, and a history of earnings. A valuation allowance is provided when the Company concludes, based on all available evidence, that it is more likely than not that the deferred tax assets will not be realized during the applicable recovery period.
On December 22, 2017, the U.S. government enacted comprehensive tax legislation under the TCJA. The TCJA makes broad and complex changes to the U.S. tax code, including reducing the U.S. federal corporate tax rate from 35 percent to 21 percent, effective January 1, 2018. Shortly after the TCJA was enacted, the Securities and Exchange Commission (“SEC”) issued accounting guidance, which provides a one-year measurement period during which a company may complete its accounting for the impacts of the TCJA. To the extent a company’s accounting for certain income tax effects of the TCJA is incomplete, the company may determine a reasonable estimate for those effects and record a provisional estimate in its financial statements. See
Note 15—Income Taxes
for further effects of the new tax legislation on the Company.
51
COMMITMENTS, CONTINGENCIES, AND OFF-BALANCE SHEET ARRANGEMENTS
Off-Balance Sheet Arrangements
Guarantees and Contingent Liabilities
We have outstanding guarantees related to certain leases, fixture financing loans and other debt obligations of various retailers as of
August 3, 2019
. We are contingently liable for leases that have been assigned to various parties in connection with facility closings and dispositions. We are also a party to a variety of contractual agreements under which we may be obligated to indemnify the other party for certain matters in the ordinary course of business, which indemnities may be secured by operation of law or otherwise. Refer to
Note 18—Commitments, Contingencies and Off-Balance Sheet Arrangements
in Part II, Item 8 of this Annual Report on Form 10-K for further information regarding our outstanding guarantees and contingent liabilities.
Multiemployer Benefit Plans
We contribute to various multiemployer pension plans under collective bargaining agreements, primarily defined benefit pension plans. These multiemployer plans generally provide retirement benefits to participants based on their service to contributing employers. The benefits are paid from assets held in trust for that purpose. Plan trustees typically are responsible for determining the level of benefits to be provided to participants as well as the investment of the assets and plan administration. Trustees are appointed in equal number by employers and unions that are parties to the collective bargaining agreement. Based on the assessment of the most recent information available from the multiemployer plans, we believe that most of the plans to which we contribute are underfunded. We are only one of a number of employers contributing to these plans and the underfunding is not a direct obligation or liability to us.
Our contributions can fluctuate from year to year due to store closures, employer participation within the respective plans and reductions in headcount. Our contributions to these plans could increase in the near term. However, the amount of any increase or decrease in contributions will depend on a variety of factors, including the results of our collective bargaining efforts, investment returns on the assets held in the plans, actions taken by the trustees who manage the plans and requirements under the Pension Protection Act of 2006, the Multiemployer Pension Reform Act and Section 412(e) of the Internal Revenue Code. Furthermore, if we were to significantly reduce contributions, exit certain markets or otherwise cease making contributions to these plans, we could trigger a partial or complete withdrawal that could require us to make withdrawal liability payments to the fund. Expense is recognized in connection with these plans as contributions are funded, in accordance with GAAP. We made contributions to these plans, and recognized continuing and discontinued operations expense, of
$41.0 million
,
$0.5 million
and
$0.0 million
in
fiscal 2019
,
2018
and
2017
,
respectively. In fiscal 2020, we expect to contribute approximately
$37 million
related to continuing operations contributions to the multiemployer pension plans, subject to the outcome of collective bargaining and capital market conditions. Furthermore, if we were to significantly reduce contributions, exit certain markets or otherwise cease making contributions to these plans, it could trigger a partial or complete withdrawal that would require us to record a withdrawal liability. Any withdrawal liability would be recorded when it is probable that a liability exists and can be reasonably estimated, in accordance with GAAP. Any triggered withdrawal obligation could result in a material charge and payment obligations that would be required to be made over an extended period of time.
We also make contributions to multiemployer health and welfare plans in amounts set forth in the related collective bargaining agreements. A small minority of collective bargaining agreements contain reserve requirements that may trigger unanticipated contributions resulting in increased healthcare expenses. If these healthcare provisions cannot be renegotiated in a manner that reduces the prospective healthcare cost as we intend, our Operating expenses could increase in the future.
Refer to
Note 14—Benefit Plans
in Part II, Item 8 of this Annual Report on Form 10-K for further information regarding the plans in which we participate.
52
Contractual Obligations
The following schedule summarizes our significant contractual obligations as of
August 3, 2019
:
|
Payments Due Per Period
|
|||||||||||||||||||
|
(in millions)
|
Total
|
Fiscal 2020
|
Fiscal 2021-2022
|
Fiscal 2023-2024
|
Thereafter
|
||||||||||||||
|
Contractual obligations
(1)(2)
:
|
|||||||||||||||||||
|
Long-term debt
(3)
|
$
|
3,003
|
|
$
|
103
|
|
$
|
62
|
|
$
|
1,137
|
|
$
|
1,701
|
|
||||
|
Interest on long-term debt
(4)
|
913
|
|
167
|
|
324
|
|
284
|
|
138
|
|
|||||||||
|
Operating leases
(5)
|
1,732
|
|
174
|
|
300
|
|
251
|
|
1,007
|
|
|||||||||
|
Capital leases
(6)
|
180
|
|
35
|
|
55
|
|
45
|
|
45
|
|
|||||||||
|
Purchase obligations
(7)
|
260
|
|
182
|
|
68
|
|
6
|
|
4
|
|
|||||||||
|
Self-insurance liabilities
(8)
|
96
|
|
31
|
|
34
|
|
15
|
|
16
|
|
|||||||||
|
Multiemployer plan withdrawal liabilities
|
74
|
|
2
|
|
3
|
|
6
|
|
63
|
|
|||||||||
|
Deferred compensation
|
6
|
|
1
|
|
2
|
|
1
|
|
2
|
|
|||||||||
|
Total contractual obligations
|
$
|
6,264
|
|
$
|
695
|
|
$
|
848
|
|
$
|
1,745
|
|
$
|
2,976
|
|
||||
|
(1)
|
Because the timing of certain future payments beyond fiscal 2019 cannot be reasonably determined, contractual obligations payments due per fiscal period presented here exclude our discretionary funding of our pension plans and required funding of our postretirement benefit obligations. Pension and postretirement benefit obligations were
$239 million
as of fiscal year ended
August 3, 2019
.
The Company expects to contribute approximately $8 million to $14 million to its defined benefit pension plans and postretirement benefit plans in fiscal 2020.
|
|
(2)
|
Unrecognized tax benefits, which totaled
$40 million
as of fiscal year ended
August 3, 2019
, were excluded from the contractual obligations table because an estimate of the timing of future tax settlements cannot be reasonably determined.
|
|
(3)
|
Long-term debt amounts exclude original issue discounts and deferred financing costs. Long-term debt payments due per period exclude any cash prepayments that may be required under the provisions of the Term Loan Facility because future prepayment amounts, if any, are not reasonably estimable as of
August 3, 2019
.
|
|
(4)
|
Amounts include contractual interest payments (net of our interest rate swap payments) using the face value and applicable interest rate as of
August 3, 2019
. The face value of variable debt instruments with a variable rate equal to one-month LIBOR plus an applicable margin is
$2,892 million
. The face value of variable interest debt instruments with a variable rate equal to the prime rate plus an applicable margin is
$53 million
.
|
|
(5)
|
Represents the minimum rents payable under operating leases, excluding common area maintenance, insurance or tax payments, for which we are also obligated, offset by minimum subtenant rentals of
$215 million
total,
$50 million
,
$69 million
,
$39 million
and
$57 million
, respectively.
|
|
(6)
|
Represents the minimum payments under capital leases, excluding common area maintenance, insurance or tax payments, for which we are also obligated, offset by minimum subtenant rentals of
$21 million
total,
$6 million
,
$8 million
,
$4 million
and
$3 million
, respectively.
|
|
(7)
|
Our purchase obligations include various obligations that have annual purchase commitments of
$1 million
or greater. As of fiscal year ended
August 3, 2019
, future purchase obligations existed that primarily related to fixed asset, information technology and inventory purchase commitments. In addition, in the ordinary course of business, we enter into supply contracts to purchase product for resale to wholesale customers and to consumers, which are typically of a short-term nature with limited or no purchase commitments. The majority of our supply contracts are short-term in nature and relate to fixed assets, information technology and contracts to purchase product for resale. These supply contracts typically include either volume commitments or fixed expiration dates, termination provisions and other standard contractual considerations. The supply contracts that are cancelable have not been included above.
|
|
(8)
|
Our insurance liabilities include the undiscounted obligations related to workers’ compensation, general and automobile liabilities at the estimated ultimate cost of reported claims and claims incurred but not yet reported and related expenses. Future payments reflected here represent our reasonably determined estimate.
|
Recently Issued Financial Accounting Standards
For a discussion of recently issued financial accounting standards, refer to
Note 2—Recently Adopted and Issued Accounting Pronouncements
in Part II, Item 8 of this Annual Report on Form 10-K for further detail.
ITEM 7A. QUANTITATIVE AND QUALITATIVE DISCLOSURES ABOUT MARKET RISK.
We are exposed to a number of market related risks, including changes in interest rates, fuel prices, foreign exchange rates and changes in the market price of investments held in our master trust used to fund defined benefit pension obligations. We have historically employed financial derivative instruments from time to time to reduce these risks. We do not use financial instruments or derivatives for any trading or other speculative purposes. We currently utilize derivative financial instruments to reduce the market risks related to changes in interest rates and foreign exchange rates.
53
Interest Rate Risk
We are exposed to market pricing risk consisting of interest rate risk related to certain of our debt instruments and notes receivable outstanding. Our debt obligations are more fully described in
Note 10—Long-Term Debt
to the Consolidated Financial Statements included in Item 8. Financial Statements and Supplementary Data of this Annual Report. Interest rate risk is managed through the strategic use of fixed and variable rate debt and derivative instruments. As more fully described in
Note 9—Derivatives
to the Consolidated Financial Statements included in Item 8. Financial Statements and Supplementary Data of this Annual Report, we have used interest rate swap agreements with the objective to protect us against adverse changes in interest rates by effectively converting certain of our variable rate obligations to fixed rate obligations. These interest rate swaps are derivative instruments designated as cash flow hedges on the forecasted interest payments related to a certain portion of our debt obligations. Our variable rate borrowings consist primarily of LIBOR based loans, which is the benchmark interest rate being hedged in our interest rate swap agreements.
Changes in interest rates could also affect the interest rates we pay on future borrowings under our ABL Credit Facility and Term Loan Facility, which rates are typically related to LIBOR. We estimate that a 100 basis point increase in the interest rates related to our variable rate borrowings would increase our annualized interest expense by approximately
$7.4 million
, net of the floating interest rate receivable on our interest rate swaps. Changes in interest rates related to our fixed rate debt instruments do not have an impact upon future results of operations or cash flows while outstanding; however, if additional debt issuances at higher interest rates are required to fund fixed rate debt maturities, future results of operations or cash flows may be impacted.
At
August 3, 2019
, a 100 basis point increase in interest rates would decrease the unrealized fair market value of our debt currently bearing fixed rates or debt scheduled to convert to fixed rates by approximately
$2.3 million
, while a 100 basis point decrease in interest rates would increase the unrealized fair market value of those same debt instruments by approximately
$2.4 million
. At
August 3, 2019
, a 100 basis point increase in forward LIBOR interest rates would increase the fair value of our outstanding interest rate swaps by approximately
$69.7 million
, while a 100 basis point decrease would decrease the fair value of those swaps by approximately
$73.0 million
.
Loans are extended to certain wholesale customers in the normal course of business through notes receivable. The notes generally bear fixed interest rates negotiated with each wholesale customer. The market value of the fixed rate notes is subject to change due to fluctuations in market interest rates.
The table below provides information about our financial instruments that are sensitive to changes in interest rates, including debt obligations, interest rate swaps and notes receivable. For debt obligations, the table presents principal amounts due and related weighted average interest rates by expected maturity dates using interest rates as of
August 3, 2019
, excluding any original issue and purchase accounting discounts, and deferred financing costs. For interest rate swaps, the table presents the notional amounts and related weighted average interest rates by maturity. For notes receivable, the table presents the expected collection of principal cash flows and weighted average interest rates by expected year of maturity.
|
August 3, 2019
|
Expected Fiscal Year of Maturity
|
||||||||||||||||||||||||||||||
|
Fair Value
|
Total
|
2020
|
2021
|
2022
|
2023
|
2024
|
Thereafter
|
||||||||||||||||||||||||
|
(in millions, except interest rates)
|
|||||||||||||||||||||||||||||||
|
Long-term Debt:
|
|||||||||||||||||||||||||||||||
|
Variable rate—principal payments
|
$
|
2,671
|
|
$
|
2,945
|
|
$
|
92
|
|
$
|
18
|
|
$
|
18
|
|
$
|
18
|
|
$
|
1,098
|
|
$
|
1,701
|
|
|||||||
|
Weighted average interest rate
(1)
|
5.4
|
%
|
4.7
|
%
|
6.5
|
%
|
6.5
|
%
|
6.5
|
%
|
3.6
|
%
|
6.5
|
%
|
|||||||||||||||||
|
Fixed rate—principal payments
|
$
|
59
|
|
$
|
58
|
|
$
|
11
|
|
$
|
12
|
|
$
|
13
|
|
$
|
14
|
|
$
|
8
|
|
$
|
—
|
|
|||||||
|
Weighted average interest rate
|
5.3
|
%
|
5.3
|
%
|
5.3
|
%
|
5.3
|
%
|
5.3
|
%
|
4.9
|
%
|
—
|
|
|||||||||||||||||
|
Interest Rate Swaps:
|
|||||||||||||||||||||||||||||||
|
Notional amounts hedged under pay fixed, receive variable swaps
|
$
|
(77
|
)
|
$
|
2,200
|
|
$
|
208
|
|
$
|
360
|
|
$
|
360
|
|
$
|
472
|
|
$
|
350
|
|
$
|
450
|
|
|||||||
|
Weighted average pay rate
|
2.5
|
%
|
2.4
|
%
|
2.3
|
%
|
2.4
|
%
|
2.6
|
%
|
2.7
|
%
|
2.7
|
%
|
|||||||||||||||||
|
Weighted average receive rate
|
1.5
|
%
|
1.8
|
%
|
1.6
|
%
|
1.5
|
%
|
1.5
|
%
|
1.5
|
%
|
1.5
|
%
|
|||||||||||||||||
|
Notes receivable:
|
|||||||||||||||||||||||||||||||
|
Principal receivable
|
$
|
45
|
|
$
|
46
|
|
$
|
12
|
|
$
|
8
|
|
$
|
6
|
|
$
|
5
|
|
$
|
2
|
|
$
|
13
|
|
|||||||
|
Weighted average receivable rate
|
5.1
|
%
|
5.3
|
%
|
5.4
|
%
|
5
|
%
|
4.8
|
%
|
6
|
%
|
4.6
|
%
|
|||||||||||||||||
|
(1)
|
Excludes the effect of interest rate swaps effectively converting certain of our variable rate obligations to fixed rate obligations.
|
54
Fuel Price Risk
We are exposed to market pricing risk consisting of changes in diesel prices. We maintain a fuel surcharge program, which allows us to pass some of our higher fuel costs through to our customers. In addition, to reduce diesel price risk, we have in the past, and may in the future, periodically enter in to derivative financial instruments and forward purchase commitments for a portion of our projected monthly diesel fuel requirements at fixed prices. As of
August 3, 2019
, we had no forward diesel fuel commitments or derivatives outstanding.
Foreign Exchange Risk
We are exposed to market pricing risk consisting of changes in foreign exchange rates. To reduce foreign exchange risk, we have in the past, and may in the future, periodically enter into derivative financial instruments for a portion of our projected monthly foreign currency requirements at fixed prices. As of
August 3, 2019
, our outstanding foreign currency forward contracts were immaterial.
Investment Risk
We assumed the defined benefit pension plan obligations and assets of the SUPERVALU Retirement Plan from the Supervalu acquisition. This plan holds investments in public and private equity, fixed income and real estate securities, which is described further in
Note 14—Benefit Plans
in Part II, Item 8 of this Annual Report. Changes in SUPERVALU Retirement Plan assets can affect the amount of our anticipated future contributions. In addition, increases or decreases in SUPERVALU Retirement Plan assets can result in a related increase or decrease to our equity through Accumulated other comprehensive loss. As of
August 3, 2019
, a 10 percent unfavorable change in the value of investments held by the SUPERVALU Retirement Plan would not have had an impact on our minimum contributions required under ERISA for fiscal
2019
, but would have resulted in an unfavorable change in net periodic pension income for fiscal 2020 of
$3 million
and would have reduced stockholders’ equity by
$250
million on a pre-tax basis as of
August 3, 2019
.
55
ITEM 8. FINANCIAL STATEMENTS AND SUPPLEMENTARY DATA
INDEX TO FINANCIAL STATEMENTS
|
Consolidated Financial Statements
|
Page
|
|
All other schedules are omitted because they are not applicable or not required.
56
Report of Independent Registered Public Accounting Firm
To the Stockholders and Board of Directors
United Natural Foods, Inc.:
Opinions on the Consolidated Financial Statements and Internal Control Over Financial Reporting
We have audited the accompanying consolidated balance sheets of United Natural Foods, Inc. and subsidiaries (the Company) as of August 3, 2019 and July 28, 2018, the related consolidated statements of operations, comprehensive income, stockholders’ equity, and cash flows for each of the years in the three-year period ended August 3, 2019, and the related notes (collectively, the consolidated financial statements). We also have audited the Company’s internal control over financial reporting as of August 3, 2019, based on criteria established in
Internal Control - Integrated Framework
(2013)
issued by the Committee of Sponsoring Organizations of the Treadway Commission.
In our opinion, the consolidated financial statements referred to above present fairly, in all material respects, the financial position of the Company as of August 3, 2019 and July 28, 2018, and the results of its operations and its cash flows for each of the years in the three-year period ended August 3, 2019, in conformity with U.S. generally accepted accounting principles. Also in our opinion, the Company maintained, in all material respects, effective internal control over financial reporting as of August 3, 2019, based on criteria established in
Internal Control - Integrated Framework (2013)
issued by the Committee of Sponsoring Organizations of the Treadway Commission.
The Company acquired SUPERVALU Inc. (Supervalu) on October 22, 2018, and management excluded from its assessment of the effectiveness of the Company’s internal control over financial reporting as of August 3, 2019, Supervalu’s internal control over financial reporting associated with total assets of $4.4 billion (of which $923 million represents goodwill and intangible assets included within the scope of management’s assessment) and total revenues of $10.5 billion included in the consolidated financial statements of the Company as of and for the year ended August 3, 2019. Our audit of internal control over financial reporting of the Company also excluded an evaluation of the internal control over financial reporting of Supervalu.
Basis for Opinions
The Company’s management is responsible for these consolidated financial statements, for maintaining effective internal control over financial reporting, and for its assessment of the effectiveness of internal control over financial reporting, included in the accompanying Management’s Annual Report on Internal Control over Financial Reporting. Our responsibility is to express an opinion on the Company’s consolidated financial statements and an opinion on the Company’s internal control over financial reporting based on our audits. We are a public accounting firm registered with the Public Company Accounting Oversight Board (United States) (PCAOB) and are required to be independent with respect to the Company in accordance with the U.S. federal securities laws and the applicable rules and regulations of the Securities and Exchange Commission and the PCAOB.
We conducted our audits in accordance with the standards of the PCAOB. Those standards require that we plan and perform the audits to obtain reasonable assurance about whether the consolidated financial statements are free of material misstatement, whether due to error or fraud, and whether effective internal control over financial reporting was maintained in all material respects.
Our audits of the consolidated financial statements included performing procedures to assess the risks of material misstatement of the consolidated financial statements, whether due to error or fraud, and performing procedures that respond to those risks. Such procedures included examining, on a test basis, evidence regarding the amounts and disclosures in the consolidated financial statements. Our audits also included evaluating the accounting principles used and significant estimates made by management, as well as evaluating the overall presentation of the consolidated financial statements. Our audit of internal control over financial reporting included obtaining an understanding of internal control over financial reporting, assessing the risk that a material weakness exists, and testing and evaluating the design and operating effectiveness of internal control based on the assessed risk. Our audits also included performing such other procedures as we considered necessary in the circumstances. We believe that our audits provide a reasonable basis for our opinions.
Definition and Limitations of Internal Control Over Financial Reporting
A company’s internal control over financial reporting is a process designed to provide reasonable assurance regarding the reliability of financial reporting and the preparation of financial statements for external purposes in accordance with generally accepted accounting principles. A company’s internal control over financial reporting includes those policies and procedures that (1) pertain to the maintenance of records that, in reasonable detail, accurately and fairly reflect the transactions and dispositions of the assets of the company; (2) provide reasonable assurance that transactions are recorded as necessary to permit preparation of financial statements in accordance with generally accepted accounting principles, and that receipts and expenditures of the company are being made only in accordance with authorizations of management and directors of the company; and (3) provide reasonable assurance regarding prevention or timely detection of unauthorized acquisition, use, or disposition of the company’s assets that could have a material effect on the financial statements.
Because of its inherent limitations, internal control over financial reporting may not prevent or detect misstatements. Also, projections of any evaluation of effectiveness to future periods are subject to the risk that controls may become inadequate because of changes in conditions, or that the degree of compliance with the policies or procedures may deteriorate.
Critical Audit Matters
The critical audit matters communicated below are matters arising from the current period audit of the consolidated financial statements that were communicated or required to be communicated to the audit committee and that: (1) relate to accounts or disclosures that are material to the consolidated financial statements and (2) involved our especially challenging, subjective, or complex judgments. The communication of critical audit matters does not alter in any way our opinion on the consolidated financial statements, taken as a whole, and we are not, by communicating the critical audit matters below, providing separate opinions on the critical audit matters or on the accounts or disclosures to which they relate.
Evaluation of the acquisition-date fair value of customer relationship assets
As discussed in Note 4 to the consolidated financial statements, on October 22, 2018, the Company acquired Supervalu. As a result of the transaction, the Company acquired customer relationship assets representing the generation of future income from Supervalu’s existing customers. The acquisition-date fair value for the customer relationship assets was $810 million.
We identified the evaluation of the acquisition-date fair value of the Supervalu customer relationship assets as a critical audit matter due to the high degree of subjectivity in evaluating certain inputs in the discounted cash flow model used to determine the fair value of such assets. The discounted cash flow model included the following internally-developed assumptions for which there was limited observable market information, and the calculated fair value of such assets was sensitive to possible changes to these key assumptions:
|
–
|
forecasted revenues attributable to existing customers
|
|
–
|
forecasted earnings before interest, taxes, depreciation, and amortization (EBITDA) margins for the acquired business
|
|
–
|
estimated annual customer attrition rates
|
|
–
|
estimated discount rate
|
The primary procedures we performed to address this critical audit matter included the following. We tested certain internal controls over the Company’s acquisition-date valuation process, including controls over the development of the key assumptions listed above. We performed sensitivity analyses to assess the impact of reasonably possible changes to forecasted revenues, EBITDA margins, annual customer attrition rates, and the discount rate. We evaluated the forecasted revenue growth rates from existing customers by comparing the growth assumptions to those of the Company’s peers and industry reports. In connection with our assessment of the forecasts used in the valuation, we compared (1) forecasted revenue, cost of sales, and operating expense margins to Supervalu’s historical actual results and (2) estimated annual customer attrition rates to historical Supervalu customer attrition data. We tested the Company’s determined weighted average cost of capital (WACC), which was used to determine the discount rate, by comparing it to the WACC of comparable companies. In addition, we involved valuation professionals with specialized skills and knowledge, who assisted in:
|
–
|
evaluating the selected discount rate by comparing it against a discount rate range that was independently developed using publicly available market data for comparable companies, and
|
|
–
|
developing an estimate of the acquisition-date fair value of the customer relationship assets using the Company’s cash flow forecasts and the independently developed discount rate, and comparing the result to the Company’s fair value estimate.
|
Evaluation of the acquisition-date fair value of property, plant, and equipment assets
As discussed in Note 4 to the consolidated financial statements, the Supervalu acquisition resulted in the acquisition of property, plant, and equipment assets, which were recorded at fair value as of the acquisition date. The acquisition-date fair value of the acquired property, plant, and equipment was $1.2 billion.
We identified the evaluation of the acquisition-date fair value of the Supervalu property, plant, and equipment assets as a critical audit matter. A high degree of subjectivity was involved in evaluating the methodologies and certain key inputs and assumptions used to determine the acquisition-date fair values of those assets. The Company used a combination of cost and market approaches to determine the estimated fair values of such assets, which were sensitive to changes in the following key inputs and internally-developed assumptions:
|
–
|
external transactions and other information related to comparable assets
|
|
–
|
estimated replacement or reproduction costs
|
|
–
|
estimated useful lives and salvage values
|
The primary procedures we performed to address this critical audit matter included the following. We tested certain internal controls over the Company’s acquisition-date valuation process, including controls over the selection of the valuation methodologies used as well as the key inputs and assumptions listed above. In addition, we involved valuation professionals with specialized skills and knowledge, who assisted in:
|
–
|
evaluating the valuation methodologies selected
|
|
–
|
evaluating the relevance and reliability of the Company’s inputs and assumptions by comparing them to industry sources
|
|
–
|
developing estimates of the property, plant, and equipment fair values using independently obtained external information and comparing the results to the Company’s fair value estimates
|
|
–
|
performing sensitivity analyses to assess the impact of reasonably possible changes to the key inputs and assumptions on the acquisition-date fair values.
|
Evaluation of the Company’s second quarter goodwill impairment assessment
As discussed in Note 7 to the consolidated financial statements, due to a sustained decline in stock price through the second quarter, the Company determined that there was more than a 50% likelihood that the carrying value of the Supervalu wholesale reporting unit exceeded its fair value. Accordingly, the Company performed an interim quantitative impairment test of goodwill for all of its reporting units. Based on this analysis, the Company determined that the carrying value of its Supervalu wholesale reporting unit exceeded its fair value by an amount that was greater than its assigned goodwill. As a result, the Company recorded a goodwill impairment charge of $292.8 million. The goodwill impairment charge represented the impairment of all of the Supervalu wholesale reporting unit’s goodwill.
We identified the evaluation of the goodwill impairment assessment as a critical audit matter because of the high degree of subjectivity in evaluating the assumptions used to estimate the fair values of the Company’s reporting units. The reporting unit fair values were used as the basis to determine whether goodwill impairment existed in one or more of the Company’s reporting units. The fair value estimation methodologies used the following internally-developed assumptions for which there was limited observable market information, and the determined fair values were sensitive to changes to the following key assumptions:
|
–
|
forecasted reporting unit cash flows
|
|
–
|
estimated long-term growth rates
|
|
–
|
estimated discount rates
|
The primary procedures we performed to address this critical audit matter included the following. We tested certain internal controls over the Company’s quantitative impairment test process, including controls related to the development of the key assumptions listed above. We performed sensitivity analyses to assess the impact of reasonably possible changes to forecasted cash flows, long-term growth rates, and discount rates. We evaluated the Company’s forecasted growth rates by comparing the growth assumptions to those of the Company’s peers and industry reports. We compared the Company’s forecasted revenue, cost of sales, and operating expense margins to historical actual results to assess the Company’s ability to accurately forecast cash flows. We tested the Company’s determined WACC, which was used to determine the discount rates, by comparing it to the WACC of comparable companies. In addition, we involved valuation professionals with specialized skills and knowledge, who assisted in:
|
–
|
evaluating the discount rates used by the Company by comparing them against discount rate ranges that were independently developed using publicly available market data for comparable companies, and
|
|
–
|
developing an estimate of fair value for each of the Company’s reporting units, using the Company’s cash flow forecasts and the independently developed discount rates, and comparing the results to the Company’s fair value estimates.
|
Assessment of the value of the defined benefit pension obligation
As discussed in Note 14 to the consolidated financial statements, the Company sponsors defined benefit pension plans, acquired in connection with the Supervalu acquisition, covering primarily former Supervalu employees who meet certain eligibility requirements. The fair value of the defined benefit pension obligation at the date of acquisition and at year end was $2.5 billion and $2.7 billion, respectively, partially offset by plan assets totaling $2.3 billion and $2.5 billion as of the acquisition date and year end, respectively. The determination of the Company’s defined benefit pension obligation with respect to these plans is dependent, in part, on the selection of certain actuarial assumptions, including the discount rate used.
We identified the assessment of the value of the defined benefit pension obligation as a critical audit matter because of the subjectivity in evaluating the discount rates used, and the impact small changes in this assumption would have on the measurement of the defined benefit pension obligation.
The primary procedures we performed to address this critical audit matter included the following. We tested certain internal controls over the Company’s defined benefit pension obligation process, including controls related to the development of the discount rates used. We compared the methodology used in the current year to develop the discount rates to the methodology used by Supervalu in periods prior to the acquisition. In addition, we involved actuarial professionals with specialized skills and knowledge, who assisted in the evaluation of the Company’s discount rates, by understanding the methodology used by the Company and assessing the selected discount rates against publicly available discount rate benchmark information.
/s/ KPMG LLP
We have served as the Company’s auditor since 1993.
Providence, Rhode Island
October 1, 2019
57
UNITED NATURAL FOODS, INC. AND SUBSIDIARIES
CONSOLIDATED BALANCE SHEETS
(In thousands, except for per share data)
|
August 3,
2019 |
July 28,
2018 |
||||||
|
ASSETS
|
|
|
|||||
|
Cash and cash equivalents
|
$
|
42,350
|
|
$
|
23,315
|
|
|
|
Accounts receivable, net
|
1,065,699
|
|
579,702
|
|
|||
|
Inventories
|
2,089,416
|
|
1,135,775
|
|
|||
|
Prepaid expenses and other current assets
|
226,727
|
|
50,122
|
|
|||
|
Current assets of discontinued operations
|
143,729
|
|
—
|
|
|||
|
Total current assets
|
3,567,921
|
|
1,788,914
|
|
|||
|
Property and equipment, net
|
1,639,259
|
|
571,146
|
|
|||
|
Goodwill
|
442,256
|
|
362,495
|
|
|||
|
Intangible assets, net
|
1,041,058
|
|
193,209
|
|
|||
|
Deferred income taxes
|
31,087
|
|
—
|
|
|||
|
Other assets
|
107,319
|
|
48,708
|
|
|||
|
Long-term assets of discontinued operations
|
352,065
|
|
—
|
|
|||
|
Total assets
|
$
|
7,180,965
|
|
$
|
2,964,472
|
|
|
|
LIABILITIES AND STOCKHOLDERS’ EQUITY
|
|
|
|||||
|
Accounts payable
|
$
|
1,476,857
|
|
$
|
517,125
|
|
|
|
Accrued expenses and other current liabilities
|
249,426
|
|
103,526
|
|
|||
|
Accrued compensation and benefits
|
148,296
|
|
66,132
|
|
|||
|
Current portion of long-term debt and capital lease obligations
|
112,103
|
|
12,441
|
|
|||
|
Current liabilities of discontinued operations
|
122,265
|
|
—
|
|
|||
|
Total current liabilities
|
2,108,947
|
|
699,224
|
|
|||
|
Long-term debt
|
2,819,050
|
|
308,836
|
|
|||
|
Long-term capital lease obligations
|
108,208
|
|
31,487
|
|
|||
|
Pension and other postretirement benefit obligations
|
237,266
|
|
—
|
|
|||
|
Deferred income taxes
|
1,042
|
|
44,384
|
|
|||
|
Other long-term liabilities
|
393,595
|
|
34,586
|
|
|||
|
Long-term liabilities of discontinued operations
|
1,923
|
|
—
|
|
|||
|
Total liabilities
|
5,670,031
|
|
1,118,517
|
|
|||
|
Commitments and contingencies
|
|
|
|||||
|
Stockholders’ equity:
|
|
|
|||||
|
Preferred stock, $0.01 par value, authorized 5,000 shares; none issued or outstanding
|
—
|
|
—
|
|
|||
|
Common stock, $0.01 par value, authorized 100,000 shares; 53,501 shares issued and 52,886 shares outstanding at August 3, 2019; 51,025 issued and 50,411 shares outstanding shares at July 28, 2018
|
535
|
|
510
|
|
|||
|
Additional paid-in capital
|
530,801
|
|
483,623
|
|
|||
|
Treasury stock at cost
|
(24,231
|
)
|
(24,231
|
)
|
|||
|
Accumulated other comprehensive loss
|
(108,953
|
)
|
(14,179
|
)
|
|||
|
Retained earnings
|
1,115,519
|
|
1,400,232
|
|
|||
|
Total United Natural Foods, Inc. stockholders
’
equity
|
1,513,671
|
|
1,845,955
|
|
|||
|
Noncontrolling interests
|
(2,737
|
)
|
—
|
|
|||
|
Total stockholders' equity
|
1,510,934
|
|
1,845,955
|
|
|||
|
Total liabilities and stockholders
’
equity
|
$
|
7,180,965
|
|
$
|
2,964,472
|
|
|
See accompanying Notes to Consolidated Financial Statements.
58
UNITED NATURAL FOODS, INC. AND SUBSIDIARIES
CONSOLIDATED STATEMENTS OF OPERATIONS
(In thousands, except for per share data)
|
|
Fiscal Year Ended
|
||||||||||
|
|
August 3,
2019 |
July 28,
2018 |
July 29,
2017 |
||||||||
|
Net sales
|
$
|
21,387,068
|
|
$
|
10,226,683
|
|
$
|
9,274,471
|
|
||
|
Cost of sales
|
18,602,058
|
|
8,703,916
|
|
7,845,550
|
|
|||||
|
Gross profit
|
2,785,010
|
|
1,522,767
|
|
1,428,921
|
|
|||||
|
Operating expenses
|
2,629,713
|
|
1,274,562
|
|
1,196,032
|
|
|||||
|
Goodwill and asset impairment charges
|
292,770
|
|
11,242
|
|
—
|
|
|||||
|
Restructuring, acquisition and integration related expenses
|
153,539
|
|
9,738
|
|
6,864
|
|
|||||
|
Operating (loss) income
|
(291,012
|
)
|
227,225
|
|
226,025
|
|
|||||
|
Other expense (income):
|
|
|
|
||||||||
|
Net periodic benefit income, excluding service cost
|
(34,726
|
)
|
—
|
|
—
|
|
|||||
|
Interest expense, net
|
179,963
|
|
16,025
|
|
16,754
|
|
|||||
|
Other, net
|
(957
|
)
|
(1,545
|
)
|
(5,152
|
)
|
|||||
|
Total other expense, net
|
144,280
|
|
14,480
|
|
11,602
|
|
|||||
|
(Loss) income from continuing operations before income taxes
|
(435,292
|
)
|
212,745
|
|
214,423
|
|
|||||
|
(Benefit) provision for income taxes
|
(84,609
|
)
|
47,075
|
|
84,268
|
|
|||||
|
Net (loss) income from continuing operations
|
(350,683
|
)
|
165,670
|
|
130,155
|
|
|||||
|
Income from discontinued operations, net of tax
|
65,800
|
|
—
|
|
—
|
|
|||||
|
Net (loss) income including noncontrolling interests
|
(284,883
|
)
|
165,670
|
|
130,155
|
|
|||||
|
Less net (income) loss attributable to noncontrolling interests
|
(107
|
)
|
—
|
|
—
|
|
|||||
|
Net (loss) income attributable to United Natural Foods, Inc.
|
$
|
(284,990
|
)
|
$
|
165,670
|
|
$
|
130,155
|
|
||
|
Basic (loss) earnings per share:
|
|
|
|
||||||||
|
Continuing operations
|
$
|
(6.84
|
)
|
|
$
|
3.28
|
|
|
$
|
2.57
|
|
|
Discontinued operations
|
$
|
1.28
|
|
$
|
—
|
|
$
|
—
|
|
||
|
Basic (loss) income per share
|
$
|
(5.56
|
)
|
$
|
3.28
|
|
$
|
2.57
|
|
||
|
Diluted (loss) earnings per share:
|
|
|
|
||||||||
|
Continuing operations
|
$
|
(6.84
|
)
|
$
|
3.26
|
|
$
|
2.56
|
|
||
|
Discontinued operations
|
$
|
1.27
|
|
$
|
—
|
|
$
|
—
|
|
||
|
Diluted (loss) income per share
|
$
|
(5.56
|
)
|
$
|
3.26
|
|
$
|
2.56
|
|
||
|
Weighted average shares outstanding:
|
|||||||||||
|
Basic
|
51,245
|
|
50,530
|
|
50,570
|
|
|||||
|
Diluted
|
51,537
|
|
50,837
|
|
50,775
|
|
|||||
See accompanying Notes to Consolidated Financial Statements.
59
UNITED NATURAL FOODS, INC. AND SUBSIDIARIES
CONSOLIDATED STATEMENTS OF COMPREHENSIVE INCOME
(In thousands)
|
Fiscal Year Ended
|
|||||||||||
|
August 3, 2019
(53 weeks)
|
July 28, 2018
(52 weeks)
|
July 29, 2017
(52 weeks)
|
|||||||||
|
Net (loss) income including noncontrolling interests
|
$
|
(284,883
|
)
|
$
|
165,670
|
|
$
|
130,155
|
|
||
|
Other comprehensive (loss) income:
|
|
||||||||||
|
Recognition of pension and other postretirement benefit obligations, net of tax
(1)
|
(32,458
|
)
|
—
|
|
—
|
|
|||||
|
Recognition of interest rate swap cash flow hedges, net of tax
(2)
|
(61,287
|
)
|
3,575
|
|
4,879
|
|
|||||
|
Foreign currency translation adjustments
|
(1,029
|
)
|
(3,791
|
)
|
3,537
|
|
|||||
|
Total other comprehensive (loss) income
|
(94,774
|
)
|
(216
|
)
|
8,416
|
|
|||||
|
Less comprehensive (income) loss attributable to noncontrolling interests
|
(107
|
)
|
—
|
|
—
|
|
|||||
|
Total comprehensive (loss) income attributable to United Natural Foods, Inc.
|
$
|
(379,764
|
)
|
$
|
165,454
|
|
$
|
138,571
|
|
||
|
(1)
|
Amounts are net of tax (benefit) expense of
$(11.3) million
,
$0 million
and
$0 million
for the fiscal years ended
August 3, 2019
,
July 28, 2018
and
July 29, 2017
, respectively.
|
|
(2)
|
Amounts are net of tax (benefit) expense of
$(22.5) million
,
$1.5 million
and
3.2 million
for the fiscal years ended
August 3, 2019
,
July 28, 2018
and
July 29, 2017
, respectively.
|
See accompanying Notes to Consolidated Financial Statements.
60
UNITED NATURAL FOODS, INC. AND SUBSIDIARIES
CONSOLIDATED STATEMENTS OF STOCKHOLDERS’ EQUITY
(In thousands)
|
Additional
Paid-in Capital
|
Accumulated
Other
Comprehensive Loss
|
Retained Earnings
|
Total United Natural Foods, Inc.
Stockholders’ Equity
|
Noncontrolling Interests
|
Total Stockholders’ Equity
|
||||||||||||||||||||||||||||||||
|
|
Common Stock
|
Treasury Stock
|
|||||||||||||||||||||||||||||||||||
|
Shares
|
Amount
|
Shares
|
Amount
|
||||||||||||||||||||||||||||||||||
|
Balances at July 30, 2016
|
50,383
|
|
$
|
504
|
|
—
|
|
$
|
—
|
|
$
|
436,167
|
|
$
|
(22,379
|
)
|
$
|
1,105,212
|
|
$
|
1,519,504
|
|
—
|
|
$
|
1,519,504
|
|
||||||||||
|
Restricted stock vestings and stock option exercises, net
|
239
|
|
2
|
|
|
|
|
|
(1,041
|
)
|
|
|
|
|
(1,039
|
)
|
(1,039
|
)
|
|||||||||||||||||||
|
Share-based compensation
|
26,205
|
|
26,205
|
|
26,205
|
|
|||||||||||||||||||||||||||||||
|
Tax deficit associated with stock plans
|
(1,320
|
)
|
(1,320
|
)
|
(1,320
|
)
|
|||||||||||||||||||||||||||||||
|
Other comprehensive income
|
8,416
|
|
8,416
|
|
8,416
|
|
|||||||||||||||||||||||||||||||
|
Net income
|
130,155
|
|
130,155
|
|
130,155
|
|
|||||||||||||||||||||||||||||||
|
Balances at July 29, 2017
|
50,622
|
|
$
|
506
|
|
—
|
|
$
|
—
|
|
$
|
460,011
|
|
$
|
(13,963
|
)
|
$
|
1,235,367
|
|
$
|
1,681,921
|
|
$
|
—
|
|
$
|
1,681,921
|
|
|||||||||
|
Cumulative effect of change in accounting principle
|
1,314
|
|
(805
|
)
|
509
|
|
509
|
|
|||||||||||||||||||||||||||||
|
Restricted stock vestings and stock option exercises, net
|
403
|
|
4
|
|
|
|
|
|
(3,592
|
)
|
(3,588
|
)
|
(3,588
|
)
|
|||||||||||||||||||||||
|
Share-based compensation
|
25,890
|
|
25,890
|
|
25,890
|
|
|||||||||||||||||||||||||||||||
|
Repurchase of common stock
|
615
|
|
(24,231
|
)
|
(24,231
|
)
|
(24,231
|
)
|
|||||||||||||||||||||||||||||
|
Other comprehensive loss
|
(216
|
)
|
(216
|
)
|
(216
|
)
|
|||||||||||||||||||||||||||||||
|
Net income
|
165,670
|
|
165,670
|
|
165,670
|
|
|||||||||||||||||||||||||||||||
|
Balances at July 28, 2018
|
51,025
|
|
$
|
510
|
|
615
|
|
$
|
(24,231
|
)
|
$
|
483,623
|
|
$
|
(14,179
|
)
|
$
|
1,400,232
|
|
$
|
1,845,955
|
|
$
|
—
|
|
$
|
1,845,955
|
|
|||||||||
|
Cumulative effect of change in accounting principle
|
277
|
|
277
|
|
277
|
|
|||||||||||||||||||||||||||||||
|
Restricted stock vestings and stock option exercises, net
|
471
|
|
5
|
|
(2,613
|
)
|
(2,608
|
)
|
(2,608
|
)
|
|||||||||||||||||||||||||||
|
Share-based compensation
|
25,954
|
|
25,954
|
|
25,954
|
|
|||||||||||||||||||||||||||||||
|
Other comprehensive loss
|
(94,774
|
)
|
|
|
(94,774
|
)
|
(94,774
|
)
|
|||||||||||||||||||||||||||||
|
Acquisition of noncontrolling interests
|
—
|
|
(1,633
|
)
|
(1,633
|
)
|
|||||||||||||||||||||||||||||||
|
Distributions to noncontrolling interests
|
—
|
|
(1,211
|
)
|
(1,211
|
)
|
|||||||||||||||||||||||||||||||
|
Proceeds from the issuance of common stock, net
|
2,005
|
|
20
|
|
23,837
|
|
23,857
|
|
23,857
|
|
|||||||||||||||||||||||||||
|
Net (loss) income
|
(284,990
|
)
|
(284,990
|
)
|
107
|
|
(284,883
|
)
|
|||||||||||||||||||||||||||||
|
Balances at August 3, 2019
|
53,501
|
|
$
|
535
|
|
615
|
|
$
|
(24,231
|
)
|
$
|
530,801
|
|
$
|
(108,953
|
)
|
$
|
1,115,519
|
|
$
|
1,513,671
|
|
$
|
(2,737
|
)
|
$
|
1,510,934
|
|
|||||||||
See accompanying Notes to Consolidated Financial Statements.
61
UNITED NATURAL FOODS, INC. AND SUBSIDIARIES
CONSOLIDATED STATEMENTS OF CASH FLOWS
|
Fiscal Year Ended
|
|||||||||||
|
(In thousands)
|
August 3, 2019
(53 weeks)
|
July 28, 2018
(52 weeks)
|
July 29, 2017
(52 weeks)
|
||||||||
|
CASH FLOWS FROM OPERATING ACTIVITIES:
|
|
|
|
|
|||||||
|
Net (loss) income including noncontrolling interests
|
$
|
(284,883
|
)
|
|
$
|
165,670
|
|
$
|
130,155
|
|
|
|
Income from discontinued operations, net of tax
|
65,800
|
|
—
|
|
—
|
|
|||||
|
Net (loss) income from continuing operations
|
(350,683
|
)
|
165,670
|
|
130,155
|
|
|||||
|
Adjustments to reconcile net (loss) income to net cash provided by operating activities:
|
|
|
|||||||||
|
Depreciation and amortization
|
246,825
|
|
87,631
|
|
86,051
|
|
|||||
|
Share-based compensation
|
25,551
|
|
25,783
|
|
25,675
|
|
|||||
|
Loss on disposal of assets
|
2,859
|
|
2,820
|
|
943
|
|
|||||
|
Gain associated with disposal of investment
|
—
|
|
(699
|
)
|
(6,106
|
)
|
|||||
|
Closed property and other restructuring charges
|
26,875
|
|
—
|
|
640
|
|
|||||
|
Goodwill and asset impairments
|
292,770
|
|
11,242
|
|
—
|
|
|||||
|
Net pension and other postretirement benefit income
|
(34,553
|
)
|
—
|
|
—
|
|
|||||
|
Deferred income tax benefit
|
(60,798
|
)
|
(14,819
|
)
|
(1,891
|
)
|
|||||
|
LIFO charge
|
24,120
|
|
—
|
|
—
|
|
|||||
|
Change in accounting estimate
|
—
|
|
(20,909
|
)
|
—
|
|
|||||
|
Provision for doubtful accounts
|
9,749
|
|
12,006
|
|
5,728
|
|
|||||
|
Loss on debt extinguishment
|
2,903
|
|
—
|
|
—
|
|
|||||
|
Excess tax deficit from share-based payment arrangements
|
—
|
|
—
|
|
1,320
|
|
|||||
|
Non-cash interest expense
|
12,751
|
|
275
|
|
175
|
|
|||||
|
Changes in operating assets and liabilities, net of acquired businesses
|
|||||||||||
|
Accounts receivable
|
52,735
|
|
(67,283
|
)
|
(38,757
|
)
|
|||||
|
Inventories
|
177,094
|
|
(108,795
|
)
|
(6,929
|
)
|
|||||
|
Prepaid expenses and other assets
|
(43,167
|
)
|
4,473
|
|
(6,383
|
)
|
|||||
|
Accounts payable
|
(40,149
|
)
|
3,961
|
|
82,772
|
|
|||||
|
Accrued expenses, other liabilities and other
|
(169,760
|
)
|
7,682
|
|
(62
|
)
|
|||||
|
Net cash provided by operating activities of continuing operations
|
175,122
|
|
|
109,038
|
|
273,331
|
|
||||
|
Net cash provided by operating activities of discontinued operations
|
109,408
|
|
—
|
|
—
|
|
|||||
|
Net cash provided by operating activities
|
284,530
|
|
109,038
|
|
273,331
|
|
|||||
|
CASH FLOWS FROM INVESTING ACTIVITIES:
|
|
|
|
|
|||||||
|
Capital expenditures
|
(207,817
|
)
|
(44,608
|
)
|
(56,112
|
)
|
|||||
|
Purchases of acquired businesses, net of cash acquired
|
(2,292,435
|
)
|
(39
|
)
|
(9,207
|
)
|
|||||
|
Proceeds from dispositions of assets
|
173,747
|
|
283
|
|
168
|
|
|||||
|
Proceeds from disposal of investments
|
—
|
|
756
|
|
9,192
|
|
|||||
|
Payments for long-term investment
|
(110
|
)
|
(3,397
|
)
|
(2,000
|
)
|
|||||
|
Payment of company owned life insurance premiums
|
(170
|
)
|
—
|
|
(2,000
|
)
|
|||||
|
Net cash used in investing activities of continuing operations
|
(2,326,785
|
)
|
|
(47,005
|
)
|
(59,959
|
)
|
||||
|
Net cash provided by investing activities of discontinued operations
|
67,998
|
|
—
|
|
—
|
|
|||||
|
Net cash used in investing activities
|
(2,258,787
|
)
|
(47,005
|
)
|
(59,959
|
)
|
|||||
|
CASH FLOWS FROM FINANCING ACTIVITIES:
|
|
|
|
|
|||||||
|
Proceeds from borrowings of long-term debt
|
1,926,642
|
|
—
|
|
—
|
|
|||||
|
Proceeds from borrowings under revolving credit line
|
3,971,504
|
|
556,061
|
|
215,662
|
|
|||||
|
Proceeds from issuance of other loans
|
22,358
|
|
—
|
|
—
|
|
|||||
|
Repayments of borrowings under revolving credit line
|
(3,101,679
|
)
|
(569,671
|
)
|
(418,693
|
)
|
|||||
|
Repayments of long-term debt and capital lease obligations
|
(779,909
|
)
|
(12,128
|
)
|
(11,546
|
)
|
|||||
|
Repurchase of common stock
|
—
|
|
(24,231
|
)
|
—
|
|
|||||
|
Proceeds from the issuance of common stock and exercise of stock options
|
23,975
|
|
975
|
|
274
|
|
|||||
|
Payment of employee restricted stock tax withholdings
|
(2,727
|
)
|
(4,563
|
)
|
(1,313
|
)
|
|||||
|
Excess tax deficit from share-based payment arrangements
|
—
|
|
—
|
|
(1,320
|
)
|
|||||
|
Payments for debt issuance costs
|
(62,600
|
)
|
—
|
|
(180
|
)
|
|||||
|
Net cash provided by (used in) financing activities of continuing operations
|
1,997,564
|
|
(53,557
|
)
|
(217,116
|
)
|
|||||
|
Net cash used in by financing activities of discontinued operations
|
(1,212
|
)
|
—
|
|
—
|
|
|||||
|
Net cash provided by (used in) financing activities
|
1,996,352
|
|
|
(53,557
|
)
|
(217,116
|
)
|
||||
|
EFFECT OF EXCHANGE RATE ON CASH
|
(143
|
)
|
|
(575
|
)
|
565
|
|
||||
62
|
NET INCREASE (DECREASE) IN CASH AND CASH EQUIVALENTS
|
21,952
|
|
|
7,901
|
|
(3,179
|
)
|
||||
|
Cash and cash equivalents at beginning of period
|
23,315
|
|
|
15,414
|
|
18,593
|
|
||||
|
Cash and cash equivalents at end of period
|
45,267
|
|
23,315
|
|
15,414
|
|
|||||
|
Less: cash and cash equivalents of discontinued operations
|
(2,917
|
)
|
—
|
|
—
|
|
|||||
|
Cash and cash equivalents of continuing operations
|
$
|
42,350
|
|
$
|
23,315
|
|
$
|
15,414
|
|
||
|
Supplemental disclosures of cash flow information:
|
|
|
|
|
|||||||
|
Cash paid for interest
|
$
|
183,042
|
|
|
$
|
16,471
|
|
$
|
17,115
|
|
|
|
Cash paid for federal and state income taxes, net of refunds
|
$
|
77,676
|
|
|
$
|
64,042
|
|
$
|
78,984
|
|
|
See accompanying Notes to Consolidated Financial Statements.
63
UNITED NATURAL FOODS, INC. AND SUBSIDIARIES
NOTES TO CONSOLIDATED FINANCIAL STATEMENTS
NOTE 1—SIGNIFICANT ACCOUNTING POLICIES
Nature of Business
United Natural Foods, Inc. and its subsidiaries (the “Company”, “we”, “us”, or “our”) is a leading distributor of
natural, organic, specialty, produce, and conventional grocery and non-food products, and provider of support services in the United States and Canada
. On October 22, 2018, we acquired all of the outstanding equity securities of SUPERVALU INC. (“Supervalu”); refer to
Note 4—Acquisitions
for further information. The Company sells its products primarily throughout the United States and Canada.
Fiscal Year
Our fiscal years end on the Saturday closest to July 31 and contain either 52 or 53 weeks. References to fiscal 2019 or 2019, as presented in tabular disclosure, fiscal 2018 or 2018, and fiscal 2017 or 2017, relate to the 53-week, 52-week and 52-week fiscal periods ended
August 3, 2019
,
July 28, 2018
and
July 29, 2017
, respectively.
Basis of Presentation
The accompanying Consolidated Financial Statements include the accounts of the Company and its wholly and majority-owned subsidiaries. The Consolidated Financial Statements are prepared in conformity with accounting principles generally accepted in the United States (“GAAP”). All significant intercompany transactions and balances have been eliminated in consolidation, with the exception of sales transactions from continuing to discontinued operations for wholesale supply discussed further in
Note 3—Revenue Recognition
. Unless otherwise indicated, references to the Consolidated Statements of Operations and the Consolidated Balance Sheets in the Notes to the Consolidated Financial Statements exclude all amounts related to discontinued operations. Refer to
Note 19—Discontinued Operations
for additional information, including accounting policies, about the Company’s discontinued operations.
Net Sales
Net sales consist primarily of sales of conventional, natural, organic, specialty, and produce grocery and non-food products, and provision of support services to retailers,
adjusted for customer volume discounts, vendor incentives when applicable, returns and allowances, and professional services revenue
. Net sales also include amounts charged by the Company to customers for shipping and handling, and fuel surcharges. Vendor incentives do not reduce sales in circumstances where the vendor tenders the incentive to the customer, when the incentive is not a direct reimbursement from a vendor, when the incentive is not influenced by or negotiated in conjunction with any other incentive arrangements and when the incentive is not subject to an agency relationship with the vendor, whether expressed or implied. Refer to
Note 3—Revenue Recognition
for additional information regarding the Company’s revenue recognition policies.
Cost of Sales
Cost of sales consist primarily of amounts paid to suppliers for product sold, plus transportation costs necessary to bring the product to, or move product between, the Company’s distribution facilities, offset by consideration received from suppliers in connection with the purchase, transportation, or promotion of the suppliers’ products. Cost of sales also includes production and labor costs for the Company’s Woodstock Farms manufacturing business.
The Company receives allowances and credits from vendors for buying activities, such as volume incentives, promotional allowances directed by the Company to customers, cash discounts, and new product introductions (collectively referred to as “vendor funds”), which are typically based on contractual arrangements covering a period of one year or less. The Company recognizes vendor funds for merchandising activities as a reduction of Cost of sales when the related products are sold, unless it has been determined that a discrete identifiable benefit has been provided to the vendor, in which case the related amounts are recognized within Net sales. Vendor funds that have been earned as a result of completing the required performance under the terms of the underlying agreements but for which the product has not yet been sold are recognized as a reduction to the cost of inventory. When payments or rebates can be reasonably estimated and it is probable that the specified target will be met, the payment or rebate is accrued. However, when attaining the milestone is not probable, the payment or rebate is recognized only when and if the milestone is achieved. Any upfront payments received for multi-period contracts are generally deferred and
64
amortized over the life of the contracts. The majority of the vendor fund contracts have terms of less than a year, with a small proportion of the contracts longer than one year.
Shipping and Handling Fees and Costs
The Company includes shipping and handling fees billed to customers in net sales. Shipping and handling costs associated with inbound freight are recorded in Cost of sales, whereas shipping and handling costs for receiving, selecting, quality assurance, and outbound transportation are recorded in Operating expenses. Outbound shipping and handling costs, including allocated employee benefit expenses that are recorded in Operating expenses, totaled
$1,298.9 million
,
$582.9 million
and
$517.2 million
for
fiscal 2019
,
2018
, and
2017
, respectively.
Operating Expenses and Other Expenses
Operating expenses include salaries and wages, employee benefits, warehousing and delivery, selling, occupancy, insurance, administrative, share-based compensation, depreciation, and amortization expense.
Other expense (income), net includes interest on outstanding indebtedness, including direct financing and capital lease obligations, net periodic benefit plan income, excluding service costs, interest income and miscellaneous income and expenses.
Use of Estimates
The preparation of Consolidated Financial Statements in conformity with GAAP requires management to make estimates and assumptions that affect amounts reported therein. Due to the inherent uncertainty involved in making estimates, actual results reported in future periods may be based on amounts that differ from those estimates.
Change in Accounting Estimate
As a result of growth in net sales and inventory in fiscal 2018, and the changes in processing and the resulting increase in the Company’s estimate of its accrual for inventory purchases, the Company initiated a review of its vendor invoicing processes and undertook a review of its estimate of its accrual for inventory purchases. In the third quarter of fiscal 2018, the Company finalized its analysis and review of its accrual for inventory purchases, including a historical data analysis of unmatched and partially matched amounts that were aged greater than twelve months and the ultimate resolution of such aged accruals. Based on its analysis, the Company determined that it could reasonably estimate the outcome of its partially matched vendor invoices upon receipt of such invoice rather than when the amount was aged greater than twelve months and a liability was no longer considered probable. As a result of this change in estimate, Accounts payable was reduced by
$20.9 million
, resulting in an increase to net income of
$13.9 million
, or
$0.27
per diluted share, for fiscal 2018.
Change in Inventory Accounting Policy
Inventories are valued at the lower of cost or market. Prior to fiscal 2019, inventory cost was determined using the first-in, first-out (“FIFO”) method. For a substantial portion of legacy Supervalu inventory, cost was determined using the last-in, first-out (“LIFO”) method, with the rest primarily determined using FIFO. Inventories acquired as part of the Supervalu acquisition were recorded at their fair market values as of the acquisition date. During the second quarter of fiscal 2019, the Company completed its evaluation of its combined inventory accounting policies and changed its method of inventory costing for certain historical United Natural Foods, Inc. inventory from the FIFO accounting method to the LIFO accounting method. The Company concluded that the LIFO method of inventory costing is preferable because it allows for better matching of costs and revenues, as historical inflationary inventory acquisition prices are expected to continue in the future and the LIFO method uses the current acquisition cost to value cost of goods sold as inventory is sold. Additionally, LIFO allows for better comparability of the results of the Company’s operations with those of similar companies in its peer group. As a result of the change to the LIFO method, certain Company inventories, excluding Supervalu inventories, were reduced by
$15.0 million
for fiscal 2019, which resulted in increases to Cost of sales and Loss from continuing operations before income taxes of the same amount in the Consolidated Statements of Operations for fiscal 2019. This resulted in an increase to Net loss from continuing operations of
$11.0 million
, or
$0.21
per diluted share, for fiscal 2019. The Company has not retrospectively adjusted amounts prior to fiscal 2019 in its Consolidated Balance Sheets or Consolidated Statements of Operations, as applying the change in accounting policy prior to fiscal 2019 is not practicable due to data limitations of inventory costs in prior periods.
65
Change in Book Overdraft Accounting Policy
In the first quarter of fiscal 2019, the Company changed its accounting policy for reporting book overdrafts in the Consolidated Statements of Cash Flows. Amounts previously reported as increase in bank overdrafts on the Consolidated Statements of Cash Flows represent outstanding checks issued but not yet presented to financial institutions for disbursement in excess of positive balances held at financial institutions, and as such represent book overdrafts. Book overdrafts are included within the Accounts payable balance in the Consolidated Balance Sheets. The change in these book overdraft amounts were previously reported as financing activities cash flows on the Consolidated Statements of Cash Flows, on a line item titled Increase in bank overdrafts. The Company has elected a preferable accounting policy presentation for classifying the change in book overdrafts from financing activities to operating activities, which resulted in the reclassification of prior period amounts to conform to the current period presentation. The Company concluded that operating activity classification is preferable, as book overdrafts do not result in financial institution borrowing or repayment activity at the end of respective reporting periods and the presentation presents a more accurate disclosure of its cash generation and consumption activities. The reclassification resulted in decreases to cash provided by operating activities of
$0.4 million
and
$7.4 million
, and corresponding decreases in cash used in financing activities for fiscal 2018 and 2017, respectively. The reclassification had no effect on previously reported Consolidated Balance Sheets, Consolidated Statements of Operations or Consolidated Statements of Stockholders’ Equity.
Reclassifications
Certain prior year amounts within the Consolidated Balance Sheets, Consolidated Statements of Operations, Consolidated Statements of Stockholder’s Equity and Consolidated Statements of Cash Flows have been reclassified to conform to the current period’s presentation.
Reclassifications of prior year amounts within the Consolidated Balance Sheets include:
|
•
|
the reclassification of Accrued compensation and benefits to present separately from Accrued expenses and other current liabilities;
|
|
•
|
the reclassification of Notes payable balances into Long-term debt;
|
|
•
|
the reclassification of the long-term portion of capital lease obligations from Long-term debt to present separately within Long-term capital lease obligations; and
|
|
•
|
the reclassification of residual financing obligations of
$7.4 million
associated with build-to-suit properties for which the Company is not obligated to fund unless it is obligated under a future extension of a lease agreement from the Long-term capital lease obligations to Other long-term liabilities.
|
Reclassifications of prior year amounts within the Consolidated Statements of Operations include:
|
•
|
the reclassification of goodwill and asset impairment charges of
$11.2 million
from a line item previously titled Restructuring and asset impairment charges to a new line item titled
Goodwill and asset impairment charges
;
|
|
•
|
the reclassification of acquisition costs previously included within Operating expenses of
$5.0 million
to a new line item titled
Restructuring, acquisition and integration related expenses
; and
|
|
•
|
the combination of Interest expense and Interest income to present the same amounts within Interest expense, net.
|
Within the Consolidated Statements of Cash Flows, prior year amounts for asset impairment charges have been reclassified within operating activities in a line item titled Goodwill and asset impairment charges. These reclassifications had no impact on reported net income, cash flows, or total assets and liabilities.
Cash and Cash Equivalents
Cash equivalents consist of highly liquid investments with original maturities of
three
months or less. Our banking arrangements allow us to fund outstanding checks when presented to the financial institution for payment. We fund all intraday bank balance overdrafts during the same business day. Checks outstanding in excess of bank balances create book overdrafts, which are recorded in Accounts payable in the Consolidated Balance Sheets and are reflected as an operating activity in the Consolidated Statements of Cash Flows. As of August 3, 2019 and July 28, 2018, we had net book overdrafts of
$236.9 million
and
$115.8 million
, respectively.
66
Accounts Receivable, Net
Accounts receivable primarily consist of trade receivables from customers and net receivable balances from suppliers. In determining the adequacy of the allowances, management analyzes customer creditworthiness, aging of receivables, payment terms, the value of the collateral, customer financial statements, historical collection experience, aging of receivables and other economic and industry factors. In instances where a reserve has been recorded for a particular customer, future sales to the customer are conducted using either cash-on-delivery terms, or the account is closely monitored so that as agreed upon payments are received, orders are released; a failure to pay results in held or canceled orders.
Inventories
Inventories consist primarily of finished goods and are valued at the lower of cost or net realizable value, with cost primarily being determined using the LIFO method, and under FIFO for inventories such as perishables and other inventory. Allowances for vendor funds received from suppliers are recorded as a reduction to Inventories and subsequently within Cost of sales upon the sale of the related products. As of August 3, 2019, approximately
$1.6 billion
of
inventory was valued under the LIFO method and primarily included grocery, frozen food and general merchandise products, with the remaining inventory valued under the FIFO method and primarily included meat, dairy and deli products.
Property and Equipment, Net
Property and equipment are stated at cost, less accumulated depreciation and amortization. Depreciation expense is based on the estimated useful lives of the assets using the straight-line method. Applicable interest charges incurred during the construction of new facilities are capitalized as one of the elements of cost and are amortized over the assets’ estimated useful lives if certain criteria are met. Refer to
Note 6—Property and Equipment
for additional information.
Capital lease assets are stated at the lower of the present value of minimum lease payments at the inception of the lease or the fair value of the asset. Property and equipment includes the non-cash expenditures made by the landlord for the Aurora, Colorado and Moreno Valley, California distribution centers, and office Corporate headquarters office space in Providence, Rhode Island. Refer to
Note 12—Leases
for additional information.
The Company
reviews long-lived assets for indicators of impairment whenever events or changes in circumstances indicate that the carrying value of the assets may not be recoverable. Cash flows expected to be generated by the related assets are estimated over the assets’ useful lives based on updated projections. If the evaluation indicates that the carrying amount of an asset may not be recoverable, the potential impairment is measured based on a fair value discounted cash flow model or a market approach method.
Income Taxes
The Company accounts for income taxes under the asset and liability method. Under the asset and liability method, deferred tax assets and liabilities are recognized for the future tax consequences attributable to differences between the financial statement carrying amounts of existing assets and liabilities and their respective tax bases. Deferred tax assets and liabilities are measured using enacted tax rates expected to apply to taxable income in the years in which those temporary differences are expected to be recovered or settled. The effect on deferred tax assets and liabilities of a change in tax rates is recognized in income in the period that includes the enactment date.
The Company records liabilities to address uncertain tax positions we have taken in previously filed tax returns or that we expect to take in a future tax return. The determination for required liabilities is based upon an analysis of each individual tax position, taking into consideration whether it is more likely than not that our tax position, based on technical merits, will be sustained upon examination. For those positions for which we conclude it is more likely than not it will be sustained, we recognize the largest amount of tax benefit that is greater than
50%
likely of being realized upon ultimate settlement with the taxing authority. The difference between the amount recognized and the total tax position is recorded as a liability. The ultimate resolution of these tax positions may be greater or less than the liabilities recorded.
The Company allocates tax expense among specific financial statement components using a “with-or-without” approach. Under this approach, the Company first determines the total tax expense or benefit (current and deferred) for the period. The Company then calculates the tax effect of pretax income from continuing operations only. The residual tax expense is allocated on a proportional basis to other financial statement components (i.e. discontinued operations, other comprehensive income).
67
Goodwill
We account for acquired businesses using the purchase method of accounting, which requires that the assets acquired and liabilities assumed be recorded at the acquisition date at their respective estimated fair values. Goodwill represents the excess acquisition cost over the fair value of net assets acquired in a business combination. Goodwill is assigned to the reporting units that are expected to benefit from the synergies of the business combination that generated the goodwill. Goodwill reporting units at or one level below the operating segment level, and are evaluated for events or changes in circumstances indicating a goodwill reporting unit has changed. Relative fair value allocations are performed when components of an aggregated goodwill reporting unit become separate reporting units. Refer to
Note 7—Goodwill and Intangible Assets
for additional information regarding the Company’s fiscal 2019 impairment reviews, changes to its reporting units and other information. Refer to
Note 4—Acquisitions
for further detail on the valuation of goodwill and intangible assets related to specific acquisitions.
Intangible Assets, Net
Indefinite-lived intangible assets include a branded product line asset group and a Tony’s Fine Foods (“Tony’s”) tradename. Indefinite-lived intangible assets are reviewed for impairment at least annually as of the first day of the fourth fiscal quarter and if events occur or circumstances change that would indicate that the value of the asset may be impaired. The Company performed a qualitative review of its indefinite lived intangible assets in fiscal 2019, which indicated a quantitative assessment was not required. During fiscal 2018, the Company performed its annual qualitative assessment of its indefinite lived intangible assets and determined that a quantitative analysis was required for the Tony’s tradename. Based on the results of its quantitative test performed, the Company determined that the fair value was in excess of its carrying value and no impairment existed.
In determining the estimated fair value for intangible assets, we typically utilize the income approach, which discounts the projected future net cash flow using an appropriate discount rate that reflects the risks associated with such projected future cash flow. Refer to
Note 7—Goodwill and Intangible Assets
and
Note 4—Acquisitions
for additional information on the Company’s intangible assets.
The Company performs qualitative assessments of goodwill and indefinite lived intangibles assets for impairment. If the qualitative assessment indicates it is more likely than not that a reporting unit’s or intangible asset’s fair value is less than the carrying value, or the Company bypasses the qualitative assessment, a quantitative assessment would be performed.
The Company reviews long-lived assets, including definite-lived intangible assets, for indicators of impairment whenever events or changes in circumstances indicate that the carrying value of the assets may not be recoverable. Cash flows expected to be generated by the related assets are estimated over the assets’ useful lives based on updated projections. If the evaluation indicates that the carrying amount of an asset may not be recoverable, the potential impairment is measured based using the income approach. The Company groups long-lived assets with other assets at the lowest level for which identifiable cash flows are largely independent of the cash flows of other assets.
Intangible assets with definite lives are amortized on a straight-line basis over the following lives:
|
Customer relationships
|
7-20 years
|
|
Non-competition agreements
|
1-10 years
|
|
Trademarks and tradenames
|
2-10 years
|
|
Leases in place
|
1-9 years
|
|
Favorable operating leases
|
2-25 years
|
|
Unfavorable operating leases
|
2-25 years
|
|
Pharmacy prescription files
|
5-7 years
|
Business Dispositions
The Company reviews the presentation of planned business dispositions in the Consolidated Financial Statements based on the available information and events that have occurred. The review consists of evaluating whether the business meets the definition of a component for which the operations and cash flows are clearly distinguishable from the other components of the business, and if so, whether it is anticipated that after the disposal the cash flows of the component would be eliminated from continuing operations and whether the disposition represents a strategic shift that has a major effect on operations and financial results. In addition, the Company evaluates whether the business has met the criteria as a business held for sale. In order for a planned disposition to be classified as a business held for sale, the established criteria must be met as of the reporting date, including an active program to market the business and the expected disposition of the business within one year.
68
Planned business dispositions are presented as discontinued operations when all the criteria described above are met. Operations of the business components meeting the discontinued operations requirements are presented within Income from discontinued operations, net of tax in the Consolidated Statements of Operations, and assets and liabilities of the business component planned to be disposed of are presented as separate lines within the Consolidated Balance Sheets. See
Note 19—Discontinued Operations
for additional information.
The carrying value of the business held for sale is reviewed for recoverability upon meeting the classification requirements. Evaluating the recoverability of the assets of a business classified as held for sale follows a defined order in which property and intangible assets subject to amortization are considered only after the recoverability of goodwill, indefinite lived intangible assets and other assets are assessed. After the valuation process is completed, the held for sale business is reported at the lower of its carrying value or fair value less cost to sell, and no additional depreciation or amortization expense is recognized.
There are inherent judgments and estimates used in determining the fair value less costs to sell of a business and any impairment charges. The sale of a business can result in the recognition of a gain or loss that differs from that anticipated prior to closing.
Investments
The Company has long term investments in unconsolidated entities, which it accounts for using either the cost method or the equity method of accounting. Investments in which the Company cannot exercise significant influence over the operating and financial policies of the investee are recorded at their historical cost. Investments where the Company has the ability to exercise significant influence over the investee are accounted for using the equity method, with income or loss attributable to the Company from the investee adjusting the carrying value of the investment and recorded in the Company’s Consolidated Statements of Operations. The carrying values of both cost and equity method investments were not material for
fiscal 2019
or
2018
, either individually or in the aggregate, and are included within Other assets in the Consolidated Balance Sheets. Income attributable to investments accounted for using the equity method is not material for
fiscal 2019
,
2018
, or
2017
, and is recorded in Other, net, within the Consolidated Statements of Operations.
On May 24, 2017, the Company sold its stake in Kicking Horse Coffee, a Canadian roaster and marketer of organic and fair trade coffee, which was accounted for using the cost method of accounting. As a result of the sale, the Company recognized a pre-tax gain of
$6.1 million
in fiscal 2017, which is included in Other, net in the Consolidated Statements of Operations.
Fair Value of Financial Instruments
Financial assets and liabilities measured on a recurring basis, and non-financial assets and liabilities that are recognized on a non-recurring basis, are recognized or disclosed at fair value on at least an annual basis. Fair value is defined as the price that would be received from selling an asset or paid to transfer a liability in an orderly transaction between market participants at the measurement date. When determining the fair value measurements for assets and liabilities required or permitted to be recorded at fair value, the Company considers the principal or most advantageous market in which it would transact and considers assumptions that market participants would use when pricing the asset or liability, such as inherent risk, transfer restrictions, and risk of nonperformance. ASC 820 establishes a fair value hierarchy that requires an entity to maximize the use of observable inputs and minimize the use of unobservable inputs when measuring fair value. ASC 820 establishes three levels of inputs that may be used to measure fair value:
|
•
|
Level 1 Inputs—Unadjusted quoted prices in active markets for identical assets or liabilities.
|
|
•
|
Level 2 Inputs—Inputs other than quoted prices included in Level 1 that are either directly or indirectly observable through correlation with market data. These include quoted prices for similar assets or liabilities in active markets; quoted prices for identical or similar assets or liabilities in markets that are not active; and inputs to valuation models or other pricing methodologies that do not require significant judgment because the inputs used in the model, such as interest rates and volatility, can be corroborated by readily observable market data.
|
|
•
|
Level 3 Inputs—One or more significant inputs that are unobservable and supported by little or no market activity, and that reflect the use of significant management judgment. Level 3 assets and liabilities include those whose fair value measurements are determined using pricing models, discounted cash flow methodologies or similar valuation techniques, and significant management judgment or estimation.
|
The carrying amounts of the Company’s financial instruments including cash and cash equivalents, accounts receivable, accounts payable and certain accrued expenses and other assets and liabilities approximate fair value due to the short-term nature of these instruments.
69
Share-Based Compensation
Share-based compensation consists of restricted stock units, performance units, stock options and Supervalu replacement awards. Share-based compensation expense is measured by the fair value of the award on the date of grant. The Company recognizes share-based compensation expense on a straight-line basis over the requisite service period of the individual grants. Forfeitures are recognized as reductions to share-based compensation when they occur. The grant date closing price per share of the Company’s stock is used to determine the fair value of restricted stock units. Supervalu Replacement Awards are liability classified awards as they may ultimately be settled in cash or shares at the discretion of the employee. The Company’s Chief Executive Officer and Chairman and other executive officers and members of senior management have been granted performance units which vest, when and if earned, in accordance with the terms of the related performance unit award agreements. The Company recognizes share-based compensation expense based on the target number of shares of common stock and the Company’s stock price on the date of grant and subsequently adjusts expense based on actual and forecasted performance compared to planned targets. Stock options are granted at exercise prices equal to the fair market value of the Company’s stock at the dates of grant. The fair value of stock option grants is estimated at the date of grant using the Black-Scholes option pricing model. Black-Scholes utilizes assumptions related to volatility, the risk-free interest rate, the dividend yield and expected life. Expected volatilities utilized in the model are based on the historical volatility of the Company’s stock price. The risk-free interest rate is derived from the U.S. Treasury yield curve in effect at the time of grant. The model incorporates exercise and post-vesting forfeiture assumptions based on an analysis of historical data. The expected term is derived from historical information and other factors. Share-based compensation expense is recognized within
Operating expenses
for ongoing employees and is recorded within
Restructuring, acquisition and integration related expenses
when an employee is notified of termination and their awards become accelerated. Refer to
Note 13—Share-Based Awards
for additional information.
Benefit Plans
The Company recognizes the funded status of its company-sponsored defined benefit plans, which it assumed in the first quarter of fiscal 2019 through the acquisition of Supervalu, in the Consolidated Balance Sheets and gains or losses and prior service costs or credits not yet recognized as a component of Accumulated other comprehensive loss, net of tax, in the Consolidated Balance Sheets. The Company measures its defined benefit pension and other postretirement plan obligations as of the nearest calendar month end. The Company records net periodic benefit income or expense related to interest cost, expected return on plan assets and the amortization of actuarial gains and losses, excluding service costs, in the Consolidated Statements of Operations within Total other expense, net. Service costs are recorded in Operating expenses in the Consolidated Statements of Operations.
The Company sponsors pension and other postretirement plans in various forms covering participants who meet eligibility requirements. The determination of the Company’s obligation and related income or expense for Company-sponsored pension and other postretirement benefits is dependent, in part, on management’s selection of certain actuarial assumptions in calculating these amounts. These assumptions include, among other things, the discount rate, the expected long-term rate of return on plan assets and the rates of increase in healthcare costs. These assumptions are disclosed in
Note 14—Benefit Plans
. Actual results that differ from the assumptions are accumulated and amortized over future periods.
The Company contributes to various multiemployer pension plans under collective bargaining agreements, primarily defined benefit pension plans. Pension expense for these plans is recognized as contributions are funded. See
Note 14—Benefit Plans
for additional information on participation in multiemployer plans.
Earnings Per Share
Basic earnings per share is calculated by dividing net (loss) income by the weighted average number of common shares outstanding during the period. Diluted earnings per share is calculated by adding the dilutive potential common shares to the weighted average number of common shares that were outstanding during the period. For purposes of the diluted earnings per share calculation, outstanding stock options, restricted stock units and performance-based awards, if applicable, are considered common stock equivalents, using the treasury stock method.
Treasury Stock
The Company records the repurchase of shares of common stock at cost based on the settlement date of the transaction. These shares are classified as treasury stock, which is a reduction to stockholders’ equity. Treasury stock is included in authorized and issued shares but excluded from outstanding shares.
70
On October 6, 2017, the Company announced that its Board of Directors authorized a share repurchase program for up to
$200.0 million
of the Company’s outstanding common stock. The repurchase program is scheduled to expire upon the Company’s repurchase of shares of the Company’s common stock having an aggregate purchase price of
$200.0 million
. The Company repurchased
614,660
shares of its common stock at an aggregate cost of
$24.2 million
in fiscal 2018. The Company did
no
t repurchase any shares of its common stock in fiscal 2019.
Comprehensive Income (Loss)
Comprehensive income (loss) is reported in the Consolidated Statements of Comprehensive Income. Comprehensive income (loss) includes all changes in stockholders’ equity during the reporting period, other than those resulting from investments by and distributions to stockholders. Our comprehensive income is calculated as
Net (loss) income including noncontrolling interests
, plus or minus adjustments for foreign currency translation related to the translation of UNFI Canada, Inc. (“UNFI Canada”) from the functional currency of Canadian dollars to U.S. dollar reporting currency, changes in the fair value of cash flow hedges, net of tax, and changes in defined pension and other postretirement benefit plan obligations, net of tax, less comprehensive income attributable to noncontrolling interests.
Accumulated other comprehensive loss represents the cumulative balance of other comprehensive (loss) income, net of tax, as of the end of the reporting period and relates to foreign current translation adjustments, and unrealized gains or losses on cash flow hedges, net of tax and changes in defined pension and other postretirement benefit plan obligations, net of tax.
Derivative Financial Instruments
The Company is exposed to market risks arising from changes in interest rates, fuel costs, and with the operation of UNFI Canada, foreign currency exchange rates. The Company uses derivatives principally in the management of interest rate and fuel price exposure. From time to time the Company may use contracts to hedge transactions in foreign currency. The Company does not utilize derivatives that contain leverage features. For derivative transactions accounted for as hedges, on the date the Company enters into the derivative transaction, the exposure is identified. The Company formally documents all relationships between hedging instruments and hedged items, as well as its risk-management objective and strategy for undertaking the hedge transaction. In this documentation, the Company specifically identifies the asset, liability, firm commitment, forecasted transaction, or net investment that has been designated as the hedged item and states how the hedging instrument is expected to reduce the risks related to the hedged item. The Company measures effectiveness of its hedging relationships both at hedge inception and on an ongoing basis as needed.
Self-Insurance Liabilities
The Company is primarily self-insured for workers’ compensation, general and automobile liability insurance. It is the Company’s policy to record the self-insured portion of workers’ compensation, general and automobile liabilities based upon actuarial methods to estimate the future cost of claims and related expenses that have been reported but not settled, and that have been incurred but not yet reported, discounted at a risk-free interest rate. The present value of such claims was calculated using discount rates ranging from
1.9 percent
to
3.0 percent
.
Changes in our insurance liabilities consisted of the following:
|
(in thousands)
|
2019
|
2018
|
2017
|
||||||||
|
Beginning balance
|
$
|
24,703
|
|
$
|
22,776
|
|
$
|
20,109
|
|
||
|
Assumed liabilities from the Supervalu acquisition
|
55,213
|
|
—
|
|
—
|
|
|||||
|
Expense
|
42,764
|
|
14,274
|
|
13,740
|
|
|||||
|
Claim payments
|
(33,087
|
)
|
(12,347
|
)
|
(11,073
|
)
|
|||||
|
Reclassifications
|
(755
|
)
|
—
|
|
—
|
|
|||||
|
Ending balance
|
$
|
88,838
|
|
$
|
24,703
|
|
$
|
22,776
|
|
||
The current portion of self-insurance liabilities is included in
Accrued expenses and other current liabilities
and the long-term portion is included in
Other long-term liabilities
in the Consolidated Balance Sheets. The insurance liabilities as of the end of the fiscal year are net of discounts of
$6.6 million
and
$1.3 million
as of
August 3, 2019
and
July 28, 2018
, respectively. Amounts due from insurance companies were
$11.1 million
as of
August 3, 2019
.
71
Operating Lease Expense
The Company records lease expense and income using the straight-line method within Operating expenses. For leases with step rent provisions whereby the rental payments increase over the life of the lease, and for leases where the Company receives rent-free periods, the Company recognizes expense and income based on a straight-line basis based on the total minimum lease payments to be made over the expected lease term. Deferred rent obligations are included in Other current liabilities and Other long-term liabilities in the Consolidated Balance Sheets.
For contractual obligations on properties where we remain the primary obligor upon assignment of the lease and do not obtain a release from landlords or retain the equity interests in the legal entities with the related rent contracts, the Company continues to recognize rent expense and rent income. In addition, the Company continues to recognize contractual obligations and receipts on a gross basis, such that the related lease obligation to the landlord is presented separately from the sublease created by the lease assignment to the assignee. As a result, the Company continues to recognize on its Consolidated Balance Sheets the carrying value of capital lease assets and obligations, and property and equipment where the Company determined it was the accounting owner pursuant to a lease agreement.
Reserves for Closed Properties
The Company maintains reserves for costs associated with closures of retail stores, distribution centers and other properties that are no longer being utilized in current operations. We calculate closed property operating lease liabilities using a discount rate to calculate the present value of the remaining noncancellable lease payments after the closing date, reduced by estimated subtenant rentals that could be reasonably obtained for the property. Lease reserve impairment charges are recorded as a component of
Restructuring, acquisition and integration related expenses
in the Consolidated Statements of Operations.
The closed property lease liabilities are usually paid over the remaining lease terms, which generally range from
one
to
12 years
. Adjustments to closed property reserves primarily relate to changes in subtenant income or actual exit costs differing from original estimates. Adjustments are made for changes in estimates in the period in which the changes become known.
The calculation of the closed property charges requires significant judgments and estimates, including estimated subtenant rentals, discount rates and future cash flows based on our experience and knowledge of the market in which the closed property is located, previous efforts to dispose of similar assets and the assessment of existing market conditions. Reserves for closed properties are included in Other current liabilities and Other long-term liabilities in the Consolidated Balance Sheets.
NOTE 2—RECENTLY ADOPTED AND ISSUED ACCOUNTING PRONOUNCEMENTS
Recently Adopted Accounting Pronouncements
In March 2017, the Financial Accounting Standards Board (“FASB”) issued accounting standard update (“ASU”) 2017-07,
Compensation-Retirement Benefits (Topic 715): Improving the Presentation of Net Periodic Pension Cost and Net Periodic Postretirement Benefit Cost
. ASU 2017-07 changes how benefit plan costs for defined benefit pension and other postretirement benefit plans are presented in the statement of operations. The Company adopted this guidance in the first quarter of fiscal 2019, and it presents non-service cost components of net periodic benefit income, as disclosed in
Note 14—Benefit Plans
, in an other income and expense line titled “Net periodic benefit income, excluding service cost” in the Consolidated Statements of Operations. The service cost components are recorded within Operating expenses. The adoption of this standard did not have an impact on the Company’s prior period Consolidated Statements of Operations, as all benefit plan costs for defined benefit pension and other postretirement benefit plans incurred are attributable to the Supervalu business, which was acquired in the first quarter of fiscal 2019.
In November 2016, the FASB issued ASU No. 2016-18,
Statement of Cash Flows (Topic 230): Restricted Cash (a consensus of the FASB Emerging Issues Task Force).
This ASU clarifies the presentation of restricted cash on the statement of cash flows by requiring that a statement of cash flows explain the change during the period in the total of cash, cash equivalents, and amount generally described as restricted cash or restricted cash equivalents. This ASU is effective for annual reporting periods, and interim reporting periods contained therein, beginning after December 15, 2017, with retrospective application required. The Company adopted this ASU in the first quarter of fiscal 2019. The adoption of this ASU had no impact to the Consolidated Statement of Cash Flows for fiscal 2019, as the Company did not have restricted cash in its beginning or ending amounts for those periods.
72
In October 2016, the FASB issued ASU No. 2016-16,
Income Taxes (Topic 740): Intra-Entity Transfers of Assets Other Than Inventory
, which requires the recognition of the income tax consequences of an intra-entity transfer of an asset, other than inventory, when the transfer occurs. The Company adopted the new standard in the first quarter of fiscal 2019, with no impact to its financial position, results of operations, or cash flows.
In August 2016, the FASB issued ASU 2016-15,
Statement of Cash Flows (Topic 230): Classification of Certain Cash Receipts and Cash Payments
, to address eight specific cash flow issues with the objective of reducing the existing diversity in practice. The eight specific issues are (1) Debt Prepayment or Debt Extinguishment Costs; (2) Settlement of Zero-Coupon Debt Instruments or Other Debt Instruments with Coupon Interest Rates That Are Insignificant in Relation to the Effective Interest Rate of the Borrowing; (3) Contingent Consideration Payments Made after a Businesses Combination; (4) Proceeds from the Settlement of Insurance Claims; (5) Proceeds from the Settlement of Corporate-Owned Life Insurance Policies, including Bank-Owned Life Insurance Policies; (6) Distributions Received from Equity Method Investees; (7) Beneficial Interests in Securitization Transactions; and (8) Separately Identifiable Cash and Application of the Predominance Principle. This ASU is effective for public companies with interim periods and fiscal years beginning after December 15, 2017. The Company adopted this standard in the first quarter of fiscal 2019, with no impact to its Consolidated Statements of Cash Flows.
In April 2015, the FASB issued ASU 2015-04,
Compensation—Retirement Benefits (Topic 715): Practical Expedient for the Measurement Date of an Employer’s Defined Benefit Obligation and Plan Assets,
which allows employers with a fiscal year end that does not coincide with a calendar month end to make an accounting policy election to measure defined benefit plan assets and obligations as of the end of the month closest to their fiscal year end. ASU 2015-04 is effective for annual reporting periods beginning after December 15, 2015, including interim periods within that reporting period, with prospective application required. The Company adopted this ASU in fiscal 2019 and measures its defined benefit plan assets and obligations as of the month end closest to the applicable measurement date. The adoption of this standard did not have an impact on the Company’s prior period financial statements, as all defined benefit pension and other postretirement benefit plans are attributable to the Supervalu business, which was acquired in the first quarter of fiscal 2019.
In May 2014, the FASB issued ASU No. 2014-09,
Revenue from Contracts with Customers, (Topic 606)
, which has been updated by multiple amending ASUs (collectively “ASC 606”) and supersedes previous revenue recognition requirements (“ASC 605”). The core principle of the new guidance is that an entity will recognize revenue to depict the transfer of promised goods or services to customers in an amount that reflects the consideration to which the entity expects to be entitled in exchange for those goods or services. Additionally, the ASU requires new, enhanced quantitative and qualitative disclosures related to the nature, amount, timing and uncertainty of revenue and cash flows arising from contracts with customers. The collective guidance is effective for public companies with annual periods, and interim periods within those periods, beginning after December 15, 2017. The new standard permits either of the following adoption methods: (i) a full retrospective application with restatement of each period presented in the financial statements with the option to elect certain practical expedients, or (ii) a retrospective application with the cumulative effect of adopting the guidance recognized as of the date of initial application (“modified retrospective method”). The Company has adopted this new guidance in the first quarter of fiscal 2019 using the modified retrospective method, with no significant impact to our Consolidated Balance sheets, Consolidated Statements of Operations or Consolidated Statements of Cash flows.
The primary impact of adopting the new standard, contained within the wholesale distribution reportable segment, is related to the sale of certain private label products for which revenue is recognized over time under the new standard as opposed to at a point in time under ASC 605. Private label products are specific to the customer to which they are sold, and are typically packaged with the customer’s logo or other products for which the customer has an exclusive right to sell. The Company is contractually restricted from selling private label products with the customer’s logo or other exclusive products to other third-party customers. As a result, the underlying good has no alternative use to the Company. In some instances, the Company’s contracts also require the customer to purchase private label inventory held by the Company if the agreement is terminated, the customer discontinues selling the specific product, or the product is nearing its expiration date. This gives the Company an enforceable right to payment for performance completed to date from certain customers, once it has procured private label product. As a result, the Company now recognizes revenue from these product sales over time, as control is transferred to the customer, using a cost-incurred input measure of progress, as opposed to at a point in time, typically upon delivery, under ASC 605. Control of these products is transferred to the customer upon incurrence of substantially all of the Company’s costs related to the product, and therefore the cost-incurred input method is determined to be a faithful depiction of the transfer of goods.
The effect of adopting this change resulted in an increase to Retained earnings of
$0.3 million
, which was recorded in the first quarter of fiscal 2019. This change did not materially impact our Consolidated Statements of Operations for fiscal 2019. Refer to
Note 3—Revenue Recognition
for further discussion of our adoption of the new standard.
73
Recently Issued Accounting Pronouncements
In April 2019, the FASB issued ASU No. 2019-04,
Codification Improvements to Topic 326 Financial Instruments - Credit Losses, Topic 815, Derivatives and Hedging, and Topic 825
. This ASU clarifies the accounting treatment for the measurement of credit losses under ASC 236 and provides further clarification on previously issued updates including ASU 2017-12, Derivatives and Hedging (Topic 815): Targeted Improvements to Accounting for Hedging Activities and ASU 2016-01, Financial Instruments-Overall (Subtopic 825-10): Recognition and Measurement of Financial Assets and Financial Liabilities. Since the Company adopted ASU 2017-12 in the fourth quarter of fiscal 2018, the amendments in ASU 2019-04 related to clarifications on Accounting for Hedging Activities are effective for the Company in the first quarter of fiscal 2020. The remaining amendments within ASU 2019-04 are effective for fiscal years beginning after December 15, 2019, which for the Company is the first quarter of fiscal 2021. Early adoption is permitted. The Company is currently reviewing the provisions of the new standard and evaluating its timing of adoption and impact on the Company’s consolidated financial statements.
In October 2018, the FASB issued authoritative guidance under ASU No. 2018-16,
Derivatives and Hedging (Topic 815): Inclusion of the Secured Overnight Financing Rate (SOFR) Overnight Index Swap (OIS) Rate as a Benchmark Interest Rate for Hedge Accounting Purposes
. This ASU adds the Overnight Index Swap (OIS) rate based on Secured Overnight Financing Rate (SOFR) as a benchmark interest rate for hedge accounting purposes. This ASU is effective for public companies with interim and fiscal years beginning after December 15, 2018, which for the Company is the first quarter of fiscal year 2020. The Company is currently reviewing the provisions of the new standard and evaluating its impact on the Company’s consolidated financial statements.
In August 2018, the FASB issued ASU 2018-15,
Intangibles-Goodwill and Other-Internal-Use Software: Customer’s Accounting for Implementation Costs Incurred in a Cloud Computing Arrangement that is a Service Contract
. ASU 2018-05 requires implementation costs incurred by customers in cloud computing arrangements (i.e., hosting arrangements) to be capitalized under the same premises of authoritative guidance for internal-use software, and deferred over the noncancellable term of the cloud computing arrangements plus any option renewal periods that are reasonably certain to be exercised by the customer or for which the exercise is controlled by the service provider. The Company is required to adopt this new guidance in the first quarter of fiscal 2021. The Company has outstanding cloud computing arrangements and continues to incur costs that it believes would be required to be capitalized under ASU 2018-05. The Company is currently reviewing the provisions of the new standard and evaluating its impact on the Company’s consolidated financial statements.
In August 2018, the FASB issued ASU 2018-14,
Compensation-Retirement Benefits-Defined Benefit Plans-General: Disclosure Framework-Changes to the Disclosure Requirements for Defined Benefit Plans
. ASU 2018-14 eliminates requirements for certain disclosures and requires additional disclosures under defined benefit pension plans and other postretirement plans. The Company is required to adopt this guidance in the first quarter of fiscal 2021. The Company is currently reviewing the provisions of the new standard and evaluating its impact on the Company’s consolidated financial statements and related disclosures.
In February 2018, the FASB issued ASU 2018-02,
Reclassification of Certain Tax Effects from Accumulated Other Comprehensive Income
, which allows a reclassification from accumulated other comprehensive income to retained earnings for stranded tax effects resulting from the Tax Cuts and Jobs Act of 2017. This ASU is effective for all entities for annual and interim periods in fiscal years beginning after December 15, 2018, which for the Company will be the first quarter of fiscal 2020, with early adoption permitted. The Company is currently reviewing the provisions of the new standard and evaluating its impact on the Company’s consolidated financial statements.
In June 2016, the FASB issued ASU 2016-13,
Financial Instruments-Credit Losses (Topic 326): Measurement of Credit Losses on Financial Instruments
. ASU 2016-13 changes the impairment model for most financial assets and certain other instruments. For trade and other receivables, held-to-maturity debt securities, loans and other instruments, entities will be required to use a new forward-looking “expected loss” model that will replace the current “incurred loss” model and generally will result in the earlier recognition of allowances for losses. For available-for-sale debt securities with unrealized losses, entities will measure credit losses in a manner similar to current practice, except that the losses will be recognized as an allowance. The Company is required to adopt this new guidance in the first quarter of fiscal 2021. The Company is currently reviewing the provisions of the new standard and evaluating its impact on the Company’s consolidated financial statements.
In February 2016, the FASB issued ASU No. 2016-02,
Leases (Topic 842)
, which provides new comprehensive lease accounting guidance that supersedes existing lease guidance. The objective of this ASU is to establish the principles that lessees and lessors shall apply to report useful information to users of financial statements about the amount, timing, and uncertainty of cash flows arising from a lease. Criteria for distinguishing leases between finance leases and operating leases are substantially similar to criteria for distinguishing between capital leases and operating leases in existing lease guidance. ASC 842 will require the Company to recognize most current operating lease obligations as right-of-use assets with a corresponding liability based on the present value of future operating lease payments. Lease agreements with terms that are 12 months or less are permitted to be excluded
74
from the balance sheet. In addition, this ASU expands the disclosure requirements of lease arrangements. The Company is required to adopt this standard in the first quarter of fiscal 2020 on August 4, 2019, the effective and initial application date. The Company will utilize the additional transition method under ASU 2018-11, which allows for a cumulative effect adjustment within retained earnings in the period of adoption. In addition, the Company elected the “package of three” practical expedients which allows companies to not reassess whether arrangements contain leases, the classification of leases, and the capitalization of initial direct costs. The estimated impact of the adoption to the Company’s Consolidated Balance Sheets includes the recognition of operating lease liabilities of approximately
$1.1 billion
with corresponding right-of-use assets of approximately the same amount based on the present value of the remaining lease payments for existing operating leases. In addition, the adoption of the standard is expected to result in the derecognition of existing assets of approximately
$140.0 million
and liabilities of
$130.0 million
for certain sale-leaseback transactions that do not qualify for sale accounting, including build-to-suit arrangements for which construction is complete and the Company is leasing the constructed asset. The difference between the assets and liabilities derecognized for these sale-leaseback transactions, net of the deferred tax impact, is expected to be recorded as an adjustment to retained earnings. The difference between the amount of right-of-use assets and lease liabilities recognized upon the adoption of ASC 842 is primarily related to adjustments to existing prepaid rent, deferred rent, lease intangible assets/liabilities, and closed property reserves. The Company does not expect a material impact on its lessor accounting from the adoption of this standard. Adoption of this standard is not expected to have a material impact to the Company’s Consolidated Statements of Operations or Consolidated Statements of Cash Flows. The Company is in the process of revising its accounting policies, processes and controls, and systems as applicable to comply with the provisions and disclosure requirements of the standard.
NOTE 3—REVENUE RECOGNITION
Revenue Recognition Accounting Policy
The Company recognizes revenue in an amount that reflects the consideration that is expected to be received for goods or services when its performance obligations are satisfied by transferring control of those promised goods or services to its customers. ASC 606 defines a five-step process to recognize revenue that requires judgment and estimates, including identifying the contract with the customer, identifying the performance obligations in the contract, determining the transaction price, allocating the transaction price to the performance obligations in the contract and recognizing revenue when or as the performance obligation is satisfied. This footnote addresses the Company’s revenue recognition policies for its continuing operations only; refer to
Note 19—Discontinued Operations
for additional information about our revenue recognition policies of discontinued operations.
Revenues from wholesale product sales are recognized when control is transferred, which typically happens upon either shipment or delivery, depending on the contract terms with the customer. Typically, shipping and customer receipt of wholesale products occur on the same business day. Discounts and allowances provided to customers are recognized as a reduction in Net sales as control of the products is transferred to customers. The Company recognizes freight revenue related to transportation of its products when control of the product is transferred, which is typically upon delivery.
Sales tax is excluded from Net sales. Limited rights of return or product warranties exist with the Company’s customers due to the nature of the products it sells.
Product sales
The Company enters into wholesale customer distribution agreements that provide terms and conditions of our order fulfillment. The Company’s distribution agreements often specify levels of required minimum purchases in order to earn certain rebates or incentives. Certain contracts include rebates and other forms of variable consideration, including consideration payable to the customer up-front, over time or at the end of a contract term. Many of the Company’s contracts with customers outline various other promises to be performed in conjunction with the sale of product. The Company determined that these promises provided are immaterial within the overall context of the respective contract, and as such has not allocated the transaction price to these obligations.
In transactions for goods or services where the Company engages third-parties to participate in its order fulfillment process, it evaluates whether it is the principal or an agent in the transaction. The Company’s analysis considers whether it controls the goods or services before they are transferred to its customer, including an evaluation of whether the Company has the ability to direct the use of, and obtain substantially all the remaining benefits from, the specified good or service before it is transferred to the customer. Agent transactions primarily reflect circumstances where the Company is not involved in order fulfillment or where it is involved in the order fulfillment but is not contractually obligated to purchase the related goods or services from vendors, and instead extends wholesale customers credit by paying vendor trade accounts payable and does not control products prior to their sale. Under ASC 606, if the Company determines that it is acting in an agent capacity, transactions are recorded on a net basis. If the Company determines that it is acting in a principal capacity, transactions are recorded on a gross basis.
75
The Company also evaluates vendor sales incentives to determine whether they reduce the transaction price with its customers. The Company’s analysis considers which party tenders the incentive, whether the incentive reflects a direct reimbursement from a vendor, whether the incentive is influenced by or negotiated in conjunction with any other incentive arrangements and whether the incentive is subject to an agency relationship with the vendor, whether expressed or implied. Typically, when vendor incentives are offered directly by vendors to the Company’s customers, require the achievement of vendor-specified requirements to be earned by customers, and are not negotiated by the Company or in conjunction with any other incentive agreement whereby the Company does not control the direction or earning of these incentives, then Net sales are not reduced as part of the Company’s determination of the transaction price. In circumstances where the vendors provide the Company consideration to promote the sale of their goods and the Company determines the specific performance requirements for its customers to earn these incentives, Net sales are reduced for these customer incentives as part of the determination of the transaction price.
Sales from the Company’s Wholesale segment to its retail discontinued operations are presented within Net Sales when the Company holds the business for sale with a supply agreement that it anticipates the sale of the retail banner to include upon its disposal. The Company recorded
$769.8 million
within Net sales from continuing operations attributable to discontinued operations inter-company product purchases in
fiscal 2019
, which the Company expects will continue subsequent to the sale of certain retail banners. These amounts were recorded at gross margin rates consistent with sales to other similar wholesale customers of the acquired Supervalu business. No sales were recorded within continuing operations for retail banners that the Company expects to dispose of without a supply agreement, which were eliminated upon consolidation within continuing operations and amounted to
$411.9 million
in
fiscal 2019
.
Certain customer agreements provide for the right to license one or more of the Company’s tradenames, such as FESTIVAL FOODS®, SENTRY®, COUNTY MARKET®, NEWMARKET®, FOODLAND®, JUBILEE® and SUPERVALU®. In addition, the Company enters into franchise agreements to separately charge its customers, who the Company also sells wholesale products to, for the right to use its CUB FOODS® tradename. The Company typically does not separately charge for the right to license its tradenames. The Company believes that these tradenames are capable of being distinct, but are not distinct within the context of the contracts with its customers. Accordingly, the Company does not separately recognize revenue related to tradenames utilized by its customers.
The Company enters into distribution agreements with manufacturers to provide wholesale supplies to the Defense Commissary Agency (“DeCA”) and other government agency locations. DeCA contracts with manufacturers to obtain grocery products for the commissary system. The Company contracts with manufacturers to distribute products to the commissaries after being authorized by the manufacturers to be a military distributor to DeCA. The Company must adhere to DeCA’s delivery system procedures governing matters such as product identification, ordering and processing, information exchange and resolution of discrepancies. DeCA identifies the manufacturer with which an order is to be placed, determines which distributor is contracted by the manufacturer for a particular commissary or exchange location, and then places a product order with that distributor that is covered under DeCA’s master contract with the applicable manufacturer. The Company supplies product from its existing inventory, delivers it to the DeCA designated location, and bills the manufacturer for the product price plus a drayage fee. The manufacturer then bills DeCA under the terms of its master contract. The Company has determined that it controls the goods before they are transferred to the customer, and as such it is the principal in the transaction. Revenue is recognized on a gross basis when control of the product passes to the DeCA designated location.
Customer incentives
The Company provides incentives to its wholesale customers in various forms established under the applicable agreement, including advances, payments over time that are earned by achieving specified purchasing thresholds, and upon the passage of time. The Company typically records customer advances within Other assets and Other current assets and typically recognizes customer incentive payments that are based on expected purchases over the term of the agreement as a reduction to Net sales. To the extent that the transaction price for product sales includes variable consideration, such as certain of these customer incentives, the Company estimates the amount of variable consideration that should be included in the transaction price primarily by utilizing the expected value method. Variable consideration is included in the transaction price if it is probable that a significant future reversal of cumulative revenue under the agreement will not occur. The Company believes that there will not be significant changes to its estimates of variable consideration, as the uncertainty will be resolved within a relatively short time and there is a significant amount of historical data that is used in the estimation of the amount of variable consideration to be received. Therefore, the Company has not constrained its estimates of variable consideration.
Customer incentive assets are reviewed for impairment when circumstances exist for which the Company no longer expects to recover the applicable customer incentives.
76
Professional services and equipment sales
Separate from the services provided in conjunction with the sale of product describe above, many of the Company’s agreements with customers also include distinct professional services and other promises to customers, in addition to the sale of the product itself, such as retail store support, advertising, store layout and design services, merchandising support, couponing, e-commerce, network and data hosting solutions, training and certifications classes, and administrative back-office solutions. These professional services may contain a single performance obligation for each respective service, in which case such services revenues are recognized when delivered. Relative to total Net sales, revenue from professional services is insignificant.
Wholesale equipment sales are recorded as direct sales to customers when shipped or delivered, consistent with the recognition of product sales.
Disaggregation of Revenues
The Company records revenue to four customer channels, which are described below:
|
•
|
Supernatural
, which consists of chain accounts that are national in scope and carry primarily natural products, and at this time currently consists solely of Whole Foods Market;
|
|
•
|
Independents
, which include single store and chain accounts (excluding supernatural, as defined above), which carry primarily natural products and buying clubs of consumer groups joined to buy products;
|
|
•
|
Supermarkets
, which include accounts that also carry conventional products, and at this time currently include chain accounts, supermarket independents, and gourmet and ethnic specialty stores; and
|
|
•
|
Other
, which includes foodservice, e-commerce and international customers outside of Canada, as well as sales to Amazon.com, Inc.
|
The following tables detail the Company’s net sales for the periods presented by customer channel for each of its segments. The Company does not record its revenues within its wholesale reportable segment for financial reporting purposes by product group, and it is therefore impracticable for it to report them accordingly.
|
(in millions)
|
Net Sales for Fiscal 2019 (53 weeks)
|
|||||||||||||||
|
Customer Channel
|
Wholesale
|
Other
|
Eliminations
|
Consolidated
|
||||||||||||
|
Supernatural
|
$
|
4,393
|
|
$
|
—
|
|
$
|
—
|
|
$
|
4,393
|
|
||||
|
Independents
|
3,179
|
|
—
|
|
—
|
|
3,179
|
|
||||||||
|
Supermarkets
|
12,505
|
|
—
|
|
—
|
|
12,505
|
|
||||||||
|
Other
|
1,248
|
|
228
|
|
(166
|
)
|
1,310
|
|
||||||||
|
Total
|
$
|
21,325
|
|
$
|
228
|
|
$
|
(166
|
)
|
$
|
21,387
|
|
||||
|
(in millions)
|
Net Sales for Fiscal 2018
(1)
(52 weeks)
|
|||||||||||||||
|
Customer Channel
|
Wholesale
|
Other
|
Eliminations
|
Consolidated
|
||||||||||||
|
Supernatural
|
$
|
3,758
|
|
$
|
—
|
|
$
|
—
|
|
$
|
3,758
|
|
||||
|
Independents
|
2,668
|
|
—
|
|
—
|
|
2,668
|
|
||||||||
|
Supermarkets
|
2,820
|
|
—
|
|
—
|
|
2,820
|
|
||||||||
|
Other
|
925
|
|
228
|
|
(172
|
)
|
981
|
|
||||||||
|
Total
|
$
|
10,171
|
|
$
|
228
|
|
$
|
(172
|
)
|
$
|
10,227
|
|
||||
|
(in millions)
|
Net Sales for Fiscal 2017
(1)
(52 weeks)
|
|||||||||||||||
|
Customer Channel
|
Wholesale
|
Other
|
Eliminations
|
Consolidated
|
||||||||||||
|
Supernatural
|
$
|
3,096
|
|
$
|
—
|
|
$
|
—
|
|
$
|
3,096
|
|
||||
|
Independents
|
2,490
|
|
—
|
|
—
|
|
2,490
|
|
||||||||
|
Supermarkets
|
2,731
|
|
—
|
|
—
|
|
2,731
|
|
||||||||
|
Other
|
894
|
|
232
|
|
(169
|
)
|
957
|
|
||||||||
|
Total
|
$
|
9,211
|
|
$
|
232
|
|
$
|
(169
|
)
|
$
|
9,274
|
|
||||
|
(1)
|
During fiscal 2019, the presentation of net sales by customer channel was adjusted to reflect changes in the classification of customer types as a result of a detailed review of customer channel definitions. There was no impact to the Consolidated Statements of Operations as a result of revising the classification of customer types. As a result of this adjustment, net sales to our supermarkets channel and to our other channel for
fiscal 2018
decreased approximately
$36 million
and
$58 million
, respectively, compared to the previously reported amounts, while net sales to the independents channel for
fiscal 2018
increased approximately
$95 million
compared to the previously reported amounts. In addition, based on the consistent application of these impacts to fiscal 2017, net sales to our supermarkets channel and to our other channel for
fiscal 2017
decreased approximately
$16 million
and
|
77
$47 million
, respectively, compared to the previously reported amounts, while net sales to the independents channel for
fiscal 2017
increased approximately
$63 million
compared to the previously reported amounts.
Whole Foods Market, Inc. was the Company’s largest customer in each fiscal year presented. Whole Foods Market, Inc. accounted for approximately
21%
,
37%
and
33%
of the Company’s net sales for
fiscal 2019
,
2018
and
2017
, respectively. There were no other customers that individually generated
10%
or more of the Company’s net sales during those periods.
The Company serves customers in the United States and Canada, as well as customers located in other countries. However, all of the Company’s revenue is earned in the U.S. and Canada and international distribution occurs through freight-forwarders. The Company does not have any performance obligations on international shipments subsequent to delivery to the domestic port.
Contract Balances
The Company does not typically incur costs that are required to be capitalized in connection with obtaining a contract with a customer. Expenses related to contract origination primarily relate to employee costs that the Company would incur regardless of whether the contract was obtained with the customer.
The Company typically does not have any performance obligations to deliver products under its contracts until its customers submit a purchase order, as it stands ready to deliver product upon receipt of a purchase order under contracts with its customers. These performance obligations are generally satisfied within a very short period of time. Therefore, the Company has utilized the practical expedient that provides an exemption from disclosure of the transaction price allocated to remaining performance obligations if the performance obligation is part of a contract that has an original expected duration of one year or less. The Company does not typically receive pre-payments from its customers.
Customer payments are due when control of goods or services are transferred to the customer and are typically not conditional on anything other than payment terms, which typically range less than 30 days. Since no significant financing components exist between the period of time the Company transfers goods or services to the customer and when it receives payment for those goods or services, the Company has elected not to adjust its revenue recognition policy to recognize financing components. Customer incentives are not considered contract assets as they are not generated through the transfer of goods or services to the customers. No material contract asset or liability exist for any period reported within these Consolidated Financial Statements.
Accounts and notes receivable are as follows:
|
(in thousands)
|
August 3, 2019
|
July 28, 2018
|
|||||
|
Customer accounts receivable
|
$
|
1,063,167
|
|
$
|
595,698
|
|
|
|
Allowance for uncollectible receivables
|
(20,725
|
)
|
(15,996
|
)
|
|||
|
Other receivables, net
|
23,257
|
|
—
|
|
|||
|
Accounts receivable, net
|
$
|
1,065,699
|
|
$
|
579,702
|
|
|
|
Customer notes receivable, net, included within Prepaid expenses and other current assets
|
$
|
11,912
|
|
$
|
1,277
|
|
|
|
Long-term notes receivable, net, included within Other assets
|
$
|
34,408
|
|
$
|
653
|
|
|
The allowance for uncollectible receivables, and estimated variable consideration allowed for as sales concessions consists of the following:
|
(in thousands)
|
2019
|
2018
|
2017
|
|||||||||
|
Balance at beginning of year
|
$
|
15,996
|
|
$
|
14,509
|
|
$
|
11,230
|
|
|||
|
Additions charged to operating expenses
|
9,749
|
|
12,006
|
|
5,728
|
|
||||||
|
Reductions of net sales
|
7,061
|
|
—
|
|
—
|
|
||||||
|
Deductions
|
(12,081
|
)
|
(10,519
|
)
|
(2,449
|
)
|
||||||
|
Balance at end of year
|
$
|
20,725
|
|
$
|
15,996
|
|
$
|
14,509
|
|
|||
78
NOTE 4—ACQUISITIONS
SUPERVALU INC.
On July 25, 2018, the Company entered into an agreement and plan of merger (the “Merger Agreement”) to acquire all of the outstanding equity securities of Supervalu, which was then the largest publicly traded conventional grocery distributor in the United States. The acquisition of Supervalu diversifies the Company’s customer base, further enables cross-selling opportunities, expands market reach and scale, enhances technology, capacity and systems, and is expected to deliver significant synergies and accelerate potential growth. The merger was completed on October 22, 2018 (the “Closing Date”). At the effective time of the acquisition, each share of Supervalu common stock, par value
$0.01
per share, issued and outstanding, was canceled and converted into the right to receive a cash payment equal to
$32.50
per share, without interest. Total consideration related to this acquisition was
$2.3 billion
,
$1.3 billion
of which was paid in cash to Supervalu shareholders and
$1.0 billion
of which was used to satisfy Supervalu’s outstanding debt obligations. Included in the liabilities assumed in the Supervalu acquisition were the Supervalu Senior Notes with a fair value of
$546.6 million
. These Senior Notes were redeemed in the second quarter of fiscal 2019 following the required 30-day notice period, resulting in their satisfaction and discharge.
The assets and liabilities of Supervalu were recorded in the Company’s consolidated financial statements on a preliminary basis at their estimated fair values as of the acquisition date. In conjunction with the Supervalu acquisition, the Company announced its plan to sell the remaining acquired retail operations of Supervalu. Refer to
Note 19—Discontinued Operations
for more information on discontinued operations.
The following table summarizes the consideration, preliminary fair value of assets acquired and liabilities assumed, and the resulting preliminary goodwill. As of
August 3, 2019
, the Company is continuing its assessment of fair values of assets acquired and liabilities assumed. There can be no assurance that such final assessments will not result in material changes from the preliminary purchase price allocations, and such changes may result in increases or decreases to the goodwill impairment charge recorded in fiscal 2019 due to changes in the opening balance sheet value of goodwill. The Company’s estimates and assumptions are subject to change during the measurement period (up to one year from the acquisition date), as the Company finalizes the valuations of certain tangible and intangible assets acquired, and liabilities assumed. As of
August 3, 2019
, the primary areas of the purchase price allocation that are not yet finalized relate to current and deferred income taxes and certain discontinued operations real and personal property. Any potential fair value changes to these areas, would be assessed to determine whether identifiable intangible assets or the allocation of goodwill between reporting units should also be updated.
79
|
(in thousands)
|
Preliminary Acquisition Date Fair Values as of August 3, 2019
|
|||
|
Consideration:
|
||||
|
Outstanding shares
|
$
|
1,258,450
|
|
|
|
Outstanding debt, excluding acquired senior notes
|
1,046,170
|
|
||
|
Equity-based awards
|
18,411
|
|
||
|
Total consideration
|
$
|
2,323,031
|
|
|
|
Preliminary fair value of assets acquired and liabilities assumed:
|
||||
|
Cash and cash equivalents
|
$
|
25,102
|
|
|
|
Accounts receivable
|
552,381
|
|
||
|
Inventories
|
1,159,642
|
|
||
|
Prepaid expenses and other current assets
|
108,830
|
|
||
|
Current assets of discontinued operations
|
196,848
|
|
||
|
Property, plant and equipment
|
1,210,416
|
|
||
|
Goodwill
|
374,757
|
|
||
|
Intangible assets
|
918,103
|
|
||
|
Other assets
|
75,965
|
|
||
|
Long-term assets of discontinued operations
|
429,304
|
|
||
|
Accounts payable
|
(972,888
|
)
|
||
|
Current portion of long-term debt and capital lease obligations
|
(579,565
|
)
|
||
|
Other current liabilities
|
(331,693
|
)
|
||
|
Current liabilities of discontinued operations
|
(148,763
|
)
|
||
|
Long-term debt
|
(34,355
|
)
|
||
|
Long-term capital lease obligations
|
(103,289
|
)
|
||
|
Pension and other postretirement benefit obligations
|
(234,324
|
)
|
||
|
Deferred income taxes
|
(20,131
|
)
|
||
|
Other long-term liabilities
|
(303,544
|
)
|
||
|
Long-term liabilities of discontinued operations
|
(1,398
|
)
|
||
|
Noncontrolling interests
|
1,633
|
|
||
|
Total consideration
|
2,323,031
|
|
||
|
Less: Cash and cash equivalents
(1)
|
(30,596
|
)
|
||
|
Total consideration, net of cash and cash equivalents acquired
|
$
|
2,292,435
|
|
|
|
(1)
|
Includes cash and cash equivalents acquired attributable to continuing operations and discontinued operations.
|
Preliminary goodwill represents the future economic benefits arising largely from the synergies expected from combining the operations of the Company and Supervalu that could not be individually identified and separately recognized. The Company is currently evaluating the tax deductibility of the provisional goodwill amount, however it currently expects a substantial portion of its goodwill to be deductible for income tax purposes. Goodwill from the acquisition was attributed to the Company’s Supervalu Wholesale reporting unit and the legacy Company Wholesale reporting unit. No goodwill was attributed to the Retail reporting unit within discontinued operations. Refer to
Note 7—Goodwill and Intangible Assets
for additional information regarding the assignment of goodwill to the Company’s reporting units.
During fiscal 2019, the Company updated its preliminary fair value estimates of its net assets primarily due to a review of the cash flows used to measure fair value of intangible assets, estimates of current and deferred income taxes, estimates of expected fair value, less costs to sell, of its retail disposal groups based on indications of value, and estimates of carrying values of other assets and liabilities.
80
The following table summarizes the identifiable intangible assets and liabilities recorded based on preliminary valuations. The identifiable intangible assets are expected to be amortized on a straight-line basis over the estimated useful lives indicated. The preliminary fair value of identifiable intangible assets acquired was determined using income approaches. Significant assumptions utilized in the income approach were based on Company-specific information and projections, which are not observable in the market and are thus considered Level 3 measurements as defined by authoritative guidance.
|
Preliminary Acquisition Date Fair Values as of August 3, 2019
|
||||||||||
|
(in thousands)
|
Estimated Useful Life
|
Continuing Operations
|
Discontinued Operations
|
|||||||
|
Customer relationship assets
|
10-17 years
|
$
|
810,000
|
|
$
|
—
|
|
|||
|
Favorable operating leases
|
1-19 years
|
21,629
|
|
—
|
|
|||||
|
Leases in place
|
1-8 years
|
10,474
|
|
—
|
|
|||||
|
Tradenames
|
2-9 years
|
66,000
|
|
17,000
|
|
|||||
|
Pharmacy prescription files
|
5-7 years
|
—
|
|
45,900
|
|
|||||
|
Non-compete agreement
|
2 years
|
10,000
|
|
—
|
|
|||||
|
Unfavorable operating leases
|
1-12 years
|
(21,754
|
)
|
—
|
|
|||||
|
Total
|
$
|
896,349
|
|
$
|
62,900
|
|
||||
The Company incurred acquisition-related costs in conjunction with the Supervalu acquisition, which are quantified in
Note 5—Restructuring, Acquisition and Integration Related Expenses
.
The accompanying Consolidated Statements of Operations include the results of operations of Supervalu since the October 22, 2018 acquisition date through
August 3, 2019
, which consisted of net sales from continuing operations of
$10.47 billion
. Supervalu’s net sales from discontinued operations for this time period are reported in
Note 19—Discontinued Operations
.
The following table presents unaudited supplemental pro forma consolidated Net sales and Net income (loss) from continuing operations based on the Company’s historical reporting periods as if the acquisition of Supervalu had occurred as of July 30, 2017:
|
(in thousands, except per share data)
|
August 3, 2019
(1)
(53 weeks)
|
July 28, 2018
(2)
(52 weeks)
|
||||||
|
Net sales
|
$
|
24,503,882
|
|
$
|
24,184,056
|
|
||
|
Net (loss) income from continuing operations
|
$
|
(287,001
|
)
|
$
|
13,201
|
|
||
|
Basic net (loss) income from continuing operations per share
|
$
|
(5.60
|
)
|
$
|
0.26
|
|
||
|
Diluted net (loss) income from continuing operations per share
|
$
|
(5.60
|
)
|
$
|
0.26
|
|
||
|
(1)
|
Includes 12 weeks of pro forma Supervalu results for the period ended September 8, 2018.
|
|
(2)
|
Includes 52 weeks of pro forma Supervalu results for the period ended July 28, 2018, including 19 weeks of pro forma Associated Grocers of Florida, Inc. results, which was acquired by Supervalu on December 8, 2017.
|
These unaudited pro forma results are presented for informational purposes only and are not necessarily indicative of what the actual results of operations of the combined companies would have been had the acquisitions occurred at the beginning of the periods being presented, nor are they indicative of future results of operations.
Gourmet Guru, Inc.
On August 10, 2016, the Company acquired all of the outstanding equity securities of Gourmet Guru, Inc. (“Gourmet Guru”). Gourmet Guru is a distributor and merchandiser of fresh and organic food focusing on new and emerging brands. Total cash consideration related to this acquisition was approximately
$10.0 million
, subject to certain customary post-closing adjustments. The fair value of identifiable intangible assets acquired was determined by using an income approach. The identifiable intangible asset recorded based on a provisional valuation consisted of customer lists of
$1.0 million
, which are being amortized on a straight-line basis over an estimated useful life of approximately
2 years
. During the first quarter of fiscal 2018, in finalizing the purchase accounting related to the Gourmet Guru acquisition, the Company recorded an increase to goodwill of approximately
$0.2 million
with a decrease to prepaid expenses. The goodwill of
$10.3 million
represents the future economic benefits expected to arise that could not be individually identified and separately recognized.
81
Cash paid for Gourmet Guru was financed through borrowings under the Company’s
Former ABL Credit Facility
. The results of the acquired business’s operations have been included in the Consolidated Financial Statements since the applicable date of acquisition. Operations for this acquisition have been combined with the Company’s existing wholesale distribution business and therefore results are not separable from the rest of the wholesale distribution business. The Company has not furnished pro forma financial information relating to this acquisition as such information is not material to the Company’s financial results.
NOTE 5—RESTRUCTURING, ACQUISITION AND INTEGRATION RELATED EXPENSES
Restructuring, acquisition and integration related expenses were as follows:
|
(in thousands)
|
2019
|
2018
|
2017
|
|||||||||
|
2019 SUPERVALU INC. restructuring expenses
|
$
|
74,414
|
|
$
|
—
|
|
$
|
—
|
|
|||
|
Acquisition and integration costs
|
56,589
|
|
4,967
|
|
—
|
|
||||||
|
Closed property charges
|
22,536
|
|
—
|
|
—
|
|
||||||
|
2018 Earth Origins Market restructuring expenses and loss on sale
|
—
|
|
4,771
|
|
—
|
|
||||||
|
2017 Cost Saving and Efficiency Initiatives
|
—
|
|
—
|
|
6,864
|
|
||||||
|
Total
|
$
|
153,539
|
|
$
|
9,738
|
|
$
|
6,864
|
|
|||
Closed Property Reserves
Changes in reserves for closed properties, including additions noted above, consisted of the following:
|
(in thousands)
|
2019
|
2018
|
2017
|
|||||||||
|
Beginning balance
|
$
|
—
|
|
$
|
—
|
|
$
|
443
|
|
|||
|
Acquired liabilities
|
34,581
|
|
—
|
|
—
|
|
||||||
|
Additions, accretion and changes in estimates, net
|
16,529
|
|
1,400
|
|
258
|
|
||||||
|
Payments
|
(22,467
|
)
|
(1,400
|
)
|
(701
|
)
|
||||||
|
Ending balance
|
$
|
28,643
|
|
$
|
—
|
|
$
|
—
|
|
|||
Reserves for closed property are included in the Consolidated Balance Sheets within Accrued expenses and other current liabilities and Other long-term liabilities. Closed property charges recorded in
fiscal 2019
primarily relate to
17
retail stores, including certain Shop ‘n Save and Shop ‘n Save East branded stores, and are net of estimated sublease assumptions. In addition,
12
property leases including non-retail properties with reserves were terminated in
fiscal 2019
.
Restructuring Programs
The following is a summary of the restructuring reserves by reserve type included in the Consolidated Balance Sheets, primarily within Accrued compensation and benefits for severance and other employee separation costs and tax payments, within Accrued expenses and other current liabilities for the current portion of closed property reserves and within Other long-term liabilities for the long-term portion of closed property reserves.
|
(in thousands)
|
2019 SUPERVALU INC.
|
2018 Earth Origins Market
|
2017 Cost Saving and Efficiency Initiatives
|
Total
|
||||||||||||
|
Balances at July 29, 2017
|
$
|
—
|
|
$
|
—
|
|
$
|
4,298
|
|
$
|
4,298
|
|
||||
|
Restructuring program charge
|
—
|
|
2,219
|
|
—
|
|
2,219
|
|
||||||||
|
Cash payments
|
—
|
|
(1,836
|
)
|
(3,597
|
)
|
(5,433
|
)
|
||||||||
|
Balances at July 28, 2018
|
—
|
|
383
|
|
701
|
|
1,084
|
|
||||||||
|
Restructuring program charge
(1)
|
74,414
|
|
—
|
|
—
|
|
74,414
|
|
||||||||
|
Acquired restructuring liability
|
12,573
|
|
—
|
|
—
|
|
12,573
|
|
||||||||
|
Cash payments
|
(75,130
|
)
|
—
|
|
—
|
|
(75,130
|
)
|
||||||||
|
Balances at August 3, 2019
|
$
|
11,857
|
|
$
|
383
|
|
$
|
701
|
|
$
|
12,941
|
|
||||
|
Cumulative program charges incurred from inception to date
|
$
|
74,414
|
|
$
|
2,219
|
|
$
|
6,864
|
|
$
|
83,497
|
|
||||
|
(1)
|
Includes
$43.0 million
of charges related to change-in-control expense to satisfy outstanding equity awards and severance related costs.
|
82
2019 SUPERVALU INC.
As part of its acquisition of Supervalu and in order to achieve synergies from this combination, the Company is taking certain actions, which began during the first quarter of fiscal 2019 and will continue through at least fiscal 2020 to: (i) review its organizational structure and the strategic needs of the business going forward to identify and place talent with the appropriate skills, experience and qualifications to meet these needs; and (ii) dispose of and exit the Supervalu legacy retail operations, as efficiently and economically as possible in order to focus on the Company’s core wholesale distribution business. Actions associated with retail divestitures and adjustments to the Company’s core cost-structure for its wholesale food distribution business are expected to result in headcount reductions and other costs and charges.
2018 Earth Origins Market
During the second quarter of fiscal 2018 the Company made the decision to close
three
non-core, under-performing stores of its total
twelve
stores related to its Earth Origins Market Retail business. Based on this decision, the Company recorded restructuring costs of
$9.7 million
during fiscal 2018. In the fourth quarter of fiscal 2018, the Earth Origins Retail business was sold and the Company recorded a loss on disposition of assets of
$2.7 million
.
2017 Cost Saving and Efficiency Initiatives
During fiscal 2017, the Company announced a restructuring program in conjunction with various cost saving and efficiency initiatives, including the planned opening of a shared services center.
NOTE 6—PROPERTY AND EQUIPMENT
Property and equipment, net consisted of the following:
|
(in thousands)
|
Original
Estimated
Useful Lives
|
2019
|
2018
|
|||||||
|
Land
|
|
$
|
158,625
|
|
$
|
52,929
|
|
|||
|
Buildings and improvements
|
20-40 years
|
912,732
|
|
431,297
|
|
|||||
|
Leasehold improvements
|
5-20 years
|
123,748
|
|
106,014
|
|
|||||
|
Equipment
|
3-30 years
|
722,911
|
|
426,732
|
|
|||||
|
Motor vehicles
|
3-7 years
|
76,021
|
|
4,884
|
|
|||||
|
Capital lease assets
|
1-11 years
|
114,107
|
|
15,368
|
|
|||||
|
Construction in progress
|
|
172,702
|
|
22,105
|
|
|||||
|
|
2,280,846
|
|
1,059,329
|
|
||||||
|
Less accumulated depreciation and amortization
|
|
641,587
|
|
488,183
|
|
|||||
|
Property and equipment, net
|
|
$
|
1,639,259
|
|
$
|
571,146
|
|
|||
The Company capitalized
$3.3 million
of interest during
fiscal 2019
. The Company did
no
t capitalize interest during
fiscal 2018
and
2017
.
Depreciation and amortization expense on property and equipment was
$178.8 million
,
$71.5 million
and
$69.8 million
for
fiscal 2019
,
2018
and
2017
, respectively.
In the fourth quarter of fiscal 2019, the Company entered into an agreement to sell a distribution center for
$43.2 million
related to our Pacific Northwest consolidation strategy, which is expected to close in the first quarter of fiscal 2020. This facility is classified as held for sale within
Prepaid expenses and other current assets
of continuing operations on our Consolidated Balance Sheets.
NOTE 7—GOODWILL AND INTANGIBLE ASSETS
The Company has
seven
goodwill reporting units,
three
of which represent separate operating segments and are aggregated within the Wholesale reportable segment,
three
of which are separate operating segments that do not qualify as separate reportable segments, and a single retail reporting unit, which is included within discontinued operations.
83
During fiscal 2019, a relative fair value allocation was performed when the Canada Wholesale reporting unit became a separate operating segment and reporting unit.
In conjunction with the acquisition of Supervalu, goodwill resulting from the acquisition was assigned to the Supervalu Wholesale reporting unit and the legacy Company Wholesale reporting unit, as both of these reporting units are expected to benefit from the synergies of the business combination. The assignment was based on the relative synergistic value estimated as of the acquisition date. This systematic approach utilized the relative cash flow contributions and value created from the acquisition to each reporting unit on a stand-alone basis. As of the acquisition date, approximately
$82.0 million
was attributed to the legacy Company Wholesale reporting unit, which is preliminary and subject to the final determinations of the fair value of net assets acquired and a proportionate assignment adjustment between the Supervalu Wholesale reporting unit and the legacy Company reporting unit.
The Company reviews goodwill for impairment at least annually and more frequently if events or changes in circumstances indicate it is more likely than not that the fair value of a reporting unit is below its carrying amount. The annual review for goodwill impairment is performed as of the first day of the fourth quarter of each fiscal year. The Company tests for goodwill impairment at the reporting unit level, which is one level below the operating segment level.
Goodwill Impairment Reviews
During the first quarter of fiscal 2019, the Company experienced a decline in its stock price and market capitalization. During the second quarter of fiscal 2019, the stock price continued to decline, and the decline in the stock price and market capitalization became significant and sustained. Due to this sustained decline in stock price, the Company determined that it was more likely than not that the carrying value of the Supervalu Wholesale reporting unit exceeded its fair value and performed an interim quantitative impairment test of goodwill.
The Company estimated the fair values of all reporting units using both the market approach, applying a multiple of earnings based on guidelines for publicly traded companies, and the income approach, discounting projected future cash flows based on management’s expectations of the current and future operating environment for each reporting unit. The calculation of the impairment charge includes substantial fact-based determinations and estimates including weighted average cost of capital, future revenue, profitability, cash flows and fair values of assets and liabilities. The rates used to discount projected future cash flows under the income approach reflect a weighted average cost of capital of
10%
, which considered guidelines for publicly traded companies, capital structure and risk premiums, including those reflected in the Company’s then-current market capitalization. The Company corroborated the reasonableness of the estimated reporting unit fair values by reconciling those fair values to its enterprise value and market capitalization. Based on this analysis, the Company determined that the carrying value of its Supervalu Wholesale reporting unit exceeded its fair value by an amount that exceeded the assigned goodwill as of the acquisition date. As a result, the Company recorded a goodwill impairment charge of
$292.8 million
in fiscal 2019, which reflects the preliminary goodwill impairment charge recorded in the second quarter of fiscal 2019
and adjustments to the charge
recorded in the third and fourth quarters of fiscal 2019.
The goodwill impairment charge adjustments recorded in the third and fourth quarters of fiscal 2019 were attributable to changes in the preliminary fair value of net assets, most notably changes in tax assets and liabilities, intangible assets and property and equipment, which affected the initial goodwill resulting from the Supervalu acquisition. The goodwill impairment charge is reflected in Goodwill and asset impairment charges in the Consolidated Statements of Operations. The goodwill impairment charge reflects all of Supervalu Wholesale’s reporting unit goodwill, based on preliminary acquisition date assigned fair values.
The quantitative goodwill impairment review indicated that the estimated fair value of the legacy Company Wholesale and Canada Wholesale reporting units were in excess of their carrying values by over
20%
. Other continuing operations reporting units were substantially in excess of their carrying value.
The goodwill impairment charge recorded in fiscal 2019 is subject to change based upon the final purchase price allocation during the measurement period for estimated fair values of assets acquired and liabilities assumed from the Supervalu acquisition. There can be no assurance that such final assessments will not result in material increases or decreases to the recorded goodwill impairment charge based upon the preliminary purchase price allocations, due to changes in the provisional opening balance sheet estimates of goodwill. The Company’s estimates and assumptions are subject to change during the measurement period (up to one year from the acquisition date).
Refer to
Note 4—Acquisitions
for further information about the preliminary purchase price allocation and provisional goodwill estimated as of the acquisition date.
In fiscal 2019, the Company performed quarterly reviews of the composition of its reporting units. Any future changes in the Company’s goodwill reporting units would require a relative fair value allocation of goodwill, and may require a quantitative impairment assessment of goodwill, which may result in material goodwill impairment charges.
In the fourth quarter of fiscal 2019, the Company performed its annual goodwill qualitative impairment test and determined that a quantitative impairment test was not required for any of its reporting units.
84
2018 Earth Origins Market Impairment
During the second quarter of fiscal 2018, the Company made the decision to close
three
non-core, under-performing stores of its total
twelve
stores. Based on this decision, coupled with the decline in results in the first half of fiscal 2018 and the future outlook as a result of competitive pressure, the Company determined that both a test for recoverability of long-lived assets and a goodwill impairment analysis should be performed. The determination of the need for a goodwill analysis was based on the assertion that it was more likely than not that the fair value of the reporting unit was below its carrying amount. As a result of both these analyses, the Company recorded a total impairment charge of
$3.4 million
on long-lived assets and
$7.9 million
to goodwill, respectively, during the second quarter of fiscal 2018. During the fourth quarter of fiscal 2018 the Company disposed of its Earth Origins retail business.
Goodwill and Intangible Assets Changes
Changes in the carrying value of Goodwill by reportable segment that have goodwill consisted of the following:
|
(in thousands)
|
Wholesale
|
Other
|
Total
|
|||||||||
|
Goodwill as of July 29, 2017
(1)(2)
|
$
|
353,234
|
|
$
|
18,025
|
|
$
|
371,259
|
|
|||
|
Impairment charge
|
—
|
|
(7,872
|
)
|
(7,872
|
)
|
||||||
|
Goodwill adjustment for prior fiscal year business combinations
|
220
|
|
—
|
|
220
|
|
||||||
|
Change in foreign exchange rates
|
(1,112
|
)
|
—
|
|
(1,112
|
)
|
||||||
|
Goodwill as of July 28, 2018
(1)(2)
|
352,342
|
|
10,153
|
|
362,495
|
|
||||||
|
Goodwill from current fiscal year business combinations
|
374,757
|
|
—
|
|
374,757
|
|
||||||
|
Impairment charge
|
(292,757
|
)
|
—
|
|
(292,757
|
)
|
||||||
|
Other adjustments
|
(1,951
|
)
|
—
|
|
(1,951
|
)
|
||||||
|
Change in foreign exchange rates
|
(288
|
)
|
—
|
|
(288
|
)
|
||||||
|
Goodwill as of August 3, 2019
(1)(2)
|
$
|
432,103
|
|
$
|
10,153
|
|
$
|
442,256
|
|
|||
|
(1)
|
Wholesale amounts are net of accumulated goodwill impairment charges of
$0.0 million
,
$0.0 million
and
$292.8 million
for
fiscal 2017
,
2018
and
2019
, respectively.
|
|
(2)
|
Other amounts are net of accumulated goodwill impairment charges of
$1.4 million
,
$9.3 million
and
$9.3 million
for
fiscal 2017
,
2018
and
2019
, respectively.
|
Intangible assets, net consisted of the following:
|
2019
|
2018
|
||||||||||||||||||||||
|
(in thousands)
|
Gross Carrying Amount
|
Accumulated Amortization
|
Net
|
Gross Carrying Amount
|
Accumulated Amortization
|
Net
|
|||||||||||||||||
|
Amortizing intangible assets:
|
|||||||||||||||||||||||
|
Customer relationships
|
$
|
1,007,089
|
|
$
|
111,940
|
|
$
|
895,149
|
|
$
|
197,246
|
|
$
|
61,543
|
|
$
|
135,703
|
|
|||||
|
Non-compete agreements
|
12,900
|
|
6,237
|
|
6,663
|
|
2,900
|
|
1,914
|
|
986
|
|
|||||||||||
|
Operating lease intangibles
|
32,103
|
|
2,209
|
|
29,894
|
|
—
|
|
—
|
|
—
|
|
|||||||||||
|
Trademarks and tradenames
|
67,700
|
|
14,161
|
|
53,539
|
|
1,700
|
|
981
|
|
719
|
|
|||||||||||
|
Total amortizing intangible assets
|
1,119,792
|
|
134,547
|
|
985,245
|
|
201,846
|
|
64,438
|
|
137,408
|
|
|||||||||||
|
Indefinite lived intangible assets:
|
|||||||||||||||||||||||
|
Trademarks and tradenames
|
55,813
|
|
—
|
|
55,813
|
|
55,801
|
|
—
|
|
55,801
|
|
|||||||||||
|
Intangibles assets, net
|
$
|
1,175,605
|
|
$
|
134,547
|
|
$
|
1,041,058
|
|
$
|
257,647
|
|
$
|
64,438
|
|
$
|
193,209
|
|
|||||
85
Amortization expense was
$70.3 million
,
$15.0 million
and
$15.2 million
for
fiscal 2019
,
2018
and
2017
, respectively. The estimated future amortization expense for each of the next five fiscal years and thereafter on definite lived intangible assets existing as of
August 3, 2019
is shown below:
|
Fiscal Year:
|
(In thousands)
|
||
|
2020
|
$
|
87,304
|
|
|
2021
|
73,192
|
|
|
|
2022
|
67,544
|
|
|
|
2023
|
67,232
|
|
|
|
2024
|
67,453
|
|
|
|
Thereafter
|
622,520
|
|
|
|
$
|
985,245
|
|
|
NOTE 8—FAIR VALUE MEASUREMENTS OF FINANCIAL INSTRUMENTS
Recurring Fair Value Measurements
The following table provides the fair value hierarchy for financial assets and liabilities measured on a recurring basis as of
August 3, 2019
and
July 28, 2018
:
|
Fair Value at August 3, 2019
|
||||||||||||||
|
(In thousands)
|
Consolidated Balance Sheets Location
|
Level 1
|
Level 2
|
Level 3
|
||||||||||
|
Assets:
|
||||||||||||||
|
Interest rate swaps designated as hedging instruments
|
Prepaid expenses and other current assets
|
$
|
—
|
|
$
|
389
|
|
$
|
—
|
|
||||
|
Mutual funds
|
Prepaid expenses and other current assets
|
$
|
7
|
|
$
|
—
|
|
$
|
—
|
|
||||
|
Interest rate swaps designated as hedging instruments
|
Other assets
|
$
|
—
|
|
$
|
145
|
|
$
|
—
|
|
||||
|
Mutual funds
|
Other assets
|
$
|
1,799
|
|
$
|
—
|
|
$
|
—
|
|
||||
|
Liabilities:
|
||||||||||||||
|
Interest rate swaps designated as hedging instruments
|
Accrued expenses and other current liabilities
|
$
|
—
|
|
$
|
16,360
|
|
$
|
—
|
|
||||
|
Interest rate swaps designated as hedging instruments
|
Other long-term liabilities
|
$
|
—
|
|
$
|
60,737
|
|
$
|
—
|
|
||||
|
Fair Value at July 28, 2018
|
||||||||||||||
|
(In thousands)
|
Consolidated Balance Sheets Location
|
Level 1
|
Level 2
|
Level 3
|
||||||||||
|
Assets:
|
||||||||||||||
|
Interest rate swaps designated as hedging instruments
|
Prepaid expenses and other current assets
|
$
|
—
|
|
$
|
1,459
|
|
$
|
—
|
|
||||
|
Interest rate swaps designated as hedging instruments
|
Other assets
|
$
|
—
|
|
$
|
5,860
|
|
$
|
—
|
|
||||
Interest Rate Swap Contracts
The fair values of interest rate swap contracts are measured using Level 2 inputs. The interest rate swap contracts are valued using an income approach interest rate swap valuation model incorporating observable market inputs including interest rates, LIBOR swap rates and credit default swap rates. As of
August 3, 2019
, a
100 basis point
increase in forward LIBOR interest rates would increase the fair value of the interest rate swaps by approximately
$69.7 million
; a
100 basis point
decrease in forward LIBOR interest rates would decrease the fair value of the interest rate swaps by approximately
$73.0 million
. Refer to
Note 9—Derivatives
for further information on interest rate swap contracts.
86
Mutual Funds
Mutual fund assets consist of balances held in investments to fund certain deferred compensation plans. The fair values of mutual fund assets are based on quoted market prices of the mutual funds held by the plan at each reporting period. Mutual funds traded in active markets are classified within Level 1 of the fair value hierarchy.
Fair Value Estimates
For certain of the Company’s financial instruments including cash and cash equivalents, receivables, accounts payable, accrued vacation, compensation and benefits, and other current assets and liabilities the fair values approximate carrying amounts due to their short maturities.
Notes receivable estimated fair value is determined by a discounted cash flow approach applying a market rate for similar instruments that is determined using Level 3 inputs. Refer to
Note 1—Significant Accounting Policies
for additional information regarding the fair value hierarchy.
The estimated fair value of our long-term debt was
$176.2 million
less than the carrying value as of
August 3, 2019
. There was no difference in the estimated fair value and carrying value of our long-term debt as of
July 28, 2018
. The estimated fair values are based on market quotes, where available, or market values for similar instruments, using Level 2 and 3 inputs. In the table below, the carrying value of our long-term debt is net of original issue discounts and debt issuance costs.
|
|
August 3, 2019
|
July 28, 2018
|
||||||||||||||
|
(in thousands)
|
Carrying Value
|
Fair Value
|
Carrying Value
|
Fair Value
|
||||||||||||
|
Notes receivable, including current portion
|
$
|
46,320
|
|
$
|
45,232
|
|
$
|
1,930
|
|
$
|
1,930
|
|
||||
|
Long-term debt, including current portion
|
$
|
2,906,483
|
|
$
|
2,730,271
|
|
$
|
320,000
|
|
$
|
320,000
|
|
||||
Fuel Supply Agreements and Derivatives
To reduce diesel price risk, we have in the past, and may in the future, periodically enter in to derivative financial instruments and/or forward purchase commitments for a portion of our projected monthly diesel fuel requirements at fixed prices. During the fiscal years ended
August 3, 2019
and
July 28, 2018
, the Company did not enter into any such agreements or derivatives.
Foreign Exchange Derivatives
To reduce foreign exchange risk, we have in the past, and may in the future, periodically enter in to derivative financial instruments for a portion of our projected monthly foreign currency requirements at fixed prices. As of
August 3, 2019
and
July 28, 2018
, our outstanding foreign currency forward contracts were immaterial.
NOTE 9—DERIVATIVES
Management of Interest Rate Risk
The Company enters into interest rate swap contracts from time to time to mitigate its exposure to changes in market interest rates as part of its overall strategy to manage its debt portfolio to achieve an overall desired position of notional debt amounts subject to fixed and floating interest rates. Interest rate swap contracts are entered into for periods consistent with related underlying exposures and do not constitute positions independent of those exposures. The Company’s interest rate swap contracts are designated as cash flow hedges at
August 3, 2019
. Interest rate swap contracts are reflected at their fair values in the Consolidated Balance Sheets. Refer to
Note 8—Fair Value Measurements of Financial Instruments
for further information on the fair value of interest rate swap contracts.
87
Details of outstanding swap contracts as of
August 3, 2019
, which are all pay fixed and receive floating, are as follows:
|
Swap Maturity
|
Notional Value (in millions)
|
Pay Fixed Rate
|
Receive Floating Rate
|
Floating Rate Reset Terms
|
|||||||
|
April 29, 2021
(1)
|
$
|
25.0
|
|
1.0650
|
%
|
One-Month LIBOR
|
Monthly
|
||||
|
April 29, 2021
(2)
|
25.0
|
|
0.9260
|
%
|
One-Month LIBOR
|
Monthly
|
|||||
|
August 15, 2022
(3)
|
60.0
|
|
1.7950
|
%
|
One-Month LIBOR
|
Monthly
|
|||||
|
August 15, 2022
(4)
|
40.0
|
|
1.7950
|
%
|
One-Month LIBOR
|
Monthly
|
|||||
|
October 31, 2020
(5)
|
100.0
|
|
2.8240
|
%
|
One-Month LIBOR
|
Monthly
|
|||||
|
October 31, 2022
(5)
|
100.0
|
|
2.8915
|
%
|
One-Month LIBOR
|
Monthly
|
|||||
|
October 31, 2023
(5)
|
100.0
|
|
2.9210
|
%
|
One-Month LIBOR
|
Monthly
|
|||||
|
October 22, 2025
(5)
|
50.0
|
|
2.9550
|
%
|
One-Month LIBOR
|
Monthly
|
|||||
|
March 31, 2023
(6)
|
150.0
|
|
2.8950
|
%
|
One-Month LIBOR
|
Monthly
|
|||||
|
October 22, 2025
(6)
|
50.0
|
|
2.9580
|
%
|
One-Month LIBOR
|
Monthly
|
|||||
|
October 22, 2025
(6)
|
50.0
|
|
2.9590
|
%
|
One-Month LIBOR
|
Monthly
|
|||||
|
October 29, 2021
(7)
|
100.0
|
|
2.8084
|
%
|
One-Month LIBOR
|
Monthly
|
|||||
|
September 30, 2023
(7)
|
50.0
|
|
2.8315
|
%
|
One-Month LIBOR
|
Monthly
|
|||||
|
October 31, 2024
(7)
|
100.0
|
|
2.8480
|
%
|
One-Month LIBOR
|
Monthly
|
|||||
|
October 31, 2022
(8)
|
50.0
|
|
2.4678
|
%
|
One-Month LIBOR
|
Monthly
|
|||||
|
March 28, 2024
(8)
|
100.0
|
|
2.4770
|
%
|
One-Month LIBOR
|
Monthly
|
|||||
|
October 31, 2024
(8)
|
100.0
|
|
2.5010
|
%
|
One-Month LIBOR
|
Monthly
|
|||||
|
April 29, 2021
(9)
|
50.0
|
|
2.5500
|
%
|
One-Month LIBOR
|
Monthly
|
|||||
|
October 31, 2022
(9)
|
50.0
|
|
2.5255
|
%
|
One-Month LIBOR
|
Monthly
|
|||||
|
March 31, 2023
(9)
|
50.0
|
|
2.5292
|
%
|
One-Month LIBOR
|
Monthly
|
|||||
|
March 28, 2024
(9)
|
100.0
|
|
2.5420
|
%
|
One-Month LIBOR
|
Monthly
|
|||||
|
October 31, 2024
(10)
|
50.0
|
|
2.5210
|
%
|
One-Month LIBOR
|
Monthly
|
|||||
|
October 22, 2025
(10)
|
50.0
|
|
2.5558
|
%
|
One-Month LIBOR
|
Monthly
|
|||||
|
April 15, 2022
(11)
|
100.0
|
|
2.3645
|
%
|
One-Month LIBOR
|
Monthly
|
|||||
|
December 13, 2019
(12)
|
100.0
|
|
2.4925
|
%
|
One-Month LIBOR
|
Monthly
|
|||||
|
May 15, 2020
(12)
|
100.0
|
|
2.4490
|
%
|
One-Month LIBOR
|
Monthly
|
|||||
|
June 30, 2021
(13)
|
100.0
|
|
2.2520
|
%
|
One-Month LIBOR
|
Monthly
|
|||||
|
June 30, 2022
(13)
|
100.0
|
|
2.2170
|
%
|
One-Month LIBOR
|
Monthly
|
|||||
|
June 30, 2021
(14)
|
50.0
|
|
2.2290
|
%
|
One-Month LIBOR
|
Monthly
|
|||||
|
June 30, 2022
(14)
|
50.0
|
|
2.1840
|
%
|
One-Month LIBOR
|
Monthly
|
|||||
|
$
|
2,200.0
|
|
|||||||||
|
(1)
|
On June 7, 2016, the Company entered into a pay fixed and receive floating interest rate swap contract to effectively fix the underlying variability in expected interest payment cash outflows on its LIBOR based debt. The agreement has an effective date of June 9, 2016 and expires in April 2021. The interest rate swap contract has a notional principal amount of
$25 million
and requires the Company to pay interest payments during the duration of the contract at a fixed annual rate of
1.0650%
, while receiving interest for the same contract period at one-month LIBOR on the same notional principal amount.
|
|
(2)
|
On June 24, 2016, the Company entered into a pay fixed and receive floating interest rate swap contract to effectively fix the underlying variability in expected interest payment cash outflows on its LIBOR based debt. The agreement has an effective date of June 24, 2016 and expires in April 2021. The interest rate swap contract has a notional principal amount of
$25 million
and requires the Company to pay interest payments during the duration of the contract at a fixed annual rate of
0.9260%
, while receiving interest for the same contract period at one-month LIBOR on the same notional principal amount.
|
|
(3)
|
On January 23, 2015, the Company entered into a pay fixed and receive floating interest rate swap contract to effectively fix the underlying variability in expected interest payment cash outflows on its LIBOR based debt. The agreement has an effective date of August 3, 2015 and expires in August 2022. On March 31, 2015, the Company amended the original contract to reduce the beginning notional principal amount from
$140 million
to
$84 million
. The interest rate swap contract has an amortizing notional principal amount which adjusts down on a quarterly basis and requires the Company to pay interest payments during the duration of the contract at a fixed annual rate of
1.7950%
, while receiving interest for the same respective contract period at one-month LIBOR on the same notional principal amount.
|
|
(4)
|
On March 31, 2015, the Company entered into a pay fixed and receive floating interest rate swap contract to effectively fix the underlying variability in expected interest payment cash outflows on its LIBOR based debt. The agreement has an effective date of August 3, 2015 and expires in August 2022. The interest rate swap contract has an amortizing notional principal amount which adjusts down on a quarterly basis and requires the Company to pay interest payments during the duration of the contract at a fixed annual rate of
1.7950%
, while receiving interest for the same respective contract period at one-month LIBOR on the same notional principal amount.
|
88
|
(5)
|
On October 26, 2018, the Company entered into four pay fixed receive floating interest rate swap contracts to effectively fix the underlying variability in expected interest payment cash outflows on its LIBOR based debt. The agreements have an effective date of October 26, 2018 and expire at varied dates between October 2020 and October 2025. These interest rate swap contracts have an aggregate notional principal amount of
$350 million
and require the Company to pay interest payments during the duration of the respective contracts at fixed annual rates between
2.8240%
and
2.9550%
, while receiving interest for the same respective contract periods at one-month LIBOR on the same aggregate notional principal amounts.
|
|
(6)
|
On November 16, 2018, the Company entered into three pay fixed receive floating interest rate swap contracts to effectively fix the underlying variability in expected interest payment cash outflows on its LIBOR based debt. The agreements have an effective date of November 16, 2018 and expire at varied dates between March 2023 and October 2025. These interest rate swap contracts have an aggregate notional principal amount of
$250 million
and require the Company to pay interest payments during the duration of the respective contracts at fixed annual rates between
2.8950%
and
2.9590%
, while receiving interest for the same respective contract periods at one-month LIBOR on the same aggregate notional principal amounts.
|
|
(7)
|
On November 30, 2018, the Company entered into three pay fixed receive floating interest rate swap contracts to effectively fix the underlying variability in expected interest payment cash outflows on its LIBOR based debt. The agreements have an effective date of November 30, 2018 and expire at varied dates between October 2021 and October 2024. These interest rate swap contracts have an aggregate notional principal amount of
$250 million
and require the Company to pay interest payments during the duration of the respective contracts at fixed annual rates between
2.8084%
and
2.8480%
, while receiving interest for the same respective contract periods at one-month LIBOR on the same aggregate notional principal amounts.
|
|
(8)
|
On January 11, 2019, the Company entered into three pay fixed receive floating interest rate swap contracts to effectively fix the underlying variability in expected interest payment cash outflows on its LIBOR based debt. The agreements have an effective date of January 11, 2019 and expire at varied dates between October 2022 and October 2024. These interest rate swap contracts have an aggregate notional principal amount of
$250 million
and require the Company to pay interest payments during the duration of the respective contracts at fixed annual rates between
2.4678%
and
2.5010%
, while receiving interest for the same respective contract periods at one-month LIBOR on the same aggregate notional principal amounts.
|
|
(9)
|
On January 23, 2019, the Company entered into four pay fixed receive floating interest rate swap contracts to effectively fix the underlying variability in expected interest payment cash outflows on its LIBOR based debt. The agreements have an effective date of January 23, 2019 and expire at varied dates between April 2021 and March 2024. These interest rate swap contracts have an aggregate notional principal amount of
$250 million
and require the Company to pay interest payments during the duration of the respective contracts at fixed annual rates between
2.5255%
and
2.5500%
, while receiving interest for the same respective contract periods at one-month LIBOR on the same aggregate notional principal amounts.
|
|
(10)
|
On January 24, 2019, the Company entered into two pay fixed receive floating interest rate swap contracts to effectively fix the underlying variability in expected interest payment cash outflows on its LIBOR based debt. The agreements have an effective date of January 24, 2019 and expire at varied dates between October 2024 and October 2025. These interest rate swap contracts have an aggregate notional principal amount of
$100 million
and require the Company to pay interest payments during the duration of the respective contracts at fixed annual rates between
2.5210%
and
2.5558%
, while receiving interest for the same respective contract periods at one-month LIBOR on the same aggregate notional principal amounts.
|
|
(11)
|
On March 18, 2019, the Company entered into a pay fixed and receive floating interest rate swap contract to effectively fix the underlying variability in expected interest payment cash outflows on its LIBOR based debt. The agreement has an effective date of March 21, 2019 and expires in April 2022. The interest rate swap contract has a notional principal amount of
$100.0 million
and requires the Company to pay interest payments during the duration of the contract at a fixed annual rate of
2.3645%
, while receiving interest for the same contract period at one-month LIBOR on the same notional principal amount.
|
|
(12)
|
On March 21, 2019, the Company entered into two pay fixed receive floating interest rate swap contracts to effectively fix the underlying variability in expected interest payment cash outflows on its LIBOR based debt. The agreements have an effective date of March 21, 2019 and expire at varied dates between December 2019 and May 2020. These interest rate swap contracts have an aggregate notional principal amount of
$200 million
and require the Company to pay interest payments during the duration of the respective contracts at fixed annual rates between
2.4490%
and
2.4925%
, while receiving interest for the same respective contract periods at one-month LIBOR on the same aggregate notional principal amounts.
|
|
(13)
|
On April 2, 2019, the Company entered into two pay fixed receive floating interest rate swap contracts to effectively fix the underlying variability in expected interest payment cash outflows on its LIBOR based debt. The agreements have an effective date of April 2, 2019 and expire at varied dates between June 2021 and June 2022. These interest rate swap contracts have an aggregate notional principal amount of
$200 million
and require the Company to pay interest payments during the duration of the respective contracts at fixed annual rates between
2.2170%
and
2.2520%
, while receiving interest for the same respective contract periods at one-month LIBOR on the same aggregate notional principal amounts.
|
|
(14)
|
On April 2, 2019, the Company entered into two pay fixed receive floating interest rate swap contracts to effectively fix the underlying variability in expected interest payment cash outflows on its LIBOR based debt. The agreements have an effective date of June 10, 2019 and June 28, 2019 and expire at varied dates between June 2021 and June 2022. These interest rate swap contracts have an aggregate notional principal amount of
$100 million
and require the Company to pay interest payments during the duration of the respective contracts at fixed annual rates between
2.1840%
and
2.2290%
, while receiving interest for the same respective contract periods at one-month LIBOR on the same aggregate notional principal amounts.
|
The Company performs an initial quantitative assessment of hedge effectiveness using the “Hypothetical Derivative Method” in the period in which the hedging transaction is entered. Under this method, the Company assesses the effectiveness of each hedging relationship by comparing the changes in cash flows of the derivative hedging instrument with the changes in cash flows of the designated hedged transactions. In future reporting periods, the Company performs a qualitative analysis for quarterly prospective and retrospective assessments of hedge effectiveness. The Company also monitors the risk of counterparty default on an ongoing basis and noted that the counterparties are reputable financial institutions. The entire change in the fair value of the derivative is initially reported in Other comprehensive income (outside of earnings) in the Consolidated Statements of Comprehensive Income and subsequently reclassified to earnings in Interest expense, net in the Consolidated Statements of Operations when the hedged transactions affect earnings.
89
The location and amount of gains or losses recognized in the Consolidated Statements of Operations for interest rate swap contracts for each of the periods, presented on a pretax basis, are as follows:
|
Interest Expense, net
|
||||||||||||
|
(In thousands)
|
2019
|
2018
|
2017
|
|||||||||
|
Total amounts of expense line items presented in the Consolidated Statements of Operations in which the effects of cash flow hedges are recorded
|
$
|
179,963
|
|
$
|
16,025
|
|
$
|
16,754
|
|
|||
|
Gain or (loss) on cash flow hedging relationships:
|
||||||||||||
|
Gain or (loss) reclassified from comprehensive income into income
|
$
|
13
|
|
$
|
827
|
|
$
|
(1,462
|
)
|
|||
|
Gain or (loss) on interest rate swap contracts not designated as hedging instruments:
|
||||||||||||
|
Gain or (loss) recognized as interest expense
|
$
|
51
|
|
$
|
—
|
|
$
|
—
|
|
|||
NOTE 10—LONG-TERM DEBT
The Company’s long-term debt consisted of the following:
|
(in thousands)
|
Average Interest Rate at
August 3, 2019 |
Calendar Maturity Year
|
August 3, 2019
|
July 28, 2018
|
|||||||
|
Term Loan Facility
|
6.40%
|
2019-2025
|
$
|
1,864,900
|
|
$
|
—
|
|
|||
|
ABL Credit Facility
|
3.58%
|
2023
|
1,080,000
|
|
—
|
|
|||||
|
Other secured loans
|
5.54%
|
2023-2024
|
57,649
|
|
—
|
|
|||||
|
Former ABL Credit Facility
|
—
|
|
210,000
|
|
|||||||
|
Former Term Loan Facility
|
—
|
|
110,000
|
|
|||||||
|
Debt issuance costs, net
|
(54,891
|
)
|
(1,164
|
)
|
|||||||
|
Original issue discount on debt
|
(41,175
|
)
|
—
|
|
|||||||
|
Long-term debt, including current portion
|
2,906,483
|
|
318,836
|
|
|||||||
|
Less: current portion of long-term debt
|
(87,433
|
)
|
(10,000
|
)
|
|||||||
|
Long-term debt
|
$
|
2,819,050
|
|
$
|
308,836
|
|
|||||
Future maturities of long-term debt, excluding debt issuance costs and original issue and purchase accounting discounts on debt, as of
August 3, 2019
, consist of the following:
|
Fiscal Year
|
(In thousands)
|
|||
|
2020
|
$
|
102,713
|
|
|
|
2021
|
30,413
|
|
||
|
2022
|
31,091
|
|
||
|
2023
|
31,806
|
|
||
|
2024
|
1,105,526
|
|
||
|
2025 and thereafter
|
1,701,000
|
|
||
|
$
|
3,002,549
|
|
||
ABL Credit Facility
On August 30, 2018, the Company entered into a loan agreement (as amended by that certain First Amendment to Loan Agreement, dated as of October 19, 2018, and as further amended by that certain Second Amendment to Loan Agreement, dated January 24, 2019, the “ABL Loan Agreement”), by and among the Company and United Natural Foods West, Inc. (together with the Company, the “U.S. Borrowers”) and UNFI Canada, Inc. (the “Canadian Borrower” and, together with the U.S. Borrowers, the “Borrowers”), the financial institutions that are parties thereto as lenders (collectively, the “ABL Lenders”), Bank of America, N.A. as administrative agent for the ABL Lenders (the “ABL Administrative Agent”), Bank of America, N.A. (acting through its Canada branch), as Canadian agent for the ABL Lenders (the “Canadian Agent”), and the other parties thereto.
90
The ABL Loan Agreement provides for a secured asset-based revolving credit facility (the “ABL Credit Facility” and the loans thereunder, the “ABL Loans”), of which up to (i)
$2,050.0 million
is available to the U.S. Borrowers and (ii)
$50.0 million
is available to the Canadian Borrower. The ABL Loan Agreement also provides for (i) a
$125.0 million
sublimit of availability for letters of credit of which there is a further
$5.0 million
sublimit for the Canadian Borrower, and (ii) a
$100.0 million
sublimit for short-term borrowings on a swingline basis of which there is a further
$3.5 million
sublimit for the Canadian Borrower. The ABL Credit Facility replaced the Company’s
$900.0 million
prior asset-based revolving credit facility (the “Former ABL Credit Facility”). In addition,
$1,475.0 million
of proceeds from the ABL Credit Facility were drawn to finance the Supervalu acquisition and related transaction costs on the Supervalu acquisition date (the “Closing Date”).
Under the ABL Loan Agreement, the Borrowers may, at their option, increase the aggregate amount of the ABL Credit Facility in an amount of up to
$600.0 million
without the consent of any ABL Lenders not participating in such increase, subject to certain customary conditions and applicable lenders committing to provide the increase in funding. There is no assurance that additional funding would be available.
The Borrowers’ obligations under the ABL Credit Facility are guaranteed by most of the Company’s wholly-owned subsidiaries who are not also Borrowers (collectively, the “ABL Guarantors”), subject to customary exceptions and limitations. The Borrowers’ obligations under the ABL Credit Facility and the ABL Guarantors’ obligations under the related guarantees are secured by (i) a first-priority lien on all of the Borrowers’ and ABL Guarantors’ accounts receivable, inventory and certain other assets arising therefrom or related thereto (including substantially all of their deposit accounts, collectively, the “ABL Assets”) and (ii) a second-priority lien on all of the Borrowers’ and ABL Guarantors’ assets that do not constitute ABL Assets, in each case, subject to customary exceptions and limitations.
Availability under the ABL Credit Facility is subject to a borrowing base (the “Borrowing Base”), which is based on
90%
of eligible accounts receivable, plus
90%
of eligible credit card receivables, plus
90%
of the net orderly liquidation value of eligible inventory, plus
90%
of eligible pharmacy receivables, plus certain pharmacy scripts availability of the Borrowers, after adjusting for customary reserves. The aggregate amount of the ABL Loans made and letters of credit issued under the ABL Credit Facility shall at no time exceed the lesser of the aggregate commitments under the ABL Credit Facility (currently
$2,100.0 million
or, if increased at the Borrowers’ option as described above, up to
$2,700.0 million
) or the Borrowing Base. To the extent that the Borrowers’ Borrowing Base declines, the availability under the ABL Credit Facility may decrease below
$2,100.0 million
.
As of
August 3, 2019
, the U.S. Borrowers’ Borrowing Base, net of
$119.6 million
of reserves, was
$2,036.5 million
, which is below the
$2,050.0 million
limit of availability to the U.S. Borrowers under the ABL Credit Facility. As of
August 3, 2019
, the Canadian Borrower’s Borrowing Base, net of
$3.6 million
of reserves, was
$38.9 million
, resulting in total Borrowing Base of
$2,075.4 million
supporting the ABL Loans. As of
August 3, 2019
, the U.S. Borrowers had
$1,080.0 million
of ABL Loans outstanding, which are presented net of debt issuance costs of
$12.9 million
and are included in Long-term debt in the Consolidated Balance Sheets, and the Canadian Borrower had no ABL Loans outstanding under the ABL Credit Facility. As of
August 3, 2019
, the U.S. Borrowers had
$76.2 million
in letters of credit and the Canadian Borrower had no letters of credit outstanding under the ABL Credit Facility. The Company’s resulting remaining availability under the ABL Credit Facility was
$919.2 million
as of
August 3, 2019
.
The ABL Loans of the U.S. Borrowers under the ABL Credit Facility bear interest at rates that, at the U.S. Borrowers’ option, can be either: (i) a base rate and an applicable margin, or (ii) a LIBOR rate and an applicable margin. As of
August 3, 2019
, the applicable margin for base rate loans was
0.25%
, and the applicable margin for LIBOR loans was
1.25%
. The ABL Loans of the Canadian Borrower under the ABL Credit Facility bear interest at rates that, at the Canadian Borrower’s option, can be either: (i) prime rate and an applicable margin, or (ii) a Canadian dollar bankers’ acceptance equivalent rate and an applicable margin. As of
August 3, 2019
, the applicable margin for prime rate loans was
0.25%
, and the applicable margin for Canadian dollar bankers’ acceptance equivalent rate loans was
1.25%
. Commencing on the first day of the calendar month following the ABL Administrative Agent’s receipt of the Company’s aggregate availability calculation for the fiscal quarter ending on
August 3, 2019
, and quarterly thereafter, the applicable margins for borrowings by the U.S. Borrowers and Canadian Borrower will be subject to adjustment based upon the aggregate availability under the ABL Credit Facility. Unutilized commitments under the ABL Credit Facility are subject to a per annum fee of (i)
0.375%
if the average daily total outstandings were less than
25%
of the aggregate commitments during the preceding fiscal quarter, or (ii)
0.25%
if such average daily total outstandings were
25%
or more of the aggregate commitments during the preceding fiscal quarter. As of
August 3, 2019
, the unutilized commitment fee was
0.25%
per annum. The Borrowers are also required to pay a letter of credit fronting fee to each letter of credit issuer equal to
0.125%
per annum of the amount available to be drawn under each such letter of credit (or such other amount as may be mutually agreed by the Borrowers and the applicable letter of credit issuer), as well as a fee to all lenders equal to the applicable margin for LIBOR or Canadian dollar bankers’ acceptance equivalent rate loans, as applicable, times the average daily amount available to be drawn under all outstanding letters of credit.
91
The ABL Loan Agreement subjects the Company to a fixed charge coverage ratio (as defined in the ABL Loan Agreement) of at least
1.0
to
1.0
calculated at the end of each of our fiscal quarters on a rolling four quarter basis when the adjusted aggregate availability (as defined in the ABL Loan Agreement) is less than the greater of (i)
$235.0 million
and (ii)
10%
of the aggregate borrowing base. We were not subject to the fixed charge coverage ratio covenant under the ABL Loan Agreement during the fourth quarter of fiscal 2019.
The assets included in the Consolidated Balance Sheets securing the outstanding borrowings under the ABL Credit Facility on a first-priority basis, and the unused available credit and fees under the ABL Credit Facility, were as follows:
|
Assets securing the ABL Credit Facility (in thousands)
(1)
:
|
August 3, 2019
|
||
|
Certain inventory assets included in Inventories and Current assets of discontinued operations
|
$
|
2,172,662
|
|
|
Certain receivables included in Accounts receivable, net and Current assets of discontinued operations
|
$
|
916,543
|
|
|
(1)
|
The ABL Credit Facility is also secured by all of the Company’s pharmacy scripts, which are included in Long-term assets of discontinued operations in the Consolidated Balance Sheets as of
August 3, 2019
.
|
|
Unused available credit and fees under the ABL Credit Facility (in thousands, except percentages):
|
August 3, 2019
|
||
|
Outstanding letters of credit
|
$
|
76,199
|
|
|
Letter of credit fees
|
1.375
|
%
|
|
|
Unused available credit
|
$
|
919,154
|
|
|
Unused facility fees
|
0.25
|
%
|
|
The ABL Loan Agreement contains other customary affirmative and negative covenants and customary representations and warranties that must be accurate in order for the Borrowers to borrow under the ABL Credit Facility. The ABL Loan Agreement also contains customary events of default, including, but not limited to, payment defaults, breaches of representations and warranties, covenant defaults, events of bankruptcy and insolvency, failure of any guaranty or security document supporting the ABL Credit Facility to be in full force and effect, and a change of control. If an event of default occurs and is continuing, the Borrowers may be required immediately to repay all amounts outstanding under the ABL Loan Agreement.
Term Loan Facility
On August 14, 2014, the Company and certain of its subsidiaries entered into a real estate-backed term loan agreement (as amended by the First Amendment Agreement, dated April 29, 2016, and the Second Amendment Agreement, dated September 1, 2016, the “Former Term Loan Agreement”). The Former Term Loan Agreement provided for secured first lien term loans in an aggregate amount of
$150.0 million
(the “Former Term Loan Facility”). Proceeds from this Former Term Loan Facility were used to pay down borrowings under the Former ABL Credit Facility.
Borrowings under the Former Term Loan Facility bore interest at rates that, at the Company’s option, could have been either: (i) a base rate and a margin of
0.75%
; or, (ii) a LIBOR rate and a margin of
1.75%
. The borrowers’ obligations under the Former Term Loan Facility were secured by certain parcels of the Company’s real property.
The Former Term Loan Agreement included financial covenants that required (i) the ratio of the Company’s consolidated EBITDA (as defined in the Former Term Loan Agreement) minus the unfinanced portion of Capital Expenditures (as defined in the Former Term Loan Agreement) to the Company’s consolidated Fixed Charges (as defined in the Former Term Loan Agreement) to be at least
1.20
to
1.00
as of the end of any period of
four
fiscal quarters, (ii) the ratio of the Company’s Consolidated Funded Debt (as defined in the Former Term Loan Agreement) to the Company’s EBITDA for the
four
fiscal quarters most recently ended to be not more than
3.00
to
1.00
as of the end of any fiscal quarter and (iii) the ratio, expressed as a percentage, of the Company’s outstanding borrowings under the Former Term Loan Facility), divided by the Mortgaged Property Value (as defined in the Former Term Loan Agreement) to be not more than
75%
at any time.
On August 22, 2018, the Company notified its lenders of its intention to prepay its borrowings outstanding under its Former Term Loan Facility on October 1, 2018. The Former Term Loan Facility was previously scheduled to terminate on the earlier of (a) August 14, 2022 and (b) the date that is ninety days prior to the termination date of the Former ABL Loan Agreement. On October 1, 2018, the Company prepaid the
$110.0 million
of borrowings outstanding under the Former Term Loan Agreement utilizing borrowings under its Former ABL Credit Facility and terminated the Former Term Loan Agreement. In connection with the prepayment, the Company incurred a loss on debt extinguishment related to unamortized debt issuance costs of
$0.4 million
, which was recorded as Other expense in the Consolidated Statements of Operations for the first quarter of fiscal 2019.
92
On the Closing Date, the Company entered into a new term loan agreement (the “Term Loan Agreement”), by and among the Company and Supervalu (collectively, the “Term Borrowers”), the financial institutions that are parties thereto as lenders (collectively, the “ Term Lenders”), Goldman Sachs Bank USA, as administrative agent for the Lenders (the “TLB Administrative Agent”), and the other parties thereto. The Term Loan Agreement provides for senior secured first lien term loans in an aggregate principal amount of
$1,950.0 million
, consisting of a
$1,800.0 million
seven
-year tranche (the “Term B Tranche”) and a
$150.0 million
364
-day tranche (the “364-day Tranche” and, together with the Term B Tranche, collectively, the “Term Loan Facility”). The entire amount of the net proceeds from the Term Loan Facility were used to finance the Supervalu acquisition and related transaction costs.
The loans under the Term B Tranche will be payable in full on October 22, 2025; provided that if on or prior to December 31, 2024 that certain Agreement for Distribution of Products, dated as of October 30, 2015, by and between Whole Foods Market Distribution, Inc., a Delaware corporation, and the Company has not been extended until at least October 23, 2025 on terms not materially less favorable, taken as a whole, to the Company and its subsidiaries than those in effect on the date of the Acquisition, then the loans under the Term B Tranche will be payable in full on December 31, 2024. The loans under the 364-day Tranche will be payable in full on October 21, 2019.
Under the Term Loan Agreement, the Term Borrowers may, at their option, increase the amount of the Term B Tranche, add one or more additional tranches of term loans or add one or more additional tranches of revolving credit commitments, without the consent of any Term Lenders not participating in such additional borrowings, up to an aggregate amount of
$656.25 million
plus additional amounts based on satisfaction of certain leverage ratio tests, subject to certain customary conditions and applicable lenders committing to provide the additional funding. There can be no assurance that additional funding would be available.
The Term Borrowers’ obligations under the Term Loan Facility are guaranteed by most of the Company’s wholly-owned domestic subsidiaries who are not also Term Borrowers (collectively, the “Term Guarantors”), subject to customary exceptions and limitations, including an exception for immaterial subsidiaries designated by the Company from time to time. The Term Borrowers’ obligations under the Term Loan Facility and the Term Guarantors’ obligations under the related guarantees are secured by (i) a first-priority lien on substantially all of the Term Borrowers’ and the Term Guarantors’ assets other than the ABL Assets and (ii) a second-priority lien on substantially all of the Term Borrowers’ and the Term Guarantors’ ABL Assets, in each case, subject to customary exceptions and limitations, including an exception for owned real property with net book values of less than
$10.0 million
. As of
August 3, 2019
, there was
$590.0 million
of owned real property pledged as collateral that was included in Property and equipment, net in the Consolidated Balance Sheets.
The loans under the Term Loan Facility may be voluntarily prepaid, subject to certain minimum payment thresholds and the payment of breakage or other similar costs. Under the Term Loan Facility, we are required to, subject to certain exceptions and customary reinvestment rights, apply
100 percent
of Net Cash Proceeds (as defined in the Term Loan Agreement) from certain types of asset sales to prepay the loans outstanding under the Term Loan Facility. Commencing with the fiscal year ending August 1, 2020, we must also prepay loans outstanding under the Term Loan Facility no later than
130 days
after the fiscal year end in an aggregate principal amount equal to a specified percentage (which percentage ranges from
0
to
75 percent
depending on our Consolidated First Lien Net Leverage Ratio (as defined in the Term Loan Agreement) as of the last day of such fiscal year) of Excess Cash Flow (as defined in the Term Loan Agreement) in excess of
$10 million
for the fiscal year then ended, minus any voluntary prepayments of the loans under the Term Loan Facility, the ABL Credit Facility (to the extent they permanently reduce commitments under the ABL Facility) and certain other indebtedness made during such fiscal year.
The borrowings under the Term Loan Facility bear interest at rates that, at the Term Borrowers’ option, can be either: (i) a base rate and a margin of (A) with respect to the Term B Tranche,
3.25%
and (B), with respect to the 364-day Tranche,
1.00%
, or (ii) a LIBOR rate and a margin of (A) with respect to the Term B Tranche,
4.25%
and (B), with respect to the 364-day Tranche,
2.00%
; provided that the LIBOR rate shall never be less than
0.0%
.
The Term Loan Agreement does not include any financial maintenance covenants but contains other customary affirmative and negative covenants and customary representations and warranties. The Term Loan Agreement also contains customary events of default, including, but not limited to, payment defaults, breaches of representations and warranties, covenant defaults, events of bankruptcy and insolvency, failure of any guaranty or security document supporting the Term Loan Facility to be in full force and effect, and a change of control. If an event of default occurs and is continuing, the Term Borrowers may be required immediately to repay all amounts outstanding under the Term Loan Agreement.
In the second quarter of fiscal 2019, the Company made mandatory prepayments of
$47.0 million
on the 364-day Tranche with asset sale proceeds. In connection with the prepayments, the Company incurred a loss on debt extinguishment related to unamortized debt issuance costs of
$1.0 million
, which was recorded as Other expense in the Consolidated Statements of Operations for the second quarter of fiscal 2019.
93
In the third quarter of fiscal 2019, the Company made mandatory prepayments of
$8.7 million
and
$5.5 million
on the 364-day Tranche and Term B Tranche, respectively, with asset sale proceeds. In connection with the prepayments, the Company incurred a loss on debt extinguishment related to unamortized debt issuance costs and a loss on unamortized original issue discount of
$0.2 million
and
$0.1 million
, respectively, which were recorded as Other expense in the Consolidated Statements of Operations for the third quarter of fiscal 2019.
In the fourth quarter of fiscal 2019, the Company made mandatory prepayments of
$20.4 million
and
$3.5 million
on the 364-day Tranche and Term B Tranche, respectively, with asset sale proceeds. In connection with the prepayments, the Company incurred a loss on debt extinguishment related to unamortized debt issuance costs and a loss on unamortized original issue discount of
$0.3 million
and
$0.1 million
, respectively, which were recorded as Other expense in the Consolidated Statements of Income for the fourth quarter of fiscal 2019.
As of
August 3, 2019
, the Company had borrowings of
$1,791.0 million
and
$73.9 million
under the Term B Tranche and 364-day Tranche, respectively, which are presented net of debt issuance costs of
$42.0 million
and an original issue discount on debt of
$40.7 million
. As of
August 3, 2019
,
$18.0 million
and
$73.9 million
of the Term B Tranche and 364-day Tranche, respectively, was classified as current, excluding debt issuance costs and original issue discount on debt.
Supervalu Senior Notes
On October 22, 2018, the Company delivered an irrevocable redemption notice for the remaining
$350.0 million
of
7.75%
Supervalu Senior Notes and the remaining
$180.0 million
of
6.75%
Supervalu Senior Notes assumed in conjunction with the Supervalu acquisition. In connection with the redemption notice, the Company placed
$566.4 million
on account with the trustee of the Supervalu Senior Notes to satisfy and discharge its obligations under the indenture governing the Supervalu Senior Notes. On November 21, 2018, following the required 30-day notice period, the trustee used this
$566.4 million
to extinguish the remaining principal balances, to pay the required redemption premiums and to pay accrued and unpaid interest on the redeemed Supervalu Senior Notes. As a result of the satisfaction and discharge of the indenture governing the redemption of the Supervalu Senior Notes, the Company has fully satisfied and discharged its obligations under the Supervalu Senior Notes.
NOTE 11—COMPREHENSIVE (LOSS) INCOME AND ACCUMULATED OTHER COMPREHENSIVE LOSS
Accumulated other comprehensive (loss) income changes by component for
fiscal 2019
,
fiscal 2018
and
fiscal 2017
are as follows:
|
(in thousands)
|
Benefit Plans
|
Foreign Currency
|
Swap Agreements
|
Total
|
||||||||||||
|
Accumulated other comprehensive loss at July 30, 2016, net of tax
|
$
|
—
|
|
$
|
(18,799
|
)
|
$
|
(3,580
|
)
|
$
|
(22,379
|
)
|
||||
|
Other comprehensive income before reclassifications
|
—
|
|
3,537
|
|
3,992
|
|
7,529
|
|
||||||||
|
Amortization of cash flow hedge
|
—
|
|
—
|
|
887
|
|
887
|
|
||||||||
|
Net current period Other comprehensive loss
|
—
|
|
3,537
|
|
4,879
|
|
8,416
|
|
||||||||
|
Accumulated other comprehensive (loss) income at July 29, 2017, net of tax
|
$
|
—
|
|
$
|
(15,262
|
)
|
$
|
1,299
|
|
$
|
(13,963
|
)
|
||||
|
Other comprehensive (loss) income before reclassifications
|
—
|
|
(3,791
|
)
|
4,219
|
|
428
|
|
||||||||
|
Amortization of cash flow hedge
|
—
|
|
—
|
|
(644
|
)
|
(644
|
)
|
||||||||
|
Net current period Other comprehensive (loss) income
|
—
|
|
(3,791
|
)
|
3,575
|
|
(216
|
)
|
||||||||
|
Accumulated other comprehensive (loss) income at July 28, 2018, net of tax
|
$
|
—
|
|
$
|
(19,053
|
)
|
$
|
4,874
|
|
$
|
(14,179
|
)
|
||||
|
Other comprehensive loss before reclassifications
|
(32,458
|
)
|
(1,029
|
)
|
(61,277
|
)
|
(94,764
|
)
|
||||||||
|
Amortization of cash flow hedge
|
—
|
|
—
|
|
(10
|
)
|
(10
|
)
|
||||||||
|
Net current period Other comprehensive loss
|
(32,458
|
)
|
(1,029
|
)
|
(61,287
|
)
|
(94,774
|
)
|
||||||||
|
Accumulated other comprehensive loss at August 3, 2019, net of tax
|
$
|
(32,458
|
)
|
$
|
(20,082
|
)
|
$
|
(56,413
|
)
|
$
|
(108,953
|
)
|
||||
|
(1)
|
Amortization of amounts included in net periodic benefit (income) cost includes amortization of prior service benefit and amortization of net actuarial loss as reflected in
Note 14—Benefit Plans
.
|
94
Items reclassified out of Accumulated other comprehensive loss had the following impact on the Consolidated Statements of Operations:
|
(in thousands)
|
2019
|
2018
|
2017
|
Affected Line Item on the Consolidated Statements of Operations
|
||||||||||
|
Swap agreements:
|
||||||||||||||
|
Reclassification of cash flow hedge
|
$
|
13
|
|
$
|
827
|
|
$
|
(1,462
|
)
|
Interest expense, net
|
||||
|
Income tax (benefit) expense
|
3
|
|
183
|
|
(575
|
)
|
(Benefit) provision for income taxes
|
|||||||
|
Total reclassifications, net of tax
|
$
|
10
|
|
$
|
644
|
|
$
|
(887
|
)
|
|||||
As of
August 3, 2019
, the Company expects to reclassify
$16.1 million
out of Accumulated other comprehensive loss into Interest expense, net during the following twelve-month period.
NOTE 12—LEASES
On October 23, 2018, the Company received
$101.0 million
in aggregate proceeds, excluding taxes and closing costs, for the sale and leaseback of its final distribution center of
eight
distribution center sale-leaseback transactions entered into by Supervalu in April 2018. On October 26, 2018, the Company received
$48.5 million
in aggregate proceeds, excluding taxes and closing costs, for the sale and leaseback of a separate distribution center under an agreement entered into by Supervalu in March 2018, as amended. Both distribution center sale-leasebacks qualified for sale accounting, with the lease-backs being classified as operating leases.
No
gain or loss was recognized or deferred on the sale of these facilities, as the fair value of these facilities as of the Supervalu acquisition date was determined to be equal to their contractual sale–leaseback amounts.
During the second quarter of fiscal 2019, the Company closed the remaining Shop ‘n Save St. Louis-based retail stores and the dedicated distribution center, and we continue to hold the owned real estate assets related to these locations for sale. The Company recorded a closed store reserve charge of approximately
$17.1 million
in the second quarter of fiscal 2019.
In the first quarter of fiscal 2019, the Company entered into a lease for a new distribution facility in California for approximately
1.2 million
square feet.
The Company leases certain of its distribution centers and leases most of its retail stores, and leases certain office facilities and equipment from third parties. Many of these leases include renewal options and, in certain instances, also include options to purchase. Rent expense, other operating lease expense and subtenant rentals all under operating leases included within Operating expenses, and subtenant rentals under operating leases with customers included within Net sales, consisted of the following:
|
(in thousands)
|
2019
|
2018
|
2017
|
||||||||
|
Rent expense
(1)
|
211,807
|
|
88,697
|
|
81,156
|
|
|||||
|
Less subtenant rentals recorded in Net sales
|
(17,475
|
)
|
—
|
|
—
|
|
|||||
|
Less subtenant rentals recorded in Operating expenses
|
(13,683
|
)
|
(1,649
|
)
|
(1,670
|
)
|
|||||
|
Total net rent expense
|
$
|
180,649
|
|
$
|
87,048
|
|
$
|
79,486
|
|
||
|
(1)
|
Rent expense as presented here includes
$32.2 million
,
$0.0 million
, and
$0.0 million
in
fiscal 2019
,
2018
and
2017
, respectively, of operating lease rent expense related to stores within discontinued operations, but for which GAAP requires the expense to be included within continuing operations, as we expect to remain primarily obligated under these leases.
|
95
The Company leases certain property to third parties and receives lease and subtenant rental payments under operating, capital and direct financing leases, including assigned leases for which we have future minimum lease payment obligations. Future minimum lease payments (“lease obligations”) to be made by the Company or certain third parties in the case of assigned leases for noncancellable operating leases and capital leases have not been reduced for future minimum lease and subtenant rentals (“lease receipts”) under certain operating subleases, including assignments. As of
August 3, 2019
, these lease obligations and lease receipts consisted of the following (in thousands):
|
Lease Obligations
|
Lease Receipts
|
Net Lease Obligations
|
||||||||||||||||||||||
|
Fiscal Year
|
Operating Leases
|
Capital Leases
|
Operating Leases
|
Capital Leases
|
Operating Leases
|
Capital Leases
|
||||||||||||||||||
|
2020
|
$
|
223,612
|
|
$
|
41,550
|
|
$
|
(55,922
|
)
|
$
|
(319
|
)
|
$
|
167,690
|
|
$
|
41,231
|
|
||||||
|
2021
|
190,845
|
|
32,804
|
|
(41,425
|
)
|
—
|
|
149,420
|
|
32,804
|
|
||||||||||||
|
2022
|
179,326
|
|
29,869
|
|
(35,998
|
)
|
—
|
|
143,328
|
|
29,869
|
|
||||||||||||
|
2023
|
154,812
|
|
26,699
|
|
(25,591
|
)
|
—
|
|
129,221
|
|
26,699
|
|
||||||||||||
|
2024
|
135,795
|
|
23,095
|
|
(18,183
|
)
|
—
|
|
117,612
|
|
23,095
|
|
||||||||||||
|
Thereafter
|
1,063,674
|
|
46,999
|
|
(59,186
|
)
|
—
|
|
1,004,488
|
|
46,999
|
|
||||||||||||
|
Total future minimum obligations (receipts)
|
$
|
1,948,064
|
|
$
|
201,016
|
|
$
|
(236,305
|
)
|
$
|
(319
|
)
|
$
|
1,711,759
|
|
$
|
200,697
|
|
||||||
|
Less interest
|
(68,138
|
)
|
||||||||||||||||||||||
|
Present value of capital lease obligations
|
132,878
|
|
||||||||||||||||||||||
|
Less current capital lease obligations
|
(24,670
|
)
|
||||||||||||||||||||||
|
Long-term capital lease obligations
|
$
|
108,208
|
|
|||||||||||||||||||||
NOTE 13—SHARE-BASED AWARDS
As of August 3, 2019, the Company has restricted stock awards and performance share units and stock options under
three
equity incentive plans: the 2002 Stock Incentive Plan; the 2004 Equity Incentive Plan, as amended; and the 2012 Equity Incentive Plan, as amended and restated. The terms of each stock-based award will be determined by the Board of Directors or the Compensation Committee. As of August 3, 2019, the Company has
1,472,441
shares authorized and available for grant under the 2012 Plan. The authorization for new grants under the 2002 Plan and 2004 Plan has expired.
Share-Based Compensation Expense
The following table presents information regarding share-based compensation expenses and the related tax impacts:
|
(in thousands)
|
2019
|
2018
|
2017
|
|||||||||
|
Restricted stock awards
|
$
|
21,363
|
|
$
|
19,872
|
|
$
|
16,146
|
|
|||
|
Supervalu replacement awards
(1)
|
14,304
|
|
—
|
|
—
|
|
||||||
|
Performance-based share awards
|
3,013
|
|
5,569
|
|
8,986
|
|
||||||
|
Stock option awards
|
199
|
|
342
|
|
543
|
|
||||||
|
Share-based compensation expense recorded in Operating expenses
|
38,879
|
|
25,783
|
|
25,675
|
|
||||||
|
Income tax benefit
|
(10,458
|
)
|
(6,538
|
)
|
(10,006
|
)
|
||||||
|
Share-based compensation expense, net of tax
|
$
|
28,421
|
|
$
|
19,245
|
|
$
|
15,669
|
|
|||
|
Share-based compensation expense recorded in Restructuring, acquisition and integration related expenses
(2)
|
$
|
33,021
|
|
$
|
107
|
|
$
|
532
|
|
|||
|
Income tax benefit
|
(8,870
|
)
|
(29
|
)
|
(214
|
)
|
||||||
|
Share-based compensation expense recorded in Restructuring, acquisition and integration related expenses, net of tax
|
$
|
24,151
|
|
$
|
78
|
|
$
|
318
|
|
|||
|
(1)
|
Amounts are derived entirely from liability classified awards.
|
|
(2)
|
Includes liability classified awards of
$31.7 million
and equity classified awards of
$1.4 million
for fiscal 2019. Amounts recorded in fiscal 2018 and 2017 are derived entirely from equity classified awards.
|
96
Vesting requirements for awards are generally at the discretion of the Company’s Board of Directors, or the Compensation Committee thereof, and for time vesting awards are typically
four
equal annual installments for employees and
two
equal installments for non-employee directors with the first installment on the date of grant and the second installment on the six month anniversary of the grant date. Vesting requirements for Supervalu replacement awards are typically
three
equal annual installments. As of
August 3, 2019
, there was
$51.0 million
of total unrecognized compensation cost related to outstanding share-based compensation arrangements (including stock options, restricted stock units, Supervalu replacement awards and performance-based restricted stock units) of which
$22.5 million
relates to Supervalu Replacement Awards. Unrecognized compensation cost related to Replacement Options is de minimis. This cost is expected to be recognized over a weighted-average period of
2.0 years
.
Restricted Stock Awards
The fair value of restricted stock units and performance share units are determined based on the number of units granted and the quoted price of the Company’s common stock as of the grant date. The following summary presents information regarding restricted stock units, Supervalu replacement awards and performance units:
|
Number
of Shares
|
Weighted Average
Grant-Date
Fair Value
|
||||||
|
Outstanding at July 30, 2016
|
733,797
|
|
$
|
55.55
|
|
||
|
Granted
|
1,107,526
|
|
40.16
|
|
|||
|
Vested
|
(420,098
|
)
|
50.14
|
|
|||
|
Forfeited
|
(151,114
|
)
|
50.16
|
|
|||
|
Outstanding at July 29, 2017
|
1,270,111
|
|
44.56
|
|
|||
|
Granted
|
716,952
|
|
40.06
|
|
|||
|
Vested
|
(434,730
|
)
|
47.24
|
|
|||
|
Forfeited
|
(207,731
|
)
|
41.38
|
|
|||
|
Outstanding at July 28, 2018
|
1,344,602
|
|
41.78
|
|
|||
|
Supervalu replacement awards
|
4,301,233
|
|
32.50
|
|
|||
|
Granted
|
1,665,233
|
|
23.30
|
|
|||
|
Vested
|
(2,038,290
|
)
|
34.81
|
|
|||
|
Forfeited
|
(852,045
|
)
|
30.83
|
|
|||
|
Outstanding at August 3, 2019
|
4,420,733
|
|
$
|
31.11
|
|
||
|
(in thousands)
|
2019
|
2018
|
2017
|
|||||||||
|
Intrinsic value of restricted stock units vested
|
$
|
36,071
|
|
$
|
12,420
|
|
$
|
10,465
|
|
|||
Performance-Based Share Awards
During
fiscal 2019
, the Company granted
339,282
performance share units to its executives (subject to the issuance of up to
339,282
additional shares if the Company’s performance exceeds specified targeted levels) with a weighted average grant-date fair value of
$22.56
. These performance units are tied to fiscal
2020
performance metrics, including adjusted EBITDA and adjusted return on invested capital (“ROIC”). During
fiscal 2019
,
6,260
performance share units were forfeited and as of
August 3, 2019
, there are
333,022
performance share units outstanding that are tied to the Company’s fiscal
2020
performance.
During fiscal
2018
, the Company granted
109,100
performance share units to its executives (subject to the issuance of up to
109,100
additional shares if the Company’s performance exceeds specified targeted levels) with a weighted average grant-date fair value of
$39.74
. These performance units were tied to fiscal 2019 performance metrics.
During
fiscal 2017
, the Company granted
397,242
performance share units to its executives (subject to the issuance of
221,242
additional shares if the Company’s performance exceeds specified targeted levels) with a weighted average grant-date fair value of
$40.82
tied to the Company’s performance in fiscal years 2017, 2018 and 2019. As of the fiscal year ended
July 29, 2017
,
150,396
of these performance share units vested, based on the Company’s earnings per diluted share, adjusted EBITDA, adjusted ROIC, and net sales with an estimated intrinsic value of approximately
$5.7 million
using the Company’s stock price as of July 28, 2017. As of the fiscal year ended July 31, 2018,
111,860
performance units vested, based on the Company’s earnings per diluted share, adjusted EBITDA, adjusted ROIC, and net sales with an estimated intrinsic value of approximately
$3.6 million
using the Company’s stock price as of July 27, 2018. As of
August 3, 2019
,
77,234
performance units were issuable based on the
97
Company’s adjusted EBITDA and net sales, with an intrinsic value of approximately
$0.7 million
using the Company stock price as of August 2, 2019.
Stock Options
The Company did
no
t grant stock options in fiscal
2019
,
2018
or
2017
.
The following summary presents information regarding outstanding stock options as of
August 3, 2019
and changes during the fiscal year then ended:
|
Number
of Options
|
Weighted
Average
Exercise
Price
|
Weighted
Average
Remaining
Contractual
Term
|
Aggregate
Intrinsic
Value
|
|||||||||
|
Outstanding at beginning of year
|
291,677
|
|
$
|
52.46
|
|
|||||||
|
Supervalu replacement options
|
1,625,070
|
|
41.91
|
|
||||||||
|
Exercised
|
(6,979
|
)
|
16.97
|
|
|
|
|
|||||
|
Forfeited
|
(1,420
|
)
|
13.13
|
|
|
|
|
|||||
|
Canceled
|
(139,111
|
)
|
50.50
|
|
|
|
|
|||||
|
Outstanding at end of year
|
1,769,237
|
|
43.06
|
|
5.8 years
|
$
|
—
|
|
||||
|
Exercisable at end of year
|
1,760,980
|
|
$
|
43.02
|
|
5.8 years
|
$
|
—
|
|
|||
The aggregate intrinsic value of options exercised during
fiscal 2019
,
2018
and
2017
was
$0.1 million
,
$0.7 million
and
$0.1 million
, respectively.
Supervalu Replacement Awards
Pursuant to the Merger Agreement, dated as of July 25, 2018, as amended, each outstanding Supervalu stock option, whether vested or unvested, that was unexercised immediately prior to the effective time of the Merger (“SVU Option”) was converted, effective as of the effective time of the Merger, into a stock option exercisable for shares of common stock of the Company (“Replacement Option”) in accordance with the adjustment provisions of the Supervalu stock plan pursuant to which such SVU Option was granted and the Merger Agreement, with such Replacement Option generally having the same terms and conditions as the underlying SVU Option. In addition, pursuant to the Merger Agreement, each outstanding Supervalu restricted share award, restricted stock unit award, deferred share unit award and performance share unit award (“SVU Equity Award”) was converted, effective as of the effective time of the Merger, into time-vesting awards (“Replacement Award”) with a settlement value equal to the merger consideration (
$32.50
per share) multiplied by the number of shares of Supervalu common stock subject to such SVU Equity Award, and generally upon the same terms of the SVU Equity Award including the applicable change in control termination protections. The Merger Agreement originally provided that the Replacement Awards were payable in cash, however, the Merger Agreement was amended on October 10, 2018, to provide that the Replacement Awards could be settled in cash and/or an equal value in shares of common stock of the Company.
On October 22, 2018, the Company authorized for issuance and registered on a Registration Statement on Form S-8 filed with the SEC
5,000,000
shares of common stock for issuance in order to satisfy the Replacement Options and Replacement Awards. On March 28, 2019, the Company filed a Registration Statement on Form S-3 with the SEC, which was declared effective on April 5, 2019. During fiscal 2019, the Company issued
2,004,730
shares of common stock at an average price of
$12.00
per share for
$23.9 million
of cash, of which
$0.4 million
was received subsequent to the end of fiscal 2019.
The Replacement Awards are liability classified awards as they may ultimately be settled in cash or shares at the discretion of the employee. The Replacement Awards liabilities are expensed over the service period based on the fixed value of
$32.50
per share.
Retirement Provision
During the second quarter of fiscal 2019, after reviewing retirement provisions and practices for the treatment of equity awards at comparable companies, the Compensation Committee of the Company’s Board of Directors determined to change the terms of its long-term compensation awards to executives who might consider retiring and to better assure that their awards provided an incentive to work for the long term best interests of the Company up to their termination date, and regardless of their retirement plans. Accordingly, the Compensation Committee determined that time-based vesting restricted stock units, with the exception of Replacement Awards, will continue to vest during retirement after termination of employment on the same terms as they would
98
if the executive had not retired, but without the requirement that they remain employed. Performance share-units will be treated similarly on retirement, but subject to actual performance at the time achievement of performance objectives is measured. In addition, an executive’s equity awards granted in the year of retirement will be prorated to reflect the service period prior to the date of retirement. Retirement vesting will only be available to employees age 59 or older who voluntarily terminate employment after at least
10 years
of service to the Company. As a result of these retirement provisions, the Company recorded a share-based compensation charge of approximately
$6.6 million
during the second quarter of fiscal 2019 related to the amendment of outstanding awards. Future grants made to employees who are retirement eligible will result in an accelerated pattern of expense recognition compared to non-retirement eligible employees.
NOTE 14—BENEFIT PLANS
The Company’s employees who participate are covered by various contributory and non-contributory pension, profit sharing or 401(k) plans. The Company’s primary defined benefit pension plans are the SUPERVALU INC. Retirement Plan, Unified Grocers pension plan and certain supplemental executive retirement plans. These plans were closed to new participants and service crediting ended for all participants as of December 31, 2007. Pay increases were reflected in the amount of benefits accrued in these plans until December 31, 2012. Approximately one-half of the union employees participate in multiemployer retirement plans under collective bargaining agreements. The remaining either participate in plans sponsored by the Company or are not currently eligible to participate in a retirement plan. In addition to sponsoring both defined benefit and defined contribution pension plans, the Company provides healthcare and life insurance benefits for eligible retired employees under postretirement benefit plans. The Company also provides certain health and welfare benefits, including short-term and long-term disability benefits, to inactive disabled employees prior to retirement. The terms of the postretirement benefit plans vary based on employment history, age and date of retirement. For many retirees, the Company provides a fixed dollar contribution and retirees pay contributions to fund the remaining cost.
For the defined benefit pension plans, the accumulated benefit obligation is equal to the projected benefit obligation. The benefit obligation, fair value of plan assets and funded status of our defined benefit pension plans and other postretirement benefit plans consisted of the following:
|
2019
|
||||||||
|
(in thousands)
|
Pension Benefits
|
Other Postretirement Benefits
|
||||||
|
Changes in Benefit Obligation
|
||||||||
|
Benefit obligation at acquisition date of October 22, 2018
|
$
|
2,499,954
|
|
$
|
52,276
|
|
||
|
Plan amendment
|
—
|
|
(4,199
|
)
|
||||
|
Service cost
|
—
|
|
173
|
|
||||
|
Interest cost
|
75,706
|
|
1,447
|
|
||||
|
Actuarial loss (gain)
|
249,899
|
|
(9,836
|
)
|
||||
|
Benefits paid
|
(116,285
|
)
|
(2,179
|
)
|
||||
|
Benefit obligation at end of year
|
2,709,274
|
|
37,682
|
|
||||
|
Changes in Plan Assets
|
||||||||
|
Fair value of plan assets at acquisition date of October 22, 2018
|
2,305,020
|
|
11,586
|
|
||||
|
Actual return on plan assets
|
303,696
|
|
260
|
|
||||
|
Employer contributions
|
4,116
|
|
1,636
|
|
||||
|
Benefits paid
|
(116,285
|
)
|
(2,239
|
)
|
||||
|
Fair value of plan assets at end of year
|
2,496,547
|
|
11,243
|
|
||||
|
Unfunded status at end of year
|
$
|
(212,727
|
)
|
$
|
(26,439
|
)
|
||
99
Net periodic benefit (income) cost and other changes in plan assets and benefit obligations recognized consist of the following:
|
2019
|
||||||||
|
(in thousands)
|
Pension Benefits
|
Other Postretirement Benefits
|
||||||
|
Net Periodic Benefit (Income) Cost
|
||||||||
|
Service cost
|
$
|
—
|
|
$
|
173
|
|
||
|
Interest cost
|
75,706
|
|
1,447
|
|
||||
|
Expected return on plan assets
|
(111,695
|
)
|
(184
|
)
|
||||
|
Net periodic benefit (income) cost
|
(35,989
|
)
|
1,436
|
|
||||
|
Other Changes in Plan Assets and Benefits Obligations Recognized in Other Comprehensive Income (Loss)
|
||||||||
|
Prior service benefit
|
—
|
|
(4,199
|
)
|
||||
|
Amortization of prior service benefit
|
—
|
|
—
|
|
||||
|
Net actuarial loss (gain)
|
57,902
|
|
(9,912
|
)
|
||||
|
Total expense (benefit) recognized in Other comprehensive income (loss)
|
57,902
|
|
(14,111
|
)
|
||||
|
Total expense (benefit) recognized in net periodic benefit cost (income) and Other comprehensive income (loss)
|
$
|
21,913
|
|
$
|
(12,675
|
)
|
||
No
estimated net actuarial loss is expected to be amortized from Accumulated other comprehensive loss into net periodic benefit cost for the defined benefit pension plans during fiscal 2020. The estimated net amount of prior service benefit and net actuarial gain for the postretirement benefit plans that will be amortized from Accumulated other comprehensive loss into net periodic benefit cost during fiscal 2020 is
$3.1 million
.
Amounts recognized in the Consolidated Balance Sheets as of
August 3, 2019
consist of the following:
|
August 3, 2019
|
||||||||
|
(in thousands)
|
Pension Benefits
|
Other Postretirement Benefits
|
||||||
|
Accrued compensation and benefits
|
$
|
1,900
|
|
$
|
—
|
|
||
|
Pension and other postretirement benefit obligations
|
210,827
|
|
26,439
|
|
||||
|
Total
|
$
|
212,727
|
|
$
|
26,439
|
|
||
Assumptions
Weighted average assumptions used to determine benefit obligations and net periodic benefit cost consisted of the following:
|
2019
|
|||
|
Benefit obligation assumptions:
|
|||
|
Discount rate
|
2.99% - 3.49%
|
|
|
|
Net periodic benefit cost assumptions:
|
|||
|
Discount rate
|
4.30% - 4.42%
|
|
|
|
Rate of compensation increase
|
—
|
%
|
|
|
Expected return on plan assets
(1)
|
2.25% - 6.50%
|
|
|
|
(1)
|
Expected return on plan assets is estimated by utilizing forward-looking, long-term return, risk and correlation assumptions developed and updated annually by the Company. These assumptions are weighted by the actual or target allocation to each underlying asset class represented in the pension plan asset portfolio. We also assess the expected long-term return on plan assets assumption by comparison to long-term historical performance on an asset class to ensure the assumption is reasonable. Long-term trends are also evaluated relative to market factors such as inflation, interest rates, and fiscal and monetary policies in order to assess the capital market assumptions.
|
100
The Company reviews and selects the discount rate to be used in connection with measuring our pension and other postretirement benefit obligations annually. In determining the discount rate, the Company uses the yield on corporate bonds (rated AA or better) that coincides with the cash flows of the plans’ estimated benefit payouts. The model uses a yield curve approach to discount each cash flow of the liability stream at an interest rate specifically applicable to the timing of each respective cash flow. The model totals the present values of all cash flows and calculates the equivalent weighted average discount rate by imputing the singular interest rate that equates the total present value with the stream of future cash flows. This resulting weighted average discount rate is then used in evaluating the final discount rate to be used.
For those retirees whose health plans provide for variable employer contributions, the assumed healthcare cost trend rate used in measuring the accumulated postretirement benefit obligation before age 65 was
7.30 percent
as of
August 3, 2019
. The assumed healthcare cost trend rate for retirees before age 65 will decrease each year through fiscal 2026, until it reaches the ultimate trend rate of
4.50 percent
. For those retirees whose health plans provide for variable employer contributions, the assumed healthcare cost trend rate used in measuring the accumulated postretirement benefit obligation after age 65 was
8.10 percent
as of
August 3, 2019
. The assumed healthcare cost trend rate for retirees after age 65 will decrease through fiscal 2026, until it reaches the ultimate trend rate of
4.50 percent
. For those retirees whose health plans provide for a fixed employer contribution rate, a healthcare cost trend is not applicable. The healthcare cost trend rate assumption would have had the following impact on the amounts reported: a
100 basis point
increase in the trend rate would increase the accumulated postretirement benefit obligation by approximately
$0.7 million
as of the end of fiscal 2020 and would increase service and interest cost by less than
$0.1 million
. Conversely, a
100 basis point
decrease in the healthcare cost trend rate would decrease the Company’s accumulated postretirement benefit obligation as of the end of fiscal 2020 by approximately
$0.7 million
and would decrease service and interest cost by less than
$0.1 million
.
Pension Plan Assets
Pension plan assets are held in a master trust and invested in separately managed accounts and other commingled investment vehicles holding domestic and international equity securities, domestic fixed income securities and other investment classes. The Company employs a total return approach whereby a diversified mix of asset class investments is used to maximize the long-term return of plan assets for an acceptable level of risk. Alternative investments are also used to enhance risk-adjusted long-term returns while improving portfolio diversification. Risk is managed through diversification across asset classes, multiple investment manager portfolios and both general and portfolio-specific investment guidelines. Risk tolerance is established through careful consideration of the plan liabilities, plan funded status and our financial condition. This asset allocation policy mix is reviewed annually and actual versus target allocations are monitored regularly and rebalanced on an as-needed basis. Plan assets are invested using a combination of active and passive investment strategies. Passive, or “indexed” strategies, attempt to mimic rather than exceed the investment performance of a market benchmark. The plan’s active investment strategies employ multiple investment management firms. Managers within each asset class cover a range of investment styles and approaches and are combined in a way that controls for capitalization, and style biases (equities) and interest rate exposures (fixed income) versus benchmark indices. Monitoring activities to evaluate performance against targets and measure investment risk take place on an ongoing basis through annual liability measurements, periodic asset/liability studies and quarterly investment portfolio reviews.
The asset allocation targets and the actual allocation of pension plan assets are as follows:
|
Asset Category
|
Target
|
2019
|
||||
|
Domestic equity
|
21.2
|
%
|
22.1
|
%
|
||
|
International equity
|
6.7
|
%
|
6.2
|
%
|
||
|
Private equity
|
5.3
|
%
|
4.2
|
%
|
||
|
Fixed income
|
60.9
|
%
|
62.3
|
%
|
||
|
Real estate
|
5.9
|
%
|
5.2
|
%
|
||
|
Total
|
100.0
|
%
|
100.0
|
%
|
||
The following is a description of the valuation methodologies used for investments measured at fair value:
Common stock
- Valued at the closing price reported in the active market in which the individual securities are traded.
Common collective trusts
- Investments in common/collective trust funds are stated at net asset value (“NAV”) as determined by the issuer of the common/collective trust funds and is based on the fair value of the underlying investments held by the fund less its liabilities. The majority of the common/collective trust funds have a readily determinable fair value and are classified as Level 2. Other investments in common/collective trust funds determine NAV on a less frequent basis and/or have redemption restrictions. For these investments, NAV is used as a practical expedient to estimate fair value.
101
Corporate bonds
- Valued based on yields currently available on comparable securities of issuers with similar credit ratings. When quoted prices are not available for identical or similar bonds, the fair value is based upon an industry valuation model, which maximizes observable inputs.
Government securities
- Certain government securities are valued at the closing price reported in the active market in which the security is traded. Other government securities are valued based on yields currently available on comparable securities of issuers with similar credit ratings.
Mortgage backed securities
- Valued based on yields currently available on comparable securities of issuers with similar credit ratings. When quoted prices are not available for identical or similar securities, the fair value is based upon an industry valuation model, which maximizes observable inputs.
Mutual funds
- Mutual funds are valued at the closing price reported in the active market in which the individual securities are traded.
Private equity and real estate partnerships
- Valued based on NAV provided by the investment manager, updated for any subsequent partnership interests’ cash flows or expected changes in fair value. The NAV is used as a practical expedient to estimate fair value.
Other
- Consists primarily of options, futures, and money market investments priced at $1.
The valuation methods described above may produce a fair value calculation that may not be indicative of net realizable value or reflective of future fair values. Furthermore, while the Company believes our valuation methods are appropriate and consistent with other market participants, the use of different methodologies or assumptions to determine the fair value of certain financial instruments could result in a different fair value measurement.
The fair value of assets of our defined benefit pension plans and other postretirement benefits plans held in master trusts as of
August 3, 2019
, by asset category, consisted of the following (in thousands):
|
Level 1
|
Level 2
|
Level 3
|
Measured at NAV as a Practical Expedient
|
Total
|
||||||||||||||||
|
Common stock
|
$
|
397,800
|
|
$
|
—
|
|
$
|
$
|
$
|
397,800
|
|
|||||||||
|
Common collective trusts
|
—
|
|
1,046,590
|
|
—
|
|
83,504
|
|
1,130,094
|
|
||||||||||
|
Corporate bonds
|
—
|
|
362,251
|
|
—
|
|
—
|
|
362,251
|
|
||||||||||
|
Government securities
|
—
|
|
248,872
|
|
—
|
|
—
|
|
248,872
|
|
||||||||||
|
Mutual funds
|
469
|
|
62,254
|
|
—
|
|
—
|
|
62,723
|
|
||||||||||
|
Mortgage-backed securities
|
—
|
|
10,920
|
|
—
|
|
—
|
|
10,920
|
|
||||||||||
|
Other
|
5,603
|
|
73,745
|
|
—
|
|
—
|
|
79,348
|
|
||||||||||
|
Private equity and real estate partnerships
|
—
|
|
—
|
|
—
|
|
204,539
|
|
204,539
|
|
||||||||||
|
Total plan assets at fair value
|
$
|
403,872
|
|
$
|
1,804,632
|
|
$
|
—
|
|
$
|
288,043
|
|
$
|
2,496,547
|
|
|||||
Contributions
No minimum pension contributions are required to be made to the SUPERVALU Retirement Plan in fiscal 2020. Minimum pension contributions of
$8.25 million
are required to be made under the Unified Grocers, Inc. Cash Balance Plan under the Employee Retirement Income Security Act of 1974, as amended, (“ERISA”) in fiscal 2020. The Company expects to contribute approximately
$0.0 million
to
$6.0 million
to its other defined benefit pension plans and postretirement benefit plans in fiscal 2020.
The Company funds its defined benefit pension plans based on the minimum contribution required under the Code, ERISA the Pension Protection Act of 2006 and other applicable laws, as determined by our external actuarial consultant, and additional contributions made at its discretion. The Company may accelerate contributions or undertake contributions in excess of the minimum requirements from time to time subject to the availability of cash in excess of operating and financing needs or other factors as may be applicable. The Company assesses the relative attractiveness of the use of cash including such factors as expected return on assets, discount rates, cost of debt, reducing or eliminating required Pension Benefit Guaranty Corporation variable rate premiums or the ability to achieve exemption from participant notices of underfunding.
102
Lump Sum Pension Settlement Offering
On August 1, 2019, we amended the SUPERVALU Retirement Plan to provide for a lump sum settlement window. On August 2, 2019, we sent plan participants lump sum settlement election offerings that committed the SUPERVALU Retirement Plan to pay certain deferred vested pension plan participants and retirees, that make such an election, a lump sum payment in exchange for their rights to receive ongoing payments from the plan. The lump sum payment amounts are equal to the present value of the participant’s pension benefits, and will be made to certain former (i) retired associates and beneficiaries who are receiving their monthly pension benefit payment and (ii) terminated associates who are deferred vested in the Plan, had not yet begun receiving monthly pension benefit payments and who are not eligible for any prior lump sum offerings under the plan. Benefit obligations associated with the lump sum offering have been incorporated into the funded status utilizing the actuarially determined lump sum payments based on estimated offer acceptances. The Company expects the Plan to make lump sum settlement payments to Plan participants on or around November 1, 2019, which we anticipate will result in a required remeasurement of the defined benefit pension obligations under the plan at that time.
Estimated Future Benefit Payments
The estimated future benefit payments to be made from our defined benefit pension and other postretirement benefit plans, which reflect expected future service, are as follows (in thousands):
|
Fiscal Year
|
Pension Benefits
|
Other Postretirement Benefits
|
||||||
|
2020
|
$
|
608,400
|
|
$
|
4,000
|
|
||
|
2021
|
119,700
|
|
3,800
|
|
||||
|
2022
|
125,200
|
|
3,600
|
|
||||
|
2023
|
127,800
|
|
3,500
|
|
||||
|
2024
|
131,300
|
|
3,300
|
|
||||
|
Years 2025-2029
|
671,200
|
|
13,400
|
|
||||
Defined Contribution Plans
The Company sponsors defined contribution and profit sharing plans pursuant to Section 401(k) of the Internal Revenue Code. Employees may contribute a portion of their eligible compensation to the plans on a pre-tax basis. We match a portion of certain employee contributions by contributing cash into the investment options selected by the employees. The total amount contributed by us to the plans is determined by plan provisions or at our discretion. Total employer contribution expenses for these plans were
$21.0 million
,
$11.6 million
and
$10.1 million
for
fiscal 2019
,
2018
and
2017
, respectively.
Post-Employment Benefits
The Company recognizes an obligation for benefits provided to former or inactive employees. The company is self-insured for certain disability plan programs, which comprise the primary benefits paid to inactive employees prior to retirement.
Amounts recognized in the Consolidated Balance Sheets consisted of the following (in thousands):
|
Post-Employment Benefits
|
|||
|
August 3, 2019
|
|||
|
Accrued compensation and benefits
|
$
|
2,356
|
|
|
Other long-term liabilities
|
5,053
|
|
|
|
Total
|
$
|
7,409
|
|
Multiemployer Pension Plans
The Company contributes to various multiemployer pension plans under collective bargaining agreements, primarily defined benefit pension plans. These multiemployer plans generally provide retirement benefits to participants based on their service to contributing employers. The benefits are paid from assets held in trust for that purpose. Plan trustees typically are responsible for determining the level of benefits to be provided to participants as well as the investment of the assets and plan administration. Trustees are appointed in equal number by employers and the unions that are parties to the relevant collective bargaining agreements.
103
Expense is recognized in connection with these plans as contributions are funded, in accordance with GAAP. The Company acquired multiemployer plan obligations related to continuing and discontinued operations as part of the Supervalu acquisition. The risks of participating in these multiemployer plans are different from the risks associated with single-employer plans in the following respects:
|
a.
|
Assets contributed to the multiemployer plan by one employer are held in trust and may be used to provide benefits to employees of other participating employers.
|
|
b.
|
If a participating employer stops contributing to the plan, the unfunded obligations of the plan may be borne by the remaining participating employers.
|
|
c.
|
If we choose to stop participating in some multiemployer plans, or make market exits or closures or otherwise have participation in the plan drop below certain levels, we may be required to pay those plans an amount based on the underfunded status of the plan, referred to as a withdrawal liability.
|
The Company’s participation in these plans is outlined in the table below. The EIN-Pension Plan Number column provides the Employer Identification Number (“EIN”) and the three-digit plan number, if applicable. Unless otherwise noted, the most recent Pension Protection Act (“PPA”) zone status available in 2018 relates to the plans’ most recent fiscal year-end. The zone status is based on information that we received from the plan and is annually certified by each plan’s actuary. Among other factors, red zone status plans are generally less than
65 percent
funded and are considered in critical status, plans in yellow zone status are less than
80 percent
funded and are considered in endangered or seriously endangered status, and green zone plans are at least
80 percent
funded. The Multiemployer Pension Reform Act of 2014 (“MPRA”) created a new zone status called “critical and declining” or “Deep Red”. Plans are generally considered Deep Red if they are projected to become insolvent within
15 years
. The FIP/RP Status Pending/Implemented column indicates plans for which a funding improvement plan (“FIP”) or a rehabilitation plan (“RP”) is either pending or has been implemented by the trustees of each plan.
Certain plans have been aggregated in the All Other Multiemployer Pension Plans line in the following table, as the contributions to each of these plans are not individually material. None of our collective bargaining agreements require that a minimum contribution be made to these plans.
At the date the financial statements were issued, Forms 5500 were generally not available for the plan years ending in 2018.
104
The following table contains information about the Company’s significant multiemployer plans (in millions):
|
Pension Protection Act Zone Status
|
Contributions
|
||||||||||||||
|
Pension Fund
|
EIN-Pension
Plan Number |
Plan
Month/Day End Date |
2018
|
FIP/RP Status Pending/Implemented
|
2019
|
Surcharges Imposed
(1)
|
Amortization Provisions
|
||||||||
|
Minneapolis Food Distributing Industry Pension Plan
(2)
|
416047047-001
|
12/31
|
Green
|
No
|
$
|
8
|
|
No
|
No
|
||||||
|
Minneapolis Retail Meat Cutters and Food Handlers Pension Fund
(3)
|
410905139-001
|
2/28
|
Red
|
Implemented
|
7
|
|
No
|
No
|
|||||||
|
Minneapolis Retail Meat Cutters and Food Handlers Variable Annuity Pension Fund
(3)
|
83-2598425
|
12/31
|
N/A
|
N/A
|
1
|
|
N/A
|
N/A
|
|||||||
|
Central States, Southeast and Southwest Areas Pension Fund
(2)
|
366044243-001
|
12/31
|
Deep Red
|
Implemented
|
5
|
|
No
|
Yes
|
|||||||
|
UFCW Unions and Participating Employer Pension Fund
(3)
|
526117495-001
|
12/31
|
Red
|
Implemented
|
4
|
|
No
|
No
|
|||||||
|
Western Conference of Teamsters Pension Plan Trust
(2)
|
916145047-001
|
12/31
|
Green
|
No
|
12
|
|
No
|
No
|
|||||||
|
UFCW Unions and Employers Pension Plan
(3)
|
396069053-001
|
10/31
|
Deep Red
|
Implemented
|
1
|
|
Yes
|
Yes
|
|||||||
|
All Other Multiemployer Pension Plans
(4)
|
3
|
|
|||||||||||||
|
Total
|
$
|
41
|
|
||||||||||||
|
(1)
|
PPA surcharges are
5 percent
or
10 percent
of eligible contributions and may not apply to all collective bargaining agreements or total contributions to each plan.
|
|
(2)
|
These multiemployer pension plans are associated with continuing operations.
|
|
(3)
|
These multiemployer pension plans are associated with discontinued operations.
|
|
(4)
|
All Other Multiemployer Pension Plans include
6
plans, none of which is individually significant when considering contributions to the plan, severity of the underfunded status or other factors.
|
105
The following table describes the expiration of the Company’s collective bargaining agreements associated with the significant multiemployer plans in which we participate:
|
Most Significant Collective Bargaining Agreement
|
|||||||||||
|
Pension Fund
|
Range of Collective Bargaining Agreement Expiration Dates
|
Total Collective Bargaining Agreements
|
Expiration Date
|
% of Associates under Collective Bargaining Agreement
(1)
|
Over 5% Contributions 2019
|
||||||
|
Minneapolis Food Distributing Industry Pension Plan
(2)
|
5/31/2022
|
1
|
|
5/31/2022
|
100.0
|
%
|
Yes
|
||||
|
Minneapolis Retail Meat Cutters and Food Handlers Pension Fund
(3)
|
3/4/2023
|
1
|
|
3/4/2023
|
100.0
|
%
|
Yes
|
||||
|
Minneapolis Retail Meat Cutters and Food Handlers Variable Annuity Pension Fund
(3)
|
3/4/2023
|
1
|
|
3/4/2023
|
100.0
|
%
|
N/A (contributions began 1/1/2019)
|
||||
|
Central States, Southeast and Southwest Areas Pension Fund
(2)
|
5/31/2019
|
4
|
|
9/14/2019
|
39.4
|
%
|
No
|
||||
|
UFCW Unions and Participating Employer Pension Fund
(3)
|
7/11/2020
|
2
|
|
7/11/2020
|
71.3
|
%
|
Yes
|
||||
|
Western Conference of Teamsters Pension Plan Trust
(2)
|
4/20/2019
|
20
|
|
4/22/2023
|
15.6
|
%
|
No
|
||||
|
UFCW Unions and Employers Pension Plan
(3)
|
4/9/2022
|
1
|
|
4/9/2022
|
100.0
|
%
|
Yes
|
||||
|
(1)
|
Company participating employees in the most significant collective bargaining agreement as a percent of all Company employees participating in the respective fund.
|
|
(2)
|
These multiemployer pension plans are associated with continuing operations.
|
|
(3)
|
These multiemployer pension plans are associated with discontinued operations.
|
In connection with the closure of the Shop ‘n Save locations and the acquisition of Supervalu, we acquired a
$35.7 million
multiemployer pension plan withdrawal liability, under which payments will be made over the next
20 years
and is included in Other long-term liabilities. In addition, the Company had a withdrawal liability related to one of its multi-employer plans of approximately
$3.4 million
.
The Company contributed
$41.3 million
,
$0.5 million
and
$0.0 million
in
fiscal 2019
,
2018
and
2017
, respectively, to multiemployer pension plans.
Multiemployer Postretirement Benefit Plans Other than Pensions
The Company also makes contributions to multiemployer health and welfare plans in amounts set forth in the related collective bargaining agreements. These plans provide medical, dental, pharmacy, vision and other ancillary benefits to active employees and retirees as determined by the trustees of each plan. The vast majority of the Company’s contributions benefit active employees and as such, may not constitute contributions to a postretirement benefit plan. However, the Company is unable to separate contribution amounts to postretirement benefit plans from contribution amounts paid to benefit active employees.
The company contributed
$58.5 million
in
fiscal 2019
to multiemployer health and welfare plans. If healthcare provisions within these plans cannot be renegotiated in a manner that reduces the prospective healthcare cost as we intend, our Operating expenses could increase in the future.
Collective Bargaining Agreements
As of
August 3, 2019
, we had approximately
19,000
employees. Approximately
4,800
employees are covered by
46
collective bargaining agreements, and negotiations are in progress for
two
initial collective bargaining agreements covering approximately
33
employees. During fiscal 2019,
14
collective bargaining agreements covering approximately
1,300
employees were renegotiated and
6
collective bargaining agreements covering approximately
550
employees expired without their terms being renegotiated. Negotiations are expected to continue with the bargaining units representing the employees subject to those agreements. During fiscal 2020,
6
collective bargaining agreements covering approximately
470
employees are scheduled to expire.
106
NOTE 15—INCOME TAXES
Income Tax (Benefit) Expense
For the fiscal year ended
August 3, 2019
, (loss) income before income taxes consists of
($442.3) million
from U.S. operations and
$7.0 million
from foreign operations. For the fiscal year ended July 28, 2018, income before income taxes consists of
$205.3 million
from U.S. operations and
$7.4 million
from foreign operations. For the fiscal year ended July 29, 2017, income before income taxes consists of
$211.5 million
from U.S. operations and
$2.9 million
from foreign operations.
The total (benefit) provision for income taxes included in the Consolidated Statements of Operations consisted of the following:
|
(in thousands)
|
2019
|
2018
|
2017
|
||||||||
|
Continuing operations
|
$
|
(84,609
|
)
|
$
|
47,075
|
|
$
|
84,268
|
|
||
|
Discontinued operations
|
21,840
|
|
—
|
|
—
|
|
|||||
|
Total
|
$
|
(62,769
|
)
|
$
|
47,075
|
|
$
|
84,268
|
|
||
The income tax expense (benefit) in continuing operations for fiscal 2019, 2018 and 2017 was allocated as follows:
|
(in thousands)
|
2019
|
2018
|
2017
|
||||||||
|
Income tax expense
|
$
|
(84,609
|
)
|
$
|
47,075
|
|
$
|
84,268
|
|
||
|
Stockholders’ equity, difference between compensation expense for tax purposes and amounts recognized for financial statement purposes
|
—
|
|
—
|
|
1,320
|
|
|||||
|
Other comprehensive income
|
(33,854
|
)
|
1,561
|
|
3,222
|
|
|||||
|
Total
|
$
|
(118,463
|
)
|
$
|
48,636
|
|
$
|
88,810
|
|
||
Total federal and state income tax (benefit) expense in continuing operations consists of the following:
|
(in thousands)
|
Current
|
Deferred
|
Total
|
||||||||
|
Fiscal 2019
|
|
|
|
|
|
|
|||||
|
U.S. Federal
|
$
|
(7,652
|
)
|
$
|
(59,528
|
)
|
$
|
(67,180
|
)
|
||
|
State and Local
|
1,351
|
|
(20,786
|
)
|
(19,435
|
)
|
|||||
|
Foreign
|
1,919
|
|
87
|
|
2,006
|
|
|||||
|
$
|
(4,382
|
)
|
$
|
(80,227
|
)
|
$
|
(84,609
|
)
|
|||
|
Fiscal 2018
|
|
|
|
|
|
|
|||||
|
U.S. Federal
|
$
|
46,210
|
|
$
|
(16,648
|
)
|
$
|
29,562
|
|
||
|
State and Local
|
13,310
|
|
1,878
|
|
15,188
|
|
|||||
|
Foreign
|
2,374
|
|
(49
|
)
|
2,325
|
|
|||||
|
$
|
61,894
|
|
$
|
(14,819
|
)
|
$
|
47,075
|
|
|||
|
Fiscal 2017
|
|
|
|
|
|
|
|||||
|
U.S. Federal
|
$
|
70,669
|
|
$
|
(1,874
|
)
|
$
|
68,795
|
|
||
|
State and Local
|
14,653
|
|
(82
|
)
|
14,571
|
|
|||||
|
Foreign
|
837
|
|
65
|
|
902
|
|
|||||
|
$
|
86,159
|
|
$
|
(1,891
|
)
|
$
|
84,268
|
|
|||
107
Total income tax expense (benefit) in continuing operations was different than the amounts computed by applying the statutory federal income tax rate to income before income taxes because of the following:
|
(in thousands)
|
2019
|
|
2018
|
|
2017
|
||||||
|
Computed “expected” tax expense
|
$
|
(91,411
|
)
|
$
|
57,359
|
|
$
|
75,048
|
|
||
|
State and local income tax, net of Federal income tax benefit
|
(24,124
|
)
|
10,501
|
|
9,694
|
|
|||||
|
Non-deductible expenses
|
5,433
|
|
955
|
|
1,951
|
|
|||||
|
Tax effect of share-based compensation
|
125
|
|
149
|
|
29
|
|
|||||
|
General business credits
|
(629
|
)
|
(552
|
)
|
(915
|
)
|
|||||
|
Unrecognized tax benefits
|
(8,146
|
)
|
618
|
|
118
|
|
|||||
|
Nondeductible goodwill impairment
|
32,619
|
|
—
|
|
—
|
|
|||||
|
Impacts related to the TCJA
|
—
|
|
(21,719
|
)
|
—
|
|
|||||
|
Other, net
|
1,524
|
|
(236
|
)
|
(1,657
|
)
|
|||||
|
Total income tax expense
|
$
|
(84,609
|
)
|
$
|
47,075
|
|
$
|
84,268
|
|
||
Uncertain Tax Positions
A reconciliation of the beginning and ending amount of gross unrecognized tax benefits is as follows:
|
(in thousands)
|
2019
|
2018
|
2017
|
||||||||
|
Unrecognized tax benefits at beginning of period
|
$
|
1,104
|
|
$
|
478
|
|
$
|
360
|
|
||
|
Unrecognized tax benefits added during the period
|
—
|
|
626
|
|
583
|
|
|||||
|
Unrecognized tax benefits assumed in a business combination
|
49,566
|
|
—
|
|
—
|
|
|||||
|
Decreases in unrecognized tax benefits due to statute expiration and payments
|
(10,528
|
)
|
—
|
|
(465
|
)
|
|||||
|
Unrecognized tax benefits at end of period
|
$
|
40,141
|
|
$
|
1,104
|
|
$
|
478
|
|
||
In addition, the Company has
$14 million
paid on deposit to various governmental agencies to cover the above liability. The Company recognizes interest and penalties related to unrecognized tax benefits in income tax expense. For
fiscal 2019
,
2018
and
2017
, total accrued interest and penalties was
$15.6 million
,
$0.1 million
, and
$0.1 million
, respectively.
The Company is currently under examination in several taxing jurisdictions and remains subject to examination until the statute of limitations expires for the respective taxing jurisdiction or an agreement is reached between the taxing jurisdiction and the Company. As of
August 3, 2019
, the Company is no longer subject to federal income tax examinations for fiscal years before 2015 and in most states is no longer subject to state income tax examinations for fiscal years before 2008 and 2014 for Supervalu and United Natural Foods, Inc., respectively.
Based on the possibility of the closing of pending audits and appeals, or expiration of the statute of limitations, it is reasonably possible that the amount of unrecognized tax benefits will decrease by up to
$1 million
during the next 12 months.
108
Deferred Tax Assets and Liabilities
The tax effects of temporary differences that give rise to significant portions of the net deferred tax assets and deferred tax liabilities at August 3, 2019 and July 28, 2018 are presented below:
|
(in thousands)
|
August 3,
2019 |
July 28,
2018 |
|||||
|
Deferred tax assets:
|
|
|
|||||
|
Inventories, principally due to additional costs inventoried for tax purposes
|
$
|
2
|
|
$
|
7,265
|
|
|
|
Compensation and benefits related
|
100,942
|
|
25,740
|
|
|||
|
Accounts receivable, principally due to allowances for uncollectible accounts
|
3,355
|
|
4,269
|
|
|||
|
Accrued expenses
|
12,659
|
|
119
|
|
|||
|
Net operating loss carryforwards
|
44,396
|
|
482
|
|
|||
|
Non-loss tax carryforwards
|
10,143
|
|
—
|
|
|||
|
Foreign tax credits
|
445
|
|
445
|
|
|||
|
Intangible assets
|
5,869
|
|
—
|
|
|||
|
Interest rate swap agreements
|
20,518
|
|
—
|
|
|||
|
Other deferred tax assets
|
2,134
|
|
117
|
|
|||
|
Total gross deferred tax assets
|
200,463
|
|
38,437
|
|
|||
|
Less valuation allowance
|
(445
|
)
|
(445
|
)
|
|||
|
Net deferred tax assets
|
$
|
200,018
|
|
$
|
37,992
|
|
|
|
Deferred tax liabilities:
|
|
|
|||||
|
Plant and equipment, principally due to differences in depreciation
|
$
|
117,195
|
|
$
|
39,978
|
|
|
|
Inventories, principally due to additional costs inventoried for tax purposes
|
51,392
|
|
—
|
|
|||
|
Intangible assets
|
1,016
|
|
36,544
|
|
|||
|
Interest rate swap agreements
|
|
|
2,000
|
|
|||
|
Accrued expenses
|
|
|
3,854
|
|
|||
|
Other
|
370
|
|
—
|
|
|||
|
Total deferred tax liabilities
|
169,973
|
|
82,376
|
|
|||
|
Net deferred tax assets (liabilities)
|
$
|
30,045
|
|
$
|
(44,384
|
)
|
|
Effects of the Tax Cuts and Jobs Act
The Tax Cuts and Jobs Act (“TCJA”) was enacted on December 22, 2017. Given the significance of the legislation, the Securities and Exchange Commission (“SEC”) staff issued SAB 118, which allowed registrants to record provisional or estimated amounts concerning TCJA impacts during a one year “measurement period” similar to that used when accounting for business combinations. The measurement period was deemed to end when the registrant has obtained, prepared and analyzed the information necessary to finalize its accounting.
As of
August 3, 2019
, the Company has closed the measurement period relating to the effects of TCJA. The final amounts the Company has reported may change further only in the event of return to provision adjustments.
Tax Credits and Valuation Allowances
At
August 3, 2019
, the Company had net operating loss carryforwards of approximately
$213.8 million
for federal income tax purposes. Of this amount, approximately
$2.3 million
of the federal carryforwards are subject to an annual limitation of approximately
$0.3 million
under Internal Revenue Code Section 382. These Section 382-limited carryforwards expire at various times between fiscal years
2019
and
2027
. As of
August 3, 2019
, the Company has sufficient taxable income in the federal carryback period and anticipates sufficient future taxable income over the periods in which the net operating losses can be utilized. The Company also has the availability of future reversals of taxable temporary differences that are expected to generate taxable income in the future. Therefore, the ultimate realization of net operating losses federal and state tax purposes appears more likely than not at
August 3, 2019
and correspondingly no valuation allowance has been established. The remaining
$211.5 million
of net operating losses for federal purposes are available for unlimited carryforward (but no carryback) pursuant to provisions of the TCJA permitting taxpayers to carryforward net operating losses indefinitely. As of
August 3, 2019
, the Company anticipates sufficient taxable income, including the impacts to the Company of limitations on interest deductibility under TCJA provisions, to make utilization
109
of these unlimited net operating losses more likely than not during the indefinite carryforward period, and correspondingly, no valuation allowance has been established.
At August 3, 2019, the Company had disallowed interest expense carryforwards of approximately
$37.8 million
. Internal Revenue Code Section 163(j) as revised under the TCJA, which creates the deduction limitation, permits taxpayers to carryforward any interest disallowed thereunder indefinitely for use in a period in which the interest deductibility limit exceeds the then-current deductible interest. As of August 3, 2019, the Company anticipates sufficient future interest deductibility capacity to make utilization of the disallowed interest expense carryforwards more likely than not during the indefinite carryforward period, and correspondingly, no valuation allowance has been established.
The retained earnings of the Company’s non-U.S. subsidiary were subject to deemed U.S. repatriation and taxation during fiscal 2017 pursuant to the TCJA, and existing foreign tax credits were utilized to offset the resulting liability. We have established a deferred tax asset for the remaining U.S. foreign tax credits of
$0.4 million
. Such credits are offset by a valuation allowance. The Company considers these unremitted earnings to be indefinitely reinvested; therefore, we have not provided a deferred tax liability for any residual tax that may be due upon repatriation of these earnings.
Effective Tax Rate
Our effective income tax rate for continuing operations was
19.44%
,
22.13%
, and
39.3%
on pre-tax income for fiscal 2019, 2018 and 2017, respectively. The decrease in the rate for fiscal 2019 was primarily driven by purchase accounting adjustments that impacted the goodwill impairment charge adjustment that was recorded in the year. The Company also realized the full benefit of the reduced federal income tax rate due to tax reform during fiscal 2019.
Other
Under ASU 2016-09, the Company accounts for excess tax benefits or tax deficiencies related to share-based payments in its provision for income taxes as opposed to additional paid-in capital. The Company recognized income tax expense of
$1.6 million
of income tax expense related to tax deficiencies for share-based payments for fiscal 2019 and
$1.1 million
of income tax expense related to tax deficiencies for share-based payments for fiscal 2018.
NOTE 16—EARNINGS PER SHARE
The following is a reconciliation of the basic and diluted number of shares used in computing earnings per share:
|
(in thousands, except per share data)
|
2019
|
2018
|
2017
|
|||||||||
|
Basic weighted average shares outstanding
|
51,245
|
|
50,530
|
|
50,570
|
|
||||||
|
Net effect of dilutive stock awards based upon the treasury stock method
|
—
|
|
307
|
|
205
|
|
||||||
|
Diluted weighted average shares outstanding
|
51,537
|
|
50,837
|
|
50,775
|
|
||||||
|
Basic per share data:
|
||||||||||||
|
Continuing operations
|
$
|
(6.84
|
)
|
$
|
3.28
|
|
$
|
2.57
|
|
|||
|
Discontinued operations
|
$
|
1.28
|
|
$
|
—
|
|
$
|
—
|
|
|||
|
Basic (loss) income per share
|
$
|
(5.56
|
)
|
$
|
3.28
|
|
$
|
2.57
|
|
|||
|
Diluted per share data:
|
||||||||||||
|
Continuing operations
|
$
|
(6.84
|
)
|
$
|
3.26
|
|
$
|
2.56
|
|
|||
|
Discontinued operations
(1)
|
$
|
1.27
|
|
$
|
—
|
|
$
|
—
|
|
|||
|
Diluted (loss) income per share
|
$
|
(5.56
|
)
|
$
|
3.26
|
|
$
|
2.56
|
|
|||
|
Anti-dilutive stock-based awards excluded from the calculation of diluted earnings per share
|
3,434
|
|
93
|
|
44
|
|
||||||
|
(1)
|
The computation of diluted earnings per share from discontinued operations is calculated using diluted weighted average shares outstanding, which includes the net effect of dilutive stock awards, of approximately
292 thousand
shares for
fiscal 2019
.
|
NOTE 17—BUSINESS SEGMENTS
110
The Company has
three
operating segments aggregated under the Wholesale reportable segment: legacy Company Wholesale; Supervalu Wholesale and Canada Wholesale. In addition, the Company’s Retail operating segment is a separate reportable segment, which is primarily comprised of discontinued operations activities. The legacy Company Wholesale, Supervalu Wholesale and Canada Wholesale operating segments have similar products and services, customer channels, distribution methods and economic characteristics. The Wholesale reportable segment is engaged in the national distribution of
natural, organic, specialty, produce, and conventional grocery and non-food products, and provider of support services in the United States and Canada
. The Company has additional operating segments that do not meet the quantitative thresholds for reportable segments and are therefore aggregated under the caption of Other. Other includes a former retail division, that engaged in the sale of natural foods and related products to the general public through retail storefronts on the east coast of the United States, a manufacturing division, which engages in the importing, roasting, packaging, and distributing of nuts, dried fruit, seeds, trail mixes, granola, natural and organic snack items and confections, the Company’s branded product lines, and the Company’s brokerage business, which markets various products on behalf of food vendors directly and exclusively to the Company’s customers. Other also includes certain corporate operating expenses that are not allocated to operating segments, which include, among other expenses, restructuring, acquisition and integration related expenses, share-based compensation, and salaries, retainers, and other related expenses of certain officers and all directors. The Company allocates certain corporate capital expenditures and identifiable assets to its business segments and retains certain depreciation expense related to those assets within Other. Non-operating expenses that are not allocated to the operating segments are under the caption of Unallocated (Income)/Expenses.
|
(in thousands)
|
Wholesale
|
Other
|
Eliminations
|
Unallocated (Income)/
Expenses
|
Consolidated
|
||||||||||||||
|
Fiscal year ended August 3, 2019
|
|
|
|
|
|
||||||||||||||
|
Net sales
(1)
|
$
|
21,324,693
|
|
$
|
228,518
|
|
$
|
(166,143
|
)
|
$
|
—
|
|
$
|
21,387,068
|
|
||||
|
Goodwill and asset impairment charges
|
292,770
|
|
—
|
|
—
|
|
—
|
|
292,770
|
|
|||||||||
|
Restructuring, acquisition and integration related expenses
|
1,226
|
|
152,313
|
|
—
|
|
—
|
|
153,539
|
|
|||||||||
|
Operating loss
|
(9,341
|
)
|
(277,770
|
)
|
(3,901
|
)
|
—
|
|
(291,012
|
)
|
|||||||||
|
Total other expense, net
|
—
|
|
—
|
|
—
|
|
144,280
|
|
144,280
|
|
|||||||||
|
Loss from continuing operations before income taxes
|
|
|
|
|
|
|
|
|
(435,292
|
)
|
|||||||||
|
Depreciation and amortization
|
217,954
|
|
28,871
|
|
—
|
|
—
|
|
246,825
|
|
|||||||||
|
Capital expenditures
|
206,812
|
|
1,005
|
|
—
|
|
—
|
|
207,817
|
|
|||||||||
|
Total assets of continuing operations
|
6,301,015
|
|
426,637
|
|
(42,481
|
)
|
—
|
|
6,685,171
|
|
|||||||||
|
Fiscal year ended July 28, 2018
|
|
|
|
|
|
||||||||||||||
|
Net sales
|
10,169,840
|
|
228,465
|
|
(171,622
|
)
|
—
|
|
10,226,683
|
|
|||||||||
|
Goodwill and asset impairment charges
|
67
|
|
11,175
|
|
—
|
|
—
|
|
11,242
|
|
|||||||||
|
Restructuring, acquisition and integration related expenses
|
—
|
|
9,738
|
|
—
|
|
—
|
|
9,738
|
|
|||||||||
|
Operating income (loss)
|
260,363
|
|
(36,563
|
)
|
3,425
|
|
—
|
|
227,225
|
|
|||||||||
|
Total other expense, net
|
—
|
|
—
|
|
—
|
|
14,480
|
|
14,480
|
|
|||||||||
|
Income from continuing operations before income taxes
|
|
|
|
|
|
|
|
|
212,745
|
|
|||||||||
|
Depreciation and amortization
|
85,388
|
|
2,243
|
|
—
|
|
—
|
|
87,631
|
|
|||||||||
|
Capital expenditures
|
43,402
|
|
1,206
|
|
—
|
|
—
|
|
44,608
|
|
|||||||||
|
Total assets of continuing operations
|
2,811,948
|
|
189,312
|
|
(36,788
|
)
|
—
|
|
2,964,472
|
|
|||||||||
|
Fiscal year ended July 29, 2017
|
|
|
|
|
|
||||||||||||||
|
Net sales
|
9,210,815
|
|
232,192
|
|
(168,536
|
)
|
—
|
|
9,274,471
|
|
|||||||||
|
Restructuring, acquisition and integration related expenses
|
2,922
|
|
3,942
|
|
—
|
|
—
|
|
6,864
|
|
|||||||||
|
Operating income (loss)
|
247,419
|
|
(21,857
|
)
|
463
|
|
—
|
|
226,025
|
|
|||||||||
|
Total other expense, net
|
—
|
|
—
|
|
—
|
|
11,602
|
|
11,602
|
|
|||||||||
|
Income from continuing operations before income taxes
|
|
|
|
|
|
|
|
|
214,423
|
|
|||||||||
|
Depreciation and amortization
|
83,063
|
|
2,988
|
|
—
|
|
—
|
|
86,051
|
|
|||||||||
|
Capital expenditures
|
53,328
|
|
2,784
|
|
—
|
|
—
|
|
56,112
|
|
|||||||||
|
Total assets of continuing operations
|
2,724,069
|
|
203,154
|
|
(40,660
|
)
|
—
|
|
2,886,563
|
|
|||||||||
111
|
(1)
|
For the fiscal year ended
August 3, 2019
, the Company recorded
$769.8 million
within Net sales in its Wholesale reportable segment attributable to discontinued operations inter-company product purchases from its Retail operating segment, which it expects will continue subsequent to the sale of certain retail banners.
|
NOTE 18—COMMITMENTS, CONTINGENCIES AND OFF-BALANCE SHEET ARRANGEMENTS
Guarantees and Contingent Liabilities
We have outstanding guarantees related to certain leases, fixture financing loans and other debt obligations of various retailers as of
August 3, 2019
. These guarantees were generally made to support the business growth of wholesale customers. The guarantees are generally for the entire terms of the leases, fixture financing loans or other debt obligations with remaining terms that range from less than
one year
to
eleven years
, with a weighted average remaining term of approximately
seven years
. For each guarantee issued, if the wholesale customer or other third-party defaults on a payment, we would be required to make payments under our guarantee. Generally, the guarantees are secured by indemnification agreements or personal guarantees of the primary obligor/retailer.
We review performance risk related to our guarantee obligations based on internal measures of credit performance. As of
August 3, 2019
, the maximum amount of undiscounted payments we would be required to make in the event of default of all guarantees was
$36.9 million
(
$26.0 million
on a discounted basis). Based on the indemnification agreements, personal guarantees and results of the reviews of performance risk, we believe the likelihood that we will be required to assume a material amount of these obligations is remote. Accordingly, no amount has been recorded in the Consolidated Balance Sheets for these contingent obligations under our guarantee arrangements that we are not making direct payments to the landlord already, as the fair value has been determined to be de minimis.
We are contingently liable for leases that have been assigned to various third parties in connection with facility closings and dispositions. We could be required to satisfy the obligations under the leases if any of the assignees are unable to fulfill their lease obligations. Due to the wide distribution of our lease assignments among third parties, and various other remedies available, we believe the likelihood that we will be required to assume a material amount of these obligations is remote. No amount has been recorded in the Consolidated Balance Sheets for these contingent obligations under our guarantee arrangements as the fair value has been determined to be de minimis.
We are a party to a variety of contractual agreements under which we may be obligated to indemnify the other party for certain matters in the ordinary course of business, which indemnities may be secured by operation of law or otherwise. These agreements primarily relate to our commercial contracts, service agreements, contracts entered into for the purchase and sale of stock or assets, operating leases and other real estate contracts, financial agreements, agreements to provide services to us and agreements to indemnify officers, directors and employees in the performance of their work. While our aggregate indemnification obligations could result in a material liability, we are not aware of any matters that are expected to result in a material liability. No amount has been recorded in the Consolidated Balance Sheets for these contingent obligations as the fair value has been determined to be de minimis.
In connection with Supervalu’s sale of New Albertson’s, Inc. (“NAI”) on March 21, 2013, we remain contingently liable with respect to certain self-insurance commitments and other guarantees as a result of parental guarantees issued by Supervalu with respect to the obligations of NAI that were incurred while NAI was Supervalu’s subsidiary. Based on the expected settlement of the self-insurance claims that underlie our commitments, we believe that such contingent liabilities will continue to decline. Subsequent to the sale of NAI, NAI collateralized most of these obligations with letters of credit and surety bonds to numerous state governmental authorities. Because NAI remains a primary obligor on these self-insurance and other obligations and has collateralized most of the self-insurance obligations for which we remain contingently liable, we believe that the likelihood that we will be required to assume a material amount of these obligations is remote. Accordingly, no amount has been recorded in the Consolidated Balance Sheets for these guarantees, as the fair value has been determined to be de minimis.
Agreements with Save-A-Lot and Onex
The Agreement and Plan of Merger pursuant to which Supervalu sold the Save-A-Lot business in 2016 (the “SAL Merger Agreement”) contains customary indemnification obligations of each party with respect to breaches of their respective representations, warranties and covenants, and certain other specified matters, on the terms and subject to the limitations set forth in the SAL Merger Agreement. Similarly, Supervalu entered into a Separation Agreement (the “Separation Agreement”) with Moran Foods, LLC d/b/a Save-A-Lot (“Moran Foods”), which contains indemnification obligations and covenants related to the separation of the assets and liabilities of the Save-A-Lot business from us. We also entered into a Services Agreement with Moran Foods (the “Services Agreement”), pursuant to which we are providing Save-A-Lot various technical, human resources, finance
112
and other operational services for a term of
five
years, subject to termination provisions that can be exercised by each party. The initial annual base charge under the Services Agreement is
$30 million
, subject to adjustments. The Services Agreement generally requires each party to indemnify the other party against third-party claims arising out of the performance of or the provision or receipt of services under the Services Agreement. While our aggregate indemnification obligations to Save-A-Lot and Onex could result in a material liability, we are not aware of any matters that are expected to result in a material liability. The fair value of the guarantee is immaterial and is included within Other long-term liabilities in the Consolidated Balance Sheets.
Other Contractual Commitments
In the ordinary course of business, we enter into supply contracts to purchase products for resale and purchase, and service contracts for fixed asset and information technology commitments. These contracts typically include either volume commitments or fixed expiration dates, termination provisions and other standard contractual considerations. As of
August 3, 2019
, we had approximately
$260
million of non-cancelable future purchase obligations. The Company did not have any outstanding commitments for the purchase of diesel fuel as of
August 3, 2019
.
Legal Proceedings
In December 2008, a class action complaint was filed in the United States District Court for the Western District of Wisconsin against Supervalu alleging that a 2003 transaction between Supervalu and C&S Wholesale Grocers, Inc. (“C&S”) was a conspiracy to restrain trade and allocate markets. In the 2003 transaction, Supervalu purchased certain assets of the Fleming Corporation as part of Fleming Corporation’s bankruptcy proceedings and sold certain of Supervalu’s assets to C&S that were located in New England.
Three
other retailers filed similar complaints in other jurisdictions and the cases were consolidated in the United States District Court in Minnesota. The complaints alleged that the conspiracy was concealed and continued through the use of non-compete and non-solicitation agreements and the closing down of the distribution facilities that Supervalu and C&S purchased from each other. Plaintiffs were divided into Midwest plaintiffs and a New England plaintiff and are seeking monetary damages, injunctive relief and attorney’s fees. As previously disclosed, the Company settled with the Midwest plaintiffs in November 2017. The New England plaintiff was not a party to the settlement and is pursuing its individual claims and potential class action claims against Supervalu, which at this time are determined as remote. On February 15, 2018, Supervalu filed a summary judgment and Daubert motion and the New England plaintiff filed a motion for class certification and on July 27, 2018, the District Court granted Supervalu’s motions. The New England plaintiff appealed to the 8th Circuit on August 15, 2018. Briefing on the appeal is complete and a hearing date has been set for October 15, 2019.
The Company is one of dozens of companies that have been named in various lawsuits alleging that drug manufacturers, retailers and distributors contributed to the national opioid epidemic. Currently, UNFI, primarily through its subsidiary, Advantage Logistics, is named in approximately
28
suits pending in the United States District Court for the Northern District of Ohio where over
1,800
cases have been consolidated as Multi-District Litigation (“MDL”). In accordance with the Stock Purchase Agreement dated January 10, 2013, between New Albertson’s Inc. and the Company (the “Stock Purchase Agreement”), New Albertson’s Inc. is defending and indemnifying UNFI in
19
of the cases under a reservation of rights as those cases relate to New Albertson’s pharmacies. In one of the MDL cases, MDL No. 2804 filed by The Blackfeet Tribe of the Blackfeet Indian Reservation, all defendants were ordered to Answer the Complaint, which UNFI did on July 26, 2019. To date, no discovery has been conducted against UNFI in any of the actions. UNFI is vigorously defending these matters, which it believes are without merit.
UNFI is currently subject to a qui tam action alleging violations of the False Claims Act ("FCA"). In United States ex rel. Schutte and Yarberry v. Supervalu, New Albertson's, Inc., et al, which is pending in the U.S. District Court for the Central District of Illinois, the relators allege that defendants overcharged government healthcare programs by not providing the government, as a part of usual and customary prices, the benefit of discounts given to customers purchasing prescription medication who requested that defendants match competitor prices. The complaint was originally filed under seal and amended on November 30, 2015. The government previously investigated the relators' allegations and declined to intervene. Violations of the FCA are subject to treble damages and penalties of up to a specified dollar amount per false claim. Relators elected to pursue the case on their own and have alleged FCA damages against Supervalu and New Albertsons in excess of
$100 million
, not including trebling and statutory penalties. For the majority of the relevant period Supervalu and New Albertson’s operated as a combined company. In March 2013, Supervalu divested New Albertson’s (and related assets) pursuant the Stock Purchase Agreement. Based on the claims that are currently pending and the Stock Purchase Agreement, Supervalu’s share of a potential award (at the currently claimed value by relators) would be approximately
$24 million
, not including trebling and statutory penalties. Both sides moved for summary judgment. Discovery is complete, and trial will be set after the Court rules on the pending motions. On August 5, 2019, the Court granted one of relators’ summary judgment motions finding that defendants’ lower matched prices are the usual and customary prices and that Medicare Part D and Medicaid were entitled to those prices. There are additional pending motions for summary judgment filed by defendants and relators that await rulings by the Court, including on key FCA elements of materiality and knowledge. On August 30, 2019, defendants filed a motion with the District Court seeking certification of the summary judgment
113
decision for interlocutory appeal. UNFI is vigorously defending this matter and believes that it should be successful on the merits. In light of the most recent summary judgment decision, the Company now believes the risk of loss is reasonably possible. However, management is unable to estimate a range of reasonably possible loss because there are several disputed factual and legal matters that have not yet been resolved, including fundamentally whether the FCA violations actually occurred (which defendants still strongly believe and continue to argue did not), and the appropriate methodology of determining potential damages, if any.
In November 2018, a putative nationwide class action was filed in Rhode Island state court, and which the Company removed to U.S. District Court for the District of Rhode Island. In North Country Store v. United Natural Foods, Inc., plaintiff asserts that the Company made false representations about the nature of fuel surcharges charged to customers and asserts claims for alleged violations of Connecticut’s Unfair Trade Practices Act, breach of contract, unjust enrichment and breach of the covenant of good faith and fair dealing arising out of the Company’s fuel surcharge practices. On March 5, 2019, the Company answered the complaint denying the allegations. A court-ordered mediation is scheduled for October 2019. While the Company believes that it has meritorious defenses to the allegations and should be successful upon ultimate resolution of this matter, it also believes the risk of loss is now reasonably possible. Management is unable to estimate a range of reasonably possible loss because the case is in the very early stages, no discovery has been conducted and the plaintiff has not asserted a damage amount.
From time to time, the Company receives notice of claims or potential claims, becomes involved in litigation, alternative dispute resolution such as arbitration, or other legal and regulatory proceedings that arise in the ordinary course of its business, including investigations and claims regarding employment law; pension plans; labor union disputes, including unfair labor practices, such as claims for back-pay it the context of labor contract negotiations; supplier, customer and service provider contract terms and claims including matter related to supplier or customer insolvency or general inability to pay obligations as they become due; real estate and environmental matters, including claims in connection with our ownership and lease of a substantial amount of real property, both neutral and warehouse properties; and antitrust. Other than as described above, there are no pending material legal proceedings to which the Company is a party or to which its property is subject.
Predicting the outcomes of claims and litigation and estimating related costs and exposures involves substantial uncertainties that could cause actual outcomes, costs and exposures to vary materially from current expectations. We regularly monitor our exposure to the loss contingencies associated with these matters and may from time to time change our predictions with respect to outcomes and estimates with respect to related costs and exposures. As of August 3, 2019, no material accrued obligations, individually or in the aggregate, have been recorded for these legal proceedings.
Although management believes it has made appropriate assessments of potential and contingent loss in each of these cases based on current facts and circumstances, and application of prevailing legal principles, there can be no assurance that material differences in actual outcomes from management’s current assessments, costs and exposures relative to current predictions and estimates, or material changes in such predictions or estimates will not occur. The occurrence of any of the foregoing, could have a material adverse effect on our financial condition, results of operations or cash flows.
NOTE 19—DISCONTINUED OPERATIONS
In conjunction with the Supervalu acquisition, the Company announced its plan to sell the remaining acquired retail operations of Supervalu (“Retail”). The results of operations, financial position and cash flows of Cub Foods, Hornbacher’s, Shoppers and Shop ‘n Save St. Louis and Shop ‘n Save East retail operations have been presented as discontinued operations and the related assets and liabilities have been classified as held-for-sale.
In fiscal 2019, the Company closed
three
of its
eight
Shop ‘n Save East stores and sold the remaining
five
Shop ‘n Save East stores to GIANT Food Store, LLC, and did not incur a gain or loss on the sale of this disposal group. The Company closed the remaining Shop ‘n Save St. Louis retail stores and the distribution center that were not sold prior to the Supervalu acquisition date.
In fiscal 2019, the Company completed the sale of
seven
of its
eight
Hornbacher's locations, as well as Hornbacher’s newest store currently under development in West Fargo, North Dakota, to Coborn's Inc. (“Coborn’s”). The Company did not incur a gain or loss on the sale of this disposal group. The Hornbacher’s store in Grand Forks, North Dakota was not included in the sale to Coborn’s and has closed pursuant to the terms of the definitive agreement. As part of the sale, Coborn's entered into a long-term agreement for the Company to serve as the primary supplier of the Hornbacher's locations and expand its existing supply arrangements for other Coborn’s locations.
In the fourth quarter of fiscal 2019, the Company completed the sale of the pharmacy prescription files and inventory of the Shoppers disposal group. As of August 3, 2019, only the Cub Foods and Shoppers disposal groups continue to be classified as operations held for sale as discontinued operations.
114
Operating results of discontinued operations are summarized below:
|
(in thousands)
|
2019
(1)
(41 weeks)
|
|||
|
Net sales
|
$
|
2,094,046
|
|
|
|
Cost of sales
|
1,523,742
|
|
||
|
Gross profit
|
570,304
|
|
||
|
Operating expenses
|
463,355
|
|
||
|
Restructuring expenses
|
16,931
|
|
||
|
Operating income
|
90,018
|
|
||
|
Interest expense
|
931
|
|
||
|
Net periodic benefit income, excluding service cost
|
(463
|
)
|
||
|
Equity in earnings of unconsolidated subsidiaries
|
1,910
|
|
||
|
Income from discontinued operations before income taxes
|
87,640
|
|
||
|
Income tax provision
|
21,840
|
|
||
|
Income from discontinued operations, net of tax
|
$
|
65,800
|
|
|
|
(1)
|
These results reflect retail operations from the Supervalu acquisition date of October 22, 2018 to
August 3, 2019
.
|
The Company recorded
$769.8 million
within Net sales from continuing operations attributable to discontinued operations inter-company product purchases in
fiscal 2019
, which we expect will continue subsequent to the sale of certain retail banners. These amounts were recorded at gross margin rates consistent with sales to other similar wholesale customers of the acquired Supervalu business. No sales were recorded within continuing operations for retail banners that the Company expects to dispose of without a supply agreement, which were eliminated upon consolidation within continuing operations and amounted to
$411.9 million
in
fiscal 2019
.
The carrying amounts (in thousands) of major classes of assets and liabilities that were classified as held-for-sale on the Consolidated Balance Sheets follows in the table below. The assets and liabilities of discontinued operations were acquired as part of the Supervalu acquisition, and as of
August 3, 2019
, the purchase price allocation related to these assets and liabilities was preliminary and will be finalized when valuations are complete and final assessments of the fair value of other acquired assets and assumed liabilities are completed. There can be no assurance that such final assessments will not result in material changes from the preliminary purchase price allocations. The Company’s estimates and assumptions are subject to change during the measurement period (up to one year from the acquisition date), as the Company finalizes the valuations of certain real and personal property and intangible assets. The fair value of discontinued operations, determined as of the acquisition date, includes estimated consideration expected to be received, less costs to sell. Within the Company’s determination of fair value of the respective disposal groups, the Company incorporates the impact of the fair value of off-balance sheet multiemployer pension plan obligations that it expects to sell so that long-lived assets are not reduced below their fair value.
115
|
(in thousands)
|
August 3, 2019
|
|||
|
Current assets
|
||||
|
Cash and cash equivalents
|
$
|
2,917
|
|
|
|
Receivables, net
|
1,471
|
|
||
|
Inventories
|
129,142
|
|
||
|
Other current assets
|
10,199
|
|
||
|
Total current assets of discontinued operations
|
143,729
|
|
||
|
Long-term assets
|
||||
|
Property and equipment
|
301,395
|
|
||
|
Intangible assets
|
48,788
|
|
||
|
Other assets
|
1,882
|
|
||
|
Total long-term assets of discontinued operations
|
352,065
|
|
||
|
Total assets of discontinued operations
|
$
|
495,794
|
|
|
|
Current liabilities
|
||||
|
Accounts payable
|
$
|
61,634
|
|
|
|
Accrued compensation and benefits
|
45,887
|
|
||
|
Other current liabilities
|
14,744
|
|
||
|
Total current liabilities of discontinued operations
|
122,265
|
|
||
|
Long-term liabilities
|
||||
|
Other long-term liabilities
|
1,923
|
|
||
|
Total liabilities of discontinued operations
|
124,188
|
|
||
|
Net assets of discontinued operations
|
$
|
371,606
|
|
|
Additional Retail Accounting Policies
Revenues from retail product sales are recognized at the point of sale upon customer check-out. Sales tax is excluded from Net sales. Limited rights of return exist with our customers due to the nature of the products we sell. Advertising income earned from franchisees that participate in the Company’s retail advertising program are recognized as Net sales. Loyalty program expense in the form of fuel rewards is recognized as a reduction of Net sales. Franchise agreement revenue is recognized within Net sales.
Retail advertising expenses are included in cost of sales of discontinued operations, net of cooperative advertising reimbursements. Operating expenses of discontinued operations include employee-related costs, such as salaries and wages, incentive compensation, health and welfare and workers’ compensation, and occupancy costs, including utilities and operating costs of retail stores, and depreciation and amortization expense, impairment charges on property, plant and equipment and other administrative costs. Rent expense on operating leases and capital lease amortization expense of retail stores have not been included in discontinued operations, as we expect to remain primarily obligated under these leases. Refer to
Note 12—Leases
for additional information.
Retail inventories are valued at the lower of cost or market under LIFO. Substantially all of our inventory consists of finished goods and are valued under the retail inventory method (“RIM”) or replacement cost method to value discrete inventory items at lower of cost or market under the FIFO method before application of any LIFO reserve.
116
NOTE 20—QUARTERLY FINANCIAL DATA (UNAUDITED)
The following table sets forth certain key interim financial information for
fiscal 2019
(53 weeks) and
2018
(52 weeks):
|
2019
|
|||||||||||||||||||
|
(In thousands except per share data)
|
First
Quarter
|
Second
Quarter
|
Third
Quarter
|
Fourth
Quarter
(1)
|
Full Year
(1)
|
||||||||||||||
|
Net sales
|
$
|
2,868,156
|
|
$
|
6,149,206
|
|
$
|
5,962,620
|
|
$
|
6,407,086
|
|
$
|
21,387,068
|
|
||||
|
Gross profit
|
412,331
|
|
761,783
|
|
788,550
|
|
822,346
|
|
2,785,010
|
|
|||||||||
|
Net (loss) income from continuing operations
|
(21,361
|
)
|
(363,303
|
)
|
32,774
|
|
1,207
|
|
(350,683
|
)
|
|||||||||
|
Income from discontinued operations, net of tax
|
2,070
|
|
21,407
|
|
24,370
|
|
17,953
|
|
65,800
|
|
|||||||||
|
Net (loss) income including noncontrolling interests
|
(19,291
|
)
|
(341,896
|
)
|
57,144
|
|
19,160
|
|
(284,883
|
)
|
|||||||||
|
Net (loss) income attributable to United Natural Foods, Inc.
|
(19,294
|
)
|
(341,725
|
)
|
57,092
|
|
18,937
|
|
(284,990
|
)
|
|||||||||
|
Basic (loss) earnings per share:
|
|
||||||||||||||||||
|
Continuing operations
|
$
|
(0.42
|
)
|
$
|
(7.15
|
)
|
$
|
0.64
|
|
$
|
0.02
|
|
$
|
(6.84
|
)
|
||||
|
Basic (loss) income per share
|
$
|
(0.38
|
)
|
$
|
(6.72
|
)
|
$
|
1.12
|
|
$
|
0.36
|
|
$
|
(5.56
|
)
|
||||
|
Diluted (loss) earnings per share:
|
|||||||||||||||||||
|
Continuing operations
|
$
|
(0.42
|
)
|
$
|
(7.15
|
)
|
$
|
0.64
|
|
$
|
0.02
|
|
$
|
(6.84
|
)
|
||||
|
Diluted (loss) income per share
|
$
|
(0.38
|
)
|
$
|
(6.72
|
)
|
$
|
1.12
|
|
$
|
0.36
|
|
$
|
(5.56
|
)
|
||||
|
(1)
|
Fiscal 2019
results reflect 53 weeks of operating results, as compared to
fiscal 2018
52 weeks. The fourth quarter of
fiscal 2019
includes 14 weeks and the fourth quarter of
fiscal 2018
contains 13 weeks.
|
|
2018
|
|||||||||||||||||||
|
(In thousands except per share data)
|
First
Quarter
|
Second
Quarter
|
Third
Quarter
|
Fourth
Quarter
|
Full Year
|
||||||||||||||
|
Net sales
|
$
|
2,457,545
|
|
$
|
2,528,011
|
|
$
|
2,648,879
|
|
$
|
2,592,248
|
|
$
|
10,226,683
|
|
||||
|
Gross profit
|
367,216
|
|
371,522
|
|
408,087
|
|
375,942
|
|
1,522,767
|
|
|||||||||
|
Net income from continuing operations
|
30,505
|
|
50,486
|
|
51,891
|
|
32,788
|
|
165,670
|
|
|||||||||
|
Income from discontinued operations, net of tax
|
—
|
|
—
|
|
—
|
|
—
|
|
—
|
|
|||||||||
|
Net income including noncontrolling interests
|
30,505
|
|
50,486
|
|
51,891
|
|
32,788
|
|
165,670
|
|
|||||||||
|
Net income attributable to United Natural Foods, Inc.
|
30,505
|
|
50,486
|
|
51,891
|
|
32,788
|
|
165,670
|
|
|||||||||
|
Basic earnings per share:
|
|
||||||||||||||||||
|
Continuing operations
|
$
|
0.60
|
|
$
|
1.00
|
|
$
|
1.03
|
|
$
|
0.65
|
|
$
|
3.28
|
|
||||
|
Basic income per share
|
$
|
0.60
|
|
$
|
1.00
|
|
$
|
1.03
|
|
$
|
0.65
|
|
$
|
3.28
|
|
||||
|
Diluted earnings per share:
|
|||||||||||||||||||
|
Continuing operations
|
$
|
0.60
|
|
$
|
0.99
|
|
$
|
1.02
|
|
$
|
0.64
|
|
$
|
3.26
|
|
||||
|
Diluted income per share
|
$
|
0.60
|
|
$
|
0.99
|
|
$
|
1.02
|
|
$
|
0.64
|
|
$
|
3.26
|
|
||||
In the first quarter of fiscal 2019, the Company acquired Supervalu and recognized its retail disposal groups as businesses held for sale as discontinued operations, which impacted Net (loss) income attributable to United Natural Foods, Inc. and basic and total basic and diluted earnings per share.
ITEM 9. CHANGES IN AND DISAGREEMENTS WITH ACCOUNTANTS ON ACCOUNTING AND FINANCIAL DISCLOSURE
Not applicable.
117
ITEM 9A. CONTROLS AND PROCEDURES
Evaluation of Disclosure Controls and Procedures
.
We carried out an evaluation, under the supervision and with the participation of our Chief Executive Officer and Interim Chief Financial Officer, of the effectiveness of the design and operation of our disclosure controls and procedures (as defined in Rules 13a-15(e) and 15d-15(e) of the Exchange Act) as of the end of the period covered by this Annual Report (the “Evaluation Date”). Based on this evaluation, our Chief Executive Officer and Interim Chief Financial Officer concluded that, as of the Evaluation Date, our disclosure controls and procedures were effective.
Management’s Annual Report on Internal Control Over Financial Reporting.
Our management is responsible for establishing and maintaining adequate internal control over financial reporting. Internal control over financial reporting is defined in Rules 13a-15(f) or 15d-15(f) promulgated under the Exchange Act as a process designed by, or under the supervision of, our principal executive and principal financial officers and effected by our Board of Directors, management and other personnel, to provide reasonable assurance regarding the reliability of financial reporting and the preparation of financial statements for external purposes in accordance with generally accepted accounting principles and includes those policies and procedures that:
|
•
|
Pertain to the maintenance of records that in reasonable detail accurately and fairly reflect the transactions and dispositions of our assets;
|
|
•
|
Provide reasonable assurance that transactions are recorded as necessary to permit preparation of financial statements in accordance with generally accepted accounting principles, and that receipts and expenditures are being made only in accordance with authorizations of our management and directors; and
|
|
•
|
Provide reasonable assurance regarding prevention or timely detection of unauthorized acquisition, use or disposition of our assets that could have a material effect on the financial statements.
|
Because of its inherent limitations, internal control over financial reporting may not prevent or detect misstatements. Projections of any evaluation of effectiveness to future periods are subject to the risk that controls may become inadequate because of changes in conditions, or that the degree of compliance with the policies or procedures may deteriorate.
Our management, including our Chief Executive Officer and Interim Chief Financial Officer, assessed the effectiveness of our internal control over financial reporting as of
August 3, 2019
, excluding an assessment of internal control over financial reporting of Supervalu and its subsidiaries, which was acquired on October 22, 2018 and reflecting total assets and revenue constituting $4.4 billion (of which $923.0 million represents goodwill and intangible assets included within the scope of management’s assessment) and $10.5 billion, respectively, of the Company’s consolidated financial statement amounts as of and for the year ended August 3, 2019. In making this assessment, our management used the criteria set forth by the Committee of Sponsoring Organizations of the Treadway Commission (COSO) in the Internal Control-Integrated Framework (2013 framework). Based on its assessment, our management concluded that, as of
August 3, 2019
, our internal control over financial reporting was effective based on those criteria at the reasonable assurance level.
Report of the Independent Registered Public Accounting Firm.
The effectiveness of our internal control over financial reporting as of
August 3, 2019
has been audited by KPMG LLP, an independent registered public accounting firm, as stated in its attestation report which is included in “Item 8. Financial Statements and Supplementary Data” of this Annual Report.
Changes in Internal Controls Over Financial Reporting
We are currently in the process of integrating Supervalu’s internal controls over financial reporting. During the fourth quarter of fiscal 2019, we assessed and modified certain internal controls in connection with our adoption of ASU No. 2016-02,
Leases (Topic 842)
, which we adopted effective August 4, 2019. Except for the aforementioned changes, there has been no change in our internal control over financial reporting (as such term is defined in Exchange Act Rule 13a-15(f)or 15d-15(f)) that occurred during the fiscal quarter ended
August 3, 2019
that materially affected, or is reasonably likely to materially affect, our internal control over financial reporting.
ITEM 9B. OTHER INFORMATION
None.
118
PART III.
ITEM 10. DIRECTORS, EXECUTIVE OFFICERS AND CORPORATE GOVERNANCE
The information required by this item will be contained, in part, in our Definitive Proxy Statement on Schedule 14A for our Annual Meeting of Stockholders to be held on
December 18, 2019
(the “
2019
Proxy Statement”) under the captions “Directors and Nominees for Director,” “Executive Officers of the Company,” “Delinquent Section 16(a) Reports,” if applicable, and “Committees of the Board of Directors—Audit Committee” and is incorporated herein by this reference.
We have adopted a code of conduct and ethics that applies to our Chief Executive Officer, Chief Financial Officer, and employees within our finance, operations, and sales departments. Our code of conduct and ethics is publicly available on our website at www.unfi.com and is available free of charge by writing to United Natural Foods, Inc., 11840 Valley View Road, Eden Prairie, MN 55344, Attn: Investor Relations. We intend to make any legally required disclosures regarding amendments to, or waivers of, the provisions of the code of conduct and ethics on our website at www.unfi.com. Please note that our website address is provided as an inactive textual reference only.
ITEM 11. EXECUTIVE COMPENSATION
The information required by this item will be contained in the
2019
Proxy Statement under the captions “Non-employee Director Compensation,” “Executive Compensation”, “Compensation Discussion and Analysis”, “Executive Compensation Tables,” “Potential Payments Upon Termination or Change-in-Control,” “CEO Pay Ratio,” “Risk Oversight,” “Compensation Risk,” “Compensation Committee Interlocks and Insider Participation” and “Report of the Compensation Committee” and is incorporated herein by this reference.
ITEM 12. SECURITY OWNERSHIP OF CERTAIN BENEFICIAL OWNERS AND MANAGEMENT AND RELATED STOCKHOLDER MATTERS
The information required by this item will be contained, in part, in the
2019
Proxy Statement under the caption “Stock Ownership of Certain Beneficial Owners and Management”, and is incorporated herein by this reference.
The following table provides certain information with respect to equity awards under our equity compensation plans as of
August 3, 2019
.
|
Plan Category
|
Number of securities to
be issued upon exercise
of outstanding options,
warrants and rights
|
|
Weighted-average
exercise price of
outstanding options
|
|
Number of securities remaining
available for future issuance
under equity compensation
plans (excluding securities
reflected in the second column)
|
|
|||||
|
Plans approved by stockholders
|
5,015,446
|
|
(1)
|
$
|
43.06
|
|
(1)
|
1,472,441
|
|
(2)
|
|
|
Plans not approved by stockholders
|
86,529
|
|
(3)
|
—
|
|
(3)
|
—
|
|
|
||
|
Total
|
5,101,975
|
|
|
$
|
43.06
|
|
|
1,472,441
|
|
|
|
|
(1)
|
Includes
914,051
restricted stock units under the SVU Replacement Awards,
1,520,812
stock options under the SVU Replacement Options,
1,999,136
restricted stock units under the 2012 Plan,
105,075
stock options under the 2012 Plan,
66,200
stock options under the 2004 Plan,
77,150
stock options under the 2002 Plan, and
333,022
under the 2019 Long-Term Incentive Plan. Restricted stock units and performance stock units do not have an exercise price because their value is dependent upon continued employment over a period of time or the achievement of certain performance goals, and are to be settled for shares of common stock. Accordingly, they have been disregarded for purposes of computing the weighted-average exercise price.
|
|
(2)
|
All shares were available for issuance under the 2012 Plan. The 2012 Plan authorizes grants in the form of stock options, stock appreciation rights, restricted stock, restricted stock units, performance shares, performance units or a combination thereof but includes limits on the number of awards that may be issued in the form of restricted shares or units. The number of shares remaining available for future issuances assumes that, with respect to outstanding performance-based restricted stock units, the vesting criteria will be achieved at the target level.
|
|
(3)
|
Consists of phantom stock units outstanding under the United Natural Foods Inc. Deferred Compensation Plan, which reflect immaterial obligations to the Company as of August 3, 2019. Phantom stock units do not have an exercise price because the units may be settled only for shares of common stock on a one-for-one basis at a future date as outlined in the plan.
|
ITEM 13. CERTAIN RELATIONSHIPS AND RELATED TRANSACTIONS, AND DIRECTOR INDEPENDENCE
The information required by this item will be contained in the
2019
Proxy Statement under the captions “Certain Relationships and Related Transactions” and “Director Independence” and is incorporated herein by this reference.
ITEM 14. PRINCIPAL ACCOUNTING FEES AND SERVICES
119
The information required by this item will be contained in the
2019
Proxy Statement under the captions “Fees Paid to KPMG LLP” and “Policy on Audit Committee Pre-Approval of Audit and Permissible Non-Audit Services,” and is incorporated herein by this reference.
120
PART IV.
ITEM 15. EXHIBITS, FINANCIAL STATEMENT SCHEDULES
|
(a)
|
Documents filed as a part of this Annual Report.
|
|
1.
|
Financial Statements
. The Financial Statements listed in the Index to Financial Statements in Item 8 hereof are filed as part of this Annual Report.
|
|
2.
|
Financial Statement Schedules
. All schedules have been omitted because they are either not required or the information required is included in our consolidated financial statements or the notes thereto included in Item 8 hereof.
|
|
3.
|
Exhibits
. The Exhibits listed in the Exhibit Index immediately preceding such Exhibits are filed as part of this Annual Report.
|
ITEM 16. FORM 10-K SUMMARY
None.
121
EXHIBIT INDEX
|
Exhibit No.
|
Description
|
|
|
2.1
|
|
|
|
2.2
|
||
|
3.1
|
|
|
|
3.2
|
||
|
4.1
|
||
|
4.2*
|
||
|
10.1**
|
||
|
10.2**
|
||
|
10.3**
|
||
|
10.4**
|
||
|
10.5**
|
||
|
10.6**
|
||
|
10.7**
|
||
|
10.8**
|
||
|
10.9**
|
|
|
122
|
Exhibit No.
|
Description
|
|
|
10.10**
|
||
|
10.11**
|
||
|
10.12**
|
||
|
10.13**
|
||
|
10.14**
|
||
|
10.15**
|
||
|
10.16**
|
||
|
10.17**
|
||
|
10.18
|
||
|
10.19
|
||
|
10.20
|
||
|
10.21
|
|
|
|
10.22+
|
||
|
10.23**
|
||
123
|
Exhibit No.
|
Description
|
|
|
10.24
|
||
|
10.25
|
||
|
10.26
|
||
|
10.27
|
||
|
10.28
|
||
|
10.29**
|
||
|
10.30**
|
||
|
10.31**
|
||
|
10.32**
|
||
|
10.33**
|
||
|
10.34**
|
||
|
10.35**
|
||
|
10.36* +
|
||
|
10.37
|
||
|
10.38
|
||
|
10.39
|
||
|
10.40
|
||
|
10.41
|
||
124
|
Exhibit No.
|
Description
|
|
|
10.42
|
||
|
10.43
|
||
|
10.44
|
||
|
10.45
|
||
|
10.46
|
||
|
10.47*
|
||
|
10.48* **
|
||
|
21*
|
||
|
23.1*
|
||
|
31.1*
|
||
|
31.2*
|
||
|
32.1*
|
||
|
32.2*
|
||
|
101*
|
The following materials from the United Natural Foods, Inc.’s Annual Report on Form 10-K for the fiscal year ended August 3, 2019, formatted in XBRL (eXtensible Business Reporting Language): (i) Consolidated Balance Sheets, (ii) Consolidated Statements of Operations, (iii) Consolidated Statements of Comprehensive Income, (iv) Consolidated Statement of Stockholders’ Equity, (v) Consolidated Statements of Cash Flows, and (vi) Notes to Consolidated Financial Statements.
|
|
* Filed herewith.
** Denotes a management contract or compensatory plan or arrangement.
+ Confidential treatment has been requested and granted with respect to certain portions of this exhibit pursuant to Rule 24b-2 of the Securities Exchange Act of 1934, as amended. Omitted portions have been filed separately with the United States Securities and Exchange Commission.
125
SIGNATURES
Pursuant to the requirements of Section 13 or 15 (d) of the Securities Exchange Act of 1934, the registrant has duly caused this report to be signed on its behalf by the undersigned thereunto duly authorized.
|
|
UNITED NATURAL FOODS, INC.
|
|
|
/s/ JOHN W. HOWARD
|
||
|
|
John W. Howard
Interim Chief Financial Officer (Principal Financial Officer)
|
|
|
|
Dated: October 1, 2019
|
|
Pursuant to the requirements of the Securities Exchange Act of 1934, this report has been signed below by the following persons on behalf of the registrant and in the capacities and on the dates indicated.
|
Name
|
Title
|
Date
|
||
|
/s/ STEVEN L. SPINNER
|
Chief Executive Officer and Chairman (Principal Executive Officer)
|
October 1, 2019
|
||
|
Steven L. Spinner
|
||||
|
/s/ JOHN W. HOWARD
|
Interim Chief Financial Officer (Principal Financial Officer)
|
October 1, 2019
|
||
|
John W. Howard
|
||||
|
/s/ DAVID W. JOHNSON
|
Chief Accounting Officer (Principal Accounting Officer)
|
October 1, 2019
|
||
|
David W. Johnson
|
||||
|
/s/ ERIC F. ARTZ
|
Director
|
October 1, 2019
|
||
|
Eric F. Artz
|
||||
|
/s/ ANN TORRE BATES
|
Director
|
October 1, 2019
|
||
|
Ann Torre Bates
|
||||
|
/s/ DENISE M. CLARK
|
Director
|
October 1, 2019
|
||
|
Denise M. Clark
|
||||
|
/s/ DAPHNE J. DUFRESNE
|
Director
|
October 1, 2019
|
||
|
Daphne J. Dufresne
|
||||
|
/s/ MICHAEL S. FUNK
|
Director
|
October 1, 2019
|
||
|
Michael S. Funk
|
||||
|
/s/ JAMES P. HEFFERNAN
|
Director
|
October 1, 2019
|
||
|
James P. Heffernan
|
||||
|
/s/ JAMES L. MUEHLBAUER
|
Director
|
October 1, 2019
|
||
|
James L. Muehlbauer
|
||||
|
/s/ PETER A. ROY
|
Director
|
October 1, 2019
|
||
|
Peter A. Roy
|
||||
|
/s/ JACK L. STAHL
|
Director
|
October 1, 2019
|
||
|
Jack L. Stahl
|
||||
126
TABLE OF CONTENTS
Part IItem 1. BusinessItem 1A. Risk FactorsItem 1B. Unresolved Staff CommentsItem 2. PropertiesItem 3. Legal ProceedingsNote 18 Commitments, Contingencies and Off-balance Sheet ArrangementsItem 4. Mine Safety DisclosuresPart IIItem 5. Market For The Registrant S Common Equity, Related Stockholder Matters and Issuer Purchases Of Equity SecuritiesItem 6. Selected Financial DataItem 7. Management S Discussion and Analysis Of Financial Condition and Results Of OperationsNote 4 AcquisitionsNote 5 Restructuring, Acquisition and Integration Related ExpensesNote 7 Goodwill and Intangible AssetsNote 1 Significant Accounting PoliciesNote 19 Discontinued OperationsNote 13 Share-based AwardsNote 10 Long-term DebtNote 9 DerivativesNote 14 Benefit PlansNote 15 Income TaxesNote 2 Recently Adopted and Issued Accounting PronouncementsItem 7A. Quantitative and Qualitative Disclosures About Market RiskItem 8. Financial Statements and Supplementary DataNote 3 Revenue RecognitionNote 6 Property and EquipmentNote 12 LeasesNote 8 Fair Value Measurements Of Financial InstrumentsNote 11 Comprehensive (loss) Income and Accumulated Other Comprehensive LossNote 16 Earnings Per ShareNote 17 Business SegmentsNote 20 Quarterly Financial Data (unaudited)Item 9. Changes in and Disagreements with Accountants on Accounting and Financial DisclosureItem 9A. Controls and ProceduresItem 9B. Other InformationPart IIIItem 10. Directors, Executive Officers and Corporate GovernanceItem 11. Executive CompensationItem 12. Security Ownership Of Certain Beneficial Owners and Management and Related Stockholder MattersItem 13. Certain Relationships and Related Transactions, and Director IndependenceItem 14. Principal Accounting Fees and ServicesPart IVItem 15. Exhibits, Financial Statement SchedulesItem 16. Form 10-k Summary