UNITEDHEALTH GROUP INC
10-Ks and 10-Qs
|
|
|
|
|
|
|
|
|
|
|
|
|
|
|
|
|
|
|
|
|
|
|
|
|
|
|
|
|
|
|
|
|
|
|
|
|
|
|
|
|
|
|
|
|
|
|
|
|
|
|
|
|
|
|
|
|
|
|
UNITED STATES
SECURITIES AND EXCHANGE COMMISSION
Washington, D.C. 20549
|
Form 10-K
|
||
|
x
|
ANNUAL REPORT PURSUANT TO SECTION 13 OR 15(d) OF THE SECURITIES EXCHANGE ACT OF 1934 FOR THE FISCAL YEAR ENDED DECEMBER 31, 2012
|
or
|
o
|
TRANSITION REPORT PURSUANT TO SECTION 13 OR 15(d) OF THE SECURITIES EXCHANGE ACT OF 1934
|
Commission file number: 1-10864
__________________________________________________________
UnitedHealth Group Incorporated
(Exact name of registrant as specified in its charter)
|
Minnesota
|
|
41-1321939
|
|
(State or other jurisdiction of
incorporation or organization)
|
|
(I.R.S. Employer
Identification No.)
|
|
UnitedHealth Group Center
9900 Bren Road East
Minnetonka, Minnesota
|
|
55343
|
|
(Address of principal executive offices)
|
|
(Zip Code)
|
(952) 936-1300
(Registrant’s telephone number, including area code)
______________________________________________________
Securities registered pursuant to Section 12(b) of the Act:
|
COMMON STOCK, $.01 PAR VALUE
|
NEW YORK STOCK EXCHANGE, INC.
|
|
(Title of each class)
|
(Name of each exchange on which registered)
|
Securities registered pursuant to Section 12(g) of the Act: NONE
__________________________________________________________
Indicate by check mark if the registrant is a well-known seasoned issuer, as defined in Rule 405 of the Securities Act. Yes
x
No
o
Indicate by check mark if the registrant is not required to file reports pursuant to Section 13 or Section 15(d) of the Act. Yes
o
No
x
Indicate by check mark whether the registrant (1) has filed all reports required to be filed by Section 13 or 15(d) of the Securities Exchange Act of 1934 during the preceding 12 months (or for such shorter period that the registrant was required to file such reports), and (2) has been subject to such filing requirements for the past 90 days. Yes
x
No
o
Indicate by check mark whether the registrant has submitted electronically and posted on its corporate Web site, if any, every Interactive Data File required to be submitted and posted pursuant to Rule 405 of Regulation S-T (§232.405 of this chapter) during the preceding 12 months (or for such shorter period that the registrant was required to submit and post such files). Yes
x
No
o
Indicate by check mark if disclosure of delinquent filers pursuant to Item 405 of Regulation S-K (§229.405 of this chapter) is not contained herein, and will not be contained, to the best of registrant’s knowledge, in definitive proxy or information statements incorporated by reference in Part III of this Form 10-K or any amendment to this Form 10-K.
o
Indicate by check mark whether the registrant is a large accelerated filer, an accelerated filer, a non-accelerated filer, or a smaller reporting company. See the definitions of “large accelerated filer,” “accelerated filer” and “smaller reporting company” in Rule 12b-2 of the Exchange Act. (Check one)
|
Large accelerated filer
|
x
|
Accelerated filer
|
o
|
Non-accelerated filer
|
o
|
Smaller reporting company
|
o
|
|||
Indicate by check mark whether the registrant is a shell company (as defined in Rule 12b-2 of the Exchange Act). Yes
o
No
x
The aggregate market value of voting stock held by non-affiliates of the registrant as of June 30, 2012 was $59,444,144,483 (based on the last reported sale price of $58.50 per share on June 30, 2012, on the New York Stock Exchange).*
As of January 31, 2013, there were 1,024,925,324 shares of the registrant’s Common Stock, $.01 par value per share, issued and outstanding.
Note that in Part III of this report on Form 10-K, we incorporate by reference certain information from our Definitive Proxy Statement for the 2013 Annual Meeting of Shareholders. This document will be filed with the Securities and Exchange Commission (SEC) within the time period permitted by the SEC. The SEC allows us to disclose important information by referring to it in that manner. Please refer to such information.
|
*
|
Only shares of voting stock held beneficially by directors, executive officers and subsidiaries of the Company have been excluded in determining this number.
|
UNITEDHEALTH GROUP
Table of Contents
|
|
|
Page
|
|
Part I
|
||
|
Item 1.
|
||
|
Item 1A.
|
||
|
Item 1B.
|
||
|
Item 2.
|
||
|
Item 3.
|
||
|
Item 4.
|
||
|
Part II
|
||
|
Item 5.
|
||
|
Item 6.
|
||
|
Item 7.
|
||
|
Item 7A.
|
||
|
Item 8.
|
||
|
Item 9.
|
||
|
Item 9A.
|
||
|
Item 9B.
|
||
|
Part III
|
||
|
Item 10.
|
||
|
Item 11.
|
||
|
Item 12.
|
||
|
Item 13.
|
||
|
Item 14.
|
||
|
Part IV
|
||
|
Item 15.
|
||
ITEM 1.
BUSINESS
INTRODUCTION
Overview
UnitedHealth Group is a diversified health and well-being company whose mission is to help people live healthier lives and help make health care work better (the terms “we,” “our,” “us,” “UnitedHealth Group,” or the “Company” used in this report refer to UnitedHealth Group Incorporated and our subsidiaries).
We are helping individuals access quality care at an affordable cost; simplifying health care administration and delivery; strengthening the physician/patient relationship; promoting evidence-based care; and empowering physicians, health care professionals, consumers, employers and other participants in the health system with actionable data to make better, more informed decisions.
Through our diversified family of businesses, we leverage core competencies in advanced, enabling technology; health care data, information and intelligence; and clinical care management and coordination to help meet the demands of the health system. These core competencies are deployed within our two distinct, but strategically aligned, business platforms: health benefits operating under UnitedHealthcare and health services operating under Optum.
UnitedHealthcare provides network-based health care benefits for a full spectrum of customers in the health benefits market. UnitedHealthcare Employer & Individual serves employers ranging from sole proprietorships to large, multi-site and national employers, as well as students and other individuals, and will serve TRICARE West Region members beginning April 1, 2013. UnitedHealthcare Medicare & Retirement delivers health and well-being benefits for Medicare beneficiaries and retirees. UnitedHealthcare Community & State manages health care benefit programs on behalf of state Medicaid and community programs and their participants. UnitedHealthcare International includes Amil Participações S.A (Amil), a health care company providing health benefits and hospital and clinical services to individuals in Brazil, and other diversified global health businesses.
Optum is a health services business serving the broad health care marketplace, including payers, care providers, employers, government, life sciences companies and consumers, through its OptumHealth, OptumInsight and OptumRx businesses. These businesses have dedicated units that drive improved delivery, quality and cost effectiveness across eight business markets: integrated care delivery, care management, consumer engagement and support, distribution of benefits and services, health financial services, operational services and support, health care information technology and pharmacy.
Through UnitedHealthcare and Optum, in 2012, we managed nearly $150 billion in aggregate health care spending on behalf of the constituents and consumers we served. Our revenues are derived from premiums on risk-based products; fees from management, administrative, technology and consulting services; sales of a wide variety of products and services related to the broad health and well-being industry; and investment and other income. Our two business platforms have four reportable segments:
|
•
|
UnitedHealthcare, which includes UnitedHealthcare Employer & Individual, UnitedHealthcare Medicare & Retirement, UnitedHealthcare Community & State and UnitedHealthcare International;
|
|
•
|
OptumHealth;
|
|
•
|
OptumInsight; and
|
|
•
|
OptumRx.
|
For our financial results and the presentation of certain other financial information by segment, see Note 13 of Notes to the Consolidated Financial Statements included in Item 8, “Financial Statements.”
UnitedHealthcare
UnitedHealthcare is advancing strategies to improve the way health care is delivered and financed, offering consumers a simpler, more affordable health care experience. Our market position is built on:
|
•
|
a national scale;
|
|
•
|
the breadth of our product offerings, which are responsive to many distinct market segments in health care;
|
|
•
|
strong local market relationships;
|
|
•
|
service and advanced technology;
|
|
•
|
competitive medical and operating cost positions;
|
1
|
•
|
effective clinical engagement;
|
|
•
|
extensive expertise in distinct market segments; and
|
|
•
|
a commitment to innovation.
|
The financial results of UnitedHealthcare Employer & Individual, UnitedHealthcare Medicare & Retirement, UnitedHealthcare Community & State and UnitedHealthcare International have been aggregated in the UnitedHealthcare reportable segment due to their similar economic characteristics, products and services, customers, distribution methods, operational processes and regulatory environment. The domestic businesses also share significant common assets, including our contracted networks of physicians, health care professionals, hospitals and other facilities, information technology infrastructure and other resources. UnitedHealthcare utilizes the expertise of UnitedHealth Group affiliates for capabilities in specialized areas, such as OptumRx pharmacy benefit products and services, certain OptumHealth product offerings and care management and integrated care delivery services and OptumInsight health information and technology solutions, consulting and other services. UnitedHealthcare arranges for discounted access to care through networks that include a total of nearly 780,000 physicians and other health care professionals and approximately 5,900 hospitals and other facilities across the United States (UnitedHealthcare Network).
UnitedHealthcare Employer & Individual
UnitedHealthcare Employer & Individual works closely with employers and individuals to provide health benefit plans that provide solutions to help members live healthier lives and achieve meaningful cost savings. UnitedHealthcare Employer & Individual offers a comprehensive array of consumer-oriented health benefit plans and services for large national employers, public sector employers, mid-sized employers, small businesses and individuals nationwide, providing nearly 27 million Americans access to health care as of
December 31, 2012
.
Through its risk-based product offerings, UnitedHealthcare Employer & Individual assumes the risk of both medical and administrative costs for its customers in return for a monthly premium, which is typically at a fixed rate per individual served for a one-year period. When providing administrative and other management services to customers that elect to self-fund the health care costs of their employees and employees’ dependants, UnitedHealthcare Employer & Individual receives a fixed service fee per individual served. These customers retain the risk of financing medical benefits for their employees and employees’ dependants, while UnitedHealthcare Employer & Individual provides customized services such as coordination and facilitation of medical and related services to customers, consumers and health care professionals, transaction processing and access to a contracted network of physicians, hospitals and other health care professionals, including dental and vision. Large employer groups, such as those serviced by UnitedHealthcare Employer & Individual National Accounts, typically use self-funded arrangements. As of
December 31, 2012
, UnitedHealthcare Employer & Individual National Accounts served 395 large employer groups under these arrangements, including 147 of the
Fortune 500
companies. Smaller employer groups are more likely to purchase risk-based products because they are less willing or able to bear a greater potential liability for health care expenditures. UnitedHealthcare Employer & Individual also offers a variety of non-employer based insurance options for purchase by individuals, including students, which are designed to meet the health coverage needs of these consumers and their families.
As the commercial market becomes more consumer-oriented, individuals are assuming more personal and financial responsibility for their care, and they are demanding more affordable products, greater transparency and choice and personalized help navigating the complex system. The consolidated purchasing capacity represented by the individuals UnitedHealth Group serves makes it possible for UnitedHealthcare Employer & Individual to contract for cost-effective access to a large number of conveniently located care professionals. Individuals served by UnitedHealthcare Employer & Individual have access to 91% of the physicians and other health care professionals and 95% of the hospitals in the broad UnitedHealthcare Network; certain care providers are available only to those consumers served through Medicare and/or Medicaid products.
UnitedHealthcare Employer & Individual is engaging physicians and consumers and using information to promote well-informed health decisions, improved medical outcomes and greater efficiency. It offers consumers engaging and informative tools and resources that provide greater transparency around quality and cost, such as the Premium Designation® program and Health4Me for Apple® and Android® phones, myHealthcareCost Estimator, Health Care Lane and myuhc.com. These easy-to-use resources support better consumer decisions, affording members more control over their health care.
UnitedHealthcare Employer & Individual’s distribution system consists primarily of producers (i.e., brokers and agents) and direct and internet sales in the individual market, producers in the small employer group market, and consultant-based or direct sales for larger employer and public sector segments. In recent years, the distribution model has been diversified to include professional employer organizations, associations, and private equity partners. UnitedHealthcare Employer & Individual offers its products through affiliates that are licensed as insurance companies, health maintenance organizations (HMOs), or third party administrators (TPAs).
2
UnitedHealthcare Employer & Individual’s diverse product portfolio offers a continuum of benefit designs, price points and approaches to consumer engagement, and allows the flexibility to meet the needs of employers of all sizes as well as individuals shopping for health benefits coverage. UnitedHealthcare Employer & Individual emphasizes local markets and leverages its national scale to adapt products quickly to meet specific market needs. UnitedHealthcare Employer & Individual’s major product families include:
Traditional Products.
Traditional products include a full range of medical benefits and network options from managed plans such as Choice and Options PPO to more traditional indemnity offerings. The plans offer a full spectrum of covered services, including preventive care, direct access to specialists and catastrophic protection.
Consumer Engagement Products and Tools.
Consumer engagement products couple plan design with financial accounts to increase employee ownership of their health and well-being. This suite of products includes high-deductible consumer-driven benefit plans, which include health reimbursement accounts (HRAs), health savings accounts (HSAs) and consumer activation services such as personalized multi-channel activation messaging, behavioral incentive programs and consumer education information. During 2012, nearly 42,000 employer-sponsored benefit plans, including more than 200 employers in the large group self-funded market, purchased an HRA or HSA product. The consumer engagement tools provide members with online and/or mobile access to benefit, cost and quality information.
Value-Based Products.
UnitedHealthcare Employer & Individual’s suite of consumer incentive products increases individual awareness for heightened consumer responsibility and behavior change across diverse client segments and funding relationships. Examples include: Small Business Wellness, which is a packaged wellness and incentives product offering gym reimbursement and encouraging completion of important wellness activities. For mid-sized clients, SimplyEngaged is a scalable activity-based reward program that ties incentives to completion of health improvement activities, while SimplyEngaged Plus provides richer incentives for achieving health outcome goals. For large, self-funded customers, UnitedHealthcare Health Rewards program offers a flexible incentive design for employers to choose the right activities and biometric outcomes that best fit the needs of their population. Additionally, UnitedHealth Personal Rewards leverages a tailored approach to incentives by combining personalized scorecards with financial incentives for improving biometric scores, compliance with key health treatments and preventive care.
Essential Benefits Products.
UnitedHealthcare Employer & Individual’s portfolio of affordable products drives value to consumers with lower-cost products, innovative designs and unique network programs that guide people to physicians recognized for providing quality and cost efficient care to their patients. These approaches are designed to deliver sustainable health care costs, enabling employers to continue to offer their employees coverage at more affordable prices. Products such as Catalyst, Edge, Premium Tiered Benefit Plan, Navigate and CORE offer solutions for employers looking to achieve more affordable costs through tiered benefit plans that enhance benefits in the form of greater coinsurance coverage and/or lower copays for using UnitedHealth Premium designated providers.
Clinical and Pharmacy Products.
UnitedHealthcare Employer & Individual offers a comprehensive suite of clinical and pharmacy benefit management programs. The clinical and pharmacy benefit products complement the service offering by improving quality of care, engaging members and providing cost-saving options.
All UnitedHealthcare Employer & Individual members are provided access to clinical products with the goal of helping them make better health care decisions, and thus better use of their medical benefits, with the ultimate goal of improving health and decreasing medical expenses. Each medical plan has a core set of clinical programs embedded in the offering, with additional services available depending on funding type (fully insured and self-funded), line of business (Individual, Small Business, Key Accounts, Public Sector, and National Accounts), and clinical need. The spectrum of clinical programs offered to all consumers, regardless of their health goals – staying healthy, getting healthy, living with a chronic condition includes: wellness, decision support, utilization management, case and disease management, and complex condition management, workplace on-site programs, including Know Your Numbers (biometrics) and flu shots, incentives to reinforce positive behavior change, mental health, substance use disorder management, employer assistance programs and well-being programs. The programs promote consumer engagement, health education, admission counseling before hospital stays, care advocacy to help avoid prolonged patients’ stays in the hospital, support for individuals at risk of needing intensive treatment and coordination of care for people with chronic conditions. Disease and condition management programs help individuals address significant, complex disease states, including disease-specific benefit offerings such as the Diabetes Health Plan.
UnitedHealthcare Employer & Individual’s comprehensive and integrated pharmaceutical management services promote lower costs by using formulary programs to drive better unit costs, encouraging consumers to use drugs that offer better value and outcomes, and through physician and consumer programs that support the appropriate use of drugs based on clinical evidence.
3
Specialty Offerings
. UnitedHealthcare Employer & Individual also offers a comprehensive range of dental, vision, life, and disability product offerings delivered through an integrated approach that enhances efficiency and effectiveness and includes a network of nearly 55,000 vision professionals in private and retail settings, and nearly 210,000 dental providers.
UnitedHealthcare Military & Veterans.
UnitedHealthcare Employer & Individual’s Military & Veterans Services business unit has been awarded the Department of Defense’s (DoD) TRICARE Managed Care Support contract to provide health care services for active duty and retired military service members and their families in the West Region. UnitedHealthcare Military & Veterans Services will be the Managed Care Support contractor serving more than 2.7 million TRICARE beneficiaries in 21 states. The contract includes a transition period and five one-year renewals at the government’s option for health care operations. The first year of operations is anticipated to begin April 1, 2013.
UnitedHealthcare Military & Veterans’ responsibility as a contractor is to augment the military’s direct care system by providing managed care support services, provider networks, medical management, claims/enrollment administration, and customer services. In partnership with government health programs, UnitedHealthcare Military & Veterans’ mission is to improve the health and well-being of both those who currently serve in the military and have served in the military in the past, as well as their families, by providing innovative, high-quality and affordable health care solutions.
UnitedHealthcare Medicare & Retirement
UnitedHealthcare Medicare & Retirement provides health and well-being services to individuals age 50 and older, addressing their unique needs for preventive and acute health care services as well as for services dealing with chronic disease and other specialized issues for older individuals. UnitedHealthcare Medicare & Retirement is fully dedicated to serving this growing senior market segment, providing products and services in all 50 states, the District of Columbia, and most U.S. territories and has distinct pricing, underwriting, clinical program management and marketing capabilities dedicated to risk-based health products and services in this market.
UnitedHealthcare Medicare & Retirement offers a wide spectrum of Medicare products which may be sold to individuals or on a group basis, including Medicare Advantage plans, Medicare Part D prescription drug coverage and Medicare Supplement/Medigap products that supplement traditional fee-for-service coverage. UnitedHealthcare Medicare & Retirement services include care management and clinical management programs, a nurse health line service, 24-hour access to health care information, access to discounted health services from a network of care providers and administrative services.
Premium revenues from the Centers for Medicare & Medicaid Services (CMS) represented
29%
of UnitedHealth Group’s total consolidated revenues for the year ended
December 31, 2012
, most of which were generated by UnitedHealthcare Medicare & Retirement under a number of contracts.
UnitedHealthcare Medicare & Retirement has extensive distribution capabilities and experience, including direct marketing to consumers on behalf of its key clients: AARP, the nation’s largest membership organization dedicated to the needs of people age 50 and over; state and U.S. government agencies; and employer groups. Products are also offered through employer groups to retirees.
UnitedHealthcare Medicare & Retirement’s major product categories include:
Medicare Advantage.
UnitedHealthcare Medicare & Retirement provides health care coverage for seniors and other eligible Medicare beneficiaries primarily through the Medicare Advantage program administered by CMS, including Medicare Advantage HMO plans, preferred provider organization (PPO) plans, Point-of-Service (POS) plans, Private-Fee-for-Service plans and Special Needs Plans (SNPs). Under the Medicare Advantage program, UnitedHealthcare Medicare & Retirement provides health insurance coverage in exchange for a fixed monthly premium per member from CMS. Premium amounts vary based on the geographic areas in which members reside; demographic factors such as age, gender, and institutionalized status; and the health status of the individual. UnitedHealthcare Medicare & Retirement had approximately 2.6 million members enrolled in its Medicare Advantage products as of
December 31, 2012
.
UnitedHealthcare Medicare & Retirement offers innovative care management and clinical programs, integrating federal, state and personal funding through its continuum of Medicare Advantage products. For high-risk patients in certain care settings and programs, UnitedHealthcare Medicare & Retirement uses proprietary, automated medical record software that enables clinical care teams to capture and track patient data and clinical encounters, creating a comprehensive set of care information that bridges across home, hospital and nursing home care settings. Proprietary predictive modeling tools help identify members at high risk and allow care managers to proactively outreach to members to create individualized care plans and help members obtain the right care, in the right place, at the right time.
Prescription Drug Benefit (Part D)
.
UnitedHealthcare provides Medicare prescription drug benefits (Part D) to beneficiaries throughout the United States and its territories through its Medicare Advantage and stand-alone Part D plans. The portfolio of stand-alone Part D plans addresses a large spectrum of beneficiaries’ needs and preferences for their prescription drug coverage, including low cost prescription options. As of
December 31, 2012
, UnitedHealthcare had enrolled 6.8 million
4
members in the Part D program, including 4.2 million members in the stand-alone Part D plans and 2.6 million members in its Medicare Advantage plans incorporating Part D coverage.
Medicare Supplement.
UnitedHealthcare Medicare & Retirement is currently serving approximately 4 million seniors through various Medicare Supplement products in association with AARP. We offer plans in all 50 states and most U.S. territories. These products cover varying levels of coinsurance and deductible gaps that seniors are exposed to in the traditional Medicare program.
UnitedHealthcare Community & State
UnitedHealthcare Community & State is dedicated to providing diversified solutions to states’ programs that care for the economically disadvantaged, the medically underserved and those without the benefit of employer-funded health care coverage in exchange for a monthly premium per member from the applicable state. UnitedHealthcare Community & State’s primary customers oversee Medicaid plans, the Children’s Health Insurance Program (CHIP), and other federal, state and community health care programs. States using managed care services for Medicaid beneficiaries select health plans using either a formal bid process, or award individual contracts. As of
December 31, 2012
, UnitedHealthcare Community & State participates in programs in 25 states and the District of Columbia, serving approximately 3.8 million beneficiaries. UnitedHealthcare Community & State serves populations that range in size from 9,000 people to more than 600,000 people. For those states or counties that choose not to enter into risk arrangements, UnitedHealthcare Community & State offers a variety of management services that leverage its infrastructure and experience, as well as the considerable health care system assets of UnitedHealth Group.
The primary categories of eligibility for the programs served by UnitedHealthcare Community & State include Temporary Assistance for Needy Families (TANF), CHIP, Aged Blind and Disabled, SNPs, Long-Term Care, Childless Adults & Programs, Dual Medicare-Medicaid Eligible (dually eligible) beneficiaries and other federal and state health care programs (e.g., Developmentally Disabled, Rehabilitative Services). The health plans and care programs offered are designed to address the complex needs of the populations they serve, including the chronically ill, those with disabilities and people with higher risk medical, behavioral and social conditions. UnitedHealthcare Community & State leverages the national capabilities of UnitedHealth Group, delivering them at the local market level to support effective care management, regulatory partnerships, greater administrative efficiency, improved clinical outcomes and the ability to adapt to a changing market environment. UnitedHealthcare Community & State coordinates resources among family, physicians, other health care providers, and government and community-based agencies and organizations to facilitate continuous and effective care. For example, the Personal Care Model establishes an ongoing relationship between health care professionals and individuals who have serious and chronic health conditions to help them maintain the best possible health and functional status, whether care is delivered in an acute care setting, long-term care facility or at home. Programs for families and children focus on high-prevalence and debilitating chronic illnesses such as hypertension and cardiovascular disease, asthma, sickle cell disease, diabetes, HIV/AIDS and high-risk pregnancies. Programs for the long-term care population focus on dementia, depression, coronary disease and functional-use deficiencies that impede daily living.
Additionally, there are more than nine million dually eligible beneficiaries who typically have complex conditions with costs of care that are far higher than a typical Medicare or Medicaid beneficiary. While these individuals’ health needs are more complex and more costly, they have historically been in unmanaged environments. As of December 31, 2012, UnitedHealthcare serves more than 250,000 members in legacy dually eligible programs through Medicare Advantage and SNPs. In 2013, UnitedHealthcare Community & State will help implement Ohio’s Integrated Medicare-Medicaid Eligible (MME) program, one of the first in the country under the new CMS design.
UnitedHealthcare International
UnitedHealthcare International provides solutions for consumers of domestic or cross-border health care management, insurance, and administration services; regardless of their geographic location, language or cultural origins. UnitedHealthcare International’s goal is to create business solutions that are based on local infrastructure, culture and needs, and that blend local expertise with experiences from the U.S. health care industry.
Amil.
In 2012, UnitedHealthcare International acquired Amil, which provides health and dental benefits to over five million people and also operates 22 acute hospitals, as well as specialty clinics, primary care, and emergency services across Brazil, principally for the benefit of its members. Amil’s patients are also treated in its contracted provider network of 45,000 physicians and other health care professionals, 3,300 hospitals and 12,000 laboratories and diagnostic imaging centers. Amil offers a diversified product portfolio with a wide range of product offerings, benefit designs, price points and values, including indemnity products. Amil’s products include various administrative services such as network access and administration, care management and personal health services and claims processing.
5
Other Operations.
UnitedHealthcare International also includes other diversified global health services business with a variety of offerings for international customers, including:
|
•
|
Network access and care coordination in the U.S. and overseas;
|
|
•
|
TPA products and services for health plans and TPAs;
|
|
•
|
Brokerage services;
|
|
•
|
Practice management services for care providers;
|
|
•
|
Government and corporate consulting services for improving quality and efficiency; and
|
|
•
|
Global expatriate insurance solutions.
|
See Note 13 of Notes to the Consolidated Financial Statements included in Item 8, “Financial Statements” for additional information related to the revenues and long-lived assets of the UnitedHealthcare International operations.
Optum
Optum is a health services business serving the broad health care marketplace including:
|
•
|
Those who need care: the consumers and patients who need the right support, information, resources and products to achieve their health goals.
|
|
•
|
Those who provide care: physicians and other care providers, hospitals and clinical facilities seeking to modernize in ways that enable the best patient care and experience possible, delivered cost-effectively.
|
|
•
|
Those who pay for care: insurers, employers and government agencies devoted to ensuring that those they sponsor receive high-quality care, administered and delivered efficiently.
|
|
•
|
Those who innovate for care: life sciences and research focused organizations dedicated to developing more effective approaches, enabling technologies and medicines that improve the delivery and quality of care.
|
Using advanced data, analytics and technology, Optum helps improve overall health system performance: optimizing care quality, reducing costs and improving the consumer experience and care provider performance. Optum is organized in three segments:
|
•
|
OptumHealth focuses on care management, integrated care delivery, and consumer solutions, including financial services;
|
|
•
|
OptumInsight delivers operational services and support and health information technology services; and
|
|
•
|
OptumRx specializes in pharmacy services.
|
OptumHealth
OptumHealth is a diversified health and wellness business serving the physical, emotional and financial needs of more than 61 million unique individuals and enabling consumer health management and integrated care delivery through programs offered by employers, payers, government entities and, increasingly, directly through the care delivery system. OptumHealth’s products and services can be deployed individually or integrated to provide comprehensive solutions, addressing a broad base of needs within the health care system. OptumHealth’s solutions reduce costs for customers, improve workforce productivity and consumer satisfaction and optimize the overall health and well-being of populations.
OptumHealth offers its products on a risk basis, where it assumes responsibility for health care costs in exchange for a fixed monthly premium per individual served, and on an administrative fee basis whereby it manages or administers delivery of the products or services in exchange for a fixed fee per individual served. For its financial services offerings, OptumHealth charges fees and earns investment income on managed funds.
OptumHealth sells its products primarily through its direct sales force, strategic collaborations and external producers in three markets: employers (which includes the sub-markets of large, mid and small employers), payers (which includes the sub-markets of health plans, TPAs, underwriter/stop-loss carriers and individual market intermediaries) and government entities (which includes states, CMS, DoD, Veterans Administration and other federal procurement). As provider reimbursement models evolve, care providers are emerging as a fourth market for the health management, financial services and integrated care delivery businesses.
OptumHealth is organized into three major operating groups: Care Management, Integrated Care Delivery and Consumer Solutions.
6
Care Management.
Care Management includes Specialty Networks and Health Management Solutions.
|
•
|
Specialty Networks: Within Specialty Networks, OptumHealth serves over 55 million people in two primary ways: 1) creating access to networks of provider specialists in the areas of behavioral health management (e.g., mental health, substance abuse), global well-being (e.g., international work/life solutions), chronic physical health management (e.g., chiropractic, physical therapy), and complex medical conditions (e.g., transplant, infertility); and 2) managing the care and health needs for consumers through a variety of programs utilizing predictive modeling, evidence-based clinical outcomes management and peer support. Specialty Networks addresses areas likely to have significant variation in clinical practice, where a disciplined, evidence-based approach can drive improved health outcomes and reduced costs. These range from relatively commonly accessed services (e.g., behavioral health and chiropractic) to less common procedures such as transplant, infertility, bariatric surgery and kidney disease/end stage renal disease.
|
|
•
|
Health Management Solutions: OptumHealth serves more than 40 million people with population health management solutions (e.g., care management and advocacy, health and wellness, and complex conditions including cancer, neonatal and maternity) and decision support solutions (e.g., insurance choices and treatment and health care provider options). This comprehensive solution set empowers consumers to take more control of their health and well-being and enables their collaboration with specialty care providers, which is critical to decisions that drive medical costs, including hospitalization and surgery.
|
Integrated Care Delivery.
Integrated Care Delivery is defined by the types of care delivery support services provided within OptumHealth’s two businesses: Collaborative Care and Logistics Health, Inc. (LHI). Collaborative Care is driven by the recognition that the market is moving to a collaborative network aligned around the concept of total population health management and outcomes based reimbursement. Collaborative Care’s local care delivery systems deploy a core set of technology, risk management, analytical and clinical capabilities and tools to assist physicians in delivering high-quality care across the populations they serve. Collaborative Care’s complex population management services augment primary care physicians to deliver services outside of hospitals to vulnerable, chronically ill populations. Collaborative Care also delivers care to approximately 1 million people through a spectrum of models ranging from medical clinics to contracts with individual practice association networks. LHI designs and implements mobile care delivery solutions, providing occupational health, medical and dental readiness services, treatments and immunization programs for the U.S. military and U.S. Department of Health and Human Services (HHS), as well as for many commercial companies.
Consumer Solutions.
Consumer Solutions includes consumer and marketing capabilities, such as distribution and financial services.
|
•
|
Distribution:
Connextions is a growth, retention and service solutions company meeting consumer distribution needs in the health care market. Through a combination of technology, campaign management and customer service, Connextions has developed a consumer relationship management and sales distribution platform. Services offered include call center support, software, data analysis, certified insurance brokers and trained nurses, which allow health care payers and providers to acquire, retain, schedule, refer and manage large populations of individual health care consumers. Connextions is also an enabler of health insurance exchange solutions, with private exchange business today.
|
|
•
|
Financial Services: Dedicated solely to providing financial solutions for the health care market, OptumHealth Financial Services helps organizations and individuals optimize their health care finances. As a leading provider of consumer health care accounts (e.g., HSAs, flexible spending accounts), OptumHealth’s tax-favored accounts enable individuals to save money today and build health savings for the future. Organizations rely upon OptumHealth to manage and improve their cash flows through turnkey electronic payment solutions (e.g., remittance advices, funds transfers), health care-related lending and credit (e.g., financing of care provider medical equipment acquisitions) and financial risk protection for third party payers and self-funded employers (e.g., comprehensive stop loss insurance coverage). Financial services includes Optum Bank. As of
December 31, 2012
, Financial Services had $1.8 billion in customer assets under management and during 2012 processed $66 billion in medical payments to physicians and other health care providers.
|
OptumInsight
OptumInsight is a health care information, technology, operational services and consulting company providing software and information products, advisory consulting services, and business process outsourcing services and support to participants in the health care industry. Hospitals, physicians, commercial health plans, government agencies, life sciences companies and other organizations that comprise the health care system work with OptumInsight to reduce costs, meet compliance mandates, improve clinical performance and adapt to the changing health system landscape. As of
December 31, 2012
, OptumInsight’s products and services are used by four out of five hospitals, tens of thousands of physician practices and other health care facilities, approximately 300 health plans, nearly 400 global life sciences companies, and many government agencies, as well as other UnitedHealth Group businesses.
7
Many of OptumInsight’s software and information products, advisory consulting arrangements, and outsourcing contracts are performed over an extended period, often several years. OptumInsight maintains an order backlog to track unearned revenues under these long-term arrangements. The backlog consists of estimated revenue from signed contracts, other legally binding agreements and anticipated contract renewals based on historical experience that either have not started but are anticipated to begin in the near future, or are in process and have not been completed. OptumInsight’s aggregate backlog at December 31, 2012 was $4.6 billion, of which $2.7 billion is expected to be realized within the next 12 months. This includes $1.0 billion related to intersegment agreements, all of which are included in the current portion of the backlog. OptumInsight cannot provide any assurance that it will be able to realize all of the revenues included in backlog due to uncertainty regarding the timing and scope of services, the potential for cancellation, non-renewal, or early termination of service arrangements. OptumInsight’s aggregate backlog at December 31, 2011 was $4.0 billion.
OptumInsight’s products and services are sold primarily through a direct sales force. OptumInsight’s products are also supported and distributed through an array of alliance and business partnerships with other technology vendors, who integrate and interface its products with their applications.
OptumInsight’s technology products and services solutions are offered through four integrated market groups. These market groups are care providers (e.g., physician practices and hospitals), commercial payers, governments and life sciences.
Care Providers.
The Provider Solutions businesses
combine a comprehensive range of technology and information products, advisory consulting, and outsourcing services focused on hospitals, integrated delivery networks, and physician practices. These solutions help drive financial performance, meet compliance requirements and deliver health intelligence and are organized around hospital and physician practice needs for:
|
•
|
Financial Performance Improvement: Provides comprehensive revenue cycle management technology and services, claims integrity and coding solutions, and full business process outsourcing for hospitals and physicians practices to drive higher net patient revenue and lower operational costs;
|
|
•
|
Quality Measurements and Compliance: Delivers real-time medical necessity reviews and retrospective appeals management services to more than 2,400 hospitals in all 50 states;
|
|
•
|
Clinical Workflow and Connectivity: Provides high-acuity and ambulatory clinical workflow, clinical cost and performance analytics and benchmarks and electronic medical records software that makes hospital departments and physician practices more efficient, improves patient experience, and enables sharing of clinical data in integrated care settings; and
|
|
•
|
Accountable Care Solutions: Working with early adopters of Accountable Care Organization models to build the administrative, analytics, compliance, and care management infrastructure to succeed in outcomes-based payment models.
|
Commercial Payers.
OptumInsight’s Payer Solutions group serves clients that offer commercial health insurance or privately administer health insurance programs on behalf of federal or state governments (e.g., Medicare Advantage or Managed Medicaid). The business offers technology, services and consulting capabilities that supplement OptumInsight’s clients’ existing operations, as well as fully outsourced solutions. The business addresses diverse needs for payer clients, serving four primary areas:
|
•
|
Network Performance: Comprehensive offerings to enhance performance of provider networks and improve population health, including network design, management and operation services, as well as analytical tools that support care management;
|
|
•
|
Clinical Performance and Compliance: Services that align clinical quality and performance with financial outcomes for payers, such as Medicare risk adjustment and CMS star rating system services and quality improvement consulting;
|
|
•
|
Operational Efficiency and Payment Integrity: A spectrum of offerings focused on improving the efficiency and cost-effectiveness of payer operations. Solutions assist in addressing a wide variety of operational improvement opportunities such as process improvement and automation, fraud and abuse, claims payment accuracy and coordination of benefits; and
|
|
•
|
Risk Optimization: Solutions help payers to grow and improve financial performance through predictive analytics and risk management services. Offerings include actuarial services, rating and underwriting products, and membership population modeling, as well as analytics and consulting.
|
8
Governments.
OptumInsight
Government Solutions helps state and federal governments improve the efficiency and quality of health and human services programs by offering a broad range of solutions including:
|
•
|
Financial Management and Program Integrity: Improves the accuracy and efficiency of provider payments through prospective and retrospective analysis of claims transactions, driving detection of fraud and abuse and checking payment accuracy;
|
|
•
|
Consulting: Provides policy and compliance consulting including health policy advisory services; and
|
|
•
|
Data and Analytics Technology and Systems Integration: Measures and identifies opportunities for improvement in cost, network performance, and care management for populations of covered members. Government Solutions builds and manages health care specific data model and warehouse solutions for Federal and State based programs and applies business intelligence to analyze and drive decision making to improve cost, clinical outcomes, and member satisfaction.
|
Life Sciences.
OptumInsight’s Life Sciences business addresses the changing global economic and regulatory competitive landscape by assisting life sciences clients in identifying, analyzing and measuring the value of their products. Life Sciences provides expertise in using real-world evidence to support market access and positioning of products, to deliver strategic regulatory services, to provide insights into patient reported outcomes and to optimize and manage risk to Life Sciences’ clients. Products include:
|
•
|
Market Access and Reimbursement: Utilizes real-world evidence to drive increased drug revenues and pricing and reimbursements strategies;
|
|
•
|
Health Economics Outcomes and Late Phase Research: decreased commercialization costs through health economics and outcomes research and late phase/Phase IV research studies;
|
|
•
|
Data and Informatics Services;
|
|
•
|
Regulatory Consulting: Focuses on design and execution of multi-national regulatory strategies to help clients speed regulatory approval and maintain compliance with dynamic regulations across geographies;
|
|
•
|
Epidemiology and Drug Safety: Designs and executes epidemiology studies to understand detailed drug safety profiles and build integrated plans to address safety issues with regulators, providers, and patients; and
|
|
•
|
Patient-Reported Outcomes: Drives collection and understanding of patient reported outcomes to inform comparative effectiveness research, patient engagement and adherence, and population health management.
|
OptumRx
OptumRx provides a full range of pharmacy benefit management (PBM) services to more than 14 million people nationwide, processing over 350 million adjusted retail, mail and specialty drug prescriptions and managing more than $25 billion in pharmaceutical spending annually. Its PBM services include benefit plan design and consultation, claims processing, manufacturer rebate contracting and administration, retail pharmacy network management services, mail order and specialty pharmacy services, Medicare Part D services, and a variety of clinical services, such as formulary management and compliance, drug utilization review and disease and drug therapy management services. The mail order and specialty pharmacy fulfillment capabilities of OptumRx are an important strategic component of its business, providing patients with convenient access to maintenance medications, offering a broad range of complex drug therapies and patient management services for individuals with chronic health conditions, and enabling OptumRx to manage its clients’ drug costs through operating efficiencies and economies of scale.
OptumRx provides PBM services to nearly all members enrolled in the benefit plans that offer pharmacy benefits of UnitedHealthcare’s Medicare & Retirement and Community & State businesses and also serves a portion of UnitedHealthcare’s Employer & Individual’s commercial members. In 2013, OptumRx will in-source approximately 12 million of UnitedHealthcare’s commercial members who currently receive PBM services from Express Scripts’ subsidiary, Medco Health Solutions, Inc. OptumRx also provides PBM services to non-affiliated external clients, including public and private sector employer groups, insurance companies, Taft-Hartley Trust Funds, TPAs, managed care organizations, Medicare-contracted plans, Medicaid plans and other sponsors of health benefit plans and individuals throughout the U.S. OptumRx’s distribution system consists primarily of health insurance brokers and other health care consultants and direct sales.
GOVERNMENT REGULATION
Most of our health and well-being services are regulated by U.S. federal and state as well as non-U.S. regulatory agencies that generally have discretion to issue regulations and interpret and enforce laws and rules. These regulations can vary significantly from jurisdiction to jurisdiction, and the interpretation of existing laws and rules also may change periodically. The Patient Protection and Affordable Care Act and a reconciliation measure, the Health Care and Education Reconciliation Act of 2010, which we refer to together as the Health Reform Legislation, were signed into law in the first quarter of 2010 and, after being
9
challenged, were substantially upheld in a U.S. Supreme Court decision in the second quarter of 2012. The Health Reform Legislation, portions of which are summarized below, alters the regulatory environment in which we operate, in some cases to a significant degree. U.S. federal and state governments continue to enact and consider various legislative and regulatory proposals that could materially impact certain aspects of the health care system. New laws, regulations and rules, or changes in the interpretation of existing laws, regulations and rules, as well as a result of changes in the political climate, could adversely affect our business.
In the event we fail to comply with, or we fail to respond quickly and appropriately to changes in, applicable laws, regulations and rules, our business, results of operations, financial position and cash flows could be materially and adversely affected. See Item 1A, “Risk Factors” for a discussion of the risks related to compliance with federal, state and international laws and regulations.
Health Care Reforms
The Health Reform Legislation expands access to coverage and modifies aspects of the commercial insurance market, as well as the Medicaid and Medicare programs, CHIP and other aspects of the health care system. Certain provisions of the Health Reform Legislation have already taken effect and other provisions become effective at various dates over the next several years. The U.S. Department of Labor (DOL), HHS and the U.S. Treasury Department have issued or proposed regulations on a number of aspects of Health Reform Legislation, but final rules and interim guidance on other key aspects of the legislation remain pending.
The following outlines certain provisions of the Health Reform Legislation that are currently effective, currently effective with phased implementation or are expected to take effect in the coming years.
|
•
|
Currently Effective
: The Health Reform Legislation mandated the expansion of dependant coverage to include adult children until age 26; eliminated certain annual and lifetime caps on the dollar value of certain essential health benefits; eliminated pre-existing condition limits for enrollees under age 19; prohibited certain policy rescissions; prohibited plans and issuers from charging higher cost sharing (copayments or coinsurance) for emergency services that are obtained outside of a plan’s network; and included a requirement to provide coverage for preventive services without cost to members (for non-grandfathered plans).
|
Commercial fully insured health plans in the large employer group, small employer group and individual markets with medical loss ratios below certain targets (85% for large employer groups, 80% for small employer groups and 80% for individuals, as calculated under the definitions in the Health Reform Legislation and regulations, subject to state specific exceptions) are required to rebate ratable portions of their premiums to their customers annually.
The Health Reform Legislation also mandated certain changes to coverage determination and appeals processes, including: expanding the definition of “adverse benefit determination” to include rescissions; extending external review rights of adverse benefit determinations to insured and self-funded plans; and improving the clarity of and expanding the types of information in adverse benefit determination notices.
|
•
|
Currently Effective with Phased Implementation
: The Health Reform Legislation also mandated consumer discounts on brand name and generic prescription drugs for Part D plan participants in the coverage gap. These consumer discounts will gradually increase over the next several years, which will decrease consumer out-of-pocket drug spending within the coverage gap, shifting a portion of these costs to the plan sponsor. In 2012, the discount on brand name prescription drugs was 50% while the discount on generic prescription drugs was 14%.
|
In addition, as required under the Health Reform Legislation, HHS established a federal premium rate review process, which generally applies to proposed rate increases equal to or exceeding 10%. The regulations further require commercial health plans to provide to the states and HHS extensive information supporting any rate increases subject to the new federal rate review process. The regulations clarify that HHS review will not supersede existing state review and approval processes, but plans deemed to have a history of “unreasonable” rate increases may be prohibited from participating in the state-based exchanges that are scheduled to become active under the Health Reform Legislation in 2014. Under current regulations, the HHS rate review process would apply only to health plans in the individual and small group markets.
CMS reduced or froze benchmarks which affect our Medicare Advantage reimbursements from CMS between 2009 and 2011, and in 2012, additional cuts to Medicare Advantage benchmarks began to take effect (benchmarks will ultimately range from 95% of Medicare fee-for-service rates in high cost areas to 115% in low cost areas), with changes continuing to be phased-in over the next one to five years, depending on the level of benchmark reduction in a county. In addition to other measures, quality bonuses may partially offset these anticipated benchmark reductions. CMS quality rating
10
bonuses are paid to certain qualifying plans for a three year period that began in 2012. Quality bonuses are based upon STAR ratings at the local plan level, as determined by CMS, and are dependent on numerous factors, including member satisfaction and member behavior in the context of obtaining preventive screens.
|
•
|
Effective 2013
: Effective beginning in 2013 with respect to services performed after 2009, the Health Reform Legislation limits the deductibility of executive compensation under Section 162(m) of the Internal Revenue Code for insurance providers if at least 25% of the insurance provider’s gross premium revenue from health business is derived from health insurance plans that meet the minimum creditable coverage requirements.
|
|
•
|
Effective 2013/2014
: The Health Reform Legislation provides for an increase in Medicaid fee-for-service and managed care program reimbursements for primary care services provided by primary care doctors (family medicine, general internal medicine or pediatric medicine) to 100% of the Medicare payment rates for 2013 and 2014, and provides 100% federal financing for the difference in rates based on rates applicable on July 1, 2009.
|
|
•
|
Effective 2014
: A number of the provisions of the Health Reform Legislation are scheduled to take effect in 2014, including: an annual insurance industry assessment ($8 billion to be levied on the insurance industry in 2014 increasing to $14.3 billion by 2018 with increasing annual amounts thereafter), which is not deductible for income tax purposes; a transitional reinsurance program ($25 billion over a three-year period), which will be funded by a $5.25 per member per month fee (as currently estimated by HHS), on all comprehensive lines of business (including risk-based and self-insured) with only insurance plans for individuals eligible for reinsurance recoveries; a permanent risk adjustment program designed to promote stability in the individual and small employer group marketplace by transferring funds among competing plans based on variance in risk populations; all individual and group health plans must offer coverage on a guaranteed issue and guaranteed renewal basis during annual open enrollment and special enrollment periods and cannot apply pre-existing condition exclusions or health status rating adjustments; all individual and small group plans must provide certain essential health benefits, with member cost-sharing limitations and no annual limits on essential benefits coverage; establishment of state-based exchanges for individuals and small employers as well as certain CHIP eligibles; a temporary risk corridor program that limits the losses and gains of insurers that offer products on exchanges; introduction of plan designs based on set actuarial values to increase comparability of competing products on the exchanges and limit member cost-sharing obligations; and establishment of minimum medical loss ratio of 85% for Medicare Advantage plans, as calculated under rules that have not yet been issued.
|
The Health Reform Legislation and the related federal and state regulations will impact how we do business and could restrict revenue and enrollment growth in certain products and market segments, restrict premium growth rates for certain products and market segments, increase our medical and administrative costs, expose us to an increased risk of liability (including increasing our liability in federal and state courts for coverage determinations and contract interpretation) or put us at risk for loss of business. In addition, our results of operations, financial position, including our ability to maintain the value of our goodwill, and cash flows could be materially and adversely affected by such changes. The Health Reform Legislation may also create new or expand existing opportunities for business growth, but due to its complexity, the impact of the Health Reform Legislation remains difficult to predict and is not yet fully known. See also Item 1A, “Risk Factors” for a discussion of the risks related to the Health Reform Legislation and related matters.
Other Federal Laws and Regulation
We are subject to various levels of U.S. federal regulation. For example, when we contract with the federal government, we are subject to federal laws and regulations relating to the award, administration and performance of U.S. government contracts. CMS regulates our UnitedHealthcare businesses, and certain aspects of our Optum businesses. Our UnitedHealthcare Medicare & Retirement, UnitedHealthcare Community & State and OptumHealth businesses submit information relating to the health status of enrollees to CMS (or state agencies) for purposes of determining the amount of certain payments to us. CMS also has the right to audit performance to determine compliance with CMS contracts and regulations and the quality of care given to Medicare beneficiaries. Beginning in 2014, our commercial business may be subject to audit related to the risk adjustment and reinsurance data. See Note 12 of Notes to the Consolidated Financial Statements included in Item 8, “Financial Statements” and Item 1A, “Risk Factors” for a discussion of audits by CMS.
Our UnitedHealthcare reportable segment, through UnitedHealthcare Community & State, also has Medicaid and CHIP contracts that are subject to federal regulations regarding services to be provided to Medicaid enrollees, payment for those services and other aspects of these programs. There are many regulations surrounding Medicare and Medicaid compliance, and the regulatory environment with respect to these programs has become and will continue to become increasingly complex as a result of the Health Reform Legislation. In addition, our UnitedHealthcare Military & Veterans business and certain of Optum’s businesses hold contracts with federal agencies including the DoD and we are subject to federal law and regulations relating to the administration of these contracts.
11
Certain of UnitedHealthcare’s and Optum’s businesses, such as UnitedHealthcare’s eyeglass manufacturing activities and Optum’s high acuity clinical workflow software, hearing aid products, and clinical research activities, are subject to regulation by the U.S. Food and Drug Administration (FDA), and the clinical research activities are also subject to laws and regulations outside of the United States that regulate clinical trials. Laws and regulations relating to consumer protection, anti-fraud and abuse, anti-kickbacks, false claims, prohibited referrals, inappropriately reducing or limiting health care services, anti-money laundering, securities and antitrust also affect us.
HIPAA, GLBA and Other Privacy and Security Regulation.
The administrative simplification provisions of the Health Insurance Portability and Accountability Act of 1996, as amended (HIPAA), apply to both the group and individual health insurance markets, including self-funded employee benefit plans. HIPAA requires guaranteed health care coverage for small employers and certain eligible individuals. It also requires guaranteed renewability for employers and individuals and limits exclusions based on pre-existing conditions. Federal regulations related to HIPAA include minimum standards for electronic transactions and code sets, and for the privacy and security of protected health information. The HIPAA privacy regulations do not preempt more stringent state laws and regulations that may also apply to us.
Federal privacy and security requirements change frequently because of legislation, regulations and judicial or administrative interpretation. For example, the U.S. Congress enacted the American Recovery and Reinvestment Act of 2009 (ARRA), which significantly amends, and adds new privacy and security provisions to HIPAA and imposes additional requirements on uses and disclosures of health information. ARRA includes new contracting requirements for HIPAA business associate agreements; extends parts of HIPAA privacy and security provisions to business associates; adds new federal data breach notification requirements for covered entities and business associates and new reporting requirements to HHS and the Federal Trade Commission (FTC) and, in some cases, to the local media; strengthens enforcement and imposes higher financial penalties for HIPAA violations and, in certain cases, imposes criminal penalties for individuals, including employees. In January 2013, HHS issued its final regulations implementing the ARRA amendments to HIPAA and updating the HIPAA privacy, security and enforcement rules. In the conduct of our business, we may act, depending on the circumstances, as either a covered entity or a business associate. Federal consumer protection laws may also apply in some instances to privacy and security practices related to personally identifiable information. The use and disclosure of individually identifiable health data by our businesses is also regulated in some instances by other federal laws, including the Gramm-Leach-Bliley Act (GLBA) or state statutes implementing GLBA, which generally require insurers to provide customers with notice regarding how their non-public personal health and financial information is used and the opportunity to “opt out” of certain disclosures before the insurer shares such information with a third party, and which generally require safeguards for the protection of personal information. See Item 1A, “Risk Factors” for a discussion of the risks related to compliance with HIPAA, GLBA and other privacy-related regulations.
ERISA.
The Employee Retirement Income Security Act of 1974, as amended (ERISA), regulates how goods and services are provided to or through certain types of employer-sponsored health benefit plans. ERISA is a set of laws and regulations that is subject to periodic interpretation by the DOL as well as the federal courts. ERISA places controls on how our business units may do business with employers who sponsor employee benefit health plans, particularly those that maintain self-funded plans. Regulations established by the DOL provide additional rules for claims payment and member appeals under health care plans governed by ERISA. Additionally, some states require licensure or registration of companies providing third-party claims administration services for health care plans.
State Laws and Regulation
Health Care Regulation
.
Our insurance and HMO subsidiaries must be licensed by the jurisdictions in which they conduct business. All of the states in which our subsidiaries offer insurance and HMO products regulate those products and operations. These states require periodic financial reports and establish minimum capital or restricted cash reserve requirements. The National Association of Insurance Commissioners (NAIC) has adopted model regulations that, when implemented by states would require certain governance practices substantially similar to the Sarbanes-Oxley Act of 2002 and expand insurance company and HMO risk and solvency assessment reporting. We expect that states will adopt these or similar measures over the next few years, expanding the scope of regulations relating to corporate governance and internal control activities of HMOs and insurance companies. Certain states have also adopted their own regulations for minimum medical loss ratios with which health plans must comply. In addition, a number of state legislatures have enacted or are contemplating significant reforms of their health insurance markets, either independent of or to comply with or be eligible for grants or other incentives in connection with the Health Reform Legislation. We expect the states to continue to introduce and pass similar laws in 2013, and this will affect our operations and our financial results.
Health plans and insurance companies are also regulated under state insurance holding company regulations. Such regulations generally require registration with applicable state departments of insurance and the filing of reports that describe capital structure, ownership, financial condition, certain intercompany transactions and general business operations. Some state
12
insurance holding company laws and regulations require prior regulatory approval of acquisitions and material intercompany transfers of assets, as well as transactions between the regulated companies and their parent holding companies or affiliates. These laws may restrict the ability of our regulated subsidiaries to pay dividends to our holding companies.
In addition, some of our business and related activities may be subject to other health care-related regulations and requirements, including PPO, managed care organization (MCO), utilization review (UR) or TPA-related regulations and licensure requirements. These regulations differ from state to state, and may contain network, contracting, product and rate, and financial and reporting requirements. There are laws and regulations that set specific standards for delivery of services, appeals, grievances and payment of claims, adequacy of health care professional networks, fraud prevention, protection of consumer health information, pricing and underwriting practice and covered benefits and services. State health care anti-fraud and abuse prohibitions encompass a wide range of activities, including kickbacks for referral of members, billing unnecessary medical services and improper marketing. Certain of our businesses are subject to state general agent, broker, and sales distributions laws and regulations. Our UnitedHealthcare Community & State, UnitedHealthcare Medicare & Retirement and certain Optum businesses are subject to regulation by state Medicaid agencies that oversee the provision of benefits to our Medicaid and CHIP beneficiaries and to our dually eligible beneficiaries. We also contract with state governmental entities and are subject to state laws and regulations relating to the award, administration and performance of state government contracts.
Guaranty Fund Assessments
.
Under state guaranty fund laws, certain insurance companies (and HMOs in some states), including those issuing health, long-term care, life and accident insurance policies, doing business in those states can be assessed (up to prescribed limits) for certain obligations to the policyholders and claimants of insolvent insurance companies that write the same line or lines of business. Assessments generally are based on a formula relating to premiums in the state compared to the premiums of other insurers and could be spread out over a period of years. Some states permit member insurers to recover assessments paid through full or partial premium tax offsets.
Pharmacy Regulation.
OptumRx’s mail order pharmacies must be licensed to do business as pharmacies in the states in which they are located. Our mail order pharmacies must also register with the U.S. Drug Enforcement Administration and individual state controlled substance authorities to dispense controlled substances. In many of the states where our mail order pharmacies deliver pharmaceuticals there are laws and regulations that require out-of-state mail order pharmacies to register with that state’s board of pharmacy or similar regulatory body. These states generally permit the pharmacy to follow the laws of the state in which the mail order pharmacy is located, although some states require that we also comply with certain laws in that state. Our mail order pharmacies maintain certain Medicare and state Medicaid provider numbers as pharmacies providing services under these programs. Participation in these programs requires the pharmacies to comply with the applicable Medicare and Medicaid provider rules and regulations. Other laws and regulations affecting our mail order pharmacies include federal and state statutes and regulations governing the labeling, packaging, advertising and adulteration of prescription drugs and dispensing of controlled substances. See Item 1A, “Risk Factors” for a discussion of the risks related to our PBM businesses.
Privacy and Security Laws.
States have adopted regulations to implement provisions of the GLBA. Like HIPAA, GLBA allows states to adopt more stringent requirements governing privacy protection. A number of states have also adopted other laws and regulations that may affect our privacy and security practices, for example, state laws that govern the use, disclosure and protection of social security numbers and sensitive health information or that are designed to protect credit card account data. State and local authorities increasingly focus on the importance of protecting individuals from identity theft, with a significant number of states enacting laws requiring businesses to notify individuals of security breaches involving personal information. State consumer protection laws may also apply to privacy and security practices related to personally identifiable information, including information related to consumers and care providers. Additionally, different approaches to state privacy and insurance regulation and varying enforcement philosophies in the different states may materially and adversely affect our ability to standardize our products and services across state lines. See Item 1A, “Risk Factors” for a discussion of the risks related to compliance with state privacy and security-related regulations.
Corporate Practice of Medicine and Fee-Splitting Laws.
Certain of our businesses function as direct service providers to care delivery systems and, as such, are subject to additional laws and regulations. Some states have corporate practice of medicine laws that prohibit certain entities from practicing medicine or employing physicians to practice medicine. Additionally, some states prohibit certain entities from sharing in the fees or revenues of a professional practice (fee-splitting). These prohibitions may be statutory or regulatory, or may be a matter of judicial or regulatory interpretation. These laws, regulations and interpretations have, in certain states, been subject to limited judicial and regulatory interpretation and are subject to change.
Consumer Protection Laws.
Certain businesses participate in direct-to-consumer activities and are subject to emerging regulations applicable to on-line communications and other general consumer protection laws and regulations.
Banking Regulation
Optum Bank is subject to regulation by federal banking regulators, including the Federal Deposit Insurance Corporation (FDIC), which performs annual examinations to ensure that the bank is operating in accordance with federal safety and soundness requirements, and the Consumer Financial Protection Bureau, which may perform periodic examinations to ensure
13
that the bank is in compliance with applicable consumer protection statutes, regulations and agency guidelines. Optum Bank is also subject to supervision and regulation by the Utah State Department of Financial Institutions, which carries out annual examinations to ensure that the bank is operating in accordance with state safety and soundness requirements and performs periodic examinations of the bank’s compliance with applicable state banking statutes, regulations and agency guidelines. In the event of unfavorable examination results from any of these agencies, the bank could be subjected to increased operational expenses and capital requirements, enhanced governmental oversight and monetary penalties.
International Regulation
Certain of our businesses and operations are international in nature and are subject to regulation in the jurisdictions in which they are organized or conduct business. These regulatory regimes encompass tax, licensing, tariffs, intellectual property, investment, management control, labor, anti-fraud, anti-corruption and privacy and data protection regulations (including requirements for cross-border data transfers) that vary from jurisdiction to jurisdiction, among other matters. We have recently acquired and may in the future acquire or commence additional businesses based outside of the United States, increasing our exposure to non-U.S. regulatory regimes. For example, our acquisition of Amil subjects us to Brazilian laws and regulations affecting the managed care and insurance industries and regulation by Brazilian regulators including the national regulatory agency for private health insurance and plans, the Agência Nacional de Saúde Suplementar (ANS), whose approach to the interpretation, implementation and enforcement of industry regulations could differ from the approach taken by U.S. regulators. For more information about the Amil acquisition, see Note 6 of Notes to the Consolidated Financial Statement included in Item 8, “Financial Statements.” In addition, our non-U.S. businesses and operations are also subject to U.S. laws that regulate the conduct and activities of U.S.-based businesses operating abroad, such as the Foreign Corrupt Practices Act.
Audits and Investigations
We have been and may in the future become involved in various governmental investigations, audits and reviews. These include routine, regular and special investigations, audits and reviews by CMS, state insurance and health and welfare departments, state attorneys general, the Office of the Inspector General (OIG), the Office of Personnel Management, the Office of Civil Rights, the FTC, U.S. Congressional committees, the U.S. Department of Justice (DOJ), U.S. Attorneys, the Securities and Exchange Commission (SEC), the Brazilian securities regulator, the Comissão de Valores Mobiliários (CVM), the Internal Revenue Service (IRS), the Brazilian federal revenue service - the Secretaria da Receita Federal (SRF), the DOL, the FDIC and other governmental authorities. Certain of our businesses have been reviewed or are currently under review, including for, among other things, compliance with coding and other requirements under the Medicare risk-adjustment model. Such government investigations, audits and reviews can result in assessment of damages, civil or criminal fines or penalties, or other sanctions, including loss of licensure or exclusion from participation in government programs. In addition, disclosure of any adverse investigation, audit results or sanctions could adversely affect our reputation in various markets and make it more difficult for us to sell our products and services while retaining our current business.
COMPETITION
As a diversified health and well-being services company, we operate in highly competitive markets. Our competitors include managed health care companies, insurance companies, HMOs, TPAs and business services outsourcing companies, health care professionals that have formed networks to directly contract with employers or with CMS, specialty benefit providers, government entities, disease management companies, and various health information and consulting companies. For our UnitedHealthcare businesses, competitors include Aetna Inc., Cigna Corporation, Coventry Health Care, Inc., Health Net, Inc., Humana Inc., Kaiser Permanente, WellPoint, Inc., numerous for-profit and not-for-profit organizations operating under licenses from the Blue Cross Blue Shield Association, and, with respect to our Brazilian operations, several established competitors in Brazil, and other enterprises that serve more limited geographic areas. For our OptumRx businesses, competitors include CVS Caremark Corporation, Express Scripts, Inc. and Catamaran Corporation. Our OptumHealth and OptumInsight reportable segments also compete with a broad and diverse set of businesses. New entrants into the markets in which we compete, as well as consolidation within these markets, also contribute to a competitive environment. We believe the principal competitive factors that can impact our businesses relate to the sales, marketing and pricing of our products and services; product innovation; consumer engagement and satisfaction; the level and quality of products and services; care delivery; network and clinical management capabilities; market share; product distribution systems; efficiency of administration operations; financial strength and marketplace reputation. If we fail to compete effectively to maintain or increase our market share, including maintaining or increasing enrollments in businesses providing health benefits, our results of operations, financial position and cash flows could be materially and adversely affected. See Item 1A, “Risk Factors,” for additional discussion of our risks related to competition.
EMPLOYEES
As of
December 31, 2012
, we employed approximately 133,000 individuals. We believe our employee relations are generally positive.
14
EXECUTIVE OFFICERS OF THE REGISTRANT
The following sets forth certain information regarding our executive officers as of
February 6, 2013
, including the business experience of each executive officer during the past five years:
|
Name
|
Age
|
Position
|
|
Stephen J. Hemsley
|
60
|
President and Chief Executive Officer
|
|
David S. Wichmann
|
50
|
Executive Vice President and Chief Financial Officer of UnitedHealth Group and President of UnitedHealth Group Operations
|
|
Gail K. Boudreaux
|
52
|
Executive Vice President of UnitedHealth Group and Chief Executive Officer of UnitedHealthcare
|
|
Eric S. Rangen
|
56
|
Senior Vice President and Chief Accounting Officer
|
|
Larry C. Renfro
|
59
|
Executive Vice President of UnitedHealth Group and Chief Executive Officer of Optum
|
|
Marianne D. Short
|
61
|
Executive Vice President and Chief Legal Officer
|
|
Lori Sweere
|
54
|
Executive Vice President of Human Capital
|
Our Board of Directors elects executive officers annually. Our executive officers serve until their successors are duly elected and qualified.
Mr. Hemsley
is President and Chief Executive Officer of UnitedHealth Group, has served in that capacity since January 2008, and has been a member of the Board of Directors since February 2000.
Mr. Wichmann
is Executive Vice President and Chief Financial Officer of UnitedHealth Group and President of UnitedHealth Group Operations and has served in that capacity since January 2011. Mr. Wichmann has served as Executive Vice President and President of UnitedHealth Group Operations since April 2008. From January 2008 to April 2008, Mr. Wichmann served as Executive Vice President of UnitedHealth Group and President of the Commercial Markets Group (now UnitedHealthcare Employer & Individual).
Ms. Boudreaux
is Executive Vice President of UnitedHealth Group and Chief Executive Officer of UnitedHealthcare and has served in that capacity since January 2011. Ms. Boudreaux has overall responsibility for all UnitedHealthcare health benefits businesses. Ms. Boudreaux served as Executive Vice President of UnitedHealth Group and President of UnitedHealthcare from May 2008 to January 2011. Prior to joining UnitedHealth Group, Ms. Boudreaux served as Executive Vice President of Health Care Services Corporation (HCSC) from January 2008 to April 2008.
Mr. Rangen
is Senior Vice President and Chief Accounting Officer of UnitedHealth Group and has served in that capacity since January 2008.
Mr. Renfro
is Executive Vice President of UnitedHealth Group and Chief Executive Officer of Optum and has served in that capacity since July 2011. From January 2011 to July 2011, Mr. Renfro served as Executive Vice President of UnitedHealth Group. From October 2009 to January 2011, Mr. Renfro served as Executive Vice President of UnitedHealth Group and Chief Executive Officer of the Public and Senior Markets Group. From January 2009 to October 2009, Mr. Renfro served as Executive Vice President of UnitedHealth Group and Chief Executive Officer of Ovations (now UnitedHealthcare Medicare & Retirement). Prior to joining UnitedHealth Group, Mr. Renfro served as President of Fidelity Developing Businesses at Fidelity Investments and as a member of the Fidelity Executive Committee from June 2008 to January 2009. From January 2008 to May 2008, Mr. Renfro held several senior positions at AARP Services Inc., including President and Chief Executive Officer of AARP Services Inc., Chief Operating Officer of AARP Services Inc., President and Chief Executive Officer of AARP Financial and President of the AARP Funds.
Ms. Short
is Executive Vice President and Chief Legal Officer of UnitedHealth Group and has served in that capacity since January 2013. Prior to joining UnitedHealth Group, Ms. Short served as the Managing Partner at Dorsey & Whitney LLP from 2008 to 2012.
Ms. Sweere
is Executive Vice President of Human Capital of UnitedHealth Group and has served in that capacity since January 2008.
15
Additional Information
UnitedHealth Group Incorporated was incorporated in January 1977 in Minnesota. Our executive offices are located at UnitedHealth Group Center, 9900 Bren Road East, Minnetonka, Minnesota 55343; our telephone number is (952) 936-1300.
You can access our website at
www.unitedhealthgroup.com
to learn more about our Company. From that site, you can download and print copies of our annual reports to shareholders, annual reports on Form 10-K, quarterly reports on Form 10-Q, and current reports on Form 8-K, along with amendments to those reports. You can also download from our website our Articles of Incorporation, bylaws and corporate governance policies, including our Principles of Governance, Board of Directors Committee Charters, and Code of Conduct. We make periodic reports and amendments available, free of charge, as soon as reasonably practicable after we file or furnish these reports to the SEC. We will also provide a copy of any of our corporate governance policies published on our website free of charge, upon request. To request a copy of any of these documents, please submit your request to: UnitedHealth Group Incorporated, 9900 Bren Road East, Minnetonka, MN 55343, Attn: Corporate Secretary. Information on or linked to our website is neither part of nor incorporated by reference into this Annual Report on Form 10-K or any other SEC filings.
Our transfer agent, Wells Fargo Shareowner Services, can help you with a variety of shareholder-related services, including change of address, lost stock certificates, transfer of stock to another person and other administrative services. You can write to our transfer agent at: Wells Fargo Shareowner Services, P.O. Box 64854, St. Paul, Minnesota 55164-0854, email
stocktransfer@wellsfargo.com
, or telephone (800) 468-9716 or (651) 450-4064.
CAUTIONARY STATEMENTS
The statements, estimates, projections, guidance or outlook contained in this Annual Report on Form 10-K include forward-looking statements within the meaning of the Private Securities Litigation Reform Act of 1995 (PSLRA). When used in this Annual Report on Form 10-K and in future filings by us with the SEC, in our news releases, presentations to securities analysts or investors, and in oral statements made by or with the approval of one of our executive officers, the words or phrases “believe,” “expect,” “intend,” “estimate,” “anticipate,” “plan,” project,” “should” or similar expressions are intended to identify such forward-looking statements. These statements are intended to take advantage of the “safe harbor” provisions of the PSLRA. These forward-looking statements involve risks and uncertainties that may cause our actual results to differ materially from the results discussed in the forward-looking statements.
The following discussion contains cautionary statements regarding our business that investors and others should consider. We do not undertake to address or update forward-looking statements in future filings or communications regarding our business or results of operations, and do not undertake to address how any of these factors may have caused results to differ from discussions or information contained in previous filings or communications. In addition, any of the matters discussed below may have affected past, as well as current, forward-looking statements about future results. Any or all forward-looking statements in this Form 10-K and in any other public filings or statements we make may turn out to be wrong. They can be affected by inaccurate assumptions we might make or by known or unknown risks and uncertainties. Many factors discussed below will be important in determining future results. By their nature, forward-looking statements are not guarantees of future performance or results and are subject to risks, uncertainties and assumptions that are difficult to predict or quantify. Actual future results may vary materially from expectations expressed in this report or any of our prior communications.
If we fail to effectively estimate, price for and manage our medical costs, the profitability of our risk-based products and services could decline and could materially and adversely affect our results of operations, financial position and cash flows.
Under our risk-based benefit product arrangements, we assume the risk of both medical and administrative costs for our customers in return for monthly premiums. Premium revenues from risk-based benefits products comprise approximately 90% of our total consolidated revenues. We generally use approximately 80% to 85% of our premium revenues to pay the costs of health care services delivered to these customers. The profitability of these products depends in large part on our ability to predict, price for, and effectively manage medical costs. In this regard, the Health Reform Legislation established minimum medical loss ratios for certain health plans and authorized HHS to maintain an annual price increase review process for commercial health plans, which could make it more difficult for us to price our products competitively. See the risk factor below relating to health care reform for further discussion of these provisions. In addition, our OptumHealth Collaborative Care business negotiates capitation arrangements with commercial third party payers. Under the typical capitation arrangement, the health care provider receives a fixed percentage of a third party payer’s premiums to cover all or a defined portion of the medical costs provided to the capitated member. If we fail to accurately predict, price for or manage the costs of providing care to our capitated members, our results of operations could be materially and adversely affected.
We manage medical costs through underwriting criteria, product design, negotiation of favorable provider contracts and care management programs. Total medical costs are affected by the number of individual services rendered and the cost of each
16
service. Our premium revenue on commercial policies is typically at a fixed rate per individual served for a 12-month period and is generally priced one to four months before the contract commences. Our revenue on Medicare policies is based on bids submitted in June the year before the contract year. We base the premiums we charge and our Medicare bids on our estimates of future medical costs over the fixed contract period; however, many factors may cause actual costs to exceed what was estimated and reflected in premiums or bids. These factors may include medical cost inflation, increased use of services, increased cost of individual services, natural catastrophes or other large-scale medical emergencies, epidemics, the introduction of new or costly treatments and technology, new mandated benefits (such as the expansion of essential benefits coverage) or other regulatory changes and insured population characteristics. Relatively small differences between predicted and actual medical costs or utilization rates as a percentage of revenues can result in significant changes in our financial results. For example, if our 2012 medical costs for commercial insured products were 1% higher, without proportionally higher revenues from such products, our annual net earnings for 2012 would have been reduced by approximately $215 million, excluding any offsetting impact from premium rebates.
In addition, the financial results we report for any particular period include estimates of costs that have been incurred for which claims are still outstanding. These estimates involve an extensive degree of judgment. If these estimates prove too low, our results of operations could be materially and adversely affected.
Our business activities are highly regulated; new laws or regulations or changes in existing laws or regulations or their enforcement or application could materially and adversely affect our results of operations, financial position and cash flows.
Our business is regulated at the federal, state, local and international levels. Our insurance and HMO subsidiaries must be licensed by and are subject to the regulations of the jurisdictions in which they conduct business. For example, states require periodic financial reports and enforce minimum capital or restricted cash reserve requirements. Health plans and insurance companies are also regulated under state insurance holding company regulations, and some of our activities may be subject to other health care-related regulations and requirements, including those relating to PPOs, MCOs, utilization review and TPA-related regulations and licensure requirements. Some of our UnitedHealthcare and Optum businesses hold or provide services related to government contracts and are subject to U.S. federal and state and non-U.S. self-referral, anti-kickback, medical necessity, risk adjustment, false claims, debt collection and other laws and regulations governing government contractors and the use of government funds. In addition, under state guaranty fund laws, certain health, life and accident insurance companies and, in certain cases, HMOs can be assessed (up to prescribed limits) for certain obligations to the policyholders and claimants of insolvent insurance companies that write the same line or lines of business in these states, which would expose our business to the risk of insolvency of a competitor in these states.
Certain of our Optum businesses are also subject to regulatory and other risks and uncertainties, some of which are distinct from those faced by our insurance and HMO subsidiaries, including, for example, FDA regulations, state telemedicine regulations and state corporate practice of medicine doctrines and fee-splitting rules, some of which could impact our relationships with physicians, hospitals and customers. Additionally, OptumHealth participates in the emerging private exchange markets and it is not yet known to what extent the states will issue new regulations that apply to private exchanges. These risks and uncertainties may materially and adversely affect our ability to market our products and services, or to do so at targeted margins, or increase the regulatory burdens under which we operate.
The laws and rules governing our business and interpretations of those laws and rules are subject to frequent change, and the integration into our businesses of entities that we acquire may affect the way in which existing laws and rules apply to us. The broad latitude given to the agencies administering, interpreting and enforcing current and future regulations governing our business could force us to change how we do business, restrict revenue and enrollment growth, increase our health care and administrative costs and capital requirements, or expose us to increased liability in courts for coverage determinations, contract interpretation and other actions.
We must also obtain and maintain regulatory approvals to market many of our products, increase prices for certain regulated products and complete certain acquisitions and dispositions or integrate certain acquisitions. For example, premium rates for our health insurance and/or managed care products are subject to regulatory review or approval in many states and by the federal government, and a number of states have enhanced (or are proposing to enhance) their rate review processes. In addition, geographic and product expansions may be subject to state and federal regulatory approvals. Delays in obtaining necessary approvals or our failure to obtain or maintain adequate approvals could materially and adversely affect our results of operations, financial position and cash flows.
Some of our businesses and operations are international in nature and consequently face political, economic, legal, compliance, regulatory, operational and other risks and exposures that are unique and vary by jurisdiction. The regulatory environments and associated requirements and uncertainties regarding tax, licensing, tariffs, intellectual property, privacy, data protection, investment, management control, labor relations, fraud and corruption present compliance requirements and uncertainties for us that are different from those faced by U.S.-based businesses. We have recently acquired and may in the future acquire or commence additional businesses based outside of the United States. For example, our acquisition of Amil in October 2012
17
subjects us to Brazilian laws and regulations affecting the managed care and insurance industries, which vary from comparable U.S. laws and regulations, and regulation by Brazilian regulators, whose approach to the interpretation, implementation and enforcement of industry regulations could differ from the approach taken by U.S. regulators. For more information about the Amil acquisition, see Note 6 of Notes to the Consolidated Financial Statements included in Item 8, “Financial Statements.” In addition, our non-U.S. businesses and operations are also subject to U.S. laws that regulate the conduct and activities of U.S.-based businesses operating abroad, such as the Foreign Corrupt Practices Act. Our failure to comply with U.S. or non-U.S. laws and regulations governing our conduct outside the United States or to establish constructive relations with non-U.S. regulators could adversely affect our ability to market our products and services, or to do so at targeted margins, which may have a material adverse effect on our business, financial condition and results of operations.
The health care industry is also regularly subject to negative publicity, including as a result of governmental investigations, adverse media coverage and political debate surrounding industry regulation. Negative publicity may adversely affect our stock price, damage our reputation in various markets or foster an increasingly active regulatory environment, which, in turn, could further increase the regulatory burdens under which we operate and our costs of doing business.
For a discussion of various laws and regulations that impact our businesses, see Item 1, “Business - Government Regulation.”
The implementation of the Health Reform Legislation and other reforms could materially and adversely affect the manner in which we conduct business and our results of operations, financial position and cash flows.
The Health Reform Legislation expands access to coverage and modifies aspects of the commercial insurance market, as well as the Medicaid and Medicare programs, CHIP and other aspects of the health care system. Among other things, the Health Reform Legislation includes guaranteed coverage and expanded benefit requirements, eliminates pre-existing condition exclusions and annual and lifetime maximum limits, restricts the extent to which policies can be rescinded, establishes minimum medical loss ratios, creates a federal premium review process, imposes new requirements on the format and content of communications (such as explanations of benefits, or EOBs) between health insurers and their members, grants to members new and additional appeal rights, imposes new and significant taxes on health insurers and health care benefits, reduces the Medicare Part D coverage gap and reduces payments to private plans offering Medicare Advantage.
Certain provisions of the Health Reform Legislation have already taken effect, and other provisions become effective at various dates over the next several years. HHS, the DOL and the Treasury Department have issued or proposed regulations on a number of aspects of Health Reform Legislation, but final rules and interim guidance on other key aspects of the legislation remain pending. Due to the complexity of the Health Reform Legislation, the impact of the Health Reform Legislation remains difficult to predict and is not yet fully known. For example, effective in 2011, the Health Reform Legislation established minimum medical loss ratios for all commercial health plans in the large employer group, small employer group and individual markets (85% for large employer groups, 80% for small employer groups and 80% for individuals, calculated under the definitions in the Health Reform Legislation and regulations), subject to state specific exceptions. Companies with medical loss ratios below these targets are required to rebate ratable portions of their premiums to their customers annually. The medical loss ratios that determine the size of the rebates will be measured by state, by group size and by licensed subsidiary. This disaggregation of insurance pools into much smaller pools will likely decrease the predictability of results for any given pool and could lead to variation over time in the estimates of rebates owed in total. Effective in 2014, Medicare Advantage plans will be required to maintain a minimum medical loss ratio of 85%, although the rules expected to set forth the basis for calculating this medical loss ratio have not yet been issued. Some state Medicaid programs are also imposing medical loss ratio requirements on Medicaid managed care organizations, which generally require such plans to rebate ratable portions of their premiums to their state customers if they cannot demonstrate they have met the minimum medical loss ratios. Depending on our calculations of the medical loss ratios for each of our plans and the manner in which we adjust our business model in light of these requirements, there could be meaningful disruptions in local health care markets, and our market share, results of operations, financial position and cash flows could be materially and adversely affected.
In addition, the Health Reform Legislation requires the establishment of state-based health insurance exchanges for individuals and small employers by 2014. The types of exchange participation requirements ultimately enacted by each state, the availability of federal subsidies for premiums and cost-sharing reductions within exchanges, the potential for differential imposition of state benefit mandates inside and outside the exchanges, the operation of reinsurance, risk corridors and risk adjustment mechanisms inside and outside the exchanges and the possibility that certain states may restrict the ability of health plans to continue to offer coverage to individuals and small employers outside of the exchanges could result in disruptions in local health care markets and our results of operations, financial position and cash flows could be materially and adversely affected.
The Health Reform Legislation also includes specific reforms for the individual and small group marketplace, scheduled to take effect in January 2014, including adjusted community rating requirements (which include elimination of health status and gender rating factors), essential health benefit requirements (expected to result in benefit changes for many members) and actuarial value requirements likely to result in expanded benefits or reduced member cost sharing (or a combination of both) for some policyholders. Although HHS issued proposed regulations related to these provisions in late 2012, the federal regulations
18
are not yet final and most states have not issued implementing regulations or guidance with respect to these provisions. Depending on the timing and outcome of the final federal regulations and required state regulations or guidance, there could be disruptions in local health care markets and our results of operations, financial position and cash flows could be materially and adversely affected.
The Health Reform Legislation includes a “maintenance of effort” (MOE) provision that requires states to maintain their eligibility rules for adults covered by Medicaid, until the Secretary of HHS determines that an insurance exchange is operational in a given state, scheduled for January 2014, and for children covered by Medicaid or CHIP, through federal fiscal year 2019. States with, or projecting, a budget deficit may apply for an exception to the MOE provision. If states are successful in obtaining MOE waivers and allow certain Medicaid programs to expire, we could experience reduced Medicaid enrollment, which could materially and adversely affect our results of operations, financial position and cash flows.
Under the U.S. Supreme Court’s June 2012 decision, state participation in the Health Reform Legislation’s Medicaid expansion is voluntary. Several states have indicated they may not expand their Medicaid programs based on concerns over costs when expanded federal funding pares down, starting in 2017. The extent to which states expand their Medicaid programs, or discontinue current expansion programs, could adversely impact our Medicaid enrollment levels, which could in turn materially and adversely affect our results of operations, financial position and cash flows.
Several of the provisions in the Health Reform Legislation will likely increase our medical cost trends. Examples of these provisions are the excise tax on medical devices, annual fees on prescription drug manufacturers, enhanced coverage requirements (including essential health benefit requirements and phased-in closing of the coverage gap for Medicare Part D participants), the prohibition of pre-existing condition exclusions and the implementation of adjusted community rating requirements. The annual insurance industry assessment ($8 billion to be levied on the insurance industry in 2014 increasing to $14.3 billion by 2018 with increasing annual amounts thereafter), which is not deductible for income tax purposes, and the temporary reinsurer’s fee ($25 billion to be levied on all commercial lines of business including insured and self-funded arrangements, over a three-year period starting in 2014), will increase our operating costs. Premium increases or benefit reductions will be necessary to offset the impact these and other provisions will have on our medical and operating costs. These premium increases are often subject to state regulatory approval, and the Federal government is encouraging states to intensify their reviews of requests for rate increases by commercial health plans and providing funding to assist in those state-level reviews. We have begun to experience greater regulatory challenges to appropriate premium rate increases in several states, including California and New York. In addition, as required under the Health Reform Legislation, HHS established a federal premium rate review process, which became effective in September 2011 and generally applies to proposed rate increases equal to or exceeding 10%. The regulations further require commercial health plans in the individual and small group markets to provide to the states and HHS extensive information supporting rate increases. If we are not able to secure approval for adequate premium increases to offset increases in our cost structure or if consumers forego coverage as a result of such premium increases, our margins, results of operations, financial position and cash flows could be materially and adversely affected. In addition, plans deemed to have a history of “unreasonable” rate increases may be prohibited from participating in the state-based exchanges that become active under the Health Reform Legislation in 2014. Under the regulations, the HHS rate review process would apply only to health plans in the individual and small group markets.
We also expect that implementation of the Health Reform Legislation will increase the demand for products and capabilities offered by our Optum businesses. We have made and will continue to make strategic decisions and investments based, in part, on these assumptions, and our results of operations, financial position and cash flows could be materially and adversely affected if fewer individuals gain coverage under the Health Reform Legislation than we expect or we are unable to attract these new individuals to our UnitedHealthcare offerings, or if the demand for our Optum businesses does not increase.
Future regulatory or legislative action could further impact the implementation of Health Reform Legislation. For example, Congress may attempt to amend or withhold the funding necessary to implement the Health Reform Legislation. In addition, a number of state legislatures have enacted or are contemplating significant reforms of their health insurance markets, either independent of or to comply with or be eligible for grants or other incentives in connection with the Health Reform Legislation. New federal or state laws and regulations could force us to materially change how we do business and any amendment, withholding of funding, extended delays in the issuance of necessary federal and state implementing regulations or guidance or other uncertainty regarding the Health Reform Legislation could materially and adversely impact our ability to capitalize on the opportunities presented by the legislation or cause us to incur additional costs of compliance or reverse some of the changes we have already implemented. In addition, our market share, our results of operations, our financial position, including our ability to maintain the value of our goodwill, and our cash flows could be materially and adversely affected by legislative and regulatory changes.
For additional information regarding the Health Reform Legislation, see Item 1, “Business - Government Regulation” and Item 7, “Management’s Discussion and Analysis of Financial Condition and Results of Operations - Executive Overview - Regulatory Trends and Uncertainties.”
19
As a result of our participation in various government health care programs, both as a payer and as a service provider to payers, we are exposed to additional risks associated with program funding, enrollments, payment adjustments, audits and government investigations that could materially and adversely affect our business, results of operations, financial position and cash flows.
We participate in various federal, state and local government health care coverage programs, including as a payer in Medicare Advantage, Medicare Part D, various Medicaid programs, CHIP and our TRICARE West contract with the DoD, and receive substantial revenues from these programs. We also provide services to payers through our Optum businesses. These programs generally are subject to frequent changes, including changes that may reduce the number of persons enrolled or eligible for coverage, reduce the amount of reimbursement or payment levels, reduce our participation in certain service areas or markets, or increase our administrative or medical costs under such programs. Revenues for these programs are dependent upon periodic funding from the federal government or applicable state governments and allocation of the funding through various payment mechanisms. Funding for these government programs is dependent upon many factors outside of our control, including general economic conditions and budgetary constraints at the federal or applicable state level, and general political issues and priorities. For example, CMS has in the past reduced or frozen Medicare Advantage benchmarks and additional cuts to Medicare Advantage benchmarks are expected in the next few years. Although we have adjusted members’ benefits and premiums on a selective basis, terminated benefit plans in certain counties, and intensified both our medical and operating cost management in response to these benchmark reductions, there can be no assurance that we will be able to execute successfully on these or other strategies to address changes in the Medicare Advantage program. A reduction or less than expected increase, or a protracted delay, in government funding for these programs or change in allocation methodologies may materially and adversely affect our results of operations, financial position and cash flows.
Under the Medicaid Managed Care program, state Medicaid agencies are periodically required by federal law to seek bids from eligible health plans to continue their participation in the acute care Medicaid health programs. If we are not successful in obtaining renewals of state Medicaid Managed Care contracts, we risk losing the members that were enrolled in those Medicaid plans. Under the Medicare Part D program, to qualify for automatic enrollment of low income members, our bids must result in an enrollee premium below a regional benchmark, which is calculated by the government after all regional bids are submitted. If the enrollee premium is not below the government benchmark, we risk losing the members who were auto-assigned to us and we will not have additional members auto-assigned to us. For example, we lost approximately 470,000 of our auto-enrolled low-income subsidy members in 2012 because certain of our bids exceeded thresholds set by the government. In general, our bids are based upon certain assumptions regarding enrollment, utilization, medical costs, and other factors. In the event any of these assumptions are materially incorrect, either as a result of unforeseen changes to the Medicare program or other programs on which we bid, or our competitors submit bids at lower rates than our bids, our results of operations, financial position and cash flows could be materially and adversely affected.
Many of the government health care coverage programs in which we participate are subject to the prior satisfaction of certain conditions or performance standards or benchmarks. For example, as part of the Health Reform Legislation, CMS has developed a system entitling plans that meet certain quality ratings at the local plan level to various quality bonus payments. In addition, under the Health Reform Legislation, Congress authorized CMS and the states to implement MME managed care demonstration programs to serve dually eligible beneficiaries to improve the coordination of their care. Health plan participation in these demonstration programs is subject to CMS approval of specified care delivery models and the satisfaction of conditions to participation, including meeting certain performance requirements. Any changes in standards or care delivery models that apply to government health care programs, including Medicare, Medicaid and the MME demonstration programs for dually eligible beneficiaries, or our inability to meet government performance requirements or to match the performance of our competitors could result in limitations to our participation in or exclusion from these or other government programs, which in turn could materially and adversely affect our results of operations, financial position and cash flows.
CMS uses various payment mechanisms to allocate funding for Medicare programs, including adjusting monthly capitation payments to Medicare Advantage plans and Medicare Part D plans according to the predicted health status of each beneficiary as supported by data from health care providers as well as, for Medicare Part D plans, risk-sharing provisions based on a comparison of costs predicted in our annual bids to actual prescription drug costs. Some state Medicaid programs utilize a similar process. For example, our UnitedHealthcare Medicare & Retirement and UnitedHealthcare Community & State businesses submit information relating to the health status of enrollees to CMS or state agencies for purposes of determining the amount of certain payments to us. CMS and the Office of Inspector General for HHS periodically perform risk adjustment data validation (RADV) audits of selected Medicare health plans to validate the coding practices of and supporting documentation maintained by health care providers, and certain of our local plans have been audited. Such audits have in the past resulted and could in the future result in retrospective adjustments to payments made to our health plans, fines, corrective action plans or other adverse action by CMS. In February 2012, CMS published a final RADV audit and payment adjustment methodology. The methodology contains provisions allowing retroactive contract level payment adjustments for the year audited, beginning with 2011 payments, using an extrapolation of the “error rate” identified in audit samples and, for Medicare Advantage plans, after considering a fee-for-service (FFS) “error rate” adjuster that will be used in determining the payment
20
adjustment. Depending on the plans selected for audit, if any, and the error rate found in those audits, if any, potential payment adjustments could have a material adverse effect on our results of operations, financial position and cash flows.
We have been and may in the future become involved in various governmental investigations, audits, reviews and assessments. These include routine, regular and special investigations, audits and reviews by CMS, state insurance and health and welfare departments, state attorneys general, the OIG, the Office of Personnel Management, the Office of Civil Rights, the FTC, U.S. Congressional committees, the DOJ, U.S. Attorneys, the SEC, the CVM, the IRS, the SRF, the DOL, the FDIC and other governmental authorities. Certain of our businesses have been reviewed or are currently under review, including for, among other things, compliance with coding and other requirements under the Medicare risk-adjustment model. Such investigations, audits or reviews sometimes arise out of or prompt claims by private litigants or whistleblowers that, among other things, we failed to disclose certain business practices or, as a government contractor, submitted false claims to the government. Governmental investigations, audits, reviews and assessments could expand to subjects beyond those targeted by the original investigation, audit, review, assessment or private action and could lead to government actions, which could result in the assessment of damages, civil or criminal fines or penalties, or other sanctions, including restrictions or changes in the way we conduct business, loss of licensure or exclusion from participation in government programs, any of which could have a material adverse effect on our business, results of operations, financial position and cash flows. See Note 12 of Notes to the Consolidated Financial Statements included in Item 8, “Financial Statements” for a discussion of certain of these matters.
If we fail to comply with applicable privacy and security laws, regulations and standards, including with respect to third-party service providers that utilize sensitive personal information on our behalf, or if we fail to address emerging security threats or detect and prevent privacy and security incidents, our business, reputation, results of operations, financial position and cash flows could be materially and adversely affected.
The collection, maintenance, protection, use, transmission, disclosure and disposal of sensitive personal information are regulated at the federal, state, international and industry levels and requirements are imposed on us by contracts with customers. These laws, rules and requirements are subject to change. Further, many of our businesses are subject to the Payment Card Industry Data Security Standards (PCI DSS), which is a multifaceted security standard that is designed to protect credit card account data as mandated by payment card industry entities. See Item 1, “Business - Government Regulation” for additional information. HIPAA also requires business associates as well as covered entities to comply with certain privacy and security requirements. Even though we provide for appropriate protections through our contracts with our third-party service providers and in certain cases assess their security controls, we still have limited oversight or control over their actions and practices.
Our facilities and systems and those of our third-party service providers may be vulnerable to privacy and security incidents; security attacks and breaches; acts of vandalism or theft; computer viruses; coordinated attacks by activist entities; emerging cybersecurity risks; misplaced or lost data; programming and/or human errors; or other similar events. Emerging and advanced security threats, including coordinated attacks, require additional layers of security which may disrupt or impact efficiency of operations.
Compliance with new privacy and security laws, regulations and requirements may result in increased operating costs, and may constrain our ability to manage our business model. For example, final HHS regulations released in January 2013 implementing the ARRA amendments to HIPAA may further restrict our ability to collect, disclose and use sensitive personal information and may impose additional compliance requirements on our business. In addition, HHS has announced that it will continue its audit program to assess HIPAA compliance efforts by covered entities. Although we are not aware of HHS plans to audit any of our covered entities, an audit resulting in findings or allegations of noncompliance could have a material adverse effect on our results of operations, financial position and cash flows.
Noncompliance or findings of noncompliance with applicable laws, regulations or requirements, or the occurrence of any privacy or security breach involving the misappropriation, loss or other unauthorized disclosure of sensitive personal information, whether by us or by one of our third-party service providers, could have a material adverse effect on our reputation and business, including mandatory disclosure to the media, significant increases in the cost of managing and remediating privacy or security incidents and material fines, penalties and litigation awards, among other consequences, any of which could have a material and adverse effect on our results of operations, financial position and cash flows.
Our businesses providing PBM services face regulatory and other risks and uncertainties associated with the PBM industry that may differ from the risks of our business of providing managed care and health insurance products
.
We provide PBM services through our OptumRx and UnitedHealthcare businesses. Each business is subject to federal and state anti-kickback and other laws that govern their relationships with pharmaceutical manufacturers, physicians, pharmacies, customers and consumers. OptumRx also conducts business as a mail order pharmacy and specialty pharmacy, which subjects it to extensive federal, state and local laws and regulations. In addition, federal and state legislatures regularly consider new regulations for the industry that could materially and adversely affect current industry practices, including the receipt or disclosure of rebates from pharmaceutical companies, the development and use of formularies, and the use of average
21
wholesale prices. See Item 1, “Business - Government Regulation” for a discussion of various federal and state laws and regulations governing our PBM businesses.
Our PBM businesses would also be materially and adversely affected by an inability to contract on favorable terms with pharmaceutical manufacturers and other suppliers, and could face potential claims in connection with purported errors by our mail order or specialty pharmacies, including in connection with the risks inherent in the packaging and distribution of pharmaceuticals and other health care products. Disruptions at any of our mail order or specialty pharmacies due to an accident or an event that is beyond our control could affect our ability to timely process and dispense prescriptions and could materially and adversely affect our results of operations, financial position and cash flows.
In addition, our PBM businesses provide services to sponsors of health benefit plans that are subject to ERISA. The DOL, which is the agency that enforces ERISA, could assert that the fiduciary obligations imposed by the statute apply to some or all of the services provided by our PBM businesses even where our PBM businesses are not contractually obligated to assume fiduciary obligations. In the event a court were to determine that fiduciary obligations apply to our PBM businesses in connection with services for which our PBM businesses are not contractually obligated to assume fiduciary obligations, we could be subject to claims for breaches of fiduciary obligations or entering into certain prohibited transactions.
UnitedHealthcare Employer & Individual recently began to transition pharmacy benefit management for approximately 12 million of its commercial members, including pharmacy claims adjudication and customer service, from Express Scripts’ subsidiary, Medco Health Solutions, Inc., to OptumRx. If our customers are not satisfied with our pharmacy benefit management services as a result of this transition, UnitedHealthcare Employer & Individual could face loss of business, which could adversely impact our results of operations, financial position and cash flows.
If we fail to compete effectively to maintain or increase our market share, including maintaining or increasing enrollments in businesses providing health benefits, our results of operations, financial position and cash flows
could be materially and adversely affected.
Our businesses compete throughout the United States and face significant competition in all of the geographic markets in which we operate. We compete with other companies on the basis of many factors, including price of benefits offered and cost and risk of alternatives, location and choice of health care providers, quality of customer service, comprehensiveness of coverage offered, reputation for quality care, financial stability and diversity of product offerings. For our UnitedHealthcare businesses, competitors include Aetna Inc., Cigna Corporation, Coventry Health Care, Inc., Health Net, Inc., Humana Inc., Kaiser Permanente, WellPoint, Inc., numerous for-profit and not-for-profit organizations operating under licenses from the Blue Cross Blue Shield Association, and, with respect to our Brazilian operations, several established competitors in Brazil, and other enterprises that serve more limited geographic areas. For our OptumRx businesses, competitors include CVS Caremark Corporation, Express Scripts, Inc. and Catamaran Corporation. Our OptumHealth and OptumInsight reportable segments also compete with a broad and diverse set of businesses.
In particular markets, competitors may have greater capabilities, resources or market share; a more established reputation; superior supplier or health care professional arrangements; better existing business relationships; or other factors that give such competitors a competitive advantage. In addition, significant merger and acquisition activity has occurred in the industries in which we operate, both among our competitors and suppliers (including hospitals, physician groups and other care professionals). Consolidation may make it more difficult for us to retain or increase our customer base, improve the terms on which we do business with our suppliers, or maintain or increase profitability. If we do not compete effectively in our markets, if we set rates too high or too low in highly competitive markets, if we do not design and price our products properly and competitively, if we are unable to innovate and deliver products and services that demonstrate value to our customers, if we do not provide a satisfactory level of services, if membership or demand for other services does not increase as we expect or declines, or if we lose accounts with more profitable products while retaining or increasing membership in accounts with less profitable products, our business, results of operations, financial position and cash flows could be materially and adversely affected.
If we fail to develop and maintain satisfactory relationships with physicians, hospitals, and other health care providers, our business could be materially and adversely affected.
We contract with physicians, hospitals, pharmaceutical benefit service providers, pharmaceutical manufacturers, and other health care providers for services. Our results of operations and prospects are substantially dependent on our continued ability to contract for these services at competitive prices. Failure to develop and maintain satisfactory relationships with health care providers, whether in-network or out-of-network, could materially and adversely affect our business, results of operations, financial position and cash flows.
In any particular market, physicians and health care providers could refuse to contract, demand higher payments, or take other actions that could result in higher medical costs, less desirable products for customers or difficulty meeting regulatory or accreditation requirements. In some markets, certain health care providers, particularly hospitals, physician/hospital
22
organizations or multi-specialty physician groups, may have significant market positions or near monopolies that could result in diminished bargaining power on our part. In addition, accountable care organizations (ACOs), practice management companies, which aggregate physician practices for administrative efficiency and marketing leverage, and other organizational structures that physicians, hospitals and other care providers choose may change the way that these providers interact with us and may change the competitive landscape. Such organizations or groups of physicians may compete directly with us, which may impact our relationships with these providers or affect the way that we price our products and estimate our costs and may require us to incur costs to change our operations, and our results of operations, financial position and cash flows could be adversely affected. In addition, if these providers refuse to contract with us, use their market position to negotiate favorable contracts or place us at a competitive disadvantage, our ability to market products or to be profitable in those areas could be materially and adversely affected.
We have capitation arrangements with some physicians, hospitals and other health care providers. Capitation arrangements limit our exposure to the risk of increasing medical costs, but expose us to risk related to the adequacy of the financial and medical care resources of the health care provider. To the extent that a capitated health care provider organization faces financial difficulties or otherwise is unable to perform its obligations under the capitation arrangement, we may be held responsible for unpaid health care claims that should have been the responsibility of the capitated health care provider and for which we have already paid the provider under the capitation arrangement. Further, payment or other disputes between a primary care provider and specialists with whom the primary care provider contracts can result in a disruption in the provision of services to our members or a reduction in the services available to our members. There can be no assurance that health care providers with whom we contract will properly manage the costs of services, maintain financial solvency or avoid disputes with other providers. Any of these events could have a material adverse effect on the provision of services to our members and our operations.
Some providers that render services to our members do not have contracts with us. In those cases, we do not have a pre-established understanding about the amount of compensation that is due to the provider for services rendered to our members. In some states, the amount of compensation due to these out-of-network providers is defined by law or regulation, but in most instances, it is either not defined or it is established by a standard that does not clearly specify dollar terms. In some instances, providers may believe that they are underpaid for their services and may either litigate or arbitrate their dispute with us or try to recover from our members the difference between what we have paid them and the amount they charged us. For example, we are involved in litigation with out-of-network providers, as described in more detail in “Litigation Matters” in Note 12 of Notes to the Consolidated Financial Statements included in Item 8, “Financial Statements.”
The success of certain Optum businesses, particularly Collaborative Care, depends on maintaining satisfactory physician relationships. The primary care physicians that practice medicine or contract with our affiliated physician organizations could terminate their provider contracts or otherwise become unable or unwilling to continue practicing medicine or contracting with us. If we are unable to maintain satisfactory relationships with primary care physicians, or to retain enrollees following the departure of a physician, our revenues could be materially and adversely affected. In addition, our affiliated physician organizations contract with health insurance and HMO competitors of UnitedHealthcare. If our affiliated physician organizations fail to maintain relationships with these health insurance or HMO companies, or to adequately price their contracts with these third party payers, our results of operations, financial position and cash flows could be materially and adversely affected.
In addition, physicians, hospitals, pharmaceutical benefit service providers, pharmaceutical manufacturers, and certain health care providers are customers of our Optum businesses. Given the importance of health care providers and other constituents to our businesses, failure to maintain satisfactory relationships with them could materially and adversely affect our results of operations, financial position and cash flows.
Because of the nature of our business, we are routinely subject to various litigation actions, which could damage our reputation and, if resolved unfavorably, could result in substantial penalties and/or monetary damages and materially and adversely affect our results of operations, financial position and cash flows.
Because of the nature of our business, we are routinely made party to a variety of legal actions related to, among other things, the design, management and delivery of our product and service offerings. These matters have included or could in the future include claims related to health care benefits coverage and payment (including disputes with enrollees, customers, and contracted and non-contracted physicians, hospitals and other health care professionals), tort (including claims related to the delivery of health care services, such as medical malpractice by health care practitioners who are employed by us, have contractual relationships with us, or serve as providers to our managed care networks), contract and labor disputes, tax claims and claims related to disclosure of certain business practices. We are also party to certain class action lawsuits brought by health care professional groups and consumers. In addition, we periodically acquire businesses or commence operations in jurisdictions outside of the United States, where contractual rights, tax positions and applicable regulations may be subject to interpretation or uncertainty to a greater degree than in the United States, and therefore subject to dispute by customers, government authorities or others. We are largely self-insured with regard to litigation risks. Although we maintain excess
23
liability insurance with outside insurance carriers for claims in excess of our self-insurance, certain types of damages, such as punitive damages in some circumstances, are not covered by insurance. We record liabilities for our estimates of the probable costs resulting from self-insured matters; however, it is possible that the level of actual losses will significantly exceed the liabilities recorded.
A description of significant legal actions in which we are currently involved is included in Note 12 of Notes to the Consolidated Financial Statements included in Item 8, “Financial Statements.” We cannot predict the outcome of these actions with certainty, and we are incurring expenses in resolving these matters. The legal actions we face or may face in the future could further increase our cost of doing business and materially and adversely affect our results of operations, financial position and cash flows. In addition, certain legal actions could result in adverse publicity, which could damage our reputation and materially and adversely affect our ability to retain our current business or grow our market share in select markets and businesses.
Any failure by us to successfully manage our strategic alliances or complete, manage or integrate acquisitions and other significant strategic transactions could materially and adversely affect our business, prospects, results of operations, financial position and cash flows.
As part of our business strategy, we frequently engage in discussions with third parties regarding possible investments, acquisitions, divestitures, strategic alliances, joint ventures, and outsourcing transactions and often enter into agreements relating to such transactions. For example, we have a strategic alliance with AARP under which we provide AARP-branded Medicare Supplement insurance to AARP members and other AARP-branded products and services to both AARP members and non-members. If we fail to meet the needs of AARP and its members, including by developing additional products and services, pricing our products and services competitively or responding effectively to applicable federal and state regulatory changes, our alliance with the AARP could be damaged or terminated, which in turn could adversely impact our reputation, business and results of operations. Further, if we fail to identify and complete successfully transactions that further our strategic objectives, we may be required to expend resources to develop products and technology internally, we may be at a competitive disadvantage or we may be adversely affected by negative market perceptions, any of which may have a material adverse effect on our results of operations, financial position or cash flows. For acquisitions, success is also dependent upon efficiently integrating the acquired business into our existing operations. We are required to integrate these businesses into our internal control environment, which may present challenges that are different than those presented by organic growth and that may be difficult to manage. If we are unable to successfully integrate and grow these acquisitions and to realize contemplated revenue synergies and cost savings, our business, prospects, results of operations, financial position and cash flows could be materially and adversely affected.
As we continue to expand our business outside the United States, acquired foreign businesses, such as Amil, will present challenges that are different from those presented by acquisitions of domestic businesses, including adapting to new markets, business, labor and cultural practices and regulatory environments that are materially different from what we have experienced in our U.S. operations. For more information on the Amil acquisition, see Note 6 of Notes to the Consolidated Financial Statements included in Item 8, “Financial Statements.” Adapting to these challenges could require us to devote significant senior management and other resources to the acquired businesses before we realize anticipated benefits or synergies from the acquired businesses. These challenges vary widely by country and may include political instability, government intervention, discriminatory regulation, and currency exchange controls or other restrictions that could prevent us from transferring funds from these operations out of the countries in which our acquired businesses operate or converting local currencies that we hold into U.S. dollars or other currencies. If we are unable to successfully manage our foreign acquisitions, our business, prospects, results of operations and financial position could be materially and adversely affected.
Additionally, foreign currency exchange rates and fluctuations may have an impact on our shareholders’ equity from period to period, which could adversely affect our debt to debt-plus-equity ratio, and the future costs of or revenues and cash flows from our international operations, and any measures we may implement to reduce the effect of volatile currencies may be costly or ineffective.
Sales of our products and services are dependent on our ability to attract, retain and provide support to a network of independent producers and consultants.
Our products are sold in part through independent producers and consultants who assist in the production and servicing of business. We typically do not have long-term contracts with our producers and consultants, who generally are not exclusive to us and who typically also recommend and/or market health care products and services of our competitors. As a result, we must compete intensely for their services and allegiance. Our sales would be materially and adversely affected if we were unable to attract or retain independent producers and consultants or if we do not adequately provide support, training and education to them regarding our product portfolio, or if our sales strategy is not appropriately aligned across distribution channels.
Because producer commissions are included as administrative expenses under the medical loss ratio requirements of the Health Reform Legislation, these expenses will be under the same cost reduction pressures as other administrative costs. Our
24
relationships with producers could be materially and adversely impacted by changes in our business practices and the nature of our relationships to address these pressures, including potential reductions in commissions.
In addition, there have been a number of investigations regarding the marketing practices of producers selling health care products and the payments they receive. These have resulted in enforcement actions against companies in our industry and producers marketing and selling these companies’ products. These investigations and enforcement actions could result in penalties and the imposition of corrective action plans, which could materially and adversely impact our ability to market our products.
Unfavorable economic conditions could materially and adversely affect our revenues and our results of operations.
Unfavorable economic conditions may impact demand for certain of our products and services. For example, high unemployment rates have caused and could continue to cause lower enrollment or lower rates of renewal in our employer group plans and our non-employer individual plans. Unfavorable economic conditions have also caused and could continue to cause employers to stop offering certain health care coverage as an employee benefit or elect to offer this coverage on a voluntary, employee-funded basis as a means to reduce their operating costs. In addition, unfavorable economic conditions could adversely impact our ability to increase premiums or result in the cancellation by certain customers of our products and services. All of these could lead to a decrease in our membership levels and premium and fee revenues and could materially and adversely affect our results of operations, financial position and cash flows.
During a prolonged unfavorable economic environment, state and federal budgets could be materially and adversely affected, resulting in reduced reimbursements or payments in our federal and state government health care coverage programs, including Medicare, Medicaid and CHIP. A reduction in state Medicaid reimbursement rates could be implemented retrospectively to payments already negotiated and/or received from the government and could materially and adversely affect our results of operations, financial position and cash flows. In addition, the state and federal budgetary pressures could cause the government to impose new or a higher level of taxes or assessments for our commercial programs, such as premium taxes on insurance companies and health maintenance organizations and surcharges or fees on select fee-for-service and capitated medical claims, and could materially and adversely affect our results of operations, financial position and cash flows.
In addition, a prolonged unfavorable economic environment could adversely impact the financial position of hospitals and other care providers, which could materially and adversely affect our contracted rates with these parties and increase our medical costs or materially and adversely affect their ability to purchase our service offerings. Further, unfavorable economic conditions could adversely impact the customers of our Optum businesses, including health plans, HMOs, hospitals, care providers, employers and others, which could, in turn, materially and adversely affect Optum’s financial results.
Our investment portfolio may suffer losses, which could materially and adversely affect our results of operations, financial position and cash flows.
Market fluctuations could impair our profitability and capital position. Volatility in interest rates affects our interest income and the market value of our investments in debt securities of varying maturities, which comprise the vast majority of the fair value of our investments as of December 31, 2012. Relatively low interest rates on investments, such as those experienced during recent years, have adversely impacted our investment income, and a prolonged low interest rate environment could further adversely affect our investment income. In addition, a delay in payment of principal and/or interest by issuers, or defaults by issuers (primarily from investments in corporate and municipal bonds), could reduce our net investment income and we may be required to write down the value of our investments, which could materially and adversely affect our profitability and shareholders’ equity.
We also allocate a small proportion of our portfolio to equity investments, which are subject to greater volatility than fixed income investments. General economic conditions, stock market conditions, and many other factors beyond our control can materially and adversely affect the value of our equity investments and may result in investment losses.
There can be no assurance that our investments will produce total positive returns or that we will not sell investments at prices that are less than their carrying values. Changes in the value of our investment assets, as a result of interest rate fluctuations, changes in issuer financial conditions, illiquidity or otherwise, could have an adverse effect on our shareholders’ equity. In addition, if it became necessary for us to liquidate our investment portfolio on an accelerated basis, it could have a material adverse effect on our results of operations and the capital position of regulated subsidiaries.
If the value of our intangible assets is materially impaired, our results of operations, shareholders’ equity and debt ratings could be materially and adversely affected.
Goodwill and other intangible assets were
$36.0 billion
as of December 31, 2012, representing
44%
of our total consolidated assets. We periodically evaluate our goodwill and other intangible assets to determine whether all or a portion of their carrying values may be impaired, in which case a charge to earnings may be necessary. For example, the manner in or the extent to which the Health Reform Legislation is implemented may impact our ability to maintain the value of our goodwill and other
25
intangible assets in our business. Similarly, the value of our goodwill may be materially and adversely impacted if businesses that we acquire perform in a manner that is inconsistent with our assumptions. In addition, from time to time we divest businesses, and any such divestiture could result in significant asset impairment and disposition charges, including those related to goodwill and other intangible assets. Any future evaluations requiring an impairment of our goodwill and other intangible assets could materially and adversely affect our results of operations and shareholders’ equity in the period in which the impairment occurs. A material decrease in shareholders’ equity could, in turn, adversely impact our debt ratings or potentially impact our compliance with our debt covenants.
If we fail to properly maintain the integrity or availability of our data or to strategically implement new or upgrade or consolidate existing information systems, or if our technology products do not operate as intended, our business could be materially and adversely affected.
Our ability to adequately price our products and services, to provide effective service to our customers in an efficient and uninterrupted fashion, and to accurately report our results of operations depends on the integrity of the data in our information systems. As a result of technology initiatives and recently enacted regulations, changes in our system platforms and integration of new business acquisitions, we periodically consolidate, integrate, upgrade and expand our information systems capabilities. Our information systems require an ongoing commitment of significant resources to maintain, protect and enhance existing systems and develop new systems to keep pace with continuing changes in information processing technology, evolving systems and regulatory standards, emerging cybersecurity risks and threats, and changing customer patterns. If the information we rely upon to run our businesses was found to be inaccurate or unreliable or if we fail to maintain or protect our information systems and data integrity effectively, we could lose existing customers, have difficulty attracting new customers, have problems in determining medical cost estimates and establishing appropriate pricing, have difficulty preventing, detecting and controlling fraud, have disputes with customers, physicians and other health care professionals, have regulatory sanctions or penalties imposed, have increases in operating expenses or suffer other adverse consequences. There can be no assurance that our process of consolidating the number of systems we operate, upgrading and expanding our information systems capabilities, protecting our systems against cybersecurity risks and threats, enhancing our systems and developing new systems to keep pace with continuing changes in information processing technology will be successful or that additional systems issues will not arise in the future. Failure to protect, consolidate and integrate our systems successfully could result in higher than expected costs and diversion of management’s time and energy, which could materially and adversely affect our results of operations, financial position and cash flows.
Certain of our businesses sell and install hardware and software products, and these products may contain unexpected design defects or may encounter unexpected complications during installation or when used with other technologies utilized by the customer. Connectivity among competing technologies is becoming increasingly important in the health care industry. A failure of our technology products to operate as intended and in a seamless fashion with other products could materially and adversely affect our results of operations, financial position and cash flows.
In addition, uncertain and rapidly evolving U.S. federal and state, non-U.S. and international laws and regulations related to the health information technology market may present compliance challenges and could materially and adversely affect the configuration of our information systems and platforms, and our ability to compete in this market.
If we are not able to protect our proprietary rights to our databases and related products, our ability to market our knowledge and information-related businesses could be hindered and our results of operations, financial position and cash flows could be materially and adversely affected.
We rely on our agreements with customers, confidentiality agreements with employees, and our trademarks, trade secrets, copyrights and patents to protect our proprietary rights. These legal protections and precautions may not prevent misappropriation of our proprietary information. In addition, substantial litigation regarding intellectual property rights exists in the software industry, and we expect software products to be increasingly subject to third-party infringement claims as the number of products and competitors in this industry segment grows. Such litigation and misappropriation of our proprietary information could hinder our ability to market and sell products and services and our results of operations, financial position and cash flows could be materially and adversely affected.
Our ability to obtain funds from some of our subsidiaries is restricted and if we are unable to obtain sufficient funds from our subsidiaries to fund our obligations, our results of operations and financial position could be materially and adversely affected.
Because we operate as a holding company, we are dependent upon dividends and administrative expense reimbursements from some of our subsidiaries to fund our obligations. Many of these subsidiaries are regulated by departments of insurance. We are also required by law or regulation to maintain specific prescribed minimum amounts of capital in these subsidiaries. The levels of capitalization required depend primarily upon the volume of premium revenues generated by the applicable subsidiary. A significant increase in premium volume will require additional capitalization from us. In most states, we are required to seek prior approval by these state regulatory authorities before we transfer money or pay dividends from these subsidiaries that
26
exceed specified amounts. An inability of our regulated subsidiaries to pay dividends to their parent companies in the desired amounts or at the time of our choosing could adversely affect our ability to reinvest in our business through capital expenditures or business acquisitions, as well as our ability to maintain our corporate quarterly dividend payment cycle, repurchase shares of our common stock and repay our debt. If we are unable to obtain sufficient funds from our subsidiaries to fund our obligations, our results of operations and financial position could be materially and adversely affected.
Downgrades in our credit ratings, should they occur, may adversely affect our business, financial condition and results of operations.
Claims paying ability, financial strength, and credit ratings by Nationally Recognized Statistical Rating Organizations are important factors in establishing the competitive position of insurance companies. Ratings information is broadly disseminated and generally used throughout the industry. We believe our claims paying ability and financial strength ratings are important factors in marketing our products to certain of our customers. Our credit ratings impact both the cost and availability of future borrowings. Each of the credit rating agencies reviews its ratings periodically and there can be no assurance that current credit ratings will be maintained in the future. Our ratings reflect each credit rating agency’s opinion of our financial strength, operating performance and ability to meet our debt obligations or obligations to policyholders. Downgrades in our credit ratings, should they occur, may adversely affect our results of operations, financial position and cash flows.
None.
|
ITEM 2.
|
PROPERTIES
|
To support our business operations in the United States and other countries we own and lease real properties. Our various reportable segments use these facilities for their respective business purposes, and we believe these current facilities are suitable for their respective uses and are adequate for our anticipated future needs.
See Note 12 of Notes to the Consolidated Financial Statements included in Item 8, “Financial Statements.”
|
ITEM 4.
|
MINE SAFETY DISCLOSURES
|
N/A
27
|
ITEM 5.
|
MARKET FOR REGISTRANT’S COMMON EQUITY, RELATED STOCKHOLDER MATTERS AND ISSUER PURCHASES OF EQUITY SECURITIES
|
MARKET PRICES
Our common stock is traded on the New York Stock Exchange (NYSE) under the symbol UNH. On January 31, 2013, there were 15,204 registered holders of record of our common stock. The per share high and low common stock sales prices reported by the NYSE were as follows:
|
High
|
Low
|
Cash Dividends Declared
|
|||||||||
|
2013
|
|||||||||||
|
First quarter (through February 6, 2013)
|
$
|
57.83
|
|
$
|
51.36
|
|
$
|
0.2125
|
|
||
|
2012
|
|||||||||||
|
First quarter
|
$
|
59.43
|
|
$
|
49.82
|
|
$
|
0.1625
|
|
||
|
Second quarter
|
$
|
60.75
|
|
$
|
53.78
|
|
$
|
0.2125
|
|
||
|
Third quarter
|
$
|
59.31
|
|
$
|
50.32
|
|
$
|
0.2125
|
|
||
|
Fourth quarter
|
$
|
58.29
|
|
$
|
51.09
|
|
$
|
0.2125
|
|
||
|
2011
|
|||||||||||
|
First quarter
|
$
|
45.75
|
|
$
|
36.37
|
|
$
|
0.1250
|
|
||
|
Second quarter
|
$
|
52.64
|
|
$
|
43.30
|
|
$
|
0.1625
|
|
||
|
Third quarter
|
$
|
53.50
|
|
$
|
41.27
|
|
$
|
0.1625
|
|
||
|
Fourth quarter
|
$
|
51.71
|
|
$
|
41.32
|
|
$
|
0.1625
|
|
||
DIVIDEND POLICY
In
June 2012
, our Board of Directors increased our cash dividend on common stock to an annual dividend rate of
$0.85
per share, paid quarterly. Since
May 2011
, we had paid an annual cash dividend on common stock of $
0.65
per share, distributed quarterly. Declaration and payment of future quarterly dividends is at the discretion of the Board and may be adjusted as business needs or market conditions change.
ISSUER PURCHASES OF EQUITY SECURITIES
Issuer Purchases of Equity Securities (a)
Fourth Quarter 2012
|
For the Month Ended
|
Total Number
of Shares
Purchased
|
Average Price
Paid per Share
|
Total Number of
Shares Purchased
as Part of Publicly
Announced Plans
or Programs
|
Maximum Number
of Shares That May
Yet Be Purchased
Under The Plans or
Programs
|
|||||||||
|
(in millions)
|
(in millions)
|
(in millions)
|
|||||||||||
|
October 31, 2012
|
—
|
|
$
|
—
|
|
—
|
|
94
|
|
||||
|
November 30, 2012
|
—
|
|
—
|
|
—
|
|
94
|
|
|||||
|
December 31, 2012
|
9
|
|
54
|
|
9
|
|
85
|
|
|||||
|
Total
|
9
|
|
|
$
|
54
|
|
9
|
|
|||||
|
(a)
|
In November 1997, our Board of Directors adopted a share repurchase program, which the Board evaluates periodically. In June 2012, the Board renewed and expanded our share repurchase program with an authorization to repurchase up to 110 million shares of our common stock in open market purchases or other types of transactions (including prepaid or structured repurchase programs). There is no established expiration date for the program.
|
UNREGISTERED SALE OF EQUITY SECURITIES
On November 2, 2012, we issued and sold, in reliance on Section 4(a)(2) of the Securities Act of 1933, as amended, 8 million shares of our common stock to CSHG 1122 FUNDO DE INVESTIMENTO MULTIMERCADO - CRÉDITO PRIVADO
28
INVESTIMENTO NO EXTERIOR, a fund wholly beneficially owned by Dr. Edson de Godoy Bueno, a member of our Board of Directors. We received net proceeds of approximately $470 million in cash and did not pay underwriting or placement discounts or fees in the transaction. Dr. Bueno has agreed to hold the shares for five years from the date of sale, subject to certain exceptions.
PERFORMANCE GRAPHS
The following two performance graphs compare our total return to shareholders with the returns of indexes of other specified companies and the S&P 500 Index. The first graph compares the cumulative five-year total return to shareholders on our common stock relative to the cumulative total returns of the S&P 500 index and a customized peer group of certain
Fortune 50
companies (the “
Fortune 50
Group”), for the five-year period ended
December 31, 2012
. The second graph compares our cumulative total return to shareholders with the S&P 500 Index and an index of a group of peer companies selected by us for the five-year period ended
December 31, 2012
. We are not included in either the
Fortune 50
Group index in the first graph or the peer group index in the second graph. In calculating the cumulative total shareholder return of the indexes, the shareholder returns of the
Fortune 50
Group companies in the first graph and the peer group companies in the second graph are weighted according to the stock market capitalizations of the companies at January 1 of each year. The comparisons assume the investment of $100 on December 31, 2007 in our common stock and in each index, and that dividends were reinvested when paid.
Fortune 50 Group
The
Fortune 50
Group consists of the following companies: American International Group, Inc., Berkshire Hathaway Inc., Cardinal Health, Inc., Citigroup Inc., General Electric Company, International Business Machines Corporation and Johnson & Johnson. Although there are differences in terms of size and industry, like UnitedHealth Group, all of these companies are large multi-segment companies using a well-defined operating model in one or more broad sectors of the economy.
COMPARISON OF 5 YEAR CUMULATIVE TOTAL RETURN
Among UnitedHealth Group, the S&P 500 Index,
and Fortune 50 Group
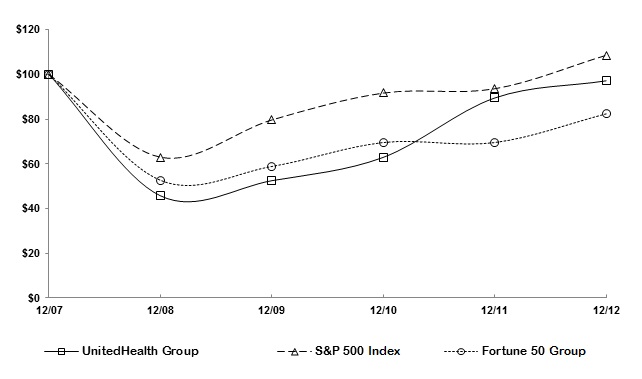
|
12/07
|
12/08
|
12/09
|
12/10
|
12/11
|
12/12
|
||||||||||||||||||
|
UnitedHealth Group
|
$
|
100.00
|
|
$
|
45.74
|
|
$
|
52.49
|
|
$
|
62.93
|
|
$
|
89.48
|
|
$
|
97.17
|
|
|||||
|
S&P 500 Index
|
100.00
|
|
63.00
|
|
79.67
|
|
91.67
|
|
93.61
|
|
108.59
|
|
|||||||||||
|
Fortune 50 Group
|
100.00
|
|
52.66
|
|
58.88
|
|
69.57
|
|
69.55
|
|
82.41
|
|
|||||||||||
The stock price performance included in this graph is not necessarily indicative of future stock price performance.
29
Peer Group
The companies included in our peer group are Aetna Inc., Cigna Corporation, Coventry Health Care, Inc., Humana Inc. and WellPoint, Inc. We believe that this peer group reflects publicly traded peers to our UnitedHealthcare businesses.
COMPARISON OF 5 YEAR CUMULATIVE TOTAL RETURN
Among UnitedHealth Group, the S&P 500 Index,
and a Peer Group

|
12/07
|
12/08
|
12/09
|
12/10
|
12/11
|
12/12
|
||||||||||||||||||
|
UnitedHealth Group
|
$
|
100.00
|
|
$
|
45.74
|
|
$
|
52.49
|
|
$
|
62.93
|
|
$
|
89.48
|
|
$
|
97.17
|
|
|||||
|
S&P 500 Index
|
100.00
|
|
63.00
|
79.67
|
91.67
|
93.61
|
108.59
|
||||||||||||||||
|
Peer Group
|
100.00
|
|
44.58
|
|
60.73
|
|
62.11
|
|
80.06
|
|
83.33
|
|
|||||||||||
The stock price performance included in this graph is not necessarily indicative of future stock price performance.
30
|
ITEM 6.
|
SELECTED FINANCIAL DATA
|
FINANCIAL HIGHLIGHTS
|
For the Year Ended December 31,
|
||||||||||||||||||||
|
(In millions, except percentages and per share data)
|
2012
|
2011
|
2010
|
2009
|
2008
|
|||||||||||||||
|
Consolidated operating results
|
||||||||||||||||||||
|
Revenues
|
$
|
110,618
|
|
$
|
101,862
|
|
$
|
94,155
|
|
$
|
87,138
|
|
$
|
81,186
|
|
|||||
|
Earnings from operations
|
9,254
|
|
8,464
|
|
7,864
|
|
6,359
|
|
5,263
|
|
||||||||||
|
Net earnings
|
5,526
|
|
5,142
|
|
4,634
|
|
3,822
|
|
2,977
|
|
||||||||||
|
Return on shareholders’ equity (a)
|
18.7
|
%
|
18.9
|
%
|
18.7
|
%
|
17.3
|
%
|
14.9
|
%
|
||||||||||
|
Basic earnings per share attributable to UnitedHealth Group common shareholders
|
$
|
5.38
|
|
$
|
4.81
|
|
$
|
4.14
|
|
$
|
3.27
|
|
$
|
2.45
|
|
|||||
|
Diluted earnings per share attributable to UnitedHealth Group common shareholders
|
5.28
|
|
4.73
|
|
4.10
|
|
3.24
|
|
2.40
|
|
||||||||||
|
Cash dividends declared per common share
|
0.8000
|
|
0.6125
|
|
0.4050
|
|
0.0300
|
|
0.0300
|
|
||||||||||
|
Consolidated cash flows from (used for)
|
||||||||||||||||||||
|
Operating activities
|
$
|
7,155
|
|
$
|
6,968
|
|
$
|
6,273
|
|
$
|
5,625
|
|
$
|
4,238
|
|
|||||
|
Investing activities
|
(8,649
|
)
|
(4,172
|
)
|
(5,339
|
)
|
(976
|
)
|
(5,072
|
)
|
||||||||||
|
Financing activities
|
471
|
|
(2,490
|
)
|
(1,611
|
)
|
(2,275
|
)
|
(605
|
)
|
||||||||||
|
Consolidated financial condition
|
||||||||||||||||||||
|
(As of December 31)
|
||||||||||||||||||||
|
Cash and investments
|
$
|
29,148
|
|
$
|
28,172
|
|
$
|
25,902
|
|
$
|
24,350
|
|
$
|
21,575
|
|
|||||
|
Total assets
|
80,885
|
|
67,889
|
|
63,063
|
|
59,045
|
|
55,815
|
|
||||||||||
|
Total commercial paper and long-term debt
|
16,754
|
|
11,638
|
|
11,142
|
|
11,173
|
|
12,794
|
|
||||||||||
|
Shareholders’ equity
|
31,178
|
|
28,292
|
|
25,825
|
|
23,606
|
|
20,780
|
|
||||||||||
|
Debt to debt-plus-equity ratio
|
35.0
|
%
|
29.1
|
%
|
30.1
|
%
|
32.1
|
%
|
38.1
|
%
|
||||||||||
|
(a)
|
Return on equity is calculated as net earnings divided by average equity. Average equity is calculated using the equity balance at the end of the preceding year and the equity balances at the end of the four quarters of the year presented.
|
Financial Highlights should be read with the accompanying Management’s Discussion and Analysis of Financial Condition and Results of Operations in Item 7 and the Consolidated Financial Statements and Notes to the Consolidated Financial Statements included in Item 8, “Financial Statements.”
31
|
ITEM 7.
|
MANAGEMENT’S DISCUSSION AND ANALYSIS OF FINANCIAL CONDITION AND RESULTS OF OPERATIONS
|
The following discussion should be read together with the accompanying Consolidated Financial Statements and Notes to the Consolidated Financial Statements thereto. Readers are cautioned that the statements, estimates, projections or outlook contained in this report, including discussions regarding financial prospects, economic conditions, trends and uncertainties contained in this Item 7, may constitute forward-looking statements within the meaning of the PSLRA. These forward-looking statements involve risks and uncertainties that may cause our actual results to differ materially from the results discussed in the forward-looking statements. A description of some of the risks and uncertainties can be found further below in this Item 7 and in Item 1A, “Risk Factors.”
EXECUTIVE OVERVIEW
General
UnitedHealth Group is a diversified health and well-being company dedicated to helping people live healthier lives and making health care work better. We offer a broad spectrum of products and services through two distinct platforms: UnitedHealthcare, which provides health care coverage and benefits services; and Optum, which provides information and technology-enabled health services. Further information on our business is included in Item 1, “Business” and additional information on the our segments can be found in this Item 7 and in Note 13 to the Consolidated Financial Statements in Item 8, “Financial Statements.”
Revenues
Our revenues are primarily comprised of premiums derived from risk-based health insurance arrangements in which the premium is typically at a fixed rate per individual served for a one-year period, and we assume the economic risk of funding our customers’ health care benefits and related administrative costs. We also generate revenues from fee-based services performed for customers that self-insure the health care costs of their employees and employees’ dependants. For both risk-based and fee-based health care benefit arrangements, we provide coordination and facilitation of medical services; transaction processing; health care professional services; and access to contracted networks of physicians, hospitals and other health care professionals. We also generate service revenues from our Optum businesses relating to care management, consumer engagement and support, distribution of benefits and services, health financial services, operational services and support, health care information technology and pharmacy services. Product revenues are mainly comprised of products sold by our pharmacy benefit management business. We derive investment income primarily from interest earned on our investments in debt securities; investment income also includes gains or losses when investment securities are sold, or other-than-temporarily impaired.
Pricing Trends
. We seek to price our products consistent with anticipated underlying medical trends, while balancing growth, margins, competitive dynamics, cost increases for the industry fees and tax provisions of Health Reform Legislation and premium rebates at the local market level. We endeavor to sustain a commercial medical care ratio in a stable range for an equivalent mix of business. Changes in business mix and Health Reform Legislation may impact our premiums, medical costs and medical care ratio. Further, we continue to expect premium rates to be under pressure through continued market competition in commercial products and government payment rates. Aggregating UnitedHealthcare’s businesses, we expect the medical care ratio to rise over time as we continue to grow in the senior and public markets and participate in the health benefit exchange market in 2014.
In the commercial market segment, we expect pricing to continue to be highly competitive in 2013. We plan to hold to our pricing disciplines and, considering the competitive environment and persistently weak employment and new business formation rates, we expect continued pressure on our commercial risk-based product membership in 2013. Additionally, self-insured membership as a percent of total commercial membership is expected to continue to increase at a modest pace in 2013 and beyond, due in part to the emerging popularity of midsize employers moving to self-funded arrangements.
In government programs, we are seeing continuing rate pressures, and rate changes for some Medicaid programs are slightly negative. Unlike in prior years, recent Medicaid reductions have generally not been mitigated by corresponding benefit reductions or care provider fee schedule reductions by the state sponsor. We continue to take a prudent, market-sustainable posture for both new bids and maintenance of existing Medicaid contracts. Medicare funding is similarly pressured; see further discussion below in “Regulatory Trends and Uncertainties.” We expect these factors to result in pressure on gross margin percentages for our Medicare and Medicaid programs in 2013.
In 2013, UnitedHealthcare created a new affordable “Basic Plan” for Medicare Part D consumers and reclassified its large 4 million member Medicare Part D plan to an “Enhanced Plan” status with CMS. The change to Enhanced Plan status changes the seasonal pattern of earnings to later in the year with no material impact expected on full year profitability.
32
Operating Costs
Medical Costs.
Medical costs represent the costs of our obligations for claims and/or benefits of our risk-based insurance arrangements. Our operating results depend in large part on our ability to effectively estimate, price for and manage our medical costs through underwriting criteria, product design, negotiation of favorable care provider contracts and care coordination programs. Controlling medical costs requires a comprehensive and integrated approach to organize and advance the full range of interrelationships among patients/consumers, health professionals, hospitals, pharmaceutical/technology manufacturers and other key stakeholders.
Medical costs include estimates of our obligations for medical care services rendered on behalf of insured consumers for which we have not yet received or processed claims, and our estimates for physician, hospital and other medical cost disputes. In every reporting period, our operating results include the effects of more completely developed medical costs payable estimates associated with previously reported periods.
Our medical care ratio, calculated as medical costs as a percentage of premium revenues, reflects the combination of pricing, rebates, benefit designs, consumer health care utilization and comprehensive care facilitation efforts.
Medical Cost Trends.
In 2012, we managed our commercial medical cost trend to a level under 5.5 percent. In 2013, we expect a slight increase in trend from 2012, albeit with relatively consistent unit cost and utilization trends compared to 2012. We expect our total trend will be driven primarily by continued unit cost pressure from health care providers as they try to compensate for soft utilization trends and cross-subsidization pressure due to their government reimbursement levels.
Underlying utilization trends declined significantly in 2010 and increased modestly in 2011 and 2012. Use of outpatient services has been the primary driver of utilization trend increase, with inpatient utilization declining. We also experienced an increase in prescription drug costs in 2012 and expect that trend to continue due to unit cost pressure and a trend towards expensive new specialty drugs. As we move into 2013, we believe current utilization trends are slightly below what we believe to be normal utilization levels. The weak economic environment, combined with our medical cost management, has had a favorable impact on utilization trends. We believe our alignment of progressive benefit designs, consumer engagement, clinical management, pay-for-performance reimbursement programs for care providers and network resources is favorably controlling medical and pharmacy costs, enhancing affordability and quality for our customers and members and helping to drive strong market response and growth.
Operating Costs.
Operating costs are primarily comprised of costs related to employee compensation and benefits, agent and broker commissions, premium taxes and assessments, professional fees, advertising and occupancy costs. We seek to improve our operating cost ratio, calculated as operating costs as a percentage of total revenues, for an equivalent mix of business. However, changes in business mix, such as increases in the size of our health services businesses or an increase in the delivery of medical services on an integrated basis may impact our operating costs and operating cost ratio.
Other Business Trends
Our businesses participate in the U.S., Brazilian and certain other health economies. In the U.S., health care spending comprises approximately 18% of gross domestic product and has grown consistently for many years. We expect overall spending on health care to continue to grow in the future, due to inflation, medical technology and pharmaceutical advancement, regulatory requirements, demographic trends in the population and national interest in health and well-being. The rate of market growth may be affected by a variety of factors, including macro-economic conditions and regulatory changes, including in the U.S. enacted health care reforms, which could also impact our results of operations.
Delivery System and Payment Modernization.
The market is changing based on demographic shifts, new regulations, political forces and both payer and patient expectations. These factors are creating market pressures to change from fee-for-service models to new delivery models focused on the holistic health of the consumer, integrated care across care providers and pay-for-performance payment structures. Health plans and care providers are being called upon to work together to close gaps in care and improve the overall care for people, improve the health of a population and reduce the cost of care. The focus on delivery system modernization and payment reform is critical and the alignment of incentives between key constituents remains an important theme. We have seen increased participation in incentive-based payment models such as pay for performance, shared savings, bundled/episode payment and Patient-Centered Medical Home models (PCMHs). We also have seen continued development and deployment of risk-based accountable care models designed to modernize local delivery systems by better coordinating care, reducing the fragmentation of treatments between multiple care providers in the current system, limiting unnecessary hospital admissions and readmissions, focusing on preventive care, breaking down reimbursement and treatment “silos,” and improving quality and outcomes.
33
This trend is creating the need for health management services that can coordinate care around the primary care physician and for investment in new clinical and administrative information and management systems, providing growth opportunities for our Optum business platform.
Government Reliance on Private Sector.
The government, as a benefit sponsor, has been increasingly relying on private sector solutions. We expect this trend to continue as we believe the private sector provides a more flexible, better managed, higher quality health care experience than do traditional passive indemnity programs typically used in governmental benefit programs.
States are struggling to balance unprecedented budget pressures with increases in their Medicaid expenditures. At the same time, many are expanding their interest in managed care with particular emphasis on consumers who have complex and expensive health care needs. More and more, Medicaid managed care is being viewed as an effective method to improve quality and manage costs. Additionally, there are more than nine million individuals eligible for both Medicare and Medicaid. Dually eligible beneficiaries typically have complex conditions with costs of care that are far higher than a typical Medicare or Medicaid beneficiary. While these individuals’ health needs are more complex and more costly, they have historically been in unmanaged environments. This provides UnitedHealthcare an opportunity to integrate Medicare and Medicaid financing to fund efforts to optimize the health status of this frail population through close coordination of care. As of December 31, 2012, UnitedHealthcare served more than 250,000 members in legacy dually eligible programs through Medicare Advantage and SNPs. In 2013, UnitedHealthcare Community & State will help implement Ohio’s MME program, one of the first in the country under the new CMS design.
Regulatory Trends and Uncertainties
Following is a summary of management’s view of the trends and uncertainties related to some of the key provisions of the Health Reform Legislation and other regulatory items; for additional information regarding the Health Reform Legislation and Regulatory Trends and Uncertainties, see Item 1, “Business - Government Regulation” and Item 1A, “Risk Factors.”
Commercial Rate Increase Review.
The Health Reform Legislation requires HHS to maintain an annual review of “unreasonable” increases in premium rates for commercial health plans. HHS established a review threshold of annual premium rate increases generally at or above 10% and clarified that HHS review will not supersede existing state review and approval procedures. Premium rate review legislation (ranging from new or enhanced rate filing requirements to prior approval requirements) has been introduced or passed in more than half of the states as of the date of this report.
The competitive forces common in our markets do not support unjustifiable rate increases. We have experienced and expect to continue to experience a tight, competitive commercial pricing environment. Further, our rates and rate filings are developed using methods consistent with the standards of actuarial practices. We anticipate requesting rate increases above 10% in a number of markets due to the combination of medical cost trends and the incremental costs of health care reform. We have begun to experience greater regulatory challenges to appropriate premium rate increases in several states, including California and New York. Depending on the level of scrutiny by the states, there is a broad range of potential business impacts. For example, it may become more difficult to price our commercial risk business consistent with expected underlying cost trends, leading to the risk of operating margin compression in the commercial health benefits business.
Medicare Advantage Rates and Minimum Loss Ratios.
Medicare Advantage pricing benchmarks have been cut over the last several years and additional cuts were implemented in 2012, with changes to continue to be phased in over the next one to five years (benchmarks will ultimately range from 95% of Medicare fee-for-service rates in high cost areas to 115% in low cost areas), depending on the level of benchmark reduction in a county. Additionally, Congress passed the Budget Control Act of 2011, which as amended by the American Taxpayer Relief Act of 2012, would trigger automatic across-the-board budget cuts (sequestration), including a reduction in outlays for Medicare starting in March 2013, absent further Congressional action. Further, beginning in 2014, Medicare Advantage plans will be required to have a minimum medical loss ratio of 85%. CMS has not yet issued guidance as to how this requirement will be calculated for Medicare Advantage plans.
A significant portion of our network contracts are tied to Medicare reimbursement levels. However, future Medicare Advantage rates may be outpaced by underlying medical cost trends, placing continued importance on effective medical management and ongoing improvements in administrative costs. There are a number of annual adjustments we can and are making to our operations, which may partially offset any impact from these rate reductions. For example, we seek to intensify our medical and operating cost management, adjust members’ benefits and decide on a county-by-county basis in which geographies to participate. Additionally, achieving high quality scores from CMS for improving upon certain clinical and operational performance standards will impact future quality bonuses that may offset these anticipated rate reductions. The expanded stars bonus program is set to expire in 2014. In 2015, quality bonus payments will only be paid to 4 and 5 star plans per PPACA (compared to current bonuses that are available to certain qualifying plans rated 3 stars or higher). Approximately 60% and 10% of our current Medicare Advantage members are enrolled in plans that will be rated 3.5 stars or higher and 4 stars or
34
higher, respectively for the 2014 payment year based on scoring released by CMS in October 2012. Updated scores, to be released in October 2013, will determine what portion of our Medicare Advantage membership will reside in a 4 star or 5 star plan and qualify for quality bonus payments in 2015. Although we are dedicating substantial resources to improving our quality scores and star ratings, if we are unable to significantly increase the level of membership in plans with a rating of 4 stars or higher for the 2015 payment year, our 2015 results of operations and cash flows could be adversely impacted.
We also may be able to mitigate the effects of reduced funding by increasing enrollment due, in part, to the increasing number of people eligible for Medicare in coming years. Compared to 2011, our 2012 Medicare Advantage membership has increased by
400,000
consumers, or
18%
, including acquisitions. Longer term, market wide decreases in the availability or relative quality of Medicare Advantage products may increase demand for other senior health benefits products such as our Medicare Supplement and Medicare Part D insurance offerings.
Industry Fees and Taxes.
The Health Reform Legislation includes an annual, non-deductible insurance industry tax to be levied proportionally across the insurance industry for risk-based products, beginning January 1, 2014. The amount of the annual tax is $8 billion in 2014, $11.3 billion in 2015 and 2016, $13.9 billion in 2017 and $14.3 billion in 2018. For 2019 and beyond, the amount will be equal to the annual tax for the preceding year increased by the rate of premium growth for the preceding year. The annual tax will be allocated based on the ratio of an entity’s net premiums written during the preceding calendar year to the total health insurance industry’s net premiums written for any U.S. health risk-based products during the preceding calendar year, subject to certain exceptions. This tax will first be paid and expensed in 2014; however, because our policies are annual, we have included the tax and other Health Reform Legislation cost factors in our 2013 rate filings relating to 2014 rate periods and any related premium increases for 2013 policies that have coverage into 2014 will increase the amount of premium recognized in 2013. Our effective income tax rate will increase significantly in 2014 as a result of the non-deductibility of these taxes.
With the introduction of state health insurance exchanges in 2014, the Health Reform Legislation includes three programs designed to stabilize the health insurance markets. These programs are: a transitional reinsurance program; a temporary risk corridors program; and a permanent risk adjustment program. The transitional reinsurance program is a temporary program which will be funded on a per capita basis from all commercial lines of business including insured and self-funded arrangements ($25 billion over a three-year period beginning in 2014 of which $20 billion (subject to increases based on state decisions) will fund the state reinsurance pools and $5 billion funds the U.S. Treasury). The terms of the specific reinsurance programs to be used in each state are not yet known.
It is our intention to pass these taxes and fees on to customers through increases in rates and/or decreases in benefits, subject to regulatory approval.
State-Based Exchanges and Coverage Expansion.
Effective in 2014, state-based exchanges are required to be established for individuals and small employers with enrollment processes scheduled to commence in October of 2013. We expect to selectively respond and participate in exchanges as they are introduced to the market. Our level of participation in state-based exchanges will be driven by how we assess each local market’s current and future prospects, including how the exchange and its rules are set up state-by-state and, our market position relative to others in the market. Our participation will likely evolve and change over time as the exchange markets mature. Exchanges will create new market dynamics that could impact our existing businesses, depending on the ultimate member migration patterns for each market, its pace and its impact on our established membership. For example, certain small employers may no longer offer health benefits to their employees and larger employers may elect to convert their benefit plans from risk-based to self-funded programs.
The Health Reform Legislation also provides for expanded Medicaid coverage effective in January 2014. These measures remain subject to implementation at the state level.
Individual & Small Group Market Reforms.
The Health Reform Legislation includes several provisions that will take effect on January 1, 2014 and are expected to alter the individual and small group marketplace. Although HHS issued proposed regulations in late 2012, these regulations are not yet final. Key provisions include: (1) adjusted community rating requirements, which will change how individual and small group plans are rated in many states and are expected to result in significant adjustments in some policyholders’ rates during the transition period; (2) essential health benefit requirements, which will result in benefit changes for many individual and small group policyholders and will also impact rates; and (3) actuarial value requirements, which will significantly impact benefit designs (e.g. member cost sharing requirements) and could also significantly impact rates for some policyholders.
35
RESULTS SUMMARY
|
For the Years Ended December 31,
|
Increase/(Decrease)
|
Increase/(Decrease)
|
||||||||||||||||||||||||
|
(in millions, except percentages and per share data)
|
2012
|
2011
|
2010
|
2012 vs. 2011
|
2011 vs. 2010
|
|||||||||||||||||||||
|
Revenues:
|
||||||||||||||||||||||||||
|
Premiums
|
$
|
99,728
|
|
$
|
91,983
|
|
$
|
85,405
|
|
$
|
7,745
|
|
8
|
%
|
$
|
6,578
|
|
8
|
%
|
|||||||
|
Services
|
7,437
|
|
6,613
|
|
5,819
|
|
824
|
|
12
|
|
794
|
|
14
|
|
||||||||||||
|
Products
|
2,773
|
|
2,612
|
|
2,322
|
|
161
|
|
6
|
|
290
|
|
12
|
|
||||||||||||
|
Investment and other income
|
680
|
|
654
|
|
609
|
|
26
|
|
4
|
|
45
|
|
7
|
|
||||||||||||
|
Total revenues
|
110,618
|
|
101,862
|
|
94,155
|
|
8,756
|
|
9
|
|
7,707
|
|
8
|
|
||||||||||||
|
Operating costs:
|
|
|
||||||||||||||||||||||||
|
Medical costs
|
80,226
|
|
74,332
|
|
68,841
|
|
5,894
|
|
8
|
|
5,491
|
|
8
|
|
||||||||||||
|
Operating costs
|
17,306
|
|
15,557
|
|
14,270
|
|
1,749
|
|
11
|
|
1,287
|
|
9
|
|
||||||||||||
|
Cost of products sold
|
2,523
|
|
2,385
|
|
2,116
|
|
138
|
|
6
|
|
269
|
|
13
|
|
||||||||||||
|
Depreciation and amortization
|
1,309
|
|
1,124
|
|
1,064
|
|
185
|
|
16
|
|
60
|
|
6
|
|
||||||||||||
|
Total operating costs
|
101,364
|
|
93,398
|
|
86,291
|
|
7,966
|
|
9
|
|
7,107
|
|
8
|
|
||||||||||||
|
Earnings from operations
|
9,254
|
|
8,464
|
|
7,864
|
|
790
|
|
9
|
|
600
|
|
8
|
|
||||||||||||
|
Interest expense
|
(632
|
)
|
(505
|
)
|
(481
|
)
|
127
|
|
25
|
|
24
|
|
5
|
|
||||||||||||
|
Earnings before income taxes
|
8,622
|
|
7,959
|
|
7,383
|
|
663
|
|
8
|
|
576
|
|
8
|
|
||||||||||||
|
Provision for income taxes
|
(3,096
|
)
|
(2,817
|
)
|
(2,749
|
)
|
279
|
|
10
|
|
68
|
|
2
|
|
||||||||||||
|
Net earnings
|
$
|
5,526
|
|
$
|
5,142
|
|
$
|
4,634
|
|
$
|
384
|
|
7
|
%
|
$
|
508
|
|
11
|
%
|
|||||||
|
Diluted earnings per share attributable to UnitedHealth Group common shareholders
|
$
|
5.28
|
|
$
|
4.73
|
|
$
|
4.10
|
|
$
|
0.55
|
|
12
|
%
|
$
|
0.63
|
|
15
|
%
|
|||||||
|
Medical care ratio (a)
|
80.4
|
%
|
80.8
|
%
|
80.6
|
%
|
(0.4
|
)%
|
0.2
|
%
|
||||||||||||||||
|
Operating cost ratio
|
15.6
|
|
15.3
|
|
15.2
|
|
0.3
|
|
0.1
|
|
||||||||||||||||
|
Operating margin
|
8.4
|
|
8.3
|
|
8.4
|
|
0.1
|
|
(0.1
|
)
|
||||||||||||||||
|
Tax rate
|
35.9
|
|
35.4
|
|
37.2
|
|
0.5
|
|
(1.8
|
)
|
||||||||||||||||
|
Net margin
|
5.0
|
|
5.0
|
|
4.9
|
|
—
|
|
0.1
|
|
||||||||||||||||
|
Return on equity (b)
|
18.7
|
%
|
18.9
|
%
|
18.7
|
%
|
(0.2
|
)%
|
0.2
|
%
|
||||||||||||||||
|
(a)
|
Medical care ratio is calculated as medical costs divided by premium revenue.
|
|
(b)
|
Return on equity is calculated as net earnings divided by average equity. Average equity is calculated using the equity balance at the end of the preceding year and the equity balances at the end of the four quarters of the year presented.
|
36
SELECTED OPERATING PERFORMANCE AND OTHER SIGNIFICANT ITEMS
The following represents a summary of select 2012 year-over-year operating comparisons to 2011 and other 2012 significant items.
|
•
|
Consolidated revenues increased
9%
and UnitedHealthcare revenues increased
8%
.
|
|
•
|
UnitedHealthcare medical enrollment grew by
6.4 million
people, including
4.4 million
people served in Brazil as a result of the Amil acquisition; Medicare Part D stand-alone membership decreased by
0.6 million
people.
|
|
•
|
The consolidated medical care ratio of
80.4%
decreased 40 basis points.
|
|
•
|
Earnings from operations increased
8%
at UnitedHealthcare and
14%
at Optum.
|
|
•
|
Net earnings of
$5.5 billion
and diluted earnings per share of
$5.28
increased
7%
and
12%
, respectively.
|
|
•
|
$1.1 billion
in cash was held by non-regulated entities as of
December 31, 2012
.
|
|
•
|
2012 debt offerings amounted to $4 billion, including the August debt exchange.
|
|
•
|
Cash paid for acquisitions in 2012, net of cash assumed, totaled $6.5 billion, including the fourth quarter acquisition of approximately 65% of the outstanding shares of Amil. We also plan to acquire an additional 25% of Amil in the first half of 2013. See Note 6 of Notes to the Consolidated Financial Statements included in Item 8, “Financial Statements” for further detail on Amil.
|
|
•
|
We repurchased 57 million shares for $3.1 billion and paid dividends of $0.8 billion.
|
2012 RESULTS OF OPERATIONS COMPARED TO 2011 RESULTS
C
onsolidated Financial Results
Revenues
Revenue increases in
2012
were driven by growth in the number of individuals served and premium rate increases related to underlying medical cost trends in our UnitedHealthcare businesses and growth in our Optum health service and technology offerings.
Medical Costs
Medical costs increased in
2012
due to risk-based membership growth in our public and senior markets businesses, unit cost inflation across all businesses and continued moderate increases in health system use, partially offset by an increase in favorable medical reserve development. Unit cost increases represented the primary driver of our medical cost trend, with the largest contributor being price increases to hospitals.
Operating Costs
The increases in our operating costs for
2012
were due to business growth, including increases in revenues from UnitedHealthcare fee-based benefits and Optum services, which carry comparatively higher operating costs, as well as investments in the OptumRx pharmacy management services and UnitedHealthcare Military & Veterans businesses.
Income Tax Rate
The increase in our effective income tax rate for
2012
was due to the favorable resolution of various tax matters in 2011, which lowered the
2011
effective income tax rate.
Reportable Segments
We have four reportable segments across our two business platforms, UnitedHealthcare and Optum:
|
•
|
UnitedHealthcare, which includes UnitedHealthcare Employer & Individual, UnitedHealthcare Medicare & Retirement, UnitedHealthcare Community & State, and UnitedHealthcare International;
|
|
•
|
OptumHealth;
|
|
•
|
OptumInsight; and
|
|
•
|
OptumRx.
|
See Note 13 of Notes to the Consolidated Financial Statements included in Item 8, “Financial Statements” and Item 1, “Business” for a description of how each of our reportable segments derives its revenues.
Transactions between reportable segments principally consist of sales of pharmacy benefit products and services to UnitedHealthcare customers by OptumRx, certain product offerings and care management and integrated care delivery services sold to UnitedHealthcare by OptumHealth, and health information and technology solutions, consulting and other services sold to UnitedHealthcare by OptumInsight. These transactions are recorded at management’s estimate of fair value. Intersegment transactions are eliminated in consolidation.
37
The following table presents reportable segment financial information:
|
|
For the Years Ended December 31,
|
Increase/(Decrease)
|
Increase/(Decrease)
|
|||||||||||||||||||||||
|
(in millions, except percentages)
|
2012
|
2011
|
2010
|
2012 vs. 2011
|
2011 vs. 2010
|
|||||||||||||||||||||
|
Revenues
|
||||||||||||||||||||||||||
|
UnitedHealthcare
|
$
|
103,419
|
|
$
|
95,336
|
|
$
|
88,730
|
|
$
|
8,083
|
|
8
|
%
|
$
|
6,606
|
|
7
|
%
|
|||||||
|
OptumHealth
|
8,147
|
|
6,704
|
|
4,565
|
|
1,443
|
|
22
|
|
2,139
|
|
47
|
|
||||||||||||
|
OptumInsight
|
2,882
|
|
2,671
|
|
2,342
|
|
211
|
|
8
|
|
329
|
|
14
|
|
||||||||||||
|
OptumRx
|
18,359
|
|
19,278
|
|
16,724
|
|
(919
|
)
|
(5
|
)
|
2,554
|
|
15
|
|
||||||||||||
|
Total Optum
|
29,388
|
|
28,653
|
|
23,631
|
|
735
|
|
3
|
|
5,022
|
|
21
|
|
||||||||||||
|
Eliminations
|
(22,189
|
)
|
(22,127
|
)
|
(18,206
|
)
|
62
|
|
—
|
|
3,921
|
|
22
|
|
||||||||||||
|
Consolidated revenues
|
$
|
110,618
|
|
$
|
101,862
|
|
$
|
94,155
|
|
$
|
8,756
|
|
9
|
%
|
$
|
7,707
|
|
8
|
%
|
|||||||
|
Earnings from operations
|
||||||||||||||||||||||||||
|
UnitedHealthcare
|
$
|
7,815
|
|
$
|
7,203
|
|
$
|
6,740
|
|
$
|
612
|
|
8
|
%
|
$
|
463
|
|
7
|
%
|
|||||||
|
OptumHealth
|
561
|
|
423
|
|
511
|
|
138
|
|
33
|
|
(88
|
)
|
(17
|
)
|
||||||||||||
|
OptumInsight
|
485
|
|
381
|
|
84
|
|
104
|
|
27
|
|
297
|
|
354
|
|
||||||||||||
|
OptumRx
|
393
|
|
457
|
|
529
|
|
(64
|
)
|
(14
|
)
|
(72
|
)
|
(14
|
)
|
||||||||||||
|
Total Optum
|
1,439
|
|
1,261
|
|
1,124
|
|
178
|
|
14
|
|
137
|
|
12
|
|
||||||||||||
|
Consolidated earnings from operations
|
$
|
9,254
|
|
$
|
8,464
|
|
$
|
7,864
|
|
$
|
790
|
|
9
|
%
|
$
|
600
|
|
8
|
%
|
|||||||
|
Operating margin
|
||||||||||||||||||||||||||
|
UnitedHealthcare
|
7.6
|
%
|
7.6
|
%
|
7.6
|
%
|
—
|
%
|
—
|
%
|
||||||||||||||||
|
OptumHealth
|
6.9
|
|
6.3
|
|
11.2
|
|
0.6
|
|
(4.9
|
)
|
||||||||||||||||
|
OptumInsight
|
16.8
|
|
14.3
|
|
3.6
|
|
2.5
|
|
10.7
|
|
||||||||||||||||
|
OptumRx
|
2.1
|
|
2.4
|
|
3.2
|
|
(0.3
|
)
|
(0.8
|
)
|
||||||||||||||||
|
Total Optum
|
4.9
|
|
4.4
|
|
4.8
|
|
0.5
|
|
(0.4
|
)
|
||||||||||||||||
|
Consolidated operating margin
|
8.4
|
%
|
8.3
|
%
|
8.4
|
%
|
0.1
|
%
|
(0.1
|
)%
|
||||||||||||||||
UnitedHealthcare
The following table summarizes UnitedHealthcare revenue by business:
|
|
For the Years Ended December 31,
|
Increase/(Decrease)
|
Increase/(Decrease)
|
|||||||||||||||||||||||
|
(in millions, except percentages)
|
2012
|
2011
|
2010
|
2012 vs. 2011
|
2011 vs. 2010
|
|||||||||||||||||||||
|
UnitedHealthcare Employer & Individual
|
$
|
46,596
|
|
$
|
45,404
|
|
$
|
42,550
|
|
$
|
1,192
|
|
3
|
%
|
$
|
2,854
|
|
7
|
%
|
|||||||
|
UnitedHealthcare Medicare & Retirement
(a)
|
39,257
|
|
34,933
|
|
33,018
|
|
4,324
|
|
12
|
|
1,915
|
|
6
|
|
||||||||||||
|
UnitedHealthcare Community & State
(a)
|
16,422
|
|
14,954
|
|
13,123
|
|
1,468
|
|
10
|
|
1,831
|
|
14
|
|
||||||||||||
|
UnitedHealthcare International
|
1,144
|
|
45
|
|
39
|
|
1,099
|
|
nm
|
|
6
|
|
15
|
|
||||||||||||
|
Total UnitedHealthcare revenue
|
$
|
103,419
|
|
$
|
95,336
|
|
$
|
88,730
|
|
$
|
8,083
|
|
8
|
%
|
$
|
6,606
|
|
7
|
%
|
|||||||
nm= not meaningful
|
(a)
|
In the fourth quarter of 2012, UnitedHealthcare reclassified 75,000 dually eligible enrollees to UnitedHealthcare Community & State from UnitedHealthcare Medicare & Retirement to better reflect how these members are served. Earlier periods presented have been conformed to reflect this change.
|
38
The following table summarizes the number of individuals served by our UnitedHealthcare businesses, by major market segment and funding arrangement:
|
|
December 31,
|
Increase/(Decrease)
|
Increase/(Decrease)
|
||||||||||||||||||
|
(in thousands, except percentages)
|
2012
|
2011
|
2010
|
2012 vs. 2011
|
2011 vs. 2010
|
||||||||||||||||
|
Commercial risk-based
|
9,340
|
|
9,550
|
|
9,405
|
|
(210
|
)
|
(2
|
)%
|
145
|
|
2
|
%
|
|||||||
|
Commercial fee-based
|
17,585
|
|
16,320
|
|
15,405
|
|
1,265
|
|
8
|
|
915
|
|
6
|
|
|||||||
|
Total commercial
|
26,925
|
|
25,870
|
|
24,810
|
|
1,055
|
|
4
|
|
1,060
|
|
4
|
|
|||||||
|
Medicare Advantage
(a)
|
2,565
|
|
2,165
|
|
2,005
|
|
400
|
|
18
|
|
160
|
|
8
|
|
|||||||
|
Medicaid
(a)
|
3,830
|
|
3,600
|
|
3,385
|
|
230
|
|
6
|
|
215
|
|
6
|
|
|||||||
|
Medicare Supplement (Standardized)
|
3,180
|
|
2,935
|
|
2,770
|
|
245
|
|
8
|
|
165
|
|
6
|
|
|||||||
|
Total public and senior
|
9,575
|
|
8,700
|
|
8,160
|
|
875
|
|
10
|
|
540
|
|
7
|
|
|||||||
|
International
|
4,425
|
|
—
|
|
—
|
|
4,425
|
|
nm
|
|
—
|
|
—
|
|
|||||||
|
Total UnitedHealthcare - medical
|
40,925
|
|
34,570
|
|
32,970
|
|
6,355
|
|
18
|
%
|
1,600
|
|
5
|
%
|
|||||||
|
Supplemental Data:
|
|
|
|||||||||||||||||||
|
Medicare Part D stand-alone
|
4,225
|
|
4,855
|
|
4,530
|
|
(630
|
)
|
(13
|
)%
|
325
|
|
7
|
%
|
|||||||
nm= not meaningful
|
(a)
|
Earlier periods presented above have been recast such that all periods presented reflect the dually eligible enrollment change from Medicare Advantage to Medicaid discussed above.
|
Commercial risk-based membership decreased in 2012 due to a competitive market environment, conversions to fee-based products by large public sector clients that we retained and other decreases in the public sector. In fee-based commercial products, the increase was due to a number of new business awards and strong customer retention. Medicare Advantage increased due to strengthened execution in product design, marketing and local engagement, which drove sales growth, combined with the addition of 185,000 Medicare Advantage members from 2012 acquisitions. Medicaid growth was due to a combination of winning new state accounts and growth within existing state customers, partially offset by a fourth quarter market withdrawal from one product in a specific region, affecting 175,000 beneficiaries. Medicare Supplement growth was due to strong retention and new sales. In our Medicare Part D stand-alone business, membership decreased primarily as a result of the first quarter 2012 loss of approximately 470,000 auto-assigned low-income subsidy Medicare Part D beneficiaries, due to pricing benchmarks for the government-subsidized low income Medicare Part D market coming in below our bids in a number of regions. International represents commercial membership in Brazil added as a result of the Amil acquisition in 2012.
UnitedHealthcare’s revenue growth in
2012
was primarily due to growth in the number of individuals served, commercial premium rate increases related to expected increases in underlying medical cost trends and the impact of lower premium rebates.
UnitedHealthcare’s earnings from operations for
2012
increased compared to the prior year primarily due to the factors that increased revenues combined with an improvement in the medical care ratio driven by effective management of medical costs and increased favorable medical reserve development. The favorable development for
2012
was driven by lower than expected health system utilization levels and increased efficiency in claims handling and processing.
In March 2012, UnitedHealthcare Military & Veterans was awarded the TRICARE West Region Managed Care Support Contract. The contract, for health care operations, includes a transition period and five one-year renewals at the government’s option. The first year of operations is anticipated to begin April 1, 2013. The base administrative services contract is expected to generate a total of $1.4 billion in revenues over the five years.
Optum.
Total revenues increased in
2012
due to business growth and 2011 acquisitions at OptumHealth, partially offset by a reduction in pharmacy service revenues related to reduced levels of UnitedHealthcare Part D prescription drug membership and related prescription volumes.
Optum’s earnings from operations and operating margin for
2012
increased compared to 2011 due to improvements in operating cost structure stemming from advances in business simplification, integration and overall efficiency and revenue growth in higher margin products.
39
The results by segment were as follows:
OptumHealth
Revenue increases at OptumHealth for
2012
were primarily due to market expansion, including growth related to 2011 acquisitions in integrated care delivery, and strong overall business growth.
Earnings from operations for
2012
and operating margins increased compared to 2011 primarily due to gains in operating efficiency and cost management as well as increases in earnings from integrated care operations.
OptumInsight
Revenues at OptumInsight for
2012
increased primarily due to the impact of growth in compliance services for care providers and payment integrity offerings for commercial payers, which was partially offset by the June 2011 divestiture of the clinical trials services business.
The increases in earnings from operations and operating margins for
2012
reflect an improved mix of services and advances in operating efficiency and cost management.
OptumRx
The decreases in OptumRx revenues in
2012
were due to the reduction in UnitedHealthcare Medicare Part D plan participants. Intersegment revenues eliminated in consolidation were
$15.6 billion
for
2012
and
$16.7 billion
for
2011
.
OptumRx earnings from operations and operating margins for
2012
decreased primarily due to decreased prescription volume in the Medicare Part D business and investments to support growth initiatives, which were partially offset by earnings contributions from specialty pharmacy growth and greater use of generic medications.
Over the course of 2013, we will consolidate and manage our commercial pharmacy benefit programs from Express Scripts’ subsidiary, Medco Health Solutions, Inc. As a result of this transition, OptumRx expects to add approximately12 million members throughout 2013.
2011 RESULTS OF OPERATIONS COMPARED TO 2010 RESULTS
Consolidated Financial Results
Revenues
The increases in revenues for
2011
were driven by strong organic growth in the number of individuals served in our UnitedHealthcare businesses, commercial premium rate increases reflecting underlying medical cost trends and revenue growth across all Optum businesses.
Medical Costs
Medical costs for
2011
increased due to risk-based membership growth in our commercial and public and senior markets businesses and continued increases in the cost per service paid for health system use, and a modest increase in health system utilization, mainly in outpatient and physician office settings.
For each period, our operating results include the effects of revisions in medical cost estimates related to prior periods. Changes in medical cost estimates related to prior periods, resulting from more complete claim information identified in the current period, are included in total medical costs reported for the current period. For
2011
and
2010
there was
$720 million
and
$800 million
, respectively, of net favorable medical cost development related to prior fiscal years. The favorable development in both periods was primarily driven by continued improvements in claims submission timeliness, which resulted in higher completion factors and lower than expected health system utilization levels. The favorable development in 2010 also benefited from a reduction in reserves needed for disputed claims from care providers; and favorable resolution of certain state-based assessments.
Operating Costs
The increase in our operating costs for
2011
was due to business growth, including an increased mix of Optum and UnitedHealthcare fee-based and service revenues, which have higher operating costs, and increased spending related to reform readiness and compliance. These factors were partially offset by overall operating cost management and the increase in 2010 operating costs due to the goodwill impairment and charges for a business line disposition of certain i3-branded clinical trial service businesses.
40
Income Tax Rate
The effective income tax rate for
2011
decreased compared to the prior year due to favorable resolution of various historical tax matters in the current year as well as a higher effective income tax rate in 2010, due to the cumulative implementation of certain changes under the Health Reform Legislation.
Reportable Segments
UnitedHealthcare
UnitedHealthcare’s revenue growth for
2011
was due to growth in the number of individuals served across our businesses and commercial premium rate increases reflecting expected underlying medical cost trends.
UnitedHealthcare’s earnings from operations for
2011
increased compared to the prior year as revenue growth and improvements in the operating cost ratio more than offset increased compliance costs and an increase to the medical care ratio, which was primarily due to the initiation of premium rebate obligations in 2011, and lower favorable reserve development levels.
Optum.
Total revenue for these businesses increased in 2011 due to business growth and acquisitions at OptumHealth and OptumInsight and growth in customers served through pharmaceutical benefit management programs at OptumRx.
Optum’s operating margin for
2011
was down compared to 2010. The decrease was due to changes in business mix within Optum’s businesses and realignment of certain internal business arrangements.
The results by segment were as follows:
OptumHealth
Increased revenues at OptumHealth for
2011
were primarily due to expansions in service offerings through acquisitions in clinical services, as well as growth in consumer and population health management offerings.
Earnings from operations for
2011
and operating margin decreased compared to 2010. The decreases reflect the impact from internal business and service arrangement realignments and the mix effect of growth and expansion in newer businesses such as clinical services.
OptumInsight
Increased revenues at OptumInsight for
2011
were due to the impact of organic growth and the full-year impact of 2010 acquisitions, which were partially offset by the divestiture of the clinical trials services business in June 2011.
The increases in earnings from operations and operating margins for
2011
reflect an increased mix of higher margin services in 2011 as well as the effect on 2010 earnings from operations and operating margin of the goodwill impairment and charges for a business line disposition of certain i3-branded clinical trial service businesses.
OptumRx
The increase in OptumRx revenues for
2011
was due to increased prescription volumes, primarily due to growth in customers served through Medicare Part D prescription drug plans by our UnitedHealthcare Medicare & Retirement business, and a favorable mix of higher revenue specialty drug prescriptions. Intersegment revenues eliminated in consolidation were
$16.7 billion
and
$14.4 billion
for
2011
and
2010
, respectively.
OptumRx earnings from operations and operating margins for
2011
decreased as the mix of lower margin specialty pharmaceuticals and Medicaid business and investments to support growth initiatives including the in-sourcing of our commercial pharmacy benefit programs more than offset the earnings contribution from higher revenues and greater use of generic medications.
LIQUIDITY, FINANCIAL CONDITION AND CAPITAL RESOURCES
Liquidity
Introduction
We manage our liquidity and financial position in the context of our overall business strategy. We continually forecast and manage our cash, investments, working capital balances and capital structure to meet the short- and long-term obligations of our businesses while seeking to maintain liquidity and financial flexibility. Cash flows generated from operating activities are principally from earnings before non-cash expenses.
41
Our regulated subsidiaries generate significant cash flows from operations and are subject to financial regulations and standards in their respective jurisdictions. These standards, among other things, require these subsidiaries to maintain specified levels of statutory capital, as defined by each jurisdiction, and restrict the timing and amount of dividends and other distributions that may be paid to their parent companies. In the United States, most of these regulations and standards are generally consistent with model regulations established by the NAIC. Except in the case of extraordinary dividends, these standards generally permit dividends to be paid from statutory unassigned surplus of the regulated subsidiary and are limited based on the regulated subsidiary’s level of statutory net income and statutory capital and surplus. These dividends are referred to as “ordinary dividends” and generally can be paid without prior regulatory approval. If the dividend, together with other dividends paid within the preceding twelve months, exceeds a specified statutory limit or is paid from sources other than earned surplus, the entire dividend is generally considered an “extraordinary dividend” and must receive prior regulatory approval. In 2012, based on the 2011 statutory net income and statutory capital and surplus levels, the maximum amount of ordinary dividends which could be paid by our U.S. regulated subsidiaries to their parent companies was
$4.6 billion
.
In
2012
, our regulated subsidiaries paid their parent companies dividends of
$4.9 billion
, including
$1.2 billion
of extraordinary dividends. In
2011
, our regulated subsidiaries paid their parent companies dividends of
$4.5 billion
, including
$1.1 billion
of extraordinary dividends.
Our non-regulated businesses also generate cash flows from operations for general corporate use. Cash flows generated by these entities, combined with dividends from our regulated entities and financing through the issuance of long term debt as well as issuance of commercial paper or drawings under our committed credit facility, further strengthen our operating and financial flexibility. We use these cash flows to expand our businesses through acquisitions, reinvest in our businesses through capital expenditures, repay debt, and return capital to our shareholders through shareholder dividends and/or repurchases of our common stock, depending on market conditions.
Summary of our Major Sources and Uses of Cash
|
|
For the Years Ended December 31,
|
Increase/(Decrease)
|
Increase/(Decrease)
|
|||||||||||||||||
|
(in millions)
|
2012
|
2011
|
2010
|
2012 vs. 2011
|
2011 vs. 2010
|
|||||||||||||||
|
Sources of cash:
|
||||||||||||||||||||
|
Cash provided by operating activities
|
$
|
7,155
|
|
$
|
6,968
|
|
$
|
6,273
|
|
$
|
187
|
|
$
|
695
|
|
|||||
|
Proceeds from issuances of long-term debt and commercial paper, net of repayments
|
4,567
|
|
346
|
|
94
|
|
4,221
|
|
252
|
|
||||||||||
|
Proceeds from common stock issuances
|
1,078
|
|
381
|
|
272
|
|
697
|
|
109
|
|
||||||||||
|
Net proceeds from customer funds administered
|
—
|
|
37
|
|
974
|
|
(37
|
)
|
(937
|
)
|
||||||||||
|
Other
|
—
|
|
391
|
|
20
|
|
(391
|
)
|
371
|
|
||||||||||
|
Total sources of cash
|
12,800
|
|
8,123
|
|
7,633
|
|
|
|
|
|
||||||||||
|
Uses of cash:
|
||||||||||||||||||||
|
Cash paid for acquisitions, net of cash assumed and dispositions
|
(6,280
|
)
|
(1,459
|
)
|
(2,304
|
)
|
(4,821
|
)
|
845
|
|
||||||||||
|
Common stock repurchases
|
(3,084
|
)
|
(2,994
|
)
|
(2,517
|
)
|
(90
|
)
|
(477
|
)
|
||||||||||
|
Purchases of investments, net of sales and maturities
|
(1,299
|
)
|
(1,695
|
)
|
(2,157
|
)
|
396
|
|
462
|
|
||||||||||
|
Purchases of property, equipment and capitalized software, net of dispositions
|
(1,070
|
)
|
(1,018
|
)
|
(878
|
)
|
(52
|
)
|
(140
|
)
|
||||||||||
|
Cash dividends paid
|
(820
|
)
|
(651
|
)
|
(449
|
)
|
(169
|
)
|
(202
|
)
|
||||||||||
|
Net cash paid for customer funds administered
|
(324
|
)
|
—
|
|
—
|
|
(324
|
)
|
—
|
|
||||||||||
|
Acquisition of noncontrolling interest shares
|
(319
|
)
|
—
|
|
—
|
|
(319
|
)
|
—
|
|
||||||||||
|
Other
|
(627
|
)
|
—
|
|
(5
|
)
|
(627
|
)
|
5
|
|
||||||||||
|
Total uses of cash
|
(13,823
|
)
|
(7,817
|
)
|
(8,310
|
)
|
|
|
|
|
||||||||||
|
Net (decrease) increase in cash
|
$
|
(1,023
|
)
|
$
|
306
|
|
$
|
(677
|
)
|
$
|
(1,329
|
)
|
$
|
983
|
|
|||||
2012 Cash Flows Compared to 2011 Cash Flows
Cash flows from operating activities for
2012
increased
$187 million
, or
3%
from 2011 due to increased net income and related tax accruals, which were partially offset by the payment in 2012 of 2011 premium rebate obligations as 2012 was the first year rebate payments were made under the Health Reform Legislation.
42
Cash flows used for investing activities increased
$4.5 billion
, or
107%
, primarily due to increased investments in acquisitions in 2012. See Note 6 of Notes to the Consolidated Financial Statements included in Item 8, “Financial Statements” for further information on 2012 acquisitions.
Cash flows from financing activities increased
$3.0 billion
primarily due to increases in long-term debt, commercial paper and common stock issuances, partially offset by increases in cash paid for customer funds related to Part D and increased shareholder dividend payments. The increases in long-term debt, commercial paper and common stock issuances were primarily related to the Amil acquisition.
2011 Cash Flows Compared to 2010 Cash Flows
Cash flows from operating activities increased
$695 million
, or
11%
, from 2010. The increase was primarily driven by growth in net earnings and changes in various working capital accounts, which were partially offset by a reduction in unearned revenues due to the early receipt of certain 2011 state Medicaid premium payments in 2010, which increased 2010 cash from operating activities.
Cash flows used for investing activities decreased
$1.2 billion
, or
22%
, primarily due to relatively lower investments in acquisitions in 2011 and a decrease in net purchases of investments.
Cash flows used for financing activities increased
$879 million
, or
55%
, primarily due to increased share repurchases and cash dividends in 2011, partially offset by an increase in net borrowings.
Financial Condition
As of
December 31, 2012
, our cash, cash equivalent and available-for-sale investment balances of
$28.3 billion
included
$8.4 billion
of cash and cash equivalents (of which
$1.1 billion
was held by non-regulated entities),
$19.2 billion
of debt securities and
$677 million
of investments in equity securities and venture capital funds. Given the significant portion of our portfolio held in cash equivalents, we do not anticipate fluctuations in the aggregate fair value of our financial assets to have a material impact on our liquidity or capital position. The use of different market assumptions or valuation methodologies, especially those used in valuing our
$241 million
of available-for-sale Level 3 securities (those securities priced using significant unobservable inputs), may have an effect on the estimated fair value amounts of our investments. Due to the subjective nature of these assumptions, the estimates may not be indicative of the actual exit price if we had sold the investment at the measurement date. Other sources of liquidity, primarily from operating cash flows and our commercial paper program, which is supported by our bank credit facilities, reduce the need to sell investments during adverse market conditions. See Note 4 of Notes to the Consolidated Financial Statements included in Item 8, “Financial Statements” for further detail of our fair value measurements.
Our cash equivalent and investment portfolio had a weighted-average duration of 2.1 years and a weighted-average credit rating of “AA” as of
December 31, 2012
. Included in the debt securities balance was $1.9 billion of state and municipal obligations that are guaranteed by a number of third parties. Due to the high underlying credit ratings of the issuers, the weighted-average credit rating of these securities with and without the guarantee was “AA” as of
December 31, 2012
. We do not have any significant exposure to any single guarantor (neither indirect through the guarantees, nor direct through investment in the guarantor). When multiple credit ratings are available for an individual security, the average of the available ratings is used to determine the weighted-average credit rating.
Capital Resources and Uses of Liquidity
In addition to cash flow from operations and cash and cash equivalent balances available for general corporate use, our capital resources and uses of liquidity are as follows:
Commercial Paper.
We maintain a commercial paper borrowing program, which facilitates the private placement of unsecured debt through third-party broker-dealers. The commercial paper program is supported by the bank credit facilities described below. As of
December 31, 2012
, we had
$1.6 billion
of commercial paper outstanding at a weighted-average annual interest rate of
0.3%
.
Bank Credit Facilities
.
We have
$3.0 billion
five-year and $1.0 billion 364-day revolving bank credit facilities with
21
banks, which mature in
November 2017
and November 2013, respectively. These facilities provide liquidity support for our $4.0 billion commercial paper program and are available for general corporate purposes. There were no amounts outstanding under these facilities as of
December 31, 2012
. The interest rates on borrowings are variable depending on term and are calculated based on the LIBOR plus a credit spread based on our senior unsecured credit ratings. As of
December 31, 2012
, the annual interest rates on these facilities, had they been drawn, would have ranged from
1.0%
to
1.3%
.
Our bank credit facilities contain various covenants, including requiring us to maintain a debt to debt-plus-equity ratio of not more than 50%. Our debt to debt-plus-equity ratio, calculated as the sum of debt divided by the sum of debt and shareholders’
43
equity, which reasonably approximates the actual covenant ratio, was
35.0%
as of
December 31, 2012
. We were in compliance with our debt covenants as of
December 31, 2012
.
In connection with the Amil acquisition, we assumed variable rate debt denominated in Brazilian Reais, Amil’s functional currency. The total Brazilian Real denominated long-term debt outstanding at December 31, 2012 was
$611 million
, and had an aggregate weighted average interest rate of approximately 9%. For more detail on the Amil debt see Note 8 of Notes to the Consolidated Financial Statements included in Item 8, “Financial Statements.”
In October 2012, we issued
$2.5 billion
in senior unsecured notes, which included:
$625 million
of
0.850%
fixed-rate notes due
October 2015
,
$625 million
of
1.400%
fixed-rate notes due
October 2017
,
$625 million
of
2.750%
fixed-rate notes due
February 2023
and
$625 million
of
3.950%
fixed-rate notes due
October 2042
.
In August 2012, we completed an exchange of
$1.1 billion
of our zero coupon senior unsecured notes due November 2022 for
$0.5 billion
additional issuance of our
2.875%
notes due in
March 2022
,
$0.1 billion
additional issuance of our
4.375%
notes due
March 2042
and
$0.1 billion
in cash. The transaction was undertaken to increase financial flexibility and reduce interest expense.
In
March 2012
, we issued
$1.0 billion
in senior unsecured notes. The issuance included
$600 million
of
2.875%
fixed-rate notes due
March 2022
and
$400 million
of
4.375%
fixed-rate notes due
March 2042
.
Credit Ratings.
Our credit ratings at
December 31, 2012
were as follows:
|
|
Moody’s
|
|
Standard & Poor’s
|
|
Fitch
|
|
A.M. Best
|
||||||||
|
|
Ratings
|
|
Outlook
|
|
Ratings
|
|
Outlook
|
|
Ratings
|
|
Outlook
|
|
Ratings
|
|
Outlook
|
|
Senior unsecured debt
|
A3
|
|
Negative
|
|
A
|
|
Stable
|
|
A-
|
|
Stable
|
|
bbb+
|
|
Stable
|
|
Commercial paper
|
P-2
|
|
n/a
|
|
A-1
|
|
n/a
|
|
F1
|
|
n/a
|
|
AMB-2
|
|
n/a
|
The availability of financing in the form of debt or equity is influenced by many factors, including our profitability, operating cash flows, debt levels, credit ratings, debt covenants and other contractual restrictions, regulatory requirements and economic and market conditions. For example, a significant downgrade in our credit ratings or conditions in the capital markets may increase the cost of borrowing for us or limit our access to capital. We have adopted strategies and actions toward maintaining financial flexibility to mitigate the impact of such factors on our ability to raise capital.
Share Repurchase Program.
Under our Board of Directors’ authorization, we maintain a share repurchase program. Repurchases may be made from time to time in open market purchases or other types of transactions (including prepaid or structured share repurchase programs), subject to certain Board restrictions. In
June 2012
, our Board renewed and expanded our share repurchase program with an authorization to repurchase up to
110 million
shares of our common stock. As of
December 31, 2012
, we had Board authorization to purchase up to an additional
85 million
shares of our common stock. For details of our 2012 share repurchases, see Note 10 of Notes to the Consolidated Financial Statements included in Item 8, “Financial Statements.”
Dividends.
In
June 2012
, our Board of Directors increased our cash dividend to shareholders to an annual dividend rate of
$0.85
per share, paid quarterly. Since
May 2011
, we had paid an annual dividend of
$0.65
per share, paid quarterly. Declaration and payment of future quarterly dividends is at the discretion of the Board and may be adjusted as business needs or market conditions change. For details of our dividend payments, see Note 10 of Notes to the Consolidated Financial Statements included in Item 8, “Financial Statements.”
Amil Tender Offer.
During the fourth quarter of 2012, we purchased approximately 65% of the outstanding shares of Amil for $3.5 billion. We expect to acquire an additional 25% ownership interest during the first half of 2013 through a tender offer for Amil’s publicly traded shares. The tender offer price will be at the same price paid to Amil’s controlling shareholders, adjusted for statutory interest under Brazilian law from the date of payment to the controlling shareholders to the date of payment to the tendering minority shareholders.
44
CONTRACTUAL OBLIGATIONS AND COMMITMENTS
The following table summarizes future obligations due by period as of
December 31, 2012
, under our various contractual obligations and commitments:
|
(in millions)
|
2013
|
2014 to 2015
|
2016 to 2017
|
Thereafter
|
Total
|
|||||||||||||||
|
Debt (a)
|
$
|
3,413
|
|
$
|
3,271
|
|
$
|
3,384
|
|
$
|
16,769
|
|
$
|
26,837
|
|
|||||
|
Operating leases
|
380
|
|
676
|
|
510
|
|
556
|
|
2,122
|
|
||||||||||
|
Purchase obligations (b)
|
137
|
|
184
|
|
7
|
|
—
|
|
328
|
|
||||||||||
|
Future policy benefits (c)
|
135
|
|
256
|
|
265
|
|
1,923
|
|
2,579
|
|
||||||||||
|
Unrecognized tax benefits (d)
|
11
|
|
—
|
|
—
|
|
60
|
|
71
|
|
||||||||||
|
Other liabilities recorded on the Consolidated Balance Sheet (e)
|
89
|
|
18
|
|
6
|
|
1,511
|
|
1,624
|
|
||||||||||
|
Other obligations (f)
|
50
|
|
144
|
|
60
|
|
43
|
|
297
|
|
||||||||||
|
Redeemable noncontrolling interests (g)
|
1,393
|
|
182
|
|
546
|
|
—
|
|
2,121
|
|
||||||||||
|
Total contractual obligations
|
$
|
5,608
|
|
$
|
4,731
|
|
$
|
4,778
|
|
$
|
20,862
|
|
$
|
35,979
|
|
|||||
|
(a)
|
Includes interest coupon payments and maturities at par or put values. For variable rate debt, the rates in effect at December 31, 2012 were used to calculate the interest coupon payments. The table also assumes amounts are outstanding through their contractual term. See Note 8 of Notes to the Consolidated Financial Statements included in Item 8, "Financial Statements" for more detail.
|
|
(b)
|
Includes fixed or minimum commitments under existing purchase obligations for goods and services, including agreements that are cancelable with the payment of an early termination penalty. Excludes agreements that are cancelable without penalty and excludes liabilities to the extent recorded in our Consolidated Balance Sheets as of
December 31, 2012
.
|
|
(c)
|
Future policy benefits represent account balances that accrue to the benefit of the policyholders, excluding surrender charges, for universal life and investment annuity products and for long-duration health policies sold to individuals for which some of the premium received in the earlier years is intended to pay benefits to be incurred in future years. See Note 2 of Notes to the Consolidated Financial Statements included in Item 8, "Financial Statements" for more detail.
|
|
(d)
|
As the timing of future settlements is uncertain, the long-term portion has been classified as “Thereafter.”
|
|
(e)
|
Includes obligations associated with contingent consideration and other payments related to business acquisitions, certain employee benefit programs, charitable contributions related to the PacifiCare acquisition and various other long-term liabilities. Due to uncertainty regarding payment timing, obligations for employee benefit programs, charitable contributions and other liabilities have been classified as “Thereafter.”
|
|
(f)
|
Includes remaining capital commitments for venture capital funds and other funding commitments.
|
|
(g)
|
Includes commitments to purchase the remaining publicly traded Amil shares as well as the put/call for the shares owned by Amil's remaining non-public shareholders. See Note 6 of Notes to the Consolidated Financial Statements included in Item 8, "Financial Statements" for more detail.
|
We do not have other significant contractual obligations or commitments that require cash resources; however, we continually evaluate opportunities to expand our operations. This includes internal development of new products, programs and technology applications, and may include acquisitions.
OFF-BALANCE SHEET ARRANGEMENTS
As of December 31, 2012, we were not involved in any off-balance sheet arrangements (as that phrase is defined by SEC rules applicable to this report) which have or are reasonably likely to have a material adverse effect on our financial condition, results of operations or liquidity.
RECENTLY ISSUED ACCOUNTING STANDARDS
We have determined that there have been no recently issued, but not yet adopted, accounting standards that will have a material impact on our Consolidated Financial Statements.
CRITICAL ACCOUNTING ESTIMATES
Critical accounting estimates are those estimates that require management to make challenging, subjective or complex judgments, often because they must estimate the effects of matters that are inherently uncertain and may change in subsequent
45
periods. Critical accounting estimates involve judgments and uncertainties that are sufficiently sensitive and may result in materially different results under different assumptions and conditions.
Medical Costs Payable
Each reporting period, we estimate our obligations for medical care services that have been rendered on behalf of insured consumers but for which claims have either not yet been received or processed and for liabilities for physician, hospital and other medical cost disputes. We develop estimates for medical care services incurred but not reported using an actuarial process that is consistently applied, centrally controlled and automated. The actuarial models consider factors such as time from date of service to claim receipt, claim processing backlogs, seasonal variances in medical care consumption, health care professional contract rate changes, medical care utilization and other medical cost trends, membership volume and demographics, the introduction of new technologies, benefit plan changes, and business mix changes related to products, customers and geography. Depending on the health care professional and type of service, the typical billing lag for services can be up to 90 days from the date of service. Substantially all claims related to medical care services are known and settled within nine to twelve months from the date of service. As of December 31, 2012, our days outstanding in medical payables was 49 days.
Each period, we re-examine previously established medical costs payable estimates based on actual claim submissions and other changes in facts and circumstances. As more complete claim information becomes available, we adjust the amount of the estimates and include the changes in estimates in medical costs in the period in which the change is identified. In every reporting period, our operating results include the effects of more completely developed medical costs payable estimates associated with previously reported periods. If the revised estimate of prior period medical costs is less than the previous estimate, we will decrease reported medical costs in the current period (favorable development). If the revised estimate of prior period medical costs is more than the previous estimate, we will increase reported medical costs in the current period (unfavorable development). Medical costs in
2012
,
2011
, and
2010
included favorable medical cost development related to prior years of
$860 million
,
$720 million
and
$800 million
, respectively.
In developing our medical costs payable estimates, we apply different estimation methods depending on the month for which incurred claims are being estimated. For example, we actuarially calculate completion factors using an analysis of claim adjudication patterns over the most recent 36-month period. A completion factor is an actuarial estimate, based upon historical experience and analysis of current trends, of the percentage of incurred claims during a given period that have been adjudicated by us at the date of estimation. For months prior to the most recent three months, we apply the completion factors to actual claims adjudicated-to-date to estimate the expected amount of ultimate incurred claims for those months. For the most recent three months, we estimate claim costs incurred primarily by applying observed medical cost trend factors to the average per member per month (PMPM) medical costs incurred in prior months for which more complete claim data is available, supplemented by a review of near-term completion factors. This approach is consistently applied from period to period.
Completion Factors.
Completion factors are the most significant factors we use in developing our medical costs payable estimates for older periods, generally periods prior to the most recent three months. The completion factor includes judgments in relation to claim submissions such as the time from date of service to claim receipt, claim inventory levels and claim processing backlogs as well as other factors. If actual claims submission rates from providers (which can be influenced by a number of factors including provider mix and electronic versus manual submissions) or our claim processing patterns are different than estimated, our reserves may be significantly impacted.
The following table illustrates the sensitivity of these factors and the estimated potential impact on our medical costs payable estimates for those periods as of
December 31, 2012
:
|
Completion Factors
Increase (Decrease) in Factors
|
Increase (Decrease)
In Medical Costs Payable
|
|||
|
(in millions)
|
||||
|
(0.75)%
|
$
|
261
|
|
|
|
(0.50)
|
173
|
|
||
|
(0.25)
|
87
|
|
||
|
0.25
|
(86
|
)
|
||
|
0.50
|
(172
|
)
|
||
|
0.75
|
(257
|
)
|
||
Medical cost PMPM trend factors.
Medical cost PMPM trend factors are significant factors we use in developing our medical costs payable estimates for the most recent three months. Medical cost trend factors are developed through a comprehensive analysis of claims incurred in prior months, provider contracting and expected unit costs, benefit design, and by reviewing a
46
broad set of health care utilization indicators including, but not limited to, pharmacy utilization trends, inpatient hospital census data and incidence data from the National Centers for Disease Control. We also consider macroeconomic variables such as gross-domestic product growth, employment and disposable income. A large number of factors can cause the medical cost trend to vary from our estimates including: our ability and practices to manage medical costs, changes in level and mix of services utilized, mix of benefits offered including the impact of co-pays and deductibles, changes in medical practices, catastrophes and epidemics.
The following table illustrates the sensitivity of these factors and the estimated potential impact on our medical costs payable estimates for the most recent three months as of
December 31, 2012
:
|
Medical Costs PMPM Trend
Increase (Decrease) in Factors
|
Increase (Decrease)
In Medical Costs Payable
|
|||
|
(in millions)
|
||||
|
3%
|
$
|
505
|
|
|
|
2
|
337
|
|
||
|
1
|
168
|
|
||
|
(1)
|
(168
|
)
|
||
|
(2)
|
(337
|
)
|
||
|
(3)
|
(505
|
)
|
||
The analyses above include outcomes that are considered reasonably likely based on our historical experience estimating liabilities for incurred but not reported benefit claims.
Our estimate of medical costs payable represents management’s best estimate of our liability for unpaid medical costs as of
December 31, 2012
, developed using consistently applied actuarial methods. Management believes the amount of medical costs payable is reasonable and adequate to cover our liability for unpaid claims as of
December 31, 2012
; however, actual claim payments may differ from established estimates as discussed above. Assuming a hypothetical 1% difference between our
December 31, 2012
estimates of medical costs payable and actual medical costs payable, excluding AARP Medicare Supplement Insurance and any potential offsetting impact from premium rebates,
2012
net earnings would have increased or decreased by $62 million.
Revenues
Revenues are principally derived from health care insurance premiums. We recognize premium revenues in the period eligible individuals are entitled to receive health care services. Customers are typically billed monthly at a contracted rate per eligible person multiplied by the total number of people eligible to receive services, as recorded in our records.
Effective in 2011, U.S. commercial health plans with medical loss ratios on fully insured products, as calculated under the definitions in the Health Reform Legislation, that fall below certain targets are required to rebate ratable portions of their premiums to their customers annually. Premium revenues are recognized based on the estimated premiums earned net of projected rebates because we are able to reasonably estimate the ultimate premiums of these contracts. Each period, we estimate premium rebates based on the expected financial performance of the applicable contracts within each defined aggregation set (e.g., by state, group size and licensed subsidiary). The most significant factors in estimating the financial performance are current and future premiums and medical claim experience, effective tax rates and expected changes in business mix. The estimated ultimate premium is revised each period to reflect current and projected experience.
Our Medicare Advantage and Part D premium revenues are subject to periodic adjustment under CMS’ risk adjustment payment methodology. The CMS risk adjustment model provides higher per member payments for enrollees diagnosed with certain conditions and lower payments for enrollees who are healthier. We and health care providers collect, capture, and submit available diagnosis data to CMS within prescribed deadlines. CMS uses submitted diagnosis codes, demographic information, and special statuses to determine the risk score for most Medicare Advantage beneficiaries. CMS also retroactively adjusts risk scores during the year based on additional data. We estimate risk adjustment revenues based upon the data submitted and expected to be submitted to CMS. As a result of the variability of factors that determine such estimations, the actual amount of CMS’ retroactive payments could be materially more or less than our estimates. This may result in favorable or unfavorable adjustments to our Medicare premium revenue and, accordingly, our profitability. Risk adjustment data for certain of our plans is subject to review by the government, including audit by regulators. See Note 12 of Notes to the Consolidated Financial Statements included in Item 8, “Financial Statements” for additional information regarding these audits.
47
Goodwill and Intangible Assets
Goodwill.
Goodwill represents the amount of the purchase price in excess of the fair values assigned to the underlying identifiable net assets of acquired businesses. Goodwill is not amortized, but is subject to an annual impairment test. Tests are performed more frequently if events occur or circumstances change that would more likely than not reduce the fair value of the reporting unit below its carrying amount.
To determine whether goodwill is impaired, we perform a multi-step impairment test. First, we can elect to perform a qualitative assessment of each reporting unit to determine whether facts and circumstances support a determination that their fair values are greater than their carrying values. If the qualitative analysis is not conclusive, or if we elect to proceed directly with quantitative testing, we will then measure the fair values of the reporting units and compare them to their aggregate carrying values, including goodwill. If the fair value is less than the carrying value of the reporting unit, then the implied value of goodwill would be calculated and compared to the carrying amount of goodwill to determine whether goodwill is impaired.
We estimate the fair values of our reporting units using discounted cash flows, which include assumptions about a wide variety of internal and external factors. Significant assumptions used in the impairment analysis include financial projections of free cash flow (including significant assumptions about operations, capital requirements and income taxes), long-term growth rates for determining terminal value beyond the discretely forecasted periods, and discount rates. For each reporting unit, comparative market multiples are used to corroborate the results of our discounted cash flow test.
Forecasts and long-term growth rates used for our reporting units are consistent with, and use inputs from, our internal long-term business plan and strategy. Key assumptions used in these forecasts include:
|
•
|
Revenue trends.
Key drivers for each reporting unit are determined and assessed. Significant factors include: membership growth, medical trends, and the impact and expectations of regulatory environments. Additional macro-economic assumptions around unemployment, GDP growth, interest rates, and inflation are also evaluated and incorporated.
|
|
•
|
Medical cost trends.
See further discussion of medical costs trends within Medical Costs above. Similar factors are considered in estimating our long-term medical trends at the reporting unit level.
|
|
•
|
Operating productivity.
We forecast expected operating cost levels based on historical levels and expectations of future operating cost productivity initiatives.
|
|
•
|
Capital levels.
The capital structure and requirements for each business is considered.
|
Although we believe that the financial projections used are reasonable and appropriate for all of our reporting units, due to the long-term nature of the forecasts there is significant uncertainty inherent in those projections. That uncertainty is increased by the impact of health care reforms as discussed in Item 1, “Business - Government Regulation”. For additional discussions regarding how the enactment or implementation of health care reforms and how other factors could affect our business and the related long-term forecasts, see Item 1A, “Risk Factors” in Part I and “Regulatory Trends and Uncertainties” above.
Discount rates are determined for each reporting unit and include consideration of the implied risk inherent in their forecasts. This risk is evaluated using comparisons to market information such as peer company weighted average costs of capital and peer company stock prices in the form of revenue and earnings multiples. Beyond our selection of the most appropriate risk-free rates and equity risk premiums, our most significant estimates in the discount rate determinations involve our adjustments to the peer company weighted average costs of capital that reflect reporting unit-specific factors. Such adjustments include the addition of size premiums and company-specific risk premiums intended to compensate for apparent forecast risk. We have not made any adjustments to decrease a discount rate below the calculated peer company weighted average cost of capital for any reporting unit. Company-specific adjustments to discount rates are subjective and thus are difficult to measure with certainty.
The passage of time and the availability of additional information regarding areas of uncertainty in regards to the reporting units’ operations could cause these assumptions to change in the future.
We elected to bypass the optional qualitative reporting unit fair value assessment and completed our annual quantitative tests for goodwill impairment as of January 1, 2013. All of our reporting units had fair values substantially in excess of their carrying values, thus we concluded that there was no need for any impairment of our goodwill balances as of
December 31, 2012
.
Intangible assets.
Separately-identifiable intangible assets are acquired in business combinations and are assets that represent future expected benefits but lack physical substance (e.g., membership lists, customer contracts, trademarks and technology). Our intangible assets are initially recorded at their fair values. Finite-lived intangible assets are amortized over their expected useful lives, while indefinite-lived intangible assets are evaluated for impairment on at least an annual basis. Both finite-lived and indefinite-lived intangible assets are evaluated for impairment between annual periods if an event occurs or circumstances change that may indicate impairment. Our most significant intangible assets are customer-related intangibles, which represent
77%
of our total intangible asset balance of
$4.7 billion
.
48
Customer-related intangible assets acquired in business combinations are typically valued using an income approach based on discounted future cash flows attributable to customers that exist as of the date of acquisition. The most significant assumptions used in the valuation of customer-related assets include: projected revenue and earnings growth, retention rate, perpetuity growth rate and discount rate. These initial valuations and the embedded assumptions contain uncertainty to the extent that those assumptions and estimates may ultimately differ from actual results (e.g., customer turnover may be higher or lower than the assumed retention rate suggested).
Our finite-lived intangible assets are subject to impairment tests when events or circumstances indicate that an asset’s (or asset group’s) carrying value may exceed its estimated fair value. Consideration is given on a quarterly basis to a number of potential impairment indicators including: changes in the use of the assets, changes in legal or other business factors that could affect value, experienced or expected operating cash-flow deterioration or losses, adverse changes in customer populations, adverse competitive or technological advances that could impact value, and other factors. Following the identification of any potential impairment indicators, we would calculate the estimated fair value of a finite-lived intangible asset (or asset group) using the undiscounted cash flows that are expected to result from the use of the asset or related group of assets. If it is determined that an impairment exists, the amount by which the carrying value exceeds its estimated fair value would be recorded as an impairment.
Our indefinite-lived intangible assets are tested for impairment on an annual basis, or more frequently if impairment indicators exist. To determine if an indefinite-lived intangible asset is impaired, we assess qualitative factors to determine whether the existence of events and circumstances indicate that it is more likely than not that the indefinite-lived intangible asset’s carrying value exceeds its fair value. If, after assessing the totality of events and circumstances, we conclude that it is not more likely than not that the indefinite-lived intangible asset’s carrying value exceeds its fair value, no impairment exists and no further testing is performed. If we conclude otherwise, we would perform a quantitative analysis by comparing its estimated fair value to its carrying value. If the carrying value exceeds its estimated fair value, an impairment would be recorded for the amount by which the carrying value exceeds its estimated fair value.
Intangible assets were not impaired in
2012
.
Investments
As of
December 31, 2012
, we had investments with a carrying value of
$21 billion
, primarily held in marketable debt securities. Our investments are principally classified as available-for-sale and are recorded at fair value. We exclude gross unrealized gains and losses on available-for-sale investments from earnings and report net unrealized gains or losses, net of income tax effects, as a separate component in shareholders’ equity. We continually monitor the difference between the cost and fair value of our investments. As of
December 31, 2012
, our investments had gross unrealized gains of
$825 million
and gross unrealized losses of
$9 million
.
For debt securities, if we intend to either sell or determine that we will be more likely than not be required to sell the security before recovery of the entire amortized cost basis or maturity of the security, we recognize the entire impairment in earnings. If we do not intend to sell the debt security and we determine that we will not be more likely than not be required to sell the debt security but we do not expect to recover the entire amortized cost basis, the impairment is bifurcated into the amount attributed to the credit loss, which is recognized in earnings, and all other causes, which are recognized in other comprehensive income.
For equity securities, we recognize impairments in other comprehensive income if we expect to hold the equity security until fair value increases to at least the equity security’s cost basis and we expect that increase in fair value to occur in a reasonably forecasted period. If we intend to sell the equity security or if we believe that recovery of fair value to cost will not occur in the near term, we recognize the impairment in our income statement.
The most significant judgments and estimates related to investments are related to determination of their fair values and the other-than-temporary impairment assessment.
49
Fair values.
Fair values of available-for-sale debt and equity securities are based on quoted market prices, where available. We obtain one price for each security primarily from a third-party pricing service (pricing service), which generally uses quoted or other observable inputs for the determination of fair value. The pricing service normally derives the security prices through recently reported trades for identical or similar securities, making adjustments through the reporting date based upon available observable market information. For securities not actively traded, the pricing service may use quoted market prices of comparable instruments or discounted cash flow analyses, incorporating inputs that are currently observable in the markets for similar securities. Inputs that are often used in the valuation methodologies include, but are not limited to, benchmark yields, credit spreads, default rates and prepayment speeds, and non-binding broker quotes. As we are responsible for the determination of fair value, we perform quarterly analyses on the prices received from the pricing service to determine whether the prices are reasonable estimates of fair value. Specifically, we compare:
|
•
|
the prices received from the pricing service to prices reported by a secondary pricing service, its custodian, its investment consultant and/or third-party investment advisors; and
|
|
•
|
changes in the reported market values and returns to relevant market indices and our expectations to test the reasonableness of the reported prices.
|
Based on our internal price verification procedures and our review of the fair value methodology documentation provided by independent pricing service, we have not historically adjusted the prices obtained from the pricing service.
Other-than-temporary impairment assessment.
Individual securities with fair values lower than costs are reviewed for impairment considering the following factors: our intent to sell the security or the likelihood that we will be required to sell the security before recovery of the entire amortized cost, the length of time and extent of impairment and the financial condition and near-term prospects of the issuer as well as specific events or circumstances that may influence the operations of the issuer. Other factors included in the assessment include the type and nature of the securities and liquidity. Given the nature of our portfolio, primarily investment grade securities, historical impairments were largely market related (e.g., interest rate fluctuations, etc.) as opposed to credit related. We do not expect that trend to change in the near term. Our large cash holdings reduce the risk that we will be required to sell a security. However, our intent to sell a security may change from period to period if facts and circumstances change.
We believe we will collect the principal and interest due on our debt securities with an amortized cost in excess of fair value. The unrealized losses of $9 million and $32 million at
December 31, 2012
and
2011
, respectively, were primarily caused by market interest rate increases and not by unfavorable changes in the credit standing. We manage our investment portfolio to limit our exposure to any one issuer or market sector, and largely limit our investments to U.S. government and agency securities; state and municipal securities; mortgage-backed securities; and corporate debt obligations, substantially all of investment-grade quality. Securities downgraded below policy minimums after purchase will be disposed of in accordance with our investment policy. Total other-than-temporary impairments during
2012
,
2011
and
2010
were
$6 million
,
$12 million
and
$23 million
, respectively. Our cash equivalent and investment portfolio had a weighted-average duration of 2.1 years and a weighted-average credit rating of “AA” as of
December 31, 2012
. We have minimal securities collateralized by sub-prime or Alt-A securities, and a minimal amount of commercial mortgage loans in default.
The judgments and estimates related to fair value and other-than-temporary impairment may ultimately prove to be inaccurate due to many factors including: circumstances may change over time, industry sector and market factors may differ from expectations and estimates or we may ultimately sell a security we previously intended to hold. Our assessment of the financial condition and near-term prospects of the issuer may ultimately prove to be inaccurate as time passes and new information becomes available including current facts and circumstances changing, or as unknown or estimated unlikely trends develop.
As discussed further in Item 7A “Quantitative and Qualitative Disclosures About Market Risk” a 1% increase in market interest rates has the effect of decreasing the fair value of our investment portfolio by $656 million.
Income Taxes
Our provision for income taxes, deferred tax assets and liabilities, and uncertain tax positions reflect our assessment of estimated future taxes to be paid on items in the consolidated financial statements.
Deferred income taxes arise from temporary differences between financial reporting and tax reporting bases of assets and liabilities, as well as net operating loss and tax credit carryforwards for tax purposes. We have established a valuation allowance against certain deferred tax assets based on the weight of available evidence (both positive and negative) for which it is more-likely-than-not that some portion, or all, of the deferred tax asset will not be realized.
An uncertain tax position is recognized when it is more likely than not that the position will be sustained upon examination, including resolutions of any related appeals or litigation processes, based on the technical merits. We prepare and file tax returns based on our interpretation of tax laws and regulations and record estimates based on these judgments and interpretations. In the normal course of business, our tax returns are subject to examination by various taxing authorities. Such
50
examinations may result in future tax and interest assessments by these taxing authorities. Inherent uncertainties exist in estimates of tax positions due to changes in tax law resulting from legislation, regulation and/or as concluded through the various jurisdictions’ tax court systems.
The significant assumptions and estimates described above are important contributors to our ultimate effective tax rate in each year. A hypothetical increase or decrease in our effective tax rate by 1% on our 2012 earnings before income taxes would have caused the provision for income taxes and net earnings to change by $86 million.
Contingent Liabilities
Because of the nature of our businesses, we are routinely involved in various disputes, legal proceedings and governmental audits and investigations. We record liabilities for our estimates of the probable costs resulting from these matters where appropriate. Our estimates are developed in consultation with legal counsel, if appropriate, and are based upon an analysis of potential results, assuming a combination of litigation and settlement strategies and considering our insurance coverage, if any, for such matters.
Estimates of costs resulting from legal and regulatory matters involving us are inherently difficult to predict, particularly where the matters: involve indeterminate claims for monetary damages or may involve fines, penalties or punitive damages; present novel legal theories or represent a shift in regulatory policy; involve a large number of claimants or regulatory bodies; are in the early stages of the proceedings; or could result in a change in business practices. Accordingly, in many cases, we are unable to estimate the losses or ranges of losses for those matters where there is a reasonable possibility or it is probable that a loss may be incurred. Similarly, the assessment of the likelihood of assertion of unasserted claims involves significant judgment.
Given this inherent uncertainty, it is possible that future results of operations for any particular quarterly or annual period could be materially affected by changes in our estimates or assumptions. We evaluate our related disclosures each reporting period. See Note 12 of Notes to the Consolidated Financial Statements included in Item 8, “Financial Statements” for discussion of specific legal proceedings including an assessment of whether a reasonable estimate of the losses or range of loss could be determined.
LEGAL MATTERS
A description of our legal proceedings is included in Note 12 of Notes to the Consolidated Financial Statements included in Item 8 “Financial Statements.”
CONCENTRATIONS OF CREDIT RISK
Investments in financial instruments such as marketable securities and accounts receivable may subject us to concentrations of credit risk. Our investments in marketable securities are managed under an investment policy authorized by our Board of Directors. This policy limits the amounts that may be invested in any one issuer and generally limits our investments to U.S. government and agency securities, state and municipal securities and corporate debt obligations that are investment grade. Concentrations of credit risk with respect to accounts receivable are limited due to the large number of employer groups and other customers that constitute our client base. As of
December 31, 2012
, we had an aggregate
$1.9 billion
reinsurance receivable resulting from the sale of our Golden Rule Financial Corporation life and annuity business in 2005. We regularly evaluate the financial condition of the reinsurer and only record the reinsurance receivable to the extent that the amounts are deemed probable of recovery. As of December 31, 2012, the reinsurer was rated by A.M. Best as “A+.” As of
December 31, 2012
, there were no other significant concentrations of credit risk.
Our primary market risks are exposures to (a) changes in interest rates that impact our investment income and interest expense and the fair value of certain of our fixed-rate investments and debt, (b) foreign currency exchange rate risk of the U.S. dollar primarily to the Brazilian Real and (c) changes in equity prices that impact the value of our equity investments.
As of
December 31, 2012
, we had
$9.4 billion
of cash, cash equivalents and investments on which the interest rates received vary with market interest rates, which may materially impact our investment income. Also,
$6.7 billion
of our debt and deposit liabilities as of
December 31, 2012
were at interest rates that vary with market rates, either directly or through the use of related interest rate swap contracts.
The fair value of certain of our fixed-rate investments and debt also varies with market interest rates. As of
December 31, 2012
,
$19.1 billion
of our investments were fixed-rate debt securities and $13.6 billion of our debt was non-swapped fixed-rate term debt. An increase in market interest rates decreases the market value of fixed-rate investments and fixed-rate debt. Conversely, a decrease in market interest rates increases the market value of fixed-rate investments and fixed-rate debt.
51
We manage exposure to market interest rates by diversifying investments across different fixed income market sectors and debt across maturities, as well as endeavoring to match our floating-rate assets and liabilities over time, either directly or periodically through the use of interest rate swap contracts.
The following tables summarize the impact of hypothetical changes in market interest rates across the entire yield curve by 1% or 2% as of
December 31, 2012
and
2011
on our investment income and interest expense per annum, and the fair value of our investments and debt (in millions, except percentages):
nm = not meaningful
|
December 31, 2012
|
||||||||||||||||
|
Increase (Decrease) in Market Interest Rate
|
Investment
Income Per
Annum (a)
|
Interest
Expense Per
Annum (a)
|
Fair Value of
Investments (b)
|
Fair Value of
Debt
|
||||||||||||
|
2 %
|
$
|
189
|
|
$
|
134
|
|
$
|
(1,303
|
)
|
$
|
(2,200
|
)
|
||||
|
1
|
94
|
|
67
|
|
(656
|
)
|
(1,194
|
)
|
||||||||
|
(1)
|
(18
|
)
|
(14
|
)
|
518
|
|
1,366
|
|
||||||||
|
(2)
|
nm
|
|
nm
|
|
686
|
|
2,747
|
|
||||||||
|
December 31, 2011
|
||||||||||||||||
|
Increase (Decrease) in Market Interest Rate
|
Investment
Income Per
Annum (a)
|
Interest
Expense Per
Annum (a)
|
Fair Value of
Investments (b)
|
Fair Value of
Debt
|
||||||||||||
|
2%
|
$
|
199
|
|
$
|
28
|
|
$
|
(1,239
|
)
|
$
|
(1,946
|
)
|
||||
|
1
|
99
|
|
14
|
|
(622
|
)
|
(1,082
|
)
|
||||||||
|
(1)
|
(12
|
)
|
(4
|
)
|
586
|
|
1,086
|
|
||||||||
|
(2)
|
nm
|
|
nm
|
|
885
|
|
2,343
|
|
||||||||
|
(a)
|
Given the low absolute level of short-term market rates on our floating-rate assets and liabilities as of
December 31, 2012
and
2011
, the assumed hypothetical change in interest rates does not reflect the full 100 basis point reduction in interest income or interest expense as the rate cannot fall below zero and thus the 200 basis point reduction is not meaningful.
|
|
(b)
|
As of
December 31, 2012
, some of our investments had interest rates below 2% so the assumed hypothetical change in the fair value of investments does not reflect the full 200 basis point reduction.
|
With the Amil acquisition, we have an exposure to changes in the value of the Brazilian Real to the U.S. Dollar in translation of Amil’s operating results at the average exchange rate over the accounting period, and Amil’s assets and liabilities at the spot rate at the end of the accounting period. The gains or losses resulting from translating foreign currency financial statements into U.S. dollars are included in shareholders’ equity and comprehensive income.
An appreciation of the U.S. dollar against the Brazilian Real reduces the carrying value of the net assets denominated in Brazilian Real. For example, as of December 31, 2012 a hypothetical 10% increase in the value of the U.S. Dollar against the Brazilian Real would cause a reduction in net assets of $510 million. We manage exposure to foreign currency risk by conducting our international business operations primarily in their functional currencies. We funded certain cash needs of Amil through intercompany notes. At December 31, 2012, we had currency swaps with a total notional amount of $256 million hedging the U.S. dollar to the Brazilian Real to provide a cash flow hedge on the principal amount of the intercompany notes to Amil.
As of
December 31, 2012
, we had
$677 million
of investments in equity securities, including employee savings plan related investments of
$348 million
and venture capital funds, a portion of which were invested in various public and non-public companies concentrated in the areas of health care delivery and related information technologies. Market conditions that affect the value of health care or technology stocks will impact the value of our equity investments.
52
|
Page
|
|
53
Report of Independent Registered Public Accounting Firm
To the Board of Directors and Shareholders of UnitedHealth Group Incorporated and Subsidiaries:
We have audited the accompanying consolidated balance sheets of UnitedHealth Group Incorporated and Subsidiaries (the “Company”) as of December 31, 2012 and 2011, and the related consolidated statements of operations, comprehensive income, shareholders’ equity and cash flows for each of the three years in the period ended December 31, 2012. These consolidated financial statements are the responsibility of the Company’s management. Our responsibility is to express an opinion on these consolidated financial statements based on our audits.
We conducted our audits in accordance with the standards of the Public Company Accounting Oversight Board (United States). Those standards require that we plan and perform the audit to obtain reasonable assurance about whether the consolidated financial statements are free of material misstatement. An audit includes examining, on a test basis, evidence supporting the amounts and disclosures in the consolidated financial statements. An audit also includes assessing the accounting principles used and significant estimates made by management, as well as evaluating the overall financial statement presentation. We believe that our audits provide a reasonable basis for our opinion.
In our opinion, such consolidated financial statements present fairly, in all material respects, the financial position of UnitedHealth Group Incorporated and Subsidiaries as of December 31, 2012 and 2011, and the results of their operations and their cash flows for each of the three years in the period ended December 31, 2012, in conformity with accounting principles generally accepted in the United States of America.
We have also audited, in accordance with the standards of the Public Company Accounting Oversight Board (United States), the Company’s internal control over financial reporting as of December 31, 2012, based on the criteria established in
Internal Control-Integrated Framework
issued by the Committee of Sponsoring Organizations of the Treadway Commission and our report dated
February 6, 2013
, expressed an unqualified opinion on the Company’s internal control over financial reporting.
|
/
S
/ DELOITTE & TOUCHE LLP
|
|
Minneapolis, Minnesota
|
|
February 6, 2013
|
54
UnitedHealth Group
|
(in millions, except per share data)
|
December 31, 2012
|
December 31, 2011
|
||||||
|
Assets
|
||||||||
|
Current assets:
|
||||||||
|
Cash and cash equivalents
|
$
|
8,406
|
|
$
|
9,429
|
|
||
|
Short-term investments
|
3,031
|
|
2,577
|
|
||||
|
Accounts receivable, net of allowances of $189 and $196
|
2,709
|
|
2,294
|
|
||||
|
Other current receivables, net of allowances of $206 and $72
|
2,889
|
|
2,255
|
|
||||
|
Assets under management
|
2,773
|
|
2,708
|
|
||||
|
Deferred income taxes
|
463
|
|
472
|
|
||||
|
Prepaid expenses and other current assets
|
781
|
|
615
|
|
||||
|
Total current assets
|
21,052
|
|
20,350
|
|
||||
|
Long-term investments
|
17,711
|
|
16,166
|
|
||||
|
Property, equipment and capitalized software, net of accumulated depreciation and amortization of $2,564 and $2,440
|
3,939
|
|
2,515
|
|
||||
|
Goodwill
|
31,286
|
|
23,975
|
|
||||
|
Other intangible assets, net of accumulated amortization of $1,824 and $1,451
|
4,682
|
|
2,795
|
|
||||
|
Other assets
|
2,215
|
|
2,088
|
|
||||
|
Total assets
|
$
|
80,885
|
|
$
|
67,889
|
|
||
|
Liabilities and shareholders’ equity
|
||||||||
|
Current liabilities:
|
||||||||
|
Medical costs payable
|
$
|
11,004
|
|
$
|
9,799
|
|
||
|
Accounts payable and accrued liabilities
|
6,984
|
|
6,853
|
|
||||
|
Other policy liabilities
|
4,910
|
|
5,063
|
|
||||
|
Commercial paper and current maturities of long-term debt
|
2,713
|
|
982
|
|
||||
|
Unearned revenues
|
1,505
|
|
1,225
|
|
||||
|
Total current liabilities
|
27,116
|
|
23,922
|
|
||||
|
Long-term debt, less current maturities
|
14,041
|
|
10,656
|
|
||||
|
Future policy benefits
|
2,444
|
|
2,445
|
|
||||
|
Deferred income taxes
|
2,450
|
|
1,351
|
|
||||
|
Other liabilities
|
1,535
|
|
1,223
|
|
||||
|
Total liabilities
|
47,586
|
|
39,597
|
|
||||
|
Commitments and contingencies (Note 12)
|
|
|
||||||
|
Redeemable noncontrolling interest
|
2,121
|
|
—
|
|
||||
|
Shareholders’ equity:
|
||||||||
|
Preferred stock, $0.001 par value - 10 shares authorized; no shares issued or outstanding
|
—
|
|
—
|
|
||||
|
Common stock, $0.01 par value - 3,000 shares authorized;
1,019 and 1,039 issued and outstanding
|
10
|
|
10
|
|
||||
|
Additional paid-in capital
|
66
|
|
—
|
|
||||
|
Retained earnings
|
30,664
|
|
27,821
|
|
||||
|
Accumulated other comprehensive income
|
438
|
|
461
|
|
||||
|
Total shareholders’ equity
|
31,178
|
|
28,292
|
|
||||
|
Total liabilities and shareholders’ equity
|
$
|
80,885
|
|
$
|
67,889
|
|
||
See Notes to the Consolidated Financial Statements
55
UnitedHealth Group
|
|
For the Years Ended December 31,
|
|||||||||||
|
(in millions, except per share data)
|
2012
|
2011
|
2010
|
|||||||||
|
Revenues:
|
||||||||||||
|
Premiums
|
$
|
99,728
|
|
$
|
91,983
|
|
$
|
85,405
|
|
|||
|
Services
|
7,437
|
|
6,613
|
|
5,819
|
|
||||||
|
Products
|
2,773
|
|
2,612
|
|
2,322
|
|
||||||
|
Investment and other income
|
680
|
|
654
|
|
609
|
|
||||||
|
Total revenues
|
110,618
|
|
101,862
|
|
94,155
|
|
||||||
|
Operating costs:
|
||||||||||||
|
Medical costs
|
80,226
|
|
74,332
|
|
68,841
|
|
||||||
|
Operating costs
|
17,306
|
|
15,557
|
|
14,270
|
|
||||||
|
Cost of products sold
|
2,523
|
|
2,385
|
|
2,116
|
|
||||||
|
Depreciation and amortization
|
1,309
|
|
1,124
|
|
1,064
|
|
||||||
|
Total operating costs
|
101,364
|
|
93,398
|
|
86,291
|
|
||||||
|
Earnings from operations
|
9,254
|
|
8,464
|
|
7,864
|
|
||||||
|
Interest expense
|
(632
|
)
|
(505
|
)
|
(481
|
)
|
||||||
|
Earnings before income taxes
|
8,622
|
|
7,959
|
|
7,383
|
|
||||||
|
Provision for income taxes
|
(3,096
|
)
|
(2,817
|
)
|
(2,749
|
)
|
||||||
|
Net earnings
|
$
|
5,526
|
|
$
|
5,142
|
|
$
|
4,634
|
|
|||
|
Earnings per share attributable to UnitedHealth Group common shareholders:
|
||||||||||||
|
Basic
|
$
|
5.38
|
|
$
|
4.81
|
|
$
|
4.14
|
|
|||
|
Diluted
|
$
|
5.28
|
|
$
|
4.73
|
|
$
|
4.10
|
|
|||
|
Basic weighted-average number of common shares outstanding
|
1,027
|
|
1,070
|
|
1,120
|
|
||||||
|
Dilutive effect of common stock equivalents
|
19
|
|
17
|
|
11
|
|
||||||
|
Diluted weighted-average number of common shares outstanding
|
1,046
|
|
1,087
|
|
1,131
|
|
||||||
|
Anti-dilutive shares excluded from the calculation of dilutive effect of common stock equivalents
|
17
|
|
47
|
|
94
|
|
||||||
|
Cash dividends declared per common share
|
$
|
0.8000
|
|
$
|
0.6125
|
|
$
|
0.4050
|
|
|||
See Notes to the Consolidated Financial Statements
56
UnitedHealth Group
Consolidated Statements of Comprehensive Income
|
|
||||||||||||
|
|
For the Years Ended December 31,
|
|||||||||||
|
(in millions)
|
2012
|
2011
|
2010
|
|||||||||
|
Net earnings
|
$
|
5,526
|
|
$
|
5,142
|
|
$
|
4,634
|
|
|||
|
Other comprehensive (loss) income:
|
||||||||||||
|
Gross unrealized holding gains on investment securities during the period
|
217
|
|
422
|
|
74
|
|
||||||
|
Income tax expense
|
(78
|
)
|
(154
|
)
|
(26
|
)
|
||||||
|
Total unrealized gains, net of tax
|
139
|
|
268
|
|
48
|
|
||||||
|
Gross reclassification adjustment for net realized gains included in net earnings
|
(156
|
)
|
(113
|
)
|
(71
|
)
|
||||||
|
Income tax effect
|
57
|
|
41
|
|
26
|
|
||||||
|
Total reclassification adjustment, net of tax
|
(99
|
)
|
(72
|
)
|
(45
|
)
|
||||||
|
Foreign currency translation adjustments
|
(63
|
)
|
13
|
|
(4
|
)
|
||||||
|
Other comprehensive (loss) income
|
(23
|
)
|
209
|
|
(1
|
)
|
||||||
|
Comprehensive income
|
$
|
5,503
|
|
$
|
5,351
|
|
$
|
4,633
|
|
|||
See Notes to the Consolidated Financial Statements
57
UnitedHealth Group
Consolidated Statements of Changes in Shareholders’ Equity
|
Common Stock
|
Additional Paid-In Capital
|
Retained Earnings
|
Accumulated Other Comprehensive Income (Loss)
|
Total Equity
|
|||||||||||||||||||||||
|
(in millions)
|
Shares
|
Amount
|
Net Unrealized Gains on Investments
|
Foreign Currency Translation (Losses) Gains
|
|||||||||||||||||||||||
|
Balance at January 1, 2010
|
1,147
|
|
$
|
11
|
|
$
|
—
|
|
$
|
23,342
|
|
$
|
277
|
|
$
|
(24
|
)
|
$
|
23,606
|
|
|||||||
|
Net earnings
|
4,634
|
|
|
|
4,634
|
|
|||||||||||||||||||||
|
Other comprehensive income
|
3
|
|
(4
|
)
|
(1
|
)
|
|||||||||||||||||||||
|
Issuances of common stock, and related tax effects
|
15
|
|
—
|
|
207
|
|
|
|
207
|
|
|||||||||||||||||
|
Share-based compensation, and related tax benefits
|
345
|
|
|
|
345
|
|
|||||||||||||||||||||
|
Common stock repurchases
|
(76
|
)
|
—
|
|
(552
|
)
|
(1,965
|
)
|
(2,517
|
)
|
|||||||||||||||||
|
Cash dividends paid on common stock
|
(449
|
)
|
|
|
(449
|
)
|
|||||||||||||||||||||
|
Balance at December 31, 2010
|
1,086
|
|
11
|
|
—
|
|
25,562
|
|
280
|
|
(28
|
)
|
25,825
|
|
|||||||||||||
|
Net earnings
|
5,142
|
|
|
|
5,142
|
|
|||||||||||||||||||||
|
Other comprehensive income
|
196
|
|
13
|
|
209
|
|
|||||||||||||||||||||
|
Issuances of common stock, and related tax effects
|
18
|
|
—
|
|
308
|
|
|
|
308
|
|
|||||||||||||||||
|
Share-based compensation, and related tax benefits
|
453
|
|
|
|
453
|
|
|||||||||||||||||||||
|
Common stock repurchases
|
(65
|
)
|
(1
|
)
|
(761
|
)
|
(2,232
|
)
|
(2,994
|
)
|
|||||||||||||||||
|
Cash dividends paid on common stock
|
(651
|
)
|
|
|
(651
|
)
|
|||||||||||||||||||||
|
Balance at December 31, 2011
|
1,039
|
|
10
|
|
—
|
|
27,821
|
|
476
|
|
(15
|
)
|
28,292
|
|
|||||||||||||
|
Net earnings
|
5,526
|
|
5,526
|
|
|||||||||||||||||||||||
|
Other comprehensive income
|
40
|
|
(63
|
)
|
(23
|
)
|
|||||||||||||||||||||
|
Issuances of common stock, and related tax effects
|
37
|
|
—
|
|
704
|
|
704
|
|
|||||||||||||||||||
|
Share-based compensation, and related tax benefits
|
594
|
|
594
|
|
|||||||||||||||||||||||
|
Common stock repurchases
|
(57
|
)
|
—
|
|
(1,221
|
)
|
(1,863
|
)
|
(3,084
|
)
|
|||||||||||||||||
|
Acquisition of noncontrolling interest
|
(11
|
)
|
(11
|
)
|
|||||||||||||||||||||||
|
Cash dividends paid on common stock
|
(820
|
)
|
(820
|
)
|
|||||||||||||||||||||||
|
Balance at December 31, 2012
|
1,019
|
|
$
|
10
|
|
$
|
66
|
|
$
|
30,664
|
|
$
|
516
|
|
$
|
(78
|
)
|
$
|
31,178
|
|
|||||||
See Notes to the Consolidated Financial Statements
58
UnitedHealth Group
|
|
For the Years Ended
December 31,
|
|||||||||||
|
(in millions)
|
2012
|
2011
|
2010
|
|||||||||
|
Operating activities
|
||||||||||||
|
Net earnings
|
$
|
5,526
|
|
$
|
5,142
|
|
$
|
4,634
|
|
|||
|
Non-cash items:
|
||||||||||||
|
Depreciation and amortization
|
1,309
|
|
1,124
|
|
1,064
|
|
||||||
|
Deferred income taxes
|
308
|
|
59
|
|
45
|
|
||||||
|
Share-based compensation
|
421
|
|
401
|
|
326
|
|
||||||
|
Other, net
|
(231
|
)
|
(67
|
)
|
203
|
|
||||||
|
Net change in other operating items, net of effects from acquisitions and changes in AARP balances:
|
||||||||||||
|
Accounts receivable
|
(130
|
)
|
(267
|
)
|
(16
|
)
|
||||||
|
Other assets
|
(295
|
)
|
(121
|
)
|
84
|
|
||||||
|
Medical costs payable
|
101
|
|
377
|
|
(88
|
)
|
||||||
|
Accounts payable and other liabilities
|
199
|
|
146
|
|
(341
|
)
|
||||||
|
Other policy liabilities
|
(81
|
)
|
482
|
|
10
|
|
||||||
|
Unearned revenues
|
28
|
|
(308
|
)
|
352
|
|
||||||
|
Cash flows from operating activities
|
7,155
|
|
6,968
|
|
6,273
|
|
||||||
|
Investing activities
|
||||||||||||
|
Purchases of investments
|
(9,903
|
)
|
(9,895
|
)
|
(7,855
|
)
|
||||||
|
Sales of investments
|
3,794
|
|
3,949
|
|
2,593
|
|
||||||
|
Maturities of investments
|
4,810
|
|
4,251
|
|
3,105
|
|
||||||
|
Cash paid for acquisitions, net of cash assumed
|
(6,280
|
)
|
(1,844
|
)
|
(2,323
|
)
|
||||||
|
Cash received from dispositions
|
—
|
|
385
|
|
19
|
|
||||||
|
Purchases of property, equipment and capitalized software
|
(1,070
|
)
|
(1,067
|
)
|
(878
|
)
|
||||||
|
Proceeds from disposal of property, equipment and capitalized software
|
—
|
|
49
|
|
—
|
|
||||||
|
Cash flows used for investing activities
|
(8,649
|
)
|
(4,172
|
)
|
(5,339
|
)
|
||||||
|
Financing activities
|
||||||||||||
|
Common stock repurchases
|
(3,084
|
)
|
(2,994
|
)
|
(2,517
|
)
|
||||||
|
Proceeds from common stock issuances
|
1,078
|
|
381
|
|
272
|
|
||||||
|
Cash dividends paid
|
(820
|
)
|
(651
|
)
|
(449
|
)
|
||||||
|
Proceeds from (repayments of) commercial paper, net
|
1,587
|
|
(933
|
)
|
930
|
|
||||||
|
Proceeds from issuance of long-term debt
|
3,966
|
|
2,234
|
|
747
|
|
||||||
|
Repayments of long-term debt
|
(986
|
)
|
(955
|
)
|
(1,583
|
)
|
||||||
|
Interest rate swap termination
|
—
|
|
132
|
|
—
|
|
||||||
|
Customer funds administered
|
(324
|
)
|
37
|
|
974
|
|
||||||
|
Checks outstanding
|
(202
|
)
|
206
|
|
(5
|
)
|
||||||
|
Acquisition of noncontrolling interest shares
|
(319
|
)
|
—
|
|
—
|
|
||||||
|
Other, net
|
(425
|
)
|
53
|
|
20
|
|
||||||
|
Cash flows from (used for) financing activities
|
471
|
|
(2,490
|
)
|
(1,611
|
)
|
||||||
|
(Decrease) increase in cash and cash equivalents
|
(1,023
|
)
|
306
|
|
(677
|
)
|
||||||
|
Cash and cash equivalents, beginning of period
|
9,429
|
|
9,123
|
|
9,800
|
|
||||||
|
Cash and cash equivalents, end of period
|
$
|
8,406
|
|
$
|
9,429
|
|
$
|
9,123
|
|
|||
|
Supplemental cash flow disclosures
|
||||||||||||
|
Cash paid for interest
|
$
|
600
|
|
$
|
472
|
|
$
|
509
|
|
|||
|
Cash paid for income taxes
|
2,666
|
|
2,739
|
|
2,725
|
|
||||||
See Notes to the Consolidated Financial Statements
59
UnitedHealth Group
Notes to the Consolidated Financial Statements
|
1.
|
Description of Business
|
UnitedHealth Group Incorporated (also referred to as “UnitedHealth Group” and “the Company”) is a diversified health and well-being company whose mission is to help people live healthier lives and make health care work better.
The Company helps individuals access quality care at an affordable cost; simplifying health care administration and delivery; strengthening the physician/patient relationship; promoting evidence-based care; and empowering physicians, health care professionals, consumers, employers and other participants in the health system with actionable data to make better, more informed decisions.
Through the Company’s diversified family of businesses, it leverages core competencies in advanced, enabling technology; health care data, information and intelligence; and clinical care management and coordination to help meet the demands of the health system. See Note 13 for a description of the Company’s reportable segments and how the segments generate their revenues.
|
2.
|
Basis of Presentation, Use of Estimates and Significant Accounting Policies
|
Basis of Presentation
The Company has prepared the Consolidated Financial Statements according to United States of America (U.S.) Generally Accepted Accounting Principles (GAAP) and has included the accounts of UnitedHealth Group and its subsidiaries. The Company has eliminated intercompany balances and transactions.
Use of Estimates
These Consolidated Financial Statements include certain amounts based on the Company’s best estimates and judgments. The Company’s most significant estimates relate to medical costs payable, premium rebates and risk-adjusted and risk-sharing provisions related to revenues,
valuation and impairment analysis of goodwill and other intangible assets, estimates of other policy liabilities and other current receivables, valuations of investments, and estimates and judgments related to income taxes and contingent liabilities. These estimates require the application of complex assumptions and judgments, often because they involve matters that are inherently uncertain and will likely change in subsequent periods. The impact of any changes in estimates is included in earnings in the period in which the estimate is adjusted.
Revenues
Premium revenues are primarily derived from risk-based health insurance arrangements in which the premium is typically at a fixed rate per individual served for a one-year period, and the Company assumes the economic risk of funding its customers’ health care and related administrative costs.
Premium revenues are recognized in the period in which eligible individuals are entitled to receive health care benefits. Health care premium payments received from its customers in advance of the service period are recorded as unearned revenues. Effective in 2011, U.S. commercial health plans with medical loss ratios on fully insured products, as calculated under the definitions in the Patient Protection and Affordable Care Act and a reconciliation measure, the Health Care and Education Reconciliation Act of 2010 (together, Health Reform Legislation) and implementing regulations, that fall below certain targets are required to rebate ratable portions of their premiums annually. Premium revenues are recognized based on the estimated premiums earned net of projected rebates because the Company is able to reasonably estimate the ultimate premiums of these contracts. Each period, the Company estimates premium rebates based on the expected financial performance of the applicable contracts within each defined aggregation set (e.g., by state, group size and licensed subsidiary). The most significant factors in estimating the financial performance are current and future premiums and medical claim experience, effective tax rates and expected changes in business mix. The estimated ultimate premium is revised each period to reflect current and projected experience. The Company also records premium revenues from capitation arrangements at its OptumHealth businesses.
The Company’s Medicare Advantage and Part D premium revenues are subject to periodic adjustment under the Centers for Medicare and Medicaid Services’ (CMS) risk adjustment payment methodology. CMS deploys a risk adjustment model that apportions premiums paid to all health plans according to health severity and certain demographic factors. The CMS risk adjustment model provides higher per member payments for enrollees diagnosed with certain conditions and lower payments for enrollees who are healthier. Under this risk adjustment methodology, CMS calculates the risk adjusted premium payment using diagnosis data from hospital inpatient, hospital outpatient and physician treatment settings. The Company and health care providers collect, capture, and submit the necessary and available diagnosis data to CMS within prescribed deadlines. The Company estimates risk adjustment revenues based upon the diagnosis data submitted and expected to be submitted to CMS.
60
Risk adjustment data for certain of the Company’s plans is subject to review by the government, including audit by regulators. See Note 12 for additional information regarding these audits.
Service revenues consist primarily of fees derived from services performed for customers that self-insure the health care costs of their employees and employees’ dependants. Under service fee contracts, the Company recognizes revenue in the period the related services are performed. The customers retain the risk of financing health care costs for their employees and employees’ dependants, and the Company administers the payment of customer funds to physicians and other health care professionals from customer-funded bank accounts. As the Company has neither the obligation for funding the health care costs, nor the primary responsibility for providing the medical care, the Company does not recognize premium revenue and medical costs for these contracts in its Consolidated Financial Statements.
For both risk-based and fee-based customer arrangements, the Company provides coordination and facilitation of medical services; transaction processing; customer, consumer and care professional services; and access to contracted networks of physicians, hospitals and other health care professionals. These services are performed throughout the contract period.
For the Company’s OptumRx pharmacy benefits management (PBM) business, revenues are derived from products sold through a contracted network of retail pharmacies or mail services, and from administrative services, including claims processing and formulary design and management. Product revenues include ingredient costs (net of rebates), a negotiated dispensing fee and customer co-payments for drugs dispensed through the Company’s mail-service pharmacy. In retail pharmacy transactions, revenues recognized exclude the member’s applicable co-payment. Product revenues are recognized when the prescriptions are dispensed through the retail network or received by consumers through the Company’s mail-service pharmacy. Service revenues are recognized when the prescription claim is adjudicated. The Company has entered into retail service contracts in which it is primarily obligated to pay its network pharmacy providers for benefits provided to their customers regardless if the Company is paid. The Company is also involved in establishing the prices charged by retail pharmacies, determining which drugs will be included in formulary listings and selecting which retail pharmacies will be included in the network offered to plan sponsors’ members. As a result, revenues are reported on a gross basis.
Medical Costs and Medical Costs Payable
Medical costs and medical costs payable include estimates of the Company’s obligations for medical care services that have been rendered on behalf of insured consumers, but for which claims have either not yet been received or processed, and for liabilities for physician, hospital and other medical cost disputes. The Company develops estimates for medical costs incurred but not reported using an actuarial process that is consistently applied, centrally controlled and automated. The actuarial models consider factors such as time from date of service to claim receipt, claim processing backlogs, care provider contract rate changes, medical care utilization and other medical cost trends. The Company estimates liabilities for physician, hospital and other medical cost disputes based upon an analysis of potential outcomes, assuming a combination of litigation and settlement strategies. Each period, the Company re-examines previously established medical costs payable estimates based on actual claim submissions and other changes in facts and circumstances. As the medical costs payable estimates recorded in prior periods develop, the Company adjusts the amount of the estimates and includes the changes in estimates in medical costs in the period in which the change is identified. Medical costs also include the direct cost of patient care rendered through OptumHealth.
Cash, Cash Equivalents and Investments
Cash and cash equivalents are highly liquid investments that have an original maturity of three months or less. The fair value of cash and cash equivalents approximates their carrying value because of the short maturity of the instruments.
The Company had checks outstanding of
$1.3 billion
and
$1.5 billion
as of
December 31, 2012
and
2011
, respectively, which were classified as Accounts Payable and Accrued Liabilities in the Consolidated Balance Sheets and the change in this balance has been reflected as Checks Outstanding within financing activities in the Consolidated Statements of Cash Flows. The outstanding checks are all related to zero balance accounts; the Company does not net checks outstanding with deposits in other accounts.
Investments with maturities of less than one year are classified as short-term. Because of regulatory requirements, certain investments are included in long-term investments regardless of their maturity date. The Company classifies these investments as held-to-maturity and reports them at amortized cost. Substantially all other investments are classified as available-for-sale and reported at fair value based on quoted market prices, where available.
The Company excludes unrealized gains and losses on investments in available-for-sale securities from earnings and reports them as comprehensive income and, net of income tax effects, as a separate component of shareholders’ equity. To calculate realized gains and losses on the sale of investments, the Company specifically identifies the cost of each investment sold.
61
The Company evaluates an investment for impairment by considering the length of time and extent to which market value has been less than cost or amortized cost, the financial condition and near-term prospects of the issuer as well as specific events or circumstances that may influence the operations of the issuer and the Company’s intent to sell the security or the likelihood that it will be required to sell the security before recovery of the entire amortized cost.
|
•
|
For debt securities, if the Company intends to either sell or determines that it will be more likely than not be required to sell a security before recovery of the entire amortized cost basis or maturity of the security, the Company recognizes the entire impairment in Investment and Other Income. If the Company does not intend to sell the debt security and it determines that it will not be more likely than not be required to sell the security but it does not expect to recover the entire amortized cost basis, the impairment is bifurcated into the amount attributed to the credit loss, which is recognized in earnings, and all other causes, which are recognized in other comprehensive income.
|
|
•
|
For equity securities, the Company recognizes impairments in other comprehensive income if it expects to hold the security until fair value increases to at least the security’s cost basis and it expects that increase in fair value to occur in a reasonably forecasted period. If the Company intends to sell the equity security or if it believes that recovery of fair value to cost will not occur in a reasonably forecasted period, the Company recognizes the impairment in Investment and Other Income.
|
New information and the passage of time can change these judgments. The Company manages its investment portfolio to limit its exposure to any one issuer or market sector, and largely limits its investments to U.S. government and agency securities; state and municipal securities; mortgage-backed securities; and corporate debt obligations, substantially all of which are investment grade quality. Securities downgraded below policy minimums after purchase will be disposed of in accordance with the investment policy.
Assets Under Management
The Company provides health insurance products and services to members of AARP under a Supplemental Health Insurance Program (the AARP Program), and to AARP members and non-members under separate Medicare Advantage and Medicare Part D arrangements. The products and services under the AARP Program include supplemental Medicare benefits (AARP Medicare Supplement Insurance), hospital indemnity insurance, including insurance for individuals between 50 to 64 years of age, and other related products.
The Company’s arrangements with AARP extend to December 31, 2017 for the AARP Program and give the Company an exclusive right to use the AARP brand on the Company’s Medicare Advantage and Medicare Part D offerings until December 31, 2014, subject to certain limited exclusions.
Pursuant to the Company’s agreement, AARP Program assets are managed separately from its general investment portfolio and are used to pay costs associated with the AARP Program. These assets are invested at the Company’s discretion, within investment guidelines approved by AARP. The Company does not guarantee any rates of return on these investments and, upon transfer of the AARP Program contract to another entity, the Company would transfer cash equal in amount to the fair value of these investments at the date of transfer to that entity. Because the purpose of these assets is to fund the medical costs payable, the rate stabilization fund (RSF) liabilities and other related liabilities associated with this AARP contract, assets under management are classified as current assets, consistent with the classification of these liabilities. Interest earnings and realized investment gains and losses on these assets accrue to the overall benefit of the AARP policyholders through the RSF. Accordingly, they are not included in the Company’s earnings. Interest income and realized gains and losses related to assets under management are recorded as an increase to the RSF and were
$109 million
,
$99 million
and
$107 million
in
2012
,
2011
and
2010
, respectively.
The effects of changes in balance sheet amounts associated with the AARP Program also accrue to the overall benefit of the AARP policyholders through the RSF balance. Accordingly, the Company excludes the effect of such changes in its Consolidated Statements of Cash Flows. For more detail on the RSF, see “Other Policy Liabilities” below.
Other Current Receivables
Other current receivables include amounts due from pharmaceutical manufacturers for rebates and Medicare Part D drug discounts, reinsurance and other miscellaneous amounts due to the Company.
The Company’s PBM businesses contract with pharmaceutical manufacturers, some of whom provide rebates based on use of the manufacturers’ products by its PBM businesses’ affiliated and non-affiliated clients. The Company accrues rebates as they are earned by its clients on a monthly basis based on the terms of the applicable contracts, historical data and current estimates. The PBM businesses bill these rebates to the manufacturers on a monthly or quarterly basis depending on the contractual terms. The PBM businesses record rebates attributable to affiliated clients as a reduction to medical costs. Rebates attributable to non-
62
affiliated clients are accrued as rebates receivable and a reduction of cost of products sold with a corresponding payable for the amounts of the rebates to be remitted to non-affiliated clients in accordance with their contracts and recorded in the Consolidated Statements of Operations as a reduction of Product Revenue. The Company generally receives rebates from two to five months after billing.
For details on the Company’s Medicare Part D receivables see “Medicare Part D Pharmacy Benefits” below.
For details on the Company’s reinsurance receivable see “Future Policy Benefits and Reinsurance Receivable” below.
Medicare Part D Pharmacy Benefits
The Company serves as a plan sponsor offering Medicare Part D prescription drug insurance coverage under contracts with CMS. Under the Medicare Part D program, there are seven separate elements of payment received by the Company during the plan year. These payment elements are as follows:
|
•
|
CMS Premium.
CMS pays a fixed monthly premium per member to the Company for the entire plan year.
|
|
•
|
Member Premium.
Additionally, certain members pay a fixed monthly premium to the Company for the entire plan year.
|
|
•
|
Low-Income Premium Subsidy.
For qualifying low-income members, CMS pays some or all of the member’s monthly premiums to the Company on the member’s behalf.
|
|
•
|
Catastrophic Reinsurance Subsidy
. CMS pays the Company a cost reimbursement estimate monthly to fund the CMS obligation to pay approximately
80%
of the costs incurred by individual members in excess of the individual annual out-of-pocket maximum. A settlement is made with CMS based on actual cost experience, after the end of the plan year.
|
|
•
|
Low-Income Member Cost Sharing Subsidy.
For qualifying low-income members, CMS pays on the member’s behalf some or all of a member’s cost sharing amounts, such as deductibles and coinsurance. The cost sharing subsidy is funded by CMS through monthly payments to the Company. The Company administers and pays the subsidized portion of the claims on behalf of CMS, and a settlement payment is made between CMS and the Company based on actual claims and premium experience, after the end of the plan year.
|
|
•
|
CMS Risk-Share.
Premiums from CMS are subject to risk corridor provisions that compare costs targeted in the Company’s annual bids by product and region to actual prescription drug costs, limited to actual costs that would have been incurred under the standard coverage as defined by CMS. Variances of more than
5%
above or below the original bid submitted by the Company may result in CMS making additional payments to the Company or require the Company to refund to CMS a portion of the premiums it received. The Company estimates and recognizes an adjustment to premium revenues related to the risk corridor payment settlement based upon pharmacy claims experience to date. The estimate of the settlement associated with these risk corridor provisions requires the Company to consider factors that may not be certain, including estimates of eligible pharmacy costs and member eligibility status differences with CMS. The Company records risk-share adjustments to Premium Revenues in the Consolidated Statements of Operations and Other Policy Liabilities or Other Current Receivables in the Consolidated Balance Sheets.
|
|
•
|
Drug Discount.
Beginning in 2011, Health Reform Legislation mandated a consumer discount of
50%
on brand name prescription drugs for Part D plan participants in the coverage gap. This discount is funded by CMS and pharmaceutical manufacturers while the Company administers the application of these funds. Amounts received are not reflected as premium revenues, but rather are accounted for as deposits. The Company records a liability when amounts are received from CMS and a receivable when the Company bills the pharmaceutical manufacturers. Related cash flows are presented as Customer Funds Administered within financing activities in the Consolidated Statements of Cash Flows.
|
The CMS Premium, the Member Premium, and the Low-Income Premium Subsidy represent payments for the Company’s insurance risk coverage under the Medicare Part D program and, therefore, are recorded as Premium Revenues in the Consolidated Statements of Operations. Premium revenues are recognized ratably over the period in which eligible individuals are entitled to receive prescription drug benefits. The Company records premium payments received in advance of the applicable service period in Unearned Revenues in the Consolidated Balance Sheets.
The Catastrophic Reinsurance Subsidy and the Low-Income Member Cost Sharing Subsidy (Subsidies) represent cost reimbursements under the Medicare Part D program. Amounts received for these Subsidies are not reflected as premium revenues, but rather are accounted for as receivables and/or deposits. Related cash flows are presented as Customer Funds Administered within financing activities in the Consolidated Statements of Cash Flows.
Pharmacy benefit costs and administrative costs under the contract are expensed as incurred and are recognized in Medical Costs and Operating Costs, respectively, in the Consolidated Statements of Operations.
63
The final 2012 risk-share amount is expected to be settled during the second half of 2013, and is subject to the reconciliation process with CMS.
The Consolidated Balance Sheets include the following amounts associated with the Medicare Part D program:
|
|
December 31, 2012
|
December 31, 2011
|
||||||||||||||||||||||
|
(in millions)
|
Subsidies
|
Drug Discount
|
Risk-Share
|
Subsidies
|
Drug Discount
|
Risk-Share
|
||||||||||||||||||
|
Other current receivables
|
$
|
461
|
|
$
|
314
|
|
$
|
—
|
|
$
|
—
|
|
$
|
509
|
|
$
|
—
|
|
||||||
|
Other policy liabilities
|
—
|
|
319
|
|
438
|
|
70
|
|
649
|
|
170
|
|
||||||||||||
As of January 1, 2013, certain changes were made to the Medicare Part D coverage by CMS, including:
|
|
The initial coverage limit increased to
$2,970
from
$2,930
in 2012.
|
|
|
The catastrophic coverage begins at
$6,734
as compared to
$6,658
in 2012.
|
|
|
The annual out-of-pocket maximum increased to
$4,750
from
$4,700
in 2012.
|
The discounts on prescription drugs within the coverage gap increased to 52.5% from 50% in 2012 for brand name drugs and to 21% from 14% in 2012 for generic drugs.
Property, Equipment and Capitalized Software
Property, equipment and capitalized software are stated at cost, net of accumulated depreciation and amortization. Capitalized software consists of certain costs incurred in the development of internal-use software, including external direct costs of materials and services and applicable payroll costs of employees devoted to specific software development. The Company reviews property, equipment and capitalized software for events or changes in circumstances that would indicate that it might not recover their carrying value. If the Company determines that an asset may not be recoverable, an impairment charge is recorded.
The Company calculates depreciation and amortization using the straight-line method over the estimated useful lives of the assets. The useful lives for property, equipment and capitalized software are:
|
Furniture, fixtures and equipment
|
3 to 7 years
|
|
Buildings
|
35 to 40 years
|
|
Leasehold improvements
|
7 years or length of lease term, whichever is shorter
|
|
Capitalized software
|
3 to 5 years
|
Goodwill
Goodwill represents the amount of the purchase price in excess of the fair values assigned to the underlying identifiable net assets of acquired businesses. Goodwill is not amortized, but is subject to an annual impairment test. Tests are performed more frequently if events occur or circumstances change that would more likely than not reduce the fair value of the reporting unit below its carrying amount.
To determine whether goodwill is impaired, the Company performs a multi-step impairment test. First, the Company can elect to perform a qualitative assessment of each reporting unit to determine whether facts and circumstances support a determination that their fair values are greater than their carrying values. If the qualitative analysis is not conclusive, or if the Company elects to proceed directly with quantitative testing, it will then measure the fair values of the reporting units and compare them to their aggregate carrying values, including goodwill. If the fair value is less than the carrying value of the reporting unit, then the implied value of goodwill would be calculated and compared to the carrying amount of goodwill to determine whether goodwill is impaired.
The Company estimates the fair values of its reporting units using discounted cash flows. To determine fair values, the Company must make assumptions about a wide variety of internal and external factors. Significant assumptions used in the impairment analysis include financial projections of free cash flow (including significant assumptions about operations, capital requirements and income taxes), long-term growth rates for determining terminal value, and discount rates. Comparative market multiples are used to corroborate the results of the discounted cash flow test.
The Company elected to bypass the optional qualitative reporting-unit fair value assessment and completed its annual quantitative test for goodwill impairment as of January 1, 2013. As of
December 31, 2012
, no reporting unit had a fair value less than its carrying value and the Company concluded that there was no need for any impairment of its goodwill balances.
64
Intangible assets
Separately-identifiable intangible assets are acquired in business combinations and are assets that represent future expected benefits but lack physical substance (e.g., membership lists, customer contracts, trademarks and technology). The Company’s intangible assets are initially recorded at their fair values. Finite-lived intangible assets are amortized over their expected useful lives.
The Company’s intangible assets are subject to impairment tests when events or circumstances indicate that an intangible asset’s (or asset group’s) may be impaired. The Company’s indefinite lived intangible assets are also tested for impairment annually. There were no material impairments of intangible assets during the year ended
December 31, 2012
.
Other Policy Liabilities
Other policy liabilities include the RSF associated with the AARP Program (described below), health savings account deposits, deposits under the Medicare Part D program (see “Medicare Part D Pharmacy Benefits” above), accruals for premium rebate payments under the Health Reform Legislation, the current portion of future policy benefits and customer balances. Customer balances represent excess customer payments and deposit accounts under experience-rated contracts. At the customer’s option, these balances may be refunded or used to pay future premiums or claims under eligible contracts.
Underwriting gains or losses related to the AARP Program are directly recorded as an increase or decrease to the RSF and accrue to the overall benefit of the AARP policyholders, unless cumulative net losses were to exceed the balance in the RSF. The primary components of the underwriting results are premium revenue, medical costs, investment income, administrative expenses, member service expenses, marketing expenses and premium taxes. To the extent underwriting losses exceed the balance in the RSF, losses would be borne by the Company. Deficits may be recovered by underwriting gains in future periods of the contract. To date, the Company has not been required to fund any underwriting deficits. Changes in the RSF are reported in Medical Costs in the Consolidated Statement of Operations. As of
December 31, 2012
and
2011
, the balance in the RSF was
$1.3 billion
.
Income Taxes
Deferred income tax assets and liabilities are recognized for the differences between the financial and income tax reporting bases of assets and liabilities based on enacted tax rates and laws. The deferred income tax provision or benefit generally reflects the net change in deferred income tax assets and liabilities during the year, excluding any deferred income tax assets and liabilities of acquired businesses. The current income tax provision reflects the tax consequences of revenues and expenses currently taxable or deductible on various income tax returns for the year reported.
Future Policy Benefits and Reinsurance Receivable
Future policy benefits represent account balances that accrue to the benefit of the policyholders, excluding surrender charges, for universal life and investment annuity products and for long-duration health policies sold to individuals for which some of the premium received in the earlier years is intended to pay benefits to be incurred in future years. As a result of the 2005 sale of the life and annuity business within the Company’s Golden Rule Financial Corporation subsidiary under an indemnity reinsurance arrangement, the Company has maintained a liability associated with the reinsured contracts, as it remains primarily liable to the policyholders, and has recorded a corresponding reinsurance receivable due from the purchaser. As of
December 31, 2012
, the Company had an aggregate
$1.9 billion
reinsurance receivable, of which
$135 million
was recorded in Other Current Receivables and
$1.8 billion
was recorded in Other Assets in the Consolidated Balance Sheets. As of
December 31, 2011
, the Company had an aggregate
$1.9 billion
reinsurance receivable, of which
$125 million
was recorded in Other Current Receivables and
$1.8 billion
was recorded in Other Assets in the Consolidated Balance Sheets. The Company evaluates the financial condition of the reinsurer and only records the reinsurance receivable to the extent of probable recovery. As of December 31, 2012, the reinsurer was rated by A.M. Best as “A+.”
Foreign currency translation
Assets and liabilities of the Company’s foreign operations denominated in non-U.S. dollar functional currencies are translated into U.S. dollars at current exchange rates as of the end of each accounting period. Related revenue and expenses are translated at average exchange rates during the accounting period. The gains or losses resulting from translating foreign currency financial statements into U.S. dollars are included in shareholders’ equity and comprehensive income.
Noncontrolling interests
Noncontrolling interests in the Company’s subsidiaries whose redemption is outside the control of the Company are classified as temporary equity. The redeemable noncontrolling interests are primarily related to holders of Amil Participações S.A. (Amil) shares. Amil was acquired in 2012, see Note 6 for more information. During 2012, the Company purchased noncontrolling interest shares for
$319 million
, of which
$11 million
was recorded as a reduction of Additional Paid-In Capital. For the year
65
ended December 31, 2012, the Company’s net earnings attributable to redeemable noncontrolling interests was nil and other noncontrolling interest activity was not material.
Policy Acquisition Costs
The Company’s short duration health insurance contracts typically have a one-year term and may be canceled by the customer with at least 30 days notice. Costs related to the acquisition and renewal of short duration customer contracts are charged to expense as incurred.
Share-Based Compensation
The Company recognizes compensation expense for share-based awards, including stock options, stock-settled stock appreciation rights (SARs) and restricted stock and restricted stock units (collectively, restricted shares), on a straight-line basis over the related service period (generally the vesting period) of the award, or to an employee’s eligible retirement date under the award agreement, if earlier. Restricted shares vest ratably, primarily over
three
to
four
years and compensation expense related to restricted shares is based on the share price on date of grant. Stock options and SARs vest ratably over
four
to
six
years and may be exercised up to
10
years from the date of grant. Compensation expense related to stock options and SARs is based on the fair value at date of grant, which is estimated on the date of grant using a binomial option-pricing model. Under the Company’s Employee Stock Purchase Plan (ESPP) eligible employees are allowed to purchase the Company’s stock at a discounted price, which is
85%
of the lower market price of the Company’s common stock at the beginning or at the end of the six-month purchase period. Share-based compensation expense for all programs is recognized in Operating Costs in the Company’s Consolidated Statements of Operations.
Net Earnings Per Common Share
The Company computes basic net earnings per common share by dividing net earnings by the weighted-average number of common shares outstanding during the period. The Company determines diluted net earnings per common share using the weighted-average number of common shares outstanding during the period, adjusted for potentially dilutive shares associated with stock options, SARs, restricted shares and the ESPP, using the treasury stock method. The treasury stock method assumes a hypothetical issuance of shares to settle the share-based awards, with the assumed proceeds used to purchase common stock at the average market price for the period. Assumed proceeds include the amount the employee must pay upon exercise, any unrecognized compensation cost and any related excess tax benefit. The difference between the number of shares assumed issued and number of shares assumed purchased represents the dilutive shares.
Recently Adopted Accounting Standards
In May 2011, the Financial Accounting Standards Board (FASB) issued Accounting Standards Update (ASU) No. 2011-04, “Fair Value Measurement (Topic 820): Amendments to Achieve Common Fair Value Measurement and Disclosure Requirements in U.S. GAAP and IFRSs”
(ASU 2011-04). This update provides guidance on how fair value measurement should be applied where existing GAAP already requires or permits fair value measurements. In addition, ASU 2011-04 requires expanded disclosures regarding fair value measurements. ASU 2011-04 became effective for the Company’s fiscal year 2012. The adoption of the measurement guidance of ASU 2011-04 did not have a material impact on the Consolidated Financial Statements. The new disclosures have been included with the Company’s fair value disclosures in Note 4.
In June 2011, the FASB issued ASU No. 2011-05,
“Comprehensive Income (Topic 220) - Presentation of Comprehensive Income” (ASU 2011-05). ASU 2011-05 requires entities to present the total of comprehensive income, the components of net income, and the components of other comprehensive income either in a single continuous statement of comprehensive income or in two separate but consecutive statements and eliminates the option to present the components of other comprehensive income as a part of the statement of equity. ASU 2011-05 became effective for the Company’s fiscal year 2012. The Company presented separate Consolidated Statements of Comprehensive Income, which appear consecutive to the Consolidated Statements of Operations.
The Company has determined that there have been no other recently adopted or issued accounting standards that had or will have a material impact on its Consolidated Financial Statements.
66
3.
Investments
A summary of short-term and long-term investments by major security type is as follows:
|
(in millions)
|
Amortized
Cost
|
Gross
Unrealized
Gains
|
Gross
Unrealized
Losses
|
Fair
Value
|
||||||||||||
|
December 31, 2012
|
||||||||||||||||
|
Debt securities - available-for-sale:
|
||||||||||||||||
|
U.S. government and agency obligations
|
$
|
2,501
|
|
$
|
38
|
|
$
|
(1
|
)
|
$
|
2,538
|
|
||||
|
State and municipal obligations
|
6,282
|
|
388
|
|
(3
|
)
|
6,667
|
|
||||||||
|
Corporate obligations
|
6,930
|
|
283
|
|
(4
|
)
|
7,209
|
|
||||||||
|
U.S. agency mortgage-backed securities
|
2,168
|
|
70
|
|
—
|
|
2,238
|
|
||||||||
|
Non-U.S. agency mortgage-backed securities
|
538
|
|
36
|
|
—
|
|
574
|
|
||||||||
|
Total debt securities - available-for-sale
|
18,419
|
|
815
|
|
(8
|
)
|
19,226
|
|
||||||||
|
Equity securities - available-for-sale
|
668
|
|
10
|
|
(1
|
)
|
677
|
|
||||||||
|
Debt securities - held-to-maturity:
|
||||||||||||||||
|
U.S. government and agency obligations
|
168
|
|
6
|
|
—
|
|
174
|
|
||||||||
|
State and municipal obligations
|
30
|
|
—
|
|
—
|
|
30
|
|
||||||||
|
Corporate obligations
|
641
|
|
2
|
|
—
|
|
643
|
|
||||||||
|
Total debt securities - held-to-maturity
|
839
|
|
8
|
|
—
|
|
847
|
|
||||||||
|
Total investments
|
$
|
19,926
|
|
$
|
833
|
|
$
|
(9
|
)
|
$
|
20,750
|
|
||||
|
December 31, 2011
|
||||||||||||||||
|
Debt securities - available-for-sale:
|
||||||||||||||||
|
U.S. government and agency obligations
|
$
|
2,319
|
|
$
|
54
|
|
$
|
—
|
|
$
|
2,373
|
|
||||
|
State and municipal obligations
|
6,363
|
|
403
|
|
(1
|
)
|
6,765
|
|
||||||||
|
Corporate obligations
|
5,825
|
|
205
|
|
(23
|
)
|
6,007
|
|
||||||||
|
U.S. agency mortgage-backed securities
|
2,279
|
|
74
|
|
—
|
|
2,353
|
|
||||||||
|
Non-U.S. agency mortgage-backed securities
|
476
|
|
28
|
|
—
|
|
504
|
|
||||||||
|
Total debt securities - available-for-sale
|
17,262
|
|
764
|
|
(24
|
)
|
18,002
|
|
||||||||
|
Equity securities - available-for-sale
|
529
|
|
23
|
|
(8
|
)
|
544
|
|
||||||||
|
Debt securities - held-to-maturity:
|
||||||||||||||||
|
U.S. government and agency obligations
|
166
|
|
7
|
|
—
|
|
173
|
|
||||||||
|
State and municipal obligations
|
13
|
|
—
|
|
—
|
|
13
|
|
||||||||
|
Corporate obligations
|
18
|
|
—
|
|
—
|
|
18
|
|
||||||||
|
Total debt securities - held-to-maturity
|
197
|
|
7
|
|
—
|
|
204
|
|
||||||||
|
Total investments
|
$
|
17,988
|
|
$
|
794
|
|
$
|
(32
|
)
|
$
|
18,750
|
|
||||
67
The fair values of the Company’s mortgage-backed securities by credit rating (when multiple credit ratings are available for an individual security, the average of the available ratings is used) and origination as of
December 31, 2012
were as follows:
|
(in millions)
|
AAA
|
AA
|
A
|
Non-Investment
Grade
|
Total Fair
Value
|
|||||||||||||||
|
2012
|
$
|
123
|
|
$
|
—
|
|
$
|
—
|
|
$
|
—
|
|
$
|
123
|
|
|||||
|
2011
|
27
|
|
—
|
|
—
|
|
—
|
|
27
|
|
||||||||||
|
2010
|
—
|
|
3
|
|
—
|
|
—
|
|
3
|
|
||||||||||
|
2007
|
88
|
|
—
|
|
—
|
|
2
|
|
90
|
|
||||||||||
|
2006
|
137
|
|
—
|
|
11
|
|
8
|
|
156
|
|
||||||||||
|
Pre - 2006
|
167
|
|
5
|
|
—
|
|
3
|
|
175
|
|
||||||||||
|
U.S. agency mortgage-backed securities
|
2,238
|
|
—
|
|
—
|
|
—
|
|
2,238
|
|
||||||||||
|
Total
|
$
|
2,780
|
|
$
|
8
|
|
$
|
11
|
|
$
|
13
|
|
$
|
2,812
|
|
|||||
The Company includes in the non-investment grade column in the table above any securities backed by Alt-A or sub-prime mortgages and any commercial mortgage loans in default.
The amortized cost and fair value of available-for-sale debt securities as of
December 31, 2012
, by contractual maturity, were as follows:
|
(in millions)
|
Amortized
Cost
|
Fair
Value
|
||||||
|
Due in one year or less
|
$
|
3,107
|
|
$
|
3,120
|
|
||
|
Due after one year through five years
|
6,249
|
|
6,471
|
|
||||
|
Due after five years through ten years
|
4,695
|
|
5,039
|
|
||||
|
Due after ten years
|
1,662
|
|
1,784
|
|
||||
|
U.S. agency mortgage-backed securities
|
2,168
|
|
2,238
|
|
||||
|
Non-U.S. agency mortgage-backed securities
|
538
|
|
574
|
|
||||
|
Total debt securities - available-for-sale
|
$
|
18,419
|
|
$
|
19,226
|
|
||
The amortized cost and fair value of held-to-maturity debt securities as of
December 31, 2012
, by contractual maturity, were as follows:
|
(in millions)
|
Amortized
Cost
|
Fair
Value
|
||||||
|
Due in one year or less
|
$
|
435
|
|
$
|
436
|
|
||
|
Due after one year through five years
|
126
|
|
129
|
|
||||
|
Due after five years through ten years
|
177
|
|
180
|
|
||||
|
Due after ten years
|
101
|
|
102
|
|
||||
|
Total debt securities - held-to-maturity
|
$
|
839
|
|
$
|
847
|
|
||
68
The fair value of available-for-sale investments with gross unrealized losses by major security type and length of time that individual securities have been in a continuous unrealized loss position were as follows:
|
|
Less Than 12 Months
|
12 Months or Greater
|
Total
|
|||||||||||||||||||||
|
(in millions)
|
Fair
Value
|
Gross
Unrealized
Losses
|
Fair
Value
|
Gross
Unrealized
Losses
|
Fair
Value
|
Gross
Unrealized
Losses
|
||||||||||||||||||
|
December 31, 2012
|
||||||||||||||||||||||||
|
Debt securities - available-for-sale:
|
||||||||||||||||||||||||
|
U.S. Government and Agency Obligations
|
$
|
183
|
|
$
|
(1
|
)
|
$
|
—
|
|
$
|
—
|
|
$
|
183
|
|
$
|
(1
|
)
|
||||||
|
State and municipal obligations
|
362
|
|
(3
|
)
|
—
|
|
—
|
|
362
|
|
(3
|
)
|
||||||||||||
|
Corporate obligations
|
695
|
|
(4
|
)
|
—
|
|
—
|
|
695
|
|
(4
|
)
|
||||||||||||
|
Total debt securities - available-for-sale
|
$
|
1,240
|
|
$
|
(8
|
)
|
$
|
—
|
|
$
|
—
|
|
$
|
1,240
|
|
$
|
(8
|
)
|
||||||
|
Equity securities - available-for-sale
|
$
|
13
|
|
$
|
(1
|
)
|
$
|
—
|
|
$
|
—
|
|
$
|
13
|
|
$
|
(1
|
)
|
||||||
|
December 31, 2011
|
||||||||||||||||||||||||
|
Debt securities - available-for-sale:
|
||||||||||||||||||||||||
|
State and municipal obligations
|
$
|
85
|
|
$
|
(1
|
)
|
$
|
21
|
|
$
|
—
|
|
$
|
106
|
|
$
|
(1
|
)
|
||||||
|
Corporate obligations
|
1,496
|
|
(22
|
)
|
28
|
|
(1
|
)
|
1,524
|
|
(23
|
)
|
||||||||||||
|
Total debt securities - available-for-sale
|
$
|
1,581
|
|
$
|
(23
|
)
|
$
|
49
|
|
$
|
(1
|
)
|
$
|
1,630
|
|
$
|
(24
|
)
|
||||||
|
Equity securities - available-for-sale
|
$
|
24
|
|
$
|
(7
|
)
|
$
|
3
|
|
$
|
(1
|
)
|
$
|
27
|
|
$
|
(8
|
)
|
||||||
The unrealized losses from all securities as of
December 31, 2012
were generated from approximately
1,300
positions out of a total of
18,000
positions. The Company believes that it will collect the principal and interest due on its investments that have an amortized cost in excess of fair value. The unrealized losses were primarily caused by interest rate increases and not by unfavorable changes in the credit ratings associated with these securities. At each reporting period, the Company evaluates securities for impairment when the fair value of the investment is less than its amortized cost. The Company evaluated the underlying credit quality and credit ratings of the issuers, noting neither a significant deterioration since purchase nor other factors leading to an other-than-temporary impairment (OTTI). As of
December 31, 2012
, the Company did not have the intent to sell any of the securities in an unrealized loss position.
A portion of the Company’s investments in equity securities and venture capital funds consists of investments held in various public and nonpublic companies concentrated in the areas of health care services and related information technologies. Market conditions that affect the value of health care and related technology stocks will likewise impact the value of the Company’s equity portfolio. The equity securities and venture capital funds were evaluated for severity and duration of unrealized loss, overall market volatility and other market factors.
Net realized gains included in Investment and Other Income on the Consolidated Statements of Operations were from the following sources:
|
For the Year Ended December 31,
|
||||||||||||
|
(in millions)
|
2012
|
2011
|
2010
|
|||||||||
|
Total OTTI
|
$
|
(6
|
)
|
$
|
(12
|
)
|
$
|
(23
|
)
|
|||
|
Portion of loss recognized in other comprehensive income
|
—
|
|
—
|
|
—
|
|
||||||
|
Net OTTI recognized in earnings
|
(6
|
)
|
(12
|
)
|
(23
|
)
|
||||||
|
Gross realized losses from sales
|
(13
|
)
|
(11
|
)
|
(6
|
)
|
||||||
|
Gross realized gains from sales
|
175
|
|
136
|
|
100
|
|
||||||
|
Net realized gains
|
$
|
156
|
|
$
|
113
|
|
$
|
71
|
|
|||
|
4.
|
Fair Value
|
Certain assets and liabilities are measured at fair value in the Consolidated Financial Statements or have fair values disclosed in the Notes to the Consolidated Financial Statements. These assets and liabilities are classified into one of three levels of a hierarchy defined by GAAP. In instances in which the inputs used to measure fair value fall into different levels of the fair value hierarchy, the fair value measurement is categorized in its entirety based on the lowest level input that is significant to the fair value measurement in its entirety. The Company’s assessment of the significance of a particular item to the fair value measurement in its entirety requires judgment, including the consideration of inputs specific to the asset or liability.
69
The fair value hierarchy is summarized as follows:
Level 1
— Quoted prices (unadjusted) for identical assets/liabilities in active markets.
Level 2
— Other observable inputs, either directly or indirectly, including:
|
•
|
Quoted prices for similar assets/liabilities in active markets;
|
|
•
|
Quoted prices for identical or similar assets/liabilities in non-active markets (e.g., few transactions, limited information, non-current prices, high variability over time);
|
|
•
|
Inputs other than quoted prices that are observable for the asset/liability (e.g., interest rates, yield curves, implied volatilities, credit spreads); and
|
|
•
|
Inputs that are corroborated by other observable market data.
|
Level 3
— Unobservable inputs that cannot be corroborated by observable market data.
Transfers between levels, if any, are recorded as of the beginning of the reporting period in which the transfer occurs; there were
no
transfers between Levels 1, 2 or 3 of any financial assets or liabilities during
2012
or
2011
.
Non-financial assets and liabilities or financial assets and liabilities that are measured at fair value on a nonrecurring basis are subject to fair value adjustments only in certain circumstances, such as when the Company records an impairment. There were no significant fair value adjustments for these assets and liabilities recorded during the years ended
December 31, 2012
,
2011
, and
2010
.
The following methods and assumptions were used to estimate the fair value and determine the fair value hierarchy classification of each class of financial instrument included in the tables below:
Cash and Cash Equivalents.
The carrying value of cash and cash equivalents approximates fair value as maturities are less than three months. Fair values of cash equivalent instruments that do not trade on a regular basis in active markets are classified as Level 2.
Debt and Equity Securities.
Fair values of debt and equity securities are based on quoted market prices, where available. The Company obtains one price for each security primarily from a third-party pricing service (pricing service), which generally uses quoted or other observable inputs for the determination of fair value. The pricing service normally derives the security prices through recently reported trades for identical or similar securities, and, if necessary, makes adjustments through the reporting date based upon available observable market information. For securities not actively traded, the pricing service may use quoted market prices of comparable instruments or discounted cash flow analyses, incorporating inputs that are currently observable in the markets for similar securities. Inputs that are often used in the valuation methodologies include, but are not limited to, benchmark yields, credit spreads, default rates, prepayment speeds and non-binding broker quotes. As the Company is responsible for the determination of fair value, it performs quarterly analyses on the prices received from the pricing service to determine whether the prices are reasonable estimates of fair value. Specifically, the Company compares the prices received from the pricing service to a secondary pricing source, prices reported by its custodian, its investment consultant and third-party investment advisors. Additionally, the Company compares changes in the reported market values and returns to relevant market indices to test the reasonableness of the reported prices. The Company’s internal price verification procedures and reviews of fair value methodology documentation provided by independent pricing services have not historically resulted in adjustment in the prices obtained from the pricing service.
Fair values of debt securities that do not trade on a regular basis in active markets but are priced using other observable inputs are classified as Level 2.
Fair value estimates for Level 1 and Level 2 equity securities are based on quoted market prices for actively traded equity securities and/or other market data for the same or comparable instruments and transactions in establishing the prices.
The Company’s Level 3 equity securities are primarily investments in venture capital securities. The fair values of Level 3 investments in venture capital portfolios are estimated using a market valuation technique that relies heavily on management assumptions and qualitative observations. Under the market approach, the fair values of the Company’s various venture capital investments are computed using limited quantitative and qualitative observations of activity for similar companies in the current market. The Company’s market modeling utilizes, as applicable, transactions for comparable companies in similar industries and having similar revenue and growth characteristics; and similar preferences in their capital structure. Key significant unobservable inputs in the market technique include implied earnings before interest, taxes, depreciation and amortization (EBITDA) multiples and revenue multiples. Additionally, the fair value of certain of the Company’s venture capital securities are based off of recent transactions in inactive markets for identical or similar securities. Significant changes in any of these inputs could result in significantly lower or higher fair value measurements.
Throughout the procedures discussed above in relation to the Company’s processes for validating third party pricing information, the Company validates the understanding of assumptions and inputs used in security pricing and determines the proper classification in the hierarchy based on that understanding.
70
AARP Program-related Investments.
AARP Program-related investments consist of debt and equity securities held to fund costs associated with the AARP Program and are priced and classified using the same methodologies as the Company’s debt and equity securities.
Interest Rate and Currency Swaps.
Fair values of the Company’s swaps are estimated using the terms of the swaps and publicly available information including market yield curves. Because the swaps are unique and not actively traded but are valued using other observable inputs, the fair values are classified as Level 2.
Long-term debt.
The fair value of the Company’s long-term debt is estimated and classified using the same methodologies as the Company’s investments in debt securities.
AARP Program-related Other Liabilities.
AARP Program-related other liabilities consist of liabilities that represent the amount of net investment gains and losses related to AARP Program-related investments that accrue to the benefit of the AARP policyholders.
The following table presents a summary of fair value measurements by level and carrying values for items measured at fair value on a recurring basis in the Consolidated Balance Sheets excluding AARP related assets and liabilities, which are presented in a separate table below:
|
(in millions)
|
Quoted Prices
in Active
Markets
(Level 1)
|
Other
Observable
Inputs
(Level 2)
|
Unobservable
Inputs
(Level 3)
|
Total
Fair and Carrying
Value
|
||||||||||||
|
December 31, 2012
|
||||||||||||||||
|
Cash and cash equivalents
|
$
|
7,615
|
|
$
|
791
|
|
$
|
—
|
|
$
|
8,406
|
|
||||
|
Debt securities - available-for-sale:
|
||||||||||||||||
|
U.S. government and agency obligations
|
1,752
|
|
786
|
|
—
|
|
2,538
|
|
||||||||
|
State and municipal obligations
|
—
|
|
6,667
|
|
—
|
|
6,667
|
|
||||||||
|
Corporate obligations
|
13
|
|
7,185
|
|
11
|
|
7,209
|
|
||||||||
|
U.S. agency mortgage-backed securities
|
—
|
|
2,238
|
|
—
|
|
2,238
|
|
||||||||
|
Non-U.S. agency mortgage-backed securities
|
—
|
|
568
|
|
6
|
|
574
|
|
||||||||
|
Total debt securities - available-for-sale
|
1,765
|
|
17,444
|
|
17
|
|
19,226
|
|
||||||||
|
Equity securities - available-for-sale
|
450
|
|
3
|
|
224
|
|
677
|
|
||||||||
|
Interest rate swap assets
|
—
|
|
14
|
|
—
|
|
14
|
|
||||||||
|
Total assets at fair value
|
|
$
|
9,830
|
|
$
|
18,252
|
|
$
|
241
|
|
$
|
28,323
|
|
|||
|
Percentage of total assets at fair value
|
35
|
%
|
64
|
%
|
1
|
%
|
100
|
%
|
||||||||
|
Interest rate and currency swap liabilities
|
$
|
—
|
|
$
|
14
|
|
$
|
—
|
|
$
|
14
|
|
||||
|
December 31, 2011
|
||||||||||||||||
|
Cash and cash equivalents
|
$
|
8,569
|
|
$
|
860
|
|
$
|
—
|
|
$
|
9,429
|
|
||||
|
Debt securities - available-for-sale:
|
||||||||||||||||
|
U.S. government and agency obligations
|
1,551
|
|
822
|
|
—
|
|
2,373
|
|
||||||||
|
State and municipal obligations
|
—
|
|
6,750
|
|
15
|
|
6,765
|
|
||||||||
|
Corporate obligations
|
16
|
|
5,805
|
|
186
|
|
6,007
|
|
||||||||
|
U.S. agency mortgage-backed securities
|
—
|
|
2,353
|
|
—
|
|
2,353
|
|
||||||||
|
Non-U.S. agency mortgage-backed securities
|
—
|
|
497
|
|
7
|
|
504
|
|
||||||||
|
Total debt securities - available-for-sale
|
1,567
|
|
16,227
|
|
208
|
|
18,002
|
|
||||||||
|
Equity securities - available-for-sale
|
333
|
|
2
|
|
209
|
|
544
|
|
||||||||
|
Total assets at fair value
|
$
|
10,469
|
|
$
|
17,089
|
|
$
|
417
|
|
$
|
27,975
|
|
||||
|
Percentage of total assets at fair value
|
37
|
%
|
61
|
%
|
2
|
%
|
100
|
%
|
||||||||
71
The following table presents a summary of fair value measurements by level and carrying values for certain financial instruments not measured at fair value on a recurring basis in the Consolidated Balance Sheets:
|
(in millions)
|
Quoted Prices
in Active
Markets
(Level 1)
|
Other
Observable
Inputs
(Level 2)
|
Unobservable
Inputs
(Level 3)
|
Total
Fair
Value
|
Total Carrying Value
|
|||||||||||||||
|
December 31, 2012
|
||||||||||||||||||||
|
Debt securities - held-to-maturity:
|
||||||||||||||||||||
|
U.S. government and agency obligations
|
$
|
174
|
|
$
|
—
|
|
$
|
—
|
|
$
|
174
|
|
$
|
168
|
|
|||||
|
State and municipal obligations
|
—
|
|
1
|
|
29
|
|
30
|
|
30
|
|
||||||||||
|
Corporate obligations
|
10
|
|
346
|
|
287
|
|
643
|
|
641
|
|
||||||||||
|
Total debt securities - held-to-maturity
|
$
|
184
|
|
$
|
347
|
|
$
|
316
|
|
$
|
847
|
|
$
|
839
|
|
|||||
|
Long-term debt
|
$
|
—
|
|
$
|
17,034
|
|
$
|
—
|
|
$
|
17,034
|
|
$
|
15,167
|
|
|||||
|
December 31, 2011
|
||||||||||||||||||||
|
Debt securities - held-to-maturity:
|
||||||||||||||||||||
|
U.S. government and agency obligations
|
$
|
173
|
|
$
|
—
|
|
$
|
—
|
|
$
|
173
|
|
$
|
166
|
|
|||||
|
State and municipal obligations
|
—
|
|
1
|
|
12
|
|
13
|
|
13
|
|
||||||||||
|
Corporate obligations
|
9
|
|
9
|
|
—
|
|
18
|
|
18
|
|
||||||||||
|
Total debt securities - held-to-maturity
|
$
|
182
|
|
$
|
10
|
|
$
|
12
|
|
$
|
204
|
|
$
|
197
|
|
|||||
|
Long-term debt
|
$
|
—
|
|
$
|
13,149
|
|
$
|
—
|
|
$
|
13,149
|
|
$
|
11,638
|
|
|||||
The carrying amounts reported in the Consolidated Balance Sheets for accounts and other current receivables, unearned revenues, commercial paper, accounts payable and accrued liabilities approximate fair value because of their short-term nature. These assets and liabilities are not listed in the table above. A reconciliation of the beginning and ending balances of assets measured at fair value on a recurring basis using Level 3 inputs is as follows:
|
|
December 31, 2012
|
December 31, 2011
|
December 31, 2010
|
|||||||||||||||||||||||||||||||||
|
(in millions)
|
Debt
Securities
|
Equity
Securities
|
Total
|
Debt
Securities
|
Equity
Securities
|
Total
|
Debt
Securities
|
Equity
Securities
|
Total
|
|||||||||||||||||||||||||||
|
Balance at beginning of period
|
$
|
208
|
|
$
|
209
|
|
$
|
417
|
|
$
|
141
|
|
$
|
208
|
|
$
|
349
|
|
$
|
120
|
|
$
|
312
|
|
$
|
432
|
|
|||||||||
|
Purchases
|
11
|
|
71
|
|
82
|
|
92
|
|
35
|
|
127
|
|
43
|
|
45
|
|
88
|
|
||||||||||||||||||
|
Sales
|
—
|
|
(34
|
)
|
(34
|
)
|
—
|
|
(17
|
)
|
(17
|
)
|
(4
|
)
|
(167
|
)
|
(171
|
)
|
||||||||||||||||||
|
Settlements
|
(1
|
)
|
—
|
|
(1
|
)
|
(25
|
)
|
(7
|
)
|
(32
|
)
|
(20
|
)
|
—
|
|
(20
|
)
|
||||||||||||||||||
|
Net unrealized (losses) gains in accumulated other comprehensive income
|
—
|
|
(14
|
)
|
(14
|
)
|
—
|
|
(4
|
)
|
(4
|
)
|
—
|
|
9
|
|
9
|
|
||||||||||||||||||
|
Net realized gains (losses) in investment and other income
|
—
|
|
13
|
|
13
|
|
—
|
|
(6
|
)
|
(6
|
)
|
2
|
|
9
|
|
11
|
|
||||||||||||||||||
|
Transfers to held-to-maturity
|
(201
|
)
|
(21
|
)
|
(222
|
)
|
—
|
|
—
|
|
—
|
|
—
|
|
—
|
|
—
|
|
||||||||||||||||||
|
Balance at end of period
|
$
|
17
|
|
$
|
224
|
|
$
|
241
|
|
$
|
208
|
|
$
|
209
|
|
$
|
417
|
|
$
|
141
|
|
$
|
208
|
|
$
|
349
|
|
|||||||||
72
The following table presents quantitative information regarding unobservable inputs that were significant to the valuation of assets measured at fair value on a recurring basis using Level 3 inputs:
|
(in millions)
|
Fair Value
|
Valuation Technique
|
Unobservable Input
|
Low
|
High
|
|||||||
|
December 31, 2012
|
||||||||||||
|
Equity securities - available-for-sale
|
||||||||||||
|
Venture capital portfolios
|
$
|
193
|
|
Market approach - comparable companies
|
Revenue multiple
|
1.0
|
10.0
|
|||||
|
EBITDA
multiple
|
8.0
|
10.0
|
||||||||||
|
31
|
|
Market approach - recent transactions
|
Inactive market transactions
|
N/A
|
N/A
|
|||||||
|
Total equity securities
available-for-sale
|
$
|
224
|
|
|||||||||
Also included in the Company’s assets measured at fair value on a recurring basis using Level 3 inputs were
$17 million
of available-for-sale debt securities at
December 31, 2012
, which were not significant.
The Company elected to measure the entirety of the AARP Assets Under Management at fair value pursuant to the fair value option. See Note 2 for further detail on AARP. The following table presents fair value information about the AARP Program-related financial assets and liabilities:
|
(in millions)
|
Quoted Prices
in Active
Markets
(Level 1)
|
Other
Observable
Inputs
(Level 2)
|
Total
Fair and Carrying
Value
|
|||||||||
|
December 31, 2012
|
||||||||||||
|
Cash and cash equivalents
|
$
|
230
|
|
$
|
—
|
|
$
|
230
|
|
|||
|
Debt securities:
|
||||||||||||
|
U.S. government and agency obligations
|
545
|
|
244
|
|
789
|
|
||||||
|
State and municipal obligations
|
—
|
|
51
|
|
51
|
|
||||||
|
Corporate obligations
|
—
|
|
1,118
|
|
1,118
|
|
||||||
|
U.S. agency mortgage-backed securities
|
—
|
|
427
|
|
427
|
|
||||||
|
Non-U.S. agency mortgage-backed securities
|
—
|
|
155
|
|
155
|
|
||||||
|
Total debt securities
|
545
|
|
1,995
|
|
2,540
|
|
||||||
|
Equity securities - available-for-sale
|
—
|
|
3
|
|
3
|
|
||||||
|
Total assets at fair value
|
$
|
775
|
|
$
|
1,998
|
|
$
|
2,773
|
|
|||
|
Other liabilities
|
$
|
23
|
|
$
|
58
|
|
$
|
81
|
|
|||
|
December 31, 2011
|
||||||||||||
|
Cash and cash equivalents
|
$
|
257
|
|
$
|
10
|
|
$
|
267
|
|
|||
|
Debt securities:
|
||||||||||||
|
U.S. government and agency obligations
|
566
|
|
214
|
|
780
|
|
||||||
|
State and municipal obligations
|
—
|
|
25
|
|
25
|
|
||||||
|
Corporate obligations
|
—
|
|
1,048
|
|
1,048
|
|
||||||
|
U.S. agency mortgage-backed securities
|
—
|
|
436
|
|
436
|
|
||||||
|
Non-U.S. agency mortgage-backed securities
|
—
|
|
150
|
|
150
|
|
||||||
|
Total debt securities
|
566
|
|
1,873
|
|
2,439
|
|
||||||
|
Equity securities - available-for-sale
|
—
|
|
2
|
|
2
|
|
||||||
|
Total assets at fair value
|
$
|
823
|
|
$
|
1,885
|
|
$
|
2,708
|
|
|||
|
Other liabilities
|
$
|
27
|
|
$
|
49
|
|
$
|
76
|
|
|||
73
|
5.
|
Property, Equipment and Capitalized Software
|
A summary of property, equipment and capitalized software is as follows:
|
(in millions)
|
December 31, 2012
|
December 31, 2011
|
||||||
|
Land and improvements
|
$
|
358
|
|
$
|
45
|
|
||
|
Buildings and improvements
|
1,910
|
|
1,052
|
|
||||
|
Computer equipment
|
1,447
|
|
1,345
|
|
||||
|
Furniture and fixtures
|
488
|
|
274
|
|
||||
|
Less accumulated depreciation
|
(1,542
|
)
|
(1,424
|
)
|
||||
|
Property and equipment, net
|
2,661
|
|
1,292
|
|
||||
|
Capitalized software
|
2,300
|
|
2,239
|
|
||||
|
Less accumulated amortization
|
(1,022
|
)
|
(1,016
|
)
|
||||
|
Capitalized software, net
|
1,278
|
|
1,223
|
|
||||
|
Total property, equipment and capitalized software, net
|
$
|
3,939
|
|
$
|
2,515
|
|
||
Depreciation expense for property and equipment for
2012
,
2011
and
2010
was
$449 million
,
$386 million
and
$398 million
, respectively. Amortization expense for capitalized software for
2012
,
2011
and
2010
was
$412 million
,
$377 million
and
$349 million
, respectively.
6. Goodwill and Other Intangible Assets
Changes in the carrying amount of goodwill, by reportable segment, were as follows:
|
(in millions)
|
UnitedHealthcare
|
OptumHealth
|
OptumInsight
|
OptumRx
|
Consolidated
|
|||||||||||||||
|
Balance at January 1, 2011
|
$
|
17,837
|
|
$
|
760
|
|
$
|
3,308
|
|
$
|
840
|
|
$
|
22,745
|
|
|||||
|
Acquisitions
|
101
|
|
1,353
|
|
—
|
|
—
|
|
1,454
|
|
||||||||||
|
Dispositions
|
(2
|
)
|
—
|
|
(214
|
)
|
—
|
|
(216
|
)
|
||||||||||
|
Adjustments, net
|
(4
|
)
|
—
|
|
(4
|
)
|
—
|
|
(8
|
)
|
||||||||||
|
Balance at December 31, 2011
|
17,932
|
|
2,113
|
|
3,090
|
|
840
|
|
23,975
|
|
||||||||||
|
Acquisitions
|
6,557
|
|
705
|
|
98
|
|
—
|
|
7,360
|
|
||||||||||
|
Adjustments and foreign currency effects, net
|
(30
|
)
|
—
|
|
(19
|
)
|
—
|
|
(49
|
)
|
||||||||||
|
Balance at December 31, 2012
|
$
|
24,459
|
|
$
|
2,818
|
|
$
|
3,169
|
|
$
|
840
|
|
$
|
31,286
|
|
|||||
In October 2012, the Company purchased approximately 60% of the outstanding shares of Amil for approximately
$3.2 billion
in a private transaction. Later in the fourth quarter of 2012, the Company purchased an additional
17.8 million
shares of Amil for
$0.3 billion
, bringing the stake in Amil attributable to the Company to approximately 65% of Amil’s outstanding shares. Amil is a health care company located in Brazil, providing health and dental benefits, hospital and clinical services, and advanced care management resources to more than
5 million
people. The total consideration paid and fair value of the noncontrolling interest exceeded the estimated fair value of the net tangible assets acquired by
$5.9 billion
, of which
$1.0 billion
has been allocated to finite-lived intangible assets,
$0.6 billion
to indefinite-lived intangible assets and
$4.3 billion
to goodwill. To estimate the acquisition date fair value of the noncontrolling interest of
$2.2 billion
, the Company utilized the public share price as of the date of acquisition. Contingent liabilities were measured based on the probable amount that could be reasonably estimated. The results of operations and financial condition of Amil have been included in the Company’s consolidated results and the results of the UnitedHealthcare reportable segment since the acquisition date. The pro-forma effects of this acquisition on the Company’s results of operations were not material. In conjunction with the 2012 purchases, the Company generated Brazilian tax deductible goodwill of approximately
$2.7 billion
.
Because of the acquisition of a controlling interest in Amil, the Company is required by Brazilian law to commence a mandatory tender offer for the remaining publicly traded shares. The Company expects to acquire an additional 25% ownership interest during the first half of 2013 through this tender offer. The tender offer price will be at the same price paid to Amil’s controlling shareholders, adjusted for statutory interest under Brazilian law from the date of payment to the controlling shareholders to the date of payment to the tendering minority shareholders. The remaining 10% stake in Amil is held by shareholders, including Amil’s CEO, who has been a member of the Company’s Board of Directors since October 2012, who have committed to retain the shares for at least five years. They have the right to put the shares to the Company and the Company has the right to call these shares upon expiration of the five year term, unless accelerated upon certain events, at fair market value. Related to this acquisition, Amil’s CEO invested approximately
$470 million
in unregistered UnitedHealth Group
74
common shares in the fourth quarter of 2012 and has committed to hold those shares for the same five year term, subject to certain exceptions.
Acquired net tangible assets and liabilities for Amil at acquisition date were:
|
(in millions)
|
||||
|
Cash and cash equivalents
|
$
|
240
|
|
|
|
Investments
|
341
|
|
||
|
Accounts receivable and other current assets
|
207
|
|
||
|
Property, equipment and other long-term assets
|
1,266
|
|
||
|
Medical costs payable
|
586
|
|
||
|
Other current liabilities
|
638
|
|
||
|
Contingent liabilities
|
270
|
|
||
|
Long-term debt and other long-term liabilities
|
569
|
|
||
Since the Amil acquisition occurred in the fourth quarter, the purchase price allocation is subject to adjustment as valuation
analyses, primarily related to intangible and fixed assets and contingent and tax liabilities, are finalized.
For the years ended December 31, 2012, 2011 and 2010, aggregate consideration paid, net of cash assumed, for acquisitions excluding Amil was
$3.3 billion
,
$1.8 billion
and
$2.3 billion
, respectively. These acquisitions were not material to the Company’s Consolidated Financial Statements.
The gross carrying value, accumulated amortization and net carrying value of other intangible assets were as follows:
|
|
December 31, 2012
|
December 31, 2011
|
||||||||||||||||||||||
|
(in millions)
|
Gross Carrying Value
|
Accumulated Amortization
|
Net Carrying Value
|
Gross Carrying Value
|
Accumulated Amortization
|
Net Carrying Value
|
||||||||||||||||||
|
Customer-related
|
$
|
5,229
|
|
$
|
(1,629
|
)
|
$
|
3,600
|
|
$
|
3,766
|
|
$
|
(1,310
|
)
|
$
|
2,456
|
|
||||||
|
Trademarks and technology
|
445
|
|
(146
|
)
|
299
|
|
368
|
|
(98
|
)
|
270
|
|
||||||||||||
|
Trademarks - indefinite-lived
|
611
|
|
—
|
|
611
|
|
—
|
|
—
|
|
—
|
|
||||||||||||
|
Other
|
221
|
|
(49
|
)
|
172
|
|
112
|
|
(43
|
)
|
69
|
|
||||||||||||
|
Total
|
$
|
6,506
|
|
$
|
(1,824
|
)
|
$
|
4,682
|
|
$
|
4,246
|
|
$
|
(1,451
|
)
|
$
|
2,795
|
|
||||||
The acquisition date fair values and weighted-average useful lives assigned to finite-lived intangible assets acquired in business combinations consisted of the following by year of acquisition:
|
|
2012
|
2011
|
||||||||||
|
(in millions, except years)
|
Fair Value
|
Weighted-Average Useful Life
|
Fair Value
|
Weighted-Average Useful Life
|
||||||||
|
Customer-related
|
$
|
1,530
|
|
8 years
|
$
|
187
|
|
9 years
|
||||
|
Trademarks and technology
|
79
|
|
4 years
|
49
|
|
5 years
|
||||||
|
Other
|
111
|
|
15 years
|
5
|
|
15 years
|
||||||
|
Total acquired finite-lived intangible assets
|
$
|
1,720
|
|
9 years
|
$
|
241
|
|
9 years
|
||||
Estimated full year amortization expense relating to intangible assets for each of the next five years ending December 31 is as follows:
|
(in millions)
|
||||
|
2013
|
$
|
545
|
|
|
|
2014
|
527
|
|
||
|
2015
|
506
|
|
||
|
2016
|
480
|
|
||
|
2017
|
456
|
|
||
Amortization expense relating to intangible assets for
2012
,
2011
and
2010
was
$448 million
,
$361 million
and
$317 million
, respectively.
75
|
7.
|
Medical Costs and Medical Costs Payable
|
The following table provides details of the Company’s favorable medical reserve development:
|
For the Years Ended December 31,
|
||||||||||||
|
(in millions)
|
2012
|
2011
|
2010
|
|||||||||
|
Related to Prior Years
|
$
|
860
|
|
$
|
720
|
|
$
|
800
|
|
|||
The favorable development for
2012
,
2011
and
2010
was driven by lower than expected health system utilization levels and increased efficiency in claims handling and processing. The favorable development for
2010
was also impacted by a reduction in reserves needed for disputed claims from care providers; and favorable resolution of certain state-based assessments.
The following table shows the components of the change in medical costs payable for the years ended December 31:
|
(in millions)
|
2012
|
2011
|
2010
|
|||||||||
|
Medical costs payable, beginning of period
|
$
|
9,799
|
|
$
|
9,220
|
|
$
|
9,362
|
|
|||
|
Acquisitions
|
1,029
|
|
155
|
|
—
|
|
||||||
|
Reported medical costs:
|
||||||||||||
|
Current year
|
81,086
|
|
75,052
|
|
69,641
|
|
||||||
|
Prior years
|
(860
|
)
|
(720
|
)
|
(800
|
)
|
||||||
|
Total reported medical costs
|
80,226
|
|
74,332
|
|
68,841
|
|
||||||
|
Claim payments:
|
||||||||||||
|
Payments for current year
|
(71,832
|
)
|
(65,763
|
)
|
(60,949
|
)
|
||||||
|
Payments for prior year
|
(8,218
|
)
|
(8,145
|
)
|
(8,034
|
)
|
||||||
|
Total claim payments
|
(80,050
|
)
|
(73,908
|
)
|
(68,983
|
)
|
||||||
|
Medical costs payable, end of period
|
$
|
11,004
|
|
$
|
9,799
|
|
$
|
9,220
|
|
|||
76
8. Commercial Paper and Long-Term Debt
Commercial paper and long-term debt consisted of the following:
|
|
December 31, 2012
|
December 31, 2011
|
||||||||||||||||||||||
|
(in millions, except percentages)
|
Par
Value
|
Carrying
Value
|
Fair
Value
|
Par
Value
|
Carrying
Value
|
Fair
Value
|
||||||||||||||||||
|
Commercial Paper
|
$
|
1,587
|
|
$
|
1,587
|
|
$
|
1,587
|
|
$
|
—
|
|
$
|
—
|
|
$
|
—
|
|
||||||
|
5.500% senior unsecured notes due November 2012
|
—
|
|
—
|
|
—
|
|
352
|
|
363
|
|
366
|
|
||||||||||||
|
4.875% senior unsecured notes due February 2013
|
534
|
|
534
|
|
536
|
|
534
|
|
540
|
|
556
|
|
||||||||||||
|
4.875% senior unsecured notes due April 2013
|
409
|
|
411
|
|
413
|
|
409
|
|
421
|
|
427
|
|
||||||||||||
|
4.750% senior unsecured notes due February 2014
|
172
|
|
178
|
|
180
|
|
172
|
|
184
|
|
185
|
|
||||||||||||
|
5.000% senior unsecured notes due August 2014
|
389
|
|
411
|
|
414
|
|
389
|
|
423
|
|
424
|
|
||||||||||||
|
4.875% senior unsecured notes due March 2015 (a)
|
416
|
|
444
|
|
453
|
|
416
|
|
458
|
|
460
|
|
||||||||||||
|
0.850% senior unsecured notes due October 2015 (a)
|
625
|
|
623
|
|
627
|
|
—
|
|
—
|
|
—
|
|
||||||||||||
|
5.375% senior unsecured notes due March 2016
|
601
|
|
660
|
|
682
|
|
601
|
|
678
|
|
689
|
|
||||||||||||
|
1.875% senior unsecured notes due November 2016
|
400
|
|
397
|
|
412
|
|
400
|
|
397
|
|
400
|
|
||||||||||||
|
5.360% senior unsecured notes due November 2016
|
95
|
|
95
|
|
110
|
|
95
|
|
95
|
|
110
|
|
||||||||||||
|
6.000% senior unsecured notes due June 2017
|
441
|
|
489
|
|
528
|
|
441
|
|
499
|
|
518
|
|
||||||||||||
|
1.400% senior unsecured notes due October 2017 (a)
|
625
|
|
622
|
|
626
|
|
—
|
|
—
|
|
—
|
|
||||||||||||
|
6.000% senior unsecured notes due November 2017
|
156
|
|
170
|
|
191
|
|
156
|
|
173
|
|
183
|
|
||||||||||||
|
6.000% senior unsecured notes due February 2018
|
1,100
|
|
1,120
|
|
1,339
|
|
1,100
|
|
1,123
|
|
1,308
|
|
||||||||||||
|
3.875% senior unsecured notes due October 2020
|
450
|
|
442
|
|
499
|
|
450
|
|
442
|
|
478
|
|
||||||||||||
|
4.700% senior unsecured notes due February 2021
|
400
|
|
417
|
|
466
|
|
400
|
|
419
|
|
450
|
|
||||||||||||
|
3.375% senior unsecured notes due November 2021 (a)
|
500
|
|
512
|
|
533
|
|
500
|
|
497
|
|
517
|
|
||||||||||||
|
2.875% senior unsecured notes due March 2022
|
1,100
|
|
998
|
|
1,128
|
|
—
|
|
—
|
|
—
|
|
||||||||||||
|
0.000% senior unsecured notes due November 2022
|
15
|
|
9
|
|
11
|
|
1,095
|
|
619
|
|
696
|
|
||||||||||||
|
2.750% senior unsecured notes due February 2023 (a)
|
625
|
|
619
|
|
631
|
|
—
|
|
—
|
|
—
|
|
||||||||||||
|
5.800% senior unsecured notes due March 2036
|
850
|
|
845
|
|
1,025
|
|
850
|
|
844
|
|
1,017
|
|
||||||||||||
|
6.500% senior unsecured notes due June 2037
|
500
|
|
495
|
|
659
|
|
500
|
|
495
|
|
636
|
|
||||||||||||
|
6.625% senior unsecured notes due November 2037
|
650
|
|
645
|
|
860
|
|
650
|
|
645
|
|
834
|
|
||||||||||||
|
6.875% senior unsecured notes due February 2038
|
1,100
|
|
1,084
|
|
1,510
|
|
1,100
|
|
1,084
|
|
1,475
|
|
||||||||||||
|
5.700% senior unsecured notes due October 2040
|
300
|
|
298
|
|
364
|
|
300
|
|
298
|
|
359
|
|
||||||||||||
|
5.950% senior unsecured notes due February 2041
|
350
|
|
348
|
|
440
|
|
350
|
|
348
|
|
430
|
|
||||||||||||
|
4.625% senior unsecured notes due November 2041
|
600
|
|
593
|
|
641
|
|
600
|
|
593
|
|
631
|
|
||||||||||||
|
4.375% senior unsecured notes due March 2042
|
502
|
|
486
|
|
521
|
|
—
|
|
—
|
|
—
|
|
||||||||||||
|
3.950% senior unsecured notes due October 2042
|
625
|
|
611
|
|
622
|
|
—
|
|
—
|
|
—
|
|
||||||||||||
|
Total U.S. Dollar denominated debt
|
16,117
|
|
16,143
|
|
18,008
|
|
11,860
|
|
11,638
|
|
13,149
|
|
||||||||||||
|
Cetip Interbank Deposit Rate (CDI) + 1.3% Subsidiary floating debt due October 2013
|
147
|
|
148
|
|
150
|
|
—
|
|
—
|
|
—
|
|
||||||||||||
|
CDI + 1.45 % Subsidiary floating debt due October 2014
|
147
|
|
149
|
|
150
|
|
—
|
|
—
|
|
—
|
|
||||||||||||
|
110% CDI Subsidiary floating debt due December 2014
|
147
|
|
151
|
|
147
|
|
—
|
|
—
|
|
—
|
|
||||||||||||
|
CDI + 1.6% Subsidiary floating debt due October 2015
|
74
|
|
76
|
|
76
|
|
—
|
|
—
|
|
—
|
|
||||||||||||
|
Brazilian Extended National Consumer Price Index (IPCA) + 7.61% Subsidiary floating debt due October 2015
|
73
|
|
87
|
|
90
|
|
—
|
|
—
|
|
—
|
|
||||||||||||
|
Total Brazilian Real denominated debt (in U.S. Dollars)
|
588
|
|
611
|
|
613
|
|
—
|
|
—
|
|
—
|
|
||||||||||||
|
Total commercial paper and long-term debt
|
$
|
16,705
|
|
$
|
16,754
|
|
$
|
18,621
|
|
$
|
11,860
|
|
$
|
11,638
|
|
$
|
13,149
|
|
||||||
|
(a)
|
In 2012, the Company entered into interest rate swap contracts with a notional amount of
$2.8 billion
hedging these fixed-rate debt instruments. See below for more information on the Company’s interest rate swaps.
|
77
Maturities of commercial paper and long-term debt for the years ending December 31 are as follows:
|
(in millions)
|
||||
|
2013 (a)
|
$
|
2,713
|
|
|
|
2014
|
920
|
|
||
|
2015
|
1,175
|
|
||
|
2016
|
1,152
|
|
||
|
2017
|
1,281
|
|
||
|
Thereafter
|
9,513
|
|
||
|
(a)
|
Includes
$33 million
of debt subject to acceleration clauses.
|
Long-Term Debt
In August 2012, the Company completed an exchange of
$1.1 billion
of its zero coupon senior unsecured notes due November of
2022
for
$0.5 billion
additional issuance of its
2.875%
notes due in March
2022
,
$0.1 billion
additional issuance of its
4.375%
notes due March
2042
and
$0.1 billion
in cash.
Commercial Paper and Bank Credit Facilities
Commercial paper consists of short-duration, senior unsecured debt privately placed on a discount basis through broker-dealers. As of
December 31, 2012
, the Company’s outstanding commercial paper had a weighted-average annual interest rate of
0.3%
.
The Company has
$3.0 billion
five-year and
$1.0 billion
364-day revolving bank credit facility with
21
banks, which mature in
November 2017
and November 2013, respectively. These facilities provide liquidity support for the Company’s
$4.0 billion
commercial paper program and are available for general corporate purposes. There were no amounts outstanding under these facilities as of
December 31, 2012
. The interest rates on borrowings are variable based on term and are calculated based on the London Interbank Offered Rate (LIBOR) plus a credit spread based on the Company’s senior unsecured credit ratings. As of
December 31, 2012
, the annual interest rates on both of the credit facilities, had they been drawn, would have ranged from
1.0%
to
1.3%
.
Debt Covenants
The Company’s bank credit facilities contain various covenants including requiring the Company to maintain a debt to debt-plus-equity ratio not more than
50%
. The Company was in compliance with its debt covenants as of
December 31, 2012
.
Interest Rate and Currency Swap Contracts
In 2012, the Company entered into interest rate swap contracts to convert a portion of its interest rate exposure from fixed rates to floating rates to more closely align interest expense with interest income received on its cash equivalent and variable rate investment balances. The floating rates are benchmarked to LIBOR. The swaps are designated as fair value hedges on the Company’s fixed-rate debt. Since the critical terms of the swaps match those of the debt being hedged, they are assumed to be highly effective hedges and all changes in fair value of the swaps are recorded as an adjustment to the carrying value of the related debt with no net impact recorded in the Consolidated Statements of Operations. Both the hedge fair value changes and the offsetting debt adjustments are recorded in Interest Expense on the Consolidated Statements of Operations. The net fair value of these swaps was
$3 million
at December 31, 2012 and is recorded in Other Long-Term Assets for
$14 million
and Other Long-Term Liabilities for
$11 million
in the Consolidated Balance Sheets.
In December 2012, the Company entered into currency swap contracts to hedge the foreign currency exposure on the principal amount of intercompany borrowings denominated in Brazilian Real. The currency swaps have a notional amount of
$256 million
and mature on December 31, 2013. As of December 31, 2012, the fair value of the currency swap liability was
$3 million
, which was recorded in Other Current Liabilities in the Company’s Consolidated Balance Sheets.
78
|
9.
|
Income Taxes
|
The components of the provision for income taxes for the years ended December 31 are as follows:
|
(in millions)
|
2012
|
2011
|
2010
|
|||||||||
|
Current Provision:
|
|
|
||||||||||
|
Federal
|
$
|
2,638
|
|
$
|
2,608
|
|
$
|
2,524
|
|
|||
|
State and local
|
150
|
|
150
|
|
180
|
|
||||||
|
Total current provision
|
2,788
|
|
2,758
|
|
2,704
|
|
||||||
|
Deferred provision
|
308
|
|
59
|
|
45
|
|
||||||
|
Total provision for income taxes
|
$
|
3,096
|
|
$
|
2,817
|
|
$
|
2,749
|
|
|||
The reconciliation of the tax provision at the U.S. Federal Statutory Rate to the provision for income taxes for the years ended December 31 is as follows:
|
(in millions, except percentages)
|
2012
|
2011
|
2010
|
||||||||||||||||||
|
Tax provision at the U.S. federal statutory rate
|
$
|
3,018
|
|
35.0
|
%
|
$
|
2,785
|
|
35.0
|
%
|
$
|
2,584
|
|
35.0
|
%
|
||||||
|
State income taxes, net of federal benefit
|
143
|
|
1.7
|
|
136
|
|
1.7
|
|
129
|
|
1.7
|
|
|||||||||
|
Settlement of state exams, net of federal benefit
|
2
|
|
—
|
|
(29
|
)
|
(0.4
|
)
|
(3
|
)
|
—
|
|
|||||||||
|
Tax-exempt investment income
|
(59
|
)
|
(0.7
|
)
|
(63
|
)
|
(0.8
|
)
|
(65
|
)
|
(0.9
|
)
|
|||||||||
|
Non-deductible compensation
|
22
|
|
0.2
|
|
10
|
|
0.1
|
|
64
|
|
0.9
|
|
|||||||||
|
Other, net
|
(30
|
)
|
(0.3
|
)
|
(22
|
)
|
(0.2
|
)
|
40
|
|
0.5
|
|
|||||||||
|
Provision for income taxes
|
$
|
3,096
|
|
35.9
|
%
|
$
|
2,817
|
|
35.4
|
%
|
$
|
2,749
|
|
37.2
|
%
|
||||||
The higher effective income tax rate for 2012 as compared to 2011 resulted from the favorable resolution of various tax matters in 2011. The 2010 effective income tax rates were at higher levels due to the cumulative implementation of changes under the Health Reform Legislation.
79
The components of deferred income tax assets and liabilities as of December 31 are as follows:
|
(in millions)
|
2012
|
2011
|
||||||
|
Deferred income tax assets:
|
|
|
||||||
|
Accrued expenses and allowances
|
$
|
306
|
|
$
|
259
|
|
||
|
U.S. Federal and State net operating loss carryforwards
|
276
|
|
247
|
|
||||
|
Share-based compensation
|
238
|
|
417
|
|
||||
|
Long term liabilities
|
160
|
|
155
|
|
||||
|
Medical costs payable and other policy liabilities
|
149
|
|
166
|
|
||||
|
Non-U.S. tax loss carryforwards
|
126
|
|
—
|
|
||||
|
Unearned revenues
|
64
|
|
56
|
|
||||
|
Unrecognized tax benefits
|
25
|
|
44
|
|
||||
|
Domestic other
|
93
|
|
192
|
|
||||
|
Foreign other
|
142
|
|
—
|
|
||||
|
Subtotal
|
1,579
|
|
1,536
|
|
||||
|
Less: valuation allowances
|
(271
|
)
|
(184
|
)
|
||||
|
Total deferred income tax assets
|
1,308
|
|
1,352
|
|
||||
|
Deferred income tax liabilities:
|
||||||||
|
U.S. Federal and State intangible assets
|
(1,335
|
)
|
(1,148
|
)
|
||||
|
Non-U.S. goodwill and intangible assets
|
(640
|
)
|
—
|
|
||||
|
Capitalized software development
|
(482
|
)
|
(465
|
)
|
||||
|
Net unrealized gains on investments
|
(296
|
)
|
(275
|
)
|
||||
|
Depreciation and amortization
|
(249
|
)
|
(256
|
)
|
||||
|
Prepaid expenses
|
(113
|
)
|
(86
|
)
|
||||
|
Foreign other
|
(179
|
)
|
—
|
|
||||
|
Total deferred income tax liabilities
|
(3,294
|
)
|
(2,230
|
)
|
||||
|
Net deferred income tax liabilities
|
$
|
(1,986
|
)
|
$
|
(878
|
)
|
||
Valuation allowances are provided when it is considered more likely than not that deferred tax assets will not be realized. The valuation allowances primarily relate to future tax benefits on certain federal, state and non-U.S. net operating loss carryforwards. Federal net operating loss carryforwards of
$105 million
expire beginning in 2019 through 2032, state net operating loss carryforwards expire beginning in 2013 through 2032. Substantially all of the non-U.S. tax loss carryforwards have indefinite carryforward periods.
As of December 31, 2012 the Company had
$94 million
of undistributed earnings from non-U.S. subsidiaries that are intended to be reinvested in non-U.S. operations. Because these earnings are considered permanently reinvested, no U.S. tax provision has been accrued related to the repatriation of these earnings. It is not practicable to estimate the amount of U.S. tax that might be payable on the eventual remittance of such earnings.
A reconciliation of the beginning and ending amount of unrecognized tax benefits as of December 31 is as follows:
|
(in millions)
|
2012
|
2011
|
2010
|
|||||||||
|
Gross unrecognized tax benefits, beginning of period
|
$
|
129
|
|
$
|
220
|
|
$
|
220
|
|
|||
|
Gross increases:
|
|
|
|
|
||||||||
|
Current year tax positions
|
6
|
|
11
|
|
13
|
|
||||||
|
Prior year tax positions
|
18
|
|
10
|
|
30
|
|
||||||
|
Gross decreases:
|
|
|
|
|
||||||||
|
Prior year tax positions
|
(48
|
)
|
(34
|
)
|
—
|
|
||||||
|
Settlements
|
(10
|
)
|
(25
|
)
|
—
|
|
||||||
|
Statute of limitations lapses
|
(14
|
)
|
(53
|
)
|
(43
|
)
|
||||||
|
Gross unrecognized tax benefits, end of period
|
$
|
81
|
|
$
|
129
|
|
$
|
220
|
|
|||
80
The Company classifies interest and penalties associated with uncertain income tax positions as income taxes within its Consolidated Financial Statements. The Company recognized tax benefits from the net reduction of interest and penalties accrued of
$20 million
and
$12 million
during the years ended
December 31, 2012
and
2011
, respectively. During the year ended
December 31, 2010
, the Company recognized
$15 million
of interest expense and penalties. The Company had
$23 million
and
$41 million
of accrued interest and penalties for uncertain tax positions as of
December 31, 2012
and
2011
, respectively. These amounts are not included in the reconciliation above. As of
December 31, 2012
, the total amount of unrecognized tax benefits that, if recognized, would affect the effective tax rate, was
$77 million
.
The Company currently files income tax returns in the U.S., various states and foreign jurisdictions. The U.S. Internal Revenue Service (IRS) has completed exams on the consolidated income tax returns for fiscal years
2011
and prior. The Company’s
2012
tax year is under advance review by the IRS under its Compliance Assurance Program. With the exception of a few states, the Company is no longer subject to income tax examinations prior to 2007. The Brazilian federal revenue service - Secretaria da Receita Federal (SRF) may audit the Company’s Brazilian subsidiaries for a period of five years from the date on which corporate income taxes should have been paid and/or the date when the tax return was filed. Estimated taxes are paid monthly or quarterly with an annual return due on June 30 following the end of the taxable year.
The Company believes it is reasonably possible that its liability for unrecognized tax benefits will decrease in the next twelve months by
$37 million
as a result of audit settlements and the expiration of statutes of limitations in certain major jurisdictions.
|
10.
|
Shareholders’ Equity
|
Regulatory Capital and Dividend Restrictions
The Company’s regulated subsidiaries are subject to regulations and standards in their respective jurisdictions. These standards, among other things, require these subsidiaries to maintain specified levels of statutory capital, as defined by each jurisdiction, and restrict the timing and amount of dividends and other distributions that may be paid to their parent companies. In the United States, most of these regulations and standards are generally consistent with model regulations established by the National Association of Insurance Commissioners. Except in the case of extraordinary dividends, these standards generally permit dividends to be paid from statutory unassigned surplus of the regulated subsidiary and are limited based on the regulated subsidiary’s level of statutory net income and statutory capital and surplus. These dividends are referred to as “ordinary dividends” and generally can be paid without prior regulatory approval. If the dividend, together with other dividends paid within the preceding twelve months, exceeds a specified statutory limit or is paid from sources other than earned surplus, it is generally considered an “extraordinary dividend” and must receive prior regulatory approval. In 2012, based on the 2011 statutory net income and statutory capital and surplus levels, the maximum amount of ordinary dividends that could have been paid by the Company’s U.S. regulated subsidiaries to their parent companies was
$4.6 billion
.
For the
year ended
December 31, 2012
, the Company’s regulated subsidiaries paid their parent companies dividends of
$4.9 billion
, including
$1.2 billion
of extraordinary dividends. For the year ended
December 31, 2011
, the Company’s regulated subsidiaries paid their parent companies dividends of
$4.5 billion
, including
$1.1 billion
of extraordinary dividends. As of
December 31, 2012
,
$1.1 billion
of the Company’s
$8.4 billion
of cash and cash equivalents was held by non-regulated entities.
The Company’s regulated subsidiaries had estimated aggregate statutory capital and surplus of approximately
$13 billion
as of
December 31, 2012
; regulated entity statutory capital exceeded aggregate minimum capital requirements.
Optum Bank must meet minimum requirements for Tier 1 leverage capital, Tier 1 risk-based capital, and Total risk-based capital of the Federal Deposit Insurance Corporation (FDIC) to be considered “Well Capitalized” under the capital adequacy rules to which it is subject. At
December 31, 2012
, the Company believes that Optum Bank met the FDIC requirements to be considered “Well Capitalized.”
Share Repurchase Program
Under its Board of Directors’ authorization, the Company maintains a share repurchase program. The objectives of the share repurchase program are to optimize the Company’s capital structure and cost of capital, thereby improving returns to shareholders, as well as to offset the dilutive impact of share-based awards. Repurchases may be made from time to time in open market purchases or other types of transactions (including prepaid or structured share repurchase programs), subject to certain Board restrictions. In
June 2012
, the Board renewed and expanded the Company’s share repurchase program with an authorization to repurchase up to
110 million
shares of its common stock. During the year ended
December 31, 2012
, the Company repurchased
57 million
shares at an average price of
$54.45
per share and an aggregate cost of
$3.1 billion
. As of
December 31, 2012
, the Company had Board authorization to purchase up to an additional
85 million
shares of its common stock.
81
Dividends
In
June 2012
, the Company’s Board of Directors increased the Company’s cash dividend to shareholders to an annual dividend rate of
$0.85
per share, paid quarterly. Since
May 2011
, the Company had paid an annual dividend of
$0.65
per share, paid quarterly. Declaration and payment of future quarterly dividends is at the discretion of the Board and may be adjusted as business needs or market conditions change.
The following table provides details of the Company’s dividend payments:
|
Payment Date
|
Amount per Share
|
Total Amount Paid
|
||||||
|
|
|
(in millions)
|
||||||
|
2010
|
$
|
0.4050
|
|
$
|
449
|
|
||
|
2011
|
0.6125
|
|
651
|
|
||||
|
2012
|
0.8000
|
|
820
|
|
||||
|
11.
|
Share-Based Compensation
|
The Company’s outstanding share-based awards consist mainly of non-qualified stock options, SARs and restricted shares. As of
December 31, 2012
, the Company had
43 million
shares available for future grants of share-based awards under its share-based compensation plan, including, but not limited to, incentive or non-qualified stock options, SARs and up to
16 million
of awards in restricted shares. As of
December 31, 2012
, there were also
20 million
shares of common stock available for issuance under the ESPP.
Stock Options and SARs
Stock option and SAR activity for the
year ended
December 31, 2012
is summarized in the table below:
|
Shares
|
Weighted-
Average
Exercise
Price
|
Weighted-
Average
Remaining
Contractual Life
|
Aggregate
Intrinsic Value
|
||||||||||
|
|
(in millions)
|
|
(in years)
|
(in millions)
|
|||||||||
|
Outstanding at beginning of period
|
91
|
|
$
|
42
|
|
||||||||
|
Granted
|
2
|
|
55
|
|
|||||||||
|
Exercised
|
(29
|
)
|
36
|
|
|||||||||
|
Forfeited
|
(1
|
)
|
43
|
|
|||||||||
|
Outstanding at end of period
|
63
|
|
45
|
|
4.0
|
|
$
|
625
|
|
||||
|
Exercisable at end of period
|
53
|
|
46
|
|
3.5
|
|
460
|
|
|||||
|
Vested and expected to vest, end of period
|
62
|
|
45
|
|
4.0
|
|
622
|
|
|||||
Restricted Shares
Restricted share activity for the
year ended
December 31, 2012
is summarized in the table below:
|
(shares in millions)
|
Shares
|
Weighted-Average
Grant Date
Fair Value
per Share
|
|||||
|
Nonvested at beginning of period
|
17
|
|
$
|
36
|
|
||
|
Granted
|
7
|
|
52
|
|
|||
|
Vested
|
(14
|
)
|
37
|
|
|||
|
Forfeited
|
(1
|
)
|
44
|
|
|||
|
Nonvested at end of period
|
9
|
|
46
|
|
|||
82
Other Share-Based Compensation Data
|
(in millions, except per share amounts)
|
For the Years Ended December 31,
|
|||||||||||
|
2012
|
2011
|
2010
|
||||||||||
|
Stock Options and SARs
|
||||||||||||
|
Weighted-average grant date fair value of shares granted, per share
|
$
|
18
|
|
$
|
15
|
|
$
|
13
|
|
|||
|
Total intrinsic value of stock options and SARs exercised
|
559
|
|
327
|
|
164
|
|
||||||
|
Restricted Shares
|
||||||||||||
|
Weighted-average grant date fair value of shares granted, per share
|
52
|
|
42
|
|
32
|
|
||||||
|
Total fair value of restricted shares vested
|
716
|
|
113
|
|
99
|
|
||||||
|
Employee Stock Purchase Plan
|
||||||||||||
|
Number of shares purchased
|
3
|
|
3
|
|
4
|
|
||||||
|
Share-Based Compensation Items
|
||||||||||||
|
Share-based compensation expense, before tax
|
$
|
421
|
|
$
|
401
|
|
$
|
326
|
|
|||
|
Share-based compensation expense, net of tax effects
|
299
|
|
260
|
|
278
|
|
||||||
|
Income tax benefit realized from share-based award exercises
|
461
|
|
170
|
|
78
|
|
||||||
|
(in millions, except years)
|
December 31, 2012
|
|||
|
Unrecognized compensation expense related to share awards
|
$
|
307
|
|
|
|
Weighted-average years to recognize compensation expense
|
1.1
|
|
||
Share-Based Compensation Recognition and Estimates
The principal assumptions the Company used in calculating grant-date fair value for stock options and SARs were as follows:
|
|
2012
|
2011
|
2010
|
||
|
Risk free interest rate
|
0.7% - 0.9%
|
0.9% - 2.3%
|
1.0% - 2.1%
|
||
|
Expected volatility
|
43.2% - 44.0%
|
44.3% - 45.1%
|
45.4% - 46.2%
|
||
|
Expected dividend yield
|
1.2% - 1.7%
|
1.0% - 1.4%
|
0.1% - 1.7%
|
||
|
Forfeiture rate
|
5.0%
|
5.0%
|
5.0%
|
||
|
Expected life in years
|
5.3 - 5.6
|
4.9 - 5.0
|
4.6 - 5.1
|
||
Risk-free interest rates are based on U.S. Treasury yields in effect at the time of grant. Expected volatilities are based on the historical volatility of the Company’s common stock and the implied volatility from exchange-traded options on the Company’s common stock. Expected dividend yields are based on the per share cash dividend paid by the Company’s Board of Directors. The Company uses historical data to estimate option and SAR exercises and forfeitures within the valuation model. The expected lives of options and SARs granted represents the period of time that the awards granted are expected to be outstanding based on historical exercise patterns.
Other Employee Benefit Plans
The Company also offers a 401(k) plan for all employees. Compensation expense related to this plan was not material for the years
2012
,
2011
and
2010
.
In addition, the Company maintains non-qualified, unfunded deferred compensation plans, which allow certain members of senior management and executives to defer portions of their salary or bonus and receive certain Company contributions on such deferrals, subject to plan limitations. The deferrals are recorded within Long-Term Investments with an approximately equal amount in Other Liabilities in the Consolidated Balance Sheets. The total deferrals are distributable based upon termination of employment or other periods, as elected under each plan and were
$348 million
and
$281 million
as of
December 31, 2012
and
2011
, respectively.
83
|
12.
|
Commitments and Contingencies
|
The Company leases facilities and equipment under long-term operating leases that are non-cancelable and expire on various dates through 2028. Rent expense under all operating leases for
2012
,
2011
and
2010
was
$334 million
,
$295 million
and
$297 million
, respectively.
As of
December 31, 2012
, future minimum annual lease payments, net of sublease income, under all non-cancelable operating leases were as follows:
|
(in millions)
|
Future Minimum Lease Payments
|
|||
|
2013
|
$
|
380
|
|
|
|
2014
|
357
|
|
||
|
2015
|
319
|
|
||
|
2016
|
277
|
|
||
|
2017
|
233
|
|
||
|
Thereafter
|
556
|
|
||
The Company provides guarantees related to its service level under certain contracts. If minimum standards are not met, the Company may be financially at risk up to a stated percentage of the contracted fee or a stated dollar amount. None of the amounts accrued, paid or charged to income for service level guarantees were material as of or for the years ended
December 31, 2012
,
2011
and 2010.
As of
December 31, 2012
, the Company had outstanding, undrawn letters of credit with financial institutions of
$45 million
and surety bonds outstanding with insurance companies of
$432 million
, primarily to bond contractual performance.
Legal Matters
Because of the nature of its businesses, the Company is frequently made party to a variety of legal actions and regulatory inquiries, including class actions and suits brought by members, care providers, customers and regulators, relating to the Company’s businesses, including management and administration of health benefit plans and other services. These matters include medical malpractice, employment, intellectual property, antitrust, privacy and contract claims, and claims related to health care benefits coverage and other business practices.
The Company records liabilities for its estimates of probable costs resulting from these matters where appropriate. Estimates of costs resulting from legal and regulatory matters involving the Company are inherently difficult to predict, particularly where the matters: involve indeterminate claims for monetary damages or may involve fines, penalties or punitive damages; present novel legal theories or represent a shift in regulatory policy; involve a large number of claimants or regulatory bodies; are in the early stages of the proceedings; or could result in a change in business practices. Accordingly, the Company is often unable to estimate the losses or ranges of losses for those matters where there is a reasonable possibility or it is probable that a loss may be incurred.
Litigation Matters
Out-of-Network Reimbursement Litigation.
The Company is involved in a number of lawsuits challenging reimbursement amounts for non-network health care services based on the Company’s use of a database previously maintained by Ingenix, Inc. (now known as OptumInsight), including putative class actions and multidistrict litigation brought on behalf of members of Aetna and WellPoint. These suits allege, among other things, that the database licensed to these companies by Ingenix was flawed and that Ingenix conspired with these companies to underpay their members’ claims and seek unspecified damages and treble damages, injunctive and declaratory relief, interest, costs and attorneys’ fees. The Company is vigorously defending these suits. In 2012, the Company was dismissed as a party from a similar lawsuit involving Cigna and its members. The Company cannot reasonably estimate the range of loss, if any, that may result from these matters due to the procedural status of the cases, dispositive motions that remain pending, the absence of class certification in any of the cases, the lack of a formal demand on the Company by the plaintiffs, and the involvement of other insurance companies as defendants.
California Claims Processing Matter.
On January 25, 2008, the California Department of Insurance (CDI) issued an Order to Show Cause to PacifiCare Life and Health Insurance Company, a subsidiary of the Company, alleging violations of certain insurance statutes and regulations related to an alleged failure to include certain language in standard claims correspondence,
84
timeliness and accuracy of claims processing, interest payments, care provider contract implementation, care provider dispute resolution and other related matters. The matter has been the subject of an administrative hearing before a California administrative law judge since December 2009. Although the Company believes that CDI has never issued a penalty in excess of
$8 million
, CDI is seeking a penalty of approximately
$325 million
in this matter. The Company is vigorously defending against the claims in this matter and believes that the penalty requested by CDI is excessive and without merit. After the administrative law judge issues a ruling at the conclusion of the administrative proceeding, expected in early 2013, the California Insurance Commissioner may accept, reject or modify the administrative law judge’s ruling, issue his own decision, and impose a fine or penalty. The Commissioner’s decision is subject to challenge in court. The Company cannot reasonably estimate the range of loss, if any, that may result from this matter given the procedural status of the dispute, the novel legal issues presented (including the legal basis for the majority of the alleged violations), the inherent difficulty in predicting regulatory fines and penalties, and the various remedies and levels of judicial review available to the Company in the event a fine or penalty is assessed.
Government Investigations, Audits and Reviews
The Company has been and is currently involved in various governmental investigations, audits and reviews. These include routine, regular and special investigations, audits and reviews by CMS, state insurance and health and welfare departments, state attorneys general, the Office of the Inspector General (OIG), the Office of Personnel Management, the Office of Civil Rights, the Federal Trade Commission (FTC), U.S. Congressional committees, the U.S. Department of Justice (DOJ), U.S. Attorneys, the Securities and Exchange Commission (SEC), the Brazilian securities regulator - Comissão de Valores Mobiliários (CVM), IRS, SRF, the U.S. Department of Labor (DOL), the FDIC and other governmental authorities. Certain of the Company’s businesses have been reviewed or are currently under review, including for, among other things, compliance with coding and other requirements under the Medicare risk-adjustment model.
In February 2012, CMS announced a final RADV audit and payment adjustment methodology and that it will conduct RADV audits beginning with the 2011 payment year. These audits involve a review of medical records maintained by care providers and may result in retrospective adjustments to payments made to health plans. CMS has not communicated how the final payment adjustment under its methodology will be implemented.
Government actions can result in assessment of damages, civil or criminal fines or penalties, or other sanctions, including loss of licensure or exclusion from participation in government programs and could have a material effect on the Company’s results of operations, financial position and cash flows.
|
13.
|
Segment Financial Information
|
Factors used to determine the Company’s reportable segments include the nature of operating activities, economic characteristics, existence of separate senior management teams and the type of information presented to the Company’s chief operating decision maker to evaluate its results of operations. Reportable segments with similar economic characteristics are combined.
The following is a description of the types of products and services from which each of the Company’s
four
reportable segments derives its revenues:
|
•
|
UnitedHealthcare
includes the combined results of operations of UnitedHealthcare Employer & Individual, UnitedHealthcare Medicare & Retirement, UnitedHealthcare Community & State and UnitedHealthcare International because they have similar economic characteristics, products and services, customers, distribution methods and operational processes and operate in a similar regulatory environment. The U.S. businesses also share significant common assets, including a contracted network of physicians, health care professionals, hospitals and other facilities, information technology infrastructure and other resources. UnitedHealthcare Employer & Individual offers an array of consumer-oriented health benefit plans and services for large national employers, public sector employers, mid-sized employers, small businesses and individuals nationwide and will serve TRICARE West Region members beginning April 1, 2013. UnitedHealthcare Medicare & Retirement provides health care coverage and health and well-being services to individuals age 50 and older, addressing their unique needs for preventive and acute health care services as well as services dealing with chronic disease and other specialized issues for older individuals. UnitedHealthcare Community & State provides health plans and care programs to beneficiaries of acute and long-term care Medicaid plans, the Children’s Health Insurance Program (CHIP), Special Needs Plans, Medicare-Medicaid Eligible beneficiaries eligible for both Medicare and Medicaid and other federal, state and community health care programs. UnitedHealthcare International is a diversified global health services business with a variety of offerings, including international commercial health and dental benefits.
|
85
|
•
|
OptumHealth
serves the physical, emotional and financial needs of individuals, enabling consumer health management and integrated care delivery through programs offered by employers, payers, government entities and directly with the care delivery system. OptumHealth offers access to networks of care provider specialists, health management services, integrated care delivery services, consumer relationship management and sales distribution platform services and financial services.
|
|
•
|
OptumInsight
is a health care information, technology, operational services and consulting company providing software and information products, advisory consulting services, and business process outsourcing services and support to participants in the health care industry. Hospitals, physicians, commercial health plans, government agencies, life sciences companies and other organizations that comprise the health care system work with OptumInsight to reduce costs, meet compliance mandates, improve clinical performance and adapt to the changing health system landscape.
|
|
•
|
OptumRx
offers a multitude of pharmacy benefit management services and programs including claims processing, retail network contracting, rebate contracting and management, clinical programs, such as step therapy, formulary management and disease/drug therapy management programs to achieve a low-cost, high-quality pharmacy benefit. OptumRx also provides patient support programs and dispensing of prescribed medications, including specialty medications, through its mail order pharmacies for its clients’ members.
|
The Company’s accounting policies for reportable segment operations are consistent with those described in the Summary of Significant Accounting Policies (see Note 2). Transactions between reportable segments principally consist of sales of pharmacy benefit products and services to UnitedHealthcare customers by OptumRx, certain product offerings and care management and integrated care delivery services sold to UnitedHealthcare by OptumHealth, and health information and technology solutions, consulting and other services sold to UnitedHealthcare by OptumInsight. These transactions are recorded at management’s estimate of fair value. Intersegment transactions are eliminated in consolidation. Assets and liabilities that are jointly used are assigned to each reportable segment using estimates of pro-rata usage. Cash and investments are assigned such that each reportable segment has working capital and/or at least minimum specified levels of regulatory capital.
As a percentage of the Company’s total consolidated revenues, premium revenues from CMS were
29%
for the year ended
December 31, 2012
,
28%
for year ended
December 31, 2011
, and
27%
for the year ended
December 31, 2010
, most of which were generated by UnitedHealthcare Medicare & Retirement and included in the UnitedHealthcare segment. U.S. customer revenue represented approximately
99%
of consolidated total revenues during 2012. Long-lived fixed assets located in the U.S. represented approximately
70%
of the total long-lived fixed assets as of December 31, 2012.
Corporate and intersegment elimination amounts are presented to reconcile the reportable segment results to the consolidated results. The following table presents the reportable segment financial information:
|
|
|
Optum
|
|
|
||||||||||||||||||||||||
|
(in millions)
|
UnitedHealthcare
|
OptumHealth
|
OptumInsight
|
OptumRx
|
Total Optum
|
Corporate and
Intersegment
Eliminations
|
Consolidated
|
|||||||||||||||||||||
|
2012
|
||||||||||||||||||||||||||||
|
Revenues - external customers:
|
||||||||||||||||||||||||||||
|
Premiums
|
$
|
97,985
|
|
$
|
1,743
|
|
$
|
—
|
|
$
|
—
|
|
$
|
1,743
|
|
$
|
—
|
|
$
|
99,728
|
|
|||||||
|
Services
|
4,867
|
|
767
|
|
1,720
|
|
83
|
|
2,570
|
|
—
|
|
7,437
|
|
||||||||||||||
|
Products
|
—
|
|
21
|
|
87
|
|
2,665
|
|
2,773
|
|
—
|
|
2,773
|
|
||||||||||||||
|
Total revenues - external customers
|
102,852
|
|
2,531
|
|
1,807
|
|
2,748
|
|
7,086
|
|
—
|
|
109,938
|
|
||||||||||||||
|
Total revenues - intersegment
|
—
|
|
5,503
|
|
1,075
|
|
15,611
|
|
22,189
|
|
(22,189
|
)
|
—
|
|
||||||||||||||
|
Investment and other income
|
567
|
|
113
|
|
—
|
|
—
|
|
113
|
|
—
|
|
680
|
|
||||||||||||||
|
Total revenues
|
$
|
103,419
|
|
$
|
8,147
|
|
$
|
2,882
|
|
$
|
18,359
|
|
$
|
29,388
|
|
$
|
(22,189
|
)
|
$
|
110,618
|
|
|||||||
|
Earnings from operations
|
$
|
7,815
|
|
$
|
561
|
|
$
|
485
|
|
$
|
393
|
|
$
|
1,439
|
|
$
|
—
|
|
$
|
9,254
|
|
|||||||
|
Interest expense
|
—
|
|
—
|
|
—
|
|
—
|
|
—
|
|
(632
|
)
|
(632
|
)
|
||||||||||||||
|
Earnings before income taxes
|
$
|
7,815
|
|
$
|
561
|
|
$
|
485
|
|
$
|
393
|
|
$
|
1,439
|
|
$
|
(632
|
)
|
$
|
8,622
|
|
|||||||
|
Total Assets
|
$
|
63,591
|
|
$
|
8,274
|
|
$
|
5,463
|
|
$
|
3,466
|
|
$
|
17,203
|
|
$
|
91
|
|
$
|
80,885
|
|
|||||||
|
Purchases of property, equipment and capitalized software
|
$
|
585
|
|
$
|
184
|
|
$
|
165
|
|
$
|
136
|
|
$
|
485
|
|
$
|
—
|
|
$
|
1,070
|
|
|||||||
|
Depreciation and amortization
|
$
|
794
|
|
$
|
193
|
|
$
|
210
|
|
$
|
112
|
|
$
|
515
|
|
$
|
—
|
|
$
|
1,309
|
|
|||||||
86
|
|
|
Optum
|
|
|
||||||||||||||||||||||||
|
(in millions)
|
UnitedHealthcare
|
OptumHealth
|
OptumInsight
|
OptumRx
|
Total Optum
|
Corporate and
Intersegment
Eliminations
|
Consolidated
|
|||||||||||||||||||||
|
2011
|
||||||||||||||||||||||||||||
|
Revenues - external customers:
|
||||||||||||||||||||||||||||
|
Premiums
|
$
|
90,487
|
|
$
|
1,496
|
|
$
|
—
|
|
$
|
—
|
|
$
|
1,496
|
|
$
|
—
|
|
$
|
91,983
|
|
|||||||
|
Services
|
4,291
|
|
628
|
|
1,616
|
|
78
|
|
2,322
|
|
—
|
|
6,613
|
|
||||||||||||||
|
Products
|
—
|
|
24
|
|
96
|
|
2,492
|
|
2,612
|
|
—
|
|
2,612
|
|
||||||||||||||
|
Total revenues - external customers
|
94,778
|
|
2,148
|
|
1,712
|
|
2,570
|
|
6,430
|
|
—
|
|
101,208
|
|
||||||||||||||
|
Total revenues - intersegment
|
—
|
|
4,461
|
|
958
|
|
16,708
|
|
22,127
|
|
(22,127
|
)
|
—
|
|
||||||||||||||
|
Investment and other income
|
558
|
|
95
|
|
1
|
|
—
|
|
96
|
|
—
|
|
654
|
|
||||||||||||||
|
Total revenues
|
$
|
95,336
|
|
$
|
6,704
|
|
$
|
2,671
|
|
$
|
19,278
|
|
$
|
28,653
|
|
$
|
(22,127
|
)
|
$
|
101,862
|
|
|||||||
|
Earnings from operations
|
$
|
7,203
|
|
$
|
423
|
|
$
|
381
|
|
$
|
457
|
|
$
|
1,261
|
|
$
|
—
|
|
$
|
8,464
|
|
|||||||
|
Interest expense
|
—
|
|
—
|
|
—
|
|
—
|
|
—
|
|
(505
|
)
|
(505
|
)
|
||||||||||||||
|
Earnings before income taxes
|
$
|
7,203
|
|
$
|
423
|
|
$
|
381
|
|
$
|
457
|
|
$
|
1,261
|
|
$
|
(505
|
)
|
$
|
7,959
|
|
|||||||
|
Total Assets
|
$
|
52,618
|
|
$
|
6,756
|
|
$
|
5,308
|
|
$
|
3,503
|
|
$
|
15,567
|
|
$
|
(296
|
)
|
$
|
67,889
|
|
|||||||
|
Purchases of property, equipment and capitalized software
|
$
|
635
|
|
$
|
168
|
|
$
|
175
|
|
$
|
89
|
|
$
|
432
|
|
$
|
—
|
|
$
|
1,067
|
|
|||||||
|
Depreciation and amortization
|
$
|
680
|
|
$
|
154
|
|
$
|
195
|
|
$
|
95
|
|
$
|
444
|
|
$
|
—
|
|
$
|
1,124
|
|
|||||||
|
2010
|
||||||||||||||||||||||||||||
|
Revenues - external customers:
|
||||||||||||||||||||||||||||
|
Premiums
|
$
|
84,158
|
|
$
|
1,247
|
|
$
|
—
|
|
$
|
—
|
|
$
|
1,247
|
|
$
|
—
|
|
$
|
85,405
|
|
|||||||
|
Services
|
4,021
|
|
331
|
|
1,403
|
|
64
|
|
1,798
|
|
—
|
|
5,819
|
|
||||||||||||||
|
Products
|
—
|
|
19
|
|
93
|
|
2,210
|
|
2,322
|
|
—
|
|
2,322
|
|
||||||||||||||
|
Total revenues - external customers
|
88,179
|
|
1,597
|
|
1,496
|
|
2,274
|
|
5,367
|
|
—
|
|
93,546
|
|
||||||||||||||
|
Total revenues - intersegment
|
—
|
|
2,912
|
|
845
|
|
14,449
|
|
18,206
|
|
(18,206
|
)
|
—
|
|
||||||||||||||
|
Investment and other income
|
551
|
|
56
|
|
1
|
|
1
|
|
58
|
|
—
|
|
609
|
|
||||||||||||||
|
Total revenues
|
$
|
88,730
|
|
$
|
4,565
|
|
$
|
2,342
|
|
$
|
16,724
|
|
$
|
23,631
|
|
$
|
(18,206
|
)
|
$
|
94,155
|
|
|||||||
|
Earnings from operations
|
$
|
6,740
|
|
$
|
511
|
|
$
|
84
|
|
$
|
529
|
|
$
|
1,124
|
|
$
|
—
|
|
$
|
7,864
|
|
|||||||
|
Interest expense
|
—
|
|
—
|
|
—
|
|
—
|
|
—
|
|
(481
|
)
|
(481
|
)
|
||||||||||||||
|
Earnings before income taxes
|
$
|
6,740
|
|
$
|
511
|
|
$
|
84
|
|
$
|
529
|
|
$
|
1,124
|
|
$
|
(481
|
)
|
$
|
7,383
|
|
|||||||
|
Total Assets
|
$
|
50,913
|
|
$
|
3,897
|
|
$
|
5,435
|
|
$
|
3,087
|
|
$
|
12,419
|
|
$
|
(269
|
)
|
$
|
63,063
|
|
|||||||
|
Purchases of property, equipment and capitalized software
|
$
|
525
|
|
$
|
117
|
|
$
|
156
|
|
$
|
80
|
|
$
|
353
|
|
$
|
—
|
|
$
|
878
|
|
|||||||
|
Depreciation and amortization
|
$
|
725
|
|
$
|
100
|
|
$
|
159
|
|
$
|
80
|
|
$
|
339
|
|
$
|
—
|
|
$
|
1,064
|
|
|||||||
|
Goodwill impairment
|
$
|
—
|
|
$
|
—
|
|
$
|
172
|
|
$
|
—
|
|
$
|
172
|
|
$
|
—
|
|
$
|
172
|
|
|||||||
87
|
14.
|
Quarterly Financial Data (Unaudited)
|
Selected quarterly financial information for all quarters of
2012
and
2011
is as follows:
|
|
For the Quarter Ended
|
|||||||||||||||
|
(in millions, except per share data)
|
March 31
|
June 30
|
September 30
|
December 31
|
||||||||||||
|
2012
|
||||||||||||||||
|
Revenues
|
$
|
27,282
|
|
$
|
27,265
|
|
$
|
27,302
|
|
$
|
28,769
|
|
||||
|
Operating costs
|
24,965
|
|
25,039
|
|
24,692
|
|
26,668
|
|
||||||||
|
Earnings from operations
|
2,317
|
|
2,226
|
|
2,610
|
|
2,101
|
|
||||||||
|
Net earnings
|
1,388
|
|
1,337
|
|
1,557
|
|
1,244
|
|
||||||||
|
Net earnings per share attributable to UnitedHealth Group common shareholders:
|
||||||||||||||||
|
Basic
|
1.34
|
|
1.30
|
|
1.52
|
|
1.22
|
|
||||||||
|
Diluted
|
1.31
|
|
1.27
|
|
1.50
|
|
1.20
|
|
||||||||
|
2011
|
|
|
|
|
||||||||||||
|
Revenues
|
$
|
25,432
|
|
$
|
25,234
|
|
$
|
25,280
|
|
$
|
25,916
|
|
||||
|
Operating costs
|
23,211
|
|
23,135
|
|
23,210
|
|
23,842
|
|
||||||||
|
Earnings from operations
|
2,221
|
|
2,099
|
|
2,070
|
|
2,074
|
|
||||||||
|
Net earnings
|
1,346
|
|
1,267
|
|
1,271
|
|
1,258
|
|
||||||||
|
Basic net earnings per common share
|
1.24
|
|
1.18
|
|
1.19
|
|
1.19
|
|
||||||||
|
Diluted net earnings per common share
|
1.22
|
|
1.16
|
|
1.17
|
|
1.17
|
|
||||||||
88
ITEM 9.
CHANGES IN AND DISAGREEMENTS WITH ACCOUNTANTS ON ACCOUNTING AND FINANCIAL DISCLOSURE
None.
|
ITEM 9A.
|
CONTROLS AND PROCEDURES
|
EVALUATION OF DISCLOSURE CONTROLS AND PROCEDURES
We maintain disclosure controls and procedures as defined in Rules 13a-15(e) and 15d-15(e) under the Securities Exchange Act of 1934 (Exchange Act) that are designed to provide reasonable assurance that information required to be disclosed by us in reports that we file or submit under the Exchange Act is (i) recorded, processed, summarized and reported within the time periods specified in SEC rules and forms; and (ii) accumulated and communicated to our management, including our principal executive officer and principal financial officer, as appropriate to allow timely decisions regarding required disclosure.
In connection with the filing of this Form 10-K, management evaluated, under the supervision and with the participation of our Chief Executive Officer and Chief Financial Officer, the effectiveness of the design and operation of our disclosure controls and procedures as of
December 31, 2012
. Based upon that evaluation, our Chief Executive Officer and Chief Financial Officer concluded that our disclosure controls and procedures were effective at the reasonable assurance level as of
December 31, 2012
.
CHANGES IN INTERNAL CONTROL OVER FINANCIAL REPORTING
There have been no changes in our internal control over financial reporting during the quarter ended
December 31, 2012
that have materially affected, or are reasonably likely to materially affect, our internal control over financial reporting.
89
Report of Management on Internal Control over Financial Reporting as of
December 31, 2012
The Company’s management is responsible for establishing and maintaining adequate internal control over financial reporting as defined in Rules 13a-15(f) and 15d-15(f) under the Securities Exchange Act of 1934. The Company’s internal control system is designed to provide reasonable assurance to our management and board of directors regarding the reliability of financial reporting and the preparation of consolidated financial statements for external purposes in accordance with generally accepted accounting principles. The Company’s internal control over financial reporting includes those policies and procedures that (i) pertain to the maintenance of records that, in reasonable detail, accurately and fairly reflect the transactions and dispositions of the assets of the Company; (ii) provide reasonable assurance that transactions are recorded as necessary to permit preparation of consolidated financial statements in accordance with generally accepted accounting principles, and that receipts and expenditures of the Company are being made only in accordance with authorizations of management and directors of the Company; and (iii) provide reasonable assurance regarding prevention or timely detection of unauthorized acquisition, use or disposition of the Company’s assets that could have a material effect on the consolidated financial statements.
Because of its inherent limitations, internal control over financial reporting may not prevent or detect misstatements. Also, projections of any evaluation of effectiveness to future periods are subject to the risk that controls may become inadequate because of changes in conditions, or that the degree of compliance with the policies or procedures may deteriorate.
Management assessed the effectiveness of the Company’s internal control over financial reporting as of
December 31, 2012
. In making this assessment, we used the criteria set forth by the Committee of Sponsoring Organizations of the Treadway Commission (COSO) in
Internal Control - Integrated F
ramework. Management’s assessment of the effectiveness of our internal control over financial reporting excluded an assessment of the effectiveness of our internal control over financial reporting of Amil Participações S.A and its subsidiaries (Amil). Such exclusion was in accordance with Securities and Exchange Commission guidance that an assessment of a recently acquired business may be omitted in management’s report on internal control over financial reporting in the year of acquisition. We acquired a controlling interest in Amil during October 2012. Amil represented 10% of our consolidated total assets and 1% of our consolidated total revenues as of and for the year ended December 31, 2012. Based on our assessment and the COSO criteria, we believe that, as of
December 31, 2012
, the Company maintained effective internal control over financial reporting.
The Company’s independent registered public accounting firm has audited the Company’s internal control over financial reporting as of
December 31, 2012
, as stated in the Report of Independent Registered Public Accounting Firm, appearing under Item 9A, which expresses an unqualified opinion on the effectiveness of the Company’s internal controls over financial reporting as of
December 31, 2012
.
90
Report of Independent Registered Public Accounting Firm
To the Board of Directors and Shareholders of UnitedHealth Group Incorporated and Subsidiaries:
We have audited the internal control over financial reporting of UnitedHealth Group Incorporated and Subsidiaries (the “Company”) as of December 31, 2012, based on criteria established in
Internal Control - Integrated Framework
issued by the Committee of Sponsoring Organizations of the Treadway Commission. As described in Report of Management on Internal Control over Financial Reporting as of December 31, 2012, management excluded from its assessment the internal control over financial reporting at Amil Participações S.A and its subsidiaries (Amil), which was acquired during October 2012 and whose financial statements collectively constitute approximately 10% of total assets and 1% of total revenues of the consolidated financial statement amounts as of and for the year ended December 31, 2012. Accordingly, our audit did not include the internal control over financial reporting at Amil. The Company’s management is responsible for maintaining effective internal control over financial reporting and for its assessment of the effectiveness of internal control over financial reporting, included in the accompanying Report of Management on Internal Control Over Financial Reporting as of December 31, 2012. Our responsibility is to express an opinion on the Company’s internal control over financial reporting based on our audit.
We conducted our audit in accordance with the standards of the Public Company Accounting Oversight Board (United States). Those standards require that we plan and perform the audit to obtain reasonable assurance about whether effective internal control over financial reporting was maintained in all material respects. Our audit included obtaining an understanding of internal control over financial reporting, assessing the risk that a material weakness exists, testing and evaluating the design and operating effectiveness of internal control based on the assessed risk, and performing such other procedures as we considered necessary in the circumstances. We believe that our audit provides a reasonable basis for our opinion.
A company’s internal control over financial reporting is a process designed by, or under the supervision of, the company’s principal executive and principal financial officers, or persons performing similar functions, and effected by the company’s board of directors, management, and other personnel to provide reasonable assurance regarding the reliability of financial reporting and the preparation of financial statements for external purposes in accordance with generally accepted accounting principles. A company’s internal control over financial reporting includes those policies and procedures that (1) pertain to the maintenance of records that, in reasonable detail, accurately and fairly reflect the transactions and dispositions of the assets of the company; (2) provide reasonable assurance that transactions are recorded as necessary to permit preparation of financial statements in accordance with generally accepted accounting principles, and that receipts and expenditures of the company are being made only in accordance with authorizations of management and directors of the company; and (3) provide reasonable assurance regarding prevention or timely detection of unauthorized acquisition, use, or disposition of the company’s assets that could have a material effect on the financial statements.
Because of the inherent limitations of internal control over financial reporting, including the possibility of collusion or improper management override of controls, material misstatements due to error or fraud may not be prevented or detected on a timely basis. Also, projections of any evaluation of the effectiveness of the internal control over financial reporting to future periods are subject to the risk that the controls may become inadequate because of changes in conditions, or that the degree of compliance with the policies or procedures may deteriorate.
In our opinion, the Company maintained, in all material respects, effective internal control over financial reporting as of December 31, 2012, based on the criteria established in
Internal Control - Integrated Framework
issued by the Committee of Sponsoring Organizations of the Treadway Commission.
We have also audited, in accordance with the standards of the Public Company Accounting Oversight Board (United States), the consolidated financial statements as of and for the year ended December 31, 2012 of the Company and our reports dated
February 6, 2013
expressed as an unqualified opinion on those consolidated financial statements and financial statement schedule.
|
/s/ DELOITTE & TOUCHE LLP
|
|
Minneapolis, Minnesota
|
|
February 6, 2013
|
91
|
ITEM 9B.
|
OTHER INFORMATION
|
None.
|
ITEM 10.
|
DIRECTORS, EXECUTIVE OFFICERS AND CORPORATE GOVERNANCE
|
Pursuant to General Instruction G(3) to Form 10-K and Instruction 3 to Item 401(b) of Regulation S-K, information regarding our executive officers is provided in Item 1 of Part I of this Annual Report on Form 10-K under the caption “Executive Officers of the Registrant.”
The remaining information required by Items 401, 405, 406 and 407(c)(3), (d)(4) and (d)(5) of Regulation S-K will be included under the headings “Corporate Governance,” “Election of Directors” and “Section 16(a) Beneficial Ownership Reporting Compliance” in our definitive proxy statement for our 2013 Annual Meeting of Shareholders, and such required information is incorporated herein by reference.
|
ITEM 11.
|
EXECUTIVE COMPENSATION
|
The information required by Items 402, 407(e)(4) and (e)(5) of Regulation S-K will be included under the headings “Executive Compensation,” “Director Compensation,” “Corporate Governance - Risk Oversight” and “Compensation Committee Interlocks and Insider Participation” in our definitive proxy statement for our 2013 Annual Meeting of Shareholders, and such required information is incorporated herein by reference.
|
ITEM 12.
|
SECURITY OWNERSHIP OF CERTAIN BENEFICIAL OWNERS AND MANAGEMENT AND RELATED STOCKHOLDER MATTERS
|
Equity Compensation Plan Information
The following table sets forth certain information, as of
December 31, 2012
, concerning shares of common stock authorized for issuance under all of our equity compensation plans:
|
Plan Category
|
(a)
Number of securities
to be issued upon
exercise of
outstanding
options, warrants
and rights
(3)
|
(b)
Weighted-average
exercise
price of
outstanding
options, warrants
and rights
(3)
|
(c)
Number of securities
remaining available for
future issuance under
equity compensation
plans (excluding
securities reflected in
column (a))
|
||||||||
|
(in millions)
|
(in millions)
|
||||||||||
|
Equity compensation plans approved by shareholders
(1)
|
51
|
|
$
|
43
|
|
63
|
|
(4)
|
|||
|
Equity compensation plans not approved by shareholders
(2)
|
—
|
|
—
|
|
—
|
|
|||||
|
Total
(2)
|
51
|
|
$
|
43
|
|
63
|
|
||||
|
(1)
|
Consists of the UnitedHealth Group Incorporated 2011 Stock Incentive Plan, as amended, and the UnitedHealth Group 1993 Employee Stock Purchase Plan, as amended.
|
|
(2)
|
Excludes 0.1 million shares underlying stock options assumed by us in connection with our acquisition of the companies under whose plans the options originally were granted. These options have a weighted-average exercise price of $41 and an average remaining term of approximately 2.1 years. The options are administered pursuant to the terms of the plan under which the option originally was granted. No future awards will be granted under these acquired plans.
|
|
(3)
|
Excludes stock appreciation rights (SARs) to acquire 12 million shares of common stock of the Company with exercise prices above $54.24, the closing price of a share of our common stock as reported on the NYSE on
December 31, 2012
.
|
|
(4)
|
Includes 20 million shares of common stock available for future issuance under the Employee Stock Purchase Plan as of
December 31, 2012
, and 43 million shares available under the 2011 Stock Incentive Plan as of
December 31, 2012
. Shares available under the 2011 Stock Incentive Plan may become the subject of future awards in the form of stock options, SARs, restricted stock, restricted stock units, performance awards and other stock-based awards, except that only 16 million of these shares are available for future grants of awards other than stock options or SARs.
|
The information required by Item 403 of Regulation S-K will be included under the heading “Security Ownership of Certain Beneficial Owners and Management” in our definitive proxy statement for our 2013 Annual Meeting of Shareholders, and such required information is incorporated herein by reference.
92
|
ITEM 13.
|
CERTAIN RELATIONSHIPS AND RELATED TRANSACTIONS, AND DIRECTOR INDEPENDENCE
|
The information required by Items 404 and 407(a) of Regulation S-K will be included under the headings “Certain Relationships and Transactions” and “Corporate Governance” in our definitive proxy statement for our 2013 Annual Meeting of Shareholders, and such required information is incorporated herein by reference.
|
ITEM 14.
|
PRINCIPAL ACCOUNTANT FEES AND SERVICES
|
The information required by Item 9(e) of Schedule 14A will be included under the heading “Independent Registered Public Accounting Firm” in our definitive proxy statement for our 2013 Annual Meeting of Shareholders, and such required information is incorporated herein by reference.
93
ITEM 15.
EXHIBITS AND FINANCIAL STATEMENT SCHEDULES
|
(a)
|
1
. Financial Statements
|
The financial statements are included under Item 8 of this report:
|
•
|
|
•
|
|
•
|
|
•
|
|
•
|
|
•
|
|
•
|
2
. Financial Statement Schedules
The following financial statement schedule of the Company is included in Item 15(c):
All other schedules for which provision is made in the applicable accounting regulations of the SEC are not required under the related instructions, are inapplicable, or the required information is included in the consolidated financial statements, and therefore have been omitted.
(b) The following exhibits are filed in response to Item 601 of Regulation S-K.
EXHIBIT INDEX**
|
3.1
|
|
Third Restated Articles of Incorporation of UnitedHealth Group Incorporated (incorporated by reference to Exhibit 3.1 to UnitedHealth Group Incorporated’s Current Report on Form 8-K dated May 29, 2007)
|
|
|
3.2
|
|
Fourth Amended and Restated Bylaws of UnitedHealth Group Incorporated (incorporated by reference to Exhibit 3.1 to UnitedHealth Group Incorporated’s Current Report on Form 8-K dated October 23, 2009)
|
|
|
4.1
|
|
Senior Indenture, dated as of November 15, 1998, between United HealthCare Corporation and The Bank of New York (incorporated by reference to Exhibit 4.1 to UnitedHealth Group Incorporated’s Registration Statement on Form S-3/A, SEC File Number 333-66013, filed on January 11, 1999)
|
|
|
4.2
|
|
Amendment, dated as of November 6, 2000, to Senior Indenture, dated as of November 15, 1998, between the UnitedHealth Group Incorporated and The Bank of New York (incorporated by reference to Exhibit 4.1 to UnitedHealth Group Incorporated’s Quarterly Report on Form 10-Q for the quarter ended September 30, 2001)
|
|
|
4.3
|
|
Instrument of Resignation, Appointment and Acceptance of Trustee, dated January 8, 2007, pursuant to the Senior Indenture, dated November 15, 1988, amended November 6, 2000, among UnitedHealth Group Incorporated, The Bank of New York and Wilmington Trust Company (incorporated by reference to Exhibit 4.3 to the Company’s Quarterly Report on Form 10-Q for the quarter ended June 30, 2007)
|
|
|
4.4
|
|
Indenture, dated as of February 4, 2008, between UnitedHealth Group Incorporated and U.S. Bank National Association (incorporated by reference to Exhibit 4.1 to UnitedHealth Group Incorporated’s Registration Statement on Form S-3, SEC File Number 333-149031, filed on February 4, 2008)
|
|
|
*10.1
|
|
UnitedHealth Group Incorporated 2011 Stock Incentive Plan, effective May 23, 2011 (incorporated by reference to Exhibit A to UnitedHealth Group Incorporated’s Definitive Proxy Statement dated April 13, 2011)
|
|
|
*10.2
|
|
Form of Agreement for Non-Qualified Stock Option Award to Executives under UnitedHealth Group Incorporated’s 2011 Stock Incentive Plan, effective as of May 24, 2011 (incorporated by reference to Exhibit 10.2 to UnitedHealth Group Incorporated’s Current Report on Form 8-K dated May 23, 2011)
|
|
|
*10.3
|
|
Form of Agreement for Restricted Stock Award to Executives under UnitedHealth Group Incorporated’s 2011 Stock Incentive Plan, effective as of May 24, 2011 (incorporated by reference to Exhibit 10.5 to UnitedHealth Group Incorporated’s Current Report on Form 8-K dated May 23, 2011)
|
|
|
*10.4
|
|
Form of Agreement for Restricted Stock Unit Award to Executives under UnitedHealth Group Incorporated’s 2011 Stock Incentive Plan, effective as of May 24, 2011 (incorporated by reference to Exhibit 10.1 to UnitedHealth Group Incorporated’s Current Report on Form 8-K dated May 23, 2011)
|
|
|
*10.5
|
|
Form of Agreement for Stock Appreciation Rights Award to Executives under UnitedHealth Group Incorporated’s 2011 Stock Incentive Plan, effective as of May 24, 2011 (incorporated by reference to Exhibit 10.4 to UnitedHealth Group Incorporated’s Current Report on Form 8-K dated May 23, 2011)
|
|
94
|
*10.6
|
|
Form of Agreement for Performance-based Restricted Stock Unit Award to Executives under UnitedHealth Group Incorporated’s 2011 Stock Incentive Plan, effective as of May 24, 2011 (incorporated by reference to Exhibit 10.3 to UnitedHealth Group Incorporated’s Current Report on Form 8-K dated May 23, 2011)
|
|
|
*10.7
|
|
Form of Agreement for Initial Deferred Stock Unit Award to Non-Employee Directors under UnitedHealth Group Incorporated’s 2011 Stock Incentive Plan, effective as of May 24, 2011 (incorporated by reference to Exhibit 10.7 to UnitedHealth Group Incorporated’s Current Report on Form 8-K dated May 23, 2011)
|
|
|
*10.8
|
|
Form of Agreement for Deferred Stock Unit Award to Non-Employee Directors under UnitedHealth Group Incorporated’s 2011 Stock Incentive Plan, effective as of May 24, 2011 (incorporated by reference to Exhibit 10.6 to UnitedHealth Group Incorporated’s Current Report on Form 8-K dated May 23, 2011)
|
|
|
*10.9
|
|
Amended and Restated UnitedHealth Group Incorporated Executive Incentive Plan (2009 Statement), effective as of December 31, 2008 (incorporated by reference to Exhibit 10.12 to UnitedHealth Group Incorporated’s Annual Report on Form 10-K for the year ended December 31, 2008)
|
|
|
*10.10
|
|
Amended and Restated UnitedHealth Group Incorporated 2008 Executive Incentive Plan, effective as of December 31, 2008 (incorporated by reference to Exhibit 10.13 to UnitedHealth Group Incorporated’s Annual Report on Form 10-K for the year ended December 31, 2008)
|
|
|
*10.11
|
|
Amendment, dated as of December 21, 2012, of Amended and Restated UnitedHealth Group Incorporated 2008 Executive Incentive Plan
|
|
|
*10.12
|
|
UnitedHealth Group Executive Savings Plan (2004 Statement) (incorporated by reference to Exhibit 10(e) of UnitedHealth Group Incorporated’s Annual Report on Form 10-K for the year ended December 31, 2003)
|
|
|
*10.13
|
|
First Amendment to UnitedHealth Group Executive Savings Plan (2004 Statement) (incorporated by reference to Exhibit 10.3 to UnitedHealth Group Incorporated’s Current Report on Form 8-K dated October 31, 2006)
|
|
|
*10.14
|
|
Second Amendment to UnitedHealth Group Executive Savings Plan (2004 Statement) (incorporated by reference to Exhibit 10.13 to UnitedHealth Group Incorporated’s Annual Report on Form 10-K for the year ended December 31, 2007)
|
|
|
*10.15
|
|
Third Amendment to UnitedHealth Group Executive Savings Plan (2004 Statement) (incorporated by reference to Exhibit 10.17 to UnitedHealth Group Incorporated’s Annual Report on Form 10-K for the year ended December 31, 2008)
|
|
|
*10.16
|
|
Fourth Amendment to UnitedHealth Group Executive Savings Plan (2004 Statement) (incorporated by reference to Exhibit 10.1 of UnitedHealth Group Incorporated’s Quarterly Report on Form 10-Q for the quarter ended September 30, 2010)
|
|
|
*10.17
|
|
Summary of Non-Management Director Compensation, effective as of July 1, 2009 (incorporated by reference to Exhibit 10.1 to UnitedHealth Group Incorporated’s Quarterly Report on Form 10-Q for the quarter ended June 30, 2009)
|
|
|
*10.18
|
|
UnitedHealth Group Directors’ Compensation Deferral Plan (2009 Statement) (incorporated by reference to Exhibit 10.18 to UnitedHealth Group Incorporated’s Annual Report on Form 10-K for the year ended December 31, 2008)
|
|
|
*10.19
|
|
Amendment to the UnitedHealth Group Directors’ Compensation Deferral Plan, effective as of January 1, 2010 (incorporated by reference to Exhibit 10.20 to UnitedHealth Group Incorporated’s Annual Report on Form 10K for the year ended December 31, 2009)
|
|
|
*10.20
|
|
First Amendment to UnitedHealth Group Directors’ Compensation Deferral Plan (incorporated by reference to Exhibit 10.2 to UnitedHealth Group Incorporated’s Quarterly Report on Form 10-Q for the quarter ended September 30, 2010)
|
|
|
*10.21
|
|
Employment Agreement, dated as of November 7, 2006, between UnitedHealth Group Incorporated and Stephen J. Hemsley (incorporated by reference to Exhibit 10.1 to UnitedHealth Group Incorporated’s Current Report on Form 8-K dated November 7, 2006)
|
|
|
*10.22
|
|
Agreement for Supplemental Executive Retirement Pay, effective April 1, 2004, between UnitedHealth Group Incorporated and Stephen J. Hemsley (incorporated by reference to Exhibit 10(b) to UnitedHealth Group Incorporated’s Quarterly Report on Form 10-Q for the quarter ended March 31, 2004)
|
|
|
*10.23
|
|
Amendment to Agreement for Supplemental Executive Retirement Pay, dated as of November 7, 2006, between UnitedHealth Group Incorporated and Stephen J. Hemsley (incorporated by reference to Exhibit A to Exhibit 10.1 to UnitedHealth Group Incorporated’s Current Report on Form 8-K dated November 7, 2006)
|
|
|
*10.24
|
|
Amendment to Employment Agreement and Agreement for Supplemental Executive Retirement Pay, effective as of December 31, 2008, between United HealthCare Services, Inc. and Stephen J. Hemsley (incorporated by reference to Exhibit 10.22 to UnitedHealth Group Incorporated’s Annual Report on Form 10-K for the year ended December 31, 2008)
|
|
|
*10.25
|
|
Letter Agreement, effective as of February 19, 2008, by and between UnitedHealth Group Incorporated and Stephen J. Hemsley (incorporated by reference to Exhibit 10.22 to UnitedHealth Group Incorporated’s Annual Report on Form 10-K for the year ended December 31, 2007)
|
|
95
|
*10.26
|
|
Amendment to Employment Agreement, dated as of December 14, 2010, between UnitedHealth Group Incorporated and Stephen J. Hemsley (incorporated by reference to Exhibit 10.1 to UnitedHealth Group Incorporated’s Current Report on Form 8-K dated December 15, 2010)
|
|
|
*10.27
|
|
Amended and Restated Employment Agreement, dated as of August 8, 2011, between United HealthCare Services, Inc. and Gail K. Boudreaux (incorporated by reference to Exhibit 10.1 to UnitedHealth Group Incorporated’s Quarterly Report on Form 10-Q for the quarter ended September 30, 2011)
|
|
|
*10.28
|
|
Amended and Restated Employment Agreement, dated as of October 25, 2011, between United HealthCare Services, Inc. and Larry C. Renfro (incorporated by reference to Exhibit 10.2 to UnitedHealth Group Incorporated’s Quarterly Report on Form 10-Q for the quarter ended September 30, 2011)
|
|
|
*10.29
|
|
Employment Agreement, effective as of December 1, 2006, between United HealthCare Services, Inc. and David S. Wichmann (incorporated by reference to Exhibit 10.2 to UnitedHealth Group Incorporated’s Quarterly Report on Form 10-Q for the quarter ended March 31, 2008)
|
|
|
*10.30
|
|
Amendment to Employment Agreement, effective as of December 31, 2008, between United HealthCare Services, Inc. and David S. Wichmann (incorporated by reference to Exhibit 10.37 to UnitedHealth Group Incorporated’s Annual Report on Form 10-K for the year ended December 31, 2008)
|
|
|
*10.31
|
|
Amended and Restated Employment Agreement, dated as of March 26, 2012, between United HealthCare Services, Inc. and Larry C. Renfro (incorporated by reference to Exhibit 10.1 to UnitedHealth Group Incorporated’s Quarterly Report on Form 10-Q for the quarter ended March 31, 2012)
|
|
|
*10.32
|
|
Amended Employment Agreement, effective as of November 1, 2012, between Amil Assistência Médica Internacional S.A. and Dr. Edson de Godoy Bueno
|
|
|
*10.33
|
|
Employment Agreement, effective as of June 29, 2007, and amendment thereto, effective as of December 31, 2008, between United HealthCare Services, Inc. and Lori Sweere
|
|
|
*10.34
|
|
Employment Agreement, effective as of April 12, 2007, between United HealthCare Services, Inc. and Anthony Welters (incorporated by reference to Exhibit 10.28 to UnitedHealth Group Incorporated’s Annual Report on Form 10-K for the year ended December 31, 2007)
|
|
|
*10.35
|
|
Amendment to Employment Agreement, effective as of December 31, 2008, between United HealthCare Services, Inc. and Anthony Welters (incorporated by reference to Exhibit 10.35 to UnitedHealth Group Incorporated’s Annual Report on Form 10-K for the year ended December 31, 2008)
|
|
|
*10.36
|
|
Form of Agreement for Non-Qualified Stock Option Award for International Participants under UnitedHealth Group Incorporated's 2011 Stock Incentive Plan
|
|
|
*10.37
|
|
Form of Addendum for Non-Qualified Stock Option Award Agreement for International Participants under UnitedHealth Group Incorporated's 2011 Stock Incentive Plan
|
|
|
11.1
|
|
Statement regarding computation of per share earnings (incorporated by reference to the information contained under the heading “Net Earnings Per Common Share” in Note 2 of Notes to the Consolidated Financial Statements included in Item 8, “Financial Statements”)
|
|
|
12.1
|
|
Ratio of Earnings to Fixed Charges
|
|
|
21.1
|
|
Subsidiaries of UnitedHealth Group Incorporated
|
|
|
23.1
|
|
Consent of Independent Registered Public Accounting Firm
|
|
|
24.1
|
|
Power of Attorney
|
|
|
31.1
|
|
Certifications pursuant to Section 302 of the Sarbanes-Oxley Act of 2002
|
|
|
32.1
|
|
Certifications pursuant to Section 906 of the Sarbanes-Oxley Act of 2002
|
|
|
101
|
|
The following materials from UnitedHealth Group Incorporated’s Annual Report on Form 10-K for the year ended December 31, 2012, filed on February 6, 2013, formatted in XBRL (eXtensible Business Reporting Language): (i) Consolidated Balance Sheets, (ii) Consolidated Statements of Operations, (iii) Consolidated Statements of Comprehensive Income, (iv) Consolidated Statements of Changes in Shareholders’ Equity, (v) Consolidated Statements of Cash Flows, and (vi) Notes to the Consolidated Financial Statements.
|
|
_______________________________________________
_
|
*
|
Denotes management contracts and compensation plans in which certain directors and named executive officers participate and which are being filed pursuant to Item 601(b)(10)(iii)(A) of Regulation S-K.
|
|
|
**
|
Pursuant to Item 601(b)(4)(iii) of Regulation S-K, copies of instruments defining the rights of certain holders of long-term debt are not filed. The Company will furnish copies thereof to the SEC upon request.
|
|
|
(c)
|
Financial Statement Schedule
|
Schedule I - Condensed Financial Information of Registrant (Parent Company Only).
96
Schedule I
Report of Independent Registered Public Accounting Firm
To the Board of Directors and Shareholders of UnitedHealth Group Incorporated and Subsidiaries:
We have audited the consolidated financial statements of UnitedHealth Group Incorporated and Subsidiaries (the “Company”) as of December 31, 2012 and 2011, and for each of the three years in the period ended December 31, 2012, and the Company’s internal control over financial reporting as of December 31, 2012, and have issued our reports thereon dated
February 6, 2013
; such consolidated financial statements and reports are included elsewhere in this Form 10-K. Our audits also included the consolidated financial statement schedule of the Company listed in Item 15. This consolidated financial statement schedule is the responsibility of the Company’s management. Our responsibility is to express an opinion based on our audits. In our opinion, the consolidated financial statement schedule, when considered in relation to the basic consolidated financial statements taken as a whole, present fairly, in all material respects, the information set forth therein.
|
/s/ DELOITTE & TOUCHE LLP
|
|
Minneapolis, Minnesota
|
|
February 6, 2013
|
97
Schedule I
Condensed Financial Information of Registrant
(Parent Company Only)
UnitedHealth Group
Condensed Balance Sheets
|
(in millions, except per share data)
|
December 31,
2012 |
December 31,
2011 |
||||||
|
Assets
|
|
|||||||
|
Current assets:
|
|
|||||||
|
Cash and cash equivalents
|
$
|
1,025
|
|
$
|
1,506
|
|
||
|
Notes receivable from subsidiaries
|
2,889
|
|
—
|
|
||||
|
Deferred income taxes, prepaid expenses and other current assets
|
225
|
|
179
|
|
||||
|
Total current assets
|
4,139
|
|
1,685
|
|
||||
|
Equity in net assets of subsidiaries
|
43,724
|
|
38,688
|
|
||||
|
Other assets
|
106
|
|
77
|
|
||||
|
Total assets
|
$
|
47,969
|
|
$
|
40,450
|
|
||
|
Liabilities and shareholders’ equity
|
||||||||
|
Current liabilities:
|
||||||||
|
Accounts payable and accrued liabilities
|
$
|
356
|
|
$
|
351
|
|
||
|
Note payable to subsidiary
|
175
|
|
145
|
|
||||
|
Commercial paper and current maturities of long-term debt
|
2,541
|
|
982
|
|
||||
|
Total current liabilities
|
3,072
|
|
1,478
|
|
||||
|
Long-term debt, less current maturities
|
13,602
|
|
10,656
|
|
||||
|
Deferred income taxes and other liabilities
|
117
|
|
24
|
|
||||
|
Total liabilities
|
16,791
|
|
12,158
|
|
||||
|
Commitments and contingencies (Note 4)
|
||||||||
|
Shareholders’ equity:
|
||||||||
|
Preferred stock, $0.001 par value -10 shares authorized; no shares issued or outstanding
|
—
|
|
—
|
|
||||
|
Common stock, $0.01 par value - 3,000 shares authorized; 1,019 and 1,039 issued and outstanding
|
10
|
|
10
|
|
||||
|
Additional paid-in capital
|
66
|
|
—
|
|
||||
|
Retained earnings
|
30,664
|
|
27,821
|
|
||||
|
Accumulated other comprehensive income
|
438
|
|
461
|
|
||||
|
Total UnitedHealth Group shareholders’ equity
|
31,178
|
|
28,292
|
|
||||
|
Total liabilities and shareholders’ equity
|
$
|
47,969
|
|
$
|
40,450
|
|
||
See Notes to the Condensed Financial Statements of Registrant
98
Schedule I
Condensed Financial Information of Registrant
(Parent Company Only)
UnitedHealth Group
Condensed Statements of Comprehensive Income
|
|
For the Years Ended December 31,
|
|||||||||||
|
(in millions)
|
2012
|
2011
|
2010
|
|||||||||
|
Revenues:
|
|
|
|
|||||||||
|
Investment and other income
|
$
|
28
|
|
$
|
3
|
|
$
|
2
|
|
|||
|
Total revenues
|
28
|
|
3
|
|
2
|
|
||||||
|
Operating costs:
|
||||||||||||
|
Operating costs
|
(2
|
)
|
25
|
|
54
|
|
||||||
|
Interest expense
|
566
|
|
451
|
|
433
|
|
||||||
|
Total operating costs
|
564
|
|
476
|
|
487
|
|
||||||
|
Loss before income taxes
|
(536
|
)
|
(473
|
)
|
(485
|
)
|
||||||
|
Benefit for income taxes
|
192
|
|
167
|
|
180
|
|
||||||
|
Loss of parent company
|
(344
|
)
|
(306
|
)
|
(305
|
)
|
||||||
|
Equity in undistributed income of subsidiaries
|
5,870
|
|
5,448
|
|
4,939
|
|
||||||
|
Net earnings
|
5,526
|
|
5,142
|
|
4,634
|
|
||||||
|
Other comprehensive (loss) income
|
(23
|
)
|
209
|
|
(1
|
)
|
||||||
|
Comprehensive income
|
$
|
5,503
|
|
$
|
5,351
|
|
$
|
4,633
|
|
|||
See Notes to the Condensed Financial Statements of Registrant
99
Schedule I
Condensed Financial Information of Registrant
(Parent Company Only)
UnitedHealth Group
Condensed Statements of Cash Flows
|
|
For the Years Ended December 31,
|
|||||||||||
|
(in millions)
|
2012
|
2011
|
2010
|
|||||||||
|
Operating activities
|
|
|
|
|||||||||
|
Cash flows from operating activities
|
$
|
6,116
|
|
$
|
5,560
|
|
$
|
3,731
|
|
|||
|
Investing activities
|
||||||||||||
|
Cash paid for acquisitions
|
(3,737
|
)
|
(2,081
|
)
|
(2,470
|
)
|
||||||
|
Capital contributions to subsidiaries
|
(99
|
)
|
(171
|
)
|
(104
|
)
|
||||||
|
Cash flows used for investing activities
|
(3,836
|
)
|
(2,252
|
)
|
(2,574
|
)
|
||||||
|
Financing activities
|
||||||||||||
|
Common stock repurchases
|
(3,084
|
)
|
(2,994
|
)
|
(2,517
|
)
|
||||||
|
Issuance of notes to subsidiaries
|
(4,149
|
)
|
—
|
|
—
|
|
||||||
|
Proceeds from common stock issuance
|
1,078
|
|
381
|
|
272
|
|
||||||
|
Cash dividends paid
|
(820
|
)
|
(651
|
)
|
(449
|
)
|
||||||
|
Proceeds from commercial paper, net
|
1,587
|
|
(933
|
)
|
930
|
|
||||||
|
Proceeds from issuance of long term debt
|
3,966
|
|
2,234
|
|
747
|
|
||||||
|
Repayments of long-term debt
|
(986
|
)
|
(955
|
)
|
(1,583
|
)
|
||||||
|
Interest rate swap termination
|
—
|
|
132
|
|
—
|
|
||||||
|
Proceeds of note from subsidiary
|
30
|
|
15
|
|
30
|
|
||||||
|
Other
|
(383
|
)
|
53
|
|
20
|
|
||||||
|
Cash flows used for financing activities
|
(2,761
|
)
|
(2,718
|
)
|
(2,550
|
)
|
||||||
|
(Decrease) increase in cash and cash equivalents
|
(481
|
)
|
590
|
|
(1,393
|
)
|
||||||
|
Cash and cash equivalents, beginning of period
|
1,506
|
|
916
|
|
2,309
|
|
||||||
|
Cash and cash equivalents, end of period
|
$
|
1,025
|
|
$
|
1,506
|
|
$
|
916
|
|
|||
|
Supplemental cash flow disclosures
|
||||||||||||
|
Cash paid for interest
|
$
|
547
|
|
$
|
418
|
|
$
|
459
|
|
|||
|
Cash paid for income taxes
|
2,666
|
|
2,739
|
|
2,725
|
|
||||||
See Notes to the Condensed Financial Statements of Registrant
100
Schedule I
Condensed Financial Information of Registrant
(Parent Company Only)
UnitedHealth Group
Notes to Condensed Financial Statements
1. Basis of Presentation
UnitedHealth Group’s parent company financial information has been derived from its consolidated financial statements and should be read in conjunction with the consolidated financial statements included in this Form 10-K. The accounting policies for the registrant are the same as those described in the Summary of Significant Accounting Policies in Note 2 of Notes to the Consolidated Financial Statements included in Item 8, “Financial Statements.”
2. Subsidiary Transactions
Investment in Subsidiaries.
UnitedHealth Group’s investment in subsidiaries is stated at cost plus equity in undistributed earnings of subsidiaries.
Notes Receivable from Subsidiaries.
Notes issued to subsidiaries were used primarily to fund acquisitions. During 2012, the parent company completed a non-cash exchange of a
$3.9 billion
intercompany note to a subsidiary for a new term note of
$2.6 billion
and an equity interest of
$1.3 billion
.
Dividends.
Cash dividends received from subsidiaries and included in Cash Flows from Operating Activities in the Condensed Statements of Cash Flows were
$7.8 billion
,
$5.6 billion
and
$4.3 billion
in
2012
,
2011
and
2010
, respectively.
3. Commercial Paper and Long-Term Debt
Maturities of commercial paper and long-term debt for the years ending December 31 are as follows:
|
(in millions)
|
||||
|
2013 (a)
|
$
|
2,541
|
|
|
|
2014
|
589
|
|
||
|
2015
|
1,067
|
|
||
|
2016
|
1,152
|
|
||
|
2017
|
1,281
|
|
||
|
Thereafter
|
9,513
|
|
||
|
(a)
|
Includes
$9 million
of debt subject to acceleration clauses.
|
Long-term debt obligations of the parent company do not include Brazilian real denominated debt of a subsidiary with a total par value of
$588 million
. Further information on commercial paper and long-term debt can be found in Note 8 of Notes to the Consolidated Financial Statements included in Item 8, “Financial Statements.”
4. Commitments and Contingencies
For a summary of commitments and contingencies, see Note 12 of Notes to the Consolidated Financial Statements included in Item 8, “Financial Statements.”
101
SIGNATURES
Pursuant to the requirements of Section 13 or 15(d) of the Securities Exchange Act of 1934, the registrant has duly caused this report to be signed on its behalf by the undersigned, thereunto duly authorized.
Dated:
February 6, 2013
|
UNITEDHEALTH GROUP INCORPORATED
|
|
|
By
|
/s/ STEPHEN J. HEMSLEY
|
|
|
Stephen J. Hemsley
President and Chief Executive Officer
|
Pursuant to the requirements of the Securities Exchange Act of 1934, this report has been signed below by the following persons on behalf of the registrant and in the capacities and on the dates indicated.
|
Signature
|
Title
|
Date
|
||
|
/s/ STEPHEN J. HEMSLEY
|
Director, President and
Chief Executive Officer
(principal executive officer)
|
February 6, 2013
|
||
|
Stephen J. Hemsley
|
||||
|
/s/ DAVID S. WICHMANN
|
Executive Vice President and
Chief Financial Officer of UnitedHealth Group and President of UnitedHealth Group Operations
(principal financial officer)
|
February 6, 2013
|
||
|
David S. Wichmann
|
||||
|
/s/ ERIC S. RANGEN
|
Senior Vice President and
Chief Accounting Officer
(principal accounting officer)
|
February 6, 2013
|
||
|
Eric S. Rangen
|
||||
|
*
|
Director
|
February 6, 2013
|
||
|
William C. Ballard, Jr.
|
||||
|
*
|
Director
|
February 6, 2013
|
||
|
Richard T. Burke
|
||||
|
*
|
Director
|
February 6, 2013
|
||
|
Edson Bueno
|
||||
|
*
|
Director
|
February 6, 2013
|
||
|
Robert J. Darretta
|
||||
|
*
|
Director
|
February 6, 2013
|
||
|
Michele J. Hooper
|
||||
|
*
|
Director
|
February 6, 2013
|
||
|
Rodger A. Lawson
|
||||
|
*
|
Director
|
February 6, 2013
|
||
|
Douglas W. Leatherdale
|
||||
|
*
|
Director
|
February 6, 2013
|
||
|
Glenn M. Renwick
|
||||
|
*
|
Director
|
February 6, 2013
|
||
|
Kenneth I. Shine
|
||||
|
*
|
Director
|
February 6, 2013
|
||
|
Gail R. Wilensky
|
||||
|
*By
|
/s/ MARIANNE D. SHORT
|
|
|
Marianne D. Short,
As Attorney-in-Fact
|
102
EXHIBIT INDEX**
|
3.1
|
|
Third Restated Articles of Incorporation of UnitedHealth Group Incorporated (incorporated by reference to Exhibit 3.1 to UnitedHealth Group Incorporated’s Current Report on Form 8-K dated May 29, 2007)
|
|
|
3.2
|
|
Fourth Amended and Restated Bylaws of UnitedHealth Group Incorporated (incorporated by reference to Exhibit 3.1 to UnitedHealth Group Incorporated’s Current Report on Form 8-K dated October 23, 2009)
|
|
|
4.1
|
|
Senior Indenture, dated as of November 15, 1998, between United HealthCare Corporation and The Bank of New York (incorporated by reference to Exhibit 4.1 to UnitedHealth Group Incorporated’s Registration Statement on Form S-3/A, SEC File Number 333-66013, filed on January 11, 1999)
|
|
|
4.2
|
|
Amendment, dated as of November 6, 2000, to Senior Indenture, dated as of November 15, 1998, between the UnitedHealth Group Incorporated and The Bank of New York (incorporated by reference to Exhibit 4.1 to UnitedHealth Group Incorporated’s Quarterly Report on Form 10-Q for the quarter ended September 30, 2001)
|
|
|
4.3
|
|
Instrument of Resignation, Appointment and Acceptance of Trustee, dated January 8, 2007, pursuant to the Senior Indenture, dated November 15, 1988, amended November 6, 2000, among UnitedHealth Group Incorporated, The Bank of New York and Wilmington Trust Company (incorporated by reference to Exhibit 4.3 to the Company’s Quarterly Report on Form 10-Q for the quarter ended June 30, 2007)
|
|
|
4.4
|
|
Indenture, dated as of February 4, 2008, between UnitedHealth Group Incorporated and U.S. Bank National Association (incorporated by reference to Exhibit 4.1 to UnitedHealth Group Incorporated’s Registration Statement on Form S-3, SEC File Number 333-149031, filed on February 4, 2008)
|
|
|
*10.1
|
|
UnitedHealth Group Incorporated 2011 Stock Incentive Plan, effective May 23, 2011 (incorporated by reference to Exhibit A to UnitedHealth Group Incorporated’s Definitive Proxy Statement dated April 13, 2011)
|
|
|
*10.2
|
|
Form of Agreement for Non-Qualified Stock Option Award to Executives under UnitedHealth Group Incorporated’s 2011 Stock Incentive Plan, effective as of May 24, 2011 (incorporated by reference to Exhibit 10.2 to UnitedHealth Group Incorporated’s Current Report on Form 8-K dated May 23, 2011)
|
|
|
*10.3
|
|
Form of Agreement for Restricted Stock Award to Executives under UnitedHealth Group Incorporated’s 2011 Stock Incentive Plan, effective as of May 24, 2011 (incorporated by reference to Exhibit 10.5 to UnitedHealth Group Incorporated’s Current Report on Form 8-K dated May 23, 2011)
|
|
|
*10.4
|
|
Form of Agreement for Restricted Stock Unit Award to Executives under UnitedHealth Group Incorporated’s 2011 Stock Incentive Plan, effective as of May 24, 2011 (incorporated by reference to Exhibit 10.1 to UnitedHealth Group Incorporated’s Current Report on Form 8-K dated May 23, 2011)
|
|
|
*10.5
|
|
Form of Agreement for Stock Appreciation Rights Award to Executives under UnitedHealth Group Incorporated’s 2011 Stock Incentive Plan, effective as of May 24, 2011 (incorporated by reference to Exhibit 10.4 to UnitedHealth Group Incorporated’s Current Report on Form 8-K dated May 23, 2011)
|
|
|
*10.6
|
|
Form of Agreement for Performance-based Restricted Stock Unit Award to Executives under UnitedHealth Group Incorporated’s 2011 Stock Incentive Plan, effective as of May 24, 2011 (incorporated by reference to Exhibit 10.3 to UnitedHealth Group Incorporated’s Current Report on Form 8-K dated May 23, 2011)
|
|
|
*10.7
|
|
Form of Agreement for Initial Deferred Stock Unit Award to Non-Employee Directors under UnitedHealth Group Incorporated’s 2011 Stock Incentive Plan, effective as of May 24, 2011 (incorporated by reference to Exhibit 10.7 to UnitedHealth Group Incorporated’s Current Report on Form 8-K dated May 23, 2011)
|
|
|
*10.8
|
|
Form of Agreement for Deferred Stock Unit Award to Non-Employee Directors under UnitedHealth Group Incorporated’s 2011 Stock Incentive Plan, effective as of May 24, 2011 (incorporated by reference to Exhibit 10.6 to UnitedHealth Group Incorporated’s Current Report on Form 8-K dated May 23, 2011)
|
|
|
*10.9
|
|
Amended and Restated UnitedHealth Group Incorporated Executive Incentive Plan (2009 Statement), effective as of December 31, 2008 (incorporated by reference to Exhibit 10.12 to UnitedHealth Group Incorporated’s Annual Report on Form 10-K for the year ended December 31, 2008)
|
|
|
*10.10
|
|
Amended and Restated UnitedHealth Group Incorporated 2008 Executive Incentive Plan, effective as of December 31, 2008 (incorporated by reference to Exhibit 10.13 to UnitedHealth Group Incorporated’s Annual Report on Form 10-K for the year ended December 31, 2008)
|
|
|
*10.11
|
|
Amendment, dated as of December 21, 2012, of Amended and Restated UnitedHealth Group Incorporated 2008 Executive Incentive Plan
|
|
|
*10.12
|
|
UnitedHealth Group Executive Savings Plan (2004 Statement) (incorporated by reference to Exhibit 10(e) of UnitedHealth Group Incorporated’s Annual Report on Form 10-K for the year ended December 31, 2003)
|
|
|
*10.13
|
|
First Amendment to UnitedHealth Group Executive Savings Plan (2004 Statement) (incorporated by reference to Exhibit 10.3 to UnitedHealth Group Incorporated’s Current Report on Form 8-K dated October 31, 2006)
|
|
|
*10.14
|
|
Second Amendment to UnitedHealth Group Executive Savings Plan (2004 Statement) (incorporated by reference to Exhibit 10.13 to UnitedHealth Group Incorporated’s Annual Report on Form 10-K for the year ended December 31, 2007)
|
|
103
|
*10.15
|
|
Third Amendment to UnitedHealth Group Executive Savings Plan (2004 Statement) (incorporated by reference to Exhibit 10.17 to UnitedHealth Group Incorporated’s Annual Report on Form 10-K for the year ended December 31, 2008)
|
|
|
*10.16
|
|
Fourth Amendment to UnitedHealth Group Executive Savings Plan (2004 Statement) (incorporated by reference to Exhibit 10.1 of UnitedHealth Group Incorporated’s Quarterly Report on Form 10-Q for the quarter ended September 30, 2010)
|
|
|
*10.17
|
|
Summary of Non-Management Director Compensation, effective as of July 1, 2009 (incorporated by reference to Exhibit 10.1 to UnitedHealth Group Incorporated’s Quarterly Report on Form 10-Q for the quarter ended June 30, 2009)
|
|
|
*10.18
|
|
UnitedHealth Group Directors’ Compensation Deferral Plan (2009 Statement) (incorporated by reference to Exhibit 10.18 to UnitedHealth Group Incorporated’s Annual Report on Form 10-K for the year ended December 31, 2008)
|
|
|
*10.19
|
|
Amendment to the UnitedHealth Group Directors’ Compensation Deferral Plan, effective as of January 1, 2010 (incorporated by reference to Exhibit 10.20 to UnitedHealth Group Incorporated’s Annual Report on Form 10K for the year ended December 31, 2009)
|
|
|
*10.20
|
|
First Amendment to UnitedHealth Group Directors’ Compensation Deferral Plan (incorporated by reference to Exhibit 10.2 to UnitedHealth Group Incorporated’s Quarterly Report on Form 10-Q for the quarter ended September 30, 2010)
|
|
|
*10.21
|
|
Employment Agreement, dated as of November 7, 2006, between UnitedHealth Group Incorporated and Stephen J. Hemsley (incorporated by reference to Exhibit 10.1 to UnitedHealth Group Incorporated’s Current Report on Form 8-K dated November 7, 2006)
|
|
|
*10.22
|
|
Agreement for Supplemental Executive Retirement Pay, effective April 1, 2004, between UnitedHealth Group Incorporated and Stephen J. Hemsley (incorporated by reference to Exhibit 10(b) to UnitedHealth Group Incorporated’s Quarterly Report on Form 10-Q for the quarter ended March 31, 2004)
|
|
|
*10.23
|
|
Amendment to Agreement for Supplemental Executive Retirement Pay, dated as of November 7, 2006, between UnitedHealth Group Incorporated and Stephen J. Hemsley (incorporated by reference to Exhibit A to Exhibit 10.1 to UnitedHealth Group Incorporated’s Current Report on Form 8-K dated November 7, 2006)
|
|
|
*10.24
|
|
Amendment to Employment Agreement and Agreement for Supplemental Executive Retirement Pay, effective as of December 31, 2008, between United HealthCare Services, Inc. and Stephen J. Hemsley (incorporated by reference to Exhibit 10.22 to UnitedHealth Group Incorporated’s Annual Report on Form 10-K for the year ended December 31, 2008)
|
|
|
*10.25
|
|
Letter Agreement, effective as of February 19, 2008, by and between UnitedHealth Group Incorporated and Stephen J. Hemsley (incorporated by reference to Exhibit 10.22 to UnitedHealth Group Incorporated’s Annual Report on Form 10-K for the year ended December 31, 2007)
|
|
|
*10.26
|
|
Amendment to Employment Agreement, dated as of December 14, 2010, between UnitedHealth Group Incorporated and Stephen J. Hemsley (incorporated by reference to Exhibit 10.1 to UnitedHealth Group Incorporated’s Current Report on Form 8-K dated December 15, 2010)
|
|
|
*10.27
|
|
Amended and Restated Employment Agreement, dated as of August 8, 2011, between United HealthCare Services, Inc. and Gail K. Boudreaux (incorporated by reference to Exhibit 10.1 to UnitedHealth Group Incorporated’s Quarterly Report on Form 10-Q for the quarter ended September 30, 2011)
|
|
|
*10.28
|
|
Amended and Restated Employment Agreement, dated as of October 25, 2011, between United HealthCare Services, Inc. and Larry C. Renfro (incorporated by reference to Exhibit 10.2 to UnitedHealth Group Incorporated’s Quarterly Report on Form 10-Q for the quarter ended September 30, 2011)
|
|
|
*10.29
|
|
Employment Agreement, effective as of December 1, 2006, between United HealthCare Services, Inc. and David S. Wichmann (incorporated by reference to Exhibit 10.2 to UnitedHealth Group Incorporated’s Quarterly Report on Form 10-Q for the quarter ended March 31, 2008)
|
|
|
*10.30
|
|
Amendment to Employment Agreement, effective as of December 31, 2008, between United HealthCare Services, Inc. and David S. Wichmann (incorporated by reference to Exhibit 10.37 to UnitedHealth Group Incorporated’s Annual Report on Form 10-K for the year ended December 31, 2008)
|
|
|
*10.31
|
|
Amended and Restated Employment Agreement, dated as of March 26, 2012, between United HealthCare Services, Inc. and Larry C. Renfro (incorporated by reference to Exhibit 10.1 to UnitedHealth Group Incorporated’s Quarterly Report on Form 10-Q for the quarter ended March 31, 2012)
|
|
|
*10.32
|
|
Amended Employment Agreement, effective as of November 1, 2012, between Amil Assistência Médica Internacional S.A. and Dr. Edson de Godoy Bueno
|
|
|
*10.33
|
|
Employment Agreement, effective as of June 29, 2007, and amendment thereto, effective as of December 31, 2008, between United HealthCare Services, Inc. and Lori Sweere
|
|
|
*10.34
|
|
Employment Agreement, effective as of April 12, 2007, between United HealthCare Services, Inc. and Anthony Welters (incorporated by reference to Exhibit 10.28 to UnitedHealth Group Incorporated’s Annual Report on Form 10-K for the year ended December 31, 2007)
|
|
104
|
*10.35
|
|
Amendment to Employment Agreement, effective as of December 31, 2008, between United HealthCare Services, Inc. and Anthony Welters (incorporated by reference to Exhibit 10.35 to UnitedHealth Group Incorporated’s Annual Report on Form 10-K for the year ended December 31, 2008)
|
|
|
*10.36
|
|
Form of Agreement for Non-Qualified Stock Option Award for International Participants under UnitedHealth Group Incorporated's 2011 Stock Incentive Plan
|
|
|
*10.37
|
|
Form of Addendum for Non-Qualified Stock Option Award Agreement for International Participants under UnitedHealth Group Incorporated's 2011 Stock Incentive Plan
|
|
|
11.1
|
|
Statement regarding computation of per share earnings (incorporated by reference to the information contained under the heading “Net Earnings Per Common Share” in Note 2 of Notes to the Consolidated Financial Statements included in Item 8, “Financial Statements”)
|
|
|
12.1
|
|
Ratio of Earnings to Fixed Charges
|
|
|
21.1
|
|
Subsidiaries of UnitedHealth Group Incorporated
|
|
|
23.1
|
|
Consent of Independent Registered Public Accounting Firm
|
|
|
24.1
|
|
Power of Attorney
|
|
|
31.1
|
|
Certifications pursuant to Section 302 of the Sarbanes-Oxley Act of 2002
|
|
|
32.1
|
|
Certifications pursuant to Section 906 of the Sarbanes-Oxley Act of 2002
|
|
|
101
|
|
The following materials from UnitedHealth Group Incorporated’s Annual Report on Form 10-K for the year ended December 31, 2012, filed on February 6, 2013, formatted in XBRL (eXtensible Business Reporting Language): (i) Consolidated Balance Sheets, (ii) Consolidated Statements of Operations, (iii) Consolidated Statements of Comprehensive Income, (iv) Consolidated Statements of Changes in Shareholders’ Equity, (v) Consolidated Statements of Cash Flows, and (vi) Notes to the Consolidated Financial Statements.
|
|
________________
|
*
|
Denotes management contracts and compensation plans in which certain directors and named executive officers participate and which are being filed pursuant to Item 601(b)(10)(iii)(A) of Regulation S-K.
|
|
|
**
|
Pursuant to Item 601(b)(4)(iii) of Regulation S-K, copies of instruments defining the rights of certain holders of long-term debt are not filed. The Company will furnish copies thereof to the SEC upon request.
|
|
105
TABLE OF CONTENTS
Part IItem 1. BusinessItem 1A. Risk FactorsItem 1B. Unresolved Staff CommentsItem 2. PropertiesItem 3. Legal ProceedingsItem 4. Mine Safety DisclosuresPart IIItem 5. Market For Registrant S Common Equity, Related Stockholder Matters and Issuer Purchases Of Equity SecuritiesItem 6. Selected Financial DataItem 7. Management S Discussion and Analysis Of Financial Condition and Results Of OperationsItem 7A. Quantitative and Qualitative Disclosures About Market RiskItem 8. Financial StatementsItem 9. Changes in and Disagreements with Accountants on Accounting and Financial DisclosureItem 9A. Controls and ProceduresItem 9B. Other InformationPart IIIItem 10. Directors, Executive Officers and Corporate GovernanceItem 11. Executive CompensationItem 12. Security Ownership Of Certain Beneficial Owners and Management and Related Stockholder MattersItem 13. Certain Relationships and Related Transactions, and Director IndependenceItem 14. Principal Accountant Fees and ServicesPart IVItem 15. Exhibits and Financial Statement Schedules