UNITEDHEALTH GROUP INC
10-Ks and 10-Qs
|
|
|
|
|
|
|
|
|
|
|
|
|
|
|
|
|
|
|
|
|
|
|
|
|
|
|
|
|
|
|
|
|
|
|
|
|
|
|
|
|
|
|
|
|
|
|
|
|
|
|
|
|
|
|
|
|
|
|
UNITED STATES
SECURITIES AND EXCHANGE COMMISSION
Washington, D.C. 20549
|
Form 10-K
|
||
|
[X]
|
ANNUAL REPORT PURSUANT TO SECTION 13 OR 15(d) OF THE SECURITIES EXCHANGE ACT OF 1934
|
|
For the fiscal year ended December 31, 2016
|
|
|
or
|
|
|
[ ]
|
TRANSITION REPORT PURSUANT TO SECTION 13 OR 15(d) OF THE SECURITIES EXCHANGE ACT OF 1934
|
|
For the transition period from _____ to _____
|
|
Commission file number: 1-10864
__________________________________________________________
UnitedHealth Group Incorporated
(Exact name of registrant as specified in its charter)
|
Delaware
|
|
41-1321939
|
|
(State or other jurisdiction of
incorporation or organization)
|
|
(I.R.S. Employer
Identification No.)
|
|
UnitedHealth Group Center
9900 Bren Road East
Minnetonka, Minnesota
|
|
55343
|
|
(Address of principal executive offices)
|
|
(Zip Code)
|
(952) 936-1300
(Registrant’s telephone number, including area code)
______________________________________________________
Securities registered pursuant to Section 12(b) of the Act:
|
COMMON STOCK, $.01 PAR VALUE
|
NEW YORK STOCK EXCHANGE, INC.
|
|
(Title of each class)
|
(Name of each exchange on which registered)
|
Securities registered pursuant to Section 12(g) of the Act: NONE
__________________________________________________________
Indicate by check mark if the registrant is a well-known seasoned issuer, as defined in Rule 405 of the Securities Act. Yes [X]
No [ ]
Indicate by check mark if the registrant is not required to file reports pursuant to Section 13 or Section 15(d) of the Act. Yes [ ]
No [X]
Indicate by check mark whether the registrant (1) has filed all reports required to be filed by Section 13 or 15(d) of the Securities Exchange Act of 1934 during the preceding 12 months (or for such shorter period that the registrant was required to file such reports), and (2) has been subject to such filing requirements for the past 90 days. Yes [X] No [ ]
Indicate by check mark whether the registrant has submitted electronically and posted on its corporate Web site, if any, every Interactive Data File required to be submitted and posted pursuant to Rule 405 of Regulation S-T (§232.405 of this chapter) during the preceding 12 months (or for such shorter period that the registrant was required to submit and post such files). Yes [X]
No [ ]
Indicate by check mark if disclosure of delinquent filers pursuant to Item 405 of Regulation S-K (§229.405 of this chapter) is not contained herein, and will not be contained, to the best of registrant’s knowledge, in definitive proxy or information statements incorporated by reference in Part III of this Form 10-K or any amendment to this Form 10-K. [X]
Indicate by check mark whether the registrant is a large accelerated filer, an accelerated filer, a non-accelerated filer, or a smaller reporting company. See the definitions of “large accelerated filer,” “accelerated filer” and “smaller reporting company” in Rule 12b-2 of the Exchange Act. (Check one)
|
Large accelerated filer
|
[X]
|
Accelerated filer
|
[ ]
|
Non-accelerated filer
|
[ ]
|
Smaller reporting company
|
[ ]
|
|||
Indicate by check mark whether the registrant is a shell company (as defined in Rule 12b-2 of the Exchange Act). Yes [ ]
No [X]
The aggregate market value of voting stock held by non-affiliates of the registrant as of June 30, 2016 was $
132,269,813,351
(based on the last reported sale price of
$141.20
per share on June 30, 2016, on the New York Stock Exchange), excluding only shares of voting stock held beneficially by directors, executive officers and subsidiaries of the registrant.
As of January 31, 2017, there were
951,165,192
shares of the registrant’s Common Stock, $.01 par value per share, issued and outstanding.
DOCUMENTS INCORPORATED BY REFERENCE
The information required by Part III of this report, to the extent not set forth herein, is incorporated by reference from the registrant’s definitive proxy statement relating to its 2017 Annual Meeting of Shareholders. Such proxy statement will be filed with the Securities and Exchange Commission within 120 days after the end of the fiscal year to which this report relates.
UNITEDHEALTH GROUP
Table of Contents
|
|
|
Page
|
|
Part I
|
||
|
Item 1.
|
||
|
Item 1A.
|
||
|
Item 1B.
|
||
|
Item 2.
|
||
|
Item 3.
|
||
|
Item 4.
|
||
|
Part II
|
||
|
Item 5.
|
||
|
Item 6.
|
||
|
Item 7.
|
||
|
Item 7A.
|
||
|
Item 8.
|
||
|
Item 9.
|
||
|
Item 9A.
|
||
|
Item 9B.
|
||
|
Part III
|
||
|
Item 10.
|
||
|
Item 11.
|
||
|
Item 12.
|
||
|
Item 13.
|
||
|
Item 14.
|
||
|
Part IV
|
||
|
Item 15.
|
||
INTRODUCTION
Overview
UnitedHealth Group is a diversified health and well-being company dedicated to helping people live healthier lives and helping to make the health system work better for everyone. The terms “we,” “our,” “us,” “its,” “UnitedHealth Group,” or the “Company” used in this report refer to UnitedHealth Group Incorporated and its subsidiaries.
Through our diversified family of businesses, we leverage core competencies in advanced, enabling technology; health care data, information and intelligence; and clinical care management and coordination to help meet the demands of the health system. These core competencies are deployed within our two distinct, but strategically aligned, business platforms: health benefits operating under UnitedHealthcare and health services operating under Optum.
UnitedHealthcare provides health care benefits to an array of customers and markets. UnitedHealthcare Employer & Individual serves employers ranging from sole proprietorships to large, multi-site and national employers, public sector employers and other individuals. UnitedHealthcare Medicare & Retirement delivers health and well-being benefits for Medicare beneficiaries and retirees. UnitedHealthcare Community & State manages health care benefit programs on behalf of state Medicaid and community programs and their participants. UnitedHealthcare Global includes UnitedHealthcare Brazil, a health care company providing health and dental benefits and hospital and clinical services to employer groups and individuals in Brazil, and other diversified global health businesses.
Optum is a health services business serving the broad health care marketplace, including payers, care providers, employers, governments, life sciences companies and consumers, through its OptumHealth, OptumInsight and OptumRx businesses. These businesses have dedicated units that help improve overall health system performance through optimizing care quality, reducing costs and improving consumer experience and care provider performance leveraging distinctive capabilities in data and analytics, pharmacy care services, population health, health care delivery and health care operations.
Through UnitedHealthcare and Optum, in 2016, we processed more than one half trillion dollars in gross billed charges and we managed more than $200 billion in aggregate health care spending on behalf of the customers and consumers we serve. Our revenues are derived from premiums on risk-based products; fees from management, administrative, technology and consulting services; sales of a wide variety of products and services related to the broad health and well-being industry; and investment and other income. Our two business platforms have four reportable segments:
|
•
|
UnitedHealthcare, which includes UnitedHealthcare Employer & Individual, UnitedHealthcare Medicare & Retirement, UnitedHealthcare Community & State and UnitedHealthcare Global;
|
|
•
|
OptumHealth;
|
|
•
|
OptumInsight; and
|
|
•
|
OptumRx.
|
For our financial results and the presentation of certain other financial information by segment, including revenues and long-lived fixed assets by geographic source, see
Note 13 of Notes to the Consolidated Financial Statements included in Part II, Item 8, “Financial Statements.”
UnitedHealthcare
Through its health benefits offerings, UnitedHealthcare is enabling better health, helping to control rising health care costs and creating a better health care experience for its customers. UnitedHealthcare’s market position is built on:
|
•
|
strong local market relationships;
|
|
•
|
the breadth of product offerings, which are responsive to many distinct market segments in health care;
|
|
•
|
service and advanced technology;
|
|
•
|
competitive medical and operating cost positions;
|
|
•
|
effective clinical engagement;
|
|
•
|
extensive expertise in distinct market segments; and
|
|
•
|
innovation for customers and consumers.
|
1
UnitedHealthcare utilizes Optum’s capabilities to help coordinate patient care, improve affordability of medical care, analyze cost trends, manage pharmacy benefits, work with care providers more effectively and create a simpler consumer experienc
e.
In the United States, UnitedHealthcare arranges for discounted access to care through networks that include 1 million physicians and other health care professionals and approximately 6,000 hospitals and other facilities.
UnitedHealthcare is subject to extensive government regulation. See further discussion of our regulatory environment below under
“Government Regulation”
and in
Part II, Item 7, “Management’s Discussion and Analysis of Financial Condition and Results of Operations.”
UnitedHealthcare Employer & Individual
UnitedHealthcare Employer & Individual offers an array of consumer-oriented health benefit plans and services nationwide for large national employers, public sector employers, mid-sized employers, small businesses, and individuals. UnitedHealthcare Employer & Individual provides access to medical services for over 30 million people on behalf of our customers and alliance partners. This includes more than 200,000 employer customers across all 50 states. Products are offered through affiliates that are licensed as insurance companies, health maintenance organizations (HMOs), or third-party administrators (TPAs). Large employer groups typically use self-funded arrangements where UnitedHealthcare Employer & Individual earns a service fee. Smaller employer groups and individuals are more likely to purchase risk-based products because they are less willing or unable to bear a greater potential liability for health care expenditures.
Through its risk-based product offerings, UnitedHealthcare Employer & Individual assumes the risk of both medical and administrative costs for its customers in return for a monthly premium, which is typically a fixed rate per individual served for a one-year period. When providing administrative and other management services to customers that elect to self-fund the health care costs of their employees and employees’ dependents, UnitedHealthcare Employer & Individual receives a fixed monthly service fee per individual served. These customers retain the risk of financing medical benefits for their employees and employees’ dependents, while UnitedHealthcare Employer & Individual provides services such as coordination and facilitation of medical and related services to customers, consumers and health care professionals, administration of transaction processing and access to a contracted network of physicians, hospitals and other health care professionals, including dental and vision.
The consolidated purchasing capacity represented by the individuals served by UnitedHealth Group makes it possible for UnitedHealthcare Employer & Individual to contract for cost-effective access to a large number of conveniently located care professionals and facilities. UnitedHealthcare Employer & Individual has relationships with network care providers that integrate data and analytics, implement value-based payments and care management programs, and enable us to jointly better manage health care across populations.
UnitedHealthcare Employer & Individual typically distributes its products through consultants or direct sales in the larger employer and public sector segments. In the smaller group segment of the commercial marketplace, UnitedHealthcare Employer & Individual’s distribution system consists primarily of direct sales and sales through collaboration with brokers and agents. UnitedHealthcare Employer & Individual also distributes products through wholesale agents or agencies that contract with health insurance carriers to distribute individual or group benefits and provide other related services to their customers.
UnitedHealthcare Employer & Individual also distributes its products through professional employer organizations, associations and, increasingly, through both multi-carrier and its own proprietary private exchange marketplaces. Direct-to-consumer sales are supported by participation in multi-carrier health insurance marketplaces for individuals and small groups through exchanges. In 2017, UnitedHealthcare Employer & Individual will participate in individual public exchanges in three states, a reduction from 34 states in 2016.
UnitedHealthcare Employer & Individual’s diverse product portfolio offers a continuum of benefit designs, price points and approaches to consumer engagement, which provides the flexibility to meet the coverage needs of employers of all sizes. The market for health benefit products is shifting, with benefit and network offerings shaped, at least in part, by the requirements and effects of the Patient Protection and Affordable Care Act (ACA) and related federal and state regulations, increased employer focus on quality and employee engagement and the urgent need to align the system around value. Cost pressures are stimulating demand for improved health care affordability and more coordinated care. UnitedHealthcare Employer & Individual is responding to this demand with medical network and contracting constructs (such as performance incentives and benefit designs that direct more patients to higher-performing care providers), alternative access to affordable and convenient care (such as through telehealth appointments with registered nurses and physicians) and a consumer-responsive service called Advocate4Me.
2
UnitedHealthcare Employer & Individual offers affordable products and actionable information to enable better health outcomes and to help employers attract and retain talent. UnitedHealthcare Employer & Individual’s major product families include:
Traditional Products.
Traditional products include a full range of medical benefits and network options from managed plans, such as Choice and Options PPO, to more traditional indemnity products. The plans offer a full spectrum of covered services, including preventive care, direct access to specialists and catastrophic protection.
Consumer Engagement Products.
Consumer engagement products couple plan design with financial accounts to increase individuals’ responsibility for their health and well-being. This suite of products includes high-deductible consumer-driven benefit plans, which include health reimbursement accounts (HRAs), health savings accounts (HSAs) and consumer engagement services such as personalized behavioral incentive programs and consumer education. During 2016, more than 40,000 employer-sponsored benefit plans, including nearly 400 employers in the large group self-funded market, purchased HRA or HSA products from us.
Clinical and Pharmacy Products.
UnitedHealthcare Employer & Individual offers a comprehensive suite of clinical and pharmacy care services products, which complement its service offerings by improving quality of care, engaging members and providing cost-saving options. All UnitedHealthcare Employer & Individual members are provided access to clinical products that help them make better health care decisions and better use of their medical benefits, which contribute to improved health and lowered medical expenses.
Each medical plan has a core set of clinical programs embedded in the offering, with additional services available depending on offering type (risk-based or self-funded), line of business (e.g., small business, key accounts, public sector, national accounts or individuals) and clinical need. UnitedHealthcare Employer & Individual’s clinical programs include:
|
•
|
wellness programs;
|
|
•
|
decision support;
|
|
•
|
utilization management;
|
|
•
|
case and disease management;
|
|
•
|
complex condition management;
|
|
•
|
on-site programs, including biometrics and flu shots;
|
|
•
|
incentives to reinforce positive behavior change;
|
|
•
|
mental health/substance use disorder management; and
|
|
•
|
employee assistance programs.
|
UnitedHealthcare Employer & Individual’s comprehensive and integrated pharmaceutical care services promote lower costs by using formulary programs to produce better unit costs, encouraging consumers to use drugs that offer improved value and outcomes, helping consumers take actions to improve their health and supporting the appropriate use of drugs based on clinical evidence through physician and consumer education programs.
Specialty Offerings
. UnitedHealthcare Employer & Individual also delivers dental, vision, life, critical illness and disability product offerings through an integrated approach, including a network of more than 20,000 vision offices and more than 80,000 dental offices, in private and retail settings.
UnitedHealthcare Military & Veterans.
UnitedHealthcare Military & Veterans is the provider of health care services for nearly 3 million active duty and retired military service members and their families in 21 states under the Department of Defense’s (DoD) TRICARE Managed Care Support contract. The contract that began on April 1, 2013 is scheduled to conclude in 2017 and has not been renewed.
UnitedHealthcare Medicare & Retirement
UnitedHealthcare Medicare & Retirement provides health and well-being services to individuals age 50 and older, addressing their unique needs for preventive and acute health care services, as well as services dealing with chronic disease and other specialized issues common among older individuals. UnitedHealthcare Medicare & Retirement is fully dedicated to serving this growing senior market segment, providing products and services in all 50 states, the District of Columbia and most U.S. territories. UnitedHealthcare Medicare & Retirement has distinct pricing, underwriting, clinical program management and marketing capabilities dedicated to health products and services in this market.
3
UnitedHealthcare Medicare & Retirement offers a selection of products that allow people to obtain the health coverage and services they need as their circumstances change. UnitedHealthcare Medicare & Retirement is positioned to serve seniors who find that affordable, network-based care provided through Medicare Advantage plans meets their unique health care needs. For those who prefer traditional fee-for-service Medicare, UnitedHealthcare Medicare & Retirement offers both Medicare Supplement and Medicare Prescription Drug Benefit (Medicare Part D) prescription drug programs that supplement their government-sponsored Medicare by providing additional benefits and coverage options. Beneficiaries with special needs are served through UnitedHealthcare Medicare & Retirement Dual, Chronic and Institutional Special Needs Plans (SNPs) in many markets. UnitedHealthcare Medicare & Retirement services include care management and clinical management programs, a nurse health line service, 24-hour access to health care information, access to discounted health services from a network of care providers and administrative services.
UnitedHealthcare Medicare & Retirement has extensive distribution capabilities and experience, including direct marketing to consumers on behalf of its key clients: AARP, the nation’s largest membership organization dedicated to the needs of people age 50 and over, and state and U.S. government agencies. Products are also offered through employer groups and agent channels.
UnitedHealthcare Medicare & Retirement’s major product categories include:
Medicare Advantage.
UnitedHealthcare Medicare & Retirement provides health care coverage for seniors and other eligible Medicare beneficiaries primarily through the Medicare Advantage program administered by CMS, including Medicare Advantage HMO plans, preferred provider organization (PPO) plans, Point-of-Service plans, Private-Fee-for-Service plans and SNPs. Under the Medicare Advantage program, UnitedHealthcare Medicare & Retirement provides health insurance coverage in exchange for a fixed monthly premium per member from CMS plus, in some cases, monthly consumer premiums. Premium amounts received from CMS vary based on the geographic areas in which members reside; demographic factors such as age, gender and institutionalized status; and the health status of the individual. Medicare Advantage plans are designed to compete at the local level, taking into account member and care provider preferences, competitor offerings, our quality and cost initiatives, our historical financial results and the long-term payment rate outlook for each geographic area. UnitedHealthcare Medicare & Retirement served
3.6 million
people through its Medicare Advantage products as of December 31, 2016.
Built on more than 20 years of experience, UnitedHealthcare Medicare & Retirement’s senior-focused care management model operates at a medical cost level below that of traditional Medicare, while helping seniors live healthier lives. Through UnitedHealth Group’s HouseCalls program, nurse practitioners performed more than 1 million in-home preventative care visits in 2016 to address unmet care opportunities and close gaps in care. For high-risk patients in certain care settings and programs, UnitedHealthcare Medicare & Retirement uses proprietary, automated medical record software that enables clinical care teams to capture and track patient data and clinical encounters, creating a comprehensive set of care information that bridges across home, hospital and nursing home care settings. Proprietary predictive modeling tools help identify members at high risk and allow care managers to reach out to those members and create individualized care plans that help them obtain the right care, in the right place, at the right time.
Medicare Part D.
UnitedHealthcare Medicare & Retirement provides Medicare Part D benefits to beneficiaries throughout the United States and its territories through its Medicare Advantage and stand-alone Medicare Part D plans. The stand-alone Medicare Part D plans address a large spectrum of beneficiaries’ needs and preferences for their prescription drug coverage, including low cost prescription options. Each of the plans includes the majority of the drugs covered by Medicare and provides varying levels of coverage to meet the diverse needs of Medicare beneficiaries. As of December 31, 2016, UnitedHealthcare enrolled 8.6 million people in the Medicare Part D programs, including 4.9 million individuals in the stand-alone Medicare Part D plans with the remainder in Medicare Advantage plans incorporating Medicare Part D coverage.
Medicare Supplement.
UnitedHealthcare Medicare & Retirement is currently serving 4.7 million seniors nationwide through various Medicare Supplement products in association with AARP. UnitedHealthcare Medicare & Retirement offers a full range of supplemental products at diverse price points. These products cover the various levels of coinsurance and deductible gaps that seniors are exposed to in the traditional Medicare program.
Premium revenues from the Centers for Medicare & Medicaid Services (CMS) represented
25%
of UnitedHealth Group’s total consolidated revenues for the year ended December 31, 2016, most of which were generated by UnitedHealthcare Medicare & Retirement.
UnitedHealthcare Community & State
UnitedHealthcare Community & State is dedicated to serving state programs that care for the economically disadvantaged, the medically underserved and those without the benefit of employer-funded health care coverage, in exchange for a monthly premium per member from the state program. In some cases, these premiums are subject to experience or risk adjustments. UnitedHealthcare Community & State’s primary customers oversee Medicaid plans, Children’s Health Insurance Programs (CHIP), SNPs, integrated Medicare-Medicaid plans (MMP) and other federal, state and community health care programs. As of
4
December 31, 2016, UnitedHealthcare Community & State participated in programs in 24 states and the District of Columbia, and served
5.9 million
beneficiaries. The Affordable Care Act provided for optional Medicaid expansion effective January 1, 2014. As of December 31, 2016, UnitedHealthcare Community & State served more than 1 million people through Medicaid expansion programs in 15 states.
States using managed care services for Medicaid beneficiaries select health plans by using a formal bid process or by awarding individual contracts. A number of factors are considered by UnitedHealthcare Community & State when choosing programs for participation, including the state’s commitment and consistency of support for its Medicaid managed care program in terms of service, innovation and funding; the eligible population base, both immediate and long term; and the structure of the projected program. UnitedHealthcare Community & State works with its state customers to advocate for actuarially sound rates that are commensurate with medical cost trends.
The primary categories of eligibility for the programs served by UnitedHealthcare Community & State and its participation are:
|
•
|
Temporary Assistance to Needy Families, primarily women and children - 22 markets;
|
|
•
|
CHIP - 21 markets;
|
|
•
|
Aged, Blind and Disabled - 20 markets;
|
|
•
|
SNP - 15 markets;
|
|
•
|
Medicaid Expansion - 15 markets;
|
|
•
|
Long-Term Services and Supports - 12 markets;
|
|
•
|
childless adult programs for the uninsured - 2 markets;
|
|
•
|
other programs (e.g., developmentally disabled, rehabilitative services) - 5 markets; and
|
|
•
|
MMP - 2 markets.
|
These health plans and care programs offered are designed to address the complex needs of the populations they serve, including the chronically ill, those with disabilities and people with a higher risk of medical, behavioral and social conditions. UnitedHealthcare Community & State administers benefits for the unique needs of children, pregnant women, adults, seniors and those who are institutionalized or are nursing home eligible. These individuals often live in areas that are medically underserved and are less likely to have a consistent relationship with the medical community or a care provider. These individuals also tend to face significant social and economic challenges.
UnitedHealthcare Community & State leverages the national capabilities of UnitedHealth Group locally, supporting effective care management, strong regulatory partnerships, greater administrative efficiency, improved clinical outcomes and the ability to adapt to a changing national and local market environment. UnitedHealthcare Community & State coordinates resources among family, physicians, other health care providers, and government and community-based agencies and organizations to facilitate continuous and effective care.
Approximately 75% of the people in state Medicaid programs are served by managed care, but this population represents only 40% of total Medicaid spending. UnitedHealthcare Community & State’s business development opportunities include entering fee-for-service markets converting to managed care, which represents a population of nearly 8 million people; and growing in existing managed care markets, including state-carve-ins of populations with more complex needs requiring more sophisticated models of care. This expansion includes integrated management of physical, behavioral, long-term care services and supports and social services by applying strong data analytics and community-based collaboration.
UnitedHealthcare Community & State continues to evolve its clinical model to enhance quality and the clinical experience for the people it serves. The model allows UnitedHealthcare Community & State to quickly identify the people who could benefit most from more highly coordinated care; typically, the 5% of members who are most at risk and drive over 50% of states’ medical costs.
UnitedHealthcare Global
UnitedHealthcare Global participates in international markets through national “in country” and cross-border strategic approaches. UnitedHealthcare Global’s cross-border health care business provides comprehensive health benefits, care management and care delivery for multinational employers, governments and individuals around the world. UnitedHealthcare Global’s goal is to create health care business solutions that are based on local expertise, infrastructure, culture and needs. As of December 31, 2016, UnitedHealthcare Global provided medical benefits to
4.2 million
people, principally in Brazil, but also residing in more than 125 other countries.
UnitedHealthcare Brazil.
UnitedHealthcare Brazil provides medical and dental benefits to nearly 6 million people. UnitedHealthcare Brazil owns and operates more than 40 acute hospitals and more than 50 specialty, primary care and
5
emergency services clinics across Brazil, principally for the benefit of its members. UnitedHealthcare Brazil’s patients are also treated in its contracted provider network of nearly 22,000 physicians and other health care professionals, approximately 1,900 hospitals and nearly 7,000 laboratories and diagnostic imaging centers. UnitedHealthcare Brazil offers a diversified product portfolio with a wide range of product offerings, benefit designs, price points and value, including indemnity products. UnitedHealthcare Brazil’s products include various administrative services such as network access and administration, care management and personal health services and claims processing.
Other Global Offerings.
UnitedHealthcare Global includes other diversified global health services with a variety of offerings for international customers, including:
|
•
|
network access and care coordination in the United States and overseas;
|
|
•
|
TPA products and services for health plans and TPAs;
|
|
•
|
brokerage services;
|
|
•
|
practice management services for care providers;
|
|
•
|
government and corporate consulting services for improving quality and efficiency; and
|
|
•
|
global expatriate insurance solutions.
|
Optum
Optum is a health services business serving the broad health care marketplace, including:
|
•
|
Those who need care: the consumers who need the right support, information, resources and products to achieve their health goals.
|
|
•
|
Those who provide care: pharmacies, hospitals, physicians, practices and other health care facilities seeking to modernize the health system and support the best possible patient care and experiences.
|
|
•
|
Those who pay for care: employers, health plans, and state, federal and municipal agencies devoted to ensuring the populations they sponsor receive high-quality care, administered and delivered efficiently and effectively.
|
|
•
|
Those who innovate for care: global life sciences organizations dedicated to developing more effective approaches to care, enabling technologies and medicines that improve care delivery and health outcomes.
|
Optum operates three reportable segments leveraging distinctive capabilities in data and analytics, pharmacy care services, population health, health care delivery and health care operations:
|
•
|
OptumHealth focuses on care delivery, care management, wellness and consumer engagement, and health financial services;
|
|
•
|
OptumInsight specializes in data and analytics and other health care information technology services, and delivers operational services and support; and
|
|
•
|
OptumRx provides pharmacy care services.
|
OptumHealth
OptumHealth is a diversified health and wellness business serving the physical, emotional and health-related financial needs of 83 million unique individuals. OptumHealth enables population health management through programs offered by employers, payers, government entities and directly with the care delivery system. OptumHealth products and services deliver value by improving quality and patient satisfaction while lowering cost. OptumHealth builds high-performing networks and centers of excellence across the care continuum, by working directly with physicians to advance population health management and by coordinating care for the most medically complex patients.
OptumHealth offers its products on a risk basis, where it assumes responsibility for health care costs in exchange for a monthly premium per individual served, on an administrative fee basis, under which it manages or administers delivery of the products or services in exchange for a fixed monthly fee per individual served, or on a fee-for-service basis, where it delivers medical services to patients in exchange for a contracted fee. For its financial services offerings, OptumHealth charges fees and earns investment income on managed funds.
OptumHealth sells its products primarily through its direct sales force, strategic collaborations and external producers in three markets: employers (which includes the sub-markets of large, mid-sized and small employers), payers (which includes the sub-markets of health plans, TPAs, underwriter/stop-loss carriers and individual market intermediaries) and government entities (which includes states, CMS, DoD, the Veterans Administration and other federal procurement agencies).
OptumHealth serves patients and care providers through its local ambulatory care services business and delivers care through a physician-led, patient-centric and data-driven organization comprised of over 20,000 employed, managed and contracted
6
physicians. OptumHealth also enables care providers’ transition from traditional, fee-for-service care delivery to performance-based delivery and payment models that put patient health and outcomes first, such as those emerging through accountable care organizations (ACOs) and local care provider partnerships. Through OptumHealth’s strategic partnerships, alliances and ownership arrangements it helps care providers adopt new approaches and technologies that improve the coordination of care across all providers involved in patient care.
MedExpress’ nearly 200 neighborhood care centers provide urgent and walk-in care services with a consumer-friendly approach
.
The HouseCalls program provides in-home health assessments that engage individuals, understand their health status and needs, and close gaps in care. In 2016, HouseCalls conducted more than 1 million in-home health assessments.
OptumHealth’s mobile care delivery business delivers occupational health and medical services to government customers, with a particular focus on the U.S. military.
OptumHealth serves people through population health management services that meet both the preventative care and health intervention needs of consumers across the care continuum - physical health and wellness, mental health, complex medical conditions, disease management, hospitalization and post-acute care. This includes offering access to proprietary networks of provider specialists in many clinical specialties, including behavioral health, organ transplant, chiropractic and physical therapy. OptumHealth engages consumers in managing their health, including guidance, tools and programs that help them achieve their health goals and maintain healthy lifestyles.
Optum Financial Services, through Optum Bank, a wholly-owned subsidiary, serves consumers through over 4.6 million health savings and other accounts with $7 billion in assets under management as of December 31, 2016. During 2016, Optum Bank processed over $100 billion in medical payments to physicians and other health care providers. Organizations across the health system rely on Optum to manage and improve payment flows through its highly automated, scalable, electronic payment systems.
OptumInsight
OptumInsight provides services, technology and health care expertise to major participants in the health care industry. OptumInsight’s capabilities are focused on data and analytics, technology and information that help improve the quality of care and drive greater efficiency in the health care system. Hospital systems, physicians, health plans, governments, life sciences companies and other organizations that comprise the health care industry depend on OptumInsight to help them improve performance, achieve efficiency, reduce costs, meet compliance mandates and modernize their core operating systems to meet the changing needs of the health system.
Many of OptumInsight’s software and information products and professional services are delivered over extended periods, often several years. OptumInsight maintains an order backlog to track unearned revenues under these long-term arrangements. The backlog consists of estimated revenue from signed contracts, other legally binding agreements and anticipated contract renewals based on historical experience with OptumInsight’s customers. OptumInsight’s aggregate backlog at December 31, 2016, was $12.6 billion, of which $6.9 billion is expected to be realized within the next 12 months. This includes $4.5 billion related to intersegment agreements, all of which are in the current portion of the backlog. OptumInsight’s aggregate backlog at December 31, 2015, was $10.4 billion. OptumInsight cannot provide any assurance that it will be able to realize all of the revenues included in the backlog due to uncertainties with regard to the timing and scope of services and the potential for cancellation, non-renewal or early termination of service arrangements.
OptumInsight’s products and services are sold primarily through a direct sales force. OptumInsight’s products are also supported and distributed through an array of alliances and business partnerships with other technology vendors, who integrate and interface OptumInsight’s products with their applications.
OptumInsight believes it is well positioned to address the needs of four primary market segments: care providers (e.g., physicians and hospital systems), health plans, governments and life sciences companies.
Care Providers.
Serving more than four out of five U.S. hospitals and tens of thousands of physicians, OptumInsight assists care providers in meeting their challenge to improve patient outcomes and care amid changing payment models and pressures. OptumInsight brings a broad array of solutions to help care providers meet these challenges, with particular focus on clinical performance and quality improvement, population health management, data management and analytics, revenue management, cost containment, compliance, cloud-enabled collaboration and consumer engagement.
Health Plans.
OptumInsight serves approximately 300 health plans through cost-effective, technology-enabled solutions that help them improve efficiency, understand and optimize growth while managing risk, deliver on clinical performance and compliance goals, and build and manage strong networks of care.
7
Governments.
OptumInsight provides services tailored to government payers, including data and analytics technology, claims management and payment accuracy services, and strategic consulting.
Life Sciences.
OptumInsight provides services to global life sciences companies. These companies look to OptumInsight for data, analytics and expertise in core areas of health economics and outcomes research, market access consulting, integrated clinical and health care claims data and informatics services, epidemiology and drug safety, and patient reported outcomes.
OptumRx
OptumRx provides a full spectrum of pharmacy care services to more than 65 million people in the United States through its network of more than 67,000 retail pharmacies and multiple home delivery facilities throughout the country. In 2016, OptumRx managed more than $80 billion in pharmaceutical spending, including more than $30 billion in specialty pharmaceutical spending. OptumRx provides retail network contracting, purchasing and clinical capabilities and works with customers to develop an optimal set of programs in areas such as step therapy, formulary management, drug adherence and disease/drug therapy management to achieve a high-quality, low-cost pharmacy offering. OptumRx’s comprehensive whole-person approach to pharmacy care services integrates demographic, medical, laboratory, pharmaceutical and other clinical data and applies analytics to drive clinical care insight to support care treatments and compliance, benefiting clients and individuals through enhanced services and cost trend management.
OptumRx provides pharmacy care services to non-affiliated clients, including a number of health plans, large national employer plans, unions and trusts and government entities; as well as a substantial majority of UnitedHealthcare members. Additionally, OptumRx manages specialty pharmacy care services, including patient support and clinical programs designed to ensure quality and deliver value for consumers. OptumRx’s distribution system consists primarily of health insurance brokers and other health care consultants and direct sales.
GOVERNMENT REGULATION
Most of our health and well-being businesses are subject to comprehensive federal, state and international laws and regulations. We are regulated by federal, state and international regulatory agencies that generally have discretion to issue regulations and interpret and enforce laws and rules. The regulations can vary significantly from jurisdiction to jurisdiction and the interpretation of existing laws and rules also may change periodically. Domestic and international governments continue to enact and consider various legislative and regulatory proposals that could materially impact certain aspects of the health care system. New laws, regulations and rules, or changes in the interpretation of existing laws, regulations and rules, including as a result of changes in the political climate, could adversely affect our business.
If we fail to comply with, or fail to respond quickly and appropriately to changes in, applicable laws, regulations and rules, our business, results of operations, financial position and cash flows could be materially and adversely affected. See
Part I, Item 1A, “Risk Factors”
for a discussion of the risks related to our compliance with federal, state and international laws and regulations.
Federal Laws and Regulation
We are subject to various levels of U.S. federal regulation. For example, when we contract with the federal government, we are subject to federal laws and regulations relating to the award, administration and performance of U.S. government contracts. CMS regulates our UnitedHealthcare businesses and certain aspects of our Optum businesses. Payments by CMS to our businesses are subject to regulations, including those governing fee-for-service and the submission of information relating to the health status of enrollees for purposes of determining the amounts of certain payments to us. CMS also has the right to audit our performance to determine our compliance with CMS contracts and regulations and the quality of care we provide to Medicare beneficiaries. Our commercial business is further subject to CMS audits related to medical loss ratios (MLRs), risk adjustment and reinsurance data.
UnitedHealthcare Community & State has Medicaid and CHIP contracts that are subject to federal regulations regarding services to be provided to Medicaid enrollees, payment for those services and other aspects of these programs. There are many regulations affecting Medicare and Medicaid compliance and the regulatory environment with respect to these programs is complex. We are also subject to federal law and regulations relating to the administration of contracts with federal agencies. Our business is also subject to laws and regulations relating to consumer protection, anti-fraud and abuse, anti-kickbacks, false claims, prohibited referrals, inappropriately reducing or limiting health care services, anti-money laundering, securities and antitrust.
Affordable Care Act.
The ACA expanded access to coverage and modified aspects of the commercial insurance market, as well as the Medicaid and Medicare programs, CHIP and other aspects of the health care system.
8
Among other requirements, the ACA expanded dependent coverage to age 26, expanded benefit requirements, eliminated certain annual and lifetime maximum limits, eliminated certain pre-existing condition limits, required coverage for preventative services without cost to members, required premium rebates if certain MLRs are not satisfied, granted members new and additional appeal rights, created new premium rate review processes, established a system of state and federal exchanges through which consumers can purchase health coverage, imposed new requirements on the format and content of communications (such as explanations of benefits) between health insurers and their members, introduced new risk sharing programs, reduced the Medicare Part D coverage gap and reduced payments to private plans offering Medicare Advantage.
The ACA is affecting how we do business and could impact our results of operations, financial position and cash flows. See also
Part I, Item 1A, “Risk Factors”
for a discussion of the risks related to the ACA and related matters.
Privacy, Security and Data Standards Regulation.
The administrative simplification provisions of the Health Insurance Portability and Accountability Act of 1996, as amended (HIPAA), apply to both the group and individual health insurance markets, including self-funded employee benefit plans. Federal regulations related to HIPAA contain minimum standards for electronic transactions and code sets and for the privacy and security of protected health information.
The Health Information Technology for Economic and Clinical Health Act (HITECH) imposed requirements on uses and disclosures of health information; included contracting requirements for HIPAA business associate agreements; extended parts of HIPAA privacy and security provisions to business associates; added federal data breach notification requirements for covered entities and business associates and reporting requirements to the U.S. Department of Health and Human Services (HHS) and the Federal Trade Commission and, in some cases, to the local media; strengthened enforcement and imposed higher financial penalties for HIPAA violations and, in certain cases, imposed criminal penalties for individuals, including employees. In the conduct of our business, depending on the circumstances, we may act as either a covered entity or a business associate. Federal consumer protection laws may also apply in some instances to privacy and security practices related to personally identifiable information.
The use and disclosure of individually identifiable health data by our businesses is also regulated in some instances by other federal laws, including the Gramm-Leach-Bliley Act (GLBA) or state statutes implementing GLBA. These federal laws and state statutes generally require insurers to provide customers with notice regarding how their non-public personal health and financial information is used and the opportunity to “opt out” of certain disclosures before the insurer shares such information with a third party, and generally require safeguards for the protection of personal information. Neither the GLBA nor HIPAA privacy regulations preempt more stringent state laws and regulations that may apply to us, as discussed below.
ERISA.
The Employee Retirement Income Security Act of 1974, as amended (ERISA), regulates how our services are provided to or through certain types of employer-sponsored health benefit plans. ERISA is a set of laws and regulations that is subject to periodic interpretation by the U.S. Department of Labor (DOL) as well as the federal courts. ERISA sets forth standards on how our business units may do business with employers who sponsor employee health benefit plans, particularly those that maintain self-funded plans. Regulations established by the DOL subject us to additional requirements for claims payment and member appeals under health care plans governed by ERISA.
State Laws and Regulation
Health Care Regulation
.
Our insurance and HMO subsidiaries must be licensed by the jurisdictions in which they conduct business. All of the states in which our subsidiaries offer insurance and HMO products regulate those products and operations. The states require periodic financial reports and establish minimum capital or restricted cash reserve requirements. The National Association of Insurance Commissioners has adopted model regulations that, where implemented by states, require expanded governance practices and risk and solvency assessment reporting. Most states have adopted these or similar measures to expand the scope of regulations relating to corporate governance and internal control activities of HMOs and insurance companies. We are required to maintain a risk management framework and file a confidential self-assessment report with state insurance regulators. Reports are filed annually with Connecticut, our lead regulator, and with New York, as required by that state’s regulation. Certain states have also adopted their own regulations for minimum MLRs with which health plans must comply. In addition, a number of state legislatures have enacted or are contemplating significant reforms of their health insurance markets, either independent of or to comply with or be eligible for grants or other incentives in connection with the ACA, which may affect our operations and our financial results.
Health plans and insurance companies are regulated under state insurance holding company regulations. Such regulations generally require registration with applicable state departments of insurance and the filing of reports that describe capital structure, ownership, financial condition, certain intercompany transactions and general business operations. Most state insurance holding company laws and regulations require prior regulatory approval of acquisitions and material intercompany transfers of assets, as well as transactions between the regulated companies and their parent holding companies or affiliates. These laws may restrict the ability of our regulated subsidiaries to pay dividends to our holding companies.
9
Some of our business activity is subject to other health care-related regulations and requirements, including PPO, Managed Care Organization (MCO), utilization review (UR), TPA, pharmacy care services, durable medical equipment or care provider-related regulations and licensure requirements. These regulations differ from state to state and may contain network, contracting, product and rate, licensing and financial and reporting requirements. There are laws and regulations that set specific standards for delivery of services, appeals, grievances and payment of claims, adequacy of health care professional networks, fraud prevention, protection of consumer health information, pricing and underwriting practices and covered benefits and services. State health care anti-fraud and abuse prohibitions encompass a wide range of activities, including kickbacks for referral of members, billing for unnecessary medical services and improper marketing. Certain of our businesses are subject to state general agent, broker and sales distributions laws and regulations. UnitedHealthcare Community & State and certain of our Optum businesses are subject to regulation by state Medicaid agencies that oversee the provision of benefits to our Medicaid and CHIP beneficiaries and to our dually eligible (for Medicare and Medicaid) beneficiaries. We also contract with state governmental entities and are subject to state laws and regulations relating to the award, administration and performance of state government contracts.
Guaranty Fund Assessments
.
Under state guaranty association laws, certain insurance companies can be assessed (up to prescribed limits) for certain obligations to the policyholders and claimants of impaired or insolvent insurance companies that write the same line or similar lines of business. Some states have similar laws relating to HMOs and other payers such as consumer operated and oriented plans (co-ops) established under the ACA. Assessments are generally based on a formula relating to our premiums in the state compared to the premiums of other insurers and could be spread out over a period of years. Some states permit member insurers to recover assessments paid through full or partial premium tax offsets or through premiums. Any such assessment could expose our insurance entities and other insurers to the risk of paying a portion of an impaired or insolvent insurance company’s claims through state guaranty associations.
Pharmacy Regulation.
OptumRx’s businesses include home delivery and specialty pharmacies that must be licensed as pharmacies in the states in which they are located. Certain of our home delivery and specialty pharmacies must also register with the U.S. Drug Enforcement Administration (DEA) and individual state controlled substance authorities to dispense controlled substances. In addition to the laws and regulations in the states where our home delivery and specialty pharmacies are located, laws and regulations in non-resident states where we deliver pharmaceuticals may also apply, including the requirement to register with the board of pharmacy in the non-resident state. These non-resident states generally expect our home delivery and specialty pharmacies to follow the laws of the state in which the pharmacies are located, but some states also require us to comply with the laws of that non-resident state when pharmaceuticals are delivered there. As certain of our home delivery and specialty pharmacies maintain eligibility as Medicare and state Medicaid providers, their participation in the programs requires them to comply with the applicable Medicare and Medicaid provider rules and regulations. Other laws and regulations affecting our home delivery and specialty pharmacies include federal and state statutes and regulations governing the labeling, packaging, advertising and adulteration of prescription drugs and dispensing of controlled substances. See
Part I, Item 1A, “Risk Factors”
for a discussion of the risks related to our pharmacy care services businesses.
State Privacy and Security Regulations.
A number of states have adopted laws and regulations that may affect our privacy and security practices, such as state laws that govern the use, disclosure and protection of social security numbers and sensitive health information or that are designed to implement GLBA or protect credit card account data. State and local authorities increasingly focus on the importance of protecting individuals from identity theft, with a significant number of states enacting laws requiring businesses to notify individuals of security breaches involving personal information. State consumer protection laws may also apply to privacy and security practices related to personally identifiable information, including information related to consumers and care providers. Additionally, different approaches to state privacy and insurance regulation and varying enforcement philosophies in the different states may materially and adversely affect our ability to standardize our products and services across state lines. See
Part I, Item 1A, “Risk Factors”
for a discussion of the risks related to compliance with state privacy and security regulations.
Corporate Practice of Medicine and Fee-Splitting Laws.
Certain of our businesses function as direct medical service providers and, as such, are subject to additional laws and regulations. Some states have corporate practice of medicine laws that prohibit specific types of entities from practicing medicine or employing physicians to practice medicine. Moreover, some states prohibit certain entities from sharing in the fees or revenues of a professional practice (fee-splitting). These prohibitions may be statutory or regulatory, or may be imposed through judicial or regulatory interpretation. The laws, regulations and interpretations in certain states have been subject to limited judicial and regulatory interpretation and are subject to change.
Consumer Protection Laws.
Certain of our businesses participate in direct-to-consumer activities and are subject to regulations applicable to on-line communications and other general consumer protection laws and regulations.
10
Banking Regulation
Optum Bank is subject to regulation by federal banking regulators, including the Federal Deposit Insurance Corporation, which performs annual examinations to ensure that the bank is operating in accordance with federal safety and soundness requirements, and the Consumer Financial Protection Bureau, which may perform periodic examinations to ensure that the bank is in compliance with applicable consumer protection statutes, regulations and agency guidelines. Optum Bank is also subject to supervision and regulation by the Utah State Department of Financial Institutions, which carries out annual examinations to ensure that the bank is operating in accordance with state safety and soundness requirements and performs periodic examinations of the bank’s compliance with applicable state banking statutes, regulations and agency guidelines. In the event of unfavorable examination results from any of these agencies, the bank could become subject to increased operational expenses and capital requirements, enhanced governmental oversight and monetary penalties.
International Regulation
Certain of our businesses operate internationally and are subject to regulation in the jurisdictions in which they are organized or conduct business. These regulatory regimes vary from jurisdiction to jurisdiction. In addition, our non-U.S. businesses and operations are subject to U.S. laws that regulate the conduct and activities of U.S.-based businesses operating abroad, such as the Foreign Corrupt Practices Act (FCPA), which prohibits offering, promising, providing or authorizing others to give anything of value to a foreign government official to obtain or retain business or otherwise secure a business advantage.
COMPETITION
As a diversified health and well-being services company, we operate in highly competitive markets. Our competitors include managed health care companies, insurance companies, HMOs, TPAs and business services outsourcing companies, health care professionals that have formed networks to contract directly with employers or with CMS, specialty benefit providers, government entities, population health management companies and various health information and consulting companies. For our UnitedHealthcare businesses, our competitors include Aetna Inc., Anthem, Inc., Centene Corporation, Cigna Corporation, Humana Inc., Kaiser Permanente, numerous for-profit and not-for-profit organizations operating under licenses from the Blue Cross Blue Shield Association and, with respect to our Brazilian operations, several established competitors in Brazil and other enterprises that serve more limited geographic areas. For our OptumRx businesses, our competitors include CVS Health Corporation, Express Scripts, Inc. and Prime Therapeutics LLC. New entrants into the markets in which we compete, as well as consolidation within these markets, also contribute to a competitive environment. We compete on the basis of the sales, marketing and pricing of our products and services; product innovation; consumer engagement and satisfaction; the level and quality of products and services; care delivery; network and clinical management capabilities; market share; product distribution systems; efficiency of administration operations; financial strength; and marketplace reputation. If we fail to compete effectively to maintain or increase our market share, including by maintaining or increasing enrollments in businesses providing health benefits, our results of operations, financial position and cash flows could be materially and adversely affected. See
Part I, Item 1A, “Risk Factors,”
for additional discussion of our risks related to competition.
INTELLECTUAL PROPERTY RIGHTS
We have obtained trademark registration for the UnitedHealth Group, UnitedHealthcare and Optum names and logos. We own registrations for certain of our other trademarks in the United States and abroad. We hold a portfolio of patents and have patent applications pending from time to time. We are not substantially dependent on any single patent or group of related patents.
Unless otherwise noted, trademarks appearing in this report are trademarks owned by us. We disclaim any proprietary interest in the marks and names of others.
EMPLOYEES
As of
December 31, 2016
, we employed more than 230,000 individuals.
11
EXECUTIVE OFFICERS OF THE REGISTRANT
The following sets forth certain information regarding our executive officers as of
February 8, 2017
, including the business experience of each executive officer during the past five years:
|
Name
|
Age
|
Position
|
||
|
Stephen J. Hemsley
|
64
|
Chief Executive Officer
|
||
|
David S. Wichmann
|
54
|
President
|
||
|
Larry C. Renfro
|
63
|
Vice Chairman of UnitedHealth Group and Chief Executive Officer of Optum
|
||
|
John F. Rex
|
54
|
Executive Vice President and Chief Financial Officer
|
||
|
Thomas E. Roos
|
44
|
Senior Vice President and Chief Accounting Officer
|
||
|
Marianne D. Short
|
65
|
Executive Vice President and Chief Legal Officer
|
||
|
D. Ellen Wilson
|
59
|
Executive Vice President, Human Capital
|
||
Our Board of Directors elects executive officers annually. Our executive officers serve until their successors are duly elected and qualified, or until their earlier death, resignation, removal or disqualification.
Mr. Hemsley
is Chief Executive Officer of UnitedHealth Group, has served in that capacity since November 2006, and has been a member of the Board of Directors since February 2000. From May 1999 to November 2014, Mr. Hemsley also served as President of UnitedHealth Group.
Mr. Wichmann
is President of UnitedHealth Group. Mr. Wichmann has served as President of UnitedHealth Group since November 2014. From January 2011 to June 2016, Mr. Wichmann also served as Chief Financial Officer. From April 2008 to November 2014, Mr. Wichmann also served as Executive Vice President of UnitedHealth Group and President of UnitedHealth Group Operations.
Mr. Renfro
is Vice Chairman of UnitedHealth Group and Chief Executive Officer of Optum. Mr. Renfro has served as Vice Chairman of UnitedHealth Group since November 2014 and Chief Executive Officer of Optum since July 2011. From January 2011 to July 2011, Mr. Renfro served as Executive Vice President of UnitedHealth Group.
Mr. Rex
is Executive Vice President and Chief Financial Officer of UnitedHealth Group and has served in that capacity since June 2016. From March 2012 to June 2016, Mr. Rex served as Executive Vice President and Chief Financial Officer of Optum. Prior to joining Optum in 2012, Mr. Rex spent over a decade at JP Morgan, a global financial services firm, and its predecessors, concluding his tenure as a Managing Director.
Mr. Roos
is Senior Vice President and Chief Accounting Officer of UnitedHealth Group and has served in that capacity since August 2015. Prior to joining UnitedHealth Group, Mr. Roos was a Partner at Deloitte & Touche LLP, an independent registered accounting firm, from September 2007 to August 2015.
Ms. Short
is Executive Vice President and Chief Legal Officer of UnitedHealth Group and has served in that capacity since January 2013. Prior to joining UnitedHealth Group, Ms. Short served as the Managing Partner at Dorsey & Whitney LLP, an international law firm, from January 2007 to December 2012.
Ms. Wilson
is Executive Vice President, Human Capital of UnitedHealth Group and has served in that capacity since June 2013. From January 2012 to May 2013, Ms. Wilson served as Chief Administrative Officer of Optum. Prior to joining Optum, Ms. Wilson served for 17 years at Fidelity Investments concluding her tenure there as head of Human Resources.
Additional Information
UnitedHealth Group Incorporated was incorporated in January 1977 in Minnesota. On July 1, 2015, UnitedHealth Group Incorporated changed its state of incorporation from Minnesota to Delaware pursuant to a plan of conversion. Our executive offices are located at UnitedHealth Group Center, 9900 Bren Road East, Minnetonka, Minnesota 55343; our telephone number is (952) 936-1300.
You can access our website at
www.unitedhealthgroup.com
to learn more about our Company. From that site, you can download and print copies of our annual reports to shareholders, annual reports on Form 10-K, quarterly reports on Form 10-Q and current reports on Form 8-K, along with amendments to those reports. You can also download from our website our certificate of incorporation, bylaws and corporate governance policies, including our Principles of Governance, Board of
12
Directors Committee Charters and Code of Conduct. We make periodic reports and amendments available, free of charge, as soon as reasonably practicable after we file or furnish these reports to the Securities and Exchange Commission (SEC). We will also provide a copy of any of our corporate governance policies published on our website free of charge, upon request. To request a copy of any of these documents, please submit your request to: UnitedHealth Group Incorporated, 9900 Bren Road East, Minnetonka, MN 55343, Attn: Corporate Secretary. Information on or linked to our website is neither part of nor incorporated by reference into this Annual Report on Form 10-K or any other SEC filings.
Our transfer agent, Wells Fargo Shareowner Services, can help you with a variety of shareholder-related services, including change of address, lost stock certificates, transfer of stock to another person and other administrative services. You can write to our transfer agent at: Wells Fargo Shareowner Services, P.O. Box 64854, St. Paul, Minnesota 55164-0854, email
stocktransfer@wellsfargo.com
, or telephone (800) 468-9716 or (651) 450-4064.
CAUTIONARY STATEMENTS
The statements, estimates, projections or outlook contained in this Annual Report on Form 10-K include forward-looking statements within the meaning of the Private Securities Litigation Reform Act of 1995 (PSLRA). When used in this Annual Report on Form 10-K and in future filings by us with the SEC, in our news releases, presentations to securities analysts or investors, and in oral statements made by or with the approval of one of our executive officers, the words “believe,” “expect,” “intend,” “estimate,” “anticipate,” “forecast,” “outlook,” “plan,” “project,” “should” or similar words or phrases are intended to identify such forward-looking statements. These statements are intended to take advantage of the “safe harbor” provisions of the PSLRA. These forward-looking statements involve risks and uncertainties that may cause our actual results to differ materially from the expectations expressed or implied in the forward-looking statements. Any forward-looking statement speaks only as of the date of this report and, except as required by law; we undertake no obligation to update any forward-looking statement to reflect events or circumstances, including unanticipated events, after the date of this report.
The following discussion contains cautionary statements regarding our business that investors and others should consider. We do not undertake to address in future filings or communications regarding our business or results of operations how any of these factors may have caused our results to differ from discussions or information contained in previous filings or communications. In addition, any of the matters discussed below may have affected past, as well as current, forward-looking statements about future results. Any or all forward-looking statements in this Annual Report on Form 10-K and in any other public filings or statements we make may turn out to be wrong. Our forward-looking statements can be affected by inaccurate assumptions we might make or by known or unknown risks and uncertainties. Many factors discussed below will be important in determining our future results. By their nature, forward-looking statements are not guarantees of future performance or results and are subject to risks, uncertainties and assumptions that are difficult to predict or quantify.
If we fail to estimate, price for and manage our medical costs in an effective manner, the profitability of our risk-based products and services could decline and could materially and adversely affect our results of operations, financial position and cash flows.
Through our risk-based benefit products, we assume the risk of both medical and administrative costs for our customers in return for monthly premiums. Premium revenues from risk-based benefits products comprise nearly 80% of our total consolidated revenues. We generally use approximately 80% to 85% of our premium revenues to pay the costs of health care services delivered to these customers. The profitability of our products depends in large part on our ability to predict, price for, and effectively manage medical costs. In this regard, federal and state regulatory requirements obligate our commercial, Medicare Advantage and certain state-based Medicaid health plans to maintain minimum MLRs, which could make it more difficult for us to obtain price increases for our products. In addition, our OptumHealth business negotiates capitation arrangements with commercial third-party payers. Under the typical capitation arrangement, the health care provider receives a fixed percentage of a third-party payer’s premiums to cover all or a defined portion of the medical costs provided to the capitated member. If we fail to predict accurately, price for or manage the costs of providing care to our capitated members, our results of operations could be materially and adversely affected.
We manage medical costs through underwriting criteria, product design, negotiation of favorable provider contracts and care management programs. Total medical costs are affected by the number of individual services rendered, the cost of each service and the type of service rendered. Our premium revenue on commercial policies is typically at a fixed monthly rate per individual served for a 12-month period and is generally priced one to six months before the contract commences. Our revenue on Medicare policies is based on bids submitted in June the year before the contract year. Although we base the premiums we charge and our Medicare bids on our estimates of future medical costs over the fixed contract period, many factors may cause actual costs to exceed those estimated and reflected in premiums or bids. These factors may include medical cost inflation, increased use of services, increased cost of individual services, natural catastrophes or other large-scale medical emergencies, epidemics, the introduction of new or costly drugs, treatments and technology, new mandated benefits (such as the expansion of
13
essential benefits coverage) or other regulatory changes and insured population characteristics. Relatively small differences between predicted and actual medical costs or utilization rates as a percentage of revenues can result in significant changes in our financial results. For example, if our 2016 medical costs for commercial insured products were 1% higher, without proportionally higher revenues from such products, our annual net earnings for 2016 would have been reduced by approximately $240 million, excluding any offsetting impact from risk adjustment, reinsurance or from reduced premium rebates due to minimum MLRs.
In addition, the financial results we report for any particular period include estimates of costs that have been incurred for which claims are still outstanding. These estimates involve an extensive degree of judgment. If these estimates prove inaccurate, our results of operations could be materially and adversely affected.
Our business activities are highly regulated and new laws or regulations or changes in existing laws or regulations or their enforcement or application could materially and adversely affect our business.
We are regulated by federal, state and local governments in the United States and other countries where we do business. Our insurance and HMO subsidiaries must be licensed by and are subject to regulation in the jurisdictions in which they conduct business. For example, states require periodic financial reports and enforce minimum capital or restricted cash reserve requirements. Health plans and insurance companies are also regulated under state insurance holding company regulations and some of our activities may be subject to other health care-related regulations and requirements, including those relating to PPOs, MCOs, UR and TPA-related regulations and licensure requirements. Some of our UnitedHealthcare and Optum businesses hold or provide services related to government contracts and are subject to U.S. federal and state and non-U.S. self-referral, anti-kickback, medical necessity, risk adjustment, false claims and other laws and regulations governing government contractors and the use of government funds. In addition, under state guaranty association laws, certain insurance companies can be assessed (up to prescribed limits) for certain obligations to the policyholders and claimants of impaired or insolvent insurance companies that write the same line or similar lines of business. Some states have similar laws relating to HMOs and other payers such as consumer operated and oriented plans (co-ops) established under the ACA. Any such assessment could expose our insurance entities and other insurers to the risk of paying a portion of an impaired or insolvent insurance company’s claims through state guaranty associations.
Certain of our businesses provide products or services to various government agencies. Our relationships with these government agencies are subject to the terms of contracts that we hold with the agencies and to laws and regulations regarding government contracts. Among others, certain laws and regulations restrict or prohibit companies from performing work for government agencies that might be viewed as an actual or potential conflict of interest. These laws may limit our ability to pursue and perform certain types of work, thereby materially and adversely affecting our results of operations, financial position and cash flows.
Certain of our Optum businesses are also subject to regulations, which are distinct from those faced by our insurance and HMO subsidiaries, including, for example, state telemedicine regulations, debt collection laws, banking regulations, distributor and producer licensing requirements, state corporate practice of medicine doctrines, fee-splitting rules, health care facility licensure and certificate of need requirements, some of which could impact our relationships with physicians, hospitals and customers. These risks and uncertainties may materially and adversely affect our ability to market our products and services, or to do so at targeted margins, or may increase the regulatory burdens under which we operate.
The laws and rules governing our business and interpretations of those laws and rules are subject to frequent change, and the integration into our businesses of entities that we acquire may affect the way in which existing laws and rules apply to us, including subjecting us to laws and rules that did not previously apply to us. The broad latitude given to the agencies administering, interpreting and enforcing current and future regulations governing our business could force us to change how we do business, restrict revenue and enrollment growth, increase our health care and administrative costs and capital requirements, or expose us to increased liability in courts for coverage determinations, contract interpretation and other actions.
We must also obtain and maintain regulatory approvals to market many of our products and services, increase prices for certain regulated products and services and complete certain acquisitions and dispositions or integrate certain acquisitions. For example, premium rates for our health insurance and managed care products are subject to regulatory review or approval in many states and by the federal government. Additionally, we must submit data on all proposed rate increases to HHS for monitoring purposes on many of our products. Geographic and product expansions may be subject to state and federal regulatory approvals. Delays in obtaining necessary approvals or our failure to obtain or maintain adequate approvals could materially and adversely affect our results of operations, financial position and cash flows.
Certain of our businesses operate internationally and are subject to regulation in the jurisdictions in which they are organized or conduct business. These regulatory regimes encompass, among other matters, local and cross-border taxation, licensing, tariffs, intellectual property, investment, capital (including minimum solvency margin and reserve requirements), management control, labor, anti-fraud, anti-corruption and privacy and data protection regulations (including requirements for cross-border data
14
transfers) that vary by jurisdiction. We currently operate outside of the United States and in the future may acquire or commence additional businesses based outside of the United States, increasing our exposure to non-U.S. regulatory regimes. For example, our UnitedHealthcare Brazil business subjects us to Brazilian laws and regulations affecting hospitals, managed care and insurance industries and to regulation by Brazilian regulators, including the national regulatory agency for private health insurance and plans, the Agência Nacional de Saúde Suplementar, whose approach to the interpretation, implementation and enforcement of industry regulations could differ from the approach taken by U.S. regulators. In addition, our non-U.S. businesses and operations are subject to U.S. laws that regulate the conduct and activities of U.S.-based businesses operating abroad, such as the FCPA, which prohibits offering, promising, providing or authorizing others to give anything of value to a foreign government official to obtain or retain business or otherwise secure a business advantage. Our failure to comply with U.S. or non-U.S. laws and regulations governing our conduct outside the United States or to establish constructive relations with non-U.S. regulators could adversely affect our ability to market our products and services, or to do so at targeted operating margins, which may have a material adverse effect on our business, financial condition and results of operations.
The health care industry is also regularly subject to negative publicity, including as a result of governmental investigations, adverse media coverage and political debate surrounding industry regulation. Negative publicity may adversely affect our stock price and damage our reputation in various markets.
The ACA could materially and adversely affect the manner in which we conduct business and our results of operations, financial position and cash flows.
Due to its complexity and continued uncertainty, the ACA’s impact remains difficult to predict and could adversely affect us. The ACA includes specific reforms for the individual and small group marketplace, including guaranteed availability of coverage, adjusted community rating requirements (which include elimination of health status and gender rating factors), essential health benefit requirements (resulting in benefit changes for many members) and actuarial value requirements resulting in expanded benefits or reduced member cost sharing (or a combination of both) for many policyholders. In addition, if we do not maintain certain MLRs, we are required to rebate ratable portions of our premiums to our customers. These requirements can cause significant disruptions in local health care markets and adjustments to our business, all of which could materially and adversely affect our results of operations, financial position and cash flows.
Our results of operations, financial position and cash flows could be materially and adversely affected if the number of individuals who gain coverage under the ACA varies from our expectations, if the demand for the ACA related products and capabilities offered by our Optum businesses is less than anticipated or if our costs are greater than anticipated.
The Trump Administration and Congressional Leaders have expressed their intentions to repeal and replace the ACA. We cannot predict if the ACA will be modified, repealed or replaced, but changes to this law could materially impact our operating results, require us to revise the ways in which we conduct business or put us at risk for loss of business.
As a result of our participation in various government health care programs, both as a payer and as a service provider to payers, we are exposed to additional risks associated with program funding, enrollments, payment adjustments, audits and government investigations that could materially and adversely affect our business, results of operations, financial position and cash flows.
We participate in various federal, state and local government health care benefit programs, including as a payer in Medicare Advantage, Medicare Part D, various Medicaid programs, CHIP and our TRICARE contract with the DoD, and receive substantial revenues from these programs. Certain of our Optum businesses also provide services to payers participating in government health care programs. A reduction or less than expected increase, or a protracted delay, in government funding for these programs or change in allocation methodologies, or, as is a typical feature of many government contracts, termination of the contract at the option of the government, may materially and adversely affect our results of operations, financial position and cash flows.
The government health care programs in which we participate generally are subject to frequent changes, including changes that may reduce the number of persons enrolled or eligible for coverage, reduce the amount of reimbursement or payment levels, reduce our participation in certain service areas or markets, or increase our administrative or medical costs under such programs. Revenues for these programs depend on periodic funding from the federal government or applicable state governments and allocation of the funding through various payment mechanisms. Funding for these government programs depends on many factors outside of our control, including general economic conditions and budgetary constraints at the federal or applicable state level. For example CMS has in the past reduced or frozen Medicare Advantage benchmarks, and additional cuts to Medicare Advantage benchmarks are possible. In addition, from time to time, CMS makes changes to the way it calculates Medicare Advantage risk adjustment payments. Although we have adjusted members’ benefits and premiums on a selective basis, ceased to offer benefit plans in certain counties, and intensified both our medical and operating cost management in response to the benchmark reductions and other funding pressures, these or other strategies may not fully
15
address the funding pressures in the Medicare Advantage program. In addition, payers in the Medicare Advantage program may be subject to reductions in payments from CMS as a result of decreased funding or recoupment pursuant to government audit.
Under the Medicaid managed care program, state Medicaid agencies seek bids from eligible health plans to continue their participation in the acute care Medicaid health programs. If we are not successful in obtaining renewals of state Medicaid managed care contracts, we risk losing the members that were enrolled in those Medicaid plans. Under the Medicare Part D program, to qualify for automatic enrollment of low income members, our bids must result in an enrollee premium below a regional benchmark, which is calculated by the government after all regional bids are submitted. If the enrollee premium is not below the government benchmark, we risk losing the members who were auto-assigned to us and will not have additional members auto-assigned to us. In general, our bids are based upon certain assumptions regarding enrollment, utilization, medical costs and other factors. In the event any of these assumptions is materially incorrect, either as a result of unforeseen changes to the programs on which we bid, or submission by our competitors at lower rates than our bids, our results of operations, financial position and cash flows could be materially and adversely affected.
Many of the government health care coverage programs in which we participate are subject to the prior satisfaction of certain conditions or performance standards or benchmarks. For example, as part of the ACA, CMS has a system that provides various quality bonus payments to Medicare Advantage plans that meet certain quality star ratings at the local plan level. The star rating system considers various measures adopted by CMS, including, among other things, quality of care, preventative services, chronic illness management and customer satisfaction. Plans must have a rating of four stars or higher to qualify for bonus payments. If we do not maintain or continue to improve our star ratings, our plans may not be eligible for quality bonuses and we may experience a negative impact on our revenues and the benefits that our plans can offer, which could materially and adversely affect our membership levels, results of operations, financial position and cash flows. In addition, under the ACA, Congress authorized CMS and the states to implement MMP managed care demonstration programs to serve dually eligible beneficiaries to improve the coordination of their care. Health plan participation in these demonstration programs is subject to CMS approval of specified care delivery models and the satisfaction of conditions to participation, including meeting certain performance requirements. Any changes in standards or care delivery models that apply to government health care programs, including Medicare, Medicaid and the MMP demonstration programs for dually eligible beneficiaries, or our inability to improve our quality scores and star ratings to meet government performance requirements or to match the performance of our competitors could result in limitations to our participation in or exclusion from these or other government programs, which in turn could materially and adversely affect our results of operations, financial position and cash flows.
CMS uses various payment mechanisms to allocate funding for Medicare programs, including adjusting monthly capitation payments to Medicare Advantage plans and Medicare Part D plans according to the predicted health status of each beneficiary as supported by data from health care providers for Medicare Advantage plans, as well as, for Medicare Part D plans, risk-sharing provisions based on a comparison of costs predicted in our annual bids to actual prescription drug costs. Some state Medicaid programs utilize a similar process. For example, our UnitedHealthcare Medicare & Retirement and UnitedHealthcare Community & State businesses submit information relating to the health status of enrollees to CMS or state agencies for purposes of determining the amount of certain payments to us. CMS and the Office of Inspector General for HHS periodically perform risk adjustment data validation (RADV) audits of selected Medicare health plans to validate the coding practices of and supporting documentation maintained by health care providers, and certain of our local plans have been selected for audit. Such audits have in the past resulted and could in the future result in retrospective adjustments to payments made to our health plans, fines, corrective action plans or other adverse action by CMS.
We have been and may in the future become involved in routine, regular and special governmental investigations, audits, reviews and assessments. Certain of our businesses have been reviewed or are currently under review, including for compliance with coding and other requirements under the Medicare risk-adjustment model, our chart review programs and related processes. Such investigations, audits or reviews sometimes arise out of or prompt claims by private litigants or whistleblowers that, among other allegations, we failed to disclose certain business practices or, as a government contractor, submitted false claims to the government. Governmental investigations, audits, reviews and assessments could lead to government actions, which could result in adverse publicity, the assessment of damages, civil or criminal fines or penalties, or other sanctions, including restrictions or changes in the way we conduct business, loss of licensure or exclusion from participation in government programs, any of which could have a material adverse effect on our business, results of operations, financial position and cash flows.
If we fail to comply with applicable privacy, security and data laws, regulations and standards, including with respect to third-party service providers that utilize sensitive personal information on our behalf, our business, reputation, results of operations, financial position and cash flows could be materially and adversely affected.
The collection, maintenance, protection, use, transmission, disclosure and disposal of sensitive personal information are regulated at the federal, state, international and industry levels and requirements are imposed on us by contracts with customers. These laws, rules and requirements are subject to change. Compliance with new privacy and security laws, regulations and requirements may result in increased operating costs, and may constrain or require us to alter our business
16
model or operations. For example, the HITECH amendments to HIPAA imposed further restrictions on our ability to collect, disclose and use sensitive personal information and imposed additional compliance requirements on our business. In addition, the General Data Protection Regulation of the European Union imposes higher potential penalties and more stringent compliance and data security requirements on our ability to collect, process and transfer personal data relating to our European businesses.
Many of our businesses are also subject to the Payment Card Industry Data Security Standard, which is a multifaceted security standard that is designed to protect credit card account data as mandated by payment card industry entities.
HIPAA requires business associates as well as covered entities to comply with certain privacy and security requirements. While we provide for appropriate protections through our contracts with our third-party service providers and in certain cases assess their security controls, we have limited oversight or control over their actions and practices. Several of our businesses act as business associates to their covered entity customers and, as a result, collect, use, disclose and maintain sensitive personal information in order to provide services to these customers. HHS has announced that it will continue its audit program to assess HIPAA compliance efforts by covered entities and expand it to include business associates. An audit resulting in findings or allegations of noncompliance could have a material adverse effect on our results of operations, financial position and cash flows.
Through our Optum businesses, including our Optum Labs business, we maintain a database of administrative and clinical data that is statistically de-identified in accordance with HIPAA standards. Noncompliance or findings of noncompliance with applicable laws, regulations or requirements, or the occurrence of any privacy or security breach involving the misappropriation, loss or other unauthorized disclosure of sensitive personal information, whether by us or by one of our third-party service providers, could have a material adverse effect on our reputation and business, including mandatory disclosure to the media, loss of existing or new customers, significant increases in the cost of managing and remediating privacy or security incidents and material fines, penalties and litigation awards, among other consequences, any of which could have a material and adverse effect on our results of operations, financial position and cash flows.
Our businesses providing pharmacy care services face regulatory and operational risks and uncertainties that may differ from the risks of our other businesses.
We provide pharmacy care services through our OptumRx and UnitedHealthcare businesses. Each business is subject to federal and state anti-kickback and other laws that govern the relationships of the business with pharmaceutical manufacturers, physicians, pharmacies, customers and consumers. OptumRx also conducts business through home delivery and specialty pharmacies, which subjects it to extensive federal, state and local laws and regulations, including those of the DEA and individual state controlled substance authorities. In addition, federal and state legislatures regularly consider new regulations for the industry that could materially and adversely affect current industry practices, including potential new regulations regarding the receipt or disclosure of rebates from pharmaceutical companies, the development and use of formularies, the use of average wholesale prices or other pricing benchmarks, pricing for specialty pharmaceuticals and pharmacy network reimbursement methodologies.
Our pharmacy care services businesses would be materially and adversely affected by our inability to contract on favorable terms with pharmaceutical manufacturers and other suppliers, and could face potential claims in connection with purported errors by our home delivery or specialty pharmacies, including in connection with the risks inherent in the packaging and distribution of pharmaceuticals and other health care products. Disruptions at any of our home delivery or specialty pharmacies due to an accident or an event that is beyond our control could affect our ability to process and dispense prescriptions in a timely manner and could materially and adversely affect our results of operations, financial position and cash flows.
In addition, our pharmacy care services businesses provide services to sponsors of health benefit plans that are subject to ERISA. A private party or the DOL, which is the agency that enforces ERISA, could assert that the fiduciary obligations imposed by the statute apply to some or all of the services provided by our pharmacy care services businesses even where our pharmacy care services businesses are not contractually obligated to assume fiduciary obligations. In the event a court were to determine that fiduciary obligations apply to our pharmacy care services businesses in connection with services for which our pharmacy care services businesses are not contractually obligated to assume fiduciary obligations, we could be subject to claims for breaches of fiduciary obligations or claims that we entered into certain prohibited transactions.
If we fail to compete effectively to maintain or increase our market share, including maintaining or increasing enrollments in businesses providing health benefits, our results of operations, financial position and cash flows
could be materially and adversely affected.
Our businesses compete throughout the United States, Brazil and other foreign markets and face significant competition in all of the geographic markets in which we operate. In particular markets, our competitors, compared to us, may have greater capabilities, resources or market share; a more established reputation; superior supplier or health care professional arrangements; better existing business relationships; lower profit margin or financial return expectations; or other factors that
17
give such competitors a competitive advantage. In addition, our competitive position may be adversely affected by significant merger and acquisition activity that has occurred in the industries in which we operate, both among our competitors and suppliers (including hospitals, physician groups and other care professionals). Consolidation may make it more difficult for us to retain or increase our customer base, improve the terms on which we do business with our suppliers, or maintain or increase profitability. Additionally, new direct-to-consumer business models from competing businesses may make it more difficult for us to directly engage consumers in the selection and management of their health care benefits, health care usage, and in the effective navigation of the health care system we may be challenged by new technologies and market entrants that could disrupt our existing relationship with health plan enrollees in these areas. Our business, results of operations, financial position and cash flows could be materially and adversely affected if we do not compete effectively in our markets, if we set rates too high or too low in highly competitive markets, if we do not design and price our products properly and competitively, if we are unable to innovate and deliver products and services that demonstrate value to our customers, if we do not provide a satisfactory level of services, if membership or demand for other services does not increase as we expect or declines, or if we lose accounts with more profitable products while retaining or increasing membership in accounts with less profitable products.
If we fail to develop and maintain satisfactory relationships with physicians, hospitals and other service providers, our business could be materially and adversely affected.
Our results of operations and prospects are substantially dependent on our continued ability to contract with physicians, hospitals, pharmaceutical benefit service providers, pharmaceutical manufacturers and other service providers at competitive prices. Any failure to develop and maintain satisfactory relationships with health care providers, whether in-network or out-of-network, could materially and adversely affect our business, results of operations, financial position and cash flows. In addition, certain activities related to network design, provider participation in networks and provider payments could result in disputes that may be costly, distract managements’ attention and result in negative publicity.
In any particular market, physicians and health care providers could refuse to contract, demand higher payments, or take other actions that could result in higher medical costs, less desirable products for customers or difficulty meeting regulatory or accreditation requirements. In some markets, certain health care providers, particularly hospitals, physician/hospital organizations or multi-specialty physician groups, may have significant market positions or near monopolies that could result in diminished bargaining power on our part. In addition, accountable care organizations; practice management companies (which aggregate physician practices for administrative efficiency); and other organizational structures that physicians, hospitals and other care providers choose may change the way in which these providers interact with us and may change the competitive landscape. Such organizations or groups of physicians may compete directly with us, which could adversely affect our operations, and our results of operations, financial position and cash flows by impacting our relationships with these providers or affecting the way that we price our products and estimate our costs, which might require us to incur costs to change our operations. In addition, if these providers refuse to contract with us, use their market position to negotiate favorable contracts or place us at a competitive disadvantage, our ability to market products or to be profitable in those areas could be materially and adversely affected.
We have capitation arrangements with some physicians, hospitals and other health care providers. Capitation arrangements limit our exposure to the risk of increasing medical costs, but expose us to risk related to the adequacy of the financial and medical care resources of the health care provider. To the extent that a capitated health care provider organization faces financial difficulties or otherwise is unable to perform its obligations under the capitation arrangement, we may be held responsible for unpaid health care claims that should have been the responsibility of the capitated health care provider and for which we have already paid the provider, under the capitation arrangement. Further, payment or other disputes between a primary care provider and specialists with whom the primary care provider contracts could result in a disruption in the provision of services to our members or a reduction in the services available to our members. Health care providers with whom we contract may not properly manage the costs of services, maintain financial solvency or avoid disputes with other providers. Any of these events could have a material adverse effect on the provision of services to our members and our operations.
Some providers that render services to our members do not have contracts with us. In those cases, we do not have a pre-established understanding about the amount of compensation that is due to the provider for services rendered to our members. In some states, the amount of compensation due to these out-of-network providers is defined by law or regulation, but in most instances, the amount is either not defined or is established by a standard that does not clearly specify dollar terms. In some instances, providers may believe that they are underpaid for their services and may either litigate or arbitrate their dispute with us or try to recover from our members the difference between what we have paid them and the amount they charged us.
The success of certain businesses, including OptumHealth and UnitedHealthcare Brazil, depend on maintaining satisfactory physician employment relationships. The physicians that practice medicine or contract with our affiliated physician organizations could terminate their provider contracts or otherwise become unable or unwilling to continue practicing medicine or contracting with us. There is and will likely be heightened competition in the markets where we operate to acquire or manage physician practices or to employ or contract with individual physicians. If we are unable to maintain or grow satisfactory relationships with physicians, or to acquire, recruit or, in some instances, employ physicians, or to retain enrollees
18
following the departure of a physician, our revenues could be materially and adversely affected. In addition, our affiliated physician organizations contract with health insurance and HMO competitors of UnitedHealthcare. Our business could suffer if our affiliated physician organizations fail to maintain relationships with these health insurance or HMO companies, or adequately price their contracts with these third-party payers.
In addition, physicians, hospitals, pharmaceutical benefit service providers, pharmaceutical manufacturers and certain health care providers are customers of our Optum businesses. Given the importance of health care providers and other constituents to our businesses, failure to maintain satisfactory relationships with them could materially and adversely affect our results of operations, financial position and cash flows.
We are routinely subject to various litigation actions due to the nature of our business, which could damage our reputation and, if resolved unfavorably, could result in substantial penalties or monetary damages and materially and adversely affect our results of operations, financial position and cash flows.
We are routinely made party to a variety of legal actions related to, among other matters, the design, management and delivery of our product and service offerings. These matters have included or could in the future include matters related to health care benefits coverage and payment claims (including disputes with enrollees, customers and contracted and non-contracted physicians, hospitals and other health care professionals), tort claims (including claims related to the delivery of health care services, such as medical malpractice by health care practitioners who are employed by us, have contractual relationships with us, or serve as providers to our managed care networks), whistleblower claims (including claims under the False Claims Act or similar statutes), contract and labor disputes, tax claims and claims related to disclosure of certain business practices. We are also party to certain class action lawsuits brought by health care professional groups and consumers. In addition, we operate in jurisdictions outside of the United States, where contractual rights, tax positions and applicable regulations may be subject to interpretation or uncertainty to a greater degree than in the United States, and therefore subject to dispute by customers, government authorities or others. We are largely self-insured with regard to litigation risks. Although we maintain excess liability insurance with outside insurance carriers for claims in excess of our self-insurance, certain types of damages, such as punitive damages in some circumstances, are not covered by insurance. Although we record liabilities for our estimates of the probable costs resulting from self-insured matters, it is possible that the level of actual losses will significantly exceed the liabilities recorded.
We cannot predict the outcome of significant legal actions in which we are involved and are incurring expenses in resolving these matters. The legal actions we face or may face in the future could further increase our cost of doing business and materially and adversely affect our results of operations, financial position and cash flows. In addition, certain legal actions could result in adverse publicity, which could damage our reputation and materially and adversely affect our ability to retain our current business or grow our market share in some markets and businesses.
Any failure by us to manage successfully our strategic alliances or complete, manage or integrate acquisitions and other significant strategic transactions or relationships could materially and adversely affect our business, prospects, results of operations, financial position and cash flows.
As part of our business strategy, we frequently engage in discussions with third parties regarding possible investments, acquisitions, divestitures, strategic alliances, joint ventures and outsourcing transactions and often enter into agreements relating to such transactions. For example, we have a strategic alliance with AARP under which we provide AARP-branded Medicare Supplement insurance to AARP members and other AARP-branded products and services to Medicare beneficiaries. If we fail to meet the needs of our alliance or joint venture partners, including by developing additional products and services, providing high levels of service, pricing our products and services competitively or responding effectively to applicable federal and state regulatory changes, our alliances and joint ventures could be damaged or terminated, which in turn could adversely impact our reputation, business and results of operations. Further, if we fail to identify and successfully complete transactions that further our strategic objectives, we may be required to expend resources to develop products and technology internally, we may be placed at a competitive disadvantage or we may be adversely affected by negative market perceptions, any of which may have a material adverse effect on our results of operations, financial position or cash flows. Success in completing acquisitions is also dependent upon efficiently integrating the acquired business into our existing operations, including our internal control environment, or otherwise leveraging its operations, which may present challenges that are different from those presented by organic growth and that may be difficult for us to manage. If we cannot successfully integrate these acquisitions and realize contemplated revenue growth opportunities and cost savings, our business, prospects, results of operations, financial position and cash flows could be materially and adversely affected.
As we expand and operate our business outside of the United States, we are presented with challenges that differ from those presented by acquisitions of domestic businesses, including challenges in adapting to new markets, business, labor and cultural practices and regulatory environments. Adapting to these challenges could require us to devote significant senior management and other resources to the acquired businesses before we realize anticipated synergies or other benefits from the acquired businesses. These challenges vary widely by country and may include political instability, government intervention,
19
discriminatory regulation and currency exchange controls or other restrictions that could prevent us from transferring funds from these operations out of the countries in which our acquired businesses operate or converting local currencies that we hold into U.S. dollars or other currencies. If we are unable to manage successfully our non-U.S. acquisitions, our business, prospects, results of operations and financial position could be materially and adversely affected.
Foreign currency exchange rates and fluctuations may have an impact on our equity from period to period, which could adversely affect our debt to debt-plus-equity ratio, and our future revenues, costs and cash flows from international operations. Any measures we may implement to reduce the effect of volatile currencies may be costly or ineffective.
Our sales performance will suffer if we do not adequately attract, retain and provide support to a network of independent producers and consultants.
Our products and services are sold in part through independent producers and consultants with whom we do not have exclusive contracts and for whose services and allegiance we must compete intensely. Our sales would be materially and adversely affected if we were unable to attract, retain and support such independent producers and consultants or if our sales strategy is not appropriately aligned across distribution channels. Our relationships with producers could be materially and adversely impacted by changes in our business practices and the nature of our relationships to address these pressures, including potential reductions in commissions.
A number of investigations have been conducted regarding the marketing practices of producers selling health care products and the payments they receive and have resulted in enforcement actions against companies in our industry and producers marketing and selling those companies’ products. If we were subjected to similar investigations and enforcement actions, they could result in penalties and the imposition of corrective action plans, which could materially and adversely impact our ability to market our products.
Unfavorable economic conditions could materially and adversely affect our revenues and our results of operations.
Unfavorable economic conditions may impact demand for certain of our products and services. For example, high unemployment can cause lower enrollment or lower rates of renewal in our employer group plans. Unfavorable economic conditions have also caused and could continue to cause employers to stop offering certain health care coverage as an employee benefit or elect to offer this coverage on a voluntary, employee-funded basis as a means to reduce their operating costs. In addition, unfavorable economic conditions could adversely impact our ability to increase premiums or result in the cancellation by certain customers of our products and services. These conditions could lead to a decrease in our membership levels and premium and fee revenues and could materially and adversely affect our results of operations, financial position and cash flows.
During a prolonged unfavorable economic environment, state and federal budgets could be materially and adversely affected, resulting in reduced reimbursements or payments in our federal and state government health care coverage programs, including Medicare, Medicaid and CHIP. A reduction in state Medicaid reimbursement rates could be implemented retrospectively to apply to payments already negotiated or received from the government and could materially and adversely affect our results of operations, financial position and cash flows. In addition, state and federal budgetary pressures could cause the affected governments to impose new or a higher level of taxes or assessments for our commercial programs, such as premium taxes on insurance companies and HMOs and surcharges or fees on select fee-for-service and capitated medical claims. Any of these developments or actions could materially and adversely affect our results of operations, financial position and cash flows.
A prolonged unfavorable economic environment also could adversely impact the financial position of hospitals and other care providers, which could materially and adversely affect our contracted rates with these parties and increase our medical costs or materially and adversely affect their ability to purchase our service offerings. Further, unfavorable economic conditions could adversely impact the customers of our Optum businesses, including health plans, HMOs, hospitals, care providers, employers and others, which could, in turn, materially and adversely affect Optum’s financial results.
Our investment portfolio may suffer losses, which could materially and adversely affect our results of operations, financial position and cash flows.
Market fluctuations could impair our profitability and capital position. Volatility in interest rates affects our interest income and the market value of our investments in debt securities of varying maturities, which constitute the vast majority of the fair value of our investments as of
December 31, 2016
. Relatively low interest rates on investments, such as those experienced during recent years, have adversely impacted our investment income, and the continuation of the current low interest rate environment could further adversely affect our investment income. In addition, a delay in payment of principal or interest by issuers, or defaults by issuers (primarily from investments in corporate and municipal bonds), could reduce our investment income and require us to write down the value of our investments, which could materially and adversely affect our profitability and equity.
There can be no assurance that our investments will produce total positive returns or that we will not sell investments at prices that are less than their carrying values. Changes in the value of our investment assets, as a result of interest rate fluctuations, changes in issuer financial conditions, illiquidity or otherwise, could have an adverse effect on our equity. In addition, if it
20
became necessary for us to liquidate our investment portfolio on an accelerated basis, such an action could have a material adverse effect on our results of operations and the capital position of regulated subsidiaries.
If the value of our intangible assets is materially impaired, our results of operations, equity and credit ratings could be materially and adversely affected.
As of
December 31, 2016
, goodwill and other intangible assets had a carrying value of
$56 billion
, representing
46%
of our total consolidated assets. We periodically evaluate our goodwill and other intangible assets to determine whether all or a portion of their carrying values may be impaired, in which case a charge to earnings may be necessary. The value of our goodwill may be materially and adversely impacted if businesses that we acquire perform in a manner that is inconsistent with our assumptions. In addition, from time to time we divest businesses, and any such divestiture could result in significant asset impairment and disposition charges, including those related to goodwill and other intangible assets. Any future evaluations requiring an impairment of our goodwill and other intangible assets could materially and adversely affect our results of operations and equity in the period in which the impairment occurs. A material decrease in equity could, in turn, adversely impact our credit ratings and potentially impact our compliance with the covenants in our bank credit facilities.
If we fail to maintain properly the integrity or availability of our data or successfully consolidate, integrate, upgrade or expand our existing information systems, or if our technology products do not operate as intended, our business could be materially and adversely affected.
Our ability to price adequately our products and services, to provide effective service to our customers in an efficient and uninterrupted fashion, and to report accurately our results of operations depends on the integrity of the data in our information systems. We periodically consolidate, integrate, upgrade and expand our information systems capabilities as a result of technology initiatives and recently enacted regulations, changes in our system platforms and integration of new business acquisitions. In addition, recent trends toward greater consumer engagement in health care require new and enhanced technologies, including more sophisticated applications for mobile devices. Our information systems require an ongoing commitment of significant resources to maintain, protect and enhance existing systems and develop new systems to keep pace with continuing changes in information processing technology, evolving systems and regulatory standards and changing customer preferences. If the information we rely upon to run our businesses is found to be inaccurate or unreliable or if we fail to maintain or protect our information systems and data integrity effectively, we could lose existing customers, have difficulty attracting new customers, experience problems in determining medical cost estimates and establishing appropriate pricing, have difficulty preventing, detecting and controlling fraud, have disputes with customers, physicians and other health care professionals, become subject to regulatory sanctions or penalties, incur increases in operating expenses or suffer other adverse consequences. Our process of consolidating the number of systems we operate, upgrading and expanding our information systems capabilities, enhancing our systems and developing new systems to keep pace with continuing changes in information processing technology may not be successful. Failure to protect, consolidate and integrate our systems successfully could result in higher than expected costs and diversion of management’s time and energy, which could materially and adversely affect our results of operations, financial position and cash flows.
Certain of our businesses sell and install software products that may contain unexpected design defects or may encounter unexpected complications during installation or when used with other technologies utilized by the customer. Connectivity among competing technologies is becoming increasingly important in the health care industry. A failure of our technology products to operate as intended and in a seamless fashion with other products could materially and adversely affect our results of operations, financial position and cash flows.
Uncertain and rapidly evolving U.S. federal and state, non-U.S. and international laws and regulations related to the health information technology market may present compliance challenges and could materially and adversely affect the configuration of our information systems and platforms, and our ability to compete in this market.
If we sustain cyber-attacks or other privacy or data security incidents, that result in security breaches that disrupt our operations or result in the unintended dissemination of sensitive personal information or proprietary or confidential information, we could suffer a loss of revenue and increased costs, exposure to significant liability, reputational harm and other serious negative consequences.
We routinely process, store and transmit large amounts of data in our operations, including sensitive personal information as well as proprietary or confidential information relating to our business or third-parties. Some of the data we process, store and transmit may be outside of the United States due to our information technology systems and international business operations. We may be subject to breaches of the information technology systems we use. Experienced computer programmers and hackers may be able to penetrate our layered security controls and misappropriate or compromise sensitive personal information or proprietary or confidential information or that of third-parties, create system disruptions or cause shutdowns. They also may be able to develop and deploy viruses, worms and other malicious software programs that attack our systems or otherwise exploit any security vulnerabilities. Our facilities may also be vulnerable to security incidents or security attacks; acts of vandalism or
21
theft; coordinated attacks by activist entities; misplaced or lost data; human errors; or other similar events that could negatively affect our systems and our and our customer’s data.
The costs to eliminate or address the foregoing security threats and vulnerabilities before or after a cyber-incident could be significant. Our remediation efforts may not be successful and could result in interruptions, delays, or cessation of service and loss of existing or potential customers. In addition, breaches of our security measures and the unauthorized dissemination of sensitive personal information or proprietary information or confidential information about us or our customers or other third-parties, could expose our customers’ private information and our customers to the risk of financial or medical identity theft, or expose us or other third-parties to a risk of loss or misuse of this information, result in litigation and potential liability for us, damage our brand and reputation, or otherwise harm our business.
If we are not able to protect our proprietary rights to our databases, software and related products, our ability to market our knowledge and information-related businesses could be hindered and our results of operations, financial position and cash flows could be materially and adversely affected.
We rely on our agreements with customers, confidentiality agreements with employees and third parties, and our trademarks, trade secrets, copyrights and patents to protect our proprietary rights. These legal protections and precautions may not prevent misappropriation of our proprietary information. In addition, substantial litigation regarding intellectual property rights exists in the software industry, and we expect software products to be increasingly subject to third-party infringement claims as the number of products and competitors in this industry segment grows. Such litigation and misappropriation of our proprietary information could hinder our ability to market and sell products and services and our results of operations, financial position and cash flows could be materially and adversely affected.
Restrictions on our ability to obtain funds from our regulated subsidiaries could materially and adversely affect our results of operations, financial position and cash flows.
Because we operate as a holding company, we are dependent upon dividends and administrative expense reimbursements from our subsidiaries to fund our obligations. Many of these subsidiaries are regulated by departments of insurance or similar regulatory authorities. We are also required by law or regulation to maintain specific prescribed minimum amounts of capital in these subsidiaries. The levels of capitalization required depend primarily upon the volume of premium revenues generated by the applicable subsidiary. In most states, we are required to seek prior approval by state regulatory authorities before we transfer money or pay dividends from our regulated subsidiaries that exceed specified amounts. An inability of our regulated subsidiaries to pay dividends to their parent companies in the desired amounts or at the time of our choosing could adversely affect our ability to reinvest in our business through capital expenditures or business acquisitions, as well as our ability to maintain our corporate quarterly dividend payment, repurchase shares of our common stock and repay our debt. If we are unable to obtain sufficient funds from our subsidiaries to fund our obligations, our results of operations, financial position and cash flows could be materially and adversely affected.
Any downgrades in our credit ratings could adversely affect our business, financial condition and results of operations.
Claims paying ability, financial strength and debt ratings by Nationally Recognized Statistical Rating Organizations are important factors in establishing the competitive position of insurance companies. Ratings information is broadly disseminated and generally used by customers and creditors. We believe our claims paying ability and financial strength ratings are important factors in marketing our products to certain of our customers. Our credit ratings impact both the cost and availability of future borrowings. Each of the credit rating agencies reviews its ratings periodically. Our ratings reflect each credit rating agency’s opinion of our financial strength, operating performance and ability to meet our debt obligations or obligations to policyholders. There can be no assurance that our current credit ratings will be maintained in the future. Downgrades in our credit ratings, should they occur, could materially increase our costs of or ability to access funds in the debt and capital markets and otherwise materially increase our operating costs.
None.
|
ITEM 2.
|
PROPERTIES
|
To support our business operations in the United States and other countries we own and lease real properties. Our various reportable segments use these facilities for their respective business purposes, and we believe these current facilities are suitable for their respective uses and are adequate for our anticipated future needs.
22
The information required by this Item 3 is incorporated herein by reference to the information set forth under the captions “Litigation Matters” and “Governmental Investigations, Audits and Reviews” in
Note 12 of Notes to the Consolidated Financial Statements included in Part II, Item 8, “Financial Statements.”
|
ITEM 4.
|
MINE SAFETY DISCLOSURES
|
Not Applicable.
23
|
ITEM 5.
|
MARKET FOR REGISTRANT’S COMMON EQUITY, RELATED SHAREHOLDER MATTERS AND ISSUER PURCHASES OF EQUITY SECURITIES
|
MARKET PRICES AND HOLDERS
Our common stock is traded on the New York Stock Exchange (NYSE) under the symbol UNH. On January 31, 2017, there were 13,035 registered holders of record of our common stock. The high and low per share common stock sales prices reported by the NYSE and cash dividends declared for our last two fiscal years were as follows:
|
High
|
Low
|
Cash Dividends Declared
|
|||||||||
|
2016
|
|||||||||||
|
First quarter
|
$
|
131.10
|
|
$
|
107.51
|
|
$
|
0.500
|
|
||
|
Second quarter
|
$
|
141.31
|
|
$
|
125.26
|
|
$
|
0.625
|
|
||
|
Third quarter
|
$
|
144.48
|
|
$
|
132.39
|
|
$
|
0.625
|
|
||
|
Fourth quarter
|
$
|
164.00
|
|
$
|
133.03
|
|
$
|
0.625
|
|
||
|
2015
|
|||||||||||
|
First quarter
|
$
|
123.76
|
|
$
|
98.46
|
|
$
|
0.375
|
|
||
|
Second quarter
|
$
|
124.11
|
|
$
|
111.12
|
|
$
|
0.500
|
|
||
|
Third quarter
|
$
|
126.21
|
|
$
|
95.00
|
|
$
|
0.500
|
|
||
|
Fourth quarter
|
$
|
125.99
|
|
$
|
109.61
|
|
$
|
0.500
|
|
||
DIVIDEND POLICY
In June 2016, our Board of Directors increased the Company’s quarterly cash dividend to shareholders to an annual dividend rate of
$2.50
per share compared to the annual dividend rate of
$2.00
per share, which the Company had paid since June 2015. Declaration and payment of future quarterly dividends is at the discretion of the Board and may be adjusted as business needs or market conditions change.
ISSUER PURCHASES OF EQUITY SECURITIES
In November 1997, our Board of Directors adopted a share repurchase program, which the Board evaluates periodically. There is no established expiration date for the program. During the fourth quarter 2016, we repurchased approximately 1 million shares at an average price of $141.54 per share. As of December 31, 2016, we had Board authorization to purchase up to
51 million shares of our common stock.
PERFORMANCE GRAPHS
The following two performance graphs compare our total return to shareholders with the returns of indexes of other specified companies and the S&P 500 Index. The first graph compares the cumulative five-year total return to shareholders on our common stock relative to the cumulative total returns of the S&P 500 index and a customized peer group of certain
Fortune 50
companies (the “
Fortune 50
Group”) for the five-year period ended
December 31, 2016
. The second graph compares our cumulative total return to shareholders with the S&P 500 Index and an index of a group of peer companies selected by us for the five-year period ended
December 31, 2016
. We are not included in either the
Fortune 50
Group index in the first graph or the peer group index in the second graph. In calculating the cumulative total shareholder return of the indexes, the shareholder returns of the
Fortune 50
Group companies in the first graph and the peer group companies in the second graph are weighted according to the stock market capitalizations of the companies at January 1 of each year. The comparisons assume the investment of $100 on December 31, 2011 in our common stock and in each index, and that dividends were reinvested when paid.
24
Fortune 50 Group
The
Fortune 50
Group consists of the following companies: American International Group, Inc., Berkshire Hathaway Inc., Cardinal Health, Inc., Citigroup Inc., General Electric Company, International Business Machines Corporation and Johnson & Johnson. Although there are differences among the companies in terms of size and industry, like UnitedHealth Group, all of these companies are large multi-segment companies using a well-defined operating model in one or more broad sectors of the economy.
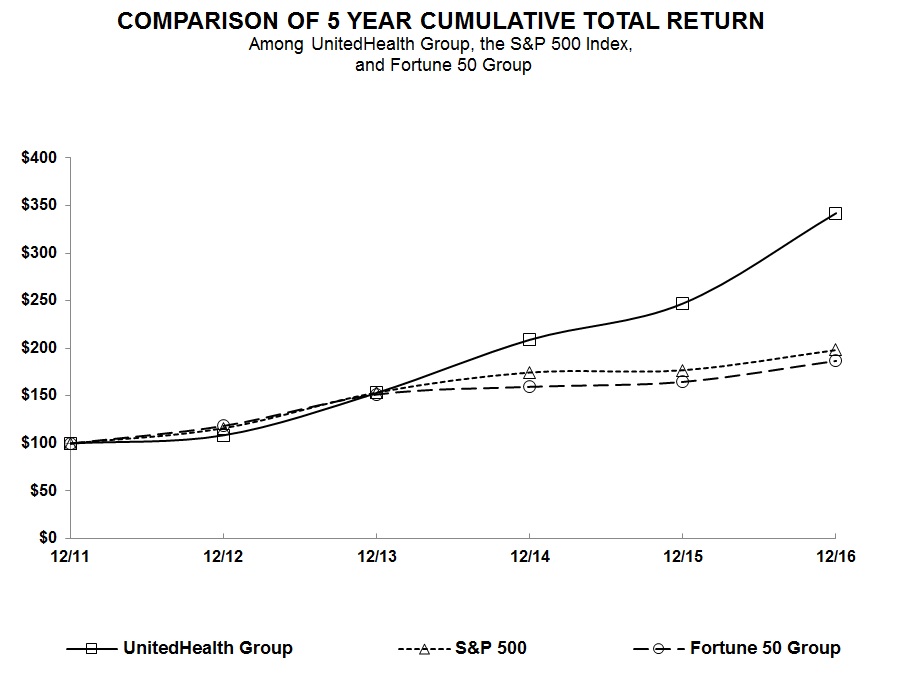
|
12/11
|
12/12
|
12/13
|
12/14
|
12/15
|
12/16
|
||||||||||||||||||
|
UnitedHealth Group
|
$
|
100.00
|
|
$
|
108.59
|
|
$
|
153.15
|
|
$
|
208.98
|
|
$
|
247.13
|
|
$
|
342.05
|
|
|||||
|
S&P 500 Index
|
100.00
|
|
116.00
|
|
153.58
|
|
174.60
|
|
177.01
|
|
198.18
|
|
|||||||||||
|
Fortune 50 Group
|
100.00
|
|
118.48
|
|
151.44
|
|
159.51
|
|
164.70
|
|
186.76
|
|
|||||||||||
The stock price performance included in this graph is not necessarily indicative of future stock price performance.
25
Peer Group
The companies included in our peer group are Aetna Inc., Anthem Inc., Cigna Corporation and Humana Inc. We believe that this peer group reflects publicly traded peers to our UnitedHealthcare businesses.
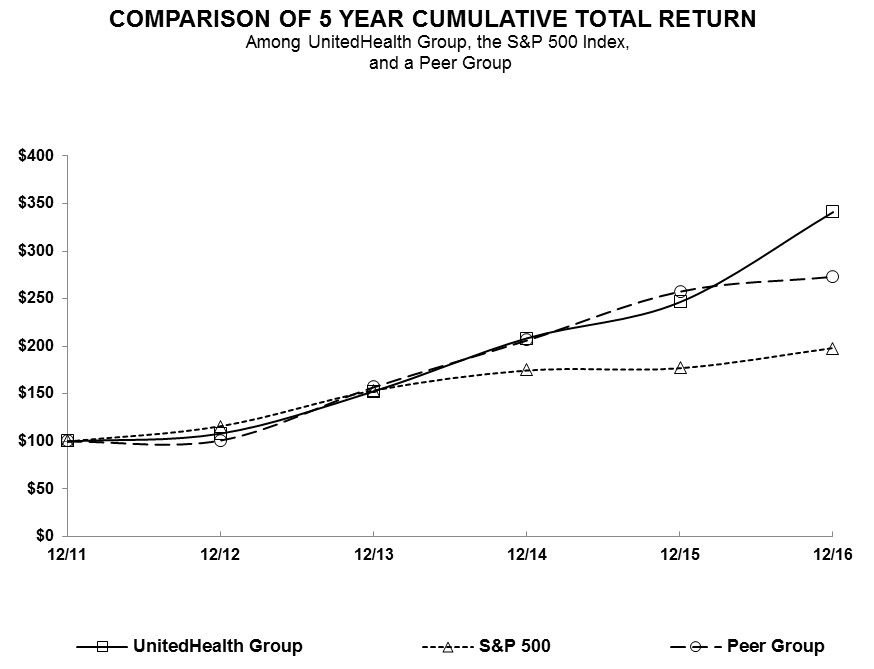
|
12/11
|
12/12
|
12/13
|
12/14
|
12/15
|
12/16
|
||||||||||||||||||
|
UnitedHealth Group
|
$
|
100.00
|
|
$
|
108.59
|
|
$
|
153.15
|
|
$
|
208.98
|
|
$
|
247.13
|
|
$
|
342.05
|
|
|||||
|
S&P 500 Index
|
100.00
|
|
116.00
|
|
153.58
|
|
174.60
|
|
177.01
|
|
198.18
|
|
|||||||||||
|
Peer Group
|
100.00
|
|
101.01
|
|
156.96
|
|
206.09
|
|
257.48
|
|
273.12
|
|
|||||||||||
The stock price performance included in this graph is not necessarily indicative of future stock price performance.
26
|
ITEM 6.
|
SELECTED FINANCIAL DATA
|
|
For the Year Ended December 31,
|
||||||||||||||||||||
|
(in millions, except percentages and per share data)
|
2016
|
2015 (a)
|
2014
|
2013
|
2012
|
|||||||||||||||
|
Consolidated operating results
|
||||||||||||||||||||
|
Revenues
|
$
|
184,840
|
|
$
|
157,107
|
|
$
|
130,474
|
|
$
|
122,489
|
|
$
|
110,618
|
|
|||||
|
Earnings from operations
|
12,930
|
|
11,021
|
|
10,274
|
|
9,623
|
|
9,254
|
|
||||||||||
|
Net earnings attributable to UnitedHealth Group common shareholders
|
7,017
|
|
5,813
|
|
5,619
|
|
5,625
|
|
5,526
|
|
||||||||||
|
Return on equity (b)
|
19.4
|
%
|
17.7
|
%
|
17.3
|
%
|
17.7
|
%
|
18.7
|
%
|
||||||||||
|
Basic earnings per share attributable to UnitedHealth Group common shareholders
|
$
|
7.37
|
|
$
|
6.10
|
|
$
|
5.78
|
|
$
|
5.59
|
|
$
|
5.38
|
|
|||||
|
Diluted earnings per share attributable to UnitedHealth Group common shareholders
|
7.25
|
|
6.01
|
|
5.70
|
|
5.50
|
|
5.28
|
|
||||||||||
|
Cash dividends declared per common share
|
2.3750
|
|
1.8750
|
|
1.4050
|
|
1.0525
|
|
0.8000
|
|
||||||||||
|
Consolidated cash flows from (used for)
|
||||||||||||||||||||
|
Operating activities
|
$
|
9,795
|
|
$
|
9,740
|
|
$
|
8,051
|
|
$
|
6,991
|
|
$
|
7,155
|
|
|||||
|
Investing activities
|
(9,355
|
)
|
(18,395
|
)
|
(2,534
|
)
|
(3,089
|
)
|
(8,649
|
)
|
||||||||||
|
Financing activities
|
(1,011
|
)
|
12,239
|
|
(5,293
|
)
|
(4,946
|
)
|
471
|
|
||||||||||
|
Consolidated financial condition
|
||||||||||||||||||||
|
(as of December 31)
|
||||||||||||||||||||
|
Cash and investments
|
$
|
37,143
|
|
$
|
31,703
|
|
$
|
28,063
|
|
$
|
28,818
|
|
$
|
29,148
|
|
|||||
|
Total assets (c)
|
122,810
|
|
111,254
|
|
86,300
|
|
81,800
|
|
80,811
|
|
||||||||||
|
Total commercial paper and long-term debt (c)
|
32,970
|
|
31,965
|
|
17,324
|
|
16,778
|
|
16,680
|
|
||||||||||
|
Redeemable noncontrolling interests
|
2,012
|
|
1,736
|
|
1,388
|
|
1,175
|
|
2,121
|
|
||||||||||
|
Total equity
|
38,177
|
|
33,725
|
|
32,454
|
|
32,149
|
|
31,178
|
|
||||||||||
|
(a)
|
Includes the effects of the July 2015 acquisition of Catamaran Corporation (Catamaran) and related debt issuances.
|
|
(b)
|
Return on equity is calculated as net earnings divided by average equity. Average equity is calculated using the equity balance at the end of the preceding year and the equity balances at the end of each of the four quarters of the year presented.
|
|
(c)
|
In the first quarter of 2016, the Company adopted Financial Accounting Standards Board (FASB) Accounting Standard Update (ASU) No. 2015-03 (ASU 2015-03), retrospectively as required. See
Note 2 of Notes to the Consolidated Financial Statements
included in Part II, Item 8, “Financial Statements” for more information on the adoption of ASU 2015-03.
|
Financial Highlights should be read with the accompanying
“Management’s Discussion and Analysis of Financial Condition and Results of Operations” in Part II, Item 7
and the
Consolidated Financial Statements and Notes to the Consolidated Financial Statements included in Part II, Item 8, “Financial Statements.”
|
ITEM 7.
|
MANAGEMENT’S DISCUSSION AND ANALYSIS OF FINANCIAL CONDITION AND RESULTS OF OPERATIONS
|
The following discussion should be read together with the accompanying
Consolidated Financial Statements and Notes to the Consolidated Financial Statements thereto included in Item 8, “Financial Statements.”
Readers are cautioned that the statements, estimates, projections or outlook contained in this report, including discussions regarding financial prospects, economic conditions, trends and uncertainties contained in this Item 7, may constitute forward-looking statements within the meaning of the PSLRA. These forward-looking statements involve risks and uncertainties that may cause our actual results to differ materially from the expectations expressed or implied in the forward-looking statements.
A description of some of the risks and uncertainties can be found further below in this Item 7
and in
Part I, Item 1A, “Risk Factors.”
EXECUTIVE OVERVIEW
General
UnitedHealth Group is a diversified health and well-being company dedicated to helping people live healthier lives and helping to make the health system work better for everyone. Through our diversified family of businesses, we leverage core
27
competencies in advanced, enabling technology; health care data; information and intelligence; and clinical care management and coordination to help meet the demands of the health system. These core competencies are deployed within our two distinct, but strategically aligned, business platforms: health benefits operating under UnitedHealthcare and health services operating under Optum.
We have four reportable segments across our two business platforms, UnitedHealthcare and Optum:
|
•
|
UnitedHealthcare, which includes UnitedHealthcare Employer & Individual, UnitedHealthcare Medicare & Retirement, UnitedHealthcare Community & State and UnitedHealthcare Global;
|
|
•
|
OptumHealth;
|
|
•
|
OptumInsight; and
|
|
•
|
OptumRx.
|
Further information on our business and reportable segments is presented in
Part I, Item 1, “Business”
and in
Note 13 of Notes to the Consolidated Financial Statements included in Part II, Item 8, “Financial Statements.”
Recent Developments
We have recognized in our financial results for the fourth quarter 2016 and the year ended December 31, 2016 the previously disclosed
$350 million
impact of our estimated share of guaranty association assessments resulting from the liquidation of Penn Treaty Network America Insurance Company and its subsidiary (Penn Treaty), following accounting, legal and regulatory consultations in connection with our 10-K filing. This charge will be funded over several years and affected by premium tax credits over time.
For more detail related to the Penn Treaty liquidation, see
Note 12 of Notes to the Consolidated Financial Statements included in Part II, Item 8, “Financial Statements.”
Business Trends
Our businesses participate in the United States, Brazilian and certain other international health markets. In the United States, health care spending has grown consistently for many years and comprises approximately 18% of gross domestic product. We expect overall spending on health care to continue to grow in the future, due to inflation, medical technology and pharmaceutical advancement, regulatory requirements, demographic trends in the population and national interest in health and well-being. The rate of market growth may be affected by a variety of factors, including macro-economic conditions and regulatory changes, which have impacted and could further impact our results of operations.
Pricing Trends
. To price our health care benefit products, we start with our view of expected future costs. We frequently evaluate and adjust our approach in each of the local markets we serve, considering all relevant factors, such as product positioning, price competitiveness and environmental, competitive, legislative and regulatory considerations. Our review of regulatory considerations involves a focus on minimum MLR thresholds and the risk adjustment that impacts the small group and individual markets. We will continue seeking to balance growth and profitability across all of these dimensions.
The commercial risk market remains highly competitive in both the small group and large group segments. We expect broad-based competition to continue as the industry adapts to individual and employer needs amid reform changes. The ACA included an annual, nondeductible insurance industry tax (Health Insurance Industry Tax) to be levied proportionally across the insurance industry for risk-based health insurance products. A provision in the 2016 Federal Budget imposes a one year moratorium for 2017 on the collection of the Health Insurance Industry Tax. Pricing for contracts that cover some portion of calendar year 2017 will reflect the impact of the moratorium. Additionally, the industry has continued to experience favorable medical cost trends due to moderated utilization, which has impacted the competitive pricing environment.
Medicare Advantage funding continues to be pressured, as discussed below in
“Regulatory Trends and Uncertainties.”
We expect continued Medicaid revenue growth due to anticipated increases in the number of people we serve; we also believe that the payment rate environment creates the risk of downward pressure on Medicaid net margin percentages. We continue to take a prudent, market-sustainable posture for both new business and maintenance of existing relationships. We advocate for actuarially sound rates that are commensurate with our medical cost trends and we remain dedicated to partnering with those states that are committed to the long-term viability of their programs.
Medical Cost Trends.
Our medical cost trends primarily relate to changes in unit costs, health system utilization and prescription drug costs. We endeavor to mitigate those increases with medical management. Our 2017 management activities include managing costs across all health care categories, including specialty pharmacy spending, as new therapies are introduced at high costs and older drugs experience price increases.
28
Delivery System and Payment Modernization.
The health care market continues to change based on demographic shifts, new regulations, political forces and both payer and patient expectations. Health plans and care providers are being called upon to work together to close gaps in care and improve overall care quality, improve the health of populations and reduce costs. We continue to see a greater number of people enrolled in plans with underlying incentive-based care provider payment models that reward high-quality, affordable care and foster collaboration. We work together with clinicians to leverage our data and analytics to provide the necessary information to close gaps in care and improve overall health outcomes for patients.
We are increasingly rewarding care providers for delivering improvements in quality and cost-efficiency. As of December 31, 2016, we served more than 15 million people through some form of aligned contractual arrangement, including full-risk, shared-risk and bundled episode-of-care and performance incentive payment approaches. As of December 31, 2016, our contracts with value-based elements total nearly $53 billion in annual spending.
This trend is creating needs for health management services that can coordinate care around the primary care physician, including new primary care channels, and for investments in new clinical and administrative information and management systems, which we believe provide growth opportunities for our Optum business platform.
Regulatory Trends and Uncertainties
Following is a summary of management’s view of the trends and uncertainties related to some of the key provisions of the ACA and other regulatory matters. For additional information regarding the ACA and regulatory trends and uncertainties, see
Part I, Item 1 “Business - Government Regulation”
and
Item 1A, “Risk Factors.”
Medicare Advantage Rates.
Final 2017 Medicare Advantage rates resulted in an increase in industry base rates of approximately 0.85%, well short of the industry forward medical cost trend of 3%, which creates continued pressure in the Medicare Advantage program. The impact of this funding shortfall in Medicare Advantage is partially mitigated by reductions in provider payments for those care providers with rates indexed to Medicare Advantage revenues or Medicare fee-for-service payment rates. These factors can affect our plan benefit designs, pricing, growth prospects and earnings expectations for our Medicare Advantage plans.
The ongoing pressure on Medicare Advantage funding places continued importance on effective medical management and ongoing improvements in administrative efficiency. There are a number of adjustments we have made to partially offset these rate pressures and reductions. In some years, these adjustments will impact the majority of the seniors we serve through Medicare Advantage. For example, we seek to intensify our medical and operating cost management, make changes to the size and composition of our care provider networks, adjust members' benefits, implement or increase the member premiums that supplement the monthly payments we receive from the government and decide on a county-by-county basis where we will offer Medicare Advantage plans.
As Medicare Advantage payments change, other products may become relatively more attractive to Medicare beneficiaries and increase the demand for other senior health benefits products such as our market-leading Medicare Supplement and stand-alone Medicare Part D insurance offerings.
As provided in the ACA, our Medicare Advantage rates are currently enhanced by CMS quality bonuses in certain counties based on our local plans’ Star ratings. The level of Star ratings from CMS, based upon specified clinical and operational performance standards, will impact future quality bonuses. In addition, Star ratings affect the amount of savings a plan can use to offer supplemental benefits, which ultimately may affect the plan’s membership and revenue. For the 2016 payment year, approximately 57% of our Medicare Advantage members were in plans rated four stars or higher. We expect that at least 80% of our Medicare Advantage members will be in plans rated four stars or higher for payment year 2017. We continue to dedicate substantial resources to advance our quality scores and Star ratings to strengthen our local market programs and further improve our performance.
Health Insurance Industry Tax and Premium Stabilization Programs.
The industry-wide amount of the Health Insurance Industry Tax was $11.3 billion in 2016 and we paid our portion of the tax, which was $1.8 billion, in September 2016. A provision in the 2016 Federal Budget imposes a one year moratorium for 2017 on the collection of the Health Insurance Industry Tax. The Health Insurance Industry Tax is scheduled to be imposed for 2018 and beyond. In 2018, the industry-wide amount of the Health Insurance Industry Tax is expected to be $14.3 billion. The ACA also included three programs designed to stabilize the health insurance markets. These programs encompassed: a transitional reinsurance program; a temporary risk corridors program; and a permanent risk adjustment program. The transitional reinsurance and temporary risk corridors programs expired at the end of 2016.
Individual Public Exchanges.
In 2016, we participated in individual public exchanges in 34 states and offered individual ACA compliant products. We recorded a premium deficiency reserve for a portion of our estimated 2016 losses in our 2015 results
29
for in-force contracts as of January 1, 2016. During 2016, we incurred additional losses in our individual ACA compliant products and, for 2017, reduced our participation to three individual public exchanges. We expect to reduce the number of consumers we serve through individual insurance plans by nearly 1 million people in 2017, which will reduce our premium revenues by more than $4 billion.
RESULTS SUMMARY
The following table summarizes our consolidated results of operations and other financial information:
|
(in millions, except percentages and per share data)
|
For the Years Ended December 31,
|
Change
|
Change
|
|||||||||||||||||||||||
|
2016
|
2015
|
2014
|
2016 vs. 2015
|
2015 vs. 2014
|
||||||||||||||||||||||
|
Revenues:
|
||||||||||||||||||||||||||
|
Premiums
|
$
|
144,118
|
|
$
|
127,163
|
|
$
|
115,302
|
|
$
|
16,955
|
|
13
|
%
|
$
|
11,861
|
|
10
|
%
|
|||||||
|
Products
|
26,658
|
|
17,312
|
|
4,242
|
|
9,346
|
|
54
|
|
13,070
|
|
308
|
|
||||||||||||
|
Services
|
13,236
|
|
11,922
|
|
10,151
|
|
1,314
|
|
11
|
|
1,771
|
|
17
|
|
||||||||||||
|
Investment and other income
|
828
|
|
710
|
|
779
|
|
118
|
|
17
|
|
(69
|
)
|
(9
|
)
|
||||||||||||
|
Total revenues
|
184,840
|
|
157,107
|
|
130,474
|
|
27,733
|
|
18
|
|
26,633
|
|
20
|
|
||||||||||||
|
Operating costs:
|
||||||||||||||||||||||||||
|
Medical costs
|
117,038
|
|
103,875
|
|
93,633
|
|
13,163
|
|
13
|
|
10,242
|
|
11
|
|
||||||||||||
|
Operating costs
|
28,401
|
|
24,312
|
|
21,263
|
|
4,089
|
|
17
|
|
3,049
|
|
14
|
|
||||||||||||
|
Cost of products sold
|
24,416
|
|
16,206
|
|
3,826
|
|
8,210
|
|
51
|
|
12,380
|
|
324
|
|
||||||||||||
|
Depreciation and amortization
|
2,055
|
|
1,693
|
|
1,478
|
|
362
|
|
21
|
|
215
|
|
15
|
|
||||||||||||
|
Total operating costs
|
171,910
|
|
146,086
|
|
120,200
|
|
25,824
|
|
18
|
|
25,886
|
|
22
|
|
||||||||||||
|
Earnings from operations
|
12,930
|
|
11,021
|
|
10,274
|
|
1,909
|
|
17
|
|
747
|
|
7
|
|
||||||||||||
|
Interest expense
|
(1,067
|
)
|
(790
|
)
|
(618
|
)
|
(277
|
)
|
35
|
|
(172
|
)
|
28
|
|
||||||||||||
|
Earnings before income taxes
|
11,863
|
|
10,231
|
|
9,656
|
|
1,632
|
|
16
|
|
575
|
|
6
|
|
||||||||||||
|
Provision for income taxes
|
(4,790
|
)
|
(4,363
|
)
|
(4,037
|
)
|
(427
|
)
|
10
|
|
(326
|
)
|
8
|
|
||||||||||||
|
Net earnings
|
7,073
|
|
5,868
|
|
5,619
|
|
1,205
|
|
21
|
|
249
|
|
4
|
|
||||||||||||
|
Earnings attributable to noncontrolling interests
|
(56
|
)
|
(55
|
)
|
—
|
|
(1
|
)
|
2
|
(55
|
)
|
nm
|
||||||||||||||
|
Net earnings attributable to UnitedHealth Group common shareholders
|
$
|
7,017
|
|
$
|
5,813
|
|
$
|
5,619
|
|
$
|
1,204
|
|
21
|
%
|
$
|
194
|
|
3
|
%
|
|||||||
|
Diluted earnings per share attributable to UnitedHealth Group common shareholders
|
$
|
7.25
|
|
$
|
6.01
|
|
$
|
5.70
|
|
$
|
1.24
|
|
21
|
%
|
$
|
0.31
|
|
5
|
%
|
|||||||
|
Medical care ratio (a)
|
81.2
|
%
|
81.7
|
%
|
81.2
|
%
|
(0.5
|
)%
|
0.5
|
%
|
||||||||||||||||
|
Operating cost ratio
|
15.4
|
|
15.5
|
|
16.3
|
|
(0.1
|
)
|
(0.8
|
)
|
||||||||||||||||
|
Operating margin
|
7.0
|
|
7.0
|
|
7.9
|
|
—
|
|
(0.9
|
)
|
||||||||||||||||
|
Tax rate
|
40.4
|
|
42.6
|
|
41.8
|
|
(2.2
|
)
|
0.8
|
|
||||||||||||||||
|
Net earnings margin (b)
|
3.8
|
|
3.7
|
|
4.3
|
|
0.1
|
|
(0.6
|
)
|
||||||||||||||||
|
Return on equity (c)
|
19.4
|
%
|
17.7
|
%
|
17.3
|
%
|
1.7
|
%
|
0.4
|
%
|
||||||||||||||||
nm= not meaningful
|
(a)
|
Medical care ratio is calculated as medical costs divided by premium revenue.
|
|
(b)
|
Net earnings margin attributable to UnitedHealth Group shareholders.
|
|
(c)
|
Return on equity is calculated as annualized net earnings divided by average equity. Average equity is calculated using the equity balance at the end of the preceding year and the equity balances at the end of each of the four quarters in the year presented.
|
SELECTED OPERATING PERFORMANCE AND OTHER SIGNIFICANT ITEMS
The following represents a summary of select
2016
year-over-year operating comparisons to
2015
and other
2016
significant items.
|
•
|
Consolidated revenues increased by
18%
, UnitedHealthcare revenues increased
13%
and Optum revenues grew
24%
.
|
|
•
|
UnitedHealthcare grew to serve an additional
2.1 million
people domestically.
|
|
•
|
Earnings from operations increased by
17%
, including increases of
8%
at UnitedHealthcare and
32%
at Optum.
|
|
•
|
Diluted earnings per common share increased
21%
to
$7.25
.
|
|
•
|
Cash flows from operations were
$9.8 billion
.
|
30
2016 RESULTS OF OPERATIONS COMPARED TO 2015 RESULTS
Our results of operations were affected by our acquisition of Catamaran in the third quarter of 2015.
Consolidated Financial Results
Revenues
The increases in revenues were primarily driven by organic growth in the number of individuals served across our UnitedHealthcare benefits businesses and growth across all of our Optum services businesses.
Medical Costs
Medical costs increased due to risk-based membership growth and medical cost trends, partially offset by medical management initiatives.
Income Tax Rate
Our effective tax rate decreased primarily due to the adoption of the ASU 2016-09, which we adopted in the first quarter of 2016. See
Note 2 of Notes to the Consolidated Financial Statements included in Part II, Item 8
, of this report for more information about the adoption of ASU 2016-09.
Reportable Segments
See
Note 13 of Notes to the Consolidated Financial Statements included in Part II, Item 8, “Financial Statements”
for more information on our segments. The following table presents a summary of the reportable segment financial information:
|
|
For the Years Ended December 31,
|
Change
|
Change
|
|||||||||||||||||||||||
|
(in millions, except percentages)
|
2016
|
2015
|
2014
|
2016 vs. 2015
|
2015 vs. 2014
|
|||||||||||||||||||||
|
Revenues
|
||||||||||||||||||||||||||
|
UnitedHealthcare
|
$
|
148,581
|
|
$
|
131,343
|
|
$
|
119,798
|
|
$
|
17,238
|
|
13
|
%
|
$
|
11,545
|
|
10
|
%
|
|||||||
|
OptumHealth
|
16,908
|
|
13,927
|
|
11,032
|
|
2,981
|
|
21
|
|
2,895
|
|
26
|
|
||||||||||||
|
OptumInsight
|
7,333
|
|
6,196
|
|
5,227
|
|
1,137
|
|
18
|
|
969
|
|
19
|
|
||||||||||||
|
OptumRx
|
60,440
|
|
48,272
|
|
31,976
|
|
12,168
|
|
25
|
|
16,296
|
|
51
|
|
||||||||||||
|
Optum eliminations
|
(1,088
|
)
|
(791
|
)
|
(489
|
)
|
(297
|
)
|
38
|
|
(302
|
)
|
62
|
|
||||||||||||
|
Optum
|
83,593
|
|
67,604
|
|
47,746
|
|
15,989
|
|
24
|
|
19,858
|
|
42
|
|
||||||||||||
|
Eliminations
|
(47,334
|
)
|
(41,840
|
)
|
(37,070
|
)
|
(5,494
|
)
|
13
|
|
(4,770
|
)
|
13
|
|
||||||||||||
|
Consolidated revenues
|
$
|
184,840
|
|
$
|
157,107
|
|
$
|
130,474
|
|
$
|
27,733
|
|
18
|
%
|
$
|
26,633
|
|
20
|
%
|
|||||||
|
Earnings from operations
|
||||||||||||||||||||||||||
|
UnitedHealthcare
|
$
|
7,307
|
|
$
|
6,754
|
|
$
|
6,992
|
|
$
|
553
|
|
8
|
%
|
$
|
(238
|
)
|
(3
|
)%
|
|||||||
|
OptumHealth
|
1,428
|
|
1,240
|
|
1,090
|
|
188
|
|
15
|
|
150
|
|
14
|
|
||||||||||||
|
OptumInsight
|
1,513
|
|
1,278
|
|
1,002
|
|
235
|
|
18
|
|
276
|
|
28
|
|
||||||||||||
|
OptumRx
|
2,682
|
|
1,749
|
|
1,190
|
|
933
|
|
53
|
|
559
|
|
47
|
|
||||||||||||
|
Optum
|
5,623
|
|
4,267
|
|
3,282
|
|
1,356
|
|
32
|
|
985
|
|
30
|
|
||||||||||||
|
Consolidated earnings from operations
|
$
|
12,930
|
|
$
|
11,021
|
|
$
|
10,274
|
|
$
|
1,909
|
|
17
|
%
|
$
|
747
|
|
7
|
%
|
|||||||
|
Operating margin
|
||||||||||||||||||||||||||
|
UnitedHealthcare
|
4.9
|
%
|
5.1
|
%
|
5.8
|
%
|
(0.2
|
)%
|
(0.7
|
)%
|
||||||||||||||||
|
OptumHealth
|
8.4
|
|
8.9
|
|
9.9
|
|
(0.5
|
)
|
(1.0
|
)
|
||||||||||||||||
|
OptumInsight
|
20.6
|
|
20.6
|
|
19.2
|
|
—
|
|
1.4
|
|
||||||||||||||||
|
OptumRx
|
4.4
|
|
3.6
|
|
3.7
|
|
0.8
|
|
(0.1
|
)
|
||||||||||||||||
|
Optum
|
6.7
|
|
6.3
|
|
6.9
|
|
0.4
|
|
(0.6
|
)
|
||||||||||||||||
|
Consolidated operating margin
|
7.0
|
%
|
7.0
|
%
|
7.9
|
%
|
—
|
%
|
(0.9
|
)%
|
||||||||||||||||
31
UnitedHealthcare
The following table summarizes UnitedHealthcare revenues by business:
|
|
For the Years Ended December 31,
|
Change
|
Change
|
|||||||||||||||||||||||
|
(in millions, except percentages)
|
2016
|
2015
|
2014
|
2016 vs. 2015
|
2015 vs. 2014
|
|||||||||||||||||||||
|
UnitedHealthcare Employer & Individual
|
$
|
53,084
|
|
$
|
47,194
|
|
$
|
43,017
|
|
$
|
5,890
|
|
12
|
%
|
$
|
4,177
|
|
10
|
%
|
|||||||
|
UnitedHealthcare Medicare & Retirement
|
56,329
|
|
49,735
|
|
46,258
|
|
6,594
|
|
13
|
|
3,477
|
|
8
|
|
||||||||||||
|
UnitedHealthcare Community & State
|
32,945
|
|
28,911
|
|
23,586
|
|
4,034
|
|
14
|
|
5,325
|
|
23
|
|
||||||||||||
|
UnitedHealthcare Global
|
6,223
|
|
5,503
|
|
6,937
|
|
720
|
|
13
|
|
(1,434
|
)
|
(21
|
)
|
||||||||||||
|
Total UnitedHealthcare revenues
|
$
|
148,581
|
|
$
|
131,343
|
|
$
|
119,798
|
|
$
|
17,238
|
|
13
|
%
|
$
|
11,545
|
|
10
|
%
|
|||||||
The following table summarizes the number of individuals served by our UnitedHealthcare businesses, by major market segment and funding arrangement:
|
|
December 31,
|
Change
|
Change
|
||||||||||||||||||
|
(in thousands, except percentages)
|
2016
|
2015
|
2014
|
2016 vs. 2015
|
2015 vs. 2014
|
||||||||||||||||
|
Commercial risk-based - group
|
7,470
|
|
7,095
|
|
6,765
|
|
375
|
|
5
|
%
|
330
|
|
5
|
%
|
|||||||
|
Commercial risk-based - individual
|
1,350
|
|
1,190
|
|
740
|
|
160
|
|
13
|
|
450
|
|
61
|
|
|||||||
|
Commercial fee-based
|
18,900
|
|
18,565
|
|
18,350
|
|
335
|
|
2
|
|
215
|
|
1
|
|
|||||||
|
Fee-based TRICARE
|
2,860
|
|
2,880
|
|
2,895
|
|
(20
|
)
|
(1
|
)
|
(15
|
)
|
(1
|
)
|
|||||||
|
Total commercial
|
30,580
|
|
29,730
|
|
28,750
|
|
850
|
|
3
|
|
980
|
|
3
|
|
|||||||
|
Medicare Advantage
|
3,630
|
|
3,235
|
|
3,005
|
|
395
|
|
12
|
|
230
|
|
8
|
|
|||||||
|
Medicaid
|
5,890
|
|
5,305
|
|
5,055
|
|
585
|
|
11
|
|
250
|
|
5
|
|
|||||||
|
Medicare Supplement (Standardized)
|
4,265
|
|
4,035
|
|
3,750
|
|
230
|
|
6
|
|
285
|
|
8
|
|
|||||||
|
Total public and senior
|
13,785
|
|
12,575
|
|
11,810
|
|
1,210
|
|
10
|
|
765
|
|
6
|
|
|||||||
|
Total UnitedHealthcare - domestic medical
|
44,365
|
|
42,305
|
|
40,560
|
|
2,060
|
|
5
|
|
1,745
|
|
4
|
|
|||||||
|
International
|
4,220
|
|
4,090
|
|
4,425
|
|
130
|
|
3
|
|
(335
|
)
|
(8
|
)
|
|||||||
|
Total UnitedHealthcare - medical
|
48,585
|
|
46,395
|
|
44,985
|
|
2,190
|
|
5
|
%
|
1,410
|
|
3
|
%
|
|||||||
|
Supplemental Data:
|
|||||||||||||||||||||
|
Medicare Part D stand-alone
|
4,930
|
|
5,060
|
|
5,165
|
|
(130
|
)
|
(3
|
)%
|
(105
|
)
|
(2
|
)%
|
|||||||
Growth in services to the public sector, mid-sized employers, small groups and individuals led the overall increase in people served through risk-based benefit plans in the commercial market. Medicare Advantage increased year-over-year due to growth in people served through individual and employer-sponsored group Medicare Advantage plans. Medicaid growth was driven by the combination of new state-based awards and growth in established programs. Medicare Supplement growth reflected strong customer retention and new sales.
UnitedHealthcare’s revenue increase was due to growth in the number of individuals served across its businesses and price increases for underlying medical cost trends.
The increase in UnitedHealthcare’s operating earnings was due to diversified growth, offset by guaranty fund assessments recorded in the fourth quarter of 2016. For more information on these assessments, see
Note 12 of Notes to the Consolidated Financial Statements included in Part II, Item 8, “Financial Statements.”
Operating earnings in 2015 included the establishment of premium deficiency reserves for 2016, primarily for individual ACA compliant business.
Optum
Total revenues and operating earnings increased as each segment reported increased revenues and earnings from operations as a result of the factors discussed below.
The results by segment were as follows:
OptumHealth
Revenue increased at OptumHealth primarily due to growth in its health care delivery businesses as well as expansion of behavioral services into new Medicaid markets. Strong performance in business supporting UnitedHealthcare partially offset by investments in the health care delivery business drove the increase in earnings from operations.
32
OptumInsight
Revenue and earnings from operations at OptumInsight increased primarily due to growth in revenue management, business process outsourcing and technology services.
OptumRx
Revenue and earnings from operations at OptumRx increased primarily due to the full-year impact of Catamaran and organic growth. In 2016, OptumRx fulfilled 1.24 billion adjusted scripts compared to 932 million in 2015.
2015 RESULTS OF OPERATIONS COMPARED TO 2014 RESULTS
Consolidated Financial Results
Revenues
The increase in revenues was primarily driven by the effect of the Catamaran acquisition and organic growth in the number of individuals served across our benefits businesses and across all of Optum’s businesses.
Medical Costs
Medical costs increased primarily due to risk-based membership growth in our benefits businesses. Medical costs also included losses on individual ACA compliant products related to 2015, and the establishment of premium deficiency reserves related to the 2016 policy year for anticipated future losses for in-force individual ACA compliant contracts and a new state Medicaid contract.
Operating Cost Ratio
The decrease in our operating cost ratio was due to the inclusion of Catamaran and growth in government benefits programs, both of which have lower operating cost ratios and Company wide productivity gains.
Reportable Segments
UnitedHealthcare
UnitedHealthcare’s revenue growth during the year ended December 31, 2015 was due to growth in the number of individuals served across its businesses and price increases reflecting underlying medical cost trends.
UnitedHealthcare’s operating earnings for the year ended December 31, 2015 decreased as the combined individual ACA compliant losses and premium deficiency reserves totaling $815 million more than offset strong growth across the business, improved medical cost management and increased productivity.
Optum
Total revenues and operating earnings increased for the year ended December 31, 2015 as each reporting segment increased revenues and earnings from operations by double-digit percentages as a result of the factors discussed below.
The results by segment were as follows:
OptumHealth
Revenue and earnings from operations increased at OptumHealth during the year ended December 31, 2015 primarily due to growth in its care delivery businesses and the impact of acquisitions in patient care centers and population health management services. The operating margins for the year ended December 31, 2015 decreased from the prior year primarily due to investments made to develop future growth opportunities.
OptumInsight
Revenue, earnings from operations and operating margins at OptumInsight for the year ended December 31, 2015 increased primarily due to expansion and growth in care provider revenue management services and payer services.
OptumRx
Revenue and earnings from operations for the year ended December 31, 2015 increased due to the mid-year acquisition of Catamaran as well as strong organic growth. Operating margins for the year ended December 31, 2015 decreased slightly due to the inclusion of lower margin Catamaran business.
33
LIQUIDITY, FINANCIAL CONDITION AND CAPITAL RESOURCES
Liquidity
Introduction
We manage our liquidity and financial position in the context of our overall business strategy. We continually forecast and manage our cash, investments, working capital balances and capital structure to meet the short-term and long-term obligations of our businesses while seeking to maintain liquidity and financial flexibility. Cash flows generated from operating activities are principally from earnings before noncash expenses.
Our regulated subsidiaries generate significant cash flows from operations and are subject to financial regulations and standards in their respective jurisdictions. These standards, among other things, require these subsidiaries to maintain specified levels of statutory capital, as defined by each jurisdiction, and restrict the timing and amount of dividends and other distributions that may be paid to their parent companies.
In 2016, our U.S. regulated subsidiaries paid their parent companies dividends of $3.9 billion. For the year ended December 31, 2015, our U.S. regulated subsidiaries paid their parent companies dividends of $4.4 billion. See
Note 10 of Notes to the Consolidated Financial Statements included in Part II, Item 8, “Financial Statements”
for further detail concerning our regulated subsidiary dividends.
Our nonregulated businesses also generate cash flows from operations that are available for general corporate use. Cash flows generated by these entities, combined with dividends from our regulated entities and financing through the issuance of long-term debt as well as issuance of commercial paper or the ability to draw under our committed credit facilities, further strengthen our operating and financial flexibility. We use these cash flows to expand our businesses through acquisitions, reinvest in our businesses through capital expenditures, repay debt and return capital to our shareholders through shareholder dividends and/or repurchases of our common stock, depending on market conditions.
Summary of our Major Sources and Uses of Cash and Cash Equivalents
|
|
For the Years Ended December 31,
|
Change
|
Change
|
|||||||||||||||||
|
(in millions)
|
2016
|
2015
|
2014
|
2016 vs. 2015
|
2015 vs. 2014
|
|||||||||||||||
|
Sources of cash:
|
||||||||||||||||||||
|
Cash provided by operating activities
|
$
|
9,795
|
|
$
|
9,740
|
|
$
|
8,051
|
|
$
|
55
|
|
$
|
1,689
|
|
|||||
|
Issuances of long-term debt and commercial paper, net of repayments
|
990
|
|
14,607
|
|
391
|
|
(13,617
|
)
|
14,216
|
|
||||||||||
|
Proceeds from common share issuances
|
429
|
|
402
|
|
462
|
|
27
|
|
(60
|
)
|
||||||||||
|
Sales and maturities of investments, net of purchases
|
—
|
|
—
|
|
799
|
|
—
|
|
(799
|
)
|
||||||||||
|
Customer funds administered
|
1,692
|
|
768
|
|
—
|
|
924
|
|
768
|
|
||||||||||
|
Other
|
37
|
|
—
|
|
115
|
|
37
|
|
(115
|
)
|
||||||||||
|
Total sources of cash
|
12,943
|
|
25,517
|
|
9,818
|
|
||||||||||||||
|
Uses of cash:
|
||||||||||||||||||||
|
Cash paid for acquisitions and noncontrolling interest shares, net of cash assumed
|
(2,017
|
)
|
(16,282
|
)
|
(1,923
|
)
|
14,265
|
|
(14,359
|
)
|
||||||||||
|
Cash dividends paid
|
(2,261
|
)
|
(1,786
|
)
|
(1,362
|
)
|
(475
|
)
|
(424
|
)
|
||||||||||
|
Common share repurchases
|
(1,280
|
)
|
(1,200
|
)
|
(4,008
|
)
|
(80
|
)
|
2,808
|
|
||||||||||
|
Purchases of property, equipment and capitalized software
|
(1,705
|
)
|
(1,556
|
)
|
(1,525
|
)
|
(149
|
)
|
(31
|
)
|
||||||||||
|
Purchases of investments, net of sales and maturities
|
(5,927
|
)
|
(531
|
)
|
—
|
|
(5,396
|
)
|
(531
|
)
|
||||||||||
|
Customer funds administered
|
—
|
|
—
|
|
(638
|
)
|
—
|
|
638
|
|
||||||||||
|
Other
|
(324
|
)
|
(578
|
)
|
(138
|
)
|
254
|
|
(440
|
)
|
||||||||||
|
Total uses of cash
|
(13,514
|
)
|
(21,933
|
)
|
(9,594
|
)
|
||||||||||||||
|
Effect of exchange rate changes on cash and cash equivalents
|
78
|
|
(156
|
)
|
(5
|
)
|
234
|
|
(151
|
)
|
||||||||||
|
Net (decrease) increase in cash and cash equivalents
|
$
|
(493
|
)
|
$
|
3,428
|
|
$
|
219
|
|
$
|
(3,921
|
)
|
$
|
3,209
|
|
|||||
34
2016 Cash Flows Compared to 2015 Cash Flows
Cash flows provided by operating activities increased slightly as higher net earnings were mostly offset by increased CMS receivables and other operating items.
Other significant changes in sources or uses of cash year-over-year included increased net purchases of investments in 2016 and the decreases in cash paid for acquisitions and proceeds from debt issuances due to the 2015 acquisition of Catamaran.
2015 Cash Flows Compared to 2014 Cash Flows
Cash flows provided by operating activities in 2015 increased primarily due to growth in risk-based products, which increased medical costs payable and an increase in CMS risk share payables, which increased other liabilities. These increases were partially offset by an increase in pharmacy rebates, which increased other receivables, the increase in the payment of the 2015 Health Insurance Industry Tax and the payment of Reinsurance Program fees in 2015.
Other significant changes in sources or uses of cash year-over-year included increased cash paid for acquisitions and net debt issuances and decreased share repurchases, all due to the Catamaran acquisition.
Financial Condition
As of
December 31, 2016
, our cash, cash equivalent and available-for-sale investment balances of
$36.7 billion
included
$10.4 billion
of cash and cash equivalents (of which approximately
$700 million
was available for general corporate use),
$24.2 billion
of debt securities and
$2.0 billion
of investments in equity securities consisting of investments in non-U.S. dollar fixed-income funds; employee savings plan related investments; venture capital funds; and dividend paying stocks. Given the significant portion of our portfolio held in cash equivalents, we do not anticipate fluctuations in the aggregate fair value of our financial assets to have a material impact on our liquidity or capital position. Other sources of liquidity, primarily from operating cash flows and our commercial paper program, which is supported by our bank credit facilities, reduce the need to sell investments during adverse market conditions. See
Note 4 of Notes to the Consolidated Financial Statements included in Part II, Item 8, “Financial Statements”
for further detail concerning our fair value measurements.
Our available-for-sale debt portfolio had a weighted-average duration of 3.3 years and a weighted-average credit rating of “AA” as of
December 31, 2016
. When multiple credit ratings are available for an individual security, the average of the available ratings is used to determine the weighted-average credit rating.
Capital Resources and Uses of Liquidity
In addition to cash flows from operations and cash and cash equivalent balances available for general corporate use, our capital resources and uses of liquidity are as follows:
Commercial Paper and Bank Credit Facilities.
Our revolving bank credit facilities provide liquidity support for our commercial paper borrowing program, which facilitates the private placement of senior unsecured debt through third-party broker-dealers, and are available for general corporate purposes. For more information on our commercial paper and bank credit facilities, see
Note 8 of Notes to the Consolidated Financial Statements included in Part II, Item 8, “Financial Statements.”
Our revolving bank credit facilities contain various covenants, including covenants requiring us to maintain a defined debt to debt-plus-shareholders’ equity ratio of not more than 55%. As of December 31, 2016, our debt to debt-plus-shareholders’ equity ratio, as defined and calculated under the credit facilities was approximately 44%.
Credit Ratings.
Our credit ratings as of
December 31, 2016
were as follows:
|
|
Moody’s
|
Standard & Poor’s
|
Fitch
|
A.M. Best
|
|||||||||||
|
|
Ratings
|
Outlook
|
Ratings
|
Outlook
|
Ratings
|
Outlook
|
Ratings
|
Outlook
|
|||||||
|
Senior unsecured debt
|
A3
|
Negative
|
A+
|
Negative
|
A-
|
Negative
|
bbb+
|
Stable
|
|||||||
|
Commercial paper
|
P-2
|
n/a
|
A-1
|
n/a
|
F1
|
n/a
|
AMB-2
|
n/a
|
|||||||
35
The availability of financing in the form of debt or equity is influenced by many factors, including our profitability, operating cash flows, debt levels, credit ratings, debt covenants and other contractual restrictions, regulatory requirements and economic and market conditions. For example, a significant downgrade in our credit ratings or adverse conditions in the capital markets may increase the cost of borrowing for us or limit our access to capital.
Share Repurchase Program.
As of
December 31, 2016
, we had Board authorization to purchase up to an additional
51 million
shares of our common stock. For more information on our share repurchase program, see
Note 10 of Notes to the Consolidated Financial Statements included in Part II, Item 8, “Financial Statements.”
Dividends.
In June 2016, our Board increased our quarterly cash dividend to shareholders to an annual dividend rate of
$2.50
per share. For more information on our dividend, see
Note 10 of Notes to the Consolidated Financial Statements included in Part II, Item 8, “Financial Statements.”
CONTRACTUAL OBLIGATIONS AND COMMITMENTS
The following table summarizes future obligations due by period as of December 31, 2016, under our various contractual obligations and commitments:
|
(in millions)
|
2017
|
2018 to 2019
|
2020 to 2021
|
Thereafter
|
Total
|
|||||||||||||||
|
Debt (a)
|
$
|
8,262
|
|
$
|
6,282
|
|
$
|
6,059
|
|
$
|
27,899
|
|
$
|
48,502
|
|
|||||
|
Operating leases
|
453
|
|
771
|
|
587
|
|
499
|
|
2,310
|
|
||||||||||
|
Purchase and other obligations (b)
|
623
|
|
617
|
|
297
|
|
170
|
|
1,707
|
|
||||||||||
|
Future policy benefits (c)
|
133
|
|
271
|
|
273
|
|
1,980
|
|
2,657
|
|
||||||||||
|
Unrecognized tax benefits (d)
|
19
|
|
—
|
|
—
|
|
234
|
|
253
|
|
||||||||||
|
Other liabilities recorded on the Consolidated Balance Sheet (e)
|
269
|
|
14
|
|
5
|
|
2,288
|
|
2,576
|
|
||||||||||
|
Redeemable noncontrolling interests (f)
|
958
|
|
1,054
|
|
—
|
|
—
|
|
2,012
|
|
||||||||||
|
Total contractual obligations
|
$
|
10,717
|
|
$
|
9,009
|
|
$
|
7,221
|
|
$
|
33,070
|
|
$
|
60,017
|
|
|||||
|
(a)
|
Includes interest coupon payments and maturities at par or put values. The table also assumes amounts are outstanding through their contractual term. See
Note 8 of Notes to the Consolidated Financial Statements included in Part II, Item 8, “Financial Statements”
for more detail.
|
|
(b)
|
Includes fixed or minimum commitments under existing purchase obligations for goods and services, including agreements that are cancelable with the payment of an early termination penalty and remaining capital commitments for venture capital funds and other funding commitments. Excludes agreements that are cancelable without penalty and excludes liabilities to the extent recorded in our Consolidated Balance Sheets as of
December 31, 2016
.
|
|
(c)
|
Future policy benefits represent account balances that accrue to the benefit of the policyholders, excluding surrender charges, for universal life and investment annuity products and for long-duration health policies sold to individuals for which some of the premium received in the earlier years is intended to pay benefits to be incurred in future years. See
Note 2 of Notes to the Consolidated Financial Statements included in Part II, Item 8, “Financial Statements”
for more detail.
|
|
(d)
|
As the timing of future settlements is uncertain, the long-term portion has been classified as “Thereafter.”
|
|
(e)
|
Includes obligations associated with contingent consideration and other payments related to business acquisitions, certain employee benefit programs, amounts accrued for guaranty fund assessments and various other long-term liabilities. Due to uncertainty regarding payment timing, obligations for employee benefit programs, charitable contributions and other liabilities have been classified as “Thereafter.”
|
|
(f)
|
Includes commitments for redeemable shares of our subsidiaries.
|
We do not have other significant contractual obligations or commitments that require cash resources. However, we continually evaluate opportunities to expand our operations, which include internal development of new products, programs and technology applications and may include acquisitions.
OFF-BALANCE SHEET ARRANGEMENTS
As of December 31, 2016, we were not involved in any off-balance sheet arrangements, which have or are reasonably likely to have a material effect on our financial condition, results of operations or liquidity.
36
RECENTLY ISSUED ACCOUNTING STANDARDS
See
Note 2 of Notes to the Consolidated Financial Statements in Part II, Item 8 “Financial Statements”
for a discussion of new accounting pronouncements that affect us.
CRITICAL ACCOUNTING ESTIMATES
Critical accounting estimates are those estimates that require management to make challenging, subjective or complex judgments, often because they must estimate the effects of matters that are inherently uncertain and may change in subsequent periods. Critical accounting estimates involve judgments and uncertainties that are sufficiently sensitive and may result in materially different results under different assumptions and conditions.
Medical Costs Payable
Medical costs and medical costs payable include estimates of our obligations for medical care services that have been rendered on behalf of insured consumers, but for which claims have either not yet been received or processed. Depending on the health care professional and type of service, the typical billing lag for services can be up to 90 days from the date of service. Approximately
90%
of claims related to medical care services are known and settled within 90 days from the date of service and substantially all within twelve months. As of
December 31, 2016
, our days outstanding in medical payables was 51 days, calculated as total medical payables divided by total medical costs times the number of days in the period.
In each reporting period, our operating results include the effects of more completely developed medical costs payable estimates associated with previously reported periods. If the revised estimate of prior period medical costs is less than the previous estimate, we will decrease reported medical costs in the current period (favorable development). If the revised estimate of prior period medical costs is more than the previous estimate, we will increase reported medical costs in the current period (unfavorable development). Medical costs in 2016, 2015 and 2014 included favorable medical cost development related to prior years of
$220 million
,
$320 million
and
$420 million
, respectively.
In developing our medical costs payable estimates, we apply different estimation methods depending on the month for which incurred claims are being estimated. For example, for the most recent two months, we estimate claim costs incurred by applying observed medical cost trend factors to the average per member per month (PMPM) medical costs incurred in prior months for which more complete claim data is available, supplemented by a review of near-term completion factors.
Completion Factors.
A completion factor is an actuarial estimate, based upon historical experience and analysis of current trends, of the percentage of incurred claims during a given period that have been adjudicated by us at the date of estimation. Completion factors are the most significant factors we use in developing our medical costs payable estimates for periods prior to the most recent two months. Completion factors include judgments in relation to claim submissions such as the time from date of service to claim receipt, claim inventory levels and claim processing backlogs, as well as other factors. If actual claims submission rates from providers (which can be influenced by a number of factors, including provider mix and electronic versus manual submissions) or our claim processing patterns are different than estimated, our reserves may be significantly impacted.
The following table illustrates the sensitivity of these factors and the estimated potential impact on our medical costs payable estimates for those periods as of
December 31, 2016
:
|
Completion Factors
(Decrease) Increase in Factors
|
Increase (Decrease)
In Medical Costs Payable
|
|||
|
(in millions)
|
||||
|
(0.75)%
|
$
|
437
|
|
|
|
(0.50)
|
291
|
|
||
|
(0.25)
|
145
|
|
||
|
0.25
|
(144
|
)
|
||
|
0.50
|
(288
|
)
|
||
|
0.75
|
(430
|
)
|
||
Medical Cost Per Member Per Month Trend Factors.
Medical cost PMPM trend factors are significant factors we use in developing our medical costs payable estimates for the most recent two months. Medical cost trend factors are developed through a comprehensive analysis of claims incurred in prior months, provider contracting and expected unit costs, benefit design and by reviewing a broad set of health care utilization indicators, including but not limited to, pharmacy utilization trends, inpatient hospital census data and incidence data from the National Centers for Disease Control. We also consider macroeconomic variables such as gross-domestic product growth, employment and disposable income. A large number of factors can cause the medical cost trend to vary from our estimates, including: our ability and practices to manage medical and
37
pharmaceutical costs, changes in level and mix of services utilized, mix of benefits offered, including the impact of co-pays and deductibles, changes in medical practices, catastrophes and epidemics.
The following table illustrates the sensitivity of these factors and the estimated potential impact on our medical costs payable estimates for the most recent two months as of
December 31, 2016
:
|
Medical Cost PMPM Trend
Increase (Decrease) in Factors
|
Increase (Decrease)
In Medical Costs Payable
|
|||
|
(in millions)
|
||||
|
3%
|
$
|
557
|
|
|
|
2
|
371
|
|
||
|
1
|
186
|
|
||
|
(1)
|
(186
|
)
|
||
|
(2)
|
(371
|
)
|
||
|
(3)
|
(557
|
)
|
||
The completion factors and medical costs PMPM trend factors analyses above include outcomes that are considered reasonably likely based on our historical experience estimating liabilities for incurred but not reported benefit claims.
Management believes the amount of medical costs payable is reasonable and adequate to cover our liability for unpaid claims as of
December 31, 2016
; however, actual claim payments may differ from established estimates as discussed above. Assuming a hypothetical 1% difference between our
December 31, 2016
estimates of medical costs payable and actual medical costs payable, excluding AARP Medicare Supplement Insurance and any potential offsetting impact from premium rebates, 2016 net earnings would have increased or decreased by $90 million.
For more detail related to our medical cost estimates, see
Note 2 of Notes to the Consolidated Financial Statements included in Part II, Item 8, “Financial Statements.”
Revenues
We derive a substantial portion of our revenues from health care insurance premiums. We recognize premium revenues in the period eligible individuals are entitled to receive health care services. Customers are typically billed monthly at a contracted rate per eligible person multiplied by the total number of people eligible to receive services.
Our Medicare Advantage and Medicare Part D premium revenues are subject to periodic adjustment under the CMS risk adjustment payment methodology. The CMS risk adjustment model provides higher per member payments for enrollees diagnosed with certain conditions and lower payments for enrollees who are healthier. We estimate risk adjustment revenues based upon the data submitted and expected to be submitted to CMS. As a result of the variability of factors that determine such estimations, the actual amount of CMS’ retroactive payments could be materially more or less than our estimates. This may result in favorable or unfavorable adjustments to our Medicare premium revenue and, accordingly, our profitability. For more detail on premium revenues see
Note 2 of Notes to the Consolidated Financial Statements included in Part II, Item 8, “Financial Statements.”
Risk adjustment data for certain of our plans is subject to review by the federal and state governments, including audit by regulators. See
Note 12 of Notes to the Consolidated Financial Statements included in Part II, Item 8, “Financial Statements”
for additional information regarding these audits. Our estimates of premiums to be recognized are reduced by any expected premium minimum MLR rebates payable by us to CMS.
Goodwill and Intangible Assets
Goodwill.
We evaluate goodwill for impairment annually or more frequently when an event occurs or circumstances change that indicate the carrying value may not be recoverable. When testing goodwill for impairment, we may first assess qualitative factors to determine if it is more likely than not that the carrying value of a reporting unit exceeds its estimated fair value. During a qualitative analysis, we consider the impact of changes, if any, to the following factors: macroeconomic, industry and market factors, cost factors, changes in overall financial performance, and any other relevant events and uncertainties impacting a reporting unit. If our qualitative assessment indicates that goodwill impairment is more likely than not, we perform additional quantitative analysis. We may also elect to skip the qualitative testing and proceed directly to the quantitative testing. For reporting units where a quantitative analysis is performed, we perform a multi-step test measuring the fair values of the reporting units and comparing them to their aggregate carrying values, including goodwill. If the fair value is less than the carrying value of the reporting unit, then the implied value of goodwill would be calculated and compared to the carrying amount of goodwill to determine whether goodwill is impaired.
38
We estimate the fair values of our reporting units using discounted cash flows, which include assumptions about a wide variety of internal and external factors. Significant assumptions used in the impairment analysis include financial projections of free cash flow (including significant assumptions about operations, capital requirements and income taxes), long-term growth rates for determining terminal value beyond the discretely forecasted periods and discount rates. For each reporting unit, comparative market multiples are used to corroborate the results of our discounted cash flow test.
Forecasts and long-term growth rates used for our reporting units are consistent with, and use inputs from, our internal long-term business plan and strategies. Key assumptions used in these forecasts include:
|
•
|
Revenue trends.
Key revenue drivers for each reporting unit are determined and assessed. Significant factors include: membership growth, medical trends and the impact and expectations of regulatory environments. Additional macro-economic assumptions relating to unemployment, GDP growth, interest rates and inflation are also evaluated and incorporated, as appropriate.
|
|
•
|
Medical cost trends.
For further discussion of medical cost trends, see the “Medical Cost Trend” section of Executive Overview-
Business Trends
above and the discussion in the “Medical Costs Payable” critical accounting estimate above. Similar factors, including historical and expected medical cost trend levels, are considered in estimating our long-term medical trends at the reporting unit level.
|
|
•
|
Operating productivity.
We forecast expected operating cost levels based on historical levels and expectations of future operating cost levels.
|
|
•
|
Capital levels.
The operating and long-term capital requirements for each business are considered.
|
Discount rates are determined for each reporting unit and include consideration of the implied risk inherent in their forecasts. Our most significant estimate in the discount rate determinations involves our adjustments to the peer company weighted average costs of capital that reflect reporting unit-specific factors. We have not made any adjustments to decrease a discount rate below the calculated peer company weighted average cost of capital for any reporting unit. Company-specific adjustments to discount rates are subjective and thus are difficult to measure with certainty. The passage of time and the availability of additional information regarding areas of uncertainty with respect to the reporting units’ operations could cause these assumptions to change in the future. We completed our annual impairment tests for goodwill as of October 1, 2016. All of our reporting units had fair values substantially in excess of their carrying values.
Intangible Assets.
Our finite-lived intangible assets are subject to impairment tests when events or circumstances indicate that an asset’s (or asset group’s) carrying value may exceed its estimated fair value. Consideration is given on a quarterly basis to a number of potential impairment indicators, including: changes in the use of the assets, changes in legal or other business factors that could affect value, experienced or expected operating cash-flow deterioration or losses, adverse changes in customer populations, adverse competitive or technological advances that could impact value and other factors.
Our indefinite-lived intangible assets are tested for impairment on an annual basis, or more frequently if impairment indicators exist. To determine if an indefinite-lived intangible asset is impaired, we compare its estimated fair value to its carrying value. If the carrying value exceeds its estimated fair value, an impairment would be recorded for the amount by which the carrying value exceeds its estimated fair value. Intangible assets were not impaired in 2016.
Investments
Our investments are principally classified as available-for-sale and are recorded at fair value. We continually monitor the difference between the cost and fair value of our investments.
Other-Than-Temporary Impairment Assessment.
Individual securities with fair values lower than costs are reviewed for impairment considering the following factors: our intent to sell the security or the likelihood that we will be required to sell the security before recovery of the entire amortized cost, the length of time and extent of impairment and the financial condition and near-term prospects of the issuer as well as specific events or circumstances that may influence the operations of the issuer. Other factors included in the assessment include the type and nature of the securities and their liquidity. Given the nature of our portfolio, primarily investment grade securities, historical impairments were largely market related (e.g., interest rate fluctuations) as opposed to credit related. Our large cash holdings reduce the risk that we will be required to sell a security. However, our intent to sell a security may change from period to period if facts and circumstances change.
The judgments and estimates related to other-than-temporary impairment may ultimately prove to be inaccurate due to many factors, including: circumstances may change over time, industry sector and market factors may differ from expectations and estimates or we may ultimately sell a security we previously intended to hold. Our assessment of the financial condition and near-term prospects of the issuer may ultimately prove to be inaccurate as time passes and new information becomes available, including changes to current facts and circumstances, or as unknown or estimated unlikely trends develop.
39
LEGAL MATTERS
A description of our legal proceedings is presented in
Note 12 of Notes to the Consolidated Financial Statements included in Part II, Item 8, “Financial Statements.”
CONCENTRATIONS OF CREDIT RISK
Investments in financial instruments such as marketable securities and accounts receivable may subject us to concentrations of credit risk. Our investments in marketable securities are managed under an investment policy authorized by our Board of Directors. This policy limits the amounts that may be invested in any one issuer and generally limits our investments to U.S. government and agency securities, state and municipal securities and corporate debt obligations that are investment grade. Concentrations of credit risk with respect to accounts receivable are limited due to the large number of employer groups and other customers that constitute our client base. As of
December 31, 2016
, there were no significant concentrations of credit risk.
Our primary market risks are exposures to changes in interest rates that impact our investment income and interest expense and the fair value of certain of our fixed-rate investments and debt, as well as foreign currency exchange rate risk of the U.S. dollar primarily to the Brazilian real.
As of December 31, 2016, we had $13.2 billion of financial assets on which the interest rates received vary with market interest rates, which may materially impact our investment income. Also as of December 31, 2016, $12.4 billion of our financial liabilities, which include commercial paper, debt and deposit liabilities, were at interest rates that vary with market rates, either directly or through the use of related interest rate swap contracts.
The fair value of certain of our fixed-rate investments and debt also varies with market interest rates. As of December 31, 2016, $21.9 billion of our investments were fixed-rate debt securities and $25.2 billion of our debt was non-swapped fixed-rate term debt. An increase in market interest rates decreases the market value of fixed-rate investments and fixed-rate debt. Conversely, a decrease in market interest rates increases the market value of fixed-rate investments and fixed-rate debt.
We manage exposure to market interest rates by diversifying investments across different fixed income market sectors and debt across maturities, as well as by endeavoring to match our floating-rate assets and liabilities over time, either directly or through the use of interest rate swap contracts. Unrealized gains and losses on investments in available-for-sale securities are reported in comprehensive income.
The following tables summarize the impact of hypothetical changes in market interest rates across the entire yield curve by 1% point or 2% points as of
December 31, 2016
and 2015 on our investment income and interest expense per annum and the fair value of our investments and debt (in millions, except percentages):
|
December 31, 2016
|
||||||||||||||||
|
Increase (Decrease) in Market Interest Rate
|
Investment
Income Per
Annum (a)
|
Interest
Expense Per
Annum (a)
|
Fair Value of
Financial Assets (b) |
Fair Value of
Financial Liabilities
|
||||||||||||
|
2 %
|
$
|
263
|
|
$
|
245
|
|
$
|
(1,711
|
)
|
$
|
(3,470
|
)
|
||||
|
1
|
132
|
|
122
|
|
(873
|
)
|
(1,860
|
)
|
||||||||
|
(1)
|
(105
|
)
|
(95
|
)
|
855
|
|
2,244
|
|
||||||||
|
(2)
|
nm
|
|
nm
|
|
1,562
|
|
4,784
|
|
||||||||
|
December 31, 2015
|
||||||||||||||||
|
Increase (Decrease) in Market Interest Rate
|
Investment
Income Per
Annum (a)
|
Interest
Expense Per
Annum (a)
|
Fair Value of
Financial Assets (b) |
Fair Value of
Financial Liabilities |
||||||||||||
|
2%
|
$
|
258
|
|
$
|
257
|
|
$
|
(1,388
|
)
|
$
|
(3,233
|
)
|
||||
|
1
|
129
|
|
128
|
|
(702
|
)
|
(1,746
|
)
|
||||||||
|
(1)
|
(80
|
)
|
(55
|
)
|
677
|
|
2,085
|
|
||||||||
|
(2)
|
nm
|
|
nm
|
|
1,132
|
|
4,442
|
|
||||||||
nm = not meaningful
40
|
(a)
|
Given the low absolute level of short-term market rates on our floating-rate assets and liabilities as of
December 31, 2016
and 2015, the assumed hypothetical change in interest rates does not reflect the full 100 basis point reduction in interest income or interest expense as the rate cannot fall below zero and thus the 200 basis point reduction is not meaningful.
|
|
(b)
|
As of
December 31, 2016
and 2015, some of our investments had interest rates below 2% so the assumed hypothetical change in the fair value of investments does not reflect the full 200 basis point reduction.
|
We have an exposure to changes in the value of the Brazilian real to the U.S. dollar in translation of UnitedHealthcare Brazil’s operating results at the average exchange rate over the accounting period, and UnitedHealthcare Brazil’s assets and liabilities at the spot rate at the end of the accounting period. The gains or losses resulting from translating foreign assets and liabilities into U.S. dollars are included in equity and comprehensive income.
An appreciation of the U.S. dollar against the Brazilian real reduces the carrying value of the net assets denominated in Brazilian real. For example, as of December 31, 2016, a hypothetical 10% and 25% increase in the value of the U.S. dollar against the Brazilian real would have caused a reduction in net assets of approximately $400 million and $900 million, respectively. We manage exposure to foreign currency earnings risk by conducting our international business operations primarily in their functional currencies.
As of December 31, 2016, we had
$2.0 billion
of investments in equity securities, consisting of investments in non-U.S. dollar fixed-income funds; employee savings plan related investments; venture capital funds; and dividend paying stocks. Valuations in non-U.S. dollar funds are subject to foreign exchange rates. Valuations in venture capital funds are subject to conditions affecting health care and technology stocks and dividend paying equities are subject to more general market conditions.
41
|
Page
|
|
42
Report of Independent Registered Public Accounting Firm
To the Board of Directors and Shareholders of UnitedHealth Group Incorporated and Subsidiaries:
We have audited the accompanying consolidated balance sheets of UnitedHealth Group Incorporated and subsidiaries (the "Company") as of December 31, 2016 and 2015, and the related consolidated statements of operations, comprehensive income, changes in equity and cash flows for each of the three years in the period ended December 31, 2016. These consolidated financial statements are the responsibility of the Company's management. Our responsibility is to express an opinion on these consolidated financial statements based on our audits.
We conducted our audits in accordance with the standards of the Public Company Accounting Oversight Board (United States). Those standards require that we plan and perform the audit to obtain reasonable assurance about whether the consolidated financial statements are free of material misstatement. An audit includes examining, on a test basis, evidence supporting the amounts and disclosures in the consolidated financial statements. An audit also includes assessing the accounting principles used and significant estimates made by management, as well as evaluating the overall financial statement presentation. We believe that our audits provide a reasonable basis for our opinion.
In our opinion, such consolidated financial statements present fairly, in all material respects, the financial position of UnitedHealth Group Incorporated and subsidiaries as of December 31, 2016 and 2015, and the results of their operations and their cash flows for each of the three years in the period ended December 31, 2016, in conformity with accounting principles generally accepted in the United States of America.
We have also audited, in accordance with the standards of the Public Company Accounting Oversight Board (United States), the Company's internal control over financial reporting as of December 31, 2016, based on the criteria established in
Internal Control-Integrated Framework (2013)
issued by the Committee of Sponsoring Organizations of the Treadway Commission and our report dated
February 8, 2017
, expressed an unqualified opinion on the Company's internal control over financial reporting.
|
/
S
/ DELOITTE & TOUCHE LLP
|
|
Minneapolis, Minnesota
|
|
February 8, 2017
|
43
UnitedHealth Group
|
(in millions, except per share data)
|
December 31,
2016 |
December 31,
2015 |
||||||
|
Assets
|
||||||||
|
Current assets:
|
||||||||
|
Cash and cash equivalents
|
$
|
10,430
|
|
$
|
10,923
|
|
||
|
Short-term investments
|
2,845
|
|
1,988
|
|
||||
|
Accounts receivable, net of allowances of $514 and $333
|
8,152
|
|
6,523
|
|
||||
|
Other current receivables, net of allowances of $409 and $138
|
7,499
|
|
6,801
|
|
||||
|
Assets under management
|
3,105
|
|
2,998
|
|
||||
|
Prepaid expenses and other current assets
|
1,848
|
|
2,406
|
|
||||
|
Total current assets
|
33,879
|
|
31,639
|
|
||||
|
Long-term investments
|
23,868
|
|
18,792
|
|
||||
|
Property, equipment and capitalized software, net of accumulated depreciation and amortization of $3,749 and $3,173
|
5,901
|
|
4,861
|
|
||||
|
Goodwill
|
47,584
|
|
44,453
|
|
||||
|
Other intangible assets, net of accumulated amortization of $3,847 and $3,128
|
8,541
|
|
8,391
|
|
||||
|
Other assets
|
3,037
|
|
3,118
|
|
||||
|
Total assets
|
$
|
122,810
|
|
$
|
111,254
|
|
||
|
Liabilities, redeemable noncontrolling interests and equity
|
||||||||
|
Current liabilities:
|
||||||||
|
Medical costs payable
|
$
|
16,391
|
|
$
|
14,330
|
|
||
|
Accounts payable and accrued liabilities
|
13,361
|
|
11,994
|
|
||||
|
Commercial paper and current maturities of long-term debt
|
7,193
|
|
6,634
|
|
||||
|
Unearned revenues
|
1,968
|
|
2,142
|
|
||||
|
Other current liabilities
|
10,339
|
|
7,798
|
|
||||
|
Total current liabilities
|
49,252
|
|
42,898
|
|
||||
|
Long-term debt, less current maturities
|
25,777
|
|
25,331
|
|
||||
|
Future policy benefits
|
2,524
|
|
2,496
|
|
||||
|
Deferred income taxes
|
2,761
|
|
3,587
|
|
||||
|
Other liabilities
|
2,307
|
|
1,481
|
|
||||
|
Total liabilities
|
82,621
|
|
75,793
|
|
||||
|
|
|
|||||||
|
Redeemable noncontrolling interests
|
2,012
|
|
1,736
|
|
||||
|
Equity:
|
||||||||
|
Preferred stock, $0.001 par value - 10 shares authorized; no shares issued or outstanding
|
—
|
|
—
|
|
||||
|
Common stock, $0.01 par value - 3,000 shares authorized; 952 and 953 issued and outstanding
|
10
|
|
10
|
|
||||
|
Additional paid-in capital
|
—
|
|
29
|
|
||||
|
Retained earnings
|
40,945
|
|
37,125
|
|
||||
|
Accumulated other comprehensive loss
|
(2,681
|
)
|
(3,334
|
)
|
||||
|
Nonredeemable noncontrolling interest
|
(97
|
)
|
(105
|
)
|
||||
|
Total equity
|
38,177
|
|
33,725
|
|
||||
|
Total liabilities, redeemable noncontrolling interests and equity
|
$
|
122,810
|
|
$
|
111,254
|
|
||
44
UnitedHealth Group
|
|
For the Years Ended December 31,
|
|||||||||||
|
(in millions, except per share data)
|
2016
|
2015
|
2014
|
|||||||||
|
Revenues:
|
||||||||||||
|
Premiums
|
$
|
144,118
|
|
$
|
127,163
|
|
$
|
115,302
|
|
|||
|
Products
|
26,658
|
|
17,312
|
|
4,242
|
|
||||||
|
Services
|
13,236
|
|
11,922
|
|
10,151
|
|
||||||
|
Investment and other income
|
828
|
|
710
|
|
779
|
|
||||||
|
Total revenues
|
184,840
|
|
157,107
|
|
130,474
|
|
||||||
|
Operating costs:
|
||||||||||||
|
Medical costs
|
117,038
|
|
103,875
|
|
93,633
|
|
||||||
|
Operating costs
|
28,401
|
|
24,312
|
|
21,263
|
|
||||||
|
Cost of products sold
|
24,416
|
|
16,206
|
|
3,826
|
|
||||||
|
Depreciation and amortization
|
2,055
|
|
1,693
|
|
1,478
|
|
||||||
|
Total operating costs
|
171,910
|
|
146,086
|
|
120,200
|
|
||||||
|
Earnings from operations
|
12,930
|
|
11,021
|
|
10,274
|
|
||||||
|
Interest expense
|
(1,067
|
)
|
(790
|
)
|
(618
|
)
|
||||||
|
Earnings before income taxes
|
11,863
|
|
10,231
|
|
9,656
|
|
||||||
|
Provision for income taxes
|
(4,790
|
)
|
(4,363
|
)
|
(4,037
|
)
|
||||||
|
Net earnings
|
7,073
|
|
5,868
|
|
5,619
|
|
||||||
|
Earnings attributable to noncontrolling interests
|
(56
|
)
|
(55
|
)
|
—
|
|
||||||
|
Net earnings attributable to UnitedHealth Group common shareholders
|
$
|
7,017
|
|
$
|
5,813
|
|
$
|
5,619
|
|
|||
|
Earnings per share attributable to UnitedHealth Group common shareholders:
|
||||||||||||
|
Basic
|
$
|
7.37
|
|
$
|
6.10
|
|
$
|
5.78
|
|
|||
|
Diluted
|
$
|
7.25
|
|
$
|
6.01
|
|
$
|
5.70
|
|
|||
|
Basic weighted-average number of common shares outstanding
|
952
|
|
953
|
|
972
|
|
||||||
|
Dilutive effect of common share equivalents
|
16
|
|
14
|
|
14
|
|
||||||
|
Diluted weighted-average number of common shares outstanding
|
968
|
|
967
|
|
986
|
|
||||||
|
Anti-dilutive shares excluded from the calculation of dilutive effect of common share equivalents
|
3
|
|
8
|
|
6
|
|
||||||
|
Cash dividends declared per common share
|
$
|
2.375
|
|
$
|
1.875
|
|
$
|
1.405
|
|
|||
45
UnitedHealth Group
Consolidated Statements of Comprehensive Income
|
|
||||||||||||
|
|
For the Years Ended December 31,
|
|||||||||||
|
(in millions)
|
2016
|
2015
|
2014
|
|||||||||
|
Net earnings
|
$
|
7,073
|
|
$
|
5,868
|
|
$
|
5,619
|
|
|||
|
Other comprehensive income (loss):
|
||||||||||||
|
Gross unrealized (losses) gains on investment securities during the period
|
(73
|
)
|
(123
|
)
|
476
|
|
||||||
|
Income tax effect
|
26
|
|
44
|
|
(173
|
)
|
||||||
|
Total unrealized (losses) gains, net of tax
|
(47
|
)
|
(79
|
)
|
303
|
|
||||||
|
Gross reclassification adjustment for net realized gains included in net earnings
|
(166
|
)
|
(141
|
)
|
(211
|
)
|
||||||
|
Income tax effect
|
60
|
|
53
|
|
77
|
|
||||||
|
Total reclassification adjustment, net of tax
|
(106
|
)
|
(88
|
)
|
(134
|
)
|
||||||
|
Total foreign currency translation gains (losses)
|
806
|
|
(1,775
|
)
|
(653
|
)
|
||||||
|
Other comprehensive income (loss)
|
653
|
|
(1,942
|
)
|
(484
|
)
|
||||||
|
Comprehensive income
|
7,726
|
|
3,926
|
|
5,135
|
|
||||||
|
Comprehensive income attributable to noncontrolling interests
|
(56
|
)
|
(55
|
)
|
—
|
|
||||||
|
Comprehensive income attributable to UnitedHealth Group common shareholders
|
$
|
7,670
|
|
$
|
3,871
|
|
$
|
5,135
|
|
|||
46
UnitedHealth Group
Consolidated Statements of Changes in Equity
|
Common Stock
|
Additional Paid-In Capital
|
Retained Earnings
|
Accumulated Other Comprehensive Income (Loss)
|
Nonredeemable
Noncontrolling Interest |
Total
Equity |
||||||||||||||||||||||||||
|
(in millions)
|
Shares
|
Amount
|
Net Unrealized Gains (Losses) on Investments
|
Foreign Currency Translation (Losses) Gains
|
|||||||||||||||||||||||||||
|
Balance at January 1, 2014
|
988
|
|
$
|
10
|
|
$
|
—
|
|
$
|
33,047
|
|
$
|
54
|
|
$
|
(962
|
)
|
$
|
—
|
|
$
|
32,149
|
|
||||||||
|
Net earnings
|
5,619
|
|
5,619
|
|
|||||||||||||||||||||||||||
|
Other comprehensive income (loss)
|
169
|
|
(653
|
)
|
(484
|
)
|
|||||||||||||||||||||||||
|
Issuances of common stock, and related tax effects
|
15
|
|
—
|
|
146
|
|
146
|
|
|||||||||||||||||||||||
|
Share-based compensation, and related tax benefits
|
394
|
|
394
|
|
|||||||||||||||||||||||||||
|
Common share repurchases
|
(49
|
)
|
—
|
|
(540
|
)
|
(3,468
|
)
|
(4,008
|
)
|
|||||||||||||||||||||
|
Cash dividends paid on common shares
|
(1,362
|
)
|
(1,362
|
)
|
|||||||||||||||||||||||||||
|
Balance at December 31, 2014
|
954
|
|
10
|
|
—
|
|
33,836
|
|
223
|
|
(1,615
|
)
|
—
|
|
32,454
|
|
|||||||||||||||
|
Net earnings
|
5,813
|
|
26
|
|
5,839
|
|
|||||||||||||||||||||||||
|
Other comprehensive loss
|
(167
|
)
|
(1,775
|
)
|
(1,942
|
)
|
|||||||||||||||||||||||||
|
Issuances of common stock, and related tax effects
|
10
|
|
—
|
|
127
|
|
127
|
|
|||||||||||||||||||||||
|
Share-based compensation, and related tax benefits
|
589
|
|
589
|
|
|||||||||||||||||||||||||||
|
Common share repurchases
|
(11
|
)
|
—
|
|
(462
|
)
|
(738
|
)
|
(1,200
|
)
|
|||||||||||||||||||||
|
Cash dividends paid on common shares
|
(1,786
|
)
|
(1,786
|
)
|
|||||||||||||||||||||||||||
|
Redeemable noncontrolling interests fair value and other adjustments
|
(225
|
)
|
(225
|
)
|
|||||||||||||||||||||||||||
|
Acquisition of nonredeemable noncontrolling interest
|
9
|
|
9
|
|
|||||||||||||||||||||||||||
|
Distributions to nonredeemable noncontrolling interest
|
(140
|
)
|
(140
|
)
|
|||||||||||||||||||||||||||
|
Balance at December 31, 2015
|
953
|
|
10
|
|
29
|
|
37,125
|
|
56
|
|
(3,390
|
)
|
(105
|
)
|
33,725
|
|
|||||||||||||||
|
Adjustment to adopt ASU 2016-09
|
28
|
|
28
|
|
|||||||||||||||||||||||||||
|
Net earnings
|
7,017
|
|
40
|
|
7,057
|
|
|||||||||||||||||||||||||
|
Other comprehensive (loss) income
|
(153
|
)
|
806
|
|
653
|
|
|||||||||||||||||||||||||
|
Issuances of common stock, and related tax effects
|
9
|
|
—
|
|
191
|
|
191
|
|
|||||||||||||||||||||||
|
Share-based compensation
|
455
|
|
455
|
|
|||||||||||||||||||||||||||
|
Common share repurchases
|
(10
|
)
|
—
|
|
(316
|
)
|
(964
|
)
|
(1,280
|
)
|
|||||||||||||||||||||
|
Cash dividends paid on common shares
|
(2,261
|
)
|
(2,261
|
)
|
|||||||||||||||||||||||||||
|
Acquisition of redeemable noncontrolling interest shares
|
(143
|
)
|
(143
|
)
|
|||||||||||||||||||||||||||
|
Redeemable noncontrolling interests fair value and other adjustments
|
(216
|
)
|
(216
|
)
|
|||||||||||||||||||||||||||
|
Distributions to nonredeemable noncontrolling interest
|
(32
|
)
|
(32
|
)
|
|||||||||||||||||||||||||||
|
Balance at December 31, 2016
|
952
|
|
$
|
10
|
|
$
|
—
|
|
$
|
40,945
|
|
$
|
(97
|
)
|
$
|
(2,584
|
)
|
$
|
(97
|
)
|
$
|
38,177
|
|
||||||||
47
UnitedHealth Group
|
|
For the Years Ended December 31,
|
|||||||||||
|
(in millions)
|
2016
|
2015
|
2014
|
|||||||||
|
Operating activities
|
||||||||||||
|
Net earnings
|
$
|
7,073
|
|
$
|
5,868
|
|
$
|
5,619
|
|
|||
|
Noncash items:
|
||||||||||||
|
Depreciation and amortization
|
2,055
|
|
1,693
|
|
1,478
|
|
||||||
|
Deferred income taxes
|
81
|
|
(73
|
)
|
(117
|
)
|
||||||
|
Share-based compensation
|
485
|
|
406
|
|
364
|
|
||||||
|
Other, net
|
(82
|
)
|
(235
|
)
|
(298
|
)
|
||||||
|
Net change in other operating items, net of effects from acquisitions and changes in AARP balances:
|
||||||||||||
|
Accounts receivable
|
(1,357
|
)
|
(591
|
)
|
(911
|
)
|
||||||
|
Other assets
|
(1,601
|
)
|
(1,430
|
)
|
(590
|
)
|
||||||
|
Medical costs payable
|
1,849
|
|
2,585
|
|
484
|
|
||||||
|
Accounts payable and other liabilities
|
1,494
|
|
1,280
|
|
1,637
|
|
||||||
|
Unearned revenues
|
(202
|
)
|
237
|
|
385
|
|
||||||
|
Cash flows from operating activities
|
9,795
|
|
9,740
|
|
8,051
|
|
||||||
|
Investing activities
|
||||||||||||
|
Purchases of investments
|
(17,547
|
)
|
(9,939
|
)
|
(9,928
|
)
|
||||||
|
Sales of investments
|
7,339
|
|
6,054
|
|
7,701
|
|
||||||
|
Maturities of investments
|
4,281
|
|
3,354
|
|
3,026
|
|
||||||
|
Cash paid for acquisitions, net of cash assumed
|
(1,760
|
)
|
(16,164
|
)
|
(1,923
|
)
|
||||||
|
Purchases of property, equipment and capitalized software
|
(1,705
|
)
|
(1,556
|
)
|
(1,525
|
)
|
||||||
|
Other, net
|
37
|
|
(144
|
)
|
115
|
|
||||||
|
Cash flows used for investing activities
|
(9,355
|
)
|
(18,395
|
)
|
(2,534
|
)
|
||||||
|
Financing activities
|
||||||||||||
|
Acquisition of redeemable noncontrolling interest shares
|
(257
|
)
|
(118
|
)
|
—
|
|
||||||
|
Common share repurchases
|
(1,280
|
)
|
(1,200
|
)
|
(4,008
|
)
|
||||||
|
Cash dividends paid
|
(2,261
|
)
|
(1,786
|
)
|
(1,362
|
)
|
||||||
|
Proceeds from common stock issuances
|
429
|
|
402
|
|
462
|
|
||||||
|
Repayments of long-term debt
|
(2,596
|
)
|
(1,041
|
)
|
(812
|
)
|
||||||
|
(Repayments of) proceeds from commercial paper, net
|
(382
|
)
|
3,666
|
|
(794
|
)
|
||||||
|
Proceeds from issuance of long-term debt
|
3,968
|
|
11,982
|
|
1,997
|
|
||||||
|
Customer funds administered
|
1,692
|
|
768
|
|
(638
|
)
|
||||||
|
Other, net
|
(324
|
)
|
(434
|
)
|
(138
|
)
|
||||||
|
Cash flows (used for) from financing activities
|
(1,011
|
)
|
12,239
|
|
(5,293
|
)
|
||||||
|
Effect of exchange rate changes on cash and cash equivalents
|
78
|
|
(156
|
)
|
(5
|
)
|
||||||
|
(Decrease) increase in cash and cash equivalents
|
(493
|
)
|
3,428
|
|
219
|
|
||||||
|
Cash and cash equivalents, beginning of period
|
10,923
|
|
7,495
|
|
7,276
|
|
||||||
|
Cash and cash equivalents, end of period
|
$
|
10,430
|
|
$
|
10,923
|
|
$
|
7,495
|
|
|||
|
Supplemental cash flow disclosures
|
||||||||||||
|
Cash paid for interest
|
$
|
1,055
|
|
$
|
639
|
|
$
|
644
|
|
|||
|
Cash paid for income taxes
|
4,726
|
|
4,401
|
|
4,024
|
|
||||||
48
UnitedHealth Group
Notes to the Consolidated Financial Statements
|
1.
|
Description of Business
|
UnitedHealth Group Incorporated (individually and together with its subsidiaries, “UnitedHealth Group” and “the Company”) is a diversified health and well-being company dedicated to helping people live healthier lives and helping to make the health system work better for everyone.
Through its diversified family of businesses, the Company leverages core competencies in advanced, enabling technology; health care data, information and intelligence; and clinical care management and coordination to help meet the demands of the health system. These core competencies are deployed within the Company’s two distinct, but strategically aligned, business platforms: health benefits operating under UnitedHealthcare and health services operating under Optum.
2.
Basis of Presentation, Use of Estimates and Significant Accounting Policies
Basis of Presentation
The Company has prepared the Consolidated Financial Statements according to U.S. Generally Accepted Accounting Principles (GAAP) and has included the accounts of UnitedHealth Group and its subsidiaries.
Use of Estimates
These Consolidated Financial Statements include certain amounts based on the Company’s best estimates and judgments. The Company’s most significant estimates relate to estimates and judgments for medical costs payable and revenues, valuation and impairment analysis of goodwill and other intangible assets, estimates of other current liabilities and other current receivables and valuations of certain investments. Certain of these estimates require the application of complex assumptions and judgments, often because they involve matters that are inherently uncertain and will likely change in subsequent periods. The impact of any change in estimates is included in earnings in the period in which the estimate is adjusted.
Revenues
Premiums
Premium revenues are primarily derived from risk-based health insurance arrangements in which the premium is typically at a fixed rate per individual served for a one-year period, and the Company assumes the economic risk of funding its customers’ health care and related administrative costs.
Premium revenues are recognized in the period in which eligible individuals are entitled to receive health care benefits. Health care premium payments received from the Company’s customers in advance of the service period are recorded as unearned revenues. Fully insured commercial products of U.S. health plans, Medicare Advantage and Medicare Prescription Drug Benefit (Medicare Part D) plans with medical loss ratios as calculated under the definitions in the Patient Protection and Affordable Care Act (ACA) and related federal and state regulations and implementing regulations, that fall below certain targets are required to rebate ratable portions of their premiums annually. Medicare Advantage premium revenue includes the impact of Centers for Medicare & Medicaid Services (CMS) quality bonuses based on plans’ Star ratings.
Premium revenues are recognized based on the estimated premiums earned net of projected rebates because the Company is able to reasonably estimate the ultimate premiums of these contracts. The Company also records premium revenues from capitation arrangements at its OptumHealth businesses.
The Company’s Medicare Advantage and Medicare Part D premium revenues are subject to periodic adjustment under CMS’ risk adjustment payment methodology. CMS deploys a risk adjustment model that apportions premiums paid to all health plans according to health severity and certain demographic factors. The CMS risk adjustment model provides higher per member payments for enrollees diagnosed with certain conditions and lower payments for enrollees who are healthier. Under this risk adjustment methodology, CMS calculates the risk adjusted premium payment using diagnosis data from hospital inpatient, hospital outpatient and physician treatment settings. The Company and health care providers collect, capture and submit the necessary and available diagnosis data to CMS within prescribed deadlines. The Company estimates risk adjustment revenues based upon the diagnosis data submitted and expected to be submitted to CMS. Risk adjustment data for certain of the Company’s plans are subject to review by the government, including audit by regulators. See
Note 12
for additional information regarding these audits.
49
Products and Services
For the Company’s OptumRx pharmacy care services business, the majority of revenues are derived from products sold through a contracted network of retail pharmacies or home delivery and specialty pharmacy facilities. Product revenues include ingredient costs (net of rebates), a negotiated dispensing fee and customer co-payments for drugs dispensed through the Company’s mail-service pharmacy. In retail pharmacy transactions, revenues recognized exclude the member’s applicable co-payment. Pharmacy products are billed to customers based on the number of transactions occurring during the billing period. Product revenues are recognized when the prescriptions are dispensed through the retail network or received by consumers through the Company’s mail-service pharmacy. The Company has entered into contracts in which it is primarily obligated to pay its network pharmacy providers for benefits provided to their customers regardless of whether the Company is paid. The Company is also involved in establishing the prices charged by retail pharmacies, determining which drugs will be included in formulary listings and selecting which retail pharmacies will be included in the network offered to plan sponsors’ members. As a result, revenues are reported on a gross basis.
Services revenue consists of fees derived from services performed for customers that self-insure the health care costs of their employees and employees’ dependents. Under service fee contracts, the Company receives monthly, a fixed fee per employee, which is recognized as revenue as the Company performs, or makes available the applicable services to the customer. The customers retain the risk of financing health care costs for their employees and employees’ dependents, and the Company administers the payment of customer funds to physicians and other health care professionals from customer-funded bank accounts. As the Company has neither the obligation for funding the health care costs, nor the primary responsibility for providing the medical care, the Company does not recognize premium revenue and medical costs for these contracts in its Consolidated Financial Statements. For these fee-based customer arrangements, the Company provides coordination and facilitation of medical services; transaction processing; customer, consumer and care professional services; and access to contracted networks of physicians, hospitals and other health care professionals. These services are performed throughout the contract period.
Revenues are also comprised of a number of services and products sold through Optum. For its financial services offerings, OptumHealth charges fees and earns investment income on managed funds. OptumInsight provides software and information products, advisory consulting arrangements and services outsourcing contracts, which may be delivered over several years. OptumInsight revenues are generally recognized over time on either a time and materials basis, or ratably as services are performed or made available to customers.
Medical Costs and Medical Costs Payable
The Company’s estimate of medical costs payable represents management’s best estimate of its liability for unpaid medical costs as of December 31, 2016.
Each period, the Company re-examines previously established medical costs payable estimates based on actual claim submissions and other changes in facts and circumstances. As more complete claim information becomes available, the Company adjusts the amount of the estimates and includes the changes in estimates in medical costs in the period in which the change is identified. Approximately
90%
of claims related to medical care services are known and settled within 90 days from the date of service and substantially all within twelve months.
Medical costs and medical costs payable include estimates of the Company’s obligations for medical care services that have been rendered on behalf of insured consumers, but for which claims have either not yet been received, processed, or paid. The Company develops estimates for medical care services incurred but not reported (IBNR), which includes estimates for claims that have not been received or fully processed, using an actuarial process that is consistently applied, centrally controlled and automated. The actuarial models consider factors such as time from date of service to claim processing, seasonal variances in medical care consumption, health care professional contract rate changes, medical care utilization and other medical cost trends, membership volume and demographics, the introduction of new technologies, benefit plan changes, and business mix changes related to products, customers and geography.
In developing its medical costs payable estimates, the Company applies different estimation methods depending on which incurred claims are being estimated. For the most recent two months, the Company estimates claim costs incurred by applying observed medical cost trend factors to the average per member per month (PMPM) medical costs incurred in prior months for which more complete claim data are available, supplemented by a review of near-term completion factors (actuarial estimates, based upon historical experience and analysis of current trends, of the percentage of incurred claims during a given period that have been adjudicated by the Company at the date of estimation).
For months prior to the most recent two months, the Company applies the completion factors to actual claims adjudicated-to-date to estimate the expected amount of ultimate incurred claims for those months.
50
Cost of Products Sold
The Company’s cost of products sold includes the cost of pharmaceuticals dispensed to unaffiliated customers either directly at its mail and specialty pharmacy locations, or indirectly through its nationwide network of participating pharmacies. Rebates attributable to non-affiliated clients are accrued as rebates receivable and a reduction of cost of products sold with a corresponding payable for the amounts of the rebates to be remitted to those non-affiliated clients in accordance with their contracts and recorded in the Consolidated Statements of Operations as a reduction of product revenue. Cost of products sold also includes the cost of personnel to support the Company’s transaction processing services, system sales, maintenance and professional services.
Cash, Cash Equivalents and Investments
Cash and cash equivalents are highly liquid investments that have an original maturity of three months or less. The fair value of cash and cash equivalents approximates their carrying value because of the short maturity of the instruments.
Investments with maturities of less than one year are classified as short-term. Because of regulatory requirements, certain investments are included in long-term investments regardless of their maturity date. The Company classifies these investments as held-to-maturity and reports them at amortized cost. Substantially all other investments are classified as available-for-sale and reported at fair value based on quoted market prices, where available.
The Company excludes unrealized gains and losses on investments in available-for-sale securities from net earnings and reports them as comprehensive income and, net of income tax effects, as a separate component of equity. To calculate realized gains and losses on the sale of investments, the Company specifically identifies the cost of each investment sold.
The Company evaluates an investment for impairment by considering the length of time and extent to which market value has been less than cost or amortized cost, the financial condition and near-term prospects of the issuer as well as specific events or circumstances that may influence the operations of the issuer and the Company’s intent to sell the security or the likelihood that it will be required to sell the security before recovery of the entire amortized cost.
New information and the passage of time can change these judgments. The Company manages its investment portfolio to limit its exposure to any one issuer or market sector, and largely limits its investments to investment grade quality. Securities downgraded below policy minimums after purchase will be disposed of in accordance with the Company’s investment policy.
Assets Under Management
The Company provides health insurance products and services to members of AARP under a Supplemental Health Insurance Program (the AARP Program) and to AARP members and non-members under separate Medicare Advantage and Medicare Part D arrangements. The products and services under the AARP Program include supplemental Medicare benefits, hospital indemnity insurance, including insurance for individuals between 50 to 64 years of age and other related products.
Pursuant to the Company’s agreement, AARP Program assets are managed separately from the Company’s general investment portfolio and are used to pay costs associated with the AARP Program. These assets are invested at the Company’s discretion, within investment guidelines approved by AARP. The Company does not guarantee any rates of return on these investments and, upon any transfer of the AARP Program contract to another entity, the Company would transfer cash equal in amount to the fair value of these investments at the date of transfer to that entity. Because the purpose of these assets is to fund the medical costs payable, the rate stabilization fund (RSF) liabilities and other related liabilities associated with this AARP contract, assets under management are classified as current assets, consistent with the classification of these liabilities.
The effects of changes in other balance sheet amounts associated with the AARP Program also accrue to the overall benefit of the AARP policyholders through the RSF balance. Accordingly, the Company excludes the effect of such changes in its Consolidated Statements of Cash Flows.
Other Current Receivables
Other current receivables include amounts due from pharmaceutical manufacturers for rebates and Medicare Part D drug discounts and other miscellaneous amounts due to the Company.
The Company’s pharmacy care services businesses contract with pharmaceutical manufacturers, some of which provide rebates based on use of the manufacturers’ products by its affiliated and non-affiliated clients. The Company accrues rebates as they are earned by its clients on a monthly basis based on the terms of the applicable contracts, historical data and current estimates. The pharmacy care services businesses bill these rebates to the manufacturers on a monthly or quarterly basis depending on the contractual terms and records rebates attributable to affiliated clients as a reduction to medical costs. The Company generally receives rebates from two to five months after billing. As of December 31, 2016 and 2015, total pharmaceutical manufacturer
51
rebates receivable included in other receivables in the Consolidated Balance Sheets amounted to $
3.3 billion
and
$2.6 billion
, respectively.
For details on the Company’s Medicare Part D receivables see
“Medicare Part D Pharmacy Benefits”
below.
Medicare Part D Pharmacy Benefits
The Company serves as a plan sponsor offering Medicare Part D prescription drug insurance coverage under contracts with CMS. Under the Medicare Part D program, there are seven separate elements of payment received by the Company during the plan year. These payment elements are as follows:
|
•
|
CMS Premium.
CMS pays a fixed monthly premium per member to the Company for the entire plan year.
|
|
•
|
Member Premium.
Additionally, certain members pay a fixed monthly premium to the Company for the entire plan year.
|
|
•
|
Low-Income Premium Subsidy.
For qualifying low-income members, CMS pays some or all of the member’s monthly premiums to the Company on the member’s behalf.
|
|
•
|
Catastrophic Reinsurance Subsidy
. CMS pays the Company a cost reimbursement estimate monthly to fund the CMS obligation to pay approximately 80% of the costs incurred by individual members in excess of the individual annual out-of-pocket maximum. A settlement is made with CMS based on actual cost experience, after the end of the plan year.
|
|
•
|
Low-Income Member Cost Sharing Subsidy.
For qualifying low-income members, CMS pays on the member’s behalf some or all of a member’s cost sharing amounts, such as deductibles and coinsurance. The cost sharing subsidy is funded by CMS through monthly payments to the Company. The Company administers and pays the subsidized portion of the claims on behalf of CMS, and a settlement payment is made between CMS and the Company based on actual claims and premium experience, after the end of the plan year.
|
|
•
|
CMS Risk-Share.
Premiums from CMS are subject to risk corridor provisions that compare costs targeted in the Company’s annual bids by product and region to actual prescription drug costs, limited to actual costs that would have been incurred under the standard coverage as defined by CMS. Variances of more than 5% above or below the original bid submitted by the Company may result in CMS making additional payments to the Company or require the Company to refund to CMS a portion of the premiums it received. The Company estimates and recognizes an adjustment to premium revenues related to the risk corridor payment settlement based upon pharmacy claims experience to date. The estimate of the settlement associated with these risk corridor provisions requires the Company to consider factors that may not be certain, including estimates of eligible pharmacy costs and member eligibility status differences with CMS. The Company records risk-share adjustments to premium revenues in the Consolidated Statements of Operations and other current liabilities or other current receivables in the Consolidated Balance Sheets.
|
|
•
|
Drug Discount.
The ACA mandated a consumer discount on brand name prescription drugs for Medicare Part D plan participants in the coverage gap. This discount is funded by CMS and pharmaceutical manufacturers while the Company administers the application of these funds. Accordingly, amounts received are not reflected as premium revenues, but rather are accounted for as deposits. The Company records a liability when amounts are received from CMS and a receivable when the Company bills the pharmaceutical manufacturers. Related cash flows are presented as customer funds administered within financing activities in the Consolidated Statements of Cash Flows.
|
The CMS Premium, the Member Premium and the Low-Income Premium Subsidy represent payments for the Company’s insurance risk coverage under the Medicare Part D program and, therefore, are recorded as premium revenues in the Consolidated Statements of Operations. Premium revenues are recognized ratably over the period in which eligible individuals are entitled to receive prescription drug benefits. The Company records premium payments received in advance of the applicable service period in unearned revenues in the Consolidated Balance Sheets.
The Catastrophic Reinsurance Subsidy and the Low-Income Member Cost Sharing Subsidy (Subsidies) represent cost reimbursements under the Medicare Part D program. Amounts received for these Subsidies are not reflected as premium revenues, but rather are accounted for as receivables and/or deposits. Related cash flows are presented as customer funds administered within financing activities in the Consolidated Statements of Cash Flows.
Pharmacy care costs and administrative costs under the contract are expensed as incurred and are recognized in medical costs and operating costs, respectively, in the Consolidated Statements of Operations.
The final 2016 risk-share amount is expected to be settled during the second half of 2017, and is subject to the reconciliation process with CMS.
52
The Consolidated Balance Sheets include the following amounts associated with the Medicare Part D program:
|
|
December 31, 2016
|
December 31, 2015
|
||||||||||||||||||||||
|
(in millions)
|
Subsidies
|
Drug Discount
|
Risk-Share
|
Subsidies
|
Drug Discount
|
Risk-Share
|
||||||||||||||||||
|
Other current receivables
|
$
|
934
|
|
$
|
543
|
|
$
|
—
|
|
$
|
1,703
|
|
$
|
423
|
|
$
|
—
|
|
||||||
|
Other current liabilities
|
—
|
|
267
|
|
471
|
|
—
|
|
58
|
|
496
|
|
||||||||||||
Property, Equipment and Capitalized Software
Property, equipment and capitalized software are stated at cost, net of accumulated depreciation and amortization. Capitalized software consists of certain costs incurred in the development of internal-use software, including external direct costs of materials and services and applicable payroll costs of employees devoted to specific software development.
The Company calculates depreciation and amortization using the straight-line method over the estimated useful lives of the assets. The useful lives for property, equipment and capitalized software are:
|
Furniture, fixtures and equipment
|
3 to 7 years
|
|
Buildings
|
35 to 40 years
|
|
Capitalized software
|
3 to 5 years
|
Leasehold improvements are depreciated over the shorter of the remaining lease term or their estimated useful economic life.
Goodwill
To determine whether goodwill is impaired, annually or more frequently if needed, the Company performs a multi-step impairment test. The Company may first assess qualitative factors to determine if it is more likely than not that the carrying value of a reporting unit exceeds its estimated fair value. The Company may also elect to skip the qualitative testing and proceed directly to the quantitative testing. When performing quantitative testing, the Company first estimates the fair values of its reporting units using discounted cash flows. To determine fair values, the Company must make assumptions about a wide variety of internal and external factors. Significant assumptions used in the impairment analysis include financial projections of free cash flow (including significant assumptions about operations, capital requirements and income taxes), long-term growth rates for determining terminal value and discount rates. Comparative market multiples are used to corroborate the results of the discounted cash flow test. If the fair value is less than the carrying value of the reporting unit, then the implied value of goodwill would be calculated and compared to the carrying amount of goodwill to determine whether goodwill is impaired.
There was no impairment of goodwill during the year ended
December 31, 2016
.
Intangible Assets
The Company’s intangible assets are subject to impairment tests when events or circumstances indicate that an intangible asset (or asset group) may be impaired. The Company’s indefinite lived intangible assets are also tested for impairment annually. There was no impairment of intangible assets during the year ended
December 31, 2016
.
Accounts Payable and Accrued Liabilities
The Company had checks outstanding of
$1.5 billion
and
$1.6 billion
as of
December 31, 2016
and 2015, respectively, which were classified as accounts payable and accrued liabilities and the change in this balance has been reflected within other financing activities in the Consolidated Statements of Cash Flows.
Other Current Liabilities
Other current liabilities include health savings account deposits (
$5.7 billion
and
$3.6 billion
as of
December 31, 2016
and
2015
, respectively), the RSF associated with the AARP Program, deposits under the Medicare Part D program (see
“Medicare Part D Pharmacy Benefits”
above), accruals for premium rebate payments under the ACA, the current portion of future policy benefits and customer balances.
Future Policy Benefits
Future policy benefits represent account balances that accrue to the benefit of the policyholders, excluding surrender charges, for universal life and investment annuity products and for long-duration health policies sold to individuals for which some of the premium received in the earlier years is intended to pay benefits to be incurred in future years.
Policy Acquisition Costs
The Company’s short duration health insurance contracts typically have a one-year term and may be canceled by the customer
53
with at least
30
days’ notice. Costs related to the acquisition and renewal of short duration customer contracts are charged to expense as incurred.
Redeemable Noncontrolling Interests
Redeemable noncontrolling interests in the Company’s subsidiaries whose redemption is outside the control of the Company are classified as temporary equity. The following table provides details of the Company's redeemable noncontrolling interests’ activity for the years ended
December 31, 2016
and
2015
:
|
(in millions)
|
2016
|
2015
|
||||||
|
Redeemable noncontrolling interests, beginning of period
|
$
|
1,736
|
|
$
|
1,388
|
|
||
|
Net earnings
|
16
|
|
29
|
|
||||
|
Acquisitions
|
34
|
|
196
|
|
||||
|
Redemptions
|
(123
|
)
|
(116
|
)
|
||||
|
Distributions
|
(11
|
)
|
(19
|
)
|
||||
|
Fair value and other adjustments
|
360
|
|
258
|
|
||||
|
Redeemable noncontrolling interests, end of period
|
$
|
2,012
|
|
$
|
1,736
|
|
||
Share-Based Compensation
The Company recognizes compensation expense for share-based awards, including stock options, stock-settled stock appreciation rights (SARs) and restricted stock and restricted stock units (collectively, restricted shares), on a straight-line basis over the related service period (generally the vesting period) of the award, or to an employee’s eligible retirement date under the award agreement, if earlier. Restricted shares vest ratably; primarily over
two
to
five
years and compensation expense related to restricted shares is based on the share price on date of grant. Stock options and SARs vest ratably primarily over
four
years and may be exercised up to
10
years from the date of grant. Compensation expense related to stock options and SARs is based on the fair value at date of grant, which is estimated on the date of grant using a binomial option-pricing model. Under the Company’s Employee Stock Purchase Plan (ESPP) eligible employees are allowed to purchase the Company’s stock at a discounted price, which is
85%
of the lower market price of the Company’s common stock at the beginning or at the end of the six-month purchase period. Share-based compensation expense for all programs is recognized in operating costs in the Consolidated Statements of Operations.
Net Earnings Per Common Share
The Company computes basic earnings per common share attributable to UnitedHealth Group common shareholders by dividing net earnings attributable to UnitedHealth Group common shareholders by the weighted-average number of common shares outstanding during the period. The Company determines diluted net earnings per common share attributable to UnitedHealth Group common shareholders using the weighted-average number of common shares outstanding during the period, adjusted for potentially dilutive shares associated with stock options, SARs, restricted shares and the ESPP, (collectively, common stock equivalents) using the treasury stock method. The treasury stock method assumes a hypothetical issuance of shares to settle the share-based awards, with the assumed proceeds used to purchase common stock at the average market price for the period. Assumed proceeds include the amount the employee must pay upon exercise and any unrecognized compensation cost. The difference between the number of shares assumed issued and number of shares assumed purchased represents the dilutive shares.
Health Insurance Industry Tax
The ACA includes an annual, nondeductible insurance industry tax (Health Insurance Industry Tax) to be levied proportionally across the insurance industry for risk-based health insurance products.
The Company estimates its liability for the Health Insurance Industry Tax based on a ratio of the Company’s applicable net premiums written compared to the U.S. health insurance industry total applicable net premiums, both for the previous calendar year. The Company records in full the estimated liability for the Health Insurance Industry Tax at the beginning of the calendar year with a corresponding deferred cost that is amortized to operating costs on the Consolidated Statements of Operations using a straight-line method of allocation over the calendar year. The liability is recorded in accounts payable and accrued liabilities and the corresponding deferred cost is recorded in prepaid expenses and other current assets on the Consolidated Balance Sheets. A provision in the 2016 Federal Budget imposed a one year moratorium for 2017 on the collection of the Health Insurance Industry Tax.
54
Premium Stabilization Programs
The ACA included three programs designed to stabilize health insurance markets (Premium Stabilization Programs): a permanent risk adjustment program; a temporary risk corridors program; and a transitional reinsurance program (Reinsurance Program).
The risk-adjustment provisions apply to market reform compliant individual and small group plans in the commercial markets. Under the program, each covered member is assigned a risk score based upon demographic information and applicable diagnostic codes from the current year paid claims, in order to determine an average risk score for each plan in a particular state and market risk pool. Generally, a plan with a risk score that is less than the state’s average risk score will pay into the pool, while a plan with a risk score that is greater than the state’s average will receive money from the pool. The temporary risk corridors provisions are intended to limit the gains and losses of individual and small group qualified health plans. Plans are required to calculate the U.S. Department of Health and Human Services (HHS) risk corridor ratio of allowable costs to the defined target amount. Qualified health plans with ratios below 97% are required to make payments to HHS, while plans with ratios greater than 103% expect to receive funds from HHS. The Reinsurance Program and temporary risk corridors program expired at the end of 2016.
For the Premium Stabilization Programs, the Company records a receivable or payable as an adjustment to premium revenue based on year-to-date experience when the amounts are reasonably estimable and collection is reasonably assured. Final adjustments or recoverable amounts to the Premium Stabilization Programs are determined by HHS in the year following the policy year.
Recently Issued Accounting Standards
In February 2016, the Financial Accounting Standards Board (FASB) issued Accounting Standard Update (ASU) No. 2016-02, “Leases (Topic 842)” (ASU 2016-02). Under ASU 2016-02, an entity will be required to recognize assets and liabilities for the rights and obligations created by leases on the entity’s balance sheet for both finance and operating leases. For leases with a term of 12 months or less, an entity can elect to not recognize lease assets and lease liabilities and expense the lease over a straight-line basis for the term of the lease. ASU 2016-02 will require new disclosures that depict the amount, timing, and uncertainty of cash flows pertaining to an entity’s leases. Companies are required to adopt the new standard using a modified retrospective approach for annual and interim periods beginning after December 15, 2018. Early adoption of ASU 2016-02 is permitted. When adopted, the Company does not expect ASU 2016-02 to have a material impact on its results of operations, equity or cash flows. The impact of ASU 2016-02 on the Company’s consolidated financial position will be based on leases outstanding at the time of adoption.
In January 2016, the FASB issued ASU 2016-01, “Financial Instruments - Overall (Subtopic 825-10): Recognition and Measurement of Financial Assets and Financial Liabilities” (ASU 2016-01). The new guidance changes the current accounting related to (i) the classification and measurement of certain equity investments, (ii) the presentation of changes in the fair value of financial liabilities measured under the fair value option that are due to instrument-specific credit risk, and (iii) certain disclosures associated with the fair value of financial instruments. Most notably, ASU 2016-01 requires that equity investments, with certain exemptions, be measured at fair value with changes in fair value recognized in net income as opposed to other comprehensive income. The new guidance is effective for annual and interim reporting periods beginning after December 15, 2017. As of December 31, 2016, based on equity securities held, the Company does not expect ASU 2016-01 to have a material impact on its consolidated financial position, results of operations, equity or cash flows. The Company will continue to evaluate any changes in its mix of investments or market conditions and the related impact of ASU 2016-01.
In May 2014, the FASB issued ASU No. 2014-09, “Revenue from Contracts with Customers (Topic 606)” (ASU 2014-09) as modified by ASU No. 2015-14, “Revenue from Contracts with Customers (Topic 606): Deferral of the Effective Date,” ASU 2016-08, “Revenue from Contracts with Customers (Topic 606): Principal versus Agent Considerations (Reporting Revenue Gross versus Net),” ASU No. 2016-10, “Revenue from Contracts with Customers (Topic 606): Identifying Performance Obligations and Licensing,” ASU No. 2016-12, “Revenue from Contracts with Customers (Topic 606): Narrow-Scope Improvements and Practical Expedients,” and ASU 2016-20, “Revenue from Contracts with Customers (Topic 606): Technical Corrections and Improvements.” ASU 2014-09 will supersede existing revenue recognition standards with a single model unless those contracts are within the scope of other standards (e.g., an insurance entity’s insurance contracts). The revenue recognition principle in ASU 2014-09 is that an entity should recognize revenue to depict the transfer of goods or services to customers in an amount that reflects the consideration to which the entity expects to be entitled in exchange for those goods or services. In addition, new and enhanced disclosures will be required. Companies may adopt the new standard either using the full retrospective approach, a modified retrospective approach with practical expedients, or a cumulative effect upon adoption approach. The Company early adopted the new standard effective January 1, 2017, as allowed, using the modified retrospective approach. As the majority of the Company’s revenues are not subject to the new guidance, the adoption of ASU 2014-09 did not have a material impact on the Company’s consolidated financial position, results of operations, equity or cash flows.
Recently Adopted Accounting Standards
In March 2016, the FASB issued ASU No. 2016-09, “Compensation-Stock Compensation (Topic 718): Improvements to Employee Share-Based Payment Accounting” (ASU 2016-09). ASU 2016-09 modifies several aspects of the accounting for
55
share-based payment awards, including income tax consequences, and classification on the statement of cash flows. The Company early adopted ASU 2016-09 in the first quarter of 2016. The provisions of ASU 2016-09 related to the timing of when excess tax benefits are recognized, minimum statutory withholding requirements and forfeitures were adopted using a modified retrospective transition method by means of a cumulative-effect adjustment to equity as of January 1, 2016. The provisions of ASU 2016-09 related to the recognition of excess tax benefits in the income statement and classification in the statement of cash flows were adopted prospectively and the prior periods were not retrospectively adjusted. The adoption of ASU 2016-09 did not materially impact the Company’s consolidated financial position, results of operations, equity or cash flows.
In November 2015, the FASB issued ASU No. 2015-17, “Income Taxes (Topic 740): Balance Sheet Classification of Deferred Taxes” (ASU 2015-17). ASU 2015-17 requires entities to present deferred tax assets and deferred tax liabilities as noncurrent on the balance sheet. Prior to the issuance of ASU 2015-17, deferred taxes were required to be presented as a net current asset or liability and a net noncurrent asset or liability. The Company adopted ASU 2015-17 on a prospective basis in the first quarter of 2016 and the prior period was not retrospectively adjusted. The adoption of ASU 2015-17 did not impact the Company’s consolidated financial position, results of operations, equity or cash flows.
In May 2015, the FASB issued ASU No. 2015-09, “Financial Services - Insurance (Topic 944): Disclosures about Short-Duration Contracts” (ASU 2015-09). ASU 2015-09 requires insurance entities to provide additional disclosures about short-duration insurance liabilities, including incurred and paid medical costs information by year. The Company adopted the disclosure requirements of ASU 2015-09 and has included the new disclosures within
Notes 2
and
7
.
In April 2015, the FASB issued ASU No. 2015-03, “Interest-Imputation of Interest (Subtopic 835-30): Simplifying the Presentation of Debt Issuance Costs” (ASU 2015-03). ASU 2015-03 requires debt issuance costs to be presented as a reduction of the carrying amount of the related debt liability. Prior to the issuance of ASU 2015-03, debt issuance costs were required to be presented as an asset on the balance sheet. The Company adopted ASU 2015-03 on a retrospective basis, as required, in the first quarter of 2016. The Company reclassified
$129 million
and
$82 million
in debt issuance costs that were recorded in other assets to long-term debt, less current maturities on the Consolidated Balance Sheet as of December 31, 2015 and 2014, respectively.
The Company has determined that there have been no other recently adopted or issued accounting standards that had, or will have, a material impact on its Consolidated Financial Statements.
56
3. Investments
A summary of short-term and long-term investments by major security type is as follows:
|
(in millions)
|
Amortized
Cost
|
Gross
Unrealized
Gains
|
Gross
Unrealized
Losses
|
Fair
Value
|
||||||||||||
|
December 31, 2016
|
||||||||||||||||
|
Debt securities - available-for-sale:
|
||||||||||||||||
|
U.S. government and agency obligations
|
$
|
2,294
|
|
$
|
1
|
|
$
|
(31
|
)
|
$
|
2,264
|
|
||||
|
State and municipal obligations
|
7,120
|
|
40
|
|
(101
|
)
|
7,059
|
|
||||||||
|
Corporate obligations
|
10,944
|
|
41
|
|
(58
|
)
|
10,927
|
|
||||||||
|
U.S. agency mortgage-backed securities
|
2,963
|
|
7
|
|
(43
|
)
|
2,927
|
|
||||||||
|
Non-U.S. agency mortgage-backed securities
|
1,009
|
|
3
|
|
(10
|
)
|
1,002
|
|
||||||||
|
Total debt securities - available-for-sale
|
24,330
|
|
92
|
|
(243
|
)
|
24,179
|
|
||||||||
|
Equity securities
|
2,036
|
|
52
|
|
(47
|
)
|
2,041
|
|
||||||||
|
Debt securities - held-to-maturity:
|
||||||||||||||||
|
U.S. government and agency obligations
|
250
|
|
1
|
|
—
|
|
251
|
|
||||||||
|
State and municipal obligations
|
5
|
|
—
|
|
—
|
|
5
|
|
||||||||
|
Corporate obligations
|
238
|
|
—
|
|
—
|
|
238
|
|
||||||||
|
Total debt securities - held-to-maturity
|
493
|
|
1
|
|
—
|
|
494
|
|
||||||||
|
Total investments
|
$
|
26,859
|
|
$
|
145
|
|
$
|
(290
|
)
|
$
|
26,714
|
|
||||
|
December 31, 2015
|
||||||||||||||||
|
Debt securities - available-for-sale:
|
||||||||||||||||
|
U.S. government and agency obligations
|
$
|
1,982
|
|
$
|
1
|
|
$
|
(6
|
)
|
$
|
1,977
|
|
||||
|
State and municipal obligations
|
6,022
|
|
149
|
|
(3
|
)
|
6,168
|
|
||||||||
|
Corporate obligations
|
7,446
|
|
41
|
|
(81
|
)
|
7,406
|
|
||||||||
|
U.S. agency mortgage-backed securities
|
2,127
|
|
13
|
|
(16
|
)
|
2,124
|
|
||||||||
|
Non-U.S. agency mortgage-backed securities
|
962
|
|
5
|
|
(11
|
)
|
956
|
|
||||||||
|
Total debt securities - available-for-sale
|
18,539
|
|
209
|
|
(117
|
)
|
18,631
|
|
||||||||
|
Equity securities
|
1,638
|
|
58
|
|
(57
|
)
|
1,639
|
|
||||||||
|
Debt securities - held-to-maturity:
|
||||||||||||||||
|
U.S. government and agency obligations
|
163
|
|
1
|
|
—
|
|
164
|
|
||||||||
|
State and municipal obligations
|
8
|
|
—
|
|
—
|
|
8
|
|
||||||||
|
Corporate obligations
|
339
|
|
—
|
|
—
|
|
339
|
|
||||||||
|
Total debt securities - held-to-maturity
|
510
|
|
1
|
|
—
|
|
511
|
|
||||||||
|
Total investments
|
$
|
20,687
|
|
$
|
268
|
|
$
|
(174
|
)
|
$
|
20,781
|
|
||||
Nearly all of the Company’s investments in mortgage-backed securities were rated AAA as of
December 31, 2016
.
The amortized cost and fair value of debt securities as of
December 31, 2016
, by contractual maturity, were as follows:
|
Available-for-Sale
|
Held-to-Maturity
|
|||||||||||||||
|
(in millions)
|
Amortized
Cost
|
Fair
Value
|
Amortized
Cost |
Fair
Value |
||||||||||||
|
Due in one year or less
|
$
|
2,893
|
|
$
|
2,895
|
|
$
|
151
|
|
$
|
151
|
|
||||
|
Due after one year through five years
|
9,646
|
|
9,625
|
|
153
|
|
153
|
|
||||||||
|
Due after five years through ten years
|
5,706
|
|
5,645
|
|
124
|
|
124
|
|
||||||||
|
Due after ten years
|
2,113
|
|
2,085
|
|
65
|
|
66
|
|
||||||||
|
U.S. agency mortgage-backed securities
|
2,963
|
|
2,927
|
|
—
|
|
—
|
|
||||||||
|
Non-U.S. agency mortgage-backed securities
|
1,009
|
|
1,002
|
|
—
|
|
—
|
|
||||||||
|
Total debt securities
|
$
|
24,330
|
|
$
|
24,179
|
|
$
|
493
|
|
$
|
494
|
|
||||
57
The fair value of available-for-sale investments with gross unrealized losses by major security type and length of time that individual securities have been in a continuous unrealized loss position were as follows:
|
|
Less Than 12 Months
|
12 Months or Greater
|
Total
|
|||||||||||||||||||||
|
(in millions)
|
Fair
Value
|
Gross
Unrealized
Losses
|
Fair
Value
|
Gross
Unrealized Losses |
Fair
Value
|
Gross
Unrealized Losses |
||||||||||||||||||
|
December 31, 2016
|
||||||||||||||||||||||||
|
Debt securities - available-for-sale:
|
||||||||||||||||||||||||
|
U.S. government and agency obligations
|
$
|
1,794
|
|
$
|
(31
|
)
|
$
|
—
|
|
$
|
—
|
|
$
|
1,794
|
|
$
|
(31
|
)
|
||||||
|
State and municipal obligations
|
4,376
|
|
(101
|
)
|
—
|
|
—
|
|
4,376
|
|
(101
|
)
|
||||||||||||
|
Corporate obligations
|
5,128
|
|
(56
|
)
|
137
|
|
(2
|
)
|
5,265
|
|
(58
|
)
|
||||||||||||
|
U.S. agency mortgage-backed securities
|
2,247
|
|
(40
|
)
|
79
|
|
(3
|
)
|
2,326
|
|
(43
|
)
|
||||||||||||
|
Non-U.S. agency mortgage-backed securities
|
544
|
|
(7
|
)
|
97
|
|
(3
|
)
|
641
|
|
(10
|
)
|
||||||||||||
|
Total debt securities - available-for-sale
|
$
|
14,089
|
|
$
|
(235
|
)
|
$
|
313
|
|
$
|
(8
|
)
|
$
|
14,402
|
|
$
|
(243
|
)
|
||||||
|
Equity securities
|
$
|
93
|
|
$
|
(5
|
)
|
$
|
91
|
|
$
|
(42
|
)
|
$
|
184
|
|
$
|
(47
|
)
|
||||||
|
December 31, 2015
|
||||||||||||||||||||||||
|
Debt securities - available-for-sale:
|
||||||||||||||||||||||||
|
U.S. government and agency obligations
|
$
|
1,473
|
|
$
|
(6
|
)
|
$
|
—
|
|
$
|
—
|
|
$
|
1,473
|
|
$
|
(6
|
)
|
||||||
|
State and municipal obligations
|
650
|
|
(3
|
)
|
—
|
|
—
|
|
650
|
|
(3
|
)
|
||||||||||||
|
Corporate obligations
|
4,629
|
|
(63
|
)
|
339
|
|
(18
|
)
|
4,968
|
|
(81
|
)
|
||||||||||||
|
U.S. agency mortgage-backed securities
|
1,304
|
|
(12
|
)
|
116
|
|
(4
|
)
|
1,420
|
|
(16
|
)
|
||||||||||||
|
Non-U.S. agency mortgage-backed securities
|
593
|
|
(7
|
)
|
127
|
|
(4
|
)
|
720
|
|
(11
|
)
|
||||||||||||
|
Total debt securities - available-for-sale
|
$
|
8,649
|
|
$
|
(91
|
)
|
$
|
582
|
|
$
|
(26
|
)
|
$
|
9,231
|
|
$
|
(117
|
)
|
||||||
|
Equity securities
|
$
|
112
|
|
$
|
(11
|
)
|
$
|
89
|
|
$
|
(46
|
)
|
$
|
201
|
|
$
|
(57
|
)
|
||||||
The Company’s unrealized losses from all securities as of
December 31, 2016
were generated from approximately
12,000
positions out of a total of
27,000
positions. The Company believes that it will collect the principal and interest due on its debt securities that have an amortized cost in excess of fair value. The unrealized losses were primarily caused by interest rate increases and not by unfavorable changes in the credit quality associated with these securities. At each reporting period, the Company evaluates securities for impairment when the fair value of the investment is less than its amortized cost. The Company evaluated the underlying credit quality and credit ratings of the issuers, noting no significant deterioration since purchase. As of
December 31, 2016
, the Company did not have the intent to sell any of the securities in an unrealized loss position. Therefore, the Company believes these losses to be temporary.
The Company’s investments in equity securities consist of investments in Brazilian real denominated fixed-income funds, employee savings plan related investments, venture capital funds and dividend paying stocks. The Company evaluated its investments in equity securities for severity and duration of unrealized loss, overall market volatility and other market factors.
Net realized gains reclassified out of accumulated other comprehensive income were from the following sources:
|
For the Years Ended December 31,
|
||||||||||||
|
(in millions)
|
2016
|
2015
|
2014
|
|||||||||
|
Total other-than-temporary impairment recognized in earnings
|
$
|
(45
|
)
|
$
|
(22
|
)
|
$
|
(26
|
)
|
|||
|
Gross realized losses from sales
|
(44
|
)
|
(28
|
)
|
(47
|
)
|
||||||
|
Gross realized gains from sales
|
255
|
|
191
|
|
284
|
|
||||||
|
Net realized gains (included in investment and other income on the Consolidated Statements of Operations)
|
166
|
|
141
|
|
211
|
|
||||||
|
Income tax effect (included in provision for income taxes on the Consolidated Statements of Operations)
|
(60
|
)
|
(53
|
)
|
(77
|
)
|
||||||
|
Realized gains, net of taxes
|
$
|
106
|
|
$
|
88
|
|
$
|
134
|
|
|||
58
4. Fair Value
Certain assets and liabilities are measured at fair value in the Consolidated Financial Statements or have fair values disclosed in the Notes to the Consolidated Financial Statements. These assets and liabilities are classified into one of three levels of a hierarchy defined by GAAP. In instances in which the inputs used to measure fair value fall into different levels of the fair value hierarchy, the fair value measurement is categorized in its entirety based on the lowest level input that is significant to the fair value measurement in its entirety. The Company’s assessment of the significance of a particular item to the fair value measurement in its entirety requires judgment, including the consideration of inputs specific to the asset or liability.
The fair value hierarchy is summarized as follows:
Level 1
— Quoted prices (unadjusted) for identical assets/liabilities in active markets.
Level 2
— Other observable inputs, either directly or indirectly, including:
|
•
|
Quoted prices for similar assets/liabilities in active markets;
|
|
•
|
Quoted prices for identical or similar assets/liabilities in inactive markets (e.g., few transactions, limited information, noncurrent prices, high variability over time);
|
|
•
|
Inputs other than quoted prices that are observable for the asset/liability (e.g., interest rates, yield curves, implied volatilities, credit spreads); and
|
|
•
|
Inputs that are corroborated by other observable market data.
|
Level 3
— Unobservable inputs that cannot be corroborated by observable market data.
Transfers between levels, if any, are recorded as of the beginning of the reporting period in which the transfer occurs; there was
no
transfer between Levels 1, 2 or 3 of any financial assets or liabilities during the years ended
December 31, 2016
or
2015
.
Nonfinancial assets and liabilities or financial assets and liabilities that are measured at fair value on a nonrecurring basis are subject to fair value adjustments only in certain circumstances, such as when the Company records an impairment. There were no significant fair value adjustments for these assets and liabilities recorded during the years ended
December 31, 2016
or
2015
.
The following methods and assumptions were used to estimate the fair value and determine the fair value hierarchy classification of each class of financial instrument included in the tables below:
Cash and Cash Equivalents.
The carrying value of cash and cash equivalents approximates fair value as maturities are less than three months. Fair values of cash equivalent instruments that do not trade on a regular basis in active markets are classified as Level 2.
Debt and Equity Securities.
Fair values of debt and equity securities are based on quoted market prices, where available. The Company obtains one price for each security primarily from a third-party pricing service (pricing service), which generally uses quoted or other observable inputs for the determination of fair value. The pricing service normally derives the security prices through recently reported trades for identical or similar securities, and, if necessary, makes adjustments through the reporting date based upon available observable market information. For securities not actively traded, the pricing service may use quoted market prices of comparable instruments or discounted cash flow analyses, incorporating inputs that are currently observable in the markets for similar securities. Inputs that are often used in the valuation methodologies include, but are not limited to, benchmark yields, credit spreads, default rates, prepayment speeds and nonbinding broker quotes. As the Company is responsible for the determination of fair value, it performs quarterly analyses on the prices received from the pricing service to determine whether the prices are reasonable estimates of fair value. Specifically, the Company compares the prices received from the pricing service to prices reported by a secondary pricing source, such as its custodian, its investment consultant and third-party investment advisors. Additionally, the Company compares changes in the reported market values and returns to relevant market indices to test the reasonableness of the reported prices. The Company’s internal price verification procedures and reviews of fair value methodology documentation provided by independent pricing services have not historically resulted in adjustment in the prices obtained from the pricing service.
Fair values of debt securities that do not trade on a regular basis in active markets but are priced using other observable inputs are classified as Level 2.
Fair value estimates for Level 1 and Level 2 equity securities are based on quoted market prices for actively traded equity securities and/or other market data for the same or comparable instruments and transactions in establishing the prices.
The fair values of Level 3 investments in venture capital portfolios are estimated using a market valuation technique that relies heavily on management assumptions and qualitative observations. Under the market approach, the fair values of the Company’s various venture capital investments are computed using limited quantitative and qualitative observations of activity for similar companies in the current market. The Company’s market modeling utilizes, as applicable, transactions for comparable companies in similar industries that also have similar revenue and growth characteristics and preferences in their capital
59
structure. Key significant unobservable inputs in the market technique include implied earnings before interest, taxes, depreciation and amortization (EBITDA) multiples and revenue multiples. Additionally, the fair values of certain of the Company’s venture capital securities are based on recent transactions in inactive markets for identical or similar securities. Significant changes in any of these inputs could result in significantly lower or higher fair value measurements.
Throughout the procedures discussed above in relation to the Company’s processes for validating third-party pricing information, the Company validates the understanding of assumptions and inputs used in security pricing and determines the proper classification in the hierarchy based on that understanding.
Assets Under Management.
Assets under management consists of debt securities and other investments held to fund costs associated with the AARP Program and are priced and classified using the same methodologies as the Company’s investments in debt and equity securities.
Other Assets.
The fair values of the Company’s other assets are estimated and classified using the same methodologies as the Company’s investments in debt securities.
Interest Rate Swaps.
Fair values of the Company’s swaps are estimated using the terms of the swaps and publicly available information, including market yield curves. Because the swaps are unique and not actively traded but are valued using other observable inputs, the fair values are classified as Level 2.
Long-Term Debt.
The fair values of the Company’s long-term debt are estimated and classified using the same methodologies as the Company’s investments in debt securities.
60
The following table presents a summary of fair value measurements by level and carrying values for items measured at fair value on a recurring basis in the Consolidated Balance Sheets:
|
(in millions)
|
Quoted Prices
in Active
Markets
(Level 1)
|
Other
Observable
Inputs
(Level 2)
|
Unobservable
Inputs
(Level 3)
|
Total
Fair and Carrying
Value
|
||||||||||||
|
December 31, 2016
|
||||||||||||||||
|
Cash and cash equivalents
|
$
|
10,386
|
|
$
|
44
|
|
$
|
—
|
|
$
|
10,430
|
|
||||
|
Debt securities - available-for-sale:
|
||||||||||||||||
|
U.S. government and agency obligations
|
2,017
|
|
247
|
|
—
|
|
2,264
|
|
||||||||
|
State and municipal obligations
|
—
|
|
7,059
|
|
—
|
|
7,059
|
|
||||||||
|
Corporate obligations
|
21
|
|
10,804
|
|
102
|
|
10,927
|
|
||||||||
|
U.S. agency mortgage-backed securities
|
—
|
|
2,927
|
|
—
|
|
2,927
|
|
||||||||
|
Non-U.S. agency mortgage-backed securities
|
—
|
|
1,002
|
|
—
|
|
1,002
|
|
||||||||
|
Total debt securities - available-for-sale
|
2,038
|
|
22,039
|
|
102
|
|
24,179
|
|
||||||||
|
Equity securities
|
1,591
|
|
13
|
|
437
|
|
2,041
|
|
||||||||
|
Assets under management
|
1,064
|
|
2,041
|
|
—
|
|
3,105
|
|
||||||||
|
Interest rate swap assets
|
—
|
|
55
|
|
—
|
|
55
|
|
||||||||
|
Total assets at fair value
|
|
$
|
15,079
|
|
$
|
24,192
|
|
$
|
539
|
|
$
|
39,810
|
|
|||
|
Percentage of total assets at fair value
|
38
|
%
|
61
|
%
|
1
|
%
|
100
|
%
|
||||||||
|
Interest rate swap liabilities
|
$
|
—
|
|
$
|
14
|
|
$
|
—
|
|
$
|
14
|
|
||||
|
December 31, 2015
|
||||||||||||||||
|
Cash and cash equivalents
|
$
|
10,906
|
|
$
|
17
|
|
$
|
—
|
|
$
|
10,923
|
|
||||
|
Debt securities - available-for-sale:
|
||||||||||||||||
|
U.S. government and agency obligations
|
1,779
|
|
198
|
|
—
|
|
1,977
|
|
||||||||
|
State and municipal obligations
|
—
|
|
6,168
|
|
—
|
|
6,168
|
|
||||||||
|
Corporate obligations
|
5
|
|
7,308
|
|
93
|
|
7,406
|
|
||||||||
|
U.S. agency mortgage-backed securities
|
—
|
|
2,124
|
|
—
|
|
2,124
|
|
||||||||
|
Non-U.S. agency mortgage-backed securities
|
—
|
|
951
|
|
5
|
|
956
|
|
||||||||
|
Total debt securities - available-for-sale
|
1,784
|
|
16,749
|
|
98
|
|
18,631
|
|
||||||||
|
Equity securities
|
1,223
|
|
14
|
|
402
|
|
1,639
|
|
||||||||
|
Assets under management
|
832
|
|
2,166
|
|
—
|
|
2,998
|
|
||||||||
|
Interest rate swap assets
|
—
|
|
93
|
|
—
|
|
93
|
|
||||||||
|
Total assets at fair value
|
$
|
14,745
|
|
$
|
19,039
|
|
$
|
500
|
|
$
|
34,284
|
|
||||
|
Percentage of total assets at fair value
|
43
|
%
|
56
|
%
|
1
|
%
|
100
|
%
|
||||||||
|
Interest rate swap liabilities
|
$
|
—
|
|
$
|
11
|
|
$
|
—
|
|
$
|
11
|
|
||||
61
The following table presents a summary of fair value measurements by level and carrying values for certain financial instruments not measured at fair value on a recurring basis in the Consolidated Balance Sheets:
|
(in millions)
|
Quoted Prices
in Active
Markets
(Level 1)
|
Other
Observable
Inputs
(Level 2)
|
Unobservable
Inputs
(Level 3)
|
Total
Fair
Value
|
Total Carrying Value
|
|||||||||||||||
|
December 31, 2016
|
||||||||||||||||||||
|
Debt securities - held-to-maturity:
|
||||||||||||||||||||
|
U.S. government and agency obligations
|
$
|
251
|
|
$
|
—
|
|
$
|
—
|
|
$
|
251
|
|
$
|
250
|
|
|||||
|
State and municipal obligations
|
—
|
|
—
|
|
5
|
|
5
|
|
5
|
|
||||||||||
|
Corporate obligations
|
20
|
|
8
|
|
210
|
|
238
|
|
238
|
|
||||||||||
|
Total debt securities - held-to-maturity
|
$
|
271
|
|
$
|
8
|
|
$
|
215
|
|
$
|
494
|
|
$
|
493
|
|
|||||
|
Other assets
|
$
|
—
|
|
$
|
476
|
|
$
|
—
|
|
$
|
476
|
|
$
|
471
|
|
|||||
|
Long-term debt and other financing obligations
|
$
|
—
|
|
$
|
31,295
|
|
$
|
—
|
|
$
|
31,295
|
|
$
|
29,337
|
|
|||||
|
December 31, 2015
|
||||||||||||||||||||
|
Debt securities - held-to-maturity:
|
||||||||||||||||||||
|
U.S. government and agency obligations
|
$
|
164
|
|
$
|
—
|
|
$
|
—
|
|
$
|
164
|
|
$
|
163
|
|
|||||
|
State and municipal obligations
|
—
|
|
—
|
|
8
|
|
8
|
|
8
|
|
||||||||||
|
Corporate obligations
|
91
|
|
10
|
|
238
|
|
339
|
|
339
|
|
||||||||||
|
Total debt securities - held-to-maturity
|
$
|
255
|
|
$
|
10
|
|
$
|
246
|
|
$
|
511
|
|
$
|
510
|
|
|||||
|
Other assets
|
$
|
—
|
|
$
|
493
|
|
$
|
—
|
|
$
|
493
|
|
$
|
500
|
|
|||||
|
Long-term debt and other financing obligations
|
$
|
—
|
|
$
|
29,455
|
|
$
|
—
|
|
$
|
29,455
|
|
$
|
27,978
|
|
|||||
The carrying amounts reported on the Consolidated Balance Sheets for other current financial assets and liabilities approximate fair value because of their short-term nature. These assets and liabilities are not listed in the table above.
A reconciliation of the beginning and ending balances of assets measured at fair value on a recurring basis using Level 3 inputs is as follows:
|
|
December 31, 2016
|
December 31, 2015
|
December 31, 2014
|
|||||||||||||||||||||||||||||||||
|
(in millions)
|
Debt
Securities
|
Equity
Securities
|
Total
|
Debt
Securities
|
Equity
Securities
|
Total
|
Debt
Securities
|
Equity
Securities
|
Total
|
|||||||||||||||||||||||||||
|
Balance at beginning of period
|
$
|
98
|
|
$
|
402
|
|
$
|
500
|
|
$
|
74
|
|
$
|
310
|
|
$
|
384
|
|
$
|
42
|
|
$
|
269
|
|
$
|
311
|
|
|||||||||
|
Purchases
|
12
|
|
100
|
|
112
|
|
27
|
|
106
|
|
133
|
|
32
|
|
105
|
|
137
|
|
||||||||||||||||||
|
Sales
|
(9
|
)
|
(29
|
)
|
(38
|
)
|
(4
|
)
|
(24
|
)
|
(28
|
)
|
(1
|
)
|
(180
|
)
|
(181
|
)
|
||||||||||||||||||
|
Net unrealized gains (losses) in accumulated other comprehensive income
|
1
|
|
(13
|
)
|
(12
|
)
|
2
|
|
5
|
|
7
|
|
1
|
|
6
|
|
7
|
|
||||||||||||||||||
|
Net realized (losses) gains in investment and other income
|
—
|
|
(23
|
)
|
(23
|
)
|
(1
|
)
|
5
|
|
4
|
|
—
|
|
110
|
|
110
|
|
||||||||||||||||||
|
Balance at end of period
|
$
|
102
|
|
$
|
437
|
|
$
|
539
|
|
$
|
98
|
|
$
|
402
|
|
$
|
500
|
|
$
|
74
|
|
$
|
310
|
|
$
|
384
|
|
|||||||||
62
The following table presents quantitative information regarding unobservable inputs that were significant to the valuation of assets measured at fair value on a recurring basis using Level 3 inputs:
|
Range
|
||||||||||||
|
(in millions)
|
Fair Value
|
Valuation Technique
|
Unobservable Input
|
Low
|
High
|
|||||||
|
December 31, 2016
|
||||||||||||
|
Equity securities:
|
||||||||||||
|
Venture capital portfolios
|
$
|
404
|
|
Market approach - comparable companies
|
Revenue multiple
|
1.0
|
6.0
|
|||||
|
EBITDA
multiple
|
8.0
|
12.0
|
||||||||||
|
33
|
|
Market approach - recent transactions
|
Inactive market transactions
|
N/A
|
N/A
|
|||||||
|
Total equity securities
|
$
|
437
|
|
|||||||||
Also included in the Company’s assets measured at fair value on a recurring basis using Level 3 inputs were
$102 million
of available-for-sale debt securities as of
December 31, 2016
, which were not significant.
5. Property, Equipment and Capitalized Software
A summary of property, equipment and capitalized software is as follows:
|
(in millions)
|
December 31, 2016
|
December 31, 2015
|
||||||
|
Land and improvements
|
$
|
324
|
|
$
|
237
|
|
||
|
Buildings and improvements
|
3,148
|
|
2,420
|
|
||||
|
Computer equipment
|
2,021
|
|
1,945
|
|
||||
|
Furniture and fixtures
|
999
|
|
790
|
|
||||
|
Less accumulated depreciation
|
(2,621
|
)
|
(2,163
|
)
|
||||
|
Property and equipment, net
|
3,871
|
|
3,229
|
|
||||
|
Capitalized software
|
3,158
|
|
2,642
|
|
||||
|
Less accumulated amortization
|
(1,128
|
)
|
(1,010
|
)
|
||||
|
Capitalized software, net
|
2,030
|
|
1,632
|
|
||||
|
Total property, equipment and capitalized software, net
|
$
|
5,901
|
|
$
|
4,861
|
|
||
Depreciation expense for property and equipment for the years ended
December 31, 2016
,
2015
and 2014 was
$698 million
,
$613 million
and
$532 million
, respectively. Amortization expense for capitalized software for the years ended
December 31, 2016
,
2015
and 2014 was
$475 million
,
$430 million
and
$422 million
, respectively.
6. Goodwill and Other Intangible Assets
Changes in the carrying amount of goodwill, by reportable segment, were as follows:
|
(in millions)
|
UnitedHealthcare
|
OptumHealth
|
OptumInsight
|
OptumRx
|
Consolidated
|
|||||||||||||||
|
Balance at January 1, 2015
|
$
|
24,030
|
|
$
|
3,834
|
|
$
|
4,236
|
|
$
|
840
|
|
$
|
32,940
|
|
|||||
|
Acquisitions
|
128
|
|
1,817
|
|
89
|
|
10,732
|
|
12,766
|
|
||||||||||
|
Foreign currency effects and adjustments, net
|
(1,233
|
)
|
9
|
|
(29
|
)
|
—
|
|
(1,253
|
)
|
||||||||||
|
Balance at December 31, 2015
|
22,925
|
|
5,660
|
|
4,296
|
|
11,572
|
|
44,453
|
|
||||||||||
|
Acquisitions
|
526
|
|
683
|
|
—
|
|
1,387
|
|
2,596
|
|
||||||||||
|
Foreign currency effects and adjustments, net
|
403
|
|
(21
|
)
|
153
|
|
—
|
|
535
|
|
||||||||||
|
Balance at December 31, 2016
|
$
|
23,854
|
|
$
|
6,322
|
|
$
|
4,449
|
|
$
|
12,959
|
|
$
|
47,584
|
|
|||||
During the third quarter of 2015, the Company acquired all of the outstanding common shares of Catamaran Corporation and funded Catamaran’s payoff of its outstanding debt and credit facility for a total of
$14.3 billion
in cash. This combination diversified OptumRx’s customer and business mix and enhanced OptumRx’s technology capabilities and flexible service offerings. The total consideration exceeded the estimated fair value of the net tangible assets acquired by
$16.0 billion
, of which
$5.4 billion
has been allocated to finite-lived intangible assets and
$10.6 billion
to goodwill. The goodwill is not deductible for income tax purposes.
63
The gross carrying value, accumulated amortization and net carrying value of other intangible assets were as follows:
|
|
December 31, 2016
|
December 31, 2015
|
||||||||||||||||||||||
|
(in millions)
|
Gross Carrying Value
|
Accumulated Amortization
|
Net Carrying Value
|
Gross Carrying Value
|
Accumulated Amortization
|
Net Carrying Value
|
||||||||||||||||||
|
Customer-related
|
$
|
10,942
|
|
$
|
(3,416
|
)
|
$
|
7,526
|
|
$
|
10,270
|
|
$
|
(2,796
|
)
|
$
|
7,474
|
|
||||||
|
Trademarks and technology
|
720
|
|
(323
|
)
|
397
|
|
682
|
|
(249
|
)
|
433
|
|
||||||||||||
|
Trademarks - indefinite-lived
|
468
|
|
—
|
|
468
|
|
358
|
|
—
|
|
358
|
|
||||||||||||
|
Other
|
258
|
|
(108
|
)
|
150
|
|
209
|
|
(83
|
)
|
126
|
|
||||||||||||
|
Total
|
$
|
12,388
|
|
$
|
(3,847
|
)
|
$
|
8,541
|
|
$
|
11,519
|
|
$
|
(3,128
|
)
|
$
|
8,391
|
|
||||||
The acquisition date fair values and weighted-average useful lives assigned to finite-lived intangible assets acquired in business combinations consisted of the following by year of acquisition:
|
|
2016
|
2015
|
||||||||||
|
(in millions, except years)
|
Fair Value
|
Weighted-Average Useful Life
|
Fair Value
|
Weighted-Average Useful Life
|
||||||||
|
Customer-related
|
$
|
785
|
|
17 years
|
$
|
5,518
|
|
19 years
|
||||
|
Trademarks and technology
|
82
|
|
4 years
|
194
|
|
4 years
|
||||||
|
Other
|
22
|
|
5 years
|
—
|
|
|
||||||
|
Total acquired finite-lived intangible assets
|
$
|
889
|
|
16 years
|
$
|
5,712
|
|
19 years
|
||||
Estimated full year amortization expense relating to intangible assets for each of the next five years ending December 31 is as follows:
|
(in millions)
|
||||
|
2017
|
$
|
865
|
|
|
|
2018
|
755
|
|
||
|
2019
|
679
|
|
||
|
2020
|
596
|
|
||
|
2021
|
536
|
|
||
Amortization expense relating to intangible assets for the years ended
December 31, 2016
,
2015
and 2014 was
$882 million
,
$650 million
and
$524 million
, respectively.
64
7. Medical Costs Payable
The following table shows the components of the change in medical costs payable for the years ended December 31:
|
(in millions)
|
2016
|
2015
|
2014
|
|||||||||
|
Medical costs payable, beginning of period
|
$
|
14,330
|
|
$
|
12,040
|
|
$
|
11,575
|
|
|||
|
Reported medical costs:
|
||||||||||||
|
Current year
|
117,258
|
|
104,195
|
|
94,053
|
|
||||||
|
Prior years
|
(220
|
)
|
(320
|
)
|
(420
|
)
|
||||||
|
Total reported medical costs
|
117,038
|
|
103,875
|
|
93,633
|
|
||||||
|
Medical payments:
|
||||||||||||
|
Payments for current year
|
(101,696
|
)
|
(90,630
|
)
|
(82,750
|
)
|
||||||
|
Payments for prior years
|
(13,281
|
)
|
(10,955
|
)
|
(10,418
|
)
|
||||||
|
Total medical payments
|
(114,977
|
)
|
(101,585
|
)
|
(93,168
|
)
|
||||||
|
Medical costs payable, end of period
|
$
|
16,391
|
|
$
|
14,330
|
|
$
|
12,040
|
|
|||
For the years ended
December 31, 2016
, 2015 and 2014 the medical cost reserve development included no individual factors that were material
.
Medical costs payable included IBNR of
$11.6 billion
and
$9.8 billion
at December 31, 2016 and 2015, respectively. Substantially all of the IBNR balance as of
December 31, 2016
relates to the current year. The following is information about incurred and paid medical cost development as of
December 31, 2016
:
|
Net Incurred Medical Costs
|
||||||||
|
(in millions)
|
For the Years ended December 31,
|
|||||||
|
Year
|
2015
|
2016
|
||||||
|
2015
|
$
|
104,195
|
|
$
|
103,973
|
|
||
|
2016
|
117,258
|
|
||||||
|
Total
|
$
|
221,231
|
|
|||||
|
Net Cumulative Medical Payments
|
||||||||
|
(in millions)
|
For the Years ended December 31,
|
|||||||
|
Year
|
2015
|
2016
|
||||||
|
2015
|
$
|
(90,630
|
)
|
$
|
(103,885
|
)
|
||
|
2016
|
(101,696
|
)
|
||||||
|
Total
|
(205,581
|
)
|
||||||
|
Net remaining outstanding liabilities prior to 2015
|
741
|
|
||||||
|
Total medical costs payable
|
$
|
16,391
|
|
|||||
65
8. Commercial Paper and Long-Term Debt
Commercial paper, term loan and senior unsecured long-term debt consisted of the following:
|
|
December 31, 2016
|
December 31, 2015
|
||||||||||||||||||||||
|
(in millions, except percentages)
|
Par
Value
|
Carrying
Value
|
Fair
Value
|
Par
Value
|
Carrying
Value (a)
|
Fair
Value
|
||||||||||||||||||
|
Commercial paper
|
$
|
3,633
|
|
$
|
3,633
|
|
$
|
3,633
|
|
$
|
3,987
|
|
$
|
3,987
|
|
$
|
3,987
|
|
||||||
|
Floating rate term loan due July 2016
|
—
|
|
—
|
|
—
|
|
1,500
|
|
1,500
|
|
1,500
|
|
||||||||||||
|
5.375% notes due March 2016
|
—
|
|
—
|
|
—
|
|
601
|
|
605
|
|
606
|
|
||||||||||||
|
1.875% notes due November 2016
|
—
|
|
—
|
|
—
|
|
400
|
|
400
|
|
403
|
|
||||||||||||
|
5.360% notes due November 2016
|
—
|
|
—
|
|
—
|
|
95
|
|
95
|
|
98
|
|
||||||||||||
|
Floating rate notes due January 2017
|
750
|
|
750
|
|
750
|
|
750
|
|
749
|
|
751
|
|
||||||||||||
|
6.000% notes due June 2017
|
441
|
|
446
|
|
450
|
|
441
|
|
458
|
|
469
|
|
||||||||||||
|
1.450% notes due July 2017
|
750
|
|
750
|
|
751
|
|
750
|
|
749
|
|
750
|
|
||||||||||||
|
1.400% notes due October 2017
|
625
|
|
624
|
|
626
|
|
625
|
|
624
|
|
624
|
|
||||||||||||
|
6.000% notes due November 2017
|
156
|
|
159
|
|
163
|
|
156
|
|
162
|
|
168
|
|
||||||||||||
|
1.400% notes due December 2017
|
750
|
|
751
|
|
750
|
|
750
|
|
751
|
|
748
|
|
||||||||||||
|
6.000% notes due February 2018
|
1,100
|
|
1,107
|
|
1,153
|
|
1,100
|
|
1,114
|
|
1,196
|
|
||||||||||||
|
1.900% notes due July 2018
|
1,500
|
|
1,496
|
|
1,507
|
|
1,500
|
|
1,494
|
|
1,505
|
|
||||||||||||
|
1.700% notes due February 2019
|
750
|
|
748
|
|
748
|
|
—
|
|
—
|
|
—
|
|
||||||||||||
|
1.625% notes due March 2019
|
500
|
|
501
|
|
498
|
|
500
|
|
502
|
|
494
|
|
||||||||||||
|
2.300% notes due December 2019
|
500
|
|
498
|
|
504
|
|
500
|
|
499
|
|
502
|
|
||||||||||||
|
2.700% notes due July 2020
|
1,500
|
|
1,495
|
|
1,523
|
|
1,500
|
|
1,493
|
|
1,516
|
|
||||||||||||
|
3.875% notes due October 2020
|
450
|
|
450
|
|
474
|
|
450
|
|
452
|
|
476
|
|
||||||||||||
|
4.700% notes due February 2021
|
400
|
|
409
|
|
433
|
|
400
|
|
413
|
|
438
|
|
||||||||||||
|
2.125% notes due March 2021
|
750
|
|
745
|
|
741
|
|
—
|
|
—
|
|
—
|
|
||||||||||||
|
3.375% notes due November 2021
|
500
|
|
497
|
|
519
|
|
500
|
|
500
|
|
517
|
|
||||||||||||
|
2.875% notes due December 2021
|
750
|
|
748
|
|
760
|
|
750
|
|
753
|
|
760
|
|
||||||||||||
|
2.875% notes due March 2022
|
1,100
|
|
1,057
|
|
1,114
|
|
1,100
|
|
1,059
|
|
1,099
|
|
||||||||||||
|
3.350% notes due July 2022
|
1,000
|
|
995
|
|
1,030
|
|
1,000
|
|
994
|
|
1,023
|
|
||||||||||||
|
0.000% notes due November 2022
|
15
|
|
11
|
|
12
|
|
15
|
|
10
|
|
11
|
|
||||||||||||
|
2.750% notes due February 2023
|
625
|
|
609
|
|
622
|
|
625
|
|
611
|
|
613
|
|
||||||||||||
|
2.875% notes due March 2023
|
750
|
|
771
|
|
753
|
|
750
|
|
781
|
|
742
|
|
||||||||||||
|
3.750% notes due July 2025
|
2,000
|
|
1,986
|
|
2,070
|
|
2,000
|
|
1,985
|
|
2,062
|
|
||||||||||||
|
3.100% notes due March 2026
|
1,000
|
|
994
|
|
986
|
|
—
|
|
—
|
|
—
|
|
||||||||||||
|
3.450% notes due January 2027
|
750
|
|
745
|
|
762
|
|
—
|
|
—
|
|
—
|
|
||||||||||||
|
4.625% notes due July 2035
|
1,000
|
|
991
|
|
1,090
|
|
1,000
|
|
991
|
|
1,038
|
|
||||||||||||
|
5.800% notes due March 2036
|
850
|
|
837
|
|
1,034
|
|
850
|
|
838
|
|
1,003
|
|
||||||||||||
|
6.500% notes due June 2037
|
500
|
|
491
|
|
643
|
|
500
|
|
492
|
|
628
|
|
||||||||||||
|
6.625% notes due November 2037
|
650
|
|
640
|
|
850
|
|
650
|
|
641
|
|
829
|
|
||||||||||||
|
6.875% notes due February 2038
|
1,100
|
|
1,075
|
|
1,497
|
|
1,100
|
|
1,076
|
|
1,439
|
|
||||||||||||
|
5.700% notes due October 2040
|
300
|
|
296
|
|
366
|
|
300
|
|
296
|
|
348
|
|
||||||||||||
|
5.950% notes due February 2041
|
350
|
|
345
|
|
437
|
|
350
|
|
345
|
|
416
|
|
||||||||||||
|
4.625% notes due November 2041
|
600
|
|
588
|
|
634
|
|
600
|
|
588
|
|
609
|
|
||||||||||||
|
4.375% notes due March 2042
|
502
|
|
483
|
|
509
|
|
502
|
|
483
|
|
493
|
|
||||||||||||
|
3.950% notes due October 2042
|
625
|
|
606
|
|
609
|
|
625
|
|
606
|
|
582
|
|
||||||||||||
|
4.250% notes due March 2043
|
750
|
|
734
|
|
765
|
|
750
|
|
734
|
|
728
|
|
||||||||||||
|
4.750% notes due July 2045
|
2,000
|
|
1,972
|
|
2,203
|
|
2,000
|
|
1,971
|
|
2,107
|
|
||||||||||||
|
4.200% notes due January 2047
|
750
|
|
737
|
|
759
|
|
—
|
|
—
|
|
—
|
|
||||||||||||
|
Total commercial paper, term loan and long-term debt
|
$
|
33,022
|
|
$
|
32,770
|
|
$
|
34,728
|
|
$
|
31,972
|
|
$
|
31,801
|
|
$
|
33,278
|
|
||||||
|
(a)
|
In the first quarter of 2016, the Company adopted ASU 2015-03, retrospectively as required. See
Note 2
for more information on the adoption of ASU 2015-03.
|
The Company’s long-term debt obligations also included
$200 million
and
$164 million
of other financing obligations, of which
$80 million
and
$47 million
were current as of
December 31, 2016
and 2015, respectively.
66
Maturities of commercial paper and long-term debt for the years ending December 31 are as follows:
|
(in millions)
|
||||
|
2017
|
$
|
7,185
|
|
|
|
2018
|
2,622
|
|
||
|
2019
|
1,769
|
|
||
|
2020
|
1,955
|
|
||
|
2021
|
2,407
|
|
||
|
Thereafter
|
17,284
|
|
||
Commercial Paper and Revolving Bank Credit Facilities
Commercial paper consists of short-duration, senior unsecured debt privately placed on a discount basis through broker-dealers. As of
December 31, 2016
, the Company’s outstanding commercial paper had a weighted-average annual interest rate of
0.9%
.
The Company has
$3.0 billion
five-year,
$2.0 billion
three-year and
$1.0 billion
364-day revolving bank credit facilities with
23
banks, which mature in
December 2021
,
December 2019
, and
December 2017
, respectively. These facilities provide liquidity support for the Company’s commercial paper program and are available for general corporate purposes. As of
December 31, 2016
, no amounts had been drawn on any of the bank credit facilities. The annual interest rates, which are variable based on term, are calculated based on the London Interbank Offered Rate (LIBOR) plus a credit spread based on the Company’s senior unsecured credit ratings. If amounts had been drawn on the bank credit facilities as of
December 31, 2016
, annual interest rates would have ranged from
1.6%
to
2.2%
.
Debt Covenants
The Company’s bank credit facilities contain various covenants, including requiring the Company to maintain a debt to debt-plus-shareholders’ equity ratio of not more than
55%
. The Company was in compliance with its debt covenants as of
December 31, 2016
.
9. Income Taxes
The current income tax provision reflects the tax consequences of revenues and expenses currently taxable or deductible on various income tax returns for the year reported. The deferred income tax provision or benefit generally reflects the net change in deferred income tax assets and liabilities during the year, excluding any deferred income tax assets and liabilities of acquired businesses. The components of the provision for income taxes for the years ended
December 31 are as follows:
|
(in millions)
|
2016
|
2015
|
2014
|
|||||||||
|
Current Provision:
|
|
|
||||||||||
|
Federal
|
$
|
4,397
|
|
$
|
4,155
|
|
$
|
3,883
|
|
|||
|
State and local
|
312
|
|
281
|
|
271
|
|
||||||
|
Total current provision
|
4,709
|
|
4,436
|
|
4,154
|
|
||||||
|
Deferred provision (benefit)
|
81
|
|
(73
|
)
|
(117
|
)
|
||||||
|
Total provision for income taxes
|
$
|
4,790
|
|
$
|
4,363
|
|
$
|
4,037
|
|
|||
The reconciliation of the tax provision at the U.S. federal statutory rate to the provision for income taxes and the effective tax rate for the years ended December 31 is as follows:
|
(in millions, except percentages)
|
2016
|
2015
|
2014
|
||||||||||||||||||
|
Tax provision at the U.S. federal statutory rate
|
$
|
4,152
|
|
35.0
|
%
|
$
|
3,581
|
|
35.0
|
%
|
$
|
3,380
|
|
35.0
|
%
|
||||||
|
Health insurance industry tax
|
645
|
|
5.4
|
|
627
|
|
6.1
|
|
469
|
|
4.8
|
|
|||||||||
|
State income taxes, net of federal benefit
|
205
|
|
1.7
|
|
145
|
|
1.4
|
|
154
|
|
1.6
|
|
|||||||||
|
Share-based awards - excess tax benefit
|
(158
|
)
|
(1.3
|
)
|
—
|
|
—
|
|
—
|
|
—
|
|
|||||||||
|
Non-deductible compensation
|
128
|
|
1.1
|
|
103
|
|
1.0
|
|
96
|
|
1.0
|
|
|||||||||
|
Other, net
|
(182
|
)
|
(1.5
|
)
|
(93
|
)
|
(0.9
|
)
|
(62
|
)
|
(0.6
|
)
|
|||||||||
|
Provision for income taxes
|
$
|
4,790
|
|
40.4
|
%
|
$
|
4,363
|
|
42.6
|
%
|
$
|
4,037
|
|
41.8
|
%
|
||||||
67
Deferred income tax assets and liabilities are recognized for the differences between the financial and income tax reporting bases of assets and liabilities based on enacted tax rates and laws. The components of deferred income tax assets and liabilities as of December 31 are as follows:
|
(in millions)
|
2016
|
2015
|
||||||
|
Deferred income tax assets:
|
|
|
||||||
|
Accrued expenses and allowances
|
$
|
820
|
|
$
|
739
|
|
||
|
U.S. federal and state net operating loss carryforwards
|
147
|
|
139
|
|
||||
|
Share-based compensation
|
126
|
|
124
|
|
||||
|
Nondeductible liabilities
|
236
|
|
205
|
|
||||
|
Medical costs payable and other current liabilities
|
95
|
|
71
|
|
||||
|
Non-U.S. tax loss carryforwards
|
434
|
|
244
|
|
||||
|
Net unrealized losses on investments
|
55
|
|
—
|
|
||||
|
Other-domestic
|
194
|
|
214
|
|
||||
|
Other-non-U.S.
|
175
|
|
130
|
|
||||
|
Subtotal
|
2,282
|
|
1,866
|
|
||||
|
Less: valuation allowances
|
(55
|
)
|
(44
|
)
|
||||
|
Total deferred income tax assets
|
2,227
|
|
1,822
|
|
||||
|
Deferred income tax liabilities:
|
||||||||
|
U.S. federal and state intangible assets
|
(3,055
|
)
|
(2,951
|
)
|
||||
|
Non-U.S. goodwill and intangible assets
|
(584
|
)
|
(397
|
)
|
||||
|
Capitalized software
|
(707
|
)
|
(574
|
)
|
||||
|
Net unrealized gains on investments
|
—
|
|
(34
|
)
|
||||
|
Depreciation and amortization
|
(332
|
)
|
(312
|
)
|
||||
|
Prepaid expenses
|
(228
|
)
|
(205
|
)
|
||||
|
Other-non-U.S.
|
(82
|
)
|
(76
|
)
|
||||
|
Total deferred income tax liabilities
|
(4,988
|
)
|
(4,549
|
)
|
||||
|
Net deferred income tax liabilities
|
$
|
(2,761
|
)
|
$
|
(2,727
|
)
|
||
Valuation allowances are provided when it is considered more likely than not that deferred tax assets will not be realized. The valuation allowances primarily relate to future tax benefits on certain federal, state and non-U.S. net operating loss carryforwards. Federal net operating loss carryforwards of
$74 million
expire beginning in 2021 through 2036; state net operating loss carryforwards expire beginning in 2017 through 2036. Substantially all of the non-U.S. tax loss carryforwards have indefinite carryforward periods.
As of
December 31, 2016
, the Company had
$717 million
of undistributed earnings from non-U.S. subsidiaries that are intended to be reinvested in non-U.S. operations. Because these earnings are considered permanently reinvested, no U.S. tax provision has been accrued related to the repatriation of these earnings. It is not practicable to estimate the amount of U.S. tax that might be payable on the eventual remittance of such earnings.
A reconciliation of the beginning and ending amount of unrecognized tax benefits as of December 31 is as follows:
|
(in millions)
|
2016
|
2015
|
2014
|
|||||||||
|
Gross unrecognized tax benefits, beginning of period
|
$
|
224
|
|
$
|
92
|
|
$
|
89
|
|
|||
|
Gross increases:
|
|
|
|
|
|
|
||||||
|
Current year tax positions
|
37
|
|
—
|
|
—
|
|
||||||
|
Prior year tax positions
|
24
|
|
55
|
|
4
|
|
||||||
|
Acquired reserves
|
—
|
|
89
|
|
—
|
|
||||||
|
Gross decreases:
|
|
|
|
|
|
|
||||||
|
Prior year tax positions
|
(4
|
)
|
(2
|
)
|
—
|
|
||||||
|
Settlements
|
(6
|
)
|
(1
|
)
|
—
|
|
||||||
|
Statute of limitations lapses
|
(12
|
)
|
(9
|
)
|
(1
|
)
|
||||||
|
Gross unrecognized tax benefits, end of period
|
$
|
263
|
|
$
|
224
|
|
$
|
92
|
|
|||
68
The Company believes it is reasonably possible that its liability for unrecognized tax benefits will decrease in the next twelve months by
$197 million
as a result of audit settlements and the expiration of statutes of limitations.
The Company classifies interest and penalties associated with uncertain income tax positions as income taxes within its Consolidated Statement of Operations. During the years ended
December 31, 2016
,
2015
and 2014 the Company recognized
$11 million
,
$11 million
and
$6 million
of interest and penalties, respectively. The Company had
$70 million
and
$59 million
of accrued interest and penalties for uncertain tax positions as of
December 31, 2016
and 2015, respectively. These amounts are not included in the reconciliation above.
The Company currently files income tax returns in the United States, various states and non-U.S. jurisdictions. The U.S. Internal Revenue Service (IRS) has completed exams on the consolidated income tax returns for fiscal years 2015 and prior. The Company’s 2016 tax year is under advance review by the IRS under its Compliance Assurance Program. With the exception of a few states, the Company is no longer subject to income tax examinations prior to the 2010 tax year. The Brazilian federal revenue service - Secretaria da Receita Federal (SRF) may audit the Company’s Brazilian subsidiaries for a period of five years from the date on which corporate income taxes should have been paid and/or the date when the tax return was filed.
10. Shareholders' Equity
Regulatory Capital and Dividend Restrictions
The Company’s regulated subsidiaries are subject to regulations and standards in their respective jurisdictions. These standards, among other things, require these subsidiaries to maintain specified levels of statutory capital, as defined by each jurisdiction, and restrict the timing and amount of dividends and other distributions that may be paid to their parent companies. In the United States, most of these regulations and standards are generally consistent with model regulations established by the National Association of Insurance Commissioners. These standards generally permit dividends to be paid from statutory unassigned surplus of the regulated subsidiary and are limited based on the regulated subsidiary’s level of statutory net income and statutory capital and surplus. These dividends are referred to as “ordinary dividends” and generally can be paid without prior regulatory approval. If the dividend, together with other dividends paid within the preceding twelve months, exceeds a specified statutory limit or is paid from sources other than earned surplus, it is generally considered an “extraordinary dividend” and must receive prior regulatory approval.
For the year ended
December 31, 2016
, the Company’s regulated subsidiaries paid their parent companies dividends of
$3.9 billion
, including
$3.3 billion
of extraordinary dividends. For the year ended
December 31, 2015
, the Company’s regulated subsidiaries paid their parent companies dividends of
$4.4 billion
, including
$1.5 billion
of extraordinary dividends. As of
December 31, 2016
, approximately
$700 million
of the Company’s
$10.4 billion
of cash and cash equivalents was available for general corporate use.
The Company's regulated subsidiaries had estimated aggregate statutory capital and surplus of approximately
$17.9 billion
as of
December 31, 2016
. The estimated statutory capital and surplus necessary to satisfy regulatory requirements of the Company's regulated subsidiaries was approximately
$10.5 billion
as of
December 31, 2016
.
Optum Bank must meet minimum requirements for Tier 1 leverage capital, Tier 1 risk-based capital, common equity Tier1 risk-based capital and total risk-based capital of the Federal Deposit Insurance Corporation (FDIC) to be considered “Well Capitalized” under the capital adequacy rules to which it is subject. At
December 31, 2016
, the Company believes that Optum Bank met the FDIC requirements to be considered “Well Capitalized.”
Share Repurchase Program
Under its Board of Directors’ authorization, the Company maintains a share repurchase program. The objectives of the share repurchase program are to optimize the Company’s capital structure and cost of capital, thereby improving returns to shareholders, as well as to offset the dilutive impact of share-based awards. Repurchases may be made from time to time in open market purchases or other types of transactions (including prepaid or structured share repurchase programs), subject to certain Board restrictions. In June 2014, the Board renewed the Company’s share repurchase program with an authorization to
repurchase up to
100 million
shares of its common stock.
69
A summary of common share repurchases for the years ended December 31, 2016 and 2015 is as follows:
|
Years Ended December 31,
|
||||||||||
|
(in millions, except per share data)
|
2016
|
2015
|
||||||||
|
Common share repurchases, shares
|
10
|
|
11
|
|
||||||
|
Common share repurchases, average price per share
|
$
|
128.97
|
|
$
|
112.45
|
|
||||
|
Common share repurchases, aggregate cost
|
$
|
1,280
|
|
$
|
1,200
|
|
||||
|
Board authorized shares remaining
|
51
|
|
61
|
|
||||||
Dividends
In June 2016, the Company’s Board of Directors increased the Company’s quarterly cash dividend to shareholders to equal an annual dividend rate of
$2.50
per share compared to the annual dividend rate of
$2.00
per share, which the Company had paid since June 2015. Declaration and payment of future quarterly dividends is at the discretion of the Board and may be adjusted as business needs or market conditions change.
11. Share-Based Compensation
The Company’s outstanding share-based awards consist mainly of non-qualified stock options, SARs and restricted shares. As of
December 31, 2016
, the Company had
68 million
shares available for future grants of share-based awards under the Plan. As of
December 31, 2016
, there were also
10 million
shares of common stock available for issuance under the ESPP.
Stock Options and SARs
Stock option and SAR activity for the year ended
December 31, 2016
is summarized in the table below:
|
Shares
|
Weighted-
Average
Exercise
Price
|
Weighted-
Average
Remaining
Contractual Life
|
Aggregate
Intrinsic Value
|
||||||||||
|
|
(in millions)
|
|
(in years)
|
(in millions)
|
|||||||||
|
Outstanding at beginning of period
|
34
|
|
$
|
68
|
|
||||||||
|
Granted
|
11
|
|
113
|
|
|||||||||
|
Exercised
|
(8
|
)
|
57
|
|
|||||||||
|
Forfeited
|
(1
|
)
|
103
|
|
|||||||||
|
Outstanding at end of period
|
36
|
|
84
|
|
6.6
|
|
$
|
2,758
|
|
||||
|
Exercisable at end of period
|
14
|
|
56
|
|
4.0
|
|
1,458
|
|
|||||
|
Vested and expected to vest, end of period
|
35
|
|
83
|
|
6.6
|
|
2,704
|
|
|||||
Restricted Shares
Restricted share activity for the year ended
December 31, 2016
is summarized in the table below:
|
(shares in millions)
|
Shares
|
Weighted-Average
Grant Date
Fair Value
per Share
|
|||||
|
Nonvested at beginning of period
|
7
|
|
$
|
82
|
|
||
|
Granted
|
3
|
|
115
|
|
|||
|
Vested
|
(3
|
)
|
76
|
|
|||
|
Nonvested at end of period
|
7
|
|
96
|
|
|||
70
Other Share-Based Compensation Data
|
(in millions, except per share amounts)
|
For the Years Ended December 31,
|
|||||||||||
|
2016
|
2015
|
2014
|
||||||||||
|
Stock Options and SARs
|
||||||||||||
|
Weighted-average grant date fair value of shares granted, per share
|
$
|
20
|
|
$
|
22
|
|
$
|
22
|
|
|||
|
Total intrinsic value of stock options and SARs exercised
|
595
|
|
482
|
|
526
|
|
||||||
|
Restricted Shares
|
||||||||||||
|
Weighted-average grant date fair value of shares granted, per share
|
115
|
|
110
|
|
71
|
|
||||||
|
Total fair value of restricted shares vested
|
$
|
274
|
|
$
|
460
|
|
$
|
437
|
|
|||
|
Employee Stock Purchase Plan
|
||||||||||||
|
Number of shares purchased
|
2
|
|
2
|
|
2
|
|
||||||
|
Share-Based Compensation Items
|
||||||||||||
|
Share-based compensation expense, before tax
|
$
|
485
|
|
$
|
406
|
|
$
|
364
|
|
|||
|
Share-based compensation expense, net of tax effects
|
417
|
|
348
|
|
314
|
|
||||||
|
Income tax benefit realized from share-based award exercises
|
236
|
|
247
|
|
231
|
|
||||||
|
(in millions, except years)
|
December 31, 2016
|
|||
|
Unrecognized compensation expense related to share awards
|
$
|
516
|
|
|
|
Weighted-average years to recognize compensation expense
|
1.3
|
|
||
Share-Based Compensation Recognition and Estimates
The principal assumptions the Company used in calculating grant-date fair value for stock options and SARs were as follows:
|
For the Years Ended December 31,
|
||||||
|
|
2016
|
2015
|
2014
|
|||
|
Risk-free interest rate
|
1.2% - 1.4%
|
1.6% - 1.7%
|
1.7% - 1.8%
|
|||
|
Expected volatility
|
20.8% - 22.5%
|
22.3% - 24.1%
|
24.1% - 39.6%
|
|||
|
Expected dividend yield
|
1.8%
|
1.4% - 1.7%
|
1.6% - 1.9%
|
|||
|
Forfeiture rate
|
5.0%
|
5.0%
|
5.0%
|
|||
|
Expected life in years
|
5.6 - 5.9
|
5.5 - 6.1
|
5.4
|
|||
Risk-free interest rates are based on U.S. Treasury yields in effect at the time of grant. Expected volatilities are based on the historical volatility of the Company’s common stock and the implied volatility from exchange-traded options on the Company’s common stock. Expected dividend yields are based on the per share cash dividend paid by the Company. The Company uses historical data to estimate option and SAR exercises and forfeitures within the valuation model. The expected lives of options and SARs granted represents the period of time that the awards granted are expected to be outstanding based on historical exercise patterns.
Other Employee Benefit Plans
The Company also offers a 401(k) plan for its employees. Compensation expense related to this plan was not material for 2016, 2015 and 2014.
In addition, the Company maintains non-qualified, deferred compensation plans, which allow certain members of senior management and executives to defer portions of their salary or bonus and receive certain Company contributions on such deferrals, subject to plan limitations. The deferrals are recorded within long-term investments with an approximately equal amount in other liabilities in the Consolidated Balance Sheets. The total deferrals are distributable based upon termination of employment or other periods, as elected under each plan and were
$672 million
and
$553 million
as of
December 31, 2016
and
2015
, respectively.
71
12. Commitments and Contingencies
The Company leases facilities and equipment under long-term operating leases that are non-cancelable and expire on various dates. Rent expense under all operating leases for the years ended
December 31, 2016
,
2015
and 2014 was
$608 million
,
$555 million
and
$449 million
, respectively.
As of
December 31, 2016
, future minimum annual lease payments, net of sublease income, under all non-cancelable operating leases were as follows:
|
(in millions)
|
Future Minimum Lease Payments
|
|||
|
2017
|
$
|
453
|
|
|
|
2018
|
416
|
|
||
|
2019
|
355
|
|
||
|
2020
|
314
|
|
||
|
2021
|
273
|
|
||
|
Thereafter
|
499
|
|
||
The Company provides guarantees related to its service level under certain contracts. If minimum standards are not met, the Company may be financially at risk up to a stated percentage of the contracted fee or a stated dollar amount. None of the amounts accrued, paid or charged to income for service level guarantees were material as of December 31, 2016, 2015 or 2014.
As of December 31, 2016, the Company had outstanding, undrawn letters of credit with financial institutions of
$28 million
and surety bonds outstanding with insurance companies of
$1.2 billion
, primarily to bond contractual performance.
Legal Matters
Because of the nature of its businesses, the Company is frequently made party to a variety of legal actions and regulatory inquiries, including class actions and suits brought by members, care providers, consumer advocacy organizations, customers and regulators, relating to the Company’s businesses, including management and administration of health benefit plans and other services. These matters include medical malpractice, employment, intellectual property, antitrust, privacy and contract claims and claims related to health care benefits coverage and other business practices.
The Company records liabilities for its estimates of probable costs resulting from these matters where appropriate. Estimates of costs resulting from legal and regulatory matters involving the Company are inherently difficult to predict, particularly where the matters: involve indeterminate claims for monetary damages or may involve fines, penalties or punitive damages; present novel legal theories or represent a shift in regulatory policy; involve a large number of claimants or regulatory bodies; are in the early stages of the proceedings; or could result in a change in business practices. Accordingly, the Company is often unable to estimate the losses or ranges of losses for those matters where there is a reasonable possibility or it is probable that a loss may be incurred.
Litigation Matters
California Claims Processing Matter.
On January 25, 2008, the California Department of Insurance (CDI) issued an Order to Show Cause to PacifiCare Life and Health Insurance Company, a subsidiary of the Company, alleging violations of certain insurance statutes and regulations related to an alleged failure to include certain language in standard claims correspondence, timeliness and accuracy of claims processing, interest payments, care provider contract implementation, care provider dispute resolution and other related matters. Although the Company believes that CDI had never before issued a fine in excess of
$8 million
, CDI advocated a fine of approximately
$325 million
in this matter. The matter was the subject of an administrative hearing before a California administrative law judge beginning in December 2009, and in August 2013, the administrative law judge issued a nonbinding proposed decision recommending a fine of
$11.5 million
. The California Insurance Commissioner rejected the administrative law judge’s recommendation and on June 9, 2014, issued his own decision imposing a fine of approximately
$174 million
. On July 10, 2014, the Company filed a lawsuit in California state court challenging the Commissioner’s decision. On September 8, 2015, in the first phase of that lawsuit, the California state court issued an order invalidating certain of the regulations the Commissioner had relied upon in issuing his decision and penalty. The Company cannot reasonably estimate the range of loss, if any, that may result from this matter given the procedural status of the dispute, the wide range of possible outcomes, the legal issues presented (including the legal basis for the majority of the alleged violations), the inherent difficulty in predicting a regulatory fine in the event of a remand, and the various remedies and levels of judicial review that remain available to the Company.
72
Government Investigations, Audits and Reviews
The Company has been involved or is currently involved in various governmental investigations, audits and reviews. These include routine, regular and special investigations, audits and reviews by the CMS, state insurance and health and welfare departments, the Brazilian national regulatory agency for private health insurance and plans (the Agência Nacional de Saúde Suplementar), state attorneys general, the Office of the Inspector General, the Office of Personnel Management, the Office of Civil Rights, the Government Accountability Office, the Federal Trade Commission, U.S. Congressional committees, the U.S. Department of Justice, the SEC, the Internal Revenue Service, the U.S. Drug Enforcement Administration, the Brazilian federal revenue service (the Secretaria da Receita Federal), the U.S. Department of Labor, the Federal Deposit Insurance Corporation, the Defense Contract Audit Agency and other governmental authorities. Certain of the Company’s businesses have been reviewed or are currently under review, including for, among other matters, compliance with coding and other requirements under the Medicare risk-adjustment model. The Company has produced documents, information and witnesses to the Department of Justice in cooperation with a current review of the Company’s risk-adjustment processes, including the Company’s patient chart review and related programs. CMS has selected certain of the Company’s local plans for risk adjustment data validation (RADV) audits to validate the coding practices of and supporting documentation maintained by health care providers and such audits may result in retrospective adjustments to payments made to the Company’s health plans.
The Company cannot reasonably estimate the range of loss, if any, that may result from any material government investigations, audits and reviews in which it is currently involved given the status of the reviews, the wide range of possible outcomes and the inherent difficulty in predicting regulatory action, fines and penalties, if any, the Company’s legal and factual defenses and the various remedies and levels of judicial review available to the Company in the event of an adverse finding.
Guaranty Fund Assessments
Under state guaranty association laws, certain insurance companies can be assessed (up to prescribed limits) for certain obligations to the policyholders and claimants of impaired or insolvent insurance companies that write the same line or similar lines of business. Some states have similar laws relating to HMOs and other payers such as consumer operated and oriented plans (co-ops) established under the ACA. In 2009, the Pennsylvania Insurance Commissioner placed long term care insurer Penn Treaty Network America Insurance Company and its subsidiary (Penn Treaty), neither of which is affiliated with the Company, in rehabilitation and petitioned a state court for approval to liquidate Penn Treaty. In 2012, the court denied the liquidation petition and ordered the Insurance Commissioner to submit a rehabilitation plan. A second amended plan of rehabilitation was later withdrawn and, as of November 2016, Penn Treaty will be liquidated. As of December 31, 2016, the Company recorded the
$350 million
impact of its estimated share of guaranty association assessments resulting from the Penn Treaty liquidation.
13. Segment Financial Information
Factors used to determine the Company’s reportable segments include the nature of operating activities, economic characteristics, existence of separate senior management teams and the type of information used by the Company’s chief operating decision maker to evaluate its results of operations. Reportable segments with similar economic characteristics, products and services, customers, distribution methods and operational processes that operate in a similar regulatory environment are combined.
The following is a description of the types of products and services from which each of the Company’s
four
reportable segments derives its revenues:
|
•
|
UnitedHealthcare
includes the combined results of operations of UnitedHealthcare Employer & Individual, UnitedHealthcare Medicare & Retirement, UnitedHealthcare Community & State and UnitedHealthcare Global. The U.S. businesses share significant common assets, including a contracted network of physicians, health care professionals, hospitals and other facilities, information technology infrastructure and other resources. UnitedHealthcare Employer & Individual offers an array of consumer-oriented health benefit plans and services for large national employers, public sector employers, mid-sized employers, small businesses and individuals nationwide and active and retired military and their families through the TRICARE program. UnitedHealthcare Medicare & Retirement provides health care coverage and health and well-being services to individuals age 50 and older, addressing their unique needs for preventive and acute health care services as well as services dealing with chronic disease and other specialized issues for older individuals. UnitedHealthcare Community & State’s primary customers oversee Medicaid plans, the Children’s Health Insurance Program and other federal, state and community health care programs. UnitedHealthcare Global is a diversified global health services business with a variety of offerings, including international commercial health and dental benefits.
|
|
•
|
OptumHealth
serves the physical, emotional and health-related financial needs of individuals, enabling population health management through programs offered by employers, payers, government entities and directly with the care
|
73
delivery system. OptumHealth offers access to networks of care provider specialists, health management services, care delivery, consumer engagement and financial services.
|
•
|
OptumInsight
provides services, technology and health care expertise to major participants in the health care industry. Hospital systems, physicians, health plans, governments, life sciences companies and other organizations that comprise the health care industry depend on OptumInsight to help them improve performance, achieve efficiency, reduce costs, meet compliance mandates and modernize their core operating systems to meet the changing needs of the health system.
|
|
•
|
OptumRx
offers pharmacy care services and programs, including retail network contracting, home delivery and specialty pharmacy services, purchasing and clinical capabilities, and develops programs in areas such as step therapy, formulary management, drug adherence and disease/drug therapy management.
|
The Company’s accounting policies for reportable segment operations are consistent with those described in the Summary of Significant Accounting Policies (see
Note 2
). Transactions between reportable segments principally consist of sales of pharmacy care products and services to UnitedHealthcare customers by OptumRx, certain product offerings and care management and local care delivery services sold to UnitedHealthcare by OptumHealth, and health information and technology solutions, consulting and other services sold to UnitedHealthcare by OptumInsight. These transactions are recorded at management’s estimate of fair value. Intersegment transactions are eliminated in consolidation. Assets and liabilities that are jointly used are assigned to each reportable segment using estimates of pro-rata usage. Cash and investments are assigned such that each reportable segment has working capital and/or at least minimum specified levels of regulatory capital.
As a percentage of the Company’s total consolidated revenues, premium revenues from CMS were
25%
for 2016,
26%
for 2015 and
29%
for 2014, most of which were generated by UnitedHealthcare Medicare & Retirement and included in the UnitedHealthcare segment. U.S. customer revenue represented approximately
97%
,
96%
and
95%
of consolidated total revenues for 2016, 2015 and 2014, respectively. Long-lived fixed assets located in the United States represented approximately
75%
and
81%
of the total long-lived fixed assets as of December 31, 2016 and 2015, respectively. The non-U.S. revenues and fixed assets are primarily related to UnitedHealthcare Global.
74
The following table presents the reportable segment financial information:
|
|
|
Optum
|
|
|
||||||||||||||||||||||||||||
|
(in millions)
|
UnitedHealthcare
|
OptumHealth
|
OptumInsight
|
OptumRx
|
Optum Eliminations
|
Optum
|
Corporate and
Eliminations
|
Consolidated
|
||||||||||||||||||||||||
|
2016
|
||||||||||||||||||||||||||||||||
|
Revenues - external customers:
|
||||||||||||||||||||||||||||||||
|
Premiums
|
$
|
140,455
|
|
$
|
3,663
|
|
$
|
—
|
|
$
|
—
|
|
$
|
—
|
|
$
|
3,663
|
|
$
|
—
|
|
$
|
144,118
|
|
||||||||
|
Products
|
1
|
|
48
|
|
103
|
|
26,506
|
|
—
|
|
26,657
|
|
—
|
|
26,658
|
|
||||||||||||||||
|
Services
|
7,514
|
|
2,498
|
|
2,670
|
|
554
|
|
—
|
|
5,722
|
|
—
|
|
13,236
|
|
||||||||||||||||
|
Total revenues - external customers
|
147,970
|
|
6,209
|
|
2,773
|
|
27,060
|
|
—
|
|
36,042
|
|
—
|
|
184,012
|
|
||||||||||||||||
|
Total revenues - intersegment
|
—
|
|
10,491
|
|
4,559
|
|
33,372
|
|
(1,088
|
)
|
47,334
|
|
(47,334
|
)
|
—
|
|
||||||||||||||||
|
Investment and other income
|
611
|
|
208
|
|
1
|
|
8
|
|
—
|
|
217
|
|
—
|
|
828
|
|
||||||||||||||||
|
Total revenues
|
$
|
148,581
|
|
$
|
16,908
|
|
$
|
7,333
|
|
$
|
60,440
|
|
$
|
(1,088
|
)
|
$
|
83,593
|
|
$
|
(47,334
|
)
|
$
|
184,840
|
|
||||||||
|
Earnings from operations
|
$
|
7,307
|
|
$
|
1,428
|
|
$
|
1,513
|
|
$
|
2,682
|
|
$
|
—
|
|
$
|
5,623
|
|
$
|
—
|
|
$
|
12,930
|
|
||||||||
|
Interest expense
|
—
|
|
—
|
|
—
|
|
—
|
|
—
|
|
—
|
|
(1,067
|
)
|
(1,067
|
)
|
||||||||||||||||
|
Earnings before income taxes
|
$
|
7,307
|
|
$
|
1,428
|
|
$
|
1,513
|
|
$
|
2,682
|
|
$
|
—
|
|
$
|
5,623
|
|
$
|
(1,067
|
)
|
$
|
11,863
|
|
||||||||
|
Total assets
|
$
|
70,505
|
|
$
|
18,656
|
|
$
|
9,017
|
|
$
|
29,066
|
|
$
|
—
|
|
$
|
56,739
|
|
$
|
(4,434
|
)
|
$
|
122,810
|
|
||||||||
|
Purchases of property, equipment and capitalized software
|
640
|
|
345
|
|
571
|
|
149
|
|
—
|
|
1,065
|
|
—
|
|
1,705
|
|
||||||||||||||||
|
Depreciation and amortization
|
724
|
|
297
|
|
559
|
|
475
|
|
—
|
|
1,331
|
|
—
|
|
2,055
|
|
||||||||||||||||
|
2015
|
||||||||||||||||||||||||||||||||
|
Revenues - external customers:
|
||||||||||||||||||||||||||||||||
|
Premiums
|
$
|
124,011
|
|
$
|
3,152
|
|
$
|
—
|
|
$
|
—
|
|
$
|
—
|
|
$
|
3,152
|
|
$
|
—
|
|
$
|
127,163
|
|
||||||||
|
Products
|
2
|
|
31
|
|
108
|
|
17,171
|
|
—
|
|
17,310
|
|
—
|
|
17,312
|
|
||||||||||||||||
|
Services
|
6,776
|
|
2,375
|
|
2,390
|
|
381
|
|
—
|
|
5,146
|
|
—
|
|
11,922
|
|
||||||||||||||||
|
Total revenues - external customers
|
130,789
|
|
5,558
|
|
2,498
|
|
17,552
|
|
—
|
|
25,608
|
|
—
|
|
156,397
|
|
||||||||||||||||
|
Total revenues - intersegment
|
—
|
|
8,216
|
|
3,697
|
|
30,718
|
|
(791
|
)
|
41,840
|
|
(41,840
|
)
|
—
|
|
||||||||||||||||
|
Investment and other income
|
554
|
|
153
|
|
1
|
|
2
|
|
—
|
|
156
|
|
—
|
|
710
|
|
||||||||||||||||
|
Total revenues
|
$
|
131,343
|
|
$
|
13,927
|
|
$
|
6,196
|
|
$
|
48,272
|
|
$
|
(791
|
)
|
$
|
67,604
|
|
$
|
(41,840
|
)
|
$
|
157,107
|
|
||||||||
|
Earnings from operations
|
$
|
6,754
|
|
$
|
1,240
|
|
$
|
1,278
|
|
$
|
1,749
|
|
$
|
—
|
|
$
|
4,267
|
|
$
|
—
|
|
$
|
11,021
|
|
||||||||
|
Interest expense
|
—
|
|
—
|
|
—
|
|
—
|
|
—
|
|
—
|
|
(790
|
)
|
(790
|
)
|
||||||||||||||||
|
Earnings before income taxes
|
$
|
6,754
|
|
$
|
1,240
|
|
$
|
1,278
|
|
$
|
1,749
|
|
$
|
—
|
|
$
|
4,267
|
|
$
|
(790
|
)
|
$
|
10,231
|
|
||||||||
|
Total assets
(a)
|
$
|
64,212
|
|
$
|
14,600
|
|
$
|
8,335
|
|
$
|
26,844
|
|
$
|
—
|
|
$
|
49,779
|
|
$
|
(2,737
|
)
|
$
|
111,254
|
|
||||||||
|
Purchases of property, equipment and capitalized software
|
653
|
|
252
|
|
572
|
|
79
|
|
—
|
|
903
|
|
—
|
|
1,556
|
|
||||||||||||||||
|
Depreciation and amortization
|
718
|
|
251
|
|
492
|
|
232
|
|
—
|
|
975
|
|
—
|
|
1,693
|
|
||||||||||||||||
|
2014
|
||||||||||||||||||||||||||||||||
|
Revenues - external customers:
|
||||||||||||||||||||||||||||||||
|
Premiums
|
$
|
112,645
|
|
$
|
2,657
|
|
$
|
—
|
|
$
|
—
|
|
$
|
—
|
|
$
|
2,657
|
|
$
|
—
|
|
$
|
115,302
|
|
||||||||
|
Products
|
3
|
|
18
|
|
96
|
|
4,125
|
|
—
|
|
4,239
|
|
—
|
|
4,242
|
|
||||||||||||||||
|
Services
|
6,516
|
|
1,300
|
|
2,224
|
|
111
|
|
—
|
|
3,635
|
|
—
|
|
10,151
|
|
||||||||||||||||
|
Total revenues - external customers
|
119,164
|
|
3,975
|
|
2,320
|
|
4,236
|
|
—
|
|
10,531
|
|
—
|
|
129,695
|
|
||||||||||||||||
|
Total revenues - intersegment
|
—
|
|
6,913
|
|
2,906
|
|
27,740
|
|
(489
|
)
|
37,070
|
|
(37,070
|
)
|
—
|
|
||||||||||||||||
|
Investment and other income
|
634
|
|
144
|
|
1
|
|
—
|
|
—
|
|
145
|
|
—
|
|
779
|
|
||||||||||||||||
|
Total revenues
|
$
|
119,798
|
|
$
|
11,032
|
|
$
|
5,227
|
|
$
|
31,976
|
|
$
|
(489
|
)
|
$
|
47,746
|
|
$
|
(37,070
|
)
|
$
|
130,474
|
|
||||||||
|
Earnings from operations
|
$
|
6,992
|
|
$
|
1,090
|
|
$
|
1,002
|
|
$
|
1,190
|
|
$
|
—
|
|
$
|
3,282
|
|
$
|
—
|
|
$
|
10,274
|
|
||||||||
|
Interest expense
|
—
|
|
—
|
|
—
|
|
—
|
|
—
|
|
—
|
|
(618
|
)
|
(618
|
)
|
||||||||||||||||
|
Earnings before income taxes
|
$
|
6,992
|
|
$
|
1,090
|
|
$
|
1,002
|
|
$
|
1,190
|
|
$
|
—
|
|
$
|
3,282
|
|
$
|
(618
|
)
|
$
|
9,656
|
|
||||||||
|
Total assets
(a)
|
$
|
62,405
|
|
$
|
11,148
|
|
$
|
8,112
|
|
$
|
5,474
|
|
$
|
—
|
|
$
|
24,734
|
|
$
|
(839
|
)
|
$
|
86,300
|
|
||||||||
|
Purchases of property, equipment and capitalized software
|
773
|
|
212
|
|
484
|
|
56
|
|
—
|
|
752
|
|
—
|
|
1,525
|
|
||||||||||||||||
|
Depreciation and amortization
|
772
|
|
179
|
|
433
|
|
94
|
|
—
|
|
706
|
|
—
|
|
1,478
|
|
||||||||||||||||
|
(a)
|
In the first quarter of 2016, the Company adopted ASU 2015-03, retrospectively as required. See
Note 2
for more information on the adoption of ASU 2015-03.
|
75
14. Quarterly Financial Data (Unaudited)
Selected quarterly financial information for all quarters of 2016 and 2015 is as follows:
|
|
For the Quarter Ended
|
|||||||||||||||
|
(in millions, except per share data)
|
March 31
|
June 30
|
September 30
|
December 31
|
||||||||||||
|
2016
|
||||||||||||||||
|
Revenues
|
$
|
44,527
|
|
$
|
46,485
|
|
$
|
46,293
|
|
$
|
47,535
|
|
||||
|
Operating costs
|
41,567
|
|
43,282
|
|
42,713
|
|
44,348
|
|
||||||||
|
Earnings from operations
|
2,960
|
|
3,203
|
|
3,580
|
|
3,187
|
|
||||||||
|
Net earnings
|
1,627
|
|
1,760
|
|
1,978
|
|
1,708
|
|
||||||||
|
Net earnings attributable to UnitedHealth Group common shareholders
|
1,611
|
|
1,754
|
|
1,968
|
|
1,684
|
|
||||||||
|
Net earnings per share attributable to UnitedHealth Group common shareholders:
|
||||||||||||||||
|
Basic
|
1.69
|
|
1.84
|
|
2.07
|
|
1.77
|
|
||||||||
|
Diluted
|
1.67
|
|
1.81
|
|
2.03
|
|
1.74
|
|
||||||||
|
2015
|
||||||||||||||||
|
Revenues
|
$
|
35,756
|
|
$
|
36,263
|
|
$
|
41,489
|
|
$
|
43,599
|
|
||||
|
Operating costs
|
33,116
|
|
33,368
|
|
38,471
|
|
41,131
|
|
||||||||
|
Earnings from operations
|
2,640
|
|
2,895
|
|
3,018
|
|
2,468
|
|
||||||||
|
Net earnings
|
1,413
|
|
1,585
|
|
1,618
|
|
1,252
|
|
||||||||
|
Net earnings attributable to UnitedHealth Group common shareholders
|
1,413
|
|
1,585
|
|
1,597
|
|
1,218
|
|
||||||||
|
Net earnings per share attributable to UnitedHealth Group common shareholders:
|
||||||||||||||||
|
Basic
|
1.48
|
|
1.66
|
|
1.68
|
|
1.28
|
|
||||||||
|
Diluted
|
1.46
|
|
1.64
|
|
1.65
|
|
1.26
|
|
||||||||
|
ITEM 9.
|
CHANGES IN AND DISAGREEMENTS WITH ACCOUNTANTS ON ACCOUNTING AND FINANCIAL DISCLOSURE
|
None.
|
ITEM 9A.
|
CONTROLS AND PROCEDURES
|
EVALUATION OF DISCLOSURE CONTROLS AND PROCEDURES
We maintain disclosure controls and procedures as defined in Rules 13a-15(e) and 15d-15(e) under the Securities Exchange Act of 1934 (Exchange Act) that are designed to provide reasonable assurance that information required to be disclosed by us in reports that we file or submit under the Exchange Act is (i) recorded, processed, summarized and reported within the time periods specified in SEC rules and forms; and (ii) accumulated and communicated to our management, including our principal executive officer and principal financial officer, as appropriate to allow timely decisions regarding required disclosure.
In connection with the filing of this Annual Report on Form 10-K, management evaluated, under the supervision and with the participation of our Chief Executive Officer and Chief Financial Officer, the effectiveness of the design and operation of our disclosure controls and procedures as of December 31, 2016. Based upon that evaluation, our Chief Executive Officer and Chief Financial Officer concluded that our disclosure controls and procedures were effective at the reasonable assurance level as of December 31, 2016.
CHANGES IN INTERNAL CONTROL OVER FINANCIAL REPORTING
There have been no changes in our internal control over financial reporting during the quarter ended December 31, 2016 that have materially affected, or are reasonably likely to materially affect, our internal control over financial reporting.
76
Report of Management on Internal Control Over Financial Reporting as of December 31, 2016
UnitedHealth Group Incorporated and Subsidiaries’ (the “Company”) management is responsible for establishing and maintaining adequate internal control over financial reporting as defined in Rules 13a-15(f) and 15d-15(f) under the Securities Exchange Act of 1934. The Company’s internal control system is designed to provide reasonable assurance to our management and board of directors regarding the reliability of financial reporting and the preparation of consolidated financial statements for external purposes in accordance with generally accepted accounting principles. The Company’s internal control over financial reporting includes those policies and procedures that (i) pertain to the maintenance of records that, in reasonable detail, accurately and fairly reflect the transactions and dispositions of the assets of the Company; (ii) provide reasonable assurance that transactions are recorded as necessary to permit preparation of consolidated financial statements in accordance with generally accepted accounting principles, and that receipts and expenditures of the Company are being made only in accordance with authorizations of management and directors of the Company; and (iii) provide reasonable assurance regarding prevention or timely detection of unauthorized acquisition, use or disposition of the Company’s assets that could have a material effect on the consolidated financial statements.
Because of its inherent limitations, internal control over financial reporting may not prevent or detect misstatements. Also, projections of any evaluation of effectiveness to future periods are subject to the risk that controls may become inadequate because of changes in conditions, or that the degree of compliance with the policies or procedures may deteriorate.
Management assessed the effectiveness of the Company’s internal control over financial reporting as of December 31, 2016. In making this assessment, we used the criteria set forth by the Committee of Sponsoring Organizations of the Treadway Commission (COSO) in
Internal Control-Integrated Framework (2013).
Based on our assessment and the COSO criteria, we believe that, as of December 31, 2016, the Company maintained effective internal control over financial reporting.
The Company’s independent registered public accounting firm has audited the Company’s internal control over financial reporting as of December 31, 2016, as stated in the
Report of Independent Registered Public Accounting Firm
, appearing under Item 9A.
77
Report of Independent Registered Public Accounting Firm
To the Board of Directors and Shareholders of UnitedHealth Group Incorporated and Subsidiaries:
We have audited the internal control over financial reporting of UnitedHealth Group Incorporated and subsidiaries (the “Company”) as of December 31, 2016, based on criteria established in
Internal Control - Integrated Framework (2013)
issued by the Committee of Sponsoring Organizations of the Treadway Commission. The Company’s management is responsible for maintaining effective internal control over financial reporting and for its assessment of the effectiveness of internal control over financial reporting, included in the accompanying Report of Management on Internal Control Over Financial Reporting as of December 31, 2016. Our responsibility is to express an opinion on the Company’s internal control over financial reporting based on our audit.
We conducted our audit in accordance with the standards of the Public Company Accounting Oversight Board (United States). Those standards require that we plan and perform the audit to obtain reasonable assurance about whether effective internal control over financial reporting was maintained in all material respects. Our audit included obtaining an understanding of internal control over financial reporting, assessing the risk that a material weakness exists, testing and evaluating the design and operating effectiveness of internal control based on the assessed risk, and performing such other procedures as we considered necessary in the circumstances. We believe that our audit provides a reasonable basis for our opinion.
A company’s internal control over financial reporting is a process designed by, or under the supervision of, the company’s principal executive and principal financial officers, or persons performing similar functions, and effected by the company’s board of directors, management, and other personnel to provide reasonable assurance regarding the reliability of financial reporting and the preparation of financial statements for external purposes in accordance with generally accepted accounting principles. A company’s internal control over financial reporting includes those policies and procedures that (1) pertain to the maintenance of records that, in reasonable detail, accurately and fairly reflect the transactions and dispositions of the assets of the company; (2) provide reasonable assurance that transactions are recorded as necessary to permit preparation of financial statements in accordance with generally accepted accounting principles, and that receipts and expenditures of the company are being made only in accordance with authorizations of management and directors of the company; and (3) provide reasonable assurance regarding prevention or timely detection of unauthorized acquisition, use, or disposition of the company’s assets that could have a material effect on the financial statements.
Because of the inherent limitations of internal control over financial reporting, including the possibility of collusion or improper management override of controls, material misstatements due to error or fraud may not be prevented or detected on a timely basis. Also, projections of any evaluation of the effectiveness of the internal control over financial reporting to future periods are subject to the risk that the controls may become inadequate because of changes in conditions, or that the degree of compliance with the policies or procedures may deteriorate.
In our opinion, the Company maintained, in all material respects, effective internal control over financial reporting as of December 31, 2016, based on the criteria established in
Internal Control - Integrated Framework (2013)
issued by the Committee of Sponsoring Organizations of the Treadway Commission.
We have also audited, in accordance with the standards of the Public Company Accounting Oversight Board (United States), the consolidated financial statements as of and for the year ended December 31, 2016 of the Company and our report dated
February 8, 2017
expressed an unqualified opinion on those consolidated financial statements.
|
/s/ DELOITTE & TOUCHE LLP
|
|
Minneapolis, Minnesota
|
|
February 8, 2017
|
78
|
ITEM 9B.
|
OTHER INFORMATION
|
None.
|
ITEM 10.
|
DIRECTORS, EXECUTIVE OFFICERS AND CORPORATE GOVERNANCE
|
DIRECTORS OF THE REGISTRANT
The following sets forth certain information regarding our directors as of
February 8, 2017
, including their name and principal occupation or employment:
|
William C. Ballard, Jr.
|
Michele J. Hooper
|
|
|
Former Of Counsel
Bingham Greenebaum Doll LLP
|
President and Chief Executive Officer
The Directors’ Council, a company focused on improving
the governance processes of corporate boards
|
|
|
Edson Bueno, M.D.
|
||
|
Founder Amil and
Chairman UnitedHealth Group Latin America
|
Rodger A. Lawson
|
|
|
Executive Chair
E*TRADE Financial Corporation and
Retired President and Chief Executive Officer
Fidelity Investments - Financial Services
|
||
|
Richard T. Burke
|
||
|
Non-Executive Chair
UnitedHealth Group
|
||
|
Glenn M. Renwick
|
||
|
Robert J. Darretta
|
Executive Chair
The Progressive Corporation
|
|
|
Retired Vice-Chair and
Chief Financial Officer
Johnson & Johnson
|
||
|
Kenneth I. Shine, M.D.
|
||
|
Professor of Medicine at the Dell Medical School
University of Texas
|
||
|
Timothy P. Flynn
|
||
|
Retired Chair
KPMG International
|
||
|
Gail R. Wilensky, Ph.D.
|
||
|
Senior Fellow
Project HOPE, an international health foundation
|
||
|
Stephen J. Hemsley
|
||
|
Chief Executive Officer
UnitedHealth Group
|
||
Pursuant to General Instruction G(3) to Form 10-K and Instruction 3 to Item 401(b) of Regulation S-K, information regarding our executive officers is provided in
Item 1 of Part I of this Annual Report on Form 10-K
under the caption “Executive Officers of the Registrant.”
We have adopted a code of ethics applicable to our principal executive officer and other senior financial officers, who include our principal financial officer, principal accounting officer, controller and persons performing similar functions. The code of ethics, entitled Code of Conduct: Our Principles of Ethics and Integrity, is posted on our website at
www.unitedhealthgroup.com
. For information about how to obtain the Code of Conduct, see
Part I, Item 1, “Business.”
We intend to satisfy the SEC’s disclosure requirements regarding amendments to, or waivers of, the code of ethics for our senior financial officers by posting such information on our website indicated above.
The remaining information required by Items 401, 405, 406 and 407(c)(3), (d)(4) and (d)(5) of Regulation S-K will be included under the headings “Corporate Governance,” “Proposal 1-Election of Directors” and “Section 16(a) Beneficial Ownership Reporting Compliance” in our definitive proxy statement for our 2017 Annual Meeting of Shareholders, and such required information is incorporated herein by reference.
|
ITEM 11.
|
EXECUTIVE COMPENSATION
|
The information required by Items 402, 407(e)(4) and (e)(5) of Regulation S-K will be included under the headings “Executive Compensation,” “Director Compensation,” “Corporate Governance - Risk Oversight” and “Compensation Committee Interlocks and Insider Participation” in our definitive proxy statement for our 2017 Annual Meeting of Shareholders, and such required information is incorporated herein by reference.
79
|
ITEM 12.
|
SECURITY OWNERSHIP OF CERTAIN BENEFICIAL OWNERS AND MANAGEMENT AND RELATED SHAREHOLDER MATTERS
|
Equity Compensation Plan Information
The following table sets forth certain information, as of December 31, 2016, concerning shares of common stock authorized for issuance under all of our equity compensation plans:
|
Plan category
|
(a)
Number of securities
to be issued upon
exercise of
outstanding
options, warrants
and rights
|
(b)
Weighted-average
exercise
price of
outstanding
options, warrants
and rights
|
(c)
Number of securities
remaining available for
future issuance under
equity compensation
plans (excluding
securities reflected in
column (a))
|
||||||||
|
(in millions)
|
(in millions)
|
||||||||||
|
Equity compensation plans approved by shareholders
(1)
|
36
|
|
$
|
84
|
|
78
|
|
(3)
|
|||
|
Equity compensation plans not approved by shareholders
(2)
|
—
|
|
—
|
|
—
|
|
|||||
|
Total
(2)
|
36
|
|
$
|
84
|
|
78
|
|
||||
|
(1)
|
Consists of the UnitedHealth Group Incorporated 2011 Stock Incentive Plan, as amended and the UnitedHealth Group 1993 ESPP, as amended.
|
|
(2)
|
Excludes 184,000 shares underlying stock options assumed by us in connection with an acquisition. These options have a weighted-average exercise price of $95 and an average remaining term of approximately 7 years. The options are administered pursuant to the terms of the plan under which the options originally were granted. No future awards will be granted under this acquired plan.
|
|
(3)
|
Includes 10 million shares of common stock available for future issuance under the Employee Stock Purchase Plan as of December 31, 2016, and 68 million shares available under the 2011 Stock Incentive Plan as of December 31, 2016. Shares available under the 2011 Stock Incentive Plan may become the subject of future awards in the form of stock options, SARs, restricted stock, restricted stock units, performance awards and other stock-based awards.
|
The information required by Item 403 of Regulation S-K will be included under the heading “Security Ownership of Certain Beneficial Owners and Management” in our definitive proxy statement for our 2017 Annual Meeting of Shareholders, and such required information is incorporated herein by reference.
|
ITEM 13.
|
CERTAIN RELATIONSHIPS AND RELATED TRANSACTIONS, AND DIRECTOR INDEPENDENCE
|
The information required by Items 404 and 407(a) of Regulation S-K will be included under the headings “Certain Relationships and Transactions” and “Corporate Governance” in our definitive proxy statement for our 2017 Annual Meeting of Shareholders, and such required information is incorporated herein by reference.
ITEM 14.
PRINCIPAL ACCOUNTANT FEES AND SERVICES
The information required by Item 9(e) of Schedule 14A will be included under the heading “Disclosure of Fees Paid to Independent Registered Public Accounting Firm” in our definitive proxy statement for our 2017 Annual Meeting of Shareholders, and such required information is incorporated herein by reference.
80
ITEM 15.
EXHIBITS AND FINANCIAL STATEMENT SCHEDULES
|
(a)
|
1
. Financial Statements
|
The financial statements are included under Item 8 of this report:
|
•
|
|
•
|
|
•
|
|
•
|
|
•
|
|
•
|
|
•
|
2
. Financial Statement Schedules
The following financial statement schedule of the Company is included in Item 15(c):
All other schedules for which provision is made in the applicable accounting regulations of the SEC are not required under the related instructions, are inapplicable, or the required information is included in the consolidated financial statements, and therefore have been omitted.
|
(b)
|
The following exhibits are filed or incorporated by reference herein in response to Item 601 of Regulation S-K. The Company files Annual Reports on Form 10-K, Quarterly Reports on Form 10-Q and Current Reports on Form 8-K pursuant to the Securities Exchange Act of 1934 under Commission File No. 1‑10864.
|
EXHIBIT INDEX**
|
3.1
|
|
Certificate of Incorporation of UnitedHealth Group Incorporated (incorporated by reference to Exhibit 3.1 to UnitedHealth Group Incorporated’s Registration Statement on Form 8-A/A, Commission File No. 1-10864, filed on July 1, 2015)
|
|
|
3.2
|
|
Bylaws of UnitedHealth Group Incorporated (incorporated by reference to Exhibit 3.1 to UnitedHealth Group Incorporated’s Current Report on Form 8-K filed on February 12, 2016)
|
|
|
4.1
|
|
Senior Indenture, dated as of November 15, 1998, between United HealthCare Corporation and The Bank of New York (incorporated by reference to Exhibit 4.1 to UnitedHealth Group Incorporated’s Registration Statement on Form S-3/A, SEC File Number 333-66013, filed on January 11, 1999)
|
|
|
4.2
|
|
Amendment, dated as of November 6, 2000, to Senior Indenture, dated as of November 15, 1998, between the UnitedHealth Group Incorporated and The Bank of New York (incorporated by reference to Exhibit 4.1 to UnitedHealth Group Incorporated’s Quarterly Report on Form 10-Q for the quarter ended September 30, 2001)
|
|
|
4.3
|
|
Instrument of Resignation, Appointment and Acceptance of Trustee, dated January 8, 2007, pursuant to the Senior Indenture, dated as of November 15, 1988, amended as of November 6, 2000, among UnitedHealth Group Incorporated, The Bank of New York and Wilmington Trust Company (incorporated by reference to Exhibit 4.3 to UnitedHealth Group Incorporated’s Quarterly Report on Form 10-Q for the quarter ended June 30, 2007)
|
|
|
4.4
|
|
Indenture, dated as of February 4, 2008, between UnitedHealth Group Incorporated and U.S. Bank National Association (incorporated by reference to Exhibit 4.1 to UnitedHealth Group Incorporated’s Registration Statement on Form S-3, SEC File Number 333-149031, filed on February 4, 2008)
|
|
|
*10.1
|
|
UnitedHealth Group Incorporated 2011 Stock Incentive Plan, as amended and restated in 2015 (incorporated by reference to Exhibit 10.1 to UnitedHealth Group Incorporated’s Current Report on Form 8-K filed on June 5, 2015)
|
|
|
*10.2
|
|
Amendment to UnitedHealth Group Incorporated’s Stock Option and Stock Appreciation Right Awards, effective November 6, 2014 (incorporated by reference to Exhibit 10.2 to UnitedHealth Group Incorporated’s Annual Report on Form 10-K for the year ended December 31, 2014)
|
|
|
*10.3
|
|
Form of Agreement for Non-Qualified Stock Option Award to Executives under UnitedHealth Group Incorporated’s 2011 Stock Incentive Plan, as amended and restated in 2015, for awards made after January 1, 2016 (incorporated by reference to Exhibit 10.4 to UnitedHealth Group Incorporated’s Quarterly Report on Form 10-Q for the quarter ended September 30, 2015)
|
|
81
|
*10.4
|
|
Form of Agreement for Non-Qualified Stock Option Award for International Participants under UnitedHealth Group Incorporated's 2011 Stock Incentive Plan (incorporated by reference to Exhibit 10.3 to UnitedHealth Group Incorporated’s Annual Report on Form 10-K for the year ended December 31, 2013)
|
|
|
*10.5
|
|
Form of Addendum for Non-Qualified Stock Option Award Agreement for International Participants under UnitedHealth Group Incorporated's 2011 Stock Incentive Plan (incorporated by reference to Exhibit 10.37 to UnitedHealth Group Incorporated’s Annual Report on Form 10-K for the year ended December 31, 2012)
|
|
|
*10.6
|
|
Form of Agreement for Restricted Stock Unit Award to Executives under UnitedHealth Group Incorporated’s 2011 Stock Incentive Plan, as amended and restated in 2015, for awards made after January 1, 2016 (incorporated by reference to Exhibit 10.5 to UnitedHealth Group Incorporated’s Quarterly Report on Form 10-Q for the quarter ended September 30, 2015)
|
|
|
*10.7
|
|
Form of Agreement for Restricted Stock Award to Executives under UnitedHealth Group Incorporated’s 2011 Stock Incentive Plan (incorporated by reference to Exhibit 10.5 to UnitedHealth Group Incorporated’s Current Report on Form 8-K filed on May 27, 2011)
|
|
|
*10.8
|
|
Form of Agreement for Stock Appreciation Rights Award to Executives under UnitedHealth Group Incorporated’s 2011 Stock Incentive Plan (incorporated by reference to Exhibit 10.4 to UnitedHealth Group Incorporated’s Current Report on Form 8-K filed on May 27, 2011)
|
|
|
*10.9
|
|
Form of Agreement for Performance-based Restricted Stock Unit Award to Executives under UnitedHealth Group Incorporated’s 2011 Stock Incentive Plan, as amended and restated in 2015, for awards made after January 1, 2016 (incorporated by reference to Exhibit 10.6 to UnitedHealth Group Incorporated’s Quarterly Report on Form 10-Q for the quarter ended September 30, 2015)
|
|
|
*10.10
|
|
Form of Agreement for Initial Deferred Stock Unit Award to Non-Employee Directors under UnitedHealth Group Incorporated’s 2011 Stock Incentive Plan (incorporated by reference to Exhibit 10.7 to UnitedHealth Group Incorporated’s Current Report on Form 8-K filed on May 27, 2011)
|
|
|
*10.11
|
|
Form of Agreement for Deferred Stock Unit Award to Non-Employee Directors under UnitedHealth Group Incorporated’s 2011 Stock Incentive Plan (incorporated by reference to Exhibit 10.6 to UnitedHealth Group Incorporated’s Current Report on Form 8-K filed on May 27, 2011)
|
|
|
10.12
|
|
Form of Indemnification Agreement (incorporated by reference to Exhibit 10.1 to UnitedHealth Group Incorporated’s Current Report on Form 8-K filed on July 1, 2015)
|
|
|
*10.13
|
|
Amended and Restated UnitedHealth Group Incorporated Executive Incentive Plan (2009 Statement), effective as of December 31, 2008 (incorporated by reference to Exhibit 10.12 to UnitedHealth Group Incorporated’s Annual Report on Form 10-K for the year ended December 31, 2008)
|
|
|
*10.14
|
|
Amended and Restated UnitedHealth Group Incorporated 2008 Executive Incentive Plan, effective as of December 31, 2008 (incorporated by reference to Exhibit 10.13 to UnitedHealth Group Incorporated’s Annual Report on Form 10-K for the year ended December 31, 2008)
|
|
|
*10.15
|
|
Amendment, dated as of December 21, 2012, of Amended and Restated UnitedHealth Group Incorporated 2008 Executive Incentive Plan (incorporated by reference to Exhibit 10.11 to UnitedHealth Group Incorporated’s Annual Report on Form 10-K for the year ended December 31, 2012)
|
|
|
*10.16
|
|
Second Amendment, dated as of November 5, 2015, of Amended and Restated UnitedHealth Group Incorporated 2008 Executive Incentive Plan (incorporated by reference to Exhibit 10.3 to UnitedHealth Group Incorporated’s Quarterly Report on Form 10-Q for the quarter ended September 30, 2015)
|
|
|
*10.17
|
|
UnitedHealth Group Executive Savings Plan (2004 Statement) (incorporated by reference to Exhibit 10(e) of UnitedHealth Group Incorporated’s Annual Report on Form 10-K for the year ended December 31, 2003)
|
|
|
*10.18
|
|
First Amendment to UnitedHealth Group Executive Savings Plan (2004 Statement) (incorporated by reference to Exhibit 10.3 to UnitedHealth Group Incorporated’s Current Report on Form 8-K filed on November 3, 2006)
|
|
|
*10.19
|
|
Second Amendment to UnitedHealth Group Executive Savings Plan (2004 Statement) (incorporated by reference to Exhibit 10.13 to UnitedHealth Group Incorporated’s Annual Report on Form 10-K for the year ended December 31, 2007)
|
|
|
*10.20
|
|
Third Amendment to UnitedHealth Group Executive Savings Plan (2004 Statement) (incorporated by reference to Exhibit 10.17 to UnitedHealth Group Incorporated’s Annual Report on Form 10-K for the year ended December 31, 2008)
|
|
|
*10.21
|
|
Fourth Amendment to UnitedHealth Group Executive Savings Plan (2004 Statement) (incorporated by reference to Exhibit 10.1 to UnitedHealth Group Incorporated’s Quarterly Report on Form 10-Q for the quarter ended September 30, 2010)
|
|
|
*10.22
|
|
Fifth Amendment to UnitedHealth Group Executive Savings Plan (2004 Statement) (incorporated by reference to Exhibit 10.2 to UnitedHealth Group Incorporated’s Quarterly Report on Form 10-Q for the quarter ended September 30, 2014)
|
|
|
*10.23
|
|
Sixth Amendment to UnitedHealth Group Executive Savings Plan (2004 Statement) (incorporated by reference to Exhibit 10.2 to UnitedHealth Group Incorporated’s Quarterly Report on Form 10-Q for the quarter ended September 30, 2015)
|
|
82
|
*10.24
|
|
Seventh Amendment to UnitedHealth Group Executive Savings Plan (2004 Statement)
|
|
|
*10.25
|
|
Summary of Non-Management Director Compensation, effective as of October 1, 2016 (incorporated by reference to Exhibit 10.1 to UnitedHealth Group Incorporated’s Quarterly Report on Form 10-Q for the quarter ended September 30, 2016)
|
|
|
*10.26
|
|
UnitedHealth Group Directors’ Compensation Deferral Plan (2009 Statement) (incorporated by reference to Exhibit 10.18 to UnitedHealth Group Incorporated’s Annual Report on Form 10-K for the year ended December 31, 2008)
|
|
|
*10.27
|
|
Amendment to the UnitedHealth Group Directors’ Compensation Deferral Plan, effective as of January 1, 2010 (incorporated by reference to Exhibit 10.20 to UnitedHealth Group Incorporated’s Annual Report on Form 10-K for the year ended December 31, 2009)
|
|
|
*10.28
|
|
First Amendment to UnitedHealth Group Directors’ Compensation Deferral Plan (incorporated by reference to Exhibit 10.2 to UnitedHealth Group Incorporated’s Quarterly Report on Form 10-Q for the quarter ended September 30, 2010)
|
|
|
*10.29
|
|
Catamaran Corporation Third Amended and Restated Long-Term Incentive Plan, as amended (incorporated by reference to Exhibit 4.3 to UnitedHealth Group Incorporated’s Registration Statement on Form S-8, SEC File Number 333-205824, filed on July 23, 2015)
|
|
|
*10.30
|
|
Catalyst Health Solutions, Inc. 2006 Stock Incentive Plan, as amended (incorporated by reference to Exhibit 4.4 to UnitedHealth Group Incorporated’s Registration Statement on Form S-8, SEC File Number 333-205824, filed on July 23, 2015)
|
|
|
*10.31
|
|
Employment Agreement, dated as of November 7, 2006, between UnitedHealth Group Incorporated and Stephen J. Hemsley (incorporated by reference to Exhibit 10.1 to UnitedHealth Group Incorporated’s Current Report on Form 8-K filed on November 8, 2006)
|
|
|
*10.32
|
|
Agreement for Supplemental Executive Retirement Pay, effective April 1, 2004, between UnitedHealth Group Incorporated and Stephen J. Hemsley (incorporated by reference to Exhibit 10(b) to UnitedHealth Group Incorporated’s Quarterly Report on Form 10-Q for the quarter ended March 31, 2004)
|
|
|
*10.33
|
|
Amendment to Agreement for Supplemental Executive Retirement Pay, dated as of November 7, 2006, between UnitedHealth Group Incorporated and Stephen J. Hemsley (incorporated by reference to Exhibit A to Exhibit 10.1 to UnitedHealth Group Incorporated’s Current Report on Form 8-K filed on November 8, 2006)
|
|
|
*10.34
|
|
Amendment to Employment Agreement and Agreement for Supplemental Executive Retirement Pay, effective as of December 31, 2008, between United HealthCare Services, Inc. and Stephen J. Hemsley (incorporated by reference to Exhibit 10.22 to UnitedHealth Group Incorporated’s Annual Report on Form 10-K for the year ended December 31, 2008)
|
|
|
*10.35
|
|
Amendment to Agreement for Supplemental Executive Retirement Pay, dated as of June 7, 2016, between UnitedHealth Group Incorporated and Stephen J. Hemsley (incorporated by reference to Exhibit 10.2 to UnitedHealth Group Incorporated’s Quarterly Report on Form 10-Q for the quarter ended June 30, 2016)
|
|
|
*10.36
|
|
Letter Agreement, effective as of February 19, 2008, by and between UnitedHealth Group Incorporated and Stephen J. Hemsley (incorporated by reference to Exhibit 10.22 to UnitedHealth Group Incorporated’s Annual Report on Form 10-K for the year ended December 31, 2007)
|
|
|
*10.37
|
|
Amendment to Employment Agreement, dated as of December 14, 2010, between UnitedHealth Group Incorporated and Stephen J. Hemsley (incorporated by reference to Exhibit 10.1 to UnitedHealth Group Incorporated’s Current Report on Form 8-K filed on December 15, 2010)
|
|
|
*10.38
|
|
Amended and Restated Employment Agreement, effective as of December 1, 2014, between United HealthCare Services, Inc. and David Wichmann (incorporated by reference to Exhibit 10.1 to UnitedHealth Group Incorporated’s Quarterly Report on Form 10-Q for the quarter ended March 31, 2015)
|
|
|
*10.39
|
|
Amended and Restated Employment Agreement, effective December 1, 2014, between United HealthCare Services, Inc. and Larry Renfro (incorporated by reference to Exhibit 10.2 to UnitedHealth Group Incorporated’s Quarterly Report on Form 10-Q for the quarter ended March 31, 2015)
|
|
|
*10.40
|
|
Amended Employment Agreement, effective as of November 1, 2012, between Amil Assistência Médica Internacional S.A. and Dr. Edson de Godoy Bueno (incorporated by reference to Exhibit 10.32 to UnitedHealth Group Incorporated’s Annual Report on Form 10-K for the year ended December 31, 2012)
|
|
|
*10.41
|
|
Employment Agreement, effective as of January 1, 2013, between United HealthCare Services, Inc. and Marianne D. Short (incorporated by reference to Exhibit 10.34 to UnitedHealth Group Incorporated’s Annual Report on Form 10-K for the year ended December 31, 2013)
|
|
|
*10.42
|
|
Amended and Restated Employment Agreement, dated as of February 3, 2014, between United HealthCare Services, Inc. and D. Ellen Wilson (incorporated by reference to Exhibit 10.40 to UnitedHealth Group Incorporated’s Annual Report on Form 10-K for the year ended December 31, 2015)
|
|
|
*10.43
|
|
Amended and Restated Employment Agreement, dated as of June 7, 2016, between United HealthCare Services, Inc. and John Rex (incorporated by reference to Exhibit 10.1 to UnitedHealth Group Incorporated’s Quarterly Report on Form 10-Q for the quarter ended June 30, 2016)
|
|
83
|
11.1
|
|
Statement regarding computation of per share earnings (incorporated by reference to the information contained under the heading “Net Earnings Per Common Share” in Note 2 of Notes to the Consolidated Financial Statements included in Part II, Item 8, “Financial Statements”)
|
|
|
12.1
|
|
Computation of Ratio of Earnings to Fixed Charges
|
|
|
21.1
|
|
Subsidiaries of UnitedHealth Group Incorporated
|
|
|
23.1
|
|
Consent of Independent Registered Public Accounting Firm
|
|
|
24.1
|
|
Power of Attorney
|
|
|
31.1
|
|
Certifications pursuant to Section 302 of the Sarbanes-Oxley Act of 2002
|
|
|
32.1
|
|
Certifications pursuant to Section 906 of the Sarbanes-Oxley Act of 2002
|
|
|
101
|
|
The following materials from UnitedHealth Group Incorporated’s Annual Report on Form 10-K for the year ended December 31, 2016, filed on February 8, 2017, formatted in XBRL (eXtensible Business Reporting Language): (i) Consolidated Balance Sheets, (ii) Consolidated Statements of Operations, (iii) Consolidated Statements of Comprehensive Income, (iv) Consolidated Statements of Changes in Equity, (v) Consolidated Statements of Cash Flows, and (vi) Notes to the Consolidated Financial Statements.
|
|
_______________________________________________
_
|
*
|
Denotes management contracts and compensation plans in which certain directors and named executive officers participate and which are being filed pursuant to Item 601(b)(10)(iii)(A) of Regulation S-K.
|
|
|
**
|
Pursuant to Item 601(b)(4)(iii) of Regulation S-K, copies of instruments defining the rights of certain holders of long-term debt are not filed. The Company will furnish copies thereof to the SEC upon request.
|
|
|
(c)
|
Financial Statement Schedule
|
Schedule I - Condensed Financial Information of Registrant (Parent Company Only).
84
Schedule I
Report of Independent Registered Public Accounting Firm
To the Board of Directors and Shareholders of UnitedHealth Group Incorporated and Subsidiaries:
We have audited the consolidated financial statements of UnitedHealth Group Incorporated and subsidiaries (the “Company”) as of December 31, 2016 and 2015, and for each of the three years in the period ended December 31, 2016, and the Company’s internal control over financial reporting as of December 31, 2016, and have issued our reports thereon dated
February 8, 2017
; such consolidated financial statements and reports are included elsewhere in this Form 10-K. Our audits also included the consolidated financial statement schedule of the Company listed in Item 15. This consolidated financial statement schedule is the responsibility of the Company’s management. Our responsibility is to express an opinion based on our audits. In our opinion, the consolidated financial statement schedule, when considered in relation to the basic consolidated financial statements taken as a whole, present fairly, in all material respects, the information set forth therein.
|
/s/ DELOITTE & TOUCHE LLP
|
|
Minneapolis, Minnesota
|
|
February 8, 2017
|
85
Schedule I
Condensed Financial Information of Registrant
(Parent Company Only)
UnitedHealth Group
Condensed Balance Sheets
|
(in millions, except per share data)
|
December 31,
2016 |
December 31,
2015 |
||||||
|
Assets
|
|
|
||||||
|
Current assets:
|
|
|
||||||
|
Cash and cash equivalents
|
$
|
180
|
|
$
|
29
|
|
||
|
Short-term notes receivable from subsidiaries
|
755
|
|
—
|
|
||||
|
Other current assets
|
140
|
|
313
|
|
||||
|
Total current assets
|
1,075
|
|
342
|
|
||||
|
Equity in net assets of subsidiaries
|
60,593
|
|
56,316
|
|
||||
|
Long-term notes receivable from subsidiaries
|
9,912
|
|
9,679
|
|
||||
|
Other assets
|
248
|
|
199
|
|
||||
|
Total assets
|
$
|
71,828
|
|
$
|
66,536
|
|
||
|
Liabilities and shareholders’ equity
|
||||||||
|
Current liabilities:
|
||||||||
|
Accounts payable and accrued liabilities
|
$
|
452
|
|
$
|
449
|
|
||
|
Note payable to subsidiary
|
280
|
|
310
|
|
||||
|
Commercial paper and current maturities of long-term debt
|
7,113
|
|
6,587
|
|
||||
|
Total current liabilities
|
7,845
|
|
7,346
|
|
||||
|
Long-term debt, less current maturities
|
25,657
|
|
25,215
|
|
||||
|
Other liabilities
|
52
|
|
145
|
|
||||
|
Total liabilities
|
33,554
|
|
32,706
|
|
||||
|
Commitments and contingencies (Note 4)
|
||||||||
|
Shareholders’ equity:
|
||||||||
|
Preferred stock, $0.001 par value -10 shares authorized; no shares issued or outstanding
|
—
|
|
—
|
|
||||
|
Common stock, $0.01 par value - 3,000 shares authorized; 952 and 953 issued and outstanding
|
10
|
|
10
|
|
||||
|
Additional paid-in capital
|
—
|
|
29
|
|
||||
|
Retained earnings
|
40,945
|
|
37,125
|
|
||||
|
Accumulated other comprehensive loss
|
(2,681
|
)
|
(3,334
|
)
|
||||
|
Total UnitedHealth Group shareholders’ equity
|
38,274
|
|
33,830
|
|
||||
|
Total liabilities and shareholders’ equity
|
$
|
71,828
|
|
$
|
66,536
|
|
||
86
Schedule I
Condensed Financial Information of Registrant
(Parent Company Only)
UnitedHealth Group
Condensed Statements of Comprehensive Income
|
|
For the Years Ended December 31,
|
|||||||||||
|
(in millions)
|
2016
|
2015
|
2014
|
|||||||||
|
Revenues:
|
|
|||||||||||
|
Investment and other income
|
$
|
522
|
|
$
|
396
|
|
$
|
293
|
|
|||
|
Total revenues
|
522
|
|
396
|
|
293
|
|
||||||
|
Operating costs:
|
||||||||||||
|
Operating costs
|
(22
|
)
|
(17
|
)
|
1
|
|
||||||
|
Interest expense
|
995
|
|
717
|
|
554
|
|
||||||
|
Total operating costs
|
973
|
|
700
|
|
555
|
|
||||||
|
Loss before income taxes
|
(451
|
)
|
(304
|
)
|
(262
|
)
|
||||||
|
Benefit for income taxes
|
165
|
|
111
|
|
96
|
|
||||||
|
Loss of parent company
|
(286
|
)
|
(193
|
)
|
(166
|
)
|
||||||
|
Equity in undistributed income of subsidiaries
|
7,303
|
|
6,006
|
|
5,785
|
|
||||||
|
Net earnings
|
7,017
|
|
5,813
|
|
5,619
|
|
||||||
|
Other comprehensive income (loss)
|
653
|
|
(1,942
|
)
|
(484
|
)
|
||||||
|
Comprehensive income
|
$
|
7,670
|
|
$
|
3,871
|
|
$
|
5,135
|
|
|||
87
Schedule I
Condensed Financial Information of Registrant
(Parent Company Only)
UnitedHealth Group
Condensed Statements of Cash Flows
|
|
For the Years Ended December 31,
|
|||||||||||
|
(in millions)
|
2016
|
2015
|
2014
|
|||||||||
|
Operating activities
|
|
|||||||||||
|
Cash flows from operating activities
|
$
|
4,294
|
|
$
|
1,727
|
|
$
|
7,445
|
|
|||
|
Investing activities
|
||||||||||||
|
Issuance of notes to subsidiaries
|
(824
|
)
|
(5,064
|
)
|
(436
|
)
|
||||||
|
Cash paid for acquisitions
|
(2,292
|
)
|
(12,270
|
)
|
(1,852
|
)
|
||||||
|
Return of capital to parent company
|
2,143
|
|
4,375
|
|
—
|
|
||||||
|
Capital contributions to subsidiaries
|
(765
|
)
|
(1,109
|
)
|
(704
|
)
|
||||||
|
Other, net
|
168
|
|
140
|
|
(9
|
)
|
||||||
|
Cash flows used for investing activities
|
(1,570
|
)
|
(13,928
|
)
|
(3,001
|
)
|
||||||
|
Financing activities
|
||||||||||||
|
Common stock repurchases
|
(1,280
|
)
|
(1,200
|
)
|
(4,008
|
)
|
||||||
|
Proceeds from common stock issuances
|
429
|
|
402
|
|
462
|
|
||||||
|
Cash dividends paid
|
(2,261
|
)
|
(1,786
|
)
|
(1,362
|
)
|
||||||
|
(Repayments of) proceeds from commercial paper, net
|
(382
|
)
|
3,666
|
|
(794
|
)
|
||||||
|
Proceeds from issuance of long-term debt
|
3,968
|
|
11,982
|
|
1,997
|
|
||||||
|
Repayments of long-term debt
|
(2,596
|
)
|
(1,041
|
)
|
(812
|
)
|
||||||
|
Other, net
|
(451
|
)
|
(352
|
)
|
(190
|
)
|
||||||
|
Cash flows (used for) from financing activities
|
(2,573
|
)
|
11,671
|
|
(4,707
|
)
|
||||||
|
Increase (decrease) in cash and cash equivalents
|
151
|
|
(530
|
)
|
(263
|
)
|
||||||
|
Cash and cash equivalents, beginning of period
|
29
|
|
559
|
|
822
|
|
||||||
|
Cash and cash equivalents, end of period
|
$
|
180
|
|
$
|
29
|
|
$
|
559
|
|
|||
|
Supplemental cash flow disclosures
|
||||||||||||
|
Cash paid for interest
|
$
|
974
|
|
$
|
573
|
|
$
|
578
|
|
|||
|
Cash paid for income taxes
|
4,557
|
|
4,294
|
|
4,028
|
|
||||||
See
Notes to the Condensed Financial Statements
of Registrant
88
Schedule I
Condensed Financial Information of Registrant
(Parent Company Only)
UnitedHealth Group
Notes to Condensed Financial Statements
1. Basis of Presentation
UnitedHealth Group’s parent company financial information has been derived from its consolidated financial statements and should be read in conjunction with the consolidated financial statements included in this Form 10-K. The accounting policies for the registrant are the same as those described in
Note 2 of Notes to the Consolidated Financial Statements included in Part II, Item 8, “Financial Statements.”
2. Subsidiary Transactions
Investment in Subsidiaries.
UnitedHealth Group’s investment in subsidiaries is stated at cost plus equity in undistributed earnings of subsidiaries.
Intercompany Notes.
In July 2015, the parent company issued
$4.8 billion
in intercompany notes that were used to partially fund the acquisition of Catamaran. See
Note 6 of Notes to the Consolidated Financial Statements included in Part II, Item 8, “Financial Statements” for more information about Catamaran.
Dividends and Capital Distributions.
Cash dividends received from subsidiaries and included in Cash Flows from Operating Activities in the Condensed Statements of Cash Flows were
$3.7 billion
,
$4.8 billion
and
$5.5 billion
in 2016, 2015 and 2014, respectively. Additionally,
$2.1 billion
and
$4.4 billion
in cash were received as a return of capital to the parent company during 2016 and 2015, respectively.
3. Commercial Paper and Long-Term Debt
Discussion of commercial paper and long-term debt can be found in
Note 8 of Notes to the Consolidated Financial Statements included in Part II, Item 8, “Financial Statements.”
Long-term debt obligations of the parent company do not include other financing obligations at subsidiaries that totaled
$200 million
and
$164 million
at December 31, 2016 and 2015, respectively.
Maturities of commercial paper and long-term debt for the years ending December 31 are as follows:
|
(in millions)
|
||||
|
2017
|
$
|
7,105
|
|
|
|
2018
|
2,600
|
|
||
|
2019
|
1,750
|
|
||
|
2020
|
1,950
|
|
||
|
2021
|
2,400
|
|
||
|
Thereafter
|
17,217
|
|
||
4. Commitments and Contingencies
For a summary of commitments and contingencies, see
Note 12 of Notes to the Consolidated Financial Statements included in Part II, Item 8, “Financial Statements.”
89
SIGNATURES
Pursuant to the requirements of Section 13 or 15(d) of the Securities Exchange Act of 1934, the registrant has duly caused this report to be signed on its behalf by the undersigned, thereunto duly authorized.
Dated:
February 8, 2017
|
UNITEDHEALTH GROUP INCORPORATED
|
|
|
By
|
/s/ STEPHEN J. HEMSLEY
|
|
|
Stephen J. Hemsley
Chief Executive Officer
|
Pursuant to the requirements of the Securities Exchange Act of 1934, this report has been signed below by the following persons on behalf of the registrant and in the capacities and on the dates indicated.
|
Signature
|
Title
|
Date
|
||
|
/s/ S
TEPHEN
J. H
EMSLEY
|
Director and Chief Executive Officer
(principal executive officer)
|
February 8, 2017
|
||
|
Stephen J. Hemsley
|
||||
|
/s/ J
OHN
F. R
EX
|
Executive Vice President and Chief Financial Officer
(principal financial officer)
|
February 8, 2017
|
||
|
John F. Rex
|
||||
|
/s/ T
HOMAS
E. R
OOS
|
Senior Vice President and
Chief Accounting Officer
(principal accounting officer)
|
February 8, 2017
|
||
|
Thomas E. Roos
|
||||
|
*
|
Director
|
February 8, 2017
|
||
|
William C. Ballard, Jr.
|
||||
|
*
|
Director
|
February 8, 2017
|
||
|
Edson Bueno
|
||||
|
*
|
Director
|
February 8, 2017
|
||
|
Richard T. Burke
|
||||
|
Director
|
||||
|
Robert J. Darretta
|
||||
|
*
|
Director
|
February 8, 2017
|
||
|
Timothy P. Flynn
|
||||
|
*
|
Director
|
February 8, 2017
|
||
|
Michele J. Hooper
|
||||
|
*
|
Director
|
February 8, 2017
|
||
|
Rodger A. Lawson
|
||||
|
*
|
Director
|
February 8, 2017
|
||
|
Glenn M. Renwick
|
||||
|
*
|
Director
|
February 8, 2017
|
||
|
Kenneth I. Shine
|
||||
|
*
|
Director
|
February 8, 2017
|
||
|
Gail R. Wilensky
|
||||
|
*By
|
/s/ MARIANNE D. SHORT
|
|
|
Marianne D. Short,
As Attorney-in-Fact
|
90
EXHIBIT INDEX**
|
3.1
|
|
Certificate of Incorporation of UnitedHealth Group Incorporated (incorporated by reference to Exhibit 3.1 to UnitedHealth Group Incorporated’s Registration Statement on Form 8-A/A, Commission File No. 1-10864, filed on July 1, 2015)
|
|
|
3.2
|
|
Bylaws of UnitedHealth Group Incorporated (incorporated by reference to Exhibit 3.1 to UnitedHealth Group Incorporated’s Current Report on Form 8-K filed on February 12, 2016)
|
|
|
4.1
|
|
Senior Indenture, dated as of November 15, 1998, between United HealthCare Corporation and The Bank of New York (incorporated by reference to Exhibit 4.1 to UnitedHealth Group Incorporated’s Registration Statement on Form S-3/A, SEC File Number 333-66013, filed on January 11, 1999)
|
|
|
4.2
|
|
Amendment, dated as of November 6, 2000, to Senior Indenture, dated as of November 15, 1998, between the UnitedHealth Group Incorporated and The Bank of New York (incorporated by reference to Exhibit 4.1 to UnitedHealth Group Incorporated’s Quarterly Report on Form 10-Q for the quarter ended September 30, 2001)
|
|
|
4.3
|
|
Instrument of Resignation, Appointment and Acceptance of Trustee, dated January 8, 2007, pursuant to the Senior Indenture, dated as of November 15, 1988, amended as of November 6, 2000, among UnitedHealth Group Incorporated, The Bank of New York and Wilmington Trust Company (incorporated by reference to Exhibit 4.3 to UnitedHealth Group Incorporated’s Quarterly Report on Form 10-Q for the quarter ended June 30, 2007)
|
|
|
4.4
|
|
Indenture, dated as of February 4, 2008, between UnitedHealth Group Incorporated and U.S. Bank National Association (incorporated by reference to Exhibit 4.1 to UnitedHealth Group Incorporated’s Registration Statement on Form S-3, SEC File Number 333-149031, filed on February 4, 2008)
|
|
|
*10.1
|
|
UnitedHealth Group Incorporated 2011 Stock Incentive Plan, as amended and restated in 2015 (incorporated by reference to Exhibit 10.1 to UnitedHealth Group Incorporated’s Current Report on Form 8-K filed on June 5, 2015)
|
|
|
*10.2
|
|
Amendment to UnitedHealth Group Incorporated’s Stock Option and Stock Appreciation Right Awards, effective November 6, 2014 (incorporated by reference to Exhibit 10.2 to UnitedHealth Group Incorporated’s Annual Report on Form 10-K for the year ended December 31, 2014)
|
|
|
*10.3
|
|
Form of Agreement for Non-Qualified Stock Option Award to Executives under UnitedHealth Group Incorporated’s 2011 Stock Incentive Plan, as amended and restated in 2015, for awards made after January 1, 2016 (incorporated by reference to Exhibit 10.4 to UnitedHealth Group Incorporated’s Quarterly Report on Form 10-Q for the quarter ended September 30, 2015)
|
|
|
*10.4
|
|
Form of Agreement for Non-Qualified Stock Option Award for International Participants under UnitedHealth Group Incorporated's 2011 Stock Incentive Plan (incorporated by reference to Exhibit 10.3 to UnitedHealth Group Incorporated’s Annual Report on Form 10-K for the year ended December 31, 2013)
|
|
|
*10.5
|
|
Form of Addendum for Non-Qualified Stock Option Award Agreement for International Participants under UnitedHealth Group Incorporated's 2011 Stock Incentive Plan (incorporated by reference to Exhibit 10.37 to UnitedHealth Group Incorporated’s Annual Report on Form 10-K for the year ended December 31, 2012)
|
|
|
*10.6
|
|
Form of Agreement for Restricted Stock Unit Award to Executives under UnitedHealth Group Incorporated’s 2011 Stock Incentive Plan, as amended and restated in 2015, for awards made after January 1, 2016 (incorporated by reference to Exhibit 10.5 to UnitedHealth Group Incorporated’s Quarterly Report on Form 10-Q for the quarter ended September 30, 2015)
|
|
|
*10.7
|
|
Form of Agreement for Restricted Stock Award to Executives under UnitedHealth Group Incorporated’s 2011 Stock Incentive Plan (incorporated by reference to Exhibit 10.5 to UnitedHealth Group Incorporated’s Current Report on Form 8-K filed on May 27, 2011)
|
|
|
*10.8
|
|
Form of Agreement for Stock Appreciation Rights Award to Executives under UnitedHealth Group Incorporated’s 2011 Stock Incentive Plan (incorporated by reference to Exhibit 10.4 to UnitedHealth Group Incorporated’s Current Report on Form 8-K filed on May 27, 2011)
|
|
|
*10.9
|
|
Form of Agreement for Performance-based Restricted Stock Unit Award to Executives under UnitedHealth Group Incorporated’s 2011 Stock Incentive Plan, as amended and restated in 2015, for awards made after January 1, 2016 (incorporated by reference to Exhibit 10.6 to UnitedHealth Group Incorporated’s Quarterly Report on Form 10-Q for the quarter ended September 30, 2015)
|
|
|
*10.10
|
|
Form of Agreement for Initial Deferred Stock Unit Award to Non-Employee Directors under UnitedHealth Group Incorporated’s 2011 Stock Incentive Plan (incorporated by reference to Exhibit 10.7 to UnitedHealth Group Incorporated’s Current Report on Form 8-K filed on May 27, 2011)
|
|
|
*10.11
|
|
Form of Agreement for Deferred Stock Unit Award to Non-Employee Directors under UnitedHealth Group Incorporated’s 2011 Stock Incentive Plan (incorporated by reference to Exhibit 10.6 to UnitedHealth Group Incorporated’s Current Report on Form 8-K filed on May 27, 2011)
|
|
|
10.12
|
|
Form of Indemnification Agreement (incorporated by reference to Exhibit 10.1 to UnitedHealth Group Incorporated’s Current Report on Form 8-K filed on July 1, 2015)
|
|
91
|
*10.13
|
|
Amended and Restated UnitedHealth Group Incorporated Executive Incentive Plan (2009 Statement), effective as of December 31, 2008 (incorporated by reference to Exhibit 10.12 to UnitedHealth Group Incorporated’s Annual Report on Form 10-K for the year ended December 31, 2008)
|
|
|
*10.14
|
|
Amended and Restated UnitedHealth Group Incorporated 2008 Executive Incentive Plan, effective as of December 31, 2008 (incorporated by reference to Exhibit 10.13 to UnitedHealth Group Incorporated’s Annual Report on Form 10-K for the year ended December 31, 2008)
|
|
|
*10.15
|
|
Amendment, dated as of December 21, 2012, of Amended and Restated UnitedHealth Group Incorporated 2008 Executive Incentive Plan (incorporated by reference to Exhibit 10.11 to UnitedHealth Group Incorporated’s Annual Report on Form 10-K for the year ended December 31, 2012)
|
|
|
*10.16
|
|
Second Amendment, dated as of November 5, 2015, of Amended and Restated UnitedHealth Group Incorporated 2008 Executive Incentive Plan (incorporated by reference to Exhibit 10.3 to UnitedHealth Group Incorporated’s Quarterly Report on Form 10-Q for the quarter ended September 30, 2015)
|
|
|
*10.17
|
|
UnitedHealth Group Executive Savings Plan (2004 Statement) (incorporated by reference to Exhibit 10(e) of UnitedHealth Group Incorporated’s Annual Report on Form 10-K for the year ended December 31, 2003)
|
|
|
*10.18
|
|
First Amendment to UnitedHealth Group Executive Savings Plan (2004 Statement) (incorporated by reference to Exhibit 10.3 to UnitedHealth Group Incorporated’s Current Report on Form 8-K filed on November 3, 2006)
|
|
|
*10.19
|
|
Second Amendment to UnitedHealth Group Executive Savings Plan (2004 Statement) (incorporated by reference to Exhibit 10.13 to UnitedHealth Group Incorporated’s Annual Report on Form 10-K for the year ended December 31, 2007)
|
|
|
*10.20
|
|
Third Amendment to UnitedHealth Group Executive Savings Plan (2004 Statement) (incorporated by reference to Exhibit 10.17 to UnitedHealth Group Incorporated’s Annual Report on Form 10-K for the year ended December 31, 2008)
|
|
|
*10.21
|
|
Fourth Amendment to UnitedHealth Group Executive Savings Plan (2004 Statement) (incorporated by reference to Exhibit 10.1 to UnitedHealth Group Incorporated’s Quarterly Report on Form 10-Q for the quarter ended September 30, 2010)
|
|
|
*10.22
|
|
Fifth Amendment to UnitedHealth Group Executive Savings Plan (2004 Statement) (incorporated by reference to Exhibit 10.2 to UnitedHealth Group Incorporated’s Quarterly Report on Form 10-Q for the quarter ended September 30, 2014)
|
|
|
*10.23
|
|
Sixth Amendment to UnitedHealth Group Executive Savings Plan (2004 Statement) (incorporated by reference to Exhibit 10.2 to UnitedHealth Group Incorporated’s Quarterly Report on Form 10-Q for the quarter ended September 30, 2015)
|
|
|
*10.24
|
|
Seventh Amendment to UnitedHealth Group Executive Savings Plan (2004 Statement)
|
|
|
*10.25
|
|
Summary of Non-Management Director Compensation, effective as of October 1, 2016 (incorporated by reference to Exhibit 10.1 to UnitedHealth Group Incorporated’s Quarterly Report on Form 10-Q for the quarter ended September 30, 2016)
|
|
|
*10.26
|
|
UnitedHealth Group Directors’ Compensation Deferral Plan (2009 Statement) (incorporated by reference to Exhibit 10.18 to UnitedHealth Group Incorporated’s Annual Report on Form 10-K for the year ended December 31, 2008)
|
|
|
*10.27
|
|
Amendment to the UnitedHealth Group Directors’ Compensation Deferral Plan, effective as of January 1, 2010 (incorporated by reference to Exhibit 10.20 to UnitedHealth Group Incorporated’s Annual Report on Form 10-K for the year ended December 31, 2009)
|
|
|
*10.28
|
|
First Amendment to UnitedHealth Group Directors’ Compensation Deferral Plan (incorporated by reference to Exhibit 10.2 to UnitedHealth Group Incorporated’s Quarterly Report on Form 10-Q for the quarter ended September 30, 2010)
|
|
|
*10.29
|
|
Catamaran Corporation Third Amended and Restated Long-Term Incentive Plan, as amended (incorporated by reference to Exhibit 4.3 to UnitedHealth Group Incorporated’s Registration Statement on Form S-8, SEC File Number 333-205824, filed on July 23, 2015)
|
|
|
*10.30
|
|
Catalyst Health Solutions, Inc. 2006 Stock Incentive Plan, as amended (incorporated by reference to Exhibit 4.4 to UnitedHealth Group Incorporated’s Registration Statement on Form S-8, SEC File Number 333-205824, filed on July 23, 2015)
|
|
|
*10.31
|
|
Employment Agreement, dated as of November 7, 2006, between UnitedHealth Group Incorporated and Stephen J. Hemsley (incorporated by reference to Exhibit 10.1 to UnitedHealth Group Incorporated’s Current Report on Form 8-K filed on November 8, 2006)
|
|
|
*10.32
|
|
Agreement for Supplemental Executive Retirement Pay, effective April 1, 2004, between UnitedHealth Group Incorporated and Stephen J. Hemsley (incorporated by reference to Exhibit 10(b) to UnitedHealth Group Incorporated’s Quarterly Report on Form 10-Q for the quarter ended March 31, 2004)
|
|
|
*10.33
|
|
Amendment to Agreement for Supplemental Executive Retirement Pay, dated as of November 7, 2006, between UnitedHealth Group Incorporated and Stephen J. Hemsley (incorporated by reference to Exhibit A to Exhibit 10.1 to UnitedHealth Group Incorporated’s Current Report on Form 8-K filed on November 8, 2006)
|
|
92
|
*10.34
|
|
Amendment to Employment Agreement and Agreement for Supplemental Executive Retirement Pay, effective as of December 31, 2008, between United HealthCare Services, Inc. and Stephen J. Hemsley (incorporated by reference to Exhibit 10.22 to UnitedHealth Group Incorporated’s Annual Report on Form 10-K for the year ended December 31, 2008)
|
|
|
*10.35
|
|
Amendment to Agreement for Supplemental Executive Retirement Pay, dated as of June 7, 2016, between UnitedHealth Group Incorporated and Stephen J. Hemsley (incorporated by reference to Exhibit 10.2 to UnitedHealth Group Incorporated’s Quarterly Report on Form 10-Q for the quarter ended June 30, 2016)
|
|
|
*10.36
|
|
Letter Agreement, effective as of February 19, 2008, by and between UnitedHealth Group Incorporated and Stephen J. Hemsley (incorporated by reference to Exhibit 10.22 to UnitedHealth Group Incorporated’s Annual Report on Form 10-K for the year ended December 31, 2007)
|
|
|
*10.37
|
|
Amendment to Employment Agreement, dated as of December 14, 2010, between UnitedHealth Group Incorporated and Stephen J. Hemsley (incorporated by reference to Exhibit 10.1 to UnitedHealth Group Incorporated’s Current Report on Form 8-K filed on December 15, 2010)
|
|
|
*10.38
|
|
Amended and Restated Employment Agreement, effective as of December 1, 2014, between United HealthCare Services, Inc. and David Wichmann (incorporated by reference to Exhibit 10.1 to UnitedHealth Group Incorporated’s Quarterly Report on Form 10-Q for the quarter ended March 31, 2015)
|
|
|
*10.39
|
|
Amended and Restated Employment Agreement, effective December 1, 2014, between United HealthCare Services, Inc. and Larry Renfro (incorporated by reference to Exhibit 10.2 to UnitedHealth Group Incorporated’s Quarterly Report on Form 10-Q for the quarter ended March 31, 2015)
|
|
|
*10.40
|
|
Amended Employment Agreement, effective as of November 1, 2012, between Amil Assistência Médica Internacional S.A. and Dr. Edson de Godoy Bueno (incorporated by reference to Exhibit 10.32 to UnitedHealth Group Incorporated’s Annual Report on Form 10-K for the year ended December 31, 2012)
|
|
|
*10.41
|
|
Employment Agreement, effective as of January 1, 2013, between United HealthCare Services, Inc. and Marianne D. Short (incorporated by reference to Exhibit 10.34 to UnitedHealth Group Incorporated’s Annual Report on Form 10-K for the year ended December 31, 2013)
|
|
|
*10.42
|
|
Amended and Restated Employment Agreement, dated as of February 3, 2014, between United HealthCare Services, Inc. and D. Ellen Wilson (incorporated by reference to Exhibit 10.40 to UnitedHealth Group Incorporated’s Annual Report on Form 10-K for the year ended December 31, 2015)
|
|
|
*10.43
|
|
Amended and Restated Employment Agreement, dated as of June 7, 2016, between United HealthCare Services, Inc. and John Rex (incorporated by reference to Exhibit 10.1 to UnitedHealth Group Incorporated’s Quarterly Report on Form 10-Q for the quarter ended June 30, 2016)
|
|
|
11.1
|
|
Statement regarding computation of per share earnings (incorporated by reference to the information contained under the heading “Net Earnings Per Common Share” in Note 2 of Notes to the Consolidated Financial Statements included in Part II, Item 8, “Financial Statements”)
|
|
|
12.1
|
|
Computation of Ratio of Earnings to Fixed Charges
|
|
|
21.1
|
|
Subsidiaries of UnitedHealth Group Incorporated
|
|
|
23.1
|
|
Consent of Independent Registered Public Accounting Firm
|
|
|
24.1
|
|
Power of Attorney
|
|
|
31.1
|
|
Certifications pursuant to Section 302 of the Sarbanes-Oxley Act of 2002
|
|
|
32.1
|
|
Certifications pursuant to Section 906 of the Sarbanes-Oxley Act of 2002
|
|
|
101
|
|
The following materials from UnitedHealth Group Incorporated’s Annual Report on Form 10-K for the year ended December 31, 2016, filed on February 8, 2017, formatted in XBRL (eXtensible Business Reporting Language): (i) Consolidated Balance Sheets, (ii) Consolidated Statements of Operations, (iii) Consolidated Statements of Comprehensive Income, (iv) Consolidated Statements of Changes in Equity, (v) Consolidated Statements of Cash Flows, and (vi) Notes to the Consolidated Financial Statements.
|
|
_______________________________________________
_
|
*
|
Denotes management contracts and compensation plans in which certain directors and named executive officers participate and which are being filed pursuant to Item 601(b)(10)(iii)(A) of Regulation S-K.
|
|
|
**
|
Pursuant to Item 601(b)(4)(iii) of Regulation S-K, copies of instruments defining the rights of certain holders of long-term debt are not filed. The Company will furnish copies thereof to the SEC upon request.
|
|
93
TABLE OF CONTENTS
Part IItem 1. BusinessItem 1A. Risk FactorsItem 1B. Unresolved Staff CommentsItem 2. PropertiesItem 3. Legal ProceedingsItem 4. Mine Safety DisclosuresPart IIItem 5. Market For Registrant S Common Equity, Related Shareholder Matters and Issuer Purchases Of Equity SecuritiesItem 6. Selected Financial DataItem 7. Management S Discussion and Analysis Of Financial Condition and Results Of OperationsItem 7A. Quantitative and Qualitative Disclosures About Market RiskItem 8. Financial StatementsItem 9. Changes in and Disagreements with Accountants on Accounting and Financial DisclosureItem 9A. Controls and ProceduresItem 9B. Other InformationPart IIIItem 10. Directors, Executive Officers and Corporate GovernanceItem 11. Executive CompensationItem 12. Security Ownership Of Certain Beneficial Owners and Management and Related Shareholder MattersItem 13. Certain Relationships and Related Transactions, and Director IndependenceItem 14. Principal Accountant Fees and ServicesPart IVItem 15. Exhibits and Financial Statement Schedules