UNIT CORP
10-Ks and 10-Qs
|
|
|
|
|
|
|
|
|
|
|
|
|
|
|
|
|
|
|
|
|
|
|
|
|
|
|
|
|
UNITED STATES
SECURITIES AND EXCHANGE COMMISSION
WASHINGTON, D.C. 20549
FORM 10-K
ANNUAL REPORT PURSUANT TO SECTION 13 OR 15(d) OF THE
SECURITIES EXCHANGE ACT OF 1934
For the fiscal year ended
December 31, 2017
OR
TRANSITION REPORT PURSUANT TO SECTION 13 OR 15(d) OF THE
SECURITIES EXCHANGE ACT OF 1934
For the transition period from to
Commission file number: 1-9260

UNIT CORPORATION
(Exact name of registrant as specified in its charter)
|
Delaware
|
73-1283193
|
|
(State or other jurisdiction of incorporation or organization)
|
(I.R.S. Employer Identification No.)
|
|
8200 South Unit Drive, Tulsa, Oklahoma
|
74132
|
|
(Address of principal executive offices)
|
(Zip Code)
|
(Registrant’s telephone number, including area code) (918) 493-7700
Securities registered pursuant to Section 12(b) of the Act:
|
Title of each class
|
Name of each exchange on which registered
|
|
Common Stock, par value $.20 per share
|
NYSE
|
Securities registered pursuant to Section 12(g) of the Act: None
Indicate by check mark if the registrant is a well-known seasoned issuer, as defined in Rule 405 of the Securities Act. Yes [x] No [ ]
Indicate by check mark if the registrant is not required to file reports pursuant to Section 13 or Section 15(d) of the Exchange Act. Yes [ ] No [x]
Indicate by check mark whether the registrant (1) has filed all reports required to be filed by Section 13 or 15(d) of the Securities Exchange Act of 1934 during the preceding 12 months (or for such shorter period that the registrant was required to file such reports), and (2) has been subject to such filing requirements for the past 90 days. Yes [x] No [ ]
Indicate by check mark whether the registrant has submitted electronically and posted on its corporate Web site, if any, every Interactive Data File required to be submitted and posted pursuant to Rule 405 of Regulation S-T (§232.405 of this chapter) during the preceding 12 months (or for such shorter period that the registrant was required to submit and post such files). Yes [x] No [ ]
Indicate by check mark if disclosure of delinquent filers pursuant to Item 405 of Regulation S-K is not contained herein, and will not be contained, to the best of registrant’s knowledge, in definitive proxy or information statements incorporated by reference in Part III of this Form 10-K or any amendment to this Form 10-K. [x]
Indicate by check mark whether the registrant is a large accelerated filer, an accelerated filer, a non-accelerated filer, or a smaller reporting company. See the definitions of “large accelerated filer”, “accelerated filer” and “smaller reporting company” in Rule 12b-2 of the Exchange Act.
Large accelerated filer [ x ] Accelerated filer [ ] Non-accelerated filer (Do not check if a smaller reporting company) [ ]
Smaller reporting company [ ] Emerging growth company [ ]
If an emerging growth company, indicate by check mark if the registrant has elected not to use the extended transition period for complying with any new or revised financial accounting standards provided pursuant to Section 13(a) of the Exchange Act. [ ]
Indicate by check mark whether the registrant is a shell company (as defined in Rule 12b-2 of the Exchange Act) Yes [ ] No [x]
As of
June 30, 2017
, the aggregate market value of the voting and non-voting common equity (based on the closing price of the stock on the NYSE on
June 30, 2017
) held by non-affiliates was approximately
$958,140,471
. Determination of stock ownership by non-affiliates was made solely for the purpose of this requirement, and the registrant is not bound by these determinations for any other purpose.
Indicate the number of shares outstanding of each of the issuer’s classes of common stock, as of the latest practicable date.
|
Class
|
Outstanding at February 13, 2018
|
|
Common Stock, $0.20 par value per share
|
53,061,832 shares
|
DOCUMENTS INCORPORATED BY REFERENCE
|
Document
|
Parts Into Which Incorporated
|
|
Portions of the registrant’s definitive proxy statement (the Proxy Statement) with respect to its annual meeting of shareholders scheduled to be held on May 2, 2018. The Proxy Statement will be filed within 120 days after the end of the fiscal year to which this report relates.
|
Part III
|
Exhibit Index—See Page 122
FORM 10-K
UNIT CORPORATION
TABLE OF CONTENTS
|
|
|
Page
|
|
PART I
|
||
|
Item 1.
|
||
|
Item 1A.
|
||
|
Item 1B.
|
||
|
Item 2.
|
||
|
Item 3.
|
||
|
Item 4.
|
||
|
PART II
|
||
|
Item 5.
|
||
|
Item 6.
|
||
|
Item 7.
|
||
|
Item 7A.
|
||
|
Item 8.
|
||
|
Item 9.
|
||
|
Item 9A.
|
||
|
Item 9B.
|
||
|
PART III
|
||
|
Item 10.
|
||
|
Item 11.
|
||
|
Item 12.
|
||
|
Item 13.
|
||
|
Item 14.
|
||
|
PART IV
|
||
|
Item 15.
|
||
|
Item 16.
|
||
DEFINITIONS
The following are explanations of some of the terms used in this report.
ARO
– Asset retirement obligations.
ASC
– FASB Accounting Standards Codification.
ASU
– Accounting Standards Update.
Bcf
– Billion cubic feet of natural gas.
Bcfe
– Billion cubic feet of natural gas equivalent. Determined using the ratio of one barrel of crude oil or NGLs to six Mcf of natural gas.
Bbl
– Barrel, or 42 U.S. gallons liquid volume.
Boe
– Barrel of oil equivalent. Determined using the ratio of six Mcf of natural gas to one barrel of crude oil or NGLs.
BOKF
– Bank of Oklahoma Financial Corporation.
Btu
– British thermal unit, used in gas volumes. Btu is used to refer to the amount of natural gas required to raise the temperature of one pound of water by one-degree Fahrenheit at one atmospheric pressure.
Development drilling
– The drilling of a well within the proved area of an oil or gas reservoir to the depth of a stratigraphic horizon known to be productive.
DD&A
– Depreciation, depletion, and amortization.
FASB
– Financial and Accounting Standards Board.
Finding and development costs
– Costs associated with acquiring and developing proved natural gas and oil reserves capitalized under generally accepted accounting principles, including any capitalized general and administrative expenses.
Gross acres or gross wells
– The total acres or wells in which a working interest is owned.
IF
– Inside FERC (U.S. Federal Energy Regulatory Commission).
LIBOR
– London Interbank Offered Rate.
MBbls
– Thousand barrels of crude oil or other liquid hydrocarbons.
Mcf
– Thousand cubic feet of natural gas.
Mcfe
– Thousand cubic feet of natural gas equivalent. Determined using the ratio of one barrel of crude oil or NGLs to six Mcf of natural gas.
MMBbls
– Million barrels of crude oil or other liquid hydrocarbons.
MMBoe
– Million barrels of oil equivalents.
MMBtu
– Million Btu’s.
MMcf
– Million cubic feet of natural gas.
MMcfe
– Million cubic feet of natural gas equivalent. Determined using the ratio of one barrel of crude oil or NGLs to six Mcf of natural gas.
Net acres or net wells
– The total fractional working interests owned in gross acres or gross wells.
NGLs
– Natural gas liquids.
NYMEX
– The New York Mercantile Exchange.
Play
– A term applied by geologists and geophysicists identifying an area with potential oil and gas reserves.
DEFINITIONS — (Continued)
Producing property
– A natural gas or oil property with existing production.
Proved developed reserves
– Reserves expected to be recovered through existing wells with existing equipment and operating methods or in which the cost of the required equipment is relatively minor compared to the cost of a new well; and through installed extraction equipment and infrastructure operational at the time of the reserves estimate. For additional information, see the SEC’s definition in Rule 4-10(a)(3) of Regulation S-X.
Proved reserves
– Proved oil and gas reserves are those quantities of oil and gas, which, by analysis of geosciences and engineering data, can be estimated with reasonable certainty to be economically producible – from a given date forward, from known reservoirs and under existing economic conditions, operating methods, and government regulations – before the time when the contracts providing the right to operate expire, unless evidence indicates that renewal is reasonably certain, regardless of whether deterministic or probabilistic methods are used for the estimation. The project to extract the hydrocarbons must have commenced or the operator must be reasonably certain that it will commence the project within a reasonable time. For additional information, see the SEC’s definition in Rule 4-10(a)(2)(i) through (iii) of Regulation S-X.
Proved undeveloped reserves
– Proved reserves expected to be recovered from new wells on undrilled acreage, or from existing wells where a relatively major expenditure is required for recompletion. For additional information, see the SEC’s definition in Rule 4-10(a)(4) of Regulation S-X.
Reasonable certainty (regarding reserves)
– If deterministic methods are used, reasonable certainty means high confidence that the quantities will be recovered. If probabilistic methods are used, there should be at least a 90% probability that the quantities recovered will equal or exceed the estimate.
Reliable technology
– A grouping of one or more technologies (including computational methods) that has been field tested and has been demonstrated to provide reasonably certain results with consistency and repeatability in the formation being evaluated or in an analogous formation.
SARs
– Stock appreciation rights.
Unconventional play
– Plays targeting tight sand, carbonates, coal bed, or oil and gas shale reservoirs. The reservoirs tend to cover large areas and lack the readily apparent traps, seals, and discrete hydrocarbon-water boundaries that typically define conventional reservoirs. These reservoirs generally require horizontal wells and fracture stimulation treatments or other special recovery processes to produce economically.
Undeveloped acreage
– Lease acreage on which wells have not been drilled or completed to a point that would permit the production of economic quantities of natural gas or oil regardless of whether the acreage contains proved reserves.
Well spacing
– The regulation of the number and location of wells over an oil or gas reservoir, as a conservation measure. Well spacing is normally accomplished by order of the appropriate regulatory conservation commission.
Workovers
– Operations on a producing well to restore or increase production.
WTI
– West Texas Intermediate, the benchmark crude oil in the United States.
UNIT CORPORATION
Annual Report
For The Year Ended
December 31, 2017
Unless otherwise indicated or required by the context, the terms “Company”, “Unit”, “us”, “our”, “we”, and “its” refer to Unit Corporation or, as appropriate, one or more of its subsidiaries.
Our executive offices are at 8200 South Unit Drive, Tulsa, Oklahoma 74132; our telephone number is (918) 493-7700.
Information regarding our annual reports on Form 10-K, quarterly reports on Form 10-Q, current reports on Form 8-K, and any amendments to these reports, will be provided free in print to any shareholders who request them. They are also available on our internet website at
www.unitcorp.com
, as soon as reasonably practicable after we electronically file these reports with or furnish them to the Securities and Exchange Commission (SEC). Materials we file with the SEC may be read and copied at the SEC’s Public Reference Room at 100 F. Street, N.E. Room 1580, N.W., Washington, D.C. 20549. Information on the operation of the Public Reference Room may be obtained by calling the SEC at 1-800-SEC-0330. The SEC also maintains an Internet website at
www.sec.gov
that contains reports, proxy and information statements, and other information about us that we file electronically with the SEC.
In addition, we post on our Internet website,
www.unitcorp.com
, copies of our corporate governance documents. Our corporate governance guidelines and code of ethics, and the charters of our Board’s Audit, Compensation, and Nominating and Governance Committees, are available for free on our website or in print to any shareholder who requests them. We may occasionally provide important disclosures to investors by posting them in the investor information section of our website, as allowed by SEC rules.
GENERAL
We were founded in 1963 as an oil and natural gas contract drilling company. Today, besides our drilling operations, we have operations in the exploration and production and mid-stream areas. We operate, manage, and analyze our results of operations through our three principal business segments:
|
•
|
Oil and Natural Gas
– carried out by our subsidiary Unit Petroleum Company. This segment explores, develops, acquires, and produces oil and natural gas properties for our own account.
|
|
•
|
Contract Drilling
– carried out by our subsidiary Unit Drilling Company. This segment contracts to drill onshore oil and natural gas wells for others and for our own account.
|
|
•
|
Mid-Stream
– carried out by our subsidiary Superior Pipeline Company, L.L.C. and its subsidiaries. This segment buys, sells, gathers, processes, and treats natural gas for third parties and for our own account.
|
Each company may conduct operations through subsidiaries of its own.
1
This table provides certain information about us as of
February 13, 2018
:
|
Oil and Natural Gas
|
||
|
Completed gross wells in which we own an interest
|
6,375
|
|
|
Contract Drilling
|
||
|
Number of drilling rigs available for use
|
95
|
|
|
Mid-Stream
|
||
|
Number of natural gas treatment plants we own
|
3
|
|
|
Number of processing plants we own
|
13
|
|
|
Number of natural gas gathering systems we own
(1)
|
22
|
|
_________________________
(1) In 2018, two gathering systems were transferred to our oil and natural gas segment.
2017
SEGMENT OPERATIONS HIGHLIGHTS
Oil and Natural Gas
|
•
|
Acquired certain oil and natural gas assets located primarily in Grady and Caddo Counties in western Oklahoma for approximately $54.3 million.
|
|
•
|
Total year-end 2017 proved oil and natural gas reserves increased 27% over 2016.
|
|
•
|
Replaced 300% of 2017 production with new reserves.
|
|
•
|
Sold non-core assets with proceeds of $18.6 million.
|
Contract Drilling
|
•
|
Utilization cycle during 2017:
|
|
◦
|
Started year with 21 drilling rigs operating;
|
|
◦
|
Placed one new BOSS drilling rig into service at the end of the second quarter;
|
|
◦
|
Returned to service 14 SCR drilling rigs and by mid-July had 36 drilling rigs operating; and
|
|
◦
|
Exited year with 31 drilling rigs operating, following weaker commodity prices in the third quarter and with commodity prices beginning to improve late in the year.
|
|
•
|
All ten BOSS drilling rigs were operating during the year.
|
Mid-Stream
|
•
|
Record operating profit (revenue less operating expense) of $51.7 million, a 7% increase over 2016.
|
|
•
|
Connected five wells to our Pittsburgh Mills gathering system resulting in increased gathered volume of up to 141 MMcf per day.
|
|
•
|
Began construction on a $14.0 million pipeline and compressor expansion project at our Cashion facility to allow us to gather and process production from a new producer with a significant acreage dedication.
|
|
•
|
Connected three new wells to our Segno gathering system increasing our gathered volumes to a record high of 98.2 MMcf per day.
|
|
•
|
Connected six new wells to our Hemphill facility and upgraded compression facilities to handle expected higher volumes in the Buffalo Wallow area.
|
FINANCIAL INFORMATION ABOUT SEGMENTS
See Note 16 of our Notes to Consolidated Financial Statements in Item 8 of this report for information regarding each of our segment’s revenues, profits or losses, and total assets.
2
OIL AND NATURAL GAS
General.
All our oil and natural gas properties are in the United States. Our producing oil and natural gas properties, unproved properties, and related assets are in these locations:
|
Division
|
Location
|
|
West division
|
Western and Southern Texas, Colorado, Wyoming, Montana, North Dakota, New Mexico, Southern Louisiana, and Utah
|
|
East division
|
Eastern Oklahoma and Arkansas
|
|
Central division
|
Western Oklahoma, Texas Panhandle, and Kansas
|
When we are the operator of a property, we attempt to use a drilling rig owned by our contract drilling segment, and we use our mid-stream segment to gather our gas if it is economical for us to do so.
This table presents certain information regarding our oil and natural gas operations as of
December 31, 2017
:
|
Our Divisions/Area
|
Number
of
Gross
Wells
|
Number
of Net
Wells
|
Number
of Gross
Wells in
Process
|
Number
of Net
Wells in
Process
|
2017 Average
Net Daily Production
|
|||||||||||||||
|
Natural
Gas
(Mcf)
|
Oil
(Bbls)
|
NGLs (Bbls)
|
||||||||||||||||||
|
West division
|
1,163
|
|
430.75
|
|
—
|
|
—
|
|
54,450
|
|
1,921
|
|
4,875
|
|
||||||
|
East division
|
192
|
|
105.00
|
|
—
|
|
—
|
|
6,195
|
|
10
|
|
—
|
|
||||||
|
Central division
|
5,109
|
|
1,905.18
|
|
10
|
|
3.11
|
|
79,792
|
|
5,508
|
|
8,104
|
|
||||||
|
Total
|
6,464
|
|
2,440.93
|
|
10
|
|
3.11
|
|
140,437
|
|
7,439
|
|
12,979
|
|
||||||
As of
December 31, 2017
, we had no significant water floods, pressure maintenance operations, or any other material related activities that were in process.
Description and Location of Our Core Operations
West division.
In our Wilcox play, located primarily in Polk, Tyler, Hardin, and Goliad Counties, Texas, we completed six vertical and two horizontal wells (average working interest 94.3%) in 2017. Seven wells were completed as gas/condensate producers and one well as an oil producer. Annual production from our Wilcox play averaged 91 MMcfe per day (12% oil, 30% NGLs, 58% natural gas) which is a decrease of approximately 4% compared to 2016. We averaged approximately 0.5 Unit drilling rigs operating during 2017 and we plan to use approximately 0.8 Unit drilling rigs operating during 2018. We anticipate completing approximately eight vertical wells and two horizontal wells during 2018. In addition, we plan to complete approximately 13 behind pipe gas and liquids zones.
Central division.
In our Southern Oklahoma Hoxbar Oil Trend (SOHOT) play, in western Oklahoma primarily in Grady County, we completed six horizontal oil wells (average working interest 88.8%) in the Marchand zone of the Hoxbar interval. Annual production from western Oklahoma averaged 60.5 MMcfe per day (29% oil, 22% NGLs, 49% natural gas) which is a decrease of approximately 7% compared to 2016. During 2017, we averaged approximately 0.75 Unit drilling rigs operating and we currently plan to use approximately one Unit drilling rigs operating during 2018. We anticipate completing approximately nine horizontal Marchand wells in our SOHOT play during 2018 with six being extended laterals.
Also in Oklahoma, we intend to utilize 0.75 Unit drilling rigs throughout 2018 between our Western STACK and Red Fork plays. We anticipate completing one horizontal Osage, two extended lateral horizontal Meramec, one standard length horizontal Meramec, and two horizontal Red Fork wells.
In our Texas Panhandle Granite Wash play, we completed six extended lateral horizontal gas/condensate wells (average working interest 99%) in our Buffalo Wallow field. Annual production from the Texas Panhandle averaged 86.5 MMcfe per day (10% oil, 38% NGLs, 52% natural gas) which is a decrease of approximately 8% compared to 2016. We used one Unit drilling rig during 2017 and plan to continue using that rig during 2018. We anticipate completing approximately 11 extended lateral Granite Wash horizontal wells in our Buffalo Wallow field during 2018.
3
In our Mississippian play in south central Kansas, we completed one horizontal oil well (working interest 100%). Annual production from Kansas averaged 7.3 MMcfe per day (60% oil, 11% NGLs, 29% natural gas) which is an increase of approximately 18% compared to 2016.
East division.
Over the last several years, activity in our East division has been limited due to low gas prices since this area rarely has oil or NGLs associated with the gas. We drilled no wells in this division during 2017.
Dispositions.
We had non-core asset sales, net of related expenses, of
$18.6 million
,
$67.2 million
, and
$1.9 million
, in
2017
,
2016
, and
2015
, respectively. Proceeds from these sales reduced the net book value of the full cost pool with no gain or loss recognized.
During prior years, we determined the value of certain of our unproved oil and gas properties were diminished (in part or in whole) based on an impairment evaluation and our anticipated future exploration plans. Those determinations resulted in
$114.4 million
,
$7.6 million
, and
$10.5 million
in
2015
,
2016
, and 2017, respectively of costs being added to the total of our capitalized costs being amortized. We incurred a
$1.6 billion
pre-tax (
$1.0 billion
net of tax) non-cash ceiling test write-down of our oil and natural gas properties in
2015
due to a reduction of the 12-month average commodity prices during the year and including the impaired value of those unproved properties. In
2016
, we incurred non-cash ceiling test write-downs of our oil and natural gas properties of
$161.6 million
pre-tax (
$100.6 million
net of tax) primarily due to the reduction of the 12-month average commodity prices during the first three quarters of the year. We had no ceiling test write-downs for 2017.
4
Well and Leasehold Data.
The following tables identify certain information regarding our oil and natural gas exploratory and development drilling operations:
|
|
Year Ended December 31,
|
||||||||||||||||
|
|
2017
|
2016
|
2015
|
||||||||||||||
|
|
Gross
|
Net
|
Gross
|
Net
|
Gross
|
Net
|
|||||||||||
|
Wells drilled:
|
|||||||||||||||||
|
Development:
|
|||||||||||||||||
|
Oil:
|
|||||||||||||||||
|
West division
|
1
|
|
1.00
|
|
—
|
|
—
|
|
2
|
|
0.66
|
|
|||||
|
East division
|
—
|
|
—
|
|
—
|
|
—
|
|
—
|
|
—
|
|
|||||
|
Central division
|
44
|
|
9.98
|
|
9
|
|
3.57
|
|
21
|
|
8.12
|
|
|||||
|
Total oil
|
45
|
|
10.98
|
|
9
|
|
3.57
|
|
23
|
|
8.78
|
|
|||||
|
Natural gas:
|
|||||||||||||||||
|
West division
|
7
|
|
6.55
|
|
4
|
|
3.98
|
|
15
|
|
13.50
|
|
|||||
|
East division
|
—
|
|
—
|
|
—
|
|
—
|
|
—
|
|
—
|
|
|||||
|
Central division
|
16
|
|
7.35
|
|
7
|
|
1.12
|
|
18
|
|
11.50
|
|
|||||
|
Total natural gas
|
23
|
|
13.90
|
|
11
|
|
5.10
|
|
33
|
|
25.00
|
|
|||||
|
Dry:
|
|||||||||||||||||
|
West division
|
2
|
|
0.83
|
|
—
|
|
—
|
|
1
|
|
1.00
|
|
|||||
|
East division
|
—
|
|
—
|
|
—
|
|
—
|
|
—
|
|
—
|
|
|||||
|
Central division
|
—
|
|
—
|
|
—
|
|
—
|
|
1
|
|
0.21
|
|
|||||
|
Total dry
|
2
|
|
0.83
|
|
—
|
|
—
|
|
2
|
|
1.21
|
|
|||||
|
Total development
|
70
|
|
25.71
|
|
20
|
|
8.67
|
|
58
|
|
34.99
|
|
|||||
|
Exploratory:
|
|||||||||||||||||
|
Oil:
|
|||||||||||||||||
|
West division
|
—
|
|
—
|
|
1
|
|
1.00
|
|
—
|
|
—
|
|
|||||
|
East division
|
—
|
|
—
|
|
—
|
|
—
|
|
—
|
|
—
|
|
|||||
|
Central division
|
—
|
|
—
|
|
—
|
|
—
|
|
—
|
|
—
|
|
|||||
|
Total oil
|
—
|
|
—
|
|
1
|
|
1.00
|
|
—
|
|
—
|
|
|||||
|
Natural gas:
|
|||||||||||||||||
|
West division
|
—
|
|
—
|
|
—
|
|
—
|
|
—
|
|
—
|
|
|||||
|
East division
|
—
|
|
—
|
|
—
|
|
—
|
|
—
|
|
—
|
|
|||||
|
Central division
|
—
|
|
—
|
|
—
|
|
—
|
|
—
|
|
—
|
|
|||||
|
Total natural gas
|
—
|
|
—
|
|
—
|
|
—
|
|
—
|
|
—
|
|
|||||
|
Dry:
|
|||||||||||||||||
|
West division
|
—
|
|
—
|
|
—
|
|
—
|
|
—
|
|
—
|
|
|||||
|
East division
|
—
|
|
—
|
|
—
|
|
—
|
|
—
|
|
—
|
|
|||||
|
Central division
|
—
|
|
—
|
|
—
|
|
—
|
|
—
|
|
—
|
|
|||||
|
Total dry
|
—
|
|
—
|
|
—
|
|
—
|
|
—
|
|
—
|
|
|||||
|
Total exploratory
|
—
|
|
—
|
|
1
|
|
1.00
|
|
—
|
|
—
|
|
|||||
|
Total wells drilled
|
70
|
|
25.71
|
|
21
|
|
9.67
|
|
58
|
|
34.99
|
|
|||||
5
|
|
Year Ended December 31,
|
||||||||||||||||
|
|
2017
|
2016
(1)
|
2015
|
||||||||||||||
|
|
Gross
|
Net
|
Gross
|
Net
|
Gross
|
Net
|
|||||||||||
|
Wells producing or capable of producing:
|
|||||||||||||||||
|
Oil:
|
|||||||||||||||||
|
West division
|
602
|
|
124.39
|
|
648
|
|
136.59
|
|
692
|
|
149.34
|
|
|||||
|
East division
|
11
|
|
—
|
|
18
|
|
0.72
|
|
28
|
|
1.79
|
|
|||||
|
Central division
|
941
|
|
508.46
|
|
908
|
|
497.25
|
|
907
|
|
498.75
|
|
|||||
|
Total oil
|
1,554
|
|
632.85
|
|
1,574
|
|
634.56
|
|
1,627
|
|
649.88
|
|
|||||
|
Natural gas:
|
|||||||||||||||||
|
West division
|
546
|
|
298.97
|
|
582
|
|
296.71
|
|
659
|
|
325.57
|
|
|||||
|
East division
|
179
|
|
104.64
|
|
181
|
|
105.85
|
|
1,358
|
|
466.22
|
|
|||||
|
Central division
|
4,162
|
|
1,394.05
|
|
4,181
|
|
1,367.87
|
|
4,217
|
|
1,376.94
|
|
|||||
|
Total natural gas
|
4,887
|
|
1,797.66
|
|
4,944
|
|
1,770.43
|
|
6,234
|
|
2,168.73
|
|
|||||
|
Total
|
6,441
|
|
2,430.51
|
|
6,518
|
|
2,404.99
|
|
7,861
|
|
2,818.61
|
|
|||||
_________________________
|
(1)
|
During 2016, we had divestitures of 1,300 gross (407.70 net) wells. There were no significant divestitures in 2017 or 2015.
|
As of
February 13, 2018
, we were drilling or participating in
12
gross (
4.22
net) wells started during
2018
.
Cost for development drilling includes
$41.6 million
,
$2.5 million
, and
$58.6 million
in
2017
,
2016
, and
2015
, respectively, to develop previously booked proved undeveloped oil and natural gas reserves.
This table summarizes our leasehold acreage at
December 31, 2017
:
|
|
Year Ended December 31, 2017
|
||||||||||||||||
|
|
Developed
|
Undeveloped
|
Total
|
||||||||||||||
|
|
Gross
|
Net
|
Gross
|
Net
(1)
|
Gross
|
Net
|
|||||||||||
|
West division
|
254,887
|
|
81,989
|
|
74,387
|
|
58,608
|
|
329,274
|
|
140,597
|
|
|||||
|
East division
|
88,278
|
|
23,717
|
|
3,349
|
|
2,190
|
|
91,627
|
|
25,907
|
|
|||||
|
Central division
|
901,570
|
|
425,462
|
|
91,843
|
|
52,868
|
|
993,413
|
|
478,330
|
|
|||||
|
Total
|
1,244,735
|
|
531,168
|
|
169,579
|
|
113,666
|
|
1,414,314
|
|
644,834
|
|
|||||
_________________________
|
(1)
|
Approximately 70% (West – 76%; East – 95%; and Central – 61%) of the net undeveloped acres are covered by leases that will expire in the years 2018—2020 unless drilling or production extends the terms of those leases. Currently, we do not have any material proved undeveloped (PUD) reserves attributable to acreage where the expiration date precedes the scheduled PUD reserve development plan.
|
6
Price and Production Data.
The following tables identify the average sales price, production volumes, and average production cost per equivalent barrel for our oil, NGLs, and natural gas production for the years indicated:
|
|
Year Ended December 31,
|
||||||||||
|
|
2017
|
2016
|
2015
|
||||||||
|
Average sales price per barrel of oil produced:
|
|||||||||||
|
Price before derivatives
|
$
|
48.98
|
|
$
|
39.05
|
|
$
|
45.04
|
|
||
|
Effect of derivatives
|
0.46
|
|
1.45
|
|
5.75
|
|
|||||
|
Price including derivatives
|
$
|
49.44
|
|
$
|
40.50
|
|
$
|
50.79
|
|
||
|
Average sales price per barrel of NGLs produced:
|
|||||||||||
|
Price before derivatives
|
$
|
18.35
|
|
$
|
11.26
|
|
$
|
10.12
|
|
||
|
Effect of derivatives
|
—
|
|
—
|
|
—
|
|
|||||
|
Price including derivatives
|
$
|
18.35
|
|
$
|
11.26
|
|
$
|
10.12
|
|
||
|
Average sales price per Mcf of natural gas produced:
|
|||||||||||
|
Price before derivatives
|
$
|
2.49
|
|
$
|
1.98
|
|
$
|
2.25
|
|
||
|
Effect of derivatives
|
(0.03
|
)
|
0.09
|
|
0.38
|
|
|||||
|
Price including derivatives
|
$
|
2.46
|
|
$
|
2.07
|
|
$
|
2.63
|
|
||
7
|
Year Ended December 31,
|
|||||||||||
|
|
2017
|
2016
|
2015
|
||||||||
|
Oil production (MBbls):
|
|||||||||||
|
West division:
|
|||||||||||
|
Jazz Wilcox field
|
533
|
|
589
|
|
422
|
|
|||||
|
All other west division fields
|
168
|
|
238
|
|
258
|
|
|||||
|
Total west division
|
701
|
|
827
|
|
680
|
|
|||||
|
East division
|
4
|
|
8
|
|
11
|
|
|||||
|
Central division:
|
|||||||||||
|
Buffalo Wallow field
|
127
|
|
120
|
|
145
|
|
|||||
|
All other central division fields
|
1,883
|
|
2,019
|
|
2,947
|
|
|||||
|
Total central division
|
2,010
|
|
2,139
|
|
3,092
|
|
|||||
|
Total oil production
|
2,715
|
|
2,974
|
|
3,783
|
|
|||||
|
NGLs production (MBbls):
|
|||||||||||
|
West division:
|
|||||||||||
|
Jazz Wilcox field
|
1,567
|
|
1,671
|
|
1,275
|
|
|||||
|
All other west division fields
|
212
|
|
216
|
|
266
|
|
|||||
|
Total west division
|
1,779
|
|
1,887
|
|
1,541
|
|
|||||
|
East division
|
—
|
|
—
|
|
6
|
|
|||||
|
Central division:
|
|||||||||||
|
Buffalo Wallow field
|
728
|
|
592
|
|
724
|
|
|||||
|
All other central division fields
|
2,230
|
|
2,535
|
|
3,003
|
|
|||||
|
Total central division
|
2,958
|
|
3,127
|
|
3,727
|
|
|||||
|
Total NGLs production
|
4,737
|
|
5,014
|
|
5,274
|
|
|||||
|
Natural gas production (MMcf):
|
|||||||||||
|
West division:
|
|||||||||||
|
Jazz Wilcox field
|
16,799
|
|
18,145
|
|
14,538
|
|
|||||
|
All other west division fields
|
3,076
|
|
2,506
|
|
3,259
|
|
|||||
|
Total west division
|
19,875
|
|
20,651
|
|
17,797
|
|
|||||
|
East division
|
2,261
|
|
2,956
|
|
6,846
|
|
|||||
|
Central division:
|
|||||||||||
|
Buffalo Wallow field
|
6,228
|
|
5,506
|
|
6,895
|
|
|||||
|
All other central division fields
|
22,896
|
|
26,622
|
|
34,008
|
|
|||||
|
Total central division
|
29,124
|
|
32,128
|
|
40,903
|
|
|||||
|
Total natural gas production
|
51,260
|
|
55,735
|
|
65,546
|
|
|||||
|
Total production (MBoe):
|
|||||||||||
|
West division:
|
|||||||||||
|
Jazz Wilcox field
|
4,900
|
|
5,284
|
|
4,120
|
|
|||||
|
All other west division fields
|
893
|
|
872
|
|
1,067
|
|
|||||
|
Total west division
|
5,793
|
|
6,156
|
|
5,187
|
|
|||||
|
East division
|
381
|
|
500
|
|
1,158
|
|
|||||
|
Central division:
|
|||||||||||
|
Buffalo Wallow field
|
1,893
|
|
1,629
|
|
2,019
|
|
|||||
|
All other central division fields
|
7,929
|
|
8,992
|
|
11,618
|
|
|||||
|
Total central division
|
9,822
|
|
10,621
|
|
13,637
|
|
|||||
|
Total production
|
15,996
|
|
17,277
|
|
19,982
|
|
|||||
|
Average production cost per equivalent Bbl
(1)
|
$
|
5.86
|
|
$
|
5.62
|
|
$
|
7.06
|
|
||
_______________________
|
(1)
|
Excludes ad valorem taxes and gross production taxes.
|
8
Our Buffalo Wallow field in Hemphill County, Texas, contained
24%
,
13%
,
10%
of our total proved reserves in
2017
,
2016
, and
2015
, respectively, expressed on an oil equivalent barrels basis. Our Jazz Wilcox field in South Texas, which includes our Gilly, Segno, and Wildwood prospects and several smaller prospects, contained
18%
,
26%
, and
24%
of our total proved reserves for those same years also expressed on an oil equivalent barrels basis. There are no other fields that accounted for more than 15% of our proved reserves.
Oil, NGLs, and Natural Gas Reserves.
The following table identifies our estimated proved developed and undeveloped oil, NGLs, and natural gas reserves:
|
|
Year Ended December 31, 2017
|
||||||||||
|
|
Oil
(MBbls)
|
NGLs (MBbls)
|
Natural
Gas
(MMcf)
|
Total
Proved
Reserves
(MBoe)
|
|||||||
|
Proved developed:
|
|||||||||||
|
West division
|
2,902
|
|
8,812
|
|
93,456
|
|
27,290
|
|
|||
|
East division
|
—
|
|
—
|
|
41,720
|
|
6,953
|
|
|||
|
Central division
|
11,960
|
|
24,546
|
|
253,270
|
|
78,718
|
|
|||
|
Total proved developed
|
14,862
|
|
33,358
|
|
388,446
|
|
112,961
|
|
|||
|
Proved undeveloped:
|
|||||||||||
|
West division
|
329
|
|
1,220
|
|
12,255
|
|
3,592
|
|
|||
|
East division
|
—
|
|
—
|
|
1,394
|
|
232
|
|
|||
|
Central division
|
4,322
|
|
10,908
|
|
106,555
|
|
32,989
|
|
|||
|
Total proved undeveloped
|
4,651
|
|
12,128
|
|
120,204
|
|
36,813
|
|
|||
|
Total proved
|
19,513
|
|
45,486
|
|
508,650
|
|
149,774
|
|
|||
Oil, NGLs, and natural gas reserves cannot be measured exactly. Estimates of those reserves require extensive judgments of reservoir engineering data and are generally less precise than other estimates made in financial disclosures. We use Ryder Scott Company L.P., (Ryder Scott), independent petroleum consultants, to audit the reserves prepared by our reservoir engineers. Ryder Scott has been providing petroleum consulting services throughout the world since 1937. Their summary report is attached as Exhibit 99.1 to this Form 10-K. The wells or locations for which reserve estimates were audited were taken from our reserve and income projections as of
December 31, 2017
, and comprised
83%
of the total proved developed future net income discounted at 10% and
86%
of the total proved discounted future net income (based on the SEC's unescalated pricing policy).
Our Reservoir Engineering department is responsible for reserve determination for the wells in which we have an interest. Their primary objective is to estimate the wells' future reserves and future net value to us. Data is incorporated from multiple sources including geological, production engineering, marketing, production, land, and accounting departments. The engineers review this information for accuracy as it is incorporated into the reservoir engineering database. Our internal audit group reviews our internal controls to help provide assurance all the data has been provided. New well reserve estimates are provided to management and the respective operational divisions for additional scrutiny. Major reserve changes on existing wells are reviewed regularly with the operational divisions to confirm completeness and accuracy. As the external audit is being completed by Ryder Scott, the reservoir department performs a final review of all properties for accuracy of forecasting.
Technical Qualifications
Ryder Scott
– Mr. Robert J. Paradiso was the primary technical person responsible for overseeing the estimate of the reserves, future production and income prepared by Ryder Scott.
Mr. Paradiso, an employee of Ryder Scott since 2008, is a Vice President and serves as Project Coordinator, responsible for coordinating and supervising staff and consulting engineers in ongoing reservoir evaluation studies worldwide. Before joining Ryder Scott, Mr. Paradiso served in several engineering positions with Getty Oil Company, Texaco, Union Texas Petroleum, Amax Oil and Gas, Inc., Norcen Explorer, Inc., Amerac Energy Corporation, Halliburton Energy Services, Santa Fe Snyder Corp., and Devon Energy Corporation.
9
Mr. Paradiso earned a Bachelor of Science degree in Petroleum Engineering from Texas Tech University in 1979 and is a registered Professional Engineer in the State of Texas. He is also a member of the Society of Petroleum Engineers (SPE).
Besides gaining experience and competency through prior work experience, the Texas Board of Professional Engineers requires at least fifteen hours of continuing education annually, including at least one hour in professional ethics, which Mr. Paradiso fulfills. As part of his 2017 continuing education hours, Mr. Paradiso attended 6 hours of formalized training during the 2017 RSC Reserves Conference relating to the definitions and disclosure guidelines in the United States Securities and Exchange Commission Title 17, Code of Federal Regulations, Modernization of Oil and Gas Reporting, Final Rule released January 14, 2009 in the Federal Register. Mr. Paradiso attended an additional 37.5 hours of formalized in-house training during 2017 covering such topics as the SPE/WPC/AAPG/SPEE Petroleum Resources Management System, reservoir engineering, geoscience and petroleum economics evaluation methods, procedures and software and ethics for consultants.
Based on his educational background, professional training and over 38 years of practical experience in the estimation and evaluation of petroleum reserves, Mr. Paradiso has attained the professional qualifications as a Reserves Estimator and Reserves Auditor set forth in Article III of the “Standards Pertaining to the Estimating and Auditing of Oil and Gas Reserves Information” promulgated by the SPE as of February 19, 2007. For more information regarding Mr. Paradiso’s geographic and job specific experience, please refer to the Ryder Scott Company website at http://www.ryderscott.com/Company/Employees.
The Company –
Responsibility for overseeing the preparation of our reserve report is shared by our reservoir engineers Trenton Mitchell and Derek Smith.
Mr. Mitchell earned a Bachelor of Science degree in Petroleum Engineering from Texas A&M University in 1994. He has been an employee of Unit since 2002. Initially, he was the Outside Operated Engineer and since 2003 he has served in the capacity of Reservoir Engineer and in 2010 he was promoted to Manager of Reservoir Engineering. Before joining Unit, he served in several engineering field and technical support positions with Schlumberger Well Services in their pumping services segment (formerly Dowell Schlumberger). He obtained his Professional Engineer registration from the State of Oklahoma in 2004. He has been a member of SPE since 1991 and joined the Society of Petroleum Evaluation Engineers (SPEE) in 2017.
Mr. Smith received a Bachelor of Science in Petroleum Engineering with a Minor in Business from the University of Tulsa in 2005. He worked for Apache Corporation immediately after in Production Engineering, then Reservoir Engineering, followed by Drilling Engineering for approximately one year each before moving to Corporate Reserves in 2008. He joined Unit in 2009 as a Corporate Reserves Engineer involved in reserve evaluation, acquisition appraisals, and prospect reviews with increasing levels of responsibility. He has been a member of SPE since 2000.
As part of their continuing education Mr. Mitchell and Mr. Smith have attended various seminars and forums to enhance their understanding of current standards and issues for reserves presentation. These forums have included those sponsored by various professional societies and professional service firms including Ryder Scott.
Definitions and Other.
Proved oil, NGLs, and natural gas reserves, as defined in SEC Rule 4-10(a), are those quantities of oil and gas, which, by analysis of geoscience and engineering data, can be estimated with reasonable certainty to be economically producible – from a given date forward, from known reservoirs and under existing economic conditions, operating methods and government regulations – before the time the contracts providing the right to operate expire, unless evidence indicates that renewal is reasonably certain, regardless of whether deterministic or probabilistic methods are used for estimation. The project to extract the hydrocarbons must have commenced or the operator must be reasonably certain that it will commence the project within a reasonable time.
The area of the reservoir considered as "proved" includes:
|
•
|
The area identified by drilling and limited by any fluid contacts, and
|
|
•
|
Adjacent undrilled portions of the reservoir that can, with reasonable certainty, be judged to be continuous with it and to contain economically producible oil or gas based on available geosciences and engineering data.
|
Absent data on fluid contacts, proved quantities in a reservoir are limited by the lowest known hydrocarbons as incurred in a well penetration unless geosciences, engineering, or performance data and reliable technology establishes a lower contact with reasonable certainty.
10
Where direct observation from well penetrations has defined a highest known oil elevation and the potential exists for an associated gas cap, proved oil reserves may be assigned in the structurally higher portions of the reservoir only if geosciences, engineering, or performance data and reliable technology establish the higher contact with reasonable certainty.
Reserves which can be produced economically through application of improved recovery techniques (including, but not limited to, fluid injection) are included in the proved classification when:
|
•
|
Successful testing by a pilot project in an area of the reservoir with properties no more favorable than the reservoir as a whole;
|
|
•
|
The operation of an installed program in the reservoir or other evidence using reliable technology establishes reasonable certainty of the engineering analysis on which the project or program was based; and
|
|
•
|
The project has been approved for development by all necessary parties and entities, including governmental entities.
|
Existing economic conditions include prices and costs at which economic producibility from a reservoir is to be determined. The price used is the average of the prices over the 12-month period before the ending date of the period covered by the report and is an unweighted arithmetic average of the first day of the month price for each month within the period, unless prices are defined by contractual arrangements, excluding escalations based on future conditions.
"Proved undeveloped" oil, NGLs, and natural gas reserves are proved reserves expected to be recovered from new wells on undrilled acreage, or from existing wells where a relatively major expense is required for completion. Reserves on undrilled acreage are limited to those directly offsetting development spacing areas reasonably certain of production when drilled, unless evidence using reliable technology exists that establishes reasonable certainty of economic producibility at greater distances. Undrilled locations can be classified as having undeveloped reserves only if a development plan has been adopted indicating that they are scheduled to be drilled within five years, unless the specific circumstances, justify a longer time. Under no circumstances can estimates for proved undeveloped reserves be attributable to acreage for which an application of fluid injection or other improved recovery technique is contemplated, unless those techniques have been proved effective by actual projects in the same reservoir or an analogous reservoir, or by other evidence using reliable technology establishing reasonable certainty.
Proved Undeveloped Reserves.
As of
December 31, 2017
, we had
99
gross proved undeveloped wells all of which we plan to develop within five years of initial disclosure at a net estimated cost of approximately
$326.2 million
. The future estimated development costs to develop our proved undeveloped oil and natural gas reserves for the years 2018-2022, as disclosed in our
December 31, 2017
oil and natural gas reserve report, are shown below:
|
Year
|
Number of Gross Wells Planned
|
Estimated Net Development Cost
(In millions)
|
|||||
|
2018
|
35
|
|
$
|
78.3
|
|
||
|
2019
|
36
|
|
152.2
|
|
|||
|
2020
|
19
|
|
78.3
|
|
|||
|
2021
|
9
|
|
17.4
|
|
|||
|
2022
|
—
|
|
—
|
|
|||
|
99
|
|
$
|
326.2
|
|
|||
11
Our proved undeveloped reserves reported at
December 31, 2017
did not include reserves we did not expect to develop within five years of initial disclosure of those reserves. Below is a summary of changes to our proved undeveloped reserves during
2017
:
|
Oil
(MMBbls)
|
NGLs
(MMBbls)
|
Natural Gas (Bcf)
|
Total
(MMBoe)
|
||||||||
|
Proved undeveloped reserves, January 1, 2017
|
3.0
|
|
6.0
|
|
58.5
|
|
18.7
|
|
|||
|
Extensions and discoveries
|
2.4
|
|
7.6
|
|
75.0
|
|
22.6
|
|
|||
|
Converted to developed
|
(1.1
|
)
|
(1.1
|
)
|
(11.7
|
)
|
(4.2
|
)
|
|||
|
Revisions of previous estimates
|
(0.2
|
)
|
(0.7
|
)
|
(4.5
|
)
|
(1.7
|
)
|
|||
|
Purchases of reserves
|
0.6
|
|
0.3
|
|
2.9
|
|
1.4
|
|
|||
|
Proved undeveloped reserves, December 31, 2017
|
4.7
|
|
12.1
|
|
120.2
|
|
36.8
|
|
|||
During
2017
, we converted
nine
proved undeveloped well locations into proved developed wells at a cost of approximately
$41.6 million
. The increase in the table above to our extensions and discoveries were due to a number of factors including increased drilling activity, higher commodity prices resulting in an increased budget for future capital expenditures, all contributing to more wells being economic to develop in the next five years.
Our estimated proved reserves and the standardized measure of discounted future net cash flows of the proved reserves at
December 31, 2017
,
2016
, and
2015
, the changes in quantities, and standardized measure of those reserves for the three years then ended, are shown in the Supplemental Oil and Gas Disclosures in Item 8 of this report.
Contracts.
Our oil production is sold at or near our wells under purchase contracts at prevailing prices under arrangements customary in the oil industry. Our natural gas production is sold to intrastate and interstate pipelines and to independent marketing firms under contracts with terms generally ranging from one month to a year. Few of these contracts contain provisions for readjustment of price as most are market sensitive.
Customers.
During
2017
, sales to Sunoco Logistics accounted for
10%
of our oil and natural gas revenues. No other company accounted for over 10% of our oil and natural gas revenues besides our mid-stream segment. During
2017
, our mid-stream segment purchased
$63.2 million
of our natural gas and NGLs production and provided gathering and transportation services of
$6.7 million
. Intercompany revenue from services and purchases of production between our mid-stream segment and our oil and natural gas segment has been eliminated in our consolidated financial statements. In
2016
and
2015
, we eliminated intercompany revenues of
$51.9 million
and
$65.2 million
, respectively, attributable to the intercompany purchase of our production of natural gas and NGLs and gathering and transportation services.
CONTRACT DRILLING
General.
Our contract drilling business is conducted through Unit Drilling Company. Through this company we drill onshore oil and natural gas wells for our own account and for other oil and natural gas companies. Our drilling operations are in Oklahoma, Texas, Louisiana, Kansas, Colorado, Wyoming, and North Dakota. Until October 31, 2015, our drilling operations in Texas were conducted under Unit Texas Drilling L.L.C., a subsidiary of Unit Drilling Company. Effective October 31, 2015, that subsidiary was merged into Unit Drilling Company.
12
This table identifies certain information about our contract drilling segment:
|
|
Year Ended December 31,
|
||||||||||
|
|
2017
|
2016
|
2015
|
||||||||
|
Number of drilling rigs available for use at year end
|
95.0
|
|
94.0
|
|
94.0
|
|
|||||
|
Average number of drilling rigs owned during year
|
94.5
|
|
93.9
|
|
92.6
|
|
|||||
|
Average number of drilling rigs utilized
|
30.0
|
|
17.4
|
|
34.7
|
|
|||||
|
Utilization rate
(1)
|
32
|
%
|
19
|
%
|
38
|
%
|
|||||
|
Average revenue per day
(2)
|
$
|
15,935
|
|
$
|
19,154
|
|
$
|
20,950
|
|
||
|
Total footage drilled (feet in 1,000’s)
|
6,864
|
|
5,112
|
|
7,237
|
|
|||||
|
Number of wells drilled
|
468
|
|
358
|
|
516
|
|
|||||
_________________________
|
(1)
|
Utilization rate is determined by dividing the average number of drilling rigs used by the average number of drilling rigs owned during the year.
|
|
(2)
|
Represents the total revenues from our contract drilling segment divided by the total days our drilling rigs were used during the year.
|
Description and Location of Our Drilling Rigs.
An on-shore drilling rig is composed of major equipment components like engines, drawworks or hoists, derrick or mast, substructure, mud pumps, blowout preventers, top drives, and drill pipe. Because of the normal wear and tear from operating 24 hours a day, several of the major components, like engines, mud pumps, top drives, and drill pipe, must be replaced or rebuilt on a periodic basis. Other major components, like the substructure, mast, and drawworks, can be used for extended periods of time with proper maintenance. We also own additional equipment used in operating our drilling rigs, including iron roughnecks, automated catwalks, skidding systems, large air compressors, trucks, and other support equipment. Our drilling rigs can be transferred between divisions.
The maximum depth capacities of our various drilling rigs range from 9,500 to 40,000 feet allowing us to cover a wide range of our customers drilling requirements. In
2017
,
36
of our
95
drilling rigs were used in drilling services.
This table shows certain information about our drilling rigs (including their distribution) as of
February 13, 2018
:
|
Divisions
|
Contracted
Rigs
|
Non-Contracted
Rigs
|
Total
Rigs
|
Average
Rated
Drilling
Depth
(ft)
|
|||||||
|
Mid-Continent
|
25
|
|
50
|
|
75
|
|
17,260
|
|
|||
|
Rocky Mountain
|
6
|
|
14
|
|
20
|
|
19,925
|
|
|||
|
Totals
|
31
|
|
64
|
|
95
|
|
17,821
|
|
|||
The cyclical nature of the contract drilling business is reflected in drilling rig utilization rates. Drilling rig utilization at the end of 2015 was 26 drilling rigs. Then in 2016, utilization bottomed out in May at 13 operating drilling rigs. As commodity prices improved during the remainder 2016, we exited the year with 21 active drilling rigs. The increased rig activity continued on into 2017 as we added one new BOSS drilling rig and returned to service 14 SCR drilling rigs to peak at 36 drilling rigs utilized in the third quarter. Following which commodity prices weakened during the third quarter and our active drilling rig count dropped to 27 drilling rigs. However, commodity prices rebounded late in the year and we finished 2017 with 31 drilling rigs operating.
Mid-Continent.
The Mid-Continent division manages operations from Oklahoma, Texas, Louisiana, and Kansas. The division operated an average of 23.8 drilling rigs during 2017. As of December 31, 2017, this division was operating 26 drilling rigs, 18 of which were working in Oklahoma and the Texas Panhandle, one in East Texas, and seven in the Permian Basin of West Texas.
Rocky Mountains.
Our Rocky Mountain division covers Colorado, Utah, Wyoming, Montana, and North Dakota. This vast area has produced several conventional and unconventional oil and gas fields. This division operated an average of 6.2 drilling rigs during 2017. We had two drilling rigs operating in Wyoming and three drilling rigs operating in the Bakken Shale of North Dakota at the end of 2017.
13
The number of drilling rigs we can work depends on several conditions besides demand, including the availability of qualified labor and the availability of needed drilling supplies and equipment. The impact of these conditions affects the utilization for our drilling rigs. Our average utilization rate for 2017, 2016, and 2015 was 32%, 19%, and 38%, respectively.
The following table shows the average number of our drilling rigs working by quarter for the years indicated:
|
2017
|
2016
|
2015
|
||||||
|
First quarter
|
25.5
|
|
20.6
|
|
50.1
|
|
||
|
Second quarter
|
28.8
|
|
13.5
|
|
30.7
|
|
||
|
Third quarter
|
34.6
|
|
16.0
|
|
31.2
|
|
||
|
Fourth quarter
|
31.2
|
|
19.5
|
|
27.2
|
|
||
Drilling Rig Fleet.
The following table summarizes the changes to our drilling rig fleet in
2017
. A more complete discussion of changes over the last three years follows the table:
|
Drilling rigs available for use at January 1, 2017
|
94
|
|
|
Drilling rigs constructed
|
1
|
|
|
Total drilling rigs available for use at December 31, 2017
|
95
|
|
Dispositions, Acquisitions, and Construction.
During 2015, we recorded a write-down on 31 of our drilling rigs and related equipment of approximately $8.3 million pre-tax based on the estimated market value for similar equipment from auctions sales. We then sold all 31 of these drilling rigs and some other drilling equipment to unaffiliated third parties. The proceeds from the sale of those assets, less costs to sell, was less than the $11.3 million net book value resulting in a loss of $7.3 million pre-tax.
During 2015, five BOSS drilling rigs were constructed and placed into service for third-party operators.
During December 2016, we sold an idle 1,500 horsepower SCR drilling rig to an unaffiliated third party. We also built and placed into service for a third party operator our ninth BOSS drilling rig. This new BOSS rig was constructed using the long lead time components purchased in prior years.
During 2017, we built our tenth BOSS drilling rig and placed it into service for a third party operator under a long term contract.
Drilling Contracts.
Our drilling contracts are generally obtained through competitive bidding on a well by well basis. Contract terms and payment rates vary depending on the type of contract used, the duration of the work, the equipment and services supplied, and other matters. We pay certain operating expenses, including the wages of our drilling rig personnel, maintenance expenses, and incidental drilling rig supplies and equipment. The contracts are usually subject to early termination by the customer subject to the payment of a fee. Our contracts also contain provisions regarding indemnification against certain types of claims involving injury to persons, property, and for acts of pollution. The specific terms of these indemnifications are negotiable on a contract by contract basis.
The type of contract used determines our compensation. Contracts are generally one of three types: daywork; footage; or turnkey. Under a daywork contract, we provide the drilling rig with the required personnel and the operator supervises the drilling of the well. Our compensation is based on a negotiated rate to be paid for each day the drilling rig is used. Footage contracts usually require us to bear some of the drilling costs besides providing the drilling rig. We are paid on completion of the well at a negotiated rate for each foot drilled. Under turnkey contracts we drill the well to a specified depth for a set amount and provide most of the required equipment and services. We bear the risk of drilling the well to the contract depth and are paid when the contract provisions are completed. We may incur losses if we underestimate the costs to drill the well or if unforeseen events occur that increase our costs or result in losing the well. We had no footage or turnkey contracts in
2017
,
2016
, or
2015
. Because market demand for our drilling rigs and the desires of our customers determine the types of contracts we use, we cannot predict when and if a part of our drilling will be conducted under footage or turnkey contracts.
The majority of our contracts are on a well-to-well basis, with the rest under term contracts. Term contracts range from six months to two years and the rates can either be fixed throughout the term or allow for periodic adjustments.
14
Customers.
During
2017
, QEP Resources, Inc. was our largest drilling customer accounting for approximately
26%
of our total contract drilling revenues. Our work for this customer was under multiple contracts and our business was not substantially dependent on any of these individual contracts. None of these individual contracts were considered to be material. No other third party customer accounted for 10% or more of our contract drilling revenues.
Our contract drilling segment also provides drilling services for our oil and natural gas segment. During
2017
,
2016
, and
2015
, our contract drilling segment drilled
27
,
10
, and
38
wells, respectively, for our oil and natural gas segment, or
6%
,
3%
, and
7%
, respectively, of the total wells drilled by our contract drilling segment. Depending on the timing of the drilling services performed on our properties those services may be deemed, for financial reporting purposes, to be associated with acquiring an ownership interest in the property. Revenues and expenses for these services are eliminated in our statement of operations, with any profit recognized reducing our investment in our oil and natural gas properties. The contracts for these services are issued under similar terms and rates as the contracts signed with unrelated third parties. By providing drilling services for the oil and natural gas segment, we eliminated revenue of
$13.4 million
and
$22.1 million
during
2017
and
2015
, respectively, from our contract drilling segment and eliminated the associated operating expense of
$11.8 million
and
$18.3 million
during
2017
and
2015
, respectively, yielding
$1.6 million
and
$3.8 million
during
2017
and
2015
, respectively, as a reduction to the carrying value of our oil and natural gas properties. We eliminated no revenue or expenses in our contract drilling segment during 2016.
MID-STREAM
General.
Our mid-stream operations are conducted through Superior Pipeline Company, L.L.C. and its subsidiaries. Its operations consist of buying, selling, gathering, processing, and treating natural gas. It operates
three
natural gas treatment plants,
13
processing plants,
24
active gathering systems, and approximately
1,455
miles of pipeline. Superior and its subsidiaries operate in Oklahoma, Texas, Kansas, Pennsylvania, and West Virginia.
This table presents certain information regarding our mid-stream segment for the years indicated:
|
|
Year Ended December 31,
|
|||||||
|
|
2017
|
2016
|
2015
|
|||||
|
Gas gathered—Mcf/day
|
385,209
|
|
419,217
|
|
353,771
|
|
||
|
Gas processed—Mcf/day
|
137,625
|
|
155,461
|
|
182,684
|
|
||
|
NGLs sold—gallons/day
|
534,140
|
|
536,494
|
|
577,513
|
|
||
Dispositions and Acquisitions.
This segment had no significant dispositions or acquisitions during 2015, 2016, or 2017.
Contracts.
Our mid-stream segment provides its customers with a full range of gathering, processing, and treating services. These services are usually provided to each customer under long-term contracts (more than one year), but we have some short-term contracts. Our customer agreements include these types of contracts:
|
•
|
Fee-Based Contracts.
These contracts provide for a set fee for gathering, transporting, compressing, and treating services. Our mid-stream’s revenue is a function of the volume of natural gas and is not directly dependent on the value of the natural gas. For the year ended
December 31, 2017
,
71%
of our mid-stream segment’s total volumes and
62%
of its operating margins (as defined below) were under fee-based contracts.
|
|
•
|
Commodity-Based Contracts.
These contracts consist of several contract structure types. Under these contract structures, our mid-stream segment purchases the raw well-head natural gas and settles with the producer at a stipulated price while retaining all sales proceeds from third parties or retains a negotiated percentage of the sales proceeds from the residue natural gas and NGLs it gathers and processes, with the remainder being paid to the producer. For the year ended
December 31, 2017
,
29%
of our mid-stream segment’s total volumes and
38%
of operating margins (as defined below) were under commodity-based contracts.
|
For each of the above contracts, operating margin is defined as total operating revenues less operating expenses and does not include depreciation, amortization, and impairment, general and administrative expenses, interest expense, or income taxes.
Customers.
During
2017
,
ONEOK, Inc.
accounted for approximately
36%
of our mid-stream revenues. We believe that if we lost this customer, there are other customers available to purchase our gas and NGLs. During
2017
,
2016
, and
2015
this segment purchased
$63.2 million
,
$42.7 million
, and
$57.6 million
, respectively, of our oil and natural gas segment's natural gas and NGLs production, and provided gathering and transportation services of
$6.7 million
,
$9.2 million
, and
$7.6 million
,
15
respectively. Intercompany revenue from services and purchases of production between this business segment and our oil and natural gas segment has been eliminated in our consolidated financial statements.
VOLATILE NATURE OF OUR BUSINESS
The prevailing prices for oil, NGLs, and natural gas significantly affect our revenues, operating results, cash flow and our ability to grow our operations. Oil, NGLs, and natural gas prices have been volatile and they will probably continue to be so. For each period indicated, this table shows the highest and lowest average prices our oil and natural gas segment received for its sales of oil, NGLs, and natural gas without considering the effect of derivatives:
|
|
Oil Price per Bbl
|
NGLs Price per Bbl
|
Natural Gas Price per Mcf
|
||||||||||||||||||||
|
Quarter
|
High
|
Low
|
High
|
Low
|
High
|
Low
|
|||||||||||||||||
|
2015
|
|||||||||||||||||||||||
|
First
|
$
|
46.70
|
|
$
|
43.22
|
|
$
|
18.90
|
|
$
|
1.60
|
|
$
|
2.85
|
|
$
|
2.30
|
|
|||||
|
Second
|
$
|
54.37
|
|
$
|
49.28
|
|
$
|
15.41
|
|
$
|
10.21
|
|
$
|
2.50
|
|
$
|
2.11
|
|
|||||
|
Third
|
$
|
49.02
|
|
$
|
40.36
|
|
$
|
9.49
|
|
$
|
7.81
|
|
$
|
2.51
|
|
$
|
2.17
|
|
|||||
|
Fourth
|
$
|
42.21
|
|
$
|
33.29
|
|
$
|
12.81
|
|
$
|
9.03
|
|
$
|
2.12
|
|
$
|
1.64
|
|
|||||
|
2016
|
|||||||||||||||||||||||
|
First
|
$
|
31.49
|
|
$
|
26.62
|
|
$
|
9.49
|
|
$
|
4.54
|
|
$
|
1.86
|
|
$
|
1.20
|
|
|||||
|
Second
|
$
|
45.13
|
|
$
|
36.63
|
|
$
|
13.19
|
|
$
|
8.61
|
|
$
|
1.52
|
|
$
|
1.36
|
|
|||||
|
Third
|
$
|
41.75
|
|
$
|
41.40
|
|
$
|
14.95
|
|
$
|
9.87
|
|
$
|
2.48
|
|
$
|
2.32
|
|
|||||
|
Fourth
|
$
|
48.80
|
|
$
|
42.71
|
|
$
|
19.07
|
|
$
|
12.14
|
|
$
|
2.85
|
|
$
|
2.25
|
|
|||||
|
2017
|
|||||||||||||||||||||||
|
First
|
$
|
50.48
|
|
$
|
46.85
|
|
$
|
20.71
|
|
$
|
15.04
|
|
$
|
3.76
|
|
$
|
2.14
|
|
|||||
|
Second
|
$
|
48.73
|
|
$
|
43.49
|
|
$
|
15.33
|
|
$
|
14.36
|
|
$
|
2.95
|
|
$
|
2.30
|
|
|||||
|
Third
|
$
|
49.66
|
|
$
|
44.54
|
|
$
|
19.99
|
|
$
|
16.17
|
|
$
|
2.53
|
|
$
|
2.04
|
|
|||||
|
Fourth
|
$
|
57.38
|
|
$
|
49.62
|
|
$
|
22.39
|
|
$
|
21.13
|
|
$
|
2.58
|
|
$
|
1.93
|
|
|||||
Prices for oil, NGLs, and natural gas are subject to wide fluctuations in response to relatively minor changes in the actual or perceived supply of and demand for oil and natural gas, market uncertainty, and many additional factors that are beyond our control, including:
|
•
|
political conditions in oil producing regions;
|
|
•
|
the ability of the members of the Organization of Petroleum Exporting Countries (OPEC) to agree on prices and their ability or willingness to maintain production quotas;
|
|
•
|
actions taken by foreign oil and natural gas producing nations;
|
|
•
|
the price of foreign oil imports;
|
|
•
|
imports and exports of oil and liquefied natural gas;
|
|
•
|
actions of governmental authorities;
|
|
•
|
the domestic and foreign supply of oil, NGLs, and natural gas;
|
|
•
|
the level of consumer demand;
|
|
•
|
United States storage levels of oil, NGLs, and natural gas;
|
|
•
|
weather conditions;
|
|
•
|
domestic and foreign government regulations;
|
|
•
|
the price, availability, and acceptance of alternative fuels;
|
|
•
|
volatility in ethane prices causing rejection of ethane as part of the liquids processed stream; and
|
|
•
|
worldwide economic conditions.
|
16
These factors and the volatile nature of the energy markets make it impossible to predict with any certainty the future prices of oil, NGLs, and natural gas. You are encouraged to read the Risk Factors discussed in Item 1A of this report for additional risks that can affect our operations.
Our contract drilling operations depend on the level of demand in our operating markets. Both short-term and long-term trends in oil, NGLs, and natural gas prices affect demand. Because oil, NGLs, and natural gas prices are volatile, the level of demand for our services can also be volatile.
Our mid-stream operations provide us greater flexibility in delivering our (and third parties) natural gas and NGLs from the wellhead to major natural gas and NGLs pipelines. Margins received for the delivery of these natural gas and NGLs depend on the price for oil, NGLs, and natural gas and the demand for natural gas and NGLs in our area of operations. If the price of NGLs falls without a corresponding decrease in the cost of natural gas, it may become uneconomical to us to extract certain NGLs. The volumes of natural gas and NGLs processed depend highly on the volume and Btu content of the natural gas and NGLs gathered.
COMPETITION
All of our businesses are highly competitive and price sensitive. Competition in the contract drilling business traditionally involves factors such as demand, price, efficiency, condition of equipment, availability of labor and equipment, reputation, and customer relations.
Our oil and natural gas operations likewise encounter strong competition from other oil and natural gas companies. Many competitors have greater financial, technical, and other resources than we do and have more experience than we do in the exploration for and production of oil and natural gas.
Our drilling success and the success of other activities integral to our operations will depend, in part, during times of increased competition on our ability to attract and retain experienced geologists, engineers, and other professionals. Competition for these professionals can be intense.
Our mid-stream segment competes with purchasers and gatherers of all types and sizes, including those affiliated with various producers, other major pipeline companies, and independent gatherers for the right to purchase natural gas and NGLs, build gathering and processing systems, and deliver the natural gas and NGLs once the gathering and processing systems are established. The principal elements of competition include the rates, terms, and availability of services, reputation, and the flexibility and reliability of service.
OIL AND NATURAL GAS PROGRAMS AND CONFLICTS OF INTEREST
Unit Petroleum Company serves as the general partner of
13
oil and gas limited partnerships (the employee partnerships) which were formed to allow certain of our qualified employees and our directors to participate in Unit Petroleum’s oil and gas exploration and production operations. Employee partnerships were formed for each year beginning with 1984 and ending with 2011. We also had three non-employee partnerships, one formed in 1984 and two formed in 1986 (investments by third parties). Effective December 31, 2014, the 1984 partnership was dissolved and effective December 31, 2016, the two 1986 partnerships were dissolved.
The employee partnerships formed in 1984 through 1999 have been combined into a single consolidated partnership. The employee partnerships each have a set annual percentage (ranging from 1% to 15%) of our interest that the partnership acquires in most of the oil and natural gas wells we drill or acquire for our own account during the year in which the partnership was formed. The total interest the participants have in our oil and natural gas wells by participating in these partnerships does not exceed one percent of our interest in the wells.
Under our partnership agreements, the general partner has broad discretionary authority to manage the business and operations of the partnership, including the authority to decide regarding the partnership’s participation in a drilling location or a property acquisition, the partnership’s expenditure of funds, and distributing funds to partners. Because the business activities of the limited partners and the general partner are different, conflicts of interest will exist and it is impossible to entirely eliminate these conflicts. Additionally, conflicts of interest may arise when we are the operator of an oil and natural gas well and also provide contract drilling services. In these cases, the drilling operations are conducted under drilling contracts containing terms comparable to those contained in our drilling contracts with non-affiliated operators. We believe we fulfill our responsibility to each contracting party and comply fully with the terms of the agreements which regulate these conflicts.
17
These partnerships are further described in Notes 2 and 10 to the Consolidated Financial Statements in Item 8 of this report.
EMPLOYEES
As of
February 13, 2018
, we had approximately
910
employees in our contract drilling segment,
262
employees in our oil and natural gas segment,
124
employees in our mid-stream segment, and
79
in our general corporate area. None of our employees are members of a union or labor organization nor have our operations ever been interrupted by a strike or work stoppage. We consider relations with our employees to be satisfactory.
GOVERNMENTAL REGULATIONS
General.
Our business depends on the demand for services from the oil and natural gas exploration and development industry, and therefore our business can be affected by political developments and changes in laws and regulations that control or curtail drilling for oil and natural gas for economic, environmental, or other policy reasons.
Various state and federal regulations affect the production and sale of oil and natural gas. All states in which we conduct activities impose varying restrictions on the drilling, production, transportation, and sale of oil and natural gas. This discussion of certain laws and regulations affecting our operations should not be relied on as an exhaustive review of all regulatory considerations affecting us, due to the multitude of complex federal, state, and local regulations, and their susceptibility to change at any time by later agency actions and court rulings that may affect our operations.
Natural Gas Sales and Transportation.
Under the Natural Gas Act of 1938, the Federal Energy Regulatory Commission (FERC) regulates the interstate transportation and the sale in interstate commerce for resale of natural gas. FERC’s jurisdiction over interstate natural gas sales has been substantially modified by the Natural Gas Policy Act under which FERC continued to regulate the maximum selling prices of certain categories of gas sold in “first sales” in interstate and intrastate commerce. Effective January 1, 1993, however, the Natural Gas Wellhead Decontrol Act (the Decontrol Act) deregulated natural gas prices for all “first sales” of natural gas. Because “first sales” include typical wellhead sales by producers, all natural gas produced from our natural gas properties is sold at market prices, subject to the terms of any private contracts which may be in effect. FERC’s jurisdiction over interstate natural gas transportation is not affected by the Decontrol Act.
Our sales of natural gas are affected by intrastate and interstate gas transportation regulation. Beginning in 1985, FERC adopted regulatory changes that have significantly altered the transportation and marketing of natural gas. These changes are intended by FERC to foster competition by, among other things, transforming the role of interstate pipeline companies from wholesale marketers of natural gas to the primary role of gas transporters. All natural gas marketing by the pipelines must divest to a marketing affiliate, which operates separately from the transporter and in direct competition with all other merchants. Because of the various omnibus rulemaking proceedings in the late 1980s and the later individual pipeline restructuring proceedings of the early to mid-1990s, interstate pipelines must provide open and nondiscriminatory transportation and transportation-related services to all producers, natural gas marketing companies, local distribution companies, industrial end users, and other customers seeking service. Through similar orders affecting intrastate pipelines that provide similar interstate services, FERC expanded the impact of open access regulations to certain aspects of intrastate commerce.
FERC has pursued other policy initiatives that affected natural gas marketing. Most notable are (1) the large-scale divestiture of interstate pipeline-owned gas gathering facilities to affiliated or non-affiliated companies; (2) further development of rules governing the relationship of the pipelines with their marketing affiliates; (3) the publication of standards relating to using electronic bulletin boards and electronic data exchange by the pipelines to make available transportation information timely and to enable transactions to occur on a purely electronic basis; (4) further review of the role of the secondary market for released pipeline capacity and its relationship to open access service in the primary market; and (5) development of policy and promulgation of orders pertaining to its authorization of market-based rates (rather than traditional cost-of-service based rates) for transportation or transportation-related services on the pipeline’s demonstration of lack of market control in the relevant service market.
Because of these changes, independent sellers and buyers of natural gas have gained direct access to the particular pipeline services they need and can better conduct business with a larger number of counter parties. These changes generally have improved the access to markets for natural gas while substantially increasing competition in the natural gas marketplace. However, we cannot predict what new or different regulations FERC and other regulatory agencies may adopt or what effect later regulations may have on production and marketing of natural gas from our properties.
18
Although in the past Congress has been very active in the area of natural gas regulation as discussed above, the more recent trend has been for deregulation and the promotion of competition in the natural gas industry. In addition to “first sales” deregulation, Congress also repealed incremental pricing requirements and natural gas use restraints previously applicable. There continually are legislative proposals pending in the Federal and state legislatures which, if enacted, would significantly affect the petroleum industry. It is impossible to predict what proposals might be enacted by Congress or the various state legislatures and what effect these proposals might have on the production and marketing of natural gas by us. Similarly, and despite the trend toward federal deregulation of the natural gas industry, whether or to what extent that trend will continue or what the ultimate effect will be on the production and marketing of natural gas by us cannot be predicted.
Oil and Natural Gas Liquids Sales and Transportation.
Our sales of oil and natural gas liquids currently are not regulated and are at market prices. The prices received from the sale of these products are affected by the cost of transporting these products to market. Much of that transportation is through interstate common carrier pipelines. Effective as of January 1, 1995, FERC implemented regulations generally grandfathering all previously approved interstate transportation rates and establishing an indexing system for those rates by which adjustments are made annually based on the rate of inflation, subject to certain conditions and limitations. These regulations may increase the cost of transporting oil and natural gas liquids by interstate pipeline, although the annual adjustments could cause decreased rates in a given year. These regulations have generally been approved on judicial review. Every five years, FERC examines the relationship between the annual change in the index and the actual cost changes experienced by the oil pipeline industry and makes any necessary adjustment in the index to be used during the ensuing five years. We cannot predict with certainty what effect the periodic review of the index by FERC will have on us.
Exploration and Production Activities.
Federal, state, and local agencies also have promulgated extensive rules and regulations applicable to our oil and natural gas exploration, production, and related operations. The states we operate in require permits for drilling operations, drilling bonds, and filing reports about operations and impose other requirements relating to the exploration of oil and natural gas. Many states also have statutes or regulations addressing conservation matters including provisions for the unitization or pooling of oil and natural gas properties, the establishment of maximum rates of production from oil and natural gas wells, and regulating spacing, plugging and, abandonment of such wells. The statutes and regulations of some states limit the rate at which oil and natural gas is produced from our properties. The federal and state regulatory burden on the oil and natural gas industry increases our cost of doing business and affects our profitability. Because these rules and regulations are amended or reinterpreted frequently, we cannot predict the future cost or impact of complying with these laws.
Environmental.
General.
Our operations are subject to federal, state, and local laws and regulations governing protection of the environment. These laws and regulations may require acquisition of permits before certain of our operations may be commenced and may restrict the types, quantities, and concentrations of various substances that can be released into the environment. Planning and implementation of protective measures must prevent accidental discharges. Spills of oil, natural gas liquids, drilling fluids, and other substances may subject us to penalties and cleanup requirements. Handling, storage, and disposal of both hazardous and non-hazardous wastes are subject to regulatory requirements.
The federal Clean Water Act, as amended by the Oil Pollution Act, the federal Clean Air Act, the federal Resource Conservation and Recovery Act, and their state counterparts, are the primary vehicles for imposition of such requirements and for civil, criminal, and administrative penalties and other sanctions for violation of their requirements. In addition, the federal Comprehensive Environmental Response Compensation and Liability Act and similar state statutes impose strict liability, without regard to fault or the legality of the original conduct, on certain classes of persons considered responsible for the release of hazardous substances into the environment. Such liability, which may be imposed for the conduct of others and for conditions others have caused, includes the cost of remedial action and damages to natural resources.
The EPA in 2015 established publicly owned treatment works (POTWs) effluent guidelines and standards for oil and gas extraction facilities which reflected industry best practices for unconventional oil and gas extraction facilities.
The EPA and the U.S. Army Corp of Engineers (Army) in 2015 proposed a new expansive definition of the “waters of the United States,” which the United States Court of Appeals for the Sixth Circuit stayed nationally. On February 28, 2017, an Executive Order was issued and directed that the EPA and Army consider interpreting the term “navigable waters” in a manner consistent with Justice Scalia’s opinion in Rapanos v. United States (2006). On March 6, 2017, the EPA and Army announced their intention to review and rescind or revise the 2015 Clean Water Rule and on June 27, 2017 they issued a proposed rule and written recommendations. On January 22, 2018, the United States Supreme Court in National Association of Manufacturers v.
19
Department of Defense, et al. vacated the Sixth Circuit’s nationwide stay. As a result, on January 31, 2018, the EPA and Army issued a rule providing that the 2015 definition of “waters of the United States” will not apply until two years following the date this rule is published in the Federal Register. In addition, Army includes wetlands within its definition of “waters of the United States.” In 2016, the United States Supreme Court in
U.S. Army Corps of Engineers v. Hawkes
held that landowners can challenge in court an Army Corps of Engineers jurisdictional determination. It is anticipated this decision will provide landowners an important tool in negotiating and resolving conflicts with federal agencies over the extent of wetlands on a property.
Endangered Species Act.
The federal Endangered Species Act, called the “ESA,” and analogous state laws regulate many activities, including oil and gas development, which could have an adverse effect on species listed as threatened or endangered under the ESA or their habitats. Designating previously unidentified endangered or threatened species could cause oil and natural gas exploration and production operators and service companies to incur additional costs or become subject to operating delays, restrictions or bans in affected areas, which impacts could adversely reduce drilling activities in affected areas. All three of our business segments could be subject to the effect of one or more species being listed as threatened or endangered within the areas of our operations. Numerous species have been listed or proposed for protected status in areas in which we provide or could undertake operations. The U.S. Fish and Wildlife Service and the National Marine Fisheries in 2016 issued final revised definitions relating to impacts on critical habitats for potentially endangered species allowing exclusion of certain areas if they will not result in the extinction of the species. In 2017, the Western Governor’s Association issued a Policy Resolution calling on Congress to amend and reauthorize the ESA based upon seven broad goals to make the act more workable and understandable. In December 2017, the Interior Department announced that it is working on possible changes to the ESA with the U.S. Fish and Wildlife Service to revise the regulations for listing endangered and threatened species and for designation of critical habitat. The presence of protected species in areas where we provide contract drilling or mid-stream services or conduct exploration and production operations could impair our ability to timely complete or carry out those services and, consequently, hurt our results of operations and financial position.
Climate Change.
Recent scientific studies have suggested that emissions of certain gases, commonly called “greenhouse gases,” or GHGs, may be contributing to warming of the Earth’s atmosphere. As a result there have been many regulatory developments, proposals or requirements, and legislative initiatives introduced in the United States (and other parts of the World) that are focused on restricting the emission of carbon dioxide, methane, and other greenhouse gases.
In 2007, the United States Supreme Court in
Massachusetts, et al. v. EPA
, held that carbon dioxide may be regulated as an “air pollutant” under the federal Clean Air Act if it represents a health hazard to the public. On December 7, 2009, the U.S. Environmental Protection Agency (EPA) responded to the
Massachusetts, et al. v. EPA
decision and issued a finding that the current and projected concentrations of GHGs in the atmosphere threaten the public health and welfare of current and future generations, and that certain GHGs from new motor vehicles and motor vehicle engines contribute to the atmospheric concentrations of GHG and hence to the threat of climate change. In addition, the EPA issued a final rule, effective in December 2009, requiring the reporting of GHG emissions from specified large (25,000 metric tons or more) GHG emission sources in the U.S., beginning in 2011 for emissions in 2010. During 2010, the EPA proposed revisions to these reporting requirements to apply to all oil and gas production, transmission, processing, and other facilities exceeding certain emission thresholds. On May 12, 2016, the EPA issued three final rules that together will curb emissions of methane, smog-forming volatile organic compounds (VOCs) and toxic air-pollutants such as benzene from new, reconstructed and modified oil and natural gas sources, while providing greater certainty about Clean Air Act permitting requirements for the industry. First, the EPA issued updates to the New Source Performance Standards (NSPS) for the oil and natural gas industry to add requirements that the industry reduce emissions of GHGs and to cover additional equipment and activities in the oil and natural gas distribution chain by setting emissions limits for methane and to require owners/operators to find and repair methane and VOC leaks. Second, the EPA issued a source determination rule regarding the EPA’s air permitting rules as they apply to the oil and natural gas industry. The EPA clarified when multiple pieces of equipment and activities must be deemed a single source for determining whether (i) major source Prevention of Significant Deterioration (PSD) and Nonattainment New Source Review requirements apply regarding preconstruction permitting and (ii) a Title V Operating permit is required. Third, the EPA issued a final rule to implement the Minor New Source Review Program in Indian Country for oil and natural gas production designed to limit emissions of harmful air pollution while making the preconstruction permitting process more streamlined and efficient. These regulations will cause additional costs to reduce emissions of GHGs associated with our operations and could hurt demand for the crude oil we gather, transport, store or otherwise handle in connection with our services. Although the EPA announced in April 2017 it will reconsider the GHG oil and gas emissions rule and delay its compliance, lawsuits have prevented such an effort.
Hydraulic Fracturing.
Our oil and natural gas segment routinely applies hydraulic fracturing techniques to many of our oil and natural gas properties, including our unconventional resource plays in the Granite Wash of Texas and Oklahoma, the
20
Marmaton of Oklahoma, the Wilcox of Texas, and the Mississippian of Kansas. On July 25, 2017, the Bureau of Land Management announced a proposal to rescind the 2015 Department of Interior final rule on hydraulic fracturing, a rule that was never in effect due to pending litigation. Multiple bills have been introduced in Congress that would (i) block federal regulation of hydraulic fracturing in favor of state rules, (ii) allow a state to regulate hydraulic fracturing on federal lands within that state, (iii) prevent federal regulation of hydraulic regulation to apply to any land held in trust or restricted status for the benefit of Indians without their express consent, (iv) repeal the exemption for hydraulic fracturing in the Safe Drinking Water Act, and/or (v) require the disclosure of chemicals used in hydraulic fracturing. In addition, certain states in which we operate, including Texas, Oklahoma, Kansas, Colorado, and Wyoming have adopted, and other states and municipalities and other local governmental entities in some states, have and others are considering adopting regulations and ordinances that could impose more stringent permitting, public disclosure of fracking fluids, waste disposal, and well construction requirements on these operations, and even restrict or ban hydraulic fracturing in certain circumstances.
On December 31, 2016, the EPA released its scientific Final Report on Impacts from Hydraulic Fracturing Activities on Drinking Water. The EPA states the report, which was done at the request of Congress, provides scientific evidence that hydraulic fracturing activities can affect drinking water resources in the United States under some circumstances. The EPA identifies six conditions under which impacts from hydraulic fracturing activities can be more frequent or severe and existing uncertainties and data gaps. Both the EPA and the United States Geological Survey (USGS) have made statements indicating that activities associated with hydraulic fracturing may be causing earthquakes, with the focus being on wastewater disposal wells rather than injection wells. In an August 2015 report sent to the Texas Railroad Commission, the EPA stated it believes there is a significant possibility that North Texas earthquake activity is associated with disposal wells. The USGS has stated that hydraulic fracturing causes small earthquakes, but they are almost always too small to be detected. Regarding disposal wells, the USGS has stated that the injection of wastewater and salt water by deep wells into the subsurface can cause earthquakes that are large enough to be felt and may cause damage. As a result, the USGS and its university partners have deployed seismometers at sites of known or possible injection induced earthquakes in Arkansas, Colorado, Kansas, Oklahoma, Ohio and Texas and that it is also developing methods to assess the earthquake hazard associated with wastewater injection wells.
Any new laws, regulation, or permitting requirements regarding hydraulic fracturing could lead to operational delay, or increased operating costs or third party or governmental claims, and could result in additional burdens that could delay or limit the drilling services we provide to third parties whose drilling operations could be affected by these regulations or increase our costs of compliance and doing business and delay the development of unconventional gas resources from shale formations which are not commercial without using hydraulic fracturing. Restrictions on hydraulic fracturing could also reduce the oil and natural gas we can ultimately produce from our reserves.
Other; Compliance Costs.
We cannot predict future legislation or regulations. It is possible that some future laws, regulations, and/or ordinances could cause increasing our compliance costs or additional operating restrictions and those of our customers. Such future developments also might curtail the demand for fossil fuels which could hurt the demand for our services, which could hurt our future results of operations. Likewise we cannot predict with any certainty whether any changes to temperature, storm intensity or precipitation patterns because of climate change (or otherwise) will have a material impact on our operations.
Compliance with applicable environmental requirements has not, to date, had a material effect on the cost of our operations, earnings, or competitive position. However, as noted above in our discussion of the regulation of GHGs and hydraulic fracturing, compliance with amended, new or more stringent requirements of existing environmental regulations or requirements may cause us to incur additional costs or subject us to liabilities that may have a material adverse effect on our results of operations and financial condition.
FINANCIAL INFORMATION ABOUT GEOGRAPHIC AREAS
Historically, our revenues from our Canadian operations, and information relating to long-lived assets attributable to those operations were immaterial. We no longer have any interests there or any other international operations.
21
FORWARD-LOOKING STATEMENTS/CAUTIONARY STATEMENT AND RISK FACTORS
This report contains “forward-looking statements” – meaning, statements related to future events within the meaning of Section 27A of the Securities Act of 1933, as amended and Section 21E of the Securities Exchange Act of 1934, as amended. All statements, other than statements of historical facts, included or incorporated by reference in this document which addresses activities, events or developments which we expect or anticipate will or may occur, are forward-looking statements. The words “believes,” “intends,” “expects,” “anticipates,” “projects,” “estimates,” “predicts,” and similar expressions are used to identify forward-looking statements. This report modifies and supersedes documents filed by us before this report. In addition, certain information we file with the SEC in the future will automatically update and supersede information in this report.
These forward-looking statements include, among others, such things as:
|
•
|
the amount and nature of our future capital expenditures and how we expect to fund our capital expenditures;
|
|
•
|
prices for oil, NGLs, and natural gas;
|
|
•
|
demand for oil, NGLs, and natural gas;
|
|
•
|
our exploration and drilling prospects;
|
|
•
|
the estimates of our proved oil, NGLs, and natural gas reserves;
|
|
•
|
oil, NGLs, and natural gas reserve potential;
|
|
•
|
development and infill drilling potential;
|
|
•
|
expansion and other development trends of the oil and natural gas industry;
|
|
•
|
our business strategy;
|
|
•
|
our plans to maintain or increase production of oil, NGLs, and natural gas;
|
|
•
|
the number of gathering systems and processing plants we plan to construct or acquire;
|
|
•
|
volumes and prices for natural gas gathered and processed;
|
|
•
|
expansion and growth of our business and operations;
|
|
•
|
demand for our drilling rigs and drilling rig rates;
|
|
•
|
our belief that the final outcome of our legal proceedings will not materially affect our financial results;
|
|
•
|
our ability to timely secure third-party services used in completing our wells;
|
|
•
|
our ability to transport or convey our oil, NGLs, or natural gas production to established pipeline systems;
|
|
•
|
impact of federal and state legislative and regulatory actions affecting our costs and increasing operating restrictions or delays and other adverse impacts on our business;
|
|
•
|
our projected production guidelines for the year;
|
|
•
|
our anticipated capital budgets;
|
|
•
|
our financial condition and liquidity;
|
|
•
|
the number of wells our oil and natural gas segment plans to drill during the year; and
|
|
•
|
our estimates of the amounts of any ceiling test write-downs or other potential asset impairments we may have to record in future periods.
|
These statements are based on certain assumptions and analyses made by us considering our experience and our perception of historical trends, current conditions, and expected future developments and other factors we believe are appropriate in the circumstances. Whether actual results and developments will conform to our expectations and predictions is subject to several risks and uncertainties any one or combination of which could cause our actual results to differ materially from our expectations and predictions, including:
|
•
|
the risk factors discussed in this document and in the documents (if any) we incorporate by reference;
|
22
|
•
|
general economic, market, or business conditions;
|
|
•
|
the availability of and nature of (or lack of) business opportunities we pursue;
|
|
•
|
demand for our land drilling services;
|
|
•
|
changes in laws or regulations;
|
|
•
|
changes in the current geopolitical situation;
|
|
•
|
risks relating to financing, including restrictions in our debt agreements and availability and cost of credit;
|
|
•
|
risks associated with future weather conditions;
|
|
•
|
decreases or increases in commodity prices; and
|
|
•
|
other factors, most of which are beyond our control.
|
You should not place undue reliance on these forward-looking statements. Except as required by law, we disclaim any intention to update forward-looking information and to release publicly the results of any future revisions we may make to forward-looking statements to reflect events or circumstances after the date of this document to reflect unanticipated events.
To help provide you with a more thorough understanding of the possible effects of these influences on any forward-looking statements made by us, this discussion outlines some (but not all) of the factors that could cause our consolidated results to differ materially from those that may be presented in any forward-looking statement made by us or on our behalf.
Demand for our contract drilling and mid-stream services depends substantially on the levels of expenditures by the oil and gas industry. A substantial or an extended decline in oil and gas prices could cause lower expenditures by the oil and gas industry, which could have a material adverse effect on our financial condition, results of operations and cash flows.
Demand for our contract drilling and mid-stream services depends substantially on the level of expenditures by the oil and gas industry for the exploration, development and production of oil and natural gas reserves. These expenditures depend generally on the industry’s view of future oil and natural gas prices and are sensitive to the industry’s view of future economic growth and the resulting impact on demand for oil and natural gas. Declines, and anticipated declines, in oil and gas prices could also result in project modifications, delays or cancellations, general business disruptions, and delays in payment of, or nonpayment of, amounts owed to us. These effects could have a material adverse effect on our financial condition, results of operations and cash flows.
The oil and gas industry has historically experienced periodic downturns, which have been characterized by diminished demand for oilfield services and downward pressure on the prices we charge. A significant downturn in the oil and gas industry could cause a reduction in demand for oilfield services and could hurt our financial condition, results of operations and cash flows.
Oil, NGLs, and Natural Gas Prices.
Besides the impact oil and gas prices may have on our contract drilling and mid-stream segments, the prices we receive for our oil, NGLs, and natural gas production directly affect our revenues, profitability, and cash flow and our ability to meet our projected financial and operational goals. The prices for oil, NGLs, and natural gas are determined on several factors beyond our control, including:
|
•
|
the demand for and supply of oil, NGLs, and natural gas;
|
|
•
|
weather conditions in the continental United States (which can greatly influence the demand and prices for natural gas);
|
|
•
|
the amount and timing of oil, liquid natural gas, and liquefied petroleum gas imports and exports;
|
|
•
|
the ability of distribution systems in the United States to effectively meet the demand for oil, NGLs, and natural gas, particularly in times of peak demand which may result because of adverse weather conditions;
|
|
•
|
the ability or willingness of the OPEC to set and maintain production levels for oil;
|
|
•
|
oil and gas production levels by non-OPEC countries;
|
|
•
|
the level of excess production capacity;
|
|
•
|
political and economic uncertainty and geopolitical activity;
|
|
•
|
governmental policies and subsidies;
|
23
|
•
|
the costs of exploring for producing and delivering oil and gas; and
|
|
•
|
technological advances affecting energy consumption.
|
Oil prices are extremely sensitive to influences domestic and foreign based on political, social or economic underpinnings, any of which could have an immediate and significant effect on the price and supply of oil
.
In addition, prices of oil, NGLs, and natural gas have been at various times influenced by trading on the commodities markets. That trading has increased the volatility associated with these prices resulting in large differences in prices even on a week-to-week and month-to-month basis. These factors, especially when coupled with much of our product prices being determined daily, can, and do, lead to wide fluctuations in the prices we receive.
Based on our
2017
production, a $0.10 per Mcf change in what we receive for our natural gas production, without the effect of derivatives, would cause a corresponding
$410,000
per month (
$4.9 million
annualized) change in our pre-tax operating cash flow. A $1.00 per barrel change in our oil price, without the effect of derivatives, would have a
$217,000
per month (
$2.6 million
annualized) change in our pre-tax operating cash flow and a $1.00 per barrel change in our NGLs price, without the effect of derivatives, would have a
$380,000
per month (
$4.6 million
annualized) change in our pre-tax operating cash flow.
To reduce our exposure to short-term fluctuations in the price of oil, NGLs, and natural gas, we sometimes enter into derivative contracts such as swaps and collars. To date, we have derivatives covering part, but not all of our production which provides price protection only against declines in oil, NGLs, and natural gas prices on the production subject to our derivatives, but not otherwise. Should market prices for the production we have derivatives exceed the prices due under our derivative contracts, our derivative contracts then expose us to risk of financial loss and limit the benefit to us of those increases in market prices. During
2017
, all of our NGLs volumes, half of our oil, and about a quarter of our natural gas volumes were sold at market responsive prices. To help manage our cash flow and capital expenditure requirements, we had derivative contracts on approximately
50%
and
72%
of our
2017
average daily production for oil and natural gas, respectively. A more thorough discussion of our derivative arrangements is contained in the Management’s Discussion and Analysis of Financial Condition and Results of Operations section of this report in Item 7.
Uncertainty of Oil, NGLs, and Natural Gas Reserves; Ceiling Test.
Many uncertainties are inherent in estimating quantities of oil, NGLs, and natural gas reserves and their values, including many factors beyond our control. The oil, NGLs, and natural gas reserve information in this report represents only an estimate of these reserves. Oil, NGLs, and natural gas reservoir engineering is a subjective and an inexact process of estimating underground accumulations of oil, NGLs, and natural gas that cannot be measured in an exact manner. Estimates of economically recoverable oil, NGLs, and natural gas reserves depend on several variable factors, including historical production from the area compared with production from other producing areas, and assumptions about:
|
•
|
reservoir size;
|
|
•
|
the effects of regulations by governmental agencies;
|
|
•
|
future oil, NGLs, and natural gas prices;
|
|
•
|
future operating costs;
|
|
•
|
severance and excise taxes;
|
|
•
|
operational risks;
|
|
•
|
development costs; and
|
|
•
|
workover and remedial costs.
|
Some or all of these assumptions may vary considerably from actual results. For these and other reasons, estimates of the economically recoverable quantities of oil, NGLs, and natural gas attributable to any group of properties, classifications of those oil, NGLs, and natural gas reserves based on risk of recovery, and estimates of the future net cash flows from oil, NGLs, and natural gas reserves prepared by different engineers or by the same engineers but at different times may vary substantially. Accordingly, oil, NGLs, and natural gas reserve estimates may be subject to periodic downward or upward adjustments. Actual production, revenues, and expenditures regarding our oil, NGLs, and natural gas reserves will likely vary from estimates and those variances may be material.
24
The information regarding discounted future net cash flows in this report is not necessarily the current market value of the estimated oil, NGLs, and natural gas reserves attributable to our properties. Using full cost accounting requires us to use the unweighted arithmetic average of the commodity prices existing on the first day of each of the 12 months before the end of the reporting period to calculate discounted future revenues, unless prices were otherwise determined under contractual arrangements. Actual future prices and costs may be materially higher or lower. Actual future net cash flows are also affected, in part, by these factors:
|
•
|
the amount and timing of oil, NGLs, and natural gas production;
|
|
•
|
supply and demand for oil, NGLs, and natural gas;
|
|
•
|
increases or decreases in consumption; and
|
|
•
|
changes in governmental regulations or taxation.
|
In addition, the 10% discount factor, required by the SEC for calculating discounted future net cash flows for reporting purposes, is not necessarily the most appropriate discount factor based on interest rates in effect from time to time and the risks associated with our operations or the oil and natural gas industry.
We review quarterly the carrying value of our oil and natural gas properties under the full cost accounting rules of the SEC. Under these rules, capitalized costs of proved oil and natural gas properties may not exceed the present value of estimated future net revenues from those proved reserves, discounted at 10%. Application of this “ceiling test” generally requires pricing future revenue at the unescalated 12-month average price and requires a write-down for accounting purposes if we exceed the ceiling. We may be required to write-down the carrying value of our oil and natural gas properties when oil, NGLs, and natural gas prices are depressed. If a write-down is required, it would cause a charge to earnings but would not impact our cash flow from operating activities. Once incurred, a write-down is not reversible.
Debt and Bank Borrowing.
We have incurred and expect to continue to incur substantial capital expenditures in our operations. Historically, we have funded our capital needs through a combination of internally generated cash flow and borrowings under our bank credit agreement. In 2011 and 2012, we issued
$250.0 million
(the 2011 Notes) and
$400.0 million
(the 2012 Notes), respectively, of senior subordinated notes (collectively, the Notes). We have, and will continue to have, a certain amount of indebtedness. At
December 31, 2017
, we had
$178.0 million
of outstanding long-term debt under our credit agreement, and
$642.3 million
, net of unamortized discount and debt issuance costs, under the Notes.
Depending on our debt, the cash flow needed to satisfy that debt and the covenants in our bank credit agreement and those applicable to the Notes could:
|
•
|
limit funds otherwise available for financing our capital expenditures, our drilling program or other activities or cause us to curtail these activities;
|
|
•
|
limit our flexibility in planning for or reacting to changes in our business;
|
|
•
|
place us at a competitive disadvantage to those of our competitors that are less indebted than we are;
|
|
•
|
make us more vulnerable during periods of low oil, NGLs, and natural gas prices or if a downturn in our business occurs; and
|
|
•
|
prevent us from obtaining additional financing on acceptable terms or limit amounts available under our existing or any future credit facilities.
|
Our ability to meet our debt obligations depends on our future performance. If the requirements of our indebtedness are not satisfied, a default could be deemed to occur and our lenders or the holders of the Notes could accelerate the payment of the outstanding indebtedness. If that were to happen, we would not have sufficient funds available (and probably could not obtain the financing required) to meet our obligations.
Our existing debt, and our future debt, if any, is, largely, based on the costs associated with the projects we undertake and of our cash flow. Generally, our normal operating costs are those resulting from the drilling of oil and natural gas wells, the acquisition of producing properties, the costs associated with the maintenance, upgrade, or expansion of our drilling rig fleet, and the operations of our natural gas buying, selling, gathering, processing, and treating systems. To some extent, these costs, particularly the first two, are discretionary and we maintain some control regarding the timing or the need to incur them. But, sometimes, unforeseen circumstances may arise, like an unanticipated opportunity to make a large acquisition or the need to
25
replace a costly drilling rig component due to an unexpected loss, which could force us to incur additional debt above what we had expected or forecasted. Likewise, if our cash flow should prove insufficient to cover our cash requirements we would need to increase our debt either through bank borrowings or otherwise.
RISK FACTORS
Many other factors could hurt our business. This discussion describes the material risks currently known to us. However, additional risks we do not know about or that we currently view as immaterial may also impair our business or hurt the value of our securities. You should carefully consider the risks described below together with the other information contained in, or incorporated by reference into, this report.
If demand for oil, NGLs, and natural gas is reduced, our ability to market and produce our oil, NGLs, and natural gas may be negatively affected.
Historically, oil, NGLs, and natural gas prices have been volatile, with significant increases and significant price drops being experienced occasionally. Various factors beyond our control will have a significant effect on oil, NGLs, and natural gas prices. Those factors include, among other things, the domestic and foreign supply of oil, NGLs, and natural gas, the price of imports, the levels of consumer demand, the price and availability of alternative fuels, the availability of pipeline capacity, and changes in existing and proposed federal regulation and price controls.
The oil, NGLs, and natural gas markets are also unsettled due to several factors. Production from oil and natural gas wells in some geographic areas of the United States has been curtailed for considerable periods of time due to a lack of market demand and transportation and storage capacity. It is possible, however, that some of our wells may be shut-in or that oil, NGLs, and natural gas will be sold on terms less favorable than might otherwise be obtained should demand for oil, NGLs, and natural gas decrease. Competition for markets has been vigorous and there remains great uncertainty about prices that purchasers will pay. Oil, NGLs, and natural gas surpluses could cause our inability to market oil, NGLs, and natural gas profitably, causing us to curtail production and/or receive lower prices for our oil, NGLs, and natural gas, situations which would hurt us.
Disruptions in the financial markets could affect our ability to obtain financing or refinance existing indebtedness on reasonable terms and may have other adverse effects.
Commercial-credit and equity market disruptions may cause tight capital markets in the United States. Liquidity in the global-capital markets can be severely contracted by market disruptions making terms for certain financings less attractive, and in certain cases, result in the unavailability of certain types of financing. Because credit and equity market turmoil, we may not be able to obtain debt or equity financing, or refinance existing indebtedness on favorable terms, which could affect operations and financial performance.
Oil, NGLs, and natural gas prices are volatile, and low prices have negatively affected our financial results and could do so in the future.
Our revenues, operating results, cash flow, and growth depend substantially on prevailing prices for oil, NGLs, and natural gas. Historically, oil, NGLs, and natural gas prices and markets have been volatile, and they are likely to continue to be volatile. Any decline in prices would have a negative impact on our future financial results and our ability to grow our business segments.
Prices for oil, NGLs, and natural gas are subject to wide fluctuations in response to relatively minor changes in the actual or perceived supply of and demand for oil, NGLs, and natural gas, market uncertainty, and many additional factors that are beyond our control. These factors include:
|
•
|
political conditions in oil producing regions;
|
|
•
|
the ability of the members of the OPEC to agree on prices and their ability or willingness to maintain production quotas;
|
|
•
|
actions taken by foreign oil and natural gas companies;
|
|
•
|
the price of foreign oil imports;
|
|
•
|
imports and exports of oil and liquefied natural gas;
|
26
|
•
|
actions of governmental authorities;
|
|
•
|
the domestic and foreign supply of oil, NGLs, and natural gas;
|
|
•
|
the level of consumer demand;
|
|
•
|
United States storage levels of oil, NGLs, and natural gas;
|
|
•
|
weather conditions;
|
|
•
|
domestic and foreign government regulations;
|
|
•
|
the price, availability, and acceptance of alternative fuels;
|
|
•
|
volatility in ethane prices causing rejection of ethane as part of the liquids processed stream; and
|
|
•
|
worldwide economic conditions.
|
These factors and the volatile nature of the energy markets make it impossible to predict with any certainty the future prices of oil, NGLs, and natural gas.
Our contract drilling operations depend on levels of activity in the oil, NGLs, and natural gas exploration and production industry.
Our contract drilling operations depend on the level of activity in oil, NGLs, and natural gas exploration and production in our operating markets. Both short-term and long-term trends in oil, NGLs, and natural gas prices affect the level of that activity. Because oil, NGLs, and natural gas prices are volatile, the level of exploration and production activity can also be volatile. Any decrease from current oil, NGLs, and natural gas prices could further depress the level of exploration and production activity. This, in turn, would likely result in further declines in the demand for our drilling services and would have an adverse effect on our contract drilling revenues, cash flows, and profitability. As a result, the future demand for our drilling services is uncertain.
The industries in which we operate are highly competitive, and many of our competitors have resources greater than we do.
The drilling industry in which we operate is generally very competitive. Most drilling contracts are awarded based on competitive bids, which may cause intense price competition. Some of our competitors in the contract drilling industry have greater financial and human resources than we do. These resources may enable them to better withstand periods of low drilling rig utilization, to compete more effectively based on price and technology, to build new drilling rigs or acquire existing drilling rigs, and to provide drilling rigs more quickly than we do in periods of high drilling rig utilization.
The oil and natural gas industry is also highly competitive. We compete in the areas of property acquisitions and oil and natural gas exploration, development, production, and marketing with major oil companies, other independent oil and natural gas concerns, and individual producers and operators. In addition, we must compete with major and independent oil and natural gas concerns in recruiting and retaining qualified employees. Many of our competitors in the oil and natural gas industry have resources substantially greater than we do.
The mid-stream industry is also highly competitive. We compete in areas of gathering, processing, transporting, and treating natural gas with other mid-stream companies. We are continually competing with larger mid-stream companies for acquisitions and construction projects. Many of our competitors have greater financial resources, human resources, and geographic presence larger than we do.
Growth through acquisitions is not assured.
We have experienced growth in each segment, in part, through mergers and acquisitions. The contract land drilling industry, the exploration and development industry, and the gas gathering and processing industry, have experienced significant consolidation over the past several years, and there can be no assurance that acquisition opportunities will be available. Even if available, there is no assurance we would have the financial ability to pursue the opportunity. And we are likely to continue to face intense competition from other companies for acquisition opportunities.
27
There can be no assurance we will:
|
•
|
be able to identify suitable acquisition opportunities;
|
|
•
|
have sufficient capital resources to complete additional acquisitions;
|
|
•
|
successfully integrate acquired operations and assets;
|
|
•
|
effectively manage the growth and increased size;
|
|
•
|
maintain the crews and market share to operate any future drilling rigs we may acquire; or
|
|
•
|
improve our financial condition, results of operations, business or prospects in any material manner because of any completed acquisition.
|
We may incur substantial indebtedness to finance future acquisitions and also may issue debt instruments, equity securities, or convertible securities in connection with any acquisitions. Debt service requirements could represent a significant burden on our results of operations and financial condition and issuing additional equity would be dilutive to existing shareholders. Also, continued growth could strain our management, operations, employees, and other resources.
Successful acquisitions, particularly those of oil and natural gas companies or of oil and natural gas properties, require an assessment of several factors, many of which are beyond our control. These factors include recoverable reserves, exploration potential, future oil, NGLs, and natural gas prices, operating costs, and potential environmental and other liabilities. Such assessments are inexact and their accuracy is inherently uncertain.
Our operations have significant capital requirements, and our indebtedness could have important consequences.
We have experienced and will continue to experience substantial capital needs for our operations. We have
$642.3 million
of indebtedness outstanding (net of unamortized discount and debt issuance costs) under the senior subordinated notes we have issued to date and, in addition, may borrow up to
$475.0 million
under our credit agreement. As of
February 13, 2018
, we had
$173.8 million
outstanding borrowings under our credit agreement. Our level of indebtedness, the cash flow to satisfy our indebtedness, and the covenants governing our indebtedness could:
|
•
|
limit funds available for financing capital expenditures, our drilling program or other activities or cause us to curtail these activities;
|
|
•
|
limit our flexibility in planning for, or reacting to changes in, our business;
|
|
•
|
place us at a competitive disadvantage to some of our competitors that are less leveraged than we are;
|
|
•
|
make us more vulnerable during periods of low oil, NGLs, and natural gas prices or if downturn in our business occurs; and
|
|
•
|
prevent us from obtaining additional financing on acceptable terms or limit amounts available under our existing or any future credit facilities.
|
Our ability to meet our debt service and other contractual and contingent obligations will depend on our future performance. In addition, lower oil, NGLs, and natural gas prices could cause future reductions in the amount available for borrowing under our credit agreement, reducing our liquidity, and even triggering mandatory loan repayments.
The instruments governing our indebtedness contain various covenants limiting the conduct of our business.
The indentures governing our senior subordinated notes and our credit agreement contain various restrictive covenants that limit the conduct of our business. These agreements place certain limits on our ability to, among other things:
|
•
|
incur additional indebtedness, guarantee obligations or issue disqualified capital stock;
|
|
•
|
pay dividends or distributions on our capital stock or redeem, repurchase or retire our capital stock;
|
|
•
|
make investments or other restricted payments;
|
|
•
|
grant liens on assets;
|
|
•
|
enter into transactions with stockholders or affiliates;
|
28
|
•
|
sell assets;
|
|
•
|
issue or sell capital stock of certain subsidiaries; and
|
|
•
|
merge or consolidate.
|
In addition, our credit agreement also requires us to maintain a minimum current ratio and a maximum senior indebtedness or leverage ratio.
If we violate the restrictions in the indentures governing our senior subordinated notes, our credit agreement or any other subsequent financing agreements, a default may allow the creditors, if the agreements so provide, to accelerate the related indebtedness and any other indebtedness to which a cross-acceleration or cross-default provision applies. If that occurs, we may not make the required payments or borrow sufficient funds to refinance that debt. Even if new financing were available at that time, it may not be on terms acceptable to us. In addition, lenders may be able to terminate any commitments they had made to make available further funds.
Our future performance depends on our ability to find or acquire additional oil, NGLs, and natural gas reserves that are economically recoverable.
Production from oil and natural gas properties declines as reserves are depleted, with the rate of decline depending on reservoir characteristics. Unless we replace the reserves we produce, our reserves will decline, resulting eventually in a decrease in oil, NGLs, and natural gas production and lower revenues and cash flow from operations. Historically, we have increased reserves after taking production into account through exploration and development. We have conducted these activities on our existing oil and natural gas properties and on newly acquired properties. We may not continue to replace reserves from these activities at acceptable costs. Lower prices of oil, NGLs, and natural gas may further limit the reserves that can economically be developed. Lower prices also decrease our cash flow and may cause us to decrease capital expenditures.
We are continually identifying and evaluating opportunities to acquire oil and natural gas properties, including acquisitions significantly larger than those consummated by us. We cannot assure you we will successfully consummate any acquisition, that we can acquire producing oil and natural gas properties that contain economically recoverable reserves or that any acquisition will be profitably integrated into our operations.
The competition for producing oil and natural gas properties is intense. This competition could mean that to acquire properties we must pay higher prices and accept greater ownership risks than we have in the past.
Our exploration and production and mid-stream operations involve high business and financial risk which could hurt us.
Exploration and development involve numerous risks that may cause dry holes, the failure to produce oil, NGLs, and natural gas in commercial quantities and the inability to fully produce discovered reserves. The cost of drilling, completing, and operating wells is substantial and uncertain. Numerous factors beyond our control may cause the curtailment, delay, or cancellation of drilling operations, including:
|
•
|
unexpected drilling conditions;
|
|
•
|
pressure or irregularities in formations;
|
|
•
|
capacity of pipeline systems;
|
|
•
|
equipment failures or accidents;
|
|
•
|
adverse weather conditions;
|
|
•
|
compliance with governmental requirements; and
|
|
•
|
shortages or delays in the availability of drilling rigs, pressure pumping services, or delivery crews and the delivery of equipment.
|
Exploratory drilling is a speculative activity. Although we may disclose our overall drilling success rate, those rates may decline. Although we may discuss drilling prospects we have identified or budgeted for, we may ultimately not lease or drill these prospects within the expected time frame, or at all. Lack of drilling success will have an adverse effect on our future results of operations and financial condition.
29
Our mid-stream operations involve numerous risks, both financial and operational. The cost of developing gathering systems and processing plants is substantial and our ability to recoup these costs is uncertain. Our operations may be curtailed, delayed, or canceled because of many things beyond our control, including:
|
•
|
unexpected changes in the deliverability of natural gas reserves from the wells connected to the gathering systems;
|
|
•
|
availability of competing pipelines in the area;
|
|
•
|
capacity of pipeline systems;
|
|
•
|
equipment failures or accidents;
|
|
•
|
adverse weather conditions;
|
|
•
|
compliance with governmental requirements;
|
|
•
|
delays in developing other producing properties within the gathering system’s area of operation; and
|
|
•
|
demand for natural gas and its constituents.
|
Many of the wells from which we gather and process natural gas are operated by other parties. We have little control over the operations of those wells which can act to increase our risk. Operators of those wells may act in ways not in our best interests.
Competition for experienced technical personnel may negatively affect our operations or financial results.
The success of our three segments and the success of our other activities integral to our operations will depend, in part, on our ability to attract and retain experienced geologists, engineers, and other professionals. Competition for these professionals can be intense, particularly when the industry is experiencing favorable conditions.
Our derivative arrangements might limit the benefit of increases in oil, NGLs, and natural gas prices.
To reduce our exposure to short-term fluctuations in the price of oil, NGLs, and natural gas, we sometimes enter into derivative contracts. These derivative contracts apply to only a portion of our production and provide only partial price protection against declines in oil, NGLs, and natural gas prices. These derivative contracts may expose us to risk of financial loss and limit the benefit to us of increases in prices.
Estimates of our reserves are uncertain and may prove inaccurate.
Numerous uncertainties are inherent in estimating quantities of proved reserves and their values, including many factors beyond our control. The reserve data represents only estimates. Reservoir engineering is a subjective and inexact process of estimating underground accumulations of oil and natural gas that cannot be measured in an exact manner. Estimates of economically recoverable oil, NGLs, and natural gas reserves depend on several variable factors, including historical production from the area compared with production from other producing areas, and assumptions about:
|
•
|
the effects of regulations by governmental agencies;
|
|
•
|
future oil, NGLs, and natural gas prices;
|
|
•
|
future operating costs;
|
|
•
|
severance and excise taxes;
|
|
•
|
development costs; and
|
|
•
|
workover and remedial costs.
|
Some or all of these assumptions may vary considerably from actual results. Estimates of the economically recoverable quantities of oil, NGLs, and natural gas attributable to any group of properties, classifications of those reserves based on risk of recovery, and estimates of the future net cash flows from reserves prepared by different engineers or by the same engineers but at different times may vary substantially. Accordingly, reserve estimates may be subject to downward or upward adjustment. Actual production, revenues and expenditures regarding our reserves will likely vary from estimates, and those variances may be material.
30
The information regarding discounted future net cash flows should not be considered as the current market value of the estimated oil, NGLs, and natural gas reserves attributable to our properties. As required by the SEC, the estimated discounted future net cash flows from proved reserves are based on prices on the first day of the month for each month within the 12-month period before the end of the reporting period and costs as of the date of the estimate, while actual future prices and costs may be materially higher or lower. Actual future net cash flows also will be affected by these factors:
|
•
|
the amount and timing of actual production;
|
|
•
|
supply and demand for oil, NGLs, and natural gas;
|
|
•
|
increases or decreases in consumption; and
|
|
•
|
changes in governmental regulations or taxation.
|
In addition, the 10% per year discount factor, which is required by the SEC to be used in calculating discounted future net cash flows for reporting purposes, is not necessarily the most appropriate discount factor based on interest rates in effect from time to time and risks associated with our operations or the oil and natural gas industry.
If oil, NGLs, and natural gas prices decrease or are unusually volatile, we may have to take write-downs of our oil and natural gas properties, the carrying value of our drilling rigs or our natural gas gathering and processing systems.
We review quarterly the carrying value of our oil and natural gas properties under the full cost accounting rules of the SEC. Under these rules, capitalized costs of proved oil and natural gas properties may not exceed the present value of estimated future net revenues from proved reserves, discounted at 10% per year. Application of the ceiling test generally requires pricing future revenue at the unweighted arithmetic average of the price on the first day of month for each month within the 12-month period before the end of the reporting period, unless prices were defined by contractual arrangements, and requires a write-down for accounting purposes if the ceiling is exceeded. We may be required to write-down the carrying value of our oil and natural gas properties when oil, NGLs, and natural gas prices are depressed. If a write-down is required, it would cause a charge to earnings, but would not impact cash flow from operating activities. Once incurred, a write-down of oil and natural gas properties is not reversible later. Because our ceiling tests use a rolling 12-month look back average price it is possible that a write down during a reporting period will not remove the need for us to take additional write downs in one or more succeeding periods. This would be the case when months with higher commodity prices roll off the 12-month period and are replaced with more recent months having lower commodity prices.
Our drilling equipment, transportation equipment, gas gathering and processing systems, and other property and equipment are carried at cost. We are required to periodically test to see if these values, including associated goodwill and other intangible assets, have been impaired whenever events or changes in circumstances suggest the carrying amount may not be recoverable. If any of these assets are determined to be impaired, the loss is measured as the amount by which the carrying amount of the asset exceeds its fair value. An estimate of fair value is based on the best information available, including prices for similar assets. Changes in these estimates could cause us to reduce the carrying value of property, equipment, and related intangible assets. Once these values have been reduced, they are not reversible.
Our operations present inherent risks of loss that, if not insured or indemnified against, could hurt our results of operations.
Our contract drilling operations are subject to many hazards inherent in the drilling industry, including blowouts, cratering, explosions, fires, loss of well control, loss of hole, damaged or lost drilling equipment, and damage or loss from inclement weather. Our exploration and production and mid-stream operations are subject to these and similar risks. These events could cause personal injury or death, damage to or destruction of equipment and facilities, suspension of operations, environmental damage, and damage to the property of others. Generally, drilling contracts provide for the division of responsibilities between a drilling company and its customer, and we seek to obtain indemnification from our drilling customers by contract for some of these risks. If we cannot transfer these risks to drilling customers by contract or indemnification agreements (or to the extent we assume obligations of indemnity or assume liability for certain risks under our drilling contracts), we seek protection from some of these risks through insurance. However, some risks are not covered by insurance and we cannot assure you that the insurance we have or the indemnification agreements we have will adequately protect us against liability from the consequences of the hazards described above. An event not fully insured or indemnified against, or the failure of a customer to meet its indemnification obligations, could cause substantial losses. In addition, we cannot assure you that insurance will be available to cover any or all of these risks. Even if available, the insurance might not be adequate to cover all of our losses, or we might decide against obtaining that insurance because of high premiums or other costs.
31
We do not operate many of the wells in which we own an interest. Our operating risks for those wells and our ability to influence the operations for those wells are less subject to our control. Operators of those wells may act in ways not in our best interests.
Governmental and environmental regulations could hurt our business.
Our business is subject to federal, state, and local laws and regulations on taxation, the exploration for and development, production, and marketing of oil and natural gas, and safety matters. Many laws and regulations require drilling permits and govern the spacing of wells, rates of production, prevention of waste, unitization and pooling of properties, and other matters. These laws and regulations have increased the costs of planning, designing, drilling, installing, operating, and abandoning our oil and natural gas wells and other facilities. In addition, these laws and regulations, and any others that are passed by the jurisdictions where we have production, could limit the number of wells drilled or the allowable production from successful wells, which could limit our revenues.
We are (or could become) subject to complex environmental laws and regulations adopted by the jurisdictions where we own or operate. We could incur liability to governments or third parties for discharges of oil, natural gas or other pollutants into the air, soil or water, including responsibility for remedial costs. We could discharge these materials into the environment in many ways including:
|
•
|
from a well or drilling equipment at a drill site;
|
|
•
|
from gathering systems, pipelines, transportation facilities, and storage tanks;
|
|
•
|
damage to oil and natural gas wells resulting from accidents during normal operations;
|
|
•
|
sabotage; and
|
|
•
|
blowouts, cratering, and explosions.
|
Because the requirements imposed by laws and regulations frequently change, we cannot assure you that future laws and regulations, including changes to existing laws and regulations, will not hurt our business. The Congress and White House administration may impose or change laws and regulations that will hurt our business. Stricter standards, greater regulation, and more extensive permit requirements, could increase our future risks and costs related to environmental matters. In addition, because we acquire interests in properties operated in the past by others, we may be liable for environmental damage caused by the former operators, which liability could be material.
Any future implementation of price controls on oil, NGLs, and natural gas would affect our operations.
Certain groups have asserted efforts to have the United States Congress impose price controls on either oil, natural gas, or both. There is no way at this time to know what result these efforts will have nor, if implemented, their effect on our operations. However, it is possible that these efforts, if successful, would limit the amount we might get for our future oil, NGLs, and natural gas production. Any future limits on the price of oil, NGLs, and natural gas could also cause hurting the demand for our drilling services.
Provisions of Delaware law and our by-laws and charter could discourage change in control transactions and prevent shareholders from receiving a premium on their investment.
Our by-laws and charter provide for a classified board of directors with staggered terms and authorizes the board of directors to set the terms of preferred stock. In addition, our charter and Delaware law contain provisions that impose restrictions on business combinations with interested parties. Because of our by-laws, charter, and Delaware law, persons considering unsolicited tender offers or other unilateral takeover proposals may be more likely to negotiate with our board of directors rather than pursue non-negotiated takeover attempts. These provisions may make it more difficult for our shareholders to benefit from transactions opposed by an incumbent board of directors.
32
New technologies may cause our exploration and drilling methods to become obsolete, resulting in an adverse effect on our production.
Our industry is subject to rapid and significant advancements in technology, including the introduction of new products and services using new technologies. As competitors use or develop new technologies, we may be placed at a competitive disadvantage, and competitive pressures may force us to implement new technologies at a substantial cost. In addition, competitors may have greater financial, technical, and personnel resources that allow them to enjoy technological advantages and may allow them to implement new technologies before we can. We cannot be certain that we can implement technologies timely or at a cost acceptable to us. One or more technologies that we use or that we may implement may become obsolete or may not work as we expected and we may be hurt.
We may be affected by climate change and market or regulatory responses to climate change.
Climate change, including the impact of potential global warming regulations, could have a material adverse effect on our results of operations, financial condition, and liquidity. Restrictions, caps, taxes, or other controls on emissions of greenhouse gasses, including diesel exhaust, could significantly increase our operating costs. Restrictions on emissions could also affect our customers that (a) use commodities we carry to produce energy, (b) use significant energy in producing or delivering the commodities we carry, or (c) manufacture or produce goods that consume significant energy or burn fossil fuels, including chemical producers, farmers and food producers, and automakers and other manufacturers. Significant cost increases, government regulation, or changes of consumer preferences for goods or services relating to alternative sources of energy or emissions reductions could materially affect the markets for the commodities associated with our business, which could have a material adverse effect on our results of operations, financial condition, and liquidity. Government incentives encouraging the use of alternative sources of energy could also affect certain of our customers and the markets for certain of the commodities associated with our business in an unpredictable manner that could alter our business activities. Finally, we could face increased costs related to defending and resolving legal claims and other litigation related to climate change and the alleged impact of our operations on climate change. These factors, individually or in operation with one or more of the other factors, or other unforeseen impacts of climate change could reduce the business activity we conduct and have a material adverse effect on our results of operations, financial condition, and liquidity.
The results of our operations depend on our ability to transport oil, NGLs, and gas production to key markets.
The marketability of our oil, NGLs, and natural gas production depends in part on the availability, proximity, and capacity of pipeline systems, refineries, and other transportation sources. The unavailability of or lack of capacity on these systems and facilities could cause the shut-in of producing wells or the delay or discontinuance of development plans for properties. Federal and state regulation of oil, NGLs, and natural gas production and transportation, tax and energy policies, changes in supply and demand, pipeline pressures, damage to or destruction of pipelines, and general economic conditions could hurt our ability to produce, gather and, transport oil, NGLs, and natural gas.
Losing one or several of our larger customers could have a material adverse effect on our financial condition and results of operations.
During
2017
, sales to Sunoco Logistics accounted for
10%
of our oil and natural gas revenues. QEP Resources, Inc. was our largest drilling customer accounting for approximately
26%
of our total contract drilling revenues. And for our mid-stream segment,
ONEOK, Inc.
accounted for approximately
36%
of our revenues. No other third party customer accounted for 10% or more of any of our individual segment revenues. Any of our customers may choose not to use our services and losing several our larger customers could have a material adverse effect on our financial condition and results of operations if we could not find replacements.
Shortage of completion equipment and services could delay or otherwise hurt our oil and natural gas segment's operations.
As there is an increase in horizontal drilling activity in certain areas, shortages could cause the availability of third party equipment and services required for completing wells drilled by our oil and natural gas segment. We could experience delays in completing some of our wells. Although we can try to reduce the delays associated with these services, we anticipate these services will be in high demand for the immediate future and could delay, restrict, or curtail part of our exploration and development operations, which could in turn harm our results.
33
Our mid-stream segment depends on certain natural gas producers and pipeline operators for a significant portion of its supply of natural gas and NGLs. Losing any of these producers could cause a decline in our volumes and revenues.
We rely on certain natural gas producers for a significant portion of our natural gas and NGLs supply. While some of these producers are subject to long-term contracts, we may not negotiate extensions or replacements of these contracts on favorable terms, if at all. Losing all or even a portion of the natural gas volumes supplied by these producers, because of competition or otherwise, could have a material adverse effect on our mid-stream segment unless we acquired comparable volumes from other sources.
The counterparties to our commodity derivative contracts may not perform their obligations to us, which could materially affect our cash flows and results of operations.
To reduce our exposure to adverse fluctuations in the prices of oil and natural gas, we currently, and may in the future, enter into commodity derivative contracts for a significant portion of our forecasted oil, NGLs, and natural gas production. The extent of our commodity price exposure is related largely to the effectiveness and scope of our derivative activities, and to the ability of counterparties under our commodity derivative contracts to satisfy their obligations to us. If one or more of our counterparties is unable or unwilling to pay us under our commodity derivative contracts, it could have a material adverse effect on our financial condition and results of operations.
Reliance on management.
We depend greatly on the efforts of our executive officers and other key employees to manage our operations. The loss or unavailability of any of our executive officers or other key employees could have a material adverse effect on our business.
We are subject to various claims and litigation that could ultimately be resolved against us requiring material future cash payments and/or future material charges against our operating income and materially impairing our financial position.
The nature of our business makes us highly susceptible to claims and litigation. We are subject to various existing legal claims and lawsuits, which could have a material adverse effect on our consolidated financial position, results of operations, or cash flows. Any claims or litigation, even if fully indemnified or insured, could negatively affect our reputation among our customers and the public, and make it more difficult for us to compete effectively or obtain adequate insurance in the future.
Derivative regulations in current financial reform legislation could impede our ability to manage business and financial risks by restricting our use of derivative instruments as hedges against fluctuating commodity prices and interest rates.
In July 2010, the Dodd-Frank Wall Street Reform and Consumer Protection Act (the Act) was passed by Congress and signed into law. The Act contains significant derivative regulations, requiring that certain transactions be cleared on exchanges and a requirement to post cash collateral (commonly called margin) for such transactions. The Act provides for a potential exception from these clearing and cash collateral requirements for commercial end-users and it includes several defined terms used in determining how this exception applies to particular derivative transactions and the parties to those transactions.
We use crude oil and natural gas derivative instruments regarding a portion of our expected production to reduce commodity price uncertainty and enhance the predictability of cash flows relating the marketing our crude oil and natural gas. As commodity prices increase, our derivative liability positions increase; however, none of our current derivative contracts require posting margin or similar cash collateral when there are changes in the underlying commodity prices referred to in these contracts.
Depending on the rules and definitions adopted by the CFTC, we could have to post collateral with our dealer counterparties for our commodities derivative transactions. Such a requirement could have a significant impact on our business by reducing our ability to execute derivative transactions to reduce commodity price uncertainty and to protect cash flows. Requirements to post collateral would cause significant liquidity issues by reducing our ability to use cash for investment or other corporate purposes, or would require us to increase our level of debt. In addition, a requirement for our counterparties to post collateral would likely cause additional costs being passed on to us, thereby decreasing the effectiveness of our derivative contracts and our profitability.
34
Proposed federal and state legislative and regulatory initiatives relating to hydraulic fracturing could cause increased costs and additional operating restrictions or delays.
Hydraulic-fracturing is an essential and common practice in the oil and gas industry used to stimulate production of oil, natural gas, and associated liquids from dense subsurface rock formations. Our oil and natural gas segment routinely apply hydraulic-fracturing techniques to many of our oil and natural gas properties, including our unconventional resource plays in the Granite Wash of Texas and Oklahoma, the Marmaton and Hoxbar of Oklahoma, the Wilcox of Texas, and the Mississippian of Kansas. Hydraulic-fracturing involves using water, sand, and certain chemicals to fracture the hydrocarbon-bearing rock formation to allow the flow of hydrocarbons into the wellbore. The process is typically regulated by state oil and natural gas commissions; however, the EPA has asserted federal regulatory authority over certain hydraulic-fracturing activities involving diesel under the Safe Drinking Water Act and published permitting guidance addressing the performance of such activities using diesel. The EPA is also seeking to require companies to disclose information regarding the chemicals used in hydraulic fracturing and the bureau of Land Management has imposed requirements for hydraulic fracturing activities of federal lands. In addition, Congress has occasionally considered legislation to provide for federal regulation of hydraulic-fracturing and to require disclosure of the chemicals used in the hydraulic-fracturing process.
Certain states in which we operate, including Texas, Oklahoma, Kansas, Colorado, and Wyoming, have adopted, and other states are considering adopting, regulations that could impose more stringent permitting, public disclosure of fracking fluids, waste disposal, and well construction requirements on hydraulic-fracturing operations or otherwise seek to ban fracturing activities altogether. For example, Texas adopted a law in June 2011 requiring disclosure to the Railroad Commission of Texas (RCT) and the public of certain information regarding the components used in the hydraulic-fracturing process. Besides state laws, local land use restrictions, such as city ordinances, may restrict or prohibit the performance of well drilling and/or hydraulic fracturing. If state, local, or municipal legal restrictions are adopted in areas where we are conducting, or plan to conduct operations, we may incur additional costs to comply with such requirements that may be significant, experience delays or curtailment pursuing exploration, development, or production activities, and perhaps even be precluded from the drilling and/or completion of wells.
There are certain governmental reviews either underway or being proposed that focus on environmental aspects of hydraulic-fracturing practices. The White House Council on Environmental Quality is coordinating a review of hydraulic-fracturing practices, and a committee of the United States House of Representatives investigated hydraulic-fracturing practices. Furthermore, several federal agencies are analyzing, or have been requested to review, many environmental issues associated with hydraulic fracturing. The EPA is evaluating the potential environmental effects of hydraulic fracturing on drinking water and groundwater. In addition, the U.S. Department of Energy has investigated practices the agency could recommend to better protect the environment from drilling using hydraulic-fracturing completion methods.
And certain members of the Congress have called on the U.S. Government Accountability Office to investigate how hydraulic fracturing might hurt water resources, the U.S. Securities and Exchange Commission to investigate the natural gas industry and any possible misleading of investors or the public regarding the economic feasibility of pursuing natural gas deposits in shales by means of hydraulic fracturing, and the U.S. Energy Information Administration to provide a better understanding of that agency’s estimates regarding natural gas reserves, including reserves from shale formations, and uncertainties associated with those estimates. These ongoing or proposed studies, depending on their course and results obtained, could spur initiatives to further regulate hydraulic fracturing under the Safe Drinking Water Act or other regulatory processes.
Increased regulation and attention given to the hydraulic fracturing process could lead to greater opposition, including litigation, to oil and gas production activities using hydraulic fracturing techniques. Additional legislation or regulation could also lead to operational delays or increased operating costs in the production of oil, natural gas, and associated liquids including from developing shale plays, or could make it more difficult to perform hydraulic fracturing. The adoption of additional federal, state or local laws or implementing regulations regarding hydraulic fracturing could cause a decrease in completing of new oil and gas wells, increased compliance costs and time, which could hurt our financial position, results of operations, and cash flows.
Our ability to produce crude oil, natural gas, and associated liquids economically and in commercial quantities could be impaired if we cannot acquire adequate supplies of water for our drilling operations and/or completions or cannot dispose of or recycle the water we use at a reasonable cost and under applicable environmental rules.
To our knowledge, there have been no citations, suits, or contamination of potable drinking water arising from our fracturing operations. We do not have insurance policies in effect intended to provide coverage for losses solely related to
35
hydraulic fracturing operations; however, our general liability and excess liability insurance policies might cover third-party claims related to hydraulic fracturing operations and associated legal expenses depending on the specific nature of the claims, the timing of the claims, and the specific terms of such policies.
Uncertainty regarding increased seismic activity in Oklahoma and Kansas.
We conduct oil and natural gas exploration, development and drilling activities in Oklahoma, Kansas, and elsewhere. In recent years, Oklahoma and Kansas has experienced a significant increase in earthquakes and other seismic activity. Some parties believe there is a correlation between certain oil and gas activities and the increased occurrence of earthquakes. The extent of this correlation is the subject of studies by both state and federal agencies the results of which remain uncertain. We cannot state at this time what if any impact this seismic activity may have on us or our industry.
The hydraulic fracturing process on which we depend to produce commercial quantities of crude oil, natural gas, and associated NGLs from many reservoirs requires the use and disposal of significant quantities of water.
Our inability to secure sufficient amounts of water, or to dispose of or recycle the water used in our oil and natural gas segment operations, could adversely affect our operations. The imposition of new environmental initiatives and regulations could include restrictions on our ability to conduct certain operations such as hydraulic fracturing or disposal of wastes, including, but not limited to, produced water, drilling fluids, and other wastes associated with the exploration, development or production of oil and natural gas.
Compliance with environmental regulations and permit requirements governing the withdrawal, storage and, use of surface water or groundwater necessary for hydraulic fracturing of wells may increase our operating costs and cause delays, interruptions, or termination of our operations, the extent of which cannot be predicted, all of which could have an adverse effect on our operations and financial condition.
We may decide not to drill some prospects we have identified, and locations we drill may not yield oil, NGLs, and natural gas in commercially viable quantities.
Our oil and natural gas segment's prospective drilling locations are in various stages of evaluation, ranging from a prospect ready to drill to a prospect that will require additional geological and engineering analysis. Based on many factors, including future oil, NGLs, natural gas prices, the generation of additional seismic or geological information, and other factors, we may decide not to drill one or more of these prospects. As a result, we may not increase or maintain our reserves or production, which in turn could have an adverse effect on our business, financial position, and results of operations. In addition, the SEC's reserve reporting rules require that, subject to limited exceptions, proved undeveloped reserves may only be booked if they relate to wells scheduled to be drilled within five years of booking. At
December 31, 2017
, we had
99
proved undeveloped drilling locations. If we do not drill these locations within five years of initial booking, they may not continue to qualify for classification as proved reserves, and we may have to reclassify such reserves as unproved reserves. The reclassification of those reserves could also have a negative effect on the borrowing base under our credit facility.
The cost of drilling, completing, and operating a well is often uncertain, and cost factors can hurt the economics of a well. Our efforts will be uneconomic if we drill dry holes or wells that are productive but do not produce enough oil, NGLs, and natural gas to be commercially viable after drilling, operating, and other costs.
The borrowing base under our credit agreement is determined semi-annually at the discretion of the lenders and is based in a large part on the prices for oil, NGLs, and natural gas.
Significant declines in oil, NGLs, and natural gas prices may cause a decrease in our borrowing base. The lenders can unilaterally adjust the borrowing base and therefore the borrowings permitted to be outstanding under our credit agreement. If outstanding borrowings are over the borrowing base, we must (a) repay the amount in excess of the borrowing base, (b) dedicate additional properties to the borrowing base, or (c) begin monthly principal payments under our credit agreement.
Potential listing of species as “endangered” under the federal Endangered Species Act could cause increased costs and new operating restrictions or delays on our operations and that of our customers, which could hurt our operations and financial results.
The federal Endangered Species Act, referred to as the “ESA,” and analogous state laws regulate a variety of activities, including oil and gas development, which could have an adverse effect on species listed as threatened or endangered under the
36
ESA or their habitats. The designation of previously unidentified endangered or threatened species could cause oil and natural gas exploration and production operators and service companies to incur additional costs or become subject to operating delays, restrictions or bans in affected areas, which impacts could adversely reduce the amount of drilling activities in affected areas. All three of our business segments could be subject to the effect of one or more species being listed as threatened or endangered within the areas of our operations. Numerous species have been listed or proposed for protected status in areas in which we provide or could in the future undertake operations. The U.S. Fish and Wildlife Service and the National Marine Fisheries in 2016 issued final revised definitions relating to impacts on critical habitats for potentially endangered species allowing exclusion of certain areas so long as they will not result in the extinction of the species. In 2017, the Western Governor’s Association issued a Policy Resolution calling on Congress to amend and reauthorize the ESA based upon seven broad goals to make the act more workable and understandable. In December 2017, the Interior Department announced that it is working on possible changes to the ESA with the U.S. Fish and Wildlife Service to revise the regulations for listing endangered and threatened species and for designation of critical habitat. The presence of protected species in areas where we provide contract drilling or mid-stream services or conduct exploration and production operations could impair our ability to timely complete or carry out those services and, consequently, adversely affect our results of operations and financial position.
Constructing our new proprietary BOSS drilling rigs is subject to risks, including delays and cost overruns, and may not meet our expectations.
We have designed and built several new proprietary 1,500 horsepower AC electric drilling rigs, which we call BOSS drilling rigs. This new design should position us to better meet the demands of our customers. Constructing any future new BOSS drilling rigs is subject to the risks of delays or cost overruns inherent in any large construction project because of numerous possible factors, including:
|
•
|
shortages of equipment, materials or skilled labor;
|
|
•
|
work stoppages and labor disputes;
|
|
•
|
unscheduled delays in the delivery of ordered materials and equipment;
|
|
•
|
unanticipated increases in the cost of equipment, labor and raw materials used in construction of our drilling rigs, particularly steel;
|
|
•
|
weather interferences;
|
|
•
|
difficulties in obtaining necessary permits or in meeting permit conditions;
|
|
•
|
unforeseen design and engineering problems;
|
|
•
|
failure or delay in obtaining acceptance of the drilling rig from our customer;
|
|
•
|
failure or delay of third party equipment vendors or service providers; and
|
|
•
|
lack of demand from the downturn in the oil and gas industry.
|
On our new BOSS drilling rigs, there can be no assurance we will:
|
•
|
obtain additional new-build contract opportunities; or
|
|
•
|
improve our financial condition, results of operations or prospects because of the new drilling rigs.
|
While we hold certain patents regarding our BOSS drilling rig design, it is still possible that third parties may claim we infringe their intellectual property rights. We may receive notices from others claiming that our BOSS drilling rig design infringes on their intellectual property rights. In that event we may resolve these claims by signing royalty and licensing agreements, redesigning the drilling rig, or paying damages. These outcomes may cause operating margins to decline. Besides money damages, in some jurisdictions plaintiffs can seek injunctive relief that may limit or prevent marketing and use of our drilling rigs that have infringing technologies.
Terrorist attacks or cyber-attacks could have a material adverse effect on our business, financial condition or results of operations.
Terrorist attacks or cyber-attacks may significantly affect the energy industry, and economic conditions, including our operations and our customers, as well as general economic conditions, consumer confidence and spending and market liquidity. Strategic targets, such as energy-related assets, may be at greater risk of future attacks than other targets in the United States. A
37
cyber incident could result in information theft, data corruption, operational disruption and/or financial loss. Our insurance may not protect us against such occurrences. Consequently, it is possible that any of these occurrences, or a combination of them, could have a material adverse effect on our business, financial condition and results of operations.
The oil and natural gas industry has become increasingly dependent upon digital technologies, including information systems, infrastructure and cloud applications and services, to operate our businesses, process and record financial and operating data, communicate with our employees and business partners, analyze seismic and drilling information, estimate quantities of natural gas reserves, and perform other activities related to our businesses. Our business partners, including vendors, service providers, and financial institutions, are also dependent on digital technology.
As dependence on digital technologies has increased, cyber incidents, including deliberate attacks or unintentional events, have also increased. A cyber-attack could include gaining unauthorized access to digital systems for purposes of misappropriating assets or sensitive information, corrupting data, or causing operational disruption, or result in denial-of-service on websites.
Our technologies, systems, networks, and those of our business partners may become the target of cyber-attacks or information security breaches that could result in the unauthorized release, gathering, monitoring, misuse, loss or destruction of proprietary and other information, or other disruption of our business operations. In addition, certain cyber incidents, such as surveillance, may remain undetected for an extended period.
Deliberate attacks on our assets, or security breaches in our systems or infrastructure, the systems or infrastructure of third-parties or the cloud could lead to corruption or loss of our proprietary data and potentially sensitive data, delays in production or delivery, difficulty in completing and settling transactions, challenges in maintaining our books and records, environmental damage, communication interruptions, other operational disruptions and third-party liability, including the following:
|
•
|
a cyber-attack on a vendor or service provider could result in supply chain disruptions which could delay or halt development of additional infrastructure, effectively delaying the start of cash flows from the project;
|
|
•
|
a cyber-attack on our facilities may result in equipment damage or failure;
|
|
•
|
a cyber-attack on mid-stream or downstream pipelines could prevent our product from being delivered, resulting in a loss of revenues;
|
|
•
|
a cyber-attack on a communications network or power grid could cause operational disruption resulting in loss of revenues;
|
|
•
|
deliberate corruption of our financial or operational data could result in events of non-compliance which could lead to regulatory fines or penalties; and
|
|
•
|
business interruptions could result in expensive remediation efforts, distraction of management, damage to our reputation, or a negative impact on the price of our units.
|
Implementation of various controls and processes to monitor and mitigate security threats and to increase security for our information, facilities and infrastructure is costly and labor intensive. Moreover, there can be no assurance that such measures will be sufficient to prevent security breaches from occurring. As cyber threats continue to evolve, we may be required to expend significant additional resources to continue to modify or enhance our protective measures or to investigate and remediate any information security vulnerabilities. We are not aware that any such breaches have occurred.
We are the subject of putative class action lawsuits that may result in substantial expenditures and divert management's attention.
We are the subject of putative class action lawsuits in Oklahoma with respect to the alleged failure to pay interest with on untimely royalty payments and with respect to the alleged underpayment of royalties. These lawsuits seek various remedies, including damages, injunctive relief, and attorney’s fees. For additional information on these lawsuits, see Item 3 Legal Proceedings in this Annual Report on Form 10-K.
Although we believe that the allegations in these lawsuits are without merit and intend to defend such litigation vigorously, litigation is subject to inherent uncertainties, and an adverse result in one of these lawsuits or other matters that may arise from time to time could have a material adverse effect on our business, results of operations and financial condition.
38
Defending the lawsuits may be costly and, further, could require significant involvement of our senior management and may divert management's attention from our business and operations.
None.
The information called for by this item was consolidated with and disclosed in connection with Item 1 above.
Panola Independent School District No. 4, et al
.
v. Unit Petroleum Company
, No. CJ-07-215, District Court of Latimer County, Oklahoma.
Panola Independent School District No. 4, Michael Kilpatrick, Gwen Grego, Carla Lessel, Thelma Christine Pate, Juanita Golightly, Melody Culberson, and Charlotte Abernathy are the Plaintiffs and are royalty owners in oil and gas drilling and spacing units for which the company’s exploration segment distributes royalty. The Plaintiffs’ central allegation is that the company’s exploration segment has underpaid royalty obligations by deducting post-production costs or marketing related fees. Plaintiffs sought to pursue the case as a class action on behalf of persons who receive royalty from us for our Oklahoma production. We have asserted several defenses including that the deductions are permitted under Oklahoma law. We have also asserted that the case should not be tried as a class action due to the materially different circumstances that determine what, if any, deductions are taken for each lease. On December 16, 2009, the trial court entered its order certifying the class. On May 11, 2012 the court of civil appeals reversed the trial court’s order certifying the class. The Plaintiffs petitioned the Supreme Court for certiorari and on October 8, 2012, the Plaintiff’s petition was denied. On January 22, 2013, the Plaintiffs filed a second request to certify a class of royalty owners slightly smaller than their first attempt. Since then, the Plaintiffs have further amended their proposed class to just include royalty owners entitled to royalties under certain leases in Latimer, Le Flore, and Pittsburg Counties, Oklahoma. In July 2014, a second class certification hearing was held where, besides the defenses described above, we argued that the amended class definition is still deficient under the court of civil appeals opinion reversing the initial class certification. Closing arguments were held on December 2, 2014. There is no timetable for when the court will issue its ruling. The merits of Plaintiffs’ claims will remain stayed while class certification issues are pending.
Cockerell Oil Properties, Ltd., v. Unit Petroleum Company
, No. 16-cv-135-JHP, United States District Court for the Eastern District of Oklahoma.
On March 11, 2016, a putative class action lawsuit was filed against Unit Petroleum Company styled
Cockerell Oil Properties, Ltd., v. Unit Petroleum Company
in LeFlore County, Oklahoma. We removed the case to federal court in the Eastern District of Oklahoma. The plaintiff alleges that Unit Petroleum wrongfully failed to pay interest with respect to untimely royalty payments under Oklahoma’s Production Revenue Standards Act. The lawsuit seeks actual and punitive damages, an accounting, disgorgement, injunctive relief, and attorney’s fees. Plaintiff is seeking relief on behalf of royalty owners in our Oklahoma wells. We have asserted several defenses including that the case cannot be properly certified as a class action because of the wide variety of circumstances that determine whether a royalty payment was timely made or has accrued interest under Oklahoma law. At this point, the court has not taken any action on the issue of class certification.
Chieftain Royalty Company v. Unit Petroleum Company
, No. CJ-16-230, District Court of LeFlore County, Oklahoma.
On November 3, 2016, a putative class action lawsuit was filed against Unit Petroleum Company styled
Chieftain Royalty Company v. Unit Petroleum Company
in LeFlore County, Oklahoma. Plaintiff alleges that Unit Petroleum breached its duty to pay royalties on natural gas used for fuel off the lease premises. The lawsuit seeks actual and punitive damages, an accounting, injunctive relief, and attorney’s fees. Plaintiff is seeking relief on behalf of Oklahoma citizens who are or were royalty owners in our Oklahoma wells. We filed a motion to dismiss on the basis that the claims asserted by the Plaintiff and the putative class are barred because they have already been asserted by the putative class in the Panola lawsuit and are subject to its reversal of class certification. The court denied our motion to dismiss and we have asked the court to certify its order so that it can be immediately appealed. That issue is still pending before the court. If we do not ultimately prevail on our claim of issue preclusion, we have several other defenses, including that the case cannot be properly certified as a class action because of the wide variety of circumstances that determine whether a royalty payment was wrongfully withheld. At this point, the issue of class certification has not been set before the court.
39
We continue to vigorously defend against each of the pending claims. At this time we are unable to express an opinion with respect to the likelihood of an unfavorable outcome or provide an estimate of potential losses, if any.
Not applicable.
Our common stock trades on the New York Stock Exchange under the symbol “UNT.” This table identifies the high and low closing sales prices per share of our common stock for the periods indicated:
|
|
2017
|
2016
|
|||||||||||||
|
Quarter
|
High
|
Low
|
High
|
Low
|
|||||||||||
|
First
|
$
|
30.25
|
|
$
|
20.73
|
|
$
|
12.51
|
|
$
|
4.41
|
|
|||
|
Second
|
$
|
24.26
|
|
$
|
16.47
|
|
$
|
17.81
|
|
$
|
8.44
|
|
|||
|
Third
|
$
|
21.55
|
|
$
|
15.42
|
|
$
|
18.82
|
|
$
|
11.29
|
|
|||
|
Fourth
|
$
|
22.83
|
|
$
|
17.20
|
|
$
|
28.11
|
|
$
|
16.44
|
|
|||
On
February 13, 2018
, the closing sale price of our common stock, as reported by the NYSE, was
$20.16
per share. On that date, there were approximately
793
holders of record of our common stock.
We have declared no cash dividends on our common stock. Any future determination by our board of directors to pay dividends on our common stock will be made only after considering our financial condition, results of operations, capital requirements, and other relevant factors. Our bank credit agreement and the Notes prohibit the payment of cash dividends on our common stock under certain circumstances. For further information regarding our bank credit agreement and the Notes agreement’s impact on our ability to pay dividends see “Our Credit Agreement and Senior Subordinated Notes” under Item 7 of this report.
40
Performance Graph.
The following graph and related information shall not be deemed “soliciting material” or be deemed to be “filed” with the SEC, nor will this information be incorporated by reference into any future filing, except to the extent that we specifically incorporate it by reference into that filing.
Set forth below is a line graph comparing our cumulative total shareholder return on our common stock with the cumulative total return of the S&P 500 Stock Index, S&P 600 Oil and Gas Exploration & Production and our peer group which includes Helmerich & Payne, Inc., Patterson – UTI Energy Inc., and Pioneer Energy Services Corp. The graph below assumes an investment of $100 at the beginning of the period. The shareholder return set forth below is not necessarily indicative of future performance.
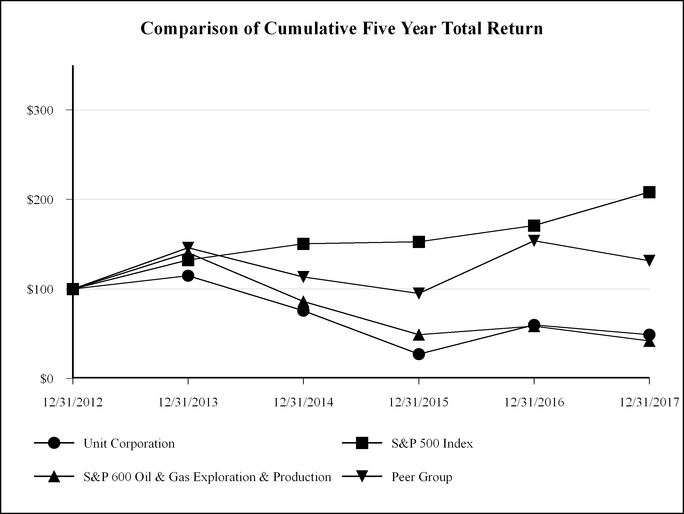
41
The following table shows selected consolidated financial data. The data should be read in conjunction with Item 7 “Management’s Discussion and Analysis of Financial Condition and Results of Operations,” for a review of
2017
,
2016
, and
2015
activity.
|
|
As of and for the Year Ended December 31,
|
|||||||||||||||||||
|
|
2017
|
2016
|
2015
|
2014
|
|
2013
|
||||||||||||||
|
|
(In thousands except per share amounts)
|
|||||||||||||||||||
|
Revenues
|
$
|
739,640
|
|
$
|
602,177
|
|
$
|
854,231
|
|
|
$
|
1,572,944
|
|
|
$
|
1,351,850
|
|
|||
|
Net income (loss)
|
$
|
117,848
|
|
$
|
(135,624
|
)
|
(3)
|
$
|
(1,037,361
|
)
|
(2)
|
$
|
136,276
|
|
(1)
|
$
|
184,746
|
|
||
|
Net income (loss) per common share:
|
||||||||||||||||||||
|
Basic
|
$
|
2.31
|
|
$
|
(2.71
|
)
|
$
|
(21.12
|
)
|
$
|
2.80
|
|
$
|
3.83
|
|
|||||
|
Diluted
|
$
|
2.28
|
|
$
|
(2.71
|
)
|
$
|
(21.12
|
)
|
$
|
2.78
|
|
$
|
3.80
|
|
|||||
|
Total assets
|
$
|
2,581,452
|
|
$
|
2,479,303
|
|
(3)
|
$
|
2,799,842
|
|
(2)
|
$
|
4,463,473
|
|
(1)
|
$
|
4,010,546
|
|
||
|
Long-term debt
(4)
|
$
|
820,276
|
|
$
|
800,917
|
|
$
|
918,995
|
|
|
$
|
801,908
|
|
|
$
|
633,852
|
|
|||
|
Other long-term liabilities
(5)
|
$
|
100,203
|
|
$
|
103,479
|
|
$
|
140,626
|
|
|
$
|
148,785
|
|
|
$
|
158,331
|
|
|||
|
Cash dividends per common share
|
$
|
—
|
|
$
|
—
|
|
$
|
—
|
|
|
$
|
—
|
|
|
$
|
—
|
|
|||
_________________________
|
(1)
|
In December 2014, we incurred a non-cash ceiling test write-down of our oil and natural gas properties of
$76.7 million
pre-tax (
$47.7 million
, net of tax), a non-cash write-down associated with the removal of 31 drilling rigs from our fleet along with certain other equipment and drill pipe of pre-tax
$74.3 million
pre-tax ($46.3 million, net of tax), and a non-cash write-down associated with a reduction in the carrying value of three mid-stream segment systems of
$7.1 million
pre-tax ($4.4 million, net of tax).
|
|
(2)
|
In total for 2015, we incurred non-cash ceiling test write-downs on our oil and natural gas properties of
$1.6 billion
pre-tax (
$1.0 billion
, net of tax). We also incurred a non-cash write-down on certain drilling rigs and other equipment of approximately $8.3 million pre-tax ($5.1 million, net of tax), and a non-cash write-down associated with a reduction in the carrying value of three mid-stream segment systems of $27.0 million pre-tax ($16.8 million, net of tax).
|
|
(3)
|
For the first three quarters of 2016, we incurred non-cash ceiling test write-downs on our oil and natural gas properties of
$161.6 million
pre-tax (
$100.6 million
, net of tax).
|
|
(4)
|
Long-term debt is net of unamortized discount and debt issuance costs.
|
|
(5)
|
Includes non-current derivative liabilities, if any.
|
42
Please read this discussion of our financial condition and results of operations with the consolidated financial statements and related notes in Item 8 of this report.
General
We operate, manage, and analyze our results of operations through our three principal business segments:
|
•
|
Oil and Natural Gas
– carried out by our subsidiary Unit Petroleum Company. This segment explores, develops, acquires, and produces oil and natural gas properties for our own account.
|
|
•
|
Contract Drilling
– carried out by our subsidiary Unit Drilling Company. This segment contracts to drill onshore oil and natural gas wells for others and for our own account.
|
|
•
|
Mid-Stream
– carried out by our subsidiary Superior Pipeline Company, L.L.C. and its subsidiaries. This segment buys, sells, gathers, processes, and treats natural gas for third parties and for our own account.
|
Business Outlook
As discussed in other parts of this report, our success depends, to a large degree, on the prices we receive for our oil and natural gas production, the demand for oil, natural gas, and NGLs, and the demand for our drilling rigs which influences the amounts we can charge for those drilling rigs. While our operations are within the United States, events outside the United States affect us and our industry.
Deteriorating commodity prices worldwide during the past several years brought about significant and adverse changes to our industry and us. As a result we reduced or stopped, for a time, our oil and natural gas segment's drilling activity. Industry wide reductions in drilling activity and spending for extended periods also reduces the rates for and the number of our drilling rigs we can work. In addition, sustained lower commodity prices impact the liquidity condition of some of our industry partners and customers, which could limit their ability to meet their financial obligations to us.
During 2016, commodity prices improved. In the fourth quarter of 2016, our oil and natural gas segment began using two of our drilling rigs and has been using two to three drilling rigs throughout 2017. Our contract drilling segment completed the construction and contracted the ninth and tenth BOSS drilling rigs in the fourth quarter of 2016 and the second quarter of 2017, respectively. Our drilling rig segment's rig utilization increased from 16 drilling rigs working as of June 30, 2016, to 31 drilling rigs working as of December 31, 2017. The extent and duration of this improvement remains uncertain.
The reduction in oil, NGLs, and natural gas prices had several consequences for us (although, as noted, we are seeing improvements). Below are some of those consequences:
|
•
|
We incurred non-cash ceiling test write-downs in the first nine months of 2016 of $161.6 million ($100.6 million net of tax). We had no write-downs during 2017. It is hard to predict with any reasonable certainty the need for or amount of any future impairments given the many factors that go into the ceiling test calculation including, future pricing, operating costs, drilling and completion costs, upward or downward oil and gas reserve revisions, oil and gas reserve additions, and tax attributes. Subject to these inherent uncertainties, if we hold these same factors constant as they existed at December 31, 2017, and only adjust the 12-month average price to an estimated first quarter ending average (holding February 2018 prices constant for the remaining one month of the first quarter of 2018), our forward looking expectation is that we will not recognize an impairment in the first quarter of 2018. But commodity prices (and other factors) remain volatile and they could negatively affect the 12-month average price resulting in the potential for a future impairment.
|
|
•
|
The number of gross wells our oil and gas segment drilled in 2017 verses 2016 increased from 21 wells to 70 wells due to increased cash flow. For 2018, we plan to increase the number of gross wells drilled to 75-85 wells (depending on future commodity prices).
|
|
•
|
The decline in drilling by our customers reduced the average use of our drilling rig fleet. At December 31, 2015, we had 26 drilling rigs operating. In 2016, utilization continued downward bottoming out in May at 13 operating drilling rigs. After May commodity prices improved for the remainder of the year and we exited 2016 with 21 active rigs. As of December 31, 2017, we had 31 drilling rigs operating. Operators have been increasing drilling, but the extent of further increases remains uncertain. As of December 31 2017, all ten of our BOSS drilling rigs were under contract.
|
43
|
•
|
Due to low ethane price, we continue to operate some of our mid-stream processing facilities in ethane rejection mode which reduces the liquids sold. If ethane price relative to natural gas price remains depressed, we expect to continue operating in ethane rejection mode at some of our processing facilities.
|
Also, as noted elsewhere, beginning on April 4, 2017, we began an at-the-market offering for the sale of shares of our common stock. The offering allows us to sell shares, from time to time, up to an aggregate of $100.0 million in gross proceeds. As of December 31, 2017, we sold 787,547 shares for $18.6 million, net of offering costs of $0.4 million. Approximately $81.0 million remain available for sale under the program. Net proceeds from the offering will fund (or offset costs of) acquisitions, future capital expenditures, repay amounts outstanding under our revolving credit facility, and general corporate purposes.
On April 3, 2017, we closed an acquisition of certain oil and natural gas assets from an unrelated third party. The acquisition included approximately 47 proved developed producing wells and 8,300 net acres primarily in Grady and Caddo Counties in western Oklahoma. The final adjusted value of consideration given was $54.3 million. The effective date of this acquisition was January 1, 2017.
Executive Summary
Oil and Natural Gas
Fourth quarter
2017
production from our oil and natural gas segment was
4,310
MBoe, an
increase
of
6%
over
the third quarter of
2017
and an
increase
of
2%
over
the fourth quarter of
2016
. The increases mostly came from acquired wells and new wells drilled in 2017. Oil and NGLs production during the fourth quarter of
2017
was
46%
of our total production compared to
47%
of our total production during the fourth quarter of
2016
.
Fourth quarter
2017
oil and natural gas revenues
increase
d
19%
over
the third quarter of
2017
and
increase
d
15%
over
the fourth quarter of
2016
. These increases were primarily due to higher oil and NGLs prices and higher oil and natural gas production volumes.
Our NGLs, oil, and natural gas prices for the fourth quarter of
2017
increase
d
19%
,
15%
, and
1%
, respectively, compared to the third quarter of
2017
. Our NGLs and oil prices
increase
d
50%
and
18%
, respectively, compared to the fourth quarter of
2016
, while our natural gas prices were essentially unchanged.
Direct profit (oil and natural gas revenues less oil and natural gas operating expense)
increase
d
29%
over
the third quarter of
2017
and
10%
over
the fourth quarter of
2016
. The
increase
s were primarily due to higher revenues due to rising commodity prices and production volumes.
Operating cost per Boe produced for the fourth quarter of
2017
decrease
d
3%
from
the third quarter of
2017
and
increase
d
24%
over
the fourth quarter of
2016
. The decrease from the third quarter of 2017 was primarily due to higher production volumes. The increase over the fourth quarter of 2016 was primarily due to higher lease operating expenses (LOE), gross production taxes, general and administrative expenses offset partially by higher production.
44
At
December 31, 2017
, these non-designated hedges were outstanding:
|
Term
|
Commodity
|
Contracted Volume
|
Weighted Average
Fixed Price for Swaps
|
Contracted Market
|
||||
|
Jan’18 – Dec’18
|
Natural gas – swap
|
20,000 MMBtu/day
|
$3.013
|
IF – NYMEX (HH)
|
||||
|
Apr'18 – Oct'18
|
Natural gas – swap
|
10,000 MMBtu/day
|
$2.990
|
IF – NYMEX (HH)
|
||||
|
Jan’18 – Mar'18
|
Natural gas – basis swap
|
10,000 MMBtu/day
|
$(0.208)
|
IF – NYMEX (HH)
|
||||
|
Nov’18 – Dec'18
|
Natural gas – basis swap
|
10,000 MMBtu/day
|
$(0.208)
|
IF – NYMEX (HH)
|
||||
|
Jan’18 – Mar'18
|
Natural gas – three-way collar
|
60,000 MMBtu/day
|
$3.29 - $2.63 - $4.07
|
IF – NYMEX (HH)
|
||||
|
Apr’18 – Dec'18
|
Natural gas – three-way collar
|
20,000 MMBtu/day
|
$3.00 - $2.50 - $3.51
|
IF – NYMEX (HH)
|
||||
|
Jan’18 – Dec'18
|
Crude oil – swap
|
3,000 Bbl/day
|
$51.36
|
WTI – NYMEX
|
||||
|
Jan’18 – Mar'18
|
Crude oil – collar
|
500 Bbl/day
|
$55.00 - $59.50
|
WTI – NYMEX
|
||||
|
Jan’18 – Dec'18
|
Crude oil – three-way collar
|
2,000 Bbl/day
|
$47.50 - $37.50 - $56.08
|
WTI – NYMEX
|
||||
|
Apr’18 – Sep'18
|
Liquids (Propane) – swap
|
1,000 Bbl/day
|
$31.16
|
MONT BELVIEU
|
||||
After
December 31, 2017
, these non-designated hedges were entered into:
|
Term
|
Commodity
|
Contracted Volume
|
Weighted Average
Fixed Price for Swaps |
Contracted Market
|
||||
|
Apr’18 – Sep'18
|
Natural gas – swap
|
10,000 MMBtu/day
|
$2.925
|
IF – NYMEX (HH)
|
||||
|
Apr’18 – Sep'18
|
Natural gas – collar
|
30,000 MMBtu/day
|
$2.67 - $2.97
|
IF – NYMEX (HH)
|
||||
|
Feb’18 – Dec'18
|
Natural gas – basis swap
|
10,000 MMBtu/day
|
$(0.678)
|
PEPL
|
||||
|
Feb’18 – Dec'18
|
Natural gas – basis swap
|
10,000 MMBtu/day
|
$(0.568)
|
NGPL MIDCON
|
||||
|
Apr’18 – Oct'18
|
Natural gas – basis swap
|
10,000 MMBtu/day
|
$(0.190)
|
NGPL TEXOK
|
||||
|
Jan'19 – Dec'19
|
Natural gas – basis swap
|
10,000 MMBtu/day
|
$(0.728)
|
PEPL
|
||||
|
Jan'19 – Dec'19
|
Natural gas – basis swap
|
10,000 MMBtu/day
|
$(0.625)
|
NGPL MIDCON
|
||||
|
Jan'19 – Dec'19
|
Natural gas – basis swap
|
20,000 MMBtu/day
|
$(0.273)
|
NGPL TEXOK
|
||||
|
Jan'20 – Dec'20
|
Natural gas – basis swap
|
20,000 MMBtu/day
|
$(0.280)
|
NGPL TEXOK
|
||||
|
Apr'18 – Dec'18
|
Crude oil – swap
|
1,000 Bbl/day
|
$60.00
|
WTI – NYMEX
|
||||
|
Apr’18 – Sep'18
|
Liquids – swap
|
500 Bbl/day
|
$34.10
|
MONT BELVIEU
|
||||
During
2017
, we participated in the drilling of
70
wells (
25.71
net wells). For
2018
, we plan to participate in the drilling of approximately
75
to
85
gross wells. Our
2018
production guidance is approximately
17.1
to
17.4
MMBoe, an
increase
of
7
-
9%
over
2017
, actual results will be subject to many factors. This segment’s capital budget for 2018 is approximately
$272.0 million
, a
26%
increase over
2017
, excluding acquisitions and ARO liability.
Contract Drilling
The average number of drilling rigs we operated in the fourth quarter was
31.2
compared to
34.6
and
19.5
in the third quarter of 2017 and fourth quarter of 2016, respectively. As of December 31, 2017, 31 of our drilling rigs were operating.
Revenue for the fourth quarter of
2017
decrease
d
10%
from
the third quarter of
2017
and
increase
d
40%
over
the fourth quarter of
2016
. The decrease from the third quarter of 2017 was primarily due to fewer drilling rigs operating offset slightly by higher dayrates. The increase over the fourth quarter of 2016 was primarily due to more drilling rigs operating partially offset by lower dayrates.
Dayrates for the fourth quarter of
2017
averaged
$16,645
, a
1%
increase
over
the third quarter of
2017
and a
1%
decrease
from
the fourth quarter of
2016
. The increase over the third quarter of 2017 was primarily due to a labor increase that was passed through to contracted rigs. The decrease from the fourth quarter of 2016 was primarily due to downward pressure on dayrates due to lower demand as higher rate contracts were expiring.
45
Operating costs for the fourth quarter of
2017
decrease
d
10%
from
the third quarter of
2017
and
increase
d
45%
over
the fourth quarter of
2016
. The decrease from the third quarter of 2017 was primarily due to fewer drilling rigs operating while the increase over the fourth quarter of 2016 was primarily due to more drilling rigs operating.
Direct profit (contract drilling revenue less contract drilling operating expense) for the fourth quarter of
2017
decrease
d
9%
from
the third quarter of
2017
and
increase
d
31%
over
the fourth quarter of
2016
. The decrease from the third quarter of 2017 was primarily due to fewer drilling rigs operating while the increase over the fourth quarter of 2016 was primarily due to more drilling rigs operating.
Operating cost per day for the fourth quarter of
2017
was essentially unchanged from the third quarter of
2017
and
decrease
d
9%
from
the fourth quarter of
2016
. The decrease from the fourth quarter of 2016 was primarily due to an increase in drilling rigs operating.
During 2017, almost all of our working drilling rigs were drilling horizontal or directional wells for oil and NGLs. The future demand for and the availability of drilling rigs to meet that demand will affect our future dayrates.
As of December 31,
2017
, we had
nine
term drilling contracts with original terms ranging from
six months
to
two years
.
Eight
of these contracts are up for renewal in
2018
, (
four
in the first quarter,
three
in the second quarter, and
one
in the fourth quarter) and
one
is up for renewal in
2019
. Term contracts may contain a fixed rate during the contract or provide for rate adjustments within a specific range from the existing rate. Some operators who had signed term contracts have opted to release the drilling rig and pay an early termination penalty for the remaining term of the contract. We recorded $0.8 million, $3.1 million, and $29.0 million in early termination fees in 2017, 2016, and 2015, respectively.
All ten of our existing BOSS drilling rigs are under contract.
Our anticipated
2018
capital expenditures for this segment are approximately
$47.0 million
, a
30%
increase
over
2017
.
Mid-Stream
Fourth quarter
2017
liquids sold per day
increase
d
10%
and
9%
over
the third quarter of
2017
and the fourth quarter of
2016
, respectively. The increases were due primarily to more processed volume due to connecting additional wells to our systems. For the fourth quarter of
2017
, gas processed per day
increase
d
6%
and
5%
over
the third quarter of
2017
and the fourth quarter of
2016
, respectively. The increases were due to connecting additional wells to our processing systems. For the fourth quarter of
2017
, gas gathered per day was essentially unchanged
from
the third quarter of
2017
and
decrease
d
10%
from
the fourth quarter of
2016
. The decrease from the fourth quarter of 2016 was primarily due to declining volumes from the Appalachian region.
NGLs prices in the fourth quarter of
2017
increase
d
17%
and
44%
over
the prices received in the third quarter of
2017
and the fourth quarter of
2016
, respectively. Because certain of the contracts used by our mid-stream segment for NGLs transactions are commodity-based contracts – under which we receive a share of the proceeds from the sale of the NGLs – our revenues from those commodity-based contracts fluctuate based on NGLs prices.
Direct profit (mid-stream revenues less mid-stream operating expense) for the fourth quarter of
2017
decrease
d
2%
and
11%
from
the third quarter of
2017
and fourth quarter of
2016
, respectively. The decrease from the third quarter was primarily due to a demand fee expiring in the fourth quarter of 2017 at our Pittsburgh Mills facility. The decrease from the fourth quarter of 2016 was also primarily due to the expiring demand fee at our Pittsburgh Mills facility in the fourth quarter of 2017 along with a short-fall fee that was recognized in the fourth quarter of 2016. Total operating cost for this segment for the fourth quarter of
2017
increase
d
14%
over
both the third quarter of
2017
and the fourth quarter of
2016
, respectively due primarily to the combination of the higher cost of gas purchased and increased purchase volumes.
46
At our Cashion processing facility in central Oklahoma, our total throughput volume for the fourth quarter of 2017 averaged approximately 37.3 MMcf per day and our total production of natural gas liquids increased to approximately 198,600 gallons per day. The total processing capacity at this facility is approximately 45 MMcf per day. During 2017, we connected 12 new wells to this system from three producers. We are continuing a pipeline extension project for a producer scheduled to actively drill in the Cashion area in 2018. We have already connected four new wells from this producer and anticipate connecting several more wells throughout 2018. As volume increases on this system, we will evaluate the need to add additional processing capacity. If volume continues to increase, we may need to add an additional processing plant in the Cashion area.
At our Hemphill processing facility in the Texas panhandle, our average gathered volume for the fourth quarter of 2017 was approximately 68.5 MMcf per day and our total production of natural gas liquids increased to 188,600 gallons per day. During 2017, we connected six new wells to this processing system with several more wells scheduled to be connected in the first part of 2018. We have completed construction of the pipeline to connect the next well pad and we are upgrading our compression facilities to handles the expected additional volume.
At our Bellmon processing facility in the Mississippian play in north central Oklahoma, during 2017 we connected 14 new wells to this system. Our total throughput volume for the fourth quarter of 2017 averaged approximately 27 MMcf per day. We have two processing skids available that provide total processing capacity of 90 MMcf per day.
At our Segno gathering facility in Southeast Texas, our average gathered volume for the fourth quarter of 2017 was approximately 86.4 MMcf per day. The gathering and dehydration capacity for this facility is approximately 120 MMcf per day. During 2017, we connected three new wells to this gathering system along with additional volume from recompletion activity in the area around our system.
In the Appalachian region, at our Pittsburgh Mills gathering system, we continue to connect new well pads to this system. During 2017, we connected one new well pad with five new wells to this gathering system. By adding these new wells our average gathered volume for the fourth quarter was approximately 117.2 MMcf per day. We are constructing a new pipeline to connect the next well pad to this system. Most of the preliminary environmental and permitting activities have been completed and right of way has been obtained. In the first quarter of 2018, we will start the construction of the pipeline with an expected completion date in the third quarter of 2018. This new well pad is expected to have seven wells drilled and we anticipate receiving gas from this pad at the end of 2018. This well pad is on the south end of our system and will be connected to our Kissick compressor station. And we have been notified by the producer they will drill seven infill wells on already existing pads in 2018.
Anticipated
2018
capital expenditures for this segment are approximately
$32.0 million
, a
44%
increase over
2017
.
Critical Accounting Policies and Estimates
Summary
In this section, we identify those critical accounting policies we follow in preparing our financial statements and related disclosures. Many policies require us to make difficult, subjective, and complex judgments while making estimates of matters inherently imprecise. Some accounting policies involve judgments and uncertainties to such an extent there is reasonable likelihood that materially different amounts could have been reported under different conditions, or had different assumption been used. We evaluate our estimates and assumptions regularly. We base our estimates on historical experience and various other assumptions we believe are reasonable under the circumstances, the results of which support making judgments about the carrying values of assets and liabilities not readily apparent from other sources. Actual results may differ from these estimates and assumptions used in preparation of our financial statements. In this discussion we attempt to explain the nature of these estimates, assumptions and judgments, and the likelihood that materially different amounts would be reported in our financial statements under different conditions or using different assumptions.
47
This table lists the critical accounting policies, identifies the estimates and assumptions that can have a significant impact on applying of these accounting policies, and the financial statement accounts affected by these estimates and assumptions.
|
Accounting Policies
|
Estimates or Assumptions
|
Accounts Affected
|
||
|
Full cost method of accounting for oil, NGLs, and natural gas properties
|
• Oil, NGLs, and natural gas reserves, estimates, and related present value of future net revenues
• Valuation of unproved properties
• Estimates of future development costs
|
• Oil and natural gas properties
• Accumulated depletion, depreciation and amortization
• Provision for depletion, depreciation and amortization
• Impairment of oil and natural gas properties
• Long-term debt and interest expense
|
||
|
Accounting for ARO for oil, NGLs, and natural gas properties
|
• Cost estimates related to the plugging and abandonment of wells
• Timing of cost incurred
• Credit adjusted risk free rate
|
• Oil and natural gas properties
• Accumulated depletion, depreciation and amortization
• Provision for depletion, depreciation and amortization
• Current and non-current liabilities
• Operating expense
|
||
|
Accounting for impairment of long-lived assets
|
• Forecast of undiscounted estimated future net operating cash flows
|
• Drilling and mid-stream property and equipment
• Accumulated depletion, depreciation and amortization
• Provision for depletion, depreciation and amortization
|
||
|
Goodwill
|
• Forecast of discounted estimated future net operating cash flows
• Terminal value
• Weighted average cost of capital
|
• Goodwill
|
||
|
Accounting for value of stock compensation awards
|
• Estimates of stock volatility
• Estimates of expected life of awards
granted
• Estimates of rates of forfeitures
• Estimates of performance shares
granted
|
• Oil and natural gas properties
• Shareholder’s equity
• Operating expenses
• General and administrative expenses
|
||
|
Accounting for derivative instruments
|
• Derivatives measured at fair value
|
• Current and non-current derivative assets and liabilities
• Gain (loss) on derivatives
|
||
Significant Estimates and Assumptions
Full Cost Method of Accounting for Oil, NGLs, and Natural Gas Properties.
Determining our oil, NGLs, and natural gas reserves is a subjective process. It entails estimating underground accumulations of oil, NGLs, and natural gas that cannot be measured in an exact manner. Accuracy of these estimates depends on several factors, including, the quality and availability of geological and engineering data, the precision of the interpretations of that data, and individual judgments. Each year, we hire an independent petroleum engineering firm to audit our internal evaluation of our reserves. The audit of our reserve wells or locations as of
December 31, 2017
covered those that we projected to comprise
83%
of the total proved developed future net income discounted at 10% and
86%
of the total proved discounted future net income (based on the SEC's unescalated pricing policy). Included in Part I, Item 1 of this report are the qualifications of our independent petroleum engineering firm and our employees responsible for preparing our reserve reports.
48
As a rule, the accuracy of estimating oil, NGLs, and natural gas reserves varies with the reserve classification and the related accumulation of available data, as shown in this table:
|
Type of Reserves
|
Nature of Available Data
|
Degree of Accuracy
|
||
|
Proved undeveloped
|
Data from offsetting wells, seismic data
|
Less accurate
|
||
|
Proved developed non-producing
|
The above and logs, core samples, well tests, pressure data
|
More accurate
|
||
|
Proved developed producing
|
The above and production history, pressure data over time
|
Most accurate
|
||
Assumptions of future oil, NGLs, and natural gas prices and operating and capital costs also play a significant role in estimating these reserves and the estimated present value of the cash flows to be received from the future production of those reserves. Volumes of recoverable reserves are influenced by the assumed prices and costs due to the economic limit (that point when the projected costs and expenses of producing recoverable oil, NGLs, and natural gas reserves is greater than the projected revenues from the oil, NGLs, and natural gas reserves). But more significantly, the estimated present value of the future cash flows from our oil, NGLs, and natural gas reserves is sensitive to prices and costs and may vary materially based on different assumptions. Companies, like ours, using full cost accounting use the unweighted arithmetic average of the commodity prices existing on the first day of each of the 12 months before the end of the reporting period to calculate discounted future revenues, unless prices were otherwise determined under contractual arrangements.
We compute DD&A on a units-of-production method. Each quarter, we use these formulas to compute the provision for DD&A for our producing properties:
|
•
|
DD&A Rate = Unamortized Cost / End of Period Reserves Adjusted for Current Period Production
|
|
•
|
Provision for DD&A = DD&A Rate x Current Period Production
|
Unamortized cost includes all capitalized costs, estimated future expenditures to be incurred in developing proved reserves and estimated dismantlement and abandonment costs, net of estimated salvage values less accumulated amortization, unproved properties, and equipment not placed in service.
Oil, NGLs, and natural gas reserve estimates have a significant impact on our DD&A rate. If future reserve estimates for a property or group of properties are revised downward, the DD&A rate will increase because of the revision. If reserve estimates are revised upward, the DD&A rate will decrease. Based on our
2017
production level of
16.0
MMBoe, a decrease in our
2017
oil, NGLs, and natural gas reserves by 5% would increase our DD&A rate by
$0.36
per Boe and would decrease pre-tax income by
$5.8 million
annually. Conversely, an increase in our
2017
oil, NGLs, and natural gas reserves by 5% would decrease our DD&A rate by
$0.30
per Boe and would increase pre-tax income by
$4.8 million
annually.
The DD&A expense on our oil and natural gas properties is calculated each quarter using period end reserve quantities adjusted for period production.
We account for our oil and natural gas exploration and development activities using the full cost method of accounting. Under this method, we capitalize all costs incurred in the acquisition, exploration, and development of oil and natural gas properties. At the end of each quarter, the net capitalized costs of our oil and natural gas properties are limited to that amount which is the lower of unamortized costs or a ceiling. The ceiling is defined as the sum of the present value (using a 10% discount rate) of the estimated future net revenues from our proved reserves (based on the unescalated 12-month average price on our oil, NGLs, and natural gas adjusted for any cash flow hedges), plus the cost of properties not being amortized, plus the lower of the cost or estimated fair value of unproved properties included in the costs being amortized, less related income taxes. If the net capitalized costs of our oil and natural gas properties exceed the ceiling, we are required to write-down the excess amount. A ceiling test write-down is a non-cash charge to earnings. If required, it reduces earnings and impacts shareholders’ equity in the period of occurrence and results in lower DD&A expense in future periods. Once incurred, a write-down cannot be reversed.
The risk we will be required to write-down the carrying value of our oil and natural gas properties increases when the prices for oil, NGLs, and natural gas are depressed or if we have large downward revisions in our estimated proved oil, NGLs, and natural gas reserves. Application of these rules during periods of relatively low prices, even if temporary, increases the
49
chance of a ceiling test write-down. At December 31,
2017
, our reserves were calculated based on applying 12-month
2017
average unescalated prices of
$51.34
per barrel of oil,
$31.83
per barrel of NGLs, and
$2.98
per Mcf of natural gas (then adjusted for price differentials) over the estimated life of each of our oil and natural gas properties. We had no ceiling test write-down for 2017.
It is hard to predict with any reasonable certainty the need for or amount of any future impairments given the many factors that go into the ceiling test calculation including, but not limited to, future pricing, operating costs, drilling and completion costs, upward or downward oil and gas reserve revisions, oil and gas reserve additions, and tax attributes. Subject to these inherent uncertainties, if we hold these same factors constant as they existed at December 31, 2017 and only adjust the 12-month average price to an estimated first quarter ending average (holding February 2018 prices constant for the remaining one month of the first quarter of 2018), our forward looking expectation is that we will not recognize an impairment in the first quarter of 2018. But commodity prices (and other factors) remain volatile and they could negatively affect the 12-month average price resulting in the potential for an impairment in the first quarter.
We use the sales method for recording natural gas sales. This method allows for the recognition of revenue, which may be more or less than our share of pro-rata production from certain wells. Our policy is to expense our pro-rata share of lease operating costs from all wells as incurred. The expenses relating to the wells in which we have a production imbalance are not material.
Costs Withheld from Amortization.
Costs associated with unproved properties are excluded from our amortization base until we have evaluated the properties. The costs associated with unevaluated leasehold acreage and related seismic data, wells drilling and capitalized interest are initially excluded from our amortization base. Leasehold costs are transferred to our amortization base with the costs of drilling a well on the lease or are assessed at least annually for possible impairment or reduction in value. Leasehold costs are transferred to our amortization base to the extent a reduction in value has occurred.
Our decision to withhold costs from amortization and the timing of transferring those costs into the amortization base involve significant judgment and may be subject to changes over time based on several factors, including our drilling plans, availability of capital, project economics and results of drilling on adjacent acreage. In December 2015, December 2016, and December 2017, we determined the value of certain unproved oil and gas properties were diminished (in part or in whole) based on an impairment evaluation and our anticipated future exploration plans. Those determinations resulted in
$114.4 million
,
$7.6 million
, and
$10.5 million
in
2015
,
2016
, and 2017, respectively of costs being added to the total of our capitalized costs being amortized. At December 31, 2017, we had approximately
$296.8 million
of costs excluded from the amortization base of our full cost pool.
Accounting for ARO for Oil, NGLs, and Natural Gas Properties.
We record the fair value of liabilities associated with the future plugging and abandonment of wells. In our case, when the reserves in each of our oil or gas wells deplete or otherwise become uneconomical, we must incur costs to plug and abandon the wells. These costs are recorded in the period in which the liability is incurred (at the time the wells are drilled or acquired). We have no assets restricted to settle these ARO liabilities. Our engineering staff uses historical experience to determine the estimated plugging costs considering the type of well (either oil or natural gas), the depth of the well, the physical location of the well, and the ultimate productive life to determine the estimated plugging costs. A risk-adjusted discount rate and an inflation factor are used on these estimated costs to determine the current present value of this obligation. To the extent any change in these assumptions affect future revisions and impact the present value of the existing ARO, a corresponding adjustment is made to the full cost pool.
Accounting for Impairment of Long-Lived Assets.
Drilling equipment, transportation equipment, gas gathering and processing systems, and other property and equipment are carried at cost less accumulated depreciation. Renewals and enhancements are capitalized while repairs and maintenance are expensed.
We review the carrying amounts of long-lived assets for potential impairment annually, typically during the fourth quarter, or when events occur or changes in circumstances suggest these carrying amounts may not be recoverable. Changes that could prompt such an assessment may include equipment obsolescence, changes in the market demand for a specific asset, changes in commodity prices, periods of relatively low drilling rig utilization, declining revenue per day, declining cash margin per day, or overall changes in market conditions. Assets are determined to be impaired if a forecast of undiscounted estimated future net operating cash flows directly related to the asset, including disposal value if any, is less than the carrying amount of the asset. If any asset is determined to be impaired, the loss is measured as the amount by which the carrying amount of the asset exceeds its fair value. The estimate of fair value is based on the best information available, including prices for similar assets. Changes in these estimates could cause us to reduce the carrying value of property and equipment.
Asset impairment evaluations are, by nature, highly subjective. They involve expectations about future cash flows generated by our assets and reflect management’s assumptions and judgments regarding
50
future industry conditions and their effect on future utilization levels, dayrates, and costs. Using different estimates and assumptions could cause materially different carrying values of our assets.
On a periodic basis, we evaluate our fleet of drilling rigs for marketability based on the condition of inactive rigs, expenditures that would be necessary to bring them to working condition and the expected demand for drilling services by rig type. The components comprising inactive rigs are evaluated, and those components with continuing utility to the Company’s other marketed rigs are transferred to other rigs or to its yards to be spare equipment. The remaining components of these rigs are retired. During 2015, we recorded a write-down on
31
of our drilling rigs and related equipment of approximately
$8.3 million
pre-tax based on the estimated market value for similar equipment from auctions sales. We then sold all
31
of these drilling rigs and some other drilling equipment to unaffiliated third parties. The proceeds from the sale of those assets, less costs to sell, was less than the
$11.3 million
net book value resulting in a loss of
$7.3 million
pre-tax. No impairments were recorded in 2016 or 2017.
In 2015, our mid-stream segment incurred a
$27.0 million
pre-tax write-down of its systems, Bruceton Mills, Spring Creek, and Midwell due to anticipated future cash flow and future development around these systems not being sufficient to support their carrying value. The estimated future cash flows were less than the carrying value on these systems. No impairments were recorded in 2016 or 2017.
Goodwill.
Goodwill represents the excess of the cost of acquisitions over the fair value of the net assets acquired. Goodwill is not amortized, but an impairment test is performed at least annually to determine whether the fair value has decreased and is performed additionally when events indicate an impairment may have occurred. For impairment testing, goodwill is evaluated at the reporting unit level. Our goodwill is all related to our contract drilling segment, and, the impairment test is generally based on the estimated discounted future net cash flows of our drilling segment, utilizing discount rates and other factors in determining the fair value of our drilling segment. Inputs in our estimated discounted future net cash flows include drilling rig utilization, day rates, gross margin percentages, and terminal value.
No
goodwill impairment was recorded at December 31,
2017
,
2016
, or
2015
. Based on our impairment test performed as of December 31,
2017
, the fair value of our drilling segment exceeded its carrying value by 41%. A period of sustained reduced commodity prices resulting in further reductions in the number of our drilling rigs working and the rates we charge for them could cause a non-cash goodwill impairment in future periods.
Turnkey and Footage Drilling Contracts.
Because our contract drilling operations do not bear the risk of completion of a well being drilled under a “daywork” contract, we recognize revenues and expense generated under “daywork” contracts as the services are performed. Under “footage” and “turnkey” contracts we bear the risk of completion of the well, so revenues and expenses are recognized when the well is substantially completed. Substantial completion is determined when the well bore reaches the depth specified in the contract. The entire amount of any loss is recorded when the loss can be reasonably determined, however, any profit is recorded only at the time the well is finished. The costs of drilling contracts uncompleted at the end of the reporting period (which includes expenses incurred on “footage” or “turnkey” contracts) are included in other current assets. We drilled no wells under turnkey or footage contracts in
2017
,
2016
, or
2015
.
Accounting for Value of Stock Compensation Awards.
To account for stock-based compensation, compensation cost is measured at the grant date based on the fair value of an award and is recognized over the service period, which is usually the vesting period. We elected to use the modified prospective method, which requires compensation expense to be recorded for all unvested stock options and other equity-based compensation beginning in the first quarter of adoption. Determining the fair value of an award requires significant estimates and subjective judgments regarding, among other things, the appropriate option pricing model, the expected life of the award and performance vesting criteria assumptions. As there are inherent uncertainties related to these factors and our judgment in applying them to the fair value determinations, there is risk that the recorded stock compensation may not accurately reflect the amount ultimately earned by the employee.
Accounting for Derivative Instruments and Hedging.
All derivatives are recognized on the balance sheet and measured at fair value. Any changes in our derivatives' fair value before their maturity (i.e., temporary fluctuations in value) along with any derivatives settled are reported in gain (loss) on derivatives in our Consolidated Statements of Operations.
51
New Accounting Standards
Compensation—Stock Compensation.
The FASB issued ASU 2017-09, to clarify and reduce both (i) diversity in practice and (ii) cost and complexity when applying its guidance to changes in the terms of a share-based payment award. The amendment is effective for reporting periods beginning after December 15, 2017. This amendment will not have a material impact on our financial statements.
Intangibles—Goodwill and Other: Simplifying the Test for Goodwill Impairment.
The FASB issued ASU 2017-04, to simplify the measurement of goodwill. The amendment eliminates Step 2 from the goodwill impairment test. The amendment will be effective prospectively for reporting periods beginning after December 15, 2019, and early adoption is permitted. This amendment will not have a material impact on our financial statements.
Business Combinations; Clarifying the Definition of a Business.
The FASB issued ASU 2017-01, clarifying the definition of a business. The amendment should help companies and other organizations evaluate whether transactions should be accounted for as acquisitions (or disposals) of assets or businesses. For public companies, the amendment is effective for annual periods beginning after December 15, 2017. This amendment will not have a material impact on our financial statements.
Statement of Cash Flows: Classification of Certain Cash Receipts and Cash Payments.
The FASB issued ASU 2016-15, to address diversity in how certain transactions are presented and classified in the statement of cash flows. The amendment will be effective retrospectively for reporting periods beginning after December 31, 2017, and early adoption is permitted. This amendment will not have a material impact on our financial statements.
Leases.
The FASB has issued ASU 2016-02. The amendment will require lessees to recognize at the commencement date a lease liability, which is a lessee's obligation to make lease payments arising from a lease, measured on a discounted basis; and a right-of-use asset, which is an asset that represents the lessee's right to use a specified asset for the lease term. Lessor accounting is largely unchanged. For public companies, the amendment is effective for annual periods beginning after December 15, 2018, and interim periods within those annual periods. The standard will not apply to leases of mineral rights. We are evaluating the impact this amendment will have on our financial statements and currently evaluating a plan for implementation.
Revenue from Contracts with Customers.
The FASB has issued ASU 2014-09. This standard affects any entity using U.S. GAAP that either contracts with customers to transfer goods or services or enters into contracts for transferring nonfinancial assets unless those contracts are within the scope of other standards (e.g., insurance contracts or lease contracts). The core principle of the amendments is that an entity should recognize revenue to depict the transfer of promised goods or services to customers in an amount that reflects the consideration to which the entity expects to be entitled in exchange for those goods or services. ASU 2014-09 has been amended several times pre-issuance, which is codified in the new Topic 606, effective January 1, 2018. The guidance in this update supersedes the revenue recognition requirements in Topic 605, Revenue Recognition, and most industry-specific guidance throughout the Industry Topics of the Codification. We adopted this standard January 1, 2018 using the modified retrospective approach, which resulted in a cumulative effect adjustment upon adoption for our mid-stream segment. This adjustment related to the timing of revenue on certain demand fees which was not material to the company. Both our oil and natural gas and contract drilling segments had no retained earnings adjustment.
The application of Topic 606 will not have a material effect on our statement of operations or our balance sheet, as the timing of revenue recognized will not be materially modified, but additional footnote disclosures are required with respect to revenue. In our oil and natural gas segment, the classification of certain costs as either a deduction from revenue or an expense will be determined based on when control of the commodity transfers to the customer, which would impact total revenue recognized, but will not affect gross profit.
Part of our review included evaluation of these issues:
|
•
|
Based on an analysis of whether the transportation of gas is a performance obligation that occurs at a point in time or over time, the timing of when we recognize certain revenue elements will change. Specifically related to our mid-stream segment, certain fees collectible during a contract will be recognized over the life of the contract because these fees are part of the single performance obligation associated with the contract.
|
|
•
|
Certain of our contracts include promises to deliver a minimum volume of commodity to the customer over a defined period. If we do not meet this commitment, a deficiency fee is payable to the customer. Topic 606 requires these arrangements represent variable consideration related to the sale of the commodity, and requires that we include an
|
52
estimate of any deficiency fees expected within revenue, rather than as operating costs. In addition, we will also be required to analyze fees that are billable for deficiencies in minimum volume commitments from customers for our mid-stream segment. In these instances, we will assess the likelihood of earning these fees each reporting period based on the customer’s performance and recognize variable revenue when it is not expected to be subject to a significant reversal.
Our internal control framework did not materially change, but the existing internal controls have been modified to consider our new revenue recognition policy effective January 1, 2018. As we implement the new standard, we have added internal controls to ensure that we adequately evaluate new contracts under the five-step model under ASU 2014-09.
Adopted Standards
Income Taxes: Balance Sheet Classification of Deferred Taxes.
The FASB has issued ASU 2015-17. This changes how deferred taxes are classified on organizations' balance sheets. Organizations must classify all deferred tax assets and liabilities as noncurrent. The amendments apply to all organizations that present a classified balance sheet. For public companies, the amendments were effective for financial statements issued for annual periods beginning after December 15, 2016, and interim periods within those annual periods. The amendment requires current deferred tax assets to be combined with noncurrent deferred tax assets. We have adopted this ASU during the first quarter of 2017 on a prospective basis. Previously, we had a net current deferred tax asset now netted with our noncurrent deferred tax liability.
P
rior periods were not retrospectively adjusted.
Compensation—Stock Compensation: Improvements to Employee Share-Based Payment Accounting.
The FASB has issued ASU 2016-09. The amendment should improve the accounting for employee share-based payments and affect all organizations that issue share-based payment awards to their employees. Several aspects of the accounting for share-based payment award transactions are simplified, including: (a) income tax consequences; (b) classification of awards as either equity or liabilities; and (c) classification on the statement of cash flows. For public companies, the amendment was effective for annual periods beginning after December 15, 2016, and interim periods within those annual periods. The amendment primarily affects classification within the statement of cash flows between financial and operating activities. This did not have a material impact on our financial statements.
Financial Condition and Liquidity
Summary.
Our financial condition and liquidity primarily depends on the cash flow from our operations and borrowings under our credit agreement. The principal factors determining our cash flow are:
|
•
|
the amount of natural gas, oil, and NGLs we produce;
|
|
•
|
the prices we receive for our natural gas, oil, and NGLs production;
|
|
•
|
the demand for and the dayrates we receive for our drilling rigs; and
|
|
•
|
the fees and margins we obtain from our natural gas gathering and processing contracts.
|
We believe we have sufficient cash flow and liquidity to meet our obligations and remain in compliance with our debt covenants for the next twelve months. Our ability to meet our debt covenants (under our credit agreement and our Indenture) and our capacity to incur additional indebtedness will depend on our future performance, which in turn will be affected by financial, business, economic, regulatory, and other factors. For example, lower oil, natural gas, and NGLs prices since the last redetermination under our credit agreement could cause a redetermination of the borrowing base to a lower level and therefore reduce or limit our ability to borrow funds. We monitor our liquidity and capital resources, endeavor to anticipate potential covenant compliance issues and work with the lenders under our credit agreement to address any of those issues ahead of time.
53
Below is a summary of certain financial information for the years ended December 31:
|
2017
|
2016
|
2015
|
||||||||||
|
|
(In thousands)
|
|||||||||||
|
Net cash provided by operating activities
|
$
|
279,588
|
|
$
|
240,130
|
|
$
|
446,944
|
|
|||
|
Net cash used in investing activities
|
(306,998
|
)
|
(110,971
|
)
|
(549,778
|
)
|
||||||
|
Net cash provided by (used in) financing activities
|
27,218
|
|
(129,101
|
)
|
102,620
|
|
||||||
|
Net increase (decrease) in cash and cash equivalents
|
$
|
(192
|
)
|
$
|
58
|
|
$
|
(214
|
)
|
|||
Cash flows from Operating Activities
Our operating cash flow is primarily influenced by the prices we receive for our oil, NGLs, and natural gas production, the quantity of oil, NGL, and natural gas we produce, settlements of derivative contracts, third-party demand for our drilling rigs and mid-stream services, and the rates we can charge for those services. Our cash flows from operating activities are also affected by changes in working capital.
Net cash provided by operating activities during 2017 increased by $39.5 million from 2016 due primarily to higher revenues due to higher commodity prices and higher drilling rig utilization partially offset by changes in operating assets and liabilities related to the timing of cash receipts and disbursements.
Cash flows from Investing Activities
We dedicate and expect to continue to dedicate a substantial portion of our capital budget to the exploration for and production of oil, NGLs, and natural gas. These expenditures are necessary to off-set the inherent production declines typically experienced in oil and gas wells.
Cash flows used in investing activities increased by $196.0 million in 2017 compared to 2016. The change was due primarily to an increase in capital expenditures due to an oil and gas property acquisition, the restarting of our drilling program in 2017, the construction of a new BOSS drilling rig, and a decrease in the proceeds received from the disposition of assets. See additional information on capital expenditures below under Capital Requirements.
Cash Flows from Financing Activities
Cash flows provided by (used in) financing activities increased by $156.3 million in 2017 compared to 2016. The increase was primarily due to proceeds from the ATM common stock program coupled with an increase in net borrowing after paying down long-term debt in 2016.
At
December 31, 2017
, we had unrestricted cash totaling
$0.7 million
and had borrowed
$178.0 million
of the
$475.0 million
we have available under our credit agreement.
54
Below is a summary of certain financial information as of December 31, and for the years ended December 31:
|
2017
|
2016
|
2015
|
||||||||||
|
|
(In thousands)
|
|||||||||||
|
Working capital
|
$
|
(62,264
|
)
|
$
|
(43,719
|
)
|
$
|
(10,633
|
)
|
|||
|
Long-term debt
(1)
|
$
|
820,276
|
|
$
|
800,917
|
|
$
|
918,995
|
|
|||
|
Shareholders’ equity
(2)
|
$
|
1,345,560
|
|
$
|
1,194,070
|
|
$
|
1,313,580
|
|
|||
|
Net income (loss)
(2)
|
$
|
117,848
|
|
$
|
(135,624
|
)
|
$
|
(1,037,361
|
)
|
|||
_________________________
|
(1)
|
Long-term debt is net of unamortized discount and debt issuance costs.
|
|
(2)
|
In 2016 and 2015, we incurred non-cash ceiling test write-downs of our oil and natural gas properties of
$161.6 million
, and
$1.6 billion
pre-tax (
$100.6 million
and
$1.0 billion
, net of tax), respectively. In 2015, we incurred a non-cash write-down associated with the removal of 31 drilling rigs from our fleet along with certain other equipment and drill pipe of $8.3 million pre-tax ($5.1 million, net of tax). In December 2015, we incurred a non-cash write-down associated with the reduction in the carrying value of three mid-stream segment gathering systems of $27.0 million pre-tax ($16.8 million, net of tax). The write-downs affected our shareholders’ equity, ratio of long-term debt to total capitalization, and net income (loss) for 2015. There was no impact on our compliance with the covenants in our credit agreement.
|
Working Capital
Typically, our working capital balance fluctuates, in part, because of the timing of our trade accounts receivable and accounts payable and the fluctuation in current assets and liabilities associated with the mark to market value of our derivative activity. We had negative working capital of
$62.3 million
, $43.7 million, and $10.6 million as of December 31,
2017
,
2016
, and
2015
, respectively. This is primarily due to increased accounts payable due to increased activity in our drilling program and increased drilling rig utilization and the reclassification of the current deferred tax asset to long-term asset per ASU 2015-17 partially offset by increased accounts receivable from increased revenues and the change in the value of outstanding derivatives. Our credit agreement is used primarily for working capital and capital expenditures. At December 31,
2017
, we had borrowed
$178.0 million
of the
$475.0 million
available to us under our credit agreement. The effect of our derivatives decreased working capital by $7.1 million as of
December 31, 2017
, and increased working capital by
$21.6 million
and
$10.2 million
as of December 31,
2016
and
2015
, respectively.
55
This table summarizes certain operating information for the years ended December 31:
|
2017
|
2016
|
2015
|
||||||||||
|
Oil and Natural Gas:
|
||||||||||||
|
Oil production (MBbls)
|
2,715
|
|
2,974
|
|
3,783
|
|
||||||
|
Natural gas liquids production (MBbls)
|
4,737
|
|
5,014
|
|
5,274
|
|
||||||
|
Natural gas production (MMcf)
|
51,260
|
|
55,735
|
|
65,546
|
|
||||||
|
Average oil price per barrel received
|
$
|
49.44
|
|
$
|
40.50
|
|
$
|
50.79
|
|
|||
|
Average oil price per barrel received excluding derivatives
|
$
|
48.98
|
|
$
|
39.05
|
|
$
|
45.04
|
|
|||
|
Average NGLs price per barrel received
|
$
|
18.35
|
|
$
|
11.26
|
|
$
|
10.12
|
|
|||
|
Average NGLs price per barrel received excluding derivatives
|
$
|
18.35
|
|
$
|
11.26
|
|
$
|
10.12
|
|
|||
|
Average natural gas price per mcf received
|
$
|
2.46
|
|
$
|
2.07
|
|
$
|
2.63
|
|
|||
|
Average natural gas price per mcf received excluding derivatives
|
$
|
2.49
|
|
$
|
1.98
|
|
$
|
2.25
|
|
|||
|
Contract Drilling:
|
||||||||||||
|
Average number of our drilling rigs in use during the period
|
30.0
|
|
17.4
|
|
34.7
|
|
||||||
|
Total drilling rigs available for use at the end of the period
|
95
|
|
94
|
|
94
|
|
||||||
|
Average dayrate
|
$
|
16,256
|
|
$
|
17,784
|
|
$
|
19,455
|
|
|||
|
Mid-Stream:
|
||||||||||||
|
Gas gathered—Mcf/day
|
385,209
|
|
419,217
|
|
353,771
|
|
||||||
|
Gas processed—Mcf/day
|
137,625
|
|
155,461
|
|
182,684
|
|
||||||
|
Gas liquids sold—gallons/day
|
534,140
|
|
536,494
|
|
577,513
|
|
||||||
|
Number of natural gas gathering systems
|
24
|
|
25
|
|
25
|
|
(1)
|
|||||
|
Number of processing plants
|
13
|
|
13
|
|
13
|
|
||||||
_________________________
|
(1)
|
In 2015, our mid-stream segment transferred 11 natural gas gathering systems to our oil and natural gas segment.
|
Oil and Natural Gas Operations
Any significant change in oil, NGLs, or natural gas prices has a material effect on our revenues, cash flow, and the value of our oil, NGLs, and natural gas reserves. Generally, prices and demand for domestic natural gas are influenced by weather conditions, supply imbalances, and by worldwide oil price levels. Domestic oil prices are primarily influenced by world oil market developments. These factors are beyond our control and we cannot predict nor measure their future influence on the prices we will receive.
Based on our
2017
production, a $0.10 per Mcf change in what we are paid for our natural gas production, without the effect of derivatives, would cause a corresponding
$410,000
per month (
$4.9 million
annualized) change in our pre-tax operating cash flow. Our
2017
average natural gas price was
$2.46
compared to an average natural gas price of
$2.07
for
2016
and
$2.63
for
2015
. A $1.00 per barrel change in our oil price, without the effect of derivatives, would have a
$217,000
per month (
$2.6 million
annualized) change in our pre-tax operating cash flow and a $1.00 per barrel change in our NGLs prices, without the effect of derivatives, would have a
$380,000
per month (
$4.6 million
annualized) change in our pre-tax operating cash flow based on our production in
2017
. Our
2017
average oil price per barrel was
$49.44
compared with an average oil price of
$40.50
in
2016
and
$50.79
in
2015
, and our
2017
average NGLs price per barrel was
$18.35
compared with an average NGLs price of
$11.26
in
2016
and
$10.12
in
2015
.
Because commodity prices affect the value of our oil, NGLs, and natural gas reserves, declines in those prices can cause a decline in the carrying value of our oil and natural gas properties. At December 31, 2017, the 12-month average unescalated prices were
$51.34
per barrel of oil,
$31.83
per barrel of NGLs, and
$2.98
per Mcf of natural gas, and then are adjusted for price differentials. We did not have to take a write down in 2017.
It is hard to predict with any reasonable certainty the need for or amount of any future impairments given the many factors that go into the ceiling test calculation including, but not limited to, future pricing, operating costs, drilling and completion costs, upward or downward oil and gas reserve revisions, oil and gas reserve additions, and tax attributes. Subject to these inherent uncertainties, if we hold these same factors constant as they existed at December 31, 2017 and only adjust the 12-month average price to an estimated first quarter ending average (holding February 2018 prices constant for the remaining
56
one month of the first quarter of 2018), our forward looking expectation is that we will not recognize an impairment in the first quarter of 2018. Commodity prices remain volatile and they could negatively affect the 12-month average price and the potential for an impairment in the first quarter.
Our natural gas production is sold to intrastate and interstate pipelines, to independent marketing firms and gatherers under contracts with terms generally ranging from one month to five years. Our oil production is sold to independent marketing firms generally under six-month contracts.
Contract Drilling Operations
Many factors influence the number of drilling rigs we have working and the costs and revenues associated with that work. These factors include the demand for drilling rigs in our areas of operation, competition from other drilling contractors, the prevailing prices for oil, NGLs, and natural gas, availability and cost of labor to run our drilling rigs, and our ability to supply the equipment needed.
Competition to keep qualified labor continues. We increased compensation for some rig personnel in the third quarter of 2017 and again during the first quarter of 2018.
During
2017
, almost all of our working drilling rigs were drilling horizontal or directional wells for oil and NGLs. The continuous fluctuations in commodity prices for oil and natural gas changes demand for drilling rigs. These factors ultimately affect the demand and mix of the type of drilling rigs used by our customers. The future demand for and the availability of drilling rigs to meet that demand will affect our future dayrates. For
2017
, our average dayrate was
$16,256
per day compared to
$17,784
and
$19,455
per day for
2016
and
2015
, respectively. Our average number of drilling rigs used (utilization %) in
2017
was
30.0
(
32%
) compared with
17.4
(
19%
) and
34.7
(
38%
) in
2016
and
2015
, respectively.
Based on the average utilization of our drilling rigs during
2017
, a $100 per day change in dayrates has a
$3,000
per day (
$1.1 million
annualized) change in our pre-tax operating cash flow.
Our contract drilling segment provides drilling services for our exploration and production segment. Some of the drilling services we perform on our properties are, depending on the timing of those services, deemed associated with acquiring an ownership interest in the property. In those cases, revenues and expenses for those services are eliminated in our statement of operations, with any profit recognized as a reduction in our investment in our oil and natural gas properties. The contracts for these services are issued under the same conditions and rates as the contracts entered into with unrelated third parties. By providing drilling services for the oil and natural gas segment, we eliminated revenue of
$13.4 million
and
$22.1 million
during
2017
and
2015
, respectively, from our contract drilling segment and eliminated the associated operating expense of
$11.8 million
and
$18.3 million
during
2017
and
2015
, respectively, yielding
$1.6 million
and
$3.8 million
during
2017
and
2015
, respectively, as a reduction to the carrying value of our oil and natural gas properties. We eliminated no revenue or expenses in our contract drilling segment during 2016.
Mid-Stream Operations
This segment is engaged primarily in the buying, selling, gathering, processing, and treating of natural gas. It operates
three
natural gas treatment plants,
13
processing plants,
24
gathering systems, and approximately
1,455
miles of pipeline. Its operations are in Oklahoma, Texas, Kansas, Pennsylvania, and West Virginia. This segment enhances our ability to gather and market not only our own natural gas and NGLs but also that owned by third parties and serves as a mechanism through which we can construct or acquire existing natural gas gathering and processing facilities. During
2017
,
2016
, and
2015
this segment purchased
$63.2 million
,
$42.7 million
, and
$57.6 million
, respectively, of our oil and natural gas segment's natural gas and NGLs production, and provided gathering and transportation services of
$6.7 million
,
$9.2 million
, and
$7.6 million
, respectively. Intercompany revenue from services and purchases of production between this business segment and our oil and natural gas segment has been eliminated in our consolidated financial statements.
Our mid-stream segment gathered an average of
385,209
Mcf per day in
2017
compared to
419,217
Mcf per day in
2016
and
353,771
Mcf per day in
2015
. It processed an average of
137,625
Mcf per day in
2017
compared to
155,461
Mcf per day in
2016
and
182,684
Mcf per day in
2015
, and sold NGLs of
534,140
gallons per day in
2017
compared to
536,494
gallons per day in
2016
and
577,513
gallons per day in
2015
. Gas gathering volumes per day in
2017
decreased primarily due to lower volumes from our fee-based Appalachian systems. Volumes processed decreased primarily due to lower purchased volumes and fewer new wells connected to our processing systems in 2017. NGLs sold decreased primarily due to lower purchased volumes and continuing to operate most of our systems in ethane rejection mode.
57
At-the-Market (ATM) Common Stock Program
On April 4, 2017, we entered into a Distribution Agreement (the Agreement) with a sales agent, under which we may offer and sell, from time to time, through the sales agent shares of our common stock, par value $0.20 per share (the Shares), up to an aggregate offering price of $100.0 million. We intend to use the net proceeds from these sales to fund (or offset costs of) acquisitions, future capital expenditures, repay amounts outstanding under our revolving credit facility, and general corporate purposes.
Under the Agreement, the sales agent may sell the Shares by methods deemed to be an “at-the-market” offering as defined in Rule 415 promulgated under the Securities Act of 1933, as amended, including sales made directly on the NYSE, on any other existing trading market for the Shares or to or through a market maker. In addition, under the Agreement, the sales agent may sell the Shares by any other method permitted by law, including in privately negotiated transactions. Subject to the terms of the Agreement, the sales agent will use commercially reasonable efforts, consistent with its normal trading and sales practices and applicable state and federal law, rules and regulations and the rules of the NYSE, to sell the Shares from time to time, based on our instructions (including any price, time or size limits or other customary parameters or conditions we may impose).
We do not have to make any sales of the Shares under the Agreement. The offering of Shares under the Agreement will terminate on the earlier of (1) the sale of all of the Shares subject to the Agreement or (2) the termination of the Agreement by the sales agent or us. We will pay the sales agent a commission of 2.0% of the gross sales price per share sold and have agreed to provide the sales agent with customary indemnification and contribution rights.
Since entering into the Agreement through February 13, 2018, we have sold 787,547 shares of our common stock resulting in net proceeds of approximately $18.6 million. No shares were sold in the fourth quarter of 2017. Approximately $81.0 million remain available for sale under the program.
Our Credit Agreement and Senior Subordinated Notes
Credit Agreement.
On April 8, 2016, we amended our Senior Credit Agreement (credit agreement) scheduled to mature on April 10, 2020.
The amount we can borrow is the lesser of the amount we elect (from time to time) as the commitment amount or the value of the borrowing base as determined by the lenders, but in either event not to exceed the maximum credit agreement amount of
$875.0 million
. Our elected commitment amount is
$475.0 million
. Our borrowing base is
$475.0 million
. We are charged a commitment fee of
0.50%
on the amount available but not borrowed. The fee varies based on the amount borrowed as a percentage of the total borrowing base.
We paid
$1.0 million
in origination, agency, syndication, and other related fees. We are amortizing these fees over the life of the credit agreement. With the new amendment, we pledged the following collateral: (a) 85% of the proved developed producing (discounted as present worth at 8%) total value of our oil and gas properties and (b) 100% of our ownership interest in our mid-stream affiliate, Superior Pipeline Company, L.L.C.
The lenders under our credit agreement and their respective participation interests are:
|
Lender
|
Participation
Interest
|
|
|
BOK (BOKF, NA, dba Bank of Oklahoma)
|
17
|
%
|
|
Compass Bank
|
17
|
%
|
|
BMO Harris Financing, Inc.
|
15
|
%
|
|
Bank of America, N.A.
|
15
|
%
|
|
Comerica Bank
|
8
|
%
|
|
Wells Fargo Bank, N.A.
|
8
|
%
|
|
Canadian Imperial Bank of Commerce
|
8
|
%
|
|
Toronto Dominion (New York), LLC
|
8
|
%
|
|
The Bank of Nova Scotia
|
4
|
%
|
|
100
|
%
|
|
The borrowing base amount–which is subject to redetermination by the lenders on April 1st and October 1st of each year, is based primarily on a percentage of the discounted future value of our oil and natural gas reserves and on our cash flows from our mid-stream segment. The October 2017 redetermination did not result in any changes. We or the lenders may request a
58
onetime special redetermination of the borrowing base between each scheduled redetermination. In addition, we may request a redetermination following the completion of an acquisition that meets the requirements in the credit agreement.
At our election, any part of the outstanding debt under the credit agreement may be fixed at a London Interbank Offered Rate (LIBOR). LIBOR interest is computed as the sum of the LIBOR base for the applicable term plus
2.00%
to
3.00%
depending on the level of debt as a percentage of the borrowing base and is payable at the end of each term, or every
90 days
,
whichever is less. Borrowings not under LIBOR bear interest at the prime rate specified in the credit agreement that cannot be less than
LIBOR plus 1.00% plus a margin
. Interest is payable at the end of each month and the principal may be repaid in whole or in part at any time, without a premium or penalty. At
December 31, 2017
and
February 13, 2018
, we had
$178.0 million
and
$173.8 million
, respectively,
outstanding borrowings under our credit agreement.
We can use borrowings for financing general working capital requirements for (a) exploration, development, production and acquisition of oil and gas properties, (b) acquisitions and operation of mid-stream assets, (c) issuance of standby letters of credit, (d) contract drilling services, and (e) general corporate purposes.
The credit agreement prohibits, among other things:
|
•
|
the payment of dividends (other than stock dividends) during any fiscal year over
30%
of our consolidated net income for the preceding fiscal year;
|
|
•
|
the incurrence of additional debt with certain limited exceptions; and
|
|
•
|
the creation or existence of mortgages or liens, other than those in the ordinary course of business, on any of our properties, except for our lenders.
|
The credit agreement also requires that we have at the end of each quarter:
|
•
|
a current ratio (as defined in the credit agreement) of not less than
1 to 1
.
|
Through the quarter ending March 31, 2019, the credit agreement also requires that we have at the end of each quarter:
|
•
|
a senior indebtedness ratio of senior indebtedness to consolidated EBITDA (as defined in the credit agreement) for the most recently ended rolling four quarters of no greater than 2.75 to 1.
|
Beginning with the quarter ending June 30, 2019, and for each quarter ending thereafter, the credit agreement requires:
|
•
|
a leverage ratio of funded debt to consolidated EBITDA (as defined in the credit agreement) for the most recently ended rolling four fiscal quarters of no greater than
4 to 1
.
|
As of
December 31, 2017
, we were in compliance with the covenants in the credit agreement.
6.625% Senior Subordinated Notes.
We have an aggregate principal amount of
$650.0 million
,
6.625%
senior subordinated notes (the Notes). Interest on the Notes is payable semi-annually (in arrears) on May 15 and November 15 of each year. The Notes will mature on
May 15, 2021
. In issuing the Notes, we incurred
$14.7 million
of fees that are being amortized as debt issuance cost over the life of the Notes.
The Notes are subject to an Indenture dated as of May 18, 2011, between us and Wilmington Trust, National Association (successor to Wilmington Trust FSB), as Trustee (the Trustee), as supplemented by the First Supplemental Indenture dated as of May 18, 2011, between us, the Guarantors, and the Trustee, and as further supplemented by the Second Supplemental Indenture dated as of January 7, 2013, between us, the Guarantors and the Trustee (as supplemented, the 2011 Indenture), establishing the terms and providing for issuing the Notes. The Guarantors are our direct and indirect subsidiaries. The discussion of the Notes in this report is qualified by and subject to the actual terms of the 2011 Indenture.
Unit, as the parent company, has no independent assets or operations. The guarantees by the Guarantors of the Notes (registered under registration statements) are full and unconditional, joint and several, subject to certain automatic customary releases, are subject to certain restrictions on the sale, disposition, or transfer of the capital stock or substantially all of the assets of a subsidiary guarantor, and other conditions and terms set out in the Indenture. Any of our subsidiaries that are not Guarantors are minor. There are no significant restrictions on our ability to receive funds from our subsidiaries through dividends, loans, advances or otherwise.
59
We may redeem all or, from time to time, a part of the Notes at certain redemption prices, plus accrued and unpaid interest. If a “change of control” occurs, subject to certain conditions, we must offer to repurchase from each holder all or any part of that holder’s Notes at a purchase price in cash equal to
101%
of the principal amount of the Notes plus accrued and unpaid interest, if any, to the date of purchase. The 2011 Indenture contains customary events of default. The 2011 Indenture also contains covenants that, among other things, limit our ability and the ability of certain of our subsidiaries to incur or guarantee additional indebtedness; pay dividends on our capital stock or redeem capital stock or subordinated indebtedness; transfer or sell assets; make investments; incur liens; enter into transactions with our affiliates; and merge or consolidate with other companies. We were in compliance with all covenants of the Notes as of
December 31, 2017
.
Capital Requirements
Oil and Natural Gas Dispositions, Acquisitions, and Capital Expenditures.
Most of our capital expenditures for this segment are discretionary and directed toward growth. Any decision to increase our oil, NGLs, and natural gas reserves through acquisitions or through drilling depends on the prevailing or expected market conditions, potential return on investment, future drilling potential, and opportunities to obtain financing, which provide us flexibility in deciding when and if to incur these costs. We completed drilling
70
gross wells (
25.71
net wells) in
2017
compared to
21
gross wells (
9.67
net wells) in
2016
, and
58
gross wells (
34.99
net wells) in
2015
.
On April 3, 2017, we closed an acquisition of certain oil and natural gas assets located primarily in Grady and Caddo Counties in western Oklahoma. The final adjusted value of consideration given was $54.3 million. As of January 1, 2017, the effective date of the acquisition, the estimated proved oil and gas reserves of the acquired properties were 3.2 million barrels of oil equivalent (MMBoe). The acquisition added approximately 8,300 net oil and gas leasehold acres to our core Hoxbar area in southwestern Oklahoma including approximately 47 proved developed producing wells. This acquisition included 13 potential horizontal drilling locations not otherwise included in our existing acreage. Of the acreage acquired, approximately 71% was held by production. We also received one gathering system as part of the transaction.
Capital expenditures for oil and gas properties on the full cost method for
2017
by this segment, excluding a
$4.0 million
reduction in the ARO liability and
$59.0 million
in acquisitions (including associated ARO), totaled
$215.4 million
compared to
2016
capital expenditures of
$119.9 million
(excluding a
$30.9 million
reduction in the ARO liability and
$0.6 million
in acquisitions), and
2015
capital expenditures of
$273.5 million
(excluding an
$5.7 million
reduction in the ARO liability and
$0.2 million
in acquisitions).
For 2018, we plan to participate in drilling approximately
75
to
85
gross wells and estimate our total capital expenditures (excluding any possible acquisitions) for our oil and natural gas segment will be approximately
$272.0 million
. Whether we drill all of those wells depends on several factors, many of which are beyond our control and include the availability of drilling rigs, availability of pressure pumping services, prices for oil, NGLs, and natural gas, demand for oil, NGLs, and natural gas, the cost to drill wells, the weather, and the efforts of outside industry partners.
We sold non-core oil and natural gas assets, net of related expenses, for
$18.6 million
,
$67.2 million
, and
$1.9 million
during
2017
,
2016
, and
2015
, respectively. Proceeds from those dispositions reduced the net book value of our full cost pool with no gain or loss recognized.
Contract Drilling Dispositions, Acquisitions, and Capital Expenditures.
During 2015, we recorded a write-down on 31 of our drilling rigs and related equipment of approximately $8.3 million pre-tax based on the estimated market value for similar equipment from auctions sales. We then sold all 31 of these drilling rigs and some other drilling equipment to unaffiliated third parties. The proceeds from the sale of those assets, less costs to sell, was less than the $11.3 million net book value resulting in a loss of $7.3 million pre-tax.
During 2015, five BOSS drilling rigs were constructed and placed into service for third-party operators.
During December 2016, we sold an idle 1500 HP SCR drilling rig to an unaffiliated third party. We also fabricated and placed into service our ninth new BOSS drilling rig for a third party operator. This new BOSS rig was constructed using the long lead time components purchased in prior years.
During 2017, we built our tenth BOSS drilling rig and placed it into service for a third party operator under a long term contract. We also returned to service 14 SCR drilling rigs that had been previously stacked.
Our anticipated
2018
capital expenditures for this segment is approximately
$47.0 million
. We spent
$36.1 million
for capital expenditures during
2017
compared to
$19.1 million
in
2016
, and
$84.8 million
in
2015
.
60
Mid-Stream Dispositions, Acquisitions, and Capital Expenditures
.
At our Cashion processing facility in central Oklahoma, our total throughput volume for the fourth quarter of 2017 averaged approximately 37.3 MMcf per day and our total production of natural gas liquids increased to approximately 198,600 gallons per day. The total processing capacity at this facility is approximately 45 MMcf per day. During 2017, we connected 12 new wells to this system from three producers. We are continuing a pipeline extension project for a producer scheduled to actively drill in the Cashion area in 2018. We have already connected four new wells from this producer and anticipate connecting several more wells throughout 2018. As volume increases on this system, we will evaluate the need to add additional processing capacity. If volume continues to increase, we may need to add an additional processing plant in the Cashion area.
At our Hemphill processing facility in the Texas panhandle, our average gathered volume for the fourth quarter of 2017 was approximately 68.5 MMcf per day and our total production of natural gas liquids increased to 188,600 gallons per day. During 2017, we connected six new wells to this processing system with several more wells scheduled to be connected in the first part of 2018. We have completed construction of the pipeline to connect the next well pad and we are upgrading our compression facilities to handles the expected additional volume.
At our Bellmon processing facility in the Mississippian play in north central Oklahoma, during 2017 we connected 14 new wells to this system. Our total throughput volume for the fourth quarter of 2017 averaged approximately 27 MMcf per day. We have two processing skids available that provide total processing capacity of 90 MMcf per day.
At our Segno gathering facility in Southeast Texas, our average gathered volume for the fourth quarter of 2017 was approximately 86.4 MMcf per day. The gathering and dehydration capacity for this facility is approximately 120 MMcf per day. During 2017, we connected three new wells to this gathering system along with additional volume from recompletion activity in the area around our system.
In the Appalachian region, at our Pittsburgh Mills gathering system, we continue to connect new well pads to this system. During 2017, we connected one new well pad with five new wells to this gathering system. By adding these new wells our average gathered volume for the fourth quarter was approximately 117.2 MMcf per day. We are constructing a new pipeline to connect the next well pad to this system. Most of the preliminary environmental and permitting activities have been completed and right of way has been obtained. In the first quarter of 2018, we will start the construction of the pipeline with an expected completion date in the third quarter of 2018. This new well pad is expected to have seven wells drilled and we anticipate receiving gas from this pad at the end of 2018. This well pad is on the south end of our system and will be connected to our Kissick compressor station. And we have been notified by the producer they will drill seven infill wells on already existing pads in 2018.
During
2017
, our mid-stream segment incurred
$22.2 million
in capital expenditures as compared to
$16.8 million
in
2016
, and
$63.5 million
, in
2015
. For
2018
, our estimated capital expenditures is approximately
$32.0 million
.
61
Contractual Commitments
At
December 31, 2017
, we had these contractual obligations:
|
Payments Due by Period
|
|||||||||||||||||||
|
Total
|
Less Than
1 Year
|
2-3
Years
|
4-5
Years
|
After
5 Years
|
|||||||||||||||
|
(In thousands)
|
|||||||||||||||||||
|
Long-term debt
(1)
|
$
|
986,931
|
|
$
|
49,133
|
|
$
|
271,871
|
|
$
|
665,927
|
|
$
|
—
|
|
||||
|
Operating leases
(2)
|
3,878
|
|
2,717
|
|
1,024
|
|
137
|
|
—
|
|
|||||||||
|
Capital lease interest and maintenance
(3)
|
7,048
|
|
2,324
|
|
4,172
|
|
552
|
|
—
|
|
|||||||||
|
Drill pipe, drilling components, and equipment purchases
(4)
|
3,887
|
|
3,887
|
|
—
|
|
—
|
|
—
|
|
|||||||||
|
Total contractual obligations
|
$
|
1,001,744
|
|
$
|
58,061
|
|
$
|
277,067
|
|
$
|
666,616
|
|
$
|
—
|
|
||||
_________________________
|
(1)
|
See previous discussion in MD&A regarding our long-term debt. This obligation is presented under the Notes and credit agreement and includes interest calculated using our
December 31, 2017
interest rates of
6.625%
for the Notes and
3.4%
for the credit agreement.
|
|
(2)
|
We lease office space or yards in Edmond and Oklahoma City, Oklahoma; Houston, Texas; Englewood, Colorado; Pinedale, Wyoming; and Canonsburg, Pennsylvania under the terms of operating leases expiring through December 2021. And, we have several equipment leases and lease space on short-term commitments to stack excess drilling rig equipment and production inventory.
|
|
(3)
|
Maintenance and interest payments are included in our capital lease agreements. The capital leases are discounted using annual rates of 4.0%. Total maintenance and interest remaining are
$5.9 million
and
$1.2 million
, respectively.
|
|
(4)
|
We have committed to purchase approximately $3.9 million of new drilling rig components over the next year.
|
62
At
December 31, 2017
, we also had these commitments and contingencies that could create, increase or accelerate our liabilities:
|
Estimated Amount of Commitment Expiration Per Period
|
|||||||||||||||||||
|
Other Commitments
|
Total
Accrued
|
Less
Than 1
Year
|
2-3
Years
|
4-5
Years
|
After 5
Years
|
||||||||||||||
|
(In thousands)
|
|||||||||||||||||||
|
Deferred compensation plan
(1)
|
$
|
5,390
|
|
Unknown
|
|
Unknown
|
|
Unknown
|
|
Unknown
|
|
||||||||
|
Separation benefit plans
(2)
|
$
|
6,524
|
|
$
|
657
|
|
Unknown
|
|
Unknown
|
|
Unknown
|
|
|||||||
|
ARO liability
(3)
|
$
|
69,444
|
|
$
|
1,726
|
|
$
|
42,409
|
|
$
|
3,908
|
|
$
|
21,401
|
|
||||
|
Gas balancing liability
(4)
|
$
|
3,283
|
|
Unknown
|
|
Unknown
|
|
Unknown
|
|
Unknown
|
|
||||||||
|
Repurchase obligations
(5)
|
$
|
—
|
|
Unknown
|
|
Unknown
|
|
Unknown
|
|
Unknown
|
|
||||||||
|
Workers’ compensation liability
(6)
|
$
|
13,340
|
|
$
|
6,775
|
|
$
|
1,712
|
|
$
|
917
|
|
$
|
3,936
|
|
||||
|
Capital lease obligations
(7)
|
$
|
15,224
|
|
$
|
3,844
|
|
$
|
8,164
|
|
$
|
3,216
|
|
$
|
—
|
|
||||
|
Derivative liabilities—commodity hedges
|
$
|
7,763
|
|
$
|
7,763
|
|
$
|
—
|
|
$
|
—
|
|
$
|
—
|
|
||||
_________________________
|
(1)
|
We provide a salary deferral plan which allows participants to defer the recognition of salary for income tax purposes until actual distribution of benefits, which occurs at either termination of employment, death or certain defined unforeseeable emergency hardships. We recognize payroll expense and record a liability, included in other long-term liabilities in our Consolidated Balance Sheets, at the time of deferral.
|
|
(2)
|
Effective January 1, 1997, we adopted a separation benefit plan (Separation Plan). The Separation Plan allows eligible employees whose employment with us is involuntarily terminated or with an employee who has completed 20 years of service, voluntarily or involuntarily terminated, to receive benefits equivalent to four weeks salary for every whole year of service completed with the company up to a maximum of 104 weeks. To receive payments the recipient must waive certain claims against us in exchange for receiving the separation benefits. On October 28, 1997, we adopted a Separation Benefit Plan for Senior Management (Senior Plan). The Senior Plan provides certain officers and key executives of the company with benefits generally equivalent to the Separation Plan. The Compensation Committee of the Board of Directors has absolute discretion in the selection of the individuals covered in this plan. On May 5, 2004 we also adopted the Special Separation Benefit Plan (Special Plan). This plan is identical to the Separation Benefit Plan with the exception that the benefits under the plan vest on the earliest of a participant’s reaching the age of 65 or serving 20 years with the company.
|
|
(3)
|
When a well is drilled or acquired, under ASC 410 “Accounting for Asset Retirement Obligations,” we record the fair value of liabilities associated with the retirement of long-lived assets (mainly plugging and abandonment costs for our depleted wells).
|
|
(4)
|
We have recorded a liability for those properties we believe do not have sufficient oil, NGLs, and natural gas reserves to allow the under-produced owners to recover their under-production from future production volumes.
|
|
(5)
|
We formed The Unit 1984 Oil and Gas Limited Partnership and the 1986 Energy Income Limited Partnership along with private limited partnerships (the Partnerships) with certain qualified employees, officers and directors from 1984 through 2011. One of our subsidiaries serves as the general partner of each of these programs. Effective December 31, 2014, the 1984 partnership was dissolved and effective December 31, 2016, the two 1986 partnerships were also dissolved. The Partnerships were formed to conduct oil and natural gas acquisition, drilling and development operations and serving as co-general partner with us in any additional limited partnerships formed during that year. The Partnerships participated on a proportionate basis with us in most drilling operations and most producing property acquisitions commenced by us for our own account during the period from the formation of the Partnership through December 31 of that year. These partnership agreements require, on the election of a limited partner, that we repurchase the limited partner’s interest at amounts to be determined by appraisal in the future. Repurchases in any one year are limited to 20% of the units outstanding. We made repurchases of approximately
$2,900
, $5,000, and $118,000 in 2017, 2016, and 2015, respectively.
|
|
(6)
|
We have recorded a liability for future estimated payments related to workers’ compensation claims primarily associated with our contract drilling segment.
|
|
(7)
|
This amount includes commitments under capital lease arrangements for compressors in our mid-stream segment.
|
Derivative Activities
Periodically we enter into derivative transactions locking in the prices to be received for a portion of our oil, NGLs, and natural gas production. Any change in the fair value of all our derivatives are reflected in the statement of operations.
63
Commodity Derivatives
. Our commodity derivatives should reduce our exposure to price volatility and manage price risks. Our decision on the type and quantity of our production and the price(s) of our derivative(s) is based, in part, on our view of current and future market conditions. As of
December 31, 2017
, based on our fourth quarter
2017
average daily production, the approximated percentages of our production under derivative contracts are as follows:
|
Mark-to-Market
|
|||||||||||
|
2018
|
|||||||||||
|
Q1
|
Q2
|
Q3
|
Q4
|
||||||||
|
Daily oil production
|
70
|
%
|
63
|
%
|
63
|
%
|
63
|
%
|
|||
|
Daily natural gas production
|
53
|
%
|
33
|
%
|
33
|
%
|
29
|
%
|
|||
|
Daily NGLs production
|
—
|
%
|
7
|
%
|
7
|
%
|
—
|
%
|
|||
Regarding the commodities subject to derivative contracts, those contracts limit the risk of adverse downward price movements. However, they also limit increases in future revenues that would otherwise result from price movements above the contracted prices.
Using derivative transactions has the risk that the counterparties may not meet their financial obligations under the transactions. Based on our evaluation at
December 31, 2017
, we believe the risk of non-performance by our counterparties is not material. At
December 31, 2017
, the fair values of the net assets (liabilities) we had with each of the counterparties to our commodity derivative transactions are:
|
|
December 31, 2017
|
||
|
|
(In millions)
|
||
|
Canadian Imperial Bank of Commerce
|
$
|
0.7
|
|
|
Bank of America Merrill Lynch
|
(2.5
|
)
|
|
|
Bank of Montreal
|
(5.3
|
)
|
|
|
Total assets (liabilities)
|
$
|
(7.1
|
)
|
If a legal right of set-off exists, we net the value of the derivative arrangements we have with the same counterparty in our Consolidated Balance Sheets. At
December 31, 2017
, we recorded the fair value of our commodity derivatives on our balance sheet as current derivative assets of
$0.7 million
and current derivative liabilities of
$7.8 million
. At December 31, 2016, we recorded the fair value of our commodity derivatives on our balance sheet as non-current derivative assets of $0.4 million and current and non-current derivative liabilities of $21.6 million and $0.4 million, respectively.
All derivatives are recognized on the balance sheet and measured at fair value. Any changes in our derivatives' fair value before their maturity (i.e., temporary fluctuations in value) are reported in gain (loss) on derivatives in our Consolidated Statements of Operations.
These gains (losses) are as follows at December 31:
|
2017
|
2016
|
2015
|
|||||||||
|
|
(In thousands)
|
||||||||||
|
Gain (loss) on derivatives, included are amounts settled during the period of $173, $9,658, and $46,615, respectively
|
$
|
14,732
|
|
$
|
(22,813
|
)
|
$
|
26,345
|
|
||
Stock and Incentive Compensation
During
2017
, we granted awards covering
708,276
shares of restricted stock. These awards were granted as retention incentive awards. These stock awards had an estimated fair value as of the grant date of
$17.4 million
. Compensation expense will be recognized over the awards' three year vesting period. During
2017
, we recognized
$7.0 million
in additional compensation expense and capitalized
$1.1 million
for these awards. During
2016
, we granted awards covering
736,451
shares of restricted stock. These awards were granted as retention incentive awards and are being recognized over the awards' three year vesting period. During
2015
, we granted awards covering
750,290
shares of restricted stock. These awards were granted as retention incentive awards and are being recognized over their two and three year vesting periods.
No
SAR awards were made during
2017
,
2016
, or
2015
.
64
During
2017
, we recognized compensation expense of
$13.3 million
for our restricted stock grants and capitalized
$1.8 million
of compensation cost for oil and natural gas properties.
Insurance
We are self-insured for certain losses relating to workers’ compensation, general liability, control of well, and employee medical benefits. Insured policies for other coverage contain deductibles or retentions per occurrence that range from zero to $1.0 million. We have purchased stop-loss coverage to limit, to the extent feasible, per occurrence and aggregate exposure to certain types of claims. There is no assurance that the insurance coverage we have will protect us against liability from all potential consequences. If insurance coverage becomes more expensive, we may choose to self-insure, decrease our limits, raise our deductibles, or any combination of these rather than pay higher premiums.
Oil and Natural Gas Limited Partnerships and Other Entity Relationships.
We are the general partner of
13
oil and natural gas partnerships formed privately or publicly. Each partnership’s revenues and costs are shared under formulas set out in that partnership’s agreement. The partnerships repay us for contract drilling, well supervision and general and administrative expense. Related party transactions for contract drilling and well supervision fees are the related party’s share of such costs. These costs are billed the same as billings to unrelated third parties for similar services. General and administrative reimbursements consist of direct general and administrative expense incurred on the related party’s behalf and indirect expenses assigned to the related parties. Allocations are based on the related party’s level of activity and are considered by us to be reasonable. During
2017
,
2016
, and
2015
, the total we received for these fees was
$0.2 million
,
$0.3 million
, and
$0.4 million
, respectively. Our proportionate share of assets, liabilities, and net income relating to the oil and natural gas partnerships is included in our consolidated financial statements.
Effects of Inflation
The effect of inflation in the oil and natural gas industry is primarily driven by the prices for oil, NGLs, and natural gas. Increases in these prices increase the demand for our contract drilling rigs and services. This increase in demand affects the dayrates we can obtain for our contract drilling services. During periods of higher demand for our drilling rigs we have experienced increases in labor costs and the costs of services to support our drilling rigs. Historically, during this same period, when oil, NGLs, and natural gas prices declined, labor rates did not come back down to the levels existing before the increases. If commodity prices increase substantially for a long period, shortages in support equipment (like drill pipe, third party services, and qualified labor) can cause additional increases in our material and labor costs. Increases in dayrates for drilling rigs also increase the cost of our oil and natural gas properties. Commodity prices also can affect our fracking and completion costs. How inflation will affect us in the future will depend on increases, if any, realized in our drilling rig rates, the prices we receive for our oil, NGLs, and natural gas, and the rates we receive for gathering and processing natural gas. Due to increased demand for drilling rigs and the need to maintain qualified labor, we increased pay for some of our drilling personnel in the fourth quarter of 2017 and again in the first quarter of 2018.
Off-Balance Sheet Arrangements
We do not currently utilize any off-balance sheet arrangements with unconsolidated entities to enhance liquidity and capital resource positions, or for any other purpose. However, as is customary in the oil and gas industry, we are subject to various contractual commitments.
65
Results of Operations
2017
versus
2016
|
2017
|
2016
|
Percent
Change
(1)
|
||||||||
|
(In thousands unless otherwise specified)
|
||||||||||
|
Total operating revenue
|
$
|
739,640
|
|
$
|
602,177
|
|
23
|
%
|
||
|
Net income (loss)
|
$
|
117,848
|
|
$
|
(135,624
|
)
|
187
|
%
|
||
|
Oil and Natural Gas:
|
||||||||||
|
Revenue
|
$
|
357,744
|
|
$
|
294,221
|
|
22
|
%
|
||
|
Operating costs excluding depreciation, depletion, amortization, and impairment
|
$
|
130,789
|
|
$
|
120,184
|
|
9
|
%
|
||
|
Depreciation, depletion, and amortization
|
$
|
101,911
|
|
$
|
113,811
|
|
(10
|
)%
|
||
|
Impairment of oil and gas properties
|
$
|
—
|
|
$
|
161,563
|
|
(100
|
)%
|
||
|
Average oil price received (Bbl)
|
$
|
49.44
|
|
$
|
40.50
|
|
22
|
%
|
||
|
Average NGL price received (Bbl)
|
$
|
18.35
|
|
$
|
11.26
|
|
63
|
%
|
||
|
Average natural gas price received (Mcf)
|
$
|
2.46
|
|
$
|
2.07
|
|
19
|
%
|
||
|
Oil production (MBbls)
|
2,715
|
|
2,974
|
|
(9
|
)%
|
||||
|
NGLs production (MBbls)
|
4,737
|
|
5,014
|
|
(6
|
)%
|
||||
|
Natural gas production (MMcf)
|
51,260
|
|
55,735
|
|
(8
|
)%
|
||||
|
Depreciation, depletion, and amortization rate (Boe)
|
$
|
6.00
|
|
$
|
6.24
|
|
(4
|
)%
|
||
|
Contract Drilling:
|
||||||||||
|
Revenue
|
$
|
174,720
|
|
$
|
122,086
|
|
43
|
%
|
||
|
Operating costs excluding depreciation
|
$
|
122,600
|
|
$
|
88,154
|
|
39
|
%
|
||
|
Depreciation
|
$
|
56,370
|
|
$
|
46,992
|
|
20
|
%
|
||
|
Percentage of revenue from daywork contracts
|
100
|
%
|
100
|
%
|
—
|
%
|
||||
|
Average number of drilling rigs in use
|
30.0
|
|
17.4
|
|
72
|
%
|
||||
|
Average dayrate on daywork contracts
|
$
|
16,256
|
|
$
|
17,784
|
|
(9
|
)%
|
||
|
Mid-Stream:
|
||||||||||
|
Revenue
|
$
|
207,176
|
|
$
|
185,870
|
|
11
|
%
|
||
|
Operating costs excluding depreciation and amortization
|
$
|
155,483
|
|
$
|
137,609
|
|
13
|
%
|
||
|
Depreciation and amortization
|
$
|
43,499
|
|
$
|
45,715
|
|
(5
|
)%
|
||
|
Gas gathered—Mcf/day
|
385,209
|
|
419,217
|
|
(8
|
)%
|
||||
|
Gas processed—Mcf/day
|
137,625
|
|
155,461
|
|
(11
|
)%
|
||||
|
Gas liquids sold—gallons/day
|
534,140
|
|
536,494
|
|
—
|
%
|
||||
|
Corporate and other:
|
||||||||||
|
General and administrative expense
|
$
|
38,087
|
|
$
|
33,337
|
|
14
|
%
|
||
|
Other depreciation
|
$
|
7,477
|
|
$
|
1,835
|
|
NM
|
|
||
|
Gain on disposition of assets
|
$
|
327
|
|
$
|
2,540
|
|
(87
|
)%
|
||
|
Other income (expense):
|
||||||||||
|
Interest expense, net
|
$
|
(38,334
|
)
|
$
|
(39,829
|
)
|
(4
|
)%
|
||
|
Gain (loss) on derivatives
|
$
|
14,732
|
|
$
|
(22,813
|
)
|
165
|
%
|
||
|
Other
|
$
|
21
|
|
$
|
307
|
|
(93
|
)%
|
||
|
Income tax benefit
|
$
|
(57,678
|
)
|
$
|
(71,194
|
)
|
19
|
%
|
||
|
Average interest rate
|
6.0
|
%
|
5.7
|
%
|
5
|
%
|
||||
|
Average long-term debt outstanding
|
$
|
810,734
|
|
$
|
868,332
|
|
(7
|
)%
|
||
|
(1)
|
NM – A percentage calculation is not meaningful due to a zero-value denominator or a percentage change greater than 200.
|
66
Oil and Natural Gas
Oil and natural gas revenues
increase
d
$63.5 million
or
22%
in
2017
as compared to
2016
due primarily to higher commodity prices partially offset by a decrease in production. Oil production
decrease
d
9%
, NGLs production
decrease
d
6%
, and natural gas production
decrease
d
8%
. Average oil prices between the comparative years
increase
d
22%
to
$49.44
per barrel, NGLs prices
increase
d
63%
to
$18.35
per barrel, and natural gas prices increased
19%
to
$2.46
per Mcf.
Oil and natural gas operating costs
increase
d
$10.6 million
or
9%
between the comparative years of
2017
and
2016
primarily due to higher LOE and gross production taxes partially offset by lower saltwater disposal expense.
DD&A
decrease
d
$11.9 million
or
10%
primarily due to a
4%
decrease in our DD&A rate and by the effect of a 7% decrease in equivalent production. The decrease in our DD&A rate in 2017 compared to 2016 resulted primarily from the effect of the ceiling test write-downs throughout 2016. Our DD&A expense on our oil and natural properties is calculated each quarter using period end reserve quantities adjusted for period production.
During 2016, we recorded non-cash ceiling test write-downs of our oil and natural gas properties totaling
$161.6 million
pre-tax (
$100.6 million
net of tax). We did not have a non-cash ceiling test write-down in 2017. The write-downs were due primarily from the reduction of the 12-month average commodity prices during 2016.
Contract Drilling
Drilling revenues
increase
d
$52.6 million
or
43%
in
2017
as compared to
2016
. The
increase
was due primarily to a 72% increase in the average number of drilling rigs in use partially offset by a 9% decrease in the average dayrate compared to 2016. Average drilling rig utilization increased from
17.4
drilling rigs in
2016
to
30.0
drilling rigs in
2017
.
Drilling operating costs
increase
d
$34.4 million
or
39%
in
2017
compared to
2016
. The increase was due primarily to more drilling rigs operating. Contract drilling depreciation
increase
d
$9.4 million
or
20%
also due primarily to more drilling rigs operating.
Mid-Stream
Our mid-stream revenues
increase
d
$21.3 million
or
11%
in
2017
as compared to
2016
primarily due to increased NGLs and condensate sales. Gas processing volumes per day
decrease
d
11%
between the comparative years primarily due to fewer new well connections to our processing systems. Gas gathering volumes per day
decrease
d
8%
primarily due to declining volumes in the Appalachian region.
Operating costs
increase
d
$17.9 million
or
13%
in
2017
compared to
2016
primarily due to increased natural gas, NGLs, and condensate prices. Depreciation and amortization
decrease
d
$2.2 million
or
5%
primarily due to less capital expenditures this year while older assets became fully depreciated.
General and Administrative
General and administrative expenses
increase
d
$4.8 million
or
14%
in
2017
compared to
2016
primarily due to higher employee costs.
Other Depreciation
Other depreciation
increase
d
$5.6 million
in 2017 compared to 2016 primarily due to the depreciation on the new ERP system and the corporate office facility.
Gain on Disposition of Assets
Gain on disposition of assets decreased $2.2 million in 2017 compared to 2016. The gain in 2017 was primarily for the sale of a corporate aircraft and vehicles, while the pre-tax gain of $3.2 million in 2016 was primarily for the sale of one drilling rig, various drilling rig components, vehicles, and other equipment somewhat offset by losses from our oil and natural gas and mid-stream segments in 2016.
67
Other Income (Expense)
Interest expense, net of capitalized interest,
decrease
d
$1.5 million
between the comparative years of
2017
and
2016
. We capitalized interest based on the net book value associated with unproved properties not being amortized, the construction of additional drilling rigs, and the construction of gas gathering systems. Capitalized interest for 2017 was $15.9 million compared to $15.3 million in 2016, and was netted against our gross interest of $54.2 million and $55.1 million for 2017 and 2016, respectively. Our average interest rate
increase
d from
5.7%
to
6.0%
and our average debt outstanding was
$57.6 million
lower
in
2017
as compared to
2016
primarily due to the decrease in our outstanding borrowings under our credit agreement over the comparative periods.
Gain (loss) on derivatives increased from a loss of $22.8 million in 2016 to a gain of $14.7 million in 2017 primarily due to fluctuations in forward prices used to estimate the fair value in mark-to-market accounting.
Income Tax Benefit
Income tax benefit decreased
$13.5 million
in
2017
compared to
2016
primarily. During the fourth quarter of 2017, the U.S. government enacted the Tax Cuts and Jobs Act (the Tax Act). Among other provisions, the Tax Act reduces the federal corporate tax rate from the existing maximum rate of 35% to 21%, effective January 1, 2018. As a result of the Tax Act, the Company recorded a tax benefit of $81.3 million due to a revaluation of our net deferred tax liability. Without this income tax benefit charge, income tax expense would have been $23.6 million in 2017 compared to an income tax benefit of $71.2 million in 2016 or an increase of $94.8 million which is commensurate with the increase in pre-tax income for 2017 compared to 2016.
Our effective tax rate was (95.9%) for 2017 compared to 34.4% for 2016. The effective tax rate for the current year was dramatically lower due to the Tax Act and revaluation of our net deferred tax liability. Without the $81.3 million income tax benefit, our effective tax rate for 2017 would have been 39.3% The rate change without consideration of deferred tax liability revaluation was primarily due to increased deferred income tax expense related to our restricted stock vestings in both years whereby the increase in 2017 increased our deferred income tax expense and the increase in 2016 decreased our income tax benefit. We did not pay any income taxes during 2017.
68
2016
versus
2015
|
2016
|
2015
|
Percent
Change
(1)
|
||||||||
|
(In thousands unless otherwise specified)
|
||||||||||
|
Total operating revenue
|
$
|
602,177
|
|
$
|
854,231
|
|
(30
|
)%
|
||
|
Net loss
|
$
|
(135,624
|
)
|
$
|
(1,037,361
|
)
|
87
|
%
|
||
|
Oil and Natural Gas:
|
||||||||||
|
Revenue
|
$
|
294,221
|
|
$
|
385,774
|
|
(24
|
)%
|
||
|
Operating costs excluding depreciation, depletion, amortization, and impairment
|
$
|
120,184
|
|
$
|
166,046
|
|
(28
|
)%
|
||
|
Depreciation, depletion, and amortization
|
$
|
113,811
|
|
$
|
251,944
|
|
(55
|
)%
|
||
|
Impairment of oil and natural gas properties
|
$
|
161,563
|
|
$
|
1,599,348
|
|
(90
|
)%
|
||
|
Average oil price received (Bbl)
|
$
|
40.50
|
|
$
|
50.79
|
|
(20
|
)%
|
||
|
Average NGLs price received (Bbl)
|
$
|
11.26
|
|
$
|
10.12
|
|
11
|
%
|
||
|
Average natural gas price received (Mcf)
|
$
|
2.07
|
|
$
|
2.63
|
|
(21
|
)%
|
||
|
Oil production (MBbls)
|
2,974
|
|
3,783
|
|
(21
|
)%
|
||||
|
NGLs production (MBbls)
|
5,014
|
|
5,274
|
|
(5
|
)%
|
||||
|
Natural gas production (MMcf)
|
55,735
|
|
65,546
|
|
(15
|
)%
|
||||
|
Depreciation, depletion, and amortization rate (Boe)
|
$
|
6.24
|
|
$
|
12.30
|
|
(49
|
)%
|
||
|
Contract Drilling:
|
||||||||||
|
Revenue
|
$
|
122,086
|
|
$
|
265,668
|
|
(54
|
)%
|
||
|
Operating costs excluding depreciation and impairment
|
$
|
88,154
|
|
$
|
156,408
|
|
(44
|
)%
|
||
|
Depreciation
|
$
|
46,992
|
|
$
|
56,135
|
|
(16
|
)%
|
||
|
Impairment of contract drilling equipment
|
$
|
—
|
|
$
|
8,314
|
|
(100
|
)%
|
||
|
Percentage of revenue from daywork contracts
|
100
|
%
|
100
|
%
|
—
|
%
|
||||
|
Average number of drilling rigs in use
|
17.4
|
|
34.7
|
|
(50
|
)%
|
||||
|
Average dayrate on daywork contracts
|
$
|
17,784
|
|
$
|
19,455
|
|
(9
|
)%
|
||
|
Mid-Stream:
|
||||||||||
|
Revenue
|
$
|
185,870
|
|
$
|
202,789
|
|
(8
|
)%
|
||
|
Operating costs excluding depreciation, amortization, and impairment
|
$
|
137,609
|
|
$
|
161,556
|
|
(15
|
)%
|
||
|
Depreciation and amortization
|
$
|
45,715
|
|
$
|
43,676
|
|
5
|
%
|
||
|
Impairment of gas gathering and processing systems
|
$
|
—
|
|
$
|
26,966
|
|
(100
|
)%
|
||
|
Gas gathered—Mcf/day
|
419,217
|
|
353,771
|
|
18
|
%
|
||||
|
Gas processed—Mcf/day
|
155,461
|
|
182,684
|
|
(15
|
)%
|
||||
|
Gas liquids sold—gallons/day
|
536,494
|
|
577,513
|
|
(7
|
)%
|
||||
|
Corporate and other:
|
||||||||||
|
General and administrative expense
|
$
|
33,337
|
|
$
|
34,358
|
|
(3
|
)%
|
||
|
Other depreciation
|
$
|
1,835
|
|
$
|
987
|
|
86
|
%
|
||
|
Gain (loss) on disposition of assets
|
$
|
2,540
|
|
$
|
(7,229
|
)
|
135
|
%
|
||
|
Other income (expense):
|
||||||||||
|
Interest expense, net
|
$
|
(39,829
|
)
|
$
|
(31,963
|
)
|
25
|
%
|
||
|
Gain (loss) on derivatives
|
$
|
(22,813
|
)
|
$
|
26,345
|
|
(187
|
)%
|
||
|
Other
|
$
|
307
|
|
$
|
45
|
|
NM
|
|
||
|
Income tax benefit
|
$
|
(71,194
|
)
|
$
|
(626,948
|
)
|
89
|
%
|
||
|
Average interest rate
|
5.7
|
%
|
5.4
|
%
|
6
|
%
|
||||
|
Average long-term debt outstanding
|
$
|
868,332
|
|
$
|
897,391
|
|
(3
|
)%
|
||
_________________________
|
(1)
|
NM – A percentage calculation is not meaningful due to a zero-value denominator or a percentage change greater than 200.
|
69
Oil and Natural Gas
Oil and natural gas revenues decreased $91.6 million or 24% in 2016 as compared to 2015 due primarily to lower oil and natural gas prices and a decrease in production. Oil production decreased 21%, NGLs production decreased 5%, and natural gas production decreased 15%. Average oil prices between the comparative years decreased 20% to $40.50 per barrel, NGLs prices increased 11% to $11.26 per barrel, and natural gas prices decreased 21% to $2.07 per Mcf.
Oil and natural gas operating costs decreased $45.9 million or 28% between the comparative years of 2016 and 2015 due to lower LOE, saltwater disposal, and general and administrative expense.
DD&A decreased $138.1 million or 55% primarily due to a 49% decrease in our DD&A rate and by the effect of a 14% decrease in equivalent production. The decrease in our DD&A rate in 2016 compared to 2015 resulted primarily from the effect of the ceiling test write-downs during 2015 and 2016. Our DD&A expense on our oil and natural properties is calculated each quarter using period end reserve quantities adjusted for period production.
During 2016, we recorded non-cash ceiling test write-downs of our oil and natural gas properties totaling $161.6 million pre-tax ($100.6 million, net of tax) compared to a non-cash ceiling test write-down of our oil and natural gas properties of $1.6 billion pre-tax ($1.0 billion net of tax) in 2015. These write-downs were due primarily from the reduction of the 12-month average commodity prices during each year.
Contract Drilling
Drilling revenues decreased $143.6 million or 54% in 2016 as compared to 2015. The decrease was due primarily to a 50% decrease in the average number of drilling rigs in use, a 9% decrease in the average dayrate, and $25.9 million less received for fees on contracts terminated early in 2016 compared to 2015. Average drilling rig utilization decreased from 34.7 drilling rigs in 2015 to 17.4 drilling rigs in 2016.
Drilling operating costs decreased $68.3 million or 44% in 2016 compared to 2015. The decrease was due primarily to fewer drilling rigs operating. Contract drilling depreciation decreased $9.1 million or 16% also due primarily to fewer drilling rigs operating. During the second quarter of 2015, we recorded an impairment of approximately $8.3 million on 31 drilling rigs and other equipment sold at auction during the third quarter.
Mid-Stream
Our mid-stream revenues decreased $16.9 million or 8% in 2016 as compared to 2015 due primarily to gas sold per day decreasing 16% and NGLs sold per day decreasing 7%. Gas processing volumes per day decreased 15% between the comparative years primarily from fewer well connections near our processing systems. Gas gathering volumes per day increased 18% primarily from new well connections in the Appalachian region.
Operating costs decreased $23.9 million or 15% in 2016 compared to 2015 primarily due to a 6% decrease in prices paid for natural gas purchased and a 15% decrease in purchase volumes. Depreciation and amortization increased $2.0 million or 5% primarily due to capital expenditures for upgrades and well connects.
In December 2015, our mid-stream segment had a $27.0 million pre-tax write-down of three of its systems, Bruceton Mills, Midwell, and Spring Creek due to anticipated future cash flow and future development around these systems not being sufficient to support their carrying value. The estimated future cash flows were less than the carrying value on these systems.
Due to continued depressed NGLs prices, we were operating most of our processing facilities in full ethane rejection mode which reduced the liquids sold throughout 2016. Our mid-stream segment also experienced a reduction in processed volumes in 2016 due to the low pricing environment and reduced drilling activity around our systems.
General and Administrative
General and administrative expenses decreased $1.0 million or 3% in 2016 compared to 2015 primarily due to lower employee costs.
70
Other Depreciation
Other depreciation increased $0.8 million or 86% in 2016 compared to 2015 primarily due to the depreciation on the corporate office facility.
Gain (loss) on Disposition of Assets
Gain (loss) on disposition of assets increased $9.8 million in 2016 compared to 2015 primarily due to the gain of $3.2 million pre-tax on the sale of one drilling rig, various drilling rig components, vehicles, and other equipment somewhat offset by losses from our oil and natural gas and mid-stream segments, compared to a loss of $7.3 million pre-tax on the sale of 31 drilling rigs and other drilling equipment somewhat offset by the gains on the sale of one gathering system, various drilling rig components, vehicles, and a drilling rig during 2015.
Other Income (Expense)
Interest expense, net of capitalized interest, increased $7.9 million between the comparative years of 2016 and 2015. We capitalized interest based on the net book value associated with unproved properties not being amortized, the construction of additional drilling rigs, and the construction of gas gathering systems. Capitalized interest for 2016 was $15.3 million compared to $21.7 million in 2015, and was netted against our gross interest of $55.1 million and $53.7 million for 2016 and 2015, respectively. Our average interest rate increased from 5.4% to 5.7% and our average debt outstanding was $29.1 million lower in 2016 as compared to 2015 primarily due to the decrease in our outstanding borrowings under our credit agreement over the comparative periods.
Gain (loss) on derivatives decreased from a gain of $26.3 million in 2015 to a loss of $22.8 million in 2016 primarily due to fluctuations in forward prices used to estimate the fair value in mark-to-market accounting.
Income Tax Benefit
Income tax benefit decreased $555.8 million in 2016 compared to 2015 primarily due to a lower pre-tax loss from a reduction in non-cash ceiling test write-downs in 2016 compared to 2015. Our effective tax rate was 34.4% for 2016 and 37.7% for 2015. This decrease was primarily due to increased deferred tax expense in 2016 related to our restricted stock vestings in 2016 after the exhaustion of our remaining accumulated excess tax benefits. The current income tax benefit was minimal in 2016 compared to a current income tax benefit of $20.6 million for 2015. The $20.6 million current income tax benefit in 2015 was primarily due to an anticipated alternative minimum tax (AMT) net operating loss (NOL) carryback refund claim. We paid $42,000 in income taxes during 2016.
Our operations are exposed to market risks primarily because of changes in the prices for natural gas and oil and interest rates.
Commodity Price Risk.
Our major market risk exposure is in the prices we receive for our oil, NGLs, and natural gas production. Those prices are primarily driven by the prevailing worldwide price for crude oil and market prices applicable to our natural gas production. Historically, these prices have fluctuated and they will probably continue to do so. The price of oil, NGLs, and natural gas also affects both the demand for our drilling rigs and the amount we can charge for our drilling rigs. Based on our
2017
production, a $0.10 per Mcf change in what we are paid for our natural gas production would cause a corresponding
$410,000
per month (
$4.9 million
annualized) change in our pre-tax cash flow. A $1.00 per barrel change in our oil price would have a
$217,000
per month (
$2.6 million
annualized) change in our pre-tax operating cash flow and a $1.00 per barrel change in our NGLs prices would have a
$380,000
per month (
$4.6 million
annualized) change in our pre-tax cash flow.
We use derivative transactions to manage the risk associated with price volatility. Our decision on the type and quantity of our production and the price(s) of our derivative(s) is based, in part, on our view of current and future market conditions. The transactions we use include financial price swaps under which we will receive a fixed price for our production and pay a variable market price to the contract counterparty. We do not hold or issue derivative instruments for speculative trading purposes.
71
At
December 31, 2017
, these non-designated hedges were outstanding:
|
Term
|
Commodity
|
Contracted Volume
|
Weighted Average
Fixed Price for Swaps
|
Contracted Market
|
||||
|
Jan’18 – Dec’18
|
Natural gas – swap
|
20,000 MMBtu/day
|
$3.013
|
IF – NYMEX (HH)
|
||||
|
Apr'18 – Oct'18
|
Natural gas – swap
|
10,000 MMBtu/day
|
$2.990
|
IF – NYMEX (HH)
|
||||
|
Jan’18 – Mar'18
|
Natural gas – basis swap
|
10,000 MMBtu/day
|
$(0.208)
|
IF – NYMEX (HH)
|
||||
|
Nov’18 – Dec'18
|
Natural gas – basis swap
|
10,000 MMBtu/day
|
$(0.208)
|
IF – NYMEX (HH)
|
||||
|
Jan’18 – Mar'18
|
Natural gas – three-way collar
|
60,000 MMBtu/day
|
$3.29 - $2.63 - $4.07
|
IF – NYMEX (HH)
|
||||
|
Apr’18 – Dec'18
|
Natural gas – three-way collar
|
20,000 MMBtu/day
|
$3.00 - $2.50 - $3.51
|
IF – NYMEX (HH)
|
||||
|
Jan’18 – Dec'18
|
Crude oil – swap
|
3,000 Bbl/day
|
$51.36
|
WTI – NYMEX
|
||||
|
Jan’18 – Mar'18
|
Crude oil – collar
|
500 Bbl/day
|
$55.00 - $59.50
|
WTI – NYMEX
|
||||
|
Jan’18 – Dec'18
|
Crude oil – three-way collar
|
2,000 Bbl/day
|
$47.50 - $37.50 - $56.08
|
WTI – NYMEX
|
||||
|
Apr’18 – Sep'18
|
Liquids (Propane) – swap
|
1,000 Bbl/day
|
$31.16
|
MONT BELVIEU
|
||||
After
December 31, 2017
, these non-designated hedges were entered into:
|
Term
|
Commodity
|
Contracted Volume
|
Weighted Average
Fixed Price for Swaps |
Contracted Market
|
||||
|
Apr’18 – Sep'18
|
Natural gas – swap
|
10,000 MMBtu/day
|
$2.925
|
IF – NYMEX (HH)
|
||||
|
Apr’18 – Sep'18
|
Natural gas – collar
|
30,000 MMBtu/day
|
$2.67 - $2.97
|
IF – NYMEX (HH)
|
||||
|
Feb’18 – Dec'18
|
Natural gas – basis swap
|
10,000 MMBtu/day
|
$(0.678)
|
PEPL
|
||||
|
Feb’18 – Dec'18
|
Natural gas – basis swap
|
10,000 MMBtu/day
|
$(0.568)
|
NGPL MIDCON
|
||||
|
Apr’18 – Oct'18
|
Natural gas – basis swap
|
10,000 MMBtu/day
|
$(0.190)
|
NGPL TEXOK
|
||||
|
Jan'19 – Dec'19
|
Natural gas – basis swap
|
10,000 MMBtu/day
|
$(0.728)
|
PEPL
|
||||
|
Jan'19 – Dec'19
|
Natural gas – basis swap
|
10,000 MMBtu/day
|
$(0.625)
|
NGPL MIDCON
|
||||
|
Jan'19 – Dec'19
|
Natural gas – basis swap
|
20,000 MMBtu/day
|
$(0.273)
|
NGPL TEXOK
|
||||
|
Jan'20 – Dec'20
|
Natural gas – basis swap
|
20,000 MMBtu/day
|
$(0.280)
|
NGPL TEXOK
|
||||
|
Apr'18 – Dec'18
|
Crude oil – swap
|
1,000 Bbl/day
|
$60.00
|
WTI – NYMEX
|
||||
|
Apr’18 – Sep'18
|
Liquids – swap
|
500 Bbl/day
|
$34.10
|
MONT BELVIEU
|
||||
Interest Rate Risk.
Our interest rate exposure relates to our long-term debt under our credit agreement and the Notes. The credit agreement, at our election bears interest at variable rates based on the Prime Rate or the LIBOR Rate. At our election, borrowings under our credit agreement may be fixed at the LIBOR Rate for periods of up to 180 days. Based on our average outstanding long-term debt subject to a variable rate in 2017, a 1% increase in the floating rate would reduce our annual pre-tax cash flow by approximately $1.6 million. Under our Notes, we pay a fixed rate of interest of
6.625%
per year (payable semi-annually in arrears on May 15 and November 15 of each year).
72
Index to Financial Statements
Unit Corporation and Subsidiaries
|
|
Page
|
|
Consolidated Financial Statements:
|
|
73
Management’s Report on Internal Control over Financial Reporting
Management of the company is responsible for establishing and maintaining adequate internal control over financial reporting. Internal control over financial reporting is defined in Rules 13a-15(f) or 15d-15(f) promulgated under the Securities Exchange Act of 1934 as a process designed by, or under the supervision of, the company’s principal executive and principal financial officers and effected by the company’s board of directors, management and other personnel, to provide reasonable assurance regarding the reliability of financial reporting and the preparation of financial statements for external purposes in accordance with generally accepted accounting principles and includes those policies and procedures that:
|
•
|
Pertain to the maintenance of records that in reasonable detail accurately and fairly reflect the transactions and dispositions of the assets of the company;
|
|
•
|
Provide reasonable assurance that transactions are recorded as necessary to permit preparation of financial statements in accordance with generally accepted accounting principles, and that receipts and expenditures of the company are being made only in accordance with authorizations of management and directors of the company; and
|
|
•
|
Provide reasonable assurance regarding prevention or timely detection of unauthorized acquisition, use or disposition of the company’s assets that could have a material effect on the financial statements.
|
Because of its inherent limitations, internal control over financial reporting may not prevent or detect misstatements. Also, projections of any evaluation of effectiveness to future periods are subject to the risk that controls may become inadequate because of changes in conditions, or that the degree of compliance with the policies or procedures may deteriorate. Internal control over financial reporting cannot provide absolute assurance of achieving financial reporting objectives because of its inherent limitations. Internal control over financial reporting is a process that involves human diligence and compliance and is subject to lapses in judgment and breakdowns resulting from human failures. Internal control over financial reporting also can be circumvented by collusion or improper management override. Because of such limitations, there is a risk that material misstatements may not be prevented or detected on a timely basis by internal control over financial reporting. However, these inherent limitations are known features of the financial reporting process. Therefore, it is possible to design into the process safeguards to reduce, though not eliminate, this risk.
The company’s management assessed the effectiveness of the company’s internal control over financial reporting as of
December 31, 2017
. In making this assessment, the company’s management used the criteria set forth in
Internal Control—Integrated Framework (2013)
issued by the Committee of Sponsoring Organizations of the Treadway Commission (COSO). Based on their assessment, the company’s management concluded that, as of
December 31, 2017
, the company’s internal control over financial reporting was effective based on those criteria.
The effectiveness of the company’s internal control over financial reporting as of
December 31, 2017
, has been audited by PricewaterhouseCoopers LLP, an independent registered public accounting firm, as stated in their report which appears herein.
74
Report of Independent Registered Public Accounting Firm
To
Board of Directors and Shareholders of Unit Corporation:
Opinions on the Financial Statements and Internal Control over Financial Reporting
We have audited the accompanying consolidated balance sheets of Unit Corporation
and its subsidiaries
as of
December 31, 2017
and
2016
, and the related consolidated statements of operations, comprehensive income (loss), changes in shareholders’ equity, and cash flows for each of the three years in the period ended
December 31, 2017
, including the related notes and financial statement schedule listed in the index appearing under Item 15(a)(2) (collectively referred to as the “consolidated financial statements”). We also have audited the Company's internal control over financial reporting as of
December 31, 2017
, based on criteria established in
Internal Control - Integrated Framework
(2013)
issued by the Committee of Sponsoring Organizations of the Treadway Commission (COSO).
In our opinion, the consolidated
financial statements referred to above present fairly, in all material respects, the financial position of the Company as of
December 31, 2017
and
2016
, and the results of their operations and their cash flows for each of the three years in the period ended
December 31, 2017
in conformity with accounting principles generally accepted in the United States of America. Also in our opinion, the Company maintained, in all material respects, effective internal control over financial reporting as of
December 31, 2017
, based on criteria established in
Internal Control - Integrated Framework
(2013)
issued by the COSO.
Basis for Opinions
The Company's management is responsible for these consolidated financial statements, for maintaining effective internal control over financial reporting, and for its assessment of the effectiveness of internal control over financial reporting, included in the accompanying Management's Report on Internal Control over Financial Reporting. Our responsibility is to express opinions on the Company’s consolidated
financial statements and on the Company's internal control over financial reporting based on our audits. We are a public accounting firm registered with the Public Company Accounting Oversight Board (United States) ("PCAOB") and are required to be independent with respect to the Company in accordance with the U.S. federal securities laws and the applicable rules and regulations of the Securities and Exchange Commission and the PCAOB.
We conducted our audits in accordance with the standards of the PCAOB. Those standards require that we plan and perform the audits to obtain reasonable assurance about whether the consolidated
financial statements are free of material misstatement, whether due to error or fraud, and whether effective internal control over financial reporting was maintained in all material respects.
Our audits of the consolidated
financial statements included performing procedures to assess the risks of material misstatement of the consolidated
financial statements, whether due to error or fraud, and performing procedures that respond to those risks. Such procedures included examining, on a test basis, evidence regarding the amounts and disclosures in the consolidated
financial statements. Our audits also included evaluating the accounting principles used and significant estimates made by management, as well as evaluating the overall presentation of the consolidated
financial statements. Our audit of internal control over financial reporting included obtaining an understanding of internal control over financial reporting, assessing the risk that a material weakness exists, and testing and evaluating the design and operating effectiveness of internal control based on the assessed risk. Our audits also included performing such other procedures as we considered necessary in the circumstances. We believe that our audits provide a reasonable basis for our opinions.
Definition and Limitations of Internal Control over Financial Reporting
A company’s internal control over financial reporting is a process designed to provide reasonable assurance regarding the reliability of financial reporting and the preparation of financial statements for external purposes in accordance with generally accepted accounting principles. A company’s internal control over financial reporting includes those policies and procedures that (i) pertain to the maintenance of records that, in reasonable detail, accurately and fairly reflect the transactions and dispositions of the assets of the company; (ii) provide reasonable assurance that transactions are recorded as necessary to permit preparation of financial statements in accordance with generally accepted accounting principles, and that receipts and expenditures of the company are being made only in accordance with authorizations of management and directors of the company; and (iii) provide reasonable assurance regarding prevention or timely detection of unauthorized acquisition, use, or disposition of the company’s assets that could have a material effect on the financial statements.
75
Because of its inherent limitations, internal control over financial reporting may not prevent or detect misstatements. Also, projections of any evaluation of effectiveness to future periods are subject to the risk that controls may become inadequate because of changes in conditions, or that the degree of compliance with the policies or procedures may deteriorate.
/s/ PricewaterhouseCoopers LLP
Tulsa, Oklahoma
February 27, 2018
We have served as the Company’s auditor since 1989.
76
UNIT CORPORATION AND SUBSIDIARIES
|
|
As of December 31,
|
||||||
|
2017
|
2016
|
||||||
|
(In thousands except share and par value amounts)
|
|||||||
|
ASSETS
|
|||||||
|
Current assets:
|
|||||||
|
Cash and cash equivalents
|
$
|
701
|
|
$
|
893
|
|
|
|
Accounts receivable (less allowance for doubtful accounts of $2,450 and $3,773 at December 31, 2017 and 2016, respectively)
|
111,512
|
|
83,954
|
|
|||
|
Materials and supplies
|
505
|
|
3,340
|
|
|||
|
Current derivative asset (Note 12)
|
721
|
|
—
|
|
|||
|
Current deferred tax asset (Note 8)
|
—
|
|
25,211
|
|
|||
|
Prepaid expenses and other
|
6,233
|
|
7,798
|
|
|||
|
Total current assets
|
119,672
|
|
121,196
|
|
|||
|
Property and equipment:
|
|||||||
|
Oil and natural gas properties, on the full cost method:
|
|||||||
|
Proved properties
|
5,712,813
|
|
5,446,305
|
|
|||
|
Unproved properties not being amortized
|
296,764
|
|
314,867
|
|
|||
|
Drilling equipment
|
1,593,611
|
|
1,565,268
|
|
|||
|
Gas gathering and processing equipment
|
726,236
|
|
705,859
|
|
|||
|
Saltwater disposal systems
|
62,618
|
|
60,638
|
|
|||
|
Corporate land and building
|
59,080
|
|
59,066
|
|
|||
|
Transportation equipment
|
29,631
|
|
32,842
|
|
|||
|
Other
|
53,439
|
|
48,590
|
|
|||
|
8,534,192
|
|
8,233,435
|
|
||||
|
Less accumulated depreciation, depletion, amortization, and impairment
|
6,151,450
|
|
5,952,330
|
|
|||
|
Net property and equipment
|
2,382,742
|
|
2,281,105
|
|
|||
|
Goodwill (Note 2)
|
62,808
|
|
62,808
|
|
|||
|
Non-current derivative asset (Note 12)
|
—
|
|
377
|
|
|||
|
Other assets
|
16,230
|
|
13,817
|
|
|||
|
Total assets
|
$
|
2,581,452
|
|
$
|
2,479,303
|
|
|
77
UNIT CORPORATION AND SUBSIDIARIES
CONSOLIDATED BALANCE SHEETS - (Continued)
|
As of December 31,
|
|||||||
|
2017
|
2016
|
||||||
|
(In thousands except share and par value amounts)
|
|||||||
|
LIABILITIES AND SHAREHOLDERS’ EQUITY
|
|||||||
|
Current liabilities:
|
|||||||
|
Accounts payable
|
$
|
112,648
|
|
$
|
88,793
|
|
|
|
Accrued liabilities (Note 5)
|
48,523
|
|
39,651
|
|
|||
|
Current derivative liabilities (Note 12)
|
7,763
|
|
21,564
|
|
|||
|
Current portion of other long-term liabilities (Note 6)
|
13,002
|
|
14,907
|
|
|||
|
Total current liabilities
|
181,936
|
|
164,915
|
|
|||
|
Long-term debt less unamortized discount and debt issuance costs (Note 6)
|
820,276
|
|
800,917
|
|
|||
|
Non-current derivative liabilities (Note 12)
|
—
|
|
415
|
|
|||
|
Other long-term liabilities (Note 6)
|
100,203
|
|
103,064
|
|
|||
|
Deferred income taxes (Note 8)
|
133,477
|
|
215,922
|
|
|||
|
Commitments and contingencies (Note 14)
|
—
|
|
—
|
|
|||
|
Shareholders’ equity:
|
|||||||
|
Preferred stock, $1.00 par value, 5,000,000 shares authorized, none issued
|
—
|
|
—
|
|
|||
|
Common stock, $0.20 par value, 175,000,000 shares authorized, 52,880,134 and 51,494,318 shares issued as of December 31, 2017 and 2016, respectively
|
10,280
|
|
10,016
|
|
|||
|
Capital in excess of par value
|
535,815
|
|
502,500
|
|
|||
|
Accumulated other comprehensive income (net of tax of $39 at December 31, 2017) (Note 15)
|
63
|
|
—
|
|
|||
|
Retained earnings
|
799,402
|
|
681,554
|
|
|||
|
Total shareholders’ equity
|
1,345,560
|
|
1,194,070
|
|
|||
|
Total liabilities and shareholders’ equity
|
$
|
2,581,452
|
|
$
|
2,479,303
|
|
|
The accompanying notes are an integral part of the consolidated financial statements.
78
UNIT CORPORATION AND SUBSIDIARIES
|
|
Year Ended December 31,
|
||||||||||
|
|
2017
|
2016
|
2015
|
||||||||
|
(In thousands except per share amounts)
|
|||||||||||
|
Revenues:
|
|||||||||||
|
Oil and natural gas
|
$
|
357,744
|
|
$
|
294,221
|
|
$
|
385,774
|
|
||
|
Contract drilling
|
174,720
|
|
122,086
|
|
265,668
|
|
|||||
|
Gas gathering and processing
|
207,176
|
|
185,870
|
|
202,789
|
|
|||||
|
Total revenues
|
739,640
|
|
602,177
|
|
854,231
|
|
|||||
|
Expenses:
|
|||||||||||
|
Operating costs:
|
|||||||||||
|
Oil and natural gas
|
130,789
|
|
120,184
|
|
166,046
|
|
|||||
|
Contract drilling
|
122,600
|
|
88,154
|
|
156,408
|
|
|||||
|
Gas gathering and processing
|
155,483
|
|
137,609
|
|
161,556
|
|
|||||
|
Total operating costs
|
408,872
|
|
345,947
|
|
484,010
|
|
|||||
|
Depreciation, depletion, and amortization
|
209,257
|
|
208,353
|
|
352,742
|
|
|||||
|
Impairments
|
—
|
|
161,563
|
|
1,634,628
|
|
|||||
|
General and administrative
|
38,087
|
|
33,337
|
|
34,358
|
|
|||||
|
(Gain) loss on disposition of assets
|
(327
|
)
|
(2,540
|
)
|
7,229
|
|
|||||
|
Total expenses
|
655,889
|
|
746,660
|
|
2,512,967
|
|
|||||
|
Income (loss) from operations
|
83,751
|
|
(144,483
|
)
|
(1,658,736
|
)
|
|||||
|
Other income (expense):
|
|||||||||||
|
Interest, net
|
(38,334
|
)
|
(39,829
|
)
|
(31,963
|
)
|
|||||
|
Gain (loss) on derivatives
|
14,732
|
|
(22,813
|
)
|
26,345
|
|
|||||
|
Other
|
21
|
|
307
|
|
45
|
|
|||||
|
Total other income (expense)
|
(23,581
|
)
|
(62,335
|
)
|
(5,573
|
)
|
|||||
|
Income (loss) before income taxes
|
60,170
|
|
(206,818
|
)
|
(1,664,309
|
)
|
|||||
|
Income tax expense (benefit):
|
|||||||||||
|
Current
|
5
|
|
15
|
|
(20,616
|
)
|
|||||
|
Deferred
|
(57,683
|
)
|
(71,209
|
)
|
(606,332
|
)
|
|||||
|
Total income taxes
|
(57,678
|
)
|
(71,194
|
)
|
(626,948
|
)
|
|||||
|
Net income (loss)
|
$
|
117,848
|
|
$
|
(135,624
|
)
|
$
|
(1,037,361
|
)
|
||
|
Net income (loss) per common share:
|
|||||||||||
|
Basic
|
$
|
2.31
|
|
$
|
(2.71
|
)
|
$
|
(21.12
|
)
|
||
|
Diluted
|
$
|
2.28
|
|
$
|
(2.71
|
)
|
$
|
(21.12
|
)
|
||
The accompanying notes are an integral part of the consolidated financial statements.
79
UNIT CORPORATION AND SUBSIDIARIES
CONSOLIDATED STATEMENTS OF COMPREHENSIVE INCOME (LOSS)
|
For Years Ended December 31,
|
|||||||||||
|
|
2017
|
2016
|
2015
|
||||||||
|
|
(In thousands)
|
||||||||||
|
Net income (loss)
|
$
|
117,848
|
|
$
|
(135,624
|
)
|
$
|
(1,037,361
|
)
|
||
|
Other comprehensive income, net of taxes:
|
|||||||||||
|
Unrealized appreciation on securities, net of tax of $39, $0, and $0
|
63
|
|
—
|
|
—
|
|
|||||
|
Comprehensive income (loss)
|
$
|
117,911
|
|
$
|
(135,624
|
)
|
$
|
(1,037,361
|
)
|
||
The accompanying notes are an integral part of these
unaudited condensed consolidated financial statements.
80
UNIT CORPORATION AND SUBSIDIARIES
CONSOLIDATED STATEMENTS OF CHANGES IN SHAREHOLDERS’ EQUITY
Year Ended December 31,
2015
,
2016
, and
2017
|
Common
Stock
|
Capital In Excess
of Par Value
|
Accumulated Other Comprehensive Income
|
Retained
Earnings
|
Total
|
|||||||||||||||
|
|
(In thousands except per share amounts)
|
||||||||||||||||||
|
Balances, January 1, 2015
|
$
|
9,732
|
|
$
|
468,123
|
|
$
|
—
|
|
$
|
1,854,539
|
|
$
|
2,332,394
|
|
||||
|
Net loss
|
—
|
|
—
|
|
—
|
|
(1,037,361
|
)
|
(1,037,361
|
)
|
|||||||||
|
Activity in employee compensation plans (819,289 shares)
|
99
|
|
18,448
|
|
—
|
|
—
|
|
18,547
|
|
|||||||||
|
Balances, December 31, 2015
|
9,831
|
|
486,571
|
|
—
|
|
817,178
|
|
1,313,580
|
|
|||||||||
|
Net loss
|
—
|
|
—
|
|
—
|
|
(135,624
|
)
|
(135,624
|
)
|
|||||||||
|
Activity in employee compensation plans (1,081,217 shares)
|
185
|
|
15,929
|
|
—
|
|
—
|
|
16,114
|
|
|||||||||
|
Balances, December 31, 2016
|
10,016
|
|
502,500
|
|
—
|
|
681,554
|
|
1,194,070
|
|
|||||||||
|
Net income
|
—
|
|
—
|
|
—
|
|
117,848
|
|
117,848
|
|
|||||||||
|
Other comprehensive income (net of tax $39)
|
—
|
|
—
|
|
63
|
|
—
|
|
63
|
|
|||||||||
|
Total comprehensive income
|
117,911
|
|
|||||||||||||||||
|
Proceeds from sale of stock (787,547 shares)
|
158
|
|
18,465
|
|
—
|
|
—
|
|
18,623
|
|
|||||||||
|
Activity in employee compensation plans (598,269 shares)
|
106
|
|
14,850
|
|
—
|
|
—
|
|
14,956
|
|
|||||||||
|
Balances, December 31, 2017
|
$
|
10,280
|
|
$
|
535,815
|
|
$
|
63
|
|
$
|
799,402
|
|
$
|
1,345,560
|
|
||||
The accompanying notes are an integral part of the consolidated financial statements.
81
UNIT CORPORATION AND SUBSIDIARIES
|
|
Year Ended December 31,
|
||||||||||
|
|
2017
|
2016
|
2015
|
||||||||
|
|
(In thousands)
|
||||||||||
|
OPERATING ACTIVITIES:
|
|||||||||||
|
Net income (loss)
|
$
|
117,848
|
|
$
|
(135,624
|
)
|
$
|
(1,037,361
|
)
|
||
|
Adjustments to reconcile net income (loss) to net cash provided (used) by operating activities:
|
|||||||||||
|
Depreciation, depletion, and amortization
|
209,257
|
|
208,353
|
|
352,742
|
|
|||||
|
Impairments (Note 2)
|
—
|
|
161,563
|
|
1,634,628
|
|
|||||
|
Amortization of debt issuance costs and debt discount
|
2,159
|
|
2,122
|
|
2,088
|
|
|||||
|
(Gain) loss on derivatives
|
(14,732
|
)
|
22,813
|
|
(26,345
|
)
|
|||||
|
Cash receipts on derivatives settled
|
173
|
|
9,658
|
|
46,615
|
|
|||||
|
(Gain) loss on disposition of assets
|
(327
|
)
|
(3,127
|
)
|
7,229
|
|
|||||
|
Deferred tax benefit
|
(57,683
|
)
|
(71,209
|
)
|
(606,332
|
)
|
|||||
|
Employee stock compensation plans
|
17,747
|
|
13,812
|
|
21,468
|
|
|||||
|
Bad debt expense
|
348
|
|
785
|
|
1,191
|
|
|||||
|
ARO liability accretion
|
2,886
|
|
2,779
|
|
3,453
|
|
|||||
|
Other, net
|
(865
|
)
|
(6,037
|
)
|
(1,517
|
)
|
|||||
|
Changes in operating assets and liabilities increasing (decreasing) cash:
|
|||||||||||
|
Accounts receivable
|
(32,073
|
)
|
(11,796
|
)
|
105,426
|
|
|||||
|
Materials and supplies
|
2,835
|
|
225
|
|
1,507
|
|
|||||
|
Prepaid expenses and other
|
1,527
|
|
2,585
|
|
7,134
|
|
|||||
|
Accounts payable
|
21,824
|
|
27,400
|
|
(20,306
|
)
|
|||||
|
Accrued liabilities
|
6,996
|
|
(4,388
|
)
|
(22,920
|
)
|
|||||
|
Income taxes
|
38
|
|
20,903
|
|
(21,482
|
)
|
|||||
|
Contract advances
|
1,630
|
|
(687
|
)
|
(274
|
)
|
|||||
|
Net cash provided by operating activities
|
279,588
|
|
240,130
|
|
446,944
|
|
|||||
|
INVESTING ACTIVITIES:
|
|||||||||||
|
Capital expenditures
|
(269,185
|
)
|
(186,149
|
)
|
(561,453
|
)
|
|||||
|
Producing property and other acquisitions
|
(58,026
|
)
|
(564
|
)
|
(179
|
)
|
|||||
|
Proceeds from disposition of property and equipment
|
21,713
|
|
74,823
|
|
11,854
|
|
|||||
|
Other
|
(1,500
|
)
|
919
|
|
—
|
|
|||||
|
Net cash used in investing activities
|
(306,998
|
)
|
(110,971
|
)
|
(549,778
|
)
|
|||||
|
FINANCING ACTIVITIES:
|
|||||||||||
|
Borrowings under line of credit
|
343,900
|
|
251,398
|
|
618,500
|
|
|||||
|
Payments under line of credit
|
(326,700
|
)
|
(371,600
|
)
|
(503,500
|
)
|
|||||
|
Payments on capitalized leases
|
(3,694
|
)
|
(3,694
|
)
|
(3,549
|
)
|
|||||
|
Proceeds from common stock issued, net of issue costs (Note 15)
|
18,623
|
|
—
|
|
—
|
|
|||||
|
Tax expense from stock compensation
|
—
|
|
(376
|
)
|
(3,207
|
)
|
|||||
|
Decrease in book overdrafts (Note 2)
|
(4,911
|
)
|
(4,829
|
)
|
(5,624
|
)
|
|||||
|
Net cash provided by (used in) financing activities
|
27,218
|
|
(129,101
|
)
|
102,620
|
|
|||||
|
Net increase (decrease) in cash and cash equivalents
|
(192
|
)
|
58
|
|
(214
|
)
|
|||||
|
Cash and cash equivalents, beginning of year
|
893
|
|
835
|
|
1,049
|
|
|||||
|
Cash and cash equivalents, end of year
|
$
|
701
|
|
$
|
893
|
|
$
|
835
|
|
||
|
Supplemental disclosure of cash flow information:
|
|||||||||||
|
Cash paid during the year for:
|
|||||||||||
|
Interest paid (net of capitalized)
|
$
|
33,931
|
|
$
|
35,690
|
|
$
|
30,910
|
|
||
|
Income taxes
|
$
|
—
|
|
$
|
42
|
|
$
|
3,540
|
|
||
|
Changes in accounts payable and accrued liabilities related to purchases of property, plant, and equipment
|
$
|
(6,942
|
)
|
$
|
21,190
|
|
$
|
105,157
|
|
||
|
Non-cash reductions to oil and natural gas properties related to asset retirement obligations
|
$
|
3,613
|
|
$
|
30,897
|
|
$
|
5,694
|
|
||
The accompanying notes are an integral part of the consolidated financial statements.
82
UNIT CORPORATION AND SUBSIDIARIES
NOTES TO CONSOLIDATED FINANCIAL STATEMENTS
Unless the context clearly indicates otherwise, references in this report to “Unit”, “Company”, “we”, “our”, “us”, or like terms refer to Unit Corporation and its subsidiaries.
We are primarily engaged in the exploration, development, acquisition, and production of oil and natural gas properties, the land contract drilling of natural gas and oil wells, and the buying, selling, gathering, processing, and treating of natural gas. Our operations are principally in the United States and are organized in the following three reporting segments: (1) Oil and Natural Gas, (2) Contract Drilling, and (3) Mid-Stream.
Oil and Natural Gas.
Carried out by our subsidiary, Unit Petroleum Company, we explore, develop, acquire, and produce oil and natural gas properties for our own account. Our producing oil and natural gas properties, unproved properties, and related assets are mainly in Oklahoma and Texas, and to a lesser extent, in Arkansas, Colorado, Kansas, Louisiana, Montana, New Mexico, North Dakota, Utah, and Wyoming.
Contract Drilling.
Carried out by our subsidiary, Unit Drilling Company, we drill onshore oil and natural gas wells for our own account and for a wide range of other oil and natural gas companies. Our drilling operations are mainly in Oklahoma, Texas, Wyoming, North Dakota, and to a lesser extent in Louisiana and Kansas.
Mid-Stream.
Carried out by our subsidiary, Superior Pipeline Company, L.L.C. and its subsidiaries, we buy, sell, gather, transport, process, and treat natural gas for our own account and for third parties. Mid-stream operations are performed in Oklahoma, Texas, Kansas, Pennsylvania, and West Virginia.
Principles of Consolidation.
The consolidated financial statements include the accounts of Unit Corporation and its subsidiaries. Our investment in limited partnerships is accounted for on the proportionate consolidation method, whereby our share of the partnerships’ assets, liabilities, revenues, and expenses are included in the appropriate classification in the accompanying consolidated financial statements.
Certain amounts in the accompanying consolidated financial statements for prior periods have been reclassified to conform to current year presentation. Certain financial statement captions were expanded or combined with no impact to consolidated net income or shareholders' equity.
Accounting Estimates.
The preparation of financial statements in conformity with generally accepted accounting principles (GAAP) requires management to make estimates and assumptions that affect the reported amounts of assets and liabilities and disclosure of contingent assets and liabilities at the date of the financial statements and the reported amounts of revenues and expenses during the reporting period. Actual results could differ from those estimates.
Drilling Contracts.
We recognize revenues and expenses generated from “daywork” drilling contracts as the services are performed, since we do not bear the risk of completion of the well. Under “footage” and “turnkey” contracts, we bear the risk of completion of the well; therefore, revenues and expenses are recognized when the well is substantially completed. Under this method, substantial completion is determined when the well bore reaches the negotiated depth as stated in the contract. The entire amount of a loss, if any, is recorded when the loss is determinable. The costs of uncompleted drilling contracts include expenses incurred to date on “footage” or “turnkey” contracts, which are still in process at the end of the period, and are included in other current assets. Typically, any one of these three types of contracts can be used for the drilling of one well which can take from
10
to
90
days. At
December 31, 2017
, all of our contracts were daywork contracts of which
nine
were multi-well and had durations which ranged from
six months
to
two years
,
eight
of which expire in 2018 and
one
expiring in 2019. These longer term contracts may contain a fixed rate for the duration of the contract or provide for the periodic renegotiation of the rate within a specific range from the existing rate.
Cash Equivalents and Book Overdrafts.
We include as cash equivalents all investments with maturities at date of purchase of three months or less which are readily convertible into known amounts of cash. Book overdrafts are checks that
83
UNIT CORPORATION AND SUBSIDIARIES
NOTES TO CONSOLIDATED FINANCIAL STATEMENTS—(Continued)
have been issued before the end of the period, but not presented to our bank for payment before the end of the period. At
December 31, 2017
and
2016
, book overdrafts were
$12.4 million
and
$17.3 million
, respectively.
Accounts Receivable.
Accounts receivable are carried on a gross basis, with no discounting, less an allowance for doubtful accounts. We estimate the allowance for doubtful accounts based on existing economic conditions, the financial condition of our customers, and the amount and age of past due accounts. Receivables are considered past due if full payment is not received by the contractual due date. Past due accounts are generally written off against the allowance for doubtful accounts only after all collection attempts have been unsuccessful.
Financial Instruments and Concentrations of Credit Risk and Non-performance Risk.
Financial instruments, which potentially subject us to concentrations of credit risk, consist primarily of trade receivables with a variety of oil and natural gas companies. We do not generally require collateral related to receivables. Our credit risk is considered to be limited due to the large number of customers comprising our customer base. Below are the third-party customers that accounted for more than 10% of our segment’s revenues:
|
2017
|
2016
|
2015
|
||||||
|
Oil and Natural Gas:
|
||||||||
|
Sunoco Logistics Partners L.P.
|
10
|
%
|
24
|
%
|
19
|
%
|
||
|
Valero Energy Corporation
|
9
|
%
|
11
|
%
|
15
|
%
|
||
|
Drilling:
|
||||||||
|
QEP Resources, Inc.
|
26
|
%
|
28
|
%
|
25
|
%
|
||
|
Whiting Petroleum Corp. (formerly Kodiak Oil and Gas Corp.)
|
7
|
%
|
18
|
%
|
7
|
%
|
||
|
Mid-Stream:
|
||||||||
|
ONEOK, Inc.
|
36
|
%
|
30
|
%
|
29
|
%
|
||
|
Range Resources Corporation
|
9
|
%
|
10
|
%
|
5
|
%
|
||
|
Koch Energy Services, LLC
|
8
|
%
|
11
|
%
|
9
|
%
|
||
|
Tenaska Resources, LLC
|
6
|
%
|
10
|
%
|
18
|
%
|
||
|
Laclede Group, Inc.
|
1
|
%
|
9
|
%
|
12
|
%
|
||
We had a concentration of cash of
$11.4 million
and
$8.3 million
at
December 31, 2017
and
2016
, respectively with one bank.
The use of derivative transactions also involves the risk that the counterparties will be unable to meet the financial terms of the transactions. We considered this non-performance risk with regard to our counterparties and our own non-performance risk in our derivative valuation at
December 31, 2017
and determined there was no material risk at that time. At
December 31, 2017
, the fair values of the net assets (liabilities) we had with each of the counterparties with respect to all of our commodity derivative transactions are listed in the table below:
|
|
December 31, 2017
|
||
|
|
(In millions)
|
||
|
Canadian Imperial Bank of Commerce
|
$
|
0.7
|
|
|
Bank of America Merrill Lynch
|
(2.5
|
)
|
|
|
Bank of Montreal
|
(5.3
|
)
|
|
|
Total assets (liabilities)
|
$
|
(7.1
|
)
|
Property and Equipment.
Drilling equipment, transportation equipment, gas gathering and processing systems, and other property and equipment are carried at cost less accumulated depreciation. Renewals and enhancements are capitalized while repairs and maintenance are expensed. Depreciation of drilling equipment is recorded using the units-of-production method based on estimated useful lives starting at
15 years
, including a minimum provision of
20%
of the active rate when the equipment is idle. We use the composite method of depreciation for drill pipe and collars and calculate the depreciation by footage actually drilled compared to total estimated remaining footage. Depreciation on our corporate building is computed using the straight-line method over the estimated useful life of the asset for
39
years. Depreciation of other property and equipment is computed using the straight-line method over the estimated useful lives of the assets ranging from
3
to
15
years.
84
UNIT CORPORATION AND SUBSIDIARIES
NOTES TO CONSOLIDATED FINANCIAL STATEMENTS—(Continued)
We review the carrying amounts of long-lived assets for potential impairment annually, typically during the fourth quarter, or when events occur or changes in circumstances suggest that these carrying amounts may not be recoverable. Changes that could prompt such an assessment may include equipment obsolescence, changes in the market demand for a specific asset, changes in commodity prices, periods of relatively low drilling rig utilization, declining revenue per day, declining cash margin per day, or overall changes in general market conditions. Assets are determined to be impaired if a forecast of undiscounted estimated future net operating cash flows directly related to the asset, including disposal value if any, is less than the carrying amount of the asset. If any asset is determined to be impaired, the loss is measured as the amount by which the carrying amount of the asset exceeds its fair value. The estimate of fair value is based on the best information available, including prices for similar assets. Changes in these estimates could cause us to reduce the carrying value of property and equipment.
Asset impairment evaluations are, by nature, highly subjective. They involve expectations about future cash flows generated by our assets and reflect management’s assumptions and judgments regarding future industry conditions and their effect on future utilization levels, dayrates, and costs. The use of different estimates and assumptions could cause materially different carrying values of our assets.
On a periodic basis, we evaluate our fleet of drilling rigs for marketability based on the condition of inactive rigs, expenditures that would be necessary to bring them to working condition and the expected demand for drilling services by rig type. The components comprising inactive rigs are evaluated, and those components with continuing utility to the Company’s other marketed rigs are transferred to other rigs or to its yards to be used as spare equipment. The remaining components of these rigs are retired. During 2015, we recorded a write-down on
31
of our drilling rigs and related equipment of approximately
$8.3 million
pre-tax based on the estimated market value for similar equipment from auctions sales. We then sold all
31
of these drilling rigs and some other drilling equipment to unaffiliated third parties. The proceeds from the sale of those assets, less costs to sell, was less than the
$11.3 million
net book value resulting in a loss of
$7.3 million
pre-tax. When property and equipment components are disposed of, the cost and the related accumulated depreciation are removed from the accounts and any resulting gain or loss is generally reflected in operations. Our contract drilling segment had
no
impairments in either 2016 or 2017. For dispositions of drill pipe and drill collars, an average cost for the appropriate feet of drill pipe and drill collars is removed from the asset account and charged to accumulated depreciation and proceeds, if any, are credited to accumulated depreciation.
In 2015, our mid-stream segment incurred a
$27.0 million
, pre-tax write-down of
three
of its systems, Bruceton Mills, Midwell, and Spring Creek due to anticipated future cash flow and future development around these systems not being sufficient to support their carrying value. The estimated future cash flows were less than the carrying value on these systems. Our mid-stream segment had
no
impairments in either 2016 or 2017.
We record an asset and a liability equal to the present value of the expected future ARO associated with our oil and gas properties. The ARO asset is depreciated in a manner consistent with the depreciation of the underlying physical asset. We measure changes in the liability due to passage of time by accreting an interest charge. This amount is recognized as an increase in the carrying amount of the liability and as a corresponding accretion expense.
Capitalized Interest.
During
2017
,
2016
, and
2015
, interest of approximately
$15.9 million
,
$15.3 million
, and
$21.7 million
, respectively, was capitalized based on the net book value associated with unproved properties not being amortized, the construction of additional drilling rigs, and the construction of gas gathering systems. Interest is being capitalized using a weighted average interest rate based on our outstanding borrowings.
Goodwill.
Goodwill represents the excess of the cost of acquisitions over the fair value of the net assets acquired. Goodwill is not amortized, but an impairment test is performed at least annually to determine whether the fair value has decreased and is performed additionally when events indicate an impairment may have occurred. For impairment testing, goodwill is evaluated at the reporting unit level. Our goodwill is all related to our contract drilling segment, and, the impairment test is generally based on the estimated discounted future net cash flows of our drilling segment, utilizing discount rates and other factors in determining the fair value of our drilling segment. Inputs in our estimated discounted future net cash flows include drilling rig utilization, day rates, gross margin percentages, and terminal value.
No
goodwill impairment was recorded for the years ended
December 31, 2017
,
2016
, or
2015
. There were
no
additions to goodwill in
2017
,
2016
, or
2015
. Based on our impairment test performed as of
December 31, 2017
, the fair value of our drilling segment exceeded its carrying value by
41%
. Goodwill of
$0.7 million
is deductible for tax purposes.
Oil and Natural Gas Operations.
We account for our oil and natural gas exploration and development activities using the full cost method of accounting prescribed by the SEC. Accordingly, all productive and non-productive costs incurred in connection with the acquisition, exploration and development of our oil, NGLs, and natural gas reserves, including directly related overhead costs and related asset retirement costs, are capitalized and amortized on a units-of-production method based
85
UNIT CORPORATION AND SUBSIDIARIES
NOTES TO CONSOLIDATED FINANCIAL STATEMENTS—(Continued)
on proved oil and natural gas reserves. Directly related overhead costs of
$14.8 million
,
$15.4 million
, and
$19.2 million
were capitalized in
2017
,
2016
, and
2015
, respectively. Independent petroleum engineers annually audit our internal evaluation of our reserves. The average rates used for DD&A were
$6.00
,
$6.24
, and
$12.30
per Boe in
2017
,
2016
, and
2015
, respectively. The calculation of DD&A includes all capitalized costs, estimated future expenditures to be incurred in developing proved reserves and estimated dismantlement and abandonment costs, net of estimated salvage values less accumulated amortization, unproved properties, and equipment not placed in service. Our unproved properties and wells in progress totaling
$296.8 million
are excluded from the DD&A calculation.
No gains or losses are recognized on the sale, conveyance, or other disposition of oil and natural gas properties unless a significant reserve amount to our total reserves is involved.
Revenue from the sale of oil and natural gas is recognized when title passes, net of royalties.
Under the full cost rules, at the end of each quarter, we review the carrying value of our oil and natural gas properties. The full cost ceiling is based principally on the estimated future discounted net cash flows from our oil and natural gas properties discounted at
10%
. We use the unweighted arithmetic average of the commodity prices existing on the first day of each of the 12 months before the end of the reporting period to calculate discounted future revenues, unless prices were otherwise determined under contractual arrangements. In the event the unamortized cost of oil and natural gas properties being amortized exceeds the full cost ceiling, as defined by the SEC, the excess is charged to expense in the period during which such excess occurs. Once incurred, a write-down of oil and natural gas properties is not reversible.
We determined the value of certain unproved oil and gas properties were diminished (in part or in whole) based on an impairment evaluation and our anticipated future exploration plans. Those determinations resulted in
$114.4 million
,
$7.6 million
, and
$10.5 million
in 2015, 2016, and 2017, respectively of costs being added to the total of our capitalized costs being amortized. In 2015, we incurred non-cash ceiling test write-downs of our oil and natural gas properties of
$1.6 billion
pre-tax (
$1.0 billion
net of tax) primarily due to the reduction of the 12-month average commodity prices during the year. In 2016, we incurred non-cash ceiling test write-downs of our oil and natural gas properties of
$161.6 million
pre-tax (
$100.6 million
net of tax) due to the reduction of the 12-month average commodity prices during the first three quarters of the year. We had
no
non-cash ceiling test write-downs during 2017.
Our contract drilling segment provides drilling services for our exploration and production segment. Depending on the timing of the drilling services performed on our properties those services may be deemed, for financial reporting purposes, to be associated with the acquisition of an ownership interest in the property. Revenues and expenses for these services are eliminated in our statement of operations, with any profit recognized reducing our investment in our oil and natural gas properties. The contracts for these services are issued under the similar terms and rates as the contracts entered into with unrelated third parties. By providing drilling services for the oil and natural gas segment, we eliminated revenue of
$13.4 million
and
$22.1 million
during
2017
and
2015
, respectively, from our contract drilling segment and eliminated the associated operating expense of
$11.8 million
and
$18.3 million
during
2017
and
2015
, respectively, yielding
$1.6 million
and
$3.8 million
during
2017
and
2015
, respectively, as a reduction to the carrying value of our oil and natural gas properties. We eliminated no revenue or expenses in our contract drilling segment during 2016.
ARO.
We record the fair value of liabilities associated with the future plugging and abandonment of wells. In our case, when the reserves in each of our oil or gas wells deplete or otherwise become uneconomical, we must incur costs to plug and abandon the wells. These costs are recorded in the period in which the liability is incurred (at the time the wells are drilled or acquired). We have no assets restricted to settle these ARO liabilities. Our engineering staff uses historical experience to determine the estimated plugging costs considering the type of well (either oil or natural gas), the depth of the well, the physical location of the well, and the ultimate productive life to determine the estimated plugging costs. A risk-adjusted discount rate and an inflation factor are used on these estimated costs to determine the current present value of this obligation. To the extent any change in these assumptions affect future revisions and impact the present value of the existing ARO, a corresponding adjustment is made to the full cost pool.
Gas Gathering and Processing Revenue.
Our gathering and processing segment recognizes revenue from the gathering and processing of natural gas and NGLs in the period the service is provided based on contractual terms.
Insurance.
We are self-insured for certain losses relating to workers’ compensation, control of well and employee medical benefits. Insured policies for other coverage contain deductibles or retentions per occurrence that range from
zero
to
$1.0 million
. We have purchased stop-loss coverage in order to limit, to the extent feasible, per occurrence and aggregate
86
UNIT CORPORATION AND SUBSIDIARIES
NOTES TO CONSOLIDATED FINANCIAL STATEMENTS—(Continued)
exposure to certain types of claims. There is no assurance that the insurance coverages we have will adequately protect us against liability from all potential consequences. If insurance coverage becomes more expensive, we may choose to self-insure, decrease our limits, raise our deductibles, or any combination of these rather than pay higher premiums.
Derivative Activities.
All derivatives are recognized on the balance sheet and measured at fair value with the exception of normal purchase and normal sales which are expected to result in physical delivery. Any changes in our derivatives' fair value occurring before their maturity (i.e., temporary fluctuations in value) are reported in gain (loss) on derivatives in our Consolidated Statements of Operations.
We document our risk management strategy and do not engage in derivative transactions for speculative purposes.
Limited Partnerships.
Unit Petroleum Company is a general partner in
13
oil and natural gas limited partnerships sold privately and publicly. Some of our officers, directors, and employees own the interests in most of these partnerships. We share in each partnership’s revenues and costs in accordance with formulas set out in each of the limited partnership agreement. The partnerships also reimburse us for certain administrative costs incurred on behalf of the partnerships.
Income Taxes.
During the fourth quarter of 2017, the U.S. government enacted the Tax Act. Among other provisions, the Tax Act reduces the federal corporate tax rate from the existing maximum rate of
35%
to
21%
, effective January 1, 2018. The change in tax law required the Company to remeasure existing net deferred tax liabilities using the lower rate in the period of enactment resulting in the Company recording a tax benefit of
$81.3 million
in 2017 due to a revaluation of our net deferred tax liability. Measurement of net deferred tax liabilities is based on provisions of enacted tax law (including the Tax Act); the effects of future changes in tax laws or rates are not included in the measurement. Valuation allowances are established where necessary to reduce deferred tax assets to the amount expected to be realized. Income tax expense is the tax payable for the year and the change during that year in deferred tax assets and liabilities.
The accounting for uncertainty in income taxes prescribes a recognition threshold and measurement attribute for the financial statement recognition and measurement of a tax position taken or expected to be taken in a return. Guidance is also provided on de-recognition, classification, interest and penalties, accounting in interim periods, disclosure, and transition.
Natural Gas Balancing.
We use the sales method for recording natural gas sales. This method allows for recognition of revenue, which may be more or less than its share of pro-rata production from certain wells. We estimate our
December 31, 2017
balancing position to be approximately
3.7
Bcf on under-produced properties and approximately
3.8
Bcf on over-produced properties. We have recorded a receivable of
$2.4 million
on certain wells where we estimate that insufficient reserves are available for us to recover the under-production from future production volumes. We have also recorded a liability of
$3.3 million
on certain properties where we believe there are insufficient reserves available to allow the under-produced owners to recover their under-production from future production volumes. Our policy is to expense the pro-rata share of lease operating costs from all wells as incurred. Such expenses relating to the balancing position on wells in which we have imbalances are not material.
Employee and Director Stock Based Compensation.
We recognize in our financial statements the cost of employee services received in exchange for awards of equity instruments based on the grant date fair value of those awards. The amount of our equity compensation cost relating to employees directly involved in exploration activities of our oil and natural gas segment is capitalized to our oil and natural gas properties. Amounts not capitalized to our oil and natural gas properties are recognized in general and administrative expense and operating costs of our business segments. We utilize the Black-Scholes option pricing model to measure the fair value of stock options and SARs. The value of our restricted stock grants is based on the closing stock price on the date of the grants.
New Accounting Standards
Compensation—Stock Compensation.
The FASB issued ASU 2017-09, to clarify and reduce both (i) diversity in practice and (ii) cost and complexity when applying its guidance to changes in the terms of a share-based payment award. The amendment is effective for reporting periods beginning after December 15, 2017. This amendment will not have a material impact on our financial statements.
Intangibles—Goodwill and Other: Simplifying the Test for Goodwill Impairment.
The FASB issued ASU 2017-04, to simplify the measurement of goodwill. The amendment eliminates Step 2 from the goodwill impairment test. The amendment
87
UNIT CORPORATION AND SUBSIDIARIES
NOTES TO CONSOLIDATED FINANCIAL STATEMENTS—(Continued)
will be effective prospectively for reporting periods beginning after December 15, 2019, and early adoption is permitted. This amendment will not have a material impact on our financial statements.
Business Combinations; Clarifying the Definition of a Business.
The FASB issued ASU 2017-01, clarifying the definition of a business. The amendment should help companies and other organizations evaluate whether transactions should be accounted for as acquisitions (or disposals) of assets or businesses. For public companies, the amendment is effective for annual periods beginning after December 15, 2017. This amendment will not have a material impact on our financial statements.
Statement of Cash Flows: Classification of Certain Cash Receipts and Cash Payments.
The FASB issued ASU 2016-15, to address diversity in how certain transactions are presented and classified in the statement of cash flows. The amendment will be effective retrospectively for reporting periods beginning after December 31, 2017, and early adoption is permitted. This amendment will not have a material impact on our financial statements.
Leases.
The FASB has issued ASU 2016-02. The amendment will require lessees to recognize at the commencement date a lease liability, which is a lessee's obligation to make lease payments arising from a lease, measured on a discounted basis; and a right-of-use asset, which is an asset that represents the lessee's right to use a specified asset for the lease term. Lessor accounting is largely unchanged. For public companies, the amendment is effective for annual periods beginning after December 15, 2018, and interim periods within those annual periods. The standard will not apply to leases of mineral rights. We are evaluating the impact this amendment will have on our financial statements and currently evaluating a plan for implementation.
Revenue from Contracts with Customers.
The FASB has issued ASU 2014-09. This standard affects any entity using U.S. GAAP that either contracts with customers to transfer goods or services or enters into contracts for transferring nonfinancial assets unless those contracts are within the scope of other standards (e.g., insurance contracts or lease contracts). The core principle of the amendments is that an entity should recognize revenue to depict the transfer of promised goods or services to customers in an amount that reflects the consideration to which the entity expects to be entitled in exchange for those goods or services. ASU 2014-09 has been amended several times pre-issuance, which is codified in the new Topic 606, effective January 1, 2018. The guidance in this update supersedes the revenue recognition requirements in Topic 605, Revenue Recognition, and most industry-specific guidance throughout the Industry Topics of the Codification. We adopted this standard January 1, 2018 using the modified retrospective approach, which resulted in a cumulative effect adjustment upon adoption for our mid-stream segment. This adjustment related to the timing of revenue on certain demand fees which was not material to the company. Both our oil and natural gas and contract drilling segments had no retained earnings adjustment.
The application of Topic 606 will not have a material effect on our statement of operations or our balance sheet, as the timing of revenue recognized will not be materially modified, but additional footnote disclosures are required with respect to revenue. In our oil and natural gas segment, the classification of certain costs as either a deduction from revenue or an expense will be determined based on when control of the commodity transfers to the customer, which would impact total revenue recognized, but will not affect gross profit.
Part of our review included evaluation of these issues:
|
•
|
Based on an analysis of whether the transportation of gas is a performance obligation that occurs at a point in time or over time, the timing of when we recognize certain revenue elements will change. Specifically related to our mid-stream segment, certain fees collectible during a contract will be recognized over the life of the contract because these fees are part of the single performance obligation associated with the contract.
|
|
•
|
Certain of our contracts include promises to deliver a minimum volume of commodity to the customer over a defined period. If we do not meet this commitment, a deficiency fee is payable to the customer. Topic 606 requires these arrangements represent variable consideration related to the sale of the commodity, and requires that we include an estimate of any deficiency fees expected within revenue, rather than as operating costs. In addition, we will also be required to analyze fees that are billable for deficiencies in minimum volume commitments from customers for our mid-stream segment. In these instances, we will assess the likelihood of earning these fees each reporting period based on the customer’s performance and recognize variable revenue when it is not expected to be subject to a significant reversal.
|
88
UNIT CORPORATION AND SUBSIDIARIES
NOTES TO CONSOLIDATED FINANCIAL STATEMENTS—(Continued)
Our internal control framework did not materially change, but the existing internal controls have been modified to consider our new revenue recognition policy effective January 1, 2018. As we implement the new standard, we have added internal controls to ensure that we adequately evaluate new contracts under the five-step model under ASU 2014-09.
Adopted Standards
Income Taxes: Balance Sheet Classification of Deferred Taxes.
The FASB has issued ASU 2015-17. This changes how deferred taxes are classified on organizations' balance sheets. Organizations must classify all deferred tax assets and liabilities as noncurrent. The amendments apply to all organizations that present a classified balance sheet. For public companies, the amendments were effective for financial statements issued for annual periods beginning after December 15, 2016, and interim periods within those annual periods. The amendment requires current deferred tax assets to be combined with noncurrent deferred tax assets. We have adopted this ASU during the first quarter of 2017 on a prospective basis. Previously, we had a net current deferred tax asset now netted with our noncurrent deferred tax liability.
P
rior periods were not retrospectively adjusted.
Compensation—Stock Compensation: Improvements to Employee Share-Based Payment Accounting.
The FASB has issued ASU 2016-09. The amendment should improve the accounting for employee share-based payments and affect all organizations that issue share-based payment awards to their employees. Several aspects of the accounting for share-based payment award transactions are simplified, including: (a) income tax consequences; (b) classification of awards as either equity or liabilities; and (c) classification on the statement of cash flows. For public companies, the amendment was effective for annual periods beginning after December 15, 2016, and interim periods within those annual periods. The amendment primarily affects classification within the statement of cash flows between financial and operating activities. This did not have a material impact on our financial statements.
Acquisitions
On April 3, 2017, we closed on an acquisition of certain oil and natural gas assets located primarily in Grady and Caddo Counties in western Oklahoma. The final adjusted value of consideration given was
$54.3 million
.
As of
January 1, 2017
, the effective date of the acquisition, the estimated proved oil and gas reserves of the acquired properties were
3.2 million
barrels of oil equivalent (MMBoe). The acquisition added approximately
8,300
net oil and gas leasehold acres to our core Hoxbar area in southwestern Oklahoma including approximately
47
proved developed producing wells. Of the acreage acquired, approximately
71%
was held by production. We also received
one
gathering system as part of the transaction.
We accounted for this acquisition using the acquisition method under ASC 805,
Business Combinations
, which requires that the acquired assets and liabilities be recorded at their fair values as of the acquisition date. The following table summarizes the final adjusted purchase price and the values of assets acquired and liabilities assumed.
|
Final Adjusted Purchase Price
|
|||
|
Total consideration given
|
$
|
54,332
|
|
|
Final Adjusted Allocation of Purchase Price
|
|||
|
Oil and natural gas properties included in the full cost pool:
|
|||
|
Proved oil and natural gas properties
|
$
|
43,745
|
|
|
Undeveloped oil and natural gas properties
|
8,650
|
|
|
|
Total oil and natural gas properties included in the full cost pool
(1)
|
52,395
|
|
|
|
Gas gathering equipment and other
|
2,340
|
|
|
|
Asset retirement obligation
|
(403
|
)
|
|
|
Fair value of net assets acquired
|
$
|
54,332
|
|
|
(1)
|
We used a discounted cash flow model and made market assumptions as to future commodity prices, projections of estimated quantities of oil and natural gas reserves, expectations for timing and amount of future development and operating costs, projections of future rates of production, expected recovery rates, and risk adjusted discount rates.
|
89
UNIT CORPORATION AND SUBSIDIARIES
NOTES TO CONSOLIDATED FINANCIAL STATEMENTS—(Continued)
The pro forma effects of this acquired business are immaterial to the results of operations.
For 2017, we had approximately
$4.7 million
in other acquisitions.
Divestitures
Oil and Natural Gas
We had non-core asset sales with proceeds, net of related expenses, of
$18.6 million
,
$67.2 million
, and
$1.9 million
, in
2017
,
2016
, and
2015
, respectively. Proceeds from these dispositions reduced the net book value of the full cost pool with no gain or loss recognized.
Contract Drilling
During 2015, we recorded a write-down on
31
of our drilling rigs and related equipment of approximately
$8.3 million
pre-tax based on the estimated market value for similar equipment from auctions sales. We then sold all
31
of these drilling rigs and some other drilling equipment to unaffiliated third parties. The proceeds from the sale of those assets, less costs to sell, was less than the
$11.3 million
net book value resulting in a loss of
$7.3 million
pre-tax.
During December
2016
, we sold
one
idle 1500 HP SCR drilling rig to an unaffiliated third party. The proceeds of this sale, less costs to sell, exceeded the
$1.7 million
net book value of the drilling rig, resulting in a gain of
$1.6 million
.
We did
no
t have any divestitures in 2017.
The following data shows the amounts used in computing earnings (loss) per share:
|
Income (Loss)
(Numerator)
|
Weighted
Shares
(Denominator)
|
Per-Share
Amount
|
||||||||
|
|
(In thousands except per share amounts)
|
|||||||||
|
For the year ended December 31, 2015:
|
||||||||||
|
Basic loss per common share
|
$
|
(1,037,361
|
)
|
49,110
|
|
$
|
(21.12
|
)
|
||
|
Effect of dilutive stock options, restricted stock, and SARs
|
—
|
|
—
|
|
—
|
|
||||
|
Diluted loss per common share
|
$
|
(1,037,361
|
)
|
49,110
|
|
$
|
(21.12
|
)
|
||
|
For the year ended December 31, 2016:
|
||||||||||
|
Basic loss per common share
|
$
|
(135,624
|
)
|
50,029
|
|
$
|
(2.71
|
)
|
||
|
Effect of dilutive stock options, restricted stock, and SARs
|
—
|
|
—
|
|
—
|
|
||||
|
Diluted loss per common share
|
$
|
(135,624
|
)
|
50,029
|
|
$
|
(2.71
|
)
|
||
|
For the year ended December 31, 2017:
|
||||||||||
|
Basic earnings per common share
|
$
|
117,848
|
|
51,113
|
|
$
|
2.31
|
|
||
|
Effect of dilutive restricted stock
|
—
|
|
635
|
|
(0.03
|
)
|
||||
|
Diluted earnings per common share
|
$
|
117,848
|
|
51,748
|
|
$
|
2.28
|
|
||
Due to the net loss for the years ended December 31, 2016 and 2015, approximately
509,000
and
186,000
, respectively, weighted average shares related to stock options, restricted stock, and SARs were antidilutive and were excluded from the earnings per share calculation above.
90
UNIT CORPORATION AND SUBSIDIARIES
NOTES TO CONSOLIDATED FINANCIAL STATEMENTS—(Continued)
The following options and their average exercise prices were not included in the computation of diluted earnings per share because the option exercise prices were greater than the average market price of our common stock for the years ended December 31:
|
2017
|
2016
|
2015
|
|||||||||
|
Options and SARs
|
87,500
|
|
199,755
|
|
261,270
|
|
|||||
|
Average exercise price
|
$
|
51.34
|
|
$
|
48.79
|
|
$
|
50.34
|
|
||
Accrued liabilities consisted of the following as of December 31:
|
2017
|
2016
|
||||||
|
|
(In thousands)
|
||||||
|
Employee costs
|
$
|
19,521
|
|
$
|
15,394
|
|
|
|
Lease operating expenses
|
11,819
|
|
10,075
|
|
|||
|
Interest payable
|
6,745
|
|
6,524
|
|
|||
|
Taxes
|
3,404
|
|
2,219
|
|
|||
|
Third-party credits
|
2,240
|
|
2,998
|
|
|||
|
Other
|
4,794
|
|
2,441
|
|
|||
|
Total accrued liabilities
|
$
|
48,523
|
|
$
|
39,651
|
|
|
Long-term debt consisted of the following as of December 31:
|
2017
|
2016
|
||||||
|
|
(In thousands)
|
||||||
|
Credit agreement with average interest rates of 3.4% and 2.8% at December 31, 2017 and 2016, respectively
|
$
|
178,000
|
|
$
|
160,800
|
|
|
|
6.625% senior subordinated notes due 2021
|
650,000
|
|
650,000
|
|
|||
|
Total principal amount
|
$
|
828,000
|
|
$
|
810,800
|
|
|
|
Less: unamortized discount
|
(2,234
|
)
|
(2,804
|
)
|
|||
|
Less: debt issuance costs, net
|
(5,490
|
)
|
(7,079
|
)
|
|||
|
Total long-term debt
|
$
|
820,276
|
|
$
|
800,917
|
|
|
Credit Agreement.
On April 8, 2016, we amended our Senior Credit Agreement (credit agreement) scheduled to mature on
April 10, 2020
. The amount we can borrow is the lesser of the amount we elect (from time to time) as the commitment amount or the value of the borrowing base as determined by the lenders, but in either event not to exceed the maximum credit agreement amount of
$875.0 million
. Our elected commitment amount is
$475.0 million
. Our borrowing base is
$475.0 million
. We are charged a commitment fee of
0.50%
on the amount available but not borrowed. The fee varies based on the amount borrowed as a percentage of the amount of the total borrowing base. We paid
$1.0 million
in origination, agency, syndication, and other related fees. We are amortizing these fees over the life of the credit agreement. With the new amendment, we pledged the following collateral: (a)
85%
of the proved developed producing (discounted as present worth at
8%
) total value of our oil and gas properties and (b)
100%
of our ownership interest in our mid-stream affiliate, Superior Pipeline Company, L.L.C.
The borrowing base amount–which is subject to redetermination by the lenders on April 1st and October 1st of each year, is based primarily on a percentage of the discounted future value of our oil and natural gas reserves and on our cash flows from our mid-stream segment. The October 2017 redetermination did not cause any changes. We or the lenders may request a onetime special redetermination of the borrowing base between each scheduled redetermination. In addition, we may request a redetermination following the completion of an acquisition that meets the requirements set forth in the credit agreement.
91
UNIT CORPORATION AND SUBSIDIARIES
NOTES TO CONSOLIDATED FINANCIAL STATEMENTS—(Continued)
At our election, any part of the outstanding debt under the credit agreement may be fixed at a London Interbank Offered Rate (LIBOR). LIBOR interest is computed as the sum of the LIBOR base for the applicable term plus
2.00%
to
3.00%
depending on the level of debt as a percentage of the borrowing base and is payable at the end of each term, or every
90 days
,
whichever is less. Borrowings not under LIBOR bear interest at the prime rate specified in the credit agreement that cannot be less than
LIBOR plus 1.00% plus a margin
. Interest is payable at the end of each month and the principal may be repaid in whole or in part at any time, without a premium or penalty. At
December 31, 2017
, we had
$178.0 million
outstanding borrowings under our credit agreement.
We can use borrowings for financing general working capital requirements for (a) exploration, development, production and acquisition of oil and gas properties, (b) acquisitions and operation of mid-stream assets, (c) issuance of standby letters of credit, (d) contract drilling services, and (e) general corporate purposes.
The credit agreement prohibits, among other things:
|
•
|
the payment of dividends (other than stock dividends) during any fiscal year over
30%
of our consolidated net income for the preceding fiscal year;
|
|
•
|
the incurrence of additional debt with certain limited exceptions; and
|
|
•
|
the creation or existence of mortgages or liens, other than those in the ordinary course of business, on any of our properties, except for our lenders.
|
The credit agreement also requires that we have at the end of each quarter:
|
•
|
a current ratio (as defined in the credit agreement) of not less than
1 to 1
.
|
Through the quarter ending March 31, 2019, the credit agreement also requires that we have at the end of each quarter:
|
•
|
a senior indebtedness ratio of senior indebtedness to consolidated EBITDA (as defined in the credit agreement) for the most recently ended rolling four quarters of no greater than
2.75 to 1
.
|
Beginning with the quarter ending June 30, 2019, and for each quarter ending thereafter, the credit agreement requires:
|
•
|
a leverage ratio of funded debt to consolidated EBITDA (as defined in the credit agreement) for the most recently ended rolling four fiscal quarters of no greater than
4 to 1
.
|
As of
December 31, 2017
, we were in compliance with the covenants contained in the credit agreement.
6.625% Senior Subordinated Notes.
We have an aggregate principal amount of
$650.0 million
,
6.625%
senior subordinated notes (the Notes). Interest on the Notes is payable semi-annually (in arrears) on May 15 and November 15 of each year. The Notes will mature on
May 15, 2021
. In connection with the issuance of the Notes, we incurred
$14.7 million
of fees that are being amortized as debt issuance cost over the life of the Notes.
The Notes are subject to an Indenture dated as of May 18, 2011, between us and Wilmington Trust, National Association (successor to Wilmington Trust FSB), as Trustee (the Trustee), as supplemented by the First Supplemental Indenture dated as of May 18, 2011, between us, the Guarantors, and the Trustee, and as further supplemented by the Second Supplemental Indenture dated as of January 7, 2013, between us, the Guarantors and the Trustee (as supplemented, the 2011 Indenture), establishing the terms and providing for issuing the Notes. The Guarantors are our direct and indirect subsidiaries. The discussion of the Notes in this report is qualified by and subject to the actual terms of the 2011 Indenture.
Unit, as the parent company, has no independent assets or operations. The guarantees by the Guarantors of the Notes (registered under registration statements) are full and unconditional, joint and several, subject to certain automatic customary releases, are subject to certain restrictions on the sale, disposition, or transfer of the capital stock or substantially all of the assets of a subsidiary guarantor, and other conditions and terms set out in the Indenture. Any of our subsidiaries that are not Guarantors are minor. There are no significant restrictions on our ability to receive funds from our subsidiaries through dividends, loans, advances or otherwise.
We may redeem all or, from time to time, a part of the Notes at certain redemption prices, plus accrued and unpaid interest. If a “change of control” occurs, subject to certain conditions, we must offer to repurchase from each holder all or any
92
UNIT CORPORATION AND SUBSIDIARIES
NOTES TO CONSOLIDATED FINANCIAL STATEMENTS—(Continued)
part of that holder’s Notes at a purchase price in cash equal to
101%
of the principal amount of the Notes plus accrued and unpaid interest, if any, to the date of purchase. The 2011 Indenture contains customary events of default. The 2011 Indenture also contains covenants that, among other things, limit our ability and the ability of certain of our subsidiaries to incur or guarantee additional indebtedness; pay dividends on our capital stock or redeem capital stock or subordinated indebtedness; transfer or sell assets; make investments; incur liens; enter into transactions with our affiliates; and merge or consolidate with other companies. We were in compliance with all covenants of the Notes as of
December 31, 2017
.
Other Long-Term Liabilities
Other long-term liabilities consisted of the following as of December 31:
|
2017
|
2016
|
||||||
|
|
(In thousands)
|
||||||
|
ARO liability
|
$
|
69,444
|
|
$
|
70,170
|
|
|
|
Capital lease obligations
|
15,224
|
|
18,918
|
|
|||
|
Workers’ compensation
|
13,340
|
|
15,163
|
|
|||
|
Separation benefit plans
|
6,524
|
|
4,943
|
|
|||
|
Deferred compensation plan
|
5,390
|
|
4,578
|
|
|||
|
Gas balancing liability
|
3,283
|
|
3,789
|
|
|||
|
Other
|
—
|
|
410
|
|
|||
|
113,205
|
|
117,971
|
|
||||
|
Less current portion
|
13,002
|
|
14,907
|
|
|||
|
Total other long-term liabilities
|
$
|
100,203
|
|
$
|
103,064
|
|
|
Estimated annual principal payments under the terms of debt and other long-term liabilities from
2018
through
2022
are
$13.0 million
,
$45.6 million
,
$184.7 million
,
$655.9 million
, and
$2.1 million
, respectively.
Capital Leases
During 2014, our mid-stream segment entered into capital lease agreements for
twenty
compressors with initial terms of
seven
years. The underlying assets are included in gas gathering and processing equipment. The current portion of our capital lease obligations of
$3.8 million
is included in current portion of other long-term liabilities and the non-current portion of
$11.4 million
is included in other long-term liabilities in the accompanying Consolidated Balance Sheets as of
December 31, 2017
. These capital leases are discounted using annual rates of
4.0%
. Total maintenance and interest remaining related to these leases are
$5.9 million
and
$1.2 million
, respectively at
December 31, 2017
. Annual payments, net of maintenance and interest, average
$4.2 million
annually through
2021
. At the end of the term, our mid-stream segment has the option to purchase the assets at
10%
of the fair market value of the assets at that time.
Future payments required under the capital leases at
December 31, 2017
are as follows:
|
Amount
|
||||
|
Ending December 31,
|
(In thousands)
|
|||
|
2018
|
$
|
6,168
|
|
|
|
2019
|
6,168
|
|
||
|
2020
|
6,168
|
|
||
|
2021
|
3,768
|
|
||
|
Total future payments
|
22,272
|
|
||
|
Less payments related to:
|
||||
|
Maintenance
|
5,874
|
|
||
|
Interest
|
1,174
|
|
||
|
Present value of future minimum payments
|
$
|
15,224
|
|
|
93
UNIT CORPORATION AND SUBSIDIARIES
NOTES TO CONSOLIDATED FINANCIAL STATEMENTS—(Continued)
We are required to record the estimated fair value of the liabilities relating to the future retirement of our long-lived assets (AROs). Our oil and natural gas wells are plugged and abandoned when the oil and natural gas reserves in those wells are depleted or the wells are no longer able to produce. The plugging and abandonment liability for a well is recorded in the period in which the obligation is incurred (at the time the well is drilled or acquired). None of our assets are restricted for purposes of settling these AROs. All of our AROs relate to plugging costs associated with our oil and gas wells.
The following table shows certain information about our AROs for the periods indicated:
|
2017
|
2016
|
||||||
|
|
(In thousands)
|
||||||
|
ARO liability, January 1:
|
$
|
70,170
|
|
$
|
98,297
|
|
|
|
Accretion of discount
|
2,886
|
|
2,779
|
|
|||
|
Liability incurred
|
1,948
|
|
584
|
|
|||
|
Liability settled
|
(2,694
|
)
|
(1,215
|
)
|
|||
|
Liability sold
|
(1,735
|
)
|
(10,882
|
)
|
|||
|
Revision of estimates
(1)
|
(1,131
|
)
|
(19,393
|
)
|
|||
|
ARO liability, December 31:
|
69,444
|
|
70,170
|
|
|||
|
Less current portion
|
1,726
|
|
2,906
|
|
|||
|
Total long-term ARO liability
|
$
|
67,718
|
|
$
|
67,264
|
|
|
_________________________
|
(1)
|
Plugging liability estimates were revised in both 2017 and 2016 for updates in the cost of services used to plug wells over the preceding year. We had various upward and downward adjustments and changes in estimated timing of cash flows.
|
During the fourth quarter of 2017, the U.S. government enacted the Tax Act. Among its many provisions, the Tax Act reduces the federal corporate tax rate from
35%
to
21%
, effective January 1, 2018. The change in tax law required the Company to revalue its existing net deferred tax liability using the lower rate in the period of enactment resulting in the recognition of an income tax benefit of
$81.3 million
for the year ended December 31, 2017 related to that revaluation. As a result, the Company recognized an overall income tax benefit of
$57.7 million
for the year ended December 31, 2017.
Also during the fourth quarter of 2017, the SEC issued Staff Accounting Bulletin 118 (SAB 118), which provides guidance on accounting for tax effects of the Tax Act. SAB 118 provides a measurement period that should not extend beyond one year from the Tax Act enactment date for companies to complete the accounting under ASC 740. In accordance with SAB 118, a company must reflect the income tax effects of those aspects of the Act for which the accounting under ASC 740 is complete. While we were able to make reasonable estimates of the impact of the reduction in corporate rate, bonus depreciation expensing provisions, and impact of Sec 162(m) to our existing restricted stock grants, the final impact of the Tax Act may differ from these estimates, due to, among other things, changes in our interpretations and assumptions, additional guidance that may be issued by the IRS, and actions we may take.
94
UNIT CORPORATION AND SUBSIDIARIES
NOTES TO CONSOLIDATED FINANCIAL STATEMENTS—(Continued)
A reconciliation of income tax expense (benefit), computed by applying the federal statutory rate to pre-tax income (loss) to our effective income tax expense (benefit) is as follows:
|
2017
|
2016
|
2015
|
|||||||||
|
|
(In thousands)
|
||||||||||
|
Income tax expense (benefit) computed by applying the statutory rate
|
$
|
21,059
|
|
$
|
(72,386
|
)
|
$
|
(582,508
|
)
|
||
|
State income tax expense (benefit), net of federal benefit
|
1,655
|
|
(5,687
|
)
|
(45,768
|
)
|
|||||
|
Deferred tax liability revaluation
(1)
|
(81,307
|
)
|
—
|
|
—
|
|
|||||
|
Restricted stock shortfall
|
1,867
|
|
5,465
|
|
—
|
|
|||||
|
Statutory depletion and other
|
(952
|
)
|
1,414
|
|
1,328
|
|
|||||
|
Income tax benefit
|
$
|
(57,678
|
)
|
$
|
(71,194
|
)
|
$
|
(626,948
|
)
|
||
__________________________
|
(1)
|
In 2017, the revaluation from the Tax Act.
|
For the periods indicated, the total provision for income taxes consisted of the following:
|
2017
|
2016
|
2015
|
|||||||||
|
|
(In thousands)
|
||||||||||
|
Current taxes:
|
|||||||||||
|
Federal
|
$
|
—
|
|
$
|
—
|
|
$
|
(20,612
|
)
|
||
|
State
|
5
|
|
15
|
|
(4
|
)
|
|||||
|
5
|
|
15
|
|
(20,616
|
)
|
||||||
|
Deferred taxes:
|
|||||||||||
|
Federal
|
(62,788
|
)
|
(62,923
|
)
|
(535,691
|
)
|
|||||
|
State
|
5,105
|
|
(8,286
|
)
|
(70,641
|
)
|
|||||
|
(57,683
|
)
|
(71,209
|
)
|
(606,332
|
)
|
||||||
|
Total provision
|
$
|
(57,678
|
)
|
$
|
(71,194
|
)
|
$
|
(626,948
|
)
|
||
Deferred tax assets and liabilities are comprised of the following at December 31:
|
2017
|
2016
|
||||||
|
|
(In thousands)
|
||||||
|
Deferred tax assets:
|
|||||||
|
Allowance for losses and nondeductible accruals
|
$
|
32,242
|
|
$
|
53,967
|
|
|
|
Net operating loss carryforward
|
153,746
|
|
190,603
|
|
|||
|
Alternative minimum tax and research and development tax credit carryforward
|
5,409
|
|
5,409
|
|
|||
|
191,397
|
|
249,979
|
|
||||
|
Deferred tax liability:
|
|||||||
|
Depreciation, depletion, amortization, and impairment
|
(324,874
|
)
|
(440,690
|
)
|
|||
|
Net deferred tax liability
|
(133,477
|
)
|
(190,711
|
)
|
|||
|
Current deferred tax asset
|
—
|
|
25,211
|
|
|||
|
Non-current—deferred tax liability
|
$
|
(133,477
|
)
|
$
|
(215,922
|
)
|
|
Realization of the deferred tax assets are dependent on generating sufficient future taxable income. Although realization is not assured, management believes it is more likely than not that the deferred tax asset will be realized. The amount of the deferred tax asset considered realizable, however, could be reduced in the near-term if estimates of future taxable income are reduced. At
December 31, 2017
, we have federal net operating loss carryforwards of approximately
$587.9 million
which expire from
2021
to
2037
.
We file income tax returns in the U.S. federal jurisdiction and various states. We are no longer subject to U.S. federal tax examinations for years before 2016 or state income tax examinations by state taxing authorities for years before 2014. During 2014, we recognized a tax benefit relating to a research and development tax credit carryforward in conjunction with our BOSS
95
UNIT CORPORATION AND SUBSIDIARIES
NOTES TO CONSOLIDATED FINANCIAL STATEMENTS—(Continued)
drilling rig activities. Due to the nature and subjectivity surrounding the research and development credit and historical challenges by the IRS against companies who claim the credit, it was our belief that the full amount of the credit may not have been eventually allowed by the IRS once we were no longer in an AMT tax paying position. During 2017, our U.S federal tax returns for 2013, 2014, and 2015 were examined by the IRS and no additional tax was found to be due and the research and development tax credit carryforward was allowed in full. Accordingly, we
no
longer have any unrecognized tax benefits as of December 31, 2017.
Under our 401(k) Employee Thrift Plan, employees who meet specified service requirements may contribute a percentage of their total compensation, up to a specified maximum, to the plan. We may match each employee’s contribution, up to a specified maximum, in full or on a partial basis. We made discretionary contributions under the plan of
155,822
,
630,039
, and
235,104
shares of common stock and recognized expense of
$4.4 million
,
$4.0 million
, and
$6.2 million
in
2017
,
2016
, and
2015
, respectively.
We provide a salary deferral plan (Deferral Plan) which allows participants to defer the recognition of salary for income tax purposes until actual distribution of benefits which occurs at either termination of employment, death or certain defined unforeseeable emergency hardships. The liability recorded under the Deferral Plan at December 31,
2017
and
2016
was
$5.4 million
and
$4.6 million
, respectively. We recognized payroll expense and recorded a liability at the time of deferral.
Effective January 1, 1997, we adopted a separation benefit plan (Separation Plan). The Separation Plan allows eligible employees whose employment is involuntarily terminated or, in the case of an employee who has completed
20
years of service, voluntarily or involuntarily terminated, to receive benefits equivalent to four weeks salary for every whole year of service completed up to a maximum of
104
weeks. To receive payments, the recipient must waive any claims against us in exchange for receiving the separation benefits. On October 28, 1997, we adopted a Separation Benefit Plan for Senior Management (Senior Plan). The Senior Plan provides certain officers and key executives of Unit with benefits generally equivalent to the Separation Plan. The Compensation Committee of the Board of Directors has absolute discretion in the selection of the individuals covered in this plan. On May 5, 2004 we also adopted the Special Separation Benefit Plan (Special Plan). This plan is identical to the Separation Benefit Plan with the exception that the benefits under the plan vest on the earliest of a participant’s reaching the age of
65
or serving
20
years with the company.
On December 31, 2008, we amended all three Plans to be in compliance with Section 409A of the Internal Revenue Code of 1986, as amended. The key amendments to the Plans address, among other things, when distributions may be made, the timing of payments, and the circumstances under which employees become eligible to receive benefits. On December 8, 2015, we amended the Plans to change the calculation for determining the payouts at the time of a Separation of Service under the Plans. None of the amendments materially increase the benefits, grants or awards issuable under the Plans. We recognized expense of
$2.7 million
,
$3.1 million
, and
$3.0 million
in
2017
,
2016
, and
2015
, respectively, for benefits associated with anticipated payments from these separation plans.
We have entered into key employee change of control contracts with three of our current executive officers. These severance contracts have an initial
three
-year term that is automatically extended for
one
year on each anniversary, unless a notice not to extend is given by us. If a change of control of the company, as defined in the contracts, occurs during the term of the severance contract, then the contract becomes operative for a fixed
three
-year period. The severance contracts generally provide that the executive’s terms and conditions for employment (including position, work location, compensation, and benefits) will not be adversely changed during the
three
-year period after a change of control. If the executive’s employment is terminated (other than for cause, death, or disability), the executive terminates for good reason during such
three
-year period, or the executive terminates employment for any reason during the
30
-day period following the first anniversary of the change of control, and on certain terminations prior to a change of control or in connection with or in anticipation of a change of control, the executive is generally entitled to receive, in addition to certain other benefits, any earned but unpaid compensation; up to
2.9
times the executive’s base salary plus annual bonus (based on historic annual bonus); and the company matching contributions that would have been made had the executive continued to participate in the company’s 401(k) plan for up to an additional
three
years.
The severance contract provides that the executive is entitled to receive a payment in an amount sufficient to make the executive whole for any excise tax on excess parachute payments imposed under Section 4999 of the Code. As a condition to receipt of these severance benefits, the executive must remain in the employ of the company prior to change of control and render services commensurate with his position.
96
UNIT CORPORATION AND SUBSIDIARIES
NOTES TO CONSOLIDATED FINANCIAL STATEMENTS—(Continued)
Unit Petroleum Company serves as the general partner of
13
oil and gas limited partnerships (the employee partnerships) which were formed to allow certain of our qualified employees and our directors to participate in Unit Petroleum’s oil and gas exploration and production operations. Employee partnerships were formed for each year beginning with 1984 and ending with 2011. Previously, there were three non-employee partnerships, one that was formed in 1984 and two formed in 1986 (investments by third parties). Effective December 31, 2014, the 1984 partnership was dissolved and effective December 31, 2016, the two 1986 partnerships were also dissolved.
The employee partnerships formed in 1984 through 1990 were consolidated into a single consolidating partnership in 1993 and the employee partnerships formed in 1991 through 1999 were also consolidated into the consolidating partnership in 2002. The consolidation of the 1991 through the 1999 employee partnerships was done by the general partners under the authority contained in the respective partnership agreements and did not involve any vote, consent or approval by the limited partners. The employee partnerships have each had a set percentage (ranging from
1%
to
15%
) of our interest in most of the oil and natural gas wells we drill or acquire for our own account during the particular year for which the partnership was formed. The total interest the employees have in our oil and natural gas wells by participating in these partnerships does not exceed one percent.
Amounts received in the years ended December 31, from both public and private Partnerships for which Unit is a general partner are as follows:
|
2017
|
2016
|
2015
|
|||||||||
|
|
(In thousands)
|
||||||||||
|
Well supervision and other fees
|
$
|
172
|
|
$
|
254
|
|
$
|
423
|
|
||
|
General and administrative expense reimbursement
|
—
|
|
6
|
|
18
|
|
|||||
Related party transactions for contract drilling and well supervision fees are the related party’s share of such costs. These costs are billed to related parties on the same basis as billings to unrelated parties for such services. General and administrative reimbursements are both direct general and administrative expense incurred on the related party’s behalf and indirect expenses allocated to the related parties. Such allocations are based on the related party’s level of activity and are considered by management to be reasonable.
As of December 31, 2016, John Nikkel retired as director and chairman of Unit's board and is no longer considered a related party. As of 2016, Mr. Nikkel was a
25.8%
owner of Rampart Holdings, Inc. which owned 100% of Toklan Oil and Gas Company (Toklan), an oil and gas exploration and production company located in Tulsa, Oklahoma. Mr. Nikkel's son, Robert Nikkel is Toklan's President, and he owned
20.0%
of the company. In 2015, there was
one
well drilled for Toklan with
no
activity in 2016. Under its usual standard dayrate contract terms available generally to all similarly-situated customers at that time and in the same general drilling area, the Company recognized revenue from Toklan of approximately
$0.5 million
in 2015. During 2015, we received payments of
$0.9 million
with
no
accounts receivable balance at December 31, 2015. There were
no
material revenues in 2016. There were no material royalties to disclose for 2015 or 2016. Also in 2015, Toklan paid
$0.5 million
for the North Custer Gathering System, an inactive (since 2009) gathering system owned by our mid-stream segment. We determined that the capital required to re-activate that system would not provide adequate returns based on future cash flow potential. Toklan operates the North Custer Gathering System under its affiliate, West Thomas Field Services, LLC (West Thomas), a company in which Mr. John Nikkel held an approximate
25.0%
ownership interest and in which Mr. Robert Nikkel held ownership interest of approximately
20.0%
. West Thomas entered into a gas purchase agreement with our exploration and production segment in November of 2015. Payments from West Thomas under that contract amounted to
$0.4 million
and
$0.1 million
for 2016 and 2015 volumes purchased, respectively. Additionally, on March 10, 2016, Mr. Nikkel purchased in the open market
$0.4 million
in aggregate principal amount of our outstanding 6.625% senior subordinated notes due 2021. The notes pay interest semi-annually in cash in arrears on May 15 and November 15 of each year. For 2016, interest payments for May and November were approximately
$4,800
and
$13,250
, respectively.
One of our directors, G. Bailey Peyton IV, also serves as Manager of Peyton Royalties, LP, a family-controlled limited partnership that owns royalty rights in wells in the Texas and Oklahoma Panhandles. The Company in the ordinary course of business, paid royalties or lease bonuses, primarily due to its status as successor in interest to prior transactions and as operator of the wells involved and, in some cases, as lessee, with respect to certain wells in which Mr. Peyton, members of Mr. Peyton's
97
UNIT CORPORATION AND SUBSIDIARIES
NOTES TO CONSOLIDATED FINANCIAL STATEMENTS—(Continued)
family, and Peyton Royalties, LP have an interest. Such payments totaled approximately
$0.7 million
,
$0.5 million
, and
$0.8 million
during 2017, 2016, and 2015, respectively.
Our Audit Committee and the board, in accordance with our related party transaction policy, have determined that these arrangements are in the best interest of the Company.
For restricted stock awards, we had:
|
2017
|
2016
|
2015
|
|||||||||
|
|
(In millions)
|
||||||||||
|
Recognized stock compensation expense
|
$
|
13.3
|
|
$
|
9.6
|
|
$
|
15.3
|
|
||
|
Capitalized stock compensation cost for our oil and natural gas properties
|
1.8
|
|
2.1
|
|
3.5
|
|
|||||
|
Tax benefit on stock based compensation
|
5.0
|
|
3.6
|
|
5.8
|
|
|||||
The remaining unrecognized compensation cost related to unvested awards at
December 31, 2017
is approximately
$12.8 million
of which
$1.3 million
is anticipated to be capitalized. The weighted average period of time over which this cost will be recognized is
0.7
of a year.
The Second Amended and Restated Unit Corporation Stock and Incentive Compensation Plan effective May 6, 2015 (the amended plan) allows us to grant stock-based and cash-based compensation to our employees (including employees of subsidiaries) and to non-employee directors. A total of
7,230,000
shares of the company's common stock is authorized for issuance to eligible participants under the amended plan with
2.0 million
shares being the maximum number of shares that can be issued as “incentive stock options.” Awards under this plan may be granted in any one or a combination of the following:
|
•
|
incentive stock options under Section 422 of the Internal Revenue Code;
|
|
•
|
non-qualified stock options;
|
|
•
|
performance shares;
|
|
•
|
performance units;
|
|
•
|
restricted stock;
|
|
•
|
restricted stock units;
|
|
•
|
stock appreciation rights;
|
|
•
|
cash based awards; and
|
|
•
|
other stock-based awards.
|
This plan also contains various limits as to the amount of awards that can be given to an employee in any fiscal year. All awards are generally subject to the minimum vesting periods, as determined by our Compensation Committee and included in the award agreement.
Expected volatilities are based on the historical volatility of our stock. We use historical data to estimate option exercise and termination rates within the model and aggregate groups that have similar historical exercise behavior for valuation purposes. To date, we have not paid dividends on our stock. The risk free interest rate is computed from the United States Treasury Strips rate using the term over which it is anticipated the grant will be exercised.
98
UNIT CORPORATION AND SUBSIDIARIES
NOTES TO CONSOLIDATED FINANCIAL STATEMENTS—(Continued)
SARs
Activity pertaining to SARs granted under the amended plan is as follows:
|
Number of
Shares
|
Weighted
Average
Price
|
|||||
|
Outstanding at January 1, 2015
|
131,770
|
|
$
|
46.60
|
|
|
|
Granted
|
—
|
|
—
|
|
||
|
Exercised
|
—
|
|
—
|
|
||
|
Forfeited
|
—
|
|
—
|
|
||
|
Outstanding at December 31, 2015
|
131,770
|
|
46.60
|
|
||
|
Granted
|
—
|
|
—
|
|
||
|
Exercised
|
—
|
|
—
|
|
||
|
Forfeited
|
(40,515
|
)
|
51.76
|
|
||
|
Outstanding at December 31, 2016
|
91,255
|
|
44.31
|
|
||
|
Granted
|
—
|
|
—
|
|
||
|
Exercised
|
—
|
|
—
|
|
||
|
Forfeited
|
(91,255
|
)
|
44.31
|
|
||
|
Outstanding at December 31, 2017
|
—
|
|
$
|
—
|
|
|
There were
no
SARs granted or vested during
2017
,
2016
, or
2015
. There were no SARs exercised in
2017
. The SARs expired after
10
years from the date of the grant, and there were
no
outstanding shares at
December 31, 2017
.
99
UNIT CORPORATION AND SUBSIDIARIES
NOTES TO CONSOLIDATED FINANCIAL STATEMENTS—(Continued)
Restricted Stock
Activity pertaining to restricted stock awards granted under the amended plan is as follows:
|
Employees
|
Number of Time Vested Shares
|
Number of Performance Vested Shares
|
Total Number of
Shares
|
Weighted
Average
Price
|
||||||||
|
Nonvested at January 1, 2015
|
724,766
|
|
175,520
|
|
900,286
|
|
$
|
50.81
|
|
|||
|
Granted
|
576,361
|
|
148,081
|
|
724,442
|
|
34.06
|
|
||||
|
Vested
|
(343,657
|
)
|
(39,245
|
)
|
(382,902
|
)
|
49.69
|
|
||||
|
Forfeited
|
(20,808
|
)
|
(7,196
|
)
|
(28,004
|
)
|
45.33
|
|
||||
|
Nonvested at December 31, 2015
|
936,662
|
|
277,160
|
|
1,213,822
|
|
41.29
|
|
||||
|
Granted
|
494,078
|
|
152,373
|
|
646,451
|
|
5.62
|
|
||||
|
Vested
|
(425,195
|
)
|
—
|
|
(425,195
|
)
|
43.47
|
|
||||
|
Forfeited
|
(75,808
|
)
|
(57,405
|
)
|
(133,213
|
)
|
36.87
|
|
||||
|
Nonvested at December 31, 2016
|
929,737
|
|
372,128
|
|
1,301,865
|
|
23.32
|
|
||||
|
Granted
|
485,799
|
|
173,373
|
|
659,172
|
|
26.07
|
|
||||
|
Vested
|
(455,570
|
)
|
(62,119
|
)
|
(517,689
|
)
|
29.87
|
|
||||
|
Forfeited
|
(44,408
|
)
|
(34,953
|
)
|
(79,361
|
)
|
38.87
|
|
||||
|
Nonvested at December 31, 2017
|
915,558
|
|
448,429
|
|
1,363,987
|
|
$
|
21.25
|
|
|||
|
Non-Employee Directors
|
Number of
Shares
|
Weighted
Average
Price
|
||||
|
Nonvested at January 1, 2015
|
35,136
|
|
$
|
50.08
|
|
|
|
Granted
|
25,848
|
|
34.04
|
|
||
|
Vested
|
(18,920
|
)
|
46.51
|
|
||
|
Forfeited
|
—
|
|
—
|
|
||
|
Nonvested at December 31, 2015
|
42,064
|
|
$
|
41.83
|
|
|
|
Granted
|
90,000
|
|
12.02
|
|
||
|
Vested
|
(20,248
|
)
|
43.46
|
|
||
|
Forfeited
|
—
|
|
—
|
|
||
|
Nonvested at December 31, 2016
|
111,816
|
|
$
|
17.21
|
|
|
|
Granted
|
49,104
|
|
17.92
|
|
||
|
Vested
|
(43,206
|
)
|
21.24
|
|
||
|
Forfeited
|
—
|
|
—
|
|
||
|
Nonvested at December 31, 2017
|
117,714
|
|
$
|
16.03
|
|
|
The time vested restricted stock awards granted are being recognized over a
three
year vesting period. During 2016, there were two different performance vested restricted stock awards granted to certain executive officers. The first will cliff vest three years from the grant date based on the company's achievement of certain stock performance measures at the end of the term and will range from
0%
to
200%
of the restricted shares granted as performance shares. The second will vest, one-third each year, over a three year vesting period based on the company's achievement of cash flow to total assets (CFTA) performance measurement each year and will range from
0%
to
200%
. Based on a probability assessment of the selected performance criteria at December 31, 2017, the participants are estimated to receive
82%
of the 2017,
159%
of the 2016, and
100%
of the 2015 performance based shares. The CFTA performance measurement at December 31, 2017 for the one-third vesting in 2018 was assessed to vest at
131%
. The CFTA performance measurement for future years was assessed to vest at target or
100%
.
The fair value of the restricted stock granted in
2017
,
2016
, and
2015
at the grant date was
$17.4 million
,
$4.5 million
, and
$24.5 million
, respectively. The aggregate intrinsic value of the
560,895
shares of restricted stock that vested in
2017
on
100
UNIT CORPORATION AND SUBSIDIARIES
NOTES TO CONSOLIDATED FINANCIAL STATEMENTS—(Continued)
their vesting date was
$12.3 million
. The aggregate intrinsic value of the
1,481,701
shares of restricted stock outstanding subject to vesting at December 31,
2017
was
$32.6 million
with a weighted average remaining life of
0.9
of a year.
Employee Stock Option Plan
The Stock Option Plan, provided the granting of options for up to
2,700,000
shares of common stock to officers and employees. The option plan permitted the issuance of qualified or nonqualified stock options. Options granted typically became exercisable at the rate of
20%
per year one year after being granted and expire after
10 years
from the original grant date. The exercise price for options granted under this plan was the fair market value of the common stock on the date of the grant. In 2006, as a result of the approval of the adoption of the Unit Corporation Stock and Incentive Compensation Plan, no further awards were made under this plan. During 2015, the remaining options expired.
Activity pertaining to the Stock Option Plan is as follows:
|
Number of
Shares
|
Weighted
Average
Exercise
Price
|
|||||
|
Outstanding at January 1, 2015
|
9,500
|
|
$
|
37.69
|
|
|
|
Granted
|
—
|
|
—
|
|
||
|
Exercised
|
—
|
|
—
|
|
||
|
Forfeited
|
(9,500
|
)
|
37.69
|
|
||
|
Outstanding at December 31, 2015
|
—
|
|
—
|
|
||
|
Granted
|
—
|
|
—
|
|
||
|
Exercised
|
—
|
|
—
|
|
||
|
Forfeited
|
—
|
|
—
|
|
||
|
Outstanding at December 31, 2016
|
—
|
|
—
|
|
||
|
Granted
|
—
|
|
—
|
|
||
|
Exercised
|
—
|
|
—
|
|
||
|
Forfeited
|
—
|
|
—
|
|
||
|
Outstanding at December 31, 2017
|
—
|
|
$
|
—
|
|
|
As of December 31, 2015, there were no further options outstanding or exercisable in this plan.
Non-Employee Directors' Stock Option Plan
Under the Unit Corporation 2000 Non-Employee Directors’ Stock Option Plan, on the first business day following each annual meeting of shareholders, each person who was then a member of our Board of Directors and who was not then an employee of the company or any of its subsidiaries was granted an option to purchase
3,500
shares of common stock. The option price for each stock option was the fair market value of the common stock on the date the stock options were granted. The term of each option is
10 years
and cannot be increased and no stock options were to be exercised during the first
six months
of its term except in case of death. On May 2, 2012, our stockholders approved the amended plan which succeeds this plan, the remaining available shares were transferred over to the new plan and no further awards were made under the non-employee director option plan.
101
UNIT CORPORATION AND SUBSIDIARIES
NOTES TO CONSOLIDATED FINANCIAL STATEMENTS—(Continued)
Activity pertaining to the Directors’ Plan is as follows:
|
Number of
Shares
|
Weighted
Average
Exercise
Price
|
|||||
|
Outstanding at January 1, 2015
|
150,500
|
|
$
|
54.18
|
|
|
|
Granted
|
—
|
|
—
|
|
||
|
Exercised
|
—
|
|
—
|
|
||
|
Forfeited
|
(21,000
|
)
|
54.35
|
|
||
|
Outstanding at December 31, 2015
|
129,500
|
|
54.15
|
|
||
|
Granted
|
—
|
|
—
|
|
||
|
Exercised
|
—
|
|
—
|
|
||
|
Forfeited
|
(21,000
|
)
|
62.40
|
|
||
|
Outstanding at December 31, 2016
|
108,500
|
|
52.56
|
|
||
|
Granted
|
—
|
|
—
|
|
||
|
Exercised
|
—
|
|
—
|
|
||
|
Forfeited
|
(21,000
|
)
|
57.63
|
|
||
|
Outstanding at December 31, 2017
|
87,500
|
|
$
|
51.34
|
|
|
There were no options exercised in
2017
.
|
|
Outstanding and Exercisable
Options at December 31, 2017 |
|||||||
|
Weighted Average Exercise Price
|
Number
of Shares
|
Weighted Average Remaining
Contractual Life |
Weighted Average
Exercise Price |
|||||
|
$31.30 - $41.21
|
38,500
|
|
1.9 years
|
$
|
37.58
|
|
||
|
$53.81 - $73.26
|
49,000
|
|
2.1 years
|
$
|
62.15
|
|
||
There was no aggregate intrinsic value of the shares outstanding subject to options at
December 31, 2017
. The remaining weighted average remaining contractual term is
2.0 years
.
Commodity Derivatives
We have entered into various types of derivative transactions covering some of our projected natural gas, NGLs, and oil production. These transactions are intended to reduce our exposure to market price volatility by setting the price(s) we will receive for that production. Our decisions on the price(s), type, and quantity of our production subject to a derivative contract are based, in part, on our view of current and future market conditions. As of
December 31, 2017
, our derivative transactions consisted of the following types of hedges:
|
•
|
Swaps.
We receive or pay a fixed price for the commodity and pay or receive a floating market price to the counterparty. The fixed-price payment and the floating-price payment are netted, resulting in a net amount due to or from the counterparty.
|
|
•
|
Basis Swaps.
We receive or pay the NYMEX settlement value plus or minus a fixed delivery point price for the commodity and pay or receive the published index price at the specified delivery point. We use basis swaps to hedge the price risk between NYMEX and its physical delivery points.
|
102
UNIT CORPORATION AND SUBSIDIARIES
NOTES TO CONSOLIDATED FINANCIAL STATEMENTS—(Continued)
|
•
|
Collars.
A collar contains a fixed floor price (put) and a ceiling price (call). If the market price exceeds the call strike price or falls below the put strike price, we receive the fixed price and pay the market price. If the market price is between the call and the put strike price, no payments are due from either party.
|
|
•
|
Three-way collars.
A three-way collar contains a fixed floor price (long put), fixed subfloor price (short put) and a fixed ceiling price (short call). If the market price exceeds the ceiling strike price, we receive the ceiling strike price and pay the market price. If the market price is between the ceiling and the floor strike price, no payments are due from either party. If the market price is below the floor price but above the subfloor price, we receive the floor strike price and pay the market price. If the market price is below the subfloor price, we receive the market price plus the difference between the floor and subfloor strike prices and pay the market price.
|
We have documented policies and procedures to monitor and control the use of derivative instruments. We do not engage in derivative transactions for speculative purposes. All derivatives are recognized on the balance sheet and measured at fair value. Any changes in our derivatives' fair value occurring before their maturity (i.e., temporary fluctuations in value) are reported in gain (loss) on derivatives in our Consolidated Statements of Operations.
At
December 31, 2017
, the following non-designated hedges were outstanding:
|
Term
|
Commodity
|
Contracted Volume
|
Weighted Average
Fixed Price for Swaps
|
Contracted Market
|
||||
|
Jan’18 – Dec’18
|
Natural gas – swap
|
20,000 MMBtu/day
|
$3.013
|
IF – NYMEX (HH)
|
||||
|
Apr'18 – Oct'18
|
Natural gas – swap
|
10,000 MMBtu/day
|
$2.990
|
IF – NYMEX (HH)
|
||||
|
Jan’18 – Mar'18
|
Natural gas – basis swap
|
10,000 MMBtu/day
|
$(0.208)
|
IF – NYMEX (HH)
|
||||
|
Nov’18 – Dec'18
|
Natural gas – basis swap
|
10,000 MMBtu/day
|
$(0.208)
|
IF – NYMEX (HH)
|
||||
|
Jan’18 – Mar'18
|
Natural gas – three-way collar
|
60,000 MMBtu/day
|
$3.29 - $2.63 - $4.07
|
IF – NYMEX (HH)
|
||||
|
Apr’18 – Dec'18
|
Natural gas – three-way collar
|
20,000 MMBtu/day
|
$3.00 - $2.50 - $3.51
|
IF – NYMEX (HH)
|
||||
|
Jan’18 – Dec'18
|
Crude oil – swap
|
3,000 Bbl/day
|
$51.36
|
WTI – NYMEX
|
||||
|
Jan’18 – Mar'18
|
Crude oil – collar
|
500 Bbl/day
|
$55.00 - $59.50
|
WTI – NYMEX
|
||||
|
Jan’18 – Dec'18
|
Crude oil – three-way collar
|
2,000 Bbl/day
|
$47.50 - $37.50 - $56.08
|
WTI – NYMEX
|
||||
|
Apr’18 – Sep'18
|
Liquids (Propane) – swap
|
1,000 Bbl/day
|
$31.16
|
MONT BELVIEU
|
||||
After
December 31, 2017
, the following non-designated hedges were entered into:
|
Term
|
Commodity
|
Contracted Volume
|
Weighted Average
Fixed Price for Swaps |
Contracted Market
|
||||
|
Apr’18 – Sep'18
|
Natural gas – swap
|
10,000 MMBtu/day
|
$2.925
|
IF – NYMEX (HH)
|
||||
|
Apr’18 – Sep'18
|
Natural gas – collar
|
30,000 MMBtu/day
|
$2.67 - $2.97
|
IF – NYMEX (HH)
|
||||
|
Feb’18 – Dec'18
|
Natural gas – basis swap
|
10,000 MMBtu/day
|
$(0.678)
|
PEPL
|
||||
|
Feb’18 – Dec'18
|
Natural gas – basis swap
|
10,000 MMBtu/day
|
$(0.568)
|
NGPL MIDCON
|
||||
|
Apr’18 – Oct'18
|
Natural gas – basis swap
|
10,000 MMBtu/day
|
$(0.190)
|
NGPL TEXOK
|
||||
|
Jan'19 – Dec'19
|
Natural gas – basis swap
|
10,000 MMBtu/day
|
$(0.728)
|
PEPL
|
||||
|
Jan'19 – Dec'19
|
Natural gas – basis swap
|
10,000 MMBtu/day
|
$(0.625)
|
NGPL MIDCON
|
||||
|
Jan'19 – Dec'19
|
Natural gas – basis swap
|
20,000 MMBtu/day
|
$(0.273)
|
NGPL TEXOK
|
||||
|
Jan'20 – Dec'20
|
Natural gas – basis swap
|
20,000 MMBtu/day
|
$(0.280)
|
NGPL TEXOK
|
||||
|
Apr'18 – Dec'18
|
Crude oil – swap
|
1,000 Bbl/day
|
$60.00
|
WTI – NYMEX
|
||||
|
Apr’18 – Sep'18
|
Liquids – swap
|
500 Bbl/day
|
$34.10
|
MONT BELVIEU
|
||||
103
UNIT CORPORATION AND SUBSIDIARIES
NOTES TO CONSOLIDATED FINANCIAL STATEMENTS—(Continued)
The following tables present the fair values and locations of the derivative transactions recorded in our Consolidated Balance Sheets at December 31:
|
|
Derivative Assets
Fair Value
|
|||||||||
|
Balance Sheet Location
|
2017
|
2016
|
||||||||
|
|
|
(In thousands)
|
||||||||
|
Commodity derivatives:
|
||||||||||
|
Current
|
Current derivative assets
|
$
|
721
|
|
$
|
—
|
|
|||
|
Long-term
|
Non-current derivative assets
|
—
|
|
377
|
|
|||||
|
Total derivative assets
|
$
|
721
|
|
$
|
377
|
|
||||
|
|
Derivative Liabilities
Fair Value
|
|||||||||
|
Balance Sheet Location
|
2017
|
2016
|
||||||||
|
|
|
(In thousands)
|
||||||||
|
Commodity derivatives:
|
||||||||||
|
Current
|
Current derivative liabilities
|
$
|
7,763
|
|
$
|
21,564
|
|
|||
|
Long-term
|
Non-current derivative liabilities
|
—
|
|
415
|
|
|||||
|
Total derivative liabilities
|
$
|
7,763
|
|
$
|
21,979
|
|
||||
If a legal right of set-off exists, we net the value of the derivative transactions we have with the same counterparty in our Consolidated Balance Sheets.
Effect of derivative instruments on the Consolidated Statements of Operations for the year ended December 31:
|
Derivatives Instruments
|
Location of Gain or (Loss)
Recognized in Income on
Derivative
|
Amount of Gain or (Loss)
Recognized in Income on
Derivative
|
||||||||
|
2017
|
2016
|
|||||||||
|
|
|
(In thousands)
|
||||||||
|
Commodity derivatives
|
Gain (loss) on derivatives
(1)
|
$
|
14,732
|
|
$
|
(22,813
|
)
|
|||
|
Total
|
$
|
14,732
|
|
$
|
(22,813
|
)
|
||||
_________________________
|
(1)
|
Amount settled during the period are gains of
$173
and
$9,658
, respectively.
|
104
UNIT CORPORATION AND SUBSIDIARIES
NOTES TO CONSOLIDATED FINANCIAL STATEMENTS—(Continued)
The estimated fair value of our available-for-sale securities, reflected on our Unaudited Condensed Consolidated Balance Sheets as Non-current other assets, is based on market quotes. The following is a summary of available-for-sale securities:
|
Cost
|
Gross Unrealized Gains
|
Gross Unrealized Losses
|
Estimated Fair Value
|
|||||||||||||
|
(In thousands)
|
||||||||||||||||
|
Equity Securities:
|
||||||||||||||||
|
December 31, 2017
|
$
|
830
|
|
$
|
102
|
|
$
|
—
|
|
$
|
932
|
|
||||
|
December 31, 2016
|
$
|
—
|
|
$
|
—
|
|
$
|
—
|
|
$
|
—
|
|
||||
During the second quarter of 2017, we received available-for-sale securities for early termination fees associated with a long-term drilling contract. We will evaluate the marketable equity securities to determine if any decline in fair value below cost is other-than-temporary. If a decline in fair value below cost is determined to be other-than-temporary, an impairment charge will be recorded and a new cost basis established. We will review several factors to determine whether a loss is other-than-temporary. These factors include, but are not limited to, (i) the length of time a security is in an unrealized loss position, (ii) the extent to which fair value is less than cost, (iii) the financial condition and near-term prospects of the issuer, and (iv) our intent and ability to hold the security for a period of time sufficient to allow for any anticipated recovery in fair value. These securities would be classified as Level 2.
Fair value is defined as the amount that would be received from the sale of an asset or paid for the transfer of a liability in an orderly transaction between market participants (in either case, an exit price). To estimate an exit price, a three-level hierarchy is used prioritizing the valuation techniques used to measure fair value into three levels with the highest priority given to Level 1 and the lowest priority given to Level 3. The levels are summarized as follows:
|
•
|
Level 1—unadjusted quoted prices in active markets for identical assets and liabilities.
|
|
•
|
Level 2—significant observable pricing inputs other than quoted prices included within level 1 that are either directly or indirectly observable as of the reporting date. Essentially, inputs (variables used in the pricing models) that are derived principally from or corroborated by observable market data.
|
|
•
|
Level 3—generally unobservable inputs which are developed based on the best information available and may include our own internal data.
|
The inputs available to us determine the valuation technique we use to measure the fair values of our financial instruments.
The following tables set forth our recurring fair value measurements:
|
|
December 31, 2017
|
||||||||||||||
|
|
Level 2
|
Level 3
|
Effect of Netting
|
Total
|
|||||||||||
|
|
(In thousands)
|
||||||||||||||
|
Financial assets (liabilities):
|
|||||||||||||||
|
Commodity derivatives:
|
|||||||||||||||
|
Assets
|
$
|
2,137
|
|
$
|
3,344
|
|
$
|
(4,760
|
)
|
$
|
721
|
|
|||
|
Liabilities
|
(8,973
|
)
|
(3,550
|
)
|
4,760
|
|
(7,763
|
)
|
|||||||
|
$
|
(6,836
|
)
|
$
|
(206
|
)
|
$
|
—
|
|
$
|
(7,042
|
)
|
||||
105
UNIT CORPORATION AND SUBSIDIARIES
NOTES TO CONSOLIDATED FINANCIAL STATEMENTS—(Continued)
|
|
December 31, 2016
|
||||||||||||||
|
|
Level 2
|
Level 3
|
Effect of Netting
|
Total
|
|||||||||||
|
|
(In thousands)
|
||||||||||||||
|
Financial assets (liabilities):
|
|||||||||||||||
|
Commodity derivatives:
|
|||||||||||||||
|
Assets
|
$
|
878
|
|
$
|
43
|
|
$
|
(544
|
)
|
$
|
377
|
|
|||
|
Liabilities
|
(15,358
|
)
|
(7,165
|
)
|
544
|
|
(21,979
|
)
|
|||||||
|
$
|
(14,480
|
)
|
$
|
(7,122
|
)
|
$
|
—
|
|
$
|
(21,602
|
)
|
||||
All of our counterparties are subject to master netting arrangements. If a legal right of set-off exists, we net the value of the derivative transactions we have with the same counterparty. We are not required to post any cash collateral with our counterparties and
no
collateral has been posted as of
December 31, 2017
.
The following methods and assumptions were used to estimate the fair values of the assets and liabilities in the table above. There were
no
transfers between Level 2 and Level 3 financial assets (liabilities).
Level 2 Fair Value Measurements
Commodity Derivatives
. We measure the fair values of our crude oil and natural gas swaps using estimated internal discounted cash flow calculations based on the NYMEX futures index.
Level 3 Fair Value Measurements
Commodity Derivatives
. The fair values of our natural gas and crude oil collars are estimated using internal discounted cash flow calculations based on forward price curves, quotes obtained from brokers for contracts with similar terms, or quotes obtained from counterparties to the agreements.
The following tables are reconciliations of our level 3 fair value measurements:
|
|
Net Derivatives
|
||||||
|
|
For the Year Ended,
|
||||||
|
December 31, 2017
|
December 31, 2016
|
||||||
|
|
(In thousands)
|
||||||
|
Beginning of period
|
$
|
(7,122
|
)
|
$
|
9,094
|
|
|
|
Total gains or losses:
|
|||||||
|
Included in earnings
(1)
|
7,791
|
|
(9,042
|
)
|
|||
|
Settlements
|
(875
|
)
|
(7,174
|
)
|
|||
|
End of period
|
$
|
(206
|
)
|
$
|
(7,122
|
)
|
|
|
Total gains (losses) for the period included in earnings attributable to the change in unrealized loss relating to assets still held at end of period
|
$
|
6,916
|
|
$
|
(16,216
|
)
|
|
_________________________
|
(1)
|
Commodity derivatives are reported in the Consolidated Statements of Operations in gain (loss) on derivatives.
|
106
UNIT CORPORATION AND SUBSIDIARIES
NOTES TO CONSOLIDATED FINANCIAL STATEMENTS—(Continued)
The following table provides quantitative information about our Level 3 unobservable inputs at
December 31, 2017
:
|
Commodity
(1)
|
Fair Value
|
Valuation Technique
|
Unobservable Input
|
Range
|
||
|
|
(In thousands)
|
|
|
|
||
|
Oil collars
|
$
|
(77
|
)
|
Discounted cash flow
|
Forward commodity price curve
|
$0.00 - $2.48
|
|
Oil three-way collar
|
(3,473
|
)
|
Discounted cash flow
|
Forward commodity price curve
|
$0.00 - $5.96
|
|
|
Natural gas three-way collar
|
3,344
|
|
Discounted cash flow
|
Forward commodity price curve
|
$0.00 - $0.68
|
|
_________________________
|
(1)
|
The commodity contracts detailed in this category include non-exchange-traded crude oil collars and crude and natural gas three-way collars that are valued based on NYMEX. The forward pricing range represents the low and high price expected to be received within the settlement period.
|
Based on our valuation at
December 31, 2017
, we determined that the non-performance risk with regard to our counterparties was immaterial.
Fair Value of Other Financial Instruments
The following disclosure of the estimated fair value of financial instruments is made in accordance with accounting guidance for financial instruments. We have determined the estimated fair values by using available market information and valuation methodologies. Considerable judgment is required in interpreting market data to develop the estimates of fair value. The use of different market assumptions or valuation methodologies may have a material effect on the estimated fair value amounts.
At
December 31, 2017
, the carrying values on the consolidated balance sheets for cash and cash equivalents (classified as Level 1), accounts receivable, accounts payable, other current assets, and current liabilities approximate their fair value because of their short term nature.
Based on the borrowing rates currently available to us for credit agreement debt with similar terms and maturities and also considering the risk of our non-performance, long-term debt under our credit agreement at
December 31, 2017
approximates its fair value. This debt would be classified as Level 2.
The carrying amounts of long-term debt, net of unamortized discount and debt issuance costs, associated with the Notes reported in the Consolidated Balance Sheets at
December 31, 2017
and
December 31, 2016
were
$642.3 million
and
$640.1 million
, respectively. We estimate the fair value of these Notes using quoted marked prices at
December 31, 2017
and
December 31, 2016
were
$649.7 million
and
$649.9 million
, respectively. These Notes would be classified as Level 2.
Fair Value of Non-Financial Instruments
The initial measurement of AROs at fair value is calculated using discounted cash flow techniques and based on internal estimates of future retirement costs associated with property, plant, and equipment. Significant Level 3 inputs used in the calculation of AROs include plugging costs and remaining reserve lives. A reconciliation of the Company’s AROs is presented in Note 7 – Asset Retirement Obligations.
Non-recurring fair value measurements are also applied, when applicable, to determine the fair value of our long-lived assets and goodwill. During 2016 and 2015, we recorded non-cash impairment charges discussed further in Note 2 – Summary of Significant Accounting Policies. The valuation of these assets requires the use of significant unobservable inputs classified as Level 3.
We lease office space or yards in Edmond and Oklahoma City, Oklahoma; Houston, Texas; Englewood, Colorado; Pinedale, Wyoming; and Canonsburg, Pennsylvania under the terms of operating leases expiring through
December 2021
. Additionally, we have several compressor rentals, equipment leases, and lease space on short-term commitments to stack excess drilling rig equipment and production inventory.
Future minimum rental payments under the terms of the leases are approximately
$2.7 million
,
$0.6 million
,
$0.4 million
, and
$0.1 million
in 2018 through 2021, respectively. Total rent expense incurred was
$8.8 million
,
$11.1 million
, and
$12.9 million
in
2017
,
2016
, and
2015
, respectively.
107
UNIT CORPORATION AND SUBSIDIARIES
NOTES TO CONSOLIDATED FINANCIAL STATEMENTS—(Continued)
During 2014, our mid-stream segment entered into capital lease agreements for
twenty
compressors with initial terms of
seven
years. Future capital lease payments under the terms are approximately
$6.2 million
each year through 2020 and approximately
$3.8 million
in 2021. Total maintenance and interest remaining related to these leases are
$5.9 million
and
$1.2 million
, respectively at
December 31, 2017
. Annual payments, net of maintenance and interest, average
$4.2 million
annually through
2021
. At the end of the term, our mid-stream segment has the option to purchase the assets at
10%
of the fair market value of the assets at that time.
The employee oil and gas limited partnerships require, on the election of a limited partner, that we repurchase the limited partner’s interest at amounts to be determined by appraisal in the future. These repurchases in any one year are limited to
20%
of the units outstanding. We made repurchases of approximately
$2,900
,
$5,000
,
$118,000
in
2017
,
2016
, and
2015
, respectively.
We manage our exposure to environmental liabilities on properties to be acquired by identifying existing problems and assessing the potential liability. We also conduct periodic reviews, on a company-wide basis, to identify changes in our environmental risk profile. These reviews evaluate whether there is a probable liability, its amount, and the likelihood that the liability will be incurred. The amount of any potential liability is determined by considering, among other matters, incremental direct costs of any likely remediation and the proportionate cost of employees who are expected to devote a significant amount of time directly to any possible remediation effort. As it relates to evaluations of purchased properties, depending on the extent of an identified environmental problem, we may exclude a property from the acquisition, require the seller to remediate the property to our satisfaction, or agree to assume liability for the remediation of the property.
We have not historically experienced any environmental liability while being a contract driller since the greatest portion of risk is borne by the operator. Any liabilities we have incurred have been small and have been resolved while the drilling rig is on the location and the cost has been included in the direct cost of drilling the well.
For 2018, we have committed to purchase approximately
$3.9 million
of new drilling rig components.
We are a party to various litigation matters and claims that have arisen in the normal course of our operations. While the results of litigation and claims cannot be predicted with certainty, we believe the reasonably possible losses from such matter, individually and in the aggregate, are not material. Additionally, we believe the probable final outcome of such matters will not have a material adverse effect on our results of operations, financial position, or cash flows.
At-the-Market (ATM) Common Stock Program
On April 4, 2017, we entered into a Distribution Agreement (the Agreement) with a sales agent, under which we may offer and sell, from time to time, through the sales agent shares of our common stock, par value
$0.20
per share (the Shares), up to an aggregate offering price of
$100.0 million
. We intend to use the net proceeds from these sales to fund (or offset costs of) acquisitions, future capital expenditures, repay amounts outstanding under our revolving credit facility, and general corporate purposes.
Under the Agreement, the sales agent may sell the Shares by methods deemed to be an “at-the-market” offering as defined in Rule 415 promulgated under the Securities Act of 1933, as amended, including sales made directly on the NYSE, on any other existing trading market for the Shares or to or through a market maker. In addition, under the Agreement, the sales agent may sell the Shares by any other method permitted by law, including in privately negotiated transactions. Subject to the terms and conditions of the Agreement, the sales agent will use commercially reasonable efforts, consistent with its normal trading and sales practices and applicable state and federal law, rules and regulations and the rules of the NYSE, to sell the Shares from time to time, based on our instructions (including any price, time or size limits or other customary parameters or conditions that we may impose).
We are not obligated to make any sales of the Shares under the Agreement. The offering of Shares under the Agreement will terminate on the earlier of (1) the sale of all of the Shares subject to the Agreement or (2) the termination of the Agreement by the sales agent or us. We will pay the sales agent a commission of
2.0%
of the gross sales price per share sold and have agreed to provide the sales agent with customary indemnification and contribution rights.
108
UNIT CORPORATION AND SUBSIDIARIES
NOTES TO CONSOLIDATED FINANCIAL STATEMENTS—(Continued)
As of
December 31, 2017
, we sold
787,547
shares of our common stock resulting in net proceeds of approximately
$18.6 million
. No shares were sold in the fourth quarter of 2017.
Accumulated Other Comprehensive Income
Components of accumulated other comprehensive income were as follows for the years ended December 31:
|
2017
|
2016
|
2015
|
|||||||||
|
(In thousands)
|
|||||||||||
|
Unrealized appreciation on securities, before tax
|
$
|
102
|
|
$
|
—
|
|
$
|
—
|
|
||
|
Tax expense
|
(39
|
)
|
—
|
|
—
|
|
|||||
|
Unrealized appreciation on securities, net of tax
|
$
|
63
|
|
$
|
—
|
|
$
|
—
|
|
||
Changes in accumulated other comprehensive income by component, net of tax, for the years ended December 31 are as follows:
|
Net Gains on Equity Securities
|
|||||||||||
|
2017
|
2016
|
2015
|
|||||||||
|
(In thousands)
|
|||||||||||
|
Balance at January 1:
|
$
|
—
|
|
$
|
—
|
|
$
|
—
|
|
||
|
Unrealized appreciation before reclassifications
|
63
|
|
—
|
|
—
|
|
|||||
|
Amounts reclassified from accumulated other comprehensive income
|
—
|
|
—
|
|
—
|
|
|||||
|
Net current-period other comprehensive income
|
63
|
|
—
|
|
—
|
|
|||||
|
Balance at December 31:
|
$
|
63
|
|
$
|
—
|
|
$
|
—
|
|
||
We have three main business segments offering different products and services:
|
•
|
Oil and natural gas,
|
|
•
|
Contract drilling, and
|
|
•
|
Mid-stream
|
The oil and natural gas segment is engaged in the development, acquisition, and production of oil, NGLs, and natural gas properties. The contract drilling segment is engaged in the land contract drilling of oil and natural gas wells and the mid-stream segment is engaged in the buying, selling, gathering, processing, and treating of natural gas and NGLs.
We evaluate each segment’s performance based on its operating income, which is defined as operating revenues less operating expenses and depreciation, depletion, amortization, and impairment. Our oil and natural gas production outside the United States is not significant.
109
UNIT CORPORATION AND SUBSIDIARIES
NOTES TO CONSOLIDATED FINANCIAL STATEMENTS—(Continued)
The following table provides certain information about the operations of each of our segments:
|
Year Ended December 31, 2017
|
||||||||||||||||||||||||
|
Oil and Natural Gas
|
Contract Drilling
|
Mid-stream
|
Other
|
Eliminations
|
Total Consolidated
|
|||||||||||||||||||
|
(In thousands)
|
||||||||||||||||||||||||
|
Revenues:
|
||||||||||||||||||||||||
|
Oil and natural gas
|
$
|
357,744
|
|
$
|
—
|
|
$
|
—
|
|
$
|
—
|
|
$
|
—
|
|
$
|
357,744
|
|
||||||
|
Contract drilling
|
—
|
|
188,172
|
|
—
|
|
—
|
|
(13,452
|
)
|
174,720
|
|
||||||||||||
|
Gas gathering and processing
|
—
|
|
—
|
|
277,049
|
|
—
|
|
(69,873
|
)
|
207,176
|
|
||||||||||||
|
Total revenues
|
357,744
|
|
188,172
|
|
277,049
|
|
—
|
|
(83,325
|
)
|
739,640
|
|
||||||||||||
|
Expenses:
|
||||||||||||||||||||||||
|
Operating costs:
|
||||||||||||||||||||||||
|
Oil and natural gas
|
135,532
|
|
—
|
|
—
|
|
—
|
|
(4,743
|
)
|
130,789
|
|
||||||||||||
|
Contract drilling
|
—
|
|
134,432
|
|
—
|
|
—
|
|
(11,832
|
)
|
122,600
|
|
||||||||||||
|
Gas gathering and processing
|
—
|
|
—
|
|
220,613
|
|
—
|
|
(65,130
|
)
|
155,483
|
|
||||||||||||
|
Total operating costs
|
135,532
|
|
134,432
|
|
220,613
|
|
—
|
|
(81,705
|
)
|
408,872
|
|
||||||||||||
|
Depreciation, depletion, and amortization
|
101,911
|
|
56,370
|
|
43,499
|
|
7,477
|
|
—
|
|
209,257
|
|
||||||||||||
|
Total expenses
|
237,443
|
|
190,802
|
|
264,112
|
|
7,477
|
|
(81,705
|
)
|
618,129
|
|
||||||||||||
|
Total operating income (loss)
(1)
|
120,301
|
|
(2,630
|
)
|
12,937
|
|
(7,477
|
)
|
(1,620
|
)
|
||||||||||||||
|
General and administrative expense
|
—
|
|
—
|
|
—
|
|
(38,087
|
)
|
—
|
|
(38,087
|
)
|
||||||||||||
|
Gain (loss) on disposition of assets
|
228
|
|
(776
|
)
|
25
|
|
850
|
|
—
|
|
327
|
|
||||||||||||
|
Gain on derivatives
|
—
|
|
—
|
|
—
|
|
14,732
|
|
—
|
|
14,732
|
|
||||||||||||
|
Interest expense, net
|
—
|
|
—
|
|
—
|
|
(38,334
|
)
|
—
|
|
(38,334
|
)
|
||||||||||||
|
Other
|
—
|
|
—
|
|
—
|
|
21
|
|
—
|
|
21
|
|
||||||||||||
|
Income (loss) before income taxes
|
$
|
120,529
|
|
$
|
(3,406
|
)
|
$
|
12,962
|
|
$
|
(68,295
|
)
|
$
|
(1,620
|
)
|
$
|
60,170
|
|
||||||
|
Identifiable assets:
|
||||||||||||||||||||||||
|
Oil and natural gas
(2)
|
$
|
1,127,900
|
|
$
|
—
|
|
$
|
—
|
|
$
|
—
|
|
$
|
—
|
|
$
|
1,127,900
|
|
||||||
|
Contract drilling
|
—
|
|
933,063
|
|
—
|
|
—
|
|
—
|
|
933,063
|
|
||||||||||||
|
Gas gathering and processing
|
—
|
|
—
|
|
438,571
|
|
—
|
|
—
|
|
438,571
|
|
||||||||||||
|
Total identifiable assets
(3)
|
1,127,900
|
|
933,063
|
|
438,571
|
|
—
|
|
—
|
|
2,499,534
|
|
||||||||||||
|
Corporate land and building
|
—
|
|
—
|
|
—
|
|
56,854
|
|
—
|
|
56,854
|
|
||||||||||||
|
Other corporate assets
(4)
|
—
|
|
—
|
|
—
|
|
25,064
|
|
—
|
|
25,064
|
|
||||||||||||
|
Total assets
|
$
|
1,127,900
|
|
$
|
933,063
|
|
$
|
438,571
|
|
$
|
81,918
|
|
$
|
—
|
|
$
|
2,581,452
|
|
||||||
|
Capital expenditures:
|
$
|
270,443
|
|
$
|
36,148
|
|
$
|
22,168
|
|
$
|
3,521
|
|
$
|
—
|
|
$
|
332,280
|
|
||||||
_______________________
|
(1)
|
Operating income (loss) is total operating revenues less operating expenses, depreciation, depletion, and amortization and does not include general corporate expenses, gain (loss) on disposition of assets, gain on derivatives, interest expense, other income, or income taxes.
|
|
(2)
|
Oil and natural gas assets include oil and natural gas properties, saltwater disposal systems, and other non-full cost pool assets.
|
|
(3)
|
Identifiable assets are those used in Unit’s operations in each industry segment.
|
|
(4)
|
Corporate assets are principally cash and cash equivalents, short-term investments, transportation equipment, furniture, and equipment.
|
110
UNIT CORPORATION AND SUBSIDIARIES
NOTES TO CONSOLIDATED FINANCIAL STATEMENTS—(Continued)
|
Year Ended December 31, 2016
|
||||||||||||||||||||||||
|
Oil and Natural Gas
|
Contract Drilling
|
Mid-stream
|
Other
|
Eliminations
|
Total Consolidated
|
|||||||||||||||||||
|
(In thousands)
|
||||||||||||||||||||||||
|
Revenues:
|
||||||||||||||||||||||||
|
Oil and natural gas
|
$
|
294,221
|
|
$
|
—
|
|
$
|
—
|
|
$
|
—
|
|
$
|
—
|
|
$
|
294,221
|
|
||||||
|
Contract drilling
|
—
|
|
122,086
|
|
—
|
|
—
|
|
—
|
|
122,086
|
|
||||||||||||
|
Gas gathering and processing
|
—
|
|
—
|
|
237,785
|
|
—
|
|
(51,915
|
)
|
185,870
|
|
||||||||||||
|
Total revenues
|
294,221
|
|
122,086
|
|
237,785
|
|
—
|
|
(51,915
|
)
|
602,177
|
|
||||||||||||
|
Expenses:
|
||||||||||||||||||||||||
|
Operating costs:
|
||||||||||||||||||||||||
|
Oil and natural gas
|
126,739
|
|
—
|
|
—
|
|
—
|
|
(6,555
|
)
|
120,184
|
|
||||||||||||
|
Contract drilling
|
—
|
|
88,154
|
|
—
|
|
—
|
|
—
|
|
88,154
|
|
||||||||||||
|
Gas gathering and processing
|
—
|
|
—
|
|
182,969
|
|
—
|
|
(45,360
|
)
|
137,609
|
|
||||||||||||
|
Total operating costs
|
126,739
|
|
88,154
|
|
182,969
|
|
—
|
|
(51,915
|
)
|
345,947
|
|
||||||||||||
|
Depreciation, depletion and amortization
|
113,811
|
|
46,992
|
|
45,715
|
|
1,835
|
|
—
|
|
208,353
|
|
||||||||||||
|
Impairments
(1)
|
161,563
|
|
—
|
|
—
|
|
—
|
|
—
|
|
161,563
|
|
||||||||||||
|
Total expenses
|
402,113
|
|
135,146
|
|
228,684
|
|
1,835
|
|
(51,915
|
)
|
715,863
|
|
||||||||||||
|
Total operating income (loss)
(2)
|
(107,892
|
)
|
(13,060
|
)
|
9,101
|
|
(1,835
|
)
|
—
|
|
||||||||||||||
|
General and administrative expense
|
—
|
|
—
|
|
—
|
|
(33,337
|
)
|
—
|
|
(33,337
|
)
|
||||||||||||
|
Gain (loss) on disposition of assets
|
(324
|
)
|
3,184
|
|
(302
|
)
|
(18
|
)
|
—
|
|
2,540
|
|
||||||||||||
|
Loss on derivatives
|
—
|
|
—
|
|
—
|
|
(22,813
|
)
|
—
|
|
(22,813
|
)
|
||||||||||||
|
Interest expense, net
|
—
|
|
—
|
|
—
|
|
(39,829
|
)
|
—
|
|
(39,829
|
)
|
||||||||||||
|
Other
|
—
|
|
—
|
|
—
|
|
307
|
|
—
|
|
307
|
|
||||||||||||
|
Income (loss) before income taxes
|
$
|
(108,216
|
)
|
$
|
(9,876
|
)
|
$
|
8,799
|
|
$
|
(97,525
|
)
|
$
|
—
|
|
$
|
(206,818
|
)
|
||||||
|
Identifiable assets:
|
||||||||||||||||||||||||
|
Oil and natural gas
(3)
|
$
|
965,159
|
|
$
|
—
|
|
$
|
—
|
|
$
|
—
|
|
$
|
—
|
|
$
|
965,159
|
|
||||||
|
Contract drilling
|
—
|
|
941,676
|
|
—
|
|
—
|
|
—
|
|
941,676
|
|
||||||||||||
|
Gas gathering and processing
|
—
|
|
—
|
|
461,600
|
|
—
|
|
—
|
|
461,600
|
|
||||||||||||
|
Total identifiable assets
(4)
|
965,159
|
|
941,676
|
|
461,600
|
|
—
|
|
—
|
|
2,368,435
|
|
||||||||||||
|
Corporate land and building
|
—
|
|
—
|
|
—
|
|
58,188
|
|
—
|
|
58,188
|
|
||||||||||||
|
Other corporate assets
(5)
|
—
|
|
—
|
|
—
|
|
52,680
|
|
—
|
|
52,680
|
|
||||||||||||
|
Total assets
|
$
|
965,159
|
|
$
|
941,676
|
|
$
|
461,600
|
|
$
|
110,868
|
|
$
|
—
|
|
$
|
2,479,303
|
|
||||||
|
Capital expenditures:
|
$
|
89,562
|
|
$
|
19,134
|
|
$
|
16,796
|
|
$
|
16,663
|
|
$
|
—
|
|
$
|
142,155
|
|
||||||
_______________________
|
(1)
|
We incurred non-cash ceiling test write-down of our oil and natural gas properties of
$161.6 million
pre-tax (
$100.6 million
, net of tax).
|
|
(2)
|
Operating income (loss) is total operating revenues less operating expenses, depreciation, depletion, amortization, and impairment and does not include general corporate expenses, gain (loss) on disposition of assets, loss on derivatives, interest expense, other income (loss), or income taxes.
|
|
(3)
|
Oil and natural gas assets include oil and natural gas properties, saltwater disposal systems, and other non-full cost pool assets.
|
|
(4)
|
Identifiable assets are those used in Unit’s operations in each industry segment.
|
|
(5)
|
Corporate assets are principally cash and cash equivalents, short-term investments, transportation equipment, furniture, and equipment.
|
111
UNIT CORPORATION AND SUBSIDIARIES
NOTES TO CONSOLIDATED FINANCIAL STATEMENTS—(Continued)
|
Year Ended December 31, 2015
|
||||||||||||||||||||||||
|
Oil and Natural Gas
|
Contract Drilling
|
Mid-stream
|
Other
|
Eliminations
|
Total Consolidated
|
|||||||||||||||||||
|
(In thousands)
|
||||||||||||||||||||||||
|
Revenues:
|
||||||||||||||||||||||||
|
Oil and natural gas
|
$
|
385,774
|
|
$
|
—
|
|
$
|
—
|
|
$
|
—
|
|
$
|
—
|
|
$
|
385,774
|
|
||||||
|
Contract drilling
|
—
|
|
287,767
|
|
—
|
|
—
|
|
(22,099
|
)
|
265,668
|
|
||||||||||||
|
Gas gathering and processing
|
—
|
|
—
|
|
268,012
|
|
—
|
|
(65,223
|
)
|
202,789
|
|
||||||||||||
|
Total revenues
|
385,774
|
|
287,767
|
|
268,012
|
|
—
|
|
(87,322
|
)
|
854,231
|
|
||||||||||||
|
Expenses:
|
||||||||||||||||||||||||
|
Operating costs:
|
||||||||||||||||||||||||
|
Oil and natural gas
|
170,831
|
|
—
|
|
—
|
|
—
|
|
(4,785
|
)
|
166,046
|
|
||||||||||||
|
Contract drilling
|
—
|
|
174,757
|
|
—
|
|
—
|
|
(18,349
|
)
|
156,408
|
|
||||||||||||
|
Gas gathering and processing
|
—
|
|
—
|
|
221,994
|
|
—
|
|
(60,438
|
)
|
161,556
|
|
||||||||||||
|
Total operating costs
|
170,831
|
|
174,757
|
|
221,994
|
|
—
|
|
(83,572
|
)
|
484,010
|
|
||||||||||||
|
Depreciation, depletion and amortization
|
251,944
|
|
56,135
|
|
43,676
|
|
987
|
|
—
|
|
352,742
|
|
||||||||||||
|
Impairments
(1)
|
1,599,348
|
|
8,314
|
|
26,966
|
|
—
|
|
—
|
|
1,634,628
|
|
||||||||||||
|
Total expenses
|
2,022,123
|
|
239,206
|
|
292,636
|
|
987
|
|
(83,572
|
)
|
2,471,380
|
|
||||||||||||
|
Total operating income (loss)
(2)
|
(1,636,349
|
)
|
48,561
|
|
(24,624
|
)
|
(987
|
)
|
(3,750
|
)
|
||||||||||||||
|
General and administrative expense
|
—
|
|
—
|
|
—
|
|
(34,358
|
)
|
—
|
|
(34,358
|
)
|
||||||||||||
|
Gain (loss) on disposition of assets
|
(147
|
)
|
(7,516
|
)
|
465
|
|
(31
|
)
|
—
|
|
(7,229
|
)
|
||||||||||||
|
Gain on derivatives
|
—
|
|
—
|
|
—
|
|
26,345
|
|
—
|
|
26,345
|
|
||||||||||||
|
Interest expense, net
|
—
|
|
—
|
|
—
|
|
(31,963
|
)
|
—
|
|
(31,963
|
)
|
||||||||||||
|
Other
|
—
|
|
—
|
|
—
|
|
45
|
|
—
|
|
45
|
|
||||||||||||
|
Income (loss) before income taxes
|
$
|
(1,636,496
|
)
|
$
|
41,045
|
|
$
|
(24,159
|
)
|
$
|
(40,949
|
)
|
$
|
(3,750
|
)
|
$
|
(1,664,309
|
)
|
||||||
|
Identifiable assets:
|
||||||||||||||||||||||||
|
Oil and natural gas
(3)
|
$
|
1,218,036
|
|
$
|
—
|
|
$
|
—
|
|
$
|
—
|
|
$
|
—
|
|
$
|
1,218,036
|
|
||||||
|
Contract drilling
|
—
|
|
993,015
|
|
—
|
|
—
|
|
—
|
|
993,015
|
|
||||||||||||
|
Gas gathering and processing
|
—
|
|
—
|
|
478,661
|
|
—
|
|
—
|
|
478,661
|
|
||||||||||||
|
Total identifiable assets
(4)
|
1,218,036
|
|
993,015
|
|
478,661
|
|
—
|
|
—
|
|
2,689,712
|
|
||||||||||||
|
Corporate land and building
|
—
|
|
—
|
|
—
|
|
49,890
|
|
—
|
|
49,890
|
|
||||||||||||
|
Other corporate assets
(5)
|
—
|
|
—
|
|
—
|
|
60,240
|
|
|
|
60,240
|
|
||||||||||||
|
Total assets
|
$
|
1,218,036
|
|
$
|
993,015
|
|
$
|
478,661
|
|
$
|
110,130
|
|
$
|
—
|
|
$
|
2,799,842
|
|
||||||
|
Capital expenditures:
|
$
|
267,944
|
|
$
|
84,802
|
|
$
|
63,476
|
|
$
|
38,065
|
|
$
|
—
|
|
$
|
454,287
|
|
||||||
_______________________
|
(1)
|
We incurred non-cash ceiling test write-down of our oil and natural gas properties of
$1.6 billion
pre-tax (
$1.0 billion
, net of tax). Impairment for contract drilling equipment includes an
$8.3 million
pre-tax write-down for
30
drilling rigs and other drilling equipment. Impairment for gas gathering and processing systems includes
$27.0 million
pre-tax write-down for
three
of our systems, Bruceton Mills, Midwell, and Spring Creek.
|
|
(2)
|
Operating income (loss) is total operating revenues less operating expenses, depreciation, depletion, amortization, and impairment and does not include general corporate expenses, gain (loss) on disposition of assets, gain on derivatives, interest expense, other income (loss), or income taxes.
|
|
(3)
|
Oil and natural gas assets include oil and natural gas properties, saltwater disposal systems, and other non-full cost pool assets.
|
|
(4)
|
Identifiable assets are those used in Unit’s operations in each industry segment.
|
|
(5)
|
Corporate assets are principally cash and cash equivalents, short-term investments, transportation equipment, furniture, and equipment.
|
112
UNIT CORPORATION AND SUBSIDIARIES
NOTES TO CONSOLIDATED FINANCIAL STATEMENTS—(Continued)
Summarized unaudited quarterly financial information is as follows:
|
|
Three Months Ended
|
|
||||||||||||||
|
|
March 31
|
June 30
|
September 30
|
December 31
|
|
|||||||||||
|
|
(In thousands except per share amounts)
|
|
||||||||||||||
|
2016
|
||||||||||||||||
|
Revenues
|
$
|
136,184
|
|
$
|
138,305
|
|
$
|
153,408
|
|
$
|
174,280
|
|
||||
|
Gross income (loss)
(1)
|
$
|
(49,745
|
)
|
$
|
(73,830
|
)
|
$
|
(26,893
|
)
|
$
|
36,782
|
|
||||
|
Net income (loss)
|
$
|
(41,149
|
)
|
$
|
(72,136
|
)
|
$
|
(24,022
|
)
|
$
|
1,683
|
|
||||
|
Net income (loss) per common share:
|
||||||||||||||||
|
Basic
(2)
|
$
|
(0.83
|
)
|
$
|
(1.44
|
)
|
$
|
(0.48
|
)
|
$
|
0.03
|
|
||||
|
Diluted
(2)
|
$
|
(0.83
|
)
|
$
|
(1.44
|
)
|
$
|
(0.48
|
)
|
$
|
0.03
|
|
||||
|
2017
|
||||||||||||||||
|
Revenues
|
$
|
175,724
|
|
$
|
170,581
|
|
$
|
188,488
|
|
$
|
204,847
|
|
|
|||
|
Gross income
(1)
|
$
|
32,657
|
|
$
|
24,462
|
|
$
|
27,181
|
|
$
|
37,211
|
|
||||
|
Net income
|
$
|
15,929
|
|
$
|
9,059
|
|
$
|
3,705
|
|
$
|
89,155
|
|
||||
|
Net income per common share:
|
||||||||||||||||
|
Basic
|
$
|
0.32
|
|
$
|
0.18
|
|
$
|
0.07
|
|
$
|
1.74
|
|
||||
|
Diluted
(2)
|
$
|
0.31
|
|
$
|
0.17
|
|
$
|
0.07
|
|
$
|
1.71
|
|
||||
_________________________
|
(1)
|
Gross income (loss) excludes general and administrative expense, interest expense, (gain) loss on disposition of assets, gain (loss) on derivatives, income taxes, and other income (loss).
|
|
(2)
|
The earnings (loss) per share for the year's four quarters does not equal annual income (loss) per share.
|
113
SUPPLEMENTAL OIL AND GAS DISCLOSURES
(UNAUDITED)
Our oil and gas operations are substantially located in the United States. The capitalized costs at year end and costs incurred during the year were as follows:
|
2017
|
2016
|
2015
|
|||||||||
|
|
(In thousands)
|
||||||||||
|
Capitalized costs:
|
|||||||||||
|
Proved properties
|
$
|
5,712,813
|
|
$
|
5,446,305
|
|
$
|
5,401,618
|
|
||
|
Unproved properties
|
296,764
|
|
314,867
|
|
337,099
|
|
|||||
|
6,009,577
|
|
5,761,172
|
|
5,738,717
|
|
||||||
|
Accumulated depreciation, depletion, amortization, and impairment
|
(4,996,696
|
)
|
(4,900,304
|
)
|
(4,631,404
|
)
|
|||||
|
Net capitalized costs
|
$
|
1,012,881
|
|
$
|
860,868
|
|
$
|
1,107,313
|
|
||
|
Cost incurred:
|
|||||||||||
|
Unproved properties acquired
|
$
|
47,029
|
|
$
|
21,675
|
|
$
|
41,777
|
|
||
|
Proved properties acquired
|
47,638
|
|
564
|
|
179
|
|
|||||
|
Exploration
|
14,811
|
|
17,325
|
|
19,222
|
|
|||||
|
Development
|
160,941
|
|
80,582
|
|
208,845
|
|
|||||
|
Asset retirement obligation
|
(3,613
|
)
|
(30,906
|
)
|
(5,693
|
)
|
|||||
|
Total costs incurred
|
$
|
266,806
|
|
$
|
89,240
|
|
$
|
264,330
|
|
||
The following table shows a summary of the oil and natural gas property costs not being amortized at
December 31, 2017
, by the year in which such costs were incurred:
|
2017
|
2016
|
2015
|
2014 and Prior
|
Total
|
|||||||||||||||
|
|
(In thousands)
|
||||||||||||||||||
|
Unproved properties acquired and wells in progress
|
$
|
50,447
|
|
$
|
22,092
|
|
$
|
40,254
|
|
$
|
183,971
|
|
$
|
296,764
|
|
||||
Unproved properties not subject to amortization relates to properties which are not individually significant and consist primarily of lease acquisition costs. The evaluation process associated with these properties has not been completed and therefore, the company is unable to estimate when these costs will be included in the amortization calculation.
The results of operations for producing activities are as follows:
|
2017
|
2016
|
2015
|
|||||||||
|
|
(In thousands)
|
||||||||||
|
Revenues
|
$
|
347,285
|
|
$
|
282,742
|
|
$
|
371,335
|
|
||
|
Production costs
|
(107,332
|
)
|
(108,822
|
)
|
(152,560
|
)
|
|||||
|
Depreciation, depletion, amortization, and impairment
|
(96,392
|
)
|
(268,901
|
)
|
(1,844,726
|
)
|
|||||
|
143,561
|
|
(94,981
|
)
|
(1,625,951
|
)
|
||||||
|
Income tax (expense) benefit
|
(56,376
|
)
|
32,696
|
|
612,496
|
|
|||||
|
Results of operations for producing activities (excluding corporate overhead and financing costs)
|
$
|
87,185
|
|
$
|
(62,285
|
)
|
$
|
(1,013,455
|
)
|
||
114
Estimated quantities of proved developed oil, NGLs, and natural gas reserves and changes in net quantities of proved developed and undeveloped oil, NGLs, and natural gas reserves were as follows:
|
Oil
Bbls
|
NGLs
Bbls
|
Natural Gas
Mcf
|
Total
MBoe
|
||||||||
|
|
(In thousands)
|
||||||||||
|
2015
|
|||||||||||
|
Proved developed and undeveloped reserves:
|
|||||||||||
|
Beginning of year
|
22,667
|
|
48,529
|
|
646,961
|
|
179,023
|
|
|||
|
Revision of previous estimates
(1)
|
(3,954
|
)
|
(9,367
|
)
|
(139,514
|
)
|
(36,573
|
)
|
|||
|
Extensions and discoveries
|
1,208
|
|
1,948
|
|
20,974
|
|
6,651
|
|
|||
|
Infill reserves in existing proved fields
|
670
|
|
1,861
|
|
22,641
|
|
6,304
|
|
|||
|
Purchases of minerals in place
|
—
|
|
—
|
|
—
|
|
—
|
|
|||
|
Production
|
(3,783
|
)
|
(5,274
|
)
|
(65,546
|
)
|
(19,981
|
)
|
|||
|
Sales
|
(73
|
)
|
(10
|
)
|
(648
|
)
|
(191
|
)
|
|||
|
End of year
|
16,735
|
|
37,687
|
|
484,868
|
|
135,233
|
|
|||
|
Proved developed reserves:
|
|||||||||||
|
Beginning of year
|
17,448
|
|
35,850
|
|
500,950
|
|
136,790
|
|
|||
|
End of year
|
14,679
|
|
31,218
|
|
416,395
|
|
115,296
|
|
|||
|
Proved undeveloped reserves:
|
|||||||||||
|
Beginning of year
|
5,219
|
|
12,679
|
|
146,011
|
|
42,233
|
|
|||
|
End of year
|
2,056
|
|
6,469
|
|
68,473
|
|
19,937
|
|
|||
|
2016
|
|||||||||||
|
Proved developed and undeveloped reserves:
|
|||||||||||
|
Beginning of year
|
16,735
|
|
37,687
|
|
484,868
|
|
135,233
|
|
|||
|
Revision of previous estimates
(1)
|
(549
|
)
|
(2,473
|
)
|
(31,670
|
)
|
(8,300
|
)
|
|||
|
Extensions and discoveries
|
1,816
|
|
1,588
|
|
13,720
|
|
5,690
|
|
|||
|
Infill reserves in existing proved fields
|
663
|
|
2,724
|
|
24,704
|
|
7,504
|
|
|||
|
Purchases of minerals in place
|
114
|
|
43
|
|
630
|
|
262
|
|
|||
|
Production
|
(2,974
|
)
|
(5,014
|
)
|
(55,735
|
)
|
(17,277
|
)
|
|||
|
Sales
|
(109
|
)
|
(73
|
)
|
(30,938
|
)
|
(5,338
|
)
|
|||
|
End of year
|
15,696
|
|
34,482
|
|
405,579
|
|
117,774
|
|
|||
|
Proved developed reserves:
|
|||||||||||
|
Beginning of year
|
14,679
|
|
31,218
|
|
416,395
|
|
115,296
|
|
|||
|
End of year
|
12,724
|
|
28,502
|
|
347,121
|
|
99,079
|
|
|||
|
Proved undeveloped reserves:
|
|||||||||||
|
Beginning of year
|
2,056
|
|
6,469
|
|
68,473
|
|
19,937
|
|
|||
|
End of year
|
2,972
|
|
5,980
|
|
58,458
|
|
18,695
|
|
|||
|
2017
|
|||||||||||
|
Proved developed and undeveloped reserves:
|
|||||||||||
|
Beginning of year
|
15,696
|
|
34,482
|
|
405,579
|
|
117,774
|
|
|||
|
Revision of previous estimates
|
730
|
|
4,325
|
|
38,330
|
|
11,444
|
|
|||
|
Extensions and discoveries
|
2,235
|
|
4,520
|
|
49,321
|
|
14,975
|
|
|||
|
Infill reserves in existing proved fields
|
1,632
|
|
5,779
|
|
52,270
|
|
16,123
|
|
|||
|
Purchases of minerals in place
|
2,019
|
|
1,197
|
|
15,313
|
|
5,768
|
|
|||
|
Production
|
(2,715
|
)
|
(4,737
|
)
|
(51,260
|
)
|
(15,996
|
)
|
|||
|
Sales
|
(84
|
)
|
(80
|
)
|
(903
|
)
|
(314
|
)
|
|||
|
End of year
|
19,513
|
|
45,486
|
|
508,650
|
|
149,774
|
|
|||
|
Proved developed reserves:
|
|||||||||||
|
Beginning of year
|
12,724
|
|
28,502
|
|
347,121
|
|
99,079
|
|
|||
|
End of year
|
14,862
|
|
33,358
|
|
388,446
|
|
112,961
|
|
|||
|
Proved undeveloped reserves:
|
|||||||||||
|
Beginning of year
|
2,972
|
|
5,980
|
|
58,458
|
|
18,695
|
|
|||
|
End of year
|
4,651
|
|
12,128
|
|
120,204
|
|
36,813
|
|
|||
|
(1)
|
Natural gas revisions of previous estimates decreased primarily due to a decline in natural gas prices.
|
115
Estimates of oil, NGLs, and natural gas reserves require extensive judgments of reservoir engineering data. Assigning monetary values to such estimates does not reduce the subjectivity and changing nature of such reserve estimates. Indeed the uncertainties inherent in the disclosure are compounded by applying additional estimates of the rates and timing of production and the costs that will be incurred in developing and producing the reserves. The information set forth in this report is, therefore, subjective and, since judgments are involved, may not be comparable to estimates submitted by other oil and natural gas producers. In addition, since prices and costs do not remain static, and no price or cost escalations or de-escalations have been considered, the results are not necessarily indicative of the estimated fair market value of estimated proved reserves, nor of estimated future cash flows.
The standardized measure of discounted future net cash flows (SMOG) was calculated using 12-month average prices and year end costs adjusted for permanent differences that relate to existing proved oil, NGLs, and natural gas reserves. Future income tax expenses consider the Tax Act statutory tax rates. SMOG as of December 31 is as follows:
|
2017
|
2016
|
2015
|
|||||||||
|
|
(In thousands)
|
||||||||||
|
Future cash flows
|
$
|
3,347,396
|
|
$
|
2,030,925
|
|
$
|
2,475,898
|
|
||
|
Future production costs
|
(1,308,244
|
)
|
(861,625
|
)
|
(1,017,777
|
)
|
|||||
|
Future development costs
|
(369,560
|
)
|
(173,446
|
)
|
(228,445
|
)
|
|||||
|
Future income tax expenses
|
(234,152
|
)
|
(141,752
|
)
|
(230,544
|
)
|
|||||
|
Future net cash flows
|
1,435,440
|
|
854,102
|
|
999,132
|
|
|||||
|
10% annual discount for estimated timing of cash flows
|
(628,270
|
)
|
(335,892
|
)
|
(409,646
|
)
|
|||||
|
Standardized measure of discounted future net cash flows relating to proved oil, NGLs, and natural gas reserves
|
$
|
807,170
|
|
$
|
518,210
|
|
$
|
589,486
|
|
||
The principal sources of changes in the standardized measure of discounted future net cash flows were as follows:
|
2017
|
2016
|
2015
|
|||||||||
|
|
(In thousands)
|
||||||||||
|
Sales and transfers of oil and natural gas produced, net of production costs
|
$
|
(239,953
|
)
|
$
|
(173,920
|
)
|
$
|
(218,115
|
)
|
||
|
Net changes in prices and production costs
|
236,126
|
|
(94,026
|
)
|
(1,356,333
|
)
|
|||||
|
Revisions in quantity estimates and changes in production timing
|
87,239
|
|
(51,979
|
)
|
(213,945
|
)
|
|||||
|
Extensions, discoveries, and improved recovery, less related costs
|
102,965
|
|
84,738
|
|
95,671
|
|
|||||
|
Changes in estimated future development costs
|
(5,194
|
)
|
70,976
|
|
227,857
|
|
|||||
|
Previously estimated cost incurred during the period
|
36,044
|
|
16,602
|
|
59,117
|
|
|||||
|
Purchases of minerals in place
|
51,686
|
|
2,652
|
|
—
|
|
|||||
|
Sales of minerals in place
|
(1,447
|
)
|
(17,248
|
)
|
(3,338
|
)
|
|||||
|
Accretion of discount
|
57,517
|
|
69,069
|
|
209,979
|
|
|||||
|
Net change in income taxes
|
(33,389
|
)
|
44,241
|
|
562,838
|
|
|||||
|
Other—net
|
(2,634
|
)
|
(22,381
|
)
|
(209,989
|
)
|
|||||
|
Net change
|
288,960
|
|
(71,276
|
)
|
(846,258
|
)
|
|||||
|
Beginning of year
|
518,210
|
|
589,486
|
|
1,435,744
|
|
|||||
|
End of year
|
$
|
807,170
|
|
$
|
518,210
|
|
$
|
589,486
|
|
||
Certain information concerning the assumptions used in computing SMOG and their inherent limitations are discussed below. We believe this information is essential for a proper understanding and assessment of the data presented.
The assumptions used to compute SMOG do not necessarily reflect our expectations of actual revenues to be derived from neither those reserves nor their present worth. Assigning monetary values to the reserve quantity estimation process does not reduce the subjective and ever-changing nature of reserve estimates. Additional subjectivity occurs when determining present values because the rate of producing the reserves must be estimated. In addition to difficulty inherent in predicting the future, variations from the expected production rate could result from factors outside of our control, such as unintentional delays in development, environmental concerns or changes in prices or regulatory controls. Also, the reserve valuation assumes
116
that all reserves will be disposed of by production. However, other factors such as the sale of reserves in place could affect the amount of cash eventually realized.
The
December 31, 2017
, future cash flows were computed by applying the unescalated 12-month average prices of
$51.34
per barrel for oil,
$31.83
per barrel for NGLs, and
$2.98
per Mcf for natural gas (then adjusted for price differentials) relating to proved reserves and to the year-end quantities of those reserves. Future price changes are considered only to the extent provided by contractual arrangements in existence at year-end.
Future production and development costs are computed by estimating the expenditures to be incurred in developing and producing the proved oil, NGLs, and natural gas reserves at the end of the year, based on continuation of existing economic conditions.
Future income tax expenses are computed by applying the appropriate year-end statutory tax rates to the future pretax net cash flows relating to proved oil, NGLs, and natural gas reserves less the tax basis of our properties. The future income tax expenses also give effect to permanent differences and tax credits and allowances relating to our proved oil, NGLs, and natural gas reserves.
Care should be exercised in the use and interpretation of the above data. As production occurs over the next several years, the results shown may be significantly different as changes in production performance, petroleum prices and costs are likely to occur.
None.
|
(a)
|
Evaluation of Disclosure Controls and Procedures
|
We maintain “disclosure controls and procedures,” as that term is defined in Rule 13a-15(e) and Rule 15d-15(e) under the Securities Exchange Act of 1934 (the Exchange Act), that are designed to ensure that information required to be disclosed in reports we file or submit under the Exchange Act is recorded, processed, summarized, and reported within the time periods specified in SEC rules and forms, and that such information is collected and communicated to management, including our Chief Executive Officer and Chief Financial Officer, as appropriate, to allow timely decisions regarding required disclosure. In designing and evaluating our disclosure controls and procedures, our management recognized that no matter how well conceived and operated, disclosure controls and procedures can provide only reasonable, not absolute, assurance that the objectives of the disclosure controls and procedures are met. Our disclosure controls and procedures have been designed to meet, and our management believes that they meet, reasonable assurance standards. Based on their evaluation as of the end of the period covered by this Annual Report on Form 10-K, our Chief Executive Officer and Chief Financial Officer have concluded that, subject to the limitations noted above, the company’s disclosure controls and procedures were effective.
|
(b)
|
Management’s Report on Internal Control Over Financial Reporting
|
Our management is responsible for establishing and maintaining adequate internal control over financial reporting, as defined in Exchange Act Rule 13a-15(f). Our management, including our Chief Executive Officer and Chief Financial Officer, conducted an evaluation of the effectiveness of our internal control over financial reporting based on the
Internal Control—Integrated Framework (2013)
issued by the Committee of Sponsoring Organizations of the Treadway Commission (COSO). Based on the results of this evaluation, our management concluded that our internal control over financial reporting was effective as of
December 31, 2017
.
The effectiveness of the company’s internal control over financial reporting as of
December 31, 2017
, has been audited by PricewaterhouseCoopers LLP, an independent registered public accounting firm, as stated in their report which appears in this report.
117
|
(c)
|
Changes in Internal Control Over Financial Reporting
|
In January 2017, we implemented a new ERP accounting and reporting system designed to upgrade our technology and improve the timeliness and quality of our financial and operational information. This new ERP system was not implemented in response to any material weakness in our internal control over financial reporting (ICFR). The implementation of the ERP system has affected the processes that constitute part of our ICFR and requires ongoing testing for effectiveness. The adoption of this new ERP system has not materially affected our ICFR. There were no changes in ICFR during the quarter ended December 31, 2017, that materially affected our ICFR or are reasonably likely to materially affect it.
None.
In accordance with Instruction G(3) of Form 10-K, the information required by this item is incorporated in this report by reference to the Proxy Statement, except for the information regarding our executive officers which is presented below. The Proxy Statement will be filed before our annual shareholders’ meeting scheduled to be held on May 2, 2018.
Our Code of Ethics and Business Conduct applies to all directors, officers, and employees, including our Chief Executive Officer, our Chief Financial Officer, and our Controller. You can find our Code of Ethics and Business Conduct on our internet website, www.unitcorp.com. We will post any amendments to the Code of Ethics and Business Conduct, and any waivers that are required to be disclosed by the rules of either the SEC or the NYSE, on our internet website.
Because our common stock is listed on the NYSE, our Chief Executive Officer was required to make, and he has made, an annual certification to the NYSE stating that he was not aware of any violation by us of the NYSE corporate governance listing standards. Our Chief Executive Officer made his annual certification to that effect to the NYSE as of May 5, 2017. In addition, we have filed, as exhibits to this Annual Report on Form 10-K, the certifications of our Chief Executive Officer and Chief Financial Officer required under Section 302 of the Sarbanes-Oxley Act of 2002 to be filed with the SEC regarding the quality of our public disclosure.
Executive Officers
The table below and accompanying text sets forth certain information as of
February 13, 2018
concerning each of our executive officers and certain officers of our subsidiaries. There were no arrangements or understandings between any of the officers and any other person(s) under which the officers were elected.
118
|
NAME
|
AGE
|
POSITION HELD
|
|||
|
Larry D. Pinkston
|
63
|
|
Chief Executive Officer since April 1, 2005, Director since January 15, 2004, President since August 1, 2003, Chief Operating Officer from February 24, 2004 to August 28, 2017, Vice President and Chief Financial Officer from May 1989 to February 24, 2004
|
||
|
Mark E. Schell
|
60
|
|
Senior Vice President since December 2002, General Counsel and Corporate Secretary since January 1987
|
||
|
David T. Merrill
|
57
|
|
Chief Operating Officer since August 28, 2017, Senior Vice President from May 2, 2012 to November 27, 2017, Chief Financial Officer and Treasurer from February 24, 2004 to November 27, 2017, Vice President of Finance from August 2003 to February 24, 2004
|
||
|
Les Austin
|
52
|
|
Senior Vice President and Chief Financial Officer since November 27, 2017
|
||
|
David P. Dunham
|
38
|
|
Senior Vice President of Business Development since August 28, 2017, Vice President of Corporate Planning from January 2012 to August 28, 2017, Director of Corporate Planning from November 2007 to January 2012
|
||
|
John Cromling
|
70
|
|
Executive Vice President, Unit Drilling Company since April 15, 2005
|
||
|
Robert Parks
|
63
|
|
Manager and President, Superior Pipeline Company, L.L.C. since June 1996
|
||
|
Frank Young
|
48
|
|
Senior Vice President Exploration and Production Midcontinent of Unit Petroleum Company since 2012, Vice President - Central Division from June 2007, when he joined Unit Company, until 2012.
|
||
Mr. Pinkston
joined the company in December 1981. He had served as Corporate Budget Director and Assistant Controller before being appointed Controller in February, 1985. In December, 1986 he was elected Treasurer of the company and was elected to the position of Vice President and Chief Financial Officer in May, 1989. In August, 2003, he was elected to the position of President. He was elected a director of the company by the Board in January, 2004. In February, 2004, in addition to his position as President, he was elected to the office of Chief Operating Officer. In April 2005, he also began serving as Chief Executive Officer. Mr. Pinkston holds the offices of President and Chief Executive Officer. He holds a Bachelor of Science Degree in Accounting from East Central University of Oklahoma.
Mr. Schell
joined the company in January 1987, as its Secretary and General Counsel. In 2003, he was promoted to Senior Vice President. From 1979 until joining Unit Corporation, Mr. Schell was Counsel, Vice President, and a member of the Board of Directors of C & S Exploration Inc. He received a Bachelor of Science degree in Political Science from Arizona State University and his Juris Doctorate degree from the University of Tulsa College of Law. He is a member of the Oklahoma Bar Association. Mr. Schell is a director of the Oklahoma Oil and Gas Association. In addition, he is the Chairman and a director of the Oklahoma Injury Benefit Coalition, an Oklahoma non-profit association advocating for improvements to Oklahoma's Workers' Compensation system. He is also a member of the State Chamber of Oklahoma board of directors and serves on the board of advisors for the Greater Oklahoma City Chamber.
Mr. Merrill
joined the company in August 2003 and served as its Vice President of Finance until February 2004 when he was elected to the position of Chief Financial Officer and Treasurer. In May 2012, he was promoted to Senior Vice President, a position he held until November 2017. In August 2017, he was promoted to Chief Operating Officer. From May 1999 through August 2003, Mr. Merrill served as Senior Vice President, Finance with TV Guide Networks, Inc. From July 1996 through May 1999 he was a Senior Manager with Deloitte & Touche LLP. From July 1994 through July 1996 he was Director of Financial Reporting and Special Projects for MAPCO, Inc. He began his career as an auditor with Deloitte, Haskins & Sells in 1983. Mr. Merrill received a Bachelor of Business Administration Degree in Accounting from the University of Oklahoma and is a Certified Public Accountant.
Mr. Austin
joined the company in November 2017 as Senior Vice President and Chief Financial Officer of the company. Prior to coming to Unit, he served as Senior Vice President and Chief Financial Officer of Cypress Energy Partners, L.P.. From 2008 to 2011, he was the Senior Vice President and Chief Financial Officer of Ram Energy Resources, Inc. In 2011, he was promoted to Chief Operating Officer where he served until its sale in 2012. Before joining Ram Energy Resources, Inc., Mr. Austin was the Vice President of Finance and Chief Financial Officer of Matrix Service Company. He has also held various managerial and financial positions at Flint Energy Construction Co. and Ernst & Young, LLP. Mr. Austin has a bachelor's degree in accounting from Oklahoma State University and is a Certified Public Accountant.
Mr. Dunham
joined the company in November 2007 as its Director of Corporate Planning. He was promoted to Vice President of Corporate Planning in January 2012. In August 2017, he was promoted to Senior Vice President of Business Development. From 2004 to November 2007, Mr. Dunham worked for Williams Power, serving as Manager of Structured
119
Products. He worked for Leggett & Platt from 2003 to 2004, serving as a Mergers & Acquisitions Analyst. He received his Bachelor of Arts degree in Psychology from Northwestern University, his Master of Science in Finance degree from the University of Tulsa, and his MBA from the Wharton School of the University of Pennsylvania.
Mr. Cromling
joined Unit Drilling Company in 1997 as a Vice-President and Division Manager. In April 2005, he was promoted to the position of Executive Vice-President of Drilling for Unit Drilling Company. In 1980, he formed Cromling Drilling Company which managed and operated drilling rigs until 1987. From 1987 to 1997, Cromling Drilling Company provided engineering consulting services and generated and drilled oil and natural gas prospects. Prior to this, he was employed by Big Chief Drilling for 11 years and served as Vice-President. Mr. Cromling graduated from the University of Oklahoma with a degree in Petroleum Engineering.
Mr. Parks
founded Superior Pipeline Company, L.L.C. in 1996. When Superior was acquired by the company in July 2004, he continued with Superior as one of its managers and as its President. From April 1992 through April 1996 Mr. Parks served as Vice-President—Gathering and Processing for Cimarron Gas Companies. From December 1986 through March 1992, he served as Vice-President—Business Development for American Central Gas Companies. Mr. Parks began his career as an engineer with Cities Service Company in 1978. He received a Bachelor of Science degree in Chemical Engineering from Rice University and his M.B.A. from the University of Texas at Austin.
Mr. Young
joined Unit Petroleum Company in June 2007 as Vice President - Central Division. In 2012, he was promoted to Senior Vice President of Exploration and Production over Unit’s Midcontinent assets. Before joining Unit, Mr. Young was employed by Anadarko Petroleum Corporation. He began his career with Anadarko in 1991 as a Production Engineer and, in 1994, began working as a Reservoir Engineer. In 1996, he was promoted to a Senior Asset Engineering role responsible for delineation and development of Anadarko’s North African oil fields. In 1999, he was moved into a Senior Completions / Operations Engineering role responsible for development of gas fields in East Texas. In 2000, he was promoted to Division Engineer responsible for operations within Anadarko’s Permian Division in West Texas. In 2002, he was promoted to Planning Manager for North America. In 2004, he was promoted to General Manager of Central Gulf of Mexico responsible for delineation and development of various Deepwater fields. Mr. Young holds a Bachelor of Science degree in Petroleum Engineering from Texas Tech University and a Master of Business Administration degree from Texas A&M University.
In accordance with Instruction G(3) of Form 10-K, the information required by this Item is incorporated into this report by reference to the Proxy Statement (see Item 10 above).
120
The following table provides information for all equity compensation plans as of the fiscal year ended
December 31, 2017
, under which our equity securities were authorized for issuance:
|
Plan Category
|
Number of
Securities to be
Issued Upon Exercise of
Outstanding Options,
Warrants and Rights
(a)
|
|
Weighted Average
Exercise Price of Outstanding Options, Warrants and Rights (b) |
Number of Securities
Remaining Available for Future Issuance Under Equity Compensation Plans (Excluding Securities Reflected in Column (a)) (c) |
|
|||||
|
Equity compensation plans approved by security holders
(1)
|
87,500
|
|
(2)
|
$
|
51.34
|
|
3,641,494
|
|
(3)
|
|
|
Equity compensation plans not approved by security holders
|
—
|
|
|
—
|
|
—
|
|
|
||
|
Total
|
87,500
|
|
|
$
|
51.34
|
|
3,641,494
|
|
|
|
_________________________
|
(1)
|
Shares awarded under all above plans may be newly issued, from our treasury, or acquired in the open market.
|
|
(2)
|
This number includes 87,500 stock options outstanding under the Non-Employee Directors’ Stock Option Plan.
|
|
(3)
|
This number reflects the shares available for issuance under the Second Amended and Restated Unit Corporation Stock and Incentive Compensation Plan effective May 6, 2015 (the amended plan). The amended plan allows us to grant stock-based compensation to our employees and non-employee directors. A total of
7,230,000
shares of the company's common stock is authorized for issuance to eligible participants under the amended plan. No more than 2,000,000 of the shares available under the amended plan may be issued as “incentive stock options” and all of the shares available under this plan may be issued as restricted stock. In addition, shares related to grants that are forfeited, terminated, canceled, expire unexercised, or settled in such manner that all or some of the shares are not issued to a participant shall immediately become available for issuance.
|
In accordance with Instruction G(3) of Form 10-K, the information required by this Item is incorporated into this report by reference to the Proxy Statement (see Item 10 above).
In accordance with Instruction G(3) of Form 10-K, the information required by this Item is incorporated into this report by reference to the Proxy Statement (see Item 10 above).
In accordance with Instruction G(3) of Form 10-K, the information required by this Item is incorporated into this report by reference to the Proxy Statement (see Item 10 above).
121
(a) Financial Statements, Schedules and Exhibits:
1.
Financial Statements:
Included in Part II of this report:
Report of Independent Registered Public Accounting Firm
Consolidated Balance Sheets as of December 31,
2017
and
2016
Consolidated Statements of Operations for the years ended December 31,
2017
,
2016
, and
2015
Consolidated Statements of Comprehensive Income (Loss) for the years ended December 31,
2017
,
2016
, and
2015
Consolidated Statements of Changes in Shareholders’ Equity for the years ended December 31,
2015
,
2016
, and
2017
Consolidated Statements of Cash Flows for the years ended December 31,
2017
,
2016
, and
2015
Notes to Consolidated Financial Statements
2.
Financial Statement Schedules:
Included in Part IV of this report for the years ended December 31,
2017
,
2016
, and
2015
:
Schedule II—Valuation and Qualifying Accounts and Reserves
Other schedules are omitted because of the absence of conditions under which they are required or because the required information is included in the consolidated financial statements or notes thereto.
3.
Exhibits:
The exhibit numbers in the following list correspond to the numbers assigned such exhibits in the Exhibit Table of Item 601 of Regulation S-K.
|
3.1
|
||
|
3.1.2
|
||
|
3.2
|
||
|
4.1
|
||
|
4.5
|
||
|
4.6
|
||
|
4.7
|
||
|
10.1.2*
|
||
|
10.1.3*
|
||
122
|
10.1.4
|
||
|
10.1.5
|
||
|
10.1.6
|
||
|
10.1.7
|
||
|
10.1.8*
|
||
|
10.1.9
|
||
|
10.1.10
|
||
|
10.2.1
|
Unit 1979 Oil and Gas Program Agreement of Limited Partnership (filed as Exhibit I to Unit Drilling and Exploration Company’s Registration Statement on Form S-1 as S.E.C. File No. 2-66347, which is incorporated herein by reference).
|
|
|
10.2.3*
|
||
|
10.2.4*
|
||
|
10.2.5*
|
Unit Corporation Employees’ Thrift Plan (filed as an Exhibit to Form S-8 as S.E.C. File No. 33-53542, which is incorporated herein by reference).
|
|
|
10.2.6
|
Unit Consolidated Employee Oil and Gas Limited Partnership Agreement (filed as an Exhibit to Unit’s Annual Report under cover of Form 10-K for the year ended December 31, 1993, which is incorporated herein by reference).
|
|
|
10.2.7*
|
||
|
10.2.8*
|
||
|
10.2.9*
|
||
|
10.2.10
|
||
|
10.2.11*
|
||
|
10.2.12
|
||
|
10.2.13
|
||
|
10.2.14
|
||
123
|
10.2.15
|
||
|
10.2.16
|
||
|
10.2.17*
|
||
|
10.2.18*
|
||
|
10.2.19
|
||
|
10.2.20
|
||
|
10.2.21*
|
||
|
10.2.22
|
||
|
10.2.23*
|
||
|
10.2.24*
|
||
|
10.2.25*
|
||
|
10.2.26*
|
||
|
10.2.27*
|
||
|
10.2.28
|
||
|
10.2.29*
|
||
|
10.2.30
|
||
|
10.2.31
|
||
|
10.2.32
|
||
|
10.2.33*
|
||
|
10.2.34*
|
||
|
10.2.35
|
||
|
10.2.36
|
||
124
|
12
|
||
|
21
|
||
|
23.1
|
||
|
23.2
|
||
|
31.1
|
||
|
31.2
|
||
|
32
|
||
|
99.1
|
||
|
101.INS
|
XBRL Instance Document.
|
|
|
101.SCH
|
XBRL Taxonomy Extension Schema Document.
|
|
|
101.CAL
|
XBRL Taxonomy Extension Calculation Linkbase Document.
|
|
|
101.DEF
|
XBRL Taxonomy Extension Definition Linkbase Document.
|
|
|
101.LAB
|
XBRL Taxonomy Extension Labels Linkbase Document.
|
|
|
101.PRE
|
XBRL Taxonomy Extension Presentation Linkbase Document.
|
|
* Indicates a management contract or compensatory plan identified under the requirements of Item 15 of Form 10-K.
Not applicable.
Schedule II
UNIT CORPORATION AND SUBSIDIARIES
VALUATION AND QUALIFYING ACCOUNTS AND RESERVES
Allowance for Doubtful Accounts:
|
Description
|
Balance at
Beginning
of Period
|
Additions
Charged to Costs & Expenses |
Deductions
& Net
Write-Offs
|
Balance at
End of
Period
|
|||||||||||
|
|
(In thousands)
|
||||||||||||||
|
Year ended December 31, 2017
|
$
|
3,773
|
|
$
|
348
|
|
$
|
(1,671
|
)
|
$
|
2,450
|
|
|||
|
Year ended December 31, 2016
|
$
|
5,199
|
|
$
|
785
|
|
$
|
(2,211
|
)
|
$
|
3,773
|
|
|||
|
Year ended December 31, 2015
|
$
|
5,039
|
|
$
|
1,191
|
|
$
|
(1,031
|
)
|
$
|
5,199
|
|
|||
125
SIGNATURES
Pursuant to the requirements of Section 13 or 15(d) of the Securities Exchange Act of 1934, the Registrant has duly caused this report to be signed on its behalf by the undersigned, thereunto duly authorized.
|
|
|
UNIT CORPORATION
|
|
|
DATE:
|
February 27, 2018
|
By:
|
/s/ L
ARRY
D. P
INKSTON
|
|
|
LARRY D. PINKSTON
|
||
|
|
President and Chief Executive Officer
(Principal Executive Officer)
|
||
Pursuant to the requirements of the Securities Exchange Act of 1934, this report has been signed below by the following persons on behalf of the Registrant and in the capacities indicated on the 27th day of February, 2018.
|
Name
|
|
Title
|
|
/s/ J. M
ICHAEL
A
DCOCK
|
|
Chairman of the Board and Director
|
|
J. Michael Adcock
|
|
|
|
/s/ L
ARRY
D. P
INKSTON
|
|
President and Chief Executive Officer and Director
(Principal Executive Officer)
|
|
Larry D. Pinkston
|
||
|
/s/ L
ES
A
USTIN
|
Senior Vice President, Chief Financial Officer (Principal Financial Officer)
|
|
|
Les Austin
|
||
|
/s/ D
ON
A. H
AYES
|
|
Vice President, Controller
(Principal Accounting Officer)
|
|
Don A. Hayes
|
|
|
|
/s/ G
ARY
C
HRISTOPHER
|
|
Director
|
|
Gary Christopher
|
|
|
|
/s/ S
TEVEN
B. H
ILDEBRAND
|
|
Director
|
|
Steven B. Hildebrand
|
|
|
|
/s/ C
ARLA
S. M
ASHINSKI
|
|
Director
|
|
Carla S. Mashinski
|
|
|
|
/s/ W
ILLIAM
B. M
ORGAN
|
|
Director
|
|
William B. Morgan
|
|
|
|
/s/ L
ARRY
C. P
AYNE
|
|
Director
|
|
Larry C. Payne
|
|
|
|
/s/ G. B
AILEY
P
EYTON
IV
|
|
Director
|
|
G. Bailey Peyton IV
|
|
|
|
/s/ R
OBERT
S
ULLIVAN
, J
R
.
|
|
Director
|
|
Robert Sullivan, Jr.
|
|
|
126
TABLE OF CONTENTS
Part IItem 1. BusinessItem 1A. Risk FactorsItem 1B. Unresolved Staff CommentsItem 2. PropertiesItem 3. Legal ProceedingsItem 4. Mine Safety DisclosuresPart IIItem 5. Market For The Registrant S Common Equity, Related Stockholder Matters, and Issuer Purchases Of Equity SecuritiesItem 6. Selected Financial DataItem 7. Management S Discussion and Analysis Of Financial Condition and Results Of OperationsItem 7A. Quantitative and Qualitative Disclosures About Market RiskItem 8. Financial Statements and Supplementary DataNote 1 OrganizationNote 2 Summary Of Significant Accounting PoliciesNote 3 Acquisitions and DivestituresNote 4 Earnings (loss) Per ShareNote 5 Accrued LiabilitiesNote 6 Long-term Debt and Other Long-term LiabilitiesNote 7 Asset Retirement ObligationsNote 8 Income TaxesNote 9 Employee Benefit PlansNote 10 Transactions with Related PartiesNote 11 Stock-based CompensationNote 12 DerivativesNote 13 Fair Value MeasurementsNote 14 Commitments and ContingenciesNote 15 EquityNote 16 Industry Segment InformationNote 17 Selected Quarterly Financial InformationItem 9. Changes in and Disagreements with Accountants on Accounting and Financial DisclosureItem 9A. Controls and ProceduresItem 9B. Other InformationPart IIIItem 10. Directors, Executive Officers, and Corporate GovernanceItem 11. Executive CompensationItem 12. Security Ownership Of Certain Beneficial Owners and Management and Related Stockholder MattersItem 13. Certain Relationships and Related Transactions, and Director IndependenceItem 14. Principal Accounting Fees and ServicesPart IVItem 15. Exhibits, Financial Statement SchedulesItem 16. Form 10-k Summary