UPBOUND GROUP, INC.
10-Ks and 10-Qs
|
|
|
|
|
|
|
|
|
|
|
|
|
|
|
|
|
|
|
|
|
|
|
|
|
|
|
|
|
|
|
|
|
|
|
|
|
|
|
|
|
|
|
|
|
|
|
|
|
|
|
|
|
|
|
|
UNITED STATES SECURITIES AND EXCHANGE COMMISSION
Washington, D.C. 20549
Form 10-K
|
(Mark One)
|
|
|
þ
|
ANNUAL REPORT PURSUANT TO SECTION 13 OR 15(d) OF THE SECURITIES EXCHANGE ACT OF 1934
|
|
For the fiscal year ended December 31, 2013
or
|
|
|
¨
|
TRANSITION REPORT PURSUANT TO SECTION 13 OR 15(d) OF THE SECURITIES EXCHANGE ACT OF 1934
|
Commission File No. 0-25370
_______________
Rent-A-Center, Inc.
(Exact name of registrant as specified in its charter)
|
Delaware
|
45-0491516
|
|
(State or other jurisdiction of
|
(I.R.S. Employer
|
|
incorporation or organization)
|
Identification No.)
|
5501 Headquarters Drive
Plano, Texas 75024
(Address, including zip code of registrant's
principal executive offices)
Registrant's telephone number, including area code:
972-801-1100
Securities registered pursuant to Section 12(b) of the Act:
|
Title of Each Class
|
Name of Exchange on Which Registered
|
|
Common Stock, par value $0.01 per share
|
The Nasdaq Global Select Market, Inc.
|
Securities registered pursuant to Section 12(g) of the Act:
None
_______________
Indicate by check mark if the registrant is a well-known seasoned issuer, as defined in Rule 405 of the Securities Act. Yes
þ
No
¨
Indicate by check mark if the registrant is not required to file reports pursuant to Section 13 or Section 15(d) of the Exchange Act. Yes
¨
No
þ
Indicate by check mark whether the registrant (1) has filed all reports required to be filed by Section 13 or 15(d) of the Securities Exchange Act of 1934 during the preceding 12 months (or for such shorter period that the registrant was required to file such reports), and (2) has been subject to such filing requirements for the past 90 days. Yes
þ
No
¨
Indicate by check mark whether the registrant has submitted electronically and posted on its corporate Web site, if any, every Interactive Data File required to be submitted and posted pursuant to Rule 405 of Regulation S-T during the preceding 12 months (or for such shorter period that the registrant was required to submit and post such files). Yes
þ
No
¨
Indicate by check mark if disclosure of delinquent filers pursuant to Item 405 of Regulation S-K is not contained herein, and will not be contained, to the best of registrant's knowledge, in definitive proxy or information statements incorporated by reference in Part III of this Form 10-K or any amendment to this Form 10-K.
þ
Indicate by check mark whether the registrant is a large accelerated filer, an accelerated filer, or a non-accelerated filer, or a smaller reporting company. See definitions of “large accelerated filer,” “accelerated filer” and “smaller reporting company” in Rule 12b-2 of the Exchange Act.
Large accelerated filer
þ
Accelerated filer
¨
Non-accelerated filer
¨
(Do not check if a smaller reporting company) Smaller reporting company
¨
Indicate by check mark whether the registrant is a shell company (as defined in Rule 12b-2 of the Exchange Act). Yes
¨
No
þ
|
Aggregate market value of the 51,749,850 shares
of Common Stock held by non-affiliates
of the registrant at the closing sales
price as reported on The Nasdaq Global Select Market, Inc. on June 28, 2013
|
$
|
1,943,206,868
|
|
|
Number of shares of Common Stock outstanding as of the close of business on February 21, 2014:
|
52,775,592
|
|
|
Documents incorporated by reference:
Portions of the definitive proxy statement relating to the 2014 Annual Meeting of Stockholders of Rent-A-Center, Inc. are incorporated by reference into Part III of this report.
.
TABLE OF CONTENTS
|
|
|
Page
|
|
PART I
|
||
|
Item 1.
|
Business
|
|
|
Item 1A.
|
Risk Factors
|
|
|
Item 1B.
|
Unresolved Staff Comments
|
|
|
Item 2.
|
Properties
|
|
|
Item 3.
|
Legal Proceedings
|
|
|
Item 4.
|
Mine Safety Disclosures
|
|
|
|
PART II
|
|
|
Item 5.
|
Market for Registrant’s Common Equity, Related Stockholder Matters and Issuer Purchases of Equity Securities
|
|
|
Item 6.
|
Selected Financial Data
|
|
|
Item 7.
|
Management’s Discussion and Analysis of Financial Condition and Results of Operations
|
|
|
Item 7A.
|
Quantitative and Qualitative Disclosures about Market Risk
|
|
|
Item 8.
|
Financial Statements and Supplementary Data
|
|
|
Item 9.
|
Changes in and Disagreements with Accountants on Accounting and Financial Disclosure
|
|
|
Item 9A.
|
Controls and Procedures
|
|
|
Item 9B.
|
Other Information
|
|
|
|
PART III
|
|
|
Item 10.
|
Directors, Executive Officers and Corporate Governance
|
|
|
Item 11.
|
Executive Compensation
|
|
|
Item 12.
|
Security Ownership of Certain Beneficial Owners and Management and Related Stockholder Matters
|
|
|
Item 13.
|
Certain Relationships and Related Transactions, and Director Independence
|
|
|
Item 14.
|
Principal Accountant Fees and Services
|
|
|
|
PART IV
|
|
|
Item 15.
|
Exhibits and Financial Statement Schedules
|
|
i
CAUTIONARY NOTE REGARDING FORWARD-LOOKING STATEMENTS
This Annual Report on Form 10-K includes “forward-looking” statements within the meaning of the Private Securities Litigation Reform Act of 1995. Forward-looking statements can be identified by the fact that they do not relate strictly to historical or current facts. They often include words such as “believes,” “expects,” “anticipates,” “estimates,” “intends,” “plans,” “seeks” or words of similar meaning, or future or conditional verbs, such as “will,” “should,” “could,” “may,” “aims,” “intends,” or “projects.” A forward-looking statement is neither a prediction nor a guarantee of future events or circumstances, and those future events or circumstances may not occur. You should not place undue reliance on forward-looking statements, which speak only as of the date of this Annual Report on Form 10-K. These forward-looking statements are all based on currently available operating, financial and competitive information and are subject to various risks and uncertainties. Our actual future results and trends may differ materially depending on a variety of factors, including, but not limited to, the risks and uncertainties discussed under “Risk Factors” and “Management’s Discussion and Analysis of Financial Condition and Results of Operations.” Given these risks and uncertainties, you should not rely on forward-looking statements as a prediction of actual results. Any or all of the forward-looking statements contained in this Annual Report on Form 10-K and any other public statement made by us, including by our management, may turn out to be incorrect. We are including this cautionary note to make applicable and take advantage of the safe harbor provisions of the Private Securities Litigation Reform Act of 1995 for forward-looking statements. We expressly disclaim any obligation to update or revise any forward-looking statements, whether as a result of new information, future events, changes in assumptions or otherwise.
1
Item 1.
Business.
History of Rent-A-Center
Unless the context indicates otherwise, references to “we,” “us” and “our” refer to the consolidated business operations of Rent-A-Center, Inc., the parent, and any or all of its direct and indirect subsidiaries.
We are the largest rent-to-own operator in North America, focused on improving the quality of life for our customers by providing them the opportunity to obtain ownership of high-quality durable products, such as consumer electronics, appliances, computers, furniture and accessories, under flexible rental purchase agreements with no long-term obligation.
We were incorporated in Delaware in 1986. From 1993 to 2006, we pursued an aggressive growth strategy in which we opened new stores and sought to acquire underperforming rent-to-own stores to which we could apply our operating model. As a result of this strategy, the number of our locations grew from 27 to over 3,400 in 2006, primarily through acquisitions. We acquired over 3,300 stores during this period, including approximately 390 of our franchised stores. These acquisitions occurred in approximately 200 separate transactions, including ten transactions in each of which we acquired in excess of 50 locations. In addition, we strategically opened or acquired stores near market areas served by our existing stores to enhance service levels, gain incremental sales and increase market penetration.
As our U.S. store base matured, we began to focus on attracting new customers through sources other than our existing U.S. rent-to-own stores and to seek additional distribution channels for our products and services. One of our current growth strategies is our “Acceptance Now” (previously "RAC Acceptance") model. With this model, we operate kiosks within various traditional retailers’ locations where we generally offer the rent-to-own transaction to consumers who do not qualify for financing from such retailers. The number of Acceptance Now locations increased to
1,325
at December 31, 2013, from 384 at December 31, 2010, and we intend to continue growing the Acceptance Now segment by expanding the number of our retail partners, increasing the number of locations with our existing retail partners and launching a virtual capability. In addition, we are expanding our operations in Mexico, and we are seeking to identify other international markets in which we believe our products and services would be in demand.
Our operations historically have generated strong cash flow. As a result, we have been able to invest in new business opportunities, execute strategic acquisitions, expand into different markets, make ongoing improvements in our support infrastructure and return value to shareholders, while maintaining a strong balance sheet.
Our principal executive offices are located at 5501 Headquarters Drive, Plano, Texas 75024. Our telephone number is (972) 801-1100 and our company website is www.rentacenter.com. We do not intend for information contained on our website to be part of this Annual Report on Form 10-K. We make available free of charge on or through our website our Annual Report on Form 10-K, our quarterly reports on Form 10-Q, our current reports on Form 8-K and amendments to those reports filed or furnished pursuant to Section 13(a) or 15(d) of the Exchange Act as soon as reasonably practicable after we electronically file such material with, or furnish it to, the Securities and Exchange Commission (the “SEC”). Additionally, we provide electronic or paper copies of our filings free of charge upon request.
The Rental Purchase Transaction
The rental purchase transaction is a flexible alternative for consumers to obtain use and enjoyment of brand name merchandise with no long-term obligation. Key features of the rental purchase transaction include:
Brand name merchandise.
We offer well-known brands such as LG, Samsung, Sony, Toshiba and Vizio home electronics; Whirlpool appliances; Acer, Apple, Asus, Dell, Hewlett-Packard, Samsung, Sony and Toshiba computers and/or tablets; and Albany, Ashley, England, Klaussner, Lane, Standard and Welton furniture.
Convenient payment options.
Our customers make payments on a weekly, semi-monthly or monthly basis in our stores, kiosks, online or by telephone. We accept cash and credit or debit cards. Rental payments are generally made in advance and, together with applicable fees, constitute our primary revenue source. Approximately 83% and 89% of our rental purchase agreements are on a weekly term in our Core U.S. rent-to-own stores and our International segment, respectively. Payments are made in advance on a monthly basis in our Acceptance Now segment.
No negative consequences.
A customer may terminate a rental purchase agreement at any time without penalty.
2
No credit needed.
Generally, we do not conduct a formal credit investigation of our customers. We verify a customer’s residence and sources of income. References provided by the customer are also contacted to verify the information contained in the rental purchase order form.
Delivery & set-up included.
We generally offer same-day or next-day delivery and installation of our merchandise at no additional cost to the customer in our rent-to-own stores. Our Acceptance Now locations rely on our third-party retail partners to deliver merchandise rented by the customer. Such third-party retail partners typically charge us a fee for delivery, which we pass on to the customer.
Product maintenance & replacement.
We provide any required service or repair without additional charge, except for damage in excess of normal wear and tear. Repair services are provided through our network of service centers, the cost of which may be reimbursed by the vendor if the item is still under factory warranty. If the product cannot be repaired at the customer’s residence, we provide a temporary replacement while the product is being repaired. If the product cannot be repaired, we will replace it with a product of comparable quality, age and condition.
Lifetime reinstatement
. If a customer is temporarily unable to make payments on a piece of rental merchandise and must return the merchandise, that customer generally may later re-rent the same piece of merchandise (or if unavailable, a substitute of comparable quality, age and condition) on the terms that existed at the time the merchandise was returned, and pick up payments where they left off without losing what they previously paid.
Flexible options to obtain ownership.
Ownership of the merchandise generally transfers to the customer if the customer has continuously renewed the rental purchase agreement for a peri
od of seven to 30 months, depend
ing upon the product type, or exercises a specified early purchase option.
Our Operating Segments
We report four operating segments: Core U.S., Acceptance Now, International, and Franchising. Additional information regarding our operating segments is presented in
“Management’s Discussion and Analysis of Financial Condition and Results of Operations”
contained in this Annual Report on Form 10-K, and financial information regarding these segments and revenues by geographic area are provided in Note Q in the consolidated financial statements contained in this Annual Report on Form 10-K. Substantially all of our revenues for the past three years originated in the United States.
Core U.S.
Our Core U.S. segment, consisting of our company-owned stores located in the United States and Puerto Rico, is our largest operating segment, comprising approximately
81%
of our consolidated net revenues and approximately
84%
of our operating profit for the
year ended
December 31, 2013
. Approximately 72% of our business in this segment is from repeat customers.
We recently launched a multi-year program designed to transform and modernize our operations company-wide in order to improve the profitability of the Core U.S. segment while continuing to support our Acceptance Now and International segments. This program is focused on building new competencies and capabilities through a variety of operational and infrastructure initiatives such as developing a new supply chain, formulating a customer-focused value-based pricing strategy, optimizing our store footprint, and innovating our digital e-commerce capabilities.
At
December 31, 2013
we operated
2,992
company-owned stores nationwide and in Puerto Rico, including
45
retail installment sales stores under the names “Get It Now” and “Home Choice.” We routinely evaluate the markets in which we operate and will close, sell or merge underperforming stores.
Acceptance Now
Through our Acceptance Now segment, we generally provide an on-site rent-to-own option at a third-party retailer’s location. In the event a retail purchase credit application is declined, the customer can be introduced to an in-store Acceptance Now representative who explains an alternative transaction for acquiring the use and ownership of the merchandise. Because we neither require nor perform a formal credit investigation for the approval of the rental purchase transaction, applicants who meet the basic criteria are generally approved. We believe our Acceptance Now program is beneficial for both the retailer and the consumer. The retailer captures more sales because we buy the inventory item directly from it and future rental payments are generally made at the retailer’s location. We believe consumers also benefit from our Acceptance Now program because they are able to obtain the products they want and need without the necessity of credit.
Each Acceptance Now kiosk location typically consists of an area with a computer, desk and chairs. We occupy the space without charge by agreement with each retailer. Accordingly, capital expenditures with respect to a new Acceptance Now location
3
are minimal. Likewise, any exit costs associated with the closure of an Acceptance Now location would also be immaterial on an individual basis.
We rely on our third-party retail partners to deliver merchandise rented by the customer. Such third-party retail partners typically charge us a fee for delivery, which we pass on to the customer. In the event the customer returns rented merchandise, we pick it up at no additional charge. Merchandise returned from an Acceptance Now kiosk location is offered for rent at one of our Core U.S. rent-to-own stores.
In 2013, approximately 22% of the total revenues of the Acceptance Now segment originated at our Acceptance Now kiosks located in stores operated by a nationwide furniture retailer and 81 of its licensees, collectively. An additional approximately 37% of the total revenues in the Acceptance Now segment in 2013 was generated by our Acceptance Now kiosks located in stores operated by three of our other third-party retail partners.
We intend to grow the Acceptance Now segment by increasing the number of our retail partners and the number of locations with our existing retail partners. In addition, our strategy includes enhancing our Acceptance Now offering by launching a virtual capability. As of
December 31, 2013
, we operated
1,325
kiosk locations inside furniture, electronics and appliance retailers located in
38
states and Puerto Rico. We expect to open approximately 100 kiosk locations in 2014.
International
Our International segment currently consists of our company-owned rent-to-own stores in Mexico and Canada. We are expanding our operations in Mexico and seeking to identify other international markets in which we believe our products and services would be in demand. We believe there are numerous opportunities to extend the rent-to-own transaction internationally.
We will expand operations into Mexico City and other complementary new market areas, while expanding our presence in currently existing market areas. At
December 31, 2013
, we operated
151
stores after adding 61 rent-to-own store locations in 2013 in Mexico, and we expect to open approximately 30 stores in 2014.
We currently operate
18
stores in Canada.
We are subject to the risks of doing business internationally as described under "Risk Factors."
Franchising
During 2013, ColorTyme, Inc., our franchisor of rent-to-own stores, changed its name to Rent-A-Center Franchising International, Inc., in connection with an offer to its current franchisees of the opportunity to convert their existing ColorTyme stores to the Rent-A-Center brand. We have ceased marketing franchises under the "ColorTyme" trade name and this segment is now referred to as Franchising. Our franchised stores use Rent-A-Center's, ColorTyme's or RimTyme's trade names, service marks, trademarks and logos, and operate under distinctive operating procedures and standards. Franchising's primary source of revenue is the sale of rental merchandise to its franchisees who, in turn, offer the merchandise to the general public for rent or purchase under a rent-to-own transaction.
To facilitate the conversion of ColorTyme branded stores to Rent-A-Center, we sold some of our company-owned stores to existing franchisees and purchased some of the former ColorTyme stores and are either operating them under the Rent-A-Center brand or merged them with existing stores. We believe that an unified network of both company-owned and franchised stores operating under the Rent-A-Center name creates a stronger service offering for our customers and leverages our growth efforts to reach more customers.
At
December 31, 2013
, this segment franchised
179
stores in
30
states operating under the Rent-A-Center (92 stores), ColorTyme (61 stores) and RimTyme (26 stores) names. These rent-to-own stores primarily offer high quality durable products such as consumer electronics, appliances, computers, furniture and accessories, wheels and tires.
As franchisor, Franchising receives royalties of 2.0% to 6.0% of the franchisees’ monthly gross revenue and, generally, an initial fee up to $35,000 per new location.
4
The following table summarizes our locations allocated among these operating segments as of December 31:
|
2013
|
2012
|
2011
|
|||||||
|
Core U.S.
|
2,992
|
|
2,990
|
|
2,994
|
|
|||
|
Acceptance Now
|
1,325
|
|
966
|
|
750
|
|
|||
|
International
|
|||||||||
|
Canada
|
18
|
|
18
|
|
28
|
|
|||
|
Mexico
|
151
|
|
90
|
|
52
|
|
|||
|
Franchising
|
179
|
|
224
|
|
216
|
|
|||
|
Total locations
|
4,665
|
|
4,288
|
|
4,040
|
|
|||
The following discussion applies generally to all of our operating segments, unless otherwise noted.
Rent-A-Center Operations
Store Design
Our Core U.S. stores average approximately 4,700 square feet and are located primarily in strip centers. Because we utilize “just in time” inventory strategies in our Core U.S. stores, receiving merchandise shipments in relatively small quantities directly from vendors, we are able to dedicate approximately 75% of the store space to showroom floor, and also eliminate warehousing costs. We continually evaluate store design in an effort to improve our customers’ in-store experience. Stores are remodeled approximately every five years.
Acceptance Now kiosks are located within the premises of third-party retailers. Each kiosk typically consists of an area with a computer, desk and chairs. We occupy the space without charge by agreement with each retailer.
Our International stores are generally similar to those in the Core U.S., although there may be differences attributable to the country in which such store is located. In Mexico, we are using distribution centers to manage inventory flow among stores.
Product Selection
Our Core U.S. and International stores generally offer merchandise from four basic product categories: consumer electronics, appliances, computers, furniture and accessories. Although we seek to maintain sufficient inventory in our stores to offer customers a wide variety of models, styles and brands, we generally limit merchandise to prescribed levels to maintain strict inventory controls. We seek to provide a wide variety of high quality merchandise to our customers, and we emphasize high-end products from name-brand manufacturers. Customers may request either new merchandise or previously rented merchandise. Previously rented merchandise is generally offered at the same weekly or monthly rental rate as is offered for new merchandise, but with an opportunity to obtain ownership of the merchandise after fewer rental payments.
Consumer electronic products offered by our stores include high definition televisions, home theater systems, video game consoles and stereos from top name-brand manufacturers such as LG, Samsung, Sony, Toshiba and Vizio. We offer major appliances manufactured by Whirlpool, including refrigerators, freezers, washing machines, dryers, and ranges. We offer desktop, laptop and tablet computers from Acer, Apple, Asus, Dell, Hewlett-Packard, Samsung, Sony and Toshiba. We offer a variety of furniture products, including dining room, living room and bedroom furniture featuring a number of styles, materials and colors. We offer furniture made by Albany, Ashley, England, Klaussner, Lane, Standard and Welton. Accessories include lamps and tables and are typically rented as part of a package of items, such as a complete room of furniture. Showroom displays enable customers to visualize how the product will look in their homes and provide a showcase for accessories.
The merchandise assortment may vary in our International stores according to market characteristics and consumer demand unique to the particular country in which we are operating. For example, in Mexico, the appliances we offer are sourced locally, providing our customers in Mexico the look and feel to which they are accustomed in that product category.
Acceptance Now locations offer the merchandise as available at the applicable third-party retailer.
For the year ended
December 31, 2013
, furniture and accessories accounted for approximately 39% of our consolidated store rental revenue, consumer electronic products for 28%, appliances for 18% and computers for 15%.
5
Product Turnover
On average, in the Core U.S. segment, a rental term of 16 months or exercising an early purchase option is generally required to obtain ownership of new merchandise. Product turnover is the number of times a product is rented to a different customer. On average, a product is rented (turned over) to three customers before a customer acquires ownership. Ownership is attained in approximately 25% of rental purchase agreements in the Core U.S. segment. The average total life for each product in our Core U.S. segment is approximately 18 months, which includes the initial rental period, all re-rental periods and idle time in our system. To cover the higher operating expenses generated by product turnover and the key features of rental purchase transactions, rental purchase agreements require higher aggregate payments than are generally charged under other types of purchase plans, such as installment purchase or credit plans.
Collections
Store managers use our management information system to track collections on a daily basis. Generally, our goal is to have no more than 5.99% of our rental agreements past due one day or more each Saturday evening in our Core U.S. rent-to-own stores. For fiscal years 2013, 2012, and 2011, the average week ending past due percentages were 7.46%, 6.76% and 7.07%, respectively. If a customer fails to make a rental payment when due, store personnel will attempt to contact the customer to obtain payment and reinstate the agreement, or will terminate the account and arrange to regain possession of the merchandise. We attempt to recover the rental items as soon as possible following termination or default of a rental purchase agreement, generally by the seventh day. Collection efforts are enhanced by the personal and job-related references required of customers, the personal nature of the relationships between our employees and customers, and the availability of lifetime reinstatement.
If a customer does not return the merchandise or make payment, the remaining book value of the rental merchandise associated with delinquent accounts is generally charged off on the 90
th
day following the time the account became past due in the Core U.S. and International segments, and on the 150
th
day in the Acceptance Now segment. Charge offs due to customer stolen merchandise in our Core U.S. rent-to-own stores, expressed as a percentage of rental store revenues, were approximately 2.7% in 2013, 2.4% in 2012, and 2.5% in 2011. Charge offs due to customer stolen merchandise in our Acceptance Now segment, expressed as a percentage of rental revenues, were approximately 5.5% in 2013, 5.4% in 2012, and 4.1% in 2011, which is higher than the Core U.S. segment due to the higher cost of rental merchandise in this segment. The ratio of agreement charge offs to total agreements in this segment is comparable to the Core U.S. segment.
Management
Our executive management team has extensive rent-to-own or similar retail experience and has demonstrated the ability to grow and manage our business through their operational leadership and strategic vision. In addition, our regional and district managers have long tenures with us, and we have a history of promoting management personnel from within. We believe this extensive industry and company experience will allow us to effectively execute our domestic and international growth strategies.
Purchasing
We utilize a centralized inventory management system that includes automated merchandise replenishment. Our automated replenishment system uses perpetual inventory records to analyze individual store requirements, as well as other pertinent information such as delivery and return forecasts, blanket orders, predetermined inventory levels, and vendor performance, to generate recommended merchandise order information. These recommended orders are reviewed by the store manager and delivered electronically to our vendors. The stores also have online access to determine whether other stores in their market may have merchandise available. This centralized inventory management system allows us to retain tight control over our inventory, improve the diversity and assortment of merchandise in our stores, and assist us in having the right products available at the right time. In addition, this centralized inventory management system requires less involvement by our store employees resulting in more time available for customer service and sales activities.
In our Core U.S. and International segments, we purchase our rental merchandise from a variety of manufacturers and distributors. In 2013, approximately 11% of our merchandise purchases were attributable to Whirlpool. No other brand accounted for more than 10% of merchandise purchased during this period. We do not generally enter into written contracts with our suppliers that obligate us to meet certain minimum purchasing levels. Although we expect to continue relationships with our existing suppliers, we believe there are numerous sources of products available, and we do not believe the success of our operations is dependent on any one or more of our present suppliers.
In our Acceptance Now segment, we purchase the merchandise selected by the customer from the applicable third-party retailer at the time such customer enters into a rental purchase agreement with us.
6
With respect to our Franchising segment, the franchise agreement requires the franchised stores to exclusively offer for rent or sale only those brands, types and models of products that Franchising has approved. The franchised stores are required to maintain an adequate mix of inventory that consists of approved products for rent as dictated by Franchising policy manuals. Franchising negotiates purchase arrangements with various suppliers it has approved. Franchising’s largest suppliers are Ashley and Whirlpool, which accounted for approximately 18% and 14% of merchandise purchased by Franchising in 2013, respectively.
Marketing
We promote our products and services through television and radio commercials, print advertisements, store telemarketing, Internet sites, direct response and store signage, all of which are designed to increase our name recognition among our customers and potential customers. Our advertisements emphasize such features as product and name-brand selection, prompt delivery, price match, service at no extra cost, lifetime reinstatement and the absence of initial deposits, formal credit investigations or long-term obligations. In addition, we promote the “RAC Worry-Free Guarantee
®
” to further highlight these aspects of the rent-to-own transaction. We believe that as the Rent-A-Center name gains familiarity and national recognition through our advertising efforts, we will continue to educate our customers and potential customers about the rent-to-own alternative to credit as well as solidify our reputation as a leading provider of high quality branded merchandise and services.
Advertising expense as a percentage of Core U.S. store revenues for the years ended December 31, 2013, 2012 and 2011 was 3.7%, 3.7% and 3.5%, respectively. As we obtain new stores in our existing market areas, the advertising expenses of each store in the market can generally be reduced by listing all stores in the same market-wide advertisement.
Franchising has established national advertising funds for the franchised stores, whereby Franchising has the right to collect up to 3% of the monthly gross revenue from each franchisee as contributions to the fund. Franchising directs the advertising programs of the fund, generally consisting of television and radio commercials and print advertisements. Franchising also has the right to require franchisees to expend up to 3% of their monthly gross revenue on local advertising.
Industry & Competition
According to the Association of Progressive Rental Organizations (“APRO”), the rent-to-own industry in the United States, Mexico and Canada consists of approximately 10,100 stores and serves approximately 4.8 million customers. We estimate that the two largest rent-to-own industry participants account for approximately 6,800 of the total number of stores, and the majority of the remainder of the industry consists of operations with fewer than 50 stores. The rent-to-own industry is highly fragmented and has experienced significant consolidation. We believe this consolidation trend in the industry will continue, presenting opportunities for us to continue to acquire additional stores or customer accounts on favorable terms.
The rent-to-own industry serves a highly diverse customer base. According to APRO, approximately 83% of rent-to-own customers have household incomes between $15,000 and $50,000 per year. The rent-to-own industry serves a wide variety of customers by allowing them to obtain merchandise that they might otherwise be unable to obtain due to insufficient cash resources or a lack of access to credit. We believe the number of consumers lacking access to credit is increasing. According to a report issued by the Fair Isaac Corporation on February 3, 2014, consumers in the “subprime” category (those with credit scores below 650) made up 34% of the United States population.
The rent-to-own industry is highly competitive. Our stores and kiosks compete with other national, regional and local rent-to-own businesses, including on-line only competitors, as well as with rental stores that do not offer their customers a purchase option. With respect to customers desiring to purchase merchandise for cash or on credit, we also compete with retail stores. Competition is based primarily on store location, product selection and availability, customer service, and rental rates and terms.
Seasonality
Our revenue mix is moderately seasonal, with the first quarter of each fiscal year generally providing higher merchandise sales than any other quarter during a fiscal year, primarily related to federal income tax refunds. Generally, our customers will more frequently exercise the early purchase option on their existing rental purchase agreements or purchase pre-leased merchandise off the showroom floor during the first quarter of each fiscal year. Furthermore, we tend to experience slower growth in the number of rental purchase agreements in the third quarter of each fiscal year when compared to other quarters throughout the year. We expect these trends to continue in the future.
7
Trademarks
We own various trademarks and service marks, including Rent-A-Center
®
and RAC Worry-Free Guarantee
®
that are used in connection with our operations and have been registered with the United States Patent and Trademark Office. The duration of our trademarks is unlimited, subject to periodic renewal and continued use. In addition, we have obtained trademark registrations in Canada, Mexico, and certain other foreign jurisdictions. We believe we hold the necessary rights for protection of the trademarks and service marks essential to our business. The products held for rent in our stores also bear trademarks and service marks held by their respective manufacturers.
Franchising licenses the use of the Rent-A-Center and ColorTyme trademarks and service marks to its franchisees under the franchise agreement. ColorTyme owns various trademarks and service marks, including ColorTyme
®
, RimTyme
®
, and Your Hometown ColorTyme
®
, that are used in connection with its operations and have been registered with the United States Patent and Trademark office. The duration of these marks is unlimited, subject to periodic renewal and continued use.
Employees
As of
February 21, 2014
, we had approximately 22,200 full-time employees.
Government Regulation
Core U.S. & Acceptance Now
State Regulation.
Currently, 46 states, the District of Columbia and Puerto Rico have rental purchase statutes that recognize and regulate rental purchase transactions as separate and distinct from credit sales. We believe this existing legislation is generally favorable to us, as it defines and clarifies the various disclosures, procedures and transaction structures related to the rent-to-own business with which we must comply. With some variations in individual states, most related state legislation requires the lessor to make prescribed disclosures to customers about the rental purchase agreement and transaction, and provides time periods during which customers may reinstate agreements despite having failed to make a timely payment. Some state rental purchase laws prescribe grace periods for non-payment, prohibit or limit certain types of collection or other practices, and limit certain fees that may be charged. Ten states limit the total rental payments that can be charged to amounts ranging from 2.0 times to 2.4 times the disclosed cash price or the retail value of the rental product. Four states limit the cash price of merchandise to amounts ranging from 1.56 to 2.5 times our cost for each item.
Although Minnesota has a rental purchase statute, the rental purchase transaction is also treated as a credit sale subject to consumer lending restrictions pursuant to judicial decision. Therefore, we offer our customers in Minnesota an opportunity to purchase our merchandise through an installment sale transaction in our Home Choice stores. We operate 17 Home Choice stores in Minnesota.
North Carolina has no rental purchase legislation. However, the retail installment sales statute in North Carolina expressly provides that lease transactions which provide for more than a nominal purchase price at the end of the agreed rental period are not credit sales under the statute. We operate 121 rent-to-own stores and 67 Acceptance Now locations in North Carolina.
Courts in Wisconsin and New Jersey, which do not have rental purchase statutes, have rendered decisions which classify rental purchase transactions as credit sales subject to consumer lending restrictions. Accordingly, in Wisconsin, we offer our customers an opportunity to purchase our merchandise through an installment sale transaction in our Get It Now stores. In New Jersey, we have modified our typical rental purchase agreements to provide disclosures, grace periods, and pricing that we believe comply with the retail installment sales act. We operate 28 Get It Now stores in Wisconsin and 47 Rent-A-Center stores in New Jersey.
There can be no assurance as to whether new or revised rental purchase laws will be enacted or whether, if enacted, the laws would not have a material and adverse effect on us.
Federal Regulation
.
To date, no comprehensive federal legislation has been enacted regulating or otherwise impacting the rental purchase transaction. The Dodd-Frank Wall Street Reform and Consumer Protection Act (“Dodd-Frank Act”) does not regulate leases with terms of 90 days or less. Because the rent-to-own transaction is for a term of week to week, or at most, month to month, and established federal law deems the term of a lease to be its minimum term regardless of extensions or renewals, if any, we believe the rent-to-own transaction is not covered by the Dodd-Frank Act.
From time to time, we have supported legislation introduced in Congress that would regulate the rental purchase transaction. While both beneficial and adverse legislation may be introduced in Congress in the future, any adverse federal legislation, if enacted, could have a material and adverse effect on us.
8
International
No comprehensive legislation regulating the rent-to-own transaction has been enacted in Mexico or Canada. We use substantially the same rental purchase transaction in those countries as in the Core U.S. stores, but with such additional provisions as we believe may be necessary to comply with such country’s specific laws and customs.
9
Item 1A.
Risk Factors.
You should carefully consider the risks described below before making an investment decision. We believe these are all the material risks currently facing our business. Our business, financial condition or results of operations could be materially adversely affected by these risks. The trading price of our common stock could decline due to any of these risks, and you may lose all or part of your investment. You should also refer to the other information included in this Annual Report on Form 10-K, including our consolidated financial statements and related notes.
Future revenue and earnings growth depends on our ability to execute our growth strategies.
Our Core U.S. store base is mature. As a result, our same store sales have increased more slowly than in historical periods, or in some cases, decreased. Accordingly, we are focused on acquiring new customers through sources other than our existing U.S. rent-to-own stores, as well as seeking additional distribution channels for our products and services. Our primary growth strategies are our Acceptance Now and International segments. Effectively managing growth can be challenging, particularly as we continue to expand into channels outside our traditional rent-to-own store model and expand internationally. This growth places significant demands on management and operational systems. If we are unable to successfully execute these growth strategies, our revenue and earnings may grow more slowly or even decrease.
Our plans depend significantly on initiatives designed to transform and modernize the efficiency and effectiveness of our operations.
We recently launched a multi-year program designed to transform and modernize our operations company-wide in order to improve the profitability of the Core U.S. segment while continuing to support the expansion in our Acceptance Now and International segments. This program is focused on building new competencies and capabilities through a variety of operational and infrastructure initiatives such as developing a new supply chain, formulating a customer-focused value-based pricing strategy, optimizing our store footprint, and innovating our digital e-commerce capabilities. Higher costs or failure to achieve targeted results associated with the implementation of such new programs or initiatives could adversely affect our results of operations or negatively impact our ability to successfully execute our growth strategies.
We are highly dependent on the financial performance of our Core U.S. operating segment.
Our financial performance is highly dependent on our Core U.S. segment, which comprised approximately
81%
of our consolidated net revenues and a substantial portion of our net earnings for the year ended
December 31, 2013
. Any significant decrease in the financial performance of the Core U.S. segment may also have a material adverse impact on our ability to implement our growth strategies.
Failure to effectively manage our costs could have a material adverse effect on our profitability.
Certain elements of our cost structure are largely fixed in nature. Consumer spending remains uncertain, which makes it more challenging for us to maintain or increase our operating income in the Core U.S. segment. The competitiveness in our industry and increasing price transparency means that the focus on achieving efficient operations is greater than ever. As a result, we must continuously focus on managing our cost structure. Failure to manage our labor and benefit rates, advertising and marketing expenses, operating leases, other store expenses or indirect spending could materially adversely affect our profitability.
Our Acceptance Now segment depends on the success of our third-party retail partners and our continued relationship with them.
Our Acceptance Now segment revenues depend in part on the ability of unaffiliated third-party retailers to attract customers. In addition, in most cases, our agreements with such third-party retailers may be terminated at the retailer's election. The failure of our third-party retail partners to maintain quality and consistency in their operations and their ability to continue to provide products and services, or the loss of the relationship with any of these third-party retailers and an inability to replace them, could cause our Acceptance Now segment to lose customers, substantially decreasing the revenues and earnings of our Acceptance Now segment. This could adversely affect our financial results and slow our overall growth. In 2013, approximately 22% of the total revenue of the Acceptance Now segment originated at our Acceptance Now kiosks located in stores operated by a nationwide furniture retailer and 81 of its licensees, collectively. An additional approximately 37% of the total revenues in the Acceptance Now segment in 2013 was generated by our Acceptance Now kiosks located in stores operated by three of our other third-party retail partners. We may be unable to continue growing the Acceptance Now segment if we are unable to find third-party retailers willing to partner with us or if we are unable to enter into agreements with third-party retailers acceptable to us.
10
The success of our business is dependent on factors affecting consumer spending that are not under our control.
Consumer spending is affected by general economic conditions and other factors including levels of employment, disposable consumer income, prevailing interest rates, consumer debt and availability of credit, costs of fuel, inflation, recession and fears of recession, war and fears of war, pandemics, inclement weather, tax rates and rate increases, timing of receipt of tax refunds, consumer confidence in future economic conditions and political conditions, and consumer perceptions of personal well-being and security. Unfavorable changes in factors affecting discretionary spending could reduce demand for our products and services resulting in lower revenue and negatively impacting the business and its financial results.
If we are unable to compete effectively with the growing e-commerce sector, our business and results of operations may be materially adversely affected.
With the continued expansion of internet use, as well as mobile computing devices and smart phones, competition from the e-commerce sector continues to grow. Although we have plans to launch virtual capabilities within our Acceptance Now and Core U.S. segments, we do not currently offer the rent-to-own transaction via an on-line marketplace. Certain of our competitors, and a number of e-commerce retailers, have established e-commerce operations against which we compete for customers. It is possible that the increasing competition from the e-commerce sector may reduce our market share, gross margin, and operating margin, and may materially adversely affect our business and results of operations in other ways.
Our debt agreements impose restrictions on us which may limit or prohibit us from engaging in certain transactions. If a default were to occur, our lenders could accelerate the amounts of debt outstanding, and holders of our secured indebtedness could force us to sell our assets to satisfy all or a part of what is owed.
Covenants under our senior credit facilities and the indenture governing our outstanding senior unsecured notes restrict our ability to pay dividends and engage in various operational matters. In addition, covenants under our senior credit facilities require us to maintain specified financial ratios. Our ability to meet these financial ratios may be affected by events beyond our control. These restrictions could limit our ability to obtain future financing, make needed capital expenditures or other investments, repurchase our outstanding debt or equity, pay dividends, withstand a future downturn in our business or in the economy, dispose of operations, engage in mergers, acquire additional stores or otherwise conduct necessary corporate activities. Various transactions that we may view as important opportunities, such as specified acquisitions, are also subject to the consent of lenders under the senior credit facilities, which may be withheld or granted subject to conditions specified at the time that may affect the attractiveness or viability of the transaction.
On
February 20, 2014
, we obtained a waiver from the lenders under our senior credit facilities to permit the declaration and payment of a cash dividend with respect to the second quarter of 2014.
In addition, on February 6, 2014, we announced that we intend to refinance our existing credit facility. We currently expect to enter into a new $850 million senior credit facility, consisting of a $350 million term loan and a $500 million revolving credit facility, during the first quarter of 2014. If we are unable to complete the refinancing transaction, or obtain other relief from the lenders under our current senior credit facilities, our current projections indicate that an event of default under our existing senior credit facilities may occur in 2014.
If a default were to occur, the lenders under our senior credit facilities could accelerate the amounts outstanding under the credit facilities. In addition, the lenders under these agreements could terminate their commitments to lend to us. If the lenders under these agreements accelerate the repayment of borrowings, we may not have sufficient liquid assets at that time to repay the amounts then outstanding under our indebtedness or be able to find additional alternative financing. Even if we could obtain additional alternative financing, the terms of the financing may not be favorable or acceptable to us.
The existing indebtedness under our senior credit facilities is secured by substantially all of our assets. Should a default or acceleration of this indebtedness occur, the holders of this indebtedness could sell the assets to satisfy all or a part of what is owed.
Our current insurance program may expose us to unexpected costs and negatively affect our financial performance.
Our insurance coverage is subject to deductibles, self-insured retentions, limits of liability and similar provisions that we believe are prudent based on our operations. Because we self-insure a significant portion of expected losses under our workers' compensation, general liability, vehicle and group health insurance programs, unanticipated changes in any applicable actuarial assumptions and management estimates underlying our recorded liabilities for these losses, including potential increases in medical and indemnity costs, could result in materially different amounts of expense than expected under these programs, which could have a material adverse effect on our financial condition and results of operations.
11
Our operations in Mexico are subject to political or regulatory changes and significant changes in the economic environment and other concerns.
We opened our first store in Mexico in October 2010, and operated
151
stores in Mexico as of
December 31, 2013
. Our growth plans include significant expansion in our International segment. Changes in the business, regulatory or political climate in Mexico could adversely affect our operations there, which could negatively impact our growth plans. Mexico is also subject to certain potential risks and uncertainties that are beyond our control, such as violence, social unrest, enforcement of property rights and public safety and security that could restrict or eliminate our ability to open new or operate some or all of our locations in Mexico, or significantly reduce customer traffic or demand. In addition, our assets, investments in, earnings from and dividends from our Mexican subsidiaries must be translated to U.S. dollars from the Mexican peso. Accordingly, we are exposed to risks associated with fluctuations of the exchange rate for the Mexican peso which may have an impact on our future costs or on future cash flows from our international operations, and could adversely affect our financial performance.
The continued expansion of our International segment, including into new international markets, presents unique challenges which may subject us to risks associated with the legislative, judicial, accounting, regulatory, political, cultural and economic factors specific to the countries or regions in which we may operate in the future, which could adversely affect our anticipated growth.
Expansion of our International segment, including into new international markets, is one of our primary growth objectives. As these operations grow, they may require greater management and financial resources. International operations require the integration of personnel with varying cultural and business backgrounds and an understanding of the relevant differences in the cultural, legal and regulatory environments. In addition, these operations are subject to the potential risks of changing economic and financial conditions in each of its markets, exchange rate fluctuations, legal and regulatory requirements in local jurisdictions, tariffs and trade barriers, difficulties in staffing and managing local operations, failure to understand the local culture and market, difficulties in protecting intellectual property, the burden of complying with complex foreign laws, including anti-competition regulations, tax laws and financial accounting standards, and adverse local economic, political and social conditions in certain countries. If, as we continue to expand our International segment, we are unable to successfully replicate our business model due to these and other commercial and regulatory constraints present in our international markets, our growth may be adversely affected.
Our transactions are regulated by and subject to the requirements of various federal and state laws and regulations, which may require significant compliance costs and expose us to litigation. Any negative change in these laws or the passage of unfavorable new laws could require us to alter our business practices in a manner that may be materially adverse to us.
Currently, 46 states, the District of Columbia and Puerto Rico have passed laws that regulate rental purchase transactions as separate and distinct from credit sales. One additional state has a retail installment sales statute that excludes leases, including rent-to-own transactions, from its coverage if the lease provides for more than a nominal purchase price at the end of the rental period. The specific rental purchase laws generally require certain contractual and advertising disclosures. They also provide varying levels of substantive consumer protection, such as requiring a grace period for late fees and contract reinstatement rights in the event the rental purchase agreement is terminated. The rental purchase laws of ten states limit the total amount that may be charged over the life of a rental purchase agreement and the laws of four states limit the cash prices for which we may offer merchandise.
Similar to other consumer transactions, our rental purchase transaction is also governed by various federal and state consumer protection statutes. These consumer protection statutes, as well as the rental purchase statutes under which we operate, provide various consumer remedies, including monetary penalties, for violations. In our history, we have been the subject of litigation alleging that we have violated some of these statutory provisions.
Although there is currently no comprehensive federal legislation regulating rental purchase transactions, adverse federal legislation may be enacted in the future. From time to time, both favorable and adverse legislation seeking to regulate our business has been introduced in Congress. In addition, various legislatures in the states where we currently do business may adopt new legislation or amend existing legislation that could require us to alter our business practices in a manner that could have a material adverse effect on our business, financial condition and results of operations.
Our reputation, ability to do business and operating results may be impaired by improper conduct by any of our employees, agents or business partners.
Our International operations are subject to certain laws generally prohibiting companies and their intermediaries from making improper payments to government officials for the purpose of obtaining or retaining business, such as the U.S. Foreign Corrupt Practices Act, and similar anti-bribery laws in other jurisdictions. Our employees, contractors or agents may violate the policies and procedures we have implemented to ensure compliance with these laws. Any such improper actions could subject us to civil
12
or criminal investigations in the U.S. and in other jurisdictions, could lead to substantial civil and criminal, monetary and non-monetary penalties, and related shareholder lawsuits, could cause us to incur significant legal fees, and could damage our reputation.
We may be subject to legal proceedings from time to time which seek material damages. The costs we incur in defending ourselves or associated with settling any of these proceedings, as well as a material final judgment or decree against us, could materially adversely affect our financial condition by requiring the payment of the settlement amount, a judgment or the posting of a bond.
In our history, we have defended class action lawsuits alleging various regulatory violations and have paid material amounts to settle such claims. Significant settlement amounts or final judgments could materially and adversely affect our liquidity and capital resources. The failure to pay any material judgment would be a default under our senior credit facilities and the indenture governing our outstanding senior unsecured notes.
Our operations are dependent on effective management information systems. Failure of these systems could negatively impact our ability to manage store operations, which could have a material adverse effect on our business, financial condition and results of operations.
We utilize integrated management information systems. The efficient operation of our business is dependent on these systems to effectively manage our financial and operational data. The failure of our management information systems to perform as designed, loss of data or any interruption of our management information systems for a significant period of time could disrupt our business. If the management information systems sustain repeated failures, we may not be able to manage our store operations, which could have a material adverse effect on our business, financial condition and results of operations.
We are currently investing in the development of new store information management systems and processes that extend and improve capabilities for store sales and operations. Such enhancements to or replacement of our store information management systems could have a significant impact on our ability to conduct our core business operations and increase our risk of loss resulting from disruptions of normal operating processes and procedures that may occur during the implementation of new technology. We can make no assurances that the costs of investments in our new store information management systems will not exceed estimates, that such systems and processes will be implemented without material disruption, or that such systems and processes will be as beneficial as predicted. If any of these events occur, our results of operations could be harmed.
If we fail to protect the integrity and security of customer and employee information, we could be exposed to litigation or regulatory enforcement and our business could be adversely impacted.
We collect and store certain personal information provided to us by our customers and employees in the ordinary course of our business. Despite instituted safeguards for the protection of such information, we cannot be certain that all of our systems are entirely free from vulnerability to attack. Computer hackers may attempt to penetrate our network security and, if successful, misappropriate confidential customer or employee information. In addition, one of our employees, contractors or other third party with whom we do business may attempt to circumvent our security measures in order to obtain such information, or inadvertently cause a breach involving such information. Loss of customer or employee information could disrupt our operations, damage our reputation, and expose us to claims from customers, employees, regulators and other persons, any of which could have an adverse effect on our business, financial condition and results of operations. In addition, the costs associated with information security, such as increased investment in technology, the costs of compliance with privacy laws, and costs incurred to prevent or remediate information security breaches, could adversely impact our business.
A change of control could accelerate our obligation to pay our outstanding indebtedness, and we may not have sufficient liquid assets at that time to repay these amounts.
Under our senior credit facilities, an event of default would result if a third party became the beneficial owner of 35.0% or more of our voting stock or upon certain changes in the constitution of Rent-A-Center’s Board of Directors. As of
December 31, 2013
,
$348.0 million
was outstanding under our senior credit facilities.
Under the indenture governing our outstanding senior unsecured notes, in the event of a change in control, we may be required to offer to purchase all of our outstanding senior unsecured notes at 101% of their original aggregate principal amount, plus accrued interest to the date of repurchase. A change in control also would result in an event of default under our senior credit facilities, which would allow our lenders to accelerate indebtedness owed to them.
13
If a specified change in control occurs and the lenders under our debt instruments accelerate these obligations, we may not have sufficient liquid assets to repay amounts outstanding under these agreements.
R
ent-A-Center's organizational documents and our debt instruments contain provisions that may prevent or deter another group from paying a premium over the market price to Rent-A-Center's stockholders to acquire its stock.
Rent-A-Center’s organizational documents contain provisions that classify its Board of Directors, authorize its Board of Directors to issue blank check preferred stock and establish advance notice requirements on its stockholders for director nominations and actions to be taken at meetings of the stockholders. In addition, as a Delaware corporation, Rent-A-Center is subject to Section 203 of the Delaware General Corporation Law relating to business combinations. Our senior credit facilities and the indentures governing our senior unsecured notes each contain various change of control provisions which, in the event of a change of control, would cause a default under those provisions. These provisions and arrangements could delay, deter or prevent a merger, consolidation, tender offer or other business combination or change of control involving us that could include a premium over the market price of Rent-A-Center’s common stock that some or a majority of Rent-A-Center’s stockholders might consider to be in their best interests.
Rent-A-Center is a holding company and is dependent on the operations and funds of its subsidiaries.
Rent-A-Center is a holding company, with no revenue generating operations and no assets other than its ownership interests in its direct and indirect subsidiaries. Accordingly, Rent-A-Center is dependent on the cash flow generated by its direct and indirect operating subsidiaries and must rely on dividends or other intercompany transfers from its operating subsidiaries to generate the funds necessary to meet its obligations, including the obligations under the senior credit facilities. The ability of Rent-A-Center’s subsidiaries to pay dividends or make other payments to it is subject to applicable state laws. Should one or more of Rent-A-Center’s subsidiaries be unable to pay dividends or make distributions, its ability to meet its ongoing obligations could be materially and adversely impacted.
Our stock price is volatile, and you may not be able to recover your investment if our stock price declines.
The price of our common stock has been volatile and can be expected to be significantly affected by factors such as:
|
•
|
our ability to meet market expectations with respect to the growth and profitability of each of our operating segments;
|
|
•
|
quarterly variations in our results of operations, which may be impacted by, among other things, changes in same store sales or when and how many locations we acquire or open;
|
|
•
|
quarterly variations in our competitors’ results of operations;
|
|
•
|
changes in earnings estimates or buy/sell recommendations by financial analysts; and
|
|
•
|
the stock price performance of comparable companies.
|
In addition, the stock market as a whole has experienced extreme price and volume fluctuations that have affected the market price of many specialty retailers in ways that may have been unrelated to these companies' operating performance.
Failure to achieve and maintain effective internal controls could have a material adverse effect on our business and stock price.
Effective internal controls are necessary for us to provide reliable financial reports. If we cannot provide reliable financial reports, our brand and operating results could be harmed. All internal control systems, no matter how well designed, have inherent limitations. Therefore, even those systems determined to be effective can provide only reasonable assurance with respect to financial statement preparation and presentation.
While we continue to evaluate and improve our internal controls, we cannot be certain that these measures will ensure that we implement and maintain adequate controls over our financial processes and reporting in the future. Any failure to implement required new or improved controls, or difficulties encountered in their implementation, could harm our operating results or cause us to fail to meet our reporting obligations.
If we fail to maintain the adequacy of our internal controls, as such standards are modified, supplemented or amended from time to time, we may not be able to ensure that we can conclude on an ongoing basis that we have effective internal control over financial reporting in accordance with Section 404 of the Sarbanes-Oxley Act. Failure to achieve and maintain an effective internal control environment could cause investors to lose confidence in our reported financial information, which could have a material adverse effect on our stock price.
14
Item 1B.
Unresolved Staff Comments.
None.
Item 2.
Properties.
We lease space for substantially all of our Core U.S. and International stores and certain support facilities under operating leases expiring at various times through 2023. Most of our store leases are five year leases and contain renewal options for additional periods ranging from three to five years at rental rates adjusted according to agreed-upon formulas. Store sizes average approximately 4,700 square feet. Approximately 75% of each store’s space is generally used for showroom space and 25% for offices and storage space. Our Acceptance Now kiosks occupy space without charge in the retailer's location with no lease commitment.
We believe suitable store space generally is available for lease and we would be able to relocate any of our stores or support facilities without significant difficulty should we be unable to renew a particular lease. We also expect additional space is readily available at competitive rates to open new stores or support facilities, as necessary.
We own the land and building at 5501 Headquarters Drive, Plano, Texas, in which our corporate headquarters is located. The land and improvements are pledged as collateral under our senior credit facilities.
Item 3.
Legal Proceedings.
From time to time, we, along with our subsidiaries, are party to various legal proceedings arising in the ordinary course of business. We reserve for litigation loss contingencies that are both probable and reasonably estimable. We do not expect these losses to have a material impact on our consolidated financial statements if and when such losses are incurred.
Item 4.
Mine Safety Disclosures.
Not applicable.
15
Item 5.
Market for Registrant’s Common Equity, Related Stockholder Matters and Issuer Purchases of Equity
Securities.
Our common stock has been listed on the Nasdaq Global Select Market
®
and its predecessors under the symbol “RCII” since January 25, 1995, the date we commenced our initial public offering. The following table sets forth, for the periods indicated, the high and low sales price per share of our common stock as reported, and the quarterly cash dividend declared per share on our common stock.
|
2013
|
High
|
Low
|
Cash Dividends
Declared
|
|||
|
Fourth Quarter
|
$39.00
|
$32.83
|
$0.23
|
|||
|
Third Quarter
|
$40.80
|
$36.44
|
$0.21
|
|||
|
Second Quarter
|
$39.61
|
$33.20
|
$0.21
|
|||
|
First Quarter
|
$38.23
|
$32.93
|
$0.21
|
|||
|
2012
|
High
|
Low
|
Cash Dividends
Declared
|
|||
|
Fourth Quarter
|
$36.73
|
$31.22
|
$0.21
|
|||
|
Third Quarter
|
$37.81
|
$32.31
|
$0.16
|
|||
|
Second Quarter
|
$38.38
|
$31.96
|
$0.16
|
|||
|
First Quarter
|
$39.50
|
$33.01
|
$0.06
|
|||
As of
February 21, 2014
, there were approximately 44 record holders of our common stock.
Future decisions to pay cash dividends on our common stock continue to be at the discretion of our Board of Directors and will depend on a number of factors, including future earnings, capital requirements, contractual restrictions, financial condition, future prospects and any other factors our Board of Directors may deem relevant. Cash dividend payments are subject to certain restrictions in our debt agreements. On
February 20, 2014
, we obtained a waiver from the lenders under our senior credit facilities to permit the declaration and payment of a cash dividend with respect to the second quarter of 2014. In addition, on February 6, 2014, we announced that we intend to refinance our existing senior credit facility. Please see the section entitled
“Management’s Discussion and Analysis of Financial Condition and Results of Operations — Liquidity and Capital Resources — Liquidity Requirements,
Senior Credit Facilities
”
and
“—
Senior Notes
”
on pages
33
and
35
, respectively, of this Annual Report on Form 10-K for further discussion of such restrictions.
Under our current common stock repurchase program, our Board of Directors has authorized the purchase, from time to time, in the open market and privately negotiated transactions, up to an aggregate of
$1.25 billion
of Rent-A-Center common stock. As of
December 31, 2013
, we had purchased a total of
36,994,653
shares of Rent-A-Center common stock for an aggregate purchase price of
$994.8 million
under this common stock repurchase program. During the year ended
December 31, 2013
, we repurchased a total of 5,874,374 shares for $217.4 million in cash, which included $200 million under an accelerated stock buyback commenced in May 2013 and settled in October 2013. In the fourth quarter of 2013, we effected the following repurchases of our common stock:
|
Period
|
Total Number
of Shares
Purchased
|
Average Price
Paid per Share
(Including Fees)
|
Total Number of
Shares Purchased as
Part of Publicly
Announced Plans or
Programs
|
Maximum Dollar Value
that May Yet Be
Purchased Under the
Plans or Programs
(Including Fees)
|
|||||||||
|
October 1 through October 31
|
816,916
|
|
$
|
36.9731
|
|
(1)
|
816,916
|
|
$
|
255,237,026
|
|
||
|
November 1 through November 30
|
—
|
|
$
|
—
|
|
—
|
|
$
|
255,237,026
|
|
|||
|
December 1 through December 31
|
—
|
|
$
|
—
|
|
—
|
|
$
|
255,237,026
|
|
|||
|
Total
|
816,916
|
|
$
|
36.9731
|
|
816,916
|
|
$
|
255,237,026
|
|
|||
|
(1)
|
Represents the final settlement of our accelerated stock buyback program, under which we received an initial share delivery of 4,592,423 shares in May 2013, which was then estimated to be 80% of the total shares. We received a total of 5,409,339 shares for $200 million, an average of $36.9731 per share.
|
16
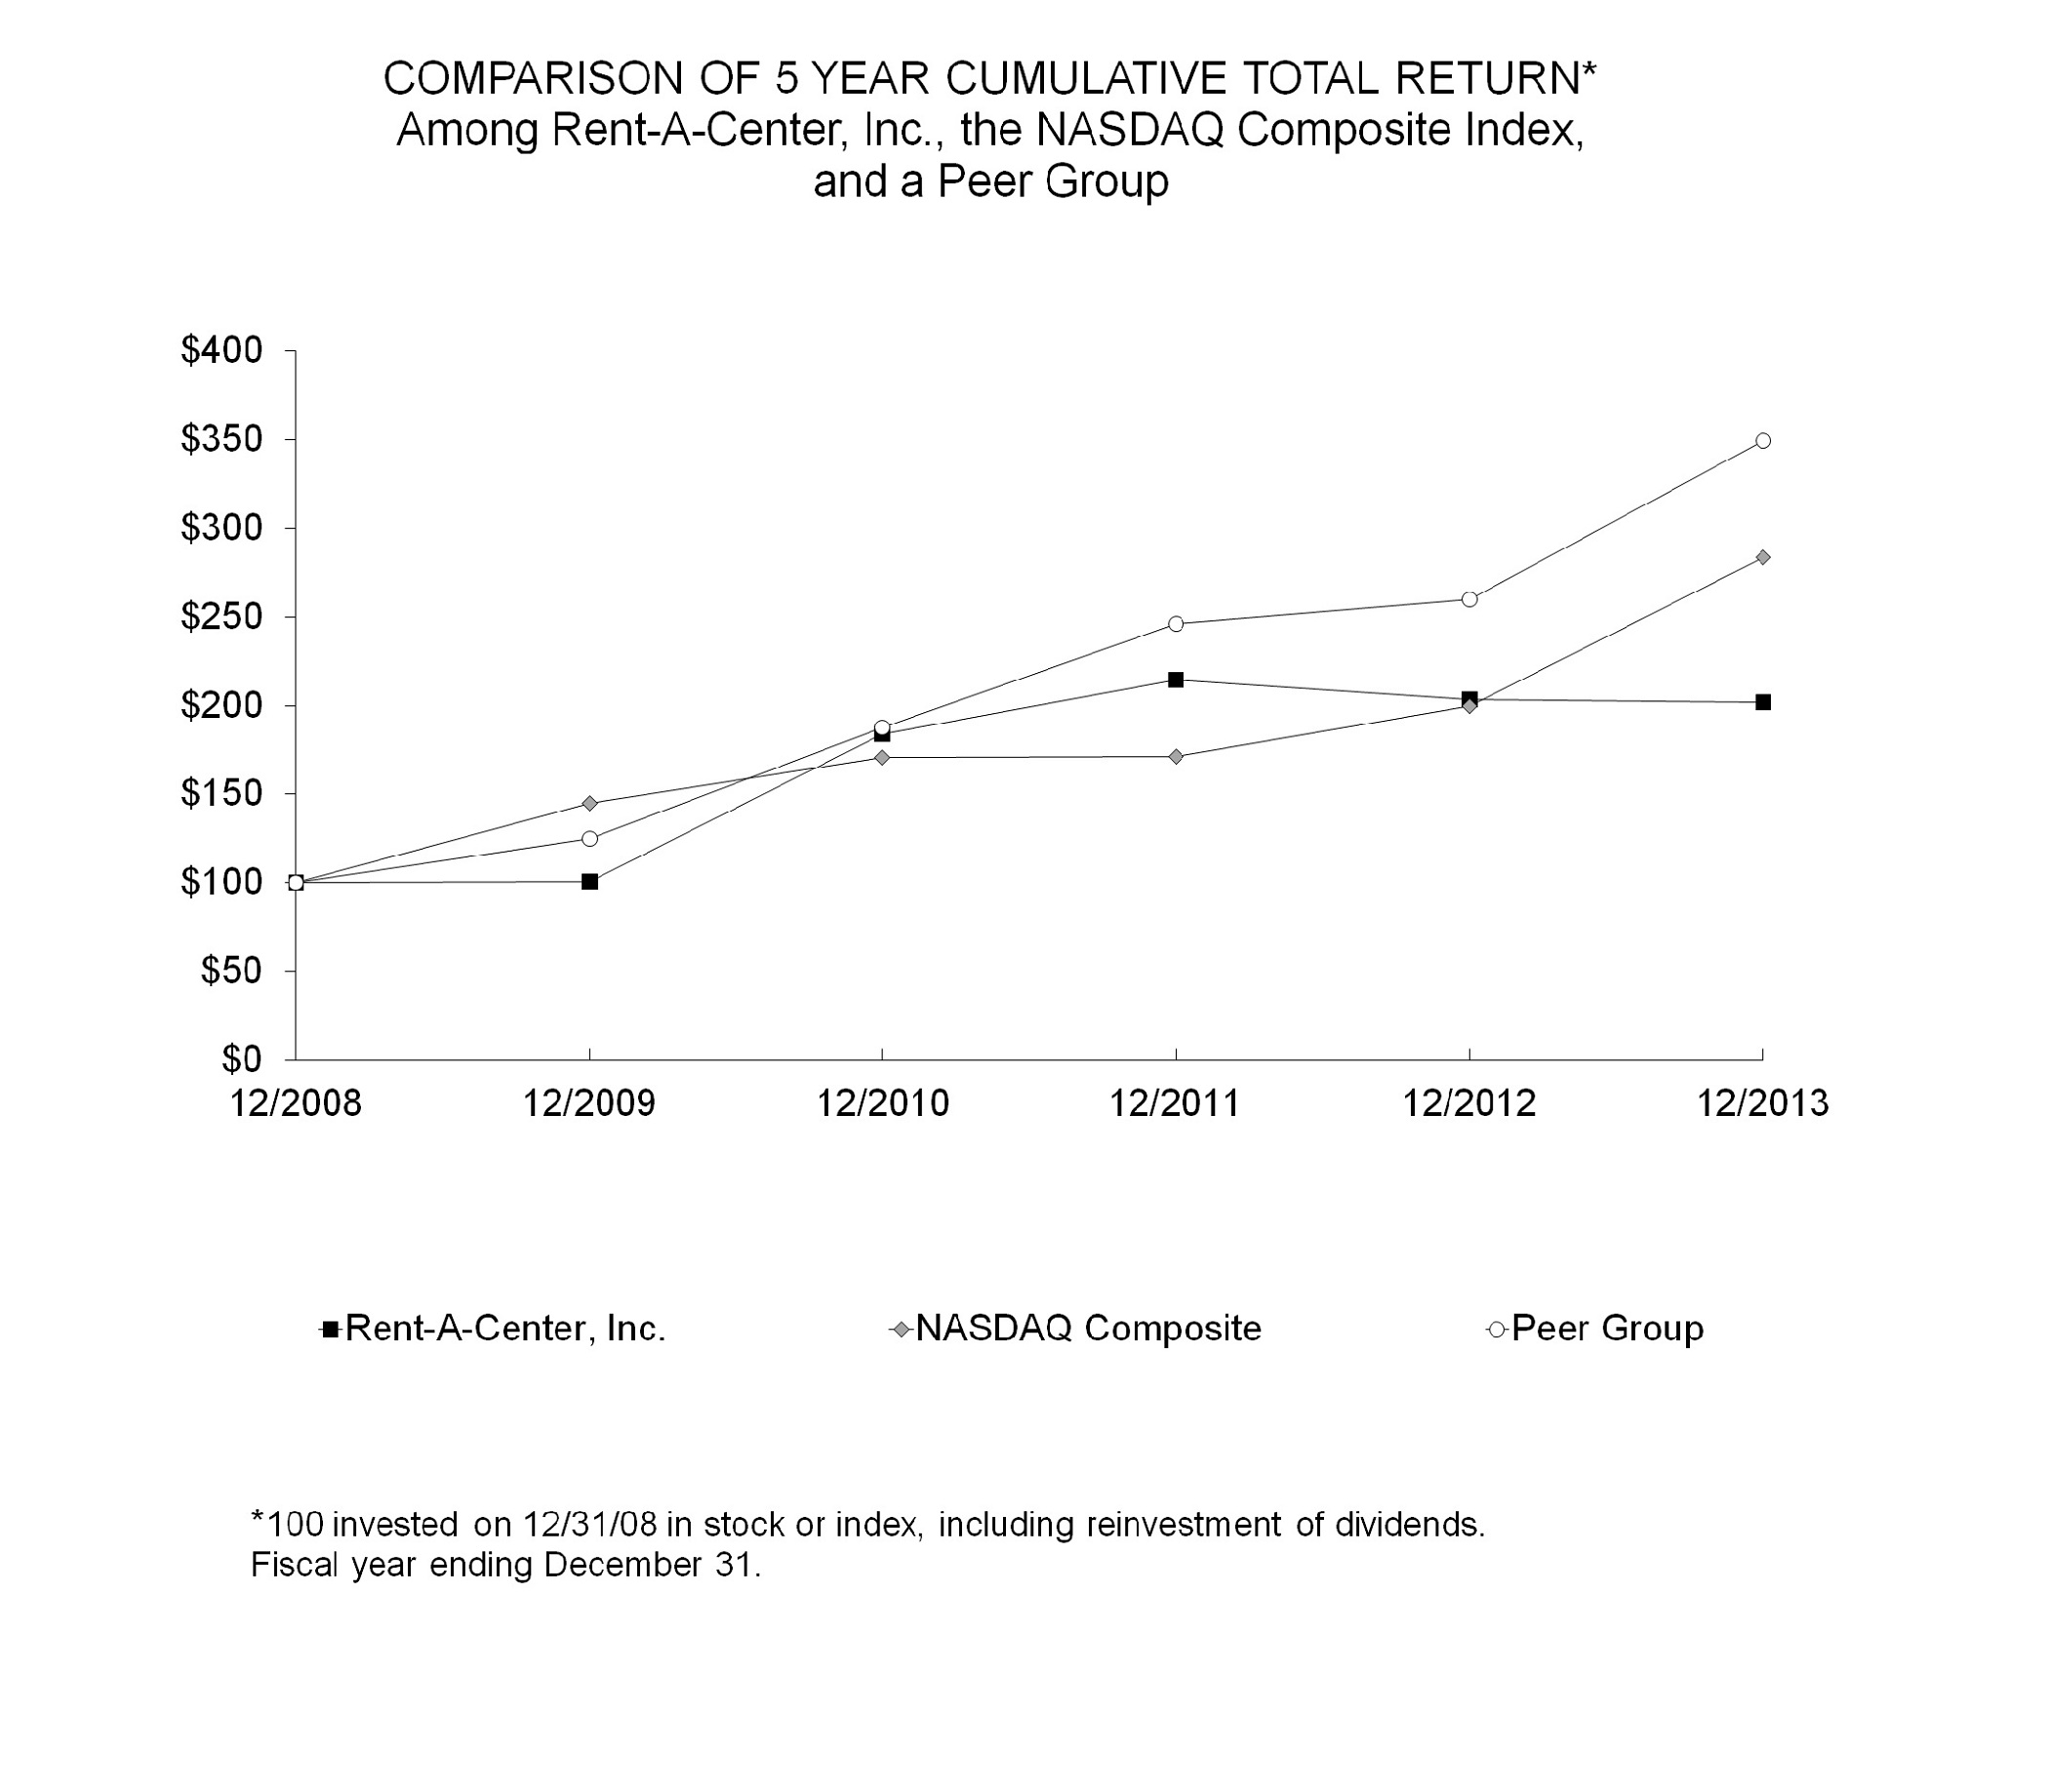
Stock Performance Graph
The following chart represents a comparison of the five year total return of our common stock to the NASDAQ Composite Index and a peer group index selected by us, which includes companies offering similar products and services as ours, such as rent-to-own and general merchandise retailers that market to our targeted customer demographic. The peer group index consists of Aaron’s, Inc., Big Lots, Inc., Conn's, Inc., Dollar General Corp., Dollar Tree Stores, Inc., Family Dollar Stores, Inc., Fred's, Inc., hhgregg, Inc. and O'Reilly Automotive, Inc. The graph assumes $100 was invested on December 31, 2008, and dividends, if any, were reinvested for all years ending December 31.
17
Item 6.
Selected Financial Data.
The selected financial data presented below for the five years ended
December 31, 2013
, have been derived from our audited consolidated financial statements. The historical financial data are qualified in their entirety by, and should be read in conjunction with, the consolidated financial statements and the notes thereto, the section entitled
“Management’s Discussion and Analysis of Financial Condition and Results of Operations”
and other financial information included in this report.
|
|
Year Ended December 31,
|
|||||||||||||||||||
|
|
2013
|
2012
|
2011
|
2010
|
2009
|
|||||||||||||||
|
|
(In thousands, except per share data)
|
|||||||||||||||||||
|
Consolidated Statements of Earnings
|
||||||||||||||||||||
|
Revenues
|
||||||||||||||||||||
|
Store
|
||||||||||||||||||||
|
Rentals and fees
|
$
|
2,698,395
|
|
$
|
2,654,081
|
|
$
|
2,496,863
|
|
$
|
2,335,496
|
|
$
|
2,346,849
|
|
|||||
|
Merchandise sales
|
278,753
|
|
300,077
|
|
259,796
|
|
220,329
|
|
261,631
|
|
||||||||||
|
Installment sales
|
72,705
|
|
68,356
|
|
68,617
|
|
63,833
|
|
53,035
|
|
||||||||||
|
Other
|
18,133
|
|
16,391
|
|
17,925
|
|
76,542
|
|
57,601
|
|
||||||||||
|
Franchise
|
||||||||||||||||||||
|
Merchandise sales
|
30,991
|
|
38,427
|
|
33,972
|
|
30,575
|
|
28,065
|
|
||||||||||
|
Royalty income and fees
|
5,206
|
|
5,314
|
|
5,011
|
|
4,857
|
|
4,775
|
|
||||||||||
|
3,104,183
|
|
3,082,646
|
|
2,882,184
|
|
2,731,632
|
|
2,751,956
|
|
|||||||||||
|
Cost of revenues
|
||||||||||||||||||||
|
Store
|
||||||||||||||||||||
|
Cost of rentals and fees
|
683,221
|
|
646,090
|
|
570,493
|
|
519,282
|
|
530,018
|
|
||||||||||
|
Cost of merchandise sold
|
216,206
|
|
|
241,219
|
|
201,854
|
|
164,133
|
|
188,433
|
|
|||||||||
|
Cost of installment sales
|
25,771
|
|
24,572
|
|
24,834
|
|
23,303
|
|
18,687
|
|
||||||||||
|
Franchise cost of merchandise sold
|
29,539
|
|
36,848
|
|
32,487
|
|
29,242
|
|
26,820
|
|
||||||||||
|
954,737
|
|
948,729
|
|
829,668
|
|
735,960
|
|
763,958
|
|
|||||||||||
|
Gross profit
|
2,149,446
|
|
2,133,917
|
|
2,052,516
|
|
1,995,672
|
|
1,987,998
|
|
||||||||||
|
Operating expenses
|
||||||||||||||||||||
|
Salaries and other expenses
|
1,733,324
|
|
1,663,857
|
|
(1)
|
1,591,837
|
|
(1)
|
1,539,926
|
|
(1)
|
1,552,240
|
|
(1)
|
||||||
|
General and administrative expenses
|
158,424
|
|
148,500
|
|
140,612
|
|
(1)
|
129,507
|
|
(1)
|
139,272
|
|
(1)
|
|||||||
|
Amortization and write-down of intangibles
|
11,529
|
|
5,889
|
|
4,675
|
|
3,254
|
|
2,843
|
|
||||||||||
|
Restructuring charge
|
—
|
|
—
|
|
13,943
|
|
(2)
|
—
|
|
—
|
|
|||||||||
|
Impairment charge
|
—
|
|
—
|
|
7,320
|
|
(3)
|
18,939
|
|
(5)
|
—
|
|
||||||||
|
Litigation expense (credit)
|
—
|
|
—
|
|
2,800
|
|
(4)
|
—
|
|
(4,869
|
)
|
(7)
|
||||||||
|
1,903,277
|
|
1,818,246
|
|
1,761,187
|
|
1,691,626
|
|
1,689,486
|
|
|||||||||||
|
Operating profit
|
246,169
|
|
315,671
|
|
291,329
|
|
304,046
|
|
298,512
|
|
||||||||||
|
Finance charges from refinancing
|
—
|
|
—
|
|
—
|
|
3,100
|
|
(6)
|
—
|
|
|||||||||
|
Interest expense, net
|
38,813
|
|
31,223
|
|
36,607
|
|
25,912
|
|
25,954
|
|
||||||||||
|
Earnings before income taxes
|
207,356
|
|
284,448
|
|
254,722
|
|
275,034
|
|
272,558
|
|
||||||||||
|
Income tax expense
|
79,118
|
|
102,745
|
|
(8)
|
91,258
|
|
(8)
|
103,219
|
|
(8)
|
103,345
|
|
(8)
|
||||||
|
NET EARNINGS
|
$
|
128,238
|
|
$
|
181,703
|
|
$
|
163,464
|
|
$
|
171,815
|
|
$
|
169,213
|
|
|||||
|
Basic earnings per common share
|
$
|
2.34
|
|
$
|
3.08
|
|
$
|
2.67
|
|
$
|
2.64
|
|
$
|
2.56
|
|
|||||
|
Diluted earnings per common share
|
$
|
2.32
|
|
$
|
3.06
|
|
$
|
2.64
|
|
$
|
2.61
|
|
$
|
2.54
|
|
|||||
|
Cash dividends paid per common share
|
$
|
0.84
|
|
$
|
0.64
|
|
$
|
0.44
|
|
$
|
0.12
|
|
$
|
—
|
|
|||||
18
Item 6.
Selected Financial Data
— Continued.
|
|
December 31,
|
|||||||||||||||||||
|
|
2013
|
2012
|
2011
|
2010
|
2009
|
|||||||||||||||
|
|
(Dollar amounts in thousands)
|
|||||||||||||||||||
|
Consolidated Balance Sheet Data
|
||||||||||||||||||||
|
Rental merchandise, net
|
$
|
1,125,068
|
|
$
|
1,007,519
|
|
(11)
|
$
|
942,526
|
|
(11)
|
$
|
828,674
|
|
(11)
|
$
|
742,244
|
|
(11)
|
|
|
Intangible assets, net
|
1,373,518
|
|
1,352,888
|
|
1,350,855
|
|
1,326,091
|
|
1,269,457
|
|
||||||||||
|
Total assets
|
3,018,553
|
|
2,859,817
|
|
(11)
|
2,794,892
|
|
(11)
|
2,683,673
|
|
(11)
|
2,439,062
|
|
(11)
|
||||||
|
Total debt
|
916,275
|
|
687,500
|
|
740,675
|
|
701,114
|
|
711,158
|
|
||||||||||
|
Total liabilities
|
1,675,002
|
|
1,395,759
|
|
(11)
|
1,439,699
|
|
(11)
|
1,332,717
|
|
(11)
|
1,194,564
|
|
(11)
|
||||||
|
Stockholders' equity
|
1,343,551
|
|
1,464,058
|
|
(11)
|
1,355,193
|
|
(11)
|
1,350,956
|
|
(11)
|
1,244,498
|
|
(11)
|
||||||
|
Operating Data (Unaudited)
|
||||||||||||||||||||
|
Core U.S. and International stores open at end of period
|
3,161
|
|
3,098
|
|
3,074
|
|
3,008
|
|
3,007
|
|
||||||||||
|
Acceptance Now locations open at end of period
|
1,325
|
|
966
|
|
750
|
|
384
|
|
82
|
|
||||||||||
|
Same store revenue growth (decrease)
(9)
|
(2.0
|
)%
|
1.4
|
%
|
0.8
|
%
|
(0.4
|
)%
|
(3.5
|
)%
|
(10)
|
|||||||||
|
Franchise stores open at end of period
|
179
|
|
224
|
|
216
|
|
209
|
|
210
|
|
||||||||||
________
|
(1)
|
Includes the effects of the reclassification of $4.5 million, $3.2 million and $1.6 million in 2011, 2010 and 2009, respectively, of certain stock-based compensation expense from salaries and other expenses to general and administrative expenses, and revisions to reserves that increased (decreased) salaries and other expense by $2.8 million, $1.8 million, $(0.3) million and $(2.2) million in 2012, 2011, 2010 and 2009, respectively.
|
|
(2)
|
Includes the effects of a $1.4 million pre-tax restructuring charge in the fourth quarter of 2011 in connection with the acquisition in November 2011 of 58 rent-to-own stores; a $7.6 million pre-tax restructuring charge in the third quarter of 2011 related to the closure of eight Home Choice stores in Illinois and 24 RAC Limited locations within third-party grocery stores, as well as the closure of 26 core rent-to-own stores following the sale of all customer accounts at these locations; and a $4.9 million pre-tax restructuring charge in the second quarter of 2011 for lease terminations related to The Rental Store acquisition.
|
|
(3)
|
Includes the effects of a $7.3 million pre-tax impairment charge in the first quarter of 2011 related to the discontinuation of the financial services business.
|
|
(4)
|
Includes the effects of a $2.8 million pre-tax litigation expense in the first quarter of 2011 related to the settlement of various California claims, including wage and hour violations.
|
|
(5)
|
Includes the effects of an $18.9 million pre-tax impairment charge in the fourth quarter of 2010 related to the discontinuation of our financial services business.
|
|
(6)
|
Includes the effects of a $3.1 million pre-tax financing expense in the fourth quarter of 2010 related to the write-off of unamortized financing costs.
|
|
(7)
|
Includes the effects of $4.9 million in pre-tax litigation credits recorded in the first quarter and second quarter of 2009 related to the Hilda Perez matter.
|
|
(8)
|
Includes the tax effects of revisions to reserves that (decreased) increased income tax expense by $(1.0) million, $(0.7) million, $0.1 million and $0.8 million in 2012, 2011, 2010 and 2009, respectively.
|
|
(9)
|
In 2009 through 2012, same store revenue growth or decrease for each period presented includes revenues only of stores open throughout the full period and the comparable prior period. Beginning in 2013, new or acquired stores were added to the same store revenue base in the 13th full month of operation.
|
|
(10)
|
Includes financial services revenue.
|
|
(11)
|
Includes revisions to reserves that decreased the following items as discussed in Note B to the consolidated financial statements, in millions:
|
|
|
December 31,
|
||||||||||||||
|
2012
|
2011
|
2010
|
2009
|
||||||||||||
|
Rental merchandise, net
|
$
|
(13.3
|
)
|
$
|
(10.7
|
)
|
$
|
(8.2
|
)
|
$
|
(7.8
|
)
|
|||
|
Total assets
|
(9.3
|
)
|
(6.5
|
)
|
(4.7
|
)
|
(4.9
|
)
|
|||||||
|
Total liabilities
|
(3.5
|
)
|
(2.5
|
)
|
(1.8
|
)
|
(1.9
|
)
|
|||||||
|
Stockholders' equity
|
(5.8
|
)
|
(4.0
|
)
|
(2.9
|
)
|
(3.0
|
)
|
|||||||
19
Item 7.
Management's Discussion and Analysis of Financial Condition and Results of Operations.
Business
We are the largest rent-to-own operator in North America, focused on improving the quality of life for our customers by providing them the opportunity to obtain ownership of high-quality durable products, such as consumer electronics, appliances, computers, furniture and accessories, under flexible rental purchase agreements with no long-term obligation.
We were incorporated in Delaware in 1986. From 1993 to 2006, we pursued an aggressive growth strategy in which we opened new stores and sought to acquire underperforming rent-to-own stores to which we could apply our operating model. As a result of this strategy, the number of our locations grew from 27 to over 3,400 in 2006, primarily through acquisitions. We acquired over 3,300 stores during this period, including approximately 390 of our franchised stores. These acquisitions occurred in approximately 200 separate transactions, including ten transactions in each of which we acquired in excess of 50 locations. In addition, we strategically opened or acquired stores near market areas served by our existing stores to enhance service levels, gain incremental sales and increase market penetration.
Historically, we achieved growth in our Core U.S. segment by opening new stores and acquiring underperforming rent-to-own stores to which we could apply our operating model. As a result, the acquired stores have generally experienced more significant revenue growth during the initial periods following their acquisition than in subsequent periods. Although we continue to believe there are attractive opportunities to expand our presence in the U.S. rent-to-own industry and we intend to continue our acquisition strategy of targeting under-performing and under-capitalized rent-to-own stores, the consolidation opportunities in the U.S. rent-to-own industry are more limited than in previous periods during which we experienced significant growth through acquisitions. Therefore, our historical results of operations and period-to-period comparisons of such results and other financial data, including the rate of earnings growth, may not be meaningful or indicative of future results.
As our U.S. store base matured, we began to focus on acquiring new customers through sources other than our existing U.S. rent-to-own store locations and to seek additional distribution channels for our products and services. One of our current growth strategies is our “Acceptance Now” (previously "RAC Acceptance") model. With this model, we operate kiosks within various traditional retailers' locations where we generally offer the rent-to-own transaction to consumers who do not qualify for financing from such retailers. We operated
1,325
Acceptance Now locations at
December 31, 2013
, and we intend to continue growing the Acceptance Now segment by expanding the number of our retail partners and the number of locations with our existing retail partners. In addition, our strategy includes enhancing our Acceptance Now offering by launching a virtual capability. Capital expenditures related to opening an Acceptance Now kiosk in a retailer's store are very low, since the only fixed assets required are the kiosk and computer equipment. There is no long-term lease associated with these stores and the retailer does not charge us rent. Our operating model is highly agile and dynamic because we can open locations quickly and efficiently, and we can also close locations quickly and efficiently when their performance does not meet our expectations. In addition, we are expanding our operations in Mexico, and we are seeking to identify other international markets in which we believe our products and services would be in demand.
We recently launched a multi-year program designed to transform and modernize our operations company-wide in order to improve the profitability of the Core U.S. segment while continuing to support our Acceptance Now and International segments. This program is focused on building new competencies and capabilities through a variety of operational and infrastructure initiatives such as developing a new supply chain, formulating a customer-focused value-based pricing strategy, optimizing our store footprint, and innovating our digital e-commerce capabilities.
Total financing requirements of a typical new Acceptance Now kiosk location approximate $350,000, with roughly 80% of that amount relating to the purchase of rental merchandise. A newly opened Acceptance Now location is typically profitable on a monthly basis within seven months after its initial opening, and achieves cumulative break-even profitability in the second year after its initial opening.
Total financing requirements of a typical new Mexico store approximate $610,000, with roughly 50% of that amount relating to the purchase of rental merchandise. A newly opened Mexico store is typically profitable on a monthly basis within 12 months after its initial opening. Historically, a typical Mexico store has achieved cumulative break-even profitability in the third year after its initial opening.
As a result of the investment in new stores and kiosk locations and their growth curves described above, our quarterly earnings are impacted by how many new locations we opened during a particular quarter and the quarters preceding it.
20
Rental payments are generally made in advance on a weekly basis in our Core U.S. and International segments and monthly in our Acceptance Now segment and, together with applicable fees, constitute our primary revenue source.
Our expenses primarily relate to merchandise costs and the operations of our stores, including salaries and benefits for our employees, occupancy expense for our leased real estate, advertising expenses, lost, damaged, or stolen merchandise, fixed asset depreciation, and corporate and other expenses.
Forward-Looking Statements
The statements, other than statements of historical facts, included in this Annual Report on Form 10-K are forward-looking statements. Forward-looking statements generally can be identified by the use of forward-looking terminology such as “may,” “will,” “would,” “expect,” “intend,” “could,” “estimate,” “should,” “anticipate” or “believe.” We believe the expectations reflected in such forward-looking statements are accurate. However, we cannot assure you that these expectations will occur. Our actual future performance could differ materially from such statements. Factors that could cause or contribute to these differences include, but are not limited to:
|
•
|
the general strength of the economy and other economic conditions affecting consumer preferences and spending;
|
|
•
|
economic pressures, such as high fuel costs, affecting the disposable income available to our current and potential customers;
|
|
•
|
changes in the unemployment rate;
|
|
•
|
difficulties encountered in improving the financial performance of our Core U.S. segment or in executing our growth initiatives;
|
|
•
|
rapid inflation or deflation in prices of our products;
|
|
•
|
consumer preferences and perceptions of our brand;
|
|
•
|
our ability to identify and successfully market products and services that appeal to our customer demographic;
|
|
•
|
adverse changes in the economic conditions of the industries, countries or markets that we serve;
|
|
•
|
our ability to develop and successfully implement virtual or electronic commerce capabilities;
|
|
•
|
our available cash flow;
|
|
•
|
our ability to control costs and increase profitability;
|
|
•
|
our ability to enter into new and collect on our rental or lease purchase agreements;
|
|
•
|
uncertainties regarding the ability to open new locations;
|
|
•
|
our ability to acquire additional stores or customer accounts on favorable terms;
|
|
•
|
our ability to enhance the performance of acquired stores;
|
|
•
|
our ability to retain the revenue associated with acquired customer accounts;
|
|
•
|
the passage of legislation adversely affecting the rent-to-own industry;
|
|
•
|
our compliance with applicable statutes or regulations governing our transactions;
|
|
•
|
our ability to protect the integrity and security of individually identifiable data of our customers and employee;
|
|
•
|
the impact of any breaches in data security or other disturbances to our information technology and other networks;
|
|
•
|
information technology and data security costs;
|
|
•
|
changes in estimates relating to self-insurance liabilities and income tax and litigation reserves;
|
|
•
|
changes in our effective tax rate;
|
|
•
|
changes in interest rates;
|
|
•
|
changes in our stock price, the number of shares of common stock that we may or may not repurchase, and future dividends, if any;
|
21
|
•
|
fluctuations in foreign currency exchange rates;
|
|
•
|
our ability to maintain an effective system of internal controls;
|
|
•
|
the resolution of our litigation; and
|
|
•
|
the other risks detailed from time to time in our SEC reports.
|
Additional important factors that could cause our actual results to differ materially from our expectations are discussed under the section “
Risk Factors
” and elsewhere in this report. You should not unduly rely on these forward-looking statements, which speak only as of the date of this Annual Report on Form 10-K. Except as required by law, we are not obligated to publicly release any revisions to these forward-looking statements to reflect events or circumstances occurring after the date of this report or to reflect the occurrence of unanticipated events.
Critical Accounting Policies Involving Critical Estimates, Uncertainties or Assessments in Our Financial Statements
The preparation of our consolidated financial statements in conformity with accounting principles generally accepted in the United States of America requires us to make estimates and assumptions that affect the reported amounts of assets and liabilities, disclosure of contingent losses and liabilities at the date of the consolidated financial statements and the reported amounts of revenues and expenses during the reporting period. In applying accounting principles, we must often make individual estimates and assumptions regarding expected outcomes or uncertainties. Our estimates, judgments and assumptions are continually evaluated based on available information and experience. Because of the use of estimates inherent in the financial reporting process, actual results could differ from those estimates. We believe the following are areas where the degree of judgment and complexity in determining amounts recorded in our consolidated financial statements make the accounting policies critical.
If we make changes to our reserves in accordance with the policies described above, our earnings would be impacted. Increases to our reserves would reduce earnings and, similarly, reductions to our reserves would increase our earnings. A pre-tax change of approximately $0.9 million in our estimates would result in a corresponding $0.01 change in our diluted earnings per common share.
Self-Insurance Liabilities.
We have self-insured retentions with respect to losses under our workers' compensation, general liability and vehicle liability insurance policies. We establish reserves for our liabilities associated with these losses by obtaining forecasts for the ultimate expected losses and estimating amounts needed to pay losses within our self-insured retentions.
We continually institute procedures to manage our loss exposure and increases in health care costs associated with our insurance claims through our risk management function, including a transitional duty program for injured workers, ongoing safety and accident prevention training, and various other programs designed to minimize losses and improve our loss experience in our store locations. We make assumptions on our liabilities within our self-insured retentions using actuarial loss forecasts, company-specific development factors, general industry loss development factors, and third-party claim administrator loss estimates which are based on known facts surrounding individual claims. These assumptions incorporate expected increases in health care costs. Periodically, we reevaluate our estimate of liability within our self-insured retentions. At that time, we evaluate the adequacy of our reserves by comparing amounts reserved on our balance sheet for anticipated losses to our updated actuarial loss forecasts and third-party claim administrator loss estimates, and make adjustments to our reserves as needed.
As of
December 31, 2013
, the amount reserved for losses within our self-insured retentions with respect to workers’ compensation, general liability and vehicle liability insurance was $116.6 million, as compared to $116.1 million at
December 31, 2012
. However, if any of the factors that contribute to the overall cost of insurance claims were to change, the actual amount incurred for our self-insurance liabilities could be more or less than the amounts currently reserved.
Income Taxes.
Our annual tax rate is affected by many factors, including the mix of our earnings, legislation and acquisitions, and is based on our income, statutory tax rates and tax planning opportunities available to us in the jurisdictions in which we operate. Tax laws are complex and subject to differing interpretations between the taxpayer and the taxing authorities. Significant judgment is required in determining our tax expense, evaluating our tax positions and evaluating uncertainties. Deferred income tax assets represent amounts available to reduce income taxes payable in future years. Such assets arise because of temporary differences between the financial reporting and tax bases of assets and liabilities, as well as from net operating loss and tax credit carryforwards. We evaluate the recoverability of these future tax deductions and credits by assessing the future expected taxable income from all sources, including reversal of taxable temporary differences, forecasted operating earnings and available tax planning strategies. These sources of income rely heavily on estimates. We use our historical experience and our short- and long-range business forecasts to provide insight and assist us in determining recoverability. We recognize the financial statement benefit of a tax position only after determining that the relevant tax authority would more likely than not sustain the position following
22
an audit. For tax positions meeting the more-likely-than not threshold, the amount recognized in the financial statements is the largest benefit that has a greater than 50 percent likelihood of being realized upon the ultimate settlement with the relevant tax authority. A number of years may elapse before a particular matter, for which we have recorded a liability, is audited and effectively settled. We review our tax positions quarterly and adjust our liability for unrecognized tax benefits in the period in which we determine the issue is effectively settled with the tax authorities, the statute of limitations expires for the relevant taxing authority to examine the tax position, or when more information becomes available.
Valuation of Goodwill.
We perform an assessment of goodwill for impairment at the reporting unit level annually as of December 31 of each year, or when events or circumstances indicate that impairment may have occurred. Factors which could necessitate an interim impairment assessment include a sustained decline in our stock price, prolonged negative industry or economic trends and significant underperformance relative to historical or projected future operating results. Our reporting units are generally our reportable operating segments identified in Note Q to the consolidated financial statements. The fair value of a reporting unit is estimated using methodologies which include the present value of estimated future cash flows and comparisons of multiples of enterprise values to earnings before interest, taxes, depreciation and amortization. The analysis is based upon available information regarding expected future cash flows and discount rates. Discount rates are based upon our cost of capital. Determining the fair value of a reporting unit is judgmental in nature and involves the use of significant estimates and assumptions that we believe are reasonable but inherently uncertain, and actual results may differ from those estimates. These estimates and assumptions include, but are not limited to, revenue growth rates, operating margins and future economic and market conditions. If the carrying value of the reporting unit exceeds fair value, we perform a second analysis to measure the fair value of all assets and liabilities within the reporting unit, and if the carrying value exceeds fair value, goodwill is considered impaired. The amount of the impairment is the difference between the carrying value of goodwill and the estimated fair value, which is calculated as if the reporting unit had just been acquired and accounted for as a business combination. At
December 31, 2013
, the amount of goodwill allocated to the Core U.S. and Acceptance Now segments was
$1,310.1 million
and
$54.4 million
, respectively. The fair values of the Core U.S. and Acceptance Now segments exceeded their carrying values by over 10%. During 2013 and 2012, we recorded goodwill impairment charges of $1.1 million and $1.0 million in our International segment as a result of the sustained underperformance of certain stores located in Canada. Based on the results of the annual assessment, we concluded that no further impairment of goodwill existed at December 31, 2013.
Based on an assessment of our accounting policies and the underlying judgments and uncertainties affecting the application of those policies, we believe our consolidated financial statements fairly present in all material respects the financial condition, results of operations and cash flows of our company as of, and for, the periods presented in this Annual Report on Form 10-K. However, we do not suggest that other general risk factors, such as those discussed elsewhere in this report as well as changes in our growth objectives or performance of new or acquired locations, could not adversely impact our consolidated financial position, results of operations and cash flows in future periods.
Significant Accounting Policies
Our significant accounting policies are summarized below and in Note A to the consolidated financial statements included elsewhere in this Annual Report on Form 10-K.
Revenues.
Merchandise is rented to customers pursuant to rental purchase agreements which provide for weekly, semi-monthly or monthly rental terms with non-refundable rental payments. Generally, the customer has the right to acquire title either through a purchase option or through payment of all required rentals. Rental revenue and fees are recognized over the rental term and merchandise sales revenue is recognized when the customer exercises the purchase option and pays the cash price due. Cash received prior to the period in which it should be recognized is deferred and recognized according to the rental term. Revenue is accrued for uncollected amounts due based on historical collection experience. However, the total amount of the rental purchase agreement is not accrued because the customer can terminate the rental agreement at any time and we cannot enforce collection for non-payment of future rents.
Revenues from the sale of merchandise in our retail installment stores are recognized when the installment note is signed, the customer has taken possession of the merchandise and collectability is reasonably assured.
Franchise Revenue.
Revenues from the sale of rental merchandise are recognized upon shipment of the merchandise to the franchisee. Franchise royalty income and fee revenue is recognized upon completion of substantially all services and satisfaction of all material conditions required under the terms of the franchise agreement.
Depreciation of Rental Merchandise.
Depreciation of rental merchandise is included in the cost of rentals and fees on our statement of earnings. Generally, we depreciate our rental merchandise using the income forecasting method. Under the income forecasting method, merchandise held for rent is not depreciated and merchandise on rent is depreciated in the proportion of rents
23
received to total rents provided in the rental contract, which is an activity-based method similar to the units of production method. Effective January 1, 2013, we depreciate merchandise (including computers and tablets) that is held for rent for at least 180 consecutive days using the straight-line method over a period generally not to exceed 18 months. Prior to January 1, 2013, merchandise held for rent (except for computers and tablets) that was at least 270 days old and held for rent for at least 180 consecutive days was depreciated using the straight-line method for a period generally not to exceed 20 months. Prior to January 1, 2013, the straight-line method was used for computers and tablets that were 24 months old or older and which have become idle over a period of at least six months, generally not to exceed an aggregate depreciation period of 30 months. This change has not had a significant impact on cost of revenues, gross profit, net earnings or earnings per share.
Cost of Merchandise Sold.
Cost of merchandise sold represents the net book value of rental merchandise at time of sale.
Salaries and Other Expenses.
Salaries and other expenses include all salaries and wages paid to store level employees, together with district managers' salaries, payroll taxes and benefits, and travel, as well as all store-level general and administrative expenses and selling, advertising, insurance, occupancy, delivery, charge offs due to customer stolen merchandise, fixed asset depreciation and other operating expenses.
General and Administrative Expenses.
General and administrative expenses include all corporate overhead expenses related to our headquarters such as salaries, payroll taxes and benefits, stock-based compensation, occupancy, administrative and other operating expenses.
Stock-Based Compensation Expense.
We recognize share-based payment awards to our employees and directors at the estimated fair value on the grant date. Determining the fair value of any share-based award requires information about several variables that could include, but are not limited to, expected stock volatility over the term of the award, expected dividend yields and the predicted employee exercise behavior. We base expected life on historical exercise and post-vesting employment-termination experience, and expected volatility on historical realized volatility trends. In addition, all stock-based compensation expense is recorded net of an estimated forfeiture rate. The forfeiture rate is based upon historical activity and is analyzed as actual forfeitures occur. Stock options granted during the year ended
December 31, 2013
, were valued using a Black-Scholes pricing model with the following assumptions for employee options: an expected volatility of 28.64% to 44.35%, a risk-free interest rate of 0.27% to 1.81%, an expected dividend yield of 2.20% to 2.44%, and an expected life of 2.33 to 6.25 years. Restricted stock units are valued using the last trade before the day of the grant.
We revised the 2011 consolidated statement of earnings to classify stock-based compensation received by employees above the district manager level that was previously reported within salaries and other expenses to general and administrative expenses to conform to the 2013 and 2012 presentation. This reclassification resulted in a decrease in salaries and other expenses of $4.5 million for the year ended December 31, 2011, with a corresponding increase to general and administrative expenses. This reclassification had no impact on net earnings or earnings per share for 2011.
Income taxes.
We have not provided for deferred income taxes on undistributed earnings of non-U.S. subsidiaries because of our intention to indefinitely reinvest these earnings outside the U.S. The determination of the amount of the unrecognized deferred income tax liability related to the undistributed earnings is not practicable: however, unrecognized foreign income tax credits would be available to reduce a portion of this liability.
Results of Operations
The following discussion focuses on our results of operations and issues related to our liquidity and capital resources. You should read this discussion in conjunction with the consolidated financial statements and notes thereto included elsewhere in this Annual Report on Form 10-K.
Comparison of the Years Ended
December 31, 2013
and
2012
Overview
The following table reflects the revisions to reserves discussed in Note B to the consolidated financial statements.
24
|
Year Ended December 31,
|
2013-2012 Change
|
2012-2011 Change
|
||||||||||||||||||||||||
|
(Dollar amounts in thousands)
|
2013
|
2012
|
2011
|
$
|
%
|
$
|
%
|
|||||||||||||||||||
|
Rentals and fees
|
$
|
2,698,395
|
|
$
|
2,654,081
|
|
$
|
2,496,863
|
|
$
|
44,314
|
|
1.7
|
%
|
$
|
157,218
|
|
6.3
|
%
|
|||||||
|
Merchandise sales
|
278,753
|
|
300,077
|
|
259,796
|
|
(21,324
|
)
|
(7.1
|
)%
|
40,281
|
|
15.5
|
%
|
||||||||||||
|
Installment sales
|
72,705
|
|
68,356
|
|
68,617
|
|
4,349
|
|
6.4
|
%
|
(261
|
)
|
(0.4
|
)%
|
||||||||||||
|
Other
|
18,133
|
|
16,391
|
|
17,925
|
|
1,742
|
|
10.6
|
%
|
(1,534
|
)
|
(8.6
|
)%
|
||||||||||||
|
Franchise merchandise sales
|
30,991
|
|
38,427
|
|
33,972
|
|
(7,436
|
)
|
(19.4
|
)%
|
4,455
|
|
13.1
|
%
|
||||||||||||
|
Franchise royalty income and fees
|
5,206
|
|
5,314
|
|
5,011
|
|
(108
|
)
|
(2.0
|
)%
|
303
|
|
6.0
|
%
|
||||||||||||
|
Total revenues
|
3,104,183
|
|
3,082,646
|
|
2,882,184
|
|
21,537
|
|
0.7
|
%
|
200,462
|
|
7.0
|
%
|
||||||||||||
|
Cost of rentals and fees
|
683,221
|
|
646,090
|
|
570,493
|
|
37,131
|
|
5.7
|
%
|
75,597
|
|
13.3
|
%
|
||||||||||||
|
Cost of merchandise sold
|
216,206
|
|
241,219
|
|
201,854
|
|
(25,013
|
)
|
(10.4
|
)%
|
39,365
|
|
19.5
|
%
|
||||||||||||
|
Cost of installment sales
|
25,771
|
|
24,572
|
|
24,834
|
|
1,199
|
|
4.9
|
%
|
(262
|
)
|
(1.1
|
)%
|
||||||||||||
|
Franchise cost of merchandise sold
|
29,539
|
|
36,848
|
|
32,487
|
|
(7,309
|
)
|
(19.8
|
)%
|
4,361
|
|
13.4
|
%
|
||||||||||||
|
Total cost of revenues
|
954,737
|
|
948,729
|
|
829,668
|
|
6,008
|
|
0.6
|
%
|
119,061
|
|
14.4
|
%
|
||||||||||||
|
Gross profit
|
2,149,446
|
|
2,133,917
|
|
2,052,516
|
|
15,529
|
|
0.7
|
%
|
81,401
|
|
4.0
|
%
|
||||||||||||
|
Salaries and other
|
1,733,324
|
|
1,663,857
|
|
1,591,837
|
|
69,467
|
|
4.2
|
%
|
72,020
|
|
4.5
|
%
|
||||||||||||
|
General and administrative
|
158,424
|
|
148,500
|
|
140,612
|
|
9,924
|
|
6.7
|
%
|
7,888
|
|
5.6
|
%
|
||||||||||||
|
Amortization and write-down of intangibles
|
11,529
|
|
5,889
|
|
4,675
|
|
5,640
|
|
95.8
|
%
|
1,214
|
|
26.0
|
%
|
||||||||||||
|
Restructuring charge
|
—
|
|
—
|
|
13,943
|
|
—
|
|
—
|
|
(13,943
|
)
|
(100.0
|
)%
|
||||||||||||
|
Impairment charge
|
—
|
|
—
|
|
7,320
|
|
—
|
|
—
|
|
(7,320
|
)
|
(100.0
|
)%
|
||||||||||||
|
Litigation expense
|
—
|
|
—
|
|
2,800
|
|
—
|
|
—
|
|
(2,800
|
)
|
(100.0
|
)%
|
||||||||||||
|
1,903,277
|
|
1,818,246
|
|
1,761,187
|
|
85,031
|
|
4.7
|
%
|
57,059
|
|
3.2
|
%
|
|||||||||||||
|
Operating profit
|
246,169
|
|
315,671
|
|
291,329
|
|
(69,502
|
)
|
(22.0
|
)%
|
24,342
|
|
8.4
|
%
|
||||||||||||
|
Interest, net
|
38,813
|
|
31,223
|
|
36,607
|
|
7,590
|
|
24.3
|
%
|
(5,384
|
)
|
(14.7
|
)%
|
||||||||||||
|
Earnings before income taxes
|
207,356
|
|
284,448
|
|
254,722
|
|
(77,092
|
)
|
(27.1
|
)%
|
29,726
|
|
11.7
|
%
|
||||||||||||
|
Income tax expense
|
79,118
|
|
102,745
|
|
91,258
|
|
(23,627
|
)
|
(23.0
|
)%
|
11,487
|
|
12.6
|
%
|
||||||||||||
|
Net earnings
|
$
|
128,238
|
|
$
|
181,703
|
|
$
|
163,464
|
|
$
|
(53,465
|
)
|
(29.4
|
)%
|
$
|
18,239
|
|
11.2
|
%
|
|||||||
During 2013, we continued the expansion of our Acceptance Now and International segments by adding 359 locations and 61 new rent-to-own stores, respectively. Our Acceptance Now segment revenue increased by 46% over
the prior year and provided over
16%
of our consolidated revenue in 2013, while International segment revenue increased by 45% over the prior year driven primarily by the growth in Mexico. Expansion in these segments drove an increase in salaries and other expenses, primarily payroll-related. The significant decline in revenue in the Core U.S. segment eroded the revenue, gross profit and operating profit gains in the Acceptance Now and International segments. Our customers remain under severe economic pressure and we face an intensified
25
promotional environment. As a result of the rebranding initiative in our Franchising segment, we sold certain Core U.S. stores to existing franchisees and purchased certain former ColorTyme stores, decreasing overall store count in the Franchising segment from 224 to 179. The sale of the company-owned stores resulted in a gain of approximately $1.6 million, net of a $7.4 million write-off of goodwill related to those stores.
Segment Performance
Core U.S. segment.
|
Year Ended December 31,
|
2013-2012 Change
|
2012-2011 Change
|
||||||||||||||||||||||||
|
(Dollar amounts in thousands)
|
2013
|
2012
|
2011
|
$
|
%
|
$
|
%
|
|||||||||||||||||||
|
Revenues
|
$
|
2,507,498
|
|
$
|
2,655,411
|
|
$
|
2,631,416
|
|
$
|
(147,913
|
)
|
(5.6
|
)%
|
$
|
23,995
|
|
0.9
|
%
|
|||||||
|
Gross profit
|
1,810,160
|
|
1,904,586
|
|
1,918,781
|
|
(94,426
|
)
|
(5.0
|
)%
|
(14,195
|
)
|
(0.7
|
)%
|
||||||||||||
|
Operating profit
|
205,928
|
|
318,784
|
|
318,271
|
|
(112,856
|
)
|
(35.4
|
)%
|
513
|
|
0.2
|
%
|
||||||||||||
|
Change in same store revenue
|
|
|
(6.4
|
)%
|
|
|
0.1
|
%
|
||||||||||||||||||
|
Stores in same store revenue calculation
|
2,844
|
|
2,545
|
|
||||||||||||||||||||||
Revenues.
Rentals and fees revenue and merchandise sales decreased in 2013 compared to 2012. We experienced a high volume of early purchase options in 2012 contributing to our recurring revenue portfolio being down year-over-year going into 2013, decreasing both rentals and fees and merchandise sales revenue in the current year. Our portfolio of agreements surpassed prior year levels in the third quarter of 2013, however, electronic product deflation coupled with promotional activity caused our average revenue per agreement (ticket) to lag behind the prior year, driving negative same store revenue. Additionally, we believe our business has been negatively impacted throughout the year by pressure on our customers in the form of higher payroll taxes and overall macroeconomic conditions. We believe these conditions impacted our performance in the critical growth month of December 2013, which was significantly below our forecast, leaving our recurring revenue portfolio going into 2014 behind the prior year.
Gross Profit.
Gross profit decreased in 2013 from 2012 primarily due to decreased store revenue as discussed above. Gross profit as a percentage of total segment revenue increased to 72.2% in
2013
from 71.7% in
2012
, primarily due to increases in early purchase option pricing.
Operating Profit.
Operating profit as a percentage of total segment revenue decreased to 8.2% in
2013
from 12.0% for
2012
. Operating profit in 2013 was impacted by decreased gross profit as discussed above, increased claims paid under our self-funded health insurance program, adjustments to certain rental merchandise reserves and severance payable to former executives of the Company. Charge offs in our Core U.S. rent-to-own stores due to customer stolen merchandise, expressed as a percentage of revenues, were approximately 2.7% in
2013
as compared to 2.4% in
2012
. Operating expenses expressed as a percentage of total segment revenue increased to 64.0% in
2013
from 59.7% in
2012
primarily due to a decrease in revenue.
Acceptance Now segment.
|
Year Ended December 31,
|
2013-2012 Change
|
2012-2011 Change
|
||||||||||||||||||||||||
|
(Dollar amounts in thousands)
|
2013
|
2012
|
2011
|
$
|
%
|
$
|
%
|
|||||||||||||||||||
|
Revenues
|
$
|
502,043
|
|
$
|
343,283
|
|
$
|
193,295
|
|
$
|
158,760
|
|
46.2
|
%
|
$
|
149,988
|
|
77.6
|
%
|
|||||||
|
Gross profit
|
290,741
|
|
194,607
|
|
114,228
|
|
96,134
|
|
49.4
|
%
|
80,379
|
|
70.4
|
%
|
||||||||||||
|
Operating profit (loss)
|
66,625
|
|
25,261
|
|
(16,483
|
)
|
41,364
|
|
163.7
|
%
|
41,744
|
|
253.3
|
%
|
||||||||||||
|
Change in same store revenue
|
|
|
30.1
|
%
|
25.3
|
%
|
||||||||||||||||||||
|
Stores in same store revenue calculation
|
868
|
|
256
|
|
||||||||||||||||||||||
Revenues.
The increase in revenues in 2013 was driven by the 30.1% growth in same store revenue and the addition of 359 locations during the period. This segment contributed approximately
16%
of consolidated revenues in 2013.
26
Gross profit.
Gross profit as a percentage of revenues was 57.9% in 2013 as compared to 56.7% in 2012 as a result of a maturing store base.
Operating profit.
Operating profit as a percentage of total segment revenue increased to 13.3% in
2013
from 7.4% for
2012
. Operating profit was positively impacted by the revenue growth in this segment, partially offset by an increase in payroll and payroll-related expenses due to the expansion and an increase in rental merchandise reserves. Charge-offs in our Acceptance Now locations due to customer stolen merchandise, expressed as a percentage of revenues, were approximately 5.5% in
2013
as compared to 5.4% in
2012
. The ratio of agreement charge-offs to total agreements in this segment is comparable to the Core U.S. segment but the percentage is higher, primarily due to the higher cost of rental merchandise in this segment. While the higher cost of merchandise results in lower gross margins in this segment, this segment's kiosk model has lower operating costs than our other operating segments, resulting in a positive contribution to operating profit while maintaining an aggressive growth plan.
International segment.
|
Year Ended December 31,
|
2013-2012 Change
|
2012-2011 Change
|
||||||||||||||||||||||||
|
(Dollar amounts in thousands)
|
2013
|
2012
|
2011
|
$
|
%
|
$
|
%
|
|||||||||||||||||||
|
Revenues
|
$
|
58,445
|
|
$
|
40,211
|
|
$
|
18,490
|
|
$
|
18,234
|
|
45.3
|
%
|
$
|
21,721
|
|
117.5
|
%
|
|||||||
|
Gross profit
|
41,887
|
|
27,831
|
|
13,011
|
|
14,056
|
|
50.5
|
%
|
14,820
|
|
113.9
|
%
|
||||||||||||
|
Operating loss
|
(28,237
|
)
|
(30,700
|
)
|
(13,679
|
)
|
2,463
|
|
8.0
|
%
|
(17,021
|
)
|
(124.4
|
)%
|
||||||||||||
|
Change in same store revenue
|
|
|
40.6
|
%
|
8.0
|
%
|
||||||||||||||||||||
|
Stores in same store revenue calculation
|
103
|
|
13
|
|
||||||||||||||||||||||
Revenues.
The increase in total revenues in
2013
was driven by the 40.6% growth in same store revenue, primarily due to the growth in Mexico, where we added 61 stores during
2013
. Revenues in Canada decreased $6.3 million, or 36.0%, to $11.3 million in 2013 compared to $17.6 million in 2012 due to the sale of 15 stores on December 31, 2012.
Gross Profit.
Gross profit increased in
2013
primarily due to increased revenue as discussed above. Gross profit as a percentage of total revenues increased to 71.7% in
2013
from 69.2% in
2012
as a result of a maturing store base.
Operating Loss.
Operating loss as a percentage of total segment revenue decreased to 48.3% in
2013
from 76.3% for
2012
. As the older stores in Mexico become profitable, those profits have been more than offset by the losses experienced in the new stores, but operating loss is improving as more stores mature.
Franchising segment.
|
Year Ended December 31,
|
2013-2012 Change
|
2012-2011 Change
|
||||||||||||||||||||||||
|
(Dollar amounts in thousands)
|
2013
|
2012
|
2011
|
$
|
%
|
$
|
%
|
|||||||||||||||||||
|
Revenues
|
$
|
36,197
|
|
$
|
43,741
|
|
$
|
38,983
|
|
$
|
(7,544
|
)
|
(17.2
|
)%
|
$
|
4,758
|
|
12.2
|
%
|
|||||||
|
Gross profit
|
6,658
|
|
6,893
|
|
6,496
|
|
(235
|
)
|
(3.4
|
)%
|
397
|
|
6.1
|
%
|
||||||||||||
|
Operating profit
|
1,853
|
|
2,326
|
|
3,220
|
|
(473
|
)
|
(20.3
|
)%
|
(894
|
)
|
(27.8
|
)%
|
||||||||||||
Revenues.
Revenues decreased due to the rebranding initiative, which decreased overall store count in this segment.
Gross Profit.
Gross profit as a percentage of revenues increased to 18.4% in
2013
from 15.8% in
2012
.
Operating Profit.
Operating profit as a percentage of total segment revenue decreased to 5.1% in
2013
from 5.3% for
2012
as we incurred approximately $0.3 million of expenses under the rebranding initiative, including replacing graphics on windows and trucks and minor store remodeling costs.
Other Consolidated Expenses
Interest Expense.
Interest expense increased $7.6 million, or 23.6%, to $39.6 million in 2013 as compared to $32.1 million in 2012 due to the issuance of $250 million of senior notes in May of 2013.
27
Income Tax Expense.
Our effective income tax rate was 38.2% and 36.1% for 2013 and 2012, respectively. The 2013 rate for income taxes is greater than that of 2012 due primarily to the non-deductible write-down of goodwill related to stores sold to franchisees.
Net Earnings and Earnings per Share.
Net earnings
decreased
by
$53.5 million
, or
29.4%
, to
$128.2 million
in
2013
as compared to
$181.7 million
in
2012
. This decrease was primarily attributable to a decline in the Core U.S. segment, an increase in interest expense and an increase in the effective income tax rate in 2013 as compared to 2012, partially offset by growth in the Acceptance Now and International segments. Diluted earnings per share in
2013
were
$2.32
compared to $
3.06
in
2012
. The decrease was due to the decrease in net income and was favorably impacted by a decrease in average diluted shares outstanding.
Comparison of the Years Ended
December 31, 2012
and
2011
Store Revenue.
Total store revenue increased by $195.7 million, or 6.9%, to $3,038.9 million in 2012 from $2,843.2 million in 2011. Store revenue increased primarily due to growth in the Acceptance Now segment, as well as growth in the Core U.S. and International segments.
Same store revenue represents revenue earned in 2,814 locations that were operated by us for each of the entire twelve-month periods ended December 31, 2012 and 2011. Same store revenues increased by $33.6 million, or 1.4%, to $2,405.1 million in 2012 as compared to $2,371.5 million in 2011. The increase in same store revenues was primarily attributable to the impact of the growth in the Acceptance Now segment.
Cost of Rentals and Fees.
Cost of rentals and fees consists primarily of depreciation of rental merchandise. Cost of rentals and fees in 2012 increased by $75.6 million, or 13.3%, to $646.1 million as compared to $570.5 million in 2011. This increase in cost of rentals and fees was primarily attributable to an increase in rentals and fees revenue in 2012 as compared to 2011. Cost of rentals and fees expressed as a percentage of store rentals and fees revenue increased to 24.3% in 2012 as compared to 22.8% in 2011, driven by higher merchandise costs in the Acceptance Now segment and changes in promotional sales strategies in the Core U.S. segment.
Cost of Merchandise Sold.
Cost of merchandise sold increased by $39.3 million, or 19.5%, to $241.2 million in 2012 from $201.9 million in 2011, driven by an increase in early purchase options. The gross margin percent of merchandise sales decreased to 19.6% in 2012 from 22.3% in 2011, primarily as a result of increased sales in the Acceptance Now segment, which has higher merchandise costs, and changes in promotional sales strategies in the Core U.S. segment.
Gross Profit.
Gross profit increased by $81.4 million, or 4.0%, to $2,133.9 million in 2012 from $2,052.5 million in 2011, primarily due to increased store revenue as discussed above. Gross profit as a percentage of total revenues decreased to 69.2% in 2012 from 71.2% in 2011 due to decreased margins related to changes in promotional sales strategies in the Core U.S. segment and the lower margins as a percentage of revenue in the Acceptance Now segment, whose revenue has grown to 11.1% of consolidated revenue in 2012 from 6.7% in 2011.
Salaries and Other Expenses.
The amounts and percentages that follow have been adjusted for the reclassification of stock-based compensation expense discussed in Note A to the financial statements. Salaries and other expenses increased by $72.0 million, or 4.5%, to $1,663.9 million in 2012 as compared to $1,591.8 million in 2011. This increase was primarily attributable to increased expenses associated with the expansion of our Acceptance Now and International segments. Charge offs in our Core U.S. rent-to-own stores due to customer stolen merchandise, expressed as a percentage of revenues, were approximately 2.4% in 2012 as compared to 2.5% in 2011. Salaries and other expenses expressed as a percentage of total store revenue decreased to 54.8% in 2012 from 56.0% in 2011 due to an increase in store revenue while continuing to manage store-related expenses.
General and Administrative Expenses.
The amounts and percentages that follow have been adjusted for the reclassification of stock-based compensation expense discussed in Note A to the financial statements. General and administrative expenses increased by $7.9 million, or 5.6%, to $148.5 million in 2012 as compared to $140.6 million in 2011. General and administrative expenses expressed as a percentage of total revenue decreased to 4.8% in 2012 from 4.9% in 2011.
Operating Profit.
Operating profit increased by $24.3 million, or 8.4%, to $315.7 million in 2012 as compared to $291.3 million in 2011. Operating profit as a percentage of total revenues increased to 10.2% in 2012 from 10.1% for 2011. Operating profit in 2012 was impacted by increased gross profit as discussed above. Operating profit in 2012 also increased compared to 2011 due to the $7.6 million restructuring charge related to the closure of eight Home Choice stores in Illinois, 24 RAC Limited locations within third-party grocery stores and 26 core rent-to-own stores following the sale of all customer accounts at those locations in 2011, the $7.3 million impairment charge related to the discontinuation of our financial services business and the $2.8 million litigation charge in 2011, all of which were reported in the Core U.S. segment, and the $4.9 million restructuring charge in 2011 for post-acquisition lease terminations related to the acquisition of The Rental Store, which was reported in the Acceptance
28
Now segment. These increases were partially offset by an increase in salaries and other expenses associated with our continued expansion of the Acceptance Now and International segments.
Income Tax Expense.
Our effective income tax rate was 36.1% and 35.8% for 2012 and 2011, respectively. The 2011 effective income tax rate was less than that of 2012 due primarily to the federal tax credits taken in 2011 that were not available in 2012.
Net Earnings and Earnings per Share.
Net earnings increased by $18.2 million, or 11.2%, to $181.7 million in 2012 as compared to $163.5 million in 2011. This increase was primarily attributable to an increase in operating profit, slightly offset by an increase in the effective income tax rate in 2012 as compared to 2011. Diluted earnings per share in 2012 were $3.06 compared to $2.64 in 2011. The increase was due primarily to the increase in net income and was also favorably impacted by a decrease in average diluted shares outstanding.
Quarterly Results
The following table contains certain unaudited historical financial information for the quarters indicated, adjusted to reflect the revisions to reserves discussed in Note B to the consolidated financial statements
:
|
1st Quarter
|
2nd Quarter
|
3rd Quarter
|
4th Quarter
|
|||||||||||||
|
|
(In thousands, except per share data)
|
|||||||||||||||
|
Year Ended December 31, 2013
|
||||||||||||||||
|
Revenues
|
$
|
819,281
|
|
$
|
760,511
|
|
$
|
754,780
|
|
$
|
769,611
|
|
||||
|
Gross profit
|
550,678
|
|
530,620
|
|
529,332
|
|
538,816
|
|
||||||||
|
Operating profit
|
78,784
|
|
77,230
|
|
55,773
|
|
34,382
|
|
||||||||
|
Net earnings
|
46,133
|
|
41,876
|
|
27,165
|
|
13,064
|
|
||||||||
|
Basic earnings per common share
|
$
|
0.80
|
|
$
|
0.76
|
|
$
|
0.51
|
|
$
|
0.25
|
|
||||
|
Diluted earnings per common share
|
$
|
0.79
|
|
$
|
0.76
|
|
$
|
0.50
|
|
$
|
0.25
|
|
||||
|
Cash dividends paid per common share
|
$
|
0.21
|
|
$
|
0.21
|
|
$
|
0.21
|
|
$
|
0.21
|
|
||||
|
1st Quarter
|
2nd Quarter
|
3rd Quarter
|
4th Quarter
|
|||||||||||||
|
|
(In thousands, except per share data)
|
|||||||||||||||
|
Year Ended December 31, 2012
|
||||||||||||||||
|
Revenues
|
$
|
835,254
|
|
$
|
749,698
|
|
$
|
739,314
|
|
$
|
758,380
|
|
||||
|
Gross profit
|
560,417
|
|
526,973
|
|
519,341
|
|
527,186
|
|
||||||||
|
Operating profit
|
90,476
|
|
78,454
|
|
67,798
|
|
78,943
|
|
||||||||
|
Net earnings
|
50,968
|
|
43,825
|
|
39,701
|
|
47,209
|
|
||||||||
|
Basic earnings per common share
|
$
|
0.86
|
|
$
|
0.74
|
|
$
|
0.67
|
|
$
|
0.81
|
|
||||
|
Diluted earnings per common share
|
$
|
0.85
|
|
$
|
0.74
|
|
$
|
0.67
|
|
$
|
0.80
|
|
||||
|
Cash dividends paid per common share
|
$
|
0.16
|
|
$
|
0.16
|
|
$
|
0.16
|
|
$
|
0.16
|
|
||||
|
1st Quarter
|
2nd Quarter
|
3rd Quarter
|
4th Quarter
|
|||||||||||||
|
|
(In thousands, except per share data)
|
|||||||||||||||
|
Year Ended December 31, 2011
|
||||||||||||||||
|
Revenues
|
$
|
742,178
|
|
$
|
698,253
|
|
$
|
704,271
|
|
$
|
737,482
|
|
||||
|
Gross profit
|
523,148
|
|
506,355
|
|
505,724
|
|
517,289
|
|
||||||||
|
Operating profit
|
80,486
|
|
72,872
|
|
57,363
|
|
80,608
|
|
||||||||
|
Net earnings
|
44,272
|
|
39,713
|
|
30,948
|
|
48,531
|
|
||||||||
|
Basic earnings per common share
|
$
|
0.70
|
|
$
|
0.64
|
|
$
|
0.52
|
|
$
|
0.82
|
|
||||
|
Diluted earnings per common share
|
$
|
0.69
|
|
$
|
0.63
|
|
$
|
0.51
|
|
$
|
0.81
|
|
||||
|
Cash dividends paid per common share
|
$
|
0.06
|
|
$
|
0.06
|
|
$
|
0.16
|
|
$
|
0.16
|
|
||||
29
|
1st Quarter
|
2nd Quarter
|
3rd Quarter
|
4th Quarter
|
|||||||||
|
|
(As a percentage of revenues)
|
|||||||||||
|
Year Ended December 31, 2013
|
||||||||||||
|
Revenues
|
100.0
|
%
|
100.0
|
%
|
100.0
|
%
|
100.0
|
%
|
||||
|
Gross profit
|
67.2
|
|
69.8
|
|
70.1
|
|
70.0
|
|
||||
|
Operating profit
|
9.6
|
|
10.2
|
|
7.4
|
|
4.5
|
|
||||
|
Net earnings
|
5.6
|
|
5.5
|
|
3.6
|
|
1.7
|
|
||||
|
1st Quarter
|
2nd Quarter
|
3rd Quarter
|
4th Quarter
|
|||||||||
|
|
(As a percentage of revenues)
|
|||||||||||
|
Year Ended December 31, 2012
|
||||||||||||
|
Revenues
|
100.0
|
%
|
100.0
|
%
|
100.0
|
%
|
100.0
|
%
|
||||
|
Gross profit
|
67.1
|
|
70.3
|
|
70.2
|
|
69.5
|
|
||||
|
Operating profit
|
10.8
|
|
10.5
|
|
9.2
|
|
10.4
|
|
||||
|
Net earnings
|
6.1
|
|
5.8
|
|
5.4
|
|
6.2
|
|
||||
|
1st Quarter
|
2nd Quarter
|
3rd Quarter
|
4th Quarter
|
|||||||||
|
|
(As a percentage of revenues)
|
|||||||||||
|
Year Ended December 31, 2011
|
||||||||||||
|
Revenues
|
100.0
|
%
|
100.0
|
%
|
100.0
|
%
|
100.0
|
%
|
||||
|
Gross profit
|
70.5
|
|
72.5
|
|
71.8
|
|
70.1
|
|
||||
|
Operating profit
|
10.8
|
|
10.4
|
|
8.1
|
|
10.9
|
|
||||
|
Net earnings
|
6.0
|
|
5.7
|
|
4.4
|
|
6.6
|
|
||||
Liquidity and Capital Resources
Overview.
For the year ended
December 31, 2013
, we generated
$134.3 million
in operating cash flow and issued $250 million in senior notes. In addition to funding operating expenses, we used $217.4 million for common stock repurchases, $108.4 million in cash for capital expenditures, $46.8 million to pay cash dividends and $41.2 million to acquire stores. We ended the year with
$42.3 million
in cash and cash equivalents.
Analysis of Cash Flow.
Net cash provided by operating activities
decreased
by
$83.6 million
to
$134.3 million
in
2013
from
$217.9 million
in
2012
. This decrease was attributable to the net changes in operating assets and liabilities, primarily from increased purchases of inventory related to expansion in our Acceptance Now and International segments.
Net cash used in investing activities
increased
by
$18.9 million
to
$129.6 million
in
2013
from
$110.7 million
in
2012
. This increase was primarily attributable to an increase in both capital expenditures and acquisitions of businesses.
Net cash used in financing activities
decreased
by
$111.3 million
to
$23.1 million
in
2013
from
$134.5 million
in
2012
. Net borrowings increased $282.0 million, including the issuance of $250 million in senior notes, and we purchased $155.6 million more of our common stock in 2013 than in 2012, primarily through the $200 million accelerated share repurchase that we initiated in May 2013 and closed in October 2013. We also increased our quarterly dividends in 2013 compared to 2012.
Liquidity Requirements
. Our primary liquidity requirements are for rental merchandise purchases, implementation of our growth strategies, income tax payments, capital expenditures and debt service. Our primary sources of liquidity have been cash provided by operations and borrowings. In the future, to provide any additional funds necessary for the continued operations and expansion of our business, we may incur from time to time additional short-term or long-term bank indebtedness and may issue, in public or private transactions, equity and debt securities. The availability and attractiveness of any outside sources of financing will depend on a number of factors, some of which relate to our financial condition and performance, and some of which are beyond our control, such as prevailing interest rates and general financing and economic conditions. The global financial markets continue to experience volatility and adverse conditions and such conditions in the capital markets may affect our ability to access additional sources of financing. There can be no assurance that additional financing will be available, or if available, that it will be on terms we find acceptable.
30
Our revolving credit facilities, including our $20.0 million line of credit at Intrust Bank, provide us with revolving loans in an aggregate principal amount not exceeding $520.0 million, of which $223.3 million was available at
February 21, 2014
. At
February 21, 2014
, we had $78.8 million in cash. To the extent we have available cash that is not necessary to fund the items listed above, we may declare and pay dividends on our common stock, repurchase additional shares of our common stock, or make additional payments to service our existing debt. While our operating cash flow has been strong and we expect this strength to continue, our liquidity could be negatively impacted if we do not remain as profitable as we expect.
As announced on February 6, 2014, we intend, subject to market and other conditions, to refinance our existing senior credit facilities. We currently expect to enter into a new $850 million senior credit facility, consisting of a $350 million term loan and a $500 million revolving credit facility, during the first quarter of 2014. We intend to repay amounts outstanding under our existing senior credit facility with the proceeds of the new term loan. We cannot provide any assurance that we will be able to complete this refinancing transaction on terms and conditions acceptable to us or at all.
Based on the long-term nature of our relationships with the lenders under our current senior credit facilities and our history of strong cash flow generation, we believe strongly we will be successful in refinancing our existing senior credit facilities on terms and conditions reasonably satisfactory to us. However, if we are unable to complete the refinancing transaction, or obtain other relief from the lenders under our current senior credit facilities, our current projections indicate that an event of default under our existing senior credit facilities may occur in 2014. If an event of default does occur, the lenders under our current senior credit facilities could accelerate all amounts outstanding thereunder. The acceleration of all amounts outstanding under our current senior credit facilities would also be an event of default under the indentures governing our senior notes. See “-Senior Credit Facilities” and “-Senior Notes.”
A change in control would result in an event of default under our senior credit facilities which would allow our lenders to accelerate the indebtedness owed to them. In addition, if a change in control occurs, we may be required to offer to repurchase all of our outstanding senior unsecured notes at 101% of their principal amount, plus accrued interest to the date of repurchase. Our senior credit facilities restrict our ability to repurchase the senior unsecured notes, including in the event of a change in control. In the event a change in control occurs, we cannot be sure we would have enough funds to immediately pay our accelerated senior credit facility and senior note obligations or that we would be able to obtain financing to do so on favorable terms, if at all.
Deferred Taxes.
Certain federal tax legislation enacted during the period 2009 to 2013 permitted bonus first-year depreciation deductions ranging from 50-100% of the adjusted basis of qualified property placed in service during such years. The depreciation benefits associated with these tax acts are now reversing and had a negative effect on our 2013 cash flow. We estimate the negative effect of these acts in 2013 to be $14 million. We estimate that the remaining tax deferral associated with these acts approximates $167 million at December 31, 2013, of which approximately 75%, or $126 million will reverse in 2014, and the remainder will reverse between 2015 and 2016.
On January 2, 2013, President Obama signed into law the 2012 Act. The Work Opportunity Tax Credit and Empowerment Zone Employment Credits, as well as the Research and Development Credit were extended retroactive to January 1, 2012. The benefit associated with these credits was $1.8 million; due to the 2012 Act's enactment in 2013, the benefit was recognized in the first quarter of 2013.
Merchandise Inventory
. A reconciliation of merchandise inventory, which includes purchases, follows:
|
|
Year Ended December 31,
|
|||||||||||
|
|
2013
|
2012
|
2011
|
|||||||||
|
|
(In thousands)
|
|||||||||||
|
Beginning merchandise value
|
$
|
1,011,260
|
|
$
|
946,623
|
|
$
|
834,091
|
|
|||
|
Inventory additions through acquisitions
|
11,843
|
|
4,380
|
|
6,023
|
|
||||||
|
Purchases
|
1,152,619
|
|
1,070,308
|
|
993,598
|
|
||||||
|
Depreciation of rental merchandise
|
(655,591
|
)
|
(622,261
|
)
|
(556,945
|
)
|
||||||
|
Cost of goods sold
|
(241,977
|
)
|
(265,791
|
)
|
(226,688
|
)
|
||||||
|
Skips and stolens
|
(105,225
|
)
|
(84,532
|
)
|
(74,061
|
)
|
||||||
|
Other inventory deletions
(1)
|
(43,823
|
)
|
(37,467
|
)
|
(29,395
|
)
|
||||||
|
Ending merchandise value
|
$
|
1,129,106
|
|
$
|
1,011,260
|
|
$
|
946,623
|
|
|||
________
|
(1)
|
Other inventory deletions include loss/damage waiver claims and unrepairable and missing merchandise, as well as acquisition write-offs.
|
31
Capital Expenditures
. We make capital expenditures in order to maintain our existing operations as well as for new capital assets in new and acquired stores, and investment in information technology. We spent
$108.4 million
, $102.5 million and $132.7 million on capital expenditures in the years
2013
,
2012
and
2011
, respectively, and expect to spend an aggregate of approximately $100.0 million in
2014
.
Acquisitions and New Location Openings.
During
2013
, we used approximately
$41.2 million
in cash acquiring locations and accounts in 47 separate transactions, including the acquisition of 66 ColorTyme franchises in 25 separate transactions as part of our franchise rebranding initiative.
The table below summarizes the location activity for the years ended
December 31, 2013
,
2012
and
2011
.
|
|
Year Ended December 31, 2013
|
|||||||||||||||||||
|
|
Core U.S.
|
Acceptance Now
|
International
|
Franchising
|
Total
|
|||||||||||||||
|
Locations at beginning of period
|
2,990
|
|
966
|
|
108
|
|
224
|
|
4,288
|
|
||||||||||
|
New location openings
|
37
|
|
411
|
|
63
|
|
40
|
|
551
|
|
||||||||||
|
Acquired locations remaining open
|
47
|
|
—
|
|
—
|
|
—
|
|
47
|
|
||||||||||
|
Closed locations
|
||||||||||||||||||||
|
Merged with existing locations
|
46
|
|
44
|
|
2
|
|
—
|
|
92
|
|
||||||||||
|
Sold or closed with no surviving location
|
36
|
|
8
|
|
—
|
|
85
|
|
129
|
|
||||||||||
|
Locations at end of period
|
2,992
|
|
1,325
|
|
169
|
|
179
|
|
4,665
|
|
||||||||||
|
Acquired locations closed and accounts merged with existing locations
|
38
|
|
—
|
|
—
|
|
—
|
|
38
|
|
||||||||||
|
Total approximate purchase price
(in millions)
|
$
|
41.2
|
|
$
|
—
|
|
$
|
—
|
|
$
|
—
|
|
$
|
41.2
|
|
|||||
|
|
Year Ended December 31, 2012
|
|||||||||||||||||||
|
|
Core U.S.
|
Acceptance Now
|
International
|
Franchising
|
Total
|
|||||||||||||||
|
Locations at beginning of period
|
2,994
|
|
750
|
|
80
|
|
216
|
|
4,040
|
|
||||||||||
|
New location openings
|
35
|
|
325
|
|
45
|
|
18
|
|
423
|
|
||||||||||
|
Acquired locations remaining open
|
6
|
|
—
|
|
—
|
|
—
|
|
6
|
|
||||||||||
|
Closed locations
|
||||||||||||||||||||
|
Merged with existing locations
|
40
|
|
95
|
|
1
|
|
—
|
|
136
|
|
||||||||||
|
Sold or closed with no surviving location
|
5
|
|
14
|
|
16
|
|
10
|
|
45
|
|
||||||||||
|
Locations at end of period
|
2,990
|
|
966
|
|
108
|
|
224
|
|
4,288
|
|
||||||||||
|
Acquired locations closed and accounts merged with existing locations
|
31
|
|
—
|
|
—
|
|
—
|
|
31
|
|
||||||||||
|
Total approximate purchase price
(in millions)
|
$
|
13.3
|
|
$
|
—
|
|
$
|
—
|
|
$
|
—
|
|
$
|
13.3
|
|
|||||
32
|
|
Year Ended December 31, 2011
|
|||||||||||||||||||
|
|
Core U.S.
|
Acceptance Now
|
International
|
Franchising
|
Total
|
|||||||||||||||
|
Locations at beginning of period
|
2,985
|
|
384
|
|
23
|
|
209
|
|
3,601
|
|
||||||||||
|
New location openings
|
52
|
|
445
|
|
57
|
|
10
|
|
564
|
|
||||||||||
|
Acquired locations remaining open
|
26
|
|
5
|
|
—
|
|
3
|
|
34
|
|
||||||||||
|
Closed locations
|
||||||||||||||||||||
|
Merged with existing locations
|
28
|
|
63
|
|
—
|
|
—
|
|
91
|
|
||||||||||
|
Sold or closed with no surviving location
|
41
|
|
21
|
|
—
|
|
6
|
|
68
|
|
||||||||||
|
Locations at end of period
|
2,994
|
|
750
|
|
80
|
|
216
|
|
4,040
|
|
||||||||||
|
Acquired locations closed and accounts merged with existing locations
|
71
|
|
—
|
|
—
|
|
—
|
|
71
|
|
||||||||||
|
Total approximate purchase price
(in millions)
|
$
|
26.4
|
|
$
|
0.3
|
|
$
|
—
|
|
$
|
—
|
|
$
|
26.7
|
|
|||||
Senior Credit Facilities.
Our $750.0 million senior credit facilities consist of a $250.0 million, five-year term loan and a $500.0 million, five-year revolving credit facility.
The table below shows the scheduled maturity dates of our senior term loan outstanding at
December 31, 2013
.
|
Year Ending December 31,
|
(In thousands)
|
||
|
2014
|
$
|
25,000
|
|
|
2015
|
25,000
|
|
|
|
2016
|
137,500
|
|
|
|
$
|
187,500
|
|
|
The full amount of the revolving credit facility may be used for the issuance of letters of credit, of which $104.7 million had been so utilized as of
February 21, 2014
, at which date $172.0 million was outstanding and $223.3 million was available. The revolving credit facility and the term loan expire on July 14, 2016.
Borrowings under our senior credit facility accrue interest at varying rates equal to, at our election, either (y) the prime rate plus 0.50% to 1.50%; or (z) the Eurodollar rate plus 1.50% to 2.50%. Interest periods range from seven days (for borrowings under the revolving credit facility only) to one, two, three or six months, at our election. The weighted average Eurodollar rate on our outstanding debt was 0.17% at
February 21, 2014
. The margins on the Eurodollar rate and on the prime rate, which were
2.25%
and
1.25%
, respectively, at
December 31, 2013
, may fluctuate dependent upon an increase or decrease in our consolidated leverage ratio as defined by a pricing grid included in the amended credit agreement, and the weighted average margins for the year ended
December 31, 2013
, were 2.08% and 1.08%, respectively. We have not entered into any interest rate protection agreements with respect to term loans under our senior credit facilities. A commitment fee equal to 0.30% to 0.50% of the average daily amount of the available revolving commitment is payable quarterly.
Our senior credit facilities are secured by a security interest in substantially all of our tangible and intangible assets, including intellectual property. Our senior credit facilities are also secured by a pledge of the capital stock of our wholly-owned U.S. subsidiaries (other than certain specified subsidiaries).
33
Our senior credit facilities contain, without limitation, covenants that generally limit our ability to:
|
•
|
incur additional debt in excess of $250.0 million at any one time outstanding (other than subordinated debt, which is generally permitted if the maturity date is later than July 14, 2017);
|
|
•
|
repurchase our capital stock and 6.625% notes and 4.75% notes and pay cash dividends in the event the pro forma senior leverage ratio is greater than 2.50x (on
February 20, 2014
, we obtained a waiver from the lenders under our senior credit facilities to permit the declaration and payment of a cash dividend with respect to the second quarter of 2014);
|
|
•
|
incur liens or other encumbrances;
|
|
•
|
merge, consolidate or sell substantially all our property or business;
|
|
•
|
sell assets, other than inventory, in the ordinary course of business;
|
|
•
|
make investments or acquisitions unless we meet financial tests and other requirements;
|
|
•
|
make capital expenditures in the event the pro forma consolidated leverage ratio is greater than 2.75x; or
|
|
•
|
enter into an unrelated line of business.
|
Our senior credit facilities require us to comply with several financial covenants. The table below shows the required and actual ratios under our credit facilities calculated as of
December 31, 2013
:
|
|
Required Ratio
|
Actual Ratio
|
|||
|
Maximum consolidated leverage ratio
|
No greater than
|
3.25:1
|
2.64:1
|
||
|
Minimum fixed charge coverage ratio
|
No less than
|
1.35:1
|
1.38:1
|
||
These financial covenants, as well as the related components of their computation, are defined in the amended and restated credit agreement governing our senior credit facility, which is included as an exhibit to our Current Report on Form 8-K dated as of July 14, 2011. In accordance with the credit agreement, the maximum consolidated leverage ratio was calculated by dividing the consolidated funded debt outstanding at
December 31, 2013
(
$880.7 million
) by consolidated EBITDA for the 12-month period ending
December 31, 2013
(
$334.1 million
). For purposes of the covenant calculation, (i) “consolidated funded debt” is defined as outstanding indebtedness less cash in excess of $25.0 million, and (ii) “consolidated EBITDA” is generally defined as consolidated net income (a) plus the sum of income taxes, interest expense, depreciation and amortization expense, extraordinary non-cash expenses or losses, and other non-cash charges, and (b) minus the sum of interest income, extraordinary income or gains, other non-cash income, and cash payments with respect to extraordinary non-cash expenses or losses recorded in prior fiscal quarters. Consolidated EBITDA is a non-GAAP financial measure that is presented not as a measure of operating results, but rather as a measure used to determine covenant compliance under our senior credit facilities.
The minimum fixed charge coverage ratio was calculated pursuant to the credit agreement by dividing consolidated EBITDA for the 12-month period ending
December 31, 2013
as adjusted for certain capital expenditures (
$485.1 million
), by consolidated fixed charges for the 12-month period ending
December 31, 2013
(
$351.5 million
). For purposes of the covenant calculation, “consolidated fixed charges” is defined as the sum of interest expense, lease expense, cash dividends, and mandatory debt repayments.
Events of default under our senior credit facilities include customary events, such as a cross-acceleration provision in the event that we default on other debt. In addition, an event of default under the senior credit facility would occur if a change of control occurs. This is defined to include the case where a third party becomes the beneficial owner of 35% or more of our voting stock or certain changes in Rent-A-Center's Board of Directors occurs. An event of default would also occur if one or more judgments were entered against us of $50.0 million or more and such judgments were not satisfied or bonded pending appeal within 30 days after entry.
We utilize our revolving credit facility for the issuance of letters of credit, as well as to manage normal fluctuations in operational cash flow caused by the timing of cash receipts. In that regard, we may from time to time draw funds under the revolving credit facility for general corporate purposes. The funds drawn on individual occasions have varied in amounts of up to
$100.0 million
, which occurred at the date we refinanced our senior secured debt, with total amounts outstanding ranging up to
$221.0 million
. Amounts are drawn as needed due to the timing of cash flows and are generally paid down as cash is generated by our operating activities.
On February 6, 2014, we announced that we intend, subject to market and other conditions, to refinance our existing senior credit facilities. We currently expect to enter into a new $850 million senior credit facility, consisting of a $350 million term loan and a $500 million revolving credit facility, during the first quarter of 2014. We intend to repay amounts outstanding under our
34
existing senior credit facility with the proceeds of the new term loan. We cannot provide any assurance that we will be able to complete this refinancing transaction on terms and conditions acceptable to us or at all.
Senior Notes
. On November 2, 2010, we issued $300.0 million in senior unsecured notes due November 2020, bearing interest at 6.625%, pursuant to an indenture dated November 2, 2010, among Rent-A-Center, Inc., its subsidiary guarantors and The Bank of New York Mellon Trust Company, as trustee. A portion of the proceeds of this offering were used to repay approximately $200.0 million of outstanding term debt under our senior credit facility. The remaining net proceeds were used to repurchase shares of our common stock.
On May 2, 2013, we issued $250.0 million in senior unsecured notes due May 2021, bearing interest at 4.750%, pursuant to an indenture dated May 2, 2013, among Rent-A-Center, Inc., its subsidiary guarantors and The Bank of New York Mellon Trust Company, as trustee. A portion of the proceeds of this offering were used to repurchase shares of our common stock under a $200.0 million accelerated stock buyback program. The remaining net proceeds were used to repay outstanding revolving debt under our senior credit facility.
The indentures governing the 6.625% notes and the 4.75% notes are substantially similar. Each indenture contains covenants that limit our ability to:
|
•
|
incur additional debt;
|
|
•
|
sell assets or our subsidiaries;
|
|
•
|
grant liens to third parties;
|
|
•
|
pay cash dividends or repurchase stock (subject to a restricted payments basket under which approxim
ately
$75 million
is available); and
|
|
•
|
engage in a merger or sell substantially all of our assets.
|
Events of default under each indenture include customary events, such as a cross-acceleration provision in the event that we default in the payment of other debt due at maturity or upon acceleration for default in an amount exceeding $50.0 million, as well as in the event a judgment is entered against us in excess of $50.0 million that is not discharged, bonded or insured.
The 6.625% notes may be redeemed on or after November 15, 2015, at our option, in whole or in part, at a premium declining from 103.313%. The 6.625% notes may be redeemed on or after November 15, 2018, at our option, in whole or in part, at par. The 6.625% notes also require that upon the occurrence of a change of control (as defined in the 2010 indenture), the holders of the notes have the right to require us to repurchase the notes at a price equal to 101% of the original aggregate principal amount, together with accrued and unpaid interest, if any, to the date of repurchase.
The 4.75% notes may be redeemed on or after May 1, 2016, at our option, in whole or in part, at a premium declining from 103.563%. The 4.75% notes may be redeemed on or after May 1, 2019, at our option, in whole or in part, at par. The 4.75% notes also require that upon the occurrence of a change of control (as defined in the 2013 indenture), the holders of the notes have the right to require us to repurchase the notes at a price equal to 101% of the original aggregate principal amount, together with accrued and unpaid interest, if any, to the date of repurchase.
Any mandatory repurchase of the 6.625% notes an/or the 4.75% notes would trigger an event of default under our senior credit facilities. We are not required to maintain any financial ratios under either of the indentures.
In addition to the senior credit facilities discussed above, we maintain a $20.0 million unsecured, revolving line of credit with INTRUST Bank, N.A. to facilitate cash management. The outstanding balance of this line of credit was
$18.3 million
and $0 at December 31, 2013, and December 31, 2012, respectively.
Store Leases
. We lease space for substantially all of our Core U.S. and International stores and certain support facilities under operating leases expiring at various times through 2023. Most of our store leases are five year leases and contain renewal options for additional periods ranging from three to five years at rental rates adjusted according to agreed-upon formulas.
Franchising Guarantees.
Our subsidiary, ColorTyme Finance, Inc., is a party to an agreement with Citibank, N.A., pursuant to which Citibank provides up to $40.0 million in aggregate financing to qualifying franchisees of Franchising. Under the Citibank agreement, upon an event of default by the franchisee under agreements governing this financing and upon the occurrence of certain other events, Citibank can assign the loans and the collateral securing such loans to ColorTyme Finance, with ColorTyme Finance paying or causing to be paid the outstanding debt to Citibank and then succeeding to the rights of Citibank under the debt agreements, including the right to foreclose on the collateral. Rent-A-Center and ColorTyme Finance guarantee the obligations of the franchise borrowers under the Citibank facility. An additional $20.0 million of financing is provided by Texas Capital Bank,
35
National Association under an agreement similar to the Citibank financing, which is guaranteed by Rent-A-Center East, Inc., a subsidiary of Rent-A-Center. The maximum guarantee obligations under these agreements, excluding the effects of any amounts that could be recovered under collateralization provisions, is $60.0 million, of which
$17.2 million
was outstanding as of
December 31, 2013
.
Contractual Cash Commitments
. The table below summarizes debt, lease and other minimum cash obligations outstanding as of
December 31, 2013
:
|
|
Payments Due by Period
|
||||||||||||||||||||
|
Contractual Cash Obligations
|
Total
|
2014
|
2015-2016
|
2017-2018
|
Thereafter
|
||||||||||||||||
|
|
(In thousands)
|
||||||||||||||||||||
|
Senior Debt (including current portion)
|
$
|
366,275
|
|
(1)
|
$
|
43,275
|
|
$
|
323,000
|
|
$
|
—
|
|
$
|
—
|
|
|||||
|
6.625% Senior Notes
(2)
|
439,122
|
|
19,876
|
|
39,750
|
|
39,750
|
|
339,746
|
|
|||||||||||
|
4.75% Senior Notes
(3)
|
339,066
|
|
11,875
|
|
23,750
|
|
23,750
|
|
279,691
|
|
|||||||||||
|
Operating Leases
|
567,035
|
|
189,353
|
|
271,887
|
|
101,927
|
|
3,868
|
|
|||||||||||
|
Total
(4)
|
$
|
1,711,498
|
|
$
|
264,379
|
|
$
|
658,387
|
|
$
|
165,427
|
|
$
|
623,305
|
|
||||||
|
(1)
|
Amount referenced does not include interest payments. Our senior credit facilities bear interest at varying rates equal to the Eurodollar rate plus 1.5% to 2.5% or the prime rate plus 0.5% to 1.5% at our election. The weighted average Eurodollar rate on our outstanding debt at
December 31, 2013
was 0.20%.
|
|
(2)
|
Includes interest payments of $9.9 million on each of May 15 and November 15 of each year.
|
|
(3)
|
Includes interest payments of $5.9 million on each May 1 and November 1 of each year.
|
|
(4)
|
As of
December 31, 2013
, we have $13.2 million in uncertain tax positions. Because of the uncertainty of the amounts to be ultimately paid as well as the timing of such payments, uncertain tax positions are not reflected in the contractual obligations table.
|
Repurchases of Outstanding Securities.
Under our current common stock repurchase program, our Board of Directors has authorized the purchase, from time to time, in the open market and privately negotiated transactions, up to an aggregate of
$1.25 billion
of Rent-A-Center common stock. On May 2, 2013, we entered into an agreement with Goldman, Sachs & Co. (“Goldman Sachs”) to repurchase $200.0 million of Rent-A-Center common stock under an accelerated stock buyback program (“the ASB transaction”). Under the agreement, we paid $200.0 million to Goldman Sachs on May 7, 2013, and we received an initial share delivery of 4,592,423 shares, which was estimated to represent 80% of shares expected to be purchased in the ASB transaction. The weighted value of these shares immediately reduced weighted-average shares outstanding in our calculation of earnings per share. The remainder of the ASB transaction was subject to a forward contract that settled in October 2013, at which time we received an additional 816,916 shares, ending the ASB transaction.
We have repurchased a total of
36,994,653
shares and 31,120,279 shares of Rent-A-Center common stock for an aggregate purchase price of
$994.8 million
and $777.3 million as of
December 31, 2013
and 2012, respectively, under this common stock repurchase program. In addition to the 5,409,339 shares repurchased pursuant to the accelerated stock buyback, we repurchased a total of
465,035
shares for
$17.4 million
in cash during the year ended
December 31, 2013
.
Seasonality.
Our revenue mix is moderately seasonal, with the first quarter of each fiscal year generally providing higher merchandise sales than any other quarter during a fiscal year, primarily related to federal income tax refunds. Generally, our customers will more frequently exercise the early purchase option on their existing rental purchase agreements or purchase pre-leased merchandise off the showroom floor during the first quarter of each fiscal year. Furthermore, we tend to experience slower growth in the number of rental purchase agreements in the third quarter of each fiscal year when compared to other quarters throughout the year. We expect these trends to continue in the future.
36
Effect of New Accounting Pronouncements
In July 2013, the Financial Accounting Standards Board ("FASB") issued Accounting Standards Update ("ASU") 2013-11,
Presentation of Unrecognized Tax Benefit When a Net Operating Loss Carryforward, a Similar Tax Loss, or a Tax Credit Carryforward Exists,
an amendment to FASB Accounting Standards Codification Topic 740,
Income Taxes
. This update clarifies that an unrecognized tax benefit, or a portion of an unrecognized tax benefit, should be presented in the financial statements as a reduction to a deferred tax asset for a net operating loss carryforward, a similar tax loss, or a tax credit carryforward if such settlement is required or expected in the event the uncertain tax position is disallowed. In situations where a net operating loss carryforward, a similar tax loss, or a tax credit carryforward is not available at the reporting date under the tax law of the applicable jurisdiction or the tax law of the jurisdiction does not require, and the entity does not intend to use the deferred tax asset for such purpose, the unrecognized tax benefit should be presented in the financial statements as a liability and should not be combined with deferred tax assets. This ASU is effective prospectively for fiscal years, and interim periods within those years, beginning after December 15, 2013. Both early adoption and retrospective application are permitted, and we will adopt this standard prospectively on January 1, 2014. This standard will not have a material impact on our consolidated statement of earnings, financial condition, statement of cash flows or earnings per share.
From time to time, new accounting pronouncements are issued by the Financial Accounting Standards Board (“FASB”) or other standards setting bodies that we adopt as of the specified effective date. Unless otherwise discussed, we believe the impact of any other recently issued standards that are not yet effective are either not applicable to us at this time or will not have a material impact on our consolidated financial statements upon adoption.
Item 7A.
Quantitative and Qualitative Disclosures About Market Risk.
Interest Rate Sensitivity
As of
December 31, 2013
, we had $300.0 million in senior notes outstanding at a fixed interest rate of 6.625% and $250.0 million in senior notes outstanding at a fixed rate of 4.75%. We also had
$187.5 million
outstanding in term loans,
$160.5 million
outstanding on our revolving credit facility and
$18.3 million
outstanding on our INTRUST line of credit, each at interest rates indexed to the Eurodollar rate. The fair value of the 6.625% senior notes, based on the closing price at December 31, 2013, was
$316.7 million
. The fair value of the 4.75% senior notes, based on the closing price at December 31, 2013, was
$234.7 million
. Carrying value approximates fair value for all other indebtedness.
Market Risk
Market risk is the potential change in an instrument’s value caused by fluctuations in interest rates. Our primary market risk exposure is fluctuations in interest rates. Monitoring and managing this risk is a continual process carried out by our senior management. We manage our market risk based on an ongoing assessment of trends in interest rates and economic developments, giving consideration to possible effects on both total return and reported earnings. As a result of such assessment, we may enter into swap contracts or other interest rate protection agreements from time to time to mitigate this risk.
Interest Rate Risk
We have senior credit facilities with variable interest rates indexed to prime or Eurodollar rates that exposes us to the risk of increased interest costs if interest rates rise. As of
December 31, 2013
, we have not entered into any interest rate swap agreements. The credit markets have experienced adverse conditions, including wide fluctuations in rates. Such volatility in the credit markets could increase the costs associated with our existing long-term debt. Based on our overall interest rate exposure at
December 31, 2013
, a hypothetical 1.0% increase or decrease in interest rates would have the effect of causing a $3.4 million additional pre-tax charge or credit to our statement of earnings.
Foreign Currency Translation
We are exposed to market risk from foreign exchange rate fluctuations of the Mexican peso and Canadian dollar to the U.S. dollar as the financial position and operating results of our stores in those countries are translated into U.S. dollars for consolidation. Resulting translation adjustments are recorded as a separate component of stockholders' equity.
37
Item 8.
Financial Statements and Supplementary Data.
INDEX TO FINANCIAL STATEMENTS
|
|
Page
|
|
Rent-A-Center, Inc. and Subsidiaries
|
|
|
Reports of Independent Registered Public Accounting Firms
|
|
|
Management's Annual Report on Internal Control over Financial Reporting
|
|
|
Consolidated Financial Statements
|
|
|
Statements of Earnings
|
|
|
Statements of Comprehensive Income
|
|
|
Balance Sheets
|
|
|
Statement of Stockholders’ Equity
|
|
|
Statements of Cash Flows
|
|
|
Notes to Consolidated Financial Statements
|
|
38
Report of Independent Registered Public Accounting Firm
Board of Directors and Shareholders
Rent-A-Center, Inc.:
We
have audited the accompanying consolidated balance sheet of Rent-A-Center, Inc. and subsidiaries (the Company) as of
December 31, 2013
, and the related consolidated statements of earnings, comprehensive income, stockholders’ equity, and cash flows for the year then ended. These consolidated financial statements are the responsibility of the Company’s management. Our responsibility is to express an opinion on these consolidated financial statements based on our audit.
We conducted our audit in accordance with the standards of the Public Company Accounting Oversight Board (United States). Those standards require that we plan and perform the audit to obtain reasonable assurance about whether the financial statements are free of material misstatement. An audit includes examining, on a test basis, evidence supporting the amounts and disclosures in the financial statements. An audit also includes assessing the accounting principles used and significant estimates made by management, as well as evaluating the overall financial statement presentation. We believe that our audit provides a reasonable basis for our opinion.
In our opinion, the consolidated financial statements referred to above present fairly, in all material respects, the financial position of Rent-A-Center, Inc. and subsidiaries as of
December 31, 2013
, and the results of their operations and their cash flows for the year then ended in conformity with U.S. generally accepted accounting principles.
We also have audited, in accordance with the standards of the Public Company Accounting Oversight Board (United States), the Company’s internal control over financial reporting as of
December 31, 2013
, based on criteria established in
Internal Control - Integrated Framework (1992)
issued by the Committee of Sponsoring Organizations of the Treadway Commission (COSO
),
and our report dated
March 3, 2014
, expressed an unqualified opinion on the effectiveness of the Company’s internal control over financial reporting
.
|
/s/ KPMG LLP
|
|
Dallas, Texas
|
|
March 3, 2014
|
39
Report of Independent Registered Public Accounting Firm
Board of Directors and Shareholders
Rent-A-Center, Inc. and Subsidiaries
We have audited the accompanying consolidated balance sheet of Rent-A-Center, Inc. (a Delaware corporation) and subsidiaries (the “Company”) as of December 31, 2012, and the related consolidated statements of earnings, comprehensive income, stockholders’ equity, and cash flows for each of the two years in the period ended December 31, 2012. These financial statements are the responsibility of the Company’s management. Our responsibility is to express an opinion on these financial statements based on our audits.
We conducted our audits in accordance with the standards of the Public Company Accounting Oversight Board (United States). Those standards require that we plan and perform the audit to obtain reasonable assurance about whether the financial statements are free of material misstatement. An audit includes examining, on a test basis, evidence supporting the amounts and disclosures in the financial statements. An audit also includes assessing the accounting principles used and significant estimates made by management, as well as evaluating the overall financial statement presentation. We believe that our audits provide a reasonable basis for our opinion.
In our opinion, the consolidated financial statements referred to above present fairly, in all material respects, the financial position of Rent-A-Center, Inc. and subsidiaries as of December 31, 2012, and the results of their operations and their cash flows for each of the two years in the period ended December 31, 2012 in conformity with accounting principles generally accepted in the United States of America.
|
/s/ Grant Thornton LLP
|
|
|
Dallas, Texas
|
|
|
February 25, 2013 (except for the effects of the immaterial error correction disclosed in Note B, as to which the date is March 3, 2014)
|
|
40
Report of Independent Registered Public Accounting Firm
Board of Directors and Shareholders
Rent-A-Center, Inc.:
We have audited Rent-A-Center, Inc.’s internal control over financial reporting as of
December 31, 2013
, based on criteria established in
Internal Control - Integrated Framework (1992)
issued by the Committee of Sponsoring Organizations of the Treadway Commission (COSO). The Company’s management is responsible for maintaining effective internal control over financial reporting and for its assessment of the effectiveness of internal control over financial reporting, included in the accompanying Management’s Annual Report on Internal Control over Financial Reporting. Our responsibility is to express an opinion on the Company’s internal control over financial reporting based on our audit.
We conducted our audit in accordance with the standards of the Public Company Accounting Oversight Board (United States). Those standards require that we plan and perform the audit to obtain reasonable assurance about whether effective internal control over financial reporting was maintained in all material respects. Our audit included obtaining an understanding of internal control over financial reporting, assessing the risk that a material weakness exists, and testing and evaluating the design and operating effectiveness of internal control based on the assessed risk. Our audit also included performing such other procedures as we considered necessary in the circumstances. We believe that our audit provides a reasonable basis for our opinion.
A company’s internal control over financial reporting is a process designed to provide reasonable assurance regarding the reliability of financial reporting and the preparation of financial statements for external purposes in accordance with generally accepted accounting principles. A company’s internal control over financial reporting includes those policies and procedures that (1) pertain to the maintenance of records that, in reasonable detail, accurately and fairly reflect the transactions and dispositions of the assets of the company; (2) provide reasonable assurance that transactions are recorded as necessary to permit preparation of financial statements in accordance with generally accepted accounting principles, and that receipts and expenditures of the company are being made only in accordance with authorizations of management and directors of the company; and (3) provide reasonable assurance regarding prevention or timely detection of unauthorized acquisition, use, or disposition of the company’s assets that could have a material effect on the financial statements.
Because of its inherent limitations, internal control over financial reporting may not prevent or detect misstatements. Also, projections of any evaluation of effectiveness to future periods are subject to the risk that controls may become inadequate because of changes in conditions, or that the degree of compliance with the policies or procedures may deteriorate.
In our opinion, the Company maintained, in all material respects, effective internal control over financial reporting as of
December 31, 2013
, based on criteria established in
Internal Control -Integrated Framework (1992)
issued by the Committee of Sponsoring Organizations of the Treadway Commission (COSO).
We also have audited, in accordance with the standards of the Public Company Accounting Oversight Board (United States), the consolidated balance sheet of the Company as of
December 31, 2013
, and the related consolidated statements of earnings, comprehensive income, stockholders’ equity, and cash flows for the year then ended, and our report dated
March 3, 2014
, expressed an unqualified opinion on those consolidated financial statements.
|
/s/ KPMG LLP
|
|
Dallas, Texas
|
|
March 3, 2014
|
41
MANAGEMENT’S ANNUAL REPORT ON INTERNAL CONTROL
OVER FINANCIAL REPORTING
Management of the Company, including the Chief Executive Officer and Chief Financial Officer, is responsible for establishing and maintaining adequate internal control over financial reporting as defined in Rule 13a-15(f) under the Securities Exchange Act of 1934, as amended. The Company’s internal control system was designed to provide reasonable assurance to management and the Company’s Board of Directors regarding the reliability of financial reporting and the preparation of financial statements for external purposes in accordance with generally accepted accounting principles.
All internal control systems, no matter how well designed, have inherent limitations. A system of internal control may become inadequate over time because of changes in conditions, or deterioration in the degree of compliance with the policies or procedures. Therefore, even those systems determined to be effective can provide only reasonable assurance with respect to financial statement preparation and presentation.
Management assessed the effectiveness of the Company’s internal control over financial reporting as of
December 31, 2013
, using the criteria set forth by the Committee of Sponsoring Organizations of the Treadway Commission in
Internal Control
—
Integrated Framework (1992).
Based on this assessment, management has concluded that, as of
December 31, 2013
, the Company’s internal control over financial reporting was effective to provide reasonable assurance regarding the reliability of financial reporting and the preparation of financial statements for external purposes in accordance with generally accepted accounting principles based on such criteria.
KPMG LLP, the Company’s independent registered public accounting firm, has issued an audit report on the effectiveness of the Company’s internal control over financial reporting. This report appears on page
41
.
42
RENT-A-CENTER, INC. AND SUBSIDIARIES
CONSOLIDATED STATEMENTS OF EARNINGS
|
|
Year Ended December 31,
|
|||||||||||
|
|
2013
|
|
2012
|
|
2011
|
|||||||
|
(In thousands, except per share data)
|
||||||||||||
|
Revenues
|
||||||||||||
|
Store
|
||||||||||||
|
Rentals and fees
|
$
|
2,698,395
|
|
$
|
2,654,081
|
|
$
|
2,496,863
|
|
|||
|
Merchandise sales
|
278,753
|
|
300,077
|
|
259,796
|
|
||||||
|
Installment sales
|
72,705
|
|
68,356
|
|
68,617
|
|
||||||
|
Other
|
18,133
|
|
16,391
|
|
17,925
|
|
||||||
|
Total store revenues
|
3,067,986
|
|
3,038,905
|
|
2,843,201
|
|
||||||
|
Franchise
|
||||||||||||
|
Merchandise sales
|
30,991
|
|
38,427
|
|
33,972
|
|
||||||
|
Royalty income and fees
|
5,206
|
|
5,314
|
|
5,011
|
|
||||||
|
Total revenues
|
3,104,183
|
|
3,082,646
|
|
2,882,184
|
|
||||||
|
Cost of revenues
|
||||||||||||
|
Store
|
||||||||||||
|
Cost of rentals and fees
|
683,221
|
|
646,090
|
|
570,493
|
|
||||||
|
Cost of merchandise sold
|
216,206
|
|
241,219
|
|
201,854
|
|
||||||
|
Cost of installment sales
|
25,771
|
|
24,572
|
|
24,834
|
|
||||||
|
Total cost of store revenues
|
925,198
|
|
911,881
|
|
797,181
|
|
||||||
|
Franchise cost of merchandise sold
|
29,539
|
|
36,848
|
|
32,487
|
|
||||||
|
Total cost of revenues
|
954,737
|
|
948,729
|
|
829,668
|
|
||||||
|
Gross profit
|
2,149,446
|
|
2,133,917
|
|
2,052,516
|
|
||||||
|
Operating expenses
|
||||||||||||
|
Salaries and other expenses
|
1,733,324
|
|
1,663,857
|
|
1,591,837
|
|
||||||
|
General and administrative expenses
|
158,424
|
|
148,500
|
|
140,612
|
|
||||||
|
Amortization and write-down of intangibles
|
11,529
|
|
5,889
|
|
4,675
|
|
||||||
|
Restructuring charge
|
—
|
|
—
|
|
13,943
|
|
||||||
|
Impairment charge
|
—
|
|
—
|
|
7,320
|
|
||||||
|
Litigation expense
|
—
|
|
—
|
|
2,800
|
|
||||||
|
1,903,277
|
|
1,818,246
|
|
1,761,187
|
|
|||||||
|
Operating profit
|
246,169
|
|
315,671
|
|
291,329
|
|
||||||
|
Interest expense
|
39,628
|
|
32,065
|
|
37,234
|
|
||||||
|
Interest income
|
(815
|
)
|
(842
|
)
|
(627
|
)
|
||||||
|
Earnings before income taxes
|
207,356
|
|
284,448
|
|
254,722
|
|
||||||
|
Income tax expense
|
79,118
|
|
102,745
|
|
91,258
|
|
||||||
|
NET EARNINGS
|
$
|
128,238
|
|
$
|
181,703
|
|
$
|
163,464
|
|
|||
|
Basic earnings per common share
|
$
|
2.34
|
|
$
|
3.08
|
|
$
|
2.67
|
|
|||
|
Diluted earnings per common share
|
$
|
2.32
|
|
$
|
3.06
|
|
$
|
2.64
|
|
|||
|
Cash dividends paid per common share
|
$
|
0.84
|
|
$
|
0.64
|
|
$
|
0.44
|
|
|||
See accompanying notes to consolidated financial statements.
43
RENT-A-CENTER, INC. AND SUBSIDIARIES
|
Year Ended December 31,
|
||||||||||||
|
|
2013
|
2012
|
2011
|
|||||||||
|
(In thousands)
|
||||||||||||
|
Net earnings
|
$
|
128,238
|
|
$
|
181,703
|
|
$
|
163,464
|
|
|||
|
Other comprehensive income (loss):
|
||||||||||||
|
Foreign currency translation adjustments
|
(2,017
|
)
|
2,775
|
|
(3,992
|
)
|
||||||
|
Total other comprehensive income (loss)
|
(2,017
|
)
|
2,775
|
|
(3,992
|
)
|
||||||
|
COMPREHENSIVE INCOME
|
$
|
126,221
|
|
$
|
184,478
|
|
$
|
159,472
|
|
|||
See accompanying notes to consolidated financial statements.
44
RENT-A-CENTER, INC. AND SUBSIDIARIES
|
|
December 31,
|
|||||||
|
|
2013
|
2012
|
||||||
|
|
(In thousands, except share
and par value data)
|
|||||||
|
ASSETS
|
||||||||
|
Cash and cash equivalents
|
$
|
42,274
|
|
$
|
61,087
|
|
||
|
Receivables, net of allowance for doubtful accounts of $3,700 and $2,920 in 2013 and 2012, respectively
|
58,686
|
|
52,819
|
|
||||
|
Prepaid expenses and other assets
|
78,471
|
|
71,963
|
|
||||
|
Rental merchandise, net
|
|
|||||||
|
On rent
|
914,618
|
|
807,397
|
|
||||
|
Held for rent
|
210,450
|
|
200,122
|
|
||||
|
Merchandise held for installment sale
|
4,038
|
|
3,741
|
|
||||
|
Property assets, net of accumulated depreciation of $433,935 and $398,039 in 2013 and 2012, respectively
|
336,498
|
|
309,800
|
|
||||
|
Goodwill, net
|
1,364,549
|
|
1,344,665
|
|
||||
|
Other intangible assets, net
|
8,969
|
|
8,223
|
|
||||
|
$
|
3,018,553
|
|
$
|
2,859,817
|
|
|||
|
LIABILITIES
|
||||||||
|
Accounts payable — trade
|
$
|
120,166
|
|
$
|
99,566
|
|
||
|
Accrued liabilities
|
315,235
|
|
309,066
|
|
||||
|
Deferred income taxes
|
323,326
|
|
299,627
|
|
||||
|
Senior debt
|
366,275
|
|
387,500
|
|
||||
|
Senior notes
|
550,000
|
|
300,000
|
|
||||
|
1,675,002
|
|
1,395,759
|
|
|||||
|
COMMITMENTS AND CONTINGENCIES
|
|
|
||||||
|
STOCKHOLDERS’ EQUITY
|
||||||||
|
Common stock, $.01 par value; 250,000,000 shares authorized; 109,108,218 and 108,530,911 shares issued in 2013 and 2012, respectively
|
1,091
|
|
1,085
|
|
||||
|
Additional paid-in capital
|
802,124
|
|
784,725
|
|
||||
|
Retained earnings
|
1,888,002
|
|
1,806,488
|
|
||||
|
Treasury stock at cost, 56,369,752 and 50,495,378 shares in 2013 and 2012, respectively
|
(1,347,677
|
)
|
(1,130,268
|
)
|
||||
|
Accumulated other comprehensive income
|
11
|
|
2,028
|
|
||||
|
1,343,551
|
|
1,464,058
|
|
|||||
|
$
|
3,018,553
|
|
$
|
2,859,817
|
|
|||
See accompanying notes to consolidated financial statements.
45
RENT-A-CENTER, INC. AND SUBSIDIARIES
CONSOLIDATED STATEMENT OF STOCKHOLDERS’ EQUITY
For the Three Years Ended December 31,
2013
(In thousands)
|
|
Common Stock
|
Additional
Paid-In
Capital
|
Retained
Earnings
|
Treasury
Stock
|
Accumulated Other Comprehensive Income (Loss)
|
Total
|
|||||||||||||||||||||
|
|
Shares
|
Amount
|
|||||||||||||||||||||||||
|
Balance at January 1, 2011
|
105,991
|
|
$
|
1,060
|
|
$
|
712,600
|
|
$
|
1,538,325
|
|
$
|
(904,274
|
)
|
$
|
3,245
|
|
$
|
1,350,956
|
|
|||||||
|
Net earnings
|
—
|
|
—
|
|
—
|
|
163,464
|
|
—
|
|
—
|
|
163,464
|
|
|||||||||||||
|
Other comprehensive loss
|
—
|
|
—
|
|
—
|
|
—
|
|
—
|
|
(3,992
|
)
|
(3,992
|
)
|
|||||||||||||
|
Purchase of treasury stock (5,852 shares)
|
—
|
|
—
|
|
(116
|
)
|
—
|
|
(164,169
|
)
|
—
|
|
(164,285
|
)
|
|||||||||||||
|
Exercise of stock options
|
1,809
|
|
17
|
|
34,893
|
|
—
|
|
—
|
|
—
|
|
34,910
|
|
|||||||||||||
|
Excess tax benefit related to stock awards
|
—
|
|
—
|
|
7,036
|
|
—
|
|
—
|
|
—
|
|
7,036
|
|
|||||||||||||
|
Stock-based compensation
|
—
|
|
—
|
|
4,471
|
|
—
|
|
—
|
|
—
|
|
4,471
|
|
|||||||||||||
|
Dividends declared
|
—
|
|
—
|
|
—
|
|
(36,357
|
)
|
—
|
|
—
|
|
(36,357
|
)
|
|||||||||||||
|
Other
|
—
|
|
—
|
|
(951
|
)
|
(59
|
)
|
—
|
|
—
|
|
(1,010
|
)
|
|||||||||||||
|
Balance at December 31, 2011
|
107,800
|
|
1,077
|
|
757,933
|
|
1,665,373
|
|
(1,068,443
|
)
|
(747
|
)
|
1,355,193
|
|
|||||||||||||
|
Net earnings
|
—
|
|
—
|
|
—
|
|
181,703
|
|
—
|
|
—
|
|
181,703
|
|
|||||||||||||
|
Other comprehensive income
|
—
|
|
—
|
|
—
|
|
—
|
|
—
|
|
2,775
|
|
2,775
|
|
|||||||||||||
|
Purchase of treasury stock (1,798 shares)
|
—
|
|
—
|
|
(35
|
)
|
—
|
|
(61,825
|
)
|
—
|
|
(61,860
|
)
|
|||||||||||||
|
Exercise of stock options
|
604
|
|
7
|
|
14,113
|
|
—
|
|
—
|
|
—
|
|
14,120
|
|
|||||||||||||
|
Vesting of restricted share units
|
127
|
|
1
|
|
—
|
|
—
|
|
—
|
|
—
|
|
1
|
|
|||||||||||||
|
Excess tax benefit related to stock awards
|
—
|
|
—
|
|
4,348
|
|
—
|
|
—
|
|
—
|
|
4,348
|
|
|||||||||||||
|
Stock-based compensation
|
—
|
|
—
|
|
8,366
|
|
—
|
|
—
|
|
—
|
|
8,366
|
|
|||||||||||||
|
Dividends declared
|
—
|
|
—
|
|
—
|
|
(40,588
|
)
|
—
|
|
—
|
|
(40,588
|
)
|
|||||||||||||
|
Balance at December 31, 2012
|
108,531
|
|
1,085
|
|
784,725
|
|
1,806,488
|
|
(1,130,268
|
)
|
2,028
|
|
1,464,058
|
|
|||||||||||||
|
Net earnings
|
—
|
|
—
|
|
—
|
|
128,238
|
|
—
|
|
—
|
|
128,238
|
|
|||||||||||||
|
Other comprehensive loss
|
—
|
|
—
|
|
—
|
|
—
|
|
—
|
|
(2,017
|
)
|
(2,017
|
)
|
|||||||||||||
|
Purchase of treasury stock (5,874 shares)
|
—
|
|
—
|
|
(12
|
)
|
—
|
|
(217,409
|
)
|
—
|
|
(217,421
|
)
|
|||||||||||||
|
Exercise of stock options
|
479
|
|
5
|
|
11,927
|
|
—
|
|
—
|
|
—
|
|
11,932
|
|
|||||||||||||
|
Vesting of restricted share units
|
98
|
|
1
|
|
—
|
|
—
|
|
—
|
|
—
|
|
1
|
|
|||||||||||||
|
Excess tax benefit related to stock awards
|
—
|
|
—
|
|
(972
|
)
|
—
|
|
—
|
|
—
|
|
(972
|
)
|
|||||||||||||
|
Stock-based compensation
|
—
|
|
—
|
|
6,456
|
|
—
|
|
—
|
|
—
|
|
6,456
|
|
|||||||||||||
|
Dividends declared
|
—
|
|
—
|
|
—
|
|
(46,724
|
)
|
—
|
|
—
|
|
(46,724
|
)
|
|||||||||||||
|
Balance at December 31, 2013
|
109,108
|
|
$
|
1,091
|
|
$
|
802,124
|
|
$
|
1,888,002
|
|
$
|
(1,347,677
|
)
|
$
|
11
|
|
$
|
1,343,551
|
|
|||||||
See accompanying notes to consolidated financial statements.
46
RENT-A-CENTER, INC. AND SUBSIDIARIES
|
|
Year Ended December 31,
|
|||||||||||
|
|
2013
|
2012
|
2011
|
|||||||||
|
|
(In thousands)
|
|||||||||||
|
Cash flows from operating activities
|
||||||||||||
|
Net earnings
|
$
|
128,238
|
|
$
|
181,703
|
|
$
|
163,464
|
|
|||
|
Adjustments to reconcile net earnings to net cash provided by operating activities
|
||||||||||||
|
Depreciation of rental merchandise
|
655,591
|
|
622,261
|
|
556,945
|
|
||||||
|
Bad debt expense
|
14,589
|
|
12,953
|
|
14,227
|
|
||||||
|
Stock-based compensation expense
|
6,456
|
|
8,366
|
|
4,471
|
|
||||||
|
Depreciation of property assets
|
76,451
|
|
73,361
|
|
65,214
|
|
||||||
|
Loss on sale or disposal of property assets
|
1,499
|
|
465
|
|
2,237
|
|
||||||
|
Amortization of intangibles
|
3,559
|
|
4,668
|
|
4,285
|
|
||||||
|
Amortization of financing fees
|
3,191
|
|
2,765
|
|
2,344
|
|
||||||
|
Deferred income taxes
|
23,699
|
|
4,386
|
|
78,105
|
|
||||||
|
Excess tax benefit related to stock awards
|
(406
|
)
|
(4,348
|
)
|
(7,036
|
)
|
||||||
|
Restructuring charge
|
—
|
|
—
|
|
13,943
|
|
||||||
|
Impairment charge
|
—
|
|
—
|
|
7,320
|
|
||||||
|
Changes in operating assets and liabilities, net of effects of acquisitions
|
||||||||||||
|
Rental merchandise
|
(770,879
|
)
|
(686,247
|
)
|
(667,860
|
)
|
||||||
|
Receivables
|
(19,124
|
)
|
(13,370
|
)
|
(9,218
|
)
|
||||||
|
Prepaid expenses and other assets
|
(9,798
|
)
|
1,772
|
|
99,114
|
|
||||||
|
Accounts payable — trade
|
20,600
|
|
(5,498
|
)
|
(20,987
|
)
|
||||||
|
Accrued liabilities
|
676
|
|
14,661
|
|
(19,942
|
)
|
||||||
|
Net cash provided by operating activities
|
134,342
|
|
217,898
|
|
286,626
|
|
||||||
|
Cash flows from investing activities
|
||||||||||||
|
Purchase of property assets
|
(108,367
|
)
|
(102,453
|
)
|
(132,710
|
)
|
||||||
|
Proceeds from sale of property assets
|
19,973
|
|
4,984
|
|
208
|
|
||||||
|
Acquisitions of businesses
|
(41,236
|
)
|
(13,258
|
)
|
(26,747
|
)
|
||||||
|
Net cash used in investing activities
|
(129,630
|
)
|
(110,727
|
)
|
(159,249
|
)
|
||||||
|
Cash flows from financing activities
|
||||||||||||
|
Purchase of treasury stock
|
(217,421
|
)
|
(61,860
|
)
|
(164,169
|
)
|
||||||
|
Exercise of stock options
|
11,932
|
|
14,121
|
|
34,910
|
|
||||||
|
Excess tax benefit related to stock awards
|
406
|
|
4,348
|
|
7,036
|
|
||||||
|
Payments on capital leases
|
—
|
|
(27
|
)
|
(285
|
)
|
||||||
|
Proceeds from debt
|
908,145
|
|
606,570
|
|
982,825
|
|
||||||
|
Repayments of debt
|
(679,370
|
)
|
(659,745
|
)
|
(943,264
|
)
|
||||||
|
Dividends paid
|
(46,809
|
)
|
(37,866
|
)
|
(26,891
|
)
|
||||||
|
Net cash used in financing activities
|
(23,117
|
)
|
(134,459
|
)
|
(109,838
|
)
|
||||||
|
Effect of exchange rate changes on cash
|
(408
|
)
|
310
|
|
(201
|
)
|
||||||
|
NET (DECREASE) INCREASE IN CASH AND CASH EQUIVALENTS
|
(18,813
|
)
|
(26,978
|
)
|
17,338
|
|
||||||
|
Cash and cash equivalents at beginning of year
|
61,087
|
|
88,065
|
|
70,727
|
|
||||||
|
Cash and cash equivalents at end of year
|
$
|
42,274
|
|
$
|
61,087
|
|
$
|
88,065
|
|
|||
|
Supplemental cash flow information
|
||||||||||||
|
Cash paid during the year for:
|
||||||||||||
|
Interest
|
$
|
36,897
|
|
$
|
31,574
|
|
$
|
35,609
|
|
|||
|
Income taxes (excludes $2,426, $4,169 and $113,202 of income taxes refunded in 2013, 2012 and 2011, respectively)
|
$
|
52,255
|
|
$
|
88,873
|
|
$
|
10,522
|
|
|||
See accompanying notes to consolidated financial statements.
47
RENT-A-CENTER, INC. AND SUBSIDIARIES
NOTES TO CONSOLIDATED FINANCIAL STATEMENTS
Note A — Nature of Operations and Summary of Accounting Policies
A summary of the significant accounting policies consistently applied in the preparation of the accompanying consolidated financial statements follows:
Principles of Consolidation and Nature of Operations
These financial statements include the accounts of Rent-A-Center, Inc., and its direct and indirect subsidiaries. All intercompany accounts and transactions have been eliminated. Unless the context indicates otherwise, references to “Rent-A-Center” refer only to Rent-A-Center, Inc., the parent, and references to “we,” “us” and “our” refer to the consolidated business operations of Rent-A-Center and any or all of its direct and indirect subsidiaries. We report four operating segments: Core U.S., Acceptance Now (formerly reported as RAC Acceptance), International and Franchising (formerly reported as ColorTyme).
Our Core U.S. segment consists of company-owed rent-to-own stores that lease household durable goods to customers on a rent-to-own basis. We also offer merchandise on an installment sales basis in certain of our stores under the names “Get It Now” and “Home Choice.” At
December 31, 2013
, we operated
2,992
company-owned stores nationwide and in Puerto Rico, including
45
retail installment sales stores.
Our Acceptance Now segment generally offers the rent-to-own transaction to consumers who do not qualify for financing from the traditional retailer through kiosks located within such retailer's locations. At
December 31, 2013
, we operated
1,325
Acceptance Now locations.
Our International segment consists of our company-owned rent-to-own stores in Mexico and Canada that lease household durable goods to customers on a rent-to-own basis. Our stores in Canada operate under the name “Rent-A-Centre.” At
December 31, 2013
, we operated
151
stores in Mexico and we operated
18
stores in Canada.
Rent-A-Center Franchising International, Inc., (formerly ColorTyme, Inc.), an indirect wholly-owned subsidiary of Rent-A-Center, is a franchisor of rent-to-own stores. At
December 31, 2013
, Franchising had
179
franchised stores operating in
30
states. Our Franchising segment's primary source of revenue is the sale of rental merchandise to its franchisees, who in turn offer the merchandise to the general public for rent or purchase under a rent-to-own transaction. The balance of our Franchising segment's revenue is generated primarily from royalties based on franchisees' monthly gross revenues.
Rental Merchandise
Rental merchandise is carried at cost, net of accumulated depreciation. Depreciation for merchandise is generally provided using the income forecasting method, which is intended to match as closely as practicable the recognition of depreciation expense with the consumption of the rental merchandise, and assumes no salvage value. The consumption of rental merchandise occurs during periods of rental and directly coincides with the receipt of rental revenue over the rental purchase agreement period. Under the income forecasting method, merchandise held for rent is not depreciated and merchandise on rent is depreciated in the proportion of rents received to total rents provided in the rental contract, which is an activity-based method similar to the units of production method. Effective January 1, 2013, we depreciate merchandise (including computers and tablets) that is held for rent for at least
180
consecutive days using the straight-line method over a period generally not to exceed
18 months
. Prior to January 1, 2013, merchandise held for rent (except for computers and tablets) that was at least
270 days
old and held for rent for at least
180
consecutive days, was depreciated using the straight-line method over a period generally not to exceed
20 months
. Prior to January 1, 2013, the straight-line method was used for computers and tablets that were
24 months
old or older and which had become idle over a period of at least
six months
, generally not to exceed an aggregate depreciation period of
30 months
. This change has not had a significant impact on cost of revenues, gross profit, net earnings or earnings per share.
Rental merchandise which is damaged and inoperable is expensed when such impairment occurs. If a customer does not return the merchandise or make payment, the remaining book value of the rental merchandise associated with delinquent accounts is generally charged off on the
90
th
day following the time the account became past due in the Core U.S. and International segments, and on the
150
th
day in the Acceptance Now segment. We maintain a reserve for these expected expenses. In addition, any minor repairs made to rental merchandise are expensed at the time of the repair.
Cash Equivalents
Cash equivalents include all highly liquid investments with an original maturity of three months or less. We maintain cash and cash equivalents at several financial institutions, which at times may not be federally insured or may exceed federally insured limits. We have not experienced any losses in such accounts and believe we are not exposed to any significant credit risks on such accounts.
48
RENT-A-CENTER, INC. AND SUBSIDIARIES
NOTES TO CONSOLIDATED FINANCIAL STATEMENTS — (Continued)
Revenues
Merchandise is rented to customers pursuant to rental purchase agreements which provide for weekly, semi-monthly or monthly rental terms with non-refundable rental payments. Generally, the customer has the right to acquire title either through a purchase option or through payment of all required rentals. Rental revenue and fees are recognized over the rental term and merchandise sales revenue is recognized when the customer exercises the purchase option and pays the cash price due. Cash received prior to the period in which it should be recognized is deferred and recognized according to the rental term. Revenue is accrued for uncollected amounts due based on historical collection experience. However, the total amount of the rental purchase agreement is not accrued because the customer can terminate the rental agreement at any time and we cannot enforce collection for non-payment of future rents.
Revenues from the sale of merchandise in our retail installment stores are recognized when the installment note is signed, the customer has taken possession of the merchandise and collectability is reasonably assured.
Revenues from the sale of rental merchandise are recognized upon shipment of the merchandise to the franchisee. Franchise royalty income and fee revenue is recognized upon completion of substantially all services and satisfaction of all material conditions required under the terms of the franchise agreement.
Receivables and Allowance for Doubtful Accounts
The receivable associated with the sale of merchandise at our Get It Now and Home Choice stores generally consists of the sales price of the merchandise purchased and any additional fees for services the customer has chosen, less the customer’s down payment. No interest is accrued and interest income is recognized each time a customer makes a payment, generally on a monthly basis.
We have established an allowance for doubtful accounts for our installment notes receivable. Our policy for determining the allowance is based on historical loss experience, as well as the results of management’s review and analysis of the payment and collection of the installment notes receivable within the previous year. We believe our allowance is adequate to absorb any known or probable losses. Our policy is to charge off installment notes receivable that are
120 days
or more past due. Charge offs are applied as a reduction to the allowance for doubtful accounts and any recoveries of previously charged off balances are applied as an increase to the allowance for doubtful accounts.
The majority of Franchising’s accounts receivable relate to amounts due from franchisees. Credit is extended based on an evaluation of a franchisee’s financial condition and collateral is generally not required. Accounts receivable are due within
30 days
and are stated at amounts due from franchisees net of an allowance for doubtful accounts. Accounts that are outstanding longer than the contractual payment terms are considered past due. Franchising determines its allowance by considering a number of factors, including the length of time trade accounts receivable are past due, Franchising’s previous loss history, the franchisee’s current ability to pay its obligation to Franchising, and the condition of the general economy and the industry as a whole. Franchising writes off accounts receivable that are
120 days
or more past due and payments subsequently received on such receivables are credited to the allowance for doubtful accounts.
Property Assets and Related Depreciation
Furniture, equipment and vehicles are stated at cost less accumulated depreciation. Depreciation is provided over the estimated useful lives of the respective assets (generally five years) by the straight-line method. Our building is depreciated over approximately 40 years. Leasehold improvements are amortized over the useful life of the asset or the initial term of the applicable leases by the straight-line method, whichever is shorter.
We have incurred costs to develop computer software for internal use. We capitalize the costs incurred during the application development stage, which includes designing the software configuration and interfaces, coding, installation, and testing. Costs incurred during the preliminary stages along with post-implementation stages of internally developed software are expensed as incurred. Internally developed software costs, once placed in service, are amortized over various periods up to ten years.
We incur repair and maintenance expenses on our vehicles and equipment. These amounts are recognized when incurred, unless such repairs significantly extend the life of the asset, in which case we amortize the cost of the repairs for the remaining life of the asset utilizing the straight-line method.
49
RENT-A-CENTER, INC. AND SUBSIDIARIES
NOTES TO CONSOLIDATED FINANCIAL STATEMENTS — (Continued)
Intangible Assets and Amortization
We record goodwill when the consideration paid for an acquisition exceeds the fair value of the identifiable net tangible and identifiable intangible assets acquired. Goodwill is not subject to amortization but must be periodically evaluated for impairment. Impairment occurs when the carrying value of goodwill is not recoverable from future cash flows. We perform an assessment of goodwill for impairment at the reporting unit level annually as of December 31 of each year, or when events or circumstances indicate that impairment may have occurred. Our reporting units are generally our reportable operating segments. Factors which could necessitate an interim impairment assessment include a sustained decline in our stock price, prolonged negative industry or economic trends and significant underperformance relative to expected historical or projected future operating results. We assess recoverability using methodologies which include the present value of estimated future cash flows and comparisons of multiples of enterprise values to earnings before interest, taxes, depreciation and amortization. The analysis is based upon available information regarding expected future cash flows and discount rates. Discount rates are based upon our cost of capital. If the carrying value exceeds the discounted fair value, a second analysis is performed to measure the fair value of all assets and liabilities. If, based on the second analysis, it is determined that the fair value of the assets and liabilities is less than the carrying value, we would recognize impairment charges in an amount equal to the excess of the carrying value over fair value. During the years ended December 31, 2013 and 2012, we recorded goodwill impairment charges of
$1.1 million
and
$1.0 million
, respectively, in our International segment as a result of the sustained underperformance of certain stores located in Canada. These charges are included in amortization and write-down of intangibles in the consolidated statements of earnings. There were no impairment charges recognized related to goodwill in
2011
.
Accounting for Impairment of Long-Lived Assets
We evaluate all long-lived assets, including intangible assets, excluding goodwill, for impairment whenever events or changes in circumstances indicate that the carrying amounts may not be recoverable. Impairment is recognized when the carrying amounts of such assets cannot be recovered by the undiscounted net cash flows they will generate.
Self-Insurance Liabilities
We have self-insured retentions with respect to losses under our workers' compensation, general liability and vehicle liability insurance policies. We establish reserves for our liabilities associated with these losses by obtaining forecasts for the ultimate expected losses and estimating amounts needed to pay losses within our self-insured retentions. We make assumptions on our liabilities within our self-insured retentions using actuarial loss forecasts, company-specific development factors, general industry loss development factors, and third-party claim administrator loss estimates which are based on known facts surrounding individual claims. These assumptions incorporate expected increases in health care costs. Periodically, we reevaluate our estimate of liability within our self-insured retentions. At that time, we evaluate the adequacy of our reserves by comparing amounts reserved on our balance sheet for anticipated losses to our updated actuarial loss forecasts and third-party claim administrator loss estimates, and make adjustments to our reserves as needed.
Foreign Currency Translation
The functional currency of our foreign operations is predominantly the applicable local currency. Assets and liabilities denominated in a foreign currency are translated into U.S. dollars at the current rate of exchange on the last day of the reporting period. Revenues and expenses are generally translated at a daily exchange rate and equity transactions are translated using the actual rate on the day of the transaction.
Other Comprehensive Income
Other comprehensive income is comprised exclusively of our foreign currency translation adjustment.
Income Taxes
We record deferred taxes for temporary differences between the tax and financial reporting bases of assets and liabilities at the enacted tax rate expected to be in effect when taxes become payable. Income tax accounting requires management to make estimates and apply judgments to events that will be recognized in one period under rules that apply to financial reporting in a different period in our tax returns. In particular, judgment is required when estimating the value of future tax deductions, tax credits and net operating loss carryforwards (NOLs), as represented by deferred tax assets. We evaluate the recoverability of these future tax deductions and credits by assessing the future expected taxable income from all sources, including reversal of taxable temporary differences, forecasted operating earnings and available tax planning strategies. These sources of income rely heavily on estimates. We use our historical experience and our short- and long-range business forecasts to provide insight and assist us in determining recoverability. When it is determined the recovery of all or a portion of a deferred tax asset is not likely, a valuation allowance is
50
RENT-A-CENTER, INC. AND SUBSIDIARIES
NOTES TO CONSOLIDATED FINANCIAL STATEMENTS — (Continued)
established. We include NOLs in the calculation of deferred tax assets. NOLs are utilized to the extent allowable due to the provisions of the Internal Revenue Code of 1986, as amended, and relevant state statutes.
We recognize the financial statement benefit of a tax position only after determining that the relevant tax authority would more likely than not sustain the position following an audit. For tax positions meeting the more likely-than-not threshold, the amount recognized in the financial statements is the largest benefit that has a greater than 50 percent likelihood of being realized upon the ultimate settlement with the relevant tax authority. A number of years may elapse before a particular matter, for which we have recorded a liability, is audited and effectively settled. We review our tax positions quarterly and adjust the balance as new information becomes available. We classify interest accrued related to unrecognized tax benefits as interest expense.
We intend to reinvest substantially all of the unremitted earnings of our non-U.S. subsidiaries and postpone their remittance indefinitely. Accordingly, no provision for U.S. income taxes for these non-U.S. subsidiaries was recorded in the accompanying Consolidated Statements of Earnings.
Sales Taxes
We apply the net basis for sales taxes imposed on our goods and services in our consolidated statements of earnings. We are required by the applicable governmental authorities to collect and remit sales taxes. Accordingly, such amounts are charged to the customer, collected and remitted directly to the appropriate jurisdictional entity.
Earnings Per Common Share
Basic earnings per common share are based upon the weighted average number of common shares outstanding during each period presented. Diluted earnings per common share are based upon the weighted average number of common shares outstanding during the period, plus, if dilutive, the assumed exercise of stock options at the beginning of the year, or for the period outstanding during the year for current year issuances.
Advertising Costs
Costs incurred for producing and communicating advertising are expensed when incurred. Advertising expense was
$92.6 million
,
$97.3 million
and
$92.8 million
, for the years ended
December 31, 2013
,
2012
and
2011
, respectively.
Stock-Based Compensation
We maintain long-term incentive plans for the benefit of certain employees, consultants and directors, which are described more fully in Note L. We recognize share-based payment awards to our employees and directors at the estimated fair value on the grant date. Determining the fair value of any share-based award requires information about several variables that include, but are not limited to, expected stock volatility over the terms of the award, expected dividend yields and the predicted employee exercise behavior. We base expected life on historical exercise and post-vesting employment-termination experience, and expected volatility on historical realized volatility trends. In addition, all stock-based compensation expense is recorded net of an estimated forfeiture rate. The forfeiture rate is based upon historical activity and is analyzed at least annually as actual forfeitures occur. Compensation costs are recognized net of estimated forfeitures over the requisite service period on a straight-line basis. We issue new shares to settle stock awards. Stock options are valued using a Black-Scholes pricing model. Restricted stock units are valued using the last trade before the day of the grant, adjusted for any provisions affecting fair value, such as the lack of dividends or dividend equivalents during the vesting period.
We revised the 2011 consolidated statements of earnings to classify stock-based compensation received by employees above the district manager level that was previously reported within salaries and other expenses to general and administrative expenses to conform to the 2013 and 2012 presentation. This reclassification resulted in a decrease in salaries and other expenses of
$4.5 million
for the year ended December 31, 2011, with a corresponding increase to general and administrative expenses. This reclassification had no impact on net earnings or earnings per share for 2011.
Reclassifications
Certain reclassifications have been made to the reported amounts for the prior periods to conform to the current period presentation. These reclassifications had no impact on net earnings or earnings per share in any period.
51
RENT-A-CENTER, INC. AND SUBSIDIARIES
NOTES TO CONSOLIDATED FINANCIAL STATEMENTS — (Continued)
Use of Estimates
In preparing financial statements in conformity with accounting principles generally accepted in the United States of America, we are required to make estimates and assumptions that affect the reported amounts of assets and liabilities, the disclosure of contingent losses and liabilities at the date of the financial statements, and the reported amounts of revenues and expenses during the reporting period. In applying accounting principles, we must often make individual estimates and assumptions regarding expected outcomes or uncertainties. Our estimates, judgments and assumptions are continually evaluated based on available information and experience. Because of the use of estimates inherent in the financial reporting process, actual results could differ from those estimates.
New Accounting Pronouncements
In July 2013, the Financial Accounting Standards Board ("FASB") issued Accounting Standards Update ("ASU") 2013-11,
Presentation of Unrecognized Tax Benefit When a Net Operating Loss Carryforward, a Similar Tax Loss, or a Tax Credit Carryforward Exists,
an amendment to FASB Accounting Standards Codification Topic 740,
Income Taxes
. This update clarifies that an unrecognized tax benefit, or a portion of an unrecognized tax benefit, should be presented in the financial statements as a reduction to a deferred tax asset for a net operating loss carryforward, a similar tax loss, or a tax credit carryforward if such settlement is required or expected in the event the uncertain tax position is disallowed. In situations where a net operating loss carryforward, a similar tax loss, or a tax credit carryforward is not available at the reporting date under the tax law of the applicable jurisdiction or the tax law of the jurisdiction does not require, and the entity does not intend to use the deferred tax asset for such purpose, the unrecognized tax benefit should be presented in the financial statements as a liability and should not be combined with deferred tax assets. This ASU is effective prospectively for fiscal years, and interim periods within those years, beginning after December 15, 2013. Both early adoption and retrospective application are permitted, and we will adopt this standard prospectively on January 1, 2014. This standard will not have a material impact on our consolidated statement of earnings, financial condition, statement of cash flows or earnings per share.
From time to time, new accounting pronouncements are issued by the FASB or other standards setting bodies that we adopt as of the specified effective date. Unless otherwise discussed, we believe the impact of any other recently issued standards that are not yet effective are either not applicable to us at this time or will not have a material impact on our consolidated financial statements upon adoption.
Note B — Correction of Immaterial Errors
During the fourth quarter of 2013, we identified errors in accounting for our estimates for rental merchandise reserves and for the allowance for doubtful accounts, resulting in an immaterial overstatement of on rent merchandise and understatements of held for rent merchandise and receivables which affected periods beginning prior to 2011 through December 31, 2013. In accordance with Staff Accounting Bulletin (SAB) No. 99,
Materiality
, and SAB No. 108,
Considering the Effects of Prior Year Misstatements when Quantifying Misstatements in Current Year Financial Statements
, management evaluated the materiality of the errors from qualitative and quantitative perspectives, and concluded the errors were immaterial to the prior periods. The errors resulted in an overstatement of on rent merchandise of
$14.5 million
, an understatement of held for rent merchandise of
$1.2 million
and an understatement of receivables of
$4.0 million
, respectively, at December 31, 2012. The errors resulted in an understatement of salaries and other expenses of
$2.8 million
and
$1.8 million
for the years ended December 31, 2012 and 2011, respectively, and
$0.5 million
,
$0.2 million
and
$0.8 million
for the three-month periods ended March 31, 2013, June 30, 2013, and September 30, 2013, respectively. The understatement of salaries and other expenses discussed above, adjusted for the related income tax expense impact, resulted in an overstatement of net earnings of
$1.8 million
and
$1.2 million
for the years ended December 31, 2012 and 2011, respectively, and
$0.3 million
,
$0.1 million
and
$0.5 million
for the three-month periods ended March 31, 2013, June 30, 2013, and September 30, 2013, respectively.
Due to the immaterial nature of the error correction, we revised our historical financial statements based on the amounts discussed above for 2011 and 2012 herein, and will revise the quarters within 2013 when they are published in future filings. We recognized the cumulative effect of the errors in periods prior to those that are presented herein by decreasing retained earnings by
$3.0 million
as of January 1, 2011.
52
RENT-A-CENTER, INC. AND SUBSIDIARIES
NOTES TO CONSOLIDATED FINANCIAL STATEMENTS — (Continued)
Note C — Receivables and Allowance for Doubtful Accounts
Receivables consist of the following:
|
|
December 31,
|
|||||||
|
|
2013
|
2012
|
||||||
|
|
(In thousands)
|
|||||||
|
Installment sales receivable
|
$
|
51,335
|
|
$
|
46,753
|
|
||
|
Trade and notes receivables
|
11,051
|
|
8,986
|
|
||||
|
Total
|
62,386
|
|
55,739
|
|
||||
|
Less allowance for doubtful accounts
|
(3,700
|
)
|
(2,920
|
)
|
||||
|
Net receivables
|
$
|
58,686
|
|
$
|
52,819
|
|
||
The allowance for doubtful accounts related to installment sales receivable was
$2.9 million
and
$2.3 million
, and the allowance for doubtful accounts related to trade receivables was
$0.8 million
and
$0.6 million
at
December 31, 2013
and
2012
, respectively.
Changes in our allowance for doubtful accounts are as follows:
|
|
Year Ended December 31,
|
|||||||||||
|
|
2013
|
2012
|
2011
|
|||||||||
|
|
(In thousands)
|
|||||||||||
|
Beginning balance
|
$
|
2,920
|
|
$
|
3,919
|
|
$
|
5,152
|
|
|||
|
Bad debt expense
|
14,589
|
|
12,953
|
|
14,227
|
|
||||||
|
Accounts written off
|
(18,348
|
)
|
(17,432
|
)
|
(19,769
|
)
|
||||||
|
Recoveries
|
4,539
|
|
3,480
|
|
4,309
|
|
||||||
|
Ending balance
|
$
|
3,700
|
|
$
|
2,920
|
|
$
|
3,919
|
|
|||
Note D — Rental Merchandise
|
|
December 31,
|
|||||||
|
|
2013
|
2012
|
||||||
|
|
(In thousands)
|
|||||||
|
On rent
|
||||||||
|
Cost
|
$
|
1,463,636
|
|
$
|
1,294,966
|
|
||
|
Less accumulated depreciation
|
(549,018
|
)
|
(487,569
|
)
|
||||
|
Net book value, on rent
|
$
|
914,618
|
|
$
|
807,397
|
|
||
|
Held for rent
|
||||||||
|
Cost
|
$
|
271,193
|
|
$
|
251,598
|
|
||
|
Less accumulated depreciation
|
(60,743
|
)
|
(51,476
|
)
|
||||
|
Net book value, held for rent
|
$
|
210,450
|
|
$
|
200,122
|
|
||
53
RENT-A-CENTER, INC. AND SUBSIDIARIES
NOTES TO CONSOLIDATED FINANCIAL STATEMENTS — (Continued)
Note E — Property Assets
|
|
December 31,
|
|||||||
|
|
2013
|
2012
|
||||||
|
|
(In thousands)
|
|||||||
|
Furniture and equipment
|
$
|
332,607
|
|
$
|
316,696
|
|
||
|
Transportation equipment
|
11,957
|
|
12,204
|
|
||||
|
Building and leasehold improvements
|
325,597
|
|
311,782
|
|
||||
|
Land and land improvements
|
6,853
|
|
5,299
|
|
||||
|
Construction in progress
|
93,419
|
|
61,858
|
|
||||
|
770,433
|
|
707,839
|
|
|||||
|
Less accumulated depreciation
|
(433,935
|
)
|
(398,039
|
)
|
||||
|
$
|
336,498
|
|
$
|
309,800
|
|
|||
We had
$86.3 million
and
$54.8 million
of capitalized software costs included in construction in progress at
December 31, 2013
, and
2012
respectively. For the years ended
December 31, 2013
,
2012
and
2011
, we placed in service internally developed software of approximately
$4.6 million
,
$8.4 million
and
$16.0 million
, respectively.
Note F — Intangible Assets and Acquisitions
Intangible Assets
Amortizable intangible assets consist of the following (in thousands):
|
|
|
December 31, 2013
|
December 31, 2012
|
|||||||||||||||
|
|
Avg.
Life
(years)
|
Gross
Carrying
Amount
|
Accumulated
Amortization
|
Gross
Carrying
Amount
|
Accumulated
Amortization
|
|||||||||||||
|
Non-compete agreements
|
3
|
$
|
6,337
|
|
$
|
6,102
|
|
$
|
6,104
|
|
$
|
6,098
|
|
|||||
|
Customer relationships
|
2
|
74,799
|
|
71,899
|
|
71,816
|
|
70,001
|
|
|||||||||
|
Vendor relationships
|
11
|
7,538
|
|
1,704
|
|
7,538
|
|
1,136
|
|
|||||||||
|
Total
|
$
|
88,674
|
|
$
|
79,705
|
|
$
|
85,458
|
|
$
|
77,235
|
|
||||||
Aggregate amortization expense (in thousands):
|
Year Ended December 31, 2013
|
$
|
3,559
|
|
|
Year Ended December 31, 2012
|
$
|
4,668
|
|
|
Year Ended December 31, 2011
|
$
|
4,285
|
|
Estimated amortization expense, assuming current intangible balances and no new acquisitions, for each of the years ending December 31, is as follows (in thousands):
|
|
Estimated
Amortization Expense
|
||
|
2014
|
$
|
2,704
|
|
|
2015
|
1,491
|
|
|
|
2016
|
644
|
|
|
|
2017
|
568
|
|
|
|
2018
|
445
|
|
|
|
Thereafter
|
3,117
|
|
|
|
$
|
8,969
|
|
|
At
December 31, 2013
, the amount of goodwill allocated to the Core U.S. and Acceptance Now segments was approximately
54
RENT-A-CENTER, INC. AND SUBSIDIARIES
NOTES TO CONSOLIDATED FINANCIAL STATEMENTS — (Continued)
$1,310.1 million
and
$54.4 million
, respectively. At
December 31, 2012
, the amount of goodwill allocated to the Core U.S., Acceptance Now and International segments was approximately
$1,289.2 million
,
$54.4 million
, and
$1.1 million
, respectively.
During the years ended December 31, 2013 and 2012, we recorded goodwill impairment charges of
$1.1 million
and
$1.0 million
, respectively, in our International segment as a result of the sustained underperformance of certain stores located in Canada. These charges are included in amortization and write-down of intangibles in the consolidated statements of earnings.
A summary of the changes in recorded goodwill follows (in thousands):
|
|
Year Ended December 31,
|
|||||||
|
|
2013
|
2012
|
||||||
|
Gross balance as of January 1,
|
$
|
1,344,665
|
|
$
|
1,339,125
|
|
||
|
Additions from acquisitions
|
28,282
|
|
6,874
|
|
||||
|
Goodwill impairments and write-offs related to stores sold or closed
|
(9,038
|
)
|
(1,221
|
)
|
||||
|
Post purchase price allocation adjustments
|
640
|
|
(113
|
)
|
||||
|
Balance as of the end of the period
|
$
|
1,364,549
|
|
$
|
1,344,665
|
|
||
Acquisitions
The following table provides information concerning the acquisitions made during the years ended
December 31, 2013
,
2012
and
2011
.
|
|
Year Ended December 31,
|
|||||||||||
|
|
2013
|
2012
|
2011
|
|||||||||
|
|
(Dollar amounts in thousands)
|
|||||||||||
|
Number of stores acquired remaining open
|
47
|
|
6
|
|
26
|
|
||||||
|
Number of stores acquired that were merged with existing stores
|
38
|
|
31
|
|
71
|
|
||||||
|
Number of kiosk locations acquired
|
—
|
|
—
|
|
5
|
|
||||||
|
Number of transactions
|
47
|
|
19
|
|
19
|
|
||||||
|
Total purchase price
|
$
|
41,236
|
|
$
|
13,258
|
|
$
|
26,747
|
|
|||
|
Amounts allocated to:
|
||||||||||||
|
Goodwill
|
$
|
28,282
|
|
$
|
6,874
|
|
$
|
18,755
|
|
|||
|
Non-compete agreements
|
235
|
|
—
|
|
10
|
|
||||||
|
Customer relationships
|
2,959
|
|
1,160
|
|
2,843
|
|
||||||
|
Rental merchandise
|
11,843
|
|
4,380
|
|
6,023
|
|
||||||
|
Property and other assets
|
910
|
|
845
|
|
—
|
|
||||||
|
Liabilities assumed
|
—
|
|
—
|
|
(884
|
)
|
||||||
Purchase prices are determined by evaluating the average monthly rental income of the acquired stores and applying a multiple to the total for rent-to-own store acquisitions. Acquired customer relationships are amortized utilizing the straight-line method over a
21
month period, non-compete agreements are amortized using the straight-line method over the contractual life of the agreements, vendor relationships are amortized using the straight-line method over a
7
or
15
year period, other intangible assets are amortized using the straight-line method over the life of the asset and goodwill associated with acquisitions is not amortized. The weighted average amortization period was approximately
22 months
for intangible assets added during the year ended
December 31, 2013
. Additions to goodwill due to acquisitions in
2013
were tax deductible.
All acquisitions have been accounted for as asset purchases, and the operating results of the acquired stores and accounts have been included in the financial statements since their date of acquisition.
Our
$750.0 million
senior credit facilities consist of a
$250.0 million
, five-year term loan and a
$500.0 million
, five-year revolving credit facility.
55
RENT-A-CENTER, INC. AND SUBSIDIARIES
NOTES TO CONSOLIDATED FINANCIAL STATEMENTS — (Continued)
The debt facilities as of
December 31, 2013
and
2012
are as follows:
|
|
|
December 31, 2013
|
December 31, 2012
|
|||||||||||||||||||||||
|
|
Facility
Maturity
|
Maximum
Facility
|
Amount
Outstanding
|
Amount
Available
|
Maximum
Facility
|
Amount
Outstanding
|
Amount
Available
|
|||||||||||||||||||
|
|
(In thousands)
|
|||||||||||||||||||||||||
|
Senior Credit Facilities:
|
||||||||||||||||||||||||||
|
Term Loan
|
July 14, 2016
|
$
|
250,000
|
|
$
|
187,500
|
|
$
|
—
|
|
$
|
250,000
|
|
$
|
212,500
|
|
$
|
—
|
|
|||||||
|
Revolving Facility
|
July 14, 2016
|
500,000
|
|
160,500
|
|
234,830
|
|
500,000
|
|
175,000
|
|
215,405
|
|
|||||||||||||
|
750,000
|
|
348,000
|
|
234,830
|
|
750,000
|
|
387,500
|
|
215,405
|
|
|||||||||||||||
|
Other Indebtedness:
|
||||||||||||||||||||||||||
|
Line of credit
|
20,000
|
|
18,275
|
|
1,725
|
|
20,000
|
|
—
|
|
20,000
|
|
||||||||||||||
|
Total
|
$
|
770,000
|
|
$
|
366,275
|
|
$
|
236,555
|
|
$
|
770,000
|
|
$
|
387,500
|
|
$
|
235,405
|
|
||||||||
The full amount of the revolving credit facility may be used for the issuance of letters of credit. At
December 31, 2013
and
2012
, the amounts available under the revolving credit facility were reduced by approximately
$104.7 million
and
$109.6 million
, respectively, for our outstanding letters of credit.
Borrowings under our senior credit facility accrue interest at varying rates equal to, at our election, either (y) the
prime rate
plus
0.50%
to
1.50%
; or (z) the
Eurodollar rate
plus
1.50%
to
2.50%
. Interest periods range from seven days (for borrowings under the revolving credit facility only) to one, two, three or six months, at our election. The margins on the Eurodollar rate and on the prime rate, which were
2.25%
and
1.25%
respectively, at
December 31, 2013
, may fluctuate dependent upon an increase or decrease in our consolidated leverage ratio as defined by a pricing grid included in the amended credit agreement, and the weighted average margins for the year ended
December 31, 2013
, were
2.08%
and
1.08%
, respectively. We have not entered into any interest rate protection agreements with respect to term loans under our senior credit facilities. A commitment fee equal to
0.30%
to
0.50%
of the average daily amount of the available revolving commitment is payable quarterly.
Our senior credit facilities are secured by a security interest in substantially all of our tangible and intangible assets, including intellectual property. Our senior credit facilities are also secured by a pledge of the capital stock of our wholly-owned U.S. subsidiaries (other than certain specified subsidiaries).
Our senior credit facilities contain, without limitation, covenants that generally limit our ability to:
|
•
|
incur additional debt in excess of
$250.0 million
at any one time outstanding (other than subordinated debt, which is generally permitted if the maturity date is later than July 14, 2017);
|
|
•
|
repurchase our capital stock and 6.625% notes and 4.75% notes and pay cash dividends in the event the pro forma senior leverage ratio is greater than
2.50
x (on February 20, 2014, we obtained a waiver from the lenders under our senior credit facilities to permit the declaration and payment of a cash dividend with respect to the second quarter of 2014);
|
|
•
|
incur liens or other encumbrances;
|
|
•
|
merge, consolidate or sell substantially all our property or business;
|
|
•
|
sell assets, other than inventory, in the ordinary course of business;
|
|
•
|
make investments or acquisitions unless we meet financial tests and other requirements;
|
|
•
|
make capital expenditures in the event the pro forma consolidated leverage ratio is greater than
2.75
x; or
|
|
•
|
enter into an unrelated line of business.
|
56
RENT-A-CENTER, INC. AND SUBSIDIARIES
NOTES TO CONSOLIDATED FINANCIAL STATEMENTS — (Continued)
Our senior credit facilities require us to comply with several financial covenants. The table below shows the required and actual ratios under our credit facilities calculated as of
December 31, 2013
:
|
|
Required Ratio
|
Actual Ratio
|
|||
|
Maximum consolidated leverage ratio
|
No greater than
|
3.25:1
|
2.64:1
|
||
|
Minimum fixed charge coverage ratio
|
No less than
|
1.35:1
|
1.38:1
|
||
These financial covenants, as well as the related components of their computation, are defined in the amended and restated credit agreement governing our senior credit facility, which is included as an exhibit to our Current Report on Form 8-K dated as of July 14, 2011. In accordance with the credit agreement, the maximum consolidated leverage ratio was calculated by dividing the consolidated funded debt outstanding at
December 31, 2013
(
$880.7 million
) by consolidated EBITDA for the 12-month period ending
December 31, 2013
(
$334.1 million
). For purposes of the covenant calculation, (i) “consolidated funded debt” is defined as outstanding indebtedness less cash in excess of
$25.0 million
, and (ii) “consolidated EBITDA” is generally defined as consolidated net income (a) plus the sum of income taxes, interest expense, depreciation and amortization expense, extraordinary non-cash expenses or losses, and other non-cash charges, and (b) minus the sum of interest income, extraordinary income or gains, other non-cash income, and cash payments with respect to extraordinary non-cash expenses or losses recorded in prior fiscal quarters. Consolidated EBITDA is a non-GAAP financial measure that is presented not as a measure of operating results, but rather as a measure used to determine covenant compliance under our senior credit facilities.
The minimum fixed charge coverage ratio was calculated pursuant to the credit agreement by dividing consolidated EBITDA for the 12-month period ending
December 31, 2013
, as adjusted for certain capital expenditures (
$485.1 million
), by consolidated fixed charges for the 12-month period ending
December 31, 2013
(
$351.5 million
). For purposes of the covenant calculation, “consolidated fixed charges” is defined as the sum of interest expense, lease expense, cash dividends, and mandatory debt repayments.
Events of default under our senior credit facilities include customary events, such as a cross-acceleration provision in the event that we default on other debt. In addition, an event of default under the senior credit facility would occur if a change of control occurs. This is defined to include the case where a third party becomes the beneficial owner of
35%
or more of our voting stock or certain changes in Rent-A-Center’s Board of Directors occurs. An event of default would also occur if one or more judgments were entered against us of
$50.0 million
or more and such judgments were not satisfied or bonded pending appeal within
30
days after entry.
We utilize our revolving credit facility for the issuance of letters of credit, as well as to manage normal fluctuations in operational cash flow caused by the timing of cash receipts. In that regard, we may from time to time draw funds under the revolving credit facility for general corporate purposes. The funds drawn on individual occasions have varied in amounts of up to
$100.0 million
, which occurred at the date we refinanced our senior secured debt, with total amounts outstanding ranging up to
$221.0 million
. Amounts are drawn as needed due to the timing of cash flows and are generally paid down as cash is generated by our operating activities.
The table below shows the scheduled maturity dates of our senior debt outstanding at
December 31, 2013
.
|
Year Ending December 31,
|
(In thousands)
|
||
|
2014
|
$
|
43,275
|
|
|
2015
|
25,000
|
|
|
|
2016
|
298,000
|
|
|
|
$
|
366,275
|
|
|
57
RENT-A-CENTER, INC. AND SUBSIDIARIES
NOTES TO CONSOLIDATED FINANCIAL STATEMENTS — (Continued)
Note H — Subsidiary Guarantors
–
Senior Notes
On November 2, 2010, we issued
$300.0 million
in senior unsecured notes due November 2020, bearing interest at
6.625%
, pursuant to an indenture dated November 2, 2010, among Rent-A-Center, Inc., its subsidiary guarantors and The Bank of New York Mellon Trust Company, as trustee. A portion of the proceeds of this offering were used to repay approximately $200.0 million of outstanding term debt under our senior credit facility. The remaining net proceeds were used to repurchase shares of our common stock.
On May 2, 2013, we issued
$250.0 million
in senior unsecured notes due May 2021, bearing interest at
4.750%
, pursuant to an indenture dated May 2, 2013, among Rent-A-Center, Inc., its subsidiary guarantors and The Bank of New York Mellon Trust Company, as trustee. A portion of the proceeds of this offering were used to repurchase shares of our common stock under a $200.0 million accelerated stock buyback program. The remaining net proceeds were used to repay outstanding revolving debt under our senior credit facility.
The indenture governing the 6.625% notes and the 4.75% notes are substantially similar. Each indenture contains covenants that limit our ability to:
|
•
|
incur additional debt;
|
|
•
|
sell assets or our subsidiaries;
|
|
•
|
grant liens to third parties;
|
|
•
|
pay cash dividends or repurchase stock (subject to a restricted payments basket under which approximately
$75 million
is available); and
|
|
•
|
engage in a merger or sell substantially all of our assets.
|
Events of default under each indenture include customary events, such as a cross-acceleration provision in the event that we default in the payment of other debt due at maturity or upon acceleration for default in an amount exceeding $50.0 million, as well as in the event a judgment is entered against us in excess of $50.0 million that is not discharged, bonded or insured.
The 6.625% notes may be redeemed on or after November 15, 2015, at our option, in whole or in part, at a premium declining from
103.313%
. The 6.625% notes may be redeemed on or after November 15, 2018, at our option, in whole or in part, at par. The 6.625% notes also require that upon the occurrence of a change of control (as defined in the 2010 indenture), the holders of the notes have the right to require us to repurchase the notes at a price equal to 101% of the original aggregate principal amount, together with accrued and unpaid interest, if any, to the date of repurchase.
The 4.75% notes may be redeemed on or after May 1, 2016, at our option, in whole or in part, at a premium declining from
103.563%
. The 4.75% notes may be redeemed on or after May 1, 2019, at our option, in whole or in part, at par. The 4.75% notes also require that upon the occurrence of a change of control (as defined in the 2013 indenture), the holders of the notes have the right to require us to repurchase the notes at a price equal to 101% of the original aggregate principal amount, together with accrued and unpaid interest, if any, to the date of repurchase.
Any mandatory repurchase of the 6.625% notes an/or the 4.75% notes would trigger an event of default under our senior credit facilities. We are not required to maintain any financial ratios under either of the indentures.
Rent-A-Center and its subsidiary guarantors have fully, jointly and severally, and unconditionally guaranteed the obligations of Rent-A-Center with respect to the 6.625% notes and the 4.75% notes. Rent-A-Center has no independent assets or operations, and each subsidiary guarantor is 100% owned directly or indirectly by Rent-A-Center. The only direct or indirect subsidiaries of Rent-A-Center that are not guarantors are minor subsidiaries. There are no restrictions on the ability of any of the subsidiary guarantors to transfer funds to Rent-A-Center in the form of loans, advances or dividends, except as provided by applicable law.
58
RENT-A-CENTER, INC. AND SUBSIDIARIES
NOTES TO CONSOLIDATED FINANCIAL STATEMENTS — (Continued)
Note I — Accrued Liabilities
|
|
December 31,
|
|||||||
|
|
2013
|
2012
|
||||||
|
|
(In thousands)
|
|||||||
|
Accrued insurance costs
|
$
|
122,475
|
|
$
|
124,499
|
|
||
|
Accrued compensation
|
55,911
|
|
56,748
|
|
||||
|
Deferred revenue
|
44,506
|
|
43,577
|
|
||||
|
Taxes other than income
|
23,660
|
|
27,656
|
|
||||
|
Accrued dividends
|
12,103
|
|
12,188
|
|
||||
|
Deferred rent
|
10,424
|
|
9,699
|
|
||||
|
Accrued interest payable
|
5,609
|
|
3,580
|
|
||||
|
Accrued other
|
40,547
|
|
31,119
|
|
||||
|
$
|
315,235
|
|
$
|
309,066
|
|
|||
Note J — Income Taxes
A reconciliation of the federal statutory rate of 35% to actual follows:
|
|
Year Ended December 31,
|
||||||||
|
|
2013
|
2012
|
2011
|
||||||
|
Tax at statutory rate
|
35.0
|
%
|
35.0
|
%
|
35.0
|
%
|
|||
|
State income taxes, net of federal benefit
|
2.6
|
%
|
1.5
|
%
|
1.9
|
%
|
|||
|
Effect of foreign operations, net of foreign tax credits
|
0.4
|
%
|
(0.2
|
)%
|
0.3
|
%
|
|||
|
Other, net
|
0.2
|
%
|
(0.2
|
)%
|
(1.4
|
)%
|
|||
|
Total
|
38.2
|
%
|
36.1
|
%
|
35.8
|
%
|
|||
The components of income tax expense are as follows:
|
|
Year Ended December 31,
|
|||||||||||
|
|
2013
|
2012
|
2011
|
|||||||||
|
|
(In thousands)
|
|||||||||||
|
Current expense
|
||||||||||||
|
Federal
|
$
|
45,784
|
|
$
|
86,839
|
|
$
|
4,154
|
|
|||
|
State
|
5,888
|
|
10,428
|
|
6,547
|
|
||||||
|
Foreign
|
5,659
|
|
3,100
|
|
3,762
|
|
||||||
|
Total current
|
57,331
|
|
100,367
|
|
14,463
|
|
||||||
|
Deferred expense
|
||||||||||||
|
Federal
|
20,427
|
|
6,589
|
|
76,336
|
|
||||||
|
State
|
2,494
|
|
(4,069
|
)
|
1,090
|
|
||||||
|
Foreign
|
(1,134
|
)
|
(142
|
)
|
(631
|
)
|
||||||
|
Total deferred
|
21,787
|
|
2,378
|
|
76,795
|
|
||||||
|
Total
|
$
|
79,118
|
|
$
|
102,745
|
|
$
|
91,258
|
|
|||
59
RENT-A-CENTER, INC. AND SUBSIDIARIES
NOTES TO CONSOLIDATED FINANCIAL STATEMENTS — (Continued)
Deferred tax assets (liabilities) consist of the following:
|
|
December 31,
|
|||||||
|
|
2013
|
2012
|
||||||
|
|
(In thousands)
|
|||||||
|
Deferred tax assets
|
||||||||
|
Federal net operating loss carryforwards
|
$
|
1,798
|
|
$
|
7,873
|
|
||
|
State net operating loss carryforwards
|
15,072
|
|
14,711
|
|
||||
|
Accrued liabilities
|
54,875
|
|
52,909
|
|
||||
|
Other assets including credits
|
2,619
|
|
1,402
|
|
||||
|
Foreign tax credit carryforwards
|
10,584
|
|
6,771
|
|
||||
|
84,948
|
|
83,666
|
|
|||||
|
Valuation allowance
|
(319
|
)
|
(319
|
)
|
||||
|
Deferred tax liabilities
|
||||||||
|
Rental merchandise
|
(256,912
|
)
|
(252,464
|
)
|
||||
|
Property assets
|
(42,357
|
)
|
(32,815
|
)
|
||||
|
Intangible assets
|
(108,686
|
)
|
(97,695
|
)
|
||||
|
(407,955
|
)
|
(382,974
|
)
|
|||||
|
Net deferred taxes
|
$
|
(323,326
|
)
|
$
|
(299,627
|
)
|
||
At
December 31, 2013
, we had approximately
$5.1 million
of federal net operating loss (“NOL”) carryforwards available to offset future taxable income expiring between
2020
and
2023
and approximately
$304.6 million
of state NOL carryforwards expiring between
2014
and
2031
. All of the federal NOL and 22% of the total remaining state NOL carryforward represent acquired NOLs. Utilization of these NOL's is subject to applicable annual limitations for U.S. state and U.S. federal tax purposes, including section 382 of the Internal Revenue Code of 1986, as amended. In addition, at December 31, 2013, we also had approximately
$10.6 million
in foreign tax credit (“FTC”) carryforwards expiring between
2020
and
2023
. We establish a valuation allowance to the extent we consider it more likely than not that the deferred tax assets attributable to our state NOLs or FTCs will not be recovered.
We have not provided for deferred income taxes on undistributed earnings of non-U.S. subsidiaries because of our intention to indefinitely reinvest these earnings outside the U.S. The determination of the amount of the unrecognized deferred income tax liability related to the undistributed earnings is not practicable: however, unrecognized foreign income tax credits would be available to reduce a portion of this liability.
We are subject to federal, state, local and foreign income taxes. Along with our U.S. subsidiaries, we file a U.S. federal consolidated income tax return. With few exceptions, we are no longer subject to U.S. federal, state, foreign and local income tax examinations by tax authorities for years before 2010. The appeals process with the Internal Revenue Service (IRS) Office of Appeals for the years 2001 through 2007 has been completed. We reached agreement on all issues except
one
issue with respect to the 2003 tax year, an issue which occurs in 2004 through 2007 taxable years as well. This matter was heard by the United States Tax Court at trial during November 2011. A favorable decision was issued by the Court on January 14, 2014, and is subject to appeal by the IRS. Our 2010 U. S. federal income tax return has been selected for a limited scope audit and we are also under examination in various states. We do not anticipate that adjustments, if any, regarding the 2003 through 2007 disputed issue, the 2010 federal exam or the various state examinations will result in a material change to our consolidated statement of earnings, financial condition, statement of cash flows or earnings per share.
60
RENT-A-CENTER, INC. AND SUBSIDIARIES
NOTES TO CONSOLIDATED FINANCIAL STATEMENTS — (Continued)
A reconciliation of the beginning and ending amount of unrecognized tax benefits follows:
|
|
(In thousands)
|
||
|
Balance at January 1, 2012
|
$
|
9,656
|
|
|
Additions for tax positions of prior years
|
1,411
|
|
|
|
Reductions for tax positions of prior years
|
(489
|
)
|
|
|
Settlements
|
(411
|
)
|
|
|
Balance at January 1, 2013
|
10,167
|
|
|
|
Additions based on tax positions related to current year
|
50
|
|
|
|
Additions for tax positions of prior years
|
3,742
|
|
|
|
Reductions for tax positions of prior years
|
(786
|
)
|
|
|
Balance at December 31, 2013
|
$
|
13,173
|
|
Included in the balance of unrecognized tax benefits at
December 31, 2013
is
$9.0 million
, net of federal benefit, which, if ultimately recognized, will affect our annual effective tax rate.
As of
December 31, 2013
, we have accrued approximately
$1.8 million
for the payment of interest and recorded interest expense of approximately
$455,000
for the year then ended, which are excluded from the reconciliation of unrecognized tax benefits presented above.
Note K — Commitments and Contingencies
Leases
We lease space for substantially all of our Core U.S. and International stores, certain support facilities and the majority of our delivery vehicles under operating leases expiring at various times through 2023. Certain of the store leases contain escalation clauses for increased taxes and operating expenses. Rental expense was
$240.9 million
,
$235.6 million
and
$230.3 million
for the years ended
December 31, 2013
,
2012
and
2011
, respectively.
Future minimum rental payments under operating leases with remaining lease terms in excess of one year at
December 31, 2013
are as follows:
|
Operating Leases
|
|||
|
Year Ending December 31,
|
(In thousands)
|
||
|
2014
|
$
|
189,353
|
|
|
2015
|
156,673
|
|
|
|
2016
|
115,214
|
|
|
|
2017
|
71,244
|
|
|
|
2018
|
30,683
|
|
|
|
Thereafter
|
3,868
|
|
|
|
$
|
567,035
|
|
|
Litigation
From time to time, we, along with our subsidiaries, are party to various legal proceedings arising in the ordinary course of business. We reserve for litigation loss contingencies that are both probable and reasonably estimable. We regularly monitor developments related to these legal proceedings, and review the adequacy of our legal reserves on a quarterly basis. We do not expect these losses to have a material impact on our consolidated financial statements if and when such losses are incurred.
Franchising Guarantees
Our subsidiary, ColorTyme Finance, Inc. ( “ColorTyme Finance”), is a party to an agreement with Citibank, N.A., pursuant to which Citibank provides up to
$40.0 million
in aggregate financing to qualifying franchisees of Franchising. Under the Citibank agreement, upon an event of default by the franchisee under agreements governing this financing and upon the occurrence of certain other events, Citibank can assign the loans and the collateral securing such loans to ColorTyme Finance, with ColorTyme Finance paying or causing to be paid the outstanding debt to Citibank and then succeeding to the rights of Citibank under the debt agreements, including the right to foreclose on the collateral. Rent-A-Center and ColorTyme Finance guarantee the obligations of
61
RENT-A-CENTER, INC. AND SUBSIDIARIES
NOTES TO CONSOLIDATED FINANCIAL STATEMENTS — (Continued)
the franchise borrowers under the Citibank facility. An additional
$20.0 million
of financing is provided by Texas Capital Bank, National Association under an agreement similar to the Citibank financing, which is guaranteed by Rent-A-Center East, Inc., a subsidiary of Rent-A-Center. The maximum guarantee obligations under these agreements, excluding the effects of any amounts that could be recovered under collateralization provisions, is
$60.0 million
, of which
$17.2 million
was outstanding as of
December 31, 2013
.
Note L — Stock-Based Compensation
We maintain long-term incentive plans for the benefit of certain employees, consultants and directors. Our plans consist of the Rent-A-Center, Inc. Amended and Restated Long-Term Incentive Plan (the “Prior Plan”), the Rent-A-Center, Inc. 2006 Long-Term Incentive Plan (the “2006 Plan”), and the Rent-A-Center, Inc. 2006 Equity Incentive Plan (the “Equity Incentive Plan”), which are collectively known as the “Plans.”
The 2006 Plan authorizes the issuance of
7,000,000
shares of Rent-A-Center’s common stock that may be issued pursuant to awards granted under the 2006 Plan, of which no more than
3,500,000
shares may be issued in the form of restricted stock, deferred stock or similar forms of stock awards which have value without regard to future appreciation in value of or dividends declared on the underlying shares of common stock. In applying these limitations, the following shares will be deemed not to have been issued: (1) shares covered by the unexercised portion of an option that terminates, expires, or is canceled or settled in cash, and (2) shares that are forfeited or subject to awards that are forfeited, canceled, terminated or settled in cash. At
December 31, 2013
and
2012
, there were
1,729,969
and
1,616,983
shares, respectively, allocated to equity awards outstanding in the 2006 Plan.
We acquired the Equity Incentive Plan (formerly known as the Rent-Way, Inc. 2006 Equity Incentive Plan) in conjunction with our acquisition of Rent-Way in 2006. There were
2,468,461
shares of our common stock reserved for issuance under the Equity Incentive Plan. There were
1,020,361
and
870,643
shares allocated to equity awards outstanding in the Equity Incentive Plan at
December 31, 2013
and
2012
, respectively.
Under the Prior Plan,
14,562,865
shares of Rent-A-Center’s common stock were reserved for issuance under stock options, stock appreciation rights or restricted stock grants. There were no grants of stock appreciation rights and all equity awards were granted with fixed prices. At
December 31, 2013
and
2012
, there were
97,499
and
212,969
shares, respectively, allocated to equity awards outstanding under the Prior Plan. The Prior Plan was terminated on May 19, 2006, upon the approval by our stockholders of the 2006 Plan.
Options granted to our employees generally become exercisable over a period of
one
to
four
years from the date of grant and may be exercised up to a maximum of
10
years from the date of grant. Options granted to directors were immediately exercisable.
We grant restricted stock units to certain employees that vest after a three-year service requirement has been met. We recognize expense for these awards using the straight-line method over the requisite service period based on the number of awards expected to vest. We also grant performance-based restricted stock units that vest between 0% and
200%
depending on our achievement of performance metrics that are established at the date of grant for the subsequent three-year period. We record expense for these awards over the requisite service period using an estimate of the number of awards that will vest, based on our performance against the established metrics, and net of the expected forfeiture rate, since the employee must maintain employment to vest in the award.
For the years ended
December 31, 2013
,
2012
and
2011
, we recorded stock based compensation expense of approximately
$6.5 million
(
$4.0 million
net of tax),
$8.4 million
(
$5.3 million
net of tax) and
$4.5 million
(
$2.8 million
net of tax), respectively, related to stock options and restricted stock units granted. We issue new shares of stock to satisfy option exercises and the vesting of restricted stock units.
62
RENT-A-CENTER, INC. AND SUBSIDIARIES
NOTES TO CONSOLIDATED FINANCIAL STATEMENTS — (Continued)
Information with respect to stock option activity related to the Plans follows:
|
Equity Awards
Outstanding
|
Weighted Average
Exercise Price
|
Weighted Average
Remaining Contractual Life
|
Aggregate Intrinsic
Value
|
||||||||||
|
|
|
|
|
(In thousands)
|
|||||||||
|
Balance outstanding at January 1, 2013
|
2,260,410
|
|
$
|
28.57
|
|
||||||||
|
Granted
|
760,322
|
|
36.05
|
|
|||||||||
|
Exercised
|
(478,652
|
)
|
24.93
|
|
|||||||||
|
Forfeited
|
(210,923
|
)
|
32.94
|
|
|||||||||
|
Balance outstanding at December 31, 2013
|
2,331,157
|
|
$
|
31.36
|
|
7.22 years
|
$
|
8,772
|
|
||||
|
Exercisable at December 31, 2013
|
863,893
|
|
$
|
26.13
|
|
5.11 years
|
$
|
6,905
|
|
||||
The intrinsic value of options exercised during the years ended
December 31, 2013
,
2012
and
2011
was
$5.8 million
,
$7.5 million
and
$24.1 million
, respectively, resulting in tax benefits of
$0.4 million
, $4.3 million and $7.0 million, respectively, which are reflected as an outflow from operating activities and an inflow from financing activities in the consolidated statements of cash flows.
The fair value of unvested options that we expect to result in compensation expense was approximately
$10.3 million
with a weighted average number of years to vesting of
2.63 years
at
December 31, 2013
.
During the year ended
December 31, 2013
, the weighted average fair values of the options granted under the Plans were calculated using the
Black-Scholes
method with the following assumptions:
|
Employee options:
|
|
|
|
Risk free interest rate (0.27% to 1.81%)
|
|
Weighted average 0.88%
|
|
Expected dividend yield (2.20% to 2.44%)
|
|
Weighted average 2.34%
|
|
Expected life (2.33 years to 6.25 years)
|
|
Weighted average 4.43 years
|
|
Expected volatility (28.64% to 44.35%)
|
|
Weighted average 37.88%
|
|
Forfeiture rate
|
|
7%
|
|
Employee stock options granted
|
|
760,322
|
|
Weighted average grant date fair value
|
|
$9.27
|
During the year ended
December 31, 2012
, the weighted average fair values of the options granted under the Plans were calculated using the
binomial
method with the following assumptions:
|
Employee options:
|
|
|
|
Risk free interest rate (0.12% to 0.77%)
|
|
Weighted average 0.35%
|
|
Expected dividend yield (1.70% to 1.90%)
|
|
Weighted average 1.74%
|
|
Expected life
|
|
6.25 years
|
|
Expected volatility (28.58% to 47.67%)
|
|
Weighted average 39.72%
|
|
Forfeiture rate (5.29% to 9.78%)
|
|
Weighted average 6.77%
|
|
Employee stock options granted
|
|
733,297
|
|
Weighted average grant date fair value
|
|
$10.08
|
63
RENT-A-CENTER, INC. AND SUBSIDIARIES
NOTES TO CONSOLIDATED FINANCIAL STATEMENTS — (Continued)
During the year ended
December 31, 2011
, the weighted average fair values of the options granted under the Plans were calculated using the
binomial
method with the following assumptions:
|
Employee options:
|
|
|
|
Risk free interest rate (0.12% to 1.78%)
|
|
Weighted average 0.71%
|
|
Expected dividend yield (0.70% to 2.30%)
|
|
Weighted average 1.31%
|
|
Expected life
|
|
6.05 years
|
|
Expected volatility (33.42% to 50.12%)
|
|
Weighted average 42.48%
|
|
Forfeiture rate (7.55% to 13.41%)
|
|
Weighted average 9.48%
|
|
Employee stock options granted
|
|
770,245
|
|
Weighted average grant date fair value
|
|
$7.50
|
Information with respect to non-vested restricted stock unit activity follows:
|
Restricted Awards
Outstanding
|
Weighted Average
Grant Date Fair Value
|
||||||
|
Balance outstanding at January 1, 2013
|
440,185
|
|
$
|
28.96
|
|
||
|
Granted
|
259,484
|
|
32.70
|
|
|||
|
Vested
|
(149,669
|
)
|
21.66
|
|
|||
|
Forfeited
|
(33,328
|
)
|
32.97
|
|
|||
|
Balance outstanding at December 31, 2013
|
516,672
|
|
$
|
32.69
|
|
||
Restricted stock units are valued using the last trade before the day of the grant. Unrecognized compensation expense for unvested restricted stock units at
December 31, 2013
, was approximately
$5.2 million
expected to be recognized over a weighted average period of
1.83 years
.
Note M — Deferred Compensation Plan
The Rent-A-Center, Inc. Deferred Compensation Plan (the “Deferred Compensation Plan”) is an unfunded, nonqualified deferred compensation plan for a select group of our key management personnel and highly compensated employees who do not participate in the Rent-A-Center, Inc. 401(k) Retirement Savings Plan. The Deferred Compensation Plan first became available to eligible employees in July 2007, with deferral elections taking effect as of August 3, 2007.
The Deferred Compensation Plan allows participants to defer up to
50%
of their base compensation and up to
100%
of any bonus compensation. Participants may invest the amounts deferred in measurement funds that are the same funds offered as the investment options in the Rent-A-Center, Inc. 401(k) Retirement Savings Plan. We may make discretionary contributions to the Deferred Compensation Plan, which are subject to a five-year graded vesting schedule based on the participant’s years of service with us. We are obligated to pay the deferred compensation amounts in the future in accordance with the terms of the Deferred Compensation Plan. Assets and associated liabilities of the Deferred Compensation Plan are included in prepaid and other assets and accrued liabilities in our consolidated balance sheets. For the years ended
December 31, 2013
,
2012
and
2011
, we made matching cash contributions of
$0.4 million
,
$0.6 million
and
$0.1 million
, respectively, which represents
50%
of the employees’ contributions to the Deferred Compensation Plan up to an amount not to exceed 4% of each employee's respective compensation. No other discretionary contributions were made for the years ended
December 31, 2013
,
2012
and
2011
. The deferred compensation plan liability was approximately
$8.3 million
and
$5.0 million
as of
December 31, 2013
and
2012
respectively.
Note N — Employee Benefit Plan
We sponsor a defined contribution pension plan under Section 401(k) of the Internal Revenue Code for certain employees who have completed at least three months of service. Employees may elect to contribute up to
50%
of their eligible compensation on a pre-tax basis, subject to limitations. We may make discretionary contributions to the 401(k) plan. Employer matching contributions are subject to a five-year graded vesting schedule based on the participant's years of service with us. For the years ended
December 31, 2013
,
2012
and
2011
, we made matching cash contributions of
$6.6 million
,
$5.3 million
and
$5.8 million
, respectively, which represents
50%
of the employees’ contributions to the 401(k) plan up to an amount not to exceed
4%
of each employee's respective compensation. Employees are permitted to elect to purchase our common stock as part of their 401(k) plan.
64
RENT-A-CENTER, INC. AND SUBSIDIARIES
NOTES TO CONSOLIDATED FINANCIAL STATEMENTS — (Continued)
As of
December 31, 2013
,
2012
and
2011
,
6.8%
,
10.0%
, and
12.0%
, respectively, of the total plan assets consisted of our common stock.
Note O — Fair Value
We use a three-tier fair value hierarchy, which classifies the inputs used in measuring fair values, in determining the fair value of our non-financial assets and non-financial liabilities, which consist primarily of goodwill. These tiers include: Level 1, defined as observable inputs such as quoted prices for identical instruments in active markets; Level 2, defined as inputs other than quoted prices in active markets that are either directly or indirectly observable; and Level 3, defined as unobservable inputs in which little or no market data exists, therefore requiring an entity to develop its own assumptions. There were no changes in the methods and assumptions used in measuring fair value during the period.
At
December 31, 2013
, our financial instruments include cash and cash equivalents, receivables, payables, senior debt and senior notes. The carrying amount of cash and cash equivalents, receivables and payables approximates fair value at
December 31, 2013
and
2012
, because of the short maturities of these instruments. Our senior debt is variable rate debt that re-prices frequently and entails no significant change in credit risk and, as a result, fair value approximates carrying value. The fair value of our senior notes is based on Level 1 inputs.
At
December 31, 2013
, the fair value of our 6.625% senior notes was
$316.7 million
, which was approximately
$16.7 million
above
their carrying value of
$300.0 million
. At
December 31, 2012
, the fair value of our 6.625% senior notes was
$327.0 million
, which was approximately
$27.0 million
above
their carrying value of
$300.0 million
. At December 31, 2013, the fair value of our 4.75% senior notes was
$234.7 million
, which was approximately
$15.3 million
below
the carrying value of
$250.0 million
.
Note P — Stock Repurchase Plan
Under our current common stock repurchase program, our Board of Directors has authorized the purchase, from time to time, in the open market and privately negotiated transactions, of up to an aggregate of
$1.25 billion
of Rent-A-Center common stock. On May 2, 2013, we entered into an agreement with Goldman, Sachs & Co. (“Goldman Sachs”) to repurchase
$200.0 million
of Rent-A-Center common stock under an accelerated stock buyback program (“the ASB transaction”). Under the agreement, we paid $200.0 million to Goldman Sachs on May 7, 2013, and we received an initial share delivery of
4,592,423
shares, which was estimated to represent 80% of shares expected to be purchased in the ASB transaction. The weighted value of these shares immediately reduced weighted-average shares outstanding in our calculation of earnings per share. The remainder of the ASB transaction was subject to a forward contract that settled in October 2013, at which time we received an additional
816,916
shares, ending the ASB transaction.
We have repurchased a total of
36,994,653
shares and
31,120,279
shares of Rent-A-Center common stock for an aggregate purchase price of
$994.8 million
and
$777.3 million
as of
December 31, 2013
and
2012
, respectively, under this common stock repurchase program. In addition to the
5,409,339
shares repurchased pursuant to the accelerated stock buyback, we repurchased a total of
465,035
shares for
$17.4 million
in cash during the year ended
December 31, 2013
.
Note Q — Segment Information
The operating segments reported below are the segments for which separate financial information is available and for which segment results are evaluated by the chief operating decision makers. Our operating segments are organized based on factors including, but not limited to, type of business transactions, geographic location and store ownership. All operating segments offer merchandise from four basic product categories: consumer electronics, appliances, computers, furniture and accessories. Reportable segments and their respective operations are defined as follows.
Our Core U.S. segment primarily operates rent-to-own stores in the United States and Puerto Rico whose customers enter into weekly, semi-monthly or monthly rental purchase agreements, which renew automatically upon receipt of each payment. We retain the title to the merchandise during the term of the rental purchase agreement and ownership passes to the customer if the customer has continuously renewed the rental purchase agreement through the end of the term or exercises a specified early purchase option. This segment also includes the
45
stores operating in two states that utilize a retail model which generates installment credit sales through a retail sale transaction. Segment assets include cash, receivables, rental merchandise, property assets, goodwill and other intangible assets. During 2011 in this segment, we recorded a pre-tax impairment charge of approximately
$7.3 million
related to the discontinuation of the financial services business, which ceased operations in December 2010, a pre-tax litigation charge of approximately
$2.8 million
related to the settlement of wage and hour claims in California and a pre-tax restructuring charge of approximately
$7.6 million
related to the closure of eight Home Choice stores in Illinois, 24 RAC Limited
65
RENT-A-CENTER, INC. AND SUBSIDIARIES
NOTES TO CONSOLIDATED FINANCIAL STATEMENTS — (Continued)
locations within third-party grocery stores and 26 core rent-to-own stores following the sale of all customer accounts at those locations.
Our Acceptance Now segment operates kiosks within various traditional retailers’ locations where we generally offer the rent-to-own transaction to consumers who do not qualify for financing from the traditional retailer. The transaction offered is generally similar to that of the Core U.S. segment; however, the majority of the customers in this segment enter into monthly rather than weekly agreements. Segment assets include cash, rental merchandise, property assets, goodwill and other intangible assets. A restructuring charge of
$4.9 million
associated with the December 2010 acquisition of The Rental Store, Inc. was recognized in this segment during 2011.
Our International segment currently consists of our company-owned rent-to-own stores in Mexico and Canada. The nature of this segment's operations and assets are the same as our Core U.S. segment. At
December 31, 2013
, we operated
151
stores in Mexico and
18
stores in Canada.
During the third quarter of 2013, ColorTyme, Inc., our franchisor of rent-to-own stores, changed its name to Rent-A-Center Franchising International, Inc., and all future franchises sold will be licensed under the Rent-A-Center name. This segment will be referred to as Franchising in the future. We offered our current franchisees the opportunity to convert their ColorTyme stores to the Rent-A-Center name. Our franchised stores use Rent-A-Center’s, ColorTyme’s or RimTyme's trade names, service marks, trademarks and logos, and operate under distinctive operating procedures and standards. Franchising’s primary source of revenue is the sale of rental merchandise to its franchisees who, in turn, offer the merchandise to the general public for rent or purchase under a rent-to-own program. As franchisor, Franchising receives royalties of
2.0%
to
6.0%
of the franchisees' monthly gross revenue and initial fees for new locations. Segment assets include cash, franchise fee receivables, property assets and intangible assets.
To facilitate the conversion of ColorTyme branded stores to Rent-A-Center, we sold some of our company-owned stores to existing franchisees and purchased some of the former ColorTyme stores and are either operating them under the Rent-A-Center brand or merged them with existing stores. We believe that an unified network of both company-owned and franchised stores operating under the Rent-A-Center name creates a stronger service offering for our customers and leverages our growth efforts to reach more customers.
We incur costs at our corporate headquarters that benefit our Core U.S., Acceptance Now and International operating segments. Accordingly, we allocate such costs among these segments based on segment revenue to determine segment operating profit. Likewise, certain corporate assets used to support these operating segments, including the land and building in which the corporate headquarters are located and related property assets, cash and prepaid expenses are also allocated to these operating segments based on segment revenue. Because our Franchising segment maintains a separate, independent corporate office, no additional corporate costs or assets are allocated to that segment.
Segment information as of and for the years ended
December 31, 2013
,
2012
and
2011
is as follows (in thousands, except location count):
|
|
Year Ended December 31, 2013
|
|||||||||||||||||||
|
|
Core U.S.
|
Acceptance Now
|
International
|
Franchising
|
Total
|
|||||||||||||||
|
Revenues
|
$
|
2,507,498
|
|
$
|
502,043
|
|
$
|
58,445
|
|
$
|
36,197
|
|
$
|
3,104,183
|
|
|||||
|
Gross profit
|
1,810,160
|
|
290,741
|
|
41,887
|
|
6,658
|
|
2,149,446
|
|
||||||||||
|
Operating profit (loss)
|
205,928
|
|
66,625
|
|
(28,237
|
)
|
1,853
|
|
246,169
|
|
||||||||||
|
Depreciation of property assets
|
64,852
|
|
5,036
|
|
6,484
|
|
79
|
|
76,451
|
|
||||||||||
|
Amortization and write-down of intangibles
|
9,892
|
|
569
|
|
1,068
|
|
—
|
|
11,529
|
|
||||||||||
|
Capital expenditures
|
84,819
|
|
11,076
|
|
12,472
|
|
—
|
|
108,367
|
|
||||||||||
|
Rental merchandise, net
|
||||||||||||||||||||
|
On rent
|
609,332
|
|
284,421
|
|
20,865
|
|
—
|
|
914,618
|
|
||||||||||
|
Held for rent
|
194,734
|
|
3,837
|
|
11,879
|
|
—
|
|
210,450
|
|
||||||||||
|
Total assets
|
2,561,688
|
|
375,920
|
|
79,257
|
|
1,688
|
|
3,018,553
|
|
||||||||||
66
RENT-A-CENTER, INC. AND SUBSIDIARIES
NOTES TO CONSOLIDATED FINANCIAL STATEMENTS — (Continued)
|
|
Year Ended December 31, 2012
|
|||||||||||||||||||
|
|
Core U.S.
|
Acceptance Now
|
International
|
Franchising
|
Total
|
|||||||||||||||
|
Revenues
|
$
|
2,655,411
|
|
$
|
343,283
|
|
$
|
40,211
|
|
$
|
43,741
|
|
$
|
3,082,646
|
|
|||||
|
Gross profit
|
1,904,586
|
|
194,607
|
|
27,831
|
|
6,893
|
|
2,133,917
|
|
||||||||||
|
Operating profit (loss)
|
318,784
|
|
25,261
|
|
(30,700
|
)
|
2,326
|
|
315,671
|
|
||||||||||
|
Depreciation of property assets
|
63,793
|
|
3,631
|
|
5,848
|
|
89
|
|
73,361
|
|
||||||||||
|
Amortization and write-down of intangibles
|
2,103
|
|
2,819
|
|
967
|
|
—
|
|
5,889
|
|
||||||||||
|
Capital expenditures
|
84,680
|
|
5,275
|
|
12,498
|
|
—
|
|
102,453
|
|
||||||||||
|
Rental merchandise, net
|
||||||||||||||||||||
|
On rent
|
589,181
|
|
204,640
|
|
13,576
|
|
—
|
|
807,397
|
|
||||||||||
|
Held for rent
|
190,703
|
|
3,007
|
|
6,412
|
|
—
|
|
200,122
|
|
||||||||||
|
Total assets
|
2,504,954
|
|
286,774
|
|
65,378
|
|
2,711
|
|
2,859,817
|
|
||||||||||
|
|
Year Ended December 31, 2011
|
|||||||||||||||||||
|
|
Core U.S.
|
Acceptance Now
|
International
|
Franchising
|
Total
|
|||||||||||||||
|
Revenues
|
$
|
2,631,416
|
|
$
|
193,295
|
|
$
|
18,490
|
|
$
|
38,983
|
|
$
|
2,882,184
|
|
|||||
|
Gross profit
|
1,918,781
|
|
114,228
|
|
13,011
|
|
6,496
|
|
2,052,516
|
|
||||||||||
|
Operating profit (loss)
|
318,271
|
|
(16,483
|
)
|
(13,679
|
)
|
3,220
|
|
291,329
|
|
||||||||||
|
Depreciation of property assets
|
60,558
|
|
2,229
|
|
2,295
|
|
132
|
|
65,214
|
|
||||||||||
|
Amortization and write-down of intangibles
|
1,092
|
|
3,583
|
|
—
|
|
—
|
|
4,675
|
|
||||||||||
|
Capital expenditures
|
108,553
|
|
5,881
|
|
18,276
|
|
—
|
|
132,710
|
|
||||||||||
|
Rental merchandise, net
|
||||||||||||||||||||
|
On rent
|
610,104
|
|
136,755
|
|
7,698
|
|
—
|
|
754,557
|
|
||||||||||
|
Held for rent
|
178,826
|
|
1,274
|
|
7,869
|
|
—
|
|
187,969
|
|
||||||||||
|
Total assets
|
2,532,412
|
|
214,572
|
|
44,337
|
|
3,571
|
|
2,794,892
|
|
||||||||||
Over 85% of our total revenues are comprised of rental and fee revenues from the following product groups:
|
|
Year Ended December 31,
|
|||||||||||
|
|
2013
|
2012
|
2011
|
|||||||||
|
|
(In thousands)
|
|||||||||||
|
Furniture and accessories
|
$
|
913,398
|
|
$
|
858,245
|
|
$
|
785,918
|
|
|||
|
Consumer electronics
|
664,882
|
|
696,621
|
|
670,135
|
|
||||||
|
Appliances
|
431,100
|
|
421,762
|
|
385,795
|
|
||||||
|
Computers
|
345,646
|
|
357,014
|
|
366,619
|
|
||||||
|
Other products and services
|
343,369
|
|
320,439
|
|
288,396
|
|
||||||
|
Total rentals and fees
|
$
|
2,698,395
|
|
$
|
2,654,081
|
|
$
|
2,496,863
|
|
|||
Our revenues originate in the following countries:
|
|
Year Ended December 31,
|
|||||||||||
|
|
2013
|
2012
|
2011
|
|||||||||
|
|
(In thousands)
|
|||||||||||
|
United States
|
$
|
3,045,738
|
|
$
|
3,042,435
|
|
$
|
2,863,694
|
|
|||
|
Mexico
|
47,169
|
|
22,603
|
|
4,303
|
|
||||||
|
Canada
|
11,276
|
|
17,608
|
|
14,187
|
|
||||||
|
Total revenues
|
$
|
3,104,183
|
|
$
|
3,082,646
|
|
$
|
2,882,184
|
|
|||
67
RENT-A-CENTER, INC. AND SUBSIDIARIES
NOTES TO CONSOLIDATED FINANCIAL STATEMENTS — (Continued)
Note R — Earnings Per Common Share
Summarized basic and diluted earnings per common share were calculated as follows:
|
Net Earnings
|
Weighted Average
Shares
|
Per Share
|
|||||||||
|
|
(In thousands, except per share data)
|
||||||||||
|
Year Ended December 31, 2013
|
|||||||||||
|
Basic earnings per common share
|
$
|
128,238
|
|
54,804
|
|
$
|
2.34
|
|
|||
|
Effect of dilutive stock options
|
—
|
|
358
|
|
|||||||
|
Diluted earnings per common share
|
$
|
128,238
|
|
55,162
|
|
$
|
2.32
|
|
|||
|
Net Earnings
|
Weighted Average
Shares
|
Per Share
|
|||||||||
|
|
(In thousands, except per share data)
|
||||||||||
|
Year Ended December 31, 2012
|
|||||||||||
|
Basic earnings per common share
|
$
|
181,703
|
|
58,913
|
|
$
|
3.08
|
|
|||
|
Effect of dilutive stock options
|
—
|
|
492
|
|
|||||||
|
Diluted earnings per common share
|
$
|
181,703
|
|
59,405
|
|
$
|
3.06
|
|
|||
|
Net Earnings
|
Weighted Average
Shares
|
Per Share
|
|||||||||
|
|
(In thousands, except per share data)
|
||||||||||
|
Year Ended December 31, 2011
|
|||||||||||
|
Basic earnings per common share
|
$
|
163,464
|
|
61,188
|
|
$
|
2.67
|
|
|||
|
Effect of dilutive stock options
|
—
|
|
701
|
|
|||||||
|
Diluted earnings per common share
|
$
|
163,464
|
|
61,889
|
|
$
|
2.64
|
|
|||
For
2013
,
2012
, and
2011
, the number of stock options that were outstanding but not included in the computation of diluted earnings per common share because their exercise price was greater than the average market price of the common stock and, therefore anti-dilutive, were
1,507,355
,
1,115,245
, and
744,640
, respectively.
Note S — Unaudited Quarterly Data
Summarized quarterly financial data for the years ended
December 31, 2013
,
2012
and
2011
is as follows, adjusted to reflect the revisions to reserves discussed in Note B to the consolidated financial statements:
|
1st Quarter
|
2nd Quarter
|
3rd Quarter
|
4th Quarter
|
|||||||||||||
|
|
(In thousands, except per share data)
|
|||||||||||||||
|
Year Ended December 31, 2013
|
||||||||||||||||
|
Revenues
|
$
|
819,281
|
|
$
|
760,511
|
|
$
|
754,780
|
|
$
|
769,611
|
|
||||
|
Gross profit
|
550,678
|
|
530,620
|
|
529,332
|
|
538,816
|
|
||||||||
|
Operating profit
|
78,784
|
|
77,230
|
|
55,773
|
|
34,382
|
|
||||||||
|
Net earnings
|
46,133
|
|
41,876
|
|
27,165
|
|
13,064
|
|
||||||||
|
Basic earnings per common share
|
$
|
0.80
|
|
$
|
0.76
|
|
$
|
0.51
|
|
$
|
0.25
|
|
||||
|
Diluted earnings per common share
|
$
|
0.79
|
|
$
|
0.76
|
|
$
|
0.50
|
|
$
|
0.25
|
|
||||
|
Cash dividends paid per common share
|
$
|
0.21
|
|
$
|
0.21
|
|
$
|
0.21
|
|
$
|
0.21
|
|
||||
68
RENT-A-CENTER, INC. AND SUBSIDIARIES
NOTES TO CONSOLIDATED FINANCIAL STATEMENTS — (Continued)
|
1st Quarter
|
2nd Quarter
|
3rd Quarter
|
4th Quarter
|
|||||||||||||
|
|
(In thousands, except per share data)
|
|||||||||||||||
|
Year Ended December 31, 2012
|
||||||||||||||||
|
Revenues
|
$
|
835,254
|
|
$
|
749,698
|
|
$
|
739,314
|
|
$
|
758,380
|
|
||||
|
Gross profit
|
560,417
|
|
526,973
|
|
519,341
|
|
527,186
|
|
||||||||
|
Operating profit
|
90,476
|
|
78,454
|
|
67,798
|
|
78,943
|
|
||||||||
|
Net earnings
|
50,968
|
|
43,825
|
|
39,701
|
|
47,209
|
|
||||||||
|
Basic earnings per common share
|
$
|
0.86
|
|
$
|
0.74
|
|
$
|
0.67
|
|
$
|
0.81
|
|
||||
|
Diluted earnings per common share
|
$
|
0.85
|
|
$
|
0.74
|
|
$
|
0.67
|
|
$
|
0.80
|
|
||||
|
Cash dividends paid per common share
|
$
|
0.16
|
|
$
|
0.16
|
|
$
|
0.16
|
|
$
|
0.16
|
|
||||
|
1st Quarter
|
2nd Quarter
|
3rd Quarter
|
4th Quarter
|
|||||||||||||
|
|
(In thousands, except per share data)
|
|||||||||||||||
|
Year Ended December 31, 2011
|
||||||||||||||||
|
Revenues
|
$
|
742,178
|
|
$
|
698,253
|
|
$
|
704,271
|
|
$
|
737,482
|
|
||||
|
Gross profit
|
523,148
|
|
506,355
|
|
505,724
|
|
517,289
|
|
||||||||
|
Operating profit
|
80,486
|
|
72,872
|
|
57,363
|
|
80,608
|
|
||||||||
|
Net earnings
|
44,272
|
|
39,713
|
|
30,948
|
|
48,531
|
|
||||||||
|
Basic earnings per common share
|
$
|
0.70
|
|
$
|
0.64
|
|
$
|
0.52
|
|
$
|
0.82
|
|
||||
|
Diluted earnings per common share
|
$
|
0.69
|
|
$
|
0.63
|
|
$
|
0.51
|
|
$
|
0.81
|
|
||||
|
Cash dividends paid per common share
|
$
|
0.06
|
|
$
|
0.06
|
|
$
|
0.16
|
|
$
|
0.16
|
|
||||
69
Item 9.
Changes in and Disagreements with Accountants on Accounting and Financial Disclosure.
None.
Item 9A.
Controls and Procedures.
Disclosure Controls and Procedures
In accordance with Rule 13a-15(b) under the Securities Exchange Act of 1934, an evaluation was performed under the supervision and with the participation of our management, including our Chief Executive Officer and Chief Financial Officer, of the effectiveness of the design and operation of our disclosure controls and procedures (as defined in Rules 13a-15(e) and 15d-15(e) under the Securities Exchange Act of 1934) as of the end of the period covered by this Annual Report on Form 10-K. Based on this evaluation, our management, including our Chief Executive Officer and our Chief Financial Officer, concluded that, as of
December 31, 2013
, our disclosure controls and procedures (as defined in Rules 13a-15(e) and 15d-15(e) under the Securities Exchange Act of 1934) were effective.
Management’s Annual Report on Internal Control over Financial Reporting
Please refer to Management’s Annual Report on Internal Control over Financial Reporting on page
42
of this Annual Report on Form 10-K.
Auditor's Report Relating to Effectiveness of Internal Control over Financial Reporting
Please refer to the Report of Independent Registered Public Accounting Firm on page
41
of this Annual Report on Form 10-K.
Changes in Internal Control over Financial Reporting
For the year ended
December 31, 2013
, there have been no changes in our internal control over financial reporting (as defined in Rule 13a-15(f) under the Securities Exchange Act of 1934) that have materially affected, or are reasonably likely to materially affect, our internal control over financial reporting.
Item 9B.
Other Information.
None.
Item 10.
Directors, Executive Officers and Corporate Governance.(*)
Item 11.
Executive Compensation.(*)
Item 12.
Security Ownership of Certain Beneficial Owners and Management
and Related Stockholder Matters.(*)
Item 13.
Certain Relationships and Related Transactions, and Director Independence.(*)
Item 14.
Principal Accountant Fees and Services.(*)
|
*
|
The information required by Items 10, 11, 12, 13 and 14 is or will be set forth in the definitive proxy statement relating to the 2014 Annual Meeting of Stockholders of Rent-A-Center, Inc., which is to be filed with the SEC pursuant to Regulation 14A under the Securities Exchange Act of 1934, as amended. This definitive proxy statement relates to a meeting of stockholders involving the election of directors and the portions therefrom required to be set forth in this Form 10-K by Items 10, 11, 12, 13 and 14 are incorporated herein by reference pursuant to General Instruction G(3) to Form 10-K.
|
70
Item 15.
Exhibits and Financial Statement Schedules.
1. Financial Statements
The financial statements included in this report are listed in the Index to Financial Statements on page 39 of this Annual Report on Form 10-K.
2. Financial Statement Schedules
Schedules for which provision is made in the applicable accounting regulations of the SEC are either not required under the related instructions or inapplicable.
3. Exhibits
The exhibits required to be filed pursuant to Item 15(b) of Form 10-K are listed in the Exhibit Index filed herewith, which Exhibit Index is incorporated herein by reference. Exhibits 10.1, 10.9 through 10.28, and 10.30, listed in the Exhibit Index filed herewith, are management or compensatory plans or arrangements required to be filed as exhibits to this Annual Report on Form 10-K pursuant to Item 15(b) thereof.
71
SIGNATURES
Pursuant to the requirements of Section 13 or 15(d) of the Securities Exchange Act of 1934, the registrant has duly caused this report to be signed on its behalf by the undersigned, thereunto duly authorized.
|
RENT-A-CENTER, INC.
|
||
|
By:
|
/
S
/ R
OBERT
D. D
AVIS
|
|
|
|
Robert D. Davis
|
|
|
|
Chief Executive Officer
|
|
Date:
March 3, 2014
Pursuant to the requirements of the Securities Exchange Act of 1934, this report has been signed by the following persons on behalf of the registrant and in the capacities and on the date indicated.
|
Signature
|
|
Title
|
|
Date
|
|
/s/ R
OBERT
D. D
AVIS
|
|
Chief Executive Officer and Director (Principal Executive Officer)
|
|
March 3, 2014
|
|
Robert D. Davis
|
||||
|
/s/ M
ICHAEL
S. W
ILDING
|
Senior Vice President — Accounting & Global Controller; Interim Chief Financial Officer (Principal Financial and Accounting Officer)
|
March 3, 2014
|
||
|
Michael S. Wilding
|
||||
|
/s/ M
ARK
E. S
PEESE
|
|
Chairman of the Board
|
|
March 3, 2014
|
|
Mark E. Speese
|
||||
|
/s/ M
ICHAEL
J. G
ADE
|
|
Director
|
|
March 3, 2014
|
|
Michael J. Gade
|
||||
|
/s/ J
EFFERY
M. J
ACKSON
|
|
Director
|
|
March 3, 2014
|
|
Jeffery M. Jackson
|
||||
|
/s/ J. V. L
ENTELL
|
|
Director
|
|
March 3, 2014
|
|
J. V. Lentell
|
||||
|
/s/ S
TEVEN
L. P
EPPER
|
|
Director
|
|
March 3, 2014
|
|
Steven L. Pepper
|
||||
|
/s/ L
EONARD
H. R
OBERTS
|
|
Director
|
|
March 3, 2014
|
|
Leonard H. Roberts
|
||||
|
/s/ P
AULA
S
TERN
|
|
Director
|
|
March 3, 2014
|
|
Paula Stern
|
||||
72
INDEX TO EXHIBITS
Exhibit No. Description
|
3.1
|
Certificate of Incorporation of Rent-A-Center, Inc., as amended (Incorporated herein by reference to Exhibit 3.1 to the registrant's Current Report on Form 8-K dated as of December 31, 2002.)
|
|
3.2
|
Certificate of Amendment to the Certificate of Incorporation of Rent-A-Center, Inc., dated May 19, 2004 (Incorporated herein by reference to Exhibit 3.2 to the registrant's Quarterly Report on Form 10-Q for the quarter ended June 30, 2004.)
|
|
3.3
|
Amended and Restated Bylaws of Rent-A-Center, Inc. (Incorporated herein by reference to Exhibit 3.1 to the registrant's Current Report on Form 8-K dated as of September 28, 2011.)
|
|
4.1
|
Form of Certificate evidencing Common Stock (Incorporated herein by reference to Exhibit 4.1 to the registrant's Registration Statement on Form S-4/A filed on January 13, 1999.)
|
|
4.2
|
Indenture, dated as of November 2, 2010, by and among Rent-A-Center, Inc., as Issuer, the Guarantors named therein, as Guarantors, and The Bank of New York Mellon Trust Company, N.A., as Trustee (Incorporated herein by reference to Exhibit 4.1 to the registrant's Current Report on Form 8-K dated as of November 2, 2010.)
|
|
4.3
|
Registration Rights Agreement relating to the 6.625% Senior Notes due 2020, dated as of November 2, 2010, among Rent-A-Center, Inc., the subsidiary guarantors party thereto and J.P. Morgan Securities LLC, as representative for the initial purchasers named therein (Incorporated herein by reference to Exhibit 4.2 to the registrant's Current Report on Form 8-K dated as of November 2, 2010.)
|
|
4.4
|
Indenture, dated as of May 2, 2013, by and among Rent-A-Center, Inc., as Issuer, the Guarantors named therein, as Guarantors, and The Bank of New York Mellon Trust Company, N.A., as Trustee (Incorporated herein by reference to Exhibit 4.1 to the registrant's Current Report on Form 8-K dated as of May 2, 2013.)
|
|
4.5
|
Registration Rights Agreement relating to the 4.75% Senior Notes due 2021, dated as of May 2, 2013, among Rent-A-Center, Inc., the subsidiary guarantors party thereto and J.P. Morgan Securities LLC, as representative for the initial purchasers named therein (Incorporated herein by reference to Exhibit 4.2 to the registrant's Current Report on Form 8-K dated as of May 2, 2013.)
|
|
10.1†
|
Amended and Restated Rent-A-Center, Inc. Long-Term Incentive Plan (Incorporated herein by reference to Exhibit 10.1 to the registrant's Quarterly Report on Form 10-Q for the quarter ended September 30, 2003.)
|
|
10.2
|
Amended and Restated Guarantee and Collateral Agreement, dated as of May 28, 2003, as amended and restated as of July 14, 2004, made by Rent-A-Center, Inc. and certain of its Subsidiaries in favor of JPMorgan Chase Bank, as Administrative Agent (Incorporated herein by reference to Exhibit 10.2 to the registrant's Current Report on Form 8-K dated July 15, 2004.)
|
|
10.3
|
Franchisee Financing Agreement, dated April 30, 2002, but effective as of June 28, 2002, by and between Texas Capital Bank, National Association, ColorTyme, Inc. and Rent-A-Center, Inc. (Incorporated herein by reference to Exhibit 10.14 to the registrant's Quarterly Report on Form 10-Q for the quarter ended June 30, 2002.)
|
|
10.4
|
Supplemental Letter Agreement to Franchisee Financing Agreement, dated May 26, 2003, by and between Texas Capital Bank, National Association, ColorTyme, Inc. and Rent-A-Center, Inc. (Incorporated herein by reference to Exhibit 10.23 to the registrant's Registration Statement on Form S-4 filed July 11, 2003.)
|
|
|
|
|
10.5
|
First Amendment to Franchisee Financing Agreement, dated August 30, 2005, by and among Texas Capital Bank, National Association, ColorTyme, Inc. and Rent-A-Center East, Inc. (Incorporated herein by reference to Exhibit 10.7 to the registrant's Quarterly Report on Form 10-Q for the quarter ended September 30, 2005.)
|
|
10.6
|
Franchise Financing Agreement, dated as of August 2, 2010, between ColorTyme Finance, Inc. and Citibank, N.A. (Incorporated herein by reference to Exhibit 10.1 to the registrant's Current Report on Form 8-K dated as of August 2, 2010.)
|
|
10.7
|
Unconditional Guaranty of Rent-A-Center, Inc., dated as of August 2, 2010, executed by Rent-A-Center, Inc. in favor of Citibank, N.A. (Incorporated herein by reference to Exhibit 10.1 to the registrant's Current Report on Form 8-K dated as of August 2, 2010.)
|
|
10.8
|
Unconditional Guaranty of Rent-A-Center, Inc., dated as of August 2, 2010, executed by ColorTyme Finance, Inc. in favor of Citibank, N.A. (Incorporated herein by reference to Exhibit 10.1 to the registrant's Current Report on Form 8-K dated as of August 2, 2010.)
|
|
10.9†
|
Form of Stock Option Agreement issuable to Directors pursuant to the Amended and Restated Rent-A-Center, Inc. Long-Term Incentive Plan (Incorporated herein by reference to Exhibit 10.20 to the registrant's Annual Report on Form 10-K for the year ended December 31, 2004.)
|
73
INDEX TO EXHIBITS
Exhibit No. Description
|
10.10†
|
Form of Stock Option Agreement issuable to management pursuant to the Amended and Restated Rent-A-Center, Inc. Long-Term Incentive Plan (Incorporated herein by reference to Exhibit 10.21 to the registrant's Annual Report on Form 10-K for the year ended December 31, 2004.)
|
|
10.11†*
|
Summary of Director Compensation
|
|
10.12†
|
Form of Stock Compensation Agreement issuable to management pursuant to the Amended and Restated Rent-A-Center, Inc. Long-Term Incentive Plan (Incorporated herein by reference to Exhibit 10.15 to the registrant's Quarterly Report on Form 10-Q for the quarter ended March 31, 2006.)
|
|
10.13†
|
Form of Long-Term Incentive Cash Award issuable to management pursuant to the Amended and Restated Rent-A-Center, Inc. Long-Term Incentive Plan (Incorporated herein by reference to Exhibit 10.16 to the registrant's Quarterly Report on Form 10-Q for the quarter ended March 31, 2006.)
|
|
10.14†
|
Form of Loyalty and Confidentiality Agreement entered into with management (Incorporated herein by reference to Exhibit 10.14 to the registrant's Quarterly Report on Form 10-Q for the quarter ended September 30, 2013.)
|
|
10.15†
|
Rent-A-Center, Inc. 2006 Long-Term Incentive Plan (Incorporated herein by reference to Exhibit 10.17 to the registrant's Quarterly Report on Form 10-Q for the quarter ended June 30, 2006.)
|
|
10.16†
|
Form of Stock Option Agreement issuable to management pursuant to the Rent-A-Center, Inc. 2006 Long-Term Incentive Plan (Incorporated herein by reference to Exhibit 10.18 to the registrant's Quarterly Report on Form 10-Q for the quarter ended June 30, 2006.)
|
|
10.17†
|
Form of Stock Compensation Agreement issuable to management pursuant to the Rent-A-Center, Inc. 2006 Equity Incentive Plan (Incorporated herein by reference to Exhibit 10.19 to the registrant's Annual Report on Form 10-K for the year ended December 31, 2006.)
|
|
10.18†
|
Form of Long-Term Incentive Cash Award issuable to management pursuant to the Rent-A-Center, Inc. 2006 Long-Term Incentive Plan (Incorporated herein by reference to Exhibit 10.20 to the registrant's Annual Report on Form 10-K for the year ended December 31, 2006.)
|
|
10.19†
|
Rent-A-Center, Inc. 2006 Equity Incentive Plan and Amendment (Incorporated herein by reference to Exhibit 4.5 to the registrant's Registration Statement on Form S-8 filed with the SEC on January 4, 2007.)
|
|
10.20†
|
Form of Stock Option Agreement issuable to management pursuant to the Rent-A-Center, Inc. 2006 Equity Incentive Plan (Incorporated herein by reference to Exhibit 10.22 to the registrant's Annual Report on Form 10-K for the year ended December 31, 2006.)
|
|
10.21†
|
Form of Stock Compensation Agreement issuable to management pursuant to the Rent-A-Center, Inc. 2006 Long-Term Incentive Plan (Incorporated herein by reference to Exhibit 10.23 to the registrant's Annual Report on Form 10-K for the year ended December 31, 2006.)
|
|
10.22†
|
Form of Stock Option Agreement issuable to Directors pursuant to the Rent-A-Center, Inc. 2006 Long-Term Incentive Plan (Incorporated herein by reference to Exhibit 10.24 to the registrant's Annual Report on Form 10-K for the year ended December 31, 2006.)
|
|
10.23†
|
Form of Deferred Stock Unit Award Agreement issuable to Directors pursuant to the Rent-A-Center, Inc. 2006 Long-Term Incentive Plan (Incorporated herein by reference to Exhibit 10.23 to the registrant's Annual Report on Form 10-K for the year ended December 31, 2010.)
|
|
10.24†
|
Form of Executive Transition Agreement entered into with management (Incorporated herein by this reference to Exhibit 10.24 to the registrant's quarterly report on Form 10-Q for the quarter ended September 30, 2013.)
|
|
10.25†
|
Employment Agreement, dated October 2, 2006, and amended and restated as of September 6, 2013, between Rent-A-Center, Inc. and Mark E. Speese (Incorporated herein by reference to Exhibit 10.25 to the registrant's Quarterly Report on Form 10-Q for the quarter ended September 30, 2013.)
|
|
10.26†
|
Non-Qualified Stock Option Agreement, dated October 2, 2006, between Rent-A-Center, Inc. and Mark E. Speese (Incorporated herein by reference to Exhibit 10.23 to the registrant's Quarterly Report on Form 10-Q for the quarter ended September 30, 2006.)
|
|
10.27†
|
Rent-A-Center, Inc. Non-Qualified Deferred Compensation Plan (Incorporated herein by reference to Exhibit 10.28 to the registrant's Quarterly Report on Form 10-Q for the quarter ended June 30, 2007.)
|
|
10.28†
|
Rent-A-Center, Inc. 401-K Plan (Incorporated herein by reference to Exhibit 10.30 to the registrant's Annual Report on Form 10-K for the year ended December 31, 2008.)
|
74
INDEX TO EXHIBITS
Exhibit No. Description
|
10.29
|
Fourth Amended and Restated Credit Agreement, dated as of May 28, 2003, as amended and restated as of July 14, 2011, among Rent-A-Center, Inc., the several banks and other financial institutions or entities from time to time parties thereto, Bank of America, N.A., Compass Bank and Wells Fargo Bank, N.A., as syndication agents, and JPMorgan Chase Bank, N.A., as administrative agent (Incorporated herein by reference to Exhibit 10.1 to the registrant's Current Report on Form 8-K dated as of July 14, 2011.)
|
|
10.30†
|
Rent-A-Center East, Inc. Retirement Savings Plan for Puerto Rico Employees (Incorporated herein by reference to Exhibit 99.1 to the registrant's Registration Statement on Form S-8 filed January 28, 2011.)
|
|
10.31
|
First Amendment, dated as of April 13, 2012, to the Fourth Amended and Restated Credit Agreement, dated as of May 28, 2003, as amended and restated as of July 14, 2011, among Rent-A-Center, Inc., the several banks and other financial institutions or entities from time to time parties thereto, Bank of America, N.A., Compass Bank and Wells Fargo Bank, N.A., as syndication agents, and JPMorgan Chase Bank, N.A., as administrative agent (Incorporated herein by reference to Exhibit 10.31 to the Registrant's Quarterly Report on Form 10-Q for the quarter ended June 30, 2012.)
|
|
10.32
|
First Amendment to Franchisee Financing Agreement between ColorTyme Finance, Inc. and Citibank, N.A., dated as of July 25, 2012 (Incorporated herein by reference to Exhibit 10.32 to the registrant's Quarterly Report on Form 10-Q for the quarter ended September 30, 2012.)
|
|
10.33
|
Master Confirmation Agreement, dated as of May 2, 2013, between Rent-A-Center, Inc. and Goldman Sachs & Co. (Incorporated herein by reference to Exhibit 10.1 to the registrant's Current Report on Form 8-K dated as of May 2, 2013.)
|
|
10.34
|
Second Amendment to Franchisee Financing Agreement between ColorTyme Finance, Inc. and Citibank, N.A., dated as of August 30, 2013 (Incorporated herein by reference to Exhibit 10.34 to the registrant's Quarterly Report on Form 10-Q for the quarter ended September 30, 2013.)
|
|
16.1
|
Letter from Grant Thornton LLP to the Securities Exchange Commission dated December 19, 2012 (Incorporated herein by reference to Exhibit 16.1 to the registrant's Current Report on Form 8-K dated as of December 13, 2012.)
|
|
16.2
|
Letter from Grant Thornton LLP to the Securities Exchange Commission dated February 25, 2013 (Incorporated herein by reference to Exhibit 16.1 to the registrant's Current Report on Form 8-K dated as of February 25, 2013.)
|
|
21.1*
|
Subsidiaries of Rent-A-Center, Inc.
|
|
23.1*
|
Consent of KPMG LLP
|
|
23.2*
|
Consent of Grant Thornton LLP
|
|
31.1*
|
Certification pursuant to Rule 13a-14(a) of the Securities Exchange Act of 1934 implementing Section 302 of the Sarbanes-Oxley Act of 2002 by Robert D. Davis
|
|
31.2*
|
Certification pursuant to Rule 13a-14(a) of the Securities Exchange Act of 1934 implementing Section 302 of the Sarbanes-Oxley Act of 2002 by Michael S. Wilding
|
|
32.1*
|
Certification pursuant to 18 U.S.C. Section 1350 as adopted pursuant to Section 906 of the Sarbanes-Oxley Act of 2002 by Robert D. Davis
|
|
32.2*
|
Certification pursuant to 18 U.S.C. Section 1350 as adopted pursuant to Section 906 of the Sarbanes-Oxley Act of 2002 by Michael S. Wilding
|
|
101.INS*
|
XBRL Instance Document
|
|
101.SCH*
|
XBRL Taxonomy Extension Schema Document
|
|
101.CAL*
|
XBRL Taxonomy Extension Calculation Linkbase Document
|
|
101.DEF*
|
XBRL Taxonomy Extension Definition Linkbase Document
|
|
101.LAB*
|
XBRL Taxonomy Extension Label Linkbase Document
|
|
101.PRE*
|
XBRL Taxonomy Extension Presentation Linkbase Document
|
________
75
INDEX TO EXHIBITS
Exhibit No. Description
|
†
|
Management contract or compensatory plan or arrangement.
|
|
*
|
Filed herewith.
|
|
**
|
The XBRL-related information in Exhibit No. 101 to this Annual Report on Form 10-K is filed for purposes of Sections 11 and 12 of the Securities Act of 1933 and Section 18 of the Securities Exchange Act of 1934.
|
76
TABLE OF CONTENTS
Part IItem 1. BusinessItem 1A. Risk FactorsItem 1B. Unresolved Staff CommentsItem 2. PropertiesItem 3. Legal ProceedingsItem 4. Mine Safety DisclosuresPart IIItem 5. Market For Registrant S Common Equity, Related Stockholder Matters and Issuer Purchases Of Equity SecuritiesItem 6. Selected Financial DataItem 6. Selected Financial Data ContinuedItem 7. Management's Discussion and Analysis Of Financial Condition and Results Of OperationsItem 7A. Quantitative and Qualitative Disclosures About Market RiskItem 8. Financial Statements and Supplementary DataItem 9. Changes in and Disagreements with Accountants on Accounting and Financial DisclosureItem 9A. Controls and ProceduresItem 9B. Other InformationPart IIIItem 10. Directors, Executive Officers and Corporate Governance.(*)Item 11. Executive Compensation.(*)Item 12. Security Ownership Of Certain Beneficial Owners and Management and Related Stockholder Matters.(*)Item 13. Certain Relationships and Related Transactions, and Director Independence.(*)Item 14. Principal Accountant Fees and Services.(*)Part IVItem 15. Exhibits and Financial Statement Schedules