UNITED PARCEL SERVICE INC
10-Ks and 10-Qs
|
|
|
|
|
|
|
|
|
|
|
|
|
|
|
|
|
|
|
|
|
|
|
|
|
|
|
|
|
|
|
|
|
|
|
|
|
|
|
|
|
|
|
|
|
|
|
|
|
|
|
|
|
|
|
|
UNITED STATES
SECURITIES AND EXCHANGE COMMISSION
Washington, D.C. 20549
____________________________________
Form 10-K
FOR ANNUAL AND TRANSITION REPORTS
PURSUANT TO SECTIONS 13 OR 15(d) OF THE
SECURITIES EXCHANGE ACT OF 1934
(Mark One)
|
x
|
ANNUAL REPORT PURSUANT TO SECTION 13 OR 15(d) OF THE SECURITIES EXCHANGE ACT OF 1934
|
For the fiscal year ended
December 31, 2014
or
|
¨
|
TRANSITION REPORT PURSUANT TO SECTION 13 OR 15(d) OF THE SECURITIES EXCHANGE ACT OF 1934
|
For the transition period from to
Commission file number 001-15451
____________________________________

____________________________________
United Parcel Service, Inc.
(Exact Name of Registrant as Specified in Its Charter)
____________________________________
|
Delaware
|
|
58-2480149
|
|
(State or Other Jurisdiction of
Incorporation or Organization)
|
|
(I.R.S. Employer
Identification No.)
|
|
55 Glenlake Parkway, N.E. Atlanta, Georgia
|
|
30328
|
|
(Address of Principal Executive Offices)
|
|
(Zip Code)
|
(404) 828-6000
(Registrant’s telephone number, including area code)
____________________________________
Securities registered pursuant to Section 12(b) of the Act:
|
Title of Each Class
|
|
Name of Each Exchange on Which Registered
|
|
Class B common stock, par value $.01 per share
|
|
New York Stock Exchange
|
____________________________________
Securities registered pursuant to Section 12(g) of the Act:
Class A common stock, par value $.01 per share
(Title of Class)
Indicate by check mark if the registrant is a well-known seasoned issuer, as defined in Rule 405 of the Securities Act. Yes
x
No
¨
Indicate by check mark if the registrant is not required to file reports pursuant to Section 13 or Section 15(d) of the Exchange Act. Yes
¨
No
x
Indicate by check mark whether the registrant: (1) has filed all reports required to be filed by Section 13 or 15(d) of the Securities Exchange Act of 1934 during the preceding 12 months (or for such shorter period that the registrant was required to file such reports), and (2) has been subject to such filing requirements for the past 90 days. Yes
x
No
¨
Indicate by check mark whether the registrant has submitted electronically and posted on its corporate Web site, if any, every Interactive Data File required to be submitted and posted pursuant to Rule 405 of Regulation S-T during the preceding 12 months (or for such shorter period that the registrant was required to submit and post such files). Yes
x
No
¨
Indicate by check mark if disclosure of delinquent filers pursuant to Item 405 of Regulation S-K is not contained herein, and will not be contained, to the best of registrant’s knowledge, in definitive proxy or information statements incorporated by reference in Part III of this Form 10-K or any amendment to this Form 10-K.
x
Indicate by check mark whether the registrant is a large accelerated filer, an accelerated filer, a non-accelerated filer or a smaller reporting company. See definition of “accelerated filer”, “large accelerated filer” and “smaller reporting company” in Rule 12b-2 of the Exchange Act. Check one:
|
Large accelerated filer
x
|
|
Accelerated filer
¨
|
|
Non-accelerated filer
¨
|
|
Smaller reporting company
¨
|
Indicate by check mark whether the registrant is a shell company (as defined in Rule 12b-2 of the Exchange Act). Yes
¨
No
x
The aggregate market value of the class B common stock held by non-affiliates of the registrant was
$72,546,596,423
as of
June 30, 2014
. The registrant’s class A common stock is not listed on a national securities exchange or traded in an organized over-the-counter market, but each share of the registrant’s class A common stock is convertible into one share of the registrant’s class B common stock.
As of
February 18, 2015
, there were
200,480,468
outstanding shares of class A common stock and
702,058,256
outstanding shares of class B common stock.
DOCUMENTS INCORPORATED BY REFERENCE
Portions of the registrant’s definitive proxy statement for its annual meeting of shareowners scheduled for
May 7, 2015
are incorporated by reference into Part III of this report.
UNITED PARCEL SERVICE, INC.
ANNUAL REPORT ON FORM 10-K
TABLE OF CONTENTS
|
PART I
|
||
|
Item 1.
|
||
|
Item 1A.
|
||
|
Item 1B.
|
||
|
Item 2.
|
||
|
Item 3.
|
||
|
Item 4.
|
||
|
PART II
|
||
|
Item 5.
|
||
|
Item 6.
|
||
|
Item 7.
|
||
|
Item 7A.
|
||
|
Item 8.
|
||
|
Item 9.
|
||
|
Item 9A.
|
||
|
Item 9B.
|
||
|
PART III
|
||
|
Item 10.
|
||
|
Item 11.
|
||
|
Item 12.
|
||
|
Item 13.
|
||
|
Item 14.
|
||
|
PART IV
|
||
|
Item 15.
|
||
Cautionary Statement About Forward-Looking Statements
This report includes certain “forward-looking statements” within the meaning of the Private Securities Litigation Reform Act of 1995. Statements in the future tense, and all statements accompanied by terms such as “believe,” “project,” “expect,” “estimate,” “assume,” “intend,” “anticipate,” “target,” “plan,” and variations thereof and similar terms are intended to be forward-looking statements. We intend that all forward-looking statements we make will be subject to safe harbor protection of the federal securities laws pursuant to Section 27A of the Securities Act of 1933 and Section 21E of the Securities Exchange Act of 1934.
Our disclosure and analysis in this report, in our Annual Report to Shareholders and in our other filings with the Securities and Exchange Commission (“SEC”) contain forward-looking statements regarding our intent, belief and current expectations about our strategic direction, prospects and future results. From time to time, we also provide forward-looking statements in other materials we release as well as oral forward-looking statements. Such statements give our current expectations or forecasts of future events; they do not relate strictly to historical or current facts. Management believes that these forward-looking statements are reasonable as and when made. However, caution should be taken not to place undue reliance on any such forward-looking statements because such statements speak only as of the date when made.
Forward-looking statements are subject to certain risks and uncertainties that could cause actual results to differ materially from our historical experience and our present expectations or anticipated results. These risks and uncertainties are described in Part I, “Item 1A. Risk Factors” and may also be described from time to time in our future reports filed with the SEC. You should consider the limitations on, and risks associated with, forward-looking statements and not unduly rely on the accuracy of predictions contained in such forward-looking statements. We do not undertake any obligation to update forward-looking statements to reflect events, circumstances, changes in expectations, or the occurrence of unanticipated events after the date of those statements.
|
Item 1.
|
Business
|
Overview
United Parcel Service, Inc. (“UPS”) was founded in 1907 as a private messenger and delivery service in Seattle, Washington. Today, UPS is the world’s largest package delivery company, a leader in the U.S. less-than-truckload industry and the premier provider of global supply chain management solutions. We deliver packages each business day for
1.6
million shipping customers to
8.2
million receivers ("consignees") in over
220
countries and territories. In
2014
, we delivered an average of
18.0 million
pieces per day worldwide, or a total of 4.6 billion packages. Total revenue in
2014
was $
58.2 billion
.
We are a global leader in logistics, and we create value for our customers through solutions that lower costs, improve service and provide highly customizable supply chain control and visibility. Customers are attracted to our broad set of services that are delivered as promised through our integrated ground, air and ocean global network.
Our services and integrated network allow shippers to simplify their supply chains by using fewer carriers, and to adapt their transportation requirements and expenditures as their businesses evolve. Across our service portfolio, we also provide control and visibility of customers’ inventories and supply chains via our UPS technology platform. The information flow from UPS technology drives improvements for our customers, as well as for UPS, in reliability, flexibility, productivity and efficiency.
Particularly over the last decade, UPS has significantly expanded the scope of our capabilities to include more than package delivery. Our logistics and distribution capabilities give companies the power to easily expand their businesses to new markets around the world. By leveraging our international infrastructure, UPS enables our customers to bridge time zones, cultures, distances and languages to keep the entire supply chain moving smoothly.
We serve the global market for logistics services, which include transportation, distribution, forwarding, ground freight, ocean freight, air freight, brokerage and financing. We have three reportable segments: U.S. Domestic Package, International Package and Supply Chain & Freight, all of which are described below. For financial information concerning our reportable segments and geographic regions, refer to note 11 of our consolidated financial statements.
1
Business Strategy
Customers leverage our broad array of logistics capabilities; global presence in North America, Europe, Asia and Latin America; reliability; industry-leading technologies; and solutions expertise for competitive advantage in markets where they choose to compete. We prudently invest to expand our integrated global network and service portfolio. Technology investments create user-friendly shipping, e-commerce, logistics management and visibility tools for our customers, while supporting our ongoing effort to increase operational efficiencies.
Our service portfolio and investments are rewarded with among the best return on invested capital and operating margins in the industry. We have a long history of sound financial management. Our consolidated balance sheet reflects financial strength that few companies can match. Our Moody’s and Standard & Poor’s short-term credit ratings are P-1 and A-1, respectively. Our Moody’s and Standard & Poor’s long-term credit ratings are Aa3 and A+, respectively. We currently have a stable outlook from both Moody's and Standard & Poor’s. Cash generation is a significant strength of UPS. This gives us strong capacity to service our obligations and allows for distributions to shareowners, reinvestment in our businesses and the pursuit of growth opportunities.
We enable and are the beneficiaries of the following trends:
Expansion of Global Trade
Transcontinental and trade across borders are predicted to grow faster than U.S. and global gross domestic production for the foreseeable future. As a result, U.S. and international economies are becoming more inter-connected and dependent on foreign trade.
UPS plays an important role in global trade and is well positioned to take advantage of trade growth, wherever it occurs. Our global presence and productivity enhancing technologies allow customers to expand into new markets. We advocate the expansion of free trade, including the passage of regional trade pacts and the removal of trade barriers. Free trade is a catalyst for job creation, economic growth and improved living standards; additionally, it propels our growth.
Emerging Market Growth
Emerging market opportunities continue to expand. Over the next ten years, these markets are expected to represent the majority of global GDP growth, and an increasing proportion of global trade. Emerging markets are understandably a focus of investment and growth for our current customers; in addition, they will be a source of UPS’s next generation of customers. To take advantage of these opportunities, UPS will continue to make long-term investments in markets where our customers choose to grow. Over the past ten years, UPS has established a strong market presence in three leading emerging markets: China, Poland and Turkey. In the future, the Middle East, Latin America, Africa and Eastern Europe will become increasingly important for UPS.
Taken together, these two trends (expanding global trade and emerging market growth) underscore why our international business is a catalyst for UPS’s growth.
Increasing Need for Segment Expertise in the Integrated Carrier, Logistics and Transportation Space
We offer differentiated value propositions in several segments, including automotive and industrial manufacturing, retail, government, professional and consumer services, healthcare and high-tech.
Our industry-specific solutions are increasingly tailored to align with customer needs in each of these sectors. Staying abreast of industry trends positions us to anticipate business challenges in each industry. We deepen our understanding by studying these challenges and engaging with customers at the strategic planning stage. We then align our logistics expertise to address these business challenges to help our customers compete.
Our understanding of how macro and industry trends impact the stakeholders in each market allows us to develop commercial insights for our customers. These insights are incorporated into our sales-and-solution process and are shared with customers through direct engagement, industry forums and publications. By inviting our customers to leverage our capabilities to improve their overall industry performance, we help them achieve their business objectives and maintain our own competitiveness.
2
The combination of rising demand for healthcare services around the globe, new product innovations, increasing regulatory demands and downward pressure on reimbursement is creating both exciting opportunities and complex challenges for healthcare and life sciences companies. In today’s environment, healthcare logistics executives are most concerned with regulatory compliance, product security, supply chain cost management and product damage/spoilage. To address these challenges, more healthcare and life sciences companies are relying on partnerships with third party logistics providers that can provide efficient, scalable solutions that enable instant access to healthcare compliant infrastructure, provide options for temperature-sensitive transportation and storage capabilities and have expertise in the regulatory requirements of the markets they seek to enter.
UPS is in a unique position to offer our clients such solutions through the combination of our dedicated healthcare transportation and distribution capabilities which sit atop our vast, global integrated transportation network and are managed by a team of employees with healthcare logistics expertise. Over the past two years, we opened 15 new dedicated healthcare facilities on four continents, with our most recent additions in the United Kingdom, Mexico, Brazil and Poland. In total, we operate nearly seven million square feet of dedicated healthcare distribution space across an integrated network of 49 facilities. These facilities allow us to provide reliable, secure and cost-effective warehousing and distribution for healthcare and life sciences firms, which, in turn, allow them to easily navigate across and within borders.
Rapid technology innovation and growing worldwide demand for electronics are driving change in the already-dynamic high-tech industry. As the technology marketplace becomes more complex, high-tech companies must manage and optimize their supply chains to remain competitive. Every year, product lifecycles are getting shorter, dictating the need for high-tech companies to better predict demand and understand their logistics requirements. Increasingly, they are looking to third party logistics providers for support in product launches, distribution, post-sales support and reverse logistics.
We have the expertise these companies need, as well as, a global transportation network and integrated technology solutions that can generate supply chain efficiency. This means high-tech companies, large and small, can get their products to market faster, improve customer service and boost revenue. We offer global sourcing and a significant amount of repair space to leverage one of the largest networks of post-sales facilities in the world. With more than 950 field stocking locations in 147 countries, we help high-tech companies identify better ways to meet their crucial logistics needs. Our experience and global capabilities make us a strong partner in the high-tech industry.
We will continue to expand our industry-specific support by growing our physical footprint and enhancing our technology based on our deepening understanding of industry-specific needs. Our aim is to increase the number of customers benefiting from these solutions and gain their associated transportation and logistics business.
Logistics Outsourcing
Outsourcing supply chain management is becoming more prevalent, as customers increasingly view professional management and operation of their supply chains as a strategic advantage. This trend enables companies to focus on what they do best. We can meet our customers’ needs for outsourced logistics with our global capabilities in customized forwarding, transportation, warehousing, distribution, delivery and post-sales services. As we move deeper into customers’ supply chains, we do so with a shared vision on how to best equip our customers with transportation and logistics solutions to better serve their customers. We integrate our technology for efficiencies, visibility and control to ensure that we execute as promised and to provide peace of mind for our customers.
Retail e-Commerce Growth
Throughout much of the world, e-commerce growth continues to outpace traditional lines of business. Our integrated network puts UPS in an ideal position to capitalize on the shift towards residential deliveries. We continue to create new services, supported by UPS technology, that complement the traditional UPS premium home delivery service and address the needs of e-commerce shippers and consignees. Our offerings span a broad spectrum that supports retailers across their value chain, from global sourcing to distribution and returns. We offer cost-sensitive solutions such as UPS SurePost, for shipments where economy takes precedence over speed, and feature-rich solutions, such as our UPS My Choice service that provides consignees with revolutionary visibility and control of their inbound shipments.
UPS My Choice keeps members up-to-date on their parcels’ delivery status through proactive alerts, and offers flexible delivery options to control when and where deliveries occur. Following on the success of UPS My Choice in the U.S. (over 13 million members), we expanded the service to 15 additional countries and territories in the Americas and Europe regions in 2014. With UPS My Choice, consignees may direct the timing and location of their deliveries before a delivery attempt is made. We strive to give our customers the best delivery experience in the industry---delivery on the first attempt, where and when their customers want them.
3
When UPS My Choice members will not be home to accept a delivery, they can redirect packages to UPS Access Point locations. UPS Access Points are convenient locations - such as The UPS Store® and other local businesses - that offer easy package drop-off and pickup. With evening and weekend hours, UPS Access Point locations fit consumers’ schedules and enable UPS to get packages delivered faster. Shippers in 50 origin countries and territories can ship directly to UPS Access Point locations in 12 destination countries, giving shippers and consignees greater control over package deliveries. Our integrated UPS Access Point network in Europe now has nearly 14,000 locations across nine countries with the 2014 additions of Poland and Italy. We also expanded into North America to include locations in Canada, Mexico and the United States. By the end of 2015, we expect to have more than 20,000 locations worldwide. This move enhances our cross-border e-commerce offerings for retailers, while increasing choice for their customers, who can opt to pick up or drop off their parcels at retail locations that are convenient to them.
In 2014, UPS announced the purchase of i-parcel, LLC. This new offering focuses on innovative international e-commerce and logistics. The combination of UPS and i-parcel yields a global e-commerce solution that further strengthens our global business-to-consumer capabilities. This solution enables merchants to connect to over 100 million global shoppers by providing an integrated web platform, creating a localized look and feel for international shoppers. The technology empowers merchants to instantly localize their shopping cart value and provide a seamless shopping experience for international customers. This solution serves retail shoppers in over 100 countries and includes local currency options, fully-landed prices, and fully trackable, end-to-end delivery services.
Technology
Technology forms the foundation of our reliability and allows us to enhance the customer experience. Technology delivers value to our customers and returns to our shareowners. Recent developments that improve our operational efficiency, flexibility, reliability and customer experience include:
|
•
|
Continuing rollout of telematics to our international delivery fleet. We have completed the deployment of telematics to our domestic small package, freight forwarding and ground freight fleets. Telematics helps UPS determine a truck’s performance and condition by capturing data on more than 200 related elements, including speed, RPM, oil pressure, seat belt use, number of times the vehicle is placed in reverse and idling time. Together, improved data and driver coaching help reduce fuel consumption, emissions and maintenance costs, while improving driver safety. Additionally, customers experience more consistent pickup times and more reliable deliveries, thereby enhancing their profitability and competitiveness. By the end of 2014, telematics had been installed in over 82,000 vehicles.
|
|
•
|
Implementing our On Road Integrated Optimization and Navigation system (“ORION”), which employs advanced algorithms to determine the optimal route for each delivery while meeting service commitments. By the end of 2014, ORION was deployed to over 23,000 drivers.
|
|
•
|
Converting to keyless entry, which enables drivers to remotely turn the engine off with a button that will unlock the bulkhead door at the same time. Keyless entry is installed on all package cars in the U.S. and Canada.
|
|
•
|
Ramping up installations of our Next Generation Small Sort (“NGSS”) technology, which reduces the amount of memorization required to sort a package, thereby improving productivity and quality. Employees sort packages to bins tagged with flashing lights, rather than memorizing addresses, allowing us to dramatically reduce training time. NGSS is deployed to 285 sites globally and 64 additional sites are under evaluation for 2015.
|
We bring industry-leading UPS technology to our customers who, in turn, realize increased productivity, greater control of their supply chains and improved customer experience when they integrate with our systems. Customers benefit through offerings such as:
Shipping
WorldShip™, which is UPS’s flagship desktop shipping application, provides middle market and large customers with robust shipping capabilities. Customers can create custom labels, set up shipment alerts, create and upload customs documentation, track and export shipments, create reports and integrate with their enterprise resource planning and accounting systems to streamline shipping with real-time connectivity.
UPS marketplace shipping, which integrates
www.ups.com
with eBay® and Amazon®, allows marketplace sellers to easily ship their orders via
www.ups.com
or WorldShip. UPS marketplace shipping provides simplified shipment processing, access to order and shipment history, automatically updates the marketplace with tracking information and provides access to multiple payment options, including PayPal™.
4
Tracking and Visibility
UPS Quantum View® can help customers better manage shipments, facilitate tracking, allow for inbound volume planning, manage third-party shipping costs and automatically notify customers of incoming shipments. With visibility into transit times and delivery confirmations, customers can speed up their revenue cycle and collect accounts receivables more quickly while improving customer service.
International Trade Tools
UPS Paperless™ solutions allow customers to self-enroll in UPS Paperless™ Invoice and to upload shipping documents. These solutions enable customers to electronically transmit a commercial invoice, packing list or their own customs documents when shipping internationally. This eliminates redundant data entry and errors, while reducing customs delays and paper waste.
UPS TradeAbility® tools help customers effectively and confidently manage the movement of goods internationally in a timely, efficient and compliant manner.
Billing
The UPS Billing Center, a secure location for customers to view, download, manage and pay their UPS invoices, helps customers accelerate billing and payment processes. Customers can assign privileges with administrative controls, manage multiple accounts and create custom reports using a simple interface.
Integration
The UPS Developer Kit, which is comprised of multiple Application Programming Interfaces ("APIs"), helps customers streamline and automate their internal business processes. The UPS Developer Kit APIs allow customers to integrate a wide range of UPS functionality into their business systems and websites such as address validation, shipment scheduling, selection of shipping service levels, tracking and much more.
Business-to-Consumer
All UPS Access Point locations are pre-approved to ensure package safety, and are also equipped with the latest UPS technology to help make package pickup quick and convenient. Consumers are kept informed of the status of their package by tracking it on
www.ups.com
or on the UPS mobile application or website.
UPS My Choice®, which focuses on the consignee, has transformed the residential delivery experience. Receivers can direct the timing and circumstances of their deliveries using their computer, mobile devices or a Facebook app. This innovative service is powered by the complex integration of real-time route optimization and other technologies within our delivery network.
The Global Locator on
www.ups.com
was enhanced to give customers greater and faster access to UPS drop-off and pickup locations, including new UPS Access Point sites. The Global Locator has a new single search field with updated filters, location images, and location-specific promotions. Customers can also provide online feedback, e-mail search results, save favorite locations and access recent searches.
Mobile
UPS Mobile™, which includes the mobile website, m.ups.com, and apps for iPhone, iPad, Android and Kindle Fire devices, is readily available for most customers at any time. Customers can track, ship, find UPS locations, manage UPS My Choice shipments and receive shipment notifications on their mobile devices. The UPS Mobile apps and website were enhanced so that customers can now convert a rate estimate into a shipment, ship a package without logging in with a My UPS ID, compare shipping services more easily, select PayPal™ as a payment option, view details on shipping charges and utilize the redesigned Global Locator.
Reporting Segments and Products & Services
As a global leader in logistics, UPS offers a broad range of domestic and export delivery services; the facilitation of international trade; and the deployment of advanced technology to more efficiently manage the world of business. We seek to streamline our customers’ shipment processing and integrate critical transportation information into their own business processes, helping them to create supply chain efficiencies, better serve their customers and improve cash flow.
5
Global Small Package
UPS’s global small package operations provide time-definite delivery services for express letters, documents, small packages and palletized freight via air and ground services. We provide domestic delivery services within 54 countries and export services to more than
220
countries and territories around the world. We handle packages that weigh up to 150 pounds and are up to 165 inches in combined length and girth as well as palletized shipments weighing greater than 150 pounds. All of our package services are supported by numerous shipping, visibility and billing technologies.
UPS handles all levels of service (air, ground, domestic, international, commercial, residential) through one global integrated pickup and delivery network. All packages are commingled within our network, except when necessary to meet their specific service commitments. This enables one UPS driver to pick up our customers’ shipments, for any of our services, at the same scheduled time each day. Compared to companies with single service network designs, our integrated network uniquely provides operational and capital efficiencies while being more environmentally-friendly.
We offer same-day pickup of air and ground packages upon request. Customers can schedule pickups for one to five days a week, based on their specific needs. Additionally, our wholly-owned and partnered global network offers approximately 150,000 entry points where customers can tender a package to us at a location or time convenient to them. This combined network includes UPS drivers who can accept packages provided to them; UPS drop boxes; UPS Access Point locations; The UPS Store locations; authorized shipping outlets and commercial counters; alliance locations; and customer centers attached to UPS facilities. Some of these locations offer a full array of services including pickup, delivery and packing options, while others are drop-off locations only. We continually look for ways to enhance the customer experience by offering easy access to UPS.
The growth of online shopping has increased our customers’ needs for efficient and reliable returns, resulting in our development of a robust selection of returns services that are available in more than 145 countries. Options vary based on customer needs and country, and range from cost-effective solutions such as UPS Returns, to more-specialized services such as UPS Returns Exchange. UPS Returns enables shippers to provide their customers with a return shipping label, while UPS Returns Exchange simplifies product exchanges by delivering a replacement item and picking up a return item in the same stop, and assisting with the re-packaging process.
We operate one of the largest airlines in the world, with global operations centered at our Worldport hub in Louisville, Kentucky. Worldport sort capacity, currently at 416,000 packages per hour, has expanded over the years due to volume growth and a centralization effort. Our European air hub is located in Cologne, Germany, and we maintain Asia-Pacific air hubs in Shanghai, China; Shenzhen, China; and Hong Kong. Our regional air hub in Canada is located in Hamilton, Ontario, and our regional air hub for Latin America and the Caribbean is in Miami, Florida.
In the U.S., Worldport is supported by our regional air hubs in Columbia, South Carolina; Dallas, Texas; Ontario, California; Philadelphia, Pennsylvania; and Rockford, Illinois. This network design allows for cost-effective package processing in our most technology-enabled facilities while enabling us to use fewer, larger and more fuel-efficient aircraft. Our U.S. ground fleet serves all business and residential zip codes in the contiguous U.S.
U.S. Domestic Package Reporting Segment
UPS is a leader in time-definite, money-back guaranteed, small package delivery services. We offer a full spectrum of U.S. domestic guaranteed ground and air package transportation services. Depending on the delivery speed needed, customers can select from a range of guaranteed time and day-definite delivery options.
|
•
|
Customers can select from same day, next day, two day and three day delivery alternatives. Many of these services offer options that enable customers to specify a time-of-day guarantee for their delivery (e.g. by 8:30, 10:30, noon, end of day, etc.).
|
|
•
|
Customers can also leverage our extensive ground network to ship using our day-definite guaranteed ground service that serves every U.S. business and residential address. UPS delivers more ground packages than any other carrier, with nearly 13 million ground packages delivered on time every day in the U.S., most within one to three business days.
|
|
•
|
UPS also offers UPS SurePost, an economy residential ground service for customers with non-urgent, lightweight residential shipments. UPS SurePost is a contractual residential ground service that combines the consistency and reliability of the UPS Ground network with final delivery often provided by the U.S. Postal Service.
|
6
As U.S. online sales are estimated to nearly double by 2020, UPS invested over $1 billion in facility expansions and equipment modernization to better manage volume growth throughout the year, and to ensure a successful peak season in 2014 and beyond. Other significant improvements to effectively manage seasonal volume fluctuations included:
|
•
|
Enhancing Cyber Week operations in the U.S., including full ground and air pickup and delivery operations on Black Friday.
|
|
•
|
Using additional aircraft and regional air hubs to add significant capacity to UPS’s air network during critical periods.
|
|
•
|
Automating facilities to expand our existing capabilities through enhanced technology.
|
|
•
|
Adding new delivery vehicles and trailers, and increasing staffing to improve efficiency in all areas.
|
|
•
|
Updating
www.ups.com
and expanding UPS communications to enhance the timeliness and relevance of alerts when service disruptions occur.
|
Our significant investments in network capacity improvements and enhanced shipment visibility demonstrate our readiness to provide exceptional service and peace of mind to our customers.
International Package Reporting Segment
Our International Package reporting segment includes the small package operations in Europe, Asia, Canada and Latin America, the Indian sub-continent, the Middle East and Africa. UPS offers a wide selection of guaranteed day and time-definite international shipping services.
|
•
|
We offer three guaranteed time-definite express options (Express Plus, Express and Express Saver) to more locations than any other carrier.
|
|
•
|
In 2013, we introduced UPS Worldwide Express Freight for palletized shipments over 150 pounds. In early 2015, this service was enhanced to include 50 origins and 51 destinations, helping UPS customers to expand the footprint of their palletized shipments to major markets throughout the world. UPS Worldwide Express Freight leverages our unique combination of package and freight networks to provide industry leading transit times with a money-back guarantee.
|
|
•
|
For international shipments that do not require express services, UPS Worldwide Expedited offers a reliable, deferred, guaranteed day-definite service option. In 2013, we tripled the coverage area for UPS Worldwide Expedited, providing delivery in two-to-five business days to more than 220 countries and territories. We continue to expand our origin footprint for this service moving to over 80 origins in 2015. This expansion will help UPS customers magnify their global reach and balance delivery speed with cost, no matter where they ship.
|
|
•
|
For cross-border ground package delivery, we offer UPS Transborder Standard delivery services within Europe, between the U.S. and Canada and between the U.S. and Mexico.
|
Europe, our largest region outside of the U.S., accounts for roughly half of international revenue and is one of the primary drivers of our growth. Several factors provide significant opportunities, including the highly fragmented nature of the market and the fact that exports make up a significant part of Europe’s GDP. We believe there is a continued strong potential for growth in small package exports in Germany, the U.K., France, Italy, Spain and the Netherlands. To accommodate this growth, we expanded our main European air hub in Cologne, Germany in the first quarter of 2014; increasing capacity to process 190,000 packages per hour.
Asia remains attractive due to growth rates in intra-Asia trade and the expanding Chinese economy. We are bringing faster time-in-transit to customers focused on intra-Asia trade, and reducing transit days from Asia to Europe. Through added flight frequencies, we provide our customers the ability to ship next day to more places in Europe, guaranteed, than any other express carrier. We are continuing to build our presence in China through the expansion of our service capabilities, investing in our transportation network and strengthening brand awareness. During 2014 we opened a new Trans Pacific Air Hub at Taiwan Taoyuan International Airport, marking a 40% increase in size from the previous hub and increasing connectivity from Taiwan to key markets in the U.S. and Europe. Additionally, we serve more than 40 Asia-Pacific countries and territories through more than two dozen alliances with local delivery companies that supplement company-owned operations.
Additional international highlights include the following:
|
•
|
In South and Central America, we benefit from a strong regional economy. Our offerings include express package delivery in major cities as well as distribution and forwarding services. We continue to expand our network in Brazil, with plans to open nine new operating facilities strategically located in the state of Sao Paolo, set to be completed in May 2015. This enhancement will increase territorial coverage by 78% and improve time in transit throughout this key market.
|
7
|
•
|
We continue to grow our business organically in Mexico. We are well positioned with freight, domestic, international and distribution services. In 2014, we opened six new UPS Express centers strategically located across Mexico, including Mexico City, State of México, Jalisco and Quintana Roo. These new centers are aimed at increasing our presence among small and medium enterprises and the retail sector.
|
|
•
|
In February 2012, we broadened our European business-to-consumer service portfolio by acquiring Kiala S.A., a Belgium-based developer of a platform that enables e-commerce retailers to offer consumers the option of having goods delivered to a convenient retail location. Kiala was rebranded as UPS Access Point™ in the UPS portfolio of services. In 2014, we had nearly 14,000 Access Points in Europe after adding Poland and Italy to the existing seven countries that include Belgium, Germany, France, the UK, Luxembourg, Spain, and the Netherlands. There are also more than 700 Access Points in Canada, and in 2014 we added Mexico to the network. We expect to expand to over 20,000 locations throughout Europe and the Americas by the end of 2015.
|
|
•
|
During 2014, UPS MyChoice was expanded to 15 additional countries and territories: Canada, Austria, Belgium, Denmark, France, Germany, Italy, Mexico, the Netherlands, Poland, Puerto Rico, Spain, Sweden, Switzerland and the United Kingdom.
|
Supply Chain & Freight Reporting Segment
The Supply Chain & Freight segment consists of our forwarding and logistics services, our UPS Freight business, and our financial offerings through UPS Capital. Supply chain complexity creates demand for a global service offering that incorporates transportation, distribution and international trade and brokerage services, with financial and information services. We meet this demand by offering a broad array of supply chain services in over 195 countries and territories.
We have continued to acquire healthcare logistics companies to expand our transportation and distribution networks in Europe. In February 2014, we acquired Polar Speed Distribution Limited, a U.K.-based healthcare transportation provider specializing in refrigerated ground transportation of temperature-sensitive medicines and medical devices. In December 2014, we announced the acquisition of Poltraf Sp. Z o.o., a Polish-based healthcare logistics company that provides direct distribution and compliant logistics services to pharmaceutical and medical device customers in the fast-growing healthcare markets of Central and Eastern Europe (this acquisition is expected to close in the first half of 2015). Both of these acquisitions are part of our ongoing global growth and investment strategy.
In 2014, we also expanded our global logistics network by more than two million square feet, including 1.5 million square feet in North America. We added contract logistics facilities in key markets including Brazil, Chile, Netherlands and China (Beijing). Our continued investment in China brings the total to more than 130 owned and agent contract logistics facilities, covering 87 cities. These facilities provide distribution and warehousing solutions to shippers who want to reach customers within China and demonstrate our continued commitment to serving China's emerging middle class. We broadened our North American Health Care service offering by developing a healthcare-compliant network of 36 Field Stocking Locations ("FSLs"). This capability helps companies quickly send medical devices to hospitals and care facilities, while better managing inventory costs, regulatory compliance requirements, and end-to-end visibility of shipments.
Freight Forwarding
UPS is one of the largest U.S. domestic air freight carriers and among the top international air freight forwarders globally. UPS offers a portfolio of guaranteed and non-guaranteed global air freight services. Additionally, as one of the world’s leading non-vessel operating common carriers, UPS also provides ocean freight full-container load and less-than-container load transportation services between most major ports around the world.
Customs Brokerage
UPS is among the world’s largest customs brokers by both the number of shipments processed annually and by the number of dedicated brokerage employees worldwide. We provide our customers with customs clearance, trade management and international trade consulting services. In 2014, UPS expanded its brokerage capabilities in Costa Rica through the integration of the 2013 acquisition of SEISA Brokerage.
Logistics and Distribution
UPS Logistics offers the following services:
|
•
|
Distribution Services: Our comprehensive distribution services are provided through a global network of distribution centers that manage the flow of goods from receiving to storage and order processing to shipment. UPS also provides specialized services to streamline supply chains in the healthcare, high tech, retail, industrial manufacturing and aerospace industries. Together, these services allow companies to save time and money by minimizing capital investment and positioning products closer to their customers.
|
8
|
•
|
Post Sales: Post Sales services support goods after they have been delivered or installed in the field. The four core service offerings within Post Sales include: (1) Critical Parts Fulfillment; (2) Reverse Logistics; (3) Test, Repair, and Refurbish and (4) Network and Parts Planning. We leverage our global distribution network of over 950 FSLs to ensure that the right type and quantity of our customers’ stock is in the right location to meet the needs of their end-customers. This solution allows our customers to maximize service to their end-customers while reducing costs.
|
|
•
|
UPS Mail Innovations: UPS Mail Innovations offers an efficient, cost-effective method for sending lightweight parcels and flat mail to global addresses from the U.S. We pick up customers’ domestic and international mail, and then sort, post, manifest and expedite the secured mail containers to the destination postal service for last-mile delivery.
|
|
•
|
UPS Express Critical: UPS Express Critical provides a broad range of urgent transportation options ranging from lightweight to heavyweight shipments around the world. Our experienced team can quickly assess a critical situation, identify transportation alternatives and implement delivery solutions that meets customers’ time and cost requirements.
|
UPS Freight
UPS Freight offers regional, inter-regional and long-haul less-than-truckload (“LTL”) services, as well as full truckload services, in all 50 states, Canada, Puerto Rico, Guam, the U.S. Virgin Islands and Mexico. UPS Freight provides reliable LTL service backed by a day-definite, on-time guarantee at no additional cost. Additionally, many user-friendly small package technology offerings are available for freight including: UPS WorldShip; Billing Center and Quantum View. These technology systems allow customers to process and track LTL shipments, create electronic bills of lading and reconcile billing.
UPS Capital
By leveraging more than 107 years of transportation and global supply chain expertise, UPS Capital, a subsidiary of UPS, provides insurance, financing and payment services that are unique, relevant and competitive. UPS Capital helps companies protect themselves from risk, improve cash flow, and accelerate and protect payments. UPS is the only logistics company in the world that offers this breadth of in-house financial and insurance solutions, providing customers with a single source for all of their logistics needs.
Sustainability
UPS’s business and corporate responsibility strategies pursue a common interest to increase the vitality and environmental sustainability of the global economy by aggregating the shipping activity of millions of businesses and individuals worldwide into a single, highly efficient logistics network. This provides benefits to:
|
•
|
UPS, by ensuring strong demand for our services.
|
|
•
|
The economy, by making global supply chains more efficient and less expensive.
|
|
•
|
The environment, by enabling our global customers to leverage UPS’s carbon efficiency and thereby reduce the carbon intensity of their supply chains.
|
|
•
|
Communities, by connecting individuals to global markets and providing the economic empowerment that can help facilitate positive social change.
|
We pursue sustainable business practices worldwide through operational efficiency, fleet advances, facility engineering projects and conservation-enabling technology and service offerings. We help our customers do the same.
We consider stakeholder engagement an essential aspect of corporate governance and collaborate regularly with a global diverse set of stakeholders on sustainability issues. In addition, we engage stakeholders directly in our sustainability strategy through our corporate materiality assessment process. In 2013, we conducted our second formal assessment, working once again with the non-profit organization Business for Social Responsibility ("BSR") to evaluate significant sustainability issues (economic, environmental and social), and ranked each issue by importance based on multiple stakeholder feedback. Our most material sustainability issues primarily involve our energy use, emissions and workplace policies. The full results of the assessment are available at
www.ups.com/sustainability
.
9
Sustainability highlights in
2014
include:
|
•
|
One of Corporate Responsibility’s “100 Best Corporate Citizens” for the 5th consecutive year.
|
|
•
|
Recognized by Ethisphere Institute as one of the “World’s Most Ethical Companies” for the 8th consecutive year.
|
|
•
|
Named to Interbrand's “Best Global Green Brands” for the 4th consecutive year. We ranked 28th and were the only company in the transportation sector to make the top 50.
|
|
•
|
Recognized as a constituent of the Dow Jones Sustainability North America Index for the 10th consecutive year; in addition, we were included on the Dow Jones Sustainability World Index for the 2nd consecutive year.
|
|
•
|
Recognized as a constituent of the NASDAQ OMX Global Sustainability Index for the 5th consecutive year.
|
|
•
|
Recognized as the top community-minded industrial company by The Civic 50.
|
|
•
|
Achieved a score of 100% in response to the Carbon Disclosure Project. It is the 4th consecutive year we have achieved a rating at or above 99%.
|
More information on how UPS addresses its most significant sustainability issues is available in the UPS Corporate Sustainability Report and on the UPS Sustainability website.
Community
We believe that strong communities are vital to the success of our company. By combining our philanthropy with the volunteer time and talents of our employees, UPS helps drive positive change for organizations and communities in need across the globe. The highlights of our corporate citizenship efforts in
2014
include:
|
•
|
Local non-profits around the world received nearly 1.9 million hours of volunteer service from UPS employees participating in our Neighbor-to-Neighbor program.
|
|
•
|
The UPS Foundation, which oversees corporate citizenship efforts for the company, invested $104 million in donations of both cash and in-kind services to global causes primarily in four focus areas—community safety, environmental sustainability, diversity and volunteerism.
|
|
•
|
UPS employees, both active and retired, contributed approximately $52 million to United Way in 2014 which was matched by a corporate contribution of $8 million.
|
|
•
|
Through The UPS Foundation we have the opportunity to support our global communities to offset carbon, support clean water, reduce poverty and help individuals sustain their lives through the planting of trees. The UPS Global Forestry Initiative, which began in 2013, is the signature program of The UPS Foundation’s Environmental Focus area. By the end of 2014, we have supported the planting of three million trees worldwide.
|
|
•
|
UPS continued to aid communities impacted by disasters through our UPS Humanitarian Relief program, by providing our logistics expertise, skilled volunteers, capacity building support and in-kind services. In 2014, UPS coordinated more than 263 humanitarian relief shipments across 43 countries and provided funding and logistics support to strengthen long-term recovery efforts of communities impacted by the Ebola epidemic, the Syrian Refugee Crisis and severe weather events in the Southern and Midwestern regions of the U.S.
|
|
•
|
Nearly 6,700 teenagers and novice drivers in the U.S., Canada, the U.K., Germany and China participated in UPS Road Code. This safety program for new drivers features UPS employees as instructors – a role where they share driving knowledge and safety tips amassed over our long history of safe driving.
|
Reputation
Great brands require connecting with customers. In working to develop these connections, UPS continually receives high accolades from independent brand evaluations. In
2014
, the company ranked 27th on Interbrand’s Best Global Brands and 16th on Millward Brown's BrandZ Most Valuable Global Brands. Additionally, in Forbes’ “America’s Most Reputable Companies 2014,” UPS ranked 2nd among 150 large publicly-traded US companies rated by the Reputation Institute.
10
Employees
The strength of our company is our people, working together with a common purpose. We had approximately
435,000
employees (excluding temporary seasonal employees) as of
December 31, 2014
, of which
354,000
are in the U.S. and
81,000
are located internationally. Our global workforce includes approximately
75,000
management employees (38% of whom are part-time) and
360,000
hourly employees (47% of whom are part-time).
As of December 31, 2014, we had approximately 270,000 employees employed under a national master agreement and various supplemental agreements with local unions affiliated with the International Brotherhood of Teamsters (“Teamsters”). During 2014, the Teamsters ratified a new national master agreement with UPS that will expire on July 31, 2018.
We have approximately 2,600 pilots who are employed under a collective bargaining agreement with the Independent Pilots Association ("IPA"), which became amendable at the end of 2011. In February 2014, UPS and the IPA requested and received mediation by the National Mediation Board for the ongoing contract negotiations.
Our airline mechanics are covered by a collective bargaining agreement with Teamsters Local 2727, which became amendable November 1, 2013. In addition, approximately 3,100 of our auto and maintenance mechanics who are not employed under agreements with the Teamsters are employed under collective bargaining agreements with the International Association of Machinists and Aerospace Workers (“IAM”). In 2014, the IAM ratified new collective bargaining agreements that will expire on July 31, 2019.
The experience of our management team continues to be an organizational strength. Nearly 34% of our full-time managers have more than 20 years of service with UPS.
We believe that our relations with our employees are good. We periodically survey all our employees to determine their level of job satisfaction. Areas of concern receive management attention as we strive to keep UPS the employer-of-choice among our employees. We consistently receive numerous awards and wide recognition as an employer-of-choice, resulting in part from our emphasis on diversity and corporate citizenship.
Safety
Health and Safety is a core value at UPS and an enduring belief that the well-being of our people, business partners and the public is of utmost importance. We train our people to avoid injury to themselves and others in all aspects of their work. We do not tolerate unsafe work practices.
We recognize employees for health, wellness, and safety accomplishments. We provide programs that help promote the health and wellness of employees and their families, and the safety of our operations. We are committed to fostering the most effective safety practices in our work environment. By meeting our high safety standards and goals, we contribute to the well-being of our people, company, and the communities we serve.
We use an all-encompassing Comprehensive Health and Safety Process ("CHSP") to prevent occupational illnesses, injuries and auto crashes, as well as promote wellness through the development of workplace programs. The foundation of this process is our co-chaired employee and management health and safety committees. Together they conduct facility and equipment audits, perform work practice and behavior analysis, conduct training and recommend work process and equipment changes.
The components of CHSP are:
|
•
|
Personal Value.
Which is the foundation and forms the base of our safety and wellness culture.
|
|
•
|
Management Commitment and Employee Involvement
- Where employees take an active role in their own safety as well as their fellow workers and are supported by management. All operations management commit to providing a work environment that is conducive to the well-being and safety of their employees.
|
|
•
|
Work Site Analysis.
Which includes injury and auto crash data analysis, behavior observations and facility and equipment audits to identify gaps and develop solutions. Our operations managers are responsible for their employees' safety results. We investigate every injury and auto crash and develop prevention activities.
|
|
•
|
Hazard Prevention and Control.
Where solutions are developed and documented to ensure identified risks have been mitigated.
|
11
|
•
|
Safety Education and Training.
Employees who are healthy and well-trained in proper methods are more safe and efficient in performing their jobs. Our approach starts with training the trainer. All trainers are certified to ensure that they have the skills and motivation to effectively instruct new employees. All new employees receive safety training during orientation and in the work area. In addition, each new driver receives extensive classroom and online instruction, as well as on-road training.
|
Other components to ensure the safety of our people and fleet include:
|
•
|
Wellness.
We have a "Five Being Habits" wellness program that turns health and wellness knowledge into actionable measures. These habits are designed to enable employees and their families to take positive steps toward healthy lifestyles.
|
|
•
|
Recognition.
We have a well-defined safe driving honor plan to recognize our drivers when they achieve accident-free milestones. We have more than 7,200 drivers enshrined in our coveted Circle of Honor for drivers who have driven 25 years or more without an avoidable auto crash.
|
|
•
|
Preventive Maintenance.
We
have a comprehensive Preventive Maintenance Program to ensure the safety of our fleet. Our fleet is managed and monitored electronically to ensure that each vehicle is serviced at a specific time to prevent malfunction or breakdown.
|
Competition
UPS is a global leader in logistics. We offer a broad array of services in the package and freight delivery industry and, therefore, compete with many different local, regional, national and international carriers. Our competitors include worldwide postal services, various motor carriers, express companies, freight forwarders, air couriers and others. Through our supply chain service offerings, we compete with a number of providers in the supply chain, financial services and information technology industries.
Competitive Strengths
Our competitive strengths include:
Global Network.
We believe that our integrated global ground and air network is the most extensive in the industry. We provide all types of package service (air, ground, domestic, international, commercial and residential) through a single pickup and delivery service network. We also have extensive air freight, ocean freight, ground freight and logistics networks that provide additional capabilities in the global transportation and logistics market.
Our sophisticated engineering systems allow us to optimize our network efficiency and asset utilization on a daily basis. This unique, integrated global business model creates consistent and superior returns.
Global Presence.
UPS serves more than
220
countries and territories around the world. We have a significant presence in all of the world’s major economies.
Leading-edge Technology.
We are a global leader in developing technology that helps our customers optimize their shipping and logistics business processes to lower costs, improve service and increase efficiency.
Technology powers virtually every service we offer and every operation we perform. Our technology offerings are driven by our customers’ needs. We offer a variety of online service options that enable our customers to integrate UPS functionality into their own businesses not only to send, manage and track their shipments conveniently, but also to provide their customers with better information services. We provide the infrastructure for an Internet presence that extends to tens of thousands of customers who have integrated UPS tools directly into their own websites.
Broad Portfolio of Services.
Our portfolio of services enables customers to choose the delivery option that is most appropriate for their requirements. Increasingly, our customers benefit from business solutions that integrate many UPS services in addition to package delivery. For example, our supply chain services—such as freight forwarding, customs brokerage, order fulfillment and returns management—help improve the efficiency of the supply chain management process.
Customer Relationships.
We focus on building and maintaining long-term customer relationships. We serve
1.6
million pickup customers and
8.2
million delivery customers daily. Cross-selling small package, supply chain and freight services across our customer base is an important growth mechanism for UPS.
Brand Equity.
We have built a leading and trusted brand that stands for quality service, reliability and product innovation. The distinctive appearance of our vehicles and the professional courtesy of our drivers are major contributors to our brand equity.
12
Distinctive Culture.
We believe that the dedication of our employees results in large part from our distinctive “employee-owner” concept. Our employee stock ownership tradition dates from 1927, when our founders, who believed that employee stock ownership was a vital foundation for successful business, first offered stock to employees. To facilitate employee stock ownership, we maintain several stock-based compensation programs.
Our long-standing policy of “promotion from within” complements our tradition of employee ownership, and this policy reduces the need for us to hire managers and executive officers from outside UPS. The majority of our management team began their careers as full-time or part-time hourly UPS employees, and have spent their entire careers with us. Many of our executive officers have more than 30 years of service with UPS and have accumulated a meaningful ownership stake in our company. Therefore, our executive officers have a strong incentive to effectively manage UPS, which benefits all our shareowners.
Financial Strength.
Our balance sheet reflects financial strength that few companies can match. Our financial strength gives us the resources to achieve global scale; to invest in employee development, technology, transportation equipment and facilities; to pursue strategic opportunities that facilitate our growth; to service our obligations; and to return value to our shareowners in the form of dividends, share repurchases and steady share growth.
Government Regulation
Air Operations
The U.S. Department of Transportation (“DOT”), the Federal Aviation Administration (“FAA”), and the U.S. Department of Homeland Security, through the Transportation Security Administration (“TSA”), have regulatory authority over United Parcel Service Co.’s (“UPS Airlines’”) air transportation services. The Federal Aviation Act of 1958, as amended, is the statutory basis for DOT and FAA authority and the Aviation and Transportation Security Act of 2001, as amended, is the basis for TSA aviation security authority.
The DOT’s authority primarily relates to economic aspects of air transportation, such as discriminatory pricing, non-competitive practices, interlocking relations and cooperative agreements. The DOT also regulates, subject to the authority of the President of the United States, international routes, fares, rates and practices, and is authorized to investigate and take action against discriminatory treatment of U.S. air carriers abroad. International operating rights for U.S. airlines are usually subject to bilateral agreement between the U.S. and foreign governments. UPS Airlines has international route operating rights granted by the DOT and we may apply for additional authorities when those operating rights are available and are required for the efficient operation of our international network. The efficiency and flexibility of our international air transportation network is dependent on DOT and foreign government regulations and operating restrictions.
The FAA’s authority primarily relates to safety aspects of air transportation, including aircraft operating procedures, transportation of hazardous materials, record keeping standards and maintenance activities, and personnel. In 1988, the FAA granted us an operating certificate, which remains in effect so long as we meet the safety and operational requirements of the applicable FAA regulations. In addition, we are subject to non-U.S. government regulation of aviation rights involving non-U.S. jurisdictions, and non-U.S. customs regulation.
UPS aircraft maintenance programs and procedures, including aircraft inspection and repair at periodic intervals, are approved for all aircraft under FAA regulations. The future cost of repairs pursuant to these programs may fluctuate according to aircraft condition, age and the enactment of additional FAA regulatory requirements.
The TSA regulates various security aspects of air cargo transportation in a manner consistent with the TSA mission statement to “protect the Nation’s transportation systems to ensure freedom of movement for people and commerce.” UPS Airlines, and specified airport and off-airport locations, are regulated under TSA regulations applicable to the transportation of cargo in an air network. In addition, personnel, facilities and procedures involved in air cargo transportation must comply with TSA regulations.
UPS Airlines, along with a number of other domestic airlines, participates in the Civil Reserve Air Fleet (“CRAF”) program. Our participation in the CRAF program allows the U.S. Department of Defense (“DOD”) to requisition specified UPS Airlines wide-body aircraft for military use during a national defense emergency. The DOD compensates us for the use of aircraft under the CRAF program. In addition, participation in CRAF entitles UPS Airlines to bid for military cargo charter operations.
13
Ground Operations
Our ground transportation of packages in the U.S. is subject to the DOT’s and the states’ jurisdiction with respect to the regulation of operations, safety, insurance and hazardous materials. We are subject to similar regulation in many non-U.S. jurisdictions.
The Postal Reorganization Act of 1970 created the U.S. Postal Service as an independent establishment of the executive branch of the federal government, and created the Postal Rate Commission, an independent agency, to recommend postal rates. The Postal Accountability and Enhancement Act of 2006 amended the 1970 Act to give the re-named Postal Regulatory Commission revised oversight authority over many aspects of the Postal Service, including postal rates, product offerings and service standards. We sometimes participate in the proceedings before the Postal Regulatory Commission in an attempt to secure fair postal rates for competitive services.
Customs
We are subject to the customs laws in the countries in which we operate, regarding the import and export of shipments, including those related to the filing of documents on behalf of client importers and exporters.
Environmental
We are subject to federal, state and local environmental laws and regulations across all of our business units. These laws and regulations cover a variety of processes, including, but not limited to: proper storage, handling, and disposal of hazardous and other waste; managing wastewater and stormwater; monitoring and maintaining the integrity of underground storage tanks; complying with laws regarding clean air, including those governing emissions; protecting against and appropriately responding to spills and releases; and communicating the presence of reportable quantities of hazardous materials to local responders. UPS has established site- and activity-specific environmental compliance and pollution prevention programs to address our environmental responsibilities and remain compliant. In addition, UPS has created numerous programs which seek to minimize waste and prevent pollution within our operations.
Other Regulations
We are subject to numerous other U.S. federal and state laws and regulations, in addition to applicable foreign laws, in connection with our package and non-package businesses in the countries in which we operate. These laws and regulations include those enforced by U.S. Customs and Border Protection and other agencies of the U.S. Department of Homeland Security, the U.S. Department of Treasury, the Federal Maritime Commission, the U.S. Drug Enforcement Administration, the U.S. Food and Drug Administration and the U.S. Department of Agriculture.
Where You Can Find More Information
UPS maintains a website at
www.ups.com
. Our annual report on Form 10-K, quarterly reports on Form 10-Q, current reports on Form 8-K, and any amendments to those reports filed or furnished pursuant to Section 13(a) of the Securities Exchange Act of 1934 are made available through our website
www.investors.ups.com
as soon as reasonably practical after we electronically file or furnish the reports to the SEC. Also available on the Corporation’s website are the Company’s Corporate Governance Guidelines and Committee Charters. However, information on these websites is not incorporated by reference into this report or any other report filed with or furnished to the SEC.
14
We have adopted a written Code of Business Conduct that applies to all of our directors, officers and employees, including our principal executive officer and senior financial officers. It is available in the governance section of the investor relations website, located at
www.investors.ups.com
. In the event that we make changes in, or provide waivers from, the provisions of the Code of Business Conduct that the SEC requires us to disclose, we intend to disclose these events in the governance section of our investor relations website.
Our Corporate Governance Guidelines and the charters for our Audit Committee, Compensation Committee and Nominating and Corporate Governance Committee are also available in the governance section of the investor relations website.
Our sustainability report, which describes our activities that support our commitment to acting responsibly and contributing to society, is available at
www.sustainability.ups.com
. We provide the addresses to our Internet sites solely for the information of investors. We do not intend for any addresses to be active links or to otherwise incorporate the contents of any website into this report.
|
Item 1A.
|
Risk Factors
|
You should carefully consider the following factors, which could materially affect our business, financial condition or results of operations. You should read these Risk Factors in conjunction with “Management’s Discussion and Analysis of Financial Condition and Results of Operations” in Item 7 and our Consolidated Financial Statements and related notes in Item 8.
General economic conditions, both in the U.S. and internationally, may adversely affect our results of operations.
We conduct operations in over
220
countries and territories. Our U.S. and international operations are subject to normal cycles affecting the economy in general, as well as the local economic environments in which we operate. The factors that create cyclical changes to the economy and to our business are beyond our control, and it may be difficult for us to adjust our business model to mitigate the impact of these factors. In particular, our business is affected by levels of industrial production, consumer spending and retail activity, and our business, financial position and results of operations could be materially affected by adverse developments in these aspects of the economy.
We face significant competition which could adversely affect our business, financial position and results of operations.
We face significant competition on a local, regional, national and international basis. Our competitors include the postal services of the U.S. and other nations, various motor carriers, express companies, freight forwarders, air couriers and others. Competition may also come from other sources in the future. Some of our competitors have cost and organizational structures that differ from ours and may offer services and pricing terms that we may not be willing or able to offer. If we are unable to timely and appropriately respond to competitive pressures, our business, financial position and results of operations could be adversely affected.
The transportation industry continues to consolidate and competition remains strong. As a result of consolidation, our competitors may increase their market share and improve their financial capacity, and may strengthen their competitive positions. Business combinations could also result in competitors providing a wider variety of services and products at competitive prices, which could adversely affect our financial performance.
Changes in our relationships with our significant customers, including the loss or reduction in business from one or more of them, could have an adverse impact on us.
No single customer accounts for 10% or more of our consolidated revenue. We do not believe the loss of any single customer would materially impair our overall financial condition or results of operations; however, collectively, some of our large customers might account for a relatively significant portion of the growth in revenue in a particular quarter or year. These customers can drive the growth in revenue for particular services based on factors such as: new customer product launches; the seasonality associated with the fourth quarter holiday season; business mergers and acquisitions; and the overall fast growth of a customer's underlying business. These customers could choose to divert all or a portion of their business with us to one of our competitors, demand pricing concessions for our services, require us to provide enhanced services that increase our costs, or develop their own shipping and distribution capabilities. If these factors drove some of our large customers to cancel all or a portion of their business relationships with us, it could materially impact the growth in our business and the ability to meet our current and long-term financial forecasts.
15
Our business is subject to complex and stringent regulation in the U.S. and internationally.
We are subject to complex and stringent aviation, transportation, environmental, security, labor, employment and other governmental laws, regulations and policies, both in the U.S. and in the other countries in which we operate. In addition, our business is impacted by laws, regulations and policies that affect global trade, including tariff and trade policies, export requirements, taxes, monetary policies and other restrictions and charges. Changes in laws, regulations and policies and the related interpretations may alter the landscape in which we do business and may affect our costs of doing business. The impact of new laws, regulations and policies cannot be predicted. Compliance with new laws and regulations may increase our operating costs or require significant capital expenditures. Any failure to comply with applicable laws or regulations in the U.S. or in any of the countries in which we operate could result in substantial fines or possible revocation of our authority to conduct our operations, which could adversely affect our financial performance.
Increased security requirements could impose substantial costs on us and we could be the target of an attack or have a security breach.
As a result of concerns about global terrorism and homeland security, governments around the world have adopted or may adopt stricter security requirements that will result in increased operating costs for businesses in the transportation industry. These requirements may change periodically as a result of regulatory and legislative requirements and in response to evolving threats. We cannot determine the effect that these new requirements will have on our cost structure or our operating results, and these rules or other future security requirements may increase our costs of operations and reduce operating efficiencies. Regardless of our compliance with security requirements or the steps we take to secure our facilities or fleet, we could be the target of an attack or security breaches could occur, which could adversely affect our operations or our reputation.
We may be affected by global climate change or by legal, regulatory or market responses to such a potential change.
Concern over climate change, including the impact of global warming, has led to significant federal, state and international legislative and regulatory efforts to limit greenhouse gas (“GHG”) emissions. For example, in the past several years, the U.S. Congress has considered various bills that would regulate GHG emissions. While these bills have not yet received sufficient Congressional support for enactment, some form of federal climate change legislation is possible in the future. Even in the absence of such legislation, the Environmental Protection Agency, spurred by judicial interpretation of the Clean Air Act, may regulate GHG emissions, especially aircraft or diesel engine emissions, and this could impose substantial costs on us. These costs include an increase in the cost of the fuel and other energy we purchase and capital costs associated with updating or replacing our aircraft or vehicles prematurely. Until the timing, scope and extent of any future regulation becomes known, we cannot predict its effect on our cost structure or our operating results. It is reasonably possible that such legislation or regulation could impose material costs on us. Moreover, even without such legislation or regulation, increased awareness and any adverse publicity in the global marketplace about the GHGs emitted by companies in the airline and transportation industries could harm our reputation and reduce customer demand for our services, especially our air services.
Strikes, work stoppages and slowdowns by our employees could adversely affect our business, financial position and results of operations.
A significant number of our employees are employed under a national master agreement and various supplemental agreements with local unions affiliated with the Teamsters. In addition, our airline pilots, airline mechanics, ground mechanics and certain other employees are employed under other collective bargaining agreements. Strikes, work stoppages and slowdowns by our employees could adversely affect our ability to meet our customers' needs, and customers may do more business with competitors if they believe that such actions or threatened actions may adversely affect our ability to provide services. We may face a permanent loss of customers if we are unable to provide uninterrupted service, and this could adversely affect our business, financial position and results of operations. The terms of future collective bargaining agreements also may affect our competitive position and results of operations.
16
We are exposed to the effects of changing prices of energy, including gasoline, diesel and jet fuel, and interruptions in supplies of these commodities.
Changing fuel and energy costs may have a significant impact on our operations. We require significant quantities of fuel for our aircraft and delivery vehicles and are exposed to the risk associated with variations in the market price for petroleum products, including gasoline, diesel and jet fuel. We mitigate our exposure to changing fuel prices through our indexed fuel surcharges and we may also enter into hedging transactions from time to time. If we are unable to maintain or increase our fuel surcharges, higher fuel costs could adversely impact our operating results. Even if we are able to offset the cost of fuel with our surcharges, high fuel surcharges may result in a mix shift from our higher-yielding air products to lower-yielding ground products or an overall reduction in volume. If fuel prices rise sharply, even if we are successful in increasing our fuel surcharge, we could experience a lag time in implementing the surcharge, which could adversely affect our short-term operating results. There can be no assurance that our hedging transactions will be effective to protect us from changes in fuel prices. Moreover, we could experience a disruption in energy supplies, including our supply of gasoline, diesel and jet fuel, as a result of war, actions by producers, or other factors beyond our control, which could have an adverse effect on our business.
Changes in exchange rates or interest rates may have an adverse effect on our results.
We conduct business across the globe with a significant portion of our revenue derived from operations outside the United States. Our operations in international markets are affected by changes in the exchange rates for local currencies, and in particular the Euro, British Pound Sterling, Canadian Dollar, Chinese Renminbi and Hong Kong Dollar.
We are exposed to changes in interest rates, primarily on our short-term debt and that portion of our long-term debt that carries floating interest rates. The impact of a 100-basis-point change in interest rates affecting our debt is discussed in the “Quantitative and Qualitative Disclosures about Market Risk” section of this report. Additionally, changes in interest rates impact the valuation of our pension and postretirement benefit obligations and the related benefit cost recognized in the income statement. The impact of changes in interest rates on our pension and postretirement benefit obligations and costs is discussed further in the "Critical Accounting Policies and Estimates" section of this report.
We monitor and manage our exposures to changes in currency exchange rates and interest rates, and make use of derivative instruments to mitigate the impact of changes in these rates on our financial position and results of operations; however, changes in exchange rates and interest rates cannot always be predicted or hedged.
If we are unable to maintain our brand image and corporate reputation, our business may suffer.
Our success depends in part on our ability to maintain the image of the UPS brand and our reputation for providing excellent service to our customers. Service quality issues, actual or perceived, even when false or unfounded, could tarnish the image of our brand and may cause customers to use other companies. Also, adverse publicity surrounding labor relations, environmental concerns, security matters, political activities and the like, or attempts to connect our company to these sorts of issues, either in the United States or other countries in which we operate, could negatively affect our overall reputation and acceptance of our services by customers. Damage to our reputation and loss of brand equity could reduce demand for our services and thus have an adverse effect on our business, financial position and results of operations, and could require additional resources to rebuild our reputation and restore the value of our brand.
17
A significant privacy breach or IT system disruption could adversely affect our business and we may be required to increase our spending on data and system security.
We rely on information technology networks and systems, including the Internet, to process, transmit and store electronic information, and to manage or support a variety of business processes and activities. In addition, the provision of service to our customers and the operation of our networks and systems involve the storage and transmission of proprietary information and sensitive or confidential data, including personal information of customers, employees and others. Our franchised center locations also are reliant on the use of information technology systems to manage their business processes and activities. Our and our franchisees’ information technology systems, some of which are managed by third-parties, may be susceptible to damage, disruptions or shutdowns due to failures during the process of upgrading or replacing software, databases or components thereof, power outages, hardware failures, computer viruses, attacks by computer hackers, malicious insiders, telecommunication failures, user errors or catastrophic events. Hackers, acting individually or in coordinated groups, may also launch distributed denial of service attacks or other coordinated attacks that may cause service outages or other interruptions in our business. In addition, breaches in security could expose us, our customers and franchisees, or the individuals affected, to a risk of loss or misuse of proprietary information and sensitive or confidential data. The techniques used to obtain unauthorized access, disable or degrade service or sabotage systems change frequently, may be difficult to detect for a long time and often are not recognized until launched against a target. As a result, we may be unable to anticipate these techniques or to implement adequate preventative measures.
Any of these occurrences could result in disruptions in our operations, the loss of existing or potential customers, damage to our brand and reputation, and litigation and potential liability for the company. In addition, the cost and operational consequences of implementing further data or system protection measures could be significant. In August 2014, a broad-based malware intrusion targeting retailers throughout the U.S. was discovered and subsequently eradicated at approximately 1% of our franchisees’ locations. While the impact of this cyber-attack, including the costs associated with investigation and remediation activities, was not material to our business and our financial results, our efforts to deter, identify, mitigate and/or eliminate any future breaches may not be successful.
Severe weather or other natural or manmade disasters could adversely affect our business.
Severe weather conditions and other natural or manmade disasters, including storms, floods, fires or earthquakes, epidemics or pandemics, or terrorist attacks, conflicts or unrest, may result in decreased revenues, as our customers reduce their shipments, or increased costs to operate our business, which could have an adverse effect on our results of operations for a quarter or year. Any such event affecting one of our major facilities could result in a significant interruption in or disruption of our business.
We make significant capital investments in our business of which a significant portion is tied to projected volume levels.
We require significant capital investments in our business consisting of aircraft, vehicles, technology, facilities and sorting and other types of equipment to support both our existing business and anticipated growth. Forecasting projected volume involves many factors which are subject to uncertainty, such as general economic trends, changes in governmental regulation and competition. If we do not accurately forecast our future capital investment needs, we could have excess capacity or insufficient capacity, either of which would negatively affect our revenues and profitability. In addition to forecasting our capital investment requirements, we adjust other elements of our operations and cost structure in response to adverse economic conditions; however, these adjustments may not be sufficient to allow us to maintain our operating margins in a weak economy.
We derive a significant portion of our revenues from our international operations and are subject to the risks of doing business in international markets.
We have significant international operations and while the geographical diversity of our international operations helps ensure that we are not overly reliant on a single region or country, we are continually exposed to changing economic, political and social developments beyond our control. Emerging markets are typically more volatile than those in the developed world, and any broad-based downturn in these markets could reduce our revenues and adversely affect our business, financial position and results of operations. We are subject to many laws governing our international operations, including those that prohibit improper payments to government officials and commercial customers, and restrict where we can do business, our shipments to certain countries and the information that we can provide to non-U.S. governments.
18
We are subject to changes in markets and our business plans that have resulted, and may in the future result, in substantial write-downs of the carrying value of our assets, thereby reducing our net income.
Our regular review of the carrying value of our assets has resulted, from time to time, in significant impairments, and we may in the future be required to recognize additional impairment charges. Changes in business strategy, government regulations, or economic or market conditions have resulted and may result in further substantial impairments of our intangible, fixed or other assets at any time in the future. In addition, we have been and may be required in the future to recognize increased depreciation and amortization charges if we determine that the useful lives of our fixed assets are shorter than we originally estimated. Such changes could reduce our net income.
Employee health and retiree health and pension benefit costs represent a significant expense to us.
With approximately
435,000
employees, including approximately
354,000
in the U.S., our expenses relating to employee health and retiree health and pension benefits are significant. In recent years, we have experienced significant increases in some of these costs, largely as a result of economic factors beyond our control, including, in particular, ongoing increases in health care costs well in excess of the rate of inflation and the decreasing trend of discount rates that we use to value our pension liabilities. Continued increasing health care costs, volatility in investment returns and discount rates, as well as changes in laws, regulations and assumptions used to calculate retiree health and pension benefit expenses, may adversely affect our business, financial position, results of operations or require significant contributions to our pension plans. The new national master agreement with the Teamsters includes changes that are designed to mitigate certain of these health care expenses, but there can be no assurance that our efforts will be successful or that the failure or success of these efforts will not adversely affect our business, financial position, results of operations or liquidity.
We participate in a number of trustee-managed multiemployer pension and health and welfare plans for employees covered under collective bargaining agreements. As part of the overall collective bargaining process for wage and benefit levels, we have agreed to contribute certain amounts to the multiemployer benefit plans during the contract period. The multiemployer benefit plans set benefit levels and are responsible for benefit delivery to participants. Future contribution amounts to multiemployer benefit plans will be determined only through collective bargaining, and we have no additional legal or constructive obligation to increase contributions beyond the agreed-upon amounts (except potential surcharges under the Pension Protection Act of 2006 in the event that a plan enters critical status, and our contributions are not sufficient to satisfy any rehabilitation plan funding schedule). In future collective bargaining negotiations, we could agree to make significantly higher future contributions to improve the funded status of one or more of these plans. The funded status of these multiemployer plans are impacted by various factors, including investment performance, health care inflation, changes in demographics and changes in participant benefit levels. At this time, we are unable to determine the amount of additional future contributions, if any, or whether any material adverse effect on our financial condition, results of operations or liquidity could result from our participation in these plans.
We may be subject to various claims and lawsuits that could result in significant expenditures.
The nature of our business exposes us to the potential for various claims and litigation related to labor and employment, personal injury, property damage, business practices, environmental liability and other matters. Any material litigation or a catastrophic accident or series of accidents could have a material adverse effect on our business, financial position and results of operations.
We may not realize the anticipated benefits of acquisitions, joint ventures or strategic alliances.
As part of our business strategy, we may acquire businesses and form joint ventures or strategic alliances. Whether we realize the anticipated benefits from these transactions depends, in part, upon the successful integration between the businesses involved, the performance of the underlying operations, capabilities or technologies and the management of the acquired operations. Accordingly, our financial results could be adversely affected by our failure to effectively integrate the acquired operations, unanticipated performance issues, transaction-related charges or charges for impairment of long-term assets that we acquire.
19
Insurance and claims expenses could have a material adverse effect on our business, financial condition and results of operations.
We have a combination of both self-insurance and high-deductible insurance programs for the risks arising out of the services we provide and the nature of our global operations, including claims exposure resulting from cargo loss, personal injury, property damage, aircraft and related liabilities, business interruption and workers' compensation. Workers' compensation, automobile and general liabilities are determined using actuarial estimates of the aggregate liability for claims incurred and an estimate of incurred but not reported claims, on an undiscounted basis. Our accruals for insurance reserves reflect certain actuarial assumptions and management judgments, which are subject to a high degree of variability. If the number or severity of claims for which we are retaining risk increases, our financial condition and results of operations could be adversely affected. If we lose our ability to self-insure these risks, our insurance costs could materially increase and we may find it difficult to obtain adequate levels of insurance coverage.
|
Item 1B.
|
Unresolved Staff Comments
|
Not applicable.
|
Item 2.
|
Properties
|
Operating Facilities
We own our headquarters, which is located in Atlanta, Georgia and consists of about 745,000 square feet of office space in an office campus, and our UPS Supply Chain Solutions group’s headquarters, which is located in Alpharetta, Georgia, and consists of about 310,000 square feet of office space.
We also own 29 of our 31 principal U.S. package operating facilities, which have floor spaces that range from approximately 310,000 to 879,000 square feet. In addition, we have a 1.9 million square foot operating facility near Chicago, Illinois, which is designed to streamline shipments between East Coast and West Coast destinations, and we own or lease over 1,000 additional smaller package operating facilities in the U.S. The smaller of these facilities have vehicles and drivers stationed for the pickup of packages, and capacity for the sorting, transfer and delivery of packages. The larger of these facilities also service our vehicles and equipment, and employ specialized mechanical installations for the sorting and handling of packages.
We own or lease more than 800 facilities that support our international package operations. In addition, we own or lease more than 500 facilities, with approximately 32.2 million square feet of floor space, that support our freight forwarding and logistics operations. We own and operate a logistics campus consisting of approximately 3.7 million square feet in Louisville, Kentucky.
We own or lease approximately 200 UPS Freight service centers with approximately 5.9 million square feet of floor space. The main offices of UPS Freight are located in Richmond, Virginia and consist of about 217,000 square feet of office space.
Our aircraft are operated in a hub and spoke pattern in the U.S., with our principal air hub, known as Worldport, located in Louisville, Kentucky. The Worldport facility consists of over 5.2 million square feet and the site includes approximately 596 acres. Between 2009 and 2010, we completed an expansion of our Worldport facility, which increased the sorting capacity to approximately 416,000 packages per hour. The expansion, which cost over $1 billion, involved the addition of two aircraft load / unload wings to the hub building, followed by the installation of high-speed conveyor and computer control systems.
We also have regional air hubs in Columbia, South Carolina; Dallas, Texas; Ontario, California; Philadelphia, Pennsylvania; and Rockford, Illinois. These hubs house facilities for the sorting, transfer and delivery of packages. Our European air hub is located in Cologne, Germany, and we maintain Asia-Pacific air hubs in Shanghai, China; Shenzhen, China; and Hong Kong. Our regional air hub in Canada is located in Hamilton, Ontario, and our regional air hub for Latin America and the Caribbean is in Miami, Florida.
In the first quarter of 2014, we completed the expansion of our European air hub in Cologne. The expansion project equipped the existing facility with additional state-of-the-art technology and included a major extension to the existing building. This extension is partially dedicated to processing larger freight shipments. Together, these initiatives significantly increased the hub’s package sorting capacity from 112,000 to 190,000 packages per hour. The total cost of the expansion was approximately $200 million.
20
Over the past several years, UPS has made a successful transition to become the first wholly-owned foreign express carrier in China. In 2008, we opened the UPS International Air Hub at Pudong International Airport, which was built on a parcel totaling 2.4 million square feet with a sorting capacity of 17,000 packages per hour. This hub links all of China via Shanghai to UPS’s international network, with direct service to the Americas, Europe and Asia. It also connects points served in China by UPS through a dedicated service provided by Yangtze River Express, a Chinese all-cargo airline.
In February 2010, we opened a new intra-Asia air hub at Shenzhen Bao'an International Airport in China. The Shenzhen facility, which was built on a parcel of almost one million square feet and has a sorting capacity of 18,000 packages per hour, serves as our primary transit hub in Asia.
Our primary information technology operations are consolidated in a 443,600 square foot owned facility, the Ramapo Ridge facility, which is located on a 39-acre site in Mahwah, New Jersey. We also own a 175,000 square foot facility located on a 25-acre site in Alpharetta, Georgia, which serves as a backup to the main information technology operations facility in New Jersey. This facility provides production functions and backup capacity in the event that a power outage or other disaster incapacitates the main data center. It also helps to meet our internal communication needs.
We believe that our facilities are adequate to support our current operations.
Fleet
Aircraft
The following table shows information about our aircraft fleet as of
December 31, 2014
:
|
Description
|
Owned and
Capital
Leases
|
Short-term
Leased or
Chartered
From
Others
|
On
Order
|
Under
Option
|
|||||||
|
Boeing 747-400F
|
11
|
|
—
|
|
—
|
|
—
|
|
|||
|
Boeing 747-400BCF
|
2
|
|
—
|
|
—
|
|
—
|
|
|||
|
Boeing 757-200F
|
75
|
|
—
|
|
—
|
|
—
|
|
|||
|
Boeing 767-300ERF
|
59
|
|
—
|
|
—
|
|
—
|
|
|||
|
Boeing MD-11F
|
38
|
|
—
|
|
—
|
|
—
|
|
|||
|
Airbus A300-600F
|
52
|
|
—
|
|
—
|
|
—
|
|
|||
|
Other
|
—
|
|
412
|
|
—
|
|
—
|
|
|||
|
Total
|
237
|
|
412
|
|
—
|
|
—
|
|
|||
We maintain an inventory of spare engines and parts for each aircraft.
All the aircraft we own meet Stage IV federal noise regulations and can operate at airports that have aircraft noise restrictions.
We currently do not have any commitments or options to purchase aircraft.
Vehicles
We operate a global ground fleet of approximately 106,000 package cars, vans, tractors and motorcycles. Our ground support fleet consists of 33,000 pieces of equipment designed specifically to support our aircraft fleet, ranging from non-powered container dollies and racks to powered aircraft main deck loaders and cargo tractors. We also have 33,000 containers used to transport cargo in our aircraft.
|
Item 3.
|
Legal Proceedings
|
For a discussion of legal proceedings affecting us and our subsidiaries, please see the information under the sub-caption “Contingencies” of the caption “Management’s Discussion and Analysis of Financial Condition and Results of Operations” included in this report.
|
Item 4.
|
Mine Safety Disclosures
|
Not applicable.
21
|
Item 5.
|
Market for Registrant’s Common Equity, Related Stockholder Matters and Issuer Purchases of Equity Securities
|
Our class A common stock is not listed on a national securities exchange or traded in an organized over-the-counter market, but each share of our class A common stock is convertible into one share of our class B common stock.
The following is a summary of our class B common stock price activity and dividend information for
2014
and
2013
. Our class B common stock is listed on the New York Stock Exchange under the symbol “UPS”.
|
High
|
Low
|
Close
|
Dividends
Declared
|
||||||||||||
|
2014:
|
|||||||||||||||
|
First Quarter
|
$
|
104.85
|
|
$
|
93.19
|
|
$
|
97.38
|
|
$
|
0.67
|
|
|||
|
Second Quarter
|
$
|
104.30
|
|
$
|
95.57
|
|
$
|
102.66
|
|
$
|
0.67
|
|
|||
|
Third Quarter
|
$
|
105.09
|
|
$
|
94.87
|
|
$
|
98.29
|
|
$
|
0.67
|
|
|||
|
Fourth Quarter
|
$
|
113.10
|
|
$
|
94.05
|
|
$
|
111.17
|
|
$
|
0.67
|
|
|||
|
2013:
|
|||||||||||||||
|
First Quarter
|
$
|
85.92
|
|
$
|
75.03
|
|
$
|
85.90
|
|
$
|
0.62
|
|
|||
|
Second Quarter
|
$
|
89.96
|
|
$
|
81.95
|
|
$
|
86.48
|
|
$
|
0.62
|
|
|||
|
Third Quarter
|
$
|
92.10
|
|
$
|
85.18
|
|
$
|
91.37
|
|
$
|
0.62
|
|
|||
|
Fourth Quarter
|
$
|
105.35
|
|
$
|
88.46
|
|
$
|
105.08
|
|
$
|
0.62
|
|
|||
As of February 20,
2015
, there were 153,035 and 18,308 record holders of class A and class B common stock, respectively.
The policy of our Board of Directors is to declare dividends out of current earnings. The declaration of dividends is subject to the discretion of the Board of Directors and will depend on various factors, including our net income, financial condition, cash requirements, future prospects, and other relevant factors.
On February 11,
2015
, our Board declared a dividend of $0.73 per share, which is payable on March 10,
2015
to shareowners of record on February 23,
2015
. This represents a 9% increase from the previous $0.67 quarterly dividend in
2014
.
On
February 14, 2013
, the Board of Directors approved a share repurchase authorization of $
10.0
billion, which replaced an authorization previously announced in
2012
. The new share repurchase authorization has no expiration date. We anticipate repurchasing approximately $
2.7
billion of shares in
2015
.
A summary of repurchases of our class A and class B common stock during the fourth quarter of
2014
is as follows (in millions, except per share amounts):
|
Total Number
of Shares
Purchased(1)
|
Average
Price Paid
Per Share(1)
|
Total Number
of Shares Purchased
as Part of Publicly
Announced Program
|
Approximate Dollar
Value of Shares that
May Yet be Purchased
Under the Program
(as of month-end)
|
||||||||||
|
October 1—October 31
|
4.4
|
|
$
|
106.17
|
|
4.4
|
|
$
|
4,309
|
|
|||
|
November 1—November 30
|
0.9
|
|
108.43
|
|
0.6
|
|
4,244
|
|
|||||
|
December 1—December 31
|
0.9
|
|
110.45
|
|
0.8
|
|
4,152
|
|
|||||
|
Total October 1—December 31
|
6.2
|
|
$
|
107.02
|
|
5.8
|
|
||||||
|
(1)
|
Includes shares repurchased through our publicly announced share repurchase program and shares tendered to pay the exercise price and tax withholding on employee stock options.
|
22
Shareowner Return Performance Graph
The following performance graph and related information shall not be deemed “soliciting material” or to be “filed” with the SEC, nor shall such information be incorporated by reference into any future filing under the Securities Act of 1933 or Securities Exchange Act of 1934, each as amended, except to the extent that the Company specifically incorporates such information by reference into such filing.
The following graph shows a five year comparison of cumulative total shareowners’ returns for our class B common stock, the Standard & Poor’s 500 Index, and the Dow Jones Transportation Average. The comparison of the total cumulative return on investment, which is the change in the quarterly stock price plus reinvested dividends for each of the quarterly periods, assumes that $100 was invested on
December 31, 2009
in the Standard & Poor’s 500 Index, the Dow Jones Transportation Average, and our class B common stock.
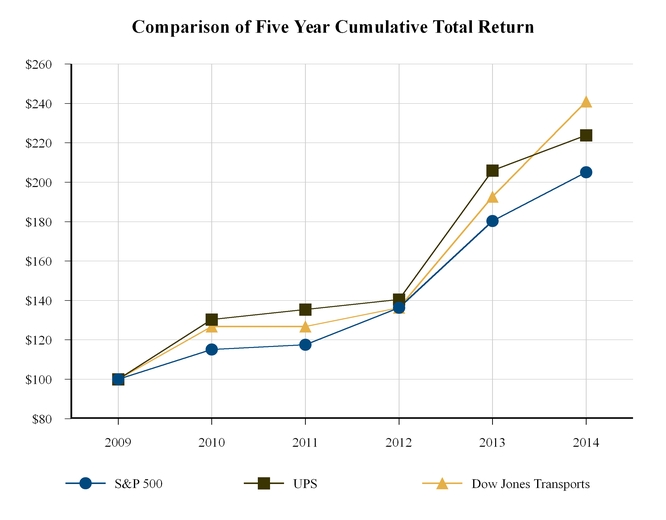
|
12/31/2009
|
12/31/2010
|
12/31/2011
|
12/31/2012
|
12/31/2013
|
12/31/2014
|
||||||||||||||||||
|
United Parcel Service, Inc.
|
$
|
100.00
|
|
$
|
130.29
|
|
$
|
135.35
|
|
$
|
140.54
|
|
$
|
205.95
|
|
$
|
223.79
|
|
|||||
|
Standard & Poor’s 500 Index
|
$
|
100.00
|
|
$
|
115.06
|
|
$
|
117.48
|
|
$
|
136.26
|
|
$
|
180.38
|
|
$
|
205.05
|
|
|||||
|
Dow Jones Transportation Average
|
$
|
100.00
|
|
$
|
126.74
|
|
$
|
126.75
|
|
$
|
136.24
|
|
$
|
192.61
|
|
$
|
240.91
|
|
|||||
23
|
Item 6.
|
Selected Financial Data
|
The following table sets forth selected financial data for each of the five years in the period ended
December 31, 2014
(in millions, except per share amounts). This financial data should be read together with our consolidated financial statements and related notes, Management’s Discussion and Analysis of Financial Condition and Results of Operations, and other financial data appearing elsewhere in this report.
|
|
Years Ended December 31,
|
||||||||||||||||||
|
|
2014
|
2013
|
2012
|
2011
|
2010
|
||||||||||||||
|
Selected Income Statement Data
|
|||||||||||||||||||
|
Revenue:
|
|||||||||||||||||||
|
U.S. Domestic Package
|
$
|
35,851
|
|
$
|
34,074
|
|
$
|
32,856
|
|
$
|
31,717
|
|
$
|
29,742
|
|
||||
|
International Package
|
12,988
|
|
12,429
|
|
12,124
|
|
12,249
|
|
11,133
|
|
|||||||||
|
Supply Chain & Freight
|
9,393
|
|
8,935
|
|
9,147
|
|
9,139
|
|
8,670
|
|
|||||||||
|
Total revenue
|
58,232
|
|
55,438
|
|
54,127
|
|
53,105
|
|
49,545
|
|
|||||||||
|
Operating expenses:
|
|||||||||||||||||||
|
Compensation and benefits
|
32,045
|
|
28,557
|
|
33,102
|
|
27,575
|
|
26,557
|
|
|||||||||
|
Other
|
21,219
|
|
19,847
|
|
19,682
|
|
19,450
|
|
17,347
|
|
|||||||||
|
Total operating expenses
|
53,264
|
|
48,404
|
|
52,784
|
|
47,025
|
|
43,904
|
|
|||||||||
|
Operating profit:
|
|||||||||||||||||||
|
U.S. Domestic Package
|
2,859
|
|
4,603
|
|
459
|
|
3,764
|
|
3,238
|
|
|||||||||
|
International Package
|
1,677
|
|
1,757
|
|
869
|
|
1,709
|
|
1,831
|
|
|||||||||
|
Supply Chain and Freight
|
432
|
|
674
|
|
15
|
|
607
|
|
572
|
|
|||||||||
|
Total operating profit
|
4,968
|
|
7,034
|
|
1,343
|
|
6,080
|
|
5,641
|
|
|||||||||
|
Other income (expense):
|
|||||||||||||||||||
|
Investment income
|
22
|
|
20
|
|
24
|
|
44
|
|
3
|
|
|||||||||
|
Interest expense
|
(353
|
)
|
(380
|
)
|
(393
|
)
|
(348
|
)
|
(354
|
)
|
|||||||||
|
Income before income taxes
|
4,637
|
|
6,674
|
|
974
|
|
5,776
|
|
5,290
|
|
|||||||||
|
Income tax expense
|
1,605
|
|
2,302
|
|
167
|
|
1,972
|
|
1,952
|
|
|||||||||
|
Net income
|
$
|
3,032
|
|
$
|
4,372
|
|
$
|
807
|
|
$
|
3,804
|
|
$
|
3,338
|
|
||||
|
Per share amounts:
|
|||||||||||||||||||
|
Basic earnings per share
|
$
|
3.31
|
|
$
|
4.65
|
|
$
|
0.84
|
|
$
|
3.88
|
|
$
|
3.36
|
|
||||
|
Diluted earnings per share
|
$
|
3.28
|
|
$
|
4.61
|
|
$
|
0.83
|
|
$
|
3.84
|
|
$
|
3.33
|
|
||||
|
Dividends declared per share
|
$
|
2.68
|
|
$
|
2.48
|
|
$
|
2.28
|
|
$
|
2.08
|
|
$
|
1.88
|
|
||||
|
Weighted average shares outstanding:
|
|||||||||||||||||||
|
Basic
|
916
|
|
940
|
|
960
|
|
981
|
|
994
|
|
|||||||||
|
Diluted
|
924
|
|
948
|
|
969
|
|
991
|
|
1,003
|
|
|||||||||
|
|
As of December 31,
|
||||||||||||||||||
|
|
2014
|
2013
|
2012
|
2011
|
2010
|
||||||||||||||
|
Selected Balance Sheet Data
|
|||||||||||||||||||
|
Cash and marketable securities
|
$
|
3,283
|
|
$
|
5,245
|
|
$
|
7,924
|
|
$
|
4,275
|
|
$
|
4,081
|
|
||||
|
Total assets
|
35,471
|
|
36,212
|
|
38,863
|
|
34,701
|
|
33,597
|
|
|||||||||
|
Long-term debt
|
9,864
|
|
10,824
|
|
11,089
|
|
11,095
|
|
10,491
|
|
|||||||||
|
Shareowners’ equity
|
2,158
|
|
6,488
|
|
4,733
|
|
7,108
|
|
8,047
|
|
|||||||||
24
|
Item 7.
|
Management’s Discussion and Analysis of Financial Condition and Results of Operations
|
Overview
U.S. economic growth, retail sales and industrial production continued at a moderate pace in 2014, which resulted in growth in the small package delivery market. Continued strong growth in e-commerce and omni-channel retail sales has driven package volume increases in both commercial and residential products. Given these trends, overall volume growth was strong during the year, and products most aligned with business-to-consumer and retail industry shipments experienced the fastest growth.
Economic conditions in Europe have deteriorated somewhat, as solid growth in the United Kingdom is being offset by slower growth in Germany and general economic weakness in France and Italy. Economic growth in Asia has continued, though growth in China has moderated. The uneven nature of economic growth worldwide, combined with a trend towards more intra-regional trade, has led to shifting trade patterns and resulted in overcapacity in certain trade lanes. These factors have created an environment in which customers are more likely to trade-down from premium express products to standard delivery products in both Europe and Asia. As a result of these circumstances, we have adjusted our air capacity and cost structure in our transportation network to better match the prevailing volume mix levels. Our broad portfolio of product offerings and the flexibilities inherent in our transportation network have helped us adapt to these changing trends.
While the worldwide economic environment has remained challenging in 2014, we have continued to undertake several initiatives in the U.S. and internationally to (1) improve the flexibility and capacity in our delivery network; (2) improve yield management; and (3) increase operational efficiency and contain costs across all segments. Most notably, the continued deployment of technology improvements (including several facility automation projects and the accelerated deployment of our On Road Integrated Optimization and Navigation system - "ORION") should increase our network capacity, and improve operational efficiency, flexibility and reliability. Additionally, we have continued to adjust our transportation network and utilize new or expanded operating facilities to improve time-in-transit for shipments in each region.
Our consolidated results are presented in the table below:
|
|
Year Ended December 31,
|
% Change
|
|||||||||||||||
|
|
2014
|
2013
|
2012
|
2014 / 2013
|
2013 / 2012
|
||||||||||||
|
Revenue (in millions)
|
$
|
58,232
|
|
$
|
55,438
|
|
$
|
54,127
|
|
5.0
|
%
|
2.4
|
%
|
||||
|
Operating Expenses (in millions)
|
53,264
|
|
48,404
|
|
52,784
|
|
10.0
|
%
|
(8.3
|
)%
|
|||||||
|
Operating Profit (in millions)
|
$
|
4,968
|
|
$
|
7,034
|
|
$
|
1,343
|
|
(29.4
|
)%
|
N/A
|
|
||||
|
Operating Margin
|
8.5
|
%
|
12.7
|
%
|
2.5
|
%
|
|||||||||||
|
Average Daily Package Volume (in thousands)
|
18,016
|
|
16,938
|
|
16,295
|
|
6.4
|
%
|
3.9
|
%
|
|||||||
|
Average Revenue Per Piece
|
$
|
10.58
|
|
$
|
10.76
|
|
$
|
10.82
|
|
(1.7
|
)%
|
(0.6
|
)%
|
||||
|
Net Income (in millions)
|
$
|
3,032
|
|
$
|
4,372
|
|
$
|
807
|
|
(30.6
|
)%
|
N/A
|
|
||||
|
Basic Earnings Per Share
|
$
|
3.31
|
|
$
|
4.65
|
|
$
|
0.84
|
|
(28.8
|
)%
|
N/A
|
|
||||
|
Diluted Earnings Per Share
|
$
|
3.28
|
|
$
|
4.61
|
|
$
|
0.83
|
|
(28.9
|
)%
|
N/A
|
|
||||
25
UNITED PARCEL SERVICE, INC. AND SUBSIDIARIES
MANAGEMENT'S DISCUSSION AND ANALYSIS OF FINANCIAL CONDITION AND
RESULTS OF OPERATIONS
Items Affecting Comparability
The year-over-year comparisons of our financial results are affected by the following items (in millions):
|
|
Year Ended December 31,
|
||||||||||
|
|
2014
|
2013
|
2012
|
||||||||
|
Operating Expenses:
|
|||||||||||
|
Defined Benefit Plans Mark-to-Market Charge
|
$
|
1,062
|
|
$
|
—
|
|
$
|
4,831
|
|
||
|
Health & Welfare Plan Charges
|
1,102
|
|
—
|
|
—
|
|
|||||
|
TNT Termination Fee and Related Expenses
|
—
|
|
284
|
|
—
|
|
|||||
|
Gain Upon Liquidation of Foreign Subsidiary
|
—
|
|
(245
|
)
|
—
|
|
|||||
|
Multiemployer Pension Plan Withdrawal Charge
|
—
|
|
—
|
|
896
|
|
|||||
|
Income Tax Expense (Benefit) from the Items Above
|
(807
|
)
|
(75
|
)
|
(2,145
|
)
|
|||||
These items have been excluded from comparisons of "adjusted" operating expenses, operating profit and operating margin in the discussion that follows.
Defined Benefit Plans Mark-to-Market Charge
In 2014 and 2012, we incurred pre-tax mark-to-market losses of $1.062 and $4.831 billion, respectively, on a consolidated basis ($670 million and $3.023 billion after-tax, respectively) on our pension and postretirement defined benefit plans related to the remeasurement of plan assets and liabilities recognized outside of a 10% corridor. No mark-to-market gain or loss was incurred in 2013, as the remeasurement of plan assets and liabilities only resulted in adjustments within the 10% corridor (and thus only impacted accumulated other comprehensive income). These mark-to-market losses in 2014 and 2012, which were recorded in compensation and benefits expense in our statements of consolidated income, impacted each of our three reporting segments in both years. The table below indicates the amounts associated with each component of the pre-tax mark-to-market loss, as well as the weighted-average actuarial assumptions used to determine our net periodic benefit costs, for each year:
|
Year Ended December 31,
|
||||||||||||
|
Components of mark-to-market gain (loss) (in millions)
|
2014
|
2013
|
2012
|
|||||||||
|
Discount rates
|
$
|
(954
|
)
|
$
|
—
|
|
$
|
(5,530
|
)
|
|||
|
Return on assets
|
42
|
|
—
|
|
708
|
|
||||||
|
Demographic assumptions
|
(150
|
)
|
—
|
|
(9
|
)
|
||||||
|
Total mark-to-market gain (loss)
|
$
|
(1,062
|
)
|
$
|
—
|
|
$
|
(4,831
|
)
|
|||
|
Weighted-average actuarial assumptions used to determine net periodic benefit cost
|
2014
|
2013
|
2012
|
|||||||||
|
Expected rate of return on plan assets
|
8.66
|
%
|
8.69
|
%
|
8.71
|
%
|
||||||
|
Actual rate of return on plan assets
|
9.45
|
%
|
8.36
|
%
|
11.76
|
%
|
||||||
|
Discount rate used for net periodic benefit cost
|
5.24
|
%
|
4.38
|
%
|
5.58
|
%
|
||||||
|
Discount rate at measurement date
|
4.36
|
%
|
5.24
|
%
|
4.38
|
%
|
||||||
The $1.062 and $4.831 billion pre-tax mark-to-market losses for the years ended December 31, 2014 and 2012, respectively, were comprised of the following components:
2014 - $1.062 billion pre-tax mark-to-market loss:
|
•
|
Discount Rates
($954 million pre-tax loss): The weighted-average discount rate for our U.S. pension and postretirement medical plans and our international pension plans declined from 5.24% at December 31, 2013 to 4.36% at December 31, 2014. This overall decline in discount rates was driven by a 122 basis point decline in the 30 year Treasury bond rate, but was partially offset by an increase in credit spreads on AA-rated 30 year bonds.
|
26
UNITED PARCEL SERVICE, INC. AND SUBSIDIARIES
MANAGEMENT'S DISCUSSION AND ANALYSIS OF FINANCIAL CONDITION AND
RESULTS OF OPERATIONS
|
•
|
Return on Assets ($42 million pre-tax gain): Our expected rate of return on U.S. pension and postretirement medical plan assets is developed taking into consideration: (1) historical plan asset returns over long-term periods, (2) current market conditions, and (3) the mix of asset classes in our investment portfolio. We review the expected rate of return on an annual basis and revise it as appropriate. In 2014, the actual rate of return on plan assets of 9.45% exceeded our expected rate of return of 8.66%, primarily due to continued gains in the world equity markets.
|
|
•
|
Demographic Assumptions
($150 million pre-tax loss): The implementation of new U.S. mortality tables in 2014 resulted in an increased participant life expectancy assumption, which increased the overall projected benefit obligation for our plans.
|
2012 - $4.831 billion pre-tax mark-to-market loss:
|
•
|
Discount Rates
($5.530 billion pre-tax loss):
The weighted-average discount rate for our U.S. pension and postretirement medical plans and our international pension plans declined from 5.58% at December 31, 2011 to 4.38% at December 31, 2012, due to two primary factors: (1) The discount rate for our U.S. pension and postretirement medical plans is determined using a bond matching approach for a portfolio of corporate AA bonds. In 2012, financial institutions comprised a smaller portion of our corporate AA bond portfolio relative to 2011, largely due to credit downgrades of several large financial institutions in 2012. (2) Credit spreads on AA-rated 30-year bonds declined in 2012. These changes in the composition of our bond portfolio mix and the compression in credit spreads were the primary factors resulting in the 120 basis point decline in the weighted-average discount rate in 2012 relative to 2011.
|
|
•
|
Return on Assets
($708 million pre-tax gain): In 2012, the actual rate of return on plan assets of 11.76% exceeded our expected rate of return of 8.71%, primarily due to strong gains in the world equity markets.
|
|
•
|
Demographic Assumptions
($9 million pre-tax loss): This represents the difference between actual and estimated demographic factors, including items such as health care cost trends, mortality rates and compensation rate increases.
|
Health and Welfare Plan Charges
In connection with the ratification of our national master agreement with the International Brotherhood of Teamsters ("Teamsters") in 2014, we incurred pre-tax charges totaling $1.102 billion ($687 million after-tax) associated with changes in the delivery of healthcare benefits to certain active and retired union employees. These charges are discussed in further detail in the "Collective Bargaining Agreements" section. These charges impacted our U.S. Domestic Package segment ($990 million), International Package segment ($28 million) and Supply Chain & Freight segment ($84 million).
TNT Termination Fee and Related Expenses
On January 30, 2013, the European Commission issued a formal decision prohibiting our proposed acquisition of TNT Express N.V. ("TNT Express"). As a result of the prohibition by the European Commission, the condition of our offer requiring European Union competition clearance was not fulfilled, and our proposed acquisition of TNT Express could not be completed. Given this outcome, UPS and TNT Express entered a separate agreement to terminate the merger protocol, and we withdrew our formal offer for TNT Express. We paid a termination fee to TNT Express of €200 million ($268 million) under this agreement, and also incurred transaction-related expenses of $16 million during the first quarter of 2013. The combination of these items resulted in a pre-tax charge of $284 million ($177 million after-tax), which impacted our International Package segment.
Gain Upon the Liquidation of a Foreign Subsidiary
Subsequent to the termination of the merger protocol, we liquidated a foreign subsidiary that would have been used to acquire the outstanding shares of TNT Express in connection with the proposed acquisition. Upon the liquidation of this subsidiary in the first quarter of 2013, we realized a pre-tax foreign currency gain of $245 million ($213 million after-tax), which impacted our International Package segment.
27
UNITED PARCEL SERVICE, INC. AND SUBSIDIARIES
MANAGEMENT'S DISCUSSION AND ANALYSIS OF FINANCIAL CONDITION AND
RESULTS OF OPERATIONS
Multiemployer Pension Plan Withdrawal Charge
In 2012, we recognized an $896 million pre-tax charge ($559 million after-tax) for the establishment of a withdrawal liability related to our withdrawal from the New England Teamsters and Trucking Industry Pension Fund ("New England Pension Fund"), a multiemployer pension plan. This charge is discussed in further detail in the "Collective Bargaining Agreements" section. This charge was recorded in compensation and benefits expense in our statements of consolidated income, and impacted our U.S. Domestic Package segment.
Results of Operations—Segment Review
The results and discussions that follow are reflective of how our executive management monitors the performance of our reporting segments. We supplement the reporting of our financial information determined under generally accepted accounting principles (“GAAP”) with certain non-GAAP financial measures, including operating profit, operating margin, pre-tax income, net income and earnings per share adjusted for the non-comparable items discussed previously. We believe that these adjusted measures provide meaningful information to assist investors and analysts in understanding our financial results and assessing our prospects for future performance. We believe these adjusted financial measures are important indicators of our recurring results of operations because they exclude items that may not be indicative of, or are unrelated to, our core operating results, and provide a better baseline for analyzing trends in our underlying businesses. Additionally, these adjusted financial measures are used internally by management for the determination of incentive compensation awards, business unit operating performance analysis, and business unit resource allocation.
As discussed in our "Critical Accounting Policies and Estimates", we recognize changes in the fair value of plan assets and net actuarial gains and losses in excess of a 10% corridor immediately as part of net periodic benefit cost. In our results of operations and the discussions that follow, we have presented adjusted operating expenses, adjusted operating profit and adjusted operating margin excluding the portion of net periodic benefit cost represented by the gains and losses recognized in excess of the 10% corridor. This adjusted net periodic benefit cost is comparable to the accounting for our defined benefit plans in our quarterly reporting under U.S. GAAP, and reflects assumptions utilizing the expected return on plan assets and the discount rate used for determining net periodic benefit cost (the non-adjusted net periodic benefit cost reflects the actual return on plan assets and the discount rate used for measuring the projected benefit obligation). We believe this adjusted net periodic benefit cost provides important supplemental information that reflects the anticipated long-term cost of our defined benefit plans, and provides a benchmark for historical defined benefit cost trends that can be used to better compare year-to-year financial performance without considering the short-term impact of changes in market interest rates, equity prices, and similar factors.
Certain operating expenses are allocated between our reporting segments based on activity-based costing methods. These activity-based costing methods require us to make estimates that impact the amount of each expense category that is attributed to each segment. Changes in these estimates will directly impact the amount of expense allocated to each segment, and therefore the operating profit of each reporting segment. There were no significant changes in our expense allocation methodology during 2014, 2013 or 2012.
28
UNITED PARCEL SERVICE, INC. AND SUBSIDIARIES
MANAGEMENT'S DISCUSSION AND ANALYSIS OF FINANCIAL CONDITION AND
RESULTS OF OPERATIONS
U.S. Domestic Package Operations
|
|
Year Ended December 31,
|
% Change
|
|||||||||||||||
|
|
2014
|
2013
|
2012
|
2014 / 2013
|
2013 / 2012
|
||||||||||||
|
Average Daily Package Volume (in thousands):
|
|||||||||||||||||
|
Next Day Air
|
1,274
|
|
1,271
|
|
1,277
|
|
0.2
|
%
|
(0.5
|
)%
|
|||||||
|
Deferred
|
1,155
|
|
1,074
|
|
1,031
|
|
7.5
|
%
|
4.2
|
%
|
|||||||
|
Ground
|
12,893
|
|
12,060
|
|
11,588
|
|
6.9
|
%
|
4.1
|
%
|
|||||||
|
Total Avg. Daily Package Volume
|
15,322
|
|
14,405
|
|
13,896
|
|
6.4
|
%
|
3.7
|
%
|
|||||||
|
Average Revenue Per Piece:
|
|||||||||||||||||
|
Next Day Air
|
$
|
20.42
|
|
$
|
20.12
|
|
$
|
19.93
|
|
1.5
|
%
|
1.0
|
%
|
||||
|
Deferred
|
12.57
|
|
12.70
|
|
13.06
|
|
(1.0
|
)%
|
(2.8
|
)%
|
|||||||
|
Ground
|
7.85
|
|
7.96
|
|
7.89
|
|
(1.4
|
)%
|
0.9
|
%
|
|||||||
|
Total Avg. Revenue Per Piece
|
$
|
9.25
|
|
$
|
9.39
|
|
$
|
9.38
|
|
(1.5
|
)%
|
0.1
|
%
|
||||
|
Operating Days in Period
|
253
|
|
252
|
|
252
|
|
|||||||||||
|
Revenue (in millions):
|
|||||||||||||||||
|
Next Day Air
|
$
|
6,581
|
|
$
|
6,443
|
|
$
|
6,412
|
|
2.1
|
%
|
0.5
|
%
|
||||
|
Deferred
|
3,672
|
|
3,437
|
|
3,392
|
|
6.8
|
%
|
1.3
|
%
|
|||||||
|
Ground
|
25,598
|
|
24,194
|
|
23,052
|
|
5.8
|
%
|
5.0
|
%
|
|||||||
|
Total Revenue
|
$
|
35,851
|
|
$
|
34,074
|
|
$
|
32,856
|
|
5.2
|
%
|
3.7
|
%
|
||||
|
Operating Expenses (in millions):
|
|||||||||||||||||
|
Operating Expenses
|
$
|
32,992
|
|
$
|
29,471
|
|
$
|
32,397
|
|
11.9
|
%
|
(9.0
|
)%
|
||||
|
Defined Benefit Plans Mark-to-Market Charge
|
(660
|
)
|
—
|
|
(3,177
|
)
|
|||||||||||
|
Health & Welfare Plan Charges
|
(990
|
)
|
—
|
|
—
|
|
|||||||||||
|
Multiemployer Pension Plan Withdrawal Charge
|
—
|
|
—
|
|
(896
|
)
|
|||||||||||
|
Adjusted Operating Expenses
|
$
|
31,342
|
|
$
|
29,471
|
|
$
|
28,324
|
|
6.3
|
%
|
4.0
|
%
|
||||
|
Operating Profit (in millions) and Operating Margin:
|
|||||||||||||||||
|
Operating Profit
|
$
|
2,859
|
|
$
|
4,603
|
|
$
|
459
|
|
(37.9
|
)%
|
N/A
|
|
||||
|
Adjusted Operating Profit
|
$
|
4,509
|
|
$
|
4,603
|
|
$
|
4,532
|
|
(2.0
|
)%
|
1.6
|
%
|
||||
|
Operating Margin
|
8.0
|
%
|
13.5
|
%
|
1.4
|
%
|
|||||||||||
|
Adjusted Operating Margin
|
12.6
|
%
|
13.5
|
%
|
13.8
|
%
|
|||||||||||
29
UNITED PARCEL SERVICE, INC. AND SUBSIDIARIES
MANAGEMENT'S DISCUSSION AND ANALYSIS OF FINANCIAL CONDITION AND
RESULTS OF OPERATIONS
Revenue
The change in overall revenue was impacted by the following factors for the years ended
December 31, 2014
and
2013
, compared with the corresponding prior year periods:
|
Volume
|
Rates /
Product Mix
|
Fuel
Surcharge
|
Total
Revenue
Change
|
||||||||
|
Revenue Change Drivers:
|
|||||||||||
|
2014 / 2013
|
6.8
|
%
|
(1.6
|
)%
|
—
|
%
|
5.2
|
%
|
|||
|
2013 / 2012
|
3.7
|
%
|
0.5
|
%
|
(0.5
|
)%
|
3.7
|
%
|
|||
Volume
2014
compared to
2013
Our total volume increased in 2014, largely due to continued solid growth in e-commerce and overall retail sales.
Business-to-consumer shipments, which represent more than 45% of total U.S. Domestic Package volume, grew 12% for the year and drove increases in both air and ground shipments. UPS SurePost volume increased more than 45% in 2014, and accounted for approximately half of the overall volume growth for the segment. Business-to-business volume grew 3% in 2014, largely due to increased volume from the retail industry, including the use of our solutions for omni-channel (including ship-from-store and ship-to-store models) and returns shipping; additionally, business-to-business volume was positively impacted by growth in shipments from the industrial, automotive and government sectors.
Among our air products, volume increased in 2014 for both our Next Day Air and deferred services. Solid air volume growth continued for those products most aligned with business-to-consumer shipping, particularly our residential Second Day Air package product. Our business-to-business air volume increased slightly as well, largely due to growth in the retail and industrial sectors. This growth was slightly offset by a decline in air letter volume, which was negatively impacted by some competitive losses and slowing growth in the financial services industry. The growth in premium and deferred air volume continues to be impacted by economic conditions and changes in our customers' supply chain networks; the combination of these factors influences their sensitivity towards the price and speed of shipments, and therefore favoring the use of our deferred air services.
The increase in ground volume in 2014 was driven by our SurePost service offering, which had a volume increase of more than 45% for the year; additionally, we experienced moderate volume growth in our traditional residential and commercial ground services. Demand for SurePost and our traditional residential products continues to be driven by business-to-consumer shipping activity from e-commerce retailers and other large customers. The growth in business-to-business ground volume was largely due to growth in omni-channel retail volume, the increased use of our returns service offerings, and the growth in shipments from the industrial sector.
2013
compared to
2012
Our overall volume increased in 2013 compared with 2012, largely due to continued solid growth in e-commerce and overall retail sales; however, the increase in volume was hindered by slow overall U.S. economic and industrial production growth. Business-to-consumer shipments, which represent over 40% of total U.S. Domestic Package volume, grew approximately 8% for the year and drove increases in both air and ground shipments. Growth accelerated during our peak holiday shipping season, as business-to-consumer volume grew over 11% in the fourth quarter of 2013, and business-to-consumer shipments exceeded 50% of total U.S. Domestic Package volume for the first time. Business-to-business volume increased slightly in 2013, largely due to increased shipping activity by the retail industry; however, business-to-business volume was negatively impacted by slowing industrial production.
30
UNITED PARCEL SERVICE, INC. AND SUBSIDIARIES
MANAGEMENT'S DISCUSSION AND ANALYSIS OF FINANCIAL CONDITION AND
RESULTS OF OPERATIONS
Among our air products, volume increased in 2013 compared with 2012, as growth in our deferred products more than offset a small decline in our Next Day Air services. Solid air volume growth continued for those products most aligned with business-to-consumer shipping, including our residential Second Day Air package and residential Next Day Air Saver products. Next Day Air letter volume decreased approximately 7% for the year, and was negatively impacted by competitive losses and slowing growth in the financial services industry. Our business-to-business air volume continued to be impacted by sluggish economic conditions in the U.S., low levels of inventory replenishment among our customers and changes in our customers' supply chain networks. The combination of these factors influenced our customers' sensitivity towards the price and speed of shipments, and therefore the use of our premium air services.
The increase in ground volume in 2013 was primarily attributed to our traditional residential service offerings and SurePost. Demand for these residential products continues to be driven by business-to-consumer shipping activity from e-commerce retailers and other large customers. Business-to-business ground volume also showed a small increase, and was positively impacted by the overall expansion of the U.S. retail sector; however, continued weakness in industrial production hindered growth. The increased use of omni-channel retailing (including ship-from-store and ship-to-store models) by customers is also positively impacting volume growth for both our residential and commercial ground products.
Rates and Product Mix
2014
compared to
2013
Overall revenue per piece decreased 1.5% in 2014, and was impacted by changes in base rates, customer and product mix, and fuel surcharge rates.
Revenue per piece for our ground and air products was positively impacted by an increase in base rates that took effect on December 30, 2013. We implemented an average 4.9% net increase in base and accessorial rates on UPS Next Day Air, UPS 2nd Day Air and UPS 3 Day Select and UPS Ground.
Revenue per piece increased for our Next Day Air products in 2014, largely due to the base rate increase, an increase in the average weight per package, and a shift in product mix from lower-yielding letters towards higher-yielding packages. Revenue per piece declined for our deferred products in 2014, as customer and product mix changes more than offset the increase in base rates. Product mix adversely impacted deferred revenue per piece, as we experienced relatively stronger growth in our lighter-weight business-to-consumer shipments, which have lower average yields than our heavier-weight commercial shipments. Customer mix also adversely impacted deferred revenue per piece, due to the faster volume growth among our larger customers, which typically have a lower average yield than our smaller and middle-market customers.
Ground revenue per piece decreased in 2014, as customer and product mix changes more than offset the impact of the base rate increase. Customer and product mix changes adversely impacted revenue per piece as a greater portion of our overall volume in 2014, relative to 2013, came from lighter-weight shipments (including more than 45% volume growth in SurePost) and larger customers.
2013
compared to
2012
Overall revenue per piece was relatively flat in 2013 compared with 2012, and was impacted by changes in base rates, customer and product mix, and fuel surcharge rates.
Revenue per piece for our ground and air products was positively impacted by an increase in base rates that took effect on December 31, 2012. We increased the base rates 6.5% on UPS Next Day Air, UPS 2nd Day Air and UPS 3 Day Select, and 5.9% on UPS Ground, while reducing our fuel surcharge indices. Other pricing changes included an increase in the residential surcharge, and an increase in the delivery area surcharge on certain residential and commercial services. These rate changes are customary and occur on an annual basis.
Revenue per piece increased for Next Day Air in 2013, and was positively impacted by the base rate increase and the loss of some lower-yielding letter volume. Revenue per piece for our deferred products declined, as the impact of the base rate increase was more than offset by declines in fuel surcharge rates and changes in customer and product mix. Revenue per piece for our air products was adversely impacted by the relatively stronger growth in our lower-yielding Next Day Air Saver and deferred products, compared with our premium Next Day Air services, as well as the faster growth in lighter-weight business-to-consumer shipments. Additionally, revenue per piece was negatively affected by the faster volume growth among our larger customers, which typically have a lower average yield than our smaller and middle-market customers.
31
UNITED PARCEL SERVICE, INC. AND SUBSIDIARIES
MANAGEMENT'S DISCUSSION AND ANALYSIS OF FINANCIAL CONDITION AND
RESULTS OF OPERATIONS
Ground revenue per piece increased in 2013 compared with 2012, primarily due to the base rate increase; however, this was partially offset by customer and product mix changes, as a greater portion of our overall volume in 2013, relative to 2012, came from lighter-weight shipments and larger customers. Fuel surcharge rate changes adversely impacted ground revenue per piece growth in 2013 compared with 2012.
Fuel Surcharges
UPS applies a fuel surcharge on our domestic air and ground services. The air fuel surcharge is based on the U.S. Department of Energy’s (“DOE”) Gulf Coast spot price for a gallon of kerosene-type jet fuel, while the ground fuel surcharge is based on the DOE’s On-Highway Diesel Fuel Price. In connection with our base rate increase on December 31, 2012, we modified the fuel surcharge on air and ground services by reducing the index used to determine the fuel surcharge by 2% and 1%, respectively. Based on published rates, the average fuel surcharge rates for domestic air and ground products were as follows:
|
|
Year Ended December 31,
|
% Point Change
|
||||||||||||
|
|
2014
|
2013
|
2012
|
2014 / 2013
|
2013 / 2012
|
|||||||||
|
Next Day Air / Deferred
|
10.2
|
%
|
10.7
|
%
|
13.0
|
%
|
(0.5
|
)%
|
(2.3
|
)%
|
||||
|
Ground
|
7.1
|
%
|
7.2
|
%
|
8.0
|
%
|
(0.1
|
)%
|
(0.8
|
)%
|
||||
Total fuel surcharge revenue declined by $8 million in 2014, as lower fuel surcharge rates (driven by lower fuel prices) slightly more than offset the impact of increased air and ground volume. In 2013, total fuel surcharge revenue declined by $178 million due to lower fuel surcharge rates (driven primarily by the reductions in the index on both the air and ground surcharges, as well as lower fuel prices).
Operating Expenses
2014
compared to
2013
Adjusted operating expenses for the segment increased $1.871 billion in 2014, primarily due to pick-up and delivery costs (up $821 million), the cost of operating our domestic integrated air and ground network (up $719 million) and the costs of package sorting (up $167 million). These costs were impacted by several factors:
|
•
|
We incurred higher employee compensation costs, largely resulting from an increase in average daily union labor hours (up 7.5%), union contractual wage rate increases, increased employee healthcare expenses and growth in the overall size of the workforce. The increase in labor hours was driven by volume growth, additional overtime and training hours during our fourth quarter holiday shipping season, and adverse weather conditions in early 2014.
|
|
•
|
We incurred higher expenses associated with outside contract carriers, due to volume growth, issues associated with the service performance of rail carriers, and the adverse weather conditions in early 2014.
|
|
•
|
These cost increases were partially offset by a reduction in worker's compensation expense, due to actuarial adjustments that were largely attributable to operational safety and claims management initiatives.
|
|
•
|
These cost increases were also mitigated by certain network efficiency and productivity improvements, which resulted in a 0.4% reduction in the total adjusted cost per piece in 2014 compared with 2013. We have continued to adjust our air and ground networks to better match higher volume levels, utilize technology to increase package sorting and delivery efficiency, and benefit from improved pick-up and delivery densities (particularly for our residential products). These improvements allowed us to process increased volume (up 6.4%) at a faster rate than the increase in average daily aircraft block hours (up 2.4%) and vehicle miles driven (up 4.2%).
|
In the fourth quarter of 2014, adjusted operating expenses increased 9.4%, as decreased productivity, higher contract carrier rates, and additional union overtime and training hours contributed to approximately $200 million in excess costs. In order to process the significant increase in package volume while maintaining service levels, we increased our overall capacity through additional staffing, more equipment rentals and new operating facilities. Additionally, we elected to operate on one additional day during the fourth quarter of 2014 to further improve service levels. However, the significant variability in package volume during the holiday shipping season resulted in a sub-optimized transportation network, and a reduction in productivity (average daily union labor hours increased 10.5%, compared with the volume increase of 6.6%). The total adjusted cost per piece in the fourth quarter of 2014 increased 1.0% compared with the fourth quarter of 2013.
32
UNITED PARCEL SERVICE, INC. AND SUBSIDIARIES
MANAGEMENT'S DISCUSSION AND ANALYSIS OF FINANCIAL CONDITION AND
RESULTS OF OPERATIONS
2013
compared to
2012
Adjusted operating expenses for the segment increased $1.147 billion in 2013 compared with 2012. This increase was primarily due to pick-up and delivery costs, which grew $772 million, as well as the cost of operating our domestic integrated air and ground network, which increased $290 million for the year. The growth in pick-up and delivery and network costs was largely due to increased volume and higher employee compensation costs, which were impacted by a union contractual wage increase (package driver wage rates rose 2.2%), an increase in average daily driver hours (up 2.2%) and an increase in employee pension and healthcare costs. Partially offsetting these cost increases was a reduction in worker's compensation expense, due to actuarial adjustments that were largely attributable to operational safety and claims management initiatives.
Cost increases have been mitigated as we adjust our air and ground networks to better match higher volume levels and utilize technology to increase package sorting and delivery efficiency. Improved pick-up and delivery densities, particularly for our residential products, have also contained increases in cost. These network efficiency improvements allowed us to process increased volume (up 3.7%) at a faster rate than the increase in average daily union labor hours (up 3.1%), aircraft block hours (down 0.6%) and miles driven (up 1.8%) in 2013 compared with 2012. As a result, the total adjusted cost per piece increased only 0.4% in 2013.
Several factors caused our fourth quarter operating expenses to significantly increase (adjusted operating expenses increased $553 million, or 7.3%, in the fourth quarter of 2013 compared with the same period of 2012). Higher-than-planned volume growth, combined with adverse weather conditions and the relatively compressed holiday shipping season in 2013 (there were six fewer days between the Thanksgiving and Christmas holidays in 2013 relative to 2012), resulted in a significant increase in labor hours and the greater use of contract carriers to help meet our service commitments. Additionally, the much later-than-anticipated seasonal increase in volume during the fourth quarter strained our transportation network, resulting in lower productivity (total union labor hours increased 6.2%, while volume increased 5.6% in the fourth quarter).
Operating Profit and Margin
2014
compared to
2013
Adjusted operating profit decreased $94 million in 2014 compared with 2013, and was impacted by several factors. We incurred approximately $200 million of additional operating costs during the fourth quarter holiday shipping season, largely due to decreased productivity, higher contract carrier rates, and additional union overtime and training hours. The unfavorable weather conditions in the U.S. in early 2014 reduced operating profit approximately $200 million in 2014, including the estimated loss in package volume, increased guaranteed service refunds to customers and higher operating expenses. Additionally, changes in customer and product mix combined to pressure our revenue per piece. These factors were partially offset by solid volume growth and the overall productivity improvements (resulting in lower cost per piece) discussed previously. The combination of these factors led to a 90 basis point decline in our operating margin in 2014 compared with 2013.
2013
compared to
2012
Adjusted operating profit increased $71 million in 2013 compared with 2012, as the volume growth and productivity improvements discussed previously more than offset the pressure on revenue per piece and the adverse impact of fuel. Overall volume growth allowed us to better leverage our transportation network, resulting in greater productivity and better pick-up and delivery density; however, these factors were partially offset by changes in customer and product mix, which combined to pressure our revenue per piece. Additionally, the net impact of fuel adversely affected operating profit by $158 million in 2013 compared with 2012, as fuel surcharge revenue decreased at a faster rate than fuel expense.
Although annual adjusted operating profit improved in 2013, it declined by $178 million in the fourth quarter of 2013 compared with the fourth quarter of 2012. This decline in profitability was largely due to additional labor and purchased transportation costs, as heavier-than-anticipated volume, adverse weather conditions and a compressed holiday shipping season combined to result in approximately $125 to $150 million in extra costs in the fourth quarter of 2013. In addition, we incurred approximately $50 million in service refunds for unmet delivery commitments in the fourth quarter of 2013. The combination of these factors resulted in a 250 basis point decrease in our fourth quarter operating margin.
33
UNITED PARCEL SERVICE, INC. AND SUBSIDIARIES
MANAGEMENT'S DISCUSSION AND ANALYSIS OF FINANCIAL CONDITION AND
RESULTS OF OPERATIONS
International Package Operations
|
|
Year Ended December 31,
|
% Change
|
|||||||||||||||||
|
|
2014
|
2013
|
2012
|
2014 / 2013
|
2013 / 2012
|
||||||||||||||
|
Average Daily Package Volume (in thousands):
|
|||||||||||||||||||
|
Domestic
|
1,579
|
|
1,499
|
|
1,427
|
|
5.3
|
%
|
5.0
|
%
|
|||||||||
|
Export
|
1,115
|
|
1,034
|
|
972
|
|
7.8
|
%
|
6.4
|
%
|
|||||||||
|
Total Avg. Daily Package Volume
|
2,694
|
|
2,533
|
|
2,399
|
|
6.4
|
%
|
5.6
|
%
|
|||||||||
|
Average Revenue Per Piece:
|
|||||||||||||||||||
|
Domestic
|
$
|
6.97
|
|
$
|
7.06
|
|
$
|
7.04
|
|
(1.3
|
)%
|
0.3
|
%
|
||||||
|
Export
|
33.98
|
|
35.18
|
|
36.88
|
|
(3.4
|
)%
|
(4.6
|
)%
|
|||||||||
|
Total Avg. Revenue Per Piece
|
$
|
18.15
|
|
$
|
18.54
|
|
$
|
19.13
|
|
(2.1
|
)%
|
(3.1
|
)%
|
||||||
|
Operating Days in Period
|
253
|
|
252
|
|
252
|
|
|||||||||||||
|
Revenue (in millions):
|
|||||||||||||||||||
|
Domestic
|
$
|
2,784
|
|
$
|
2,667
|
|
$
|
2,531
|
|
4.4
|
%
|
5.4
|
%
|
||||||
|
Export
|
9,586
|
|
9,166
|
|
9,033
|
|
4.6
|
%
|
1.5
|
%
|
|||||||||
|
Cargo
|
618
|
|
596
|
|
560
|
|
3.7
|
%
|
6.4
|
%
|
|||||||||
|
Total Revenue
|
$
|
12,988
|
|
$
|
12,429
|
|
$
|
12,124
|
|
4.5
|
%
|
2.5
|
%
|
||||||
|
Operating Expenses (in millions):
|
|||||||||||||||||||
|
Operating Expenses
|
$
|
11,311
|
|
$
|
10,672
|
|
$
|
11,255
|
|
6.0
|
%
|
(5.2
|
)%
|
||||||
|
Defined Benefit Plan Mark-to-Market Charge
|
(200
|
)
|
—
|
|
(941
|
)
|
|||||||||||||
|
Health & Welfare Plan Charges
|
(28
|
)
|
—
|
|
—
|
|
|||||||||||||
|
Gain Upon Liquidation of Foreign Subsidiary
|
—
|
|
245
|
|
—
|
|
|||||||||||||
|
TNT Termination Fee and Related Expenses
|
—
|
|
(284
|
)
|
—
|
|
|||||||||||||
|
Adjusted Operating Expenses
|
$
|
11,083
|
|
$
|
10,633
|
|
$
|
10,314
|
|
4.2
|
%
|
3.1
|
%
|
||||||
|
Operating Profit (in millions) and Operating Margin:
|
|||||||||||||||||||
|
Operating Profit
|
$
|
1,677
|
|
$
|
1,757
|
|
$
|
869
|
|
(4.6
|
)%
|
102.2
|
%
|
||||||
|
Adjusted Operating Profit
|
$
|
1,905
|
|
$
|
1,796
|
|
$
|
1,810
|
|
6.1
|
%
|
(0.8
|
)%
|
||||||
|
Operating Margin
|
12.9
|
%
|
14.1
|
%
|
7.2
|
%
|
|||||||||||||
|
Adjusted Operating Margin
|
14.7
|
%
|
14.5
|
%
|
14.9
|
%
|
|||||||||||||
|
Currency Translation Benefit / (Cost)—(in millions)*:
|
|||||||||||||||||||
|
Revenue
|
$
|
(72
|
)
|
$
|
(65
|
)
|
|||||||||||||
|
Operating Expenses
|
87
|
|
(37
|
)
|
|||||||||||||||
|
Operating Profit
|
$
|
15
|
|
$
|
(102
|
)
|
|||||||||||||
|
*
|
Net of currency hedging; amount represents the change compared to the prior year.
|
Revenue
The change in overall revenue was impacted by the following factors for the years ended
December 31, 2014
and
2013
, compared with the corresponding prior year periods:
|
Volume
|
Rates /
Product Mix
|
Fuel
Surcharge
|
Currency
|
Total
Revenue
Change
|
||||||||||
|
Revenue Change Drivers:
|
||||||||||||||
|
2014 / 2013
|
6.8
|
%
|
(1.7
|
)%
|
—
|
%
|
(0.6
|
)%
|
4.5
|
%
|
||||
|
2013 / 2012
|
5.6
|
%
|
(1.5
|
)%
|
(1.1
|
)%
|
(0.5
|
)%
|
2.5
|
%
|
||||
34
UNITED PARCEL SERVICE, INC. AND SUBSIDIARIES
MANAGEMENT'S DISCUSSION AND ANALYSIS OF FINANCIAL CONDITION AND
RESULTS OF OPERATIONS
Volume
2014
compared to
2013
Our overall average daily volume increased in 2014, largely due to strong demand from several economic sectors (including retail, healthcare, industrial and automotive).
We continued to experience strong export volume growth in 2014, with increases from all regions in the world. European export volume increased 12% for the year, with particular strength in the intra-European trade lanes and the Europe-to-U.S. trade lane. Asian export volume increased at a moderate pace (with strength in the Asia-to-U.S. and Asia-to-Europe trade lanes), and benefited from technology sector product launches. Export volume continued to shift towards our standard products, such as Transborder Standard and Worldwide Expedited, as compared with our premium express products, such as Worldwide Express. Our international customers continue to be impacted by economic pressures and changes in their supply chain networks, and the combination of these factors influences their sensitivity towards the price and speed of shipments.
The strong increase in domestic volume in 2014 was driven by solid volume growth in Canada, Italy, Spain, France and the United Kingdom.
2013
compared to
2012
Our overall average daily volume increased in 2013 compared with 2012, largely due to growth in key markets in Europe, as well as Canada and Mexico.
Export volume increased in 2013, and was driven by Europe (largely in the intra-European trade lanes) and the Americas (particularly in the Canada-to-U.S. and Mexico-to-U.S. trade lanes). Asian export volume grew at a moderate pace due to continued regional economic growth and expansion of our service offerings, but was negatively impacted by fewer technology product launches from our customers and a small number of competitive losses. Volume continued to shift towards our standard products, such as Transborder Standard and Worldwide Expedited, as compared with our premium express products, such as Worldwide Express.
Domestic volume increased in 2013 compared to 2012, and was driven by solid volume growth in several key markets, including Italy, Canada, Poland and Turkey.
Rates and Product Mix
2014
compared to
2013
Total average revenue per piece decreased 1.5% in 2014 on a currency-adjusted basis, and was impacted by changes in base rates as well as product mix.
On December 30, 2013, we implemented an average 4.9% net increase in base and accessorial rates for international shipments originating in the United States (Worldwide Express, Worldwide Saver, UPS Worldwide Expedited and UPS International Standard service). Rate changes for shipments originating outside the U.S. are made throughout the year and vary by geographic market.
Currency-adjusted export revenue per piece decreased 3.1% in 2014, as the shift in product mix from our premium express products to our standard products more than offset the increase in base rates (volume for our standard products increased 12%, while volume for our premium express products increased 4%). Additionally, currency-adjusted export revenue per piece was adversely impacted by shorter average trade lanes (due to faster growth in intra-regional shipments) and changes in customer mix (as export volume growth for larger customers exceeded the volume growth for higher-yielding middle market customers).
Currency-adjusted domestic revenue per piece increased 0.3% in 2014, and was impacted by base rate increases, as well as changes in product mix and fuel surcharge rates.
35
UNITED PARCEL SERVICE, INC. AND SUBSIDIARIES
MANAGEMENT'S DISCUSSION AND ANALYSIS OF FINANCIAL CONDITION AND
RESULTS OF OPERATIONS
2013
compared to
2012
Total average revenue per piece decreased 2.5% in 2013 on a currency-adjusted basis, and was impacted by changes in base rates, customer and product mix, and fuel surcharge rates.
On December 31, 2012, we increased the base rates 6.5% for international shipments originating in the United States (Worldwide Express, Worldwide Express Plus, UPS Worldwide Expedited and UPS International Standard service), while reducing fuel surcharge indices. Rate changes for shipments originating outside the U.S. are made throughout the year and vary by geographic market.
Currency-adjusted export revenue per piece decreased 3.7% in 2013, as the shift in product mix from our premium express products to our standard products more than offset the increase in base rates. Currency-adjusted export revenue per piece was also negatively affected by the faster growth among our larger customers, which tend to have a lower yield than middle market and smaller accounts. Additionally, currency-adjusted export revenue per piece was adversely impacted by shorter average trade lanes (due to faster growth in intra-regional shipments), as well as a small impact on pricing from overcapacity in the Asia outbound freight market.
Currency-adjusted domestic revenue per piece decreased 0.4% in 2013. Domestic revenue per piece was adversely impacted by the faster domestic volume growth in our lower-yielding standard service, as well as product and customer mix changes in several developed markets.
Fuel Surcharges
We maintain fuel surcharges on our international air and ground services. The fuel surcharges for international air products originating inside or outside the United States are indexed to the DOE's Gulf Coast spot price for a gallon of kerosene-type jet fuel, while the fuel surcharges for ground products originating outside the United States are indexed to fuel prices in the international region or country where the shipment takes place.
In connection with our base rate increase on December 31, 2012, we modified the fuel surcharge on certain U.S.-related international air services by reducing the index used to determine the fuel surcharge by 2%.
Total international fuel surcharge revenue increased by $2 million in 2014, as the combined impact of international air volume growth and modifications to the fuel surcharge indices were largely offset by declining fuel prices. Total international fuel surcharge revenue decreased by $135 million in 2013, largely due to declining fuel prices and the 2% reduction in the index; however, this was partially offset by increases in international air volume.
Operating Expenses
2014
compared to
2013
Overall adjusted operating expenses for the segment increased $450 million in 2014. This increase was driven by the cost of pick-up and delivery, which increased $201 million, as well as the cost of operating our international integrated air and ground network, which increased $150 million. The increases in pick-up and delivery and network costs were largely driven by higher package volume and higher expense for outside transportation carriers (which was impacted by network capacity constraints in Europe). However, network cost increases were mitigated by reductions in average daily aircraft block hours
(1.1% decrease in 2014), as a result of ongoing modifications to our air network; this was achieved even with a 7.8% increase in international export volume and several air product service enhancements.
The remaining increase in adjusted operating expenses in 2014 was largely due to the costs of package sorting, which increased $52 million, and was impacted by volume growth. Additionally, indirect operating costs increased $47 million in 2014, and were affected by various factors, including restructuring charges, foreign currency remeasurement losses, legal contingency accruals, bad debt expense, and several other factors.
Excluding the impact of currency exchange rate changes, the total adjusted cost per piece for the segment decreased 1.6% in 2014.
36
UNITED PARCEL SERVICE, INC. AND SUBSIDIARIES
MANAGEMENT'S DISCUSSION AND ANALYSIS OF FINANCIAL CONDITION AND
RESULTS OF OPERATIONS
2013
compared to
2012
Overall adjusted operating expenses for the segment increased $319 million in 2013 compared with 2012. This increase was driven by the cost of pick-up and delivery, which increased $195 million for the year, largely due to higher package volume.
The cost of operating our international integrated air and ground network increased $111 million for the year, also largely due to higher package volume; however, network costs were mitigated by a 0.4% reduction in average daily aircraft block hours resulting from ongoing modifications to our air network. This was achieved even with a 6.4% increase in international export volume and several air product service enhancements that occurred during 2013.
The remaining increases in adjusted operating expenses for the year were largely due to the costs of package sorting, which was impacted by volume growth, and indirect operating costs, which were affected by increased expenses associated with aviation security.
Excluding the impact of currency exchange rate changes, the total adjusted cost per piece for the segment decreased 2.7% in 2013 compared with 2012.
Operating Profit and Margin
2014
compared to
2013
Adjusted operating profit increased by $109 million in 2014, while the adjusted operating margin increased 20 basis points. These increases were largely due to moderate revenue growth combined with the mitigation of expense increases through improved productivity.
In addition to the aforementioned factors, the net impact of fuel (fuel surcharge revenue grew faster than fuel expense) and the net impact of currency (remeasurement and translation gains) resulted in a favorable impact on operating profit of $127 million when comparing 2014 with 2013. Fuel surcharge revenue was favorably impacted during 2014 by rate increases to the fuel surcharge index. Operating profit in 2014 was negatively impacted by $21 million due to a restructuring charge and related costs in Europe.
2013
compared to
2012
Adjusted operating profit contracted by 0.8% in 2013 compared with 2012, while the adjusted operating margin decreased 40 basis points. The solid volume growth in 2013 was largely offset by reductions in revenue per piece, leading to only slight growth in revenue. The net impact of fuel (fuel surcharge revenue decreased at a faster rate than fuel expense) as well as currency remeasurement and translation losses combined to decrease operating profit by $219 million when comparing 2013 with 2012. The combination of low revenue growth and the adverse impact of fuel and currency led to the reduction in adjusted operating margin.
37
UNITED PARCEL SERVICE, INC. AND SUBSIDIARIES
MANAGEMENT'S DISCUSSION AND ANALYSIS OF FINANCIAL CONDITION AND
RESULTS OF OPERATIONS
Supply Chain & Freight Operations
|
|
Year Ended December 31,
|
% Change
|
|||||||||||||||||
|
|
2014
|
2013
|
2012
|
2014 / 2013
|
2013 / 2012
|
||||||||||||||
|
Freight LTL Statistics:
|
|||||||||||||||||||
|
Revenue (in millions)
|
$
|
2,633
|
|
$
|
2,502
|
|
$
|
2,377
|
|
5.2
|
%
|
5.3
|
%
|
||||||
|
Revenue Per Hundredweight
|
$
|
22.64
|
|
$
|
22.05
|
|
$
|
21.73
|
|
2.7
|
%
|
1.5
|
%
|
||||||
|
Shipments (in thousands)
|
10,762
|
|
10,497
|
|
10,136
|
|
2.5
|
%
|
3.6
|
%
|
|||||||||
|
Shipments Per Day (in thousands)
|
42.5
|
|
41.5
|
|
40.1
|
|
2.5
|
%
|
3.6
|
%
|
|||||||||
|
Gross Weight Hauled (in millions of lbs)
|
11,632
|
|
11,348
|
|
10,939
|
|
2.5
|
%
|
3.7
|
%
|
|||||||||
|
Weight Per Shipment (in lbs)
|
1,081
|
|
1,081
|
|
1,079
|
|
—
|
%
|
0.2
|
%
|
|||||||||
|
Operating Days in Period
|
253
|
|
253
|
|
253
|
|
|||||||||||||
|
Revenue (in millions):
|
|||||||||||||||||||
|
Forwarding and Logistics
|
$
|
5,758
|
|
$
|
5,492
|
|
$
|
5,977
|
|
4.8
|
%
|
(8.1
|
)%
|
||||||
|
Freight
|
3,048
|
|
2,882
|
|
2,640
|
|
5.8
|
%
|
9.2
|
%
|
|||||||||
|
Other
|
587
|
|
561
|
|
530
|
|
4.6
|
%
|
5.8
|
%
|
|||||||||
|
Total Revenue
|
$
|
9,393
|
|
$
|
8,935
|
|
$
|
9,147
|
|
5.1
|
%
|
(2.3
|
)%
|
||||||
|
Operating Expenses (in millions):
|
|||||||||||||||||||
|
Operating Expenses
|
$
|
8,961
|
|
$
|
8,261
|
|
$
|
9,132
|
|
8.5
|
%
|
(9.5
|
)%
|
||||||
|
Defined Benefit Plans Mark-to-Market Charge
|
(202
|
)
|
—
|
|
(713
|
)
|
|||||||||||||
|
Health & Welfare Plan Charges
|
(84
|
)
|
—
|
|
—
|
|
|||||||||||||
|
Adjusted Operating Expenses
|
$
|
8,675
|
|
$
|
8,261
|
|
$
|
8,419
|
|
5.0
|
%
|
(1.9
|
)%
|
||||||
|
Operating Profit (in millions) and Operating Margins:
|
|||||||||||||||||||
|
Operating Profit
|
$
|
432
|
|
$
|
674
|
|
$
|
15
|
|
(35.9
|
)%
|
N/A
|
|
||||||
|
Adjusted Operating Profit
|
$
|
718
|
|
$
|
674
|
|
$
|
728
|
|
6.5
|
%
|
(7.4
|
)%
|
||||||
|
Operating Margin
|
4.6
|
%
|
7.5
|
%
|
0.2
|
%
|
|||||||||||||
|
Adjusted Operating Margin
|
7.6
|
%
|
7.5
|
%
|
8.0
|
%
|
|||||||||||||
|
Currency Translation Benefit / (Cost)—(in millions)*:
|
|||||||||||||||||||
|
Revenue
|
$
|
(65
|
)
|
$
|
(31
|
)
|
|||||||||||||
|
Operating Expenses
|
54
|
|
25
|
|
|||||||||||||||
|
Operating Profit
|
$
|
(11
|
)
|
$
|
(6
|
)
|
|||||||||||||
|
*
|
Amount represents the change compared to the prior year.
|
Revenue
2014
compared to
2013
Forwarding and logistics revenue increased $266 million in 2014 compared with 2013. Forwarding revenue increased for the year, primarily due to volume and tonnage growth in our international air freight, North American air freight and ocean freight businesses, which were impacted by improving overall market demand. This was partially offset, however, by lower rates charged to our customers in our international air forwarding business, which was largely due to industry overcapacity in key trade lanes, particularly the Asia-outbound market. Revenue for our logistics products increased in 2014, as we experienced solid growth in our mail services, healthcare and retail distribution solutions.
38
UNITED PARCEL SERVICE, INC. AND SUBSIDIARIES
MANAGEMENT'S DISCUSSION AND ANALYSIS OF FINANCIAL CONDITION AND
RESULTS OF OPERATIONS
Freight revenue increased $166 million in 2014, driven by solid increases in average daily LTL shipments and LTL revenue per hundredweight. The increase in average daily LTL shipments in 2014 was impacted by overall U.S. economic growth and improving LTL market conditions. The increase in LTL revenue per hundredweight was largely due to our focus on yield management, as well as general rate increases averaging 4.4% and 5.9% that took effect in March 2014 and June 2013, respectively, covering non-contractual shipments in the United States, Canada and Mexico. LTL fuel surcharge revenue increased by $13 million in 2014 compared with 2013, due to changes in diesel fuel prices and overall LTL shipment volume.
Revenue for the other businesses within Supply Chain & Freight increased $26 million in 2014, due to revenue growth at The UPS Store, UPS Capital and UPS Customer Solutions; however, this was partially offset by a decline in revenue from our contract to provide domestic air transportation services for the U.S. Postal Service.
2013
compared to
2012
Forwarding and logistics revenue decreased $485 million in 2013 compared with 2012. Forwarding revenue decreased in 2013, primarily due to lower tonnage and rates charged to our customers in our international air forwarding business. The reduction in tonnage was caused by several factors, including weak overall market demand, competitive pressures, and our customer concentration among the technology and military sectors, as demand in these sectors was relatively weaker than the remainder of the air freight market. The reduction in rates was largely due to industry overcapacity in key trade lanes, particularly the Asia-outbound market. Revenue for our logistics products increased in 2013 compared with 2012, as we experienced solid growth in our mail services and healthcare distribution solutions; however, this was largely offset by revenue declines among our technology customers.
Freight revenue increased $242 million in 2013, driven by an increase in LTL revenue per hundredweight, tonnage and average daily LTL shipments. The increase in LTL revenue per hundredweight was largely due to our focus on yield management, as well as general rate increases averaging 5.9% that took effect on both July 16, 2012 and on June 10, 2013, covering non-contractual shipments in the United States, Canada and Mexico. LTL fuel surcharge revenue increased by $18 million in 2013 compared with the prior year, due to changes in diesel fuel prices and overall LTL shipment volume. In addition, our Truckload division experienced increased volume and revenue, primarily related to our dedicated and non-dedicated service offerings.
The other businesses within Supply Chain & Freight increased revenue by $31 million in 2013, primarily due to growth at UPS Capital, The UPS Store and UPS Customer Solutions.
Operating Expenses
2014
compared to
2013
Forwarding and logistics adjusted operating expenses increased $266 million in 2014, largely due to higher purchased transportation and employee compensation expenses. Purchased transportation expense increased by $229 million for the year, primarily due to higher volume and tonnage in our international air freight forwarding business and higher rates charged to us by third-party transportation carriers. Compensation and benefits expense increased $47 million in 2014, due to merit salary and wage increases for management and hourly employees, along with an increase in the overall size of the workforce.
Freight adjusted operating expenses increased $140 million in 2014, while the total adjusted cost per LTL shipment increased 2.0%. The increase in adjusted operating expenses was largely due to pick-up and delivery expenses (which increased $96 million) and the costs associated with operating our linehaul network (which increased $65 million). The increases in pick-up and delivery and network costs were primarily due to contractual wage increases, higher LTL volume and increased costs associated with outside contract and rail carriers. Partially offsetting these cost increases were reductions in indirect operating expenses, including lower auto liability and worker's compensation costs, which were impacted by operational safety and claims management initiatives, as well as lower pension expense.
Operating expenses for the other businesses within Supply Chain & Freight increased $8 million in 2014 compared with 2013.
39
UNITED PARCEL SERVICE, INC. AND SUBSIDIARIES
MANAGEMENT'S DISCUSSION AND ANALYSIS OF FINANCIAL CONDITION AND
RESULTS OF OPERATIONS
2013
compared to
2012
Forwarding and logistics adjusted operating expenses decreased $388 million in 2013 compared with 2012, due to several factors. Purchased transportation expense declined by $236 million, primarily due to lower tonnage in our international air freight forwarding business. Compensation and benefits expense declined by $59 million, largely due to reduced payroll costs and lower expense for worker's compensation claims. The remaining decrease in expense resulted from lower fuel costs, bad debt expense, and various other items.
Freight adjusted operating expenses increased $234 million in 2013, while the total cost per LTL shipment increased 2.0%. The largest component of this increase related to the cost of operating our linehaul network, which grew by $62 million, as a result of a 3.7% average daily tonnage increase, coupled with wage and purchased transportation increases. Our Truckload division experienced a $48 million increase in costs for the year, largely related to the expansion of our dedicated and non-dedicated services. Pick-up and delivery costs increased $15 million as a result of higher volume and wage increases, but were partially offset by productivity improvements. The remaining increase in expense in 2013 was impacted by increases in pension expense and healthcare costs.
Adjusted operating expenses for the other businesses within Supply Chain & Freight decreased $4 million in 2013 compared with 2012.
Operating Profit and Margin
2014
compared to
2013
Adjusted operating profit for the forwarding and logistics unit remained comparable between 2014 and 2013, and was impacted by several factors. Operating profit in the international air forwarding business declined in 2014, as continued excess market capacity in key trade lanes reduced the margin between the rates we charge our customers and the rates at which we procure capacity from third party air carriers. We increased profitability in our North American air freight, ocean freight, distribution and mail services units in 2014, as a result of improving market demand and cost controls.
Adjusted operating profit for our freight unit increased $26 million in 2014 compared with 2013, as shipment growth, increased yields and higher productivity more than offset contractual union wage increases.
The combined operating profit for all of our other businesses in this segment increased $18 million in 2014, primarily due to higher operating profit at UPS Capital and UPS Customer Solutions.
2013
compared to
2012
Adjusted operating profit for the forwarding and logistics unit decreased by $97 million in 2013 compared with 2012. This decrease was primarily due to reduced profitability in our international air forwarding business, which resulted from competitive pressures combined with weak overall air freight market demand due to continued economic weakness in Europe, slowing growth in China and a sluggish U.S. economy. Additionally, our customer concentration among the technology and military sectors negatively impacted our results, as demand in these sectors was relatively weaker than the remainder of the air freight market. This lower demand pressured the rates we charge to our customers, which more than offset the reduced rates we incur from third-party transportation carriers, and thereby led to a compression in our operating margin.
Adjusted operating profit for our freight unit increased $8 million in 2013 compared with 2012, as improvements in average daily LTL volume, yields and productivity measures (including gains in pick-up and delivery stops per hour, dock bills per hour and linehaul network utilization) more than offset an increase in wage and benefit expenses.
The combined adjusted operating profit for all of our other businesses in this segment increased $35 million in 2013 compared with 2012, primarily due to higher operating profit at UPS Capital and The UPS Store.
40
UNITED PARCEL SERVICE, INC. AND SUBSIDIARIES
MANAGEMENT'S DISCUSSION AND ANALYSIS OF FINANCIAL CONDITION AND
RESULTS OF OPERATIONS
Operating Expenses
|
|
Year Ended December 31,
|
% Change
|
|||||||||||||||||
|
|
2014
|
2013
|
2012
|
2014 / 2013
|
2013 / 2012
|
||||||||||||||
|
Operating Expenses (in millions):
|
|||||||||||||||||||
|
Compensation and Benefits
|
$
|
32,045
|
|
$
|
28,557
|
|
$
|
33,102
|
|
12.2
|
%
|
(13.7
|
)%
|
||||||
|
Defined Benefit Plans Mark-to-Market Charge
|
(1,062
|
)
|
—
|
|
(4,831
|
)
|
|||||||||||||
|
Health & Welfare Plan Charges
|
(1,102
|
)
|
—
|
|
—
|
|
|||||||||||||
|
Multiemployer Pension Plan Withdrawal Charge
|
—
|
|
—
|
|
(896
|
)
|
|||||||||||||
|
Adjusted Compensation and Benefits
|
29,881
|
|
28,557
|
|
27,375
|
|
4.6
|
%
|
4.3
|
%
|
|||||||||
|
Repairs and Maintenance
|
1,371
|
|
1,240
|
|
1,228
|
|
10.6
|
%
|
1.0
|
%
|
|||||||||
|
Depreciation and Amortization
|
1,923
|
|
1,867
|
|
1,858
|
|
3.0
|
%
|
0.5
|
%
|
|||||||||
|
Purchased Transportation
|
8,460
|
|
7,486
|
|
7,354
|
|
13.0
|
%
|
1.8
|
%
|
|||||||||
|
Fuel
|
3,883
|
|
4,027
|
|
4,090
|
|
(3.6
|
)%
|
(1.5
|
)%
|
|||||||||
|
Other Occupancy
|
1,044
|
|
950
|
|
902
|
|
9.9
|
%
|
5.3
|
%
|
|||||||||
|
Other Expenses
|
4,538
|
|
4,277
|
|
4,250
|
|
6.1
|
%
|
0.6
|
%
|
|||||||||
|
TNT Termination Fee and Related Expenses
|
—
|
|
(284
|
)
|
—
|
|
|||||||||||||
|
Gain Upon Liquidation of Foreign Subsidiary
|
—
|
|
245
|
|
—
|
|
|||||||||||||
|
Adjusted Other Expenses
|
4,538
|
|
4,238
|
|
4,250
|
|
7.1
|
%
|
(0.3
|
)%
|
|||||||||
|
Total Operating Expenses
|
$
|
53,264
|
|
$
|
48,404
|
|
$
|
52,784
|
|
10.0
|
%
|
(8.3
|
)%
|
||||||
|
Adjusted Total Operating Expenses
|
$
|
51,100
|
|
$
|
48,365
|
|
$
|
47,057
|
|
5.7
|
%
|
2.8
|
%
|
||||||
|
Currency Translation Cost / (Benefit)*
|
$
|
(141
|
)
|
$
|
12
|
|
|||||||||||||
|
*
|
Amount represents the change compared to the prior year.
|
Compensation and Benefits
2014
compared to
2013
Employee payroll costs increased $1.054 billion in 2014, compared with 2013, largely due to contractual union wage rate increases, a 7.5% increase in average daily union labor hours, and a merit salary increase for management employees. The increase in average daily union labor hours was impacted by volume growth, as well as additional training hours for the seasonal fourth quarter staffing increase. Additionally, adverse weather conditions in the early part of 2014 contributed to an increase in labor hours in the year-to-date comparison.
Adjusted benefits expense increased $270 million in 2014, primarily due to increased health and welfare costs, payroll taxes, and vacation, holiday and excused absence expenses. However, these factors were partially offset by a reduction in pension costs and workers compensation expense. These factors are discussed further as follows:
|
•
|
Adjusted health and welfare costs increased $221 million in 2014, largely due to higher medical claims in company-sponsored plans, increased contributions to multiemployer plans and the impact of several provisions of the Patient Protection and Affordable Care Act of 2010. The growth in multiemployer plan contributions was impacted by contractual contribution rate increases and higher union labor hours.
|
|
•
|
Payroll taxes increased $73 million in 2014, primarily as a result of higher union labor hours, union wage rate increases and higher management incentive compensation payments.
|
41
UNITED PARCEL SERVICE, INC. AND SUBSIDIARIES
MANAGEMENT'S DISCUSSION AND ANALYSIS OF FINANCIAL CONDITION AND
RESULTS OF OPERATIONS
|
•
|
Vacation, holiday and excused absence expense increased $41 million in 2014, due to an increase in the overall number of employees and increased vacation entitlements earned based on employees' years of service.
|
|
•
|
Adjusted pension costs declined $23 million in 2014, as a decrease in the expense for company-sponsored pension plans (largely due to higher discount rates used to determine pension cost for 2014) was largely offset by higher contributions to multiemployer pension plans (due to both increased contribution rates and higher union labor hours).
|
|
•
|
Workers compensation expense decreased $69 million in 2014, impacting all segments. Insurance reserves are established for estimates of the loss that we will ultimately incur on reported worker's compensation claims, as well as estimates of claims that have been incurred but not reported, and take into account a number of factors including our history of claim losses, payroll growth and the impact of safety improvement initiatives. In 2014, we experienced favorable actuarial expense adjustments as the frequency and severity of claims was less than previously projected, due to the impact of ongoing operational safety improvement and claim management initiatives.
|
2013
compared to
2012
Employee payroll costs increased $684 million in 2013 compared with 2012, largely due to contractual union wage rate increases, a 3.1% increase in average daily union labor hours, and a merit salary increase for management employees; however, this was partially offset by an overall reduction in the number of management personnel.
Adjusted benefits expense increased $498 million in 2013 compared with 2012, primarily due to higher pension expense, increased vacation, holiday and excused absence expense, and higher health and welfare costs; however, these items were partially offset by changes in the expense associated with our self-insurance for worker’s compensation claims. These primary factors impacting expense are discussed further as follows:
|
•
|
Pension expense increased $300 million in 2013 compared with 2012, due to higher union contribution rates for multiemployer pension plans combined with increased service and interest costs for company-sponsored plans. The increase in service and interest costs for company-sponsored plans was largely due to continued service accruals and lower discount rates.
|
|
•
|
Vacation, holiday and excused absence expense increased $89 million in 2013 compared with 2012, due to increased vacation entitlements earned based on employees' years of service, higher wage rates and an increase in the overall number of employees during 2013.
|
|
•
|
Health and welfare costs increased $182 million in 2013 compared with 2012, largely due to increased contribution rates to multiemployer plans, higher medical claims in UPS-sponsored plans, and the impact of several provisions of the Patient Protection and Affordable Care Act of 2010.
|
|
•
|
The expense associated with our self-insurance programs for worker’s compensation claims decreased $131 million in 2013 compared with 2012. In 2013, we experienced favorable actuarial expense adjustments as the frequency and severity of claims was less than previously projected, due to the impact of ongoing safety improvement and claim management initiatives.
|
Repairs and Maintenance
2014
compared to
2013
The increase in repairs and maintenance expense in 2014 was primarily due to a $93 million increase in airframe and aircraft engine repair and component replacement costs, largely in our Boeing 747 and 767 aircraft fleets. The remaining increase was largely due to increased vehicle maintenance costs in our global package and freight operations, primarily due to the growth in the size of our vehicle fleet.
2013
compared to
2012
The increase in repairs and maintenance expense was largely due to increased vehicle maintenance costs in our global package and freight operations. These higher costs were impacted by the increase in miles driven in 2013 compared with 2012, as well as the overall increase in the size of our vehicle fleet in our U.S. Domestic Package and UPS Freight operations.
42
UNITED PARCEL SERVICE, INC. AND SUBSIDIARIES
MANAGEMENT'S DISCUSSION AND ANALYSIS OF FINANCIAL CONDITION AND
RESULTS OF OPERATIONS
Depreciation and Amortization
2014
compared to
2013
The increase in depreciation and amortization expense in 2014, compared with 2013, was primarily due to a $45 million increase in the depreciation expense on vehicles, due to the replacement of older, fully-depreciated vehicles, technology upgrades on vehicles and an overall increase in the size of our vehicle fleet in our U.S. Domestic Package and UPS Freight operations. Additionally, amortization expense increased $20 million, primarily related to intangible assets resulting from business acquisitions. These factors were partially offset by a decrease in building and facility depreciation, as several operating facilities became fully-depreciated.
2013
compared to
2012
The increase in depreciation and amortization expense in 2013, compared with 2012, was primarily due to a $62 million increase in depreciation expense on vehicles. This increase was driven by the replacement of older, fully-depreciated vehicles, technology upgrades on new vehicles and an overall increase in the size of our vehicle fleet. This increase was largely offset by several factors, including lower building and facility depreciation and capitalized software amortization.
Purchased Transportation
2014
compared to
2013
The $974 million increase in purchased transportation expense charged to us by third-party air, ocean and truck carriers in 2014 was driven by several factors:
|
•
|
Our U.S. Domestic Package segment incurred a $474 million increase in expense in 2014, primarily due to (1) higher fees paid to the U.S. Postal Service associated with the volume growth in our SurePost product; (2) the increased use of, and higher rates passed to us from, rail carriers; and (3) the increased use of outside contract carriers, which was impacted by volume growth and rail carrier service issues; additionally, adverse weather conditions in the early months of 2014 resulted in the additional use of outside contract carriers. Approximately $177 million of the increase, or 37% of the total increase for the year, was attributable to the fourth quarter as a result of high seasonal volume.
|
|
•
|
Our International Package segment incurred a $203 million increase in expense in 2014, primarily due to higher costs incurred for the use of outside transportation providers, which was impacted by strong international volume growth.
|
|
•
|
Our UPS Freight business incurred a $68 million increase in expense in 2014, largely due to increased LTL and brokerage volume, and the resulting increased use of, and higher rates passed to us from, outside transportation carriers.
|
|
•
|
The purchased transportation expense for our forwarding and logistics business increased $229 million in 2014, largely due to increased volume and tonnage in our international air freight, North American air freight, and ocean forwarding businesses.
|
2013
compared to
2012
The increase in purchased transportation expense charged to us by third-party air, ocean and truck carriers in 2013, compared with 2012, was driven by several factors:
|
•
|
Our U.S. Domestic Package segment incurred a $154 million expense increase for the year, primarily due to higher rates passed to us from rail carriers, and higher fees paid to the U.S. Postal Service associated with the volume growth in our SurePost product. This increase in expense was also impacted by the adverse weather conditions in the fourth quarter of 2013, as well as the significant increase in volume during the compressed timing of the holiday season.
|
|
•
|
Our International Package segment incurred a $144 million expense increase for the year, primarily due to international volume growth.
|
|
•
|
Our UPS Freight business incurred a $70 million increase for the year, largely due to growth in LTL volume and higher rates passed to us from rail carriers.
|
|
•
|
The purchased transportation expense for our forwarding & logistics business declined $236 million for the year, largely due to lower tonnage and reduced rates from third-party transportation carriers in our international air freight forwarding business.
|
43
UNITED PARCEL SERVICE, INC. AND SUBSIDIARIES
MANAGEMENT'S DISCUSSION AND ANALYSIS OF FINANCIAL CONDITION AND
RESULTS OF OPERATIONS
Fuel
2014
compared to
2013
The $144 million decrease in fuel expense in 2014 was primarily due to lower fuel prices (net of hedging activity), which decreased fuel expense by $180 million in 2014. This was partially offset by higher fuel usage (due to an increase in aircraft block hours and vehicle miles driven), which increased expense by $36 million.
2013
compared to
2012
The decrease in fuel expense in 2013 was largely due to the decline in fuel prices (primarily jet-A fuel prices), which decreased expense by $77 million, net of hedging. This was partially offset by a $14 million increase in overall fuel usage, which was primarily due to lower vehicle fuel efficiency and an increase in miles driven.
Other Occupancy
2014
compared to
2013
The increase in other occupancy expense in 2014 was largely due to an increase in facility rent expense ($25 million), property taxes ($10 million) and natural gas and electric utility costs ($32 million). The increase in rent, property taxes and utilities expense was impacted by new leases on facilities to support the growth of our U.S. Domestic Package operations. Additionally, adverse weather conditions in the U.S. in the early months of 2014 resulted in $15 million of increased snow removal costs at our operating facilities.
2013
compared to
2012
The increase in other occupancy expense in 2013, compared with 2012, was primarily due to higher snow removal costs at our operating facilities, an increase in utility expenses, as well as higher real estate taxes. The relatively cold winter in the United States in 2013 compared with 2012 caused the increase in snow removal costs, while increased usage and higher prices of natural gas and electricity resulted in the increase in utility expenses.
Other Expenses
2014
compared to
2013
The $300 million increase in adjusted other expenses in 2014 was impacted by a number of factors. Transportation equipment rental expense increased $90 million for the year, and was affected by the growth in package volume (particularly the seasonal volume increase in the fourth quarter). We also incurred increases in several other expense categories, including transportation security costs, employee expense reimbursements and recruitment costs (related to training and staffing for the seasonal volume increase in the fourth quarter) and legal contingency expenses. These increases were partially offset by business interruption insurance claim reimbursements from previous weather-related events, as well as lower advertising costs.
2013
compared to
2012
The decrease in adjusted other expenses in 2013 compared with 2012 was impacted by a number of factors, including decreases in bad debt expense, employee expense reimbursements, advertising costs, telecommunications expenses, and non-income based state and local taxes. These decreases in expense were partially offset by increases in auto liability insurance, transportation equipment rentals, and air cargo handling costs.
44
UNITED PARCEL SERVICE, INC. AND SUBSIDIARIES
MANAGEMENT'S DISCUSSION AND ANALYSIS OF FINANCIAL CONDITION AND
RESULTS OF OPERATIONS
Investment Income and Interest Expense
The following table sets forth investment income and interest expense for the years ended
December 31, 2014
,
2013
and
2012
(in millions):
|
|
Year Ended December 31,
|
% Change
|
|||||||||||||||
|
|
2014
|
2013
|
2012
|
2014 / 2013
|
2013 / 2012
|
||||||||||||
|
Investment Income
|
$
|
22
|
|
$
|
20
|
|
$
|
24
|
|
10.0
|
%
|
(16.7
|
)%
|
||||
|
Interest Expense
|
$
|
(353
|
)
|
$
|
(380
|
)
|
$
|
(393
|
)
|
(7.1
|
)%
|
(3.3
|
)%
|
||||
Investment Income
2014
compared to
2013
The increase in investment income in 2014 compared with 2013 was primarily due to a $7 million decrease in losses from fair value adjustments on real estate partnerships. This was partially offset by a decline in interest income, largely due to having a lower average balance of invested assets in 2014.
2013
compared to
2012
The decrease in investment income in 2013 compared with 2012 was primarily due to lower interest rates earned on invested assets, as well as a decline in the average balance of invested assets. These factors were partially offset by higher realized gains on the sales of securities in 2013 compared with 2012.
Interest Expense
2014
compared to
2013
Interest expense decreased in 2014 compared with 2013, largely due to having a lower average balance of debt outstanding. In addition, interest expense declined due to a decrease in the interest rate indices underlying our variable-rate debt and swaps in 2014 compared with 2013.
2013
compared to
2012
Interest expense decreased in 2013 compared to 2012, largely due to three factors: (1) having a greater proportion of our debt swapped to lower-yielding variable rates, (2) a decrease in the interest rate indices underlying our variable-rate debt and swaps, and (3) a lower average balance of debt outstanding. These factors were partially offset by the imputation of interest expense on the multiemployer pension withdrawal liability related to the New England Pension Fund.
Income Tax Expense
The following table sets forth income tax expense and our effective tax rate for the years ended
December 31, 2014
,
2013
and
2012
(in millions):
|
|
Year Ended December 31,
|
% Change
|
|||||||||||||||
|
|
2014
|
2013
|
2012
|
2014 / 2013
|
2013 / 2012
|
||||||||||||
|
Income Tax Expense
|
$
|
1,605
|
|
$
|
2,302
|
|
$
|
167
|
|
(30.3
|
)%
|
N/A
|
|
||||
|
Income Tax Impact of:
|
|||||||||||||||||
|
Defined Benefit Plans Mark-to-Market Charge
|
392
|
|
—
|
|
1,808
|
|
|||||||||||
|
Health & Welfare Plan Charges
|
415
|
|
—
|
|
—
|
|
|||||||||||
|
TNT Termination Fee and Related Expenses
|
—
|
|
107
|
|
—
|
|
|||||||||||
|
Gain Upon Liquidation of Foreign Subsidiary
|
—
|
|
(32
|
)
|
—
|
|
|||||||||||
|
Multiemployer Pension Plan Withdrawal Charge
|
—
|
|
—
|
|
337
|
|
|||||||||||
|
Adjusted Income Tax Expense
|
$
|
2,412
|
|
$
|
2,377
|
|
$
|
2,312
|
|
1.5
|
%
|
2.8
|
%
|
||||
|
Effective Tax Rate
|
34.6
|
%
|
34.5
|
%
|
17.1
|
%
|
|||||||||||
|
Adjusted Effective Tax Rate
|
35.5
|
%
|
35.4
|
%
|
34.5
|
%
|
|||||||||||
45
UNITED PARCEL SERVICE, INC. AND SUBSIDIARIES
MANAGEMENT'S DISCUSSION AND ANALYSIS OF FINANCIAL CONDITION AND
RESULTS OF OPERATIONS
2014
compared to
2013
Our adjusted effective tax rate increased slightly to 35.5% in 2014 from 35.4% in 2013 due to a decrease in U.S. Federal and state tax credits relative to total pre-tax income, which was largely offset by favorable changes in the proportion of our taxable income in certain U.S. and non-U.S. jurisdictions relative to total pre-tax income.
2013
compared to
2012
Our adjusted effective tax rate increased to 35.4% in 2013 from 34.5% in 2012, due to a decrease in U.S. Federal and state tax credits relative to total pre-tax income, and unfavorable changes in the proportion of our taxable income in certain U.S. and non-U.S. jurisdictions relative to total pre-tax income.
Liquidity and Capital Resources
Operating Activities
The following is a summary of the significant sources (uses) of cash from operating activities (amounts in millions):
|
2014
|
2013
|
2012
|
|||||||||
|
Net income
|
$
|
3,032
|
|
$
|
4,372
|
|
$
|
807
|
|
||
|
Non-cash operating activities(a)
|
5,901
|
|
3,318
|
|
7,313
|
|
|||||
|
Pension and postretirement plan contributions (UPS-sponsored plans)
|
(1,258
|
)
|
(212
|
)
|
(917
|
)
|
|||||
|
Settlement of postretirement benefit obligation
|
(2,271
|
)
|
—
|
|
—
|
|
|||||
|
Income tax receivables and payables
|
(224
|
)
|
(155
|
)
|
280
|
|
|||||
|
Changes in working capital and other noncurrent assets and liabilities
|
512
|
|
121
|
|
(148
|
)
|
|||||
|
Other operating activities
|
34
|
|
(140
|
)
|
(119
|
)
|
|||||
|
Net cash from operating activities
|
$
|
5,726
|
|
$
|
7,304
|
|
$
|
7,216
|
|
||
|
(a)
|
Represents depreciation and amortization, gains and losses on derivative and foreign exchange transactions, deferred income taxes, provisions for uncollectible accounts, pension and postretirement benefit expense, stock compensation expense, impairment charges and other non-cash items.
|
Cash from operating activities remained strong throughout the 2012 to 2014 time period. Operating cash flow was adversely impacted by $1.527 billion due to certain transactions resulting from the ratification of our collective bargaining agreement with the Teamsters in 2014. These transactions are discussed further in the "Collective Bargaining Agreements" section:
|
•
|
We paid $2.271 billion to settle postretirement benefit obligations for certain union employees.
|
|
•
|
We paid $176 million in 2014 for retroactive economic benefits under the collective bargaining agreement that were related to the period between August through December of 2013.
|
|
•
|
During 2014, we received cash tax benefits of $920 million from the items described above (through reduced U.S. Federal and state quarterly income tax payments).
|
Most of the remaining variability in operating cash flows during the 2012 to 2014 time period relates to the funding of our company-sponsored pension and postretirement benefit plans (and related cash tax deductions). Except for discretionary or accelerated fundings of our plans, contributions to our company-sponsored pension plans have largely varied based on whether any minimum funding requirements are present for individual pension plans.
|
•
|
In 2014, we made discretionary contributions to our three primary company-sponsored U.S. pension plans totaling $1.042 billion.
|
|
•
|
In 2013, we did not have any required, nor make any discretionary, contributions to our primary company-sponsored pension plans in the U.S.
|
|
•
|
In 2012, we made a $355 million required contribution to the UPS IBT Pension Plan.
|
|
•
|
The remaining contributions in the 2012 through 2014 period were largely due to contributions to our international pension plans and U.S. postretirement medical benefit plans.
|
46
UNITED PARCEL SERVICE, INC. AND SUBSIDIARIES
MANAGEMENT'S DISCUSSION AND ANALYSIS OF FINANCIAL CONDITION AND
RESULTS OF OPERATIONS
As discussed further in the “Contractual Commitments” section, we have minimum funding requirements in the next several years, primarily related to the UPS IBT Pension, UPS Retirement and UPS Pension plans.
Apart from the transactions described above, operating cash flow was impacted by changes in our working capital position, payments for income taxes, and changes in hedge margin payables and receivables. In 2014 and 2013, the compressed holiday shipping season resulted in an increase in working capital needs at each year-end period. The cash payments for income taxes were $1.524, $2.712 and $1.988 billion for 2014, 2013 and 2012, respectively, and were primarily impacted by the timing of current tax deductions. The net hedge margin collateral received from derivative counterparties was $421, $67 and $4 million during 2014, 2013 and 2012, respectively, due to the increased net fair value asset position of the derivative contracts used in our currency and interest rate hedging programs.
As of
December 31, 2014
, the total of our worldwide holdings of cash and cash equivalents was $
2.291 billion
, of which $1.072 billion was held by foreign subsidiaries. The amount of cash held by our U.S. and foreign subsidiaries fluctuates throughout the year due to a variety of factors, including the timing of cash receipts and disbursements in the normal course of business. Cash provided by operating activities in the United States continues to be our primary source of funds to finance domestic operating needs, capital expenditures, share repurchases and dividend payments to shareowners. To the extent that such amounts represent previously untaxed earnings, the cash held by foreign subsidiaries would be subject to tax if such amounts were repatriated in the form of dividends; however, not all international cash balances would have to be repatriated in the form of a dividend if returned to the U.S. When amounts earned by foreign subsidiaries are expected to be indefinitely reinvested, no accrual for taxes is provided.
Investing Activities
Our primary sources (uses) of cash for investing activities were as follows (amounts in millions):
|
2014
|
2013
|
2012
|
|||||||||
|
Net cash used in investing activities
|
$
|
(2,801
|
)
|
$
|
(2,114
|
)
|
$
|
(1,335
|
)
|
||
|
Capital Expenditures:
|
|||||||||||
|
Buildings and facilities
|
$
|
(808
|
)
|
$
|
(483
|
)
|
$
|
(506
|
)
|
||
|
Aircraft and parts
|
(44
|
)
|
(478
|
)
|
(568
|
)
|
|||||
|
Vehicles
|
(1,061
|
)
|
(662
|
)
|
(672
|
)
|
|||||
|
Information technology
|
(415
|
)
|
(442
|
)
|
(407
|
)
|
|||||
|
$
|
(2,328
|
)
|
$
|
(2,065
|
)
|
$
|
(2,153
|
)
|
|||
|
Capital Expenditures as a % of Revenue
|
4.0
|
%
|
3.7
|
%
|
4.0
|
%
|
|||||
|
Other Investing Activities:
|
|||||||||||
|
Proceeds from disposals of property, plant and equipment
|
$
|
53
|
|
$
|
104
|
|
$
|
95
|
|
||
|
Net decrease in finance receivables
|
$
|
44
|
|
$
|
39
|
|
$
|
101
|
|
||
|
Net (purchases) sales of marketable securities
|
$
|
(419
|
)
|
$
|
9
|
|
$
|
628
|
|
||
|
Cash received (paid) for business acquisitions and dispositions
|
$
|
(88
|
)
|
$
|
(22
|
)
|
$
|
(100
|
)
|
||
|
Other investing activities
|
$
|
(63
|
)
|
$
|
(179
|
)
|
$
|
94
|
|
||
We have commitments for the purchase of vehicles, equipment and real estate to provide for the replacement of existing capacity and anticipated future growth. We generally fund our capital expenditures with our cash from operations. Future capital spending for anticipated growth and replacement assets will depend on a variety of factors, including economic and industry conditions. We anticipate that our capital expenditures for 2015 will be approximately $3.0 billion.
Capital spending on aircraft declined over the 2012 to 2014 period, as we completed the scheduled deliveries of a previous order for the Boeing 767-300ERF aircraft. Capital spending on vehicles increased during the 2012 to 2014 period in our U.S. and international package businesses and our freight unit, due to vehicle replacements, technology enhancements and new vehicle orders to support volume growth. Capital expenditures on buildings and facilities also increased in the 2012 to 2014 period, and included hub automation and capacity expansion projects in the U.S. during 2014, as well as expansion and new construction projects at facilities in Europe and Asia (including a $200 million expansion at our European air hub in Cologne, Germany that was completed in 2014).
47
UNITED PARCEL SERVICE, INC. AND SUBSIDIARIES
MANAGEMENT'S DISCUSSION AND ANALYSIS OF FINANCIAL CONDITION AND
RESULTS OF OPERATIONS
The proceeds from the disposal of property, plant and equipment were largely due to real estate sales during the 2012 through 2014 period, as well as the proceeds from insurance recoveries in 2013. The net decline in finance receivables in the 2012 through 2014 period was primarily due to customer paydowns and loan sales activity, primarily in our commercial lending, asset-based lending and leasing portfolios. The purchases and sales of marketable securities are largely determined by liquidity needs and the periodic rebalancing of investment types, and will therefore fluctuate from period to period.
The cash paid for business acquisitions in the 2012 to 2014 period was largely due to the acquisitions of Kiala S.A. in Belgium (2012), Cemelog Ltd. in Hungary (2013), i-parcel LLC in the U.S. (2014) and Polar Speed Distribution Limited in the U.K. (2014), as well as other smaller acquisitions.
Other investing activities are impacted by changes in our restricted cash balances, capital contributions into certain investment partnerships, and various other items. In 2014 and 2013, we increased the restricted cash balance associated with our self-insurance requirements by $17 and $137 million, respectively (there were no changes in restricted cash in 2012, other than earned interest).
Financing Activities
Our primary sources (uses) of cash for financing activities were as follows (amounts in millions, except per share data):
|
2014
|
2013
|
2012
|
|||||||||
|
Net cash used in financing activities
|
$
|
(5,161
|
)
|
$
|
(7,807
|
)
|
$
|
(1,817
|
)
|
||
|
Share Repurchases:
|
|||||||||||
|
Cash expended for shares repurchased
|
$
|
(2,695
|
)
|
$
|
(3,838
|
)
|
$
|
(1,621
|
)
|
||
|
Number of shares repurchased
|
(26.4
|
)
|
(43.2
|
)
|
(21.8
|
)
|
|||||
|
Shares outstanding at year-end
|
905
|
|
923
|
|
953
|
|
|||||
|
Percent reduction in shares outstanding
|
(2.0
|
)%
|
(3.1
|
)%
|
(1.0
|
)%
|
|||||
|
Dividends:
|
|||||||||||
|
Dividends declared per share
|
$
|
2.68
|
|
$
|
2.48
|
|
$
|
2.28
|
|
||
|
Cash expended for dividend payments
|
$
|
(2,366
|
)
|
$
|
(2,260
|
)
|
$
|
(2,130
|
)
|
||
|
Borrowings:
|
|||||||||||
|
Net borrowings (repayments) of debt principal
|
$
|
(169
|
)
|
$
|
(1,775
|
)
|
$
|
1,729
|
|
||
|
Other Financing Activities:
|
|||||||||||
|
Cash received for common stock issuances
|
$
|
274
|
|
$
|
491
|
|
$
|
301
|
|
||
|
Other financing activities
|
$
|
(205
|
)
|
$
|
(425
|
)
|
$
|
(96
|
)
|
||
|
Capitalization:
|
|||||||||||
|
Total debt outstanding at year-end
|
$
|
10,787
|
|
$
|
10,872
|
|
$
|
12,870
|
|
||
|
Total shareowners’ equity at year-end
|
2,158
|
|
6,488
|
|
4,733
|
|
|||||
|
Total capitalization
|
$
|
12,945
|
|
$
|
17,360
|
|
$
|
17,603
|
|
||
|
Debt to Total Capitalization %
|
83.3
|
%
|
62.6
|
%
|
73.1
|
%
|
|||||
On
February 14, 2013
, the Board of Directors approved a share repurchase authorization of $
10.0
billion, which replaced an authorization previously announced in 2012. The share repurchase authorization has no expiration date. As of
December 31, 2014
, we had $
4.152
billion of this share repurchase authorization remaining. Share repurchases may take the form of accelerated share repurchases, open market purchases, or other such methods as we deem appropriate. The timing of our share repurchases will depend upon market conditions. Unless terminated earlier by the resolution of our Board, the program will expire when we have purchased all shares authorized for repurchase under the program. We anticipate repurchasing approximately $
2.7
billion of shares in
2015
.
The declaration of dividends is subject to the discretion of the Board of Directors and will depend on various factors, including our net income, financial condition, cash requirements, future prospects, and other relevant factors. We expect to continue the practice of paying regular cash dividends. In February 2015, we increased our quarterly dividend payment from $0.67 to $0.73 per share, a 9% increase.
48
UNITED PARCEL SERVICE, INC. AND SUBSIDIARIES
MANAGEMENT'S DISCUSSION AND ANALYSIS OF FINANCIAL CONDITION AND
RESULTS OF OPERATIONS
Issuances of debt in 2014 and 2013 consisted primarily of longer-maturity commercial paper. Issuances of debt in 2012 consisted primarily of senior fixed rate note offerings totaling $1.75 billion.
Repayments of debt in 2014 and 2013 consisted primarily of the maturity of our $1.0 and $1.75 billion senior fixed rate notes that matured in April 2014 and January 2013, respectively. The remaining repayments of debt during the 2012 through 2014 time period included paydowns of commercial paper and scheduled principal payments on our capitalized lease obligations. We consider the overall fixed and floating interest rate mix of our portfolio and the related overall cost of borrowing when planning for future issuances and non-scheduled repayments of debt.
We had $772 million of commercial paper outstanding at December 31, 2014, and no commercial paper outstanding at December 31, 2013 and 2012. The amount of commercial paper outstanding fluctuates throughout each year based on daily liquidity needs. The average commercial paper balance was $1.356 billion and the average interest rate paid was 0.10% in 2014 ($1.013 billion and 0.07% in 2013, and $962 million and 0.07% in 2012, respectively).
The variation in cash received from common stock issuances to employees was primarily due to level of stock option exercises in the 2012 through 2014 period.
The cash outflows in other financing activities were impacted by several factors. Cash inflows (outflows) from the premium payments and settlements of capped call options for the purchase of UPS class B shares were $(47), $(93) and $206 million for 2014, 2013 and 2012, respectively. Cash outflows related to the repurchase of shares to satisfy tax withholding obligations on vested employee stock awards were $224, $253 and $234 million for 2014, 2013 and 2012, respectively. In 2013, we paid $70 million to purchase the noncontrolling interest in a joint venture that operates in the Middle East, Turkey and portions of the Central Asia region. In 2012, we settled several interest rate derivatives that were designated as hedges of the senior fixed-rate debt offerings that year, which resulted in a cash outflow of $70 million.
Sources of Credit
See note 7 to the audited consolidated financial statements for a discussion of our available credit and debt covenants.
Guarantees and Other Off-Balance Sheet Arrangements
We do not have guarantees or other off-balance sheet financing arrangements, including variable interest entities, which we believe could have a material impact on financial condition or liquidity.
Contractual Commitments
We have contractual obligations and commitments in the form of capital leases, operating leases, debt obligations, purchase commitments, and certain other liabilities. We intend to satisfy these obligations through the use of cash flow from operations. The following table summarizes the expected cash outflow to satisfy our contractual obligations and commitments as of
December 31, 2014
(in millions):
|
Commitment Type
|
2015
|
2016
|
2017
|
2018
|
2019
|
After 2019
|
Total
|
||||||||||||||||||||
|
Capital Leases
|
$
|
75
|
|
$
|
74
|
|
$
|
67
|
|
$
|
62
|
|
$
|
59
|
|
$
|
435
|
|
$
|
772
|
|
||||||
|
Operating Leases
|
323
|
|
257
|
|
210
|
|
150
|
|
90
|
|
274
|
|
1,304
|
|
|||||||||||||
|
Debt Principal
|
876
|
|
8
|
|
377
|
|
752
|
|
1,000
|
|
7,068
|
|
10,081
|
|
|||||||||||||
|
Debt Interest
|
295
|
|
293
|
|
293
|
|
282
|
|
260
|
|
4,259
|
|
5,682
|
|
|||||||||||||
|
Purchase Commitments
|
269
|
|
195
|
|
71
|
|
19
|
|
8
|
|
26
|
|
588
|
|
|||||||||||||
|
Pension Fundings
|
1,030
|
|
1,161
|
|
344
|
|
347
|
|
400
|
|
488
|
|
3,770
|
|
|||||||||||||
|
Other Liabilities
|
43
|
|
23
|
|
10
|
|
5
|
|
—
|
|
—
|
|
81
|
|
|||||||||||||
|
Total
|
$
|
2,911
|
|
$
|
2,011
|
|
$
|
1,372
|
|
$
|
1,617
|
|
$
|
1,817
|
|
$
|
12,550
|
|
$
|
22,278
|
|
||||||
49
UNITED PARCEL SERVICE, INC. AND SUBSIDIARIES
MANAGEMENT'S DISCUSSION AND ANALYSIS OF FINANCIAL CONDITION AND
RESULTS OF OPERATIONS
Our capital lease obligations relate primarily to leases on aircraft. Capital leases, operating leases, and purchase commitments, as well as our debt principal obligations, are discussed further in note 7 to our consolidated financial statements. The amount of interest on our debt was calculated as the contractual interest payments due on our fixed-rate debt, in addition to interest on variable rate debt that was calculated based on interest rates as of
December 31, 2014
. The calculations of debt interest take into account the effect of interest rate swap agreements. For debt denominated in a foreign currency, the U.S. Dollar equivalent principal amount of the debt at the end of the year was used as the basis to calculate future interest payments.
Purchase commitments represent contractual agreements to purchase goods or services that are legally binding, the largest of which are orders for technology equipment and vehicles. As of
December 31, 2014
, we have no open aircraft orders.
Pension fundings represent the anticipated required cash contributions that will be made to our qualified U.S. pension plans (these plans are discussed further in note 4 to the consolidated financial statements). The pension funding requirements were estimated under the provisions of the Pension Protection Act of 2006 and the Employee Retirement Income Security Act of 1974, using discount rates, asset returns and other assumptions appropriate for these plans. In July 2012, federal legislation was signed into law that allows pension plan sponsors to use higher interest rate assumptions (based on a 25-year rate history) in valuing plan liabilities and determining funding obligations. The amount of any minimum funding requirement, as applicable, for these plans could change significantly in future periods, depending on many factors, including future plan asset returns and discount rates. A sustained significant decline in the world equity markets, and the resulting impact on our pension assets and investment returns, could result in our domestic pension plans being subject to significantly higher minimum funding requirements. To the extent that the funded status of these plans in future years differs from our current projections, the actual contributions made in future years could materially differ from the amounts shown in the table above.
As discussed in note 5 to our consolidated financial statements, we are not currently subject to any minimum contributions or surcharges with respect to the multiemployer pension and health and welfare plans in which we participate. Contribution rates to these multiemployer pension and health and welfare plans are established through the collective bargaining process. As we are not subject to any minimum contribution levels, we have not included any amounts in the contractual commitments table with respect to these multiemployer plans.
The contractual payments due for “other liabilities” primarily include commitment payments related to our investment in certain partnerships. The table above does not include approximately $
217 million
of liabilities for uncertain tax positions because we are uncertain if or when such amounts will ultimately be settled in cash. In addition, we also have recognized assets associated with uncertain tax positions in excess of the related liabilities such that we do not believe a net contractual obligation exists to the taxing authorities. Uncertain tax positions are further discussed in note 12 to the consolidated financial statements.
As of
December 31, 2014
, we had outstanding letters of credit totaling approximately $
1.064
billion issued in connection with our self-insurance reserves and other routine business requirements. We also issue surety bonds as an alternative to letters of credit in certain instances, and as of
December 31, 2014
, we had $
640
million of surety bonds written. As of
December 31, 2014
, we had unfunded loan commitments totaling $
136
million associated with our financial business.
We believe that funds from operations and borrowing programs will provide adequate sources of liquidity and capital resources to meet our expected long-term needs for the operation of our business, including anticipated capital expenditures, for the foreseeable future.
Contingencies
See note 8 to the audited consolidated financial statements for a discussion of judicial proceedings and other matters arising from the conduct of our business activities, and note 12 for a discussion of income tax related matters.
50
UNITED PARCEL SERVICE, INC. AND SUBSIDIARIES
MANAGEMENT'S DISCUSSION AND ANALYSIS OF FINANCIAL CONDITION AND
RESULTS OF OPERATIONS
Collective Bargaining Agreements
Status of Collective Bargaining Agreements
As of December 31, 2014, we had approximately 270,000 employees employed under a national master agreement and various supplemental agreements with local unions affiliated with the International Brotherhood of Teamsters (“Teamsters”). During 2014, the Teamsters ratified a new national master agreement (“NMA”) with UPS that will expire on July 31, 2018. The economic provisions in the NMA included wage rate increases, as well as increased contribution rates for healthcare and pension benefits. Most of these economic provisions were retroactive to August 1, 2013, which was the effective date of the NMA. In the second quarter of 2014, we remitted $278 million for these retroactive economic benefits; this payment had an immaterial impact on net income, as these retroactive economic benefits had been accrued since the July 31, 2013 expiration of the prior agreement.
In addition to the retroactive economic provisions of the NMA, there were certain changes to the delivery of healthcare benefits that were effective at various dates. These changes impact approximately 36,000 full-time and 73,000 part-time active employees covered by the NMA and the UPS Freight collective bargaining agreement (collectively referred to as the “NMA Group”), as well as approximately 16,000 employees covered by other collective bargaining agreements (the “Non-NMA Group”). These provisions are discussed further below in the "Changes to the Delivery of Active and Postretirement Healthcare Benefits" section.
We have approximately 2,600 pilots who are employed under a collective bargaining agreement with the Independent Pilots Association ("IPA"), which became amendable at the end of 2011. In February 2014, UPS and the IPA requested and received mediation by the National Mediation Board for the ongoing contract negotiations.
Our airline mechanics are covered by a collective bargaining agreement with Teamsters Local 2727, which became amendable November 1, 2013. In addition, approximately 3,100 of our auto and maintenance mechanics who are not employed under agreements with the Teamsters are employed under collective bargaining agreements with the International Association of Machinists and Aerospace Workers (“IAM”). In 2014, the IAM ratified new collective bargaining agreements that will expire on July 31, 2019.
Multiemployer Benefit Plans
We contribute to a number of multiemployer defined benefit and health and welfare plans under terms of collective bargaining agreements that cover our union represented employees. Our current collective bargaining agreements set forth the annual contribution increases allotted to the plans that we participate in, and we are in compliance with these contribution rates. These limitations will remain in effect throughout the terms of the existing collective bargaining agreements.
Changes to the Delivery of Active and Postretirement Healthcare Benefits
Prior to ratification, the NMA Group and Non-NMA Group employees received their healthcare benefits through UPS-sponsored active and postretirement health and welfare benefit plans. Effective June 1, 2014, we ceased providing healthcare benefits to active NMA Group employees through these UPS-sponsored benefit plans, and the responsibility for providing healthcare benefits for active employees was assumed by three separate multiemployer healthcare funds (the “Funds”). The responsibility for providing healthcare benefits for the active Non-NMA Group employees was also assumed by the Funds on various dates up to January 1, 2015, depending on the ratification date of the applicable collective bargaining agreement. We will make contributions to the Funds based on negotiated fixed hourly or monthly contribution rates for the duration of the NMA and other applicable collective bargaining agreements.
Additionally, the Funds assumed the obligation to provide postretirement healthcare benefits to the employees in the NMA Group who retire on or after January 1, 2014. The postretirement healthcare benefit obligation for the employees in the Non-NMA Group was assumed by the Funds for employees retiring on or after January 1, 2014 or January 1, 2015, depending on the applicable collective bargaining agreement. In exchange for the assumption of the obligation to provide postretirement healthcare benefits to the NMA Group and Non-NMA Group, we transferred cash totaling $2.271 billion to the Funds in the second quarter of 2014. UPS-sponsored health and welfare benefit plans retained responsibility for providing postretirement healthcare coverage for employees in the NMA Group who retired from UPS prior to January 1, 2014, and for employees in the Non-NMA Group who retire from UPS prior to the January 1, 2014 or January 1, 2015 effective date in the applicable collective bargaining agreement.
51
UNITED PARCEL SERVICE, INC. AND SUBSIDIARIES
MANAGEMENT'S DISCUSSION AND ANALYSIS OF FINANCIAL CONDITION AND
RESULTS OF OPERATIONS
Accounting Impact of Health and Welfare Plan Changes
Income Statement Impact:
We recorded a pre-tax charge of $1.066 billion ($665 million after-tax) in the second quarter of 2014 for the health and welfare plan changes described above. The components of this charge, which was included in "compensation and benefits" expense in the statement of consolidated income, are as follows:
|
•
|
Partial Plan Curtailment
: We recorded a $112 million pre-tax curtailment loss due to the elimination of future service benefit accruals. This curtailment loss represents the accelerated recognition of unamortized prior service costs.
|
|
•
|
Remeasurement of Postretirement Obligation
: We recorded a $746 million pre-tax loss due to the remeasurement of the postretirement benefit obligations of the affected UPS-sponsored health and welfare benefit plans.
|
|
•
|
Settlement
: We recorded a $208 million pre-tax settlement loss, which represents the recognition of unamortized actuarial losses associated with the postretirement obligation for the NMA Group.
|
We recorded an additional pre-tax charge of $36 million ($22 million after-tax) in the fourth quarter of 2014 upon ratification of the collective bargaining agreements covering the Non-NMA Group, related to the remeasurement and settlement of the postretirement benefit obligation associated with those employees.
Balance Sheet and Cash Flow Impact:
During 2014, as part of the health and welfare plan changes described previously, we transferred cash totaling $2.271 billion to the Funds, which was accounted for as a settlement of our postretirement benefit obligations (see note 4 to the audited consolidated financial statements). We received approximately $854 million of cash tax benefits (through reduced U.S. Federal and state quarterly income tax payments) in 2014.
For NMA Group employees who retired prior to January 1, 2014 and remained with the UPS-sponsored health and welfare plans, the changes to the contributions, benefits and cost sharing provisions in these plans resulted in an increase in the postretirement benefit obligation, and a corresponding decrease in pre-tax accumulated other comprehensive income, of $13 million upon ratification.
Anticipated Benefits of Health and Welfare Plan Changes
We believe we have obtained several benefits as a result of these health and welfare plan changes, including:
|
•
|
Liability Transfer
: We have removed a significant liability from our balance sheet, which helps to reduce uncertainty around potential changes to healthcare laws and regulations, control the volatility of healthcare inflation, and removes the risk associated with providing future retiree healthcare.
|
|
•
|
Negotiated Healthcare Costs:
Using the model of a defined contribution plan allows us to negotiate our contributions towards healthcare costs going forward, and provides more certainty of costs over the contract period.
|
|
•
|
Minimize Impact of Healthcare Law Changes:
Multiemployer plans have several advantages under the Patient Protection and Affordable Care Act of 2010, including reduced transitional fees and the ability to limit the impact of future excise taxes.
|
|
•
|
Mitigate Demographic Issues:
This helps reduce the potential impact of increased early retirements by employees.
|
Agreement with the New England Teamsters and Trucking Industry Pension Fund
In the third quarter of 2012, we reached an agreement with the New England Pension Fund, a multiemployer pension plan in which UPS is a participant, to restructure the pension liabilities for approximately 10,200 UPS employees represented by the Teamsters. The agreement reflects a decision by the New England Pension Fund's trustees to restructure the fund through plan amendments to utilize a "two pool approach", which effectively subdivides the plan assets and liabilities between two groups of beneficiaries. As part of this agreement, UPS agreed to withdraw from the original pool of the New England Pension Fund of which it had historically been a participant, and reenter the New England Pension Fund's newly-established pool as a new employer.
52
UNITED PARCEL SERVICE, INC. AND SUBSIDIARIES
MANAGEMENT'S DISCUSSION AND ANALYSIS OF FINANCIAL CONDITION AND
RESULTS OF OPERATIONS
Upon ratification of the agreement by the Teamsters in September 2012, we withdrew from the original pool of the New England Pension Fund and incurred an undiscounted withdrawal liability of $2.162 billion to be paid in equal monthly installments over 50 years. The undiscounted withdrawal liability was calculated by independent actuaries employed by the New England Pension Fund, in accordance with the governing plan documents and the applicable requirements of the Employee Retirement Income Security Act of 1974. In the third quarter of 2012, we recorded a charge to expense to establish an $896 million withdrawal liability on our balance sheet, which represents the present value of the $2.162 billion future payment obligation discounted at a 4.25% interest rate. This discount rate represents the estimated credit-adjusted market rate of interest at which we could obtain financing of a similar maturity and seniority.
As part of this agreement, we believe that UPS, the New England Pension Fund and our affected employees have obtained several benefits, including:
|
•
|
The old pool of the New England Pension Fund has historically had, and would likely continue to have, funding challenges; this represented a risk to UPS of having to face higher future contribution requirements, as well as a risk to the security of the pension benefits of those UPS employees who participate in the New England Pension Fund. The 50 year fixed payment obligation should improve the funded status of the New England Pension Fund over time, while reducing the risk to UPS of significantly higher future contribution requirements.
|
|
•
|
The newly-established pool provides better protections for new participating employers. This pool uses a direct-attribution methodology for calculating any potential future withdrawal liabilities, which reduces our exposure to the liabilities of other participating employers. Additionally, this pool contains provisions designed to maintain a fully-funded status, including automatic benefit reductions and/or increased employee contributions in the event of an underfunded situation occurring.
|
|
•
|
As part of the agreement, we were able to freeze our hourly pension contribution rate to the newly-established pool of the New England Pension Fund for a period of 10 years, which provides cash flow visibility for both UPS and the New England Pension Fund.
|
The $896 million charge to expense recorded in the third quarter of 2012 is included in "compensation and benefits expense" in the statement of consolidated income, while the corresponding withdrawal liability is included in "other non-current liabilities" on the consolidated balance sheet. We will impute interest on the withdrawal liability using the 4.25% discount rate, while the monthly payments made to the New England Pension Fund will reduce the remaining balance of the withdrawal liability.
Our status in the newly-established pool of the New England Pension Fund is accounted for as the participation in a new multiemployer pension plan, and therefore we will recognize expense based on the contractually-required contribution for each period, and we will recognize a liability for any contributions due and unpaid at the end of a reporting period.
Rate Adjustments
In October 2014, we announced an average 4.9% net increase in base and accessorial rates that took effect December 29, 2014, and impacted the following services:
|
•
|
UPS Ground services;
|
|
•
|
UPS Next Day Air, UPS 2
nd
Day Air, UPS 3 Day Select, and international air shipments originating in the United States (including Worldwide Express, Worldwide Express Plus, UPS Worldwide Expedited and UPS International Standard Service);
|
|
•
|
UPS Next Day Air Freight, UPS 2
nd
Day Air Freight, and UPS 3 Day Freight shipments within and between the U.S., Canada, and Puerto Rico; and
|
|
•
|
UPS Express Freight shipments originating in the U.S.
|
Additionally, the pricing change involving the application of dimensional weight pricing to all UPS Ground services took effect on December 29, 2014 as well.
53
UNITED PARCEL SERVICE, INC. AND SUBSIDIARIES
MANAGEMENT'S DISCUSSION AND ANALYSIS OF FINANCIAL CONDITION AND
RESULTS OF OPERATIONS
These rate changes are customary and occur on an annual basis. Rate changes for shipments originating outside the U.S. are made throughout the year and vary by geographic market.
New Accounting Pronouncements
Recently Adopted Accounting Standards
See note 1 to the audited consolidated financial statements for a discussion of recently adopted accounting standards.
Accounting Standards Issued But Not Yet Effective
See note 1 to the audited consolidated financial statements for a discussion of accounting standards issued, but not yet effective.
Critical Accounting Policies and Estimates
Our discussion and analysis of our financial condition and results of operations are based on our consolidated financial statements, which are prepared in accordance with accounting principles generally accepted in the United States of America. As indicated in note 1 to our consolidated financial statements, the amounts of assets, liabilities, revenue, and expenses reported in our financial statements are affected by estimates and judgments that are necessary to comply with generally accepted accounting principles. We base our estimates on prior experience and other assumptions that we consider reasonable to our circumstances. Actual results could differ from our estimates, which would affect the related amounts reported in our consolidated financial statements. While estimates and judgments are applied in arriving at many reported amounts, we believe that the following matters may involve a higher degree of judgment and complexity.
Contingencies
As discussed in note 8 to our consolidated financial statements, we are involved in various legal proceedings and contingencies. The events that may impact our contingent liabilities are often unique and generally are not predictable. At the time a contingency is identified, we consider all relevant facts as part of our evaluation. We record a liability for a loss when the loss is probable of occurring and reasonably estimable. Events may arise that were not anticipated and the outcome of a contingency may result in a loss to us that differs from our previously estimated liability. These factors could result in a material difference between estimated and actual operating results. Contingent losses that are probable and estimable, excluding those related to income taxes and self-insurance which are discussed further below, were not material to our financial position or results of operations as of, and for the year ended,
December 31, 2014
. In addition, we have certain contingent liabilities that have not been recognized as of
December 31, 2014
, because a loss is not reasonably estimable.
Goodwill and Intangible Impairment
We perform impairment testing of goodwill for each of our reporting units on an annual basis. Our reporting units are comprised of the Europe, Asia, Americas and ISMEA (Indian Subcontinent, Middle East and Africa) reporting units in the International Package reporting segment, and the Forwarding, Logistics, UPS Freight, The UPS Store and UPS Capital reporting units in the Supply Chain & Freight reporting segment. Our annual goodwill impairment testing date is October 1
st
for each reporting unit. In assessing goodwill for impairment, we initially evaluate qualitative factors to determine if it is more likely than not that the fair value of a reporting unit is less than its carrying amount. If the qualitative assessment is not conclusive and it is necessary to calculate the fair value of a reporting unit, then we utilize a two-step process to test goodwill for impairment. First, a comparison of the fair value of the applicable reporting unit with the aggregate carrying value, including goodwill, is performed. If the carrying amount of a reporting unit exceeds the reporting unit’s fair value, we perform the second step of the goodwill impairment test to determine the amount of impairment loss. The second step includes comparing the implied fair value of the affected reporting unit’s goodwill with the carrying value of that goodwill.
54
UNITED PARCEL SERVICE, INC. AND SUBSIDIARIES
MANAGEMENT'S DISCUSSION AND ANALYSIS OF FINANCIAL CONDITION AND
RESULTS OF OPERATIONS
We primarily determine the fair value of our reporting units using a discounted cash flow model (“DCF model”), and supplement this with observable valuation multiples for comparable companies, as applicable. The completion of the DCF model requires that we make a number of significant assumptions to produce an estimate of future cash flows. These assumptions include projections of future revenue, costs and working capital changes. In addition, we make assumptions about the estimated cost of capital and other relevant variables, as required, in estimating the fair value of our reporting units. The projections that we use in our DCF model are updated annually and will change over time based on the historical performance and changing business conditions for each of our reporting units. The determination of whether goodwill is impaired involves a significant level of judgment in these assumptions, and changes in our business strategy, government regulations, or economic or market conditions could significantly impact these judgments. We will continue to monitor market conditions and other factors to determine if interim impairment tests are necessary in future periods. If impairment indicators are present in future periods, the resulting impairment charges could have a material impact on our results of operations.
None of the reporting units incurred any goodwill impairment charges in
2014
,
2013
or
2012
. Changes in our forecasts could cause carrying values of our reporting units to exceed their fair values in future periods, potentially resulting in a goodwill impairment charge. A 10% decrease in the estimated fair value of our reporting units as of our most recent goodwill testing date (October 1,
2014
) would not result in a goodwill impairment charge.
Licenses with a carrying value of $5 million as of
December 31, 2014
are deemed to be indefinite-lived intangibles, and therefore are not amortized. Impairment tests for indefinite-lived intangibles are performed on an annual basis. All of our remaining recorded intangible assets are deemed to be finite-lived intangibles, and are thus amortized over their estimated useful lives. Impairment tests for these intangible assets are only performed when a triggering event occurs that indicates that the carrying value of the intangible may not be recoverable based on the undiscounted future cash flows of the intangible. If the carrying amount of the intangible is determined not to be recoverable, a write-down to fair value is recorded. Fair values are determined based on a DCF model. We incurred impairment charges on intangible assets of $13 million during 2013, while there were no impairments of any indefinite-lived or finite-lived intangible assets in 2014 or 2012.
Self-Insurance Accruals
We self-insure costs associated with workers’ compensation claims, automotive liability, health and welfare and general business liabilities, up to certain limits. Insurance reserves are established for estimates of the loss that we will ultimately incur on reported claims, as well as estimates of claims that have been incurred but not yet reported. Recorded balances are based on reserve levels, which incorporate historical loss experience and judgments about the present and expected levels of cost per claim. Trends in actual experience are a significant factor in the determination of such reserves. We believe our estimated reserves for such claims are adequate, but actual experience in claim frequency and/or severity could materially differ from our estimates and affect our results of operations.
Workers’ compensation, automobile liability and general liability insurance claims may take several years to completely settle. Consequently, actuarial estimates are required to project the ultimate cost that will be incurred to fully resolve the claims. A number of factors can affect the actual cost of a claim, including the length of time the claim remains open, trends in health care costs and the results of related litigation. Furthermore, claims may emerge in future years for events that occurred in a prior year at a rate that differs from previous actuarial projections. Changes in state legislation with respect to workers' compensation can affect the adequacy of our self-insurance accruals. All of these factors can result in revisions to prior actuarial projections and produce a material difference between estimated and actual operating results.
We sponsor a number of health and welfare insurance plans for our employees. These liabilities and related expenses are based on estimates of the number of employees and eligible dependents covered under the plans, anticipated medical usage by participants and overall trends in medical costs and inflation. Actual results may differ from these estimates and, therefore, produce a material difference between estimated and actual operating results.
55
UNITED PARCEL SERVICE, INC. AND SUBSIDIARIES
MANAGEMENT'S DISCUSSION AND ANALYSIS OF FINANCIAL CONDITION AND
RESULTS OF OPERATIONS
Pension and Postretirement Medical Benefits
Our pension and other postretirement benefit costs are calculated using various actuarial assumptions and methodologies. These assumptions include discount rates, health care cost trend rates, inflation, compensation increase rates, expected returns on plan assets, mortality rates and other factors. The assumptions utilized in recording the obligations under our plans represent our best estimates, and we believe that they are reasonable, based on information as to historical experience and performance as well as other factors that might cause future expectations to differ from past trends.
Differences in actual experience or changes in assumptions may affect our pension and other postretirement obligations and future expense. The primary factors contributing to actuarial gains and losses each year are (1) changes in the discount rate used to value pension and postretirement benefit obligations as of the measurement date, (2) differences between the expected and the actual return on plan assets, (3) changes in demographic assumptions including mortality and (4) participant experience different from demographic assumptions.
We recognize changes in the fair value of plan assets and net actuarial gains or losses in excess of a corridor (defined as 10% of the greater of the fair value of plan assets or the plans' projected benefit obligations) in pension expense annually at December 31st each year. The remaining components of pension expense (herein referred to as "ongoing net periodic benefit cost"), primarily service and interest costs and the expected return on plan assets, are recorded on a quarterly basis.
The following sensitivity analysis shows the impact of a 25 basis point change in the assumed discount rate, return on assets, and healthcare cost trend rate for our pension and postretirement benefit plans, and the resulting increase (decrease) on our obligations and expense as of, and for the year ended,
December 31, 2014
(in millions).
|
Pension Plans
|
25 Basis Point
Increase
|
25 Basis Point
Decrease
|
|||||
|
Discount Rate:
|
|||||||
|
Effect on ongoing net periodic benefit cost
|
$
|
(48
|
)
|
$
|
50
|
|
|
|
Effect on net periodic benefit cost for amounts recognized outside the 10% corridor
|
(888
|
)
|
1,543
|
|
|||
|
Effect on projected benefit obligation
|
(1,628
|
)
|
1,736
|
|
|||
|
Return on Assets:
|
|||||||
|
Effect on ongoing net periodic benefit cost
(1)
|
(67
|
)
|
67
|
|
|||
|
Effect on net periodic benefit cost for amounts recognized outside the 10% corridor
(2)
|
(66
|
)
|
66
|
|
|||
|
Postretirement Medical Plans
|
|||||||
|
Discount Rate:
|
|||||||
|
Effect on ongoing net periodic benefit cost
|
1
|
|
(1
|
)
|
|||
|
Effect on net periodic benefit cost for amounts recognized outside the 10% corridor
|
(9
|
)
|
10
|
|
|||
|
Effect on accumulated postretirement benefit obligation
|
(66
|
)
|
68
|
|
|||
|
Health Care Cost Trend Rate:
|
|||||||
|
Effect on ongoing net periodic benefit cost
|
1
|
|
(1
|
)
|
|||
|
Effect on net periodic benefit cost for amounts recognized outside the 10% corridor
|
10
|
|
(10
|
)
|
|||
|
Effect on accumulated postretirement benefit obligation
|
23
|
|
(23
|
)
|
|||
|
(1)
|
Amount calculated based on 25 basis point increase / decrease in the expected return on assets.
|
|
(2)
|
Amount calculated based on 25 basis point increase / decrease in the actual return on assets.
|
Expense is expected to increase in 2015 compared with 2014, due primarily to the decrease in the weighted-average discount rate used to determine ongoing net periodic benefit cost from 5.24% for 2014 to 4.36% for 2015 (These discount rates represent the combined weighted-average discount rates for our U.S. and international pension plans, as well as our U.S. postretirement medical plans).
56
UNITED PARCEL SERVICE, INC. AND SUBSIDIARIES
MANAGEMENT'S DISCUSSION AND ANALYSIS OF FINANCIAL CONDITION AND
RESULTS OF OPERATIONS
Depreciation, Residual Value and Impairment of Fixed Assets
As of
December 31, 2014
, we had $
18.281 billion
of net fixed assets, the most significant category of which is aircraft. In accounting for fixed assets, we make estimates about the expected useful lives and the expected residual values of the assets, and the potential for impairment based on the fair values of the assets and the cash flows generated by these assets.
In estimating the lives and expected residual values of aircraft, we have relied upon actual experience with the same or similar aircraft types. Subsequent revisions to these estimates could be caused by changes to our maintenance program, changes in the utilization of the aircraft, governmental regulations on aging aircraft and changing market prices of new and used aircraft of the same or similar types. We periodically evaluate these estimates and assumptions, and adjust the estimates and assumptions as necessary. Adjustments to the expected lives and residual values are accounted for on a prospective basis through depreciation expense.
We review long-lived assets for impairment when circumstances indicate the carrying amount of an asset may not be recoverable based on the undiscounted future cash flows of the asset. If the carrying amount of the asset is determined not to be recoverable, a write-down to fair value is recorded. Fair values are determined based on quoted market values, discounted cash flows or external appraisals, as applicable. We review long-lived assets for impairment at the individual asset or the asset group level for which the lowest level of independent cash flows can be identified. The circumstances that would indicate potential impairment may include, but are not limited to, a significant change in the extent to which an asset is utilized and operating or cash flow losses associated with the use of the asset. In estimating cash flows, we project future volume levels for our different air express products in all geographic regions in which we do business. Adverse changes in these volume forecasts, or a shortfall of our actual volume compared with our projections, could result in our current aircraft capacity exceeding current or projected demand. This situation would lead to an excess of a particular aircraft type, resulting in an aircraft impairment charge or a reduction of the expected life of an aircraft type (thus resulting in increased depreciation expense).
There were no impairment charges on our property, plant and equipment during
2014
,
2013
and
2012
.
Fair Value Measurements
In the normal course of business, we hold and issue financial instruments that contain elements of market risk, including derivatives, marketable securities, finance receivables, other investments and debt. Certain of these financial instruments are required to be recorded at fair value, principally derivatives, marketable securities, pension assets and certain other investments. Fair values are based on listed market prices, when such prices are available. To the extent that listed market prices are not available, fair value is determined based on other relevant factors, including dealer price quotations. Certain financial instruments, including over-the-counter derivative instruments, are valued using pricing models that consider, among other factors, contractual and market prices, correlations, time value, credit spreads and yield curve volatility factors. Changes in the fixed income, equity, foreign exchange and commodity markets will impact our estimates of fair value in the future, potentially affecting our results of operations. A quantitative sensitivity analysis of our exposure to changes in commodity prices, foreign currency exchange rates, interest rates and equity prices is presented in the “Quantitative and Qualitative Disclosures about Market Risk” section of this report.
Income Taxes
We make certain estimates and judgments in determining income tax expense for financial statement purposes. These estimates and judgments occur in the calculation of income by legal entity and jurisdiction, tax credits, benefits, and deductions, and in the calculation of certain tax assets and liabilities, which arise from differences in the timing of recognition of revenue and expense for tax and financial statement purposes, as well as the interest and penalties related to these uncertain tax positions. Significant changes to these estimates may result in an increase or decrease to our tax provision in a subsequent period.
We assess the likelihood that we will be able to recover our deferred tax assets. If recovery is not likely, we must increase our provision for taxes by recording a valuation allowance against the deferred tax assets that we estimate will not ultimately be recoverable. We believe that we will ultimately recover a substantial majority of the deferred tax assets recorded on our consolidated balance sheets. However, should there be a change in our ability to recover our deferred tax assets, our tax provision would increase in the period in which we determined that the recovery was not likely.
57
UNITED PARCEL SERVICE, INC. AND SUBSIDIARIES
MANAGEMENT'S DISCUSSION AND ANALYSIS OF FINANCIAL CONDITION AND
RESULTS OF OPERATIONS
The calculation of our tax liabilities involves dealing with uncertainties in the application of complex tax regulations. We recognize liabilities for uncertain tax positions based on a two-step process. The first step is to evaluate the tax position for recognition by determining if the weight of available evidence indicates that it is more likely than not that the position will be sustained on audit, including resolution of related appeals or litigation processes, if any. Once it is determined that the position meets the recognition threshold, the second step requires us to estimate and measure the tax benefit as the largest amount that is more likely than not to be realized upon ultimate settlement. It is inherently difficult and subjective to estimate such amounts, as we have to determine the probability of various possible outcomes. We reevaluate these uncertain tax positions on a quarterly basis. This evaluation is based on factors including, but not limited to, changes in facts or circumstances, changes in tax law, effectively settled issues under audit, and new audit activity. Such a change in recognition or measurement could result in the recognition of a tax benefit or an additional charge to the tax provision.
Allowance for Doubtful Accounts
Losses on accounts receivable are recognized when they are incurred, which requires us to make our best estimate of the probable losses inherent in our customer receivables at each balance sheet date. These estimates require consideration of historical loss experience adjusted for current conditions, trends in customer payment frequency, and judgments about the probable effects of relevant observable data, including present economic conditions and the financial health of specific customers and market sectors. Our risk management process includes standards and policies for reviewing major account exposures and concentrations of risk. Deterioration in macroeconomic variables could result in our ultimate loss exposures on our accounts receivable being significantly higher than what we have currently estimated and reserved for in our allowance for doubtful accounts. Our total allowance for doubtful accounts as of
December 31, 2014
and
2013
was $
121
and $
122
million, respectively. Our total provision for doubtful accounts charged to expense during the years ended
December 31, 2014
,
2013
and
2012
was $
143
, $
129
and $
155
million, respectively.
|
Item 7A.
|
Quantitative and Qualitative Disclosures about Market Risk
|
We are exposed to market risk from changes in certain commodity prices, foreign currency exchange rates, interest rates and equity prices. All of these market risks arise in the normal course of business, as we do not engage in speculative trading activities. In order to manage the risk arising from these exposures, we utilize a variety of commodity, foreign exchange and interest rate forward contracts, options and swaps. A discussion of our accounting policies for derivative instruments and further disclosures are provided in note 14 to the consolidated financial statements.
Commodity Price Risk
We are exposed to changes in the prices of refined fuels, principally jet-A, diesel and unleaded gasoline, as well as changes in the price of natural gas. Currently, the fuel surcharges that we apply to our domestic and international package and LTL services are the primary means of reducing the risk of adverse fuel price changes. Additionally, we periodically use a combination of option, forward and futures contracts to provide partial protection from changing fuel and energy prices. As of
December 31, 2014
and
2013
, however, we had no commodity contracts outstanding.
Foreign Currency Exchange Risk
We have foreign currency risks related to our revenue, operating expenses and financing transactions in currencies other than the local currencies in which we operate. We are exposed to currency risk from the potential changes in functional currency values of our foreign currency-denominated assets, liabilities and cash flows. Our most significant foreign currency exposures relate to the Euro, British Pound Sterling, Canadian Dollar, Chinese Renminbi and Hong Kong Dollar. We use a combination of purchased and written options to hedge forecasted cash flow currency exposures. These derivative instruments generally cover forecasted foreign currency exposures for periods of 12 to 24 months. We also utilize forward contracts to hedge portions of our anticipated cash settlements of intercompany transactions subject to foreign currency remeasurement. Additionally, we utilize cross-currency interest rate swaps to hedge the currency risk inherent in the interest and principal payments associated with foreign currency denominated debt obligations. The terms of these swap agreements are commensurate with the underlying debt obligations.
58
UNITED PARCEL SERVICE, INC. AND SUBSIDIARIES
MANAGEMENT'S DISCUSSION AND ANALYSIS OF FINANCIAL CONDITION AND
RESULTS OF OPERATIONS
Interest Rate Risk
We have issued debt instruments, including debt associated with capital leases, that accrue expense at fixed and floating rates of interest. We use a combination of interest rate swaps as part of our program to manage the fixed and floating interest rate mix of our total debt portfolio and related overall cost of borrowing. The notional amount, interest payment and maturity dates of the swaps match the terms of the associated debt. We also utilize forward starting swaps and similar instruments to lock in all or a portion of the borrowing cost of anticipated debt issuances. Our floating rate debt and interest rate swaps subject us to risk resulting from changes in short-term (primarily LIBOR) interest rates.
We also are subject to interest rate risk with respect to our pension and postretirement benefit obligations, as changes in interest rates will effectively increase or decrease our liabilities associated with these benefit plans, which also results in changes to the amount of pension and postretirement benefit expense recognized in future periods.
We have investments in debt securities, as well as cash-equivalent instruments, some of which accrue income at variable rates of interest. Additionally, we hold a portfolio of finance receivables that accrue income at fixed and floating rates of interest.
Equity Price Risk
We hold investments in various common equity securities that are subject to price risk. These securities are primarily in the form of equity index funds.
Sensitivity Analysis
The following analysis provides quantitative information regarding our exposure to foreign currency exchange risk, interest rate risk and equity price risk embedded in our existing financial instruments. We utilize valuation models to evaluate the sensitivity of the fair value of financial instruments with exposure to market risk that assume instantaneous, parallel shifts in exchange rates, interest rate yield curves and commodity and equity prices. For options and instruments with non-linear returns, models appropriate to the instrument are utilized to determine the impact of market shifts.
There are certain limitations inherent in the sensitivity analyses presented, primarily due to the assumption that exchange rates change in a parallel fashion and that interest rates change instantaneously. In addition, the analyses are unable to reflect the complex market reactions that normally would arise from the market shifts modeled. While this is our best estimate of the impact of the specified interest rate scenarios, these estimates should not be viewed as forecasts. We adjust the fixed and floating interest rate mix of our interest rate sensitive assets and liabilities in response to changes in market conditions. Additionally, changes in the fair value of foreign currency derivatives and commodity derivatives are offset by changes in the cash flows of the underlying hedged foreign currency and commodity transactions.
|
|
Shock-Test Result
As of December 31,
|
||||||
|
(in millions)
|
2014
|
2013
|
|||||
|
Change in Fair Value:
|
|||||||
|
Currency Derivatives
(1)
|
$
|
(229
|
)
|
$
|
(291
|
)
|
|
|
Change in Annual Interest Expense:
|
|||||||
|
Variable Rate Debt
(2)
|
$
|
15
|
|
$
|
7
|
|
|
|
Interest Rate Derivatives
(2)
|
$
|
81
|
|
$
|
101
|
|
|
|
Change in Annual Interest Income:
|
|||||||
|
Marketable Securities
(3)
|
$
|
—
|
|
$
|
15
|
|
|
|
(1)
|
The potential change in fair value from a hypothetical 10% weakening of the U.S. Dollar against local currency exchange rates across all maturities.
|
|
(2)
|
The potential change in annual interest expense resulting from a hypothetical 100 basis point increase in short-term interest rates, applied to our variable rate debt and swap instruments (excluding hedges of anticipated debt issuances).
|
|
(3)
|
The potential change in interest income resulting from a hypothetical 100 basis point increase in short-term interest rates, applied to our variable rate investment holdings.
|
The sensitivity of our pension and postretirement benefit obligations to changes in interest rates is quantified in “Critical Accounting Policies and Estimates”. The sensitivity in the fair value and interest income of our finance receivables due to changes in interest rates was not material as of
December 31, 2014
and
2013
.
59
|
Item 8.
|
Financial Statements and Supplementary Data
|
Table of Contents
60
Report of Independent Registered Public Accounting Firm
Board of Directors and Shareowners
United Parcel Service, Inc.
Atlanta, Georgia
We have audited the accompanying consolidated balance sheets of United Parcel Service, Inc. and subsidiaries (the “Company”) as of
December 31, 2014
and
2013
, and the related statements of consolidated income, consolidated comprehensive income, and consolidated cash flows for each of the three years in the period ended
December 31, 2014
. These financial statements are the responsibility of the Company’s management. Our responsibility is to express an opinion on these financial statements based on our audits.
We conducted our audits in accordance with the standards of the Public Company Accounting Oversight Board (United States). Those standards require that we plan and perform the audit to obtain reasonable assurance about whether the financial statements are free of material misstatement. An audit includes examining, on a test basis, evidence supporting the amounts and disclosures in the financial statements. An audit also includes assessing the accounting principles used and significant estimates made by management, as well as evaluating the overall financial statement presentation. We believe that our audits provide a reasonable basis for our opinion.
In our opinion, such consolidated financial statements present fairly, in all material respects, the financial position of United Parcel Service, Inc. and subsidiaries at
December 31, 2014
and
2013
, and the results of their operations and their cash flows for each of the three years in the period ended
December 31, 2014
, in conformity with accounting principles generally accepted in the United States of America.
We have also audited, in accordance with the standards of the Public Company Accounting Oversight Board (United States), the Company’s internal control over financial reporting as of
December 31, 2014
, based on the criteria established in
Internal Control—Integrated Framework (2013)
issued by the Committee of Sponsoring Organizations of the Treadway Commission and our report dated
February 27, 2015
expressed an unqualified opinion on the Company’s internal control over financial reporting.
/s/ Deloitte & Touche LLP
Atlanta, Georgia
February 27, 2015
61
UNITED PARCEL SERVICE, INC. AND SUBSIDIARIES
(In millions)
|
|
December 31,
|
||||||
|
|
2014
|
2013
|
|||||
|
ASSETS
|
|||||||
|
Current Assets:
|
|||||||
|
Cash and cash equivalents
|
$
|
2,291
|
|
$
|
4,665
|
|
|
|
Marketable securities
|
992
|
|
580
|
|
|||
|
Accounts receivable, net
|
6,661
|
|
6,502
|
|
|||
|
Deferred income tax assets
|
590
|
|
684
|
|
|||
|
Other current assets
|
1,274
|
|
956
|
|
|||
|
Total Current Assets
|
11,808
|
|
13,387
|
|
|||
|
Property, Plant and Equipment, Net
|
18,281
|
|
17,961
|
|
|||
|
Goodwill
|
2,184
|
|
2,190
|
|
|||
|
Intangible Assets, Net
|
847
|
|
775
|
|
|||
|
Investments and Restricted Cash
|
489
|
|
444
|
|
|||
|
Derivative Assets
|
515
|
|
323
|
|
|||
|
Deferred Income Tax Assets
|
652
|
|
110
|
|
|||
|
Other Non-Current Assets
|
695
|
|
1,022
|
|
|||
|
Total Assets
|
$
|
35,471
|
|
$
|
36,212
|
|
|
|
LIABILITIES AND SHAREOWNERS’ EQUITY
|
|||||||
|
Current Liabilities:
|
|||||||
|
Current maturities of long-term debt and commercial paper
|
$
|
923
|
|
$
|
48
|
|
|
|
Accounts payable
|
2,754
|
|
2,478
|
|
|||
|
Accrued wages and withholdings
|
2,373
|
|
2,325
|
|
|||
|
Self-insurance reserves
|
656
|
|
719
|
|
|||
|
Other current liabilities
|
1,933
|
|
1,561
|
|
|||
|
Total Current Liabilities
|
8,639
|
|
7,131
|
|
|||
|
Long-Term Debt
|
9,864
|
|
10,824
|
|
|||
|
Pension and Postretirement Benefit Obligations
|
11,452
|
|
7,051
|
|
|||
|
Deferred Income Tax Liabilities
|
83
|
|
1,244
|
|
|||
|
Self-Insurance Reserves
|
1,916
|
|
2,059
|
|
|||
|
Other Non-Current Liabilities
|
1,359
|
|
1,415
|
|
|||
|
Shareowners’ Equity:
|
|||||||
|
Class A common stock (201 and 212 shares issued in 2014 and 2013)
|
2
|
|
2
|
|
|||
|
Class B common stock (705 and 712 shares issued in 2014 and 2013)
|
7
|
|
7
|
|
|||
|
Additional paid-in capital
|
—
|
|
—
|
|
|||
|
Retained earnings
|
5,726
|
|
6,925
|
|
|||
|
Accumulated other comprehensive loss
|
(3,594
|
)
|
(460
|
)
|
|||
|
Deferred compensation obligations
|
59
|
|
69
|
|
|||
|
Less: Treasury stock (1 share in 2014 and 2013)
|
(59
|
)
|
(69
|
)
|
|||
|
Total Equity for Controlling Interests
|
2,141
|
|
6,474
|
|
|||
|
Noncontrolling Interests
|
17
|
|
14
|
|
|||
|
Total Shareowners’ Equity
|
2,158
|
|
6,488
|
|
|||
|
Total Liabilities and Shareowners’ Equity
|
$
|
35,471
|
|
$
|
36,212
|
|
|
See notes to consolidated financial statements.
62
UNITED PARCEL SERVICE, INC. AND SUBSIDIARIES
(In millions, except per share amounts)
|
|
Years Ended December 31,
|
||||||||||
|
|
2014
|
2013
|
2012
|
||||||||
|
Revenue
|
$
|
58,232
|
|
$
|
55,438
|
|
$
|
54,127
|
|
||
|
Operating Expenses:
|
|||||||||||
|
Compensation and benefits
|
32,045
|
|
28,557
|
|
33,102
|
|
|||||
|
Repairs and maintenance
|
1,371
|
|
1,240
|
|
1,228
|
|
|||||
|
Depreciation and amortization
|
1,923
|
|
1,867
|
|
1,858
|
|
|||||
|
Purchased transportation
|
8,460
|
|
7,486
|
|
7,354
|
|
|||||
|
Fuel
|
3,883
|
|
4,027
|
|
4,090
|
|
|||||
|
Other occupancy
|
1,044
|
|
950
|
|
902
|
|
|||||
|
Other expenses
|
4,538
|
|
4,277
|
|
4,250
|
|
|||||
|
Total Operating Expenses
|
53,264
|
|
48,404
|
|
52,784
|
|
|||||
|
Operating Profit
|
4,968
|
|
7,034
|
|
1,343
|
|
|||||
|
Other Income and (Expense):
|
|||||||||||
|
Investment income
|
22
|
|
20
|
|
24
|
|
|||||
|
Interest expense
|
(353
|
)
|
(380
|
)
|
(393
|
)
|
|||||
|
Total Other Income and (Expense)
|
(331
|
)
|
(360
|
)
|
(369
|
)
|
|||||
|
Income Before Income Taxes
|
4,637
|
|
6,674
|
|
974
|
|
|||||
|
Income Tax Expense
|
1,605
|
|
2,302
|
|
167
|
|
|||||
|
Net Income
|
$
|
3,032
|
|
$
|
4,372
|
|
$
|
807
|
|
||
|
Basic Earnings Per Share
|
$
|
3.31
|
|
$
|
4.65
|
|
$
|
0.84
|
|
||
|
Diluted Earnings Per Share
|
$
|
3.28
|
|
$
|
4.61
|
|
$
|
0.83
|
|
||
STATEMENTS OF CONSOLIDATED COMPREHENSIVE INCOME (LOSS)
(In millions)
|
|
Years Ended December 31,
|
||||||||||
|
|
2014
|
2013
|
2012
|
||||||||
|
Net income
|
$
|
3,032
|
|
$
|
4,372
|
|
$
|
807
|
|
||
|
Change in foreign currency translation adjustment, net of tax
|
(331
|
)
|
(260
|
)
|
294
|
|
|||||
|
Change in unrealized gain (loss) on marketable securities, net of tax
|
1
|
|
(7
|
)
|
—
|
|
|||||
|
Change in unrealized gain (loss) on cash flow hedges, net of tax
|
280
|
|
67
|
|
(82
|
)
|
|||||
|
Change in unrecognized pension and postretirement benefit costs, net of tax
|
(3,084
|
)
|
3,094
|
|
(463
|
)
|
|||||
|
Comprehensive income (loss)
|
$
|
(102
|
)
|
$
|
7,266
|
|
$
|
556
|
|
||
See notes to consolidated financial statements.
63
UNITED PARCEL SERVICE, INC. AND SUBSIDIARIES
(In millions)
|
|
Years Ended December 31,
|
||||||||||
|
|
2014
|
2013
|
2012
|
||||||||
|
Cash Flows From Operating Activities:
|
|||||||||||
|
Net income
|
$
|
3,032
|
|
$
|
4,372
|
|
$
|
807
|
|
||
|
Adjustments to reconcile net income to net cash from operating activities:
|
|||||||||||
|
Depreciation and amortization
|
1,923
|
|
1,867
|
|
1,858
|
|
|||||
|
Pension and postretirement benefit expense
|
3,040
|
|
1,115
|
|
5,753
|
|
|||||
|
Pension and postretirement benefit contributions
|
(1,258
|
)
|
(212
|
)
|
(917
|
)
|
|||||
|
Settlement of postretirement benefit obligation
|
(2,271
|
)
|
—
|
|
—
|
|
|||||
|
Self-insurance reserves
|
(201
|
)
|
34
|
|
156
|
|
|||||
|
Deferred tax expense
|
385
|
|
(246
|
)
|
(2,083
|
)
|
|||||
|
Stock compensation expense
|
536
|
|
513
|
|
547
|
|
|||||
|
Other (gains) losses
|
218
|
|
35
|
|
1,082
|
|
|||||
|
Changes in assets and liabilities, net of effect of acquisitions:
|
|||||||||||
|
Accounts receivable
|
(523
|
)
|
(515
|
)
|
(124
|
)
|
|||||
|
Other current assets
|
112
|
|
(13
|
)
|
10
|
|
|||||
|
Accounts payable
|
276
|
|
218
|
|
(58
|
)
|
|||||
|
Accrued wages and withholdings
|
106
|
|
416
|
|
98
|
|
|||||
|
Other current liabilities
|
317
|
|
(140
|
)
|
206
|
|
|||||
|
Other operating activities
|
34
|
|
(140
|
)
|
(119
|
)
|
|||||
|
Net cash from operating activities
|
5,726
|
|
7,304
|
|
7,216
|
|
|||||
|
Cash Flows From Investing Activities:
|
|||||||||||
|
Capital expenditures
|
(2,328
|
)
|
(2,065
|
)
|
(2,153
|
)
|
|||||
|
Proceeds from disposals of property, plant and equipment
|
53
|
|
104
|
|
95
|
|
|||||
|
Purchases of marketable securities
|
(3,525
|
)
|
(2,948
|
)
|
(2,357
|
)
|
|||||
|
Sales and maturities of marketable securities
|
3,106
|
|
2,957
|
|
2,985
|
|
|||||
|
Net decrease in finance receivables
|
44
|
|
39
|
|
101
|
|
|||||
|
Cash paid for business acquisitions
|
(88
|
)
|
(22
|
)
|
(100
|
)
|
|||||
|
Other investing activities
|
(63
|
)
|
(179
|
)
|
94
|
|
|||||
|
Net cash used in investing activities
|
(2,801
|
)
|
(2,114
|
)
|
(1,335
|
)
|
|||||
|
Cash Flows From Financing Activities:
|
|||||||||||
|
Net change in short-term debt
|
—
|
|
—
|
|
—
|
|
|||||
|
Proceeds from long-term borrowings
|
1,525
|
|
100
|
|
1,745
|
|
|||||
|
Repayments of long-term borrowings
|
(1,694
|
)
|
(1,875
|
)
|
(16
|
)
|
|||||
|
Purchases of common stock
|
(2,695
|
)
|
(3,838
|
)
|
(1,621
|
)
|
|||||
|
Issuances of common stock
|
274
|
|
491
|
|
301
|
|
|||||
|
Dividends
|
(2,366
|
)
|
(2,260
|
)
|
(2,130
|
)
|
|||||
|
Other financing activities
|
(205
|
)
|
(425
|
)
|
(96
|
)
|
|||||
|
Net cash used in financing activities
|
(5,161
|
)
|
(7,807
|
)
|
(1,817
|
)
|
|||||
|
Effect Of Exchange Rate Changes On Cash And Cash Equivalents
|
(138
|
)
|
(45
|
)
|
229
|
|
|||||
|
Net Increase (Decrease) In Cash And Cash Equivalents
|
(2,374
|
)
|
(2,662
|
)
|
4,293
|
|
|||||
|
Cash And Cash Equivalents:
|
|||||||||||
|
Beginning of period
|
4,665
|
|
7,327
|
|
3,034
|
|
|||||
|
End of period
|
$
|
2,291
|
|
$
|
4,665
|
|
$
|
7,327
|
|
||
|
Cash Paid During The Period For:
|
|||||||||||
|
Interest (net of amount capitalized)
|
$
|
366
|
|
$
|
409
|
|
$
|
381
|
|
||
|
Income taxes
|
$
|
1,524
|
|
$
|
2,712
|
|
$
|
1,988
|
|
||
See notes to consolidated financial statements.
64
UNITED PARCEL SERVICE, INC. AND SUBSIDIARIES
NOTES TO CONSOLIDATED FINANCIAL STATEMENTS
Basis of Financial Statements and Business Activities
The accompanying consolidated financial statements have been prepared in accordance with accounting principles generally accepted in the United States (“GAAP”), and include the accounts of United Parcel Service, Inc., and all of its consolidated subsidiaries (collectively “UPS” or the “Company”). All intercompany balances and transactions have been eliminated.
UPS concentrates its operations in the field of transportation services, primarily domestic and international letter and package delivery. Through our Supply Chain & Freight subsidiaries, we are also a global provider of specialized transportation, logistics, and financial services.
Use of Estimates
The preparation of our consolidated financial statements requires the use of estimates and assumptions that affect the reported amounts of assets and liabilities, the reported amounts of revenues and expenses and the disclosure of contingencies. Estimates have been prepared on the basis of the most current and best information, and actual results could differ materially from those estimates.
Revenue Recognition
U.S. Domestic and International Package Operations
—Revenue is recognized upon delivery of a letter or package.
Forwarding and Logistics
—Freight forwarding revenue and the expense related to the transportation of freight are recognized at the time the services are completed. Material management and distribution revenue is recognized upon performance of the service provided. Customs brokerage revenue is recognized upon completing documents necessary for customs entry purposes.
Freight
—Revenue is recognized upon delivery of a less-than-truckload (“LTL”) or truckload (“TL”) shipment.
We utilize independent contractors and third-party carriers in the performance of some transportation services. In situations where we act as principal party to the transaction, we recognize revenue on a gross basis; in circumstances where we act as an agent, we recognize revenue net of the cost of the purchased transportation.
Financial Services
—Income on loans and direct finance leases is recognized on the effective interest method. Accrual of interest income is suspended at the earlier of the time at which collection of an account becomes doubtful or the account becomes 90 days delinquent. Income on operating leases is recognized on the straight-line method over the terms of the underlying leases.
Cash and Cash Equivalents
Cash and cash equivalents consist of highly liquid investments that are readily convertible into cash. We consider securities with maturities of three months or less, when purchased, to be cash equivalents. The carrying amount of these securities approximates fair value because of the short-term maturity of these instruments.
Investments
Marketable securities are either classified as trading or available-for-sale securities and are carried at fair value. Unrealized gains and losses on trading securities are reported as investment income on the statements of consolidated income. Unrealized gains and losses on available-for-sale securities are reported as accumulated other comprehensive income (“AOCI”), a separate component of shareowners’ equity. The amortized cost of debt securities is adjusted for amortization of premiums and accretion of discounts to maturity. Such amortization and accretion is included in investment income, along with interest and dividends. The cost of securities sold is based on the specific identification method; realized gains and losses resulting from such sales are included in investment income.
We periodically review our available-for-sale investments for indications of other-than-temporary impairment considering many factors, including the extent and duration to which a security’s fair value has been less than its cost, overall economic and market conditions and the financial condition and specific prospects for the issuer. Impairment of available-for-sale securities results in a charge to income when a market decline below cost is other-than-temporary.
65
UNITED PARCEL SERVICE, INC. AND SUBSIDIARIES
NOTES TO CONSOLIDATED FINANCIAL STATEMENTS
Accounts Receivable
Losses on accounts receivable are recognized when they are incurred, which requires us to make our best estimate of the probable losses inherent in our customer receivables at each balance sheet date. These estimates require consideration of historical loss experience, adjusted for current conditions, trends in customer payment frequency, and judgments about the probable effects of relevant observable data, including present economic conditions and the financial health of specific customers and market sectors. Our risk management process includes standards and policies for reviewing major account exposures and concentrations of risk.
Our total allowance for doubtful accounts as of
December 31, 2014
and
2013
was $
121
and $
122
million, respectively. Our total provision for doubtful accounts charged to expense during the years ended
December 31, 2014
,
2013
and
2012
was $
143
, $
129
and $
155
million, respectively.
Inventories
Jet fuel, diesel, and unleaded gasoline inventories are valued at the lower of average cost or market. Fuel and other materials and supplies inventories are recognized as inventory when purchased, and then charged to expense when used in our operations. Total inventories were $
344
and $
403
million as of
December 31, 2014
and
2013
, respectively, and are included in “other current assets” on the consolidated balance sheets.
Property, Plant and Equipment
Property, plant and equipment are carried at cost. Depreciation and amortization are provided by the straight-line method over the estimated useful lives of the assets, which are as follows: Vehicles—
3
to
15
years; Aircraft—
12
to
30
years; Buildings—
20
to
40
years; Leasehold Improvements—lesser of asset useful life or lease term; Plant Equipment—
3
to
20
years; Technology Equipment—
3
to
5
years. The costs of major airframe and engine overhauls, as well as routine maintenance and repairs, are charged to expense as incurred.
Interest incurred during the construction period of certain property, plant and equipment is capitalized until the underlying assets are placed in service, at which time amortization of the capitalized interest begins, straight-line, over the estimated useful lives of the related assets. Capitalized interest was $
11
, $
14
and $
18
million for
2014
,
2013
, and
2012
, respectively.
We review long-lived assets for impairment when circumstances indicate the carrying amount of an asset may not be recoverable based on the undiscounted future cash flows of the asset. If the carrying amount of the asset is determined not to be recoverable, a write-down to fair value is recorded. Fair values are determined based on quoted market values, discounted cash flows, or external appraisals, as applicable. We review long-lived assets for impairment at the individual asset or the asset group level for which the lowest level of independent cash flows can be identified.
Goodwill and Intangible Assets
Costs of purchased businesses in excess of net identifiable assets acquired (goodwill), and indefinite-lived intangible assets are tested for impairment at least annually, unless changes in circumstances indicate an impairment may have occurred sooner. We are required to test goodwill on a “reporting unit” basis. A reporting unit is the operating segment unless, for businesses within that operating segment, discrete financial information is prepared and regularly reviewed by management, in which case such a component business is the reporting unit.
In assessing goodwill for impairment, we initially evaluate qualitative factors to determine if it is more likely than not that the fair value of a reporting unit is less than its carrying amount. We consider several factors, including macroeconomic conditions, industry and market conditions, overall financial performance of the reporting unit, changes in management, strategy or customers, and relevant reporting unit-specific events such as a change in the carrying amount of net assets, a more likely than not expectation of selling or disposing all, or a portion, of a reporting unit, and the testing for recoverability of a significant asset group within a reporting unit. If this qualitative assessment results in a conclusion that it is more likely than not that the fair value of a reporting unit exceeds the carrying value, then no further testing is performed for that reporting unit.
66
UNITED PARCEL SERVICE, INC. AND SUBSIDIARIES
NOTES TO CONSOLIDATED FINANCIAL STATEMENTS
If the qualitative assessment is not conclusive and it is necessary to calculate the fair value of a reporting unit, then we utilize a two-step process to test goodwill for impairment. First, a comparison of the fair value of the applicable reporting unit with the aggregate carrying value, including goodwill, is performed. If the carrying amount of a reporting unit exceeds its calculated fair value, then the second step is performed, and an impairment charge is recognized for the amount, if any, by which the carrying amount of goodwill exceeds its implied fair value. We primarily determine the fair value of our reporting units using a discounted cash flow model, and supplement this with observable valuation multiples for comparable companies, as applicable.
Finite-lived intangible assets, including trademarks, licenses, patents, customer lists, non-compete agreements and franchise rights are amortized on a straight-line basis over the estimated useful lives of the assets, which range from
1
to
22
years. Capitalized software is amortized over
5
years.
Self-Insurance Accruals
We self-insure costs associated with workers’ compensation claims, automotive liability, health and welfare, and general business liabilities, up to certain limits. Insurance reserves are established for estimates of the loss that we will ultimately incur on reported claims, as well as estimates of claims that have been incurred but not yet reported. Recorded balances are based on reserve levels, which incorporate historical loss experience and judgments about the present and expected levels of cost per claim.
Pension and Postretirement Benefits
We incur certain employment-related expenses associated with pension and postretirement medical benefits. These pension and postretirement medical benefit costs for company-sponsored benefit plans are calculated using various actuarial assumptions and methodologies, including discount rates, expected returns on plan assets, healthcare cost trend rates, inflation, compensation increase rates, mortality rates, and other factors. Actuarial assumptions are reviewed on an annual basis, unless circumstances require an interim remeasurement date for any of our plans.
We recognize changes in the fair value of plan assets and net actuarial gains or losses in excess of a corridor (defined as
10%
of the greater of the fair value of plan assets or the plans' projected benefit obligations) in pension expense annually at December 31st each year. The remaining components of pension expense, primarily service and interest costs and the expected return on plan assets, are recorded on a quarterly basis.
We participate in a number of trustee-managed multiemployer pension and health and welfare plans for employees covered under collective bargaining agreements. Our contributions to these plans are determined in accordance with the respective collective bargaining agreements. We recognize expense for the contractually required contribution for each period, and we recognize a liability for any contributions due and unpaid (included in “other current liabilities”).
Income Taxes
Income taxes are accounted for on an asset and liability approach that requires the recognition of deferred tax assets and liabilities for the expected future tax consequences of events that have been recognized in our consolidated financial statements or tax returns. In estimating future tax consequences, we generally consider all expected future events other than proposed changes in the tax law or rates. Valuation allowances are provided if it is more likely than not that a deferred tax asset will not be realized.
We recognize liabilities for uncertain tax positions based on a two-step process. The first step is to evaluate the tax position for recognition by determining if the weight of available evidence indicates that it is more likely than not that the position will be sustained on audit, including resolution of related appeals or litigation processes, if any. Once it is determined that the position meets the recognition threshold, the second step requires us to estimate and measure the tax benefit as the largest amount that is more likely than not to be realized upon ultimate settlement. It is inherently difficult and subjective to estimate such amounts, as we have to determine the probability of various possible outcomes. We reevaluate these uncertain tax positions on a quarterly basis. This evaluation is based on factors including, but not limited to, changes in facts or circumstances, changes in tax law, effectively settled issues under audit, and new audit activity. Such a change in recognition or measurement could result in the recognition of a tax benefit or an additional charge to the tax provision.
67
UNITED PARCEL SERVICE, INC. AND SUBSIDIARIES
NOTES TO CONSOLIDATED FINANCIAL STATEMENTS
Foreign Currency Translation
We translate the results of operations of our foreign subsidiaries using average exchange rates during each period, whereas balance sheet accounts are translated using exchange rates at the end of each period. Balance sheet currency translation adjustments are recorded in AOCI. Pre-tax currency transaction gains, net of hedging, included in other operating expenses and investment income were $
14
, $
76
and $
10
million in
2014
,
2013
and
2012
, respectively.
Stock-Based Compensation
All share-based awards to employees are measured based on their fair values and expensed over the period during which an employee is required to provide service in exchange for the award (the vesting period). We issue employee share-based awards under the UPS Incentive Compensation Plan that are subject to specific vesting conditions; generally, the awards cliff vest or vest ratably over a
three
or
five
year period (the "nominal vesting period”) or at the date the employee retires (as defined by the plan), if earlier. Compensation cost is recognized immediately for awards granted to retirement-eligible employees, or over the period from the grant date to the date retirement eligibility is achieved, if that is expected to occur during the nominal vesting period.
Fair Value Measurements
Our financial assets and liabilities measured at fair value on a recurring basis have been categorized based upon a fair value hierarchy. Level 1 inputs utilize quoted prices in active markets for identical assets or liabilities. Level 2 inputs are based on other observable market data, such as quoted prices for similar assets and liabilities, and inputs other than quoted prices that are observable, such as interest rates and yield curves. Level 3 inputs are developed from unobservable data reflecting our own assumptions, and include situations where there is little or no market activity for the asset or liability.
Certain non-financial assets and liabilities are measured at fair value on a nonrecurring basis, including property, plant, and equipment, goodwill and intangible assets. These assets are not measured at fair value on a recurring basis; however, they are subject to fair value adjustments in certain circumstances, such as when there is evidence of an impairment. A general description of the valuation methodologies used for assets and liabilities measured at fair value, including the general classification of such assets and liabilities pursuant to the valuation hierarchy, is included in each footnote with fair value measurements present.
Derivative Instruments
All financial derivative instruments are recorded on our consolidated balance sheets at fair value. Derivatives not designated as hedges must be adjusted to fair value through income. If a derivative is designated as a hedge, changes in its fair value that are considered to be effective, as defined, either (depending on the nature of the hedge) offset the change in fair value of the hedged assets, liabilities or firm commitments through income, or are recorded in AOCI until the hedged item is recorded in income. Any portion of a change in a hedge’s fair value that is considered to be ineffective, or is excluded from the measurement of effectiveness, is recorded immediately in income.
Adoption of New Accounting Standards
In January 2014, the FASB issued an accounting standards update that adds new disclosure requirements for investments in qualified affordable housing projects through limited liability entities. If certain conditions are met, the cost of an entity's investment in proportion to the tax credits and other tax benefits it receives may be amortized and included as a component of income tax expense. In January 2008, we adopted the fair value option for our investments in certain investment partnerships that were previously accounted for under the equity method; therefore, this accounting standards update did not have any effect on our consolidated financial position or results of operations.
Other accounting pronouncements adopted during the periods covered by the consolidated financial statements did not have a material impact on our consolidated financial position or results of operations.
68
UNITED PARCEL SERVICE, INC. AND SUBSIDIARIES
NOTES TO CONSOLIDATED FINANCIAL STATEMENTS
Accounting Standards Issued But Not Yet Effective
In April 2014, the FASB issued an accounting standards update that changes the requirements for reporting discontinued operations. This update will have the impact of reducing the frequency of disposals reported as discontinued operations, by requiring such a disposal to represent a strategic shift that has a major effect on an entity's operations and financial results. This update also expands the disclosures for discontinued operations, and requires new disclosures related to individually significant disposals that do not qualify as discontinued operations. This new guidance becomes effective for us prospectively in the first quarter of 2015. This amended guidance will only have a potential impact to the extent that we discontinue any operations in future periods.
In May 2014, the FASB issued an accounting standards update that changes the revenue recognition for companies that enter into contracts with customers to transfer goods or services. This amended guidance requires revenue to be recognized in an amount that reflects the consideration to which the company expects to be entitled for those goods and services when the performance obligation has been satisfied. This amended guidance also requires enhanced disclosures regarding the nature, amount, timing and uncertainty of revenue and related cash flows arising from contracts with customers. This amended guidance is effective for us beginning in the first quarter of 2017 and early adoption is not permitted. At this time, we do not expect this new guidance to have a material impact on our consolidated financial position or results of operations.
In June 2014, the FASB issued an accounting standards update for companies that grant their employees share-based payments in which the terms of the award provide that a performance target that affects vesting could be achieved after the requisite service period. This new guidance becomes effective for us beginning in the first quarter of 2015, but early adoption is permitted. This new guidance is not expected to have a material impact on our consolidated financial position or results of operations.
Other accounting pronouncements issued, but not effective until after
December 31, 2014
, are not expected to have a material impact on our consolidated financial position or results of operations.
Changes in Presentation
Certain prior year amounts have been reclassified to conform to the current year presentation. These reclassifications had no impact on our financial position or results of operations.
The following is a summary of marketable securities classified as trading and available-for-sale at
December 31, 2014
and
2013
(in millions):
|
Cost
|
Unrealized
Gains
|
Unrealized
Losses
|
Estimated
Fair Value
|
||||||||||||
|
2014
|
|||||||||||||||
|
Current marketable securities:
|
|||||||||||||||
|
U.S. government and agency debt securities
|
$
|
321
|
|
$
|
1
|
|
$
|
(1
|
)
|
$
|
321
|
|
|||
|
Mortgage and asset-backed debt securities
|
89
|
|
1
|
|
(1
|
)
|
89
|
|
|||||||
|
Corporate debt securities
|
534
|
|
—
|
|
—
|
|
534
|
|
|||||||
|
U.S. state and local municipal debt securities
|
2
|
|
—
|
|
—
|
|
2
|
|
|||||||
|
Other debt and equity securities
|
46
|
|
—
|
|
—
|
|
46
|
|
|||||||
|
Total marketable securities
|
$
|
992
|
|
$
|
2
|
|
$
|
(2
|
)
|
$
|
992
|
|
|||
69
UNITED PARCEL SERVICE, INC. AND SUBSIDIARIES
NOTES TO CONSOLIDATED FINANCIAL STATEMENTS
|
|
Cost
|
Unrealized
Gains
|
Unrealized
Losses
|
Estimated
Fair Value
|
|||||||||||
|
2013
|
|||||||||||||||
|
Current marketable securities:
|
|||||||||||||||
|
U.S. government and agency debt securities
|
$
|
355
|
|
$
|
—
|
|
$
|
(1
|
)
|
$
|
354
|
|
|||
|
Mortgage and asset-backed debt securities
|
76
|
|
1
|
|
(2
|
)
|
75
|
|
|||||||
|
Corporate debt securities
|
146
|
|
1
|
|
(1
|
)
|
146
|
|
|||||||
|
U.S. state and local municipal debt securities
|
2
|
|
—
|
|
—
|
|
2
|
|
|||||||
|
Other debt and equity securities
|
3
|
|
—
|
|
—
|
|
3
|
|
|||||||
|
Total marketable securities
|
$
|
582
|
|
$
|
2
|
|
$
|
(4
|
)
|
$
|
580
|
|
|||
Of the total estimated fair value in marketable securities listed above,
$430
million as of
December 31, 2014
was classified as "trading", with unrealized gains and losses recognized in investment income within the statements of consolidated income (
no
amounts were classified as "trading" as of
December 31, 2013
). The remaining estimated fair value of marketable securities was classified as "available-for-sale", with related unrealized gains and losses, net of tax, recognized in AOCI.
The gross realized gains on sales of marketable securities totaled $
1
, $
11
and $
15
million in
2014
,
2013
, and
2012
, respectively. The gross realized losses totaled $
0
, $
6
and $
6
million in
2014
,
2013
, and
2012
, respectively. There were
no
impairment losses recognized on marketable securities during
2014
,
2013
or
2012
.
Investment Other-Than-Temporary Impairments
We have concluded that no other-than-temporary impairment losses existed as of
December 31, 2014
. In making this determination, we considered the financial condition and prospects of the issuer, the magnitude of the losses compared with the investments’ cost, the probability that we will be unable to collect all amounts due according to the contractual terms of the security, the credit rating of the security and our ability and intent to hold these investments until the anticipated recovery in market value occurs.
Unrealized Losses
The following table presents the age of gross unrealized losses and fair value by investment category for all securities in a loss position as of
December 31, 2014
(in millions):
|
Less Than 12 Months
|
12 Months or More
|
Total
|
|||||||||||||||||||||
|
Fair Value
|
Unrealized Losses
|
Fair Value
|
Unrealized Losses
|
Fair Value
|
Unrealized Losses
|
||||||||||||||||||
|
U.S. government and agency debt securities
|
$
|
147
|
|
$
|
(1
|
)
|
$
|
—
|
|
$
|
—
|
|
$
|
147
|
|
$
|
(1
|
)
|
|||||
|
Mortgage and asset-backed debt securities
|
—
|
|
—
|
|
21
|
|
(1
|
)
|
21
|
|
(1
|
)
|
|||||||||||
|
Corporate debt securities
|
—
|
|
—
|
|
—
|
|
—
|
|
—
|
|
—
|
|
|||||||||||
|
U.S. state and local municipal debt securities
|
—
|
|
—
|
|
—
|
|
—
|
|
—
|
|
—
|
|
|||||||||||
|
Other debt and equity securities
|
—
|
|
—
|
|
—
|
|
—
|
|
—
|
|
—
|
|
|||||||||||
|
Total marketable securities
|
$
|
147
|
|
$
|
(1
|
)
|
$
|
21
|
|
$
|
(1
|
)
|
$
|
168
|
|
$
|
(2
|
)
|
|||||
The unrealized losses for the U.S. government and agency debt securities and mortgage and asset-backed debt securities are primarily due to changes in market interest rates. We have both the intent and ability to hold the securities contained in the previous table for a time necessary to recover the cost basis.
70
UNITED PARCEL SERVICE, INC. AND SUBSIDIARIES
NOTES TO CONSOLIDATED FINANCIAL STATEMENTS
Maturity Information
The amortized cost and estimated fair value of marketable securities at
December 31, 2014
, by contractual maturity, are shown below (in millions). Actual maturities may differ from contractual maturities because the issuers of the securities may have the right to prepay obligations without prepayment penalties.
|
Cost
|
Estimated
Fair Value
|
||||||
|
Due in one year or less
|
$
|
459
|
|
$
|
459
|
|
|
|
Due after one year through three years
|
439
|
|
439
|
|
|||
|
Due after three years through five years
|
15
|
|
15
|
|
|||
|
Due after five years
|
77
|
|
77
|
|
|||
|
990
|
|
990
|
|
||||
|
Equity securities
|
2
|
|
2
|
|
|||
|
$
|
992
|
|
$
|
992
|
|
||
Non-Current Investments and Restricted Cash
Restricted cash is primarily associated with our self-insurance requirements. We entered into an escrow agreement with an insurance carrier to guarantee our self-insurance obligations. This agreement requires us to provide cash collateral to the insurance carrier, which is invested in money market funds and similar cash equivalent type assets. Additional cash collateral provided is reflected in "other investing activities" in the statements of consolidated cash flows. As of
December 31, 2014
and
2013
, we had $
442
and $
425
million in self-insurance restricted cash, respectively.
We held a $
19
million investment in a variable life insurance policy to fund benefits for the UPS Excess Coordinating Benefit Plan at both
December 31, 2014
and
2013
. The quarterly change in investment fair value is recognized in "investment income" on the statements of consolidated income. Additionally, we held escrowed cash related to the acquisition and disposition of certain assets, primarily real estate, of $
28
million as of
December 31, 2014
(
none
as of
December 31, 2013
).
The amounts described above are classified as “investments and restricted cash” in the consolidated balance sheets.
Fair Value Measurements
Marketable securities utilizing Level 1 inputs include active exchange-traded equity securities and equity index funds, and most U.S. Government debt securities, as these securities all have quoted prices in active markets. Marketable securities utilizing Level 2 inputs include asset-backed securities, corporate bonds and municipal bonds. These securities are valued using market corroborated pricing, matrix pricing or other models that utilize observable inputs such as yield curves.
We maintain holdings in certain investment partnerships that are measured at fair value utilizing Level 3 inputs (classified as “other investments” in the tables below, and as “other non-current assets” in the consolidated balance sheets). These partnership holdings do not have quoted prices, nor can they be valued using inputs based on observable market data. These investments are valued internally using a discounted cash flow model with two significant inputs: (1) the after-tax cash flow projections for each partnership, and (2) a risk-adjusted discount rate consistent with the duration of the expected cash flows for each partnership. The weighted-average discount rates used to value these investments were
7.81%
and
8.65%
as of
December 31, 2014
and
2013
, respectively. These inputs and the resulting fair values are updated on a quarterly basis.
The following table presents information about our investments measured at fair value on a recurring basis as of
December 31, 2014
and
2013
, and indicates the fair value hierarchy of the valuation techniques utilized to determine such fair value (in millions):
71
UNITED PARCEL SERVICE, INC. AND SUBSIDIARIES
NOTES TO CONSOLIDATED FINANCIAL STATEMENTS
|
Quoted Prices in
Active Markets
for Identical
Assets
(Level 1)
|
Significant
Other Observable
Inputs
(Level 2)
|
Significant
Unobservable
Inputs
(Level 3)
|
Total
|
||||||||||||
|
2014
|
|||||||||||||||
|
Marketable securities:
|
|||||||||||||||
|
U.S. government and agency debt securities
|
$
|
321
|
|
$
|
—
|
|
$
|
—
|
|
$
|
321
|
|
|||
|
Mortgage and asset-backed debt securities
|
—
|
|
89
|
|
—
|
|
89
|
|
|||||||
|
Corporate debt securities
|
—
|
|
534
|
|
—
|
|
534
|
|
|||||||
|
U.S. state and local municipal debt securities
|
—
|
|
2
|
|
—
|
|
2
|
|
|||||||
|
Other debt and equity securities
|
—
|
|
46
|
|
—
|
|
46
|
|
|||||||
|
Total marketable securities
|
321
|
|
671
|
|
—
|
|
992
|
|
|||||||
|
Other investments
|
19
|
|
—
|
|
64
|
|
83
|
|
|||||||
|
Total
|
$
|
340
|
|
$
|
671
|
|
$
|
64
|
|
$
|
1,075
|
|
|||
|
|
Quoted Prices in
Active Markets
for Identical
Assets
(Level 1)
|
Significant Other
Observable Inputs
(Level 2)
|
Significant
Unobservable
Inputs
(Level 3)
|
Total
|
|||||||||||
|
2013
|
|||||||||||||||
|
Marketable securities:
|
|||||||||||||||
|
U.S. government and agency debt securities
|
$
|
353
|
|
$
|
1
|
|
$
|
—
|
|
$
|
354
|
|
|||
|
Mortgage and asset-backed debt securities
|
—
|
|
75
|
|
—
|
|
75
|
|
|||||||
|
Corporate debt securities
|
—
|
|
146
|
|
—
|
|
146
|
|
|||||||
|
U.S. state and local municipal debt securities
|
—
|
|
2
|
|
—
|
|
2
|
|
|||||||
|
Other debt and equity securities
|
—
|
|
3
|
|
—
|
|
3
|
|
|||||||
|
Total marketable securities
|
353
|
|
227
|
|
—
|
|
580
|
|
|||||||
|
Other investments
|
19
|
|
—
|
|
110
|
|
129
|
|
|||||||
|
Total
|
$
|
372
|
|
$
|
227
|
|
$
|
110
|
|
$
|
709
|
|
|||
The following table presents the changes in the above Level 3 instruments measured on a recurring basis for the years ended
December 31, 2014
and
2013
(in millions).
|
Marketable
Securities
|
Other
Investments
|
Total
|
|||||||||
|
Balance on January 1, 2013
|
$
|
—
|
|
$
|
163
|
|
$
|
163
|
|
||
|
Transfers into (out of) Level 3
|
—
|
|
—
|
|
—
|
|
|||||
|
Net realized and unrealized gains (losses):
|
|||||||||||
|
Included in earnings (in investment income)
|
—
|
|
(53
|
)
|
(53
|
)
|
|||||
|
Included in accumulated other comprehensive income (pre-tax)
|
—
|
|
—
|
|
—
|
|
|||||
|
Purchases
|
—
|
|
—
|
|
—
|
|
|||||
|
Settlements
|
—
|
|
—
|
|
—
|
|
|||||
|
Balance on December 31, 2013
|
$
|
—
|
|
$
|
110
|
|
$
|
110
|
|
||
|
Transfers into (out of) Level 3
|
—
|
|
—
|
|
—
|
|
|||||
|
Net realized and unrealized gains (losses):
|
|||||||||||
|
Included in earnings (in investment income)
|
—
|
|
(46
|
)
|
(46
|
)
|
|||||
|
Included in accumulated other comprehensive income (pre-tax)
|
—
|
|
—
|
|
—
|
|
|||||
|
Purchases
|
—
|
|
—
|
|
—
|
|
|||||
|
Settlements
|
—
|
|
—
|
|
—
|
|
|||||
|
Balance on December 31, 2014
|
$
|
—
|
|
$
|
64
|
|
$
|
64
|
|
||
72
UNITED PARCEL SERVICE, INC. AND SUBSIDIARIES
NOTES TO CONSOLIDATED FINANCIAL STATEMENTS
Property, plant and equipment, including both owned assets as well as assets subject to capital leases, consists of the following as of
December 31
(in millions):
|
2014
|
2013
|
||||||
|
Vehicles
|
$
|
7,542
|
|
$
|
6,762
|
|
|
|
Aircraft
|
15,801
|
|
15,772
|
|
|||
|
Land
|
1,145
|
|
1,163
|
|
|||
|
Buildings
|
3,276
|
|
3,260
|
|
|||
|
Building and leasehold improvements
|
3,266
|
|
3,116
|
|
|||
|
Plant equipment
|
7,649
|
|
7,221
|
|
|||
|
Technology equipment
|
1,608
|
|
1,569
|
|
|||
|
Equipment under operating leases
|
34
|
|
44
|
|
|||
|
Construction-in-progress
|
299
|
|
244
|
|
|||
|
40,620
|
|
39,151
|
|
||||
|
Less: Accumulated depreciation and amortization
|
(22,339
|
)
|
(21,190
|
)
|
|||
|
$
|
18,281
|
|
$
|
17,961
|
|
||
We continually monitor our aircraft fleet utilization in light of current and projected volume levels, aircraft fuel prices and other factors. Additionally, we monitor our other property, plant and equipment categories for any indicators that the carrying value of the assets may not be recoverable. No impairment charges on property, plant and equipment were recorded in
2014
,
2013
or
2012
.
We sponsor various retirement and pension plans, including defined benefit and defined contribution plans which cover our employees worldwide.
U.S. Pension Benefits
In the U.S. we maintain the following single-employer defined benefit pension plans: The UPS Retirement Plan, the UPS Pension Plan, the UPS IBT Pension Plan and the UPS Excess Coordinating Benefit Plan, a non-qualified plan.
The UPS Retirement Plan is noncontributory and includes substantially all eligible employees of participating domestic subsidiaries who are not members of a collective bargaining unit, as well as certain employees covered by a collective bargaining agreement. This plan generally provides for retirement benefits based on average compensation levels earned by employees prior to retirement. Benefits payable under this plan are subject to maximum compensation limits and the annual benefit limits for a tax-qualified defined benefit plan as prescribed by the Internal Revenue Service (“IRS”).
The UPS Excess Coordinating Benefit Plan is a non-qualified plan that provides benefits to certain participants in the UPS Retirement Plan for amounts that exceed the benefit limits described above.
The UPS Pension Plan is noncontributory and includes certain eligible employees of participating domestic subsidiaries and members of collective bargaining units that elect to participate in the plan. This plan generally provides for retirement benefits based on service credits earned by employees prior to retirement.
The UPS IBT Pension Plan is noncontributory and includes employees that were previously members of the Central States, Southeast and Southwest Areas Pension Fund (“Central States Pension Fund”), a multiemployer pension plan, in addition to other eligible employees who are covered under certain collective bargaining agreements. This plan generally provides for retirement benefits based on service credits earned by employees prior to retirement.
International Pension Benefits
We also sponsor various defined benefit plans covering certain of our international employees. The majority of our international obligations are for defined benefit plans in Canada and the United Kingdom. In addition, many of our international employees are covered by government-sponsored retirement and pension plans. We are not directly responsible for providing benefits to participants of government-sponsored plans.
73
UNITED PARCEL SERVICE, INC. AND SUBSIDIARIES
NOTES TO CONSOLIDATED FINANCIAL STATEMENTS
U.S. Postretirement Medical Benefits
We also sponsor postretirement medical plans in the U.S. that provide healthcare benefits to our retirees who meet certain eligibility requirements and who are not otherwise covered by multiemployer plans. Generally, this includes employees with at least
10
years of service who have reached age
55
and employees who are eligible for postretirement medical benefits from a Company-sponsored plan pursuant to collective bargaining agreements. We have the right to modify or terminate certain of these plans. These benefits have been provided to certain retirees on a noncontributory basis; however, in many cases, retirees are required to contribute all or a portion of the total cost of the coverage.
Defined Contribution Plans
We also sponsor several defined contribution plans for all employees not covered under collective bargaining agreements, and for certain employees covered under collective bargaining agreements. The Company matches, in shares of UPS common stock or cash, a portion of the participating employees’ contributions. Matching contributions charged to expense were $
95
, $
90
and $
83
million for
2014
,
2013
and
2012
, respectively.
Contributions are also made to defined contribution money purchase plans under certain collective bargaining agreements. Amounts charged to expense were $
82
, $
80
and $
80
million for
2014
,
2013
and
2012
, respectively.
Net Periodic Benefit Cost
Information about net periodic benefit cost for the company-sponsored pension and postretirement benefit plans is as follows (in millions):
|
|
U.S. Pension Benefits
|
U.S. Postretirement
Medical Benefits
|
International
Pension Benefits
|
||||||||||||||||||||||||||||||||
|
|
2014
|
2013
|
2012
|
2014
|
2013
|
2012
|
2014
|
2013
|
2012
|
||||||||||||||||||||||||||
|
Net Periodic Cost:
|
|||||||||||||||||||||||||||||||||||
|
Service cost
|
$
|
1,137
|
|
$
|
1,349
|
|
$
|
998
|
|
$
|
62
|
|
$
|
103
|
|
$
|
89
|
|
$
|
43
|
|
$
|
47
|
|
$
|
41
|
|
||||||||
|
Interest cost
|
1,604
|
|
1,449
|
|
1,410
|
|
152
|
|
185
|
|
208
|
|
49
|
|
44
|
|
41
|
|
|||||||||||||||||
|
Expected return on assets
|
(2,257
|
)
|
(2,147
|
)
|
(1,970
|
)
|
(25
|
)
|
(33
|
)
|
(18
|
)
|
(61
|
)
|
(55
|
)
|
(47
|
)
|
|||||||||||||||||
|
Amortization of:
|
|||||||||||||||||||||||||||||||||||
|
Transition obligation
|
—
|
|
—
|
|
—
|
|
—
|
|
—
|
|
—
|
|
—
|
|
—
|
|
—
|
|
|||||||||||||||||
|
Prior service cost
|
169
|
|
172
|
|
173
|
|
—
|
|
4
|
|
5
|
|
1
|
|
2
|
|
2
|
|
|||||||||||||||||
|
Actuarial (gain) loss
|
991
|
|
—
|
|
4,388
|
|
767
|
|
—
|
|
374
|
|
48
|
|
—
|
|
69
|
|
|||||||||||||||||
|
Curtailment and settlement loss
|
—
|
|
—
|
|
—
|
|
356
|
|
—
|
|
—
|
|
—
|
|
—
|
|
—
|
|
|||||||||||||||||
|
Other
|
—
|
|
—
|
|
—
|
|
—
|
|
—
|
|
—
|
|
4
|
|
(5
|
)
|
(10
|
)
|
|||||||||||||||||
|
Net periodic benefit cost
|
$
|
1,644
|
|
$
|
823
|
|
$
|
4,999
|
|
$
|
1,312
|
|
$
|
259
|
|
$
|
658
|
|
$
|
84
|
|
$
|
33
|
|
$
|
96
|
|
||||||||
The curtailment and settlement loss in 2014 for the U.S. postretirement medical benefit plans is discussed further in note 5 under the section entitled "Accounting Impact of Health and Welfare Plan Changes".
Actuarial Assumptions
The table below provides the weighted-average actuarial assumptions used to determine the net periodic benefit cost.
|
|
U.S. Pension Benefits
|
U.S. Postretirement
Medical Benefits
|
International
Pension Benefits
|
|||||||||||||||||||||||
|
|
2014
|
2013
|
2012
|
2014
|
2013
|
2012
|
2014
|
2013
|
2012
|
|||||||||||||||||
|
Discount rate
|
5.32
|
%
|
4.42
|
%
|
5.64
|
%
|
4.89
|
%
|
4.21
|
%
|
5.47
|
%
|
4.35
|
%
|
4.00
|
%
|
4.63
|
%
|
||||||||
|
Rate of compensation increase
|
4.29
|
%
|
4.16
|
%
|
4.50
|
%
|
N/A
|
|
N/A
|
|
N/A
|
|
3.22
|
%
|
3.03
|
%
|
3.58
|
%
|
||||||||
|
Expected return on assets
|
8.75
|
%
|
8.75
|
%
|
8.75
|
%
|
8.75
|
%
|
8.75
|
%
|
8.75
|
%
|
6.29
|
%
|
6.90
|
%
|
7.20
|
%
|
||||||||
74
UNITED PARCEL SERVICE, INC. AND SUBSIDIARIES
NOTES TO CONSOLIDATED FINANCIAL STATEMENTS
The table below provides the weighted-average actuarial assumptions used to determine the benefit obligations of our plans.
|
|
U.S. Pension Benefits
|
U.S. Postretirement
Medical Benefits
|
International
Pension Benefits
|
||||||||||||||
|
|
2014
|
2013
|
2014
|
2013
|
2014
|
2013
|
|||||||||||
|
Discount rate
|
4.40
|
%
|
5.32
|
%
|
4.18
|
%
|
5.14
|
%
|
3.56
|
%
|
4.40
|
%
|
|||||
|
Rate of compensation increase
|
4.29
|
%
|
4.29
|
%
|
N/A
|
|
N/A
|
|
3.08
|
%
|
3.30
|
%
|
|||||
A discount rate is used to determine the present value of our future benefit obligations. To determine our discount rate for our U.S. pension and postretirement benefit plans, we use a bond matching approach to select specific bonds that would satisfy our projected benefit payments. We believe the bond matching approach reflects the process we would employ to settle our pension and postretirement benefit obligations. For our international plans, the discount rate is determined by matching the expected cash flows of a sample plan of similar duration to a yield curve based on long-term, high quality fixed income debt instruments available as of the measurement date. These assumptions are updated each measurement date, which is typically annually.
As of
December 31, 2014
, the impact of each basis point change in the discount rate on the projected benefit obligation of the pension and postretirement medical benefit plans are as follows (in millions):
|
|
Increase (Decrease) in the Projected Benefit Obligation
|
||||||
|
|
Pension Benefits
|
Postretirement Medical Benefits
|
|||||
|
One basis point increase in discount rate
|
$
|
(65
|
)
|
$
|
(3
|
)
|
|
|
One basis point decrease in discount rate
|
$
|
69
|
|
$
|
3
|
|
|
The Society of Actuaries' ("SOA") published mortality tables and improvement scales are used in developing the best estimate of mortality for plans in the U.S. On October 27, 2014, the SOA published updated mortality tables and an updated improvement scale, both of which reflect longer anticipated lifetimes. Based on an evaluation of these new tables and our perspective of future longevity, we updated the mortality assumptions for purposes of measuring pension and other postretirement benefit obligations at
December 31, 2014
. The change to the mortality assumption increased the year-end pension and other postretirement benefit obligations by $
1.119
billion and $
51
million, respectively. At
December 31, 2014
, we also revised the retirement assumptions for non-union plan participants based on recent retirement experience. The change to the retirement assumption decreased the year-end pension and other postretirement benefit obligations by $
383
and $
234
million, respectively.
An assumption for the expected return on plan assets is used to determine a component of net periodic benefit cost for the fiscal year. This assumption for our U.S. plans was developed using a long-term projection of returns for each asset class, and taking into consideration our target asset allocation. The expected return for each asset class is a function of passive, long-term capital market assumptions and excess returns generated from active management. The capital market assumptions used are provided by independent investment advisors, while excess return assumptions are supported by historical performance, fund mandates and investment expectations. In addition, we compare the expected return on asset assumption with the average historical rate of return these plans have been able to generate.
For plans outside the U.S., consideration is given to local market expectations of long-term returns. Strategic asset allocations are determined by plan, based on the nature of liabilities and considering the demographic composition of the plan participants.
Healthcare cost trends are used to project future postretirement benefits payable from our plans. For year-end
2014
U.S. plan obligations, future postretirement medical benefit costs were forecasted assuming an initial annual increase of
7.0%
, decreasing to
4.5%
by the year
2020
and with consistent annual increases at those ultimate levels thereafter.
75
UNITED PARCEL SERVICE, INC. AND SUBSIDIARIES
NOTES TO CONSOLIDATED FINANCIAL STATEMENTS
Assumed healthcare cost trends can have a significant effect on the amounts reported for our postretirement medical plans. A one-percent change in assumed health care cost trend rates would have had the following effects on
2014
results (in millions):
|
1% Increase
|
1% Decrease
|
||||||
|
Effect on total of service cost and interest cost
|
$
|
4
|
|
$
|
(4
|
)
|
|
|
Effect on postretirement benefit obligation
|
$
|
89
|
|
$
|
(98
|
)
|
|
Funded Status
The following table discloses the funded status of our plans and the amounts recognized in our consolidated balance sheets as of
December 31
(in millions):
|
|
U.S. Pension Benefits
|
U.S. Postretirement
Medical Benefits
|
International
Pension Benefits
|
||||||||||||||||||||
|
|
2014
|
2013
|
2014
|
2013
|
2014
|
2013
|
|||||||||||||||||
|
Funded Status:
|
|||||||||||||||||||||||
|
Fair value of plan assets
|
$
|
28,828
|
|
$
|
26,224
|
|
$
|
259
|
|
$
|
355
|
|
$
|
1,042
|
|
$
|
931
|
|
|||||
|
Benefit obligation
|
(37,521
|
)
|
(29,508
|
)
|
(2,883
|
)
|
(4,046
|
)
|
(1,274
|
)
|
(1,076
|
)
|
|||||||||||
|
Funded status recognized at December 31
|
$
|
(8,693
|
)
|
$
|
(3,284
|
)
|
$
|
(2,624
|
)
|
$
|
(3,691
|
)
|
$
|
(232
|
)
|
$
|
(145
|
)
|
|||||
|
Funded Status Recognized in our Balance Sheet:
|
|||||||||||||||||||||||
|
Other non-current assets
|
$
|
—
|
|
$
|
—
|
|
$
|
—
|
|
$
|
—
|
|
$
|
25
|
|
$
|
47
|
|
|||||
|
Other current liabilities
|
(17
|
)
|
(16
|
)
|
(102
|
)
|
(97
|
)
|
(3
|
)
|
(3
|
)
|
|||||||||||
|
Pension and postretirement benefit obligations
|
(8,676
|
)
|
(3,268
|
)
|
(2,522
|
)
|
(3,594
|
)
|
(254
|
)
|
(189
|
)
|
|||||||||||
|
Net liability at December 31
|
$
|
(8,693
|
)
|
$
|
(3,284
|
)
|
$
|
(2,624
|
)
|
$
|
(3,691
|
)
|
$
|
(232
|
)
|
$
|
(145
|
)
|
|||||
|
Amounts Recognized in AOCI:
|
|||||||||||||||||||||||
|
Unrecognized net prior service cost
|
$
|
(1,122
|
)
|
$
|
(1,286
|
)
|
$
|
(32
|
)
|
$
|
(79
|
)
|
$
|
(7
|
)
|
$
|
(9
|
)
|
|||||
|
Unrecognized net actuarial gain (loss)
|
(3,752
|
)
|
1,233
|
|
(89
|
)
|
(29
|
)
|
(103
|
)
|
(7
|
)
|
|||||||||||
|
Gross unrecognized cost at December 31
|
(4,874
|
)
|
(53
|
)
|
(121
|
)
|
(108
|
)
|
(110
|
)
|
(16
|
)
|
|||||||||||
|
Deferred tax asset at December 31
|
1,833
|
|
20
|
|
45
|
|
41
|
|
29
|
|
2
|
|
|||||||||||
|
Net unrecognized cost at December 31
|
$
|
(3,041
|
)
|
$
|
(33
|
)
|
$
|
(76
|
)
|
$
|
(67
|
)
|
$
|
(81
|
)
|
$
|
(14
|
)
|
|||||
The accumulated benefit obligation for our pension plans as of the measurement dates in
2014
and
2013
was $
35.867
and $
28.586
billion, respectively.
Benefit payments under the pension plans include $
19
and $
16
million paid from employer assets in
2014
and
2013
, respectively. Benefit payments (net of participant contributions) under the postretirement medical benefit plans include $
122
and $
108
million paid from employer assets in
2014
and
2013
, respectively. Such benefit payments from employer assets are also categorized as employer contributions.
At
December 31, 2014
and
2013
, the projected benefit obligation, the accumulated benefit obligation, and the fair value of plan assets for pension plans with benefit obligations in excess of plan assets were as follows (in millions):
|
|
Projected Benefit Obligation
Exceeds the Fair Value of Plan Assets
|
Accumulated Benefit Obligation
Exceeds the Fair Value of Plan Assets
|
|||||||||||||
|
2014
|
2013
|
2014
|
2013
|
||||||||||||
|
U.S. Pension Benefits:
|
|||||||||||||||
|
Projected benefit obligation
|
$
|
37,521
|
|
$
|
29,508
|
|
$
|
37,521
|
|
$
|
29,508
|
|
|||
|
Accumulated benefit obligation
|
34,725
|
|
27,623
|
|
34,725
|
|
27,623
|
|
|||||||
|
Fair value of plan assets
|
28,828
|
|
26,224
|
|
28,828
|
|
26,224
|
|
|||||||
|
International Pension Benefits:
|
|||||||||||||||
|
Projected benefit obligation
|
$
|
510
|
|
$
|
764
|
|
$
|
474
|
|
$
|
361
|
|
|||
|
Accumulated benefit obligation
|
426
|
|
658
|
|
398
|
|
301
|
|
|||||||
|
Fair value of plan assets
|
261
|
|
580
|
|
232
|
|
184
|
|
|||||||
76
UNITED PARCEL SERVICE, INC. AND SUBSIDIARIES
NOTES TO CONSOLIDATED FINANCIAL STATEMENTS
The accumulated postretirement benefit obligation exceeds plan assets for all of our U.S. postretirement medical benefit plans.
Benefit Obligations and Fair Value of Plan Assets
The following table provides a reconciliation of the changes in the plans’ benefit obligations and fair value of plan assets as of the respective measurement dates in each year (in millions).
|
|
U.S. Pension Benefits
|
U.S. Postretirement
Medical Benefits
|
International
Pension
Benefits
|
||||||||||||||||||||
|
|
2014
|
2013
|
2014
|
2013
|
2014
|
2013
|
|||||||||||||||||
|
Benefit Obligations:
|
|||||||||||||||||||||||
|
Projected benefit obligation at beginning of year
|
$
|
29,508
|
|
$
|
31,868
|
|
$
|
4,046
|
|
$
|
4,412
|
|
$
|
1,076
|
|
$
|
1,089
|
|
|||||
|
Service cost
|
1,137
|
|
1,349
|
|
62
|
|
103
|
|
43
|
|
47
|
|
|||||||||||
|
Interest cost
|
1,604
|
|
1,449
|
|
152
|
|
185
|
|
49
|
|
44
|
|
|||||||||||
|
Gross benefits paid
|
(924
|
)
|
(813
|
)
|
(255
|
)
|
(258
|
)
|
(26
|
)
|
(21
|
)
|
|||||||||||
|
Plan participants’ contributions
|
—
|
|
—
|
|
15
|
|
17
|
|
5
|
|
4
|
|
|||||||||||
|
Plan amendments
|
5
|
|
140
|
|
65
|
|
4
|
|
—
|
|
—
|
|
|||||||||||
|
Actuarial (gain)/loss
|
6,191
|
|
(4,485
|
)
|
1,069
|
|
(417
|
)
|
194
|
|
(55
|
)
|
|||||||||||
|
Foreign currency exchange rate changes
|
—
|
|
—
|
|
—
|
|
—
|
|
(103
|
)
|
(26
|
)
|
|||||||||||
|
Curtailments and settlements
|
—
|
|
—
|
|
(2,271
|
)
|
—
|
|
(2
|
)
|
(6
|
)
|
|||||||||||
|
Other
|
—
|
|
—
|
|
—
|
|
—
|
|
38
|
|
—
|
|
|||||||||||
|
Projected benefit obligation at end of year
|
$
|
37,521
|
|
$
|
29,508
|
|
$
|
2,883
|
|
$
|
4,046
|
|
$
|
1,274
|
|
$
|
1,076
|
|
|||||
|
|
U.S. Pension Benefits
|
U.S. Postretirement
Medical Benefits
|
International
Pension
Benefits
|
||||||||||||||||||||
|
|
2014
|
2013
|
2014
|
2013
|
2014
|
2013
|
|||||||||||||||||
|
Fair Value of Plan Assets:
|
|||||||||||||||||||||||
|
Fair value of plan assets at beginning of year
|
$
|
26,224
|
|
$
|
24,941
|
|
$
|
355
|
|
$
|
460
|
|
$
|
931
|
|
$
|
801
|
|
|||||
|
Actual return on plan assets
|
2,471
|
|
2,082
|
|
22
|
|
28
|
|
106
|
|
81
|
|
|||||||||||
|
Employer contributions
|
1,057
|
|
14
|
|
122
|
|
108
|
|
79
|
|
90
|
|
|||||||||||
|
Plan participants’ contributions
|
—
|
|
—
|
|
15
|
|
17
|
|
3
|
|
1
|
|
|||||||||||
|
Gross benefits paid
|
(924
|
)
|
(813
|
)
|
(255
|
)
|
(258
|
)
|
(26
|
)
|
(21
|
)
|
|||||||||||
|
Foreign currency exchange rate changes
|
—
|
|
—
|
|
—
|
|
—
|
|
(79
|
)
|
(20
|
)
|
|||||||||||
|
Curtailments and settlements
|
—
|
|
—
|
|
—
|
|
—
|
|
(2
|
)
|
(1
|
)
|
|||||||||||
|
Other
|
—
|
|
—
|
|
—
|
|
—
|
|
30
|
|
—
|
|
|||||||||||
|
Fair value of plan assets at end of year
|
$
|
28,828
|
|
$
|
26,224
|
|
$
|
259
|
|
$
|
355
|
|
$
|
1,042
|
|
$
|
931
|
|
|||||
The curtailments and settlements amount in 2014 for the U.S. postretirement medical benefit plans is discussed further in note 5 under the section entitled "Accounting Impact of Health and Welfare Plan Changes".
Pension and Postretirement Plan Assets
The applicable benefit plan committees establish investment guidelines and strategies, and regularly monitor the performance of the funds and portfolio managers. Our investment guidelines address the following items: governance, general investment beliefs and principles, investment objectives, specific investment goals, process for determining/maintaining the asset allocation policy, long-term asset allocation, rebalancing, investment restrictions/prohibited transactions, portfolio manager structure and diversification (which addresses limits on the amount of investments held by any one manager to minimize risk), portfolio manager selection criteria, plan evaluation, portfolio manager performance review and evaluation, and risk management (including various measures used to evaluate risk tolerance).
77
UNITED PARCEL SERVICE, INC. AND SUBSIDIARIES
NOTES TO CONSOLIDATED FINANCIAL STATEMENTS
We invest pension assets in accordance with applicable laws and regulations. The long-term primary investment objectives for our pension assets are to: (1) provide for a reasonable amount of long-term growth of capital, with prudent exposure to risk; and protect the assets from erosion of purchasing power; (2) provide investment results that meet or exceed the plans’ expected long-term rate of return; and (3) match the duration of the liabilities and assets of the plans to reduce the potential risk of large employer contributions being necessary in the future. The plans strive to meet these objectives by employing portfolio managers to actively manage assets within the guidelines and strategies set forth by the benefit plan committees. These managers are evaluated by comparing their performance to applicable benchmarks.
Fair Value Measurements
Pension assets utilizing Level 1 inputs include equity investments, corporate debt instruments, and U.S. government securities. Fair values were determined by closing prices for those securities traded on national stock exchanges, while securities traded in the over-the-counter market and listed securities for which no sale was reported on the valuation date are valued at the mean between the last reported bid and asked prices.
Level 2 assets include certain bonds that are valued based on yields currently available on comparable securities of other issues with similar credit ratings, mortgage-backed securities that are valued based on cash flow and yield models using acceptable modeling and pricing conventions, and certain investments that are pooled with other investments held by the trustee in a commingled employee benefit trust fund. The investments in the commingled funds are valued by taking the percentage owned by the respective plan in the underlying net asset value of the trust fund, which was determined in accordance with the paragraph above.
Certain investments’ estimated fair value is based on unobservable inputs that are not corroborated by observable market data and are thus classified as Level 3. These investments include commingled funds comprised of corporate and government bonds, hedge funds, real estate investments and private equity funds. The fair values may, due to the inherent uncertainty of valuation for those alternative investments, differ significantly from the values that would have been used had a ready market for the alternative investments existed, and the differences could be material. These investments are described further below:
|
•
|
Hedge Funds:
We maintain plan assets invested in hedge funds that pursue multiple strategies to diversify risk and reduce volatility. Investments in hedge funds are valued using reported net asset values as of
December 31
. These assets are primarily invested in a portfolio of diversified, direct investments and funds of hedge funds. Most of these funds allow redemptions either quarterly or semi-annually after a two to three month notice period, while other funds allow for redemption after only a brief notification period with no restriction on redemption frequency. At
December 31, 2014
, unfunded commitments to these hedge funds totaling approximately $
90
million are expected to be contributed over the remaining investment period, typically ranging between three and six years.
|
|
•
|
Risk Parity Funds:
We maintain plan assets invested in risk parity strategies in order to provide diversification and balance risk / return objectives. Investments in risk parity funds are valued using reported net asset values as of
December 31
. These strategies reflect a multi-asset class balanced risk approach generally consisting of equity, interest rates, credit, and commodities. These funds allow for monthly redemptions with only a brief notification period. No unfunded commitments existed with respect to these hedge funds as of
December 31, 2014
.
|
|
•
|
Real Estate and Private Equity Funds:
We maintain plan assets invested in limited partnership interests in various private equity and real estate funds. These private equity and real estate investment funds are valued using fair values per the most recent partnership audited financial reports, adjusted as appropriate for any lag between the date of the financial reports and
December 31
. The real estate investments consist of U.S. and non-U.S. real estate investments and are broadly diversified. Limited provision exists for the redemption of these interests by the general partners that invest in these funds until the end of the term of the partnerships, typically ranging between
10
and
15
years from the date of inception. An active secondary market exists for similar partnership interests, although no particular value (discount or premium) can be guaranteed. At
December 31, 2014
, unfunded commitments to such limited partnerships totaling approximately $
1.01
billion are expected to be contributed over the remaining investment period, typically ranging between three and six years.
|
78
UNITED PARCEL SERVICE, INC. AND SUBSIDIARIES
NOTES TO CONSOLIDATED FINANCIAL STATEMENTS
The fair values of U.S. and international pension and postretirement benefit plan assets by asset category as of
December 31, 2014
are presented below (in millions), as well as the percentage that each category comprises of our total plan assets and the respective target allocations.
|
Level 1
|
Level 2
|
Level 3
|
Total
Assets
|
Percentage of
Plan Assets -
2014
|
Target
Allocation
2014
|
|||||||||||||||
|
Asset Category (U.S. Plans):
|
||||||||||||||||||||
|
Cash and cash equivalents
|
$
|
744
|
|
$
|
1,028
|
|
$
|
—
|
|
$
|
1,772
|
|
6.1
|
%
|
0-5
|
|||||
|
Equity Securities:
|
||||||||||||||||||||
|
U.S. Large Cap
|
2,066
|
|
2,082
|
|
—
|
|
4,148
|
|
||||||||||||
|
U.S. Small Cap
|
322
|
|
44
|
|
—
|
|
366
|
|
||||||||||||
|
Emerging Markets
|
1,270
|
|
116
|
|
—
|
|
1,386
|
|
||||||||||||
|
Global Equity
|
2,788
|
|
—
|
|
—
|
|
2,788
|
|
||||||||||||
|
International Equity
|
1,154
|
|
792
|
|
—
|
|
1,946
|
|
||||||||||||
|
Total Equity Securities
|
7,600
|
|
3,034
|
|
—
|
|
10,634
|
|
36.6
|
|
35-55
|
|||||||||
|
Fixed Income Securities:
|
||||||||||||||||||||
|
U.S. Government Securities
|
4,541
|
|
239
|
|
—
|
|
4,780
|
|
||||||||||||
|
Corporate Bonds
|
6
|
|
2,921
|
|
269
|
|
3,196
|
|
||||||||||||
|
Global Bonds
|
—
|
|
159
|
|
613
|
|
772
|
|
||||||||||||
|
Municipal Bonds
|
—
|
|
100
|
|
—
|
|
100
|
|
||||||||||||
|
Total Fixed Income Securities
|
4,547
|
|
3,419
|
|
882
|
|
8,848
|
|
30.4
|
|
25-35
|
|||||||||
|
Other Investments:
|
||||||||||||||||||||
|
Hedge Funds
|
—
|
|
—
|
|
3,595
|
|
3,595
|
|
12.4
|
|
5-15
|
|||||||||
|
Private Equity
|
—
|
|
—
|
|
1,323
|
|
1,323
|
|
4.5
|
|
1-10
|
|||||||||
|
Real Estate
|
412
|
|
47
|
|
1,307
|
|
1,766
|
|
6.1
|
|
1-10
|
|||||||||
|
Structured Products
(1)
|
—
|
|
332
|
|
—
|
|
332
|
|
1.1
|
|
0-5
|
|||||||||
|
Risk Parity Funds
|
—
|
|
—
|
|
817
|
|
817
|
|
2.8
|
|
1-10
|
|||||||||
|
Total U.S. Plan Assets
|
$
|
13,303
|
|
$
|
7,860
|
|
$
|
7,924
|
|
$
|
29,087
|
|
100.0
|
%
|
||||||
|
Asset Category (International Plans):
|
||||||||||||||||||||
|
Cash and cash equivalents
|
$
|
6
|
|
$
|
26
|
|
$
|
—
|
|
32
|
|
3.1
|
|
0-5
|
||||||
|
Equity Securities:
|
||||||||||||||||||||
|
Local Markets Equity
|
145
|
|
105
|
|
—
|
|
250
|
|
||||||||||||
|
U.S. Equity
|
17
|
|
—
|
|
—
|
|
17
|
|
||||||||||||
|
Emerging Markets
|
19
|
|
—
|
|
—
|
|
19
|
|
||||||||||||
|
International / Global Equity
|
82
|
|
95
|
|
—
|
|
177
|
|
||||||||||||
|
Total Equity Securities
|
263
|
|
200
|
|
—
|
|
463
|
|
44.3
|
|
50-65
|
|||||||||
|
Fixed Income Securities:
|
||||||||||||||||||||
|
Local Government Bonds
|
78
|
|
—
|
|
—
|
|
78
|
|
||||||||||||
|
Corporate Bonds
|
55
|
|
94
|
|
—
|
|
149
|
|
||||||||||||
|
Total Fixed Income Securities
|
133
|
|
94
|
|
—
|
|
227
|
|
21.8
|
|
15-35
|
|||||||||
|
Other Investments:
|
||||||||||||||||||||
|
Real Estate
|
—
|
|
108
|
|
—
|
|
108
|
|
10.4
|
|
0-17
|
|||||||||
|
Other
|
—
|
|
159
|
|
53
|
|
212
|
|
20.4
|
|
0-20
|
|||||||||
|
Total International Plan Assets
|
$
|
402
|
|
$
|
587
|
|
$
|
53
|
|
$
|
1,042
|
|
100.0
|
%
|
||||||
|
Total Plan Assets
|
$
|
13,705
|
|
$
|
8,447
|
|
$
|
7,977
|
|
$
|
30,129
|
|
||||||||
(1)
Represents mortgage and asset-backed securities.
79
UNITED PARCEL SERVICE, INC. AND SUBSIDIARIES
NOTES TO CONSOLIDATED FINANCIAL STATEMENTS
The fair values of U.S. and international pension and postretirement benefit plan assets by asset category as of
December 31, 2013
are presented below (in millions), as well as the percentage that each category comprises of our total plan assets and the respective target allocations.
|
Level 1
|
Level 2
|
Level 3
|
Total
Assets
|
Percentage of
Plan Assets -
2013
|
Target
Allocation
2013
|
|||||||||||||||
|
Asset Category (U.S. Plans):
|
||||||||||||||||||||
|
Cash and cash equivalents
|
$
|
112
|
|
$
|
514
|
|
$
|
—
|
|
$
|
626
|
|
2.3
|
%
|
0-5
|
|||||
|
Equity Securities:
|
||||||||||||||||||||
|
U.S. Large Cap
|
2,264
|
|
1,948
|
|
—
|
|
4,212
|
|
||||||||||||
|
U.S. Small Cap
|
457
|
|
50
|
|
—
|
|
507
|
|
||||||||||||
|
Emerging Markets
|
1,247
|
|
120
|
|
—
|
|
1,367
|
|
||||||||||||
|
Global Equity
|
2,154
|
|
—
|
|
—
|
|
2,154
|
|
||||||||||||
|
International Equity
|
1,397
|
|
825
|
|
—
|
|
2,222
|
|
||||||||||||
|
Total Equity Securities
|
7,519
|
|
2,943
|
|
—
|
|
10,462
|
|
39.4
|
|
25-55
|
|||||||||
|
Fixed Income Securities:
|
||||||||||||||||||||
|
U.S. Government Securities
|
3,746
|
|
615
|
|
—
|
|
4,361
|
|
||||||||||||
|
Corporate Bonds
|
7
|
|
2,550
|
|
223
|
|
2,780
|
|
||||||||||||
|
Global Bonds
|
—
|
|
681
|
|
—
|
|
681
|
|
||||||||||||
|
Municipal Bonds
|
—
|
|
55
|
|
—
|
|
55
|
|
||||||||||||
|
Total Fixed Income Securities
|
3,753
|
|
3,901
|
|
223
|
|
7,877
|
|
29.6
|
|
15-35
|
|||||||||
|
Other Investments:
|
||||||||||||||||||||
|
Hedge Funds
|
—
|
|
—
|
|
3,738
|
|
3,738
|
|
14.1
|
|
8-15
|
|||||||||
|
Private Equity
|
—
|
|
—
|
|
1,397
|
|
1,397
|
|
5.3
|
|
3-10
|
|||||||||
|
Real Estate
|
285
|
|
21
|
|
1,091
|
|
1,397
|
|
5.3
|
|
3-10
|
|||||||||
|
Structured Products
(1)
|
—
|
|
326
|
|
—
|
|
326
|
|
1.2
|
|
0-5
|
|||||||||
|
Risk Parity Funds
|
—
|
|
—
|
|
756
|
|
756
|
|
2.8
|
|
1-10
|
|||||||||
|
Total U.S. Plan Assets
|
$
|
11,669
|
|
$
|
7,705
|
|
$
|
7,205
|
|
$
|
26,579
|
|
100.0
|
%
|
||||||
|
Asset Category (International Plans):
|
||||||||||||||||||||
|
Cash and cash equivalents
|
$
|
11
|
|
$
|
17
|
|
$
|
—
|
|
28
|
|
3.0
|
|
0-5
|
||||||
|
Equity Securities:
|
||||||||||||||||||||
|
Local Markets Equity
|
122
|
|
97
|
|
—
|
|
219
|
|
||||||||||||
|
U.S. Equity
|
17
|
|
—
|
|
—
|
|
17
|
|
||||||||||||
|
Emerging Markets
|
19
|
|
—
|
|
—
|
|
19
|
|
||||||||||||
|
International / Global Equity
|
88
|
|
79
|
|
—
|
|
167
|
|
||||||||||||
|
Total Equity Securities
|
246
|
|
176
|
|
—
|
|
422
|
|
45.3
|
|
50-65
|
|||||||||
|
Fixed Income Securities:
|
||||||||||||||||||||
|
Local Government Bonds
|
68
|
|
—
|
|
—
|
|
68
|
|
||||||||||||
|
Corporate Bonds
|
86
|
|
85
|
|
—
|
|
171
|
|
||||||||||||
|
Total Fixed Income Securities
|
154
|
|
85
|
|
—
|
|
239
|
|
25.7
|
|
15-35
|
|||||||||
|
Other Investments:
|
||||||||||||||||||||
|
Real Estate
|
—
|
|
63
|
|
—
|
|
63
|
|
6.8
|
|
0-17
|
|||||||||
|
Other
|
—
|
|
124
|
|
55
|
|
179
|
|
19.2
|
|
0-20
|
|||||||||
|
Total International Plan Assets
|
$
|
411
|
|
$
|
465
|
|
$
|
55
|
|
$
|
931
|
|
100.0
|
%
|
||||||
|
Total Plan Assets
|
$
|
12,080
|
|
$
|
8,170
|
|
$
|
7,260
|
|
$
|
27,510
|
|
||||||||
(1)
Represents mortgage and asset-backed securities.
80
UNITED PARCEL SERVICE, INC. AND SUBSIDIARIES
NOTES TO CONSOLIDATED FINANCIAL STATEMENTS
The following table presents the changes in the Level 3 instruments measured on a recurring basis for the years ended
December 31, 2014
and
2013
(in millions).
|
Corporate
Bonds
|
Hedge
Funds
|
Real
Estate
|
Private
Equity
|
Global Bonds
|
Risk Parity Funds
|
Other
|
Total
|
||||||||||||||||||||||||
|
Balance on January 1, 2013
|
$
|
138
|
|
$
|
2,829
|
|
$
|
1,039
|
|
$
|
1,416
|
|
$
|
—
|
|
$
|
1,362
|
|
$
|
49
|
|
$
|
6,833
|
|
|||||||
|
Actual Return on Assets:
|
—
|
|
|||||||||||||||||||||||||||||
|
Assets Held at End of Year
|
(1
|
)
|
229
|
|
81
|
|
71
|
|
—
|
|
(99
|
)
|
6
|
|
287
|
|
|||||||||||||||
|
Assets Sold During the Year
|
—
|
|
5
|
|
54
|
|
153
|
|
—
|
|
54
|
|
—
|
|
266
|
|
|||||||||||||||
|
Purchases
|
165
|
|
1,676
|
|
145
|
|
143
|
|
—
|
|
1
|
|
—
|
|
2,130
|
|
|||||||||||||||
|
Sales
|
(79
|
)
|
(1,001
|
)
|
(228
|
)
|
(386
|
)
|
—
|
|
(562
|
)
|
—
|
|
(2,256
|
)
|
|||||||||||||||
|
Transfers Into (Out of) Level 3
|
—
|
|
—
|
|
—
|
|
—
|
|
—
|
|
—
|
|
—
|
|
—
|
|
|||||||||||||||
|
Balance on December 31, 2013
|
$
|
223
|
|
$
|
3,738
|
|
$
|
1,091
|
|
$
|
1,397
|
|
$
|
—
|
|
$
|
756
|
|
$
|
55
|
|
$
|
7,260
|
|
|||||||
|
Actual Return on Assets:
|
|||||||||||||||||||||||||||||||
|
Assets Held at End of Year
|
—
|
|
71
|
|
104
|
|
11
|
|
—
|
|
61
|
|
(2
|
)
|
245
|
|
|||||||||||||||
|
Assets Sold During the Year
|
—
|
|
(9
|
)
|
23
|
|
126
|
|
—
|
|
—
|
|
—
|
|
140
|
|
|||||||||||||||
|
Purchases
|
108
|
|
1,043
|
|
350
|
|
166
|
|
735
|
|
—
|
|
—
|
|
2,402
|
|
|||||||||||||||
|
Sales
|
(62
|
)
|
(1,248
|
)
|
(261
|
)
|
(377
|
)
|
(122
|
)
|
—
|
|
—
|
|
(2,070
|
)
|
|||||||||||||||
|
Transfers Into (Out of) Level 3
|
—
|
|
—
|
|
—
|
|
—
|
|
—
|
|
—
|
|
—
|
|
—
|
|
|||||||||||||||
|
Balance on December 31, 2014
|
$
|
269
|
|
$
|
3,595
|
|
$
|
1,307
|
|
$
|
1,323
|
|
$
|
613
|
|
$
|
817
|
|
$
|
53
|
|
$
|
7,977
|
|
|||||||
There were no UPS class A or B shares of common stock directly held in plan assets as of
December 31, 2014
or
December 31, 2013
.
Accumulated Other Comprehensive Income
The estimated amounts of prior service cost in AOCI expected to be amortized and recognized as a component of net periodic benefit cost in
2015
are as follows (in millions):
|
U.S. Pension Benefits
|
U.S. Postretirement
Medical Benefits
|
International Pension
Benefits
|
|||||||||
|
Prior service cost / (benefit)
|
$
|
168
|
|
$
|
5
|
|
$
|
1
|
|
||
Expected Cash Flows
Information about expected cash flows for the pension and postretirement benefit plans is as follows (in millions):
|
U.S.
Pension Benefits
|
U.S. Postretirement
Medical Benefits
|
International Pension
Benefits
|
|||||||||
|
Expected Employer Contributions:
|
|||||||||||
|
2015 to plan trusts
|
$
|
1,030
|
|
$
|
—
|
|
$
|
69
|
|
||
|
2015 to plan participants
|
17
|
|
104
|
|
4
|
|
|||||
|
Expected Benefit Payments:
|
|||||||||||
|
2015
|
$
|
960
|
|
$
|
245
|
|
$
|
26
|
|
||
|
2016
|
1,052
|
|
238
|
|
25
|
|
|||||
|
2017
|
1,151
|
|
236
|
|
28
|
|
|||||
|
2018
|
1,262
|
|
231
|
|
30
|
|
|||||
|
2019
|
1,382
|
|
230
|
|
33
|
|
|||||
|
2020 - 2024
|
9,013
|
|
1,034
|
|
214
|
|
|||||
Our funding policy for U.S. plans is to contribute amounts annually that are at least equal to the amounts required by applicable laws and regulations, or to directly fund payments to plan participants, as applicable. International plans will be funded in accordance with local regulations. Additional discretionary contributions may be made when deemed appropriate to meet the long-term obligations of the plans. Expected benefit payments for pensions will be primarily paid from plan trusts. Expected benefit payments for postretirement medical benefits will be paid from plan trusts and corporate assets.
81
UNITED PARCEL SERVICE, INC. AND SUBSIDIARIES
NOTES TO CONSOLIDATED FINANCIAL STATEMENTS
We contribute to a number of multiemployer defined benefit plans under the terms of collective bargaining agreements that cover our union-represented employees. These plans generally provide for retirement, death and/or termination benefits for eligible employees within the applicable collective bargaining units, based on specific eligibility/participation requirements, vesting periods and benefit formulas. The risks of participating in these multiemployer plans are different from single-employer plans in the following aspects:
|
•
|
Assets contributed to a multiemployer plan by one employer may be used to provide benefits to employees of other participating employers.
|
|
•
|
If we negotiate to cease participating in a multiemployer plan, we may be required to pay that plan an amount based on our allocable share of its underfunded status, referred to as a "withdrawal liability". However, cessation of participation in a multiemployer plan and subsequent payment of any withdrawal liability is subject to the collective bargaining process.
|
|
•
|
If any of the multiemployer pension plans in which we participate enter critical status, and our contributions are not sufficient to satisfy any rehabilitation plan funding schedule, we could be required under the Pension Protection Act of 2006 to make additional surcharge contributions to the multiemployer pension plan in the amount of five to ten percent of the existing contributions required by our labor agreement. Such surcharges would cease upon the ratification of a new collective bargaining agreement, and could not recur unless a plan re-entered critical status at a later date.
|
The discussion that follows sets forth the financial impact on our results of operations and cash flows for the years ended
December 31, 2014
,
2013
and
2012
from our participation in multiemployer benefit plans. As part of the overall collective bargaining process for wage and benefit levels, we have agreed to contribute certain amounts to the multiemployer benefit plans during the contract period. The multiemployer benefit plans set benefit levels and are responsible for benefit delivery to participants. Future contribution amounts to multiemployer benefit plans are determined only through collective bargaining, and we have no additional legal or constructive obligation to increase contributions beyond the agreed-upon amounts (except potential surcharges under the Pension Protection Act of 2006 as described above).
The number of employees covered by our multiemployer health and welfare plans increased during 2014, affecting the comparability of contributions with prior years, as a result of provisions of the new collective bargaining agreement with the International Brotherhood of Teamsters (“Teamsters”) discussed below. The number of employees covered by our multiemployer pension plans has remained consistent over the past three years, and there have been no significant changes that affect the comparability of
2014
,
2013
and
2012
contributions. We recognize expense for the contractually-required contribution for each period, and we recognize a liability for any contributions due and unpaid at the end of a reporting period.
Status of Collective Bargaining Agreements
As of
December 31, 2014
, we had approximately
270,000
employees employed under a national master agreement and various supplemental agreements with local unions affiliated with the Teamsters. During
2014
, the Teamsters ratified a new national master agreement (“NMA”) with UPS that will expire on July 31, 2018. The economic provisions in the NMA included wage rate increases, as well as increased contribution rates for healthcare and pension benefits. Most of these economic provisions were retroactive to August 1, 2013, which was the effective date of the NMA. In the second quarter of
2014
, we remitted $
278
million for these retroactive economic benefits; this payment had an immaterial impact on net income, as these retroactive economic benefits had been accrued since the July 31, 2013 expiration of the prior agreement.
In addition to the retroactive economic provisions of the NMA, there were certain changes to the delivery of healthcare benefits that were effective at various dates. These changes impact approximately
36,000
full-time and
73,000
part-time active employees covered by the NMA and the UPS Freight collective bargaining agreement (collectively referred to as the “NMA Group”), as well as approximately
16,000
employees covered by other collective bargaining agreements (the “Non-NMA Group”). These provisions are discussed further below in the "Changes to the Delivery of Active and Postretirement Healthcare Benefits" section.
We have approximately
2,600
pilots who are employed under a collective bargaining agreement with the Independent Pilots Association ("IPA"), which became amendable at the end of 2011. In February 2014, UPS and the IPA requested and have received mediation by the National Mediation Board for the ongoing contract negotiations.
Our airline mechanics are covered by a collective bargaining agreement with Teamsters Local 2727, which became amendable November 1, 2013. In addition, approximately
3,100
of our auto and maintenance mechanics who are not employed under agreements with the Teamsters are employed under collective bargaining agreements with the International Association of Machinists and Aerospace Workers (“IAM”). In 2014, the IAM ratified new collective bargaining agreements that will expire on July 31, 2019.
82
UNITED PARCEL SERVICE, INC. AND SUBSIDIARIES
NOTES TO CONSOLIDATED FINANCIAL STATEMENTS
Multiemployer Pension Plans
The following table outlines our participation in multiemployer pension plans for the periods ended
December 31, 2014
,
2013
and
2012
, and sets forth our calendar year contributions accrued for each plan. The “EIN/Pension Plan Number” column provides the Employer Identification Number (“EIN”) and the three-digit plan number. The most recent Pension Protection Act zone status available in
2014
and
2013
relates to the plans’ two most recent fiscal year-ends. The zone status is based on information that we received from the plans’ administrators and is certified by each plan’s actuary. Among other factors, plans certified in the red zone are generally less than
65%
funded, plans certified in the orange zone are both less than
80%
funded and have an accumulated funding deficiency or are expected to have a deficiency in any of the next
six
plan years, plans certified in the yellow zone are less than
80%
funded, and plans certified in the green zone are at least
80%
funded. The “FIP/RP Status Pending/Implemented” column indicates whether a financial improvement plan (“FIP”) for yellow/orange zone plans, or a rehabilitation plan (“RP”) for red zone plans, is either pending or has been implemented. As of
December 31, 2014
, all plans that have either a FIP or RP requirement have had the respective FIP or RP implemented.
Our collectively-bargained contributions satisfy the requirements of all implemented FIPs and RPs and do not currently require the payment of any surcharges. In addition, minimum contributions outside of the agreed upon contractual rate are not required. For the plans detailed in the following table, the expiration date of the associated collective bargaining agreements was
July 31, 2018
, with the exception of the Automotive Industries Pension Plan and the IAM National Pension Fund / National Pension Plan which both have a
July 31, 2019
expiration date. For all plans detailed in the following table, we provided more than
5%
of the total plan contributions from all employers for
2014
,
2013
and
2012
(as disclosed in the Form 5500 for each respective plan).
Certain plans have been aggregated in the “all other multiemployer pension plans” line in the following table, as the contributions to each of these individual plans were not material.
|
|
EIN / Pension
Plan
|
Pension
Protection Act
Zone Status
|
FIP/RP Status
Pending/
|
(in millions)
UPS Contributions and Accruals
|
Surcharge
|
||||||||||||||||
|
Pension Fund
|
Number
|
2014
|
2013
|
Implemented
|
2014
|
2013
|
2012
|
Imposed
|
|||||||||||||
|
Alaska Teamster-Employer Pension Plan
|
92-6003463-024
|
Red
|
Red
|
Yes/Implemented
|
$
|
5
|
|
$
|
5
|
|
$
|
4
|
|
No
|
|||||||
|
Automotive Industries Pension Plan
|
94-1133245-001
|
Red
|
Red
|
Yes/Implemented
|
5
|
|
4
|
|
4
|
|
No
|
||||||||||
|
Central Pennsylvania Teamsters Defined Benefit Plan
|
23-6262789-001
|
Green
|
Green
|
No
|
33
|
|
30
|
|
29
|
|
No
|
||||||||||
|
Employer-Teamsters Local Nos. 175 & 505 Pension Trust Fund
|
55-6021850-001
|
Red
|
Green
|
Yes/Implemented
|
10
|
|
9
|
|
9
|
|
No
|
||||||||||
|
Hagerstown Motor Carriers and Teamsters Pension Fund
|
52-6045424-001
|
Red
|
Red
|
Yes/Implemented
|
6
|
|
5
|
|
5
|
|
No
|
||||||||||
|
I.A.M. National Pension Fund / National Pension Plan
|
51-6031295-002
|
Green
|
Green
|
No
|
27
|
|
27
|
|
24
|
|
No
|
||||||||||
|
International Brotherhood of Teamsters Union Local No. 710 Pension Fund
|
36-2377656-001
|
Green
|
Green
|
No
|
89
|
|
88
|
|
75
|
|
No
|
||||||||||
|
Local 705, International Brotherhood of Teamsters Pension Plan
|
36-6492502-001
|
Red
|
Red
|
Yes/Implemented
|
69
|
|
68
|
|
46
|
|
No
|
||||||||||
|
Local 804 I.B.T. & Local 447 I.A.M.—UPS Multiemployer Retirement Plan
|
51-6117726-001
|
Red
|
Red
|
Yes/Implemented
|
92
|
|
88
|
|
87
|
|
No
|
||||||||||
|
Milwaukee Drivers Pension Trust Fund
|
39-6045229-001
|
Green
|
Green
|
No
|
32
|
|
29
|
|
26
|
|
No
|
||||||||||
|
New England Teamsters & Trucking Industry Pension Fund
|
04-6372430-001
|
Red
|
Red
|
Yes/Implemented
|
108
|
|
102
|
|
124
|
|
No
|
||||||||||
|
New York State Teamsters Conference Pension and Retirement Fund
|
16-6063585-074
|
Red
|
Red
|
Yes/Implemented
|
81
|
|
72
|
|
65
|
|
No
|
||||||||||
|
Teamster Pension Fund of Philadelphia and Vicinity
|
23-1511735-001
|
Yellow
|
Yellow
|
Yes/Implemented
|
50
|
|
46
|
|
44
|
|
No
|
||||||||||
|
Teamsters Joint Council No. 83 of Virginia Pension Fund
|
54-6097996-001
|
Yellow
|
Yellow
|
Yes/Implemented
|
52
|
|
49
|
|
44
|
|
No
|
||||||||||
|
Teamsters Local 639—Employers Pension Trust
|
53-0237142-001
|
Green
|
Green
|
No
|
45
|
|
41
|
|
36
|
|
No
|
||||||||||
|
Teamsters Negotiated Pension Plan
|
43-6196083-001
|
Yellow
|
Yellow
|
Yes/Implemented
|
27
|
|
26
|
|
24
|
|
No
|
||||||||||
|
Truck Drivers and Helpers Local Union No. 355 Retirement Pension Plan
|
52-6043608-001
|
Yellow
|
Yellow
|
Yes/Implemented
|
16
|
|
14
|
|
14
|
|
No
|
||||||||||
|
United Parcel Service, Inc.—Local 177, I.B.T. Multiemployer Retirement Plan
|
13-1426500-419
|
Red
|
Red
|
Yes/Implemented
|
85
|
|
68
|
|
62
|
|
No
|
||||||||||
|
Western Conference of Teamsters Pension Plan
|
91-6145047-001
|
Green
|
Green
|
No
|
604
|
|
553
|
|
520
|
|
No
|
||||||||||
|
Western Pennsylvania Teamsters and Employers Pension Fund
|
25-6029946-001
|
Red
|
Red
|
Yes/Implemented
|
24
|
|
23
|
|
24
|
|
No
|
||||||||||
|
All Other Multiemployer Pension Plans
|
57
|
|
49
|
|
59
|
|
|||||||||||||||
|
Total Contributions
|
$
|
1,517
|
|
$
|
1,396
|
|
$
|
1,325
|
|
||||||||||||
83
UNITED PARCEL SERVICE, INC. AND SUBSIDIARIES
NOTES TO CONSOLIDATED FINANCIAL STATEMENTS
Agreement with the New England Teamsters and Trucking Industry Pension Fund
In 2012, we reached an agreement with the New England Teamsters and Trucking Industry Pension Fund ("NETTI Fund"), a multiemployer pension plan in which UPS is a participant, to restructure the pension liabilities for approximately
10,200
UPS employees represented by the Teamsters. The agreement reflected a decision by the NETTI Fund's trustees to restructure the NETTI Fund through plan amendments to utilize a "two pool approach", which effectively subdivided the plan assets and liabilities between
two
groups of beneficiaries. As part of this agreement, UPS agreed to withdraw from the original pool of the NETTI Fund, of which it had historically been a participant, and reenter the NETTI Fund's newly-established pool as a new employer.
Upon ratification of the agreement by the Teamsters in September 2012, we withdrew from the original pool of the NETTI Fund and incurred an undiscounted withdrawal liability of
$2.162 billion
to be paid in equal monthly installments over
50
years. The undiscounted withdrawal liability was calculated by independent actuaries employed by the NETTI Fund, in accordance with the governing plan documents and the applicable requirements of the Employee Retirement Income Security Act of 1974. In 2012, we recorded a charge to expense to establish an
$896 million
withdrawal liability on our consolidated balance sheet, which represents the present value of the
$2.162 billion
future payment obligation discounted at a
4.25%
interest rate. This discount rate represents the estimated credit-adjusted market rate of interest at which we could obtain financing of a similar maturity and seniority. As this agreement is not a contribution to the plan, the amounts reflected in the previous table do not include this
$896 million
non-cash transaction.
The
$896 million
charge to expense recorded in 2012 is included in "compensation and benefits" expense in the statements of consolidated income. We impute interest on the withdrawal liability using the
4.25%
discount rate, while the monthly payments made to the NETTI Fund reduce the remaining balance of the withdrawal liability.
Our status in the newly-established pool of the NETTI Fund is accounted for as the participation in a new multiemployer pension plan, and therefore we recognize expense based on the contractually-required contribution for each period, and we recognize a liability for any contributions due and unpaid at the end of a reporting period.
As of December 31, 2014 and 2013, we had $
878
and $
884
million, respectively, recognized in "other non-current liabilities" on our consolidated balance sheets representing the remaining balance of the NETTI withdrawal liability. Based on the borrowing rates currently available to the Company for long-term financing of a similar maturity, the fair value of the NETTI withdrawal liability as of
December 31, 2014
and
2013
was $
913
and
$783 million
. We utilized Level 2 inputs in the fair value hierarchy of valuation techniques to determine the fair value of this liability.
84
UNITED PARCEL SERVICE, INC. AND SUBSIDIARIES
NOTES TO CONSOLIDATED FINANCIAL STATEMENTS
Multiemployer Health and Welfare Plans
We also contribute to several multiemployer health and welfare plans that cover both active and retired employees. Health care benefits are provided to participants who meet certain eligibility requirements as covered under the applicable collective bargaining unit. The following table sets forth our calendar year plan contributions and accruals. Certain plans have been aggregated in the “all other multiemployer health and welfare plans” line in the table, as the contributions to each of these individual plans are not material.
|
|
(in millions)
UPS Contributions and Accruals
|
||||||||||
|
Health and Welfare Fund
|
2014
|
2013
|
2012
|
||||||||
|
Central States, South East & South West Areas Health and Welfare Fund
|
$
|
1,306
|
|
$
|
505
|
|
$
|
471
|
|
||
|
Teamsters Western Region & Local 177 Health Care Plan
|
239
|
|
—
|
|
—
|
|
|||||
|
Health & Welfare Insurance Fund Teamsters Local 653
|
5
|
|
—
|
|
—
|
|
|||||
|
Bay Area Delivery Drivers
|
32
|
|
29
|
|
28
|
|
|||||
|
Central Pennsylvania Teamsters Health & Pension Fund
|
21
|
|
20
|
|
19
|
|
|||||
|
Delta Health Systems—East Bay Drayage Drivers
|
24
|
|
24
|
|
24
|
|
|||||
|
Employer—Teamster Local Nos. 175 & 505
|
9
|
|
9
|
|
8
|
|
|||||
|
Joint Council #83 Health & Welfare Fund
|
26
|
|
24
|
|
25
|
|
|||||
|
Local 191 Teamsters Health Fund
|
11
|
|
9
|
|
9
|
|
|||||
|
Local 401 Teamsters Health & Welfare Fund
|
7
|
|
6
|
|
6
|
|
|||||
|
Local 804 Welfare Trust Fund
|
70
|
|
67
|
|
62
|
|
|||||
|
Milwaukee Drivers Pension Trust Fund—Milwaukee Drivers Health and Welfare Trust Fund
|
32
|
|
31
|
|
29
|
|
|||||
|
Montana Teamster Employers Trust
|
7
|
|
6
|
|
6
|
|
|||||
|
New York State Teamsters Health & Hospital Fund
|
51
|
|
46
|
|
44
|
|
|||||
|
North Coast Benefit Trust
|
9
|
|
8
|
|
7
|
|
|||||
|
Northern California General Teamsters (DELTA)
|
96
|
|
84
|
|
75
|
|
|||||
|
Northern New England Benefit Trust
|
39
|
|
35
|
|
33
|
|
|||||
|
Oregon / Teamster Employers Trust
|
29
|
|
28
|
|
27
|
|
|||||
|
Teamsters 170 Health & Welfare Fund
|
15
|
|
12
|
|
12
|
|
|||||
|
Teamsters Benefit Trust
|
40
|
|
38
|
|
32
|
|
|||||
|
Teamsters Local 251 Health & Insurance Plan
|
12
|
|
11
|
|
10
|
|
|||||
|
Teamsters Local 404 Health & Insurance Plan
|
7
|
|
6
|
|
6
|
|
|||||
|
Teamsters Local 638 Health Fund
|
35
|
|
32
|
|
29
|
|
|||||
|
Teamsters Local 639—Employers Health & Pension Trust Funds
|
26
|
|
24
|
|
22
|
|
|||||
|
Teamsters Local 671 Health Services & Insurance Plan
|
14
|
|
13
|
|
12
|
|
|||||
|
Teamsters Union 25 Health Services & Insurance Plan
|
44
|
|
37
|
|
36
|
|
|||||
|
Teamsters Union Local 677 Health Services & Insurance Plan
|
9
|
|
8
|
|
8
|
|
|||||
|
Truck Drivers and Helpers Local 355 Baltimore Area Health & Welfare Fund
|
15
|
|
13
|
|
13
|
|
|||||
|
Utah-Idaho Teamsters Security Fund
|
22
|
|
18
|
|
16
|
|
|||||
|
Washington Teamsters Welfare Trust
|
36
|
|
35
|
|
32
|
|
|||||
|
All Other Multiemployer Health and Welfare Plans
|
64
|
|
44
|
|
55
|
|
|||||
|
Total Contributions
|
$
|
2,352
|
|
$
|
1,222
|
|
$
|
1,156
|
|
||
The increase in 2014 contributions to the Central States, South East & South West Areas Health and Welfare Fund, the Teamsters Western Region & Local 177 Health Care Plan, and the Health & Welfare Insurance Fund Teamsters Local 653 plan are related to the changes to the delivery of active and postretirement healthcare benefits described below.
85
UNITED PARCEL SERVICE, INC. AND SUBSIDIARIES
NOTES TO CONSOLIDATED FINANCIAL STATEMENTS
Changes to the Delivery of Active and Postretirement Healthcare Benefits
Prior to ratification, the NMA Group and Non-NMA Group employees received their healthcare benefits through UPS-sponsored active and postretirement health and welfare benefit plans. Effective June 1, 2014, we ceased providing healthcare benefits to active NMA Group employees through these UPS-sponsored benefit plans, and the responsibility for providing healthcare benefits for active employees was assumed by three separate multiemployer healthcare funds (the “Funds”). The responsibility for providing healthcare benefits for the active Non-NMA Group employees was also assumed by the Funds on various dates up to January 1, 2015, depending on the ratification date of the applicable collective bargaining agreement. We will make contributions to the Funds based on negotiated fixed hourly or monthly contribution rates for the duration of the NMA and other applicable collective bargaining agreements.
Additionally, the Funds assumed the obligation to provide postretirement healthcare benefits to the employees in the NMA Group who retire on or after January 1, 2014. The postretirement healthcare benefit obligation for the employees in the Non-NMA Group was assumed by the Funds for employees retiring on or after January 1, 2014 or January 1, 2015, depending on the applicable collective bargaining agreement. In exchange for the assumption of the obligation to provide postretirement healthcare benefits to the NMA Group and Non-NMA Group, we transferred cash totaling $2.271 billion to the Funds in the second quarter of 2014. UPS-sponsored health and welfare benefit plans retained responsibility for providing postretirement healthcare coverage for employees in the NMA Group who retired from UPS prior to January 1, 2014, and for employees in the Non-NMA Group who retire from UPS prior to the January 1, 2014 or January 1, 2015 effective date in the applicable collective bargaining agreement.
Accounting Impact of Health and Welfare Plan Changes
Income Statement Impact:
We recorded a pre-tax charge of $
1.066
billion ($
665
million after-tax) in the second quarter of
2014
for the health and welfare plan changes described above. The components of this charge, which was included in "compensation and benefits" expense in the statement of consolidated income, are as follows:
|
•
|
Partial Plan Curtailment
: We recorded a $
112
million pre-tax curtailment loss due to the elimination of future service benefit accruals. This curtailment loss represents the accelerated recognition of unamortized prior service costs.
|
|
•
|
Remeasurement of Postretirement Obligation
: We recorded a $
746
million pre-tax loss due to the remeasurement of the postretirement benefit obligations of the affected UPS-sponsored health and welfare benefit plans.
|
|
•
|
Settlement
: We recorded a $
208
million pre-tax settlement loss, which represents the recognition of unamortized actuarial losses associated with the postretirement obligation for the NMA Group.
|
We recorded an additional pre-tax charge of $
36
million ($
22
million after-tax) in the fourth quarter of
2014
upon ratification of the collective bargaining agreements covering the Non-NMA Group, related to the remeasurement and settlement of the postretirement benefit obligation associated with those employees.
Balance Sheet and Cash Flow Impact:
During 2014, as part of the health and welfare plan changes described previously, we transferred cash totaling $
2.271
billion to the Funds, which was accounted for as a settlement of our postretirement benefit obligations (see note 4). We received approximately $
854
million of cash tax benefits (through reduced U.S. Federal and state quarterly income tax payments) in
2014
.
For NMA Group employees who retired prior to January 1, 2014 and remained with the UPS-sponsored health and welfare plans, the changes to the contributions, benefits and cost sharing provisions in these plans resulted in an increase in the postretirement benefit obligation, and a corresponding decrease in pre-tax AOCI, of $
13
million upon ratification.
The following table indicates the allocation of goodwill by reportable segment (in millions):
|
U.S. Domestic
Package
|
International
Package
|
Supply Chain &
Freight
|
Consolidated
|
||||||||||||
|
Balance on January 1, 2013
|
$
|
—
|
|
$
|
430
|
|
$
|
1,743
|
|
$
|
2,173
|
|
|||
|
Acquired
|
—
|
|
3
|
|
20
|
|
23
|
|
|||||||
|
Currency / Other
|
—
|
|
(13
|
)
|
7
|
|
(6
|
)
|
|||||||
|
Balance on December 31, 2013
|
$
|
—
|
|
$
|
420
|
|
$
|
1,770
|
|
$
|
2,190
|
|
|||
|
Acquired
|
—
|
|
52
|
|
13
|
|
65
|
|
|||||||
|
Currency / Other
|
—
|
|
(23
|
)
|
(48
|
)
|
(71
|
)
|
|||||||
|
Balance on December 31, 2014
|
$
|
—
|
|
$
|
449
|
|
$
|
1,735
|
|
$
|
2,184
|
|
|||
Business Acquisitions
2014 Acquisitions:
The goodwill acquired in the International Package segment was related to our October 2014 acquisition of i-parcel, LLC. ("i-parcel"), a U.S.-based international e-commerce enabler and logistics company that operates in the U.S. and U.K. The goodwill acquired in the Supply Chain & Freight segment was related to our February 2014 acquisition of Polar Speed Distribution Limited ("Polar Speed"), a U.K.-based company that provides temperature-sensitive pharmaceutical supply chain solutions in the U.K. and continental Europe.
The purchase price allocation for acquired companies can be modified for up to one year from the date of acquisition. The acquisition of Polar Speed and i-parcel were not material to our consolidated financial position or results of operations.
2013 Acquisitions:
The goodwill acquired in the Supply Chain & Freight segment was related to our July 2013 acquisition of Cemelog Ltd. (“Cemelog”), a Hungary-based medical logistics provider that operates in Central and Eastern Europe. The goodwill acquired in the International Package segment was largely related to our October 2013 acquisition of the assets and operations of two Costa Rican-based companies: (1) Union Pak de Costa Rica, S.A., a small package delivery company, and (2) SEISA Brokerage, a customs brokerage company. Both companies had long-standing relationships with UPS as authorized service contractors.
Goodwill Impairment
We test our goodwill for impairment annually, as of
October 1st
, on a reporting unit basis. Our reporting units are comprised of the Europe, Asia, Americas and ISMEA (Indian Subcontinent, Middle East and Africa) reporting units in the International Package reporting segment, and the Forwarding, Logistics, UPS Freight, The UPS Store, and UPS Capital reporting units in the Supply Chain & Freight reporting segment.
In assessing our goodwill for impairment, we initially evaluate qualitative factors to determine if it is more likely than not that the fair value of a reporting unit is less than its carrying amount. If the qualitative assessment is not conclusive and it is necessary to calculate the fair value of a reporting unit, then we utilize a two-step process to test goodwill for impairment. First, a comparison of the fair value of the applicable reporting unit with the aggregate carrying value, including goodwill, is performed. We primarily determine the fair value of our reporting units using a discounted cash flow model, and supplement this with observable valuation multiples for comparable companies, as applicable. If the carrying amount of a reporting unit exceeds the reporting unit’s fair value, we perform the second step of the goodwill impairment test to determine the amount of impairment loss. The second step includes comparing the implied fair value of the affected reporting unit’s goodwill with the carrying value of that goodwill.
86
UNITED PARCEL SERVICE, INC. AND SUBSIDIARIES
NOTES TO CONSOLIDATED FINANCIAL STATEMENTS
In 2014, we utilized the two-step process to test goodwill for impairment for all of our reporting units. We did not have any goodwill impairment charges in
2014
,
2013
or
2012
. Cumulatively, our Supply Chain & Freight reporting segment has recorded goodwill impairment charges of $
622
million, while our International and U.S. Domestic Package segments have not recorded any impairment charges.
Intangible Assets
The following is a summary of intangible assets at
December 31, 2014
and
2013
(in millions):
|
Gross Carrying
Amount
|
Accumulated
Amortization
|
Net Carrying
Value
|
Weighted-
Average
Amortization
Period
(in years)
|
||||||||||
|
December 31, 2014
|
|||||||||||||
|
Capitalized software
|
$
|
2,641
|
|
$
|
(1,997
|
)
|
$
|
644
|
|
5.0
|
|||
|
Licenses
|
217
|
|
(133
|
)
|
84
|
|
5.1
|
||||||
|
Franchise rights
|
117
|
|
(77
|
)
|
40
|
|
20.0
|
||||||
|
Customer lists
|
123
|
|
(66
|
)
|
57
|
|
11.7
|
||||||
|
Trademarks, patents, and other
|
31
|
|
(9
|
)
|
22
|
|
12.6
|
||||||
|
Total Intangible Assets, Net
|
$
|
3,129
|
|
$
|
(2,282
|
)
|
$
|
847
|
|
5.9
|
|||
|
December 31, 2013
|
|||||||||||||
|
Capitalized software
|
$
|
2,420
|
|
$
|
(1,897
|
)
|
$
|
523
|
|
||||
|
Licenses
|
220
|
|
(97
|
)
|
123
|
|
|||||||
|
Franchise rights
|
117
|
|
(70
|
)
|
47
|
|
|||||||
|
Customer lists
|
118
|
|
(62
|
)
|
56
|
|
|||||||
|
Trademarks, patents, and other
|
37
|
|
(11
|
)
|
26
|
|
|||||||
|
Total Intangible Assets, Net
|
$
|
2,912
|
|
$
|
(2,137
|
)
|
$
|
775
|
|
||||
Licenses with a carrying value of $
5
million as of
December 31, 2014
are deemed to be indefinite-lived intangibles, and therefore are not amortized. Impairment tests for indefinite-lived intangibles are performed on an annual basis. All of our other recorded intangible assets are deemed to be finite-lived intangibles, and are thus amortized over their estimated useful lives. Impairment tests for these intangible assets are only performed when a triggering event occurs that indicates that the carrying value of the intangible may not be recoverable. We incurred impairment charges on intangible assets of
$13
million during
2013
, while there were
no
impairments of any finite-lived or indefinite-lived intangible assets in
2014
or
2012
.
Amortization of intangible assets was $
195
, $
185
and $
244
million during
2014
,
2013
and
2012
, respectively. Expected amortization of finite-lived intangible assets recorded as of
December 31, 2014
for the next five years is as follows (in millions):
2015
—$
277
;
2016
—$
212
;
2017
—$
153
;
2018
—$
100
;
2019
—$
57
. Amortization expense in future periods will be affected by business acquisitions, software development, licensing agreements, sponsorships and other factors.
87
UNITED PARCEL SERVICE, INC. AND SUBSIDIARIES
NOTES TO CONSOLIDATED FINANCIAL STATEMENTS
The following table sets forth the principal amount, maturity or range of maturities, as well as the carrying value of our debt obligations, as of
December 31, 2014
and
2013
(in millions). The carrying value of these debt obligations can differ from the principal amount due to the impact of unamortized discounts or premiums and valuation adjustments resulting from interest rate swap hedging relationships.
|
Principal
|
Carrying Value
|
||||||||||||
|
Amount
|
Maturity
|
2014
|
2013
|
||||||||||
|
Commercial paper
|
$
|
772
|
|
2015
|
$
|
772
|
|
$
|
—
|
|
|||
|
Fixed-rate senior notes:
|
|||||||||||||
|
3.875% senior notes
|
1,000
|
|
2014
|
—
|
|
1,007
|
|
||||||
|
1.125% senior notes
|
375
|
|
2017
|
370
|
|
367
|
|
||||||
|
5.50% senior notes
|
750
|
|
2018
|
802
|
|
821
|
|
||||||
|
5.125% senior notes
|
1,000
|
|
2019
|
1,076
|
|
1,079
|
|
||||||
|
3.125% senior notes
|
1,500
|
|
2021
|
1,617
|
|
1,579
|
|
||||||
|
2.45% senior notes
|
1,000
|
|
2022
|
977
|
|
913
|
|
||||||
|
6.20% senior notes
|
1,500
|
|
2038
|
1,481
|
|
1,481
|
|
||||||
|
4.875% senior notes
|
500
|
|
2040
|
489
|
|
489
|
|
||||||
|
3.625% senior notes
|
375
|
|
2042
|
367
|
|
367
|
|
||||||
|
8.375% Debentures:
|
|||||||||||||
|
8.375% debentures
|
424
|
|
2020
|
480
|
|
479
|
|
||||||
|
8.375% debentures
|
276
|
|
2030
|
283
|
|
283
|
|
||||||
|
Pound Sterling Notes:
|
|||||||||||||
|
5.50% notes
|
103
|
|
2031
|
99
|
|
105
|
|
||||||
|
5.125% notes
|
706
|
|
2050
|
673
|
|
714
|
|
||||||
|
Floating rate senior notes
|
463
|
|
2049 – 2064
|
459
|
|
370
|
|
||||||
|
Capital lease obligations
|
505
|
|
2015 – 3005
|
505
|
|
473
|
|
||||||
|
Facility notes and bonds
|
320
|
|
2015 – 2036
|
320
|
|
320
|
|
||||||
|
Other debt
|
17
|
|
2015 – 2022
|
17
|
|
25
|
|
||||||
|
Total debt
|
$
|
11,586
|
|
10,787
|
|
10,872
|
|
||||||
|
Less: current maturities
|
(923
|
)
|
(48
|
)
|
|||||||||
|
Long-term debt
|
$
|
9,864
|
|
$
|
10,824
|
|
|||||||
Commercial Paper
We are authorized to borrow up to $
10.0
billion under our U.S. commercial paper program. We had $
772
million outstanding under this program as of
December 31, 2014
. We also maintain a European commercial paper program under which we are authorized to borrow up to €
5.0
billion in a variety of currencies. As of
December 31, 2014
, there were no amounts outstanding under this program. The amount of commercial paper outstanding under these programs in
2015
is expected to fluctuate.
88
UNITED PARCEL SERVICE, INC. AND SUBSIDIARIES
NOTES TO CONSOLIDATED FINANCIAL STATEMENTS
Fixed Rate Senior Notes
We have completed several offerings of fixed rate senior notes. All of the notes pay interest semiannually, and allow for redemption of the notes by UPS at any time by paying the greater of the principal amount or a “make-whole” amount, plus accrued interest. We subsequently entered into interest rate swaps on several of these notes, which effectively converted the fixed interest rates on the notes to variable LIBOR-based interest rates. The average interest rate payable on these notes, including the impact of the interest rate swaps, for
2014
and
2013
, respectively, were as follows:
|
Principal
|
Average Effective Interest Rate
|
|||||||||
|
Value
|
Maturity
|
2014
|
2013
|
|||||||
|
3.875% senior notes
|
1,000
|
|
2014
|
0.94
|
%
|
0.97
|
%
|
|||
|
1.125% senior notes
|
375
|
|
2017
|
0.60
|
%
|
0.64
|
%
|
|||
|
5.50% senior notes
|
750
|
|
2018
|
2.49
|
%
|
2.53
|
%
|
|||
|
5.125% senior notes
|
1,000
|
|
2019
|
1.97
|
%
|
2.01
|
%
|
|||
|
3.125% senior notes
|
1,500
|
|
2021
|
1.06
|
%
|
1.11
|
%
|
|||
|
2.45% senior notes
|
1,000
|
|
2022
|
0.82
|
%
|
0.86
|
%
|
|||
On April 1, 2014, our $
1.00
billion
3.875%
senior notes matured and were repaid in full. The principal balance of the senior notes was repaid from the proceeds of short-term commercial paper issuances.
8.375
% Debentures
The
8.375
% debentures consist of
two
separate tranches, as follows:
|
•
|
$
276
million of the debentures have a maturity of
April 1, 2030
. These debentures have an
8.375%
interest rate until
April 1, 2020
, and, thereafter, the interest rate will be
7.62%
for the final
10
years. These debentures are redeemable in whole or in part at our option at any time. The redemption price is equal to the greater of
100%
of the principal amount and accrued interest, or the sum of the present values of the remaining scheduled payout of principal and interest thereon discounted to the date of redemption (at a benchmark treasury yield plus five basis points) plus accrued interest.
|
|
•
|
$
424
million of the debentures have a maturity of
April 1, 2020
. These debentures are not subject to redemption prior to maturity.
|
Interest is payable semiannually on the first of April and October for both debentures and neither debenture is subject to sinking fund requirements. We subsequently entered into interest rate swaps on the
2020
notes, which effectively converted the fixed interest rates on the notes to variable LIBOR-based interest rates. The average interest rate payable on the
2020
notes, including the impact of the interest rate swaps, for
2014
and
2013
was
4.99%
and
5.03%
, respectively.
Floating Rate Senior Notes
The floating rate senior notes bear interest at either one or three-month LIBOR, less a spread ranging from
30
to
45
basis points. The average interest rate for
2014
and
2013
was
0.00%
for both years. These notes are callable at various times after
30
years at a stated percentage of par value, and putable by the note holders at various times after
10
years at a stated percentage of par value. The notes have maturities ranging from
2049
through
2064
. In
2014
and
2013
, we redeemed notes with a principal value of $
1
and $
4
million, respectively, after put options were exercised by the note holders.
In
December 2014
, we issued a floating rate senior note with a principal balance of $
90
million that bears interest at three-month LIBOR less
30
basis points. This note matures in
2064
.
89
UNITED PARCEL SERVICE, INC. AND SUBSIDIARIES
NOTES TO CONSOLIDATED FINANCIAL STATEMENTS
Capital Lease Obligations
We have certain property, plant and equipment subject to capital leases. Some of the obligations associated with these capital leases have been legally defeased. The recorded value of our property, plant and equipment subject to capital leases is as follows as of
December 31
(in millions):
|
2014
|
2013
|
||||||
|
Vehicles
|
$
|
86
|
|
$
|
49
|
|
|
|
Aircraft
|
2,289
|
|
2,289
|
|
|||
|
Buildings
|
197
|
|
181
|
|
|||
|
Plant Equipment
|
—
|
|
2
|
|
|||
|
Technology Equipment
|
—
|
|
—
|
|
|||
|
Accumulated amortization
|
(781
|
)
|
(727
|
)
|
|||
|
$
|
1,791
|
|
$
|
1,794
|
|
||
These capital lease obligations have principal payments due at various dates from
2015
through
3005
.
Facility Notes and Bonds
We have entered into agreements with certain municipalities to finance the construction of, or improvements to, facilities that support our U.S. Domestic Package and Supply Chain & Freight operations in the United States. These facilities are located around airport properties in Louisville, Kentucky; Dallas, Texas; and Philadelphia, Pennsylvania. Under these arrangements, we enter into a lease or loan agreement that covers the debt service obligations on the bonds issued by the municipalities, as follows:
|
•
|
Bonds with a principal balance of $
149
million issued by the Louisville Regional Airport Authority associated with our Worldport facility in Louisville, Kentucky. The bonds, which are due in
January 2029
, bear interest at a variable rate, and the average interest rates for
2014
and
2013
were
0.05%
and
0.09%
, respectively.
|
|
•
|
Bonds with a principal balance of $
42
million and due in
November 2036
issued by the Louisville Regional Airport Authority associated with our air freight facility in Louisville, Kentucky. The bonds bear interest at a variable rate, and the average interest rates for
2014
and
2013
were
0.05%
and
0.08%
, respectively.
|
|
•
|
Bonds with a principal balance of $
29
million issued by the Dallas / Fort Worth International Airport Facility Improvement Corporation associated with our Dallas, Texas airport facilities. The bonds are due in
May 2032
and bear interest at a variable rate, however the variable cash flows on the obligation have been swapped to a fixed
5.11%
.
|
|
•
|
Bonds with a principal balance of $
100
million issued by the Delaware County, Pennsylvania Industrial Development Authority associated with our Philadelphia, Pennsylvania airport facilities. The bonds, which are due in
December 2015
, bear interest at a variable rate, and the average interest rates for
2014
and
2013
were
0.04%
and
0.07%
, respectively.
|
Pound Sterling Notes
The Pound Sterling notes consist of
two
separate tranches, as follows:
|
•
|
Notes with a principal amount of
£66
million accrue interest at a
5.50%
fixed rate, and are due in
February 2031
. These notes are not callable.
|
|
•
|
Notes with a principal amount of £
455
million accrue interest at a
5.125%
fixed rate, and are due in
February 2050
.
These notes are callable at our option at a redemption price equal to the greater of 100% of the principal amount and accrued interest, or the sum of the present values of the remaining scheduled payout of principal and interest thereon discounted to the date of redemption at a benchmark U.K. government bond yield plus 15 basis points and accrued interest.
|
We maintain cross-currency interest rate swaps to hedge the foreign currency risk associated with the bond cash flows for both tranches of these bonds. The average fixed interest rate payable on the swaps is
5.45%
.
90
UNITED PARCEL SERVICE, INC. AND SUBSIDIARIES
NOTES TO CONSOLIDATED FINANCIAL STATEMENTS
Contractual Commitments
We lease certain aircraft, facilities, land, equipment and vehicles under operating leases, which expire at various dates through
2038
. Certain of the leases contain escalation clauses and renewal or purchase options. Rent expense related to our operating leases was $
676
, $
575
and $
619
million for
2014
,
2013
and
2012
, respectively.
The following table sets forth the aggregate minimum lease payments under capital and operating leases, the aggregate annual principal payments due under our long-term debt, and the aggregate amounts expected to be spent for purchase commitments (in millions).
|
Year
|
Capital
Leases
|
Operating
Leases
|
Debt
Principal
|
Purchase
Commitments
|
|||||||||||
|
2015
|
$
|
75
|
|
$
|
323
|
|
$
|
876
|
|
$
|
269
|
|
|||
|
2016
|
74
|
|
257
|
|
8
|
|
195
|
|
|||||||
|
2017
|
67
|
|
210
|
|
377
|
|
71
|
|
|||||||
|
2018
|
62
|
|
150
|
|
752
|
|
19
|
|
|||||||
|
2019
|
59
|
|
90
|
|
1,000
|
|
8
|
|
|||||||
|
After 2019
|
435
|
|
274
|
|
7,068
|
|
26
|
|
|||||||
|
Total
|
772
|
|
$
|
1,304
|
|
$
|
10,081
|
|
$
|
588
|
|
||||
|
Less: imputed interest
|
(267
|
)
|
|||||||||||||
|
Present value of minimum capitalized lease payments
|
505
|
|
|||||||||||||
|
Less: current portion
|
(47
|
)
|
|||||||||||||
|
Long-term capitalized lease obligations
|
$
|
458
|
|
||||||||||||
As of
December 31, 2014
, we had outstanding letters of credit totaling approximately $
1.064
billion issued in connection with our self-insurance reserves and other routine business requirements. We also issue surety bonds as an alternative to letters of credit in certain instances, and as of
December 31, 2014
, we had $
640
million of surety bonds written.
Available Credit
We maintain
two
credit agreements with a consortium of banks. One of these agreements provides revolving credit facilities of $
1.5
billion, and expires on
March 27, 2015
. Generally, amounts outstanding under this facility bear interest at a periodic fixed rate equal to LIBOR for the applicable interest period and currency denomination, plus an applicable margin. Alternatively, a fluctuating rate of interest equal to the highest of (1) JPMorgan Chase Bank’s publicly announced prime rate, (2) the Federal Funds effective rate plus
0.50%
, and (3) LIBOR for a one month interest period plus
1.00%
, plus an applicable margin, may be used at our discretion. In each case, the applicable margin for advances bearing interest based on LIBOR is a percentage determined by quotations from Markit Group Ltd. for our
1
-year credit default swap spread, subject to a minimum rate of
0.10%
and a maximum rate of
0.75%
. The applicable margin for advances bearing interest based on the prime rate is
1.00%
below the applicable margin for LIBOR advances (but not lower than
0.00%
). We are also able to request advances under this facility based on competitive bids for the applicable interest rate. There were no amounts outstanding under this facility as of
December 31, 2014
.
The second agreement provides revolving credit facilities of $
1.0
billion, and expires on
March 28, 2019
. Generally, amounts outstanding under this facility bear interest at a periodic fixed rate equal to LIBOR for the applicable interest period and currency denomination, plus an applicable margin. Alternatively, a fluctuating rate of interest equal to the highest of (1) JPMorgan Chase Bank’s publicly announced prime rate, (2) the Federal Funds effective rate plus
0.50%
, and (3) LIBOR for a one month interest period plus
1.00%
, plus an applicable margin, may be used at our discretion. In each case, the applicable margin for advances bearing interest based on LIBOR is a percentage determined by quotations from Markit Group Ltd. for our credit default swap spread, interpolated for a period from the date of determination of such credit default swap spread in connection with a new interest period until the latest maturity date of this facility then in effect (but not less than a period of one year). The minimum applicable margin rate is
0.10%
and the maximum applicable margin rate is
0.75%
per annum. The applicable margin for advances bearing interest based on the prime rate is
1.00%
below the applicable margin for LIBOR advances (but not less than
0.00%
). We are also able to request advances under this facility based on competitive bids. There were no amounts outstanding under this facility as of
December 31, 2014
.
91
UNITED PARCEL SERVICE, INC. AND SUBSIDIARIES
NOTES TO CONSOLIDATED FINANCIAL STATEMENTS
Debt Covenants
Our existing debt instruments and credit facilities subject us to certain financial covenants. As of
December 31, 2014
and for all prior periods presented, we have satisfied these financial covenants. These covenants limit the amount of secured indebtedness that we may incur, and limit the amount of attributable debt in sale-leaseback transactions, to
10%
of net tangible assets. As of
December 31, 2014
,
10
% of net tangible assets is equivalent to $
2.380 billion
; however, we have no covered sale-leaseback transactions or secured indebtedness outstanding. We do not expect these covenants to have a material impact on our financial condition or liquidity.
Fair Value of Debt
Based on the borrowing rates currently available to the Company for long-term debt with similar terms and maturities, the fair value of long-term debt, including current maturities, is approximately $
12.257
and $
11.756
billion as of
December 31, 2014
and
2013
, respectively. We utilized Level 2 inputs in the fair value hierarchy of valuation techniques to determine the fair value of all of our debt instruments.
We are involved in a number of judicial proceedings and other matters arising from the conduct of our business activities.
Although there can be no assurance as to the ultimate outcome, we have generally denied, or believe we have a meritorious defense and will deny, liability in all litigation pending against us, including (except as otherwise noted herein) the matters described below, and we intend to defend vigorously each case. We have accrued for legal claims when, and to the extent that, amounts associated with the claims become probable and can be reasonably estimated. The actual costs of resolving legal claims may be substantially higher or lower than the amounts accrued for those claims.
For those matters as to which we are not able to estimate a possible loss or range of loss, we are not able to determine whether the loss will have a material adverse effect on our business, financial condition or results of operations or liquidity. For matters in this category, we have indicated in the descriptions that follow the reasons that we are unable to estimate the possible loss or range of loss.
Judicial Proceedings
We are a defendant in a number of lawsuits filed in state and federal courts containing various class action allegations under state wage-and-hour laws. At this time, we do not believe that any loss associated with these matters would have a material adverse effect on our financial condition, results of operations or liquidity.
UPS and our subsidiary The UPS Store, Inc., are defendants in
Morgate v. The UPS Store, Inc. et al
. an action in the Los Angeles Superior Court brought on behalf of a certified class of all franchisees who chose to rebrand their Mail Boxes Etc. franchises to The UPS Store in
March 2003
. Plaintiff alleges that UPS and The UPS Store, Inc. misrepresented and omitted facts to the class about the market tests that were conducted before offering the class the choice of whether to rebrand to The UPS Store. The trial is scheduled for
June 2015
.
There are multiple factors that prevent us from being able to estimate the amount of loss, if any, that may result from the remaining aspects of this case, including: (1) we are vigorously defending ourselves and believe we have a number of meritorious legal defenses; and (2) it remains uncertain what evidence of damages, if any, plaintiffs will be able to present. Accordingly, at this time, we are not able to estimate a possible loss or range of loss that may result from this matter or to determine whether such loss, if any, would have a material adverse effect on our financial condition, results of operations or liquidity.
92
UNITED PARCEL SERVICE, INC. AND SUBSIDIARIES
NOTES TO CONSOLIDATED FINANCIAL STATEMENTS
In
AFMS LLC v. UPS and FedEx Corporation
, a lawsuit filed in federal court in the Central District of California in
August 2010
, the plaintiff asserts that UPS and FedEx violated U.S. antitrust law by conspiring to refuse to negotiate with third-party negotiators retained by shippers and by individually imposing policies that prevent shippers from using such negotiators. UPS and FedEx have moved for summary judgment. There has been no ruling on those motions. The case does not have a trial date scheduled. The Antitrust Division of the U.S. Department of Justice (“DOJ”) has an ongoing civil investigation of our policies and practices for dealing with third-party negotiators. We are cooperating with this investigation. We deny any liability with respect to these matters and intend to vigorously defend ourselves. There are multiple factors that prevent us from being able to estimate the amount of loss, if any, that may result from these matters including: (1) we believe that we have a number of meritorious defenses; (2) the Court has not ruled on the pending dispositive motions; and (3) the DOJ investigation is pending. Accordingly, at this time, we are not able to estimate a possible loss or range of loss that may result from these matters or to determine whether such loss, if any, would have a material adverse effect on our financial condition, results of operations or liquidity.
In Canada,
four
purported class-action cases were filed against us in British Columbia (
2006
); Ontario (
2007
) and Québec (
2006
and
2013
). The cases each allege inadequate disclosure concerning the existence and cost of brokerage services provided by us under applicable provincial consumer protection legislation and infringement of interest restriction provisions under the Criminal Code of Canada. The British Columbia class action was declared inappropriate for certification and dismissed by the trial judge. That decision was upheld by the British Columbia Court of Appeal in
March 2010
, which ended the case in our favor. The Ontario class action was certified in
September 2011
. Partial summary judgment was granted to us and the plaintiffs by the Ontario motions court. The complaint under the Criminal Code was dismissed. No appeal is being taken from that decision. The allegations of inadequate disclosure were granted and we are appealing that decision. The motion to authorize the
2006
Québec litigation as a class action was dismissed by the motions judge in
October 2012
; there was no appeal, which ended that case in our favor. The
2013
Québec litigation also has been dismissed. We deny all liability and are vigorously defending the
one
outstanding case in Ontario. There are multiple factors that prevent us from being able to estimate the amount of loss, if any, that may result from this matter, including: (1) we are vigorously defending ourselves and believe that we have a number of meritorious legal defenses; and (2) there are unresolved questions of law and fact that could be important to the ultimate resolution of this matter. Accordingly, at this time, we are not able to estimate a possible loss or range of loss that may result from this matter or to determine whether such loss, if any, would have a material adverse effect on our financial condition, results of operations or liquidity.
Other Matters
In
January 2008
, a class action complaint was filed in the United States District Court for the Eastern District of New York alleging price-fixing activities relating to the provision of freight forwarding services. UPS was not named in this case. In
July 2009
, the plaintiffs filed a First Amended Complaint naming numerous global freight forwarders as defendants. UPS and UPS Supply Chain Solutions are among the
60
defendants named in the amended complaint. After two rounds of motions to dismiss, in October 2014, UPS entered into a settlement agreement with the plaintiffs to settle the remaining claims asserted against UPS for an immaterial amount. The court granted preliminary approval of the settlement on December 16, 2014. The settlement is subject to final court approval.
In
August 2010
, competition authorities in Brazil opened an administrative proceeding to investigate alleged anticompetitive behavior in the freight forwarding industry. Approximately
45
freight forwarding companies and individuals are named in the proceeding, including UPS, UPS SCS Transportes (Brasil) S.A., and a former employee in Brazil. UPS submitted its written defenses to these allegations in April 2014. UPS intends to continue to defend itself in these proceedings. In November 2012, the Commerce Commission of Singapore initiated an investigation with respect to similar matters.
We are cooperating with each of these investigations, and intend to continue to vigorously defend ourselves. There are multiple factors that prevent us from being able to estimate the amount of loss, if any, that may result from these matters including: (1) we are vigorously defending each matter and believe that we have a number of meritorious legal defenses; (2) there are unresolved questions of law that could be of importance to the ultimate resolutions of these matters, including the calculation of any potential fine; and (3) there is uncertainty about the time period that is the subject of the investigations. Accordingly, at this time, we are not able to estimate a possible loss or range of loss that may result from these matters or to determine whether such loss, if any, would have a material adverse effect on our financial condition, results of operations or liquidity.
93
UNITED PARCEL SERVICE, INC. AND SUBSIDIARIES
NOTES TO CONSOLIDATED FINANCIAL STATEMENTS
On
March 29, 2013
, we entered into a Non-Prosecution Agreement (“NPA”) with the United States Attorney's Office in the Northern District of California in connection with an investigation by the Drug Enforcement Administration of shipments by illicit online pharmacies. Under the NPA, we forfeited $
40
million to the government, admitted to a Statement of Facts describing the conduct leading to the agreement, and agreed to implement an online pharmacy compliance program. The term of the NPA is
two
years. We have petitioned the government to shorten that term in its discretion to a lesser period pursuant to the terms of the NPA. The NPA did not have a material impact on our financial condition, results of operations or liquidity.
In
January 2014
, we received a Civil Investigative Demand from the DOJ seeking documents related to possible violations of the False Claims Act ("FCA") in connection with delivery services provided to government customers where guaranteed commitment times allegedly were not met. The General Services Administration - Office of Inspector General had previously sought similar documents. The Company has been cooperating with these inquiries and is in discussions with the DOJ to resolve all claims by the federal government regarding this matter. We do not believe that a negotiated resolution would have a material adverse effect on our financial condition, results of operations or liquidity. We also have been contacted by several states requesting this information. The Company has been cooperating with these inquiries.
It is not possible to predict the potential outcome of the state inquiries at this stage, or to reasonably estimate the range or amount of possible loss, if any, that may result from these investigations based on a number of factors, including: (1) the investigations are not complete; (2) these matters are at an early stage and there are unresolved questions of law and fact that could be of importance to the ultimate resolution of these matters; (3) the scope and size of potentially affected government customers and the time period covered by potential claims remains uncertain; and (4) our current intention to vigorously defend any claims of FCA violations. Accordingly, at this time, we are not able to estimate a possible loss or range of loss that may result from these matters or to determine whether such loss, if any, would have a material adverse effect on our financial condition, results of operations or liquidity.
On
February 18, 2015
, the State and City of New York filed suit against UPS arising from alleged shipments of cigarettes to New York State and City residents. The complaint asserts claims under various federal and state laws. The complaint also includes a claim that UPS violated the Assurance of Discontinuance it entered into with the New York Attorney General concerning cigarette deliveries in
2005
. There are multiple factors that prevent us from being able to estimate the amount of loss, if any, that may result from this case, including: (1) we are vigorously defending ourselves and believe we have a number of meritorious factual and legal defenses; and (2) it remains uncertain what evidence of their claims and damages, if any, plaintiffs will be able to present. Accordingly, at this time, we are not able to estimate a possible loss or range of loss that may result from this matter or to determine whether such loss, if any, would have a material adverse effect on our financial condition, results of operations or liquidity.
We are a defendant in various other lawsuits that arose in the normal course of business. We do not believe that the eventual resolution of these other lawsuits (either individually or in the aggregate), including any reasonably possible losses in excess of current accruals, will have a material adverse effect on our financial condition, results of operations or liquidity.
94
UNITED PARCEL SERVICE, INC. AND SUBSIDIARIES
NOTES TO CONSOLIDATED FINANCIAL STATEMENTS
Capital Stock, Additional Paid-In Capital, and Retained Earnings
We maintain
two
classes of common stock, which are distinguished from each other by their respective voting rights. Class A shares of UPS are entitled to
10
votes per share, whereas class B shares are entitled to
one
vote per share. Class A shares are primarily held by UPS employees and retirees, as well as trusts and descendants of the Company’s founders, and these shares are fully convertible into class B shares at any time. Class B shares are publicly traded on the New York Stock Exchange (“NYSE”) under the symbol “UPS”. Class A and B shares both have a $
0.01
par value, and as of
December 31, 2014
, there were
4.6
billion class A shares and
5.6
billion class B shares authorized to be issued. Additionally, there are
200
million preferred shares authorized to be issued, with a par value of $
0.01
per share; as of
December 31, 2014
,
no
preferred shares had been issued.
The following is a rollforward of our common stock, additional paid-in capital, and retained earnings accounts (in millions, except per share amounts):
|
|
2014
|
2013
|
2012
|
|||||||||||||||||
|
|
Shares
|
Dollars
|
Shares
|
Dollars
|
Shares
|
Dollars
|
||||||||||||||
|
Class A Common Stock
|
||||||||||||||||||||
|
Balance at beginning of year
|
212
|
|
$
|
2
|
|
225
|
|
$
|
3
|
|
240
|
|
$
|
3
|
|
|||||
|
Common stock purchases
|
(5
|
)
|
—
|
|
(8
|
)
|
(1
|
)
|
(9
|
)
|
—
|
|
||||||||
|
Stock award plans
|
5
|
|
—
|
|
9
|
|
—
|
|
8
|
|
—
|
|
||||||||
|
Common stock issuances
|
3
|
|
—
|
|
4
|
|
—
|
|
3
|
|
—
|
|
||||||||
|
Conversions of class A to class B common stock
|
(14
|
)
|
—
|
|
(18
|
)
|
—
|
|
(17
|
)
|
—
|
|
||||||||
|
Class A shares issued at end of year
|
201
|
|
$
|
2
|
|
212
|
|
$
|
2
|
|
225
|
|
$
|
3
|
|
|||||
|
Class B Common Stock
|
||||||||||||||||||||
|
Balance at beginning of year
|
712
|
|
$
|
7
|
|
729
|
|
$
|
7
|
|
725
|
|
$
|
7
|
|
|||||
|
Common stock purchases
|
(21
|
)
|
—
|
|
(35
|
)
|
—
|
|
(13
|
)
|
—
|
|
||||||||
|
Conversions of class A to class B common stock
|
14
|
|
—
|
|
18
|
|
—
|
|
17
|
|
—
|
|
||||||||
|
Class B shares issued at end of year
|
705
|
|
$
|
7
|
|
712
|
|
$
|
7
|
|
729
|
|
$
|
7
|
|
|||||
|
Additional Paid-In Capital
|
||||||||||||||||||||
|
Balance at beginning of year
|
$
|
—
|
|
$
|
—
|
|
$
|
—
|
|
|||||||||||
|
Stock award plans
|
656
|
|
554
|
|
444
|
|
||||||||||||||
|
Common stock purchases
|
(918
|
)
|
(768
|
)
|
(943
|
)
|
||||||||||||||
|
Common stock issuances
|
309
|
|
307
|
|
293
|
|
||||||||||||||
|
Option premiums received (paid)
|
(47
|
)
|
(93
|
)
|
206
|
|
||||||||||||||
|
Balance at end of year
|
$
|
—
|
|
$
|
—
|
|
$
|
—
|
|
|||||||||||
|
Retained Earnings
|
||||||||||||||||||||
|
Balance at beginning of year
|
$
|
6,925
|
|
$
|
7,997
|
|
$
|
10,128
|
|
|||||||||||
|
Net income attributable to controlling interests
|
3,032
|
|
4,372
|
|
807
|
|
||||||||||||||
|
Dividends ($2.68, $2.48 and $2.28 per share)
|
(2,487
|
)
|
(2,367
|
)
|
(2,243
|
)
|
||||||||||||||
|
Common stock purchases
|
(1,744
|
)
|
(3,077
|
)
|
(695
|
)
|
||||||||||||||
|
Balance at end of year
|
$
|
5,726
|
|
$
|
6,925
|
|
$
|
7,997
|
|
|||||||||||
For the years ended
December 31, 2014
,
2013
and
2012
, we repurchased a total of
26.4
,
43.2
and
21.8
million shares of class A and class B common stock for $
2.662
, $
3.846
and $
1.638
billion, respectively ($
2.695
, $
3.838
and $
1.621
billion in repurchases for
2014
,
2013
and
2012
, respectively, are reported on the cash flow statement due to the timing of settlements). On
February 14, 2013
, the Board of Directors approved a new share repurchase authorization of $
10.0
billion, which replaced an authorization previously announced in
2012
. This new share repurchase authorization has no expiration date. As of
December 31, 2014
, we had $
4.152
billion of this share repurchase authorization remaining.
95
UNITED PARCEL SERVICE, INC. AND SUBSIDIARIES
NOTES TO CONSOLIDATED FINANCIAL STATEMENTS
From time to time, we enter into share repurchase programs with large financial institutions to assist in our buyback of company stock. These programs allow us to repurchase our shares at a price below the weighted average UPS share price for a given period. During the fourth quarter of
2014
, we entered into an accelerated share repurchase program, which allowed us to repurchase $
400
million of shares (
3.7
million shares). The program was completed in
December 2014
.
In order to lower the average cost of acquiring shares in our ongoing share repurchase program, we periodically enter into structured repurchase agreements involving the use of capped call options for the purchase of UPS class B shares. We pay a fixed sum of cash upon execution of each agreement in exchange for the right to receive either a pre-determined amount of cash or stock. Upon expiration of each agreement, if the closing market price of our common stock is above the pre-determined price, we will have our initial investment returned with a premium in either cash or shares (at our election). If the closing market price of our common stock is at or below the pre-determined price, we will receive the number of shares specified in the agreement. We paid net premiums of
$47
and
$93
million during
2014
and
2013
, respectively, related to entering into and settling capped call options for the purchase of class B shares. As of
December 31, 2014
, we had outstanding options for the purchase of
1.7
million shares with an average strike price of
$100.01
per share that will settle in the first and second quarters of 2015.
Accumulated Other Comprehensive Income (Loss)
We incur activity in AOCI for unrealized holding gains and losses on available-for-sale securities, foreign currency translation adjustments, unrealized gains and losses from derivatives that qualify as hedges of cash flows and unrecognized pension and postretirement benefit costs. The activity in AOCI is as follows (in millions):
|
2014
|
2013
|
2012
|
|||||||||
|
Foreign currency translation gain (loss):
|
|||||||||||
|
Balance at beginning of year
|
$
|
(126
|
)
|
$
|
134
|
|
$
|
(160
|
)
|
||
|
Reclassification to earnings (no tax impact in any period)
|
—
|
|
(161
|
)
|
—
|
|
|||||
|
Translation adjustment (net of tax effect of $105, $(5), and $(9))
|
(331
|
)
|
(99
|
)
|
294
|
|
|||||
|
Balance at end of year
|
(457
|
)
|
(126
|
)
|
134
|
|
|||||
|
Unrealized gain (loss) on marketable securities, net of tax:
|
|||||||||||
|
Balance at beginning of year
|
(1
|
)
|
6
|
|
6
|
|
|||||
|
Current period changes in fair value (net of tax effect of $1, $(3), and $4)
|
2
|
|
(4
|
)
|
6
|
|
|||||
|
Reclassification to earnings (net of tax effect of $0, $(2), and $(3))
|
(1
|
)
|
(3
|
)
|
(6
|
)
|
|||||
|
Balance at end of year
|
—
|
|
(1
|
)
|
6
|
|
|||||
|
Unrealized gain (loss) on cash flow hedges, net of tax:
|
|||||||||||
|
Balance at beginning of year
|
(219
|
)
|
(286
|
)
|
(204
|
)
|
|||||
|
Current period changes in fair value (net of tax effect of $133, $1 and $(25))
|
220
|
|
1
|
|
(43
|
)
|
|||||
|
Reclassification to earnings (net of tax effect of $35, $39, and $(24))
|
60
|
|
66
|
|
(39
|
)
|
|||||
|
Balance at end of year
|
61
|
|
(219
|
)
|
(286
|
)
|
|||||
|
Unrecognized pension and postretirement benefit costs, net of tax:
|
|||||||||||
|
Balance at beginning of year
|
(114
|
)
|
(3,208
|
)
|
(2,745
|
)
|
|||||
|
Reclassification to earnings (net of tax effect of $870, $67, and $1,876)
|
1,462
|
|
111
|
|
3,135
|
|
|||||
|
Net actuarial gain (loss) and prior service cost resulting from remeasurements of plan assets and liabilities (net of tax effect of $(2,714), $1,786, and $(2,151))
|
(4,546
|
)
|
2,983
|
|
(3,598
|
)
|
|||||
|
Balance at end of year
|
(3,198
|
)
|
(114
|
)
|
(3,208
|
)
|
|||||
|
Accumulated other comprehensive income (loss) at end of year
|
$
|
(3,594
|
)
|
$
|
(460
|
)
|
$
|
(3,354
|
)
|
||
96
UNITED PARCEL SERVICE, INC. AND SUBSIDIARIES
NOTES TO CONSOLIDATED FINANCIAL STATEMENTS
Detail of the gains (losses) reclassified from AOCI to the statements of consolidated income for the years ended
December 31, 2014
,
2013
and
2012
is as follows (in millions):
|
2014 Amount Reclassified from AOCI
|
2013 Amount Reclassified from AOCI
|
2012 Amount Reclassified from AOCI
|
Affected Line Item in the Income Statement
|
||||||||||
|
Foreign currency translation gain (loss):
|
|||||||||||||
|
Liquidation of foreign subsidiary
|
$
|
—
|
|
$
|
161
|
|
$
|
—
|
|
Other expenses
|
|||
|
Income tax (expense) benefit
|
—
|
|
—
|
|
—
|
|
Income tax expense
|
||||||
|
Impact on net income
|
—
|
|
161
|
|
—
|
|
Net income
|
||||||
|
Unrealized gain (loss) on marketable securities:
|
|||||||||||||
|
Realized gain (loss) on sale of securities
|
1
|
|
5
|
|
9
|
|
Investment income
|
||||||
|
Income tax (expense) benefit
|
—
|
|
(2
|
)
|
(3
|
)
|
Income tax expense
|
||||||
|
Impact on net income
|
1
|
|
3
|
|
6
|
|
Net income
|
||||||
|
Unrealized gain (loss) on cash flow hedges:
|
|||||||||||||
|
Interest rate contracts
|
(23
|
)
|
(22
|
)
|
(22
|
)
|
Interest expense
|
||||||
|
Foreign exchange contracts
|
(48
|
)
|
18
|
|
24
|
|
Interest expense
|
||||||
|
Foreign exchange contracts
|
(24
|
)
|
(53
|
)
|
61
|
|
Revenue
|
||||||
|
Commodity contracts
|
—
|
|
(48
|
)
|
—
|
|
Fuel expense
|
||||||
|
Income tax (expense) benefit
|
35
|
|
39
|
|
(24
|
)
|
Income tax expense
|
||||||
|
Impact on net income
|
(60
|
)
|
(66
|
)
|
39
|
|
Net income
|
||||||
|
Unrecognized pension and postretirement benefit costs:
|
|||||||||||||
|
Prior service costs
|
(170
|
)
|
(178
|
)
|
(5,011
|
)
|
Compensation and benefits
|
||||||
|
Settlement and curtailment loss
|
(356
|
)
|
—
|
|
—
|
|
Compensation and benefits
|
||||||
|
Remeasurement of benefit obligation
|
(1,806
|
)
|
—
|
|
—
|
|
Compensation and benefits
|
||||||
|
Income tax (expense) benefit
|
870
|
|
67
|
|
1,876
|
|
Income tax expense
|
||||||
|
Impact on net income
|
(1,462
|
)
|
(111
|
)
|
(3,135
|
)
|
Net income
|
||||||
|
Total amount reclassified for the period
|
$
|
(1,521
|
)
|
$
|
(13
|
)
|
$
|
(3,090
|
)
|
Net income
|
|||
97
UNITED PARCEL SERVICE, INC. AND SUBSIDIARIES
NOTES TO CONSOLIDATED FINANCIAL STATEMENTS
Deferred Compensation Obligations and Treasury Stock
We maintain a deferred compensation plan whereby certain employees were previously able to elect to defer the gains on stock option exercises by deferring the shares received upon exercise into a rabbi trust. The shares held in this trust are classified as treasury stock, and the liability to participating employees is classified as “deferred compensation obligations” in the shareowners’ equity section of the consolidated balance sheets. The number of shares needed to settle the liability for deferred compensation obligations is included in the denominator in both the basic and diluted earnings per share calculations. Employees are generally no longer able to defer the gains from stock options exercised subsequent to
December 31, 2004
. Activity in the deferred compensation program for the years ended
December 31, 2014
,
2013
and
2012
is as follows (in millions):
|
|
2014
|
2013
|
2012
|
|||||||||||||||||
|
|
Shares
|
Dollars
|
Shares
|
Dollars
|
Shares
|
Dollars
|
||||||||||||||
|
Deferred Compensation Obligations
|
||||||||||||||||||||
|
Balance at beginning of year
|
$
|
69
|
|
$
|
78
|
|
$
|
88
|
|
|||||||||||
|
Reinvested dividends
|
2
|
|
4
|
|
3
|
|
||||||||||||||
|
Options exercise deferrals
|
—
|
|
—
|
|
—
|
|
||||||||||||||
|
Benefit payments
|
(12
|
)
|
(13
|
)
|
(13
|
)
|
||||||||||||||
|
Balance at end of year
|
$
|
59
|
|
$
|
69
|
|
$
|
78
|
|
|||||||||||
|
Treasury Stock
|
||||||||||||||||||||
|
Balance at beginning of year
|
(1
|
)
|
$
|
(69
|
)
|
(1
|
)
|
$
|
(78
|
)
|
(2
|
)
|
$
|
(88
|
)
|
|||||
|
Reinvested dividends
|
—
|
|
(2
|
)
|
—
|
|
(4
|
)
|
—
|
|
(3
|
)
|
||||||||
|
Options exercise deferrals
|
—
|
|
—
|
|
—
|
|
—
|
|
—
|
|
—
|
|
||||||||
|
Benefit payments
|
—
|
|
12
|
|
—
|
|
13
|
|
1
|
|
13
|
|
||||||||
|
Balance at end of year
|
(1
|
)
|
$
|
(59
|
)
|
(1
|
)
|
$
|
(69
|
)
|
(1
|
)
|
$
|
(78
|
)
|
|||||
Noncontrolling Interests
We have noncontrolling interests in certain consolidated subsidiaries in our International Package and Supply Chain & Freight segments, primarily in international locations. The activity related to our noncontrolling interests is presented below (in millions):
|
2014
|
2013
|
2012
|
|||||||||
|
Noncontrolling Interests
|
|||||||||||
|
Balance at beginning of period
|
$
|
14
|
|
$
|
80
|
|
$
|
73
|
|
||
|
Purchase of noncontrolling interests
|
3
|
|
(66
|
)
|
7
|
|
|||||
|
Dividends attributable to noncontrolling interests
|
—
|
|
—
|
|
—
|
|
|||||
|
Net income attributable to noncontrolling interests
|
—
|
|
—
|
|
—
|
|
|||||
|
Balance at end of period
|
$
|
17
|
|
$
|
14
|
|
$
|
80
|
|
||
In January 2013, we repurchased the noncontrolling interest in our joint venture that operates in the Middle East, Turkey, and portions of the Central Asia region for
$70 million
. After this transaction, we own
100%
of this entity.
98
UNITED PARCEL SERVICE, INC. AND SUBSIDIARIES
NOTES TO CONSOLIDATED FINANCIAL STATEMENTS
The UPS Incentive Compensation Plan permits the grant of nonqualified and incentive stock options, stock appreciation rights, restricted stock and stock units, and restricted performance shares and units, to eligible employees. The number of shares reserved for issuance under the Incentive Compensation Plan is
27
million. Each share issued pursuant to restricted stock units and restricted performance units (collectively referred to as "Restricted Units"), stock options and other permitted awards will reduce the share reserve by
one
share. We had
16
million shares available to be issued under the Incentive Compensation Plan as of
December 31, 2014
.
There are currently three primary awards granted to eligible employees under the UPS Incentive Compensation Plan, including the Management Incentive Award, Long-Term Incentive Performance Award and Non-Qualified Stock Option Award. These awards are discussed in the following paragraphs. The total expense recognized in our income statement under all stock compensation award programs was
$536
,
$513
and $
547
million during
2014
,
2013
and
2012
, respectively. The associated income tax benefit recognized in our income statement was $
199
, $
190
and $
201
million during
2014
,
2013
and
2012
, respectively. The cash income tax benefit received from the exercise of stock options and the lapsing of Restricted Units was $
261
, $
286
and $
265
million during
2014
,
2013
and
2012
, respectively.
Management Incentive Award
Non-executive management earning the right to receive the Management Incentive Award are determined annually by the Salary Committee, which is comprised of executive officers of the Company. Awards granted to executive officers are determined annually by the Compensation Committee of the UPS Board of Directors. Our Management Incentive Award program provides, with certain exceptions, that
one-half
to
two-thirds
of the annual Management Incentive Award will be made in Restricted Units (depending upon the level of management involved). The other one-third to one-half of the award is in the form of cash or unrestricted shares of class A common stock, and is fully vested at the time of grant.
Upon vesting, Restricted Units result in the issuance of the equivalent number of UPS class A common shares after required tax withholdings. Except in the case of death, disability, or retirement, Restricted Units granted for our Management Incentive Award generally vest over a
five
year period with approximately
20%
of the award vesting at each anniversary date of the grant. The entire grant is expensed on a straight-line basis over the requisite service period. All Restricted Units granted are subject to earlier cancellation or vesting under certain conditions. Dividends earned on Restricted Units are reinvested in additional Restricted Units at each dividend payable date.
Long-Term Incentive Performance Award granted prior to 2014
We awarded Restricted Units in conjunction with our Long-Term Incentive Performance Award program to certain eligible employees. The Restricted Units ultimately granted under the Long-Term Incentive Performance Award program are based upon the achievement of certain performance measures, including growth in consolidated revenue and operating return on invested capital, each year during the performance award cycle, and other measures, including the achievement of an adjusted earnings per share target, over the entire
three
year performance award cycle. The Restricted Units granted under this program vest at the end of the three year performance award cycle, except in the case of death disability, or retirement, in which case immediate vesting occurs.
As of
December 31, 2014
, we had the following Restricted Units outstanding, including reinvested dividends, that were granted under our Management Incentive Award program and Long-Term Incentive Performance Award program (granted prior to 2014):
|
Shares
(in thousands)
|
Weighted Average
Grant Date
Fair Value
|
Weighted Average Remaining
Contractual Term
(in years)
|
Aggregate Intrinsic
Value (in millions)
|
|||||||||
|
Nonvested at January 1, 2014
|
12,748
|
|
$
|
74.60
|
|
|||||||
|
Vested
|
(6,455
|
)
|
71.61
|
|
||||||||
|
Granted
|
5,064
|
|
92.35
|
|
||||||||
|
Reinvested Dividends
|
363
|
|
N/A
|
|
||||||||
|
Forfeited / Expired
|
(161
|
)
|
81.73
|
|
||||||||
|
Nonvested at December 31, 2014
|
11,559
|
|
$
|
82.58
|
|
1.39
|
$
|
1,285
|
|
|||
|
Restricted Units Expected to Vest
|
11,292
|
|
$
|
82.62
|
|
1.38
|
$
|
1,255
|
|
|||
99
UNITED PARCEL SERVICE, INC. AND SUBSIDIARIES
NOTES TO CONSOLIDATED FINANCIAL STATEMENTS
The fair value of each Restricted Unit is the NYSE closing price of class B common stock on the date of grant. The weighted-average grant date fair value of Restricted Units granted during
2014
,
2013
and
2012
was $
92.35
, $
80.18
and $
77.21
, respectively. The total fair value of Restricted Units vested was $
579
, $
510
and $
627
million in
2014
,
2013
and
2012
, respectively. As of
December 31, 2014
, there was $
483
million of total unrecognized compensation cost related to nonvested Restricted Units. That cost is expected to be recognized over a weighted average period of
three
years.
Long-Term Incentive Performance Award granted in 2014
Beginning with the Long-Term Incentive Performance grant in 2014, the performance targets are equally-weighted among consolidated operating return on invested capital, growth in consolidated revenue, and total shareowner return relative to a peer group of companies. The Restricted Units granted under this award generally vest at the end of a
three
-year period (except in the case of death disability, or retirement, in which case immediate vesting occurs on a prorated basis). The number of Restricted Units earned will be based on the percentage achievement of the performance targets set forth on the grant date. The range of percentage achievement can vary from
0%
to
200%
of the target award.
For the
two-thirds
of the award related to consolidated operating return on invested capital and growth in consolidated revenue, we recognize the grant-date fair value of these units (less estimated forfeitures) as compensation expense ratably over the vesting period, based on the number of awards expected to be earned. The remaining
one-third
of the award related to total shareowner return relative to a peer group is valued using a Monte Carlo model. This portion of the award was valued at a share payout of
109.84%
of the target grant, and is recognized as compensation expense (less estimated forfeitures) ratably over the vesting period.
As of December 31, 2014, we had the following Restricted Units outstanding, including reinvested dividends, that were granted under our 2014 Long-Term Incentive Performance Award:
|
Shares
(in thousands)
|
Weighted
Average
Grant Date
Fair Value
|
Weighted Average Remaining
Contractual Term
(in years)
|
Aggregate Intrinsic
Value (in millions)
|
|||||||||
|
Nonvested at January 1, 2014
|
—
|
|
$
|
—
|
|
|||||||
|
Vested
|
(28
|
)
|
96.98
|
|
||||||||
|
Granted
|
932
|
|
96.98
|
|
||||||||
|
Reinvested Dividends
|
17
|
|
N/A
|
|
||||||||
|
Forfeited / Expired
|
(106
|
)
|
96.98
|
|
||||||||
|
Nonvested at December 31, 2014
|
815
|
|
$
|
96.98
|
|
2.08
|
$
|
91
|
|
|||
|
Performance Units Expected to Vest
|
777
|
|
$
|
96.98
|
|
2.08
|
$
|
86
|
|
|||
The fair value of each Restricted Unit is the NYSE closing price of class B common stock on the date of grant. The weighted-average grant date fair value of Restricted Units granted during 2014 was $
96.98
. The total fair value of Restricted Units vested was $
2
million in
2014
. As of
December 31, 2014
, there was $
54
million of total unrecognized compensation cost related to nonvested Restricted Units. That cost is expected to be recognized over a weighted average period of two years.
Nonqualified Stock Options
We maintain fixed stock option plans, under which options are granted to purchase shares of UPS class A common stock. Stock options granted in connection with the Incentive Compensation Plan must have an exercise price at least equal to the NYSE closing price of UPS class B common stock on the date the option is granted.
Executive officers and certain senior managers receive a non-qualified stock option grant annually, in which the value granted is determined as a percentage of salary. Options granted generally vest over a
five
year period with approximately
20%
of the award vesting at each anniversary date of the grant. All options granted are subject to earlier cancellation or vesting under certain conditions. Option holders may exercise their options via the tender of cash or class A common stock, and new class A shares are issued upon exercise.
100
UNITED PARCEL SERVICE, INC. AND SUBSIDIARIES
NOTES TO CONSOLIDATED FINANCIAL STATEMENTS
The following is an analysis of options to purchase shares of class A common stock issued and outstanding:
|
Shares
(in thousands)
|
Weighted Average
Exercise
Price
|
Weighted Average Remaining
Contractual Term
(in years)
|
Aggregate Intrinsic
Value (in millions)
|
|||||||||
|
Outstanding at January 1, 2014
|
5,212
|
|
$
|
73.73
|
|
|||||||
|
Exercised
|
(1,620
|
)
|
72.52
|
|
||||||||
|
Granted
|
127
|
|
96.98
|
|
||||||||
|
Forfeited / Expired
|
(28
|
)
|
72.82
|
|
||||||||
|
Outstanding at December 31, 2014
|
3,691
|
|
$
|
75.07
|
|
2.85
|
$
|
133
|
|
|||
|
Options Vested and Expected to Vest
|
3,691
|
|
$
|
75.07
|
|
2.85
|
$
|
133
|
|
|||
|
Exercisable at December 31, 2014
|
3,356
|
|
$
|
74.20
|
|
2.35
|
$
|
124
|
|
|||
The fair value of each option grant is estimated using the Black-Scholes option pricing model. The weighted average assumptions used, by year, and the calculated weighted average fair values of options, are as follows:
|
2014
|
2013
|
2012
|
|||||||||
|
Expected dividend yield
|
2.56
|
%
|
2.75
|
%
|
2.77
|
%
|
|||||
|
Risk-free interest rate
|
2.40
|
%
|
1.38
|
%
|
1.63
|
%
|
|||||
|
Expected life in years
|
7.5
|
|
7.5
|
|
7.5
|
|
|||||
|
Expected volatility
|
24.26
|
%
|
24.85
|
%
|
25.06
|
%
|
|||||
|
Weighted average fair value of options granted
|
$
|
20.48
|
|
$
|
15.50
|
|
$
|
14.88
|
|
||
Expected volatilities are based on the historical returns on our stock and the implied volatility of our publicly-traded options. The expected dividend yield is based on the recent historical dividend yields for our stock, taking into account changes in dividend policy. The risk-free interest rate is based on the term structure of interest rates at the time of the option grant. The expected life represents an estimate of the period of time options are expected to remain outstanding, and we have relied upon a combination of the observed exercise behavior of our prior grants with similar characteristics, the vesting schedule of the grants, and an index of peer companies with similar grant characteristics in estimating this variable.
We received cash of $
85
, $
292
and $
122
million during
2014
,
2013
and
2012
, respectively, from option holders resulting from the exercise of stock options. The total intrinsic value of options exercised during
2014
,
2013
and
2012
was
$47
,
$92
and
$39
million, respectively. As of
December 31, 2014
, there was $
1
million of total unrecognized compensation cost related to nonvested options. That cost is expected to be recognized over a weighted average period of
3
years and
2
months.
The following table summarizes information about stock options outstanding and exercisable at
December 31, 2014
:
|
|
Options Outstanding
|
Options Exercisable
|
|||||||||||||
|
Exercise Price Range
|
Shares
(in thousands)
|
Average Life
(in years)
|
Average
Exercise
Price
|
Shares
(in thousands)
|
Average
Exercise
Price
|
||||||||||
|
$50.01 - $70.00
|
264
|
|
4.85
|
$
|
61.52
|
|
246
|
|
$
|
61.11
|
|
||||
|
$70.01 - $80.00
|
2,118
|
|
2.52
|
72.05
|
|
2,002
|
|
71.82
|
|
||||||
|
$80.01 - $90.00
|
1,182
|
|
2.30
|
81.17
|
|
1,081
|
|
81.00
|
|
||||||
|
$90.01 - $100.00
|
127
|
|
9.18
|
96.98
|
|
27
|
|
96.98
|
|
||||||
|
3,691
|
|
2.85
|
$
|
75.07
|
|
3,356
|
|
$
|
74.20
|
|
|||||
Discounted Employee Stock Purchase Plan
We maintain an employee stock purchase plan for all eligible employees. Under this plan, shares of UPS class A common stock may be purchased at quarterly intervals at
95%
of the NYSE closing price of UPS class B common stock on the last day of each quarterly period. Employees purchased
0.9
,
1.1
and
1.2
million shares at average prices of
$95.67
,
$79.74
and
$72.17
per share during
2014
,
2013
and
2012
, respectively. This plan is not considered to be compensatory, and therefore no compensation cost is measured for the employees’ purchase rights.
101
UNITED PARCEL SERVICE, INC. AND SUBSIDIARIES
NOTES TO CONSOLIDATED FINANCIAL STATEMENTS
We report our operations in
three
segments: U.S. Domestic Package operations, International Package operations and Supply Chain & Freight operations. Package operations represent our most significant business and are broken down into regional operations around the world. Regional operations managers are responsible for both domestic and export products within their geographic area.
U.S. Domestic Package
Domestic Package operations include the time-definite delivery of letters, documents and packages throughout the United States.
International Package
International Package operations include delivery to more than
220
countries and territories worldwide, including shipments wholly outside the United States, as well as shipments with either origin or destination outside the United States. Our International Package reporting segment includes the operations of our Europe, Asia, Americas and ISMEA (Indian Subcontinent, Middle East and Africa) operating segments.
Supply Chain & Freight
Supply Chain & Freight includes our forwarding and logistics operations, UPS Freight and other aggregated business units. Our forwarding and logistics business provides services in more than
195
countries and territories worldwide, and includes international air and ocean freight forwarding, customs brokerage, distribution and post-sales services, and mail and consulting services. UPS Freight offers a variety of LTL and TL services to customers in North America. Other aggregated business units within this segment include The UPS Store, UPS Capital and UPS Customer Solutions.
In evaluating financial performance, we focus on operating profit as a segment’s measure of profit or loss. Operating profit is before investment income, interest expense and income taxes. The accounting policies of the reportable segments are the same as those described in the summary of accounting policies (see note 1), with certain expenses allocated between the segments using activity-based costing methods. Unallocated assets are comprised primarily of cash, marketable securities, and certain investment partnerships.
Segment information as of, and for the years ended, December 31 is as follows (in millions):
|
2014
|
2013
|
2012
|
|||||||||
|
Revenue:
|
|||||||||||
|
U.S. Domestic Package
|
$
|
35,851
|
|
$
|
34,074
|
|
$
|
32,856
|
|
||
|
International Package
|
12,988
|
|
12,429
|
|
12,124
|
|
|||||
|
Supply Chain & Freight
|
9,393
|
|
8,935
|
|
9,147
|
|
|||||
|
Consolidated
|
$
|
58,232
|
|
$
|
55,438
|
|
$
|
54,127
|
|
||
|
Operating Profit:
|
|||||||||||
|
U.S. Domestic Package
|
$
|
2,859
|
|
$
|
4,603
|
|
$
|
459
|
|
||
|
International Package
|
1,677
|
|
1,757
|
|
869
|
|
|||||
|
Supply Chain & Freight
|
432
|
|
674
|
|
15
|
|
|||||
|
Consolidated
|
$
|
4,968
|
|
$
|
7,034
|
|
$
|
1,343
|
|
||
|
Assets:
|
|||||||||||
|
U.S. Domestic Package
|
$
|
20,716
|
|
$
|
19,648
|
|
$
|
19,934
|
|
||
|
International Package
|
7,853
|
|
8,463
|
|
11,248
|
|
|||||
|
Supply Chain & Freight
|
6,024
|
|
6,624
|
|
6,610
|
|
|||||
|
Unallocated
|
878
|
|
1,477
|
|
1,071
|
|
|||||
|
Consolidated
|
$
|
35,471
|
|
$
|
36,212
|
|
$
|
38,863
|
|
||
|
Depreciation and Amortization Expense:
|
|||||||||||
|
U.S. Domestic Package
|
$
|
1,276
|
|
$
|
1,229
|
|
$
|
1,220
|
|
||
|
International Package
|
478
|
|
473
|
|
475
|
|
|||||
|
Supply Chain & Freight
|
169
|
|
165
|
|
163
|
|
|||||
|
Consolidated
|
$
|
1,923
|
|
$
|
1,867
|
|
$
|
1,858
|
|
||
102
UNITED PARCEL SERVICE, INC. AND SUBSIDIARIES
NOTES TO CONSOLIDATED FINANCIAL STATEMENTS
Revenue by product type for the years ended December 31 is as follows (in millions):
|
2014
|
2013
|
2012
|
|||||||||
|
U.S. Domestic Package:
|
|||||||||||
|
Next Day Air
|
$
|
6,581
|
|
$
|
6,443
|
|
$
|
6,412
|
|
||
|
Deferred
|
3,672
|
|
3,437
|
|
3,392
|
|
|||||
|
Ground
|
25,598
|
|
24,194
|
|
23,052
|
|
|||||
|
Total U.S. Domestic Package
|
35,851
|
|
34,074
|
|
32,856
|
|
|||||
|
International Package:
|
|||||||||||
|
Domestic
|
2,784
|
|
2,667
|
|
2,531
|
|
|||||
|
Export
|
9,586
|
|
9,166
|
|
9,033
|
|
|||||
|
Cargo
|
618
|
|
596
|
|
560
|
|
|||||
|
Total International Package
|
12,988
|
|
12,429
|
|
12,124
|
|
|||||
|
Supply Chain & Freight:
|
|||||||||||
|
Forwarding and Logistics
|
5,758
|
|
5,492
|
|
5,977
|
|
|||||
|
Freight
|
3,048
|
|
2,882
|
|
2,640
|
|
|||||
|
Other
|
587
|
|
561
|
|
530
|
|
|||||
|
Total Supply Chain & Freight
|
9,393
|
|
8,935
|
|
9,147
|
|
|||||
|
Consolidated
|
$
|
58,232
|
|
$
|
55,438
|
|
$
|
54,127
|
|
||
Geographic information as of, and for the years ended, December 31 is as follows (in millions):
|
2014
|
2013
|
2012
|
|||||||||
|
United States:
|
|||||||||||
|
Revenue
|
$
|
43,840
|
|
$
|
41,772
|
|
$
|
40,428
|
|
||
|
Long-lived assets
|
$
|
15,902
|
|
$
|
15,651
|
|
$
|
16,262
|
|
||
|
International:
|
|||||||||||
|
Revenue
|
$
|
14,392
|
|
$
|
13,666
|
|
$
|
13,699
|
|
||
|
Long-lived assets
|
$
|
6,105
|
|
$
|
6,297
|
|
$
|
5,312
|
|
||
|
Consolidated:
|
|||||||||||
|
Revenue
|
$
|
58,232
|
|
$
|
55,438
|
|
$
|
54,127
|
|
||
|
Long-lived assets
|
$
|
22,007
|
|
$
|
21,948
|
|
$
|
21,574
|
|
||
Long-lived assets include property, plant and equipment, pension and postretirement benefit assets, long-term investments, goodwill, and intangible assets.
No countries outside of the United States, nor any individual customers, provided 10% or more of consolidated revenue for the years ended
December 31, 2014
,
2013
or
2012
.
103
UNITED PARCEL SERVICE, INC. AND SUBSIDIARIES
NOTES TO CONSOLIDATED FINANCIAL STATEMENTS
The income tax expense (benefit) for the years ended
December 31
consists of the following (in millions):
|
2014
|
2013
|
2012
|
|||||||||
|
Current:
|
|||||||||||
|
U.S. Federal
|
$
|
932
|
|
$
|
2,181
|
|
$
|
1,901
|
|
||
|
U.S. State and Local
|
103
|
|
205
|
|
182
|
|
|||||
|
Non-U.S.
|
185
|
|
162
|
|
167
|
|
|||||
|
Total Current
|
1,220
|
|
2,548
|
|
2,250
|
|
|||||
|
Deferred:
|
|||||||||||
|
U.S. Federal
|
427
|
|
(242
|
)
|
(1,871
|
)
|
|||||
|
U.S. State and Local
|
(11
|
)
|
(22
|
)
|
(201
|
)
|
|||||
|
Non-U.S.
|
(31
|
)
|
18
|
|
(11
|
)
|
|||||
|
Total Deferred
|
385
|
|
(246
|
)
|
(2,083
|
)
|
|||||
|
Total
|
$
|
1,605
|
|
$
|
2,302
|
|
$
|
167
|
|
||
Income before income taxes includes the following components (in millions):
|
2014
|
2013
|
2012
|
|||||||||
|
United States
|
$
|
3,819
|
|
$
|
6,040
|
|
$
|
384
|
|
||
|
Non-U.S.
|
818
|
|
634
|
|
590
|
|
|||||
|
$
|
4,637
|
|
$
|
6,674
|
|
$
|
974
|
|
|||
A reconciliation of the statutory federal income tax rate to the effective income tax rate for the years ended
December 31
consists of the following:
|
2014
|
2013
|
2012
|
||||||
|
Statutory U.S. federal income tax rate
|
35.0
|
%
|
35.0
|
%
|
35.0
|
%
|
||
|
U.S. state and local income taxes (net of federal benefit)
|
1.2
|
|
2.1
|
|
—
|
|
||
|
Non-U.S. tax rate differential
|
(2.4
|
)
|
(1.3
|
)
|
(6.1
|
)
|
||
|
Nondeductible/nontaxable items
|
1.3
|
|
(0.2
|
)
|
(0.4
|
)
|
||
|
U.S. federal tax credits
|
(1.5
|
)
|
(1.2
|
)
|
(7.4
|
)
|
||
|
Other
|
1.0
|
|
0.1
|
|
(4.0
|
)
|
||
|
Effective income tax rate
|
34.6
|
%
|
34.5
|
%
|
17.1
|
%
|
||
Our effective tax rate increased to
34.6%
in
2014
, compared with
34.5%
in
2013
, largely due to the impact of the gain from liquidating a foreign subsidiary in early 2013 not being taxable (see note 15), offset by favorable changes in the proportion of our taxable income in certain U.S. and non-U.S. jurisdictions relative to total pre-tax income and the increase in U.S. Federal and state tax credits relative to total pre-tax income.
Beginning in 2012, we were granted a tax incentive for certain of our non-U.S. operations, which is effective through December 31, 2017 and may be extended through December 31, 2022 if additional requirements are satisfied. The tax incentive is conditional upon our meeting specific employment and investment thresholds. The impact of this tax incentive decreased non-U.S. tax expense by $
21
and $
20
million for
2014
and
2013
, respectively.
104
UNITED PARCEL SERVICE, INC. AND SUBSIDIARIES
NOTES TO CONSOLIDATED FINANCIAL STATEMENTS
Deferred tax liabilities and assets are comprised of the following at
December 31
(in millions):
|
2014
|
2013
|
||||||
|
Fixed assets and capitalized software
|
$
|
(4,816
|
)
|
$
|
(4,624
|
)
|
|
|
Other
|
(424
|
)
|
(756
|
)
|
|||
|
Deferred tax liabilities
|
(5,240
|
)
|
(5,380
|
)
|
|||
|
Pension and postretirement benefits
|
4,722
|
|
3,086
|
|
|||
|
Loss and credit carryforwards (non-U.S. and state)
|
250
|
|
279
|
|
|||
|
Insurance reserves
|
745
|
|
765
|
|
|||
|
Stock compensation
|
242
|
|
70
|
|
|||
|
Other
|
630
|
|
933
|
|
|||
|
Deferred tax assets
|
6,589
|
|
5,133
|
|
|||
|
Deferred tax assets valuation allowance
|
(208
|
)
|
(251
|
)
|
|||
|
Deferred tax asset (net of valuation allowance)
|
6,381
|
|
4,882
|
|
|||
|
Net deferred tax asset (liability)
|
$
|
1,141
|
|
$
|
(498
|
)
|
|
|
Amounts recognized in the consolidated balance sheets:
|
|||||||
|
Current deferred tax assets
|
$
|
590
|
|
$
|
684
|
|
|
|
Current deferred tax liabilities (included in other current liabilities)
|
(18
|
)
|
(48
|
)
|
|||
|
Non-current deferred tax assets
|
652
|
|
110
|
|
|||
|
Non-current deferred tax liabilities
|
(83
|
)
|
(1,244
|
)
|
|||
|
Net deferred tax asset (liability)
|
$
|
1,141
|
|
$
|
(498
|
)
|
|
The valuation allowance changed by $
(43)
, $
31
and $
15
million during the years ended
December 31, 2014
,
2013
and
2012
, respectively.
We have U.S. state and local operating loss and credit carryforwards as follows (in millions):
|
2014
|
2013
|
||||||
|
U.S. state and local operating loss carryforwards
|
$
|
815
|
|
$
|
546
|
|
|
|
U.S. state and local credit carryforwards
|
$
|
52
|
|
$
|
42
|
|
|
The operating loss carryforwards expire at varying dates through
2034
. The state credits can be carried forward for periods ranging from
three years
to indefinitely.
We also have non-U.S. loss carryforwards of approximately $
586
million as of
December 31, 2014
, the majority of which may be carried forward
indefinitely
. As indicated in the table above, we have established a valuation allowance for certain non-U.S. and state carryforwards, due to the uncertainty resulting from a lack of previous taxable income within the applicable tax jurisdictions.
Undistributed earnings of foreign subsidiaries amounted to approximately $
4.683
billion at
December 31, 2014
. Those earnings are considered to be indefinitely reinvested and, accordingly, no deferred income taxes have been provided thereon. Upon distribution of those earnings in the form of dividends or otherwise, we would be subject to income taxes and withholding taxes payable in various jurisdictions, which could potentially be offset by foreign tax credits. Determination of the amount of unrecognized deferred income tax liability is not practicable because of the complexities associated with its hypothetical calculation.
105
UNITED PARCEL SERVICE, INC. AND SUBSIDIARIES
NOTES TO CONSOLIDATED FINANCIAL STATEMENTS
The following table summarizes the activity related to our unrecognized tax benefits (in millions):
|
Tax
|
Interest
|
Penalties
|
|||||||||
|
Balance at January 1, 2012
|
$
|
252
|
|
$
|
73
|
|
$
|
3
|
|
||
|
Additions for tax positions of the current year
|
13
|
|
—
|
|
—
|
|
|||||
|
Additions for tax positions of prior years
|
7
|
|
9
|
|
1
|
|
|||||
|
Reductions for tax positions of prior years for:
|
|||||||||||
|
Changes based on facts and circumstances
|
(22
|
)
|
(18
|
)
|
—
|
|
|||||
|
Settlements during the period
|
(3
|
)
|
(7
|
)
|
—
|
|
|||||
|
Lapses of applicable statute of limitations
|
(15
|
)
|
(4
|
)
|
—
|
|
|||||
|
Balance at December 31, 2012
|
232
|
|
53
|
|
4
|
|
|||||
|
Additions for tax positions of the current year
|
15
|
|
—
|
|
—
|
|
|||||
|
Additions for tax positions of prior years
|
20
|
|
9
|
|
2
|
|
|||||
|
Reductions for tax positions of prior years for:
|
|||||||||||
|
Changes based on facts and circumstances
|
(67
|
)
|
(23
|
)
|
(1
|
)
|
|||||
|
Settlements during the period
|
(8
|
)
|
1
|
|
—
|
|
|||||
|
Lapses of applicable statute of limitations
|
(1
|
)
|
—
|
|
(1
|
)
|
|||||
|
Balance at December 31, 2013
|
191
|
|
40
|
|
4
|
|
|||||
|
Additions for tax positions of the current year
|
15
|
|
—
|
|
—
|
|
|||||
|
Additions for tax positions of prior years
|
51
|
|
13
|
|
—
|
|
|||||
|
Reductions for tax positions of prior years for:
|
|||||||||||
|
Changes based on facts and circumstances
|
(74
|
)
|
(8
|
)
|
—
|
|
|||||
|
Settlements during the period
|
(10
|
)
|
(2
|
)
|
—
|
|
|||||
|
Lapses of applicable statute of limitations
|
(1
|
)
|
(1
|
)
|
(1
|
)
|
|||||
|
Balance at December 31, 2014
|
$
|
172
|
|
$
|
42
|
|
$
|
3
|
|
||
The total amount of gross unrecognized tax benefits as of
December 31, 2014
,
2013
and
2012
that, if recognized, would affect the effective tax rate was $
166
, $
185
and $
224
million, respectively. We also had gross recognized tax benefits of $
54
, $
281
and $
280
million recorded as of
December 31, 2014
,
2013
and
2012
, respectively, associated with outstanding refund claims for prior tax years. We had a net payable recorded with respect to prior years’ income tax matters in the accompanying consolidated balance sheets as of December 31, 2014, and a net receivable recorded with respect to prior years’ income tax matters as of December 31, 2013 and 2012. We have also recognized a receivable for interest of $
4
, $
25
and $
23
million for the recognized tax benefits associated with outstanding refund claims as of
December 31, 2014
,
2013
and
2012
, respectively. Our continuing practice is to recognize interest and penalties associated with income tax matters as a component of income tax expense.
We file income tax returns in the U.S. federal jurisdiction, most U.S. state and local jurisdictions, and many non-U.S. jurisdictions. We have substantially resolved all U.S. federal income tax matters for tax years prior to
2010
.
In
June 2011
, we received an IRS Revenue Agent Report ("RAR") covering income taxes for tax years
2005
through
2007
. The income tax RAR proposed adjustments related to the value of acquired software and intangibles, research credit expenditures, and the amount of deductible costs associated with our British Pound Sterling Notes exchange offer completed in
May 2007
. Receipt of the RAR represents only the conclusion of the examination process. We disagreed with some of the proposed adjustments related to these matters. Therefore, we filed protests and, in the
third quarter
of
2011
, the IRS responded to our protests and forwarded the case to IRS Appeals.
In July 2013, we began resolution discussions with IRS Appeals on the income tax matters. In the second quarter of 2014, we reached a final resolution with IRS Appeals on all income tax matters for the 2005 through 2007 tax years and received a net refund of tax and interest totaling $
145
million during the second quarter of 2014. The resolution of these matters and subsequent refund of tax and interest did not have a material impact on net income.
106
UNITED PARCEL SERVICE, INC. AND SUBSIDIARIES
NOTES TO CONSOLIDATED FINANCIAL STATEMENTS
In February 2014, we began resolution discussions with IRS Appeals related to an RAR received for tax years 2008 and 2009. In the third quarter of 2014, we reached a final resolution with IRS Appeals on all income tax matters for the 2008 and 2009 tax years. In the fourth quarter of 2014 we received a net refund of tax and interest totaling $
26
million. The resolution of these matters and subsequent refund of tax and interest did not have a material impact on net income.
A number of years may elapse before an uncertain tax position is audited and ultimately settled. It is difficult to predict the ultimate outcome or the timing of resolution for uncertain tax positions. It is reasonably possible that the amount of unrecognized tax benefits could significantly increase or decrease within the next twelve months. Items that may cause changes to unrecognized tax benefits include the timing of interest deductions and the allocation of income and expense between tax jurisdictions. These changes could result from the settlement of ongoing litigation, the completion of ongoing examinations, the expiration of the statute of limitations or other unforeseen circumstances. At this time, an estimate of the range of the reasonably possible change cannot be made.
The following table sets forth the computation of basic and diluted earnings per share (in millions, except per share amounts):
|
2014
|
2013
|
2012
|
|||||||||
|
Numerator:
|
|||||||||||
|
Net income attributable to common shareowners
|
$
|
3,032
|
|
$
|
4,372
|
|
$
|
807
|
|
||
|
Denominator:
|
|||||||||||
|
Weighted average shares
|
913
|
|
937
|
|
957
|
|
|||||
|
Deferred compensation obligations
|
1
|
|
1
|
|
1
|
|
|||||
|
Vested portion of restricted shares
|
2
|
|
2
|
|
2
|
|
|||||
|
Denominator for basic earnings per share
|
916
|
|
940
|
|
960
|
|
|||||
|
Effect of dilutive securities:
|
|||||||||||
|
Restricted performance units
|
7
|
|
7
|
|
8
|
|
|||||
|
Stock options
|
1
|
|
1
|
|
1
|
|
|||||
|
Denominator for diluted earnings per share
|
924
|
|
948
|
|
969
|
|
|||||
|
Basic earnings per share
|
$
|
3.31
|
|
$
|
4.65
|
|
$
|
0.84
|
|
||
|
Diluted earnings per share
|
$
|
3.28
|
|
$
|
4.61
|
|
$
|
0.83
|
|
||
Diluted earnings per share for the years ended
December 31, 2014
,
2013
, and
2012
exclude the effect of
0.1
,
0.1
and
2.6
million shares, respectively, of common stock that may be issued upon the exercise of employee stock options because such effect would be antidilutive.
107
UNITED PARCEL SERVICE, INC. AND SUBSIDIARIES
NOTES TO CONSOLIDATED FINANCIAL STATEMENTS
Risk Management Policies
We are exposed to market risk, primarily related to foreign exchange rates, commodity prices and interest rates. These exposures are actively monitored by management. To manage the volatility relating to certain of these exposures, we enter into a variety of derivative financial instruments. Our objective is to reduce, where it is deemed appropriate to do so, fluctuations in earnings and cash flows associated with changes in foreign currency rates, commodity prices and interest rates. It is our policy and practice to use derivative financial instruments only to the extent necessary to manage exposures. As we use price sensitive instruments to hedge a certain portion of our existing and anticipated transactions, we expect that any loss in value for those instruments generally would be offset by increases in the value of those hedged transactions. We do not hold or issue derivative financial instruments for trading or speculative purposes.
Credit Risk Management
The forward contracts, swaps and options discussed below contain an element of risk that the counterparties may be unable to meet the terms of the agreements. However, we minimize such risk exposures for these instruments by limiting the counterparties to financial institutions that meet established credit guidelines and monitoring counterparty credit risk to prevent concentrations of credit risk with any single counterparty.
We have agreements with all of our active counterparties (covering the majority of our derivative positions) containing early termination rights and/or zero threshold bilateral collateral provisions whereby cash is required based on the net fair value of derivatives associated with those counterparties. Events such as a counterparty credit rating downgrade (depending on the ultimate rating level) could also allow us to take additional protective measures such as the early termination of trades. At
December 31, 2014
, we held cash collateral of $
548
million under these agreements.
In connection with the agreements described above, we could also be required to provide additional collateral or terminate transactions with certain counterparties in the event of a downgrade of our credit rating. The amount of collateral required would be determined by the net fair value of the associated derivatives with each counterparty. At
December 31, 2014
, we were required to post $
1
million in collateral with our counterparties. At
December 31, 2014
, there were
no
instruments in a net liability position that were not covered by the zero threshold bilateral collateral provisions.
We have not historically incurred, and do not expect to incur in the future, any losses as a result of counterparty default.
Accounting Policy for Derivative Instruments
We recognize all derivative instruments as assets or liabilities in the consolidated balance sheets at fair value. The accounting for changes in the fair value of a derivative instrument depends on whether it has been designated and qualifies as part of a hedging relationship and, further, on the type of hedging relationship. For those derivative instruments that are designated and qualify as hedging instruments, we must designate the derivative, based upon the exposure being hedged, as a cash flow hedge, a fair value hedge or a hedge of a net investment in a foreign operation.
A cash flow hedge refers to hedging the exposure to variability in expected future cash flows that is attributable to a particular risk. For derivative instruments that are designated and qualify as a cash flow hedge, the effective portion of the gain or loss on the derivative instrument is reported as a component of AOCI, and reclassified into earnings in the same period during which the hedged transaction affects earnings. The remaining gain or loss on the derivative instrument in excess of the cumulative change in the present value of future cash flows of the hedged item, or hedge components excluded from the assessment of effectiveness, are recognized in the statements of consolidated income during the current period.
A fair value hedge refers to hedging the exposure to changes in the fair value of an existing asset or liability on the consolidated balance sheets that is attributable to a particular risk. For derivative instruments that are designated and qualify as a fair value hedge, the gain or loss on the derivative instrument is recognized in the statements of consolidated income during the current period, as well as the offsetting gain or loss on the hedged item.
A net investment hedge refers to the use of cross currency swaps, forward contracts or foreign currency denominated debt to hedge portions of our net investments in foreign operations. For hedges that meet the effectiveness requirements, the net gains or losses attributable to changes in spot exchange rates are recorded in the cumulative translation adjustment within AOCI. The remainder of the change in value of such instruments is recorded in earnings.
108
UNITED PARCEL SERVICE, INC. AND SUBSIDIARIES
NOTES TO CONSOLIDATED FINANCIAL STATEMENTS
Types of Hedges
Commodity Risk Management
Currently, the fuel surcharges that we apply to our domestic and international package and LTL services are the primary means of reducing the risk of adverse fuel price changes on our business. We periodically enter into option contracts on energy commodity products to manage the price risk associated with forecasted transactions involving refined fuels, principally jet-A, diesel and unleaded gasoline. The objective of the hedges is to reduce the variability of cash flows, due to changing fuel prices, associated with the forecasted transactions involving those products. We have designated and account for these contracts as cash flow hedges of the underlying forecasted transactions involving these fuel products and, therefore, the resulting gains and losses from these hedges are recognized as a component of fuel expense or revenue when the underlying transactions occur.
Foreign Currency Risk Management
To protect against the reduction in value of forecasted foreign currency cash flows from our international package business, we maintain a foreign currency cash flow hedging program. Our most significant foreign currency exposures relate to the Euro, British Pound Sterling, Canadian Dollar, Chinese Renminbi and Hong Kong Dollar. We hedge portions of our forecasted revenue denominated in foreign currencies with option contracts. We have designated and account for these contracts as cash flow hedges of anticipated foreign currency denominated revenue and, therefore, the resulting gains and losses from these hedges are recognized as a component of international package revenue when the underlying sales transactions occur.
We also hedge portions of our anticipated cash settlements of intercompany transactions subject to foreign currency remeasurement using foreign currency forward contracts. We have designated and account for these contracts as cash flow hedges of forecasted foreign currency denominated transactions, and therefore the resulting gains and losses from these hedges are recognized as a component of other operating expense when the underlying transactions are subject to currency remeasurement.
We have foreign currency denominated debt obligations and capital lease obligations associated with our aircraft. For some of these debt obligations and leases, we hedge the foreign currency denominated contractual payments using cross-currency interest rate swaps, which effectively convert the foreign currency denominated contractual payments into U.S. Dollar denominated payments. We have designated and account for these swaps as cash flow hedges of the forecasted contractual payments and, therefore, the resulting gains and losses from these hedges are recognized in the statements of consolidated income when the currency remeasurement gains and losses on the underlying debt obligations and leases are incurred.
Interest Rate Risk Management
Our indebtedness under our various financing arrangements creates interest rate risk. We use a combination of derivative instruments, including interest rate swaps and cross-currency interest rate swaps, as part of our program to manage the fixed and floating interest rate mix of our total debt portfolio and related overall cost of borrowing. The notional amount, interest payment and maturity dates of the swaps match the terms of the associated debt being hedged. Interest rate swaps allow us to maintain a target range of floating rate debt within our capital structure.
We have designated and account for interest rate swaps that convert fixed rate interest payments into floating rate interest payments as hedges of the fair value of the associated debt instruments. Therefore, the gains and losses resulting from fair value adjustments to the interest rate swaps and fair value adjustments to the associated debt instruments are recorded to interest expense in the period in which the gains and losses occur. We have designated and account for interest rate swaps that convert floating rate interest payments into fixed rate interest payments as cash flow hedges of the forecasted payment obligations. The gains and losses resulting from fair value adjustments to these interest rate swaps are recorded to AOCI.
We periodically hedge the forecasted fixed-coupon interest payments associated with anticipated debt offerings, using forward starting interest rate swaps, interest rate locks or similar derivatives. These agreements effectively lock a portion of our interest rate exposure between the time the agreement is entered into and the date when the debt offering is completed, thereby mitigating the impact of interest rate changes on future interest expense. These derivatives are settled commensurate with the issuance of the debt, and any gain or loss upon settlement is amortized as an adjustment to the effective interest yield on the debt.
109
UNITED PARCEL SERVICE, INC. AND SUBSIDIARIES
NOTES TO CONSOLIDATED FINANCIAL STATEMENTS
Outstanding Positions
The notional amounts of our outstanding derivative positions were as follows as of
December 31, 2014
and
2013
(in millions):
|
|
2014
|
2013
|
|||||
|
Currency Hedges:
|
|||||||
|
Euro
|
EUR
|
2,833
|
|
2,637
|
|
||
|
British Pound Sterling
|
GBP
|
1,149
|
|
1,097
|
|
||
|
Canadian Dollar
|
CAD
|
293
|
|
218
|
|
||
|
Indian Rupee
|
INR
|
85
|
|
—
|
|
||
|
Malaysian Ringgit
|
MYR
|
150
|
|
—
|
|
||
|
Mexican Peso
|
MXN
|
152
|
|
583
|
|
||
|
Interest Rate Hedges:
|
|||||||
|
Fixed to Floating Interest Rate Swaps
|
USD
|
5,799
|
|
6,799
|
|
||
|
Floating to Fixed Interest Rate Swaps
|
USD
|
779
|
|
780
|
|
||
|
Interest Rate Basis Swaps
|
USD
|
1,500
|
|
2,500
|
|
||
As of
December 31, 2014
, we had no outstanding commodity hedge positions. The maximum term over which we are hedging exposures to the variability of cash flow is
35
years.
Balance Sheet Recognition
The following table indicates the location on the consolidated balance sheets in which our derivative assets and liabilities have been recognized, and the related fair values of those derivatives as of
December 31, 2014
and
2013
(in millions). The table is segregated between those derivative instruments that qualify and are designated as hedging instruments and those that are not, as well as by type of contract and whether the derivative is in an asset or liability position.
We have master netting arrangements with substantially all of our counterparties giving us the right of offset for our derivative positions. However, we have not elected to offset the fair value positions of our derivative contracts recorded on our consolidated balance sheets. The columns labeled "net amounts if right of offset had been applied" indicate the potential net fair value positions by type of contract and location on the consolidated balance sheets had we elected to apply the right of offset.
|
Gross Amounts Presented in
Consolidated Balance Sheets |
Net Amounts if Right of
Offset had been Applied |
||||||||||||||||
|
Asset Derivatives
|
Balance Sheet Location
|
2014
|
2013
|
2014
|
2013
|
||||||||||||
|
Derivatives designated as hedges:
|
|||||||||||||||||
|
Foreign exchange contracts
|
Other current assets
|
$
|
204
|
|
$
|
10
|
|
$
|
204
|
|
$
|
4
|
|
||||
|
Interest rate contracts
|
Other current assets
|
—
|
|
7
|
|
—
|
|
7
|
|
||||||||
|
Foreign exchange contracts
|
Other non-current assets
|
229
|
|
59
|
|
229
|
|
59
|
|
||||||||
|
Interest rate contracts
|
Other non-current assets
|
227
|
|
204
|
|
194
|
|
110
|
|
||||||||
|
Derivatives not designated as hedges:
|
|||||||||||||||||
|
Foreign exchange contracts
|
Other current assets
|
2
|
|
7
|
|
2
|
|
5
|
|
||||||||
|
Interest rate contracts
|
Other non-current assets
|
59
|
|
60
|
|
57
|
|
57
|
|
||||||||
|
Total Asset Derivatives
|
$
|
721
|
|
$
|
347
|
|
$
|
686
|
|
$
|
242
|
|
|||||
110
UNITED PARCEL SERVICE, INC. AND SUBSIDIARIES
NOTES TO CONSOLIDATED FINANCIAL STATEMENTS
|
Gross Amounts Presented in
Consolidated Balance Sheets
|
Net Amounts if Right of
Offset had been Applied
|
||||||||||||||||
|
Liability Derivatives
|
Balance Sheet Location
|
2014
|
2013
|
2014
|
2013
|
||||||||||||
|
Derivatives designated as hedges:
|
|||||||||||||||||
|
Foreign exchange contracts
|
Other current liabilities
|
$
|
—
|
|
$
|
6
|
|
$
|
—
|
|
$
|
—
|
|
||||
|
Foreign exchange contracts
|
Other non-current liabilities
|
34
|
|
—
|
|
34
|
|
—
|
|
||||||||
|
Interest rate contracts
|
Other non-current liabilities
|
35
|
|
104
|
|
2
|
|
10
|
|
||||||||
|
Derivatives not designated as hedges:
|
|||||||||||||||||
|
Foreign exchange contracts
|
Other current liabilities
|
—
|
|
7
|
|
—
|
|
5
|
|
||||||||
|
Interest rate contracts
|
Other current liabilities
|
1
|
|
1
|
|
1
|
|
1
|
|
||||||||
|
Interest rate contracts
|
Other non-current liabilities
|
7
|
|
3
|
|
5
|
|
—
|
|
||||||||
|
Total Liability Derivatives
|
$
|
77
|
|
$
|
121
|
|
$
|
42
|
|
$
|
16
|
|
|||||
Income Statement and AOCI Recognition
The following table indicates the amount of gains and losses that have been recognized in AOCI for the years ended
December 31, 2014
and
2013
for those derivatives designated as cash flow hedges (in millions):
|
Derivative Instruments in Cash Flow Hedging Relationships
|
Amount of Gain (Loss) Recognized in AOCI on
Derivative (Effective Portion)
|
||||||||
|
2014
|
2013
|
||||||||
|
Interest rate contracts
|
$
|
(5
|
)
|
$
|
6
|
|
|||
|
Foreign exchange contracts
|
358
|
|
44
|
|
|||||
|
Commodity contracts
|
—
|
|
(48
|
)
|
|||||
|
Total
|
$
|
353
|
|
$
|
2
|
|
|||
As of
December 31, 2014
, $
135
million of pre-tax gains related to cash flow hedges that are currently deferred in AOCI are expected to be reclassified to income over the 12 month period ended
December 31, 2015
. The actual amounts that will be reclassified to income over the next 12 months will vary from this amount as a result of changes in market conditions.
The amount of ineffectiveness recognized in income on derivative instruments designated in cash flow hedging relationships was immaterial for the years ended
December 31, 2014
,
2013
and
2012
.
The following table indicates the amount and location in the statements of consolidated income in which derivative gains and losses, as well as the associated gains and losses on the underlying exposure, have been recognized for those derivatives designated as fair value hedges for the years ended
December 31, 2014
and
2013
(in millions):
|
Derivative Instruments
in Fair Value Hedging
Relationships
|
Location of
Gain (Loss)
Recognized in
Income
|
Amount of Gain (Loss)
Recognized in Income
|
Hedged Items in
Fair Value Hedging
Relationships
|
Location of
Gain (Loss)
Recognized in
Income
|
Amount of Gain (Loss)
Recognized in Income
|
|||||||||||||||||
|
2014
|
2013
|
2014
|
2013
|
|||||||||||||||||||
|
Interest rate contracts
|
Interest Expense
|
$
|
90
|
|
$
|
(306
|
)
|
Fixed-Rate Debt
and Capital Leases
|
Interest Expense
|
$
|
(90
|
)
|
$
|
306
|
|
|||||||
Additionally, we maintain some foreign exchange forward, interest rate swap, and commodity contracts that are not designated as hedges. These foreign exchange forward contracts are intended to provide an economic offset to foreign currency remeasurement risks for certain assets and liabilities in our consolidated balance sheets. These interest rate swap contracts are intended to provide an economic hedge of a portfolio of interest bearing receivables. These commodity contracts are intended to provide a short-term economic offset to fuel expense changes due to price fluctuations.
We also periodically terminate interest rate swaps and foreign currency options by entering into offsetting swap and foreign currency positions with different counterparties. As part of this process, we de-designate our original swap and foreign currency contracts. These transactions provide an economic offset that effectively eliminates the effects of changes in market valuation.
111
UNITED PARCEL SERVICE, INC. AND SUBSIDIARIES
NOTES TO CONSOLIDATED FINANCIAL STATEMENTS
We have entered into several interest rate basis swaps, which effectively convert cash flows based on variable LIBOR-based interest rates to cash flows based on the prevailing federal funds interest rate. These swaps are not designated as hedges, and all amounts related to fair value changes and settlements are recorded to interest expense in the statements of consolidated income.
The following is a summary of the amounts recorded in the statements of consolidated income related to fair value changes and settlements of these foreign currency forward, interest rate swap, and commodity contracts not designated as hedges for the years ended
December 31, 2014
and
2013
(in millions):
|
Derivative Instruments Not Designated in
Hedging Relationships
|
Location of Gain
(Loss) Recognized
in Income
|
Amount of Gain (Loss) Recognized in Income
|
||||||||
|
2014
|
2013
|
|||||||||
|
Commodity contracts
|
Fuel Expense
|
$
|
(15
|
)
|
$
|
—
|
|
|||
|
Foreign exchange contracts
|
Other Expenses
|
27
|
|
72
|
|
|||||
|
Foreign exchange contracts
|
Investment Income
|
7
|
|
(5
|
)
|
|||||
|
Interest rate contracts
|
Interest Expense
|
(5
|
)
|
(4
|
)
|
|||||
|
Total
|
$
|
14
|
|
$
|
63
|
|
||||
Fair Value Measurements
Our foreign currency, interest rate and energy derivatives are largely comprised of over-the-counter derivatives, which are primarily valued using pricing models that rely on market observable inputs such as yield curves, currency exchange rates and commodity forward prices, and therefore are classified as Level 2. The fair values of our derivative assets and liabilities as of
December 31, 2014
and
2013
by hedge type are as follows (in millions):
|
Quoted Prices in
Active Markets for
Identical Assets
(Level 1)
|
Significant
Other
Observable
Inputs
(Level 2)
|
Significant
Unobservable
Inputs
(Level 3)
|
Total
|
|||||||||||||
|
2014
|
||||||||||||||||
|
Assets
|
||||||||||||||||
|
Foreign Exchange Contracts
|
$
|
—
|
|
$
|
435
|
|
$
|
—
|
|
$
|
435
|
|
||||
|
Interest Rate Contracts
|
—
|
|
286
|
|
—
|
|
286
|
|
||||||||
|
Total
|
$
|
—
|
|
$
|
721
|
|
$
|
—
|
|
$
|
721
|
|
||||
|
Liabilities
|
||||||||||||||||
|
Foreign Exchange Contracts
|
$
|
—
|
|
$
|
34
|
|
$
|
—
|
|
$
|
34
|
|
||||
|
Interest Rate Contracts
|
—
|
|
43
|
|
—
|
|
43
|
|
||||||||
|
Total
|
$
|
—
|
|
$
|
77
|
|
$
|
—
|
|
$
|
77
|
|
||||
|
|
Quoted Prices in
Active Markets for
Identical Assets
(Level 1)
|
Significant
Other
Observable
Inputs
(Level 2)
|
Significant
Unobservable
Inputs
(Level 3)
|
Total
|
||||||||||||
|
2013
|
||||||||||||||||
|
Assets
|
||||||||||||||||
|
Foreign Exchange Contracts
|
$
|
—
|
|
$
|
76
|
|
$
|
—
|
|
$
|
76
|
|
||||
|
Interest Rate Contracts
|
—
|
|
271
|
|
—
|
|
271
|
|
||||||||
|
Total
|
$
|
—
|
|
$
|
347
|
|
$
|
—
|
|
$
|
347
|
|
||||
|
Liabilities
|
||||||||||||||||
|
Foreign Exchange Contracts
|
$
|
—
|
|
$
|
13
|
|
$
|
—
|
|
$
|
13
|
|
||||
|
Interest Rate Contracts
|
—
|
|
108
|
|
—
|
|
108
|
|
||||||||
|
Total
|
$
|
—
|
|
$
|
121
|
|
$
|
—
|
|
$
|
121
|
|
||||
112
UNITED PARCEL SERVICE, INC. AND SUBSIDIARIES
NOTES TO CONSOLIDATED FINANCIAL STATEMENTS
TNT Termination Fee and Related Costs
On January 30, 2013, the European Commission issued a formal decision prohibiting our proposed acquisition of TNT Express N.V. (“TNT Express”). As a result of the prohibition by the European Commission, the condition of our offer requiring European Union competition clearance was not fulfilled, and our proposed acquisition of TNT Express could not be completed. Given this outcome, UPS and TNT Express entered a separate agreement to terminate the merger protocol, and we withdrew our formal offer for TNT Express. We paid a termination fee to TNT Express of
€200
million (
$268
million) under this agreement, and also incurred transaction-related expenses of $
16
million during the first quarter of 2013. The combination of these items resulted in a pre-tax charge of $
284
million ($
177
million after-tax), which impacted our International Package segment.
Gain upon the Liquidation of a Foreign Subsidiary
Subsequent to the termination of the merger protocol, we liquidated a foreign subsidiary that would have been used to acquire the outstanding shares of TNT Express in connection with the proposed acquisition. Upon the liquidation of this subsidiary in the first quarter of 2013, we realized a pre-tax foreign currency gain of $
245
million ($
213
million after-tax), which impacted our International Package segment.
Our revenue, segment operating profit, net income, basic and diluted earnings per share on a quarterly basis are presented below (in millions, except per share amounts):
|
|
First Quarter
|
Second Quarter
|
Third Quarter
|
Fourth Quarter
|
|||||||||||||||||||||||||||
|
|
2014
|
2013
|
2014
|
2013
|
2014
|
2013
|
2014
|
2013
|
|||||||||||||||||||||||
|
Revenue:
|
|||||||||||||||||||||||||||||||
|
U.S. Domestic Package
|
$
|
8,488
|
|
$
|
8,271
|
|
$
|
8,668
|
|
$
|
8,241
|
|
$
|
8,691
|
|
$
|
8,254
|
|
$
|
10,004
|
|
$
|
9,308
|
|
|||||||
|
International Package
|
3,127
|
|
2,978
|
|
3,252
|
|
3,062
|
|
3,183
|
|
3,017
|
|
3,426
|
|
3,372
|
|
|||||||||||||||
|
Supply Chain & Freight
|
2,164
|
|
2,185
|
|
2,348
|
|
2,204
|
|
2,416
|
|
2,250
|
|
2,465
|
|
2,296
|
|
|||||||||||||||
|
Total revenue
|
13,779
|
|
13,434
|
|
14,268
|
|
13,507
|
|
14,290
|
|
13,521
|
|
15,895
|
|
14,976
|
|
|||||||||||||||
|
Operating profit (loss):
|
|||||||||||||||||||||||||||||||
|
U.S. Domestic Package
|
927
|
|
1,085
|
|
209
|
|
1,132
|
|
1,279
|
|
1,186
|
|
444
|
|
1,200
|
|
|||||||||||||||
|
International Package
|
438
|
|
352
|
|
444
|
|
451
|
|
460
|
|
417
|
|
335
|
|
537
|
|
|||||||||||||||
|
Supply Chain & Freight
|
148
|
|
143
|
|
94
|
|
159
|
|
215
|
|
201
|
|
(25
|
)
|
171
|
|
|||||||||||||||
|
Total operating profit
|
1,513
|
|
1,580
|
|
747
|
|
1,742
|
|
1,954
|
|
1,804
|
|
754
|
|
1,908
|
|
|||||||||||||||
|
Net income
|
$
|
911
|
|
$
|
1,037
|
|
$
|
454
|
|
$
|
1,071
|
|
$
|
1,214
|
|
$
|
1,097
|
|
$
|
453
|
|
$
|
1,167
|
|
|||||||
|
Net income per share:
|
|||||||||||||||||||||||||||||||
|
Basic
|
$
|
0.99
|
|
$
|
1.09
|
|
$
|
0.49
|
|
$
|
1.14
|
|
$
|
1.33
|
|
$
|
1.17
|
|
$
|
0.50
|
|
$
|
1.26
|
|
|||||||
|
Diluted
|
$
|
0.98
|
|
$
|
1.08
|
|
$
|
0.49
|
|
$
|
1.13
|
|
$
|
1.32
|
|
$
|
1.16
|
|
$
|
0.49
|
|
$
|
1.25
|
|
|||||||
Operating profit for the quarter ended
December 31, 2014
was impacted by
two
items, as follows:
|
•
|
A mark-to-market loss of $
1.062
billion on our pension and postretirement benefit plans related to the remeasurement of plan assets and liabilities recognized outside of a 10% corridor (allocated as follows—U.S. Domestic Package $
660
million, International Package $
200
million, Supply Chain & Freight $
202
million). This loss reduced net income by $
670
million, and basic and diluted earnings per share by $
0.74
.
|
|
•
|
A pre-tax charge of $
36
million associated with the remeasurement and settlement of postretirement health and welfare benefit obligations for certain employees covered by collective bargaining agreements (allocated as follows—U.S. Domestic Package $
33
million, International Package $
1
million, Supply Chain & Freight $
2
million). This charge reduced net income by $
22
million, and basic and diluted earnings per share by $
0.02
.
|
113
UNITED PARCEL SERVICE, INC. AND SUBSIDIARIES
NOTES TO CONSOLIDATED FINANCIAL STATEMENTS
Operating profit for the quarter ended
June 30, 2014
was impacted by a pre-tax charge of $
1.066
billion associated with curtailment, remeasurement and settlement of postretirement health and welfare benefit obligations for certain employees covered by collective bargaining agreements (allocated as follows—U.S. Domestic Package $
957
million, International Package $
27
million, Supply Chain & Freight $
82
million). This charge reduced net income by $
665
million, and basic and diluted earnings per share by $
0.73
and $
0.72
, respectively.
The curtailment, remeasurement and settlement charges described above that impacted the quarters ended
June 30, 2014
and
December 31, 2014
are discussed further in note 5.
Operating profit for the quarter ended
March 31, 2013
was impacted by two items: (1) The termination fee and transaction-related expenses for our proposed acquisition of TNT Express, and (2) The foreign currency gain realized upon the liquidation of a subsidiary that would have been used to acquire the shares of TNT Express. These two items are discussed further in note 15. The combination of these two items reduced the operating profit for the International Package segment by $
39
million, increased net income by $
36
million, and increased basic and diluted earnings per share by $
0.04
.
114
|
Item 9.
|
Changes in and Disagreements with Accountants on Accounting and Financial Disclosure
|
None.
|
Item 9A.
|
Controls and Procedures
|
Evaluation of Disclosure Controls and Procedures:
As of the end of the period covered by this report, management, including our chief executive officer and chief financial officer, evaluated the effectiveness of the design and operation of our disclosure controls and procedures and internal controls over financial reporting. Based upon, and as of the date of, the evaluation, our chief executive officer and chief financial officer concluded that the disclosure controls and procedures were effective to ensure that information required to be disclosed in the reports we file and submit under the Exchange Act is recorded, processed, summarized and reported as and when required and is accumulated and communicated to our management, including the Chief Executive Officer and Chief Financial Officer, as appropriate to allow timely decisions regarding required disclosure.
Changes in Internal Control:
There were no changes in the Company’s internal controls over financial reporting during the quarter ended
December 31, 2014
that have materially affected, or are reasonably likely to materially affect, the Company’s internal control over financial reporting.
Management’s Report on Internal Control Over Financial Reporting:
UPS management is responsible for establishing and maintaining adequate internal controls over financial reporting for United Parcel Service, Inc. and its subsidiaries (the “Company”). Based on the criteria for effective internal control over financial reporting established in
Internal Control—Integrated Framework
(2013)
issued by the Committee of Sponsoring Organizations of the Treadway Commission, management has assessed the Company’s internal control over financial reporting as effective as of
December 31, 2014
. The independent registered public accounting firm of Deloitte & Touche LLP, as auditors of the consolidated balance sheets of United Parcel Service, Inc. and its subsidiaries as of
December 31, 2014
and the related statements of consolidated income, consolidated comprehensive income and consolidated cash flows for the year ended
December 31, 2014
, has issued an attestation report on the Company’s internal control over financial reporting, which is included herein.
/s/ United Parcel Service, Inc.
February 27, 2015
115
Report of Independent Registered Public Accounting Firm
Board of Directors and Shareowners
United Parcel Service, Inc.
Atlanta, Georgia
We have audited the internal control over financial reporting of United Parcel Service, Inc. and subsidiaries (the “Company”) as of
December 31, 2014
, based on criteria established in
Internal Control—Integrated Framework (2013)
issued by the Committee of Sponsoring Organizations of the Treadway Commission. The Company’s management is responsible for maintaining effective internal control over financial reporting and for its assessment of the effectiveness of internal control over financial reporting, included in the accompanying Management’s Report on Internal Control Over Financial Reporting. Our responsibility is to express an opinion on the Company’s internal control over financial reporting based on our audit.
We conducted our audit in accordance with the standards of the Public Company Accounting Oversight Board (United States). Those standards require that we plan and perform the audit to obtain reasonable assurance about whether effective internal control over financial reporting was maintained in all material respects. Our audit included obtaining an understanding of internal control over financial reporting, assessing the risk that a material weakness exists, testing and evaluating the design and operating effectiveness of internal control based on the assessed risk, and performing such other procedures as we considered necessary in the circumstances. We believe that our audit provides a reasonable basis for our opinion.
A company’s internal control over financial reporting is a process designed by, or under the supervision of, the company’s principal executive and principal financial officers, or persons performing similar functions, and effected by the company’s board of directors, management, and other personnel to provide reasonable assurance regarding the reliability of financial reporting and the preparation of financial statements for external purposes in accordance with generally accepted accounting principles. A company’s internal control over financial reporting includes those policies and procedures that (1) pertain to the maintenance of records that, in reasonable detail, accurately and fairly reflect the transactions and dispositions of the assets of the company; (2) provide reasonable assurance that transactions are recorded as necessary to permit preparation of financial statements in accordance with generally accepted accounting principles, and that receipts and expenditures of the company are being made only in accordance with authorizations of management and directors of the company; and (3) provide reasonable assurance regarding prevention or timely detection of unauthorized acquisition, use, or disposition of the company’s assets that could have a material effect on the financial statements.
Because of the inherent limitations of internal control over financial reporting, including the possibility of collusion or improper management override of controls, material misstatements due to error or fraud may not be prevented or detected on a timely basis. Also, projections of any evaluation of the effectiveness of the internal control over financial reporting to future periods are subject to the risk that the controls may become inadequate because of changes in conditions, or that the degree of compliance with the policies or procedures may deteriorate.
In our opinion, the Company maintained, in all material respects, effective internal control over financial reporting as of
December 31, 2014
, based on the criteria established in
Internal Control—Integrated Framework (2013)
issued by the Committee of Sponsoring Organizations of the Treadway Commission.
We have also audited, in accordance with the standards of the Public Company Accounting Oversight Board (United States), the consolidated financial statements as of and for the year ended
December 31, 2014
of the Company and our report dated February 27,
2015
expressed an unqualified opinion on those financial statements.
/s/ Deloitte & Touche LLP
Atlanta, Georgia
February 27,
2015
116
|
Item 9B.
|
Other Information
|
None.
|
Item 10.
|
Directors, Executive Officers and Corporate Governance
|
Executive Officers of the Registrant
|
Name and Office
|
Age
|
Principal Occupation
and Employment For
the Last Five Years
|
|||
|
David P. Abney
Chief Executive Officer
|
59
|
|
Chief Executive Officer ( 2014 - present), Senior Vice President and Chief Operating Officer (2007 - 2014), President, UPS Airlines (2007 - 2008), Senior Vice President and President, UPS International (2003 - 2007).
|
||
|
James J. Barber, Jr.
President, UPS International
|
54
|
|
Senior Vice President and President, UPS International (2013 - present), Chief Operating Officer, UPS Europe, Middle East, and Africa (2010 - 2013).
|
||
|
David A. Barnes
Senior Vice President and Chief Information Officer and
Global Business Services Officer
|
59
|
|
Senior Vice President and Chief Information Officer and Global Business Services Officer (2005 - present).
|
||
|
Teresa Finley
Senior Vice President, Global Marketing
|
53
|
|
Senior Vice President of Global Marketing (2015 - Present), Treasurer (2014), Corporate Controller (2010 - 2013).
|
||
|
Alan Gershenhorn
Executive Vice President and Chief Commercial Officer
|
56
|
|
Executive Vice President and Chief Commercial Officer (2014 - present), Senior Vice President, Worldwide Sales, Marketing and Strategy (2011 - 2014), Senior Vice President, Worldwide Sales and Marketing (2008 - 2010), Senior Vice President and President, UPS International (2007), President, UPS Supply Chain Solutions - Asia and Europe (2006).
|
||
|
Myron Gray
President, United States Operations
|
57
|
|
President, United States Operations (2009 - present), Vice President, Americas Region (2008 - 2009), Vice President, North Central Region (2004 - 2008).
|
||
|
Kate Gutmann
Senior Vice President, Worldwide Sales and Solutions
|
46
|
|
Senior Vice President, Worldwide Sales and Solutions (2014 - present), President, Worldwide Sales (2011 - 2014), Vice President, Marketing UPS Europe Region (2008 - 2011).
|
||
|
Kurt P. Kuehn
Senior Vice President and Chief Financial
and Compliance Officer
|
60
|
|
Senior Vice President and Chief Financial and Compliance Officer (2015 - present), Senior Vice President and Chief Financial Officer (2008 - 2014), Treasurer (2008 - 2010), Senior Vice President, Worldwide Sales and Marketing (2004 - 2007).
|
||
|
Teri P. McClure
Chief Legal Officer and Senior Vice President, Human
Resources
|
51
|
|
Chief Legal Officer and Senior Vice President, Human Resources (2015 - present), Senior Vice President of Legal, Compliance and Public Affairs, General Counsel and Corporate Secretary (2006 - 2014), Corporate Legal Department Manager (2005 - 2006).
|
||
|
Mitch Nichols
Senior Vice President, Transportation, Engineering
and Labor Relations
|
59
|
|
Senior Vice President Transportation, Engineering and Labor Relations (2015 - Present), Senior Vice President Transportation and Engineering (2014 - 2015), President, UPS Airlines (2011 - 2014), Vice President of Air Group Operations (2007 - 2011).
|
||
117
Information about our directors is presented under the caption “Election of Directors” in our definitive Proxy Statement for the Annual Meeting of Shareowners to be held on
May 7, 2015
and is incorporated herein by reference.
Information about our Audit Committee is presented under the caption “Election of Directors—Committees of the Board of Directors—Audit Committee” in our definitive Proxy Statement for the Annual Meeting of Shareowners to be held on
May 7, 2015
and is incorporated herein by reference.
Information about our Code of Business Conduct is presented under the caption “Where You Can Find More Information” in Part I, Item 1 of this report.
Information about our compliance with Section 16 of the Exchange Act of 1934, as amended, is presented under the caption “Section 16(a) Beneficial Ownership Reporting Compliance” in our definitive Proxy Statement for the Annual Meeting of Shareowners to be held on
May 7, 2015
and is incorporated herein by reference.
|
Item 11.
|
Executive Compensation
|
Information about executive compensation is presented under the captions “Compensation Discussion and Analysis,” “Compensation of Executive Officers,” “Compensation of Directors,” “Report of the Compensation Committee” and “Compensation Committee Interlocks and Insider Participation” in our definitive Proxy Statement for the Annual Meeting of Shareowners to be held on
May 7, 2015
and is incorporated herein by reference.
|
Item 12.
|
Security Ownership of Certain Beneficial Owners and Management and Related Stockholder Matters
|
Information about security ownership is presented under the caption “Beneficial Ownership of Common Stock” in our definitive Proxy Statement for the Annual Meeting of Shareowners to be held on
May 7, 2015
and is incorporated herein by reference.
Information about our equity compensation plans is presented under the caption “Equity Compensation Plans” in our definitive Proxy Statement for the Annual Meeting of Shareowners to be held on
May 7, 2015
and is incorporated herein by reference.
|
Item 13.
|
Certain Relationships and Related Transactions, and Director Independence
|
Information about transactions with related persons is presented under the caption “Related Person Transactions” in our definitive Proxy Statement for the Annual Meeting of Shareowners to be held on
May 7, 2015
and is incorporated herein by reference.
Information about director independence is presented under the caption “Election of Directors—Director Independence” in our definitive Proxy Statement for the Annual Meeting of Shareowners to be held on
May 7, 2015
and is incorporated herein by reference.
|
Item 14.
|
Principal Accounting Fees and Services
|
Information about aggregate fees billed to us by our principal accountant is presented under the caption “Principal Accounting Firm Fees” in our definitive Proxy Statement for the Annual Meetings of Shareowners to be held on
May 7, 2015
and is incorporated herein by reference.
118
|
Item 15.
|
Exhibits and Financial Statement Schedules
|
(a) 1.
Financial Statements
.
See Item 8 for the financial statements filed with this report.
2.
Financial Statement Schedules
.
None.
3.
List of Exhibits
.
See the Exhibit Index for a list of the exhibits incorporated by reference into or filed with this report.
(b)
Exhibits required by Item 601 of Regulation S-K
.
See the Exhibit Index for a list of the exhibits incorporated by reference into or filed with this report.
(c)
Financial Statement Schedules
.
None.
119
SIGNATURES
Pursuant to the requirements of Section 13 or 15(d) of the Securities Exchange Act of 1934, United Parcel Service, Inc. has duly caused this report to be signed on its behalf by the undersigned, thereunto duly authorized.
|
UNITED PARCEL SERVICE, INC.
|
||
|
(REGISTRANT)
|
||
|
By:
|
|
/
S
/ DAVID P. ABNEY
|
|
|
David P. Abney
|
|
|
|
Chief Executive Officer
|
|
Date:
February 27, 2015
Pursuant to the requirements of the Securities Exchange Act of 1934, this report has been signed below by the following persons on behalf of the Registrant and in the capacities and on the dates indicated.
|
Signature
|
|
Title
|
|
Date
|
|
/
S
/ D
AVID
P. A
BNEY
|
|
Chief Executive Officer and Director (Principal Executive Officer)
|
|
February 27, 2015
|
|
David P. Abney
|
||||
|
/
S
/ F. D
UANE
A
CKERMAN
|
|
Director
|
|
February 27, 2015
|
|
F. Duane Ackerman
|
||||
|
/
S
/ R
ODNEY
C. A
DKINS
|
Director
|
February 27, 2015
|
||
|
Rodney C. Adkins
|
||||
|
/
S
/ M
ICHAEL
J. B
URNS
|
|
Director
|
|
February 27, 2015
|
|
Michael J. Burns
|
||||
|
/
S
/ D. S
COTT
D
AVIS
|
|
Chairman and Director
|
|
February 27, 2015
|
|
D. Scott Davis
|
||||
|
/
S
/ S
TUART
E. E
IZENSTAT
|
|
Director
|
|
February 27, 2015
|
|
Stuart E. Eizenstat
|
||||
|
/
S
/ W
ILLIAM
R. J
OHNSON
|
|
Director
|
|
February 27, 2015
|
|
William R. Johnson
|
||||
|
/
S
/ C
ANDACE
K
ENDLE
|
|
Director
|
|
February 27, 2015
|
|
Candace Kendle
|
||||
|
/
S
/ K
URT
P. K
UEHN
|
|
Chief Financial Officer (Principal Financial and Accounting Officer)
|
|
February 27, 2015
|
|
Kurt P. Kuehn
|
||||
|
/
S
/ A
NN
M. L
IVERMORE
|
|
Director
|
|
February 27, 2015
|
|
Ann M. Livermore
|
||||
|
/
S
/ R
UDY
M
ARKHAM
|
|
Director
|
|
February 27, 2015
|
|
Rudy Markham
|
||||
|
/
S
/ C
LARK
T. R
ANDT
, J
R
.
|
|
Director
|
|
February 27, 2015
|
|
Clark T. Randt, Jr.
|
||||
|
/
S
/ J
OHN
T. S
TANKEY
|
Director
|
February 27, 2015
|
||
|
John T. Stankey
|
||||
|
/
S
/ C
AROL
B. T
OMÉ
|
Director
|
February 27, 2015
|
||
|
Carol B. Tomé
|
||||
|
/S/
K
EVIN
M. W
ARSH
|
Director
|
February 27, 2015
|
||
|
Kevin M. Warsh
|
||||
120
EXHIBIT INDEX
|
Exhibit
No.
|
|
Description
|
|
2.1
|
—
|
Termination Agreement, dated as of January 22, 2013, between United Parcel Service, Inc. and TNT Express N.V. (incorporated by reference to Exhibit 2.3 to the 2012 Annual Report on Form 10-K)
|
|
3.1
|
—
|
Form of Restated Certificate of Incorporation of United Parcel Service, Inc. (incorporated by reference to Exhibit 3.2 to Form 8-K filed on May 12, 2010).
|
|
3.2
|
—
|
Amended and Restated Bylaws of United Parcel Service, Inc. as of February 14, 2013 (incorporated by reference to Exhibit 3.1 to Form 8-K, filed on February 19, 2013).
|
|
4.1
|
—
|
Indenture relating to 8
3
/
8
% Debentures due April 1, 2020 (incorporated by reference to Exhibit 4(c) to Registration Statement No. 33-32481, filed December 7, 1989).
|
|
4.2
|
—
|
Indenture dated as of December 18, 1997 relating to 8
3
/
8
% Debentures due 2030 (incorporated by reference to Exhibit T-3C to Form T-3 filed December 18, 1997).
|
|
4.3
|
—
|
Indenture dated as of January 26, 1999 (incorporated by reference to Exhibit 4.1 to Pre-Effective Amendment No. 1 to Form S-3 (No. 333-08369), filed on January 26, 1999).
|
|
4.4
|
—
|
Form of Supplemental Indenture dated as of March 27, 2000 to Indenture dated January 26, 1999 (incorporated by reference to Exhibit 4.2 to Post-Effective Amendment No. 1 to Form S-3 (No. 333-08369-01), filed on March 15, 2000).
|
|
4.5
|
—
|
Form of Second Supplemental Indenture dated as of September 21, 2001 to Indenture dated January 26, 1999 (incorporated by reference to Exhibit 4 to Form 10-Q for the Quarter Ended September 30, 2001).
|
|
4.6
|
—
|
Form of Indenture dated as of August 26, 2003 (incorporated by reference to Exhibit 4.1 to Form S-3 (No. 333-108272), filed on August 27, 2003).
|
|
4.7
|
—
|
Form of First Supplemental Indenture dated as of November 15, 2013 to Indenture dated as of August 26, 2003 (incorporated by reference to Exhibit 4.2 to Form S-3ASR (No. 333-192369) filed on November 15, 2013).
|
|
4.8
|
—
|
Form of Note for 5.50% Senior Notes due January 15, 2018 (incorporated by reference to Exhibit 4.2 to Form 8-K filed on January 15, 2008).
|
|
4.9
|
—
|
Form of Note for 6.20% Senior Notes due January 15, 2038 (incorporated by reference to Exhibit 4.3 to Form 8-K filed on January 15, 2008).
|
|
4.1
|
—
|
Form of Note for 5.125% Senior Notes due April 1, 2019 (incorporated by reference to Exhibit 4.2 to Form 8-K filed on March 24, 2009).
|
|
4.11
|
—
|
Form of Note for 3.125% Senior Notes due January 15, 2021 (incorporated by reference to Exhibit 4.1 to Form 8-K filed on November 12, 2010).
|
|
4.12
|
—
|
Form of Note for 4.875% Senior Notes due November 15, 2040 (incorporated by reference to Exhibit 4.2 to Form 8-K filed on November 12, 2010).
|
|
4.13
|
—
|
Form of Note for 1.125% Senior Notes due October 1, 2017 (incorporated by reference to Exhibit 4.1 to Form 8-K filed on September 27, 2012).
|
|
4.14
|
—
|
Form of Note for 2.450% Senior Notes due October 1, 2022 (incorporated by reference to Exhibit 4.2 to Form 8-K filed on September 27, 2012).
|
|
4.15
|
—
|
Form of Note for 3.625% Senior Notes due October 1, 2042 (incorporated by reference to Exhibit 4.3 to Form 8-K filed on September 27, 2012).
|
|
4.16
|
—
|
Form of Note for Floating Rate Senior Notes due December 15, 2064 (incorporated by reference to Exhibit 4.3 to Form 8-K filed on December 15, 2014).
|
|
†10.1
|
—
|
UPS Retirement Plan, as Amended and Restated, effective as of January 1, 2014.
|
|
†10.2
|
—
|
UPS Savings Plan, as Amended and Restated, effective as of January 1, 2014.
|
|
10.3
|
—
|
Credit Agreement (364-Day Facility) dated March 28, 2014 among United Parcel Service, Inc., the initial lenders named therein, J.P. Morgan Securities LLC, Citigroup Global Markets, Inc., Barclays Bank PLC and BNP Paribas Securities Corp. as joint lead arrangers and joint bookrunners, Barclays Bank PLC and BNP Paribas as co-documentation agents, Citibank, N.A. as syndication agent, and JPMorgan Chase Bank, N.A. as administrative agent (incorporated by reference to Exhibit 10.1 to Form 10-Q for the quarter ending March 31, 2014).
|
121
|
10.4
|
—
|
Credit Agreement (5 Year Facility) dated March 28, 2014 among United Parcel Service, Inc., the initial lenders named therein, J.P. Morgan Securities LLC, Citigroup Global Markets, Inc., Barclays Bank PLC and BNP Paribas Securities Corp. as joint lead arrangers and joint bookrunners, Barclays Bank PLC and BNP Paribas as co-documentation agents, Citibank, N.A. as syndication agent, and JPMorgan Chase Bank, N.A. as administrative agent (incorporated by reference to Exhibit 10.2 to Form 10-Q for the quarter ending March 31, 2014).
|
|
10.5
|
—
|
UPS Excess Coordinating Benefit Plan, as amended and restated, effective as of January 1, 2012 (incorporated by reference to Exhibit 10.5 to the 2012 Annual Report on Form 10-K).
|
|
10.6
|
—
|
United Parcel Service, Inc. 2012 Omnibus Incentive Compensation Plan (incorporated by reference to Annex II to the Definitive Proxy Statement, filed on March 12, 2012).
|
|
(1) Form of Long-Term Incentive Performance Award Agreement (incorporated by reference to Exhibit 10.3 to the Quarterly Report on Form 10-Q for the quarter ended March 31, 2011).
|
||
|
(2) Form of Non-Management Director Restricted Stock Unit Award (incorporated by reference to Exhibit 10.2 to the Quarterly Report on Form 10-Q for the quarter ended March 31, 2010).
|
||
|
(3) UPS Management Incentive Program Terms and Conditions effective as of January 1, 2011 (incorporated by reference to Exhibit 10.10(3) to the 2010 Annual Report on Form 10-K).
|
||
|
(4) UPS Stock Option Program Terms and Conditions effective as of January 1, 2012 (incorporated by reference to Exhibit 10.7(4) to the 2011 Annual Report on Form 10-K).
|
||
|
(5) UPS Long-Term Incentive Performance Program Terms and Conditions effective as of January 1, 2012 (incorporated by reference to Exhibit 10.7(5) to the 2011 Annual Report on Form 10-K).
|
||
|
10.7
|
—
|
Form of UPS Deferred Compensation Plan (incorporated by reference to Exhibit 10.11 to the 2010 Annual Report on Form 10-K).
|
|
(1) Amendment No. 1 to the UPS Deferred Compensation Plan(incorporated by reference to Exhibit 10.7(1) to the 2012 Annual Report on Form 10-K).
|
||
|
10.8
|
—
|
United Parcel Service, Inc. Nonqualified Employee Stock Purchase Plan (incorporated by reference to Exhibit 99.1 to the registration statement on Form S-8 (No. 333-34054), filed on April 5, 2000).
|
|
10.9
|
—
|
Discounted Employee Stock Purchase Plan, as amended and restated, effective October 1, 2002.
|
|
(1) Amendment No. 1 to the Discounted Employee Stock Purchase Plan (incorporated by reference to Exhibit 10.12(1) to the 2005 Annual Report on Form 10-K).
|
||
|
(2) Amendment No. 2 to the Discounted Employee Stock Purchase Plan (incorporated by reference to Exhibit 10.13(2) to the 2009 Annual Report on Form 10-K).
|
||
|
(3) Amendment No. 3 to the Discounted Employee Stock Purchase Plan (incorporated by reference to Exhibit 10.9(3) to the 2012 Annual Report on Form 10-K).
|
||
|
10.10
|
—
|
2012 Omnibus Incentive Compensation Plan (incorporated by reference to Annex A to the proxy statement filed on March 12, 2012).
|
|
11
|
—
|
Statement regarding Computation of per Share Earnings (incorporated by reference to note 13 to Part I, Item 8 “Financial Statements and Supplementary Data” of this Annual Report on Form 10-K).
|
|
†12
|
—
|
Ratio of Earnings to Fixed Charges.
|
|
†21
|
—
|
Subsidiaries of the Registrant.
|
|
†23
|
—
|
Consent of Deloitte & Touche LLP.
|
|
†31.1
|
—
|
Certificate of the Chief Executive Officer Pursuant to Rule 13a-14(a), as adopted pursuant to Section 302 of the Sarbanes-Oxley Act of 2002.
|
|
†31.2
|
—
|
Certificate of the Chief Financial Officer Pursuant to Rule 13a-14(a), as adopted pursuant to Section 302 of the Sarbanes-Oxley Act of 2002.
|
|
†32.1
|
—
|
Certification of the Chief Executive Officer Pursuant to 18 U.S.C. Section 1350, as Adopted Pursuant to Section 906 of the Sarbanes-Oxley Act of 2002.
|
|
†32.2
|
—
|
Certification of the Chief Financial Officer Pursuant to 18 U.S.C. Section 1350, as Adopted Pursuant to Section 906 of the Sarbanes-Oxley Act of 2002.
|
122
|
††101
|
—
|
The following financial information from the Annual Report on Form 10-K for the year ended December 31, 2014, formatted in XBRL (Extensible Business Reporting Language): (i) the Consolidated Balance Sheets, (ii) the Consolidated Statements of Income, (iii) the Consolidated Statements of Comprehensive Income, (iv) the Consolidated Statements of Cash Flows, and (v) the Notes to the Consolidated Financial Statements.
|
__________________________
|
†
|
Filed herewith.
|
|
††
|
Filed electronically herewith.
|
123
TABLE OF CONTENTS
Part IItem 1. BusinessItem 1A. Risk FactorsItem 1B. Unresolved Staff CommentsItem 2. PropertiesItem 3. Legal ProceedingsItem 4. Mine Safety DisclosuresPart IIItem 5. Market For Registrant S Common Equity, Related Stockholder Matters and Issuer Purchases Of Equity SecuritiesItem 6. Selected Financial DataItem 7. Management S Discussion and Analysis Of Financial Condition and Results Of OperationsItem 7A. Quantitative and Qualitative Disclosures About Market RiskItem 8. Financial Statements and Supplementary DataNote 1. Summary Of Accounting PoliciesNote 2. Cash and InvestmentsNote 3. Property, Plant and EquipmentNote 4. Company-sponsored Employee Benefit PlansNote 5. Multiemployer Employee Benefit PlansNote 6. Business Acquisitions, Goodwill and Intangible AssetsNote 7. Debt and Financing ArrangementsNote 8. Legal Proceedings and ContingenciesNote 9. Shareowners EquityNote 10. Stock-based CompensationNote 11. Segment and Geographic InformationNote 12. Income TaxesNote 13. Earnings Per ShareNote 14. Derivative Instruments and Risk ManagementNote 15. Termination Of Tnt TransactionNote 16. Quarterly Information (unaudited)Item 9. Changes in and Disagreements with Accountants on Accounting and Financial DisclosureItem 9A. Controls and ProceduresItem 9B. Other InformationPart IIIItem 10. Directors, Executive Officers and Corporate GovernanceItem 11. Executive CompensationItem 12. Security Ownership Of Certain Beneficial Owners and Management and Related Stockholder MattersItem 13. Certain Relationships and Related Transactions, and Director IndependenceItem 14. Principal Accounting Fees and ServicesPart IVItem 15. Exhibits and Financial Statement Schedules