UNITED STATES
SECURITIES AND EXCHANGE COMMISSION
WASHINGTON, DC 20549
________________________________________________
FORM 10-Q
________________________________________________
(Mark One)
|
x
|
QUARTERLY REPORT PURSUANT TO SECTION 13 OR 15(d) OF THE SECURITIES EXCHANGE ACT OF 1934
|
For the quarterly period ended
June 30, 2019
OR
|
¨
|
TRANSITION REPORT PURSUANT TO SECTION 13 OR 15(d) OF THE SECURITIES EXCHANGE ACT OF 1934
|
For the transition period from _______ to _______
Commission File Number: 001-38678
________________________________________________
UPWORK INC.
(Exact Name of Registrant as Specified in its Charter)
________________________________________________
|
Delaware
|
46-4337682
|
|
(State or other jurisdiction of incorporation or organization)
|
(I.R.S. Employer Identification No.)
|
|
2625 Augustine Drive, Suite 601
Santa Clara, California
|
95054
|
|
(Address of principal executive offices)
|
(Zip Code)
|
(650) 316-7500
(Registrant’s telephone number, including area code)
441 Logue Avenue, Mountain View, California 94043
(Former name, former address and former fiscal year, if changed since last report)
Securities registered pursuant to Section 12(b) of the Act:
|
Title of Each Class
|
Trading Symbol
|
Name of Each Exchange on Which Registered
|
|
Common Stock, $0.0001 par value per share
|
UPWK
|
The Nasdaq Stock Market LLC
|
_______________________________________________
Indicate by check mark whether the registrant (1) has filed all reports required to be filed by Section 13 or 15(d) of the Securities Exchange Act of 1934 during the preceding 12 months (or for such shorter period that the registrant was required to file such reports), and (2) has been subject to such filing requirements for the past 90 days. Yes ☒ No ☐
Indicate by check mark whether the registrant has submitted electronically every Interactive Data File required to be submitted pursuant to Rule 405 of Regulation S-T (§232.405 of this chapter) during the preceding 12 months (or for such shorter period that the registrant was required to submit such files). Yes ☒ No ☐
Indicate by check mark whether the registrant is a large accelerated filer, an accelerated filer, a non-accelerated filer, a smaller reporting company, or an emerging growth company. See the definitions of “large accelerated filer,” “accelerated filer,” “smaller reporting company,” and “emerging growth company” in Rule 12b-2 of the Exchange Act.
|
Large accelerated filer
|
☐
|
Accelerated filer
|
☐
|
|
|
Non-accelerated filer
|
☒
|
Smaller reporting company
|
☐
|
|
|
Emerging growth company
|
☒
|
|||
If an emerging growth company, indicate by check mark if the registrant has elected not to use the extended transition period for complying with any new or revised financial accounting standards provided pursuant to Section 13(a) of the Exchange Act. ☐
Indicate by check mark whether the registrant is a shell company (as defined in Rule 12b-2 of the Exchange Act). Yes ☐ No ☒
As of
July 31, 2019
, there were 110,803,709 shares of the registrant’s common stock outstanding.
TABLE OF CONTENTS
|
Page
|
||
|
Special Note Regarding Forward-Looking Statements
|
||
|
PART I—FINANCIAL INFORMATION
|
||
|
Item 1.
|
Financial Statements (Unaudited)
|
|
|
Condensed Consolidated Balance Sheets as of June 30, 2019 and December 31, 2018
|
||
|
Condensed Consolidated Statements of Operations for the Three and Six Months Ended June 30, 2019 and 2018
|
||
|
Condensed Consolidated Statements of Redeemable Convertible Preferred Stock and Stockholders’ Equity (Deficit) for the Three and Six Months Ended June 30, 2019 and 2018
|
||
|
Condensed Consolidated Statements of Cash Flows for the Six Months Ended June 30, 2019 and 2018
|
||
|
Notes to Condensed Consolidated Financial Statements
|
||
|
Item 2.
|
Management’s Discussion and Analysis of Financial Condition and Results of Operations
|
|
|
Item 3.
|
Quantitative and Qualitative Disclosures About Market Risk
|
|
|
Item 4.
|
Controls and Procedures
|
|
|
PART II—OTHER INFORMATION
|
||
|
Item 1.
|
Legal Proceedings
|
|
|
Item 1A.
|
Risk Factors
|
|
|
Item 2.
|
Unregistered Sales of Equity Securities and Use of Proceeds
|
|
|
Item 6.
|
Exhibits
|
|
|
Signatures
|
||
Unless otherwise expressly stated or the context otherwise requires, references in this Quarterly Report on Form 10-Q (this “Quarterly Report” or “report”) to “Upwork,” “Company,” “our,” “us,” and “we” and similar references refer to Upwork Inc. and its wholly-owned subsidiaries.
SPECIAL NOTE REGARDING FORWARD-LOOKING STATEMENTS
This Quarterly Report contains forward-looking statements within the meaning of the federal securities laws. All statements contained in this Quarterly Report, other than statements of historical fact, including statements regarding our future operating results and financial position, our business strategy and plans, potential growth or growth prospects, future research and development, sales and marketing and general and administrative expenses, and our objectives for future operations, are forward-looking statements. Words such as “believes,” “may,” “will,” “estimates,” “potential,” “continues,” “anticipates,” “intends,” “expects,” “could,” “would,” “projects,” “plans,” “targets,” and variations of such words and similar expressions are intended to identify forward-looking statements.
We have based these forward-looking statements largely on our current expectations and projections as of the date of this filing about future events and trends that we believe may affect our financial condition, results of operations, business strategy, short-term and long-term business operations and objectives, and financial needs. These forward-looking statements are subject to a number of risks, uncertainties and assumptions, including those described in Part II, Item 1A, “Risk Factors” in this Quarterly Report. Readers are urged to carefully review and consider the various disclosures made in this Quarterly Report and in other documents we file from time to time with the Securities and Exchange Commission (the “SEC”) that disclose risks and uncertainties that may affect our business. Moreover, we operate in a very competitive and rapidly changing environment. New risks emerge from time to time. It is not possible for us to predict all risks, nor can we assess the impact of all factors on our business or the extent to which any factor, or combination of factors, may cause actual results to differ materially from those contained in any forward-looking statements we may make. In light of these risks, uncertainties, and assumptions, the future events and circumstances discussed in this Quarterly Report may not occur and actual results could differ materially and adversely from those anticipated or implied in the forward-looking statements.
You should not rely upon forward-looking statements as predictions of future events. The events and circumstances reflected in the forward-looking statements may not be achieved or occur. Although we believe that the expectations reflected in the forward-looking statements are reasonable, we cannot guarantee future results, performance, or achievements. In addition, the forward-looking statements in this Quarterly Report are made as of the date of this filing, and we do not undertake, and expressly disclaim any duty, to update such statements for any reason after the date of this Quarterly Report or to conform statements to actual results or revised expectations, except as required by law.
You should read this Quarterly Report and the documents that we reference herein and have filed with the SEC as exhibits to this Quarterly Report with the understanding that our actual future results, performance, and events and circumstances may be materially different from what we expect.
1
PART I—FINANCIAL INFORMATION
Item 1. Financial Statements.
UPWORK INC.
CONDENSED CONSOLIDATED BALANCE SHEETS
(In thousands, except share and per share data)
(Unaudited)
|
June 30, 2019
|
December 31, 2018
|
||||||
|
ASSETS
|
|||||||
|
Current assets
|
|||||||
|
Cash and cash equivalents
|
$
|
67,092
|
|
$
|
129,128
|
|
|
|
Marketable securities
|
62,442
|
|
—
|
|
|||
|
Funds held in escrow, including funds in transit
|
118,302
|
|
98,186
|
|
|||
|
Trade and client receivables – net of allowance of $2,195 and $2,832 as of June 30, 2019 and December 31, 2018, respectively
|
51,447
|
|
22,315
|
|
|||
|
Prepaid expenses and other current assets
|
6,554
|
|
6,253
|
|
|||
|
Total current assets
|
305,837
|
|
255,882
|
|
|||
|
Property and equipment, net
|
19,207
|
|
10,815
|
|
|||
|
Goodwill
|
118,219
|
|
118,219
|
|
|||
|
Intangible assets, net
|
4,670
|
|
6,004
|
|
|||
|
Other assets, noncurrent
|
976
|
|
653
|
|
|||
|
Total assets
|
$
|
448,909
|
|
$
|
391,573
|
|
|
|
LIABILITIES AND STOCKHOLDERS’ EQUITY
|
|||||||
|
Current liabilities
|
|||||||
|
Accounts payable
|
$
|
1,521
|
|
$
|
2,073
|
|
|
|
Escrow funds payable
|
118,302
|
|
98,186
|
|
|||
|
Debt, current
|
32,574
|
|
5,671
|
|
|||
|
Accrued expenses and other current liabilities
|
19,132
|
|
20,948
|
|
|||
|
Deferred revenue
|
1,130
|
|
722
|
|
|||
|
Total current liabilities
|
172,659
|
|
127,600
|
|
|||
|
Debt, noncurrent
|
14,469
|
|
18,239
|
|
|||
|
Other liabilities, noncurrent
|
4,148
|
|
1,989
|
|
|||
|
Total liabilities
|
191,276
|
|
147,828
|
|
|||
|
Commitments and contingencies (Note 5)
|
|
|
|||||
|
Stockholders’ equity
|
|||||||
|
Common stock, $0.0001 par value; 490,000,000 shares authorized as of June 30, 2019 and December 31, 2018; 110,708,530 and 106,454,321 shares issued and outstanding as of June 30, 2019 and December 31, 2018, respectively
|
11
|
|
11
|
|
|||
|
Additional paid-in capital
|
407,876
|
|
387,233
|
|
|||
|
Accumulated deficit
|
(150,254
|
)
|
(143,499
|
)
|
|||
|
Total stockholders' equity
|
257,633
|
|
243,745
|
|
|||
|
Total liabilities and stockholders' equity
|
$
|
448,909
|
|
$
|
391,573
|
|
|
The accompanying notes are an integral part of these condensed consolidated financial statements.
2
UPWORK INC.
CONDENSED CONSOLIDATED STATEMENTS OF OPERATIONS
(In thousands, except per share data)
(Unaudited)
|
Three Months Ended June 30,
|
Six Months Ended June 30,
|
||||||||||||||
|
2019
|
2018
|
2019
|
2018
|
||||||||||||
|
Revenue
|
$
|
74,256
|
|
$
|
62,681
|
|
$
|
143,180
|
|
$
|
121,899
|
|
|||
|
Cost of revenue
|
21,588
|
|
20,457
|
|
42,713
|
|
40,074
|
|
|||||||
|
Gross profit
|
52,668
|
|
42,224
|
|
100,467
|
|
81,825
|
|
|||||||
|
Operating expenses
|
|||||||||||||||
|
Research and development
|
15,696
|
|
12,812
|
|
31,496
|
|
26,303
|
|
|||||||
|
Sales and marketing
|
24,479
|
|
16,414
|
|
44,997
|
|
36,087
|
|
|||||||
|
General and administrative
|
14,113
|
|
11,219
|
|
29,790
|
|
22,395
|
|
|||||||
|
Provision for transaction losses
|
855
|
|
1,450
|
|
1,492
|
|
2,720
|
|
|||||||
|
Total operating expenses
|
55,143
|
|
41,895
|
|
107,775
|
|
87,505
|
|
|||||||
|
Income (loss) from operations
|
(2,475
|
)
|
329
|
|
(7,308
|
)
|
(5,680
|
)
|
|||||||
|
Interest expense
|
357
|
|
556
|
|
730
|
|
1,085
|
|
|||||||
|
Other (income) expense, net
|
(832
|
)
|
173
|
|
(1,311
|
)
|
422
|
|
|||||||
|
Loss before income taxes
|
(2,000
|
)
|
(400
|
)
|
(6,727
|
)
|
(7,187
|
)
|
|||||||
|
Income tax provision
|
(27
|
)
|
(12
|
)
|
(28
|
)
|
(9
|
)
|
|||||||
|
Net loss
|
$
|
(2,027
|
)
|
$
|
(412
|
)
|
$
|
(6,755
|
)
|
$
|
(7,196
|
)
|
|||
|
Net loss per share, basic and diluted
|
$
|
(0.02
|
)
|
$
|
(0.01
|
)
|
$
|
(0.06
|
)
|
$
|
(0.21
|
)
|
|||
|
Weighted-average shares used to compute net loss per share, basic and diluted
|
108,683
|
|
35,105
|
|
107,665
|
|
34,651
|
|
|||||||
The accompanying notes are an integral part of these condensed consolidated financial statements.
3
UPWORK INC.
CONDENSED CONSOLIDATED STATEMENTS OF REDEEMABLE CONVERTIBLE PREFERRED STOCK
AND STOCKHOLDERS’ EQUITY (DEFICIT)
(In thousands, except share amounts)
(Unaudited)
|
Three Months Ended June 30, 2019
|
Redeemable Convertible
Preferred Stock |
Common Stock
|
Additional Paid-in Capital
|
Accumulated
Deficit |
Total
Stockholders’ Equity |
|||||||||||||||||||||
|
Shares
|
Amount
|
Shares
|
Amount
|
|||||||||||||||||||||||
|
Balances as of March 31, 2019
|
—
|
|
$
|
—
|
|
106,729,758
|
|
$
|
11
|
|
$
|
392,188
|
|
$
|
(148,227
|
)
|
$
|
243,972
|
|
|||||||
|
Issuance of common stock upon exercise of stock options and common stock warrants
|
—
|
|
—
|
|
3,645,434
|
|
—
|
|
9,583
|
|
—
|
|
9,583
|
|
||||||||||||
|
Stock-based compensation expense
|
—
|
|
—
|
|
—
|
|
—
|
|
2,528
|
|
—
|
|
2,528
|
|
||||||||||||
|
Issuance of common stock for settlement of RSUs
|
—
|
|
—
|
|
53,030
|
|
—
|
|
—
|
|
—
|
|
—
|
|
||||||||||||
|
Issuance of common stock in connection with employee stock purchase plan
|
—
|
|
—
|
|
280,308
|
|
—
|
|
3,577
|
|
—
|
|
3,577
|
|
||||||||||||
|
Net loss
|
—
|
|
—
|
|
—
|
|
—
|
|
—
|
|
(2,027
|
)
|
(2,027
|
)
|
||||||||||||
|
Balances as of June 30, 2019
|
—
|
|
$
|
—
|
|
110,708,530
|
|
$
|
11
|
|
$
|
407,876
|
|
$
|
(150,254
|
)
|
$
|
257,633
|
|
|||||||
|
Three Months Ended June 30, 2018
|
Redeemable Convertible
Preferred Stock |
Common Stock
|
Additional Paid-in Capital
|
Accumulated
Deficit |
Total
Stockholders’ Deficit |
|||||||||||||||||||||
|
Shares
|
Amount
|
Shares
|
Amount
|
|||||||||||||||||||||||
|
Balances as of March 31, 2018
|
61,279,079
|
|
$
|
166,486
|
|
34,654,360
|
|
$
|
4
|
|
$
|
95,327
|
|
$
|
(130,376
|
)
|
$
|
(35,045
|
)
|
|||||||
|
Issuance of common stock upon exercise of stock options and common stock warrants
|
—
|
|
—
|
|
1,225,643
|
|
—
|
|
3,053
|
|
—
|
|
3,053
|
|
||||||||||||
|
Stock-based compensation expense
|
—
|
|
—
|
|
—
|
|
—
|
|
1,793
|
|
—
|
|
1,793
|
|
||||||||||||
|
Net loss
|
—
|
|
—
|
|
—
|
|
—
|
|
—
|
|
(412
|
)
|
(412
|
)
|
||||||||||||
|
Balances as of June 30, 2018
|
61,279,079
|
|
$
|
166,486
|
|
35,880,003
|
|
$
|
4
|
|
$
|
100,173
|
|
$
|
(130,788
|
)
|
$
|
(30,611
|
)
|
|||||||
4
|
Six Months Ended June 30, 2019
|
Redeemable Convertible
Preferred Stock |
Common Stock
|
Additional Paid-in Capital
|
Accumulated
Deficit |
Total
Stockholders’ Equity |
|||||||||||||||||||||
|
Shares
|
Amount
|
Shares
|
Amount
|
|||||||||||||||||||||||
|
Balances as of December 31, 2018
|
—
|
|
$
|
—
|
|
106,454,321
|
|
$
|
11
|
|
$
|
387,233
|
|
$
|
(143,499
|
)
|
$
|
243,745
|
|
|||||||
|
Issuance of common stock upon exercise of stock options and common stock warrants
|
—
|
|
—
|
|
3,918,539
|
|
—
|
|
10,350
|
|
—
|
|
10,350
|
|
||||||||||||
|
Stock-based compensation expense
|
—
|
|
—
|
|
—
|
|
—
|
|
6,716
|
|
—
|
|
6,716
|
|
||||||||||||
|
Issuance of common stock for settlement of RSUs
|
—
|
|
—
|
|
55,362
|
|
—
|
|
—
|
|
—
|
|
—
|
|
||||||||||||
|
Issuance of common stock in connection with employee stock purchase plan
|
—
|
|
—
|
|
280,308
|
|
—
|
|
3,577
|
|
—
|
|
3,577
|
|
||||||||||||
|
Net loss
|
—
|
|
—
|
|
—
|
|
—
|
|
—
|
|
(6,755
|
)
|
(6,755
|
)
|
||||||||||||
|
Balances as of June 30, 2019
|
—
|
|
$
|
—
|
|
110,708,530
|
|
$
|
11
|
|
$
|
407,876
|
|
$
|
(150,254
|
)
|
$
|
257,633
|
|
|||||||
|
Six Months Ended June 30, 2018
|
Redeemable Convertible
Preferred Stock |
Common Stock
|
Additional Paid-in Capital
|
Accumulated
Deficit |
Total
Stockholders’ Deficit |
|||||||||||||||||||||
|
Shares
|
Amount
|
Shares
|
Amount
|
|||||||||||||||||||||||
|
Balances as of December 31, 2017
|
61,279,079
|
|
$
|
166,486
|
|
33,740,323
|
|
$
|
3
|
|
$
|
92,222
|
|
$
|
(123,592
|
)
|
$
|
(31,367
|
)
|
|||||||
|
Issuance of common stock upon exercise of stock options and common stock warrants
|
—
|
|
—
|
|
2,139,680
|
|
1
|
|
4,270
|
|
—
|
|
4,271
|
|
||||||||||||
|
Stock-based compensation expense
|
—
|
|
—
|
|
—
|
|
—
|
|
3,681
|
|
—
|
|
3,681
|
|
||||||||||||
|
Net loss
|
—
|
|
—
|
|
—
|
|
—
|
|
—
|
|
(7,196
|
)
|
(7,196
|
)
|
||||||||||||
|
Balances as of June 30, 2018
|
61,279,079
|
|
$
|
166,486
|
|
35,880,003
|
|
$
|
4
|
|
$
|
100,173
|
|
$
|
(130,788
|
)
|
$
|
(30,611
|
)
|
|||||||
The accompanying notes are an integral part of these condensed consolidated financial statements.
5
UPWORK INC.
CONDENSED CONSOLIDATED STATEMENTS OF CASH FLOWS
(In thousands)
(Unaudited)
|
Six Months Ended June 30,
|
|||||||
|
2019
|
2018
|
||||||
|
CASH FLOWS FROM OPERATING ACTIVITIES:
|
|||||||
|
Net loss
|
$
|
(6,755
|
)
|
$
|
(7,196
|
)
|
|
|
Adjustments to reconcile net loss to net cash provided by (used in) operating activities:
|
|||||||
|
Provision for transaction losses
|
1,038
|
|
2,720
|
|
|||
|
Depreciation and amortization
|
2,827
|
|
2,255
|
|
|||
|
Amortization of debt issuance costs
|
26
|
|
51
|
|
|||
|
Amortization of discount on purchases of marketable securities
|
(665
|
)
|
—
|
|
|||
|
Change in fair value of redeemable convertible preferred stock warrant liability
|
—
|
|
359
|
|
|||
|
Change in fair value of Tides Foundation common stock warrant
|
377
|
|
—
|
|
|||
|
Stock-based compensation expense
|
6,926
|
|
3,681
|
|
|||
|
Loss on disposal of fixed assets
|
—
|
|
33
|
|
|||
|
Changes in operating assets and liabilities:
|
|||||||
|
Trade and client receivables
|
(30,288
|
)
|
(8,620
|
)
|
|||
|
Prepaid expenses and other assets
|
(701
|
)
|
(572
|
)
|
|||
|
Accounts payable
|
(589
|
)
|
261
|
|
|||
|
Accrued expenses and other liabilities
|
(430
|
)
|
17,333
|
|
|||
|
Deferred revenue
|
408
|
|
98
|
|
|||
|
Net cash provided by (used in) operating activities
|
(27,826
|
)
|
10,403
|
|
|||
|
CASH FLOWS FROM INVESTING ACTIVITIES:
|
|||||||
|
Purchases of marketable securities
|
(86,567
|
)
|
—
|
|
|||
|
Sale of marketable securities
|
24,800
|
|
—
|
|
|||
|
Decrease (increase) in restricted cash
|
150
|
|
(100
|
)
|
|||
|
Purchases of property and equipment
|
(7,435
|
)
|
(1,297
|
)
|
|||
|
Internal-use software and platform development costs
|
(2,182
|
)
|
(1,945
|
)
|
|||
|
Net cash used in investing activities
|
(71,234
|
)
|
(3,342
|
)
|
|||
|
CASH FLOWS FROM FINANCING ACTIVITIES:
|
|||||||
|
Changes in funds held in escrow, including funds in transit
|
(20,116
|
)
|
5,694
|
|
|||
|
Changes in escrow funds payable
|
20,116
|
|
(5,694
|
)
|
|||
|
Proceeds from exercises of stock options and common stock warrants
|
10,340
|
|
4,271
|
|
|||
|
Proceeds from borrowings on debt
|
50,000
|
|
—
|
|
|||
|
Repayment of debt
|
(26,893
|
)
|
—
|
|
|||
|
Proceeds from employee stock purchase plan
|
3,577
|
|
—
|
|
|||
|
Payments of costs related to the initial public offering
|
—
|
|
(1,596
|
)
|
|||
|
Net cash provided by financing activities
|
37,024
|
|
2,675
|
|
|||
|
NET INCREASE (DECREASE) IN CASH AND CASH EQUIVALENTS
|
(62,036
|
)
|
9,736
|
|
|||
|
Cash and cash equivalents, beginning of period
|
129,128
|
|
21,595
|
|
|||
|
Cash and cash equivalents, end of period
|
$
|
67,092
|
|
$
|
31,331
|
|
|
|
SUPPLEMENTAL DISCLOSURE OF CASH FLOW INFORMATION:
|
|||||||
|
Cash paid for interest
|
$
|
714
|
|
$
|
1,053
|
|
|
|
SUPPLEMENTAL DISCLOSURES OF NON-CASH INVESTING AND FINANCING ACTIVITIES:
|
|||||||
|
Property and equipment purchased but not yet paid
|
$
|
3,140
|
|
$
|
355
|
|
|
|
Unpaid deferred offering costs
|
$
|
—
|
|
$
|
1,505
|
|
|
The accompanying notes are an integral part of these condensed consolidated financial statements.
6
UPWORK INC.
Notes to Condensed Consolidated Financial Statements
(Unaudited)
Note 1—Organization and Description of Business
Upwork Inc. (the “Company” or “Upwork”) operates an online marketplace that enables businesses (“clients”) to find and work with highly-skilled independent professionals (“freelancers,” and, together with clients, “users”). The Company was originally incorporated in the state of Delaware in December 2013 prior to and in connection with the combination (the “Elance-oDesk Combination”) of Elance, Inc. (“Elance”) and oDesk Corporation (“oDesk”). The Company changed its name to Elance-oDesk, Inc. shortly before the Elance-oDesk Combination in March 2014, and later to Upwork Inc. in May 2015. In 2015, the Company relaunched as Upwork and commenced consolidation of its
two
operating platforms. In 2016, following completion of the platform consolidation, the Company began operating under a single platform. The Company is currently headquartered in Santa Clara, California.
Unless otherwise expressly stated or the context otherwise requires, the terms “Upwork” and the “Company” in these notes to the condensed consolidated financial statements refer to Upwork and its wholly-owned subsidiaries.
Initial Public Offering
In October 2018, the Company completed its initial public offering (“IPO”), in which the Company issued and sold an aggregate of
7,840,908
of the Company’s common stock, including
1,022,727
shares pursuant to the exercise of the underwriters’ option to purchase additional shares. The shares were sold to the underwriters at the IPO price of
$15.00
per share less an underwriting discount of
$1.05
per share. The Company received aggregate net proceeds of
$109.4 million
from the IPO after deducting underwriting discounts and commissions but before deducting offering expenses payable by the Company.
7
Note 2—Basis of Presentation and Summary of Significant Accounting Policies
Basis of Presentation
The accompanying unaudited condensed consolidated financial statements have been prepared in accordance with generally accepted accounting principles in the United States (“U.S. GAAP”) and applicable rules and regulations of the SEC regarding interim financial reporting. Certain information and note disclosures normally included in the financial statements prepared in accordance with U.S. GAAP have been condensed or omitted pursuant to such rules and regulations. As such, the information included in this Quarterly Report should be read in conjunction with the consolidated financial statements and notes thereto included in the Company’s Annual Report on Form 10-K for the year ended December 31, 2018 (the “Annual Report”), filed with the SEC on March 7, 2019.
The condensed consolidated balance sheet as of
December 31, 2018
included herein was derived from the audited financial statements as of that date, but does not include all disclosures including notes required by U.S. GAAP.
The condensed consolidated financial statements include the accounts of Upwork Inc. and its wholly-owned subsidiaries. All intercompany balances and transactions have been eliminated.
The accompanying condensed consolidated financial statements reflect all normal recurring adjustments necessary to present fairly the financial position, results of operations, changes in stockholders’ equity and cash flows for the interim periods, but do not purport to be indicative of the results of operations or financial condition to be anticipated for the full year ending December 31, 2019.
Use of Estimates
The preparation of the condensed consolidated financial statements in conformity with U.S. GAAP requires management to make certain estimates, judgments, and assumptions that affect the reported amounts of assets and liabilities, disclosure of contingent assets and liabilities at the date of the financial statements, and the reported amounts of revenue and expenses during the periods presented. Such estimates include, but are not limited to: the useful lives of assets; assessment of the recoverability of long-lived assets; goodwill impairment; allowance for doubtful accounts; liabilities relating to transaction losses; the valuation of warrants; stock-based compensation; and accounting for income taxes. Management bases its estimates on historical experience and on various other assumptions that management believes to be reasonable under the circumstances. The Company evaluates its estimates, assumptions, and judgments on an ongoing basis using historical experience and other factors and revises them when facts and circumstances dictate. Actual results could materially differ from these estimates.
Significant Accounting Policies
The significant accounting policies applied in the Company’s audited consolidated financial statements, as disclosed in the Annual Report, are applied consistently in these unaudited interim condensed consolidated financial statements, except as noted below.
Marketable Securities
Beginning in 2019, the Company purchased various short-term, marketable securities consisting of commercial paper, treasury bills, and U.S. government securities, all of which have contractual maturities within 12 months from the date of purchase and are classified as available-for-sale marketable securities. These marketable securities are carried at estimated fair value with unrealized gains and losses, net of taxes, included within the stockholders’ equity section of the Company’s condensed consolidated balance sheet. The Company periodically reviews its available-for-sale marketable securities for other-than-temporary impairments. The Company considers factors such as the duration, severity, and the reason for any decline in value, the potential recovery period, and its intent to sell. For debt securities, the Company also considers whether (i) it is more likely than not that the Company will be required to sell the debt securities before recovery of their amortized cost basis and (ii) the amortized cost basis cannot be recovered as a result of credit losses. Unrealized losses are charged against other (income) expense, net when a decline in fair value is determined to be other-than-temporary. The Company determines realized gains or losses from the sale of marketable securities on a specific identification method and records such gains or losses as other (income) expense, net within the Company’s condensed consolidated statements of operations.
8
Income Taxes
The Company’s income tax provision for interim periods is determined using an estimate of the Company’s annual effective tax rate, adjusted for discrete items arising in the quarter. The Company’s effective tax rate differs from the U.S. statutory tax rate primarily due to valuation allowances on the deferred tax assets as it is more likely than not that some, or all, of the Company’s deferred tax assets will not be realized. The Company continues to maintain a full valuation allowance against its net deferred tax assets. Due to tax losses and the offsetting valuation allowance, the income tax provision for the three and six months ended June 30, 2019 and 2018, respectively, was immaterial to the Company’s condensed consolidated financial statements.
Recent Accounting Pronouncements Not Yet Adopted
As an emerging growth company (“EGC”), the Company is permitted by the Jumpstart Our Business Startups Act (the “JOBS Act”) to delay adoption of new or revised accounting pronouncements applicable to public companies until such pronouncements are made applicable to private companies. The Company has elected to use this extended transition period under the JOBS Act. As a result, so long as it remains an EGC, the Company’s financial statements may not be comparable to the financial statements of issuers that are required to comply with the effective dates for new or revised accounting standards that are applicable to public companies.
Effective as of December 31, 2019, the Company will cease to qualify as an EGC. As a result, the Company will be required to comply with the requirements for adoption of new or revised accounting pronouncements applicable to public companies. Specifically, the Company will be required to accelerate the adoption of certain accounting standards previously disclosed in its Annual Report as follows:
|
Accounting Pronouncement
|
Previously Disclosed
Effective Date
|
Accelerated
Effective Date
|
|
2017-04,
Intangibles
—
Goodwill and Others (Topic 350): Simplifying the Test for Goodwill Impairment
|
For the year ending December 31, 2021
|
For the year ending December 31, 2020
|
|
2017-12,
Derivatives and Hedging (Topic 815): Targeted Improvements to Accounting for Hedging Activities
|
Fiscal years beginning after December 15, 2019
|
Fiscal years beginning after December 15, 2018
|
|
2018-07,
Compensation
—
Stock Compensation (Topic 718): Improvements to Nonemployee Share-Based Payment Accounting
|
Fiscal year ending on December 31, 2020
|
Fiscal year ending on December 31, 2019
|
|
2018-13,
Fair Value Measurement (Topic 820): Disclosure Framework
—
Changes to the Disclosure Requirements for Fair Value Measurement
|
Fiscal year ending on December 31, 2021
|
Fiscal year ending on December 31, 2020
|
|
2018-15,
Intangibles
—
Goodwill and Other
—
Internal-Use Software (Subtopic 350-40): Customer’s Accounting for Implementation Costs Incurred in a Cloud Computing Arrangement That Is a Service Contract
|
Fiscal year ending on December 31, 2021
|
Fiscal year ending on December 31, 2020
|
In May 2014, the Financial Accounting Standards Board (the “FASB”) issued Accounting Standards Update (“ASU”) No. 2014-09,
Revenue from Contracts with Customers
. Accounting Standards Codification 606—
Revenue from Contracts with Customers
(“ASC 606”) supersedes the revenue recognition requirements in ASC 605—
Revenue Recognition
, and requires the recognition of revenue when promised goods or services are transferred to customers in an amount that reflects the consideration to which the entity expects to be entitled in exchange for those goods or services. ASC 606 also includes Subtopic 340-40,
Other Assets and Deferred Costs
—
Contracts with Customers
(“Subtopic 340-40” and together with ASC 606, the “new revenue standard”), which requires the deferral of incremental costs of obtaining a contract with a customer. In August 2015, the FASB deferred the effective date for annual reporting periods beginning after December 15, 2017. In 2016, the FASB issued amendments on this guidance with the same effective date and transition guidance. The new revenue standard may be applied retrospectively to each prior period presented (“full retrospective method”) or retrospectively with the cumulative effect recognized as of the date of adoption (“modified retrospective method”).
The Company plans to adopt the new standard for the year ending December 31, 2019 during the fourth quarter of 2019, using the modified retrospective method.
Interim reporting under the new standard will not be required until 2020. The Company is continuing to evaluate the potential impact that the implementation of this standard will have on its consolidated financial statements, specifically related to the following items:
|
•
|
identification of performance obligations;
|
9
|
•
|
principal agent considerations;
|
|
•
|
whether costs to obtain a contract with a customer will be capitalized or expensed, as well as the timing of recording such capitalization or expense;
|
|
•
|
timing of revenue recognition; and
|
|
•
|
revenue disclosures which are expected to expand and may require judgment in certain areas.
|
The Company has concluded that the discounts offered under the Company’s tiered pricing program for freelancer service fees will result in a deferral of revenue under ASC 606. However, the Company has not yet determined the potential adjustment amount. The Company currently does not expect significant changes to its systems and processes from the adoption of the new standard.
In January 2016, the FASB issued Accounting Standards Update 2016-01,
Financial Instruments (Subtopic 825-10): Recognition and Measurement of Financial Assets and Financial Liabilities
(“ASU 2016-01”). ASU 2016-01 makes targeted improvements to GAAP regarding financial instruments. ASU 2016-01 eliminates the requirement to classify investments in equity securities with readily determinable fair values into trading or available-for-sale categories and requires those equity securities to be measured at fair value with changes in fair value recognized in net earnings rather than in other comprehensive income. ASU 2016-01 also revises certain presentation and disclosure requirements. Under ASU 2016-01, accounting for investments in debt securities remains essentially unchanged. The guidance is effective for the Company for fiscal year 2019 and interim periods beginning fiscal year 2020. Early adoption is not permitted. The Company has not yet evaluated the impact of adopting this guidance on its consolidated financial statements and related disclosures.
In February 2016, FASB issued ASU No. 2016-02,
Leases (Topic 842)
, related to how an entity should recognize lease assets and lease liabilities. The guidance specifies that an entity that is a lessee under lease agreements should recognize lease assets and lease liabilities for those leases classified as operating leases under previous FASB guidance. Accounting for leases by lessors is largely unchanged under the new guidance. In 2018, the FASB also approved an amendment that would permit the option to adopt the new standard prospectively as of the effective date, without adjusting comparative periods presented. Since the Company will no longer qualify as an EGC as of December 31, 2019, it expects to adopt the new lease standard for its annual results for the period ending December 31, 2019. The Company anticipates the effect of adopting this update will be recognizing right-of-use assets and corresponding lease liabilities for leases where the Company is the lessee, primarily comprised of leases for facilities. The Company is currently evaluating the impact to its condensed consolidated financial statements and related disclosures but expects the adoption of this standard to have a material impact on assets and liabilities related to leases.
In June 2016, the FASB issued ASU 2016-13,
Financial Instruments—Credit Losses (Topic 326)
. The standard changes the methodology for measuring credit losses on financial instruments and the timing of when such losses are recorded. In April 2019, the FASB issued ASU 2019-04,
Codification Improvements to Topic 326, Financial Instruments—Credit Losses, Topic 815, Derivatives and Hedging, and Topic 825, Financial Instruments
. The amendments in this update represent changes to clarify, correct errors in, or improve the Codification. In May 2019, the FASB issued 2019-05,
Financial Instruments—Credit Losses (Topic 326)
. The amendments in this update provide entities that have certain instruments within the scope of Subtopic 326-20,
Financial Instruments—Credit Losses—Measured at Amortized Cost
, with an option to irrevocably elect the fair value option in Subtopic 825-10,
Financial Instruments—Overall
, applied on an instrument-by-instrument basis for eligible instruments, upon adoption of
Topic 326
. The guidance is effective for the Company for fiscal year 2020 with early adoption permitted. The standard requires a modified retrospective method of adoption. The Company has not yet evaluated the impact of these standard updates on its consolidated financial statements and related disclosures.
10
Note 3—Fair Value Measurements
The Company defines fair value as the exchange price that would be received from the sale of an asset or paid to transfer a liability in the principal or most advantageous market for the asset or liability in an orderly transaction between market participants on the measurement date. Valuation techniques used to measure fair value must maximize the use of observable inputs and minimize the use of unobservable inputs. The authoritative guidance describes three levels of inputs that may be used to measure fair value:
|
•
|
Level I—Observable inputs that reflect unadjusted quoted prices for identical assets or liabilities in active markets;
|
|
•
|
Level II—Observable inputs other than Level I prices, such as unadjusted quoted prices for similar assets or liabilities in active markets, unadjusted quoted prices for identical or similar assets or liabilities in markets that are not active, or other inputs that are observable or can be corroborated by observable market data for substantially the full term of the assets or liabilities; and
|
|
•
|
Level III—Unobservable inputs that are supported by little or no market activity and that are significant to the fair value of the assets or liabilities. These inputs are based on the Company’s own assumptions used to measure assets and liabilities at fair value and require significant management judgment or estimation.
|
The categorization of a financial instrument within the fair value hierarchy is based upon the lowest level of input that is significant to its fair value measurement. The Company’s assessment of the significance of a particular input to the fair value measurement in its entirety requires management to make judgments and consider factors specific to the assets or liability.
The Company’s financial instruments that are carried at fair value consist of Level I and Level II assets as of
June 30, 2019
and December 31, 2018. The following tables set forth the fair value of the Company’s financial assets measured at fair value on a recurring basis based on the three-tier fair value hierarchy (in thousands):
|
June 30, 2019
|
|||||||||||||||
|
Level I
|
Level II
|
Level III
|
Total
|
||||||||||||
|
Cash equivalents
|
|||||||||||||||
|
Money market funds
|
$
|
51,169
|
|
$
|
—
|
|
$
|
—
|
|
$
|
51,169
|
|
|||
|
Commercial paper
|
—
|
|
2,498
|
|
—
|
|
2,498
|
|
|||||||
|
Marketable securities
|
|||||||||||||||
|
Commercial paper
|
—
|
|
42,481
|
|
—
|
|
42,481
|
|
|||||||
|
Treasury bills
|
4,991
|
|
—
|
|
—
|
|
4,991
|
|
|||||||
|
U.S. government securities
|
14,970
|
|
—
|
|
—
|
|
14,970
|
|
|||||||
|
Total financial assets
|
$
|
71,130
|
|
$
|
44,979
|
|
$
|
—
|
|
$
|
116,109
|
|
|||
|
December 31, 2018
|
|||||||||||||||
|
Level I
|
Level II
|
Level III
|
Total
|
||||||||||||
|
Cash equivalents—money market funds
|
$
|
117,138
|
|
$
|
—
|
|
$
|
—
|
|
$
|
117,138
|
|
|||
|
Total financial assets
|
$
|
117,138
|
|
$
|
—
|
|
$
|
—
|
|
$
|
117,138
|
|
|||
Prior to the IPO, the Company measured its redeemable convertible preferred stock warrant liability at fair value on a recurring basis, and it was classified within Level III because the warrants were valued using a Black-Scholes valuation model, for which some inputs were unobservable in the market. For the three and six months ended June 30, 2018, the Company recorded
$0.1 million
and
$0.4 million
, respectively, related to the revaluation of its redeemable convertible preferred stock warrant liability, which is included in other (income) expense, net in the Company’s condensed consolidated statement of operations.
11
Upon the closing of the IPO in October 2018, the redeemable convertible preferred stock warrant converted to a common stock warrant. As such, the Company reclassified its redeemable convertible preferred stock warrant liability to additional paid-in capital.
12
Note 4—Balance Sheet Components
Cash and Cash Equivalents
Cash and cash equivalents consisted of the following (in thousands):
|
June 30, 2019
|
December 31, 2018
|
||||||
|
Cash
|
$
|
13,425
|
|
$
|
11,990
|
|
|
|
Money market funds
|
51,169
|
|
117,138
|
|
|||
|
Commercial paper
|
2,498
|
|
—
|
|
|||
|
Total cash and cash equivalents
|
$
|
67,092
|
|
$
|
129,128
|
|
|
Marketable Securities
Marketable securities consisted of the following (in thousands):
|
June 30, 2019
|
||||
|
Commercial paper
|
$
|
42,481
|
|
|
|
Treasury bills
|
4,991
|
|
||
|
U.S. government securities
|
14,970
|
|
||
|
Total marketable securities
|
$
|
62,442
|
|
|
For the three and six months ended June 30, 2019, the gross unrealized gains and losses on the Company’s marketable securities were immaterial. As of June 30, 2019, the Company considered any decreases in market value to be temporary in nature and did not consider any of the Company’s marketable securities to be other-than-temporarily impaired. As such, the Company did not record any impairment charges with respect to its marketable securities during the three and six months ended June 30, 2019.
Property and Equipment, Net
Property and equipment, net consisted of the following (in thousands):
|
June 30, 2019
|
December 31, 2018
|
||||||
|
Computer equipment and software
|
$
|
3,750
|
|
$
|
3,189
|
|
|
|
Internal-use software and platform development
|
8,820
|
|
6,287
|
|
|||
|
Leasehold improvements
|
10,433
|
|
5,783
|
|
|||
|
Office furniture and fixtures
|
2,291
|
|
2,545
|
|
|||
|
Total property and equipment
|
25,294
|
|
17,804
|
|
|||
|
Less: accumulated depreciation
|
(6,087
|
)
|
(6,989
|
)
|
|||
|
Property and equipment, net
|
$
|
19,207
|
|
$
|
10,815
|
|
|
For the three months ended
June 30, 2019
and
2018
, depreciation expense related to property and equipment was
$0.6 million
and
$0.5 million
, respectively. For the six months ended
June 30, 2019
and
2018
, depreciation expense related to property and equipment was
$1.4 million
and
$0.9 million
, respectively.
For the three months ended June 30, 2019 and 2018, the Company capitalized
$1.4 million
and
$1.3 million
of internal-use software and platform development costs, respectively. For the six months ended June 30, 2019 and 2018, the Company capitalized
$2.5 million
and
$1.9 million
of internal-use software and platform development costs, respectively.
Amortization expense related to the capitalized internal-use software and platform development costs was immaterial for the three and six months ended June 30, 2019. For the three and six months ended June 30, 2018, there was
no
amortization expense related to the internal-use software and platform development costs as the underlying assets had not been placed into service as of June 30, 2018.
13
Intangible Assets, Net
All of the Company’s identifiable intangible assets were acquired in March 2014 from the Elance-oDesk Combination. Intangible assets, net consisted of the following (in thousands):
|
|
June 30, 2019
|
||||||||||
|
|
Gross Carrying
Amount
|
Accumulated
Amortization
|
Net Carrying
Amount
|
||||||||
|
Trade names
|
$
|
2,293
|
|
$
|
2,293
|
|
$
|
—
|
|
||
|
User relationships
|
18,678
|
|
14,008
|
|
4,670
|
|
|||||
|
Developed technology
|
10,356
|
|
10,356
|
|
—
|
|
|||||
|
Domain names
|
529
|
|
529
|
|
—
|
|
|||||
|
Total
|
$
|
31,856
|
|
$
|
27,186
|
|
$
|
4,670
|
|
||
|
|
December 31, 2018
|
||||||||||
|
|
Gross Carrying
Amount
|
Accumulated
Amortization
|
Net Carrying
Amount
|
||||||||
|
Trade names
|
$
|
2,293
|
|
$
|
2,293
|
|
$
|
—
|
|
||
|
User relationships
|
18,678
|
|
12,674
|
|
6,004
|
|
|||||
|
Developed technology
|
10,356
|
|
10,356
|
|
—
|
|
|||||
|
Domain names
|
529
|
|
529
|
|
—
|
|
|||||
|
Total
|
$
|
31,856
|
|
$
|
25,852
|
|
$
|
6,004
|
|
||
For each of the three and six months ended June 30, 2019 and 2018, amortization expense of intangible assets was
$0.7 million
and
$1.3 million
, respectively. Amortization expense is included in general and administrative expenses. As of
June 30, 2019
, the remaining useful life for user relationships was
1.8 years
. As of
December 31, 2018
, the remaining useful life for user relationships was
2.3 years
.
As of
June 30, 2019
, the estimated future amortization expense for the acquired intangible assets was as follows (in thousands):
|
|
June 30, 2019
|
||
|
Remainder of 2019
|
$
|
1,334
|
|
|
2020
|
2,668
|
|
|
|
2021
|
668
|
|
|
|
Total estimated future amortization expense
|
$
|
4,670
|
|
Accrued Expenses and Other Current Liabilities
Accrued expenses and other current liabilities consisted of the following (in thousands):
|
|
June 30, 2019
|
December 31, 2018
|
|||||
|
Accrued compensation and related benefits
|
$
|
3,712
|
|
$
|
9,314
|
|
|
|
Accrued freelancer costs
|
799
|
|
2,465
|
|
|||
|
Accrued indirect taxes
|
2,192
|
|
1,630
|
|
|||
|
Accrued vendor expenses
|
11,150
|
|
6,002
|
|
|||
|
Accrued payment processing fees
|
776
|
|
715
|
|
|||
|
Other
|
503
|
|
822
|
|
|||
|
Total accrued expenses and other current liabilities
|
$
|
19,132
|
|
$
|
20,948
|
|
|
14
Note 5—Commitments and Contingencies
Operating Leases
The Company leases office space under
five
non-cancellable operating lease agreements, which expire from 2019 through 2028. The terms of the office leases contain rent escalation clauses, rent holidays, and/or tenant improvement allowances. The Company recognizes rent expense on a straight-line basis over the non-cancellable lease term and records the difference between cash payments and the recognition of rent expense as a deferred rent liability. Where leases contain escalation clauses, rent holidays, and/or tenant improvement allowances, the Company applies them in the determination of straight-line rent expense over the lease term.
In February 2019, the Company entered into an agreement for a non-cancellable operating lease for new office space in Santa Clara, California. From June 1, 2019 through October 15, 2028, total minimum lease payments under the lease agreement are
$14.3 million
, with lease payments ranging from
$1.4 million
to
$1.8 million
per year. The Company took possession of the Santa Clara office space for its corporate headquarters during the first quarter of 2019 and moved its corporate headquarters and related operations in the second quarter of 2019 shortly after the termination of its Mountain View, California office lease. As a result, the Company accelerated the depreciation expense of its leasehold improvements and furniture and fixtures on the cease-use date for the space exited in May 2019, which was
immaterial
for the three and six months ended June 30, 2019.
In 2018, the Company entered into an agreement to extend its non-cancellable operating lease for its San Francisco office through 2024. From September 1, 2019 through August 31, 2024, total minimum lease payments under the lease agreement are
$15.7 million
, with lease payments ranging from
$1.0 million
to
$2.2 million
per year from 2019 to 2024.
Also in 2018, the Company entered into an agreement for a non-cancellable operating lease for new office space in Chicago through October 2024. In December 2018, the Company amended this agreement (the “First Amendment”) to extend the term of the original lease from October 2024 to April 2025 and to lease additional office space to accommodate continued headcount growth. From June 1, 2019 through April 30, 2025, total minimum lease payments under the original lease agreement and the First Amendment are
$10.3 million
, with lease payments ranging from
$0.5 million
to
$2.0 million
per year from 2019 to 2025. The Company moved its Chicago-based operations to this new office space in January 2019. In connection with this move, the Company entered into
two
sublease agreements that provided for the sublease of the
two
office spaces the Company occupied prior to its execution of the new operating lease. The Company exited the
two
spaces in December 2018 and January 2019, respectively. As a result, the Company accelerated the depreciation expense of its leasehold improvements and furniture and fixtures on the cease-use date for the space exited in January 2019 and accordingly recorded
$0.3 million
of accelerated depreciation expense during the three months ended March 31, 2019. The expected sublease income from the
two
sublease agreements is reflected in the future aggregate minimum lease payment table below.
As of June 30, 2019, future aggregate minimum lease payments under the non-cancellable operating leases, net of sublease income, were as follows (in thousands):
|
|
June 30, 2019
|
||
|
Remainder of 2019
|
$
|
1,722
|
|
|
2020
|
5,921
|
|
|
|
2021
|
6,405
|
|
|
|
2022
|
6,588
|
|
|
|
2023
|
6,776
|
|
|
|
Thereafter
|
13,137
|
|
|
|
Less: sublease income
|
(656
|
)
|
|
|
Total
|
$
|
39,893
|
|
For the three months ended June 30, 2019 and 2018, rent expense was
$1.5 million
and
$0.9 million
, respectively. For the six months ended June 30, 2019 and 2018, rent expense was
$2.7 million
and
$1.9 million
, respectively.
15
Letters of Credit
In conjunction with the operating lease agreements, as of June 30, 2019 and December 31, 2018, the Company had
four
and
three
irrevocable letters of credit outstanding, respectively, in the aggregate amount of
$1.1 million
and
$0.8 million
, respectively. The letters of credit are collateralized by restricted cash in the same respective amounts and begin to expire in 2019. No amounts had been drawn against these letters of credit as of June 30, 2019 and December 31, 2018.
Contingencies
The Company accrues contingent liabilities when it is probable that future expenditures will be made and such expenditures can be reasonably estimated. From time to time in the normal course of business, various claims and litigation have been asserted or commenced. Due to uncertainties inherent in litigation and other claims the Company can give no assurance that it will prevail in any such matters, which could subject the Company to significant liability or damages. Any claims or litigation could have an adverse effect on the Company’s business, financial position, results of operations, or cash flows in or following the period that claims or litigation are resolved.
As of
June 30, 2019
and
December 31, 2018
, the Company was not a party to any material legal proceedings or claims, nor is the Company aware of any pending or threatened litigation or claims that could reasonably be expected to have a material adverse effect on its business, operating results, cash flows, or financial condition. Accordingly, the Company has determined that the existence of a material loss as of this date is neither probable nor reasonably possible.
Indemnification
The Company has indemnification agreements with its officers, directors, and certain key employees to indemnify them while they are serving in good faith in their respective positions. In the ordinary course of business, the Company enters into contractual arrangements under which it agrees to provide indemnification of varying scope and terms to vendors and other parties, including, but not limited to, losses arising out of the Company’s breach of such agreements. In addition, subject to the terms of the applicable agreement, as part of the Company’s Upwork Enterprise offering, the Company indemnifies clients that subscribe to worker classification services for losses arising from worker misclassification and intellectual property claims made by third parties relating to the use of the Company’s platform. The Company also indemnifies clients utilizing its Upwork Business offering for losses arising from intellectual property claims made by third parties relating to the use of the Company’s platform, subject to the terms of the applicable agreement. It is not possible to determine the maximum potential loss under these indemnification provisions due to the Company’s limited history of prior indemnification claims and the facts and circumstances involved in each particular provision.
16
Note 6—Debt
The following table presents the carrying value of the Company’s debt obligations as of
June 30, 2019
and December 31, 2018 (in thousands):
|
|
June 30, 2019
|
December 31, 2018
|
||||||
|
First Term Loan—18 months of interest-only payments ended in March 2019 followed by 36 equal monthly installments of principal plus interest, maturing March 2022; interest at prime plus 0.25% per annum
|
$
|
13,750
|
|
$
|
15,000
|
|
||
|
Second Term Loan—11 months of interest-only payments ended in October 2018 followed by 47 equal monthly installments of principal plus interest, maturing September 2022. As of September 30, 2018, the Company achieved trailing six-month EBITDA of at least $1.0 million; as a result, the interest-only repayment period extended to March 2019, followed by 42 equal monthly installments of principal plus interest; bears interest at prime plus 5.25% per annum. As a result of the IPO, the interest rate was reduced to prime plus 0.25% per annum in the fourth quarter of 2018
|
8,357
|
|
9,000
|
|
||||
|
Line of credit—interest at prime with accrued interest due monthly; matures September 2020
|
25,000
|
|
—
|
|
||||
|
Total debt
|
47,107
|
|
24,000
|
|
||||
|
Less: unamortized debt discount issuance costs
|
(64
|
)
|
(90
|
)
|
||||
|
Balance
|
47,043
|
|
23,910
|
|
||||
|
Debt, current
|
(32,574
|
)
|
(5,671
|
)
|
||||
|
Debt, noncurrent
|
$
|
14,469
|
|
$
|
18,239
|
|
||
|
Weighted-average interest rate
|
5.96
|
%
|
6.89
|
%
|
||||
Under the Company’s Loan and Security Agreement, as amended (the “Loan Agreement”), the aggregate amount of the facility was up to
$49.0 million
, consisting of a term loan in the original principal amount of
$15.0 million
(the “First Term Loan”), a term loan in the original principal amount of
$9.0 million
(the “Second Term Loan” and, together with the First Term Loan, the “Term Loans”) and a revolving line of credit, which permits borrowings of up to
$25.0 million
subject to customary conditions. Among other things, the Company may only borrow funds under the revolving line of credit if, after giving effect thereto, total borrowings under the line of credit do not exceed a specified percentage of eligible trade and client accounts receivable.
In September 2018, the Company entered into a second amendment (the “Second Amendment”) to the Loan Agreement, which expanded the types of eligible trade and client accounts receivable considered for the determination of the borrowing base of the revolving line of credit. The Second Amendment also provided for a reduction in the interest rate for the Second Term Loan, from the prime rate plus
5.25%
per annum to the prime rate plus
0.25%
per annum, from and after the occurrence of an initial public offering by the Company with net proceeds of more than
$50.0 million
. This reduction became effective following the completion of the IPO in October 2018.
In March 2019, the Company entered into a third amendment (the “Third Amendment”) to the Loan Agreement, which, among other changes, (i) amended the adjusted quick ratio financial covenant to provide that the Company will maintain an adjusted quick ratio of
1.75
to 1.00 (previously
1.30
to 1.00), (ii) reduced the frequency with which the Company is required to provide certain financial information to the lender during periods in which it maintains an adjusted quick ratio of
2.50
to 1.00, and (iii) eliminated the minimum EBITDA covenant with which the Company was required to comply. The Company was in compliance with its covenants under the Loan Agreement as of June 30, 2019 and December 31, 2018.
To the extent the Company has not yet collected funds for hourly billings from clients that are in-transit due to timing differences in receipt of cash from clients, the Company may utilize the revolving line of credit to satisfy customary escrow funding requirements. The Company drew down
$25.0 million
under the revolving line of credit for such purpose in each of March and June 2019, which the Company subsequently repaid in April and July 2019, respectively. See “Note 14—Subsequent Events.”
Pursuant to the terms of the Loan Agreement, in April 2019, the Company commenced repayment on the Term Loans. During the three months ended June 30, 2019, the Company repaid
$1.3 million
related to the First Term Loan and
$0.6 million
related to the Second Term Loan.
17
Amortization expense related to the debt discount was immaterial for the
three and six
months ended
June 30, 2019
and
2018
.
18
Note 7—Redeemable Convertible Preferred Stock
Prior to the IPO, the Company financed its operations and capital expenditures primarily through sales of convertible preferred stock, bank borrowings, and utilization of cash generated from operations in the periods in which the Company generated cash flows from operations.
As a result of the IPO, all of the Company’s
61,279,079
shares of then-outstanding redeemable convertible preferred stock automatically converted into shares of common stock on a
one
-for-one basis. Therefore, there were
no
issued or outstanding shares of redeemable convertible preferred stock as of June 30, 2019 and December 31, 2018.
19
Note 8—Preferred and Common Stock Warrants
Redeemable Convertible Preferred Stock Warrants
As a result of the Elance-oDesk Combination, a redeemable convertible preferred stock warrant that was originally issued by Elance prior to the Elance-oDesk Combination became exercisable to purchase up to
124,506
and
273,825
shares of the Company’s Series A-1 and Series A-2 redeemable convertible preferred stock, respectively, at an exercise price of
$3.13
per share.
Prior to the IPO, the Company estimated the fair value of its redeemable convertible preferred stock warrant using the Black-Scholes valuation model. For the three and six months ended June 30, 2018, the Company recorded
$0.1 million
and
$0.4 million
, respectively, related to the revaluation of its redeemable convertible preferred stock warrant liability, which is included in other (income) expense, net in the Company’s condensed consolidated statement of operations.
Upon completion of the IPO, this warrant converted to a common stock warrant exercisable for the same number of shares and was reclassified to additional paid-in capital. The common stock warrant was outstanding and exercisable as of December 31, 2018. In April 2019, this common stock warrant was exercised in full at a total cost of
$1.2 million
. In lieu of a cash payment, the holder of the warrant surrendered
64,646
shares of common stock to cover the exercise price. The Company issued
333,685
shares of common stock upon the exercise of this common stock warrant.
Common Stock Warrant
In 2018, the Company established The Upwork Foundation initiative. The program includes a donor-advised fund created through the Tides Foundation. In May 2018, the Company issued a warrant to purchase
500,000
shares of its common stock at an exercise price of
$0.01
per share to the Tides Foundation. The vesting and exercisability provisions of the warrant became effective upon the IPO in October 2018.
This warrant is exercisable as to
1/10
th
of the shares on each anniversary of the IPO, with proceeds from the sale of such shares to be donated in accordance with the Company’s directive. For the three and six months ended June 30, 2019, the Company recorded
$0.2 million
and
$0.4 million
of expense, respectively, related to the revaluation of this warrant, which is included in general and administrative expense in the Company’s condensed consolidated statement of operations.
20
Note 9—Common Stock
Holders of common stock are entitled to
one vote per share
and are entitled to receive dividends, if any, on a pro rata basis whenever funds are legally available and when, as, and if declared by the Company’s board of directors.
As of
June 30, 2019
and
December 31, 2018
, the Company was authorized to issue
490,000,000
shares of common stock. As of
June 30, 2019
and
December 31, 2018
, the Company had reserved shares of common stock for future issuance as follows:
|
|
June 30, 2019
|
December 31, 2018
|
|||
|
Options issued and outstanding
|
19,771,277
|
|
23,774,279
|
|
|
|
RSUs issued and outstanding
|
1,213,337
|
|
288,460
|
|
|
|
Warrant to purchase common stock
|
500,000
|
|
898,331
|
|
|
|
Remaining shares reserved for future issuances under 2018 Equity Incentive Plan
|
15,320,498
|
|
10,558,306
|
|
|
|
Remaining shares reserved for futures issuances under 2018 Employee Stock Purchase Plan
|
2,271,326
|
|
1,700,000
|
|
|
|
Total
|
39,076,438
|
|
37,219,376
|
|
|
21
Note 10—Stock-Based Compensation
Equity Incentive Plans
The following table summarizes activity under the Company’s stock option plans:
|
|
Number of Shares Underlying Outstanding Options
|
Weighted-Average Exercise Price
|
Weighted-Average Remaining Contractual Term (Years)
|
Aggregate Intrinsic Value
(in thousands)
|
||||||||
|
Balances at December 31, 2018
|
23,774,279
|
|
$
|
3.71
|
|
7.10
|
$
|
342,262
|
|
|||
|
Exercised
|
(3,584,854
|
)
|
2.89
|
|
||||||||
|
Forfeited and canceled
|
(418,148
|
)
|
4.78
|
|
||||||||
|
Balances at June 30, 2019
|
19,771,277
|
|
$
|
3.84
|
|
6.81
|
$
|
241,977
|
|
|||
In 2018, the Company’s board of directors and stockholders each adopted the 2018 Equity Incentive Plan (the “2018 EIP”), which became effective on the date immediately prior to the date of the IPO. Awards granted under the 2018 EIP may be (i) incentive stock options, (ii) nonqualified stock options, (iii) restricted stock units (“RSUs”), (iv) restricted stock awards, or (v) stock appreciation rights, as determined by the Company’s board of directors at the time of grant.
The following table summarizes the RSU activity and related information under the 2018 EIP:
|
Number of RSUs
Outstanding
|
Weighted-Average Grant Date
Fair Value
|
|||||
|
Unvested balance at December 31, 2018
|
288,460
|
|
$
|
15.00
|
|
|
|
Granted
|
1,025,786
|
|
19.16
|
|
||
|
Vested
|
(55,362
|
)
|
15.30
|
|
||
|
Forfeited and canceled
|
(45,547
|
)
|
18.22
|
|
||
|
Unvested balance at June 30, 2019
|
1,213,337
|
|
$
|
18.38
|
|
|
Pursuant to the terms of the 2018 EIP, in January 2019, the number of shares available for grant was increased by
5,322,716
shares.
In July 2018, the Company’s board of directors granted an option exercisable for up to
1,860,000
shares of common stock to the Company’s Chief Executive Officer under the 2018 EIP (the “CEO Award”). The vesting and exercisability of the CEO Award is contingent upon the recipient’s continuous service as the Chief Executive Officer and the achievement of certain measurement objectives during three separate measurement periods within the period of time beginning on January 1, 2019 and ending on December 31, 2023. Each reporting period, the Company assesses the probability that the performance criteria will be met and records expense for those shares that are probable of vesting. As of June 30, 2019, the Company determined that vesting of the CEO Award was not probable. As a result, the Company reversed the full amount of previously recorded expense related to the CEO Award, which amounted to
$1.4 million
and
$0.9 million
for the three and six months ended June 30, 2019, respectively.
In February 2019, the Company’s board of directors approved the omnibus Performance Bonus Plan along with the performance criteria and bonus pool for 2019 (the “Bonus Plan”), which provides for the payment of bonus compensation to selected employees of the Company, including the Company’s executive officers, upon the achievement of certain performance criteria. In lieu of a cash payment, bonus payments to certain of the Company’s management team will be paid in the form of fully vested RSUs issued from the 2018 EIP. The ultimate number of fully vested RSUs to be granted will be determined by dividing (A) the total dollar value of the bonus that would be delivered in cash by (B) the closing stock price on the day prior to the award grant date, which is expected to occur in the first quarter of 2020. The payment of the bonus in fully vested RSUs requires accounting as a stock-based award under U.S. GAAP. Because the number of fully vested RSUs to be granted is dependent upon the future closing price of the Company’s common stock, the Company has classified this award as a liability within its condensed consolidated balance sheet as of June 30, 2019. Each reporting period, the Company assesses the probability that the performance criteria will be met and records expense for those shares that are probable of vesting.
22
Employee Stock Purchase Plan
In 2018, the Company’s board of directors and stockholders each adopted the 2018 Employee Stock Purchase Plan (the “2018 ESPP”), which became effective upon the completion of the IPO. Pursuant to the terms of the 2018 ESPP, in January 2019, the number of shares of common stock available for issuance was increased by
851,634
shares.
During the three months ended June 30, 2019, the Company issued
280,308
shares of common stock under the 2018 ESPP.
Stock-Based Compensation
The following table summarizes the components of stock-based compensation expense recognized in the condensed consolidated statements of operations (in thousands):
|
|
Three Months Ended June 30,
|
Six Months Ended June 30,
|
|||||||||||||
|
|
2019
|
2018
|
2019
|
2018
|
|||||||||||
|
Cost of revenue
|
$
|
73
|
|
$
|
53
|
|
$
|
217
|
|
$
|
105
|
|
|||
|
Research and development
|
1,686
|
|
538
|
|
3,066
|
|
1,088
|
|
|||||||
|
Sales and marketing
|
583
|
|
331
|
|
1,225
|
|
671
|
|
|||||||
|
General and administrative
|
289
|
|
871
|
|
2,418
|
|
1,817
|
|
|||||||
|
Total stock-based compensation
|
$
|
2,631
|
|
$
|
1,793
|
|
$
|
6,926
|
|
$
|
3,681
|
|
|||
Stock-based compensation expense related to non-employee stock option grants was immaterial for the three and six months ended June 30, 2019 and 2018.
The amount of stock-based compensation capitalized to internal-use software and platform development costs for the three and six months ended June 30, 2019 and 2018 was immaterial
Prior to the IPO, certain common stockholders (who were employees or former employees of the Company) sold shares of the Company’s common stock in secondary market transactions. In 2018, one such transaction occurred. The incremental value between the sale price and the fair value of the common stock at the date of sale aggregated to an immaterial amount of stock-based compensation expense for the three and six months ended June 30, 2018.
23
Note 11—Net Loss per Share
The following table sets forth the computation of the Company’s basic and diluted net loss per share for the periods presented (in thousands, except share and per share data):
|
|
Three Months Ended June 30,
|
Six Months Ended June 30,
|
|||||||||||||
|
|
2019
|
2018
|
2019
|
2018
|
|||||||||||
|
Numerator:
|
|
|
|
|
|
|
|
|
|||||||
|
Net loss
|
$
|
(2,027
|
)
|
$
|
(412
|
)
|
$
|
(6,755
|
)
|
$
|
(7,196
|
)
|
|||
|
Denominator:
|
|||||||||||||||
|
Weighted-average shares used to compute net loss per share, basic and diluted
|
108,683,099
|
|
35,104,769
|
|
107,665,492
|
|
34,651,331
|
|
|||||||
|
Net loss per share, basic and diluted
|
$
|
(0.02
|
)
|
$
|
(0.01
|
)
|
$
|
(0.06
|
)
|
$
|
(0.21
|
)
|
|||
The following potentially dilutive shares were excluded from the computation of diluted net loss per share because including them would have been anti-dilutive:
|
|
As of June 30,
|
||||
|
|
2019
|
2018
|
|||
|
Options to purchase common stock
|
19,771,277
|
|
22,932,222
|
|
|
|
Common stock issuable upon conversion of redeemable convertible preferred stock
|
—
|
|
61,279,079
|
|
|
|
Common stock issuable upon exercise of common stock warrants
|
500,000
|
|
500,000
|
|
|
|
Common stock issuable upon exercise and redeemable conversion of preferred stock warrants
|
—
|
|
398,331
|
|
|
|
Common stock issuable upon vesting of restricted stock units
|
1,213,337
|
|
—
|
|
|
|
Common stock issuable in connection with employee stock purchase plan
|
802,389
|
|
—
|
|
|
|
Total
|
22,287,003
|
|
85,109,632
|
|
|
24
Note 12—Segment and Geographical Information
The Company operates as
one
operating and reportable segment for purposes of allocating resources and evaluating financial performance.
The following table sets forth total revenue by type of service for the periods presented (in thousands):
|
Three Months Ended June 30,
|
Six Months Ended June 30,
|
||||||||||||||
|
2019
|
2018
|
2019
|
2018
|
||||||||||||
|
Marketplace
|
$
|
66,201
|
|
$
|
55,454
|
|
$
|
127,104
|
|
$
|
107,413
|
|
|||
|
Managed services
|
8,055
|
|
7,227
|
|
16,076
|
|
14,486
|
|
|||||||
|
Total revenue
|
$
|
74,256
|
|
$
|
62,681
|
|
$
|
143,180
|
|
$
|
121,899
|
|
|||
The Company generates its revenue from freelancers and clients. The following table sets forth total revenue by geographic area based on the billing address of its freelancers and clients for the periods presented (in thousands):
|
Three Months Ended June 30,
|
Six Months Ended June 30,
|
||||||||||||||
|
2019
|
2018
|
2019
|
2018
|
||||||||||||
|
Freelancers
|
|||||||||||||||
|
United States
|
$
|
12,486
|
|
$
|
9,554
|
|
$
|
24,374
|
|
$
|
18,657
|
|
|||
|
India
|
6,904
|
|
6,467
|
|
13,534
|
|
12,573
|
|
|||||||
|
Philippines
|
4,929
|
|
4,203
|
|
9,506
|
|
8,158
|
|
|||||||
|
Rest of world
|
22,588
|
|
20,159
|
|
44,283
|
|
39,184
|
|
|||||||
|
Total freelancers
|
46,907
|
|
40,383
|
|
91,697
|
|
78,572
|
|
|||||||
|
Clients
|
|||||||||||||||
|
United States
|
21,431
|
|
18,187
|
|
39,105
|
|
33,649
|
|
|||||||
|
Rest of world
|
5,918
|
|
4,111
|
|
12,378
|
|
9,678
|
|
|||||||
|
Total clients
|
27,349
|
|
22,298
|
|
51,483
|
|
43,327
|
|
|||||||
|
Total revenue
|
$
|
74,256
|
|
$
|
62,681
|
|
$
|
143,180
|
|
$
|
121,899
|
|
|||
Substantially all of the Company’s long-lived assets were located in the United States as of
June 30, 2019
and
December 31, 2018
.
25
Note 13—401(k) Plan
The Company offers the Upwork Retirement Savings Plan (the “Retirement Plan”), a defined contribution plan that allows employees to contribute a portion of their salary, subject to the annual limits. Under the Retirement Plan, eligible employees may defer a portion of their pretax salaries, but not more than the statutory limits. The Retirement Plan provides for a discretionary employer matching contribution. The Company makes matching contributions equal to
50%
of each dollar contributed, subject to a maximum contribution of
$5,000
annually per participant. The Company’s total expense for the matching contributions was
$0.5 million
and
$0.3 million
for the three months ended
June 30, 2019
and
2018
, respectively. The Company’s total expense for the matching contributions was
$1.4 million
and
$1.1 million
for the six months ended June 30, 2019 and 2018, respectively.
Note 14—Subsequent Events
In July 2019, the Company repaid
$25.0 million
outstanding under the Company’s line of credit that was drawn down in June in order to satisfy the Company’s escrow funding requirements as of June 30, 2019.
26
Item 2. Management’s Discussion and Analysis of Financial Condition and Results of Operations.
You should read the following discussion and analysis of our financial condition and results of operations together with the section titled “Risk Factors” and the condensed consolidated financial statements and related notes included elsewhere in this Quarterly Report. This discussion contains forward-looking statements based upon current expectations that involve risks and uncertainties, as well as assumptions that they may never materialize or that may be proven incorrect. Our actual results may differ materially from those anticipated in these forward-looking statements as a result of various factors, including those discussed in the sections titled “Special Note Regarding Forward-Looking Statements” and “Risk Factors,” and in other parts of this Quarterly Report.
Overview
We operate the largest online marketplace that enables businesses to find and work with highly-skilled freelancers, as measured by gross services volume (“GSV”). GSV represents the total amount that clients spend on both our marketplace offerings and our managed services offering, as well as additional fees we charge to both clients and freelancers for other services. Freelancers are an increasingly sought-after, critical, and expanding segment of the global workforce. We define freelancers as users of our platform that advertise and provide services to clients through our platform, and we define clients as users of our platform that work with freelancers through our platform. The freelancers on our platform include independent professionals and agencies of varying sizes. The clients on our platform range in size from small businesses to Fortune 500 companies. In over 180 countries, our platform enabled $0.5 billion and $0.4 billion of GSV for the three months ended June 30, 2019 and 2018, respectively, and $1.0 billion and $0.8 billion of GSV for the six months ended June 30, 2019 and 2018, respectively. For purposes of determining countries where we enable GSV, we include both the countries in which the clients that paid for the applicable services are located, as well as the countries in which the freelancers that provided those services are located.
We generate a majority of our revenue from fees charged to freelancers. We also generate revenue through fees charged to clients for transacting payments through our platform and fees for premium offerings, as well as foreign currency exchange fees and Upwork Payroll service fees. In addition, we provide a managed services offering where we engage freelancers to complete projects, directly invoice the client, and assume responsibility for work performed by the freelancers. For the three months ended June 30, 2019 and 2018, we generated total revenue of $74.3 million and $62.7 million, respectively, representing a period-over-period increase of 18%. For the six months ended June 30, 2019 and 2018, we generated total revenue of $143.2 million and $121.9 million, respectively, representing a period-over-period increase of 17%.
For the three months ended June 30, 2019, we generated a net loss of $2.0 million and our adjusted EBITDA was $1.6 million, compared to a net loss of $0.4 million and adjusted EBITDA of $3.3 million for the three months ended June 30, 2018. For the six months ended June 30, 2019, we generated a net loss of $6.8 million and our adjusted EBITDA was $2.8 million, compared to a net loss of $7.2 million and adjusted EBITDA of $0.3 million for the six months ended June 30, 2018. Adjusted EBITDA is a financial measure that is not prepared in accordance with, and is not an alternative to, financial measures prepared in accordance with U.S. generally accepted accounting principles (“U.S. GAAP”). See the section titled “Key Financial and Operational Metrics—Non-GAAP Financial Measures” below for a definition of adjusted EBITDA and information regarding our use of adjusted EBITDA and a reconciliation of net loss to adjusted EBITDA.
27
Key Financial and Operational Metrics
We monitor the following key financial and operational metrics to evaluate our business, measure our performance, identify trends affecting our business, formulate business plans, and make strategic decisions. Our key metrics were as follows as of or for the periods presented:
|
|
Three Months Ended June 30,
|
Six Months Ended June 30,
|
|||||||||||||
|
|
2019
|
2018
|
2019
|
2018
|
|||||||||||
|
(in thousands)
|
|||||||||||||||
|
GSV
|
$
|
518,761
|
|
$
|
432,284
|
|
$
|
1,005,690
|
|
$
|
834,532
|
|
|||
|
Marketplace revenue
|
66,201
|
|
55,454
|
|
127,104
|
|
107,413
|
|
|||||||
|
Adjusted EBITDA
(1)
|
1,576
|
|
3,313
|
|
2,822
|
|
256
|
|
|||||||
|
(1)
|
Adjusted EBITDA is not prepared in accordance with, and is not an alternative to, financial measures prepared in accordance with U.S. GAAP. See “—Non-GAAP Financial Measures” below for a definition of adjusted EBITDA and for information regarding our use of adjusted EBITDA and a reconciliation of adjusted EBITDA to net loss, the most directly comparable financial measure prepared under U.S. GAAP.
|
|
|
As of June 30,
|
||||
|
|
2019
|
2018
|
|||
|
(in thousands, except percentages)
|
|||||
|
Core clients
|
115.7
|
|
95.7
|
|
|
|
Client spend retention
|
105
|
%
|
106
|
%
|
|
We believe these key financial and operational metrics are useful to evaluate period-over-period comparisons of our business and in understanding our operating results. The number of core clients in any given period drives both GSV, which represents the amount of business transacted through our platform, and client spend retention. Client spend retention impacts the growth rate of GSV. We believe our marketplace revenue, which represents a majority of our revenue, will grow as GSV grows, although they could grow at different rates. For a discussion of limitations in the measurement of core clients, GSV, and client spend retention, see “Risk Factors—We track certain performance metrics with internal tools and do not independently verify such metrics. Certain of our performance metrics are subject to inherent challenges in measurement, and real or perceived inaccuracies in such metrics may harm our reputation and negatively affect our business” in Part II of this Quarterly Report.
Core Clients
We define a core client as a client that has spent in the aggregate at least $5,000 since it began using our platform and also had spend-activity on our platform during the twelve months preceding the date of measurement. This includes the total amount spent by the client on both the Elance and oDesk platforms for the periods prior to the consolidation of the two platforms as described in “Note 1—Organization and Description of Business” of our condensed consolidated financial statements and related notes included elsewhere in this Quarterly Report. We believe $5,000 is an important spend milestone as it indicates that the client is actively using our platform. Historically, these core clients have been more likely to continue using our platform. We continue to see businesses of all sizes use our platform in a recurring way for larger, more complex projects, and we expect the number of core clients to continue to increase over time. We believe that the number of core clients is a key indicator of our growth and the overall health of our business because core clients are a primary driver of GSV, and, therefore, marketplace revenue.
Gross Services Volume
GSV includes both client spend and additional fees charged for other services. Client spend, which we define as the total amount that clients spend on both our marketplace offerings and our managed services offering, is the primary component of GSV. GSV also includes additional fees charged to both clients and freelancers for other services, such as freelancer withdrawals and foreign currency exchange.
28
GSV is an important metric because it represents the amount of business transacted through our platform. Growth in the number of core clients and increased client spend retention are the primary drivers of GSV growth. In addition, our marketplace revenue is primarily comprised of the service fees paid by freelancers as a percentage of the total amount freelancers charge clients for services accessed through our platform. Therefore, marketplace revenue is correlated to GSV, and we believe that our marketplace revenue will grow as GSV grows, although they could grow at different rates. We expect our GSV to fluctuate between periods due to a number of factors, including the volume and characteristics of projects that are posted by clients on our platform, such as size, duration, pricing, and other factors.
Client Spend Retention
We calculate client spend retention by dividing our recurring client spend by our base client spend. We define base client spend as the aggregate client spend from all clients during the four quarters ended one year prior to the date of measurement. We define our recurring client spend as the aggregate client spend during the four quarters ended on the date of measurement from the same clients included in our measure of base client spend. Our business is recurring in nature even though clients are not contractually required to spend on a recurring basis. We believe that client spend retention is a key indicator of the value of our platform and the overall health of our business because it impacts the growth rate of GSV, and, therefore, marketplace revenue. As of June 30, 2019, client spend retention was
105%
, down slightly from
106%
as of June 30, 2018. We believe that this decline in client spend retention—from its historically highest levels in 2018 and the first quarter of 2019—follows an acceleration in client spend retention subsequent to the launch of our U.S.-to-U.S. domestic offering in the second half of 2017. Client spend retention will continue to vary from period to period due to client behavior.
Marketplace Revenue
Marketplace revenue, which represents the majority of our revenue, consists of revenue derived from our Upwork Basic, Plus, Business, and Enterprise offerings, and our other premium offerings. We generate marketplace revenue from both freelancers and clients. Our marketplace revenue is primarily comprised of the service fees paid by freelancers as a percentage of the total amount freelancers charge clients for services accessed through our platform, and to a lesser extent, payment processing and administration fees charged to clients. We also generate marketplace revenue from fees for premium offerings and for other services, such as foreign currency exchange fees and Upwork Payroll service fees. Marketplace revenue is an important metric because it is the primary driver of our business model, and we believe it provides greater comparability to other online marketplaces. The growth rate of marketplace revenue fluctuates in relation to the growth rate of GSV. Therefore, marketplace revenue is correlated to GSV, and we believe that our marketplace revenue will grow as GSV grows, although they could grow at different rates.
Non-GAAP Financial Measures
In addition to our results determined in accordance with U.S. GAAP, adjusted EBITDA is a non-GAAP measure that we believe is useful in evaluating our operating performance.
We define adjusted EBITDA as net income (loss) adjusted for stock-based compensation expense, depreciation and amortization, interest expense, other (income) expense, net, income tax (benefit) provision, the change in fair value of our Tides Foundation common stock warrant, and, if applicable, other non-cash transactions. Adjusted EBITDA is not prepared in accordance with, and is not an alternative to, financial measures prepared in accordance with U.S. GAAP.
29
The following table presents a reconciliation of net loss, the most directly comparable financial measure prepared in accordance with U.S. GAAP, to adjusted EBITDA for each of the periods indicated (in thousands):
|
|
Three Months Ended June 30,
|
Six Months Ended June 30,
|
|||||||||||||
|
|
2019
|
2018
|
2019
|
2018
|
|||||||||||
|
Net Loss
|
$
|
(2,027
|
)
|
$
|
(412
|
)
|
$
|
(6,755
|
)
|
$
|
(7,196
|
)
|
|||
|
Add back (deduct):
|
|||||||||||||||
|
Stock-based compensation expense
|
2,631
|
|
1,793
|
|
6,926
|
|
3,681
|
|
|||||||
|
Depreciation and amortization
|
1,295
|
|
1,191
|
|
2,827
|
|
2,255
|
|
|||||||
|
Interest expense
|
357
|
|
556
|
|
730
|
|
1,085
|
|
|||||||
|
Other (income) expense, net
|
(832
|
)
|
173
|
|
(1,311
|
)
|
422
|
|
|||||||
|
Income tax provision
|
27
|
|
12
|
|
28
|
|
9
|
|
|||||||
|
Change in fair value of Tides Foundation common stock warrant
|
125
|
|
—
|
|
377
|
|
—
|
|
|||||||
|
Adjusted EBITDA
|
$
|
1,576
|
|
$
|
3,313
|
|
$
|
2,822
|
|
$
|
256
|
|
|||
We use adjusted EBITDA as a measure of operational efficiency. We believe that this non-GAAP financial measure is useful to investors for period-to-period comparisons of our business and in understanding and evaluating our operating results for the following reasons:
|
•
|
adjusted EBITDA is widely used by investors and securities analysts to measure a company’s operating performance without regard to items such as stock-based compensation expense, depreciation and amortization, interest expense, other (income) expense, net, income tax (benefit) provision, the change in fair value of our Tides Foundation common stock warrant, and, if applicable, other non-cash transactions that can vary substantially from company to company depending upon their financing, capital structures, and the method by which assets were acquired;
|
|
•
|
our management uses adjusted EBITDA in conjunction with financial measures prepared in accordance with U.S. GAAP for planning purposes, including the preparation of our annual operating budget, as a measure of our core operating results and the effectiveness of our business strategy, and in evaluating our financial performance; and
|
|
•
|
adjusted EBITDA provides consistency and comparability with our past financial performance, facilitates period-to-period comparisons of our core operating results, and also facilitates comparisons with other peer companies, many of which use similar non-GAAP financial measures to supplement their U.S. GAAP results.
|
Our use of adjusted EBITDA has limitations as an analytical tool, and you should not consider it in isolation or as a substitute for analysis of our financial results as reported under U.S. GAAP. Some of these limitations are as follows:
|
•
|
adjusted EBITDA excludes stock-based compensation expense, which has recently been, and will continue to be for the foreseeable future, a significant recurring expense for our business and an important part of our compensation strategy;
|
|
•
|
although depreciation and amortization expense are non-cash charges, the assets being depreciated and amortized may have to be replaced in the future, and adjusted EBITDA does not reflect cash capital expenditure requirements for such replacements or for new capital expenditure requirements;
|
|
•
|
adjusted EBITDA does not reflect: (a) changes in, or cash requirements for, our working capital needs; (b) interest expense, or the cash requirements necessary to service interest or principal payments on our debt, which reduces cash available to us; or (c) tax payments that may represent a reduction in cash available to us; and
|
|
•
|
other companies, including companies in our industry, may calculate adjusted EBITDA or similarly titled measures differently, which reduces the usefulness of this measure for comparative purposes.
|
Because of these and other limitations, you should consider adjusted EBITDA along with other financial performance measures, including net loss and our other financial results prepared in accordance with U.S. GAAP.
30
Components of Our Results of Operations
Revenue
Marketplace Revenue.
Marketplace revenue is generated from our Upwork Basic, Plus, Business, and Enterprise offerings, and other premium offerings. Under these marketplace offerings, we generate revenue from both freelancers and clients.
Marketplace revenue, which represents the majority of our total revenue, is primarily comprised of the service fees paid by freelancers as a percentage of the total amount that freelancers charge clients for services accessed through our platform and, to a lesser extent, payment processing and administration fees paid by clients.
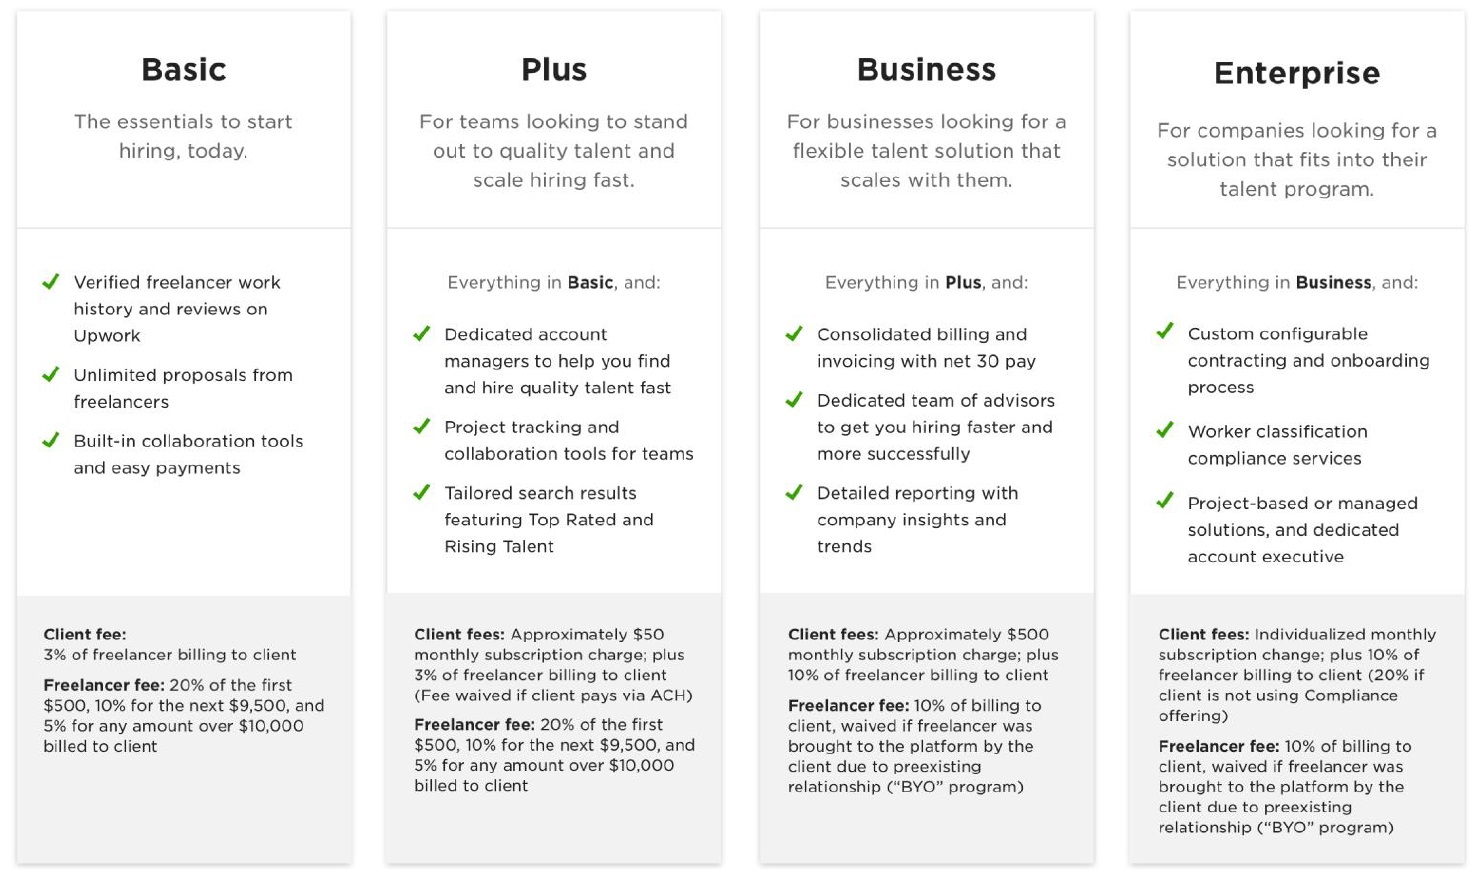
Our Upwork Basic and Plus offerings provide clients with access to freelance talent with verified work history on our platform and client feedback, the ability to instantly match with the right freelancers, and built-in collaboration features. For our Upwork Basic and Plus offerings, we have a tiered freelancer service fee schedule based on cumulative lifetime billings by the freelancer to each client. Freelancers typically pay us 20% of the first $500, 10% for the next $9,500, and then 5% for any amount over $10,000 they bill to each client through our platform. We also generate revenue from freelancers through withdrawal and other fees, which are currently immaterial.
In addition, we generate marketplace revenue from our Upwork Basic and Plus offerings by charging clients a payment processing and administration fee. Clients using our Upwork Basic offering pay a fee equal to 3% of their client spend. Clients using our Upwork Plus offering pay a flat fee of about $50 per month for additional features and pay a fee equal to 3% of their client spend unless they pay via ACH. We also generate revenue from foreign currency exchange fees from clients, which are currently immaterial.
Our Upwork Business and Enterprise offerings and other premium offerings, which are designed for larger clients, include access to additional product features, premium access to top talent, professional services, custom reporting, and invoicing on a monthly basis. For our Upwork Business offering, we charge either an annual or monthly subscription fee and a service fee calculated as a percentage of the client’s spend on freelancer services, in addition to the service fees paid by freelancers. For our Upwork Enterprise offering, we charge clients a monthly or annual subscription fee and a service fee calculated as a percentage of the client’s spend on freelancer services, in addition to the service fees paid by freelancers. Additionally, Upwork Enterprise clients can also subscribe to a compliance offering that includes worker classification services for an additional fee. Upwork Business and Enterprise clients may also choose to use our platform to engage freelancers that were not sourced through our platform for a lower fee percentage.
31
One of our premium offerings, Upwork Payroll, is available to clients when freelancers are classified as employees for engagements on our online marketplace. The client enters into an Upwork Payroll agreement with us, and we separately contract with unrelated third-party staffing providers who provide employment services to such clients. Revenue from Upwork Payroll is currently immaterial.
Managed Services Revenue.
Through our managed services offering, we are responsible for providing services and engaging freelancers directly or as employees of third-party staffing providers to perform services for clients on our behalf. The freelancers delivering managed services include independent professionals and agencies of varying sizes. Under U.S. GAAP, we are deemed to be the principal in these managed services arrangements and therefore recognize the entire GSV of managed services projects as managed services revenue, as compared to recognizing only the percentage of the client spend that we receive, as we do with our marketplace offerings.
Cost of Revenue and Gross Profit
Cost of Revenue.
Cost of revenue consists primarily of the cost of payment processing fees, amounts paid to freelancers to deliver services for clients under our managed services offering, personnel-related costs for our services and support personnel, third-party hosting fees for our use of Amazon Web Services (“AWS”), and the amortization expense associated with acquired intangibles and capitalized internal-use software and platform development. We define personnel-related costs as salaries, bonuses, benefits, travel and entertainment, and stock-based compensation costs for employees and the costs related to other service providers we engage.
We expect cost of revenue to increase in absolute dollars in future periods due to higher payment processing fees, third-party hosting fees, and personnel-related costs in order to support growth on our platform. Amounts paid to freelancers to deliver services under our managed services offering are tied to the volume of managed services used by our clients. The level and timing of all of these items could fluctuate and affect our cost of revenue in the future.
Gross Profit and Gross Margin.
Our gross profit and gross margin may fluctuate from period-to-period. Such fluctuations may be influenced by our revenue, the mix of payment methods that our clients choose, the timing and amount of investments to expand hosting capacity, our continued investments in our services and support teams, the timing and amount of services freelancers deliver for clients under our managed services offering, and the amortization expense associated with acquired intangibles and capitalized internal-use software and platform development cost. In addition, gross margin will be impacted by fluctuations in our revenue mix between marketplace revenue and our managed services revenue.
Operating Expenses
Research and Development.
Research and development expense primarily consists of personnel-related costs and third-party hosting costs related to development. Research and development costs are expensed as incurred, except to the extent that such costs are associated with internal-use software and platform development that qualifies for capitalization. We believe continued investments in research and development are important to attain our strategic objectives and expect research and development expense to increase in absolute dollars for the foreseeable future, although this expense, expressed as a percentage of total revenue, may vary from period to period.
Sales and Marketing.
Sales and marketing expense consists primarily of expenses related to personnel-related costs, including sales commissions, which we expense as they are incurred, and advertising and marketing activities. We continue to invest in our sales and marketing capabilities and expect this expense to increase in absolute dollars in future periods, although this expense expressed as a percentage of total revenue may vary from period-to-period.
General and Administrative.
General and administrative expense consists primarily of personnel-related costs for our executive, finance, legal, human resources, and operations functions, and also includes outside consulting, legal and accounting services, insurance, and the change in fair market value of our outstanding Tides Foundation common stock warrant. For further information regarding this charitable donation, see “Note 8—Preferred and Common Stock Warrants” of the notes to our condensed consolidated financial statements included elsewhere in this Quarterly Report. We expect to continue to invest in corporate infrastructure and incur additional expenses associated with operating as a public company, including increased legal and accounting costs, investor relations costs, higher insurance premiums, and compliance costs, including costs to comply with the Sarbanes-Oxley Act of 2002 (the “Sarbanes-Oxley Act”), particularly since we will no longer qualify as an “emerging growth company” as of December 31, 2019. As a result,
32
we expect general and administrative expense to increase in absolute dollars in future periods, although this expense, expressed as a percentage of total revenue, may vary from period to period.
Provision for Transaction Losses.
Provision for transaction losses consists primarily of losses resulting from fraud and bad debt expense associated with our trade and client receivables balance and transaction losses associated with chargebacks. Provisions for these items represent estimates of losses based on our actual historical incurred losses and other factors. As a result, we expect provision for transaction losses to increase in absolute dollars in future periods although this expense expressed as a percentage of total revenue may vary from period to period.
Interest Expense
Interest expense consists of interest on our outstanding borrowings.
Other (Income) Expense, Net
Other (income) expense, net consists primarily of gains and losses from foreign currency exchange transactions, interest income that we earn from our deposits in money market funds and investments in marketable securities, and, prior to October 2018, expenses resulting from the revaluation of our redeemable convertible preferred stock warrant liability. Our redeemable convertible preferred stock warrant was converted to a common stock warrant exercisable for the same number of shares, and our redeemable convertible preferred stock warrant liability was reclassified to additional paid-in capital upon the completion of our initial public offering (“IPO”), which occurred in October 2018.
Income Tax Benefit (Provision)
We account for income taxes in accordance with the liability method. Under the liability method, deferred assets and liabilities are recognized based upon anticipated future tax consequences attributable to differences between financial statement carrying amounts of assets and liabilities and their respective tax bases. The provision for income taxes is comprised of the current tax liability and the change in deferred tax assets and liabilities. We establish a valuation allowance to the extent that it is more likely than not that deferred tax assets will not be recoverable against future taxable income.
Deferred tax assets and liabilities are measured using the enacted tax rates that will be in effect for the years in which those tax assets are expected to be realized or settled. We regularly assess the likelihood that deferred tax assets will be realized from recoverable income taxes or recovered from future taxable income based on the realization criteria set forth in the relevant authoritative guidance. To the extent that we believe any amounts are less likely than not to be realized, we record a valuation allowance to reduce our deferred tax assets. The realization of deferred tax assets is dependent upon future earnings, if any, the timing and amount of which are uncertain. Accordingly, the net deferred tax assets have been fully offset by a valuation allowance. If we subsequently realize deferred tax assets that were previously determined to be unrealizable, the respective valuation allowance would be reversed, resulting in an adjustment to earnings in the period such determination is made.
In addition, the calculation of tax liabilities involves dealing with uncertainties in the application of complex tax regulations. We recognize potential liabilities based on an estimate of whether, and the extent to which, additional taxes will be due. We account for uncertain tax positions in accordance with the relevant guidance, which prescribes a recognition threshold and measurement approach for uncertain tax positions taken or expected to be taken in our income tax return, and also provides guidance on recognition, classification, interest and penalties, accounting in interim periods, disclosure, and transition. The guidance utilizes a two-step approach for evaluation of uncertain tax positions. The first step is to determine if the weight of available evidence indicates a tax position is more likely than not to be sustained upon audit. The second step is to measure the tax benefit as the largest amount, which is more likely than not to be realized on ultimate settlement. A liability is reported for unrecognized tax benefits resulting from uncertain tax positions taken or expected to be taken in a tax return. Any interest and penalties related to unrecognized tax benefits are recorded as income tax expense.
33
Results of Operations
The following table sets forth our consolidated results of operations for the periods presented (in thousands):
|
|
Three Months Ended June 30,
|
Six Months Ended June 30,
|
|||||||||||||
|
|
2019
|
2018
|
2019
|
2018
|
|||||||||||
|
Revenue
|
|
|
|
|
|||||||||||
|
Marketplace
|
$
|
66,201
|
|
$
|
55,454
|
|
$
|
127,104
|
|
$
|
107,413
|
|
|||
|
Managed services
|
8,055
|
|
7,227
|
|
16,076
|
|
14,486
|
|
|||||||
|
Total revenue
|
74,256
|
|
62,681
|
|
143,180
|
|
121,899
|
|
|||||||
|
Cost of revenue
(1)
|
21,588
|
|
20,457
|
|
42,713
|
|
40,074
|
|
|||||||
|
Gross profit
|
52,668
|
|
42,224
|
|
100,467
|
|
81,825
|
|
|||||||
|
Operating expenses
|
|||||||||||||||
|
Research and development
(1)
|
15,696
|
|
12,812
|
|
31,496
|
|
26,303
|
|
|||||||
|
Sales and marketing
(1)
|
24,479
|
|
16,414
|
|
44,997
|
|
36,087
|
|
|||||||
|
General and administrative
(1)
|
14,113
|
|
11,219
|
|
29,790
|
|
22,395
|
|
|||||||
|
Provision for transaction losses
|
855
|
|
1,450
|
|
1,492
|
|
2,720
|
|
|||||||
|
Total operating expenses
|
55,143
|
|
41,895
|
|
107,775
|
|
87,505
|
|
|||||||
|
Income (loss) from operations
|
(2,475
|
)
|
329
|
|
(7,308
|
)
|
(5,680
|
)
|
|||||||
|
Interest expense
|
357
|
|
556
|
|
730
|
|
1,085
|
|
|||||||
|
Other (income) expense, net
|
(832
|
)
|
173
|
|
(1,311
|
)
|
422
|
|
|||||||
|
Loss before income taxes
|
(2,000
|
)
|
(400
|
)
|
(6,727
|
)
|
(7,187
|
)
|
|||||||
|
Income tax provision
|
(27
|
)
|
(12
|
)
|
(28
|
)
|
(9
|
)
|
|||||||
|
Net loss
|
$
|
(2,027
|
)
|
$
|
(412
|
)
|
$
|
(6,755
|
)
|
$
|
(7,196
|
)
|
|||
(1)
Includes stock-based compensation expense as follows (in thousands):
|
|
Three Months Ended June 30,
|
Six Months Ended June 30,
|
|||||||||||||
|
|
2019
|
2018
|
2019
|
2018
|
|||||||||||
|
Cost of revenue
|
$
|
73
|
|
$
|
53
|
|
$
|
217
|
|
$
|
105
|
|
|||
|
Research and development
|
1,686
|
|
538
|
|
3,066
|
|
1,088
|
|
|||||||
|
Sales and marketing
|
583
|
|
331
|
|
1,225
|
|
671
|
|
|||||||
|
General and administrative
|
289
|
|
871
|
|
2,418
|
|
1,817
|
|
|||||||
|
Total stock-based compensation
|
$
|
2,631
|
|
$
|
1,793
|
|
$
|
6,926
|
|
$
|
3,681
|
|
|||
34
Comparison of the Three and Six Months Ended June 30, 2019 and 2018
Revenue
|
(in thousands, except percentages)
|
Three Months Ended June 30,
|
Six Months Ended June 30,
|
|||||||||||||||||||||||||||
|
2019
|
2018
|
Change
|
2019
|
2018
|
Change
|
||||||||||||||||||||||||
|
Marketplace
|
$
|
66,201
|
|
$
|
55,454
|
|
$
|
10,747
|
|
19
|
%
|
$
|
127,104
|
|
$
|
107,413
|
|
$
|
19,691
|
|
18
|
%
|
|||||||
|
Percentage of total revenue
|
89
|
%
|
88
|
%
|
89
|
%
|
88
|
%
|
|||||||||||||||||||||
|
Managed services
|
$
|
8,055
|
|
$
|
7,227
|
|
828
|
|
11
|
%
|
$
|
16,076
|
|
$
|
14,486
|
|
1,590
|
|
11
|
%
|
|||||||||
|
Percentage of total revenue
|
11
|
%
|
12
|
%
|
11
|
%
|
12
|
%
|
|||||||||||||||||||||
|
Total revenue
|
$
|
74,256
|
|
$
|
62,681
|
|
$
|
11,575
|
|
18
|
%
|
$
|
143,180
|
|
$
|
121,899
|
|
$
|
21,281
|
|
17
|
%
|
|||||||
For the three months ended June 30, 2019, total revenue was $74.3 million, an increase of $11.6 million, or 18%, as compared to the same period in 2018.
Marketplace revenue represented 89% of total revenue for the three months ended June 30, 2019, an increase of $10.7 million, or 19%, compared to the same period in 2018. Marketplace revenue increased primarily due to an increase in GSV. GSV grew by 20% in the three months ended June 30, 2019, as compared to the same period in 2018, primarily driven by a 21% increase in the number of core clients as of June 30, 2019 compared to June 30, 2018. We believe these increases were primarily due to investments in sales and marketing to acquire new clients and drive brand awareness and research and development to build new product features. Freelancer service fees generated $42.9 million and $36.8 million of marketplace revenue during the three months ended June 30, 2019 and 2018, respectively. Client payment processing and administration fees generated $10.6 million and $8.7 million of marketplace revenue during the three months ended June 30, 2019 and 2018, respectively.
Managed services revenue represented 11% and 12% of total revenue for the three months ended June 30, 2019 and 2018, respectively. Managed services revenue increased $0.8 million, or 11%, for the three months ended June 30, 2019 compared to the same period in 2018, primarily due to an increase in the amount of freelancer services engaged through our managed services offering. Managed services revenue grew at a slower rate than our marketplace revenue in the three months ended June 30, 2019 compared to the same period in 2018, and we anticipate this trend to continue.
For the six months ended June 30, 2019, total revenue was $143.2 million, an increase of $21.3 million, or 17%, as compared to the same period in 2018.
Marketplace revenue represented 89% of total revenue for the six months ended June 30, 2019, an increase of $19.7 million, or 18%, compared to the same period in 2018. Marketplace revenue increased primarily due to an increase in GSV. GSV grew by 21% in the six months ended June 30, 2019, as compared to the same period in 2018, primarily driven by a 21% increase in the number of core clients as of June 30, 2019 compared to June 30, 2018. Freelancer service fees generated $84.0 million and $72.0 million of marketplace revenue during the six months ended June 30, 2019 and 2018, respectively. Client payment processing and administration fees generated $19.9 million and $16.8 million of marketplace revenue during the six months ended June 30, 2019 and 2018, respectively.
Managed services revenue represented 11% and 12% of total revenue for the six months ended June 30, 2019 and 2018, respectively. Managed services revenue increased $1.6 million, or 11%, for the six months ended June 30, 2019 compared to the same period in 2018, primarily due to an increase in the amount of freelancer services engaged through our managed services offering. Managed services revenue grew at a slower rate than our marketplace revenue in the six months ended June 30, 2019 compared to the same period in 2018, and we anticipate this trend to continue.
35
Cost of Revenue and Gross Margin
|
(in thousands, except percentages)
|
Three Months Ended June 30,
|
Six Months Ended June 30,
|
|||||||||||||||||||||||||||
|
2019
|
2018
|
Change
|
2019
|
2018
|
Change
|
||||||||||||||||||||||||
|
Cost of revenue
|
$
|
21,588
|
|
$
|
20,457
|
|
$
|
1,131
|
|
6
|
%
|
$
|
42,713
|
|
$
|
40,074
|
|
$
|
2,639
|
|
7
|
%
|
|||||||
|
Components of cost of revenue:
|
|||||||||||||||||||||||||||||
|
Cost of freelancer services to deliver managed services
|
6,635
|
|
6,056
|
|
579
|
|
10
|
%
|
13,398
|
|
12,052
|
|
1,346
|
|
11
|
%
|
|||||||||||||
|
Other components of cost of revenue
|
14,953
|
|
14,401
|
|
552
|
|
4
|
%
|
29,315
|
|
28,022
|
|
1,293
|
|
5
|
%
|
|||||||||||||
|
Total gross margin
|
71
|
%
|
67
|
%
|
70
|
%
|
67
|
%
|
|||||||||||||||||||||
For the three months ended June 30, 2019, cost of revenue increased by $1.1 million, or 6%, compared to the same period in 2018. The increase was partially due to a $0.6 million, or 10%, increase in cost of freelancer services to deliver managed services, which was driven by a corresponding increase of $0.8 million in managed services revenue for the three months ended June 30, 2019 compared to the same period in 2018. In general, the cost of freelancer services to deliver managed services is directly correlated to our managed services revenue. Other components of cost of revenue increased by $0.5 million, which included an increase of $1.6 million in payment processing fees due to an increase in client spend on our platform, partially offset by a $0.4 million reduction in third-party hosting costs due to additional expense in the first quarter of 2018 related to our migration to AWS.
For the six months ended June 30, 2019, cost of revenue increased by $2.6 million, or 7%, compared to the same period in 2018. The increase was partially due to a $1.3 million, or 11%, increase in cost of freelancer services to deliver managed services, which was driven by a corresponding increase of $1.6 million in managed services revenue for the six months ended June 30, 2019 compared to the same period in 2018. Other components of cost of revenue increased by $1.3 million, which included an increase of $2.9 million in payment processing fees due to an increase in client spend on our platform, partially offset by a $1.0 million reduction in third-party hosting costs due to additional expense in the first half of 2018 related to our migration to AWS.
Research
and Development
|
(in thousands, except percentages)
|
Three Months Ended June 30,
|
Six Months Ended June 30,
|
|||||||||||||||||||||||||||
|
2019
|
2018
|
Change
|
2019
|
2018
|
Change
|
||||||||||||||||||||||||
|
Research and development
|
$
|
15,696
|
|
$
|
12,812
|
|
$
|
2,884
|
|
23
|
%
|
$
|
31,496
|
|
$
|
26,303
|
|
$
|
5,193
|
|
20
|
%
|
|||||||
|
Percentage of total revenue
|
21
|
%
|
20
|
%
|
22
|
%
|
22
|
%
|
|||||||||||||||||||||
For the three months ended June 30, 2019, research and development expense increased by $2.9 million, or 23%, as compared to the same period in 2018. The increase was primarily due to an increase in personnel-related costs of $2.4 million and an increase of $0.6 million in amortization of licensed software, partially offset by the capitalization of $0.1 million of additional internal-use software and platform development costs during the three months ended June 30, 2019.
For the six months ended June 30, 2019, research and development expense increased by $5.2 million, or 20%, as compared to the same period in 2018. The increase was primarily due to an increase in personnel-related costs of $4.5 million, an increase of $1.1 million in amortization of licensed software, and an increase of $0.2 million in facilities-related and other costs, partially offset by the capitalization of $0.6 million of additional internal-use software and platform development costs during the six months ended June 30, 2019.
36
Sales and Marketing
|
(in thousands, except percentages)
|
Three Months Ended June 30,
|
Six Months Ended June 30,
|
|||||||||||||||||||||||||||
|
2019
|
2018
|
Change
|
2019
|
2018
|
Change
|
||||||||||||||||||||||||
|
Sales and marketing
|
$
|
24,479
|
|
$
|
16,414
|
|
$
|
8,065
|
|
49
|
%
|
$
|
44,997
|
|
$
|
36,087
|
|
$
|
8,910
|
|
25
|
%
|
|||||||
|
Percentage of total revenue
|
33
|
%
|
26
|
%
|
31
|
%
|
30
|
%
|
|||||||||||||||||||||
For the three months ended June 30, 2019, sales and marketing expense increased by $8.1 million, or 49%, as compared to the same period in 2018. This increase was primarily due to period over period increases of $6.3 million in marketing and advertising costs due to our national TV and radio ad campaign in the second quarter of 2019, $1.1 million in personnel-related costs to build out our enterprise sales team, including sales commissions that we expense as incurred, and $0.7 million of software costs, facilities-related and other costs resulting from ongoing business growth.
For the six months ended June 30, 2019, sales and marketing expense increased by $8.9 million, or 25%, as compared to the same period in 2018. This increase was primarily due to period over period increases of $5.7 million in marketing and advertising costs due to our national TV and radio ad campaign in the second quarter of 2019, $1.9 million in personnel-related costs to build out our enterprise sales team, including sales commissions that we expense as incurred, and $1.3 million of software costs, facilities-related and other costs resulting from ongoing business growth.
General and Administrative
|
(in thousands, except percentages)
|
Three Months Ended June 30,
|
Six Months Ended June 30,
|
|||||||||||||||||||||||||||
|
2019
|
2018
|
Change
|
2019
|
2018
|
Change
|
||||||||||||||||||||||||
|
General and administrative
|
$
|
14,113
|
|
$
|
11,219
|
|
$
|
2,894
|
|
26
|
%
|
$
|
29,790
|
|
$
|
22,395
|
|
$
|
7,395
|
|
33
|
%
|
|||||||
|
Percentage of total revenue
|
19
|
%
|
18
|
%
|
21
|
%
|
18
|
%
|
|||||||||||||||||||||
For the three months ended June 30, 2019, general and administrative expense increased by $2.9 million, or 26%, as compared to the same period in 2018. This increase was primarily due to increases of $1.1 million in personnel-related costs, which included adding additional personnel primarily within our finance and accounting organization to support our being a public company and our expectation that we will be deemed a “large accelerated filer” and therefore no longer qualify as an “emerging growth company” as of December 31, 2019, $0.8 million related to increased rent, insurance, and other costs associated with our new office leases, $0.6 million in legal services and other professional expenses, $0.3 million in indirect taxes, and $0.1 million related to the revaluation of the shares that are expected to vest and become exercisable under our Tides Foundation common stock warrant.
For the six months ended June 30, 2019, general and administrative expense increased by $7.4 million, or 33%, as compared to the same period in 2018. This increase was primarily due to increases of $3.7 million in personnel-related costs, which included adding additional personnel primarily within our finance and accounting organization to support our being a public company, $1.3 million related to increased rent, insurance, and other costs associated with our new office leases, $1.3 million in legal services and other professional expenses, $0.7 million in indirect taxes, and $0.4 million related to the revaluation of the shares that are expected to vest and become exercisable under our Tides Foundation common stock warrant.
37
Provision
for Transaction Losses
|
(in thousands, except percentages)
|
Three Months Ended June 30,
|
Six Months Ended June 30,
|
|||||||||||||||||||||||||||
|
2019
|
2018
|
Change
|
2019
|
2018
|
Change
|
||||||||||||||||||||||||
|
Provision for transaction losses
|
$
|
855
|
|
$
|
1,450
|
|
$
|
(595
|
)
|
(41
|
)%
|
$
|
1,492
|
|
$
|
2,720
|
|
$
|
(1,228
|
)
|
(45
|
)%
|
|||||||
|
Percentage of total revenue
|
1
|
%
|
2
|
%
|
1
|
%
|
2
|
%
|
|||||||||||||||||||||
For the three months ended June 30, 2019, provision for transaction losses decreased by $0.6 million, or 41%, as compared to the same period in 2018. For the six months ended June 30, 2019, provision for transaction losses decreased by $1.2 million, or 45%, as compared to the same period in 2018. These decreases were mainly due to improved payment collection processes and reducing fraudulent activity on our platform.
Interest
Expense and Other (Income) Expense, Net
|
(in thousands, except percentages)
|
Three Months Ended June 30,
|
Six Months Ended June 30,
|
|||||||||||||||||||||||||||
|
2019
|
2018
|
Change
|
2019
|
2018
|
Change
|
||||||||||||||||||||||||
|
Interest expense
|
$
|
357
|
|
$
|
556
|
|
$
|
(199
|
)
|
(36
|
)%
|
$
|
730
|
|
$
|
1,085
|
|
$
|
(355
|
)
|
(33
|
)%
|
|||||||
|
Other (income) expense, net
|
(832
|
)
|
173
|
|
(1,005
|
)
|
(581
|
)%
|
(1,311
|
)
|
422
|
|
(1,733
|
)
|
(411
|
)%
|
|||||||||||||
For the three and six months ended June 30, 2019, interest expense decreased by $0.2 million and $0.4 million, respectively, as compared to the same periods in 2018. This resulted from a reduction in the interest rate on our Second Term Loan referred to below under “—Term and Revolving Loans,” which was the prime rate plus 5.25% per annum for most of 2018 and was reduced to the prime rate plus 0.25% per annum in October 2018 as a result of our IPO, resulting in a corresponding reduction in interest expense.
For the three and six months ended June 30, 2019, other income, net was $0.8 million and $1.3 million, respectively, as compared to other expense, net of $0.2 million and $0.4 million, for the same periods in 2018, respectively. During the three and six months ended June 30, 2019, we received interest income from our cash equivalents and marketable securities of $0.7 million and $1.4 million, respectively. Additionally, for the three and six months ended June 30, 2018, we incurred expense of $0.1 million and $0.4 million, respectively, related to the mark-to-market revaluation of our redeemable convertible preferred stock warrant liability. Our redeemable convertible preferred stock warrant converted to a common stock warrant exercisable for the same number of shares, and our redeemable convertible preferred stock warrant liability was reclassified to additional paid-in capital upon completion of our IPO. Accordingly, we did not incur this expense in the three and six months ended June 30, 2019, nor will this expense recur in future periods.
Liquidity and Capital Resources
Prior to our IPO, we financed our operations and capital expenditures primarily through sales of convertible preferred stock, bank borrowings, and utilization of cash generated from operations in the periods in which we generated cash flows from operations. In October 2018, we completed our IPO, from which we received aggregate net proceeds of $109.4 million after deducting underwriting discounts and commissions but before deducting offering expenses payable by us. At the end of 2018, we invested a portion of the net proceeds from our IPO in
money market funds with maturities of 90 days or less from the date of purchase.
As of June 30, 2019 and December 31, 2018, we had $67.1 million and $129.1 million in cash and cash equivalents, respectively.
In the first half of 2019, we purchased various short-term, marketable securities consisting of commercial paper, treasury bills, and U.S. government securities, all of which have contractual maturities within twelve months from the date of purchase and are classified as available-for-sale marketable securities within our condensed consolidated balance sheet. As of June 30, 2019, we had $62.4 million in marketable securities.
We believe our existing cash and cash equivalents, marketable securities, cash flow from operations (in periods in which we generate cash flow from operations), and amounts available for borrowing under the Loan Agreement referred to below under “—Term and Revolving Loans” will be sufficient to meet our working capital requirements for at least the next twelve months. To the extent existing cash and cash equivalents, cash from marketable securities, cash from
38
operations, and amounts available for borrowing under the Loan Agreement are insufficient to fund our working capital requirements, or should we require additional cash for other purposes, we will need to raise additional funds. In the future, we may attempt to raise additional capital through the sale of equity securities or through equity-linked or debt financing arrangements. If we raise additional funds by issuing equity or equity-linked securities, the ownership and economic interests of our existing stockholders will be diluted. If we raise additional financing by the incurrence of additional indebtedness, we will be subject to additional debt service requirements and could also be subject to additional restrictive covenants, such as limitations on our ability to incur additional debt, and other operating restrictions that could adversely impact our ability to conduct our business. Any future indebtedness we incur may result in terms that could also be unfavorable to our equity investors. There can be no assurances that we will be able to raise additional capital on terms we deem acceptable, or at all. The inability to raise additional capital as and when required would have an adverse effect, which could be material, on our results of operations, financial condition and ability to achieve our business objectives.
Escrow Funding Requirements
We offer escrow services to users of our platform. As such, we are licensed as an internet escrow agent and are therefore required to hold our users’ escrowed cash and in-transit cash in trust as an asset and record a corresponding liability for escrow funds held on behalf of freelancers and clients on our balance sheet. Escrow regulations require us to fund the trust with our operating cash to cover shortages due to the timing of cash receipts from clients for completed hourly billings. Freelancers submit their billings for hourly contracts to their clients on a weekly basis every Sunday and the aggregate amount of such billings is added to escrow funds payable to freelancers on the same day. As of Sunday each week, we have not yet collected funds for hourly billings from clients as these funds are in transit. Therefore, in order to satisfy escrow funding requirements, every Sunday we fund the shortage of cash in trust with our own operating cash and typically collect this cash shortage from clients within the next several days. As a result, we expect our total cash and cash flows from operating activities to be impacted when a quarter ends on a Sunday, as occurred on June 30, 2019. As of June 30, 2019 and December 31, 2018, funds held in escrow, including funds in transit, were $118.3 million and $98.2 million, respectively. To the extent we have not yet collected funds for hourly billings from clients which are in-transit due to timing differences in receipt of cash from clients and payments of cash to freelancers, we may, from time to time, utilize the revolving line of credit under our Loan Agreement to satisfy escrow funding requirements. To fund the shortage of cash in trust that occurred on June 30, 2019, we drew down $25.0 million pursuant to the revolving line of credit under the Loan Agreement in June 2019, which we repaid in July 2019.
Term and Revolving Loans
In 2017, we entered into a loan and security agreement, which was subsequently amended in November 2017, September 2018, and March 2019 (the “Loan Agreement”). The aggregate amount of the facility was up to $49.0 million, consisting of a term loan in the original principal amount of $15.0 million (the “First Term Loan”), a term loan in the original principal amount of $9.0 million (the “Second Term Loan” and, together with the First Term Loan, the “Term Loans”), and a revolving line of credit, which permits borrowings of up to $25.0 million subject to customary conditions. Among other things, we may only borrow funds under the revolving line of credit if, after giving effect thereto, our total borrowings under the line of credit do not exceed a specified percentage of eligible trade and client accounts receivable. The First Term Loan, Second Term Loan, and revolving line of credit mature in March 2022, September 2022, and September 2020, respectively. All borrowings under the Loan Agreement bear interest at floating rates, and, therefore, our borrowing costs are affected by changes in market interest rates.
Specifically, the First Term Loan bears interest at the prime rate plus 0.25% per annum and has a repayment term of 18 months of interest-only payments that ended in March 2019, followed by equal monthly installments of principal plus interest until the maturity in March 2022. Accordingly, we commenced repayment of the First Term Loan in April 2019 and repaid $1.3 million of principal during the three months ended June 30, 2019.
In September 2018, we entered into the second amendment (the “Second Amendment”) to the Loan Agreement, which, among other changes, provided for a reduction in the interest rate for the Second Term Loan, from the prime rate plus 5.25% per annum to the prime rate plus 0.25% per annum, from and after the occurrence of an initial public offering by us with net proceeds of more than $50.0 million. This reduction became effective following the completion of our IPO in October 2018. See “Note 6—Debt” in the notes to our condensed consolidated financial statements included elsewhere in this Quarterly Report for further information regarding the Second Amendment. The Second Term Loan has a repayment term of 17 months of interest-only payments that ended in March 2019, followed by equal monthly
39
installments of principal plus interest until the maturity in September 2022. Accordingly, we commenced repayment of the Second Term Loan in April 2019 and repaid $0.6 million of principal during the three months ended June 30, 2019.
The revolving line of credit bears interest at the prime rate with accrued interest due monthly. As described above under “—Escrow Funding Requirements,” to the extent we have not yet collected funds for hourly billings from clients that are in-transit due to timing differences in receipt of cash from clients, we may utilize the revolving line of credit to satisfy escrow funding requirements. In June 2019, we drew down $25.0 million under the revolving line of credit for such purpose, which we subsequently repaid in July 2019. For further information, see “Note 6—Debt” and “Note 14—Subsequent Events” in the notes to our condensed consolidated financial statements included elsewhere in this Quarterly Report.
Our obligations under the Loan Agreement are secured by first priority liens on substantially all of our assets excluding our intellectual property (but including proceeds therefrom) and the funds and assets held by our subsidiary Upwork Escrow Inc. (“Upwork Escrow”). The Loan Agreement prohibits us from pledging our intellectual property. The Loan Agreement also includes a restriction on dividend payments, other than dividends payable solely in common stock. The Loan Agreement contains affirmative covenants, including a covenant requiring that we maintain an adjusted quick ratio, and also contains certain non-financial covenants.
In March 2019, we entered into the third amendment to the Loan Agreement, which, among other changes, (i) amended the adjusted quick ratio financial covenant to provide that we will maintain an adjusted quick ratio of 1.75 to 1.00 (previously 1.30 to 1.00), (ii) reduced the frequency with which we are required to provide certain financial information to the lender during periods in which we maintain an adjusted quick ratio of 2.50 to 1.00, and (iii) eliminated the minimum EBITDA covenant with which we were required to comply. We were in compliance with our covenants under the Loan Agreement as of June 30, 2019 and December 31, 2018.
As of June 30, 2019, we had $22.1 million outstanding pursuant to the Term Loans and $25.0 million outstanding under the revolving line of credit. As of December 31, 2018, we had $24.0 million outstanding pursuant to the Term Loans and no borrowings outstanding under the revolving line of credit
.
Cash Flows
The following table summarizes our cash flows for the periods presented (in thousands):
|
|
Six Months Ended June 30,
|
||||||
|
|
2019
|
2018
|
|||||
|
Net cash provided by (used in) operating activities
|
$
|
(27,826
|
)
|
$
|
10,403
|
|
|
|
Net cash used in investing activities
|
(71,234
|
)
|
(3,342
|
)
|
|||
|
Net cash provided by financing activities
|
37,024
|
|
2,675
|
|
|||
|
Net increase (decrease) in cash and cash equivalents
|
$
|
(62,036
|
)
|
$
|
9,736
|
|
|
Operating Activities
Our largest source of operating cash is revenue generated from our platform. Our primary uses of cash from operating activities are for personnel-related expenditures, marketing activities, including advertising, payment processing fees, amounts paid to freelancers to deliver services for clients under our managed services offering, and third-party hosting costs. In addition, because we are licensed as an internet escrow agent, our total cash and cash provided by (used in) operating activities may be impacted by the timing of the end of our fiscal quarter as discussed in the section titled “—Liquidity and Capital Resources—Escrow Funding Requirements.”
For the six months ended June 30, 2019, net cash used in operating activities was $27.8 million, which resulted primarily from a net loss of $6.8 million and net cash outflows of $31.6 million from changes in operating assets and liabilities, partially offset by non-cash charges of $10.6 million. The end of the second quarter of 2019 fell on a Sunday, which directly impacted our trade and client receivables balance as of June 30, 2019. The change in operating assets and liabilities primarily resulted from the increase in trade and client receivables of $30.3 million. Due to fluctuations in revenue and the number of transactions on our platform, coupled with fluctuations of the timing of cash receipts from clients, our trade and client receivables will likely continue to fluctuate in the future.
40
Net cash provided by operating activities during the six months ended June 30, 2018 was $10.4 million, which resulted from non-cash charges of $2.3 million for depreciation and amortization, $3.7 million for stock-based compensation, $2.7 million for provision for transaction losses, $0.4 million related to the change in fair value of our redeemable preferred stock warrant liability, and net cash inflows of $8.5 million from changes in operating assets and liabilities, partially offset by a net loss of $7.2 million. The net cash inflows from changes in operating assets and liabilities were primarily the result of increases of $17.3 million in other liabilities and $0.3 million in accounts payable, partially offset by an increase of $0.6 million in prepaid expenses and other assets and an increase of $8.6 million in trade and client receivables reflecting that the last day of the quarter was a Saturday compared to a Sunday on December 31, 2017. On Sunday, December 31, 2017, trade and client receivables included the full week of marketplace accounts receivable for the last week of December 2017. On Saturday, June 30, 2018, unbilled revenue reflected six days of the last week of June 2018. In addition, client spend in the last week of June was approximately 40% higher than the last week of December 2017, which magnified the scale of the timing effect.
Investing Activities
For the six months ended June 30, 2019, net cash used in investing activities was $71.2 million, which was primarily a result of investing $86.6 million in various marketable securities during the first half of 2019, as well as $2.2 million of internal-use software and platform development costs that we paid during the period and purchases of property and equipment of $7.4 million primarily for leasehold improvements and furniture related to our new office leases in Santa Clara, California and Chicago, Illinois. These uses of cash were partially offset by sales of marketable securities of $24.8 million, as well as a net change in restricted cash of $0.2 million primarily due to cash that was restricted at December 31, 2018 but was released in the first quarter of 2019.
Net cash used in investing activities during the six months ended June 30, 2018 was $3.3 million, which resulted from capitalized internal-use software and platform development costs of $1.9 million, purchases of property and equipment of $1.3 million for leasehold improvements and furniture, and an increase of $0.1 million in restricted cash related to cash reserve requirements under California escrow laws and regulations based on the transaction volume.
Financing Activities
For the six months ended June 30, 2019, net cash provided by financing activities was $37.0 million, which resulted primarily from the $25.0 million we elected to draw from our revolving line of credit to satisfy our escrow funding requirements as of June 30, 2019, as well as cash received from stock option exercises of $10.3 million and proceeds from our employee stock purchase program of $3.6 million, partially offset by total principal repayments on the Term Loans of $1.9 million.
Net cash provided by financing activities during the six months ended June 30, 2018 was $2.7 million primarily due to proceeds of $4.3 million from the exercise of stock options, partially offset by $1.6 million in deferred offering costs paid for our IPO.
41
Obligations and Other Commitments
Our principal commitments consist of obligations under our non-cancellable operating leases for office space and the Loan Agreement. The following table summarizes our contractual obligations as of June 30, 2019 (in thousands):
|
Total
|
Less than
1 Year
|
1 - 3
Years
|
3 - 5
Years
|
More Than
5 Years
|
|||||||||||||||
|
Leases
(1)
|
$
|
40,549
|
|
$
|
4,346
|
|
$
|
12,953
|
|
$
|
13,553
|
|
$
|
9,697
|
|
||||
|
Debt principal
|
47,107
|
|
32,571
|
|
13,893
|
|
643
|
|
—
|
|
|||||||||
|
Total contractual obligations
|
$
|
87,656
|
|
$
|
36,917
|
|
$
|
26,846
|
|
$
|
14,196
|
|
$
|
9,697
|
|
||||
|
(1)
|
Represents minimum operating lease payments under operating leases for office facilities, excluding potential lease renewals, net of tenant improvement allowances.
|
In the ordinary course of business, we enter into contracts and agreements that contain a variety of representations and warranties and provide for indemnification. In addition, we have entered into indemnification agreements with our directors and executive officers and certain key employees that require us, among other things, to indemnify them against certain liabilities that may arise by reason of their status or service as our directors, executive officers, or employees. The terms of such obligations may vary. To date, we have not paid any material claims or been required to defend any actions related to our indemnification obligations.
As of June 30, 2019 and December 31, 2018, we had accrued liabilities related to uncertain non-income tax positions based on management’s best estimate of its liability, which are reflected on our condensed consolidated balance sheets. We could be subject to examination in various jurisdictions related to income and non-income tax matters. The resolution of these types of matters, giving recognition to the recorded reserve, could have an adverse impact on our business.
Off-Balance Sheet Arrangements
As of June 30, 2019, we did not have any relationships with other entities or financial partnerships such as entities often referred to as structured finance or special purpose entities that have been established for the purpose of facilitating off-balance sheet arrangements or other contractually narrow or limited purposes.
Critical Accounting Policies and Estimates
Our condensed consolidated financial statements are prepared in accordance with U.S. GAAP. The preparation of the condensed consolidated financial statements requires us to make estimates and assumptions that affect the reported amounts of assets, liabilities, revenue, expenses, and related disclosures. We evaluate our estimates and assumptions on an ongoing basis using historical experience and other factors and adjust those estimates and assumptions when facts and circumstances dictate. Actual results could materially differ from these estimates and assumptions.
An accounting policy is deemed to be critical if it requires an accounting estimate to be made based on assumptions about matters that are highly uncertain at the time the estimate is made, if different estimates reasonably could have been used, or if changes in the estimate that are reasonably possible could materially impact the financial statements. We believe estimates and assumptions associated with the evaluation of revenue recognition criteria, including the determination of revenue reporting as gross versus net in our revenue arrangements, internal-use software and platform development costs, fair values of stock-based awards, and income taxes have the greatest potential impact on our condensed consolidated financial statements. Therefore, we consider these to be our critical accounting policies and estimates.
Except as otherwise disclosed in “Note 2—Basis of Presentation and Summary of Significant Accounting Policies” of the notes to our condensed consolidated financial statements included elsewhere in this Quarterly Report, there have been no material changes to our critical accounting policies and estimates as compared to the critical accounting policies and estimates described in our Annual Report on Form 10-K for the year ended December 31, 2018 (our “Annual Report”).
Recent Accounting Pronouncements
See “Note 2—Basis of Presentation and Summary of Significant Accounting Policies” of the notes to our condensed consolidated financial statements included elsewhere in this Quarterly Report for recently issued accounting pronouncements not yet adopted as of the date of this report.
42
Item 3. Quantitative and Qualitative Disclosures about Market Risk.
We have operations both within the United States and internationally, and we are exposed to market risks in the ordinary course of our business. These risks primarily include interest rate and foreign currency exchange rates.
Interest Rate Risk
The primary objective of our investment activities is to preserve principal while maximizing income without significantly increasing risk. We do not make investments for trading or speculative purposes. Because our cash and cash equivalents have a relatively short maturity, our portfolio’s fair value is relatively insensitive to interest rate changes. Borrowings under our Loan Agreement have variable interest rates. We had $47.1 million and $24.0 million aggregate principal amount of borrowings outstanding under our Loan Agreement as of June 30, 2019 and December 31, 2018, respectively. We do not believe that a hypothetical increase or decrease in interest rates of 100 basis points would have a material impact on our operating results or financial condition.
Foreign Currency Risk
Our operating results and cash flows are subject to fluctuations due to changes in foreign currency exchange rates. In addition to the U.S. dollar, we offer clients the option to settle the invoices denominated in the U.S. dollar in Euros, the British Pound, the Australian dollar, or the Canadian dollar. When clients make payments in one of these currencies, we are exposed to foreign currency risk during the period between when payment is made and when the payment amounts settle. To mitigate this risk, we have entered into forward contracts. As such, the impact of foreign currency exchange rate fluctuations to our operating results have been insignificant to date.
Item 4. Controls and Procedures.
Evaluation of Disclosure Controls and Procedures
Our management, with the participation of our Chief Executive Officer and Chief Financial Officer, evaluated the effectiveness of our disclosure controls and procedures as defined in Rules 13a-15(e) and 15d-15(e) under the Securities Exchange Act of 1934, as amended (the “Exchange Act”), as of June 30, 2019. Our disclosure controls and procedures are designed to ensure that information we are required to disclose in the reports we file or submit under the Exchange Act is accumulated and communicated to our management, including our Chief Executive Officer and Chief Financial Officer, as appropriate to allow timely decisions regarding required disclosures, and is recorded, processed, summarized, and reported within the time periods specified in the rules and forms of the Securities and Exchange Commission (the “SEC”). Because of the material weakness in our internal control over financial reporting previously disclosed in our Annual Report, our Chief Executive Officer and Chief Financial Officer concluded that, as of June 30, 2019, our disclosure controls and procedures were not effective.
In light of this fact, our management, including our Chief Executive Officer and Chief Financial Officer, has performed additional analyses, reconciliations, and other post-closing procedures and has concluded that, notwithstanding the material weakness in our internal control over financial reporting, the condensed consolidated financial statements for the periods covered by and included in this Quarterly Report fairly present, in all material respects, our financial position, results of operations, our changes in stockholders’ equity and cash flows for the periods presented in conformity with U.S. GAAP.
Previously Reported Material Weakness
As disclosed in the section titled “Risk Factors” in Part II, Item 1A of this Quarterly Report, we previously identified a material weakness in our internal control over financial reporting related to the identification of a number of adjustments to our consolidated financial statements that resulted in a revision to previously issued financial statements. We identified the cause of these adjustments was due to growth in the business, which required additional qualified accounting personnel with an appropriate level of experience, and additional controls in the period-end financial reporting process commensurate with the complexity of the business. Accordingly, we have determined that this control deficiency constituted a material weakness in our internal control over financial reporting. A material weakness is a deficiency or combination of deficiencies in our internal control over financial reporting such that there is a reasonable possibility that a material misstatement of our consolidated financial statements would not be prevented or detected on a timely basis. This deficiency could result in additional misstatements to our consolidated financial statements that would be material and would not be prevented or detected on a timely basis.
43
Remediation Plans
We have implemented measures to remediate the identified material weakness. Those remediation measures are ongoing and include the hiring of additional accounting and finance employees with a requisite level of experience and the implementation of additional control activities related to the period-end financial reporting process.
While we believe that these efforts will improve our internal control over financial reporting, the implementation of our remediation is ongoing and will require validation and testing of the design and operating effectiveness of internal controls over a sustained period of financial reporting cycles.
We believe we are making progress toward achieving the effectiveness of our internal controls and disclosure controls. The actions that we are taking are subject to ongoing senior management review, as well as audit committee oversight. We will not be able to conclude whether the steps we are taking will fully remediate the material weakness in our internal control over financial reporting until we have completed our remediation efforts and subsequent evaluation of their effectiveness. We may also conclude that additional measures may be required to remediate the material weakness in our internal control over financial reporting, which may necessitate additional evaluation and implementation time. We will continue to assess the effectiveness of our internal control over financial reporting and take steps to remediate the known material weakness.
Changes in Internal Control over Financial Reporting
Except as disclosed above with respect to our remediation measures, there were no changes to our internal control over financial reporting that occurred during the quarter ended June 30, 2019 that have materially affected, or are reasonably likely to materially affect, our internal control over financial reporting.
44
PART II—OTHER INFORMATION
Item 1. Legal Proceedings.
We are not a party to any material pending legal proceedings. From time to time, we may be subject to legal proceedings and claims arising in the ordinary course of business.
Item 1A. Risk Factors.
A
description of the risks and uncertainties associated with our business is set forth below. You should carefully consider the risks and uncertainties described below, as well as the other information in this Quarterly Report, including our condensed consolidated financial statements and the related notes and “Management’s Discussion and Analysis of Financial Condition and Results of Operations.” The occurrence of any of the events or developments described below, or of additional risks and uncertainties not presently known to us or that we currently deem immaterial, could materially and adversely affect our business, results of operations, financial condition and growth prospects. In such an event, the market price of our common stock could decline and you could lose all or part of your investment.
Risks Related to our Business and Industry
Our growth depends on our ability to attract and retain a community of freelancers and clients, and the loss of our users, or failure to attract new users, could adversely impact our business.
The size of our community of users, including both freelancers and clients, is critical to our success. Our ability to achieve significant growth in revenue in the future will depend, in large part, upon our ability to attract new users to, and retain existing users on, our platform. Achieving growth in, and retention of, our community of users may require us to increasingly engage in sophisticated, costly, and lengthy sales and marketing efforts that may not result in additional users or effectively retain our current users. We may also need to modify our pricing model or other services and features to attract and retain such users. If we fail to attract new users or fail to maintain or expand existing relationships in a cost-effective manner, our revenue will grow more slowly than expected or may decline and our business could be adversely impacted.
Freelancers have many different ways of marketing their services, securing clients, and obtaining payments from clients, including meeting and contacting prospective clients through other services, advertising to prospective clients online or offline through other methods, signing up for online or offline third-party agencies, using other online or offline platforms, signing up with staffing firms, using other payment services, or finding full-time or part-time employment through an agency or directly with a business. If we fail to attract new freelancers, freelancers decrease their use of or cease using our platform, the quality or types of services provided by freelancers that use our platform are not satisfactory to clients, or freelancers increase their fees for services more than clients are willing to pay, clients may decrease their use of, or cease using, our platform and our revenue may be adversely impacted.
Clients have similarly diverse options to find and pay service providers, such as engaging and paying service providers directly, finding service providers through other online or offline platforms or through staffing firms and agencies, using other payment services, or hiring temporary, full-time, or part-time employees directly or through an agency. For the six months ended June 30, 2019 and the years ended December 31, 2018 and 2017, we generated significant revenue from one client, which accounted for more than 10% of revenue for each such period and, therefore, a decrease in revenue from this client could have an adverse effect on our operating results. Moreover, any decrease in the attractiveness of our platform or failure to retain clients could lead to decreased traffic on our platform, diminished network effects, or result in a drop in GSV on our platform, which could adversely affect our business, revenue, financial condition, and operating results. We expect our GSV to fluctuate between periods due to a number of factors, including the volume and characteristics of projects that are posted by clients on our platform, such as size, duration, pricing, and other factors.
Users can generally decide to cease using our platform at any time. Users may stop using our platform and related services if the quality of the user experience on our platform, including our support capabilities in the event of a problem, does not meet their expectations or keep pace with the quality of the user experience generally offered by competitive products and services. Users may also choose to cease using our platform if they perceive that our pricing model, including associated fees, is not in line with the value they derive from our platform or for other reasons. In addition, expenditures by clients may be cyclical and may reflect overall economic conditions or budgeting patterns.
45
If users stop using our platform and services for any reason, including the foregoing reasons, our revenue and business would be adversely affected.
We have a history of net losses, anticipate increasing our operating expenses in the future, and may not achieve or sustain profitability.
We have a history of incurring net losses, and we expect to incur net losses for the foreseeable future. For the six months ended June 30, 2019 and the years ended December 31, 2018 and 2017, we incurred net losses of $6.8 million, $19.9 million, and $4.1 million, respectively. As of June 30, 2019, we had an accumulated deficit of $150.3 million. We expect to make significant future expenditures related to the development and expansion of our business, including enhancing our Upwork Enterprise and Upwork Business offerings and our U.S.-to-U.S. domestic offering, broadening and deepening the categories on our platform, expanding our sales force, investing in marketing programs such as brand promotion efforts and marketing activities, enhancing our mobile product offering, expanding domestic-to-domestic offerings into new geographies, and in connection with legal, accounting, and other administrative expenses related to operating as a public company. These efforts may prove more expensive than we currently anticipate, and we may not succeed in increasing our revenue sufficiently, or at all, to offset these higher expenses. While our revenue has grown in recent years, if our revenue declines or fails to grow at a rate faster than increases in our operating expenses, we will not be able to achieve and maintain profitability in future periods. As a result, we may continue to generate losses. We cannot ensure that we will achieve profitability in the future or that, if we do become profitable, we will be able to sustain profitability.
We have a limited operating history under our current platform and pricing model, which makes it difficult to evaluate our business and prospects and increases the risks associated with your investment.
We operated the Elance and oDesk platforms separately until we relaunched as “Upwork” in May 2015 and consolidated those platforms into a single platform. In recent years, we have also expanded our Upwork Enterprise offering and recently launched our Upwork Business offering, which help enterprises and other larger businesses connect with freelancers and provide these larger clients with additional products and services. We also made significant changes to our pricing model in 2016. As a result, our platform and pricing model have not been fully proven, and we have only a limited operating history with our current platform and pricing model to evaluate our business and future prospects, which subjects us to a number of uncertainties, including our ability to plan for and model future growth. Our historical revenue growth should not be considered indicative of our future performance. We have encountered, and will continue to encounter, risks, difficulties, and uncertainties frequently experienced by growing companies in rapidly changing industries, including our ability to achieve market acceptance of our platform and attract and retain users, as well as increasing competition and increasing expenses as we continue to grow our business. We cannot ensure that we will be successful in addressing these and other challenges we may face in the future, and our business may be adversely affected if we do not manage these challenges successfully. In addition, we may not achieve sufficient revenue to achieve or maintain positive cash flow from operations or profitability in any given period, or at all.
If the market for freelancers and the services they offer develops more slowly than we expect, our growth may slow or stall, and our operating results could be adversely affected.
The market for online freelancers and the services they offer is relatively new, rapidly evolving, and unproven. Our future success will depend in large part on the continued growth and expansion of this market and the willingness of businesses to engage freelancers to provide services. It is difficult to predict the size, growth rate, and expansion of this market, the entry of products and services that are competitive to ours, the success of existing competitive products and services, or technological, macroeconomic, or other developments that will impact the overall demand for freelancer services. Furthermore, many businesses may be unwilling to engage freelancers for a variety of reasons, including perceived negative connotations with outsourcing work, quality of work, or privacy or data security concerns. If the market for freelancers and the services they offer does not achieve widespread adoption, or there is a reduction in demand for freelancer services, it could result in decreased revenue and our business could be adversely affected.
46
If we are not able to develop and release new products and services, or develop and release successful enhancements, new features, and modifications to our existing products and services, our business could be adversely affected.
The market for our platform is characterized by rapid technological change, frequent new product and service introductions and enhancements, changing user demands, and evolving industry standards. The introduction of products and services embodying new technologies can quickly make existing products and services obsolete and unmarketable. We invest substantial resources in researching and developing new products and services and enhancing our platform by incorporating additional features, improving functionality, and adding other improvements to meet our users’ evolving demands in our highly competitive industry. The success of any enhancements or improvements to, or new features of, our platform or any new products and services depends on several factors, including timely completion, competitive pricing, adequate quality testing, integration with new and existing technologies on our platform and third-party partners’ technologies, and overall market acceptance. We cannot be sure that we will succeed, on a timely or cost-effective basis, in developing, marketing, and delivering enhancements or new features to our platform or any new products and services that respond to continued changes in the market for talent or business services, nor can we be sure that any enhancements or new features to our platform or any new products and services will achieve market acceptance. Because further development of our platform is complex, challenging, and dependent upon an array of factors, the timetable for the release of new products and services and enhancements to existing products and services is difficult to predict, and we may not offer new products and services as rapidly as users of our platform require or expect. Any new products or services that we develop may not be introduced in a timely or cost-effective manner, may contain errors or defects, may not be properly integrated with new and existing technologies on our platform or third-party partners’ technologies, or may not achieve the broad market acceptance necessary to generate sufficient revenue. Moreover, even if we introduce new products and services, we may experience a decline in revenue from our existing products and services that is not offset by revenue from the new products or services. In addition, we may lose existing users that choose to use competing products or services. This could result in a temporary or permanent decrease in revenue and adversely affect our business.
Our operating results may fluctuate from quarter to quarter, which makes our future results difficult to predict.
Our quarterly operating results have fluctuated in the past and may fluctuate in the future. Additionally, we have a limited operating history with our current platform and pricing model, which makes it difficult to forecast our future results. As a result, you should not rely upon our past quarterly operating results as indicators of future performance. You should take into account the risks, difficulties, and uncertainties frequently encountered by companies in rapidly evolving markets. Our operating results in any given quarter can be influenced by numerous factors, many of which are unpredictable or are outside of our control, including:
|
•
|
our ability to generate significant revenue from our Upwork Basic, Plus, Business, and Enterprise offerings, and our other premium offerings;
|
|
•
|
fluctuations in revenue from our managed services offering due to our recognition of the entire GSV as revenue, including the amounts paid to freelancers;
|
|
•
|
our ability to maintain and grow our community of users;
|
|
•
|
spending patterns of clients, including whether those clients that use our platform frequently, or for larger projects, reduce their spend, stop using our platform, or change their method of payment to us;
|
|
•
|
due to our tiered-pricing model for freelancer service fees, the mix in any period between freelancers that have billed larger amounts to clients on our platform, where we charge a lower rate on billings, and freelancers that have billed clients less on our platform, where we charge a higher rate on billings;
|
|
•
|
the demand for and types and quality of skills and services that are offered on our platform by freelancers;
|
|
•
|
the disbursement methods chosen by freelancers;
|
|
•
|
seasonal spending patterns by clients or work patterns by freelancers and seasonality in the labor market, including the number of business days or the number of Mondays (i.e., the day we customarily bill our users) in any given quarter, as well as local, national, or international holidays;
|
|
•
|
fluctuations in the prices that freelancers charge clients on our platform;
|
47
|
•
|
fluctuations in the mix of payment provider costs and the revenues generated from payment providers;
|
|
•
|
changes to our pricing model, including associated fees, and any resulting change to how we recognize revenue;
|
|
•
|
our ability to introduce new products and services and enhance existing products and services;
|
|
•
|
our ability to generate significant revenue from new products and services;
|
|
•
|
our ability to respond to competitive developments, including new and emerging competitors, pricing changes, and the introduction of new products and services by our competitors;
|
|
•
|
data security or privacy breaches and associated remediation costs and reputational harm;
|
|
•
|
the productivity and effectiveness of our sales force;
|
|
•
|
changes in the mix of products and services that our enterprise clients or other users demand;
|
|
•
|
the length and complexity of our sales cycles;
|
|
•
|
the episodic nature of freelance work generally;
|
|
•
|
the cost and time needed to develop and upgrade our platform to incorporate new technologies;
|
|
•
|
the impact of outages of our platform and associated reputational harm;
|
|
•
|
changes to financial accounting standards and the interpretation of those standards that may affect the way we recognize and report our financial results, including changes in accounting rules governing recognition of revenue;
|
|
•
|
fluctuations in transaction losses;
|
|
•
|
fluctuations in trade and client receivables due to the timing of cash receipts from clients and the number of transactions on our platform;
|
|
•
|
litigation and adverse judgments, settlements, or other litigation-related costs;
|
|
•
|
potential costs to attract, onboard, retain, and motivate qualified talent to perform services for us;
|
|
•
|
increases in, and timing of, operating expenses that we may incur to grow and expand our operations and to remain competitive, such as advertising and other marketing expenses;
|
|
•
|
costs related to the acquisition of businesses, talent, technologies, or intellectual property, including potentially significant amortization costs and possible write-downs;
|
|
•
|
changes in the common law, statutory, legislative, or regulatory environment, such as with respect to privacy, data security, wage and hour regulations, worker classification (including classification of independent contractors or similar service providers and classification of employees as exempt or non-exempt), internet regulation, payment processing, global trade, or tax requirements;
|
|
•
|
operating lease expenses and other real estate expenses that will likely increase as we grow our operations;
|
|
•
|
the impact of collecting indirect taxes on our user fees that we may introduce in new jurisdictions from time to time due to the applicability of sales, use, and other tax laws and regulations;
|
|
•
|
fluctuations in currency exchange rates;
|
|
•
|
changes in the mix of countries in which our users are located, which impacts the amount of revenue we derive from foreign exchange;
|
|
•
|
the impact of new laws and regulations (or changes in interpretation of existing laws and regulations) on the products and services offered on our platform;
|
|
•
|
non-cash accounting charges such as stock-based compensation expense and depreciation and amortization;
|
|
•
|
spending patterns of freelancers with respect to the products and services available to them on our platform;
|
48
|
•
|
losses from indemnification and similar contractual obligations we owe to clients;
|
|
•
|
expenses incurred in connection with The Upwork Foundation initiative; and
|
|
•
|
general economic and political conditions and government regulations in the countries where we currently have significant numbers of users or where we currently operate or may expand in the future.
|
The impact of one or more of the foregoing and other factors may cause our operating results to vary significantly. As such, we believe that quarter-to-quarter comparisons of our operating results may not be meaningful and should not be relied upon as an indication of future performance. If we fail to meet or exceed the expectations of investors or securities analysts, the trading price of our common stock could fall substantially, and we could face costly lawsuits, including securities class action suits.
Because we derive the substantial majority of our revenue from our marketplace offerings, with most of our marketplace revenue derived from our Upwork Basic, Plus, Business, and Enterprise offerings, our inability to generate revenue from our marketplace offerings would adversely affect our business operations, financial results, and growth prospects.
Currently, we derive and expect to continue to derive, in the near future, the substantial majority of our revenue from our marketplace offerings, with most of our marketplace revenue derived from our Upwork Basic, Plus, Business and Enterprise offerings. As such, market acceptance of our marketplace offerings is critical to our continued success. Demand for our marketplace offerings is affected by a number of factors beyond our control, including the timing of development and release of new products and services by our competitors, our ability to respond to technological change and to innovate and grow, contraction in our market, and the other risks identified herein. If we are unable to continue to meet user demands, to expand the categories of services offered on our platform, or to achieve more widespread market acceptance of our marketplace offerings, our business operations, financial results, and growth prospects could be adversely affected.
We may be subject to new and existing laws and regulations, both in the United States and internationally.
We are subject to a wide variety of foreign and domestic laws. Laws, regulations, and standards governing issues that may affect us, such as worker classification, employment, payments, worker confidentiality obligations and whistleblowing, intellectual property, consumer protection, taxation, privacy, and data security are often complex and subject to varying interpretations, in many cases due to their lack of specificity, and, as a result, their application in practice may change or develop over time through judicial decisions or as new guidance or interpretations are provided by regulatory and governing bodies, such as federal and state administrative agencies. Many of these laws were adopted prior to the advent of the internet, mobile, and related technologies and, as a result, do not contemplate or address the unique issues of the internet, mobile, and related technologies. Other laws and regulations may be adopted in response to internet, mobile, and related technologies. New and existing laws and regulations (or changes in interpretation of existing laws and regulations), including those concerning worker classification, independent contractors, employment, payments, whistleblowing and worker confidentiality obligations, intellectual property, consumer protection, taxation, privacy, data security, benefits, unionizing and collective action, arbitration agreements and class action waiver provisions, unfair competition, terms of service, website accessibility, background checks (such as the Fair Credit Reporting Act, 15 U.S.C. § 1681), escheatment, and federal contracting may also be adopted, implemented, or interpreted to apply to us and other online services marketplaces or our users. As our platform’s geographical scope expands and as we expand the categories of services offered on our platform, regulatory agencies or courts may claim that we, or our users, are subject to additional requirements, or are prohibited from conducting our business or conducting business with us in or with certain jurisdictions, either generally or with respect to certain services, or that we are otherwise required to change our business practices. It is also possible that certain provisions in agreements with our service providers or between freelancers and clients, or the fees charged on our platform, may be found to be unenforceable or not compliant with applicable law.
Recent financial, political, and other events may increase the level of regulatory scrutiny on larger companies, technology companies in general, and companies engaged in dealings with independent contractors, payments, or personal information in particular. Regulatory agencies may enact new laws or promulgate new rules or regulations that are adverse to our business or the interests of our users, or they may view matters or interpret laws and regulations differently than they have in the past or in a manner adverse to our business or the interests of our users. Such regulatory scrutiny or action may create different or conflicting obligations on us from one jurisdiction to another.
49
Our success, or perceived success, and increased visibility may also drive some businesses that view our business model to be a threat to raise concerns about our business model to local policymakers and regulators. These businesses and their trade association groups or other organizations may take actions and employ significant resources to shape the legal and regulatory regimes in countries where we have, or may seek to have, a significant number of users in an effort to change such legal and regulatory regimes in ways intended to adversely affect or impede our business and the ability of users to utilize our platform.
As we look to expand our international footprint over time, we may become obligated to comply with additional laws and regulations of the countries or markets in which we operate or have users. If we are found to be subject to new or existing laws and regulations, contractual provisions that are designed to protect and mitigate against risks, including terms of service, arbitration and class action waiver provisions, disclaimers of warranties, limitations of liabilities, releases of claims, and indemnification provisions, could be deemed unenforceable as to the application of these laws and regulations by a court, arbitrator or other decision-making body. If we are unable to comply with these laws and regulations or manage the complexity of global operations and supporting an international user base successfully or in a cost-effective manner, our business, operating results, and financial condition could be adversely affected.
We face intense competition and could lose market share to our competitors, which could adversely affect our business, operating results and financial condition.
The market for freelancers and the clients that engage them is highly competitive, rapidly evolving, fragmented, and subject to changing technology, shifting needs, and frequent introductions of new competitors as well as new products and services. We compete with a number of online and offline platforms and services domestically and internationally to attract and retain users and expand our share of user spend. Our main competitors fall into the following categories:
|
•
|
traditional contingent workforce and staffing service providers and other outsourcing providers, such as The Adecco Group, Randstad, Recruit, ManpowerGroup, and Robert Half International;
|
|
•
|
online freelancer platforms that serve either a diverse range of skill categories, such as Fiverr and Freelancer.com, or specific skill categories;
|
|
•
|
other online providers of products and services for individuals or businesses seeking work or to advertise their services, including personal and professional social networks, such as LinkedIn and GitHub (each owned by Microsoft), employment marketplaces, recruiting websites, and project-based deliverable providers;
|
|
•
|
software and business services companies focused on talent acquisition, management, invoicing, or staffing management products and services;
|
|
•
|
payment businesses, such as PayPal and Payoneer, that can facilitate payments to and from businesses and service providers;
|
|
•
|
businesses that provide specialized, professional services, including consulting, accounting, marketing, and information technology services; and
|
|
•
|
online and offline job boards, classified ads, and other traditional means of finding work and service providers, such as Craigslist, CareerBuilder, Indeed, Monster, and ZipRecruiter.
|
In addition, well-established internet companies, such as Google, LinkedIn, and Amazon, and social media platforms, such as Facebook, have entered or may decide to enter into our market segment, and some of these companies have launched products and services that directly compete with our platform. For example, in 2016, LinkedIn launched ProFinder, its service to connect LinkedIn members with one another for freelance service relationships. Many of these established internet companies and other competitors are considerably larger than we are and have considerably greater financial and other resources than we do.
Internationally, we compete against online and offline channels and products and services in most countries. Local competitors might have greater brand recognition than us in their local country and a stronger understanding of local culture and commerce. They may also offer their products and services in local languages and currencies that we do not offer. As our business grows internationally, we may increasingly compete with these international companies. We also compete against locally-sourced service providers and traditional, offline means of finding work and procuring services, such as personal and professional networks, classified ads, recruiters, and staffing businesses.
50
We also compete with companies that utilize emerging technologies, such as blockchain, artificial intelligence, augmented reality, and machine learning. Many of the companies and services that utilize these technologies in our market are still new and not yet fully mature in their capabilities or network scale. However, we may face increased competition should these companies, or new entrants, and services succeed. These competitors may offer products and services that may, among other things, provide automated alternatives to the services that freelancers provide on our platform, use machine learning algorithms to connect businesses with service providers, or otherwise change the way that businesses engage or pay service providers so as to make our platform less attractive to users.
Many of our current and potential competitors, both online and offline, enjoy substantial competitive advantages, such as greater name recognition; longer operating histories; greater financial, technical, and other resources; and, in some cases, the ability to rapidly combine online platforms with traditional staffing and contingent worker solutions. Some of our current and potential competitors may also undertake an initial public offering, which could improve their competitive position due to the enhanced brand recognition and additional working capital. These companies may use these advantages to offer products and services similar to ours at a lower price, develop different or superior products and services to compete with our platform, or respond more quickly and effectively than we do to new or changing opportunities, technologies, standards, regulatory conditions, or user preferences or requirements. In addition, while we compete intensely in more established markets, we also compete in developing technology markets that are characterized by dynamic and rapid technological change, many and different business models, and frequent disruption of incumbents by innovative online and offline entrants. The barriers to entry into these markets can be low, and businesses easily can launch online or mobile platforms and applications quickly and at nominal cost by using commercially available software or partnering with various established companies in these markets. For all of these reasons, we may not be able to compete successfully against our current and future competitors.
Moreover, current and future competitors may also make strategic acquisitions or establish cooperative relationships among themselves or with others, including our current or future third-party partners. By doing so, these competitors may increase their ability to meet the needs of our existing or prospective users. These developments could limit our ability to obtain revenue from existing and new users. If we are unable to compete successfully against current and future competitors, our business, operating results, and financial condition would be adversely impacted.
If we fail to develop, maintain, and enhance our brand and reputation cost-effectively, our business and financial condition may be adversely affected.
The Upwork brand did not exist before 2015, but we believe that developing, maintaining, and enhancing awareness and integrity of our brand and reputation in a cost-effective manner are important to achieving widespread acceptance and use of our platform and are important elements in attracting new users and retaining existing users. Successful promotion of our brand and our business model depends on, among other things, the effectiveness of our marketing efforts and brand messaging, our ability to provide a reliable, trustworthy, and useful platform at competitive prices, the perceived value of our platform, and our ability to provide quality support. In order to reach brand awareness levels of our competitors, we will need to continuously invest in marketing programs that may not be successful in achieving meaningful awareness levels. Further, brand promotion activities may not yield increased revenue, and even if they do, the increased revenue may not offset the expenses we incur in building and maintaining our brand and reputation. For example, we increased investment in offline advertising in certain markets in 2017 and throughout the United States in 2019 to increase our brand awareness, and it is not certain that these investments will have a positive impact on our brand or will be cost effective. In order to protect our brand, we also expend substantial resources to register and defend our trademarks and to prevent others from using the same or substantially similar marks. Despite these efforts, we may not always be successful in registering and preventing misappropriation of our own marks and other intellectual property or preventing registration of confusingly similar marks, and we may suffer dilution, loss of reputation, genericization, or other harm to our brand. We also rely on our community of users in a variety of ways, including their willingness to give us feedback regarding our platform, and failure of our users to provide feedback on their experience on our platform or our failure to adequately address any concerns could negatively impact the willingness of prospective users to use our platform. If we fail to promote and maintain our brand successfully or to maintain loyalty among our users, or if we incur substantial expenses in unsuccessful attempts to promote and maintain our brand, we may fail to attract new users or retain our existing users and our business and financial condition may be adversely affected.
51
There may be adverse tax, legal, and other consequences if the contractor classification or employment status of freelancers that use our platform is challenged.
Clients are generally responsible for properly classifying the freelancers they engage through our platform under the terms of our user agreement. Some clients opt to classify freelancers as employees for certain work, while many freelancers are classified as independent contractors.
We offer an optional service to our Upwork Enterprise clients, for which we help classify freelancers as employees of third-party staffing providers or independent contractors. For clients that subscribe to this service, subject to applicable law and the terms of our agreement with the client, we indemnify clients from misclassification risk and make warranties to the client (e.g., as to compliance with applicable laws). In addition, we offer a number of other premium services where we provide increased assistance to enable users to find and contract with one another. Third-party staffing providers employ freelancers classified as employees for clients, and failure of these staffing providers to comply with all legal and tax requirements could adversely affect our business. We also use our platform to find, classify, and engage freelancers to provide services for us or for our managed services offering. In general, were a court or administrative agency to determine that we or clients that use our platform have misclassified a freelancer as an independent contractor, we or our users could incur tax and other liabilities for failing to properly withhold or pay taxes on the freelancer’s compensation as well as potential wage and hour and other liabilities depending on the circumstances and jurisdiction. Although we maintain insurance policies covering liability for certain claims, we cannot be certain that our coverage will extend to or be adequate for liabilities actually incurred or that insurance will continue to be available to us on economically reasonable terms, or at all.
There is often uncertainty in the application of worker classification laws, and consequently there is risk to us and to users, both freelancers and clients, that independent contractors could be deemed to be misclassified under applicable law. The tests governing whether a service provider is an independent contractor or an employee are typically highly fact sensitive and vary by governing law. Laws and regulations that govern the status and misclassification of independent contractors are also subject to change as well as to divergent interpretations by various authorities, which can create uncertainty and unpredictability. A misclassification determination or allegation creates potential exposure for users and for us, including but not limited to reputational harm, monetary exposure arising from or relating to failure to withhold and remit taxes, unpaid wages, and wage and hour laws and requirements (such as those pertaining to minimum wage and overtime); claims for employee benefits, social security contributions, and workers’ compensation and unemployment insurance; claims of discrimination, harassment, and retaliation under civil rights laws; claims under laws pertaining to unionizing, collective bargaining, and other concerted activity; and other claims, charges, or other proceedings under laws and regulations applicable to employers and employees, including risks relating to allegations of joint employer liability. Such claims could result in monetary damages (including but not limited to wage-based damages or restitution, compensatory damages, liquidated damages, and punitive damages), interest, fines, penalties, costs, fees (including but not limited to attorneys’ fees), criminal and other liability, assessment, injunctive relief, or settlement. Such an allegation, claim, or adverse determination, including but not limited to with respect to the freelancers that provide services to us, or the requirement for us to indemnify a client, could also harm our brand and reputation, which could adversely impact our business. While these risks are mitigated, in part, by our contractual rights of indemnification against third-party claims, such indemnification agreements could be determined to be unenforceable, could be costly to enforce or ineffective, or indemnification may otherwise prove inadequate.
Users may circumvent our platform, which could adversely impact our business.
Our business depends on users transacting through our platform. Despite our efforts to prevent them from doing so, users may circumvent our platform and engage with or pay each other through other means to avoid the fees that we charge on our platform. The loss of revenue associated with circumvention of our platform could have an adverse impact on our business, cash flows, operating results, and financial condition.
Adverse or changing economic conditions may negatively impact our business.
Our business depends on the overall demand for labor and on the economic health of current and prospective clients that use our platform. Any significant weakening of the economy in the United States or Europe or of the global economy, more limited availability of credit, a reduction in business confidence and activity, decreased government spending, economic uncertainty, financial turmoil affecting the banking system or financial markets, a more limited market for
52
independent professional service providers or information technology services, and other adverse economic or market conditions may adversely impact our business and operating results. Global economic and political events or uncertainty may cause some of our current or potential clients to curtail spending on our platform, and may ultimately result in new regulatory and cost challenges to our operations. These adverse conditions could result in reductions in revenue, increased operating expenses, longer sales cycles, slower adoption of new technologies, and increased competition. There is also risk that when overall global economic conditions are positive, our business could be negatively impacted by a decreased demand for freelancers. We cannot predict the timing, strength, or duration of any economic slowdown or any subsequent recovery generally. If the conditions in the general economy significantly deviate from present levels, our business, financial condition, and operating results could be adversely affected.
Because a substantial portion of the services offered on our platform is information technology services, a decline in the market for information technology service providers could adversely affect our business.
A significant portion of the services offered by freelancers on our platform relate to information technology. If, for any reason, the market for information technology services declines, including as a result of global economic conditions, automation, increased use of artificial intelligence, or otherwise, or if the need for these services slows or businesses satisfy their needs for these services through alternative means, the growth in the number of users of our platform may slow or decline and as a result our revenue and business may be adversely impacted.
Future changes to our pricing model could adversely affect our business.
We implemented a significant change to our pricing model in 2016, which has contributed to GSV having grown at a faster rate than revenue in recent periods, and from time to time we have made and will make further changes to our pricing model due to a variety of reasons, including changes to the market for our products and services, and as competitors introduce new products and services. Changes to any components of our pricing model may, among other things, result in user dissatisfaction, lead to a loss of users on our platform, result in a change to the way we recognize revenue, or otherwise negatively impact our operating results, financial condition, and cash flows.
We face payment and fraud risks that could adversely impact our business.
Requirements on our platform relating to user authentication and fraud detection are complex. If our security measures do not succeed, our platform may be perceived as not being secure, our reputation may be harmed, and our business may be adversely impacted. In addition, bad actors around the world use increasingly sophisticated methods to engage in illegal activities involving personal information, such as unauthorized or fraudulent use of another’s identity, payment information or other information, or acquisition or use of credit or debit card details and bank account information. This could result in any of the following, each of which could adversely impact our business:
|
•
|
we may be, and we historically have been, held liable for the unauthorized use of an account holder’s credit card or bank account number and required by card issuers or banks to return the funds at issue and pay a chargeback or return fee, and if our chargeback or return rate becomes excessive, credit card networks may also require us to pay fines or other fees and the California Department of Business Oversight (the “DBO”) may require us to hold larger cash reserves;
|
|
•
|
we may be subject to additional risk and liability exposure, including for negligence, fraud, or other claims, if employees or third-party service providers, including freelancers that provide services to us, misappropriate our banking or other information or user information for their own gain or facilitate the fraudulent use of such information;
|
|
•
|
bad actors may use our platform, including our payment processing and disbursement methods, to engage in unlawful or fraudulent conduct, such as money laundering, terrorist financing, fraudulent sale of services, bribery, breaches of security, leakage of data, piracy or misuse of software and other copyrighted or trademarked content, and other misconduct;
|
|
•
|
users that are subjected or exposed to the unlawful or improper conduct of other users or other third parties, including law enforcement, may seek to hold us responsible for the conduct of users and may lose confidence in our platform, decrease or cease use of our platform, seek to obtain damages and costs, or impose fines and penalties;
|
53
|
•
|
we may be subject to additional risk if clients fail to pay freelancers for services rendered, as freelancers may seek to hold us responsible for the clients’ conduct and may lose confidence in our platform, may decrease or cease use of our platform, or seek to obtain damages and costs;
|
|
•
|
if freelancers misstate their qualifications or location, provide misinformation, perform services they are not qualified or authorized to provide, produce insufficient or defective work product, or work product with a viral or other harmful effect, clients or other third parties may seek to hold us responsible for the freelancers’ acts or omissions and may lose confidence in our platform, decrease or cease use of our platform, or seek to obtain damages and costs; and
|
|
•
|
we may suffer reputational damage as a result of the occurrence of any of the above.
|
Despite measures we have taken to detect, reduce and mitigate these risks, we do not have control over users of our platform and cannot ensure that any of our measures will stop or minimize the use of our platform for, or to further, illegal or improper purposes. We have received in the past, and may receive in the future, complaints from clients, freelancers, and other third parties concerning misuse of our platform and wrongful conduct of other users. We have also brought claims against clients and other third parties for their misuse of our platform, and may be required to bring similar claims in the future. Even if these claims do not result in litigation or are resolved in our favor, these claims, and the time and resources necessary to resolve them, could divert the attention and resources of our management and adversely affect our business and operating results.
We may be subject to escrow, payment services, and money transmitter regulations that may adversely affect our business.
Our subsidiary, Upwork Escrow, is licensed as an internet escrow agent under California’s Escrow Law and is subject to regulations applicable to internet escrow agents promulgated by the DBO. While we have received two inquiries, each prior to 2014, from regulatory authorities inquiring whether we are engaging in payment activities through Upwork Escrow or oDesk (which is now Upwork Global Inc. (“Upwork Global”)), these inquiries were resolved in our favor and did not require us to obtain a license in the applicable jurisdiction.
Although we believe that our operations comply with existing U.S. federal, state, and international laws and regulatory requirements related to escrow, money transmission, and the handling or moving of money, the laws or regulations may change, and interpretations of existing laws and regulations may also change. As a result, Upwork Escrow or Upwork Global could be required to be licensed as an escrow agent or a money transmitter (or other similar licensee) in U.S. states or other jurisdictions or may choose to obtain such a license even if not required. Such a decision could also require Upwork Escrow or Upwork Global to register as a money services business under federal laws and regulations. It is also possible that Upwork Escrow or Upwork Global could become subject to regulatory enforcement or other proceedings in those states or other jurisdictions with escrow, money transmission, or other similar statutes or regulatory requirements related to the handling or moving of money, which could in turn have a significant impact on our business, even if we were to ultimately prevail in such proceedings. Upwork Escrow or Upwork Global may also be required to become licensed as a payment institution (or obtain a similar license) under the European Payment Services Directive or other international laws and regulations. Any developments in the laws or regulations related to escrow, money transmission, or the handling or moving of money, or increased scrutiny of our business may lead to additional compliance costs and administrative overhead.
The application of laws and regulations related to escrow, money transmission, and the handling or moving of money is subject to significant complexity and uncertainty, particularly as those laws relate to new and evolving business models. If Upwork Escrow or Upwork Global is ultimately deemed to be in violation of one or more escrow or money transmitter or other similar statutes or regulatory requirements related to the handling or moving of money in any U.S. state or other jurisdiction, we may be subject to the imposition of fines or restrictions on our business, our ability to offer some or all of our services in the relevant jurisdiction may be suspended, and we may be subject to civil or criminal liability and our business, operating results, and financial condition could be adversely affected.
Having an international community of users and engaging freelancers internationally exposes us to risks that could have an adverse effect on our business, operating results, and financial condition.
Even though we currently have a limited physical presence outside of the United States, our users have a global footprint that subjects us to the risks of being found to do business internationally. We have users on our platform
54
located in over 180 countries, including some emerging markets where we have limited experience, where challenges can be significantly different from those we have faced in more developed markets, and where business practices may create greater internal control risks. Further, certain skills and services are offered by freelancers concentrated in countries with higher risks of instability and geopolitical uncertainty, like Russia and Ukraine. In addition, we engage freelancers located in many countries to provide services for our managed services offering and to us for internal projects. Because our website is generally accessible by users worldwide, one or more jurisdictions may claim that we or our users are required to comply with their laws. Laws outside of the United States regulating internet, payments, escrow, data protection, data residency, privacy, taxation, terms of service, website accessibility, consumer protection, intellectual property ownership, services intermediaries, labor and employment, wage and hour, worker classification, background checks, and recruiting and staffing companies, among others, which could be interpreted to apply to us, are often less favorable to us than those in the United States, giving greater rights to competitors, users, and other third parties. Compliance with international laws and regulations may be more costly than expected, may require us to change our business practices or restrict our service offerings, and the imposition of any such laws or regulations on us, our users, or third parties that we or our users utilize to provide or use our services, may adversely impact our revenue and business. In addition, we may be subject to multiple overlapping legal or regulatory regimes that impose conflicting requirements which could lead to additional compliance costs and enhanced legal risks.
Risks inherent in conducting business with an international user base and engaging freelancers globally include, but are not limited to:
|
•
|
being deemed to conduct business or have operations in the jurisdictions where users, including freelancers that provide services to us, are resident and being subject to their laws and regulatory requirements;
|
|
•
|
new or changed regulatory requirements;
|
|
•
|
varying worker classification standards and regulations;
|
|
•
|
the cost and burden of complying with a wide variety of laws that may be deemed to apply to us, including those relating to labor and employment matters (including but not limited to requirements with respect to works councils or similar labor organizations), consumer and data protection, privacy, network security, encryption, data residency, and taxes, as well as securing expertise in local law and related practices;
|
|
•
|
tariffs, export and import restrictions, restrictions on foreign investments, sanctions, and other trade barriers or protection measures;
|
|
•
|
costs of localizing services, including adding the ability for clients to pay in local currencies;
|
|
•
|
lack of acceptance of localized services;
|
|
•
|
difficulties in, and costs of, staffing, managing, and operating international operations or support functions;
|
|
•
|
tax issues;
|
|
•
|
weaker intellectual property protection;
|
|
•
|
economic weakness or currency related challenges or crises;
|
|
•
|
fluctuations in foreign currency exchange rates;
|
|
•
|
compliance with U.S. and foreign laws designed to combat money laundering and the financing of terrorist activities;
|
|
•
|
organizing or similar activity by local unions, works councils, or other labor organizations;
|
|
•
|
our ability to adapt to business practices and client requirements in different cultures;
|
|
•
|
corporate or state-sponsored espionage or cyberterrorism;
|
|
•
|
macroeconomic and political conditions in certain foreign jurisdictions; and
|
|
•
|
geopolitical instability and security risks, such as armed conflict and civil or military unrest, political instability, human rights concerns, and terrorist activity in countries where we have users.
|
55
The risks described above may also make it difficult for us to expand our operations internationally. Analysis of, and compliance with, global laws and regulations may substantially increase our cost of doing business. We may be unable to keep current with changes in laws and regulations as they develop. Although we have implemented policies and procedures designed to analyze whether these laws apply and, if applicable, support compliance with these laws and regulations, there can be no assurance that we will always maintain compliance or that all of our employees, contractors, partners, users, and agents will comply. Any violations could result in enforcement actions or other proceedings, fines, civil and criminal penalties, damages, interest, costs and fees (including but not limited to legal fees), injunctions, loss of intellectual property rights, or reputational harm. If we are unable to comply with these laws and regulations or manage the complexity of global operations and supporting an international user base successfully and in a cost-effective manner, our business, operating results, and financial condition could be adversely affected.
If we or our third-party partners experience a security breach, other hacking or phishing attack, or other data privacy or security incident, whether intentionally or unintentionally caused by us or by third parties, our platform may be perceived as not being secure, our reputation may be harmed, demand for our platform may be reduced, our operations may be disrupted, we may incur significant legal costs or liabilities, and our business could be adversely affected.
Our business involves the storage, processing, and transmission of users’ proprietary, confidential, and personal information as well as the use of third-party partners and vendors who store, process, and transmit users’ proprietary, confidential, and personal information. We also maintain certain other proprietary and confidential information relating to our business and personal information of our personnel. Any security breach, other hacking or phishing attack, or other data privacy or security incident, whether intentionally or unintentionally caused by us or by third parties, that we experience could result in unauthorized access to, misuse of, or unauthorized acquisition of our, our personnel’s, or our users’ data; the loss, corruption, or alteration of this data; interruptions in our operations; or damage to our computers or systems or those of our users. Any of these could expose us to claims, litigation, fines, other potential liability, and reputational harm. An increasing number of online services have disclosed breaches of their security, some of which have involved sophisticated and highly targeted attacks on portions of their services. Because the techniques used to obtain unauthorized access, disable or degrade service, or sabotage systems change frequently and often are not foreseeable or recognized until launched against a target, we and our third-party partners may be unable to anticipate these techniques or to implement adequate preventative measures. If an actual or perceived breach of our or our third-party partners’ security or privacy or other data privacy or security incident occurs, public perception of the effectiveness of our security measures and brand could be harmed, and we could lose users and business. Data security breaches and other data privacy and security incidents may also result from non-technical means, for example, actions taken by employees or contractors, such as freelancers that we engage on our platform to perform services for us. Any compromise of our or our third-party partners’ security could result in a violation of applicable privacy and other laws, regulatory or other governmental investigations, enforcement actions, and legal and financial exposure, including potential contractual liability that is not always limited to the amounts covered by our insurance. Any such compromise could also result in damage to our reputation and a loss of confidence in our security measures. Any of these effects could adversely impact our business.
Our, our third-party partners’ and our vendors’ systems may be vulnerable to computer viruses and other malicious software, physical or electronic break-ins, or weakness resulting from intentional or unintentional service provider actions, and similar disruptions that could make all or portions of our website or applications unavailable for periods of time. We may need to expend significant resources to protect against, and to address issues created by, security breaches and other privacy and security incidents. Security breaches and other privacy and security incidents, including any breaches of our security measures or those of parties with which we have commercial relationships (including freelancers, partners, vendors, or other third-party service providers who provide development or other services to us and other partners) that result in the unauthorized access of users’ or employees’ confidential, proprietary or personal information, or the belief that any of these have occurred, could damage our reputation and expose us to a risk of loss or litigation and possible liability. Furthermore, if our network or computer systems are breached or unauthorized access to customer data is otherwise obtained, we may be held responsible for damages for contract breach, indemnity obligations, penalties for violation of applicable laws or regulations, and significant costs for remediation that may include liability for stolen assets or information and repair of system damage that may have been caused, incentives offered to customers or other business partners, or other expenditures, in an effort to maintain business relationships, and other liabilities. In addition, significant unavailability of our platform due to security
56
breaches and other privacy and security incidents could cause users to decrease their use of or cease using our platform and adversely affect our business. Although we maintain cyber liability insurance, we cannot be certain our coverage will extend to or be adequate for liabilities actually incurred or will continue to be available to us on reasonable terms, or at all.
Errors, defects, or disruptions in our platform could diminish demand, adversely impact our financial results, and subject us to liability.
Our users utilize our platform for important aspects of their businesses, and any errors, defects, or disruptions in our platform, or other performance problems with our platform or infrastructure could harm our brand and reputation and may damage the businesses of users. As the usage of our platform grows, we will need an increasing amount of technical infrastructure, including network capacity and computing power, to continue to operate our platform. It is possible that we may fail to continue to effectively scale and grow our technical infrastructure to accommodate these increased demands, which may adversely affect our user experience. We are also reliant on third-party software and infrastructure, including the infrastructure of the internet, to provide our platform. Any failure of or disruption to this software and infrastructure could also make our platform unavailable to our users. For example, for a short period of time in May 2019, due to an inadvertent error by a regulatory agency in Bangladesh, certain of our users in Bangladesh were not able to access our website and other websites that included “-rk.com” in their website addresses. Our platform is constantly changing with new updates, which may contain undetected errors when first introduced or released. Any errors, defects, disruptions in service, or other performance or stability problems with our platform, or the inadequacy of our efforts to adequately prevent or timely remedy errors or defects, could result in negative publicity, loss of or delay in market acceptance of our platform, loss of competitive position, our inability to timely and accurately maintain our financial records, inaccurate or delayed invoicing of clients, delay of payment to us or freelancers, or claims by users for losses sustained by them. In such an event, we may be required, or may choose, for customer relations or other reasons, to expend additional resources in order to help resolve the issue. Accordingly, any errors, defects, or disruptions in our platform could adversely impact our brand and reputation, revenue, and operating results.
Changes in laws or regulations relating to privacy or the protection or transfer of personal data, or any actual or perceived failure by us to comply with such laws and regulations or our privacy policies, could adversely affect our business.
We receive, collect, store, process, transfer, and use personal information and other user data. There are numerous federal, state, local, and international laws and regulations regarding privacy, data protection, information security, and the collection, storing, sharing, use, processing, transfer, disclosure, and protection of personal information and other content, the scope of which are changing, subject to differing interpretations, and may be inconsistent among countries, or conflict with other laws and regulations. We are also subject to the terms of our privacy policies and obligations to third parties related to privacy, data protection, and information security. We strive to comply with applicable laws, regulations, policies, and other legal obligations relating to privacy, data protection, and information security to the extent possible. However, the regulatory framework for privacy and data protection worldwide is, and is likely to remain for the foreseeable future, uncertain and complex, and it is possible that these or other actual or alleged obligations may be interpreted and applied in a manner that we do not anticipate or that is inconsistent from one jurisdiction to another and may conflict with other rules or our practices. Further, any significant change to applicable laws, regulations, or industry practices regarding the collection, use, retention, security, or disclosure of our users’ data, or their interpretation, or any changes regarding the manner in which the express or implied consent of users for the collection, use, retention, or disclosure of such data must be obtained, could increase our costs and require us to modify our services and features, possibly in a material manner, which we may be unable to complete in a cost-effective manner, or at all, and may limit our ability to store and process user data or develop new services and features.
We also expect that there will continue to be new laws, regulations, and industry standards concerning privacy, data protection, and information security proposed and enacted in various jurisdictions. For example, European legislators adopted the General Data Protection Regulation (the “GDPR”), which became effective in May 2018, superseded existing European Union (the “EU”) data protection legislation, imposes more stringent EU data protection requirements, and provides for significant penalties for noncompliance. The GDPR creates new compliance obligations applicable to our business, users and third-party partners, which could cause us to change our business
57
practices, and increases financial penalties for noncompliance, including possible fines of up to 4% of global annual turnover for the preceding financial year or €20 million, whichever is higher, for the most serious violations. The GDPR also confers a private right of action on data subjects and consumer associations to lodge complaints with supervisory authorities, seek judicial remedies, and obtain compensation for damages resulting from violations of the GDPR. Compliance with the GDPR has been and will be a rigorous and time-intensive process that may increase our cost of doing business or require us to change our business practices, and despite those efforts, there is a risk that we may be subject to governmental investigations or enforcement actions, fines and penalties, claims, litigation, and reputational harm in connection with any European activities. Additionally, in June 2018, California passed the California Consumer Privacy Act (the “CCPA”), which provides new data privacy rights for consumers and new operational requirements for companies, effective in 2020. Fines for noncompliance may be up to $7,500 per violation. The costs of compliance with, and other burdens imposed by, the GDPR and CCPA may limit the use and adoption of our products and services and could have an adverse impact on our business. As a result, we may need to modify the way we treat such information. Further, the United Kingdom has initiated a process to leave the EU that has created uncertainty with regard to the regulation of data protection in the United Kingdom. In particular, although the United Kingdom has proposed a Data Protection Bill that would be substantially consistent with the GDPR, this bill remains in the legislative process in the United Kingdom and it remains unclear whether it will be enacted or what it will provide for if enacted.
Any failure or perceived failure by us to comply with our posted privacy policies, our privacy-related obligations to users or other third parties, or any other legal obligations or regulatory requirements relating to privacy, data protection, or information security may result in governmental investigations or enforcement actions, litigation, claims, or public statements against us by consumer advocacy groups or others and could result in significant liability, cause our users to lose trust in us, and otherwise have an adverse effect on our reputation and business. Furthermore, the costs of compliance with, and other burdens imposed by, the laws, regulations, and policies that are applicable to the businesses of our users may limit the adoption and use of, and reduce the overall demand for, our platform.
Additionally, if third parties we work with violate applicable laws, regulations, or agreements, such violations may put our users’ data at risk, could result in governmental investigations or enforcement actions, fines, litigation, claims, or public statements against us by consumer advocacy groups or others and could result in significant liability, cause our users to lose trust in us, and otherwise have an adverse effect on our reputation and business. Further, public scrutiny of or complaints about technology companies or their data handling or data protection practices, even if unrelated to our business, industry, or operations, may lead to increased scrutiny of technology companies, including us, and may cause government agencies to enact additional regulatory requirements, or to modify their enforcement or investigation activities, which may disrupt the conduct of our business and increase our costs and risks.
We have experienced growth in recent periods and expect to continue to invest in our growth for the foreseeable future. If we are unable to manage our growth effectively, our business, revenue and profits, and financial condition could be adversely affected.
We have experienced growth in a relatively short period of time. For example, our total revenue for the six months ended June 30, 2019 was $143.2 million, representing a period-over-period growth rate of 17% over the same period in 2018. We plan to continue to expand our operations and personnel significantly. Sustaining our growth will place significant demands on our management as well as on our administrative, operational, and financial resources. To manage our growth, we must continue to improve our operational, financial, and management information systems; expand, motivate, and effectively manage our workforce; and effectively collaborate with our third-party partners. If we are unable to manage our growth successfully without compromising our quality of service or our profit margins, or if new systems that we implement to assist in managing our growth do not produce the expected benefits, our business, operating results, financial condition, and ability to successfully market our platform and serve our users could be adversely affected.
Our recent and historical growth should not be considered indicative of our future performance. We have encountered in the past, and will encounter in the future, risks, challenges, and uncertainties frequently experienced by growing companies in rapidly changing industries. If our assumptions regarding these risks, challenges, and uncertainties, which we use to plan and operate our business, are incorrect or change, or if we do not address these risks successfully, our financial condition and operating results could differ materially from our expectations, our growth rates may slow, and our business would be adversely impacted.
58
Our sales efforts are increasingly targeted at large enterprise clients, and as a result we may encounter greater pricing, implementation, and customization challenges, and we may have to delay revenue recognition for more complicated transactions, each of which could adversely impact our business and operating results.
Our sales efforts are increasingly targeted at large enterprise clients, and as a result, we face greater costs, longer sales cycles, and less predictability in completing some of our sales and in increasing spend by existing clients. For larger clients, use of our platform may require approvals by multiple departments and executive-level personnel and require us to provide greater levels of services and client education regarding the uses, benefits, security, privacy, worker classification, payments, and compliance services offered on our platform. Larger enterprises typically have longer decision-making and implementation cycles and may demand more customization, higher levels of support, a broader range of services, and greater payment flexibility. In addition, larger enterprises may require greater functionality and scalability and acceptance provisions that can lead to a delay in revenue recognition. We are often required to spend time and resources to better familiarize potential enterprise clients with the value propositions of our platform generally. Despite our efforts in familiarizing potential enterprise clients with the benefits of our platform, some potential enterprise clients may decide not to use our platform if, among other reasons, they do not feel that their procurement or compliance needs are or will be met. It is difficult to find sales personnel with the specific skills and technical knowledge needed to sell our Upwork Business, Upwork Enterprise, and other premium offerings. Even if we are able to hire qualified personnel, doing so may be costly and lengthy, as new sales personnel require significant training and can take a number of months to achieve full productivity. As a result of these factors, sales opportunities with large enterprises may require us to devote greater sales and administrative support and professional services resources to individual clients, which could increase our costs, lengthen our sales cycle, and divert our own sales and professional services resources to a smaller number of larger clients. We may spend substantial time, effort, and money in our sales efforts without being successful in producing sales or growing client spend.
Even if we reach agreement with an enterprise client to use our platform, the agreement may not be on pricing or other terms that are favorable to us. Moreover, a significant portion of the fees we typically receive from enterprise clients is contingent on the level of spend by the client. If an enterprise client negotiates pricing terms that are not favorable to us, does not engage freelancers on our platform, or uses freelancers for few projects or projects of low value, our revenue from the relationship may be minimal.
We also have in the past agreed, and may in the future agree, to take on additional risk for worker classification, privacy, security, work product, payments, or other matters for larger clients, or to other terms that are unfavorable to us in order to secure a client’s business or increase its spend. All these factors can add further risk to business conducted with these clients even after a successful sale.
Our revenue growth and ability to achieve and sustain profitability will depend in part on being able to expand and increase the productivity and effectiveness of our sales force.
We have only recently begun generating revenue from our Upwork Business and Enterprise offerings and other premium offerings. In order to increase our revenue from these offerings and achieve and sustain profitability, we must increase the size of our sales force and generate additional revenue from new and existing users.
There is significant competition for sales personnel with the skills and technical knowledge that we require. Our ability to achieve significant revenue growth will depend, in large part, on our success in recruiting, training, and retaining sufficient numbers of sales and sales support personnel to support our growth. New sales personnel require significant training and can take a number of months to achieve full productivity. Our recent hires and planned hires may not become productive as quickly as we expect and if our new sales personnel do not become fully productive on the timelines that we have projected, or at all, our revenue will not increase at anticipated rates, or at all, and our ability to achieve long-term projections may be negatively impacted. We may also be unable to hire or retain a sufficient number of qualified sales personnel. Furthermore, hiring sales personnel, particularly in new markets, requires additional costs that we may not recover if the sales personnel fail to achieve full productivity. If we are unable to hire and train a sufficient number of effective sales personnel, or if our sales personnel are not successful in obtaining new business or increasing sales to our existing user base, our business will be adversely affected.
If internet search engines’ methodologies or other channels that we utilize to direct traffic to our website are modified to our disadvantage, or our search result page rankings decline for other reasons, our user growth could decline.
59
We depend in part on various internet search engines, such as Google and Bing, as well as other channels to direct a significant amount of traffic to our website. Our ability to maintain the number of visitors directed to our website is not entirely within our control. For example, our competitors’ search engine optimization and other efforts may result in their websites receiving a higher search result page ranking than ours, internet search engines or other channels that we utilize to direct traffic to our website could revise their methodologies in a manner that adversely impacts traffic to our website, or we may make changes to our website that adversely impact our search engine optimization rankings and traffic. As a result, links to our website may not be prominent enough to drive sufficient traffic to our website, and we may not be able to influence the results.
We may experience a decline in traffic to our website if third-party browser technologies are changed or search engine or other channels that we utilize to direct traffic to our website change their methodologies or rules to our disadvantage. We expect the search engines and other channels that we utilize to drive users to our website to continue to periodically change their algorithms, policies, and technologies. These changes may result in an interruption in users’ ability to access our website or impair our ability to maintain and grow the number of users that visit our website. We may also be forced to significantly increase marketing expenditures in the event that market prices for online advertising and paid listings escalate or our organic ranking decreases. Any of these changes could have an adverse impact on our business, user acquisition, and operating results.
If we are unable to maintain our payment partner relationships on favorable terms, or at all, or if our payment partners cease providing services to us, our business could be adversely affected.
Our payment partners consist of payment processors and disbursement partners. We rely on banks and card processors to provide clearing, processing, and settlement functions for the funding of all transactions on our platform. We also rely on a network of disbursement partners to disburse funds to users.
Our payment partners are critical to our business. In order to maintain these relationships, we have in the past been, and may in the future be, forced to agree to terms that are unfavorable to us. If we are unable to maintain our agreements with current payment partners on favorable terms, or at all, or we are unable to enter into new agreements with new payment partners on favorable terms, or at all, our ability to disburse transactions and our revenue and business may be adversely affected. This could occur for a number of reasons, including the following:
|
•
|
our payment partners may be unable to effectively accommodate changing service needs, such as those which could result from rapid growth or higher volume or those which relate to local jurisdictions;
|
|
•
|
our payment partners could choose to terminate or not renew their agreements with us, or only be willing to renew on different or less advantageous terms;
|
|
•
|
our payment partners could reduce the services provided to us, cease doing business with us, or cease doing business altogether;
|
|
•
|
our payment partners could be subject to delays, limitations, or closures of their own businesses, networks, or systems, causing them to be unable to process payments or disburse funds for certain periods of time;
|
|
•
|
our payment partners may be subject to investigation, regulatory enforcement or other proceedings that result in their inability or unwillingness to provide services to us; or
|
|
•
|
we may be forced to cease doing business with payment processors if card association operating rules, certification requirements and laws, regulations, or rules governing electronic funds transfers to which we are subject change or are interpreted to make it difficult or impossible for us to comply.
|
Our user growth and engagement on mobile devices depend upon third parties maintaining open application marketplaces and effective operation with mobile operating systems, networks, and standards that we do not control.
Mobile devices are increasingly used for marketplace transactions. A significant and growing portion of our users access our platform through mobile devices, including through the use of mobile applications. Our mobile applications rely on third parties maintaining open application marketplaces, including the Apple App Store and Google Play, which make applications or new versions of our mobile applications available for download and use on mobile devices. We cannot assure you that the marketplaces through which we distribute our applications will maintain their current structures or terms of access, that such marketplaces will continue to make our mobile applications available
60
for download, or that such marketplaces will not charge us fees to list our applications for download, or charge us fees to offer products and services through our applications. Additionally, there is no guarantee that popular mobile devices will continue to support our platform, that the use of mobile devices for marketplace transactions will be available on commercially reasonable terms, or that mobile device users will use our platform rather than competing products. We are dependent on the interoperability of our platform with popular mobile operating systems that we do not control, such as Android and iOS, and any changes in such systems that degrade the functionality of our website or applications or give preferential treatment to competitors could adversely affect our platform’s usage on mobile devices. Additionally, in order to deliver high-quality mobile products, it is important that our products are designed effectively and work well with a range of mobile devices, technologies, systems, networks, and standards that we do not control. We may not be successful in developing relationships with key participants in the mobile industry or in developing products that operate effectively with these devices, technologies, systems, networks, or standards. In the event that it is more difficult for our users to access and use our platform on their mobile devices or users find our mobile offering does not meet their needs, our competitors develop products and services that are perceived to operate more effectively on mobile devices, or if our users choose not to access or use our platform on their mobile devices or use mobile products that do not offer access to our platform, our user growth, user engagement, and business could be adversely impacted.
We rely on AWS to deliver our platform to our users, and any disruption of service from AWS or material change to our arrangement with AWS could adversely affect our business. We are also subject to litigation relating to our use of AWS.
We currently host our platform, serve our users, and support our operations using AWS, a provider of cloud infrastructure services. We do not have control over the operations of the facilities of AWS that we use. AWS’s facilities are vulnerable to damage or interruption from earthquakes, hurricanes, floods, fires, cyber security attacks, terrorist attacks, power losses, telecommunications failures, and similar events. The occurrence of any of these events, a decision to close the facilities without adequate notice, or other unanticipated problems could result in lengthy interruptions to our platform. The facilities also could be subject to break-ins, computer viruses, sabotage, intentional acts of vandalism, and other misconduct. Our platform’s continuing and uninterrupted performance is critical to our success and users may become dissatisfied by any system failure that interrupts our ability to provide our platform to them. We may not be able to easily switch our AWS operations to another cloud or other data center provider if there are disruptions or interference with our use of AWS, and, even if we do switch our operations, other cloud and data center providers are subject to the same risks. Sustained or repeated system failures could reduce the attractiveness of our platform to users, cause users to decrease their use of or cease using our platform, and adversely affect our business. Moreover, negative publicity arising from these types of disruptions could damage our reputation and may adversely impact use of our platform. We may not carry sufficient business interruption insurance to compensate us for losses that may occur as a result of any events that cause interruptions in our service.
AWS does not have an obligation to renew its agreements with us on commercially reasonable terms, or at all. If we are unable to renew our agreements or unable to renew on commercially reasonable terms, our agreements are prematurely terminated, or we add additional infrastructure providers, we may experience costs or downtime in connection with the transfer to, or the addition of, new data center providers. If these providers charge high costs for or increase the cost of their services, we may have to increase the fees to use our platform and our operating results may be adversely impacted.
In addition, we and other customers of AWS have been subject to litigation by third parties claiming that AWS and basic HTTP functions infringe their patents. Although we expect Amazon to indemnify us with respect to at least a portion of such claims, the litigation may be time consuming, it may divert management’s attention, and, if Amazon fails to fully indemnify us, it may adversely impact our operating results.
Failure to comply with anti-corruption, anti-money laundering, and sanctions laws, including the United States Foreign Corrupt Practices Act (the “FCPA”) and similar laws associated with our activities outside of the United States, could subject us to penalties and other adverse consequences.
We have voluntarily implemented an anti-money laundering program designed to address the risk of our platform being used to facilitate money laundering, terrorist financing, and other illicit activity. We also have policies, procedures, and sophisticated technology designed to allow us to comply with U.S. economic sanctions laws and prevent our platform from being used to facilitate business in countries, or with persons or entities, included on
61
designated lists promulgated by the U.S. Department of the Treasury’s Office of Foreign Assets Control (“OFAC”) and equivalent foreign authorities. Although we have a program that we believe is reasonably designed to allow us to comply with applicable laws, rules, and regulations, we may still be subject to fines or other penalties in one or more jurisdictions levied by federal or state or local regulators, including state attorneys general, as well as those levied by foreign regulators in the event that we engage in any conduct, intentionally or not, that facilitates money laundering, terrorist financing, or other illicit activity, or that violates sanctions or otherwise constitutes sanctionable activity. Moreover, while we have implemented policies and procedures for compliance with OFAC regulations, including, among others, internet protocol-blocking logic designed to prevent users from using our services within the OFAC-sanctioned countries of North Korea, Syria, Iran, and the Crimea region of Ukraine, given the technical limitations in developing controls to prevent, among other things, the ability of users to place on our platform false or deliberately misleading information or to develop sanctions evasion methods, it is possible that we may inadvertently and without our knowledge provide services to individuals or entities that have been designated by OFAC or are located in a country subject to an embargo by the United States that may not be in compliance with the economic sanctions regulations administered by OFAC. A State Department advisory issued in July 2018 stated that “there are cases where North Korean companies exploit the anonymity provided by freelancing websites to sell their IT services to unwitting buyers.” Additionally, press reports have stated that North Korean operatives have used various social media applications and freelancing websites, including ours. Accordingly, although we have controls in place to detect and prevent such OFAC violations and our systems show no access from persons in North Korea, nor from any other OFAC-sanctioned jurisdictions, we may face higher levels of scrutiny by users, partners, and regulators due to the publishing of this advisory and such press reports. In addition to fines, consequences for failing to comply with applicable rules and regulations could include criminal and civil lawsuits, forfeiture of significant assets, or other enforcement actions. We could also be required to make changes to our business practices or compliance programs as a result of regulatory scrutiny. In addition, any perceived or actual breach of compliance by us or our users with respect to applicable laws, rules, and regulations could have a significant impact on our reputation and could cause us to lose existing users, prevent us from obtaining new users, cause payment partners to terminate or not renew their agreements with us, negatively impact investor sentiment about our company, require us to expend significant funds to remedy problems caused by violations and to avert further violations, and expose us to legal risk and potential liability, all of which may adversely affect our business, operating results, and financial condition and may cause the price of our common stock to decline. Further, even if we maintain proper controls and remain in compliance with OFAC regulations, should any of our competitors not implement sufficient OFAC controls and be found to have violated OFAC regulations, user perception of online freelance marketplaces in general may decrease and our business, brand, and reputation may be adversely affected.
We are also subject to the FCPA, the U.S. domestic bribery statute contained in 18 U.S.C. § 201, the U.S. Travel Act, and the UK Bribery Act 2010, and may be subject to other anti-bribery, anti-money laundering, and sanctions laws in countries in which we conduct activities or have users. We face significant risks if we fail to comply with the FCPA and other anti-corruption laws that prohibit companies and their agents and third-party intermediaries from authorizing, offering, or providing, directly or indirectly, improper payments or benefits to foreign government officials, political parties, and private-sector recipients for the purpose of obtaining or retaining business, directing business to any person, or securing any advantage. In many foreign countries, particularly in countries with developing economies, it may be a local custom that businesses engage in practices that are prohibited by the FCPA or other applicable laws and regulations. We may have direct or indirect interactions with officials and employees of government agencies or state-owned or affiliated entities, and we may be held liable for the corrupt or other illegal activities of these third-party intermediaries, our employees, representatives, contractors, partners, and agents, even if we do not explicitly authorize such activities. We have implemented an anti-corruption compliance policy, but we cannot ensure that all of our employees, users, and agents, as well as those contractors to which we outsource certain of our business operations, will not take actions in violation of our policies or agreements and applicable law, for which we may be ultimately held responsible.
Any violation of the FCPA, other applicable anti-corruption laws, and other applicable laws could result in investigations and actions by federal or state attorneys general or foreign regulators, loss of export privileges, severe criminal or civil fines and penalties or other sanctions, forfeiture of significant assets, whistleblower complaints, and adverse media coverage, which could have an adverse effect on our reputation, business, operating results, and prospects. In addition, responding to any enforcement action may result in a significant diversion of management’s attention and resources and significant defense costs and other professional fees.
62
The applicability of sales, use, and other tax laws or regulations on our business is uncertain. Adverse tax laws or regulations could be enacted or existing laws could be interpreted as applying or otherwise applied to us or users of our platform, which could subject us or our users to additional tax liability and related interest and penalties, and adversely impact our business.
The application of federal, state, local, and international tax laws to services provided over the internet is evolving. Many of the fundamental statutes and regulations that impose these taxes were established before the adoption and growth of the internet and ecommerce. In addition, governments are increasingly looking for ways to increase revenue, which has resulted in discussions about tax reform and other legislative action to increase tax revenue, including through indirect taxes. New income, payroll, sales, use, value-added, goods and services, or other tax laws, statutes, rules, regulations, or ordinances could be enacted at any time (possibly with retroactive effect), and could be applied solely or disproportionately to services provided over the internet, could target certain products and services offered on our platform, or could otherwise affect our or our users’ tax obligations or financial position and operating results. Many countries in the EU, as well as the United Kingdom and a number of other countries and organizations, such as the Organisation for Economic Cooperation and Development, have recently proposed or recommended changes to existing tax laws or have enacted new laws that could impact our tax obligations.
We may also be subject to non-income taxes, such as payroll, sales, use, value-added, and goods and services taxes (including the “digital service tax”) in the United States and various foreign jurisdictions. In certain jurisdictions, we collect and remit indirect taxes on our fees. Our collection of indirect taxes on our fees in these jurisdictions may cause our users to use other platforms or other alternatives that do not collect indirect taxes on their fees, which may in turn affect our financial results. In addition, tax authorities may raise questions about, challenge or disagree with our calculation, reporting, or collection of taxes and may require us to remit additional taxes and interest, and could impose associated penalties and fees. Should any new taxes become applicable, or if the taxes we pay are found to be deficient, our business could be adversely impacted. We have in the past been, and may in the future be, audited by tax authorities with respect to non-income taxes, and we may have exposure to additional non-income tax liabilities, which could have an adverse effect on our operating results and financial condition. In addition, our future effective tax rates could be favorably or unfavorably affected by changes in tax rates, changes in the valuation of our deferred tax assets or liabilities, the effectiveness of our tax planning strategies, or changes in tax laws or their interpretation. Such changes could have an adverse impact on our operating results and financial condition.
Moreover, state, local, and foreign tax jurisdictions have differing rules and regulations governing sales, use, value-added, payroll, and other taxes, and these rules and regulations can be complex and are subject to varying interpretations and enforcement positions that may change over time. Existing tax laws, statutes, rules, regulations, or ordinances could be interpreted, changed, modified, or applied adversely to us (possibly with retroactive effect), which could require us or our users to pay additional tax amounts on prior sales and going forward, as well as require us or our users to pay fines, penalties, and interest for past amounts. Although our terms of service require our users to pay all applicable sales and other taxes and to indemnify us for any requirement that we pay any withholding amount to the appropriate authorities, our users may be unwilling or unable to pay back taxes and associated interest or penalties and may fail to indemnify us, we may determine that it would not be commercially feasible or cost-effective to seek reimbursement, or the indemnification obligation may be deemed unenforceable. If we are required to collect and pay back taxes and associated interest and penalties, or we are unsuccessful in collecting such amounts from our users, we could incur potentially substantial unplanned expenses, thereby adversely impacting our operating results and cash flows. In addition, tax laws and regulations may subject us to audit by tax regulators and require us to provide certain data and information, including user information, from our platform to tax regulators in certain jurisdictions. If we are obligated to provide such information to tax regulators in any jurisdiction, users may choose to use other platforms or other alternatives, which may in turn adversely affect our operating results and financial condition.
As a result of these and other factors, the ultimate amount of tax obligations owed may differ from the amounts recorded in our financial statements and any such difference may adversely impact our operating results in future periods in which we change our estimates of our tax obligations or in which the ultimate tax outcome is determined.
We may be adversely affected by the withdrawal of the United Kingdom from the European Union.
In March 2017, the United Kingdom announced its decision to exit the EU (“Brexit”). The United Kingdom’s withdrawal is currently scheduled to take effect in the fourth quarter of 2019, unless a further extension is agreed to; however, uncertainty remains as to what kind of post-Brexit agreement between the United Kingdom and the EU, if any, may
63
be approved by the UK Parliament. The ongoing uncertainty on the status of such an agreement sustains the possibility of the United Kingdom leaving the EU without any agreement in place, a so-called “hard Brexit,” which would likely cause significant economic disruption and further depress consumer confidence and the economy of the United Kingdom. Our results of operations derived from revenue earned from clients and freelancers in the United Kingdom may be adversely affected by the uncertainty surrounding the timing of the withdrawal and the future relationship between the United Kingdom and the EU, and those effects would be increased in the event of a hard Brexit. Brexit could also contribute to instability in global financial and foreign exchange markets, including volatility in the value of the Euro and the British Pound, which are currencies in which we transact business. In addition, we could be adversely impacted by changes in trade policies, labor, tax or other laws and regulations, and intellectual property rights and supply chain logistics. All or any one of these factors could adversely affect our business, revenue, financial condition and results of operations.
Failure to protect our intellectual property could adversely affect our business.
Our success depends in large part on our proprietary technology and data. We rely on various intellectual property rights, including patents, copyrights, trademarks, and trade secrets, as well as confidentiality provisions and contractual arrangements, to protect our proprietary rights. If we do not protect and enforce our intellectual property rights successfully or cost-effectively, our competitive position may suffer, which could adversely impact our operating results.
Our pending patent or trademark applications may not be approved, or competitors or others may challenge the validity, enforceability, or scope of our patents, the registrability of our trademarks, or the trade secret status of our proprietary information. There can be no assurance that additional patents will be issued or that any patents that are issued will provide significant protection for our intellectual property. In addition, our patents, copyrights, trademarks, trade secrets, and other intellectual property rights may not provide us a significant competitive advantage. There is no assurance that the particular forms of intellectual property protection that we seek, including business decisions about when to file patents or register or renew trademarks and when and how to maintain and protect trade secrets, will be adequate to protect our business.
Moreover, recent amendments to, developing jurisprudence regarding, and possible changes to intellectual property laws and regulations, including U.S. and foreign patent law, may affect our ability to protect and enforce our intellectual property rights. In addition, the laws of some countries do not provide the same level of protection for our intellectual property as do the laws of the United States. As our global reputation grows and we expand our international activities, our exposure to unauthorized copying and use of our platform and proprietary information will likely increase. Despite our precautions, our intellectual property is vulnerable to unauthorized access through employee or third-party error or actions, theft, cyber security incidents, and other security breaches and incidents. It is possible for third parties to infringe upon or misappropriate our intellectual property, to copy our platform, and to use information that we regard as proprietary to create products and services that compete with ours. Effective intellectual property protection may not be available to us in every country in which our platform is available. In addition, many countries limit the enforceability of patents against certain third parties, including government agencies or government contractors. In these countries, patents may provide limited or no benefit. Further, certain countries impose additional conditions on the transfer of intellectual property rights from individuals to companies, which may make it more difficult for us to secure and maintain intellectual property protection in those countries. We may need to expend additional resources to defend our intellectual property rights domestically or internationally, which could be costly, time consuming, and distracting to management and could impair our business or adversely affect our domestic or international expansion. Moreover, we may not pursue or file patent applications or apply for registration of copyrights or trademarks in the United States and foreign jurisdictions in which we have a presence with respect to our potentially patentable inventions, works of authorship, and marks and logos for a variety of reasons, including the cost of procuring such rights and the uncertainty involved in obtaining adequate protection from such applications and registrations. If we cannot adequately protect and defend our intellectual property, we may not remain competitive, and our business, operating results, and financial condition may be adversely affected.
We enter into confidentiality and invention assignment or intellectual property ownership agreements with our employees and contractors and enter into confidentiality agreements with other parties. In addition, for employees of third-party staffing providers or other contractors, the employer agrees to enter into these agreements with individual workers. We cannot ensure that these agreements, or all the terms thereof, will be enforceable or compliant with
64
applicable law, or otherwise effective in controlling access to, use of, and distribution of our proprietary information or in effectively securing exclusive ownership of intellectual property developed by our current or former employees and contractors. For example, when working with contractors, particularly those who are off-site, it may be more difficult to control use of confidential materials, increasing the risk that our source code or other confidential or trade secret information may be exposed. Further, these agreements with our employees, contractors, and other parties may not prevent other parties from independently developing technologies that are substantially equivalent or superior to our platform.
We may need to spend significant time and resources securing and monitoring our intellectual property rights, and we may or may not be able to detect infringement by third parties. Our competitive position may be adversely impacted if we cannot detect infringement or enforce our intellectual property rights quickly or at all. In some circumstances, we may choose not to pursue enforcement because an infringer has a dominant intellectual property position or for other business reasons. In addition, competitors might avoid infringement by designing around our intellectual property rights or by developing non-infringing competing technologies. We have in the past been forced to rely on litigation, opposition, and cancellation actions, and other claims and enforcement actions to protect our intellectual property, including to dispute registration or use of marks that may be confusingly similar to our own marks. Similar claims and other litigation may be necessary in the future to enforce and protect our intellectual property rights. Litigation brought to protect and enforce our intellectual property rights could be costly, time-consuming, and distracting to management, and could result in the impairment or loss of portions of our intellectual property. Further, our efforts to enforce our intellectual property rights may be met with defenses; counterclaims attacking the scope, validity, and enforceability of our intellectual property rights; or counterclaims and countersuits asserting infringement by us of third-party intellectual property rights. Our failure to secure, protect, and enforce our intellectual property rights could adversely affect our brand and our business, and we could lose the right to use certain intellectual property or lose the opportunity to license our technology to others or to collect royalty payments based upon successful protection and assertion of our intellectual property against others.
We are vulnerable to intellectual property infringement claims and challenges to our intellectual property rights brought against us by third parties.
We operate in a highly competitive industry, and there has been considerable activity in our industry to develop and enforce intellectual property rights. Successful intellectual property infringement claims against us or our users or third-party partners could result in monetary liability or a material disruption in the conduct of our business. We cannot be certain that aspects of our platform, content, and brand names do not or will not infringe valid patents, trademarks, copyrights, or other intellectual property rights held by third parties. We are, have in the past been, and may in the future be, subject to legal proceedings and claims from time to time relating to the intellectual property of others in the ordinary course of our business. Our competitors have in the past challenged, and may in the future challenge, our registration or use of our trademarks, including “Upwork,” and, if successful, such a challenge could adversely affect our business. Any intellectual property litigation to which we might become a party, or for which we are required to provide indemnification, may require us to cease selling or using products and services that incorporate the intellectual property that we allegedly infringe; make substantial payments for legal fees, settlement payments, or other costs or damages; obtain a license to sell or use the relevant technology, which may not be available on reasonable terms or at all; or redesign the allegedly infringing products and services to avoid infringement, which could be costly, time-consuming, or impossible. Any claims or litigation, regardless of merit, could divert management’s attention and cause us to incur significant expenses and, if successfully asserted against us, could require that we pay substantial damages or ongoing royalty payments, prevent us from offering aspects of our platform, or require that we comply with other unfavorable terms. Our competitors and others may now and in the future have significantly larger and more mature patent portfolios than we have. We may also be obligated to indemnify certain clients on our platform or strategic partners or others in connection with such infringement claims, or to obtain licenses from third parties or modify our platform, and each such obligation could further exhaust our resources. Some of our infringement indemnification obligations related to intellectual property are contractually capped at a very high amount or not capped at all.
Any disputes resulting from allegations of intellectual property infringement, including current disputes, could subject us to significant legal costs and liability for damages and invalidate our proprietary rights. Any current or potential future intellectual property disputes or litigation also could force us to do one or more of the following:
65
|
•
|
cease conducting certain operations in some or all jurisdictions, or stop using technology that contains the allegedly infringing intellectual property;
|
|
•
|
stop using the name “Upwork” or other trademarks in some or all jurisdictions;
|
|
•
|
incur significant legal expenses;
|
|
•
|
pay substantial damages to the party whose intellectual property rights we may be found to be infringing;
|
|
•
|
pay substantial amounts in settlement to a party that asserts allegations of intellectual property infringement;
|
|
•
|
make expensive changes to our platform or in our methods of doing business; or
|
|
•
|
attempt to obtain a license to the relevant intellectual property from third parties, which may not be available on reasonable terms or at all.
|
Even if intellectual property claims do not result in litigation or are resolved in our favor, these claims, and the time and resources necessary to resolve them, could divert the resources of our management and adversely affect our business and operating results. We expect that the occurrence of infringement claims is likely to grow as the market for freelancers and the clients that engage them grows. Accordingly, our exposure to damages resulting from infringement claims could increase and this could further exhaust our financial and management resources.
Our revenue growth depends in part on the success of our strategic relationships with third parties and their continued performance.
To grow our business, we anticipate that we will need to continue to establish and maintain relationships with third parties, such as staffing providers, banks, and payment processing and disbursement providers. For example, we work with third-party staffing providers that support our employment offering for our marketplace, Upwork Payroll, and premium offerings. As our agreements with third-party partners terminate or expire, we may be unable to renew or replace these agreements on favorable terms, or at all. Moreover, we cannot guarantee that the parties with which we have strategic relationships will continue to devote the resources necessary to expand our reach, increase our distribution or support an increased number of users and associated use cases. Further, some of our strategic partners offer, or could offer, competing products and services or also work with our competitors. As a result of these factors, many of our third-party partners may choose to develop alternative products and services in addition to, or in lieu of, our platform, either on their own or in collaboration with others, including our competitors. If we are unsuccessful in establishing or maintaining our relationships with third parties on favorable terms, our ability to compete or to grow our total revenue could be impaired and our operating results may be adversely impacted. Even if we are successful in establishing and maintaining these relationships with third parties on comparable terms, we cannot ensure that these relationships will result in increased usage of our platform or increased revenue.
Our ability to attract and retain users is dependent in part on ease of use and reliability of our platform and the quality of our support, and any failure to offer high-quality support could adversely impact our business, operating results, and financial condition.
Our ability to attract and retain users is dependent in part on the ease of use and reliability of our platform, including our ability to provide high-quality support. Our users depend on our support organization to resolve any issues relating to our platform. Our ability to provide effective support is largely dependent on our ability to attract, resource, and retain service providers who are not only qualified to support users of our platform, but are also well versed in our platform. As we seek to continue to grow our international user base, our support organization will face additional challenges, including those associated with delivering support and documentation in languages other than English. Any failure to maintain high-quality support, or a market perception that we do not maintain high-quality support, could harm our reputation, adversely affect our ability to sell our platform to existing and prospective users, and could adversely impact our business, operating results, and financial condition.
Our business model may subject us to disputes with or between users of our platform.
Our business model involves enabling connections between freelancers and clients that contract directly through our platform. Freelancers and clients are free to negotiate any contract terms they choose, but we also provide optional service contract terms that they can elect to use. It is possible that disputes may arise between freelancers and clients with regard to their contract terms, work relationship, or otherwise, including with respect to service standards,
66
payment, confidentiality, work product, and intellectual property ownership and infringement. If either party believes the contract terms were not met, our standard terms provide a mechanism for the parties to request assistance from us, and, for some contracts, if that is unsuccessful, they may choose to resolve the dispute with the help of a third-party arbitrator. Whether or not freelancers and clients decide to seek assistance from us, if these disputes are not resolved amicably, the parties might escalate to formal proceedings, such as by filing claims with a court or arbitral authority. Given our role in facilitating and supporting these arrangements, it is possible that claims will be brought against us directly as a result of these disputes, or that freelancers or clients may bring us into any claims filed against each other. Through our user agreements we disclaim responsibility and liability for any disputes between users (except with respect to the specified dispute assistance program); however, we cannot guarantee that these terms will, in all circumstances, be effective in preventing or limiting our involvement in user disputes. In addition, from time to time users do, and may continue to, assert claims against us regarding their experience on our platform, including related to their search ranking results, their feedback ratings, our dispute resolution process, or admission or non-admission to the platform or other programs, including those designed to highlight successful freelancers. Even if these claims do not result in litigation or are resolved in our favor, these claims, and the time and resources necessary to resolve them, could result in legal, settlement, or other financial costs; divert the resources of our management; harm our reputation; and adversely affect our business and operating results.
Our business depends largely on our ability to attract and retain talented employees, including senior management and key personnel. If we lose the services of Stephane Kasriel, our President and Chief Executive Officer, or other members of our senior management team, we may not be able to execute on our business strategy.
Our future success depends on our continuing ability to attract, train, assimilate, and retain highly-skilled personnel, including software engineers and sales personnel. We face intense competition for qualified personnel from numerous software and other technology companies. In addition, competition for qualified personnel, particularly software engineers, is particularly intense in the San Francisco Bay Area, where our headquarters are located. We may not be able to retain our current key employees or attract, train, assimilate, or retain other highly-skilled personnel in the future. We may incur significant costs to attract and retain highly-skilled personnel, and we may lose new employees to our competitors or other technology companies before we realize the benefit of our investment in recruiting and training them. To the extent we move into new geographies, we would need to attract and recruit skilled personnel in those areas. If we are unable to attract and retain suitably qualified individuals who are capable of meeting our growing technical, operational, and managerial requirements, on a timely basis or at all, our business may be adversely affected.
Our future success also depends in large part on the continued services of senior management and other key personnel. In particular, we are dependent on the services of Stephane Kasriel, our President and Chief Executive Officer, and our technology, platform, future vision, and strategic direction could be compromised if he were to take another position, become ill or incapacitated, or otherwise become unable to serve as our President and Chief Executive Officer. We rely on our leadership team in the areas of product, engineering, operations, security, marketing, sales, support, and general and administrative functions. Our senior management and other key personnel are all employed on an at-will basis, which means that they could terminate their employment with us at any time, for any reason, and without notice. Historically, we have maintained, and currently we maintain, a key-person life insurance policy only on our President and Chief Executive Officer. If we lose the services of senior management or other key personnel, or if we are unable to attract, train, assimilate, and retain the highly-skilled personnel we need, our business, operating results, and financial condition could be adversely affected.
Volatility or lack of appreciation in our stock price may also affect our ability to attract new talent and retain our key employees. Many of our senior personnel and other key employees have become, or will soon become, vested in a substantial amount of stock or stock options. Employees may be more likely to leave us if the shares they own, or the shares underlying their vested options, have appreciated in value relative to the original purchase price of the shares or the exercise price of the options, or conversely, if the exercise price of the options that they hold are above or near the market price of our common stock. If we are unable to retain our employees, or if we need to increase our compensation expenses to retain our employees, our business, operating results, financial condition, and cash flows could be adversely affected.
The requirements of being a public company may strain our resources, divert management’s attention and affect our ability to attract and retain additional executive management and qualified board members. In addition, we
67
expect we will no longer be an emerging growth company as of the end of this fiscal year and the additional requirements we must comply with may further strain our resources and divert management’s attention from other business concerns.
As a public company, we are subject to the reporting requirements of the Exchange Act, the Sarbanes-Oxley Act, the Dodd-Frank Wall Street Reform and Consumer Protection Act of 2010, the listing requirements of The Nasdaq Global Select Market, and other applicable securities rules and regulations. Compliance with these rules and regulations will increase our legal and financial compliance costs, make some activities more difficult, time-consuming, or costly, and increase demand on our systems and resources, particularly after we are no longer an emerging growth company. The Exchange Act requires, among other things, that we file annual, quarterly, and current reports with respect to our business and operating results. The Sarbanes-Oxley Act requires, among other things, that we maintain effective disclosure controls and procedures and internal control over financial reporting. In order to maintain and, if required, improve our disclosure controls and procedures and internal control over financial reporting to meet this standard, significant resources and management oversight may be required. As a result, management’s attention may be diverted from other business concerns, which could adversely affect our business and operating results. Although we have already hired additional employees to comply with these requirements, we may need to hire more employees in the future or engage outside consultants or may have difficulty attracting and retaining sufficient employees, which would increase our costs and expenses.
In addition, changing laws, regulations, and standards relating to corporate governance and public disclosure are creating uncertainty for public companies, increasing legal and financial compliance costs, and making some activities more time consuming. These laws, regulations, and standards are subject to varying interpretations, in many cases due to their lack of specificity, and, as a result, their application in practice may evolve or otherwise change over time as new guidance is provided by regulatory and governing bodies. This could result in continuing uncertainty regarding compliance matters and higher costs necessitated by ongoing revisions to disclosure and governance practices. We intend to invest resources to comply with evolving laws, regulations and standards (or changing interpretations of them), and this investment may result in increased general and administrative expenses and a diversion of management’s time and attention from revenue-generating activities to compliance activities. If our efforts to comply with these laws, regulations, and standards differ from the activities intended by regulatory or governing bodies, regulatory authorities may initiate legal proceedings against us, and our business may be adversely affected. Being a public company and complying with the associated rules and regulations makes it more expensive for us to obtain director and officer liability insurance, the costs of which can fluctuate significantly from year-to-year due to general market conditions in obtaining such insurance. As a result, we may be required to accept reduced coverage or incur substantially higher costs to obtain coverage. These factors could also make it more difficult for us to attract and retain qualified executives and qualified members of our board of directors, particularly to serve on our audit, risk, and compliance committee, compensation committee, and nominating and governance committee.
As a result of disclosure of information in filings required of a public company, our business and financial condition has become more visible, which may result in threatened or actual litigation, including by competitors. If such claims are successful, our business and operating results could be adversely affected, and even if the claims do not result in litigation or are resolved in our favor, these claims, and the time and resources necessary to resolve them, could divert the resources of our management and adversely affect our business and operating results.
In addition, as a result of our disclosure obligations as a public company, we could face pressure to focus on short-term results, which may adversely affect our ability to achieve long-term profitability.
As a result of becoming a public company, we are obligated to develop and maintain proper and effective internal control over financial reporting. We have identified a material weakness in our internal control over financial reporting and if our remediation of this material weakness is not effective, or if we fail to develop and maintain an effective system of disclosure controls and internal control over financial reporting, our ability to produce timely and accurate financial statements or comply with applicable laws and regulations could be impaired.
As a public company, we will be required, pursuant to Section 404 of the Sarbanes-Oxley Act (“Section 404”), to furnish a report by management on, among other things, the effectiveness of our internal control over financial reporting commencing with our annual report on Form 10-K for the year ending December 31, 2019. Effective internal control over financial reporting is necessary for us to provide reliable financial reports and, together with adequate disclosure controls and procedures, are designed to prevent fraud. Any failure to implement required new or improved
68
controls, or difficulties encountered in their implementation, could cause us to fail to meet our reporting obligations. Ineffective internal controls could also cause investors to lose confidence in our reported financial information, which could have a negative effect on the trading price of our common stock. This assessment will need to include disclosure of any material weaknesses identified by our management in our internal control over financial reporting. However, our independent registered public accounting firm has not been required to formally attest to the effectiveness of our internal control over financial reporting pursuant to Section 404 to date as we have been an emerging growth company. We will no longer qualify as an emerging growth company as of December 31, 2019 and therefore our independent registered public accounting firm will be required to provide this attestation beginning with our Annual Report on Form 10-K for the year ending December 31, 2019, which will require increased costs, expenses and management resources. An independent assessment of the effectiveness of our internal controls could detect problems that our management’s assessment might not. Undetected material weaknesses in our internal controls could lead to financial statement restatements and require us to incur the expense of remediation. We are required to disclose changes made to our internal controls and procedures on a quarterly basis. To comply with the requirements of being a public company, we may need to undertake various actions, such as implementing new internal controls and procedures and hiring accounting or internal audit staff.
In connection with the preparation of our consolidated financial statements as of and for the year ended December 31, 2017, we identified a number of adjustments relating to previously issued consolidated financial statements that resulted in a revision to our consolidated financial statements as of and for the year ended December 31, 2016. As a result of these adjustments, for the year ended December 31, 2016, net loss increased by $0.3 million and cash flows from operations decreased by $0.3 million. There was no impact to cash flows from investing or financing activities for the year ended December 31, 2016. Moreover, total assets decreased by $0.5 million and total liabilities increased by $0.7 million as of December 31, 2016. These adjustments were related to complexities involving the accounting for financial instruments and treasury activities. We identified the cause of these adjustments was due to growth in the business, which required additional qualified accounting personnel with an appropriate level of experience, and additional controls in the period-end financial reporting process commensurate with the complexity of the business. Accordingly, we have determined that this control deficiency constituted a material weakness in our internal control over financial reporting. A material weakness is a deficiency or combination of deficiencies in our internal control over financial reporting such that there is a reasonable possibility that a material misstatement of our consolidated financial statements would not be prevented or detected on a timely basis. This deficiency could result in additional misstatements to our consolidated financial statements that would be material and would not be prevented or detected on a timely basis.
We are evaluating and implementing additional procedures in order to remediate this material weakness, however, we cannot assure you that these or other measures will fully remediate the material weakness in a timely manner. At the beginning of 2016, we had 15 accounting and finance employees. As part of our remediation plan to address the material weakness identified above, we hired a new Chief Financial Officer in October 2017 and subsequently hired additional accounting and finance employees with the specific technical accounting and financial reporting experience necessary for a public company, including a senior director of technical accounting and reporting, a manager of technical accounting and reporting, a senior director of Sarbanes-Oxley compliance, a manager of revenue recognition, a senior manager of accounting operations, and additional treasury analysts. We have hired these personnel after considering the appropriateness of each individual’s experience and believe that these personnel are qualified to serve in their current respective roles. As of June 30, 2019, we had 28 accounting and finance employees. We believe the current staffing in our accounting and finance department is sufficient to meet our requirements as a public company. However, we will continue to assess the adequacy of our accounting and finance personnel and resources, and will add additional personnel, as well as adjust our resources, as necessary, commensurate with any increase in the size and complexity of our business. We also increased the depth and level of review procedures with regard to financial reporting and internal control procedures. Our independent registered public accounting firm is not required to formally attest to the effectiveness of our internal control over financial reporting until after we no longer qualify as an emerging growth company, which will occur on December 31, 2019. At such time, our independent registered public accounting firm may issue a report that is adverse in the event it is not satisfied with the level at which our internal control over financial reporting is documented, designed or operating. If we are unable to remediate the material weakness, or otherwise maintain effective internal control over financial reporting, we may not be able to report our financial results accurately, prevent fraud or file our periodic reports in a timely manner. If our remediation of this material weakness is not effective, or if we experience additional material weaknesses or otherwise fail to maintain an effective
69
system of internal controls in the future, we may not be able to accurately or timely report our financial condition or results of operations, which may adversely affect investor confidence in us and, as a result, the value of our common stock. We cannot assure you that all of our existing material weaknesses have been identified, or that we will not in the future identify additional material weaknesses. Any failure to maintain effective disclosure controls and internal control over financial reporting could have an adverse effect on our business and results of operations and could adversely impact our business, operating results, and financial condition.
We are in the early stages of the costly and challenging process of compiling the system and processing documentation necessary to perform the evaluation needed to comply with Section 404. We may not be able to complete our evaluation, testing, and any required remediation in a timely fashion. During the evaluation and testing process, if we identify material weaknesses in our internal control over financial reporting, we will be unable to assert that our internal control over financial reporting is effective.
If we are unable to assert that our internal control over financial reporting is effective, or if our independent registered public accounting firm is unable to express an opinion on the effectiveness of our internal control, including as a result of the material weakness described above, we could lose investor confidence in the accuracy and completeness of our financial reports, which would cause the price of our common stock to decline, and we may be subject to investigation or sanctions by the SEC. In addition, if we are unable to continue to meet these requirements, we may not be able to remain listed on The Nasdaq Global Select Market.
Our management team has limited experience managing a public company.
Most members of our management team have limited experience managing a publicly traded company, interacting with public company investors, and complying with the increasingly complex laws pertaining to public companies. Our management team may not successfully or efficiently manage our transition to being a public company subject to significant regulatory oversight and reporting obligations under the federal securities laws and the continuous scrutiny of securities analysts and investors. These new obligations and constituents require significant attention from our senior management and could divert their attention away from the day-to-day management of our business, which could adversely affect our business, financial condition, and operating results.
We may be unable to integrate acquired businesses and technologies successfully or to achieve the expected benefits of such acquisitions. We may acquire or invest in additional companies, which may divert our management’s attention, result in additional dilution to our stockholders, and consume resources that are necessary to sustain our business.
Our business strategy may, from time to time, include acquiring other complementary products, technologies, or businesses. At any given time, we may be engaged in discussions or negotiations with respect to one or more of these types of transactions. Any acquisition, investment, or business relationship may result in unforeseen or additional operating difficulties, risks, and expenditures. In particular, we may encounter difficulties assimilating or integrating the businesses, technologies, products, services, personnel, or operations of the acquired companies particularly if the key personnel of the acquired companies choose not to work for us, if an acquired company’s software is not easily adapted to work with ours, or otherwise. Acquisitions may also disrupt our business, divert our resources, and require significant management attention that would otherwise be available for the development of our business. Moreover, the anticipated benefits of any acquisition, investment, or business relationship may not be realized or we may be exposed to unknown or additional risks and liabilities.
We may in the future seek to acquire or invest in additional businesses, products, technologies, or other assets. We also may enter into relationships with other businesses to expand our platform or our ability to provide our platform in foreign jurisdictions, which could involve preferred or exclusive licenses, additional channels of distribution, discount pricing, or investments in other companies. Negotiating these transactions can be time consuming, difficult, and expensive, and our ability to close these transactions may often be subject to approvals that are beyond our control. Consequently, these transactions, even if undertaken and announced, may not close. For one or more of those transactions, we may:
|
•
|
issue additional equity securities that would dilute our stockholders’ ownership interest;
|
|
•
|
use cash that we may need in the future to operate our business;
|
70
|
•
|
become subject to different laws and regulations due to the nature or location of the acquired business, products, technologies, or other assets, or become subject to more stringent scrutiny or differing applications under laws and regulations to which we are currently subject as a result of such transactions;
|
|
•
|
incur debt on terms unfavorable to us or that we are unable to repay;
|
|
•
|
incur expenses or substantial liabilities;
|
|
•
|
encounter difficulties retaining key employees of the acquired company or integrating diverse software codes or business cultures;
|
|
•
|
encounter difficulties in assimilating acquired operations and development cultures;
|
|
•
|
encounter diversion of management’s attention to other business concerns; and
|
|
•
|
become subject to adverse tax consequences, substantial depreciation, or deferred compensation charges.
|
Any of these risks could adversely impact our business and operating results.
If our estimates or judgments relating to our critical accounting policies prove to be incorrect or financial reporting standards or interpretations change, our operating results could be adversely affected.
The preparation of financial statements in conformity with U.S. GAAP requires management to make estimates, judgments, and assumptions that affect the amounts reported in our condensed consolidated financial statements and accompanying notes. We base our estimates on historical experience and on various other assumptions that we believe to be reasonable under the circumstances, as provided in “Management’s Discussion and Analysis of Financial Condition and Results of Operations” included elsewhere in this Quarterly Report. The results of these estimates form the basis for making judgments about the carrying values of assets, liabilities, and equity as of the date of the financial statements, and the amount of revenue and expenses, during the periods presented, that are not readily apparent from other sources. Significant assumptions and estimates used in preparing our condensed consolidated financial statements include those related to determination of revenue recognition, the useful lives of assets, assessment of the recoverability of long-lived assets, goodwill impairment, allowance for doubtful accounts, reserves relating to transaction losses, the valuation of warrants, stock-based compensation, and accounting for income taxes. Our operating results may be adversely affected if our assumptions change or if actual circumstances differ from those in our assumptions, which could cause our operating results to fall below the expectations of industry or financial analysts and investors, resulting in a decline in the trading price of our common stock.
Additionally, we regularly monitor our compliance with applicable financial reporting standards and review new pronouncements and drafts thereof that are relevant to us. As a result of new standards, changes to existing standards, and changes in interpretation, we might be required to change our accounting policies, alter our operational policies and implement new or enhance existing systems so that they reflect current financial reporting standards, or we may be required to restate our published financial statements. Such changes to existing standards or changes in their interpretation may have an adverse effect on our reputation, business, financial position, and profit, or cause an adverse deviation from our revenue and operating profit target, which may negatively impact our financial results.
Our corporate structure and intercompany arrangements are subject to the tax laws of various jurisdictions, and we could be obligated to pay additional taxes, which could adversely impact our operating results.
We may expand the geographic scope of our operations and personnel to support our global user base. Our corporate structure and associated transfer pricing policies contemplate future growth into international markets, and consider the functions, risks, and assets of the various entities involved in the intercompany transactions. The amount of taxes we pay in different jurisdictions may depend on the application of the tax laws of the various jurisdictions, including the United States, to our international business activities, changes in tax rates, new or revised tax laws or interpretations of existing tax laws and policies, and our ability to operate our business in a manner consistent with our corporate structure and intercompany arrangements. The taxing authorities of the jurisdictions in which we operate may challenge our methodologies for pricing intercompany transactions pursuant to the intercompany arrangements or disagree with our determinations as to the income and expenses attributable to specific jurisdictions. If such a challenge or disagreement were to occur, and our position was not sustained, we could be required to pay additional taxes, interest and penalties, which could result in one-time tax charges, higher effective tax rates, reduced cash flows and
71
lower overall profitability of our operations. Our financial statements could fail to reflect adequate reserves to cover such a contingency.
Federal income tax reform could adversely affect us.
Legislation or other changes in tax laws could increase our liability and adversely affect our after-tax profitability. For example, the Tax Cuts and Jobs Act was enacted in the United States in December 2017 (the “Tax Act”) could have a significant impact on our effective tax rate, cash tax expenses and net deferred tax assets. The Tax Act reduces the U.S. corporate statutory tax rate, eliminates or limits the deduction of several expenses that were previously deductible, imposes a mandatory deemed repatriation tax on undistributed historic earnings of foreign subsidiaries, requires a minimum tax on earnings generated by foreign subsidiaries and permits a tax-free repatriation of foreign earnings through a dividends-received deduction. The Tax Act may have significant impacts in future periods and certain deduction limitations and restrictions.
Our ability to use our net operating loss carryforwards and certain other tax attributes may be limited.
As of December 31, 2018, we had net operating loss carryforwards for U.S. federal income tax purposes and state income tax purposes of $172.3 million and $38.5 million, respectively, available to offset future taxable income. If not utilized, the federal net operating loss carryforward amounts will begin to expire in 2019, including $0.9 million due to expire in 2019. The state net operating loss carryforward amounts will begin to expire in 2028. Realization of these net operating loss carryforwards depends on future income, and there is a risk that our existing carryforwards could expire unused and be unavailable to offset future income tax liabilities, which could materially and adversely affect our operating results.
In addition, under Sections 382 and 383 of the Internal Revenue Code of 1986, as amended (the “Internal Revenue Code”), if a corporation undergoes an “ownership change,” generally defined as a greater than 50% change (by value) in its equity ownership over a three-year period, the corporation’s ability to use its pre-change net operating loss carryforwards and other pre-change tax attributes, such as research tax credits, to offset its post-change income may be limited. In addition, we may experience ownership changes in the future as a result of subsequent shifts in our stock ownership. As a result, if we earn net taxable income, our ability to use our pre-change net operating loss carry-forwards and other tax attributes to offset U.S. federal taxable income may be subject to limitations, which could potentially result in increased future tax liability to us.
Our platform contains open source software components, and failure to comply with the terms of the underlying licenses could restrict our ability to market or operate our platform.
Our platform incorporates certain open source software. An open source license typically permits the use, modification, and distribution of software in source-code form subject to certain conditions. Some open source licenses contain conditions that any person who distributes a modification or derivative work of software that was subject to an open source license make the modified version subject to the same open source license. Distributing software that is subject to this kind of open source license can lead to a requirement that certain aspects of our platform be distributed or made available in source code form. Although we do not believe that we have used open source software in a manner that might condition its use on our distribution of any portion of our platform in source code form, the interpretation of open source licenses is complex and, despite our efforts, it is possible that we may be liable for copyright infringement, breach of contract or other claims if our use of open source software is adjudged not to comply with the applicable open source licenses.
Moreover, we cannot ensure that our processes for controlling our use of open source software in our platform will be effective. If we have not complied with the terms of an applicable open source software license, we may need to seek licenses from third parties to continue offering our platform and the terms on which such licenses are available may not be economically feasible, to re-engineer our platform to remove or replace the open source software, to discontinue offering our platform if re-engineering could not be accomplished on a timely basis, to pay monetary damages, or to make available the source code for aspects of our proprietary technology, any of which could adversely affect our business, operating results, and financial condition.
In addition to risks related to license requirements, use of open source software can involve greater risks than those associated with use of third-party commercial software, as open source licensors generally do not provide warranties; assurances of title, performance, or non-infringement; or control the origin of the software. There is typically no
72
support available for open source software, and we cannot ensure that the authors of such open source software will implement or push updates to address security risks or will not abandon further development and maintenance. Many of the risks associated with the use of open source software, such as the lack of warranties or assurances of title or performance, cannot be eliminated, and could, if not properly addressed, negatively affect our business. We have established processes to help alleviate these risks, including a review process for screening requests from our development organizations for the use of open source software, but we cannot be sure that these processes are sufficient.
Clients may fail to pay their invoices, necessitating action by us to compel payment.
In connection with our Upwork Enterprise and Business offerings and for certain legacy clients, we advance payments to freelancers for invoiced services on behalf of the client and subsequently invoice the client for such services. In addition, in certain instances, we will advance payment on a freelancer invoice if the client issues a chargeback or their payment method is declined and the freelancer assigns us the right to recover any funds from the client. From time to time, clients fail to pay for these services rendered by a freelancer, and as a result, we may be adversely affected both from the inability to collect amounts due and the cost of enforcing the applicable agreement or our terms of service, including through arbitration or litigation. Furthermore, some clients may seek bankruptcy protection or other similar relief and fail to pay amounts due, or pay those amounts more slowly, either of which could adversely affect our operating results, financial position, and cash flow.
Litigation could have a material adverse impact on our operating results and financial condition.
From time to time, we are subject to litigation. The outcome of any litigation (including class actions and individual lawsuits or arbitration), regardless of its merits, is inherently uncertain. Regardless of the merits or ultimate outcome of any claims that have been or may be brought against us, pending or future litigation could result in a diversion of management’s attention and resources and reputational harm, and we may be required to incur significant expenses defending against these claims. If we are unable to prevail in litigation, we could incur substantial liabilities. We may also determine that the most cost-effective and efficient way to resolve a dispute is to enter into a settlement agreement. Where we can make a reasonable estimate of the liability relating to pending litigation and determine that it is probable, we record a related liability. As additional information becomes available, we assess the potential liability and revise estimates as appropriate. However, because of uncertainties relating to litigation, the amount of our estimates could be wrong as determining reserves for pending litigation is a complex, fact-intensive process that is subject to judgment calls. Any adverse determination related to litigation or a settlement agreement could require us to change our technology or our business practices in costly ways, prevent us from offering certain products or services, require us to pay monetary damages, fines, or penalties, or require us to enter into royalty or licensing arrangements, and could adversely affect our operating results and cash flows, harm our reputation, or otherwise negatively impact our business.
We track certain performance metrics with internal tools and do not independently verify such metrics. Certain of our performance metrics are subject to inherent challenges in measurement, and real or perceived inaccuracies in such metrics may harm our reputation and negatively affect our business.
We track certain performance metrics, including GSV, the number of core clients, and client spend retention, with internal tools, which are not independently verified by any third party. Our internal tools have a number of limitations and our methodologies for tracking these metrics may change over time, which could result in unexpected changes to our metrics, including the metrics we report. If the internal tools we use to track these metrics undercount or overcount performance or contain algorithmic or other technical errors, the data we report may not be accurate. In addition, limitations or errors with respect to how we measure data (or the data that we measure) may affect our understanding of certain details of our business, which could affect our longer-term strategies. If our performance metrics are not accurate representations of our business, user base, or traffic levels; if we discover material inaccuracies in our metrics; or if the metrics we rely on to track our performance do not provide an accurate measurement of our business, our reputation may be harmed, and our operating and financial results could be adversely affected.
Our loan and security agreement provides our lender with a first-priority lien against substantially all of our assets (excluding our intellectual property), and contains financial covenants and other restrictions on our actions, which could limit our operational flexibility and otherwise adversely affect our financial condition.
Our Loan Agreement restricts our ability to, among other things:
|
•
|
incur additional indebtedness;
|
73
|
•
|
sell certain assets;
|
|
•
|
declare dividends or make certain distributions; and
|
|
•
|
undergo a merger or consolidation or other transactions.
|
In addition, the interest rates we pay under our Loan Agreement are derived from the prime rate, which has increased recently, and may increase in the future. Interest rate increases will result in us having to make higher interest payments and reduce the amount of working capital available to us. Our Loan Agreement also prohibits us from falling below an adjusted quick ratio. Our ability to comply with this covenant is dependent upon our future business performance.
Our failure to comply with the covenants or payment requirements, or the occurrence of other events specified in our Loan Agreement, could result in an event of default under the Loan Agreement, which would give our lender the right to terminate their commitments to provide additional loans under the Loan Agreement and to declare all borrowings outstanding, together with accrued and unpaid interest and fees, to be immediately due and payable. In addition, we have granted our lender first-priority liens against substantially all of our assets, as collateral, excluding our intellectual property (but including proceeds therefrom) and the funds and assets held by Upwork Escrow. We have also agreed to a negative pledge on our intellectual property. Failure to comply with the covenants or other restrictions in the Loan Agreement could result in a default. If the debt under our Loan Agreement was to be accelerated, we may not have sufficient cash on hand or be able to sell sufficient collateral to repay it, which would have an immediate adverse effect on our business and operating results. This could potentially cause us to cease operations and result in a complete loss of your investment in our common stock.
We may require additional capital to fund our business and support our growth, including in connection with any future acquisitions or strategic investments, and any inability to generate or obtain such capital may adversely affect our operating results and financial condition.
In order to support our growth and respond to business challenges, such as developing new features or enhancements to our platform, acquiring new technologies, and improving our infrastructure, we have made significant financial investments in our business and we intend to continue to make such investments. In addition, we may, from time to time, seek to acquire or strategically invest in other complementary products, technologies, or businesses. As a result, we may need to engage in equity or debt financings, in addition to our Loan Agreement, to provide the funds required for these investments, acquisitions, and other business endeavors. If we raise additional funds through equity or convertible debt issuances, our existing stockholders may suffer significant dilution and these securities could have rights, preferences, and privileges that are superior to that of holders of our common stock. If we obtain additional funds through debt financing, we may not be able to obtain such financing on terms favorable to us. Such terms may involve additional restrictive covenants making it difficult to engage in capital raising activities and pursue business opportunities, including potential acquisitions and strategic investments. If we are unable to obtain adequate financing or financing on terms satisfactory to us when we require it, our ability to continue to support our business growth and to respond to business challenges could be significantly impaired and our business may be adversely affected, requiring us to delay, reduce, or eliminate some or all of our operations.
We are currently an emerging growth company, and we cannot be certain that the reduced disclosure requirements applicable to emerging growth companies will not make our common stock less attractive to investors.
We are currently an emerging growth company, as defined in the JOBS Act, and, for so long as we continue to be an emerging growth company, we may take advantage of certain exemptions from various reporting requirements that are applicable to other public companies that are not emerging growth companies including, but not limited to, not being required to comply with the auditor attestation requirements of Section 404, reduced disclosure obligations regarding executive compensation in our periodic reports and proxy statements, and exemptions from the requirements of holding a non-binding advisory vote on executive compensation and stockholder approval of any golden parachute payments not previously approved.
While we remain an emerging growth company under the JOBS Act, we cannot predict if investors will find our common stock less attractive or our company less comparable to certain other public companies because we rely on these exemptions. For example, if we do not adopt a new or revised accounting standard, our future operating results may not be as comparable to the operating results of certain other companies in our industry that adopted such standards. We will no longer qualify as an emerging growth company as of December 31, 2019, and, at that time, we
74
will no longer be permitted to use these reporting exemptions. If some investors find our common stock less attractive as a result, there may be a less active trading market for our common stock and our stock price may be more volatile.
We may be required to comply with governmental export control laws and regulations. Our failure to comply with these laws and regulations could have an adverse effect on our business and operating results.
We may be subject to U.S. export controls and sanctions regulations that prohibit the shipment or provision of certain products and services to certain countries, governments, and persons targeted by U.S. sanctions. While we take precautions to prevent aspects of our platform from being exported in violation of these laws, including implementing internet protocol address blocking, we cannot guarantee that the precautions we take will prevent violations of export control and sanctions laws. If we are found to be in violation of U.S. sanctions or export control laws, it could result in substantial fines and penalties for us and for the persons working for us.
In addition, various countries regulate the import and export of certain encryption and other technology, including imposing import and export permitting and licensing requirements, and have enacted laws that could limit our ability to distribute aspects of our platform or could limit our users’ ability to access our platform in those countries. Changes in our platform, or future changes in export and import regulations may prevent our international users from utilizing our platform or, in some cases, prevent the export or import of our platform to certain countries, governments, or persons altogether. Any change in export or import regulations, economic sanctions or related legislation, or change in the countries, governments, persons, or technologies targeted by such regulations, could result in decreased use of our platform by existing or potential users with international operations. Any decreased use of our platform or limitation on our ability to export or sell our products would likely adversely affect our business, operating results, and financial results.
Our reported financial results may be adversely affected by changes in U.S. GAAP.
U.S. GAAP is subject to interpretation by the Financial Accounting Standards Board (the “FASB”), the SEC, and various bodies formed to promulgate and interpret appropriate accounting principles. A change in these principles or interpretations could have a significant effect on our reported financial results and could affect the reporting of transactions completed before the announcement of a change.
In particular, in May 2014, the FASB issued ASC 606, which supersedes the revenue recognition requirements in ASC 605, Revenue Recognition. The core principle of ASC 606 is that an entity should recognize revenue to depict the transfer of promised goods or services to customers in an amount that reflects the consideration to which the entity expects to be entitled in exchange for those goods or services. As an “emerging growth company,” we are allowed under the JOBS Act to delay adoption of new or revised accounting pronouncements applicable to public companies until such pronouncements are made applicable to private companies. We have elected to take advantage of this extended transition period under the JOBS Act with respect to ASC 606, which will result in ASC 606 becoming effective for us for the year ending December 31, 2019. Any difficulties in implementing these pronouncements could cause us to fail to meet our financial reporting obligations, which could result in regulatory discipline and harm investors’ confidence in us.
We are continuing to evaluate the adoption method and the potential impact that the implementation of ASC 606 will have on our consolidated financial statements, specifically related to the following items:
|
•
|
identification of performance obligations;
|
|
•
|
principal agent considerations;
|
|
•
|
whether the discounts offered under our tiered pricing program for freelancer service fee result in a deferral of revenue under ASC 606;
|
|
•
|
whether costs to obtain a contract with a customer will be capitalized or expensed, as well as the timing of recording such capitalization or expense;
|
|
•
|
timing of revenue recognition;
|
|
•
|
method of adoption; and
|
|
•
|
revenue disclosures which are expected to expand and may require judgment in certain areas.
|
75
If currency exchange rates fluctuate substantially in the future, the results of our operations, which are reported in U.S. dollars, could be adversely affected.
As we expand our international footprint, we will become more exposed to the effects of fluctuations in currency exchange rates. Although we expect an increasing number of sales contracts to be denominated in currencies other than the U.S. dollar in the future, all of our sales contracts are and have historically been denominated in U.S. dollars. However, we offer clients the option to settle invoices denominated in U.S. dollars in the local currencies of several non-U.S. countries, and therefore, a portion of our revenue is subject to foreign currency risk. While we currently use derivative instruments to hedge certain exposures to fluctuations in foreign currency exchange rates, the use of such hedging activities may not offset any, or more than a portion, of the adverse financial effects of unfavorable movements in foreign exchange rates over the limited time the hedges are in place. Moreover, a strengthening of the U.S. dollar could increase the real cost of transacting on our platform to clients located outside of the United States and could result in a loss of such clients, which could adversely affect our business, operating results, financial condition, and cash flows.
We may be adversely affected by natural disasters and other catastrophic events, and by man-made problems such as terrorism, that could disrupt our business operations and our business continuity and disaster recovery plans may not adequately protect us from a serious disaster.
A significant natural disaster, such as an earthquake, blizzard, hurricane, fire, flood, or other catastrophic event, such as a power loss or telecommunications failure, could have a material adverse impact on our business, financial condition, and operating results. In the event of natural disaster or other catastrophic event, we may be unable to continue our operations and may endure system interruptions, reputational harm, delays in development of our platform, lengthy interruptions in service, breaches of data security, and loss of critical data, all of which could have an adverse effect on our operating results. Our corporate headquarters are located in the San Francisco Bay Area, a region known for seismic activity and potentially subject to catastrophic fires. In addition, natural disasters and other catastrophic events could affect our partners’ ability to perform services for users on a timely basis. In the event any such partners’ information technology systems or service abilities are hindered by any of the events discussed above, our ability to provide our platform and other services may be impaired, resulting in missing financial targets for a particular quarter or year, or longer period. Further, if a natural disaster or other catastrophic event occurs in a region from which we derive a significant portion of our revenue, users in that region may delay or forego use of our platform or other services, which may adversely impact our operating results. In addition, acts of terrorism, civil disorder, or military conflict could cause disruptions in our business or the business and activity of our partners, users, or the economy as a whole. These disruptions may be more severe than in the case of natural disasters. All of the aforementioned risks may be augmented if our or our partners’ business continuity and disaster recovery plans prove to be inadequate. To the extent that any of the above results in delays or reductions in platform availability, activities or other services, our business, financial condition, and operating results would be adversely affected.
Risks Related to Ownership of Our Common Stock
The stock price of our common stock has been and may continue to be volatile, and you could lose all or part of your investment.
The market price of our common stock has been and may continue to be volatile. The market price of our common stock may fluctuate significantly in response to numerous factors, many of which are beyond our control, including:
|
•
|
overall performance of the equity markets;
|
|
•
|
actual or anticipated fluctuations in our revenue and other operating results;
|
|
•
|
changes in the financial projections we may provide to the public or our failure to meet these projections;
|
|
•
|
failure of securities analysts to initiate or maintain coverage of us, changes in financial estimates by any securities analysts who follow our company, or our failure to meet these estimates or the expectations of investors;
|
|
•
|
acquisitions, strategic partnerships, joint ventures, or capital commitments;
|
|
•
|
recruitment or departure of key personnel;
|
76
|
•
|
the economy as a whole and market conditions in our industry;
|
|
•
|
negative publicity related to the real or perceived quality or security of our platform, as well as the failure to timely launch new products and services that gain market acceptance;
|
|
•
|
rumors and market speculation involving us or other companies in our industry and/or other industries;
|
|
•
|
announcements by us or our competitors of new or terminated products or services, commercial relationships, or significant technical innovations;
|
|
•
|
new laws or regulations or new interpretations of existing laws or regulations applicable to our business;
|
|
•
|
lawsuits threatened or filed against us, litigation involving our industry, or both, or lawsuits threatened or filed against our users relating to their use of our platform;
|
|
•
|
developments or disputes concerning our or other parties’ products, services, or intellectual property rights;
|
|
•
|
changes in accounting standards, policies, guidelines, interpretations, or principles;
|
|
•
|
political changes or events, such as Brexit or U.S. government shutdowns;
|
|
•
|
other events or factors, including those resulting from war, incidents of terrorism, or responses to these events;
|
|
•
|
sales of shares of our common stock by us or our stockholders; and
|
|
•
|
sales of large blocks of our stock relative to the size of our public float.
|
In addition, the stock markets have experienced extreme price and volume fluctuations that have affected and continue to affect the market prices of equity securities of many companies. Stock prices of many companies, and technology companies in particular, have fluctuated in a manner unrelated or disproportionate to the operating performance of those companies. In the past, stockholders have instituted securities class action litigation following periods of market volatility. If we were to become involved in securities litigation, it could subject us to substantial costs, divert resources and the attention of management from our business, and adversely affect our business.
Sales of substantial amounts of our common stock in the public markets, particularly sales by our directors, executive officers, and significant stockholders, or the perception that these sales could occur, could cause the market price of our common stock to decline and may make it more difficult for you to sell your common stock at a time and price that you deem appropriate.
The market price of our common stock could decline as a result of sales of a large number of shares of our common stock in the market. The perception that these sales might occur may also cause the market price of our common stock to decline. We had a total of 110,708,530 shares of our common stock outstanding as of June 30, 2019. All shares of our common stock are freely tradable, generally without restrictions or further registration under the Securities Act of 1933, as amended (the “Securities Act”) except that any shares held by our “affiliates” as defined in Rule 144 under the Securities Act would only be able to be sold in compliance with the volume and manner of sale restrictions of Rule 144.
In addition, as of June 30, 2019, we had outstanding (i) stock options that, if fully exercised, would result in the issuance of
19,771,277
shares of common stock and (ii)
1,213,337
unvested RSUs. We have filed registration statements on Form S-8 to register shares reserved for future issuance under our equity compensation plans. The shares issued upon exercise of outstanding stock options or settlement or outstanding RSUs will be available for immediate resale in the United States on the open market.
Moreover, certain holders of our common stock have rights, subject to certain conditions, to require us to file registration statements for the public resale of such shares or to include such shares in registration statements that we may file for us or other stockholders.
We may also issue our shares of common stock or securities convertible into shares of our common stock from time to time in connection with a financing, an acquisition, investments, or otherwise. We also expect to grant additional equity awards to employees, directors, and consultants under our 2018 Equity Incentive Plan and rights to purchase
77
our common stock under our 2018 Employee Stock Purchase Plan. Any such issuances could result in substantial dilution to our existing stockholders and cause the market price of our common stock to decline.
The concentration of our stock ownership with insiders could limit your ability to influence corporate matters, including the ability to influence the outcome of director elections and other matters requiring stockholder approval.
As of June 30, 2019, our executive officers, directors, current 5% or greater stockholders, and affiliated entities together beneficially owned a significant portion of our common stock. As a result, these stockholders, acting together, could have substantial influence over most matters that require approval by our stockholders, including the election of directors and approval of significant corporate transactions. They may also have interests that differ from yours and may vote in a way with which you disagree and which may be adverse to your interests. This concentration of ownership may have the effect of delaying, preventing, or deterring a change of control of our company, could deprive our stockholders of an opportunity to receive a premium for their common stock as part of a sale of our company and might ultimately affect the market price of our common stock.
If securities or industry analysts do not publish research, or publish inaccurate or unfavorable research, about our business, the price of our common stock and trading volume could decline.
The trading market for our common stock depends in part on the research and reports that securities or industry analysts publish about us or our business. If industry analysts cease coverage of us, fail to publish reports on us regularly, the trading price for our common stock would be negatively affected. If one or more of the analysts who cover us downgrade our common stock or publish inaccurate or unfavorable research about our business, the price of our common stock would likely decline. If one or more of these analysts cease coverage of us or fail to publish reports on us regularly, demand for our common stock could decrease, which might cause our common stock price and trading volume to decline.
Even if our stock is actively covered by analysts, we do not have any control over the analysts or the measures that analysts or investors may rely upon to forecast our future results.
We do not intend to pay dividends for the foreseeable future.
We have never declared or paid any cash dividends on our common stock and do not intend to pay any cash dividends in the foreseeable future. Additionally, our ability to pay dividends on our common stock is limited by restrictions under the terms of our Loan Agreement. We anticipate that for the foreseeable future we will retain all of our future earnings for use in the development of our business and for general corporate purposes. Any determination to pay dividends in the future will be at the discretion of our board of directors. Accordingly, investors must rely on sales of their common stock after price appreciation, which may never occur, as the only way to realize any future gains on their investments.
Provisions in our charter documents and under Delaware law could make an acquisition of our company more difficult, limit attempts by our stockholders to replace or remove our current management, limit our stockholders’ ability to obtain a favorable judicial forum for disputes with us or our directors, officers, or employees, and limit the market price of our common stock.
Provisions in our restated certificate of incorporation and restated bylaws may have the effect of delaying or preventing a change of control or changes in our management. Our restated certificate of incorporation and restated bylaws include provisions that:
|
•
|
provide that our board of directors is classified into three classes of directors with staggered three-year terms;
|
|
•
|
permit the board of directors to establish the number of directors and fill any vacancies and newly-created directorships;
|
|
•
|
require super-majority voting to amend some provisions in our restated certificate of incorporation and restated bylaws;
|
|
•
|
authorize the issuance of “blank check” preferred stock that our board of directors could use to implement a stockholder rights plan;
|
78
|
•
|
provide that only the chairperson of our board of directors, our chief executive officer, president, lead independent director, or a majority of our board of directors will be authorized to call a special meeting of stockholders;
|
|
•
|
prohibit stockholder action by written consent, which requires all stockholder actions to be taken at a meeting of our stockholders;
|
|
•
|
provide that the board of directors is expressly authorized to make, alter, or repeal our bylaws; and
|
|
•
|
establish advance notice requirements for nominations for election to our board of directors or for proposing matters that can be acted upon by stockholders at annual stockholder meetings.
|
In addition, our restated certificate of incorporation provides that the Court of Chancery of the State of Delaware is the exclusive forum for any derivative action or proceeding brought on our behalf, any action asserting a breach of fiduciary duty, any action asserting a claim against us arising pursuant to the Delaware General Corporation Law (the “DGCL”) our restated certificate of incorporation, or our restated bylaws, or any action asserting a claim against us that is governed by the internal affairs doctrine. Our restated bylaws also provide that the federal district courts of the United States would be the exclusive forum for resolving any complaint asserting a cause of action arising under the Securities Act (the “Federal Forum Provision”). Any person or entity purchasing or otherwise acquiring any interest in any of our securities shall be deemed to have notice of and consented to this provision.
These choice of forum provisions may limit a stockholder’s ability to bring a claim in a judicial forum that it finds favorable for disputes with us or any of our directors, officers, or other employees, which may discourage lawsuits against us and our directors, officers, and other employees.
In December 2018, the Delaware Court of Chancery found that provisions such as the Federal Forum Provision are not valid under Delaware law. In light of this decision of the Delaware Court of Chancery, we do not currently intend to enforce the Federal Forum Provision in our restated bylaws unless and until there is a final determination by the Delaware Supreme Court regarding the validity of provisions such as the Federal Forum Provision. To the extent the Delaware Supreme Court makes a final determination that provisions such as the Federal Forum Provision are not valid as a matter of Delaware law, the board of directors intends to amend our restated bylaws to remove the Federal Forum Provision.
Moreover, Section 203 of the DGCL may discourage, delay, or prevent a change of control of our company. Section 203 imposes certain restrictions on mergers, business combinations, and other transactions between us and holders of 15% or more of our common stock.
Item 2. Unregistered Sales of Equity Securities and Use of Proceeds.
In April 2019, we issued 333,685 shares of our common stock upon the cashless exercise of a warrant to purchase up to an aggregate of 398,331 shares of common stock. The warrant was exercised in full at a total cost of $1.2 million. In lieu of a cash payment, the holder of the warrant surrendered 64,646 shares of common stock to cover the exercise price. The offer, sale and issuance of these securities was deemed to be exempt from registration under the Securities Act in reliance on Section 4(a)(2) of the Securities Act. The recipient of securities acquired the securities for investment only and not with a view to or for sale in connection with any distribution thereof and appropriate legends were affixed to the securities issued in these transactions. The recipient of the securities was an accredited or sophisticated person and had adequate access, through business or other relationships, to information about us.
79
Item 6. Exhibits.
|
Filed or
Furnished Herewith
|
||
|
Exhibit Number
|
Description
|
|
|
10.1
|
X
|
|
|
10.2
|
X
|
|
|
31.1
|
X
|
|
|
31.2
|
X
|
|
|
32.1*
|
X
|
|
|
32.2*
|
X
|
|
|
101.INS
|
XBRL Instance Document.
|
X
|
|
101.SCH
|
XBRL Taxonomy Extension Schema Document.
|
X
|
|
101.CAL
|
XBRL Taxonomy Extension Calculation Linkbase Document.
|
X
|
|
101.DEF
|
XBRL Taxonomy Extension Definition Linkbase Document.
|
X
|
|
101.LAB
|
XBRL Taxonomy Extension Label Linkbase Document.
|
X
|
|
101.PRE
|
XBRL Taxonomy Extension Presentation Linkbase Document.
|
X
|
__________________________
* The certifications furnished in Exhibits 32.1 and 32.2 hereto are deemed to accompany this Form 10-Q and are not deemed “filed” for purposes of Section 18 of the Exchange Act, or otherwise subject to the liability of that section, nor shall they be deemed incorporated by reference into any filing under the Securities Act or the Exchange Act.
80
SIGNATURES
Pursuant to the requirements of the Securities Exchange Act of 1934, the registrant has duly caused this report to be signed on its behalf by the undersigned thereunto duly authorized.
|
|
|
UPWORK INC.
|
|
|
|
|
|
|
|
Date: August 7, 2019
|
|
By:
|
/s/ Stephane Kasriel
|
|
|
|
|
Stephane Kasriel
|
|
|
|
|
President and Chief Executive Officer
(Principal Executive Officer)
|
|
|
|
|
|
|
Date: August 7, 2019
|
|
By:
|
/s/ Brian Kinion
|
|
|
|
|
Brian Kinion
|
|
|
|
|
Chief Financial Officer
(Principal Financial and Accounting Officer)
|
81
TABLE OF CONTENTS
Part I Financial InformationItem 1. Financial StatementsNote 1 Organization and Description Of BusinessNote 2 Basis Of Presentation and Summary Of Significant Accounting PoliciesNote 3 Fair Value MeasurementsNote 4 Balance Sheet ComponentsNote 5 Commitments and ContingenciesNote 6 DebtNote 7 Redeemable Convertible Preferred StockNote 8 Preferred and Common Stock WarrantsNote 9 Common StockNote 10 Stock-based CompensationNote 11 Net Loss Per ShareNote 12 Segment and Geographical InformationNote 13 401(k) PlanNote 14 Subsequent EventsItem 2. Management S Discussion and Analysis Of Financial Condition and Results Of OperationsItem 3. Quantitative and Qualitative Disclosures About Market RiskItem 4. Controls and ProceduresPart II Other InformationItem 1. Legal ProceedingsItem 1A. Risk FactorsItem 2. Unregistered Sales Of Equity Securities and Use Of ProceedsItem 6. Exhibits